UNITED STATES
SECURITIES AND EXCHANGE COMMISSION
Washington, D.C. 20549
FORM N-CSR
CERTIFIED SHAREHOLDER REPORT OF REGISTERED
MANAGEMENT INVESTMENT COMPANIES
Investment Company Act file number | 811-09645 |
|
Columbia Funds Series Trust |
(Exact name of registrant as specified in charter) |
|
225 Franklin Street, Boston, Massachusetts | | 02110 |
(Address of principal executive offices) | | (Zip code) |
|
Scott R. Plummer 5228 Ameriprise Financial Center Minneapolis, MN 55474 |
(Name and address of agent for service) |
|
Registrant’s telephone number, including area code: | 1-612-671-1947 | |
|
Date of fiscal year end: | February 29 | |
|
Date of reporting period: | February 29, 2012 | |
| | | | | | | | |
Form N-CSR is to be used by management investment companies to file reports with the Commission not later than 10 days after the transmission to stockholders of any report that is required to be transmitted to stockholders under Rule 30e-1 under the Investment Company Act of 1940 (17 CFR 270.30e-1). The Commission may use the information provided on Form N-CSR in its regulatory, disclosure review, inspection, and policymaking roles.
A registrant is required to disclose the information specified by Form N-CSR, and the Commission will make this information public. A registrant is not required to respond to the collection of information contained in Form N-CSR unless the Form displays a currently valid Office of Management and Budget (“OMB”) control number. Please direct comments concerning the accuracy of the information collection burden estimate and any suggestions for reducing the burden to Secretary, Securities and Exchange Commission, 450 Fifth Street, NW, Washington, DC 20549-0609. The OMB has reviewed this collection of information under the clearance requirements of 44 U.S.C. § 3507.
Item 1. Reports to Stockholders.

Columbia Large Cap Value Fund
Annual Report for the Period Ended February 29, 2012
Not FDIC insured • No bank guarantee • May lose value
Table of Contents
| Fund Profile | | | 1 | | |
|
| Performance Information | | | 2 | | |
|
| Understanding Your Expenses | | | 3 | | |
|
| Portfolio Manager's Report | | | 4 | | |
|
| Portfolio of Investments | | | 7 | | |
|
Statement of Assets and
Liabilities | | | 12 | | |
|
| Statement of Operations | | | 14 | | |
|
Statement of Changes in
Net Assets | | | 15 | | |
|
| Financial Highlights | | | 17 | | |
|
| Notes to Financial Statements | | | 25 | | |
|
Report of Independent Registered
Public Accounting Firm | | | 37 | | |
|
| Federal Income Tax Information | | | 38 | | |
|
| Fund Governance | | | 39 | | |
|
Important Information About
This Report | | | 49 | | |
|
The views expressed in this report reflect the current views of the respective parties. These views are not guarantees of future performance and involve certain risks, uncertainties and assumptions that are difficult to predict, so actual outcomes and results may differ significantly from the views expressed. These views are subject to change at any time based upon economic, market or other conditions and the respective parties disclaim any responsibility to update such views. These views may not be relied on as investment advice and, because investment decisions for a Columbia Fund are based on numerous factors, may not be relied on as an indication of trading intent on behalf of any particular Columbia Fund. References to specific securities should not be construed as a recommendation or investment advice.
President's Message

Dear Shareholders,
Americans were dispirited in the fourth quarter of 2011 by Washington's inability to reach a plan for deficit reduction and Europe's piecemeal attempt to address its own fiscal issues. Yet, there was sufficient good news to encourage risk taking, buoying both stocks and bonds to solid gains.
U.S. economic data surprised on the upside and fears of recession abated. With the bar of expectations set low, investors responded positively to the announcement that the economy had expanded by 1.8% in the third quarter. Consumer confidence improved, even though consumers remain under pressure with no real increase in disposable income and a continued decline in household net worth. Headline inflation—which tracks a broad range of consumer expenditures, including food and energy—declined. Even manufacturing held its ground.
Against this backdrop, the U.S. equity markets logged solid returns. The S&P 500 Index gained 11.82%, moving into positive territory for the year with quarterly advances in all ten sectors. Mid- and small-cap stocks did even better. Value outperformed growth across all market capitalizations. Energy stocks led the market, as the price of oil moved above $100 a barrel in December. Industrials and materials stocks rose, buoyed by improving economic data. The U.S. fixed-income markets logged modest but solid returns. High-yield bonds were the best performers as the economy showed signs of improvement. Emerging market bonds were strong performers, as inflation came under control in key regions. Municipal bonds and Treasuries eked out only modest gains, as investors moved away from quality in favor of riskier assets.
While fourth quarter gains were encouraging, challenges still remain. Columbia Management, however, remains strong and steadfast. Columbia Management is the eighth largest manager of long-term mutual fund assets with $326 billion under management as of December 31, 2011. The past year has been one of considerable change for the organization as we worked diligently to align products, services and resources in the integration of Columbia Management with RiverSource Investments. The strong line-up of talent, resources and capabilities that has resulted is highlighted by the success of our products. As of December 31, 2011, Columbia Management offers 52 funds rated either 4 or 5 stars by Morningstar.*
For more information about these and other funds offered by Columbia Management, including detailed, up-to-date fund performance and portfolio information, please visit us online at columbiamanagement.com. Other information and resources available on our website include:
g timely economic analysis and market commentary
g quarterly fund commentaries
g Columbia Management Investor, a quarterly newsletter for shareholders
Thank you for your continued support of the Columbia Funds. We look forward to serving your investment needs for many years to come.
Best Regards,

J. Kevin Connaughton
President, Columbia Funds
*All ratings are based on Class Z shares as of 12/31/2011. Out of 119 Class Z share Columbia funds rated by Morningstar, 7 funds received a 5-star Overall Rating and 45 funds received a 4-star Overall Rating. The Overall Morningstar Rating for a retail mutual fund is derived from a weighted average of the performance figures associated with its 3-, 5- and 10-year (if applicable) Morningstar Rating metrics. For share classes that do not have a 3-, 5-, or 10-year actual performance history, the fund's independent Morningstar Rating metric is then compared against the retail mutual fund universe breakpoints to determine its hypothetical rating.
For each fund with at least a three-year history, Morningstar calculates a Morningstar RatingTM based on a Morningstar Risk-Adjusted Return measure that accounts for variation in a fund's monthly performance (including the effects of sales charges/loads, and redemption fees), placing more emphasis on downward variations and rewarding consistent performance. The top 10% of funds in each category receive 5 stars, the next 22.5% receive 4 stars, the next 35% receive 3 stars, the next 22.5% receive 2 stars and the bottom 10% receive 1 star. (Each share class is counted as a fraction of one fund within this scale and rated separately, which may cause slight variations in the distribution percentages.)
The Morningstar RatingTM is for Class Z shares only; other classes may have different performance characteristics and may have different ratings. ©2012 Morningstar, Inc. All Rights Reserved. The Morningstar information contained herein: (1) is proprietary to Morningstar and/or its content providers; (2) may not be copied or distributed; and (3) is not warranted to be accurate, complete or timely. Neither Morningstar nor its content providers are responsible for any damages or losses arising from any use of this information.
Investors should consider the investment objectives, risks, charges and expenses of a mutual fund carefully before investing. For a free prospectus, which contains this and other important information about the funds, visit columbiamanagement.com. The prospectus should be read carefully before investing.
Columbia Funds are distributed by Columbia Management Investment Distributors, Inc., member FINRA, and managed by Columbia Management Investment Advisers, LLC.
© 2012 Columbia Management Investment Advisers, LLC. All rights reserved.
Fund Profile – Columbia Large Cap Value Fund
Summary
g For the 12-month period that ended February 29, 2012, the fund's Class A shares returned –1.94%, without sales charge.
g The funds benchmark, the Russell 1000® Value Index1, returned 2.18%.
g The fund underperformed the index due primarily to stock selection in financials, consumer discretionary, health care and energy, more than offsetting the positive impact of effective stock selection in information technology and consumer staples. Sector allocation overall also detracted from the fund's results but to a more modest degree.
Portfolio Management
Laton Spahr has co-managed the fund since August 2011 and has been associated with Columbia Management Investment Advisers, LLC (the Investment Manager) as an investment professional since 2001.
Paul Stocking has co-managed the fund since August 2011 and has been associated with the Investment Manager as an investment professional since 1995.
Steven Schroll has co-managed the fund since August 2011 and has been associated with the Investment Manager as an investment professional since 1998.
1The Russell 1000 Value Index measures the performance of those Russell 1000 Index companies with lower price-to-book ratios and lower forecasted growth values.
Indices are not available for investment, are not professionally managed and do not reflect sales charges, fees, brokerage commissions, taxes or other expenses of investing. Securities in the fund may not match those in an index.
Performance data quoted represents past performance and current performance may be lower or higher. Past performance is no guarantee of future results. The investment return and principal value will fluctuate so that shares, when redeemed, may be worth more or less than the original cost. Please visit www.columbiamanagement.com for daily and most recent month-end performance updates.
Summary
1-year return as of 2/29/12
| | –1.94% | |
|
|  | | | Class A shares
(without sales charge) | |
|
| | +2.18% | |
|
|  | | | Russell 1000 Value Index | |
|
Morningstar Style BoxTM

The Morningstar Style BoxTM is based on the fund's portfolio holdings. For equity funds, the vertical axis shows the market capitalization of the stocks owned, and the horizontal axis shows investment style (value, blend, or growth). Information shown is based on the most recent data provided by Morningstar.
© 2012 Morningstar, Inc. All rights reserved. The Morningstar information contained herein: (1) is proprietary to Morningstar and/or its content providers; (2) may not be copied or distributed; and (3) is not warranted to be accurate, complete or timely. Neither Morningstar nor its content providers are responsible for any damages or losses arising from any use of this information.
1
Performance Information – Columbia Large Cap Value Fund
Performance data quoted represents past performance and current performance may be lower or higher. Past performance is no guarantee of future results. The investment return and principal value will fluctuate so that shares, when redeemed, may be worth more or less than the original cost. Please visit www.columbiamanagement.com for daily and most recent month-end performance updates.
Performance of a $10,000 investment 03/01/02 – 02/29/12
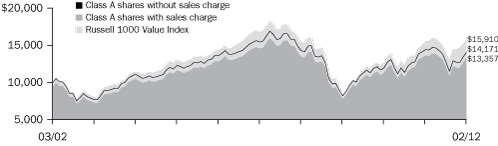
The chart above shows the change in value of a hypothetical $10,000 investment in Class A shares of Columbia Large Cap Value Fund during the stated time period, and does not reflect the deduction of taxes that a shareholder may pay on fund distributions or on the redemption of fund shares.
Performance of a $10,000 investment 03/01/02 – 02/29/12 ($)
| Sales charge | | without | | with | |
| Class A | | | 14,171 | | | | 13,357 | | |
| Class B | | | 13,107 | | | | 13,107 | | |
| Class C | | | 13,124 | | | | 13,124 | | |
| Class I* | | | 14,558 | | | | n/a | | |
| Class R* | | | 13,818 | | | | n/a | | |
| Class W* | | | 14,113 | | | | n/a | | |
| Class Y* | | | 14,587 | | | | n/a | | |
| Class Z | | | 14,510 | | | | n/a | | |
Average annual total return as of 02/29/12 (%)
| Share class | | A | | B | | C | | I* | | R* | | W* | | Y* | | Z | |
| Inception | | 12/06/89 | | 06/07/93 | | 06/17/92 | | 09/27/10 | | 01/23/06 | | 09/27/10 | | 07/15/09 | | 09/19/89 | |
| Sales charge | | without | | with | | without | | with | | without | | with | | without | | without | | without | | without | | without | |
| 1-year | | | –1.94 | | | | –7.58 | | | | –2.76 | | | | –7.61 | | | | –2.68 | | | | –3.65 | | | | –1.57 | | | | –2.19 | | | | –1.94 | | | | –1.58 | | | | –1.78 | | |
| 5-year | | | –1.74 | | | | –2.90 | | | | –2.50 | | | | –2.84 | | | | –2.48 | | | | –2.48 | | | | –1.45 | | | | –1.98 | | | | –1.77 | | | | –1.41 | | | | –1.51 | | |
| 10-year | | | 3.55 | | | | 2.94 | | | | 2.74 | | | | 2.74 | | | | 2.76 | | | | 2.76 | | | | 3.83 | | | | 3.29 | | | | 3.51 | | | | 3.85 | | | | 3.79 | | |
The "with sales charge" returns include the maximum initial sales charge of 5.75% for Class A shares and the applicable contingent deferred sales charge of 5.00% in the first year, declining to 1.00% in the sixth year and eliminated thereafter for Class B shares and 1.00% for Class C shares in the first year only. The "without sales charge" returns do not include the effect of sales charges. If they had, returns would be lower.
Performance results reflect any fee waivers or reimbursements of fund expenses by Columbia Management Investment Advisers, LLC and/or any of its affiliates. Absent these fee waivers or expense reimbursement arrangements, performance results would have been lower.
All results shown assume reinvestment of distributions. Class I, Class Y and Class Z shares are sold at net asset value with no distribution and service (Rule 12b-1) fees. Class R and Class W shares are sold at net asset value with distribution and /or service (Rule 12b-1) fees. Class I, Class R, Class W, Class Y and Class Z shares have limited eligibility and the investment minimum requirements may vary. Please see the fund's prospectuses for details. Performance for different share classes will vary based on differences in sales charges and fees associated with each class.
The tables do not reflect the deduction of taxes that a shareholder may pay on fund distributions or on the redemption of fund shares.
*The returns shown for periods prior to the share class inception date (including returns since inception, which are since fund inception) include the returns of the fund's oldest share class. These returns are adjusted to reflect any higher class-related operating expenses of the newer share classes, as applicable. Please visit columbiamanagement.com/mutual-funds/appended-performance for more information.
2
Understanding Your Expenses – Columbia Large Cap Value Fund
As an investor, you incur two types of costs. There are transaction costs, which generally include sales charges on purchases and may include redemption fees. There are also ongoing costs, which generally include management fees, distribution and service (Rule 12b-1) fees, and other fund expenses. The following information is intended to help you understand your ongoing costs (in dollars) of investing in the Fund and to help you compare these costs with the ongoing costs of investing in other mutual funds.
Analyzing your fund's expenses
To illustrate these ongoing costs, we have provided examples and calculated the expenses paid by investors in each share class of the Fund during the period. The actual and hypothetical information in the table is based on an initial investment of $1,000 at the beginning of the period indicated and held for the entire period. Expense information is calculated two ways and each method provides you with different information. The amount listed in the "Actual" column is calculated using the Fund's actual operating expenses and total return for the period. You may use the Actual information, together with the amount invested, to estimate the expenses that you paid over the period. Simply divide your account value by $1,000 (for example, an $8,600 account value divided by $1,000 = 8.6), then multiply the results by the expenses paid during the period under the Actual column. The amount listed in the "Hypothetical" column assumes a 5% annual rate of return before expenses (which is not the Fund's actual return) and then applies the Fund's actual expense ratio for the period to the hypothetical return. You should not use the hypothetical account values and expenses to estimate either your actual account balance at the end of the period or the expenses you paid during the period. See "Compare with other funds" below for details on how to use the hypothetical data.
Compare with other funds
Since all mutual funds are required to include the same hypothetical calculations about expenses in shareholder reports, you can use this information to compare the ongoing cost of investing in the Fund with other funds. To do so, compare the hypothetical example with the 5% hypothetical examples that appear in the shareholder reports of other funds. As you compare hypothetical examples of other funds, it is important to note that hypothetical examples are meant to highlight the ongoing costs of investing in a fund only and do not reflect any transaction costs, such as sales charges, or redemption or exchange fees. Therefore, the hypothetical calculations are useful in comparing ongoing costs only, and will not help you determine the relative total costs of owning different funds. If transaction costs were included in these calculations, your costs would be higher.
09/01/11 – 02/29/12
| | | Account value at the
beginning of the period ($) | | Account value at the
end of the period ($) | | Expenses paid
during the period ($) | | Fund's annualized
expense ratio (%) | |
| | | Actual | | Hypothetical | | Actual | | Hypothetical | | Actual | | Hypothetical | | Actual | |
| Class A | | | 1,000.00 | | | | 1,000.00 | | | | 1,111.60 | | | | 1,019.34 | | | | 5.83 | | | | 5.57 | | | | 1.11 | % | |
| Class B | | | 1,000.00 | | | | 1,000.00 | | | | 1,106.50 | | | | 1,015.61 | | | | 9.74 | | | | 9.32 | | | | 1.86 | % | |
| Class C | | | 1,000.00 | | | | 1,000.00 | | | | 1,107.50 | | | | 1,015.61 | | | | 9.75 | | | | 9.32 | | | | 1.86 | % | |
| Class I | | | 1,000.00 | | | | 1,000.00 | | | | 1,113.20 | | | | 1,021.43 | | | | 3.63 | | | | 3.47 | | | | 0.69 | % | |
| Class R | | | 1,000.00 | | | | 1,000.00 | | | | 1,110.10 | | | | 1,018.40 | | | | 6.82 | | | | 6.52 | | | | 1.30 | % | |
| Class W | | | 1,000.00 | | | | 1,000.00 | | | | 1,111.20 | | | | 1,019.39 | | | | 5.77 | | | | 5.52 | | | | 1.10 | % | |
| Class Y | | | 1,000.00 | | | | 1,000.00 | | | | 1,113.20 | | | | 1,021.28 | | | | 3.78 | | | | 3.62 | | | | 0.72 | % | |
| Class Z | | | 1,000.00 | | | | 1,000.00 | | | | 1,111.80 | | | | 1,020.59 | | | | 4.52 | | | | 4.32 | | | | 0.86 | % | |
Expenses paid during the period are equal to the annualized expense ratio for each class as indicated above, multiplied by the average account value over the period and then multiplied by the number of days in the Fund's most recent fiscal half year and divided by 366.
Expenses do not include fees and expenses incurred indirectly by the Fund from the underlying funds in which the Fund may invest (also referred to as "acquired funds"), including affiliated and non-affiliated pooled investments vehicles (including mutual funds and exchange traded funds).
Had Columbia Management Investment Advisers, LLC and/or certain of its affiliates not waived/reimbursed certain fees and expenses, account value at the end of the period would have been reduced.
3
Portfolio Manager's Report – Columbia Large Cap Value Fund
Performance data quoted represents past performance and current performance may be lower or higher. Past performance is no guarantee of future results. The investment return and principal value will fluctuate so that shares, when redeemed, may be worth more or less than the original cost. Please visit www.columbiamanagement.com for daily and most recent month-end performance updates.
Net asset value per share
as of 02/29/12 ($)
| Class A | | | 11.64 | | |
| Class B | | | 11.19 | | |
| Class C | | | 11.20 | | |
| Class I | | | 11.69 | | |
| Class R | | | 11.64 | | |
| Class W | | | 11.64 | | |
| Class Y | | | 11.68 | | |
| Class Z | | | 11.66 | | |
Distributions declared per share
03/01/11 – 02/29/12 ($)
| Class A | | | 0.10 | | |
| Class B | | | 0.03 | | |
| Class C | | | 0.03 | | |
| Class I | | | 0.14 | | |
| Class R | | | 0.07 | | |
| Class W | | | 0.11 | | |
| Class Y | | | 0.14 | | |
| Class Z | | | 0.12 | | |
The fund is actively managed and the composition of its portfolio will change over time. Information provided is calculated as a percentage of net assets.
Effective August 1, 2011, Steve Schroll, Laton Spahr, CFA® and Paul Stocking assumed portfolio management responsibility for the fund.
For the 12-month period that ended February 29, 2012, the fund's Class A shares returned –1.94%, without sales charge. This result was behind the 2.18% gain of the fund's benchmark, the Russell 1000® Value Index. The fund underperformed the index due primarily to stock selection in financials, consumer discretionary, health care and energy, more than offsetting the positive impact of effective stock selection in information technology and consumer staples. Sector allocation overall also detracted from the fund's results but to a more modest degree.
Volatility characterized the market
The U.S. equity markets generated modestly positive returns for the annual period ended February 29, 2012, but such returns mask what was a fiscal year characterized by frequent bouts of dramatic volatility. Such significant volatility was driven primarily by shifting sentiment toward U.S. economic activity and the potential impact of international economies on the U.S. Optimism early in the annual period for a continued economic recovery gave way to deep concerns about deteriorating U.S. economic data, persistent sovereign debt crises in Europe and the possibility of a hard landing for China's economy. During the annual period, the U.S. equity markets also faced several other exogenous challenges, including the Arab spring, the Japanese natural and nuclear disasters and the massive flooding in Thailand. The third quarter of 2011 was particularly challenging, as these factors, along with political paralysis in Washington D.C. and an unprecedented downgrade of U.S. sovereign debt by Standard & Poor's, caused investor risk aversion to heighten such that the U.S. equity markets experienced their worst quarter since the fourth quarter of 2008. From October through February, U.S. equities rebounded rather strongly, albeit not steadily, as macro concerns began to fade. U.S. economic data in the important labor, housing and manufacturing markets came in better than anticipated, and European authorities made it clear that every effort would be made to ensure that the worst case default scenario would not materialize.
While the fiscal year was bookended by rallies in the U.S. equity markets, a flight to quality still dominated the annual period overall, and thus there was a bifurcation in sector performance. Traditionally defensive sectors, most notably, consumer staples, health care and utilities, performed best within the Russell Index on a relative basis for the annual period overall, each generating double-digit returns. More cyclical, economically-sensitive sectors, including financials, materials and energy, were the weakest performers in the Russell Index during the annual period. Financials negative returns within the Russell Index were impacted most severely by concerns surrounding the European sovereign debt crisis and its potential contagion effect. Materials and energy were particularly hurt by a broad slowdown in global industrial growth.
Lost ground from financials, consumer discretionary, health care and energy
The fund's results were hurt most by stock selection in the financials sector, which more than offset the positive contribution made by having an underweighted allocation to the worst performing sector in the index during the annual period. An emphasis on
4
Portfolio Manager's Report (continued) – Columbia Large Cap Value Fund
capital markets firms and large diversified banks hindered results most. We had established exposures to these industries because it was there that we found companies with the deepest discounts to their long-term valuations. However, capital markets firms such as Goldman Sachs and Morgan Stanley performed poorly during the annual period on lower levels of capital markets activity due to concerns over broad regulatory changes and volatility in the global capital markets. Positions in diversified banks JPMorgan Chase and Bank of America hurt the fund's results as these companies faced revenue challenges based on controversy around retail fees and on ongoing costs incurred in restructuring their mortgage portfolios. A fund position in insurance company MetLife also detracted, primarily during the first months of the annual period.
Industry and stock selection in the consumer discretionary sector further detracted from the fund's results during the annual period. Specifically, greater exposure to the auto and auto parts and leisure industries, which lagged the index, and having underweighted exposure to a variety of industries within the sector, such as media, which performed better, hurt. In the auto and auto parts industry, a sizable position in automobile manufacturer Ford Motor hindered results. In the leisure industry, a significant holding in cruise line Carnival hurt the fund's relative performance. Such detractors within the consumer discretionary sector were partially offset by a sizable position in home improvement retailer Home Depot, which was a strong performer for the fund during the annual period.
In health care, the second best performer in the index during the annual period, having an underweighted exposure to the sector and industry and stock selection detracted. Having an underweighted allocation to the pharmaceuticals industry particularly hindered results, as this was one of the better performing areas of the sector.
Stock selection in the energy sector negatively impacted the fund's annual results with an overweighted allocation to the poorly performing sector also hampering relative returns. Stock selection was especially challenging in the oilfield services and exploration and production industries, with Halliburton and Apache delivering particularly disappointing results.
Contributions from information technology and consumer staples
Stock selection in the information technology and consumer staples sectors proved effective. In information technology, an emphasis on the services industries boosted results most. In particular, sizable positions in global payment solutions provider MasterCard, computer solutions provider International Business Machines (IBM) and software giant Microsoft benefited the fund during the annual period. Fund positions in personal computer and mobile communications device behemoth Apple and semiconductor manufacturer LSI also boosted results.
In consumer staples, a significant exposure to the tobacco industry contributed most positively to the fund's results, with positions in Lorillard and Philip Morris International each adding value. The fund also benefited during the annual period from underweighted exposure to industries within the consumer staples sector facing rising input costs, such as food products, which lagged.
Portfolio breakdown1
(as of February 29, 2012) (%)
| Consumer Discretionary | | | 8.7 | | |
| Consumer Staples | | | 7.5 | | |
| Energy | | | 13.1 | | |
| Financials | | | 18.8 | | |
| Health Care | | | 11.8 | | |
| Industrials | | | 14.7 | | |
| Information Technology | | | 14.3 | | |
| Materials | | | 5.0 | | |
| Telecommunication Services | | | 3.4 | | |
| Utilities | | | 0.3 | | |
| Other2 | | | 2.4 | | |
1Percentages indicated are based upon total investments (excluding Investments of Cash Collateral Received for Securities on Loan). The Fund's portfolio composition is subject to change.
2Includes investments in affiliated money market fund.
Top 10 holdings1
(as of February 29, 2012) (%)
| JPMorgan Chase & Co. | | | 3.8 | | |
| Microsoft Corp. | | | 3.5 | | |
| Lorillard, Inc. | | | 3.2 | | |
| Bank of America Corp. | | | 3.0 | | |
| Exxon Mobil Corp. | | | 2.8 | | |
| Wells Fargo & Co. | | | 2.6 | | |
| Mastercard, Inc., Class A | | | 2.2 | | |
| Chevron Corp. | | | 2.1 | | |
| AT&T, Inc. | | | 2.1 | | |
| Occidental Petroleum Corp. | | | 2.1 | | |
1Percentages indicated are based upon total investments (excluding Investments of Cash Collateral Received for Securities on Loan and affiliated money market fund).
For further detail about these holdings, please refer to the section entitled "Portfolio of Investments."
5
Portfolio Manager's Report (continued) – Columbia Large Cap Value Fund
Transitioning to a new portfolio management team
Most of the changes to the fund's portfolio were made during the third quarter of 2011, both as part of the transition to the new portfolio management team and given broad equity market volatility that dominated during those months. In transitioning to the new portfolio management team, we established certain exposures at the sector and industry level that differed from the benchmark and somewhat reduced the number of holdings in the portfolio—from 99 names at the start of the annual period to 87 at the end of February 2012.
Overall, we substantially increased the fund's allocation to the information technology sector. Within the sector, we established new positions in Microsoft, MasterCard, semiconductor bellwether Intel and networking products manufacturer Cisco Systems. To a lesser extent, the fund's exposure to materials and consumer staples also increased over the course of the annual period. In materials, we bought positions in diversified chemicals companies Dow Chemical and E. I. du Pont de Nemours and added to the fund's position in metals miner Freeport-McMoRan Copper and Gold. In consumer staples, we initiated new fund positions in Lorillard and drug store retailer CVS Caremark and expanded the fund's position in Philip Morris Int'l.
Conversely, we decreased the fund's allocation to the financials sector most. Within financials, the largest eliminations included Prudential, U.S. Bancorp and PNC Financial. We also trimmed the fund's positions in Wells Fargo and Citigroup. During the annual period, we additionally reduced the fund's exposures to the utilities and consumer discretionary sectors. In utilities, we eliminated the fund's positions in NextEra Energy and American Electric Power and trimmed its position in PG&E, each an integrated electric utility. In consumer discretionary, we sold the fund's positions in auto manufacturer General Motors and auto parts distributor Genuine Parts and reduced its positions in cruise line Carnival and multimedia company Viacom.
With these changes, it is well worth noting that at the end of February 2012, the fund had its most significant weightings compared to the Russell Index in the industrials, information technology and materials sectors and its most modest exposures relative to the benchmark index in the financials, utilities and telecommunication services sectors.
Equity securities are affected by stock market fluctuations that occur in response to economic and business developments.
Value stocks are securities of companies that may have experienced adverse business or industry developments or may be subject to special risks that have caused the stocks to be out of favor. If the managers' assessment of a company's prospects is wrong, the price of the company's stock may not approach the value the manager has placed on it.
6
Portfolio of Investments – Columbia Large Cap Value Fund
February 29, 2012
(Percentages represent value of investments compared to net assets)
| Issuer | | Shares | | Value | |
| Common Stocks 97.6% | |
| CONSUMER DISCRETIONARY 8.7% | |
| Auto Components 0.9% | |
| Johnson Controls, Inc. | | | 425,889 | | | $ | 13,896,758 | | |
| Automobiles 1.5% | |
| Ford Motor Co.(a) | | | 1,742,617 | | | | 21,573,599 | | |
| Hotels, Restaurants & Leisure 0.5% | |
| Carnival Corp. | | | 242,382 | | | | 7,341,751 | | |
| Household Durables 0.4% | |
| Lennar Corp., Class A(a) | | | 241,004 | | | | 5,634,674 | | |
| Media 1.8% | |
| Comcast Corp., Class A | | | 358,767 | | | | 10,540,574 | | |
| Viacom, Inc., Class B | | | 176,703 | | | | 8,414,597 | | |
| Walt Disney Co. (The) | | | 197,828 | | | | 8,306,798 | | |
| Total | | | 27,261,969 | | |
| Multiline Retail 2.0% | |
| Kohl's Corp.(a) | | | 189,248 | | | | 9,401,841 | | |
| Target Corp. | | | 355,856 | | | | 20,173,476 | | |
| Total | | | 29,575,317 | | |
| Specialty Retail 1.6% | |
| Best Buy Co., Inc.(a) | | | 139,247 | | | | 3,439,401 | | |
| Home Depot, Inc. (The) | | | 436,857 | | | | 20,781,287 | | |
| Total | | | 24,220,688 | | |
| TOTAL CONSUMER DISCRETIONARY | | | 129,504,756 | | |
| CONSUMER STAPLES 7.5% | |
| Food & Staples Retailing 2.4% | |
| CVS Caremark Corp. | | | 438,537 | | | | 19,778,019 | | |
| Wal-Mart Stores, Inc. | | | 284,040 | | | | 16,781,083 | | |
| Total | | | 36,559,102 | | |
| Food Products 0.3% | |
| Kraft Foods, Inc., Class A | | | 136,264 | | | | 5,187,570 | | |
| Household Products 0.3% | |
| Procter & Gamble Co. (The) | | | 56,053 | | | | 3,784,699 | | |
| Tobacco 4.5% | |
| Lorillard, Inc. | | | 350,013 | | | | 45,879,704 | | |
| Philip Morris International, Inc. | | | 250,913 | | | | 20,956,254 | | |
| Total | | | 66,835,958 | | |
| TOTAL CONSUMER STAPLES | | | 112,367,329 | | |
| ENERGY 13.1% | |
| Energy Equipment & Services 3.2% | |
| Halliburton Co. | | | 644,653 | | | | 23,587,853 | | |
| National Oilwell Varco, Inc. | | | 261,343 | | | | 21,568,638 | | |
| Schlumberger Ltd. | | | 37,464 | | | | 2,907,581 | | |
| Total | | | 48,064,072 | | |
| Oil, Gas & Consumable Fuels 9.9% | |
| Anadarko Petroleum Corp. | | | 254,407 | | | | 21,400,717 | | |
| Apache Corp. | | | 225,672 | | | | 24,356,779 | | |
| Chevron Corp. | | | 279,099 | | | | 30,455,283 | | |
| Exxon Mobil Corp. | | | 474,403 | | | | 41,035,859 | | |
| Occidental Petroleum Corp. | | | 288,088 | | | | 30,067,745 | | |
| Total | | | 147,316,383 | | |
| TOTAL ENERGY | | | 195,380,455 | | |
| Issuer | | Shares | | Value | |
| Common Stocks (continued) | |
| FINANCIALS 18.8% | |
| Capital Markets 2.7% | |
| Goldman Sachs Group, Inc. (The) | | | 243,000 | | | $ | 27,979,020 | | |
| Morgan Stanley | | | 633,255 | | | | 11,740,548 | | |
| Total | | | 39,719,568 | | |
| Commercial Banks 3.2% | |
| CIT Group, Inc.(b) | | | 269,651 | | | | 10,977,492 | | |
| Wells Fargo & Co. | | | 1,191,280 | | | | 37,275,151 | | |
| Total | | | 48,252,643 | | |
| Diversified Financial Services 7.2% | |
| Bank of America Corp. | | | 5,481,828 | | | | 43,690,169 | | |
| Citigroup, Inc. | | | 246,149 | | | | 8,201,685 | | |
| JPMorgan Chase & Co. | | | 1,404,243 | | | | 55,102,495 | | |
| Total | | | 106,994,349 | | |
| Insurance 5.7% | |
| ACE Ltd. | | | 328,347 | | | | 23,545,764 | | |
| Everest Re Group Ltd. | | | 88,498 | | | | 7,774,549 | | |
| MetLife, Inc. | | | 657,785 | | | | 25,357,612 | | |
| Travelers Companies, Inc. (The)(a) | | | 205,467 | | | | 11,910,922 | | |
| XL Group PLC | | | 770,125 | | | | 16,018,600 | | |
| Total | | | 84,607,447 | | |
| TOTAL FINANCIALS | | | 279,574,007 | | |
| HEALTH CARE 11.8% | |
| Biotechnology 1.1% | |
| Gilead Sciences, Inc.(b) | | | 365,330 | | | | 16,622,515 | | |
| Health Care Equipment & Supplies 0.4% | |
| Medtronic, Inc. | | | 183,236 | | | | 6,984,956 | | |
| Health Care Providers & Services 1.8% | |
| UnitedHealth Group, Inc.(a) | | | 354,996 | | | | 19,791,027 | | |
| WellPoint, Inc. | | | 101,738 | | | | 6,677,065 | | |
| Total | | | 26,468,092 | | |
| Life Sciences Tools & Services 2.0% | |
| Agilent Technologies, Inc.(b) | | | 276,462 | | | | 12,059,272 | | |
| Thermo Fisher Scientific, Inc.(b) | | | 312,940 | | | | 17,718,663 | | |
| Total | | | 29,777,935 | | |
| Pharmaceuticals 6.5% | |
| Bristol-Myers Squibb Co. | | | 502,870 | | | | 16,177,328 | | |
| Johnson & Johnson(a) | | | 252,803 | | | | 16,452,419 | | |
| Merck & Co., Inc. | | | 507,702 | | | | 19,378,985 | | |
| Novartis AG, ADR(a) | | | 277,364 | | | | 15,119,112 | | |
| Pfizer, Inc. | | | 1,393,479 | | | | 29,402,407 | | |
| Total | | | 96,530,251 | | |
| TOTAL HEALTH CARE | | | 176,383,749 | | |
| INDUSTRIALS 14.7% | |
| Aerospace & Defense 3.9% | |
| Boeing Co. (The) | | | 242,936 | | | | 18,208,053 | | |
| Honeywell International, Inc. | | | 251,280 | | | | 14,968,750 | | |
| Lockheed Martin Corp.(a) | | | 108,763 | | | | 9,615,737 | | |
| United Technologies Corp. | | | 187,185 | | | | 15,699,206 | | |
| Total | | | 58,491,746 | | |
| Air Freight & Logistics 0.8% | |
| United Parcel Service, Inc., Class B | | | 164,042 | | | | 12,613,189 | | |
The Accompanying Notes to Financial Statements are an integral part of this statement.
7
Columbia Large Cap Value Fund
February 29, 2012
(Percentages represent value of investments compared to net assets)
| Issuer | | Shares | | Value | |
| Common Stocks (continued) | |
| INDUSTRIALS (cont.) | |
| Airlines 0.7% | |
| Delta Air Lines, Inc.(b) | | | 289,359 | | | $ | 2,838,612 | | |
| United Continental Holdings, Inc.(a)(b) | | | 367,967 | | | | 7,598,518 | | |
| Total | | | 10,437,130 | | |
| Electrical Equipment 0.4% | |
| ABB Ltd., ADR(a) | | | 272,644 | | | | 5,586,475 | | |
| Industrial Conglomerates 3.6% | |
| General Electric Co. | | | 1,219,556 | | | | 23,232,542 | | |
| Siemens AG, ADR | | | 143,762 | | | | 14,334,509 | | |
| Tyco International Ltd. | | | 314,761 | | | | 16,310,915 | | |
| Total | | | 53,877,966 | | |
| Machinery 5.0% | |
| Caterpillar, Inc. | | | 220,522 | | | | 25,185,818 | | |
| Deere & Co. | | | 115,881 | | | | 9,610,011 | | |
| Eaton Corp.(a) | | | 248,518 | | | | 12,970,154 | | |
| Illinois Tool Works, Inc. | | | 327,997 | | | | 18,266,153 | | |
| Parker Hannifin Corp. | | | 90,118 | | | | 8,093,498 | | |
| Total | | | 74,125,634 | | |
| Road & Rail 0.3% | |
| CSX Corp.(a) | | | 188,781 | | | | 3,966,289 | | |
| TOTAL INDUSTRIALS | | | 219,098,429 | | |
| INFORMATION TECHNOLOGY 14.3% | |
| Communications Equipment 1.9% | |
| Cisco Systems, Inc. | | | 1,098,830 | | | | 21,844,740 | | |
| Nokia OYJ, ADR(a) | | | 1,237,533 | | | | 6,546,550 | | |
| Total | | | 28,391,290 | | |
| Computers & Peripherals 0.9% | |
| Apple, Inc.(b) | | | 24,366 | | | | 13,217,093 | | |
| Electronic Equipment, Instruments & Components 0.8% | |
| TE Connectivity Ltd.(a) | | | 339,454 | | | | 12,407,044 | | |
| IT Services 3.1% | |
| Accenture PLC, Class A | | | 229,025 | | | | 13,636,148 | | |
| Mastercard, Inc., Class A | | | 76,451 | | | | 32,109,420 | | |
| Total | | | 45,745,568 | | |
| Semiconductors & Semiconductor Equipment 3.0% | |
| Intel Corp. | | | 933,324 | | | | 25,087,749 | | |
| LSI Corp.(b) | | | 1,621,676 | | | | 13,946,414 | | |
| Microchip Technology, Inc.(a) | | | 153,356 | | | | 5,531,551 | | |
| Total | | | 44,565,714 | | |
| Software 4.6% | |
| Microsoft Corp. | | | 1,619,172 | | | | 51,392,519 | | |
| Oracle Corp. | | | 614,438 | | | | 17,984,600 | | |
| Total | | | 69,377,119 | | |
| TOTAL INFORMATION TECHNOLOGY | | | 213,703,828 | | |
| MATERIALS 5.0% | |
| Chemicals 3.2% | |
| Air Products & Chemicals, Inc.(a) | | | 79,576 | | | | 7,180,938 | | |
| Dow Chemical Co. (The) | | | 656,338 | | | | 21,993,887 | | |
| EI du Pont de Nemours & Co. | | | 375,953 | | | | 19,117,210 | | |
| Total | | | 48,292,035 | | |
| Metals & Mining 1.8% | |
| Barrick Gold Corp.(a) | | | 108,081 | | | | 5,158,706 | | |
| Freeport-McMoRan Copper & Gold, Inc. | | | 177,707 | | | | 7,563,210 | | |
| Nucor Corp.(a) | | | 185,719 | | | | 8,084,348 | | |
| Issuer | | Shares | | Value | |
| Common Stocks (continued) | |
| MATERIALS (cont.) | |
| Metals & Mining (cont.) | |
| Rio Tinto PLC, ADR(a) | | | 104,628 | | | $ | 5,956,472 | | |
| Total | | | 26,762,736 | | |
| TOTAL MATERIALS | | | 75,054,771 | | |
| TELECOMMUNICATION SERVICES 3.4% | |
| Diversified Telecommunication Services 3.4% | |
| AT&T, Inc.(a) | | | 987,826 | | | | 30,217,597 | | |
| Deutsche Telekom AG, ADR(a) | | | 577,050 | | | | 6,765,911 | | |
| Verizon Communications, Inc. | | | 338,661 | | | | 12,906,371 | | |
| Total | | | 49,889,879 | | |
| TOTAL TELECOMMUNICATION SERVICES | | | 49,889,879 | | |
| UTILITIES 0.3% | |
| Multi-Utilities 0.3% | |
| PG&E Corp.(a) | | | 107,928 | | | | 4,498,439 | | |
| TOTAL UTILITIES | | | 4,498,439 | | |
Total Common Stocks
(Cost: $1,273,273,832) | | $ | 1,455,455,642 | | |
| Money Market Funds 2.3% | |
| Columbia Short-Term Cash Fund, 0.166%(c)(d) | | | 35,033,376 | | | $ | 35,033,376 | | |
Total Money Market Funds
(Cost: $35,033,376) | | $ | 35,033,376 | | |
| Issuer | | Effective
Yield | | Par/
Principal/
Shares | | Value | |
| Investments of Cash Collateral Received for Securities on Loan 10.8% | |
| Asset-Backed Commercial Paper 1.5% | |
Antalis US Funding Corp.
03/01/12 | | | 0.350 | % | | $ | 9,999,319 | | | $ | 9,999,319 | | |
Rhein-Main Securitisation Ltd.
04/13/12 | | | 0.771 | % | | | 6,991,017 | | | | 6,991,017 | | |
Tasman Funding, Inc.
03/23/12 | | | 0.320 | % | | | 4,998,711 | | | | 4,998,711 | | |
| Total | | | 21,989,047 | | |
| Certificates of Deposit 3.7% | |
ABM AMRO Bank N.V.
03/21/12 | | | 0.310 | % | | | 9,997,503 | | | | 9,997,503 | | |
Australia and New Zealand Bank Group, Ltd.
03/09/12 | | | 0.500 | % | | | 8,000,000 | | | | 8,000,000 | | |
DZ Bank AG
03/12/12 | | | 0.250 | % | | | 5,000,000 | | | | 5,000,000 | | |
FMS Wertmanagement Anstalt Des Oeffentlichen Rechts
03/09/12 | | | 0.330 | % | | | 3,000,000 | | | | 3,000,000 | | |
Hong Kong Shanghai Bank Corp., Ltd.
03/12/12 | | | 0.250 | % | | | 5,000,000 | | | | 5,000,000 | | |
Mitsubishi UFJ Trust and Banking Corp.
05/31/12 | | | 0.390 | % | | | 5,000,064 | | | | 5,000,064 | | |
National Australia Bank
08/16/12 | | | 0.344 | % | | | 3,000,000 | | | | 3,000,000 | | |
The Accompanying Notes to Financial Statements are an integral part of this statement.
8
Columbia Large Cap Value Fund
February 29, 2012
(Percentages represent value of investments compared to net assets)
| Issuer | | Effective
Yield | | Par/
Principal/
Shares | | Value | |
| Investments of Cash Collateral Received for Securities on Loan (continued) | |
| Certificates of Deposit (cont.) | |
Norinchukin Bank
05/21/12 | | | 0.470 | % | | $ | 7,000,000 | | | $ | 7,000,000 | | |
Skandinaviska Enskilda Banken
04/16/12 | | �� | 0.360 | % | | | 9,000,000 | | | | 9,000,000 | | |
| Total | | | 54,997,567 | | |
| Commercial Paper 1.5% | |
Development Bank of Singapore Ltd.
08/02/12 | | | 0.551 | % | | | 4,986,708 | | | | 4,986,708 | | |
Societe Generale
03/06/12 | | | 0.320 | % | | | 4,999,689 | | | | 4,999,689 | | |
State Development Bank of NorthRhine-Westphalia
03/13/12 | | | 0.240 | % | | | 4,999,034 | | | | 4,999,034 | | |
Suncorp Metway Ltd.
04/10/12 | | | 0.480 | % | | | 1,998,373 | | | | 1,998,373 | | |
Swedish National Housing Finance Corp. (SBAB)
03/15/12 | | | 0.350 | % | | | 4,998,542 | | | | 4,998,542 | | |
| Total | | | 21,982,346 | | |
| Issuer | | Effective
Yield | | Par/
Principal/
Shares | | Value | |
| Investments of Cash Collateral Received for Securities on Loan (continued) | |
| Repurchase Agreements 4.1% | |
Credit Suisse Securities (USA) LLC
dated 02/29/12, matures 03/01/12,
repurchase price $5,923,041(e) | |
| | | | 0.160 | % | | $ | 5,923,015 | | | $ | 5,923,015 | | |
Natixis Financial Products, Inc.
dated 02/29/12, matures 03/01/12,
repurchase price $39,000,238(e) | |
| | | | 0.220 | % | | | 39,000,000 | | | | 39,000,000 | | |
Pershing LLC
dated 02/29/12, matures 03/01/12,
repurchase price $2,000,016(e) | |
| | | | 0.290 | % | | | 2,000,000 | | | | 2,000,000 | | |
RBS Securities, Inc.
dated 02/29/12, matures 03/01/12,
repurchase price $15,000,063(e) | |
| | | | 0.150 | % | | | 15,000,000 | | | | 15,000,000 | | |
| Total | | | 61,923,015 | | |
Total Investments of Cash Collateral Received for Securities
on Loan
(Cost: $160,891,975) | | $ | 160,891,975 | | |
Total Investments
(Cost: $1,469,199,183) | | | | | | | | | | $ | 1,651,380,993 | | |
| Other Assets & Liabilities, Net | | | | | | | | | | | (159,731,567 | ) | |
| Net Assets | | $ | 1,491,649,426 | | |
Notes to Portfolio of Investments
(a) At February 29, 2012, security was partially or fully on loan.
(b) Non-income producing.
(c) The rate shown is the seven-day current annualized yield at February 29, 2012.
(d) Investments in affiliates during the year ended February 29, 2012:
| Issuer | | Beginning
Cost | | Purchase
Cost | | Sales Cost/
Proceeds
from Sales | | Realized
Gain/Loss | | Ending
Cost | | Dividends
or Interest
Income | | Value | |
Columbia Short-Term
Cash Fund | | $ | — | | | $ | 316,836,949 | | | $ | (281,803,573 | ) | | $ | — | | | $ | 35,033,376 | | | $ | 22,414 | | | $ | 35,033,376 | | |
(e) The table below represents securities received as collateral for repurchase agreements. This collateral is deposited with the Fund's custodian and, pursuant to the terms of the repurchase agreement, must have an aggregate market value greater than or equal to the repurchase price plus accrued interest at all times. The value of securities and/or cash held as collateral for repurchase agreements is monitored on a daily basis to ensure the proper level of collateral.
Credit Suisse Securities (USA) LLC (0.160%)
| Security Description | | Value | |
| Ginnie Mae I Pool | | $ | 4,240,303 | | |
| Ginnie Mae II Pool | | | 1,801,186 | | |
| Total Market Value of Collateral Securities | | $ | 6,041,489 | | |
The Accompanying Notes to Financial Statements are an integral part of this statement.
9
Columbia Large Cap Value Fund
February 29, 2012
Notes to Portfolio of Investments (continued)
Natixis Financial Products, Inc. (0.220%)
| Security Description | | Value | |
| Fannie Mae Pool | | $ | 1,961,964 | | |
| Fannie Mae REMICS | | | 14,612,041 | | |
| Freddie Mac Gold Pool | | | 1,796,347 | | |
| Freddie Mac REMICS | | | 8,615,963 | | |
| Government National Mortgage Association | | | 2,571,853 | | |
| United States Treasury Note/Bond | | | 10,222,075 | | |
| Total Market Value of Collateral Securities | | $ | 39,780,243 | | |
Pershing LLC (0.290%)
| Security Description | | Value | |
| Fannie Mae Pool | | $ | 326,507 | | |
| Fannie Mae REMICS | | | 275,343 | | |
| Fannie Mae-Aces | | | 2,775 | | |
| Federal Farm Credit Bank | | | 24,674 | | |
| Federal Home Loan Banks | | | 26,538 | | |
| Federal Home Loan Mortgage Corp | | | 62,556 | | |
| Federal National Mortgage Association | | | 77,156 | | |
| Freddie Mac Gold Pool | | | 132,490 | | |
| Freddie Mac Non Gold Pool | | | 37,004 | | |
| Freddie Mac Reference REMIC | | | 9 | | |
| Freddie Mac REMICS | | | 256,456 | | |
| Ginnie Mae I Pool | | | 334,671 | | |
| Ginnie Mae II Pool | | | 298,381 | | |
| Government National Mortgage Association | | | 107,067 | | |
| United States Treasury Note/Bond | | | 73,837 | | |
| United States Treasury Strip Coupon | | | 4,536 | | |
| Total Market Value of Collateral Securities | | $ | 2,040,000 | | |
RBS Securities, Inc. (0.150%)
| Security Description | | Value | |
| United States Treasury Inflation Indexed Bonds | | $ | 3,394,231 | | |
| United States Treasury Strip Coupon | | | 10,333,052 | | |
| United States Treasury Strip Principal | | | 1,572,739 | | |
| Total Market Value of Collateral Securities | | $ | 15,300,022 | | |
Abbreviation Legend
ADR American Depositary Receipt
Fair Value Measurements
Generally accepted accounting principles (GAAP) require disclosure regarding the inputs and valuation techniques used to measure fair value and any changes in valuation inputs or techniques. In addition, investments shall be disclosed by major category.
The Fund categorizes its fair value measurements according to a three-level hierarchy that maximizes the use of observable inputs and minimizes the use of unobservable inputs by prioritizing that the most observable input be used when available. Observable inputs are those that market participants would use in pricing an investment based on market data obtained from sources independent of the reporting entity. Unobservable inputs are those that reflect the Fund's assumptions about the information market participants would use in pricing an investment. An investment's level within the fair value hierarchy is based on the lowest level of any input that is deemed significant to the asset or liability's fair value measurement. The input levels are not necessarily an indication of the risk or liquidity associated with investments at that level. For example, certain U.S. government securities are generally high quality and liquid, however, they are reflected as Level 2 because the inputs used to determine fair value may not always be quoted prices in an active market.
The Accompanying Notes to Financial Statements are an integral part of this statement.
10
Columbia Large Cap Value Fund
February 29, 2012
Fair Value Measurements (continued)
Fair value inputs are summarized in the three broad levels listed below:
• Level 1 — Valuations based on quoted prices for investments in active markets that the Fund has the ability to access at the measurement date (including NAV for open-end mutual funds). Valuation adjustments are not applied to Level 1 investments.
• Level 2 — Valuations based on other significant observable inputs (including quoted prices for similar securities, interest rates, prepayment speeds, credit risks, etc.).
• Level 3 — Valuations based on significant unobservable inputs (including the Fund's own assumptions and judgment in determining the fair value of investments).
Inputs that are used in determining fair value of an investment may include price information, credit data, volatility statistics, and other factors. These inputs can be either observable or unobservable. The availability of observable inputs can vary between investments, and is affected by various factors such as the type of investment, and the volume and level of activity for that investment or similar investments in the marketplace. The inputs will be considered by the Investment Manager, along with any other relevant factors in the calculation of an investment's fair value. The Fund uses prices and inputs that are current as of the measurement date, which may include periods of market dislocations. During these periods, the availability of prices and inputs may be reduced for many investments. This condition could cause an investment to be reclassified between the various levels within the hierarchy.
Investments falling into the Level 3 category are primarily supported by quoted prices from brokers and dealers participating in the market for those investments. However, these may be classified as Level 3 investments due to lack of market transparency and corroboration to support these quoted prices. Additionally, valuation models may be used as the pricing source for any remaining investments classified as Level 3. These models rely on one or more significant unobservable inputs and/or significant assumptions by the Investment Manager. Inputs used in valuations may include, but are not limited to, financial statement analysis, capital account balances, discount rates and estimated cash flows, and comparable company data.
The following table is a summary of the inputs used to value the Fund's investments as of February 29, 2012:
| | | Fair Value at February 29, 2012 | |
| Description(a) | | Level 1
Quoted Prices
in Active
Markets for
Identical Assets | | Level 2
Other
Significant
Observable
Inputs(b) | | Level 3
Significant
Unobservable
Inputs | | Total | |
| Equity Securities | |
| Common Stocks | |
| Consumer Discretionary | | $ | 129,504,756 | | | $ | — | | | $ | — | | | $ | 129,504,756 | | |
| Consumer Staples | | | 112,367,329 | | | | — | | | | — | | | | 112,367,329 | | |
| Energy | | | 195,380,455 | | | | — | | | | — | | | | 195,380,455 | | |
| Financials | | | 279,574,007 | | | | — | | | | — | | | | 279,574,007 | | |
| Health Care | | | 176,383,749 | | | | — | | | | — | | | | 176,383,749 | | |
| Industrials | | | 219,098,429 | | | | — | | | | — | | | | 219,098,429 | | |
| Information Technology | | | 213,703,828 | | | | — | | | | — | | | | 213,703,828 | | |
| Materials | | | 75,054,771 | | | | — | | | | — | | | | 75,054,771 | | |
| Telecommunication Services | | | 49,889,879 | | | | — | | | | — | | | | 49,889,879 | | |
| Utilities | | | 4,498,439 | | | | — | | | | — | | | | 4,498,439 | | |
| Total Equity Securities | | | 1,455,455,642 | | | | — | | | | — | | | | 1,455,455,642 | | |
| Other | |
| Money Market Funds | | | 35,033,376 | | | | — | | | | — | | | | 35,033,376 | | |
| Investments of Cash Collateral Received for Securities on Loan | | | — | | | | 160,891,975 | | | | — | | | | 160,891,975 | | |
| Total Other | | | 35,033,376 | | | | 160,891,975 | | | | — | | | | 195,925,351 | | |
| Total | | $ | 1,490,489,018 | | | $ | 160,891,975 | | | $ | — | | | $ | 1,651,380,993 | | |
The Fund's assets assigned to the Level 2 input category are generally valued using the market approach, in which a security's value is determined through reference to prices and information from market transactions for similar or identical assets.
(a) See the Portfolio of Investments for all investment classifications not indicated in the table.
(b) There were no significant transfers between Levels 1 and 2 during the period.
The Accompanying Notes to Financial Statements are an integral part of this statement.
11
Statement of Assets and Liabilities – Columbia Large Cap Value Fund
February 29, 2012
| Assets | |
| Investments, at value* | |
| Unaffiliated issuers (identified cost $1,273,273,832) | | $ | 1,455,455,642 | | |
| Affiliated issuers (identified cost $35,033,376) | | | 35,033,376 | | |
| Investment of cash collateral received for securities on loan | |
| Short-term securities (identified cost $98,968,960) | | | 98,968,960 | | |
| Repurchase agreements (identified cost $61,923,015) | | | 61,923,015 | | |
| Total investments (identified cost $1,469,199,183) | | | 1,651,380,993 | | |
| Cash | | | 564 | | |
| Receivable for: | |
| Investments sold | | | 3,672,260 | | |
| Capital shares sold | | | 1,200,873 | | |
| Dividends | | | 4,172,516 | | |
| Interest | | | 31,932 | | |
| Reclaims | | | 88,092 | | |
| Expense reimbursement due from Investment Manager | | | 4,383 | | |
| Prepaid expense | | | 22,095 | | |
| Total assets | | | 1,660,573,708 | | |
| Liabilities | |
| Due upon return of securities on loan | | | 160,891,975 | | |
| Payable for: | |
| Investments purchased | | | 3,734,615 | | |
| Capital shares purchased | | | 3,822,953 | | |
| Investment management fees | | | 27,304 | | |
| Distribution and service fees | | | 4,081 | | |
| Transfer agent fees | | | 209,270 | | |
| Administration fees | | | 2,258 | | |
| Other expenses | | | 231,826 | | |
| Total liabilities | | | 168,924,282 | | |
| Net assets applicable to outstanding capital stock | | $ | 1,491,649,426 | | |
The Accompanying Notes to Financial Statements are an integral part of this statement.
12
Statement of Assets and Liabilities (continued) – Columbia Large Cap Value Fund
February 29, 2012
| Represented by | |
| Paid-in capital | | $ | 1,724,669,432 | | |
| Undistributed net investment income | | | 4,148,438 | | |
| Accumulated net realized loss | | | (419,350,254 | ) | |
| Unrealized appreciation (depreciation) on: | |
| Investments | | | 182,181,810 | | |
| Total — representing net assets applicable to outstanding capital stock | | $ | 1,491,649,426 | | |
| *Value of securities on loan | | $ | 156,909,311 | | |
| Net assets applicable to outstanding shares | |
| Class A | | $ | 418,906,263 | | |
| Class B | | $ | 16,489,479 | | |
| Class C | | $ | 26,274,170 | | |
| Class I | | $ | 2,853 | | |
| Class R | | $ | 1,419,898 | | |
| Class W | | $ | 2,851 | | |
| Class Y | | $ | 6,602,104 | | |
| Class Z | | $ | 1,021,951,808 | | |
| Shares outstanding | |
| Class A | | | 35,994,193 | | |
| Class B | | | 1,473,174 | | |
| Class C | | | 2,346,830 | | |
| Class I | | | 244 | | |
| Class R | | | 122,007 | | |
| Class W | | | 245 | | |
| Class Y | | | 565,482 | | |
| Class Z | | | 87,627,196 | | |
| Net asset value per share | |
| Class A(a) | | $ | 11.64 | | |
| Class B | | $ | 11.19 | | |
| Class C | | $ | 11.20 | | |
| Class I | | $ | 11.69 | | |
| Class R | | $ | 11.64 | | |
| Class W | | $ | 11.64 | | |
| Class Y | | $ | 11.68 | | |
| Class Z | | $ | 11.66 | | |
(a) The maximum offering price per share for Class A is $12.35. The offering price is calculated by dividing the net asset value by 1.0 minus the maximum sales charge of 5.75%.
The Accompanying Notes to Financial Statements are an integral part of this statement.
13
Statement of Operations – Columbia Large Cap Value Fund
Year ended February 29, 2012
| Net investment income | |
| Income: | |
| Dividends | | $ | 35,997,297 | | |
| Dividends from affiliates | | | 22,414 | | |
| Income from securities lending — net | | | 128,220 | | |
| Foreign taxes withheld | | | (205,548 | ) | |
| Total income | | | 35,942,383 | | |
| Expenses: | |
| Investment management fees | | | 9,815,325 | | |
| Distribution fees | |
| Class B | | | 195,761 | | |
| Class C | | | 220,467 | | |
| Class R | | | 5,868 | | |
| Service fees | |
| Class B | | | 65,254 | | |
| Class C | | | 73,489 | | |
| Class W | | | 7 | | |
| Distribution and service fees — Class A | | | 1,099,870 | | |
| Transfer agent fees | |
| Class A | | | 830,542 | | |
| Class B | | | 48,453 | | |
| Class C | | | 53,480 | | |
| Class R | | | 1,880 | | |
| Class W | | | 4 | | |
| Class Y | | | 21 | | |
| Class Z | | | 1,994,606 | | |
| Administration fees | | | 1,573,639 | | |
| Compensation of board members | | | 66,907 | | |
| Pricing and bookkeeping fees | | | 59,100 | | |
| Custodian fees | | | 32,106 | | |
| Printing and postage fees | | | 58,448 | | |
| Registration fees | | | 77,750 | | |
| Professional fees | | | 59,457 | | |
| Chief compliance officer expenses | | | 279 | | |
| Other | | | 63,256 | | |
| Total expenses | | | 16,395,969 | | |
| Fees waived or expenses reimbursed by Investment Manager and its affiliates | | | (1,084,047 | ) | |
| Expense reductions | | | (36,791 | ) | |
| Total net expenses | | | 15,275,131 | | |
| Net investment income | | | 20,667,252 | | |
| Realized and unrealized gain (loss) — net | |
| Net realized gain (loss) on: | |
| Investments | | | 219,248,810 | | |
| Foreign currency translations | | | (37,213 | ) | |
| Forward foreign currency exchange contracts | | | 38,358 | | |
| Net realized gain | | | 219,249,955 | | |
| Net change in unrealized appreciation (depreciation) on: | |
| Investments | | | (302,758,214 | ) | |
| Net change in unrealized depreciation | | | (302,758,214 | ) | |
| Net realized and unrealized loss | | | (83,508,259 | ) | |
| Net decrease in net assets from operations | | $ | (62,841,007 | ) | |
The Accompanying Notes to Financial Statements are an integral part of this statement.
14
Statement of Changes in Net Assets – Columbia Large Cap Value Fund
| | | Year ended
February 29,
2012 | | Year ended
Februrary 28,
2011(a) | |
| Operations | |
| Net investment income | | $ | 20,667,252 | | | $ | 24,251,398 | | |
| Net realized gain | | | 219,249,955 | | | | 233,872,369 | | |
| Net change in unrealized appreciation (depreciation) | | | (302,758,214 | ) | | | 124,489,315 | | |
| Net increase (decrease) in net assets resulting from operations | | | (62,841,007 | ) | | | 382,613,082 | | |
| Distributions to shareholders from: | |
| Net investment income | |
| Class A | | | (3,791,237 | ) | | | (6,790,082 | ) | |
| Class B | | | (56,167 | ) | | | (323,287 | ) | |
| Class C | | | (72,197 | ) | | | (213,772 | ) | |
| Class I | | | (247,786 | ) | | | (533,119 | ) | |
| Class R | | | (7,381 | ) | | | (9,893 | ) | |
| Class W | | | (27 | ) | | | (8 | ) | |
| Class Y | | | (79,940 | ) | | | (193,638 | ) | |
| Class Z | | | (12,189,936 | ) | | | (18,764,224 | ) | |
| Total distributions to shareholders | | | (16,444,671 | ) | | | (26,828,023 | ) | |
| Increase (decrease) in net assets from share transactions | | | (523,674,599 | ) | | | (589,141,795 | ) | |
| Proceeds from regulatory settlements (Note7) | | | 7,701 | | | | — | | |
| Total decrease in net assets | | | (602,952,576 | ) | | | (233,356,736 | ) | |
| Net assets at beginning of year | | | 2,094,602,002 | | | | 2,327,958,738 | | |
| Net assets at end of year | | $ | 1,491,649,426 | | | $ | 2,094,602,002 | | |
| Undistributed (excess of distributions over) net investment income | | $ | 4,148,438 | | | $ | (36,125 | ) | |
(a) Class I and Class W shares are for the period from September 27, 2010 (commencement of operations) to February 28, 2011.
The Accompanying Notes to Financial Statements are an integral part of this statement.
15
Statement of Changes in Net Assets (continued) – Columbia Large Cap Value Fund
| | | Year ended February 29,
2012 | | Year ended February 28,
2011(a) | |
| | | Shares | | Dollars ($) | | Shares | | Dollars ($) | |
| Capital stock activity | |
| Class A shares | |
| Subscriptions(b) | | | 2,516,984 | | | | 28,006,998 | | | | 6,629,664 | | | | 70,755,262 | | |
| Distributions reinvested | | | 286,957 | | | | 3,023,396 | | | | 514,131 | | | | 5,387,726 | | |
| Redemptions | | | (10,020,773 | ) | | | (110,684,735 | ) | | | (52,463,069 | ) | | | (540,167,576 | ) | |
| Net decrease | | | (7,216,832 | ) | | | (79,654,341 | ) | | | (45,319,274 | ) | | | (464,024,588 | ) | |
| Class B shares | |
| Subscriptions | | | 12,309 | | | | 132,984 | | | | 49,453 | | | | 496,866 | | |
| Distributions reinvested | | | 4,559 | | | | 44,511 | | | | 23,701 | | | | 238,802 | | |
| Redemptions(b) | | | (2,284,160 | ) | | | (24,546,532 | ) | | | (6,267,231 | ) | | | (64,270,104 | ) | |
| Net decrease | | | (2,267,292 | ) | | | (24,369,037 | ) | | | (6,194,077 | ) | | | (63,534,436 | ) | |
| Class C shares | |
| Subscriptions | | | 137,370 | | | | 1,461,967 | | | | 168,724 | | | | 1,739,351 | | |
| Distributions reinvested | | | 5,696 | | | | 55,644 | | | | 15,667 | | | | 158,109 | | |
| Redemptions | | | (931,321 | ) | | | (9,936,545 | ) | | | (880,581 | ) | | | (8,998,327 | ) | |
| Net decrease | | | (788,255 | ) | | | (8,418,934 | ) | | | (696,190 | ) | | | (7,100,867 | ) | |
| Class I shares | |
| Subscriptions | | | 208,708 | | | | 2,492,014 | | | | 16,236,077 | | | | 172,515,838 | | |
| Distributions reinvested | | | 21,122 | | | | 247,752 | | | | 47,136 | | | | 533,108 | | |
| Redemptions | | | (10,457,952 | ) | | | (123,524,428 | ) | | | (6,054,847 | ) | | | (69,040,190 | ) | |
| Net increase (decrease) | | | (10,228,122 | ) | | | (120,784,662 | ) | | | 10,228,366 | | | | 104,008,756 | | |
| Class R shares | |
| Subscriptions | | | 52,204 | | | | 568,939 | | | | 98,178 | | | | 980,433 | | |
| Distributions reinvested | | | 707 | | | | 7,351 | | | | 939 | | | | 9,893 | | |
| Redemptions | | | (31,949 | ) | | | (351,744 | ) | | | (23,133 | ) | | | (273,944 | ) | |
| Net increase | | | 20,962 | | | | 224,546 | | | | 75,984 | | | | 716,382 | | |
| Class W shares | |
| Subscriptions | | | — | | | | — | | | | 259 | | | | 2,650 | | |
| Redemptions | | | — | | | | — | | | | (14 | ) | | | (154 | ) | |
| Net increase | | | — | | | | — | | | | 245 | | | | 2,496 | | |
| Class Y shares | |
| Subscriptions | | | 28,100 | | | | 289,000 | | | | 12,987 | | | | 130,000 | | |
| Distributions reinvested | | | 15 | | | | 162 | | | | 19 | | | | 203 | | |
| Redemptions | | | (56,388 | ) | | | (595,126 | ) | | | (557,752 | ) | | | (6,260,373 | ) | |
| Net decrease | | | (28,273 | ) | | | (305,964 | ) | | | (544,746 | ) | | | (6,130,170 | ) | |
| Class Z shares | |
| Subscriptions | | | 8,668,714 | | | | 95,993,762 | | | | 13,465,877 | | | | 141,147,347 | | |
| Distributions reinvested | | | 775,119 | | | | 8,249,986 | | | | 1,145,900 | | | | 12,055,399 | | |
| Redemptions | | | (35,561,203 | ) | | | (394,609,955 | ) | | | (28,724,028 | ) | | | (306,282,114 | ) | |
| Net decrease | | | (26,117,370 | ) | | | (290,366,207 | ) | | | (14,112,251 | ) | | | (153,079,368 | ) | |
| Total net decrease | | | (46,625,182 | ) | | | (523,674,599 | ) | | | (56,561,943 | ) | | | (589,141,795 | ) | |
(a) Class I and Class W shares are for the period from September 27, 2010 (commencement of operations) to February 28, 2011.
(b) Includes conversions of Class B shares to Class A shares, if any.
The Accompanying Notes to Financial Statements are an integral part of this statement.
16
Financial Highlights – Columbia Large Cap Value Fund
The following tables are intended to help you understand the Fund's financial performance. Certain information reflects financial results for a single share of a class held for the periods shown. Per share net investment income (loss) amounts are calculated based on average shares outstanding during the period. Total returns assume reinvestment of all dividends and distributions. Total returns do not reflect payments of sales charges, if any, and are not annualized for periods of less than one year.
| | | Year ended
Feb. 29, | | Year ended Feb. 28, | | Year ended
Feb. 29, | |
| | | 2012 | | 2011 | | 2010 | | 2009 | | 2008 | |
| Class A | |
| Per share data | |
| Net asset value, beginning of period | | $ | 11.98 | | | $ | 10.07 | | | $ | 7.00 | | | $ | 12.37 | | | $ | 15.16 | | |
| Income from investment operations: | |
| Net investment income | | | 0.12 | | | | 0.11 | (a) | | | 0.09 | | | | 0.18 | | | | 0.20 | | |
| Net realized and unrealized gain (loss) | | | (0.36 | ) | | | 1.93 | | | | 3.08 | | | | (5.36 | ) | | | (1.14 | ) | |
| Total from investment operations | | | (0.24 | ) | | | 2.04 | | | | 3.17 | | | | (5.18 | ) | | | (0.94 | ) | |
| Less distributions to shareholders from: | |
| Net investment income | | | (0.10 | ) | | | (0.13 | ) | | | (0.10 | ) | | | (0.19 | ) | | | (0.22 | ) | |
| Net realized gains | | | — | | | | — | | | | — | | | | — | | | | (1.63 | ) | |
| Total distributions to shareholders | | | (0.10 | ) | | | (0.13 | ) | | | (0.10 | ) | | | (0.19 | ) | | | (1.85 | ) | |
| Proceeds from regulatory settlement | | | 0.00 | (b) | | | — | | | | 0.00 | (b) | | | — | | | | — | | |
| Net asset value, end of period | | $ | 11.64 | | | $ | 11.98 | | | $ | 10.07 | | | $ | 7.00 | | | $ | 12.37 | | |
| Total return | | | (1.94 | %) | | | 20.45 | % | | | 45.49 | % | | | (42.36 | %) | | | (7.55 | %) | |
| Ratios to average net assets(c) | |
| Expenses prior to fees waived or expenses reimbursed (including interest expense) | | | 1.16 | % | | | 1.18 | %(d) | | | 1.13 | % | | | 1.10 | %(d) | | | 1.05 | % | |
| Net expenses after fees waived or expenses reimbursed (including interest expense)(e) | | | 1.09 | %(f) | | | 1.18 | %(d)(f) | | | 1.12 | %(f) | | | 1.04 | %(d)(f) | | | 0.99 | %(f) | |
| Expenses prior to fees waived or expenses reimbursed (excluding interest expense) | | | 1.16 | % | | | 1.18 | % | | | 1.13 | % | | | 1.10 | % | | | 1.05 | % | |
| Net expenses after fees waived or expenses reimbursed (excluding interest expense)(e) | | | 1.09 | %(f) | | | 1.18 | %(f) | | | 1.12 | %(f) | | | 1.04 | %(f) | | | 0.99 | %(f) | |
| Net investment income | | | 1.13 | %(f) | | | 1.02 | %(f) | | | 0.95 | %(f) | | | 1.68 | %(f) | | | 1.37 | %(f) | |
| Supplemental data | |
| Net assets, end of period (in thousands) | | $ | 418,906 | | | $ | 517,861 | | | $ | 891,894 | | | $ | 672,426 | | | $ | 1,262,700 | | |
| Portfolio turnover | | | 74 | % | | | 79 | % | | | 61 | % | | | 61 | % | | | 62 | % | |
| Notes to Financial Highlights | |
(a) Net investment income per share reflects special dividends. The effect of these dividends amounted to $0.04 per share.
(b) Rounds to less than $0.01.
(c) In addition to the fees and expenses which the Fund bears directly, the Fund indirectly bears a pro rata share of the fees and expenses of the acquired funds in which it invests. Such indirect expenses are not included in the reported expense ratios.
(d) Includes interest expense which rounds to less than 0.01%.
(e) The Investment Manager and certain of its affiliates agreed to waive/reimburse certain fees and expenses, if applicable.
(f) The benefits derived from expense reductions had an impact of less than 0.01%.
The Accompanying Notes to Financial Statements are an integral part of this statement.
17
Financial Highlights (continued) – Columbia Large Cap Value Fund
| | | Year ended
Feb. 29, | | Year ended Feb. 28, | | Year ended
Feb. 29, | |
| | | 2012 | | 2011 | | 2010 | | 2009 | | 2008 | |
| Class B | |
| Per share data | |
| Net asset value, beginning of period | | $ | 11.54 | | | $ | 9.72 | | | $ | 6.75 | | | $ | 11.94 | | | $ | 14.69 | | |
| Income from investment operations: | |
| Net investment income | | | 0.04 | | | | 0.03 | (a) | | | 0.02 | | | | 0.09 | | | | 0.09 | | |
| Net realized and unrealized gain (loss) | | | (0.36 | ) | | | 1.85 | | | | 2.99 | | | | (5.17 | ) | | | (1.10 | ) | |
| Total from investment operations | | | (0.32 | ) | | | 1.88 | | | | 3.01 | | | | (5.08 | ) | | | (1.01 | ) | |
| Less distributions to shareholders from: | |
| Net investment income | | | (0.03 | ) | | | (0.06 | ) | | | (0.04 | ) | | | (0.11 | ) | | | (0.11 | ) | |
| Net realized gains | | | — | | | | — | | | | — | | | | — | | | | (1.63 | ) | |
| Total distributions to shareholders | | | (0.03 | ) | | | (0.06 | ) | | | (0.04 | ) | | | (0.11 | ) | | | (1.74 | ) | |
| Proceeds from regulatory settlement | | | 0.00 | (b) | | | — | | | | 0.00 | (b) | | | — | | | | — | | |
| Net asset value, end of period | | $ | 11.19 | | | $ | 11.54 | | | $ | 9.72 | | | $ | 6.75 | | | $ | 11.94 | | |
| Total return | | | (2.76 | %) | | | 19.48 | % | | | 44.59 | % | | | (42.84 | %) | | | (8.24 | %) | |
| Ratios to average net assets(c) | |
| Expenses prior to fees waived or expenses reimbursed (including interest expense) | | | 1.91 | % | | | 1.93 | %(d) | | | 1.88 | % | | | 1.85 | %(d) | | | 1.80 | % | |
| Net expenses after fees waived or expenses reimbursed (including interest expense)(e) | | | 1.83 | %(f) | | | 1.93 | %(d)(f) | | | 1.87 | %(f) | | | 1.79 | %(d)(f) | | | 1.74 | %(f) | |
| Expenses prior to fees waived or expenses reimbursed (excluding interest expense) | | | 1.91 | % | | | 1.93 | % | | | 1.88 | % | | | 1.85 | % | | | 1.80 | % | |
| Net expenses after fees waived or expenses reimbursed (excluding interest expense)(e) | | | 1.83 | %(f) | | | 1.93 | %(f) | | | 1.87 | %(f) | | | 1.79 | %(f) | | | 1.74 | %(f) | |
| Net investment income | | | 0.33 | %(f) | | | 0.32 | %(f) | | | 0.23 | %(f) | | | 0.89 | %(f) | | | 0.60 | %(f) | |
| Supplemental data | |
| Net assets, end of period (in thousands) | | $ | 16,489 | | | $ | 43,173 | | | $ | 96,524 | | | $ | 127,489 | | | $ | 346,218 | | |
| Portfolio turnover | | | 74 | % | | | 79 | % | | | 61 | % | | | 61 | % | | | 62 | % | |
| Notes to Financial Highlights | |
(a) Net investment income per share reflects special dividends. The effect of these dividends amounted to $0.04 per share.
(b) Rounds to less than $0.01.
(c) In addition to the fees and expenses which the Fund bears directly, the Fund indirectly bears a pro rata share of the fees and expenses of the acquired funds in which it invests. Such indirect expenses are not included in the reported expense ratios.
(d) Includes interest expense which rounds to less than 0.01%.
(e) The Investment Manager and certain of its affiliates agreed to waive/reimburse certain fees and expenses, if applicable.
(f) The benefits derived from expense reductions had an impact of less than 0.01%.
The Accompanying Notes to Financial Statements are an integral part of this statement.
18
Financial Highlights (continued) – Columbia Large Cap Value Fund
| | | Year ended
Feb. 29, | | Year ended Feb. 28, | | Year ended
Feb. 29, | |
| | | 2012 | | 2011 | | 2010 | | 2009 | | 2008 | |
| Class C | |
| Per share data | |
| Net asset value, beginning of period | | $ | 11.54 | | | $ | 9.72 | | | $ | 6.75 | | | $ | 11.94 | | | $ | 14.69 | | |
| Income from investment operations: | |
| Net investment income | | | 0.04 | | | | 0.03 | (a) | | | 0.02 | | | | 0.09 | | | | 0.09 | | |
| Net realized and unrealized gain (loss) | | | (0.35 | ) | | | 1.85 | | | | 2.99 | | | | (5.17 | ) | | | (1.10 | ) | |
| Total from investment operations | | | (0.31 | ) | | | 1.88 | | | | 3.01 | | | | (5.08 | ) | | | (1.01 | ) | |
| Less distributions to shareholders from: | |
| Net investment income | | | (0.03 | ) | | | (0.06 | ) | | | (0.04 | ) | | | (0.11 | ) | | | (0.11 | ) | |
| Net realized gains | | | — | | | | — | | | | — | | | | — | | | | (1.63 | ) | |
| Total distributions to shareholders | | | (0.03 | ) | | | (0.06 | ) | | | (0.04 | ) | | | (0.11 | ) | | | (1.74 | ) | |
| Proceeds from regulatory settlement | | | 0.00 | (b) | | | — | | | | 0.00 | (b) | | | — | | | | — | | |
| Net asset value, end of period | | $ | 11.20 | | | $ | 11.54 | | | $ | 9.72 | | | $ | 6.75 | | | $ | 11.94 | | |
| Total return | | | (2.68 | %) | | | 19.48 | % | | | 44.59 | % | | | (42.84 | %) | | | (8.24 | %) | |
| Ratios to average net assets(c) | |
| Expenses prior to fees waived or expenses reimbursed (including interest expense) | | | 1.91 | % | | | 1.93 | %(d) | | | 1.88 | % | | | 1.85 | %(d) | | | 1.80 | % | |
| Net expenses after fees waived or expenses reimbursed (including interest expense)(e) | | | 1.84 | %(f) | | | 1.93 | %(d)(f) | | | 1.87 | %(f) | | | 1.79 | %(d)(f) | | | 1.74 | %(f) | |
| Expenses prior to fees waived or expenses reimbursed (excluding interest expense) | | | 1.91 | % | | | 1.93 | % | | | 1.88 | % | | | 1.85 | % | | | 1.80 | % | |
| Net expenses after fees waived or expenses reimbursed (excluding interest expense)(e) | | | 1.84 | %(f) | | | 1.93 | %(f) | | | 1.87 | %(f) | | | 1.79 | %(f) | | | 1.74 | %(f) | |
| Net investment income | | | 0.37 | %(f) | | | 0.32 | %(f) | | | 0.21 | %(f) | | | 0.90 | %(f) | | | 0.60 | %(f) | |
| Supplemental data | |
| Net assets, end of period (in thousands) | | $ | 26,274 | | | $ | 36,187 | | | $ | 37,229 | | | $ | 31,091 | | | $ | 70,383 | | |
| Portfolio turnover | | | 74 | % | | | 79 | % | | | 61 | % | | | 61 | % | | | 62 | % | |
| Notes to Financial Highlights | |
(a) Net investment income per share reflects special dividends. The effect of these dividends amounted to $0.04 per share.
(b) Rounds to less than $0.01.
(c) In addition to the fees and expenses which the Fund bears directly, the Fund indirectly bears a pro rata share of the fees and expenses of the acquired funds in which it invests. Such indirect expenses are not included in the reported expense ratios.
(d) Includes interest expense which rounds to less than 0.01%.
(e) The Investment Manager and certain of its affiliates agreed to waive/reimburse certain fees and expenses, if applicable.
(f) The benefits derived from expense reductions had an impact of less than 0.01%.
The Accompanying Notes to Financial Statements are an integral part of this statement.
19
Financial Highlights (continued) – Columbia Large Cap Value Fund
| | | Year ended
Feb. 29,
2012 | | Year ended
Feb. 28,
2011(a) | |
| Class I | |
| Per share data | |
| Net asset value, beginning of period | | $ | 12.03 | | | $ | 10.23 | | |
| Income from investment operations: | |
| Net investment income | | | 0.17 | | | | 0.05 | | |
| Net realized and unrealized gain (loss) | | | (0.37 | ) | | | 1.80 | | |
| Total from investment operations | | | (0.20 | ) | | | 1.85 | | |
| Less distributions to shareholders from: | |
| Net investment income | | | (0.14 | ) | | | (0.05 | ) | |
| Total distributions to shareholders | | | (0.14 | ) | | | (0.05 | ) | |
| Proceeds from regulatory settlement | | | 0.00 | (b) | | | — | | |
| Net asset value, end of period | | $ | 11.69 | | | $ | 12.03 | | |
| Total return | | | (1.57 | %) | | | 18.07 | % | |
| Ratios to average net assets(c) | |
| Expenses prior to fees waived or expenses reimbursed | | | 0.71 | % | | | 0.70 | %(d) | |
| Net expenses after fees waived or expenses reimbursed(e) | | | 0.71 | %(f) | | | 0.70 | %(d)(f) | |
| Net investment income | | | 1.45 | %(f) | | | 1.04 | %(d)(f) | |
| Supplemental data | |
| Net assets, end of period (in thousands) | | $ | 3 | | | $ | 123,018 | | |
| Portfolio turnover | | | 74 | % | | | 79 | % | |
Notes to Financial Highlights
(a) For the period from September 27, 2010 (commencement of operations) to February 28, 2011.
(b) Rounds to less than $0.01.
(c) In addition to the fees and expenses which the Fund bears directly, the Fund indirectly bears a pro rata share of the fees and expenses of the acquired funds in which it invests. Such indirect expenses are not included in the reported expense ratios.
(d) Annualized.
(e) The Investment Manager and certain of its affiliates agreed to waive/reimburse certain fees and expenses, if applicable.
(f) The benefits derived from expense reductions had an impact of less than 0.01%.
The Accompanying Notes to Financial Statements are an integral part of this statement.
20
Financial Highlights (continued) – Columbia Large Cap Value Fund
| | | Year ended
Feb. 29, | | Year ended Feb. 28, | | Year ended
Feb. 29, | |
| | | 2012 | | 2011 | | 2010 | | 2009 | | 2008 | |
| Class R | |
| Per share data | |
| Net asset value, beginning of period | | $ | 11.98 | | | $ | 10.07 | | | $ | 6.99 | | | $ | 12.36 | | | $ | 15.15 | | |
| Income from investment operations: | |
| Net investment income | | | 0.10 | | | | 0.06 | (a) | | | 0.07 | | | | 0.15 | | | | 0.22 | | |
| Net realized and unrealized gain (loss) | | | (0.37 | ) | | | 1.95 | | | | 3.09 | | | | (5.36 | ) | | | (1.19 | ) | |
| Total from investment operations | | | (0.27 | ) | | | 2.01 | | | | 3.16 | | | | (5.21 | ) | | | (0.97 | ) | |
| Less distributions to shareholders from: | |
| Net investment income | | | (0.07 | ) | | | (0.10 | ) | | | (0.08 | ) | | | (0.16 | ) | | | (0.19 | ) | |
| Net realized gains | | | — | | | | — | | | | — | | | | — | | | | (1.63 | ) | |
| Total distributions to shareholders | | | (0.07 | ) | | | (0.10 | ) | | | (0.08 | ) | | | (0.16 | ) | | | (1.82 | ) | |
| Proceeds from regulatory settlement | | | 0.00 | (b) | | | — | | | | 0.00 | (b) | | | — | | | | — | | |
| Net asset value, end of period | | $ | 11.64 | | | $ | 11.98 | | | $ | 10.07 | | | $ | 6.99 | | | $ | 12.36 | | |
| Total return | | | (2.19 | %) | | | 20.16 | % | | | 45.34 | % | | | (42.54 | %) | | | (7.79 | %) | |
| Ratios to average net assets(c) | |
| Expenses prior to fees waived or expenses reimbursed (including interest expense) | | | 1.38 | % | | | 1.43 | %(d) | | | 1.38 | % | | | 1.35 | %(d) | | | 1.30 | % | |
| Net expenses after fees waived or expenses reimbursed (including interest expense)(e) | | | 1.31 | %(f) | | | 1.43 | %(d)(f) | | | 1.37 | %(f) | | | 1.29 | %(d)(f) | | | 1.24 | %(f) | |
| Expenses prior to fees waived or expenses reimbursed (excluding interest expense) | | | 1.38 | % | | | 1.43 | % | | | 1.38 | % | | | 1.35 | % | | | 1.30 | % | |
| Net expenses after fees waived or expenses reimbursed (excluding interest expense)(e) | | | 1.31 | %(f) | | | 1.43 | %(f) | | | 1.37 | %(f) | | | 1.29 | %(f) | | | 1.24 | %(f) | |
| Net investment income | | | 0.94 | %(f) | | | 0.59 | %(f) | | | 0.71 | %(f) | | | 1.45 | %(f) | | | 1.63 | %(f) | |
| Supplemental data | |
| Net assets, end of period (in thousands) | | $ | 1,420 | | | $ | 1,211 | | | $ | 252 | | | $ | 147 | | | $ | 236 | | |
| Portfolio turnover | | | 74 | % | | | 79 | % | | | 61 | % | | | 61 | % | | | 62 | % | |
Notes to Financial Highlights
(a) Net investment income per share reflects special dividends. The effect of these dividends amounted to $0.04 per share.
(b) Rounds to less than $0.01.
(c) In addition to the fees and expenses which the Fund bears directly, the Fund indirectly bears a pro rata share of the fees and expenses of the acquired funds in which it invests. Such indirect expenses are not included in the reported expense ratios.
(d) Includes interest expense which rounds to less than 0.01%.
(e) The Investment Manager and certain of its affiliates agreed to waive/reimburse certain fees and expenses, if applicable.
(f) The benefits derived from expense reductions had an impact of less than 0.01%.
The Accompanying Notes to Financial Statements are an integral part of this statement.
21
Financial Highlights (continued) – Columbia Large Cap Value Fund
| | | Year ended
Feb. 29,
2012 | | Year ended
Feb. 28.
2011(a) | |
| Class W | |
| Per share data | |
| Net asset value, beginning of period | | $ | 11.99 | | | $ | 10.21 | | |
| Income from investment operations: | |
| Net investment income (loss) | | | 0.14 | | | | 0.03 | | |
| Net realized and unrealized gain (loss) | | | (0.38 | ) | | | 1.78 | | |
| Total from investment operations | | | (0.24 | ) | | | 1.81 | | |
| Less distributions to shareholders from: | |
| Net investment income | | | (0.11 | ) | | | (0.03 | ) | |
| Total distributions to shareholders | | | (0.11 | ) | | | (0.03 | ) | |
| Proceeds from regulatory settlement | | | 0.00 | (b) | | | — | | |
| Net asset value, end of period | | $ | 11.64 | | | $ | 11.99 | | |
| Total return | | | (1.94 | %) | | | 17.79 | % | |
| Ratios to average net assets(c) | |
| Expenses prior to fees waived or expenses reimbursed | | | 1.09 | % | | | 1.22 | %(d) | |
| Net expenses after fees waived or expenses reimbursed(e) | | | 1.01 | %(f) | | | 1.22 | %(d)(f) | |
| Net investment income | | | 1.22 | %(f) | | | 0.54 | %(d)(f) | |
| Supplemental data | |
| Net assets, end of period (in thousands) | | $ | 3 | | | $ | 3 | | |
| Portfolio turnover | | | 74 | % | | | 79 | % | |
Notes to Financial Highlights
(a) For the period from September 27, 2010 (commencement of operations) to February 28, 2011.
(b) Rounds to less than $0.01.
(c) In addition to the fees and expenses which the Fund bears directly, the Fund indirectly bears a pro rata share of the fees and expenses of the acquired funds in which it invests. Such indirect expenses are not included in the reported expense ratios.
(d) Annualized.
(e) The Investment Manager and certain of its affiliates agreed to waive/reimburse certain fees and expenses, if applicable.
(f) The benefits derived from expense reductions had an impact of less than 0.01%.
The Accompanying Notes to Financial Statements are an integral part of this statement.
22
Financial Highlights (continued) – Columbia Large Cap Value Fund
| | | Year ended
Feb. 29, | | Year ended Feb. 28, | |
| | | 2012 | | 2011 | | 2010(a) | |
| Class Y | |
| Per share data | |
| Net asset value, beginning of period | | $ | 12.02 | | | $ | 10.10 | | | $ | 8.65 | | |
| Income from investment operations: | |
| Net investment income | | | 0.17 | | | | 0.17 | (b) | | | 0.08 | | |
| Net realized and unrealized gain (loss) | | | (0.37 | ) | | | 1.92 | | | | 1.45 | | |
| Total from investment operations | | | (0.20 | ) | | | 2.09 | | | | 1.53 | | |
| Less distributions to shareholders from: | |
| Net investment income | | | (0.14 | ) | | | (0.17 | ) | | | (0.08 | ) | |
| Total distributions to shareholders | | | (0.14 | ) | | | (0.17 | ) | | | (0.08 | ) | |
| Proceeds from regulatory settlement | | | 0.00 | (c) | | | — | | | | — | | |
| Net asset value, end of period | | $ | 11.68 | | | $ | 12.02 | | | $ | 10.10 | | |
| Total return | | | (1.58 | %) | | | 20.98 | % | | | 17.67 | % | |
| Ratios to average net assets(d) | |
| Expenses prior to fees waived or expenses reimbursed (including interest expense) | | | 0.73 | % | | | 0.71 | %(e) | | | 0.72 | %(f) | |
| Net expenses prior to fees waived or expenses reimbursed (including interest expense)(g) | | | 0.73 | %(h) | | | 0.71 | %(e)(h) | | | 0.72 | %(f)(h) | |
| Expenses prior to fees waived or expenses reimbursed (excluding interest expense) | | | 0.73 | % | | | 0.71 | % | | | 0.72 | %(f) | |
| Net expenses prior to fees waived or expenses reimbursed (excluding interest expense)(g) | | | 0.73 | %(h) | | | 0.71 | %(h) | | | 0.72 | %(f)(h) | |
| Net investment income | | | 1.50 | %(h) | | | 1.62 | %(h) | | | 1.36 | %(f)(h) | |
| Supplemental data | |
| Net assets, end of period (in thousands) | | $ | 6,602 | | | $ | 7,138 | | | $ | 11,497 | | |
| Portfolio turnover | | | 74 | % | | | 79 | % | | | 61 | % | |
Notes to Financial Highlights
(a) For the period from July 15, 2009 (commencement of operations) to February 28, 2010.
(b) Net investment income per share reflects special dividends. The effect of these dividends amounted to $0.04 per share.
(c) Rounds to less than $0.01.
(d) In addition to the fees and expenses which the Fund bears directly, the Fund indirectly bears a pro rata share of the fees and expenses of the acquired funds in which it invests. Such indirect expenses are not included in the reported expense ratios.
(e) Includes interest expense which rounds to less than 0.01%.
(f) Annualized.
(g) The Investment Manager and certain of its affiliates agreed to waive/reimburse certain fees and expenses, if applicable.
(h) The benefits derived from expense reductions had an impact of less than 0.01%.
The Accompanying Notes to Financial Statements are an integral part of this statement.
23
Financial Highlights (continued) – Columbia Large Cap Value Fund
| | | Year ended
Feb. 29, | | Year ended Feb. 28, | | Year ended
Feb. 29, | |
| | | 2012 | | 2011 | | 2010 | | 2009 | | 2008 | |
| Class Z | |
| Per share data | |
| Net asset value, beginning of period | | $ | 12.01 | | | $ | 10.09 | | | $ | 7.01 | | | $ | 12.40 | | | $ | 15.19 | | |
| Income from investment operations: | |
| Net investment income | | | 0.15 | | | | 0.14 | (a) | | | 0.11 | | | | 0.20 | | | | 0.24 | | |
| Net realized and unrealized gain (loss) | | | (0.38 | ) | | | 1.94 | | | | 3.09 | | | | (5.39 | ) | | | (1.14 | ) | |
| Total from investment operations | | | (0.23 | ) | | | 2.08 | | | | 3.20 | | | | (5.19 | ) | | | (0.90 | ) | |
| Less distributions to shareholders from: | |
| Net investment income | | | (0.12 | ) | | | (0.16 | ) | | | (0.12 | ) | | | (0.22 | ) | | | (0.26 | ) | |
| Net realized gains | | | — | | | | — | | | | — | | | | — | | | | (1.63 | ) | |
| Total distributions to shareholders | | | (0.12 | ) | | | (0.16 | ) | | | (0.12 | ) | | | (0.22 | ) | | | (1.89 | ) | |
| Proceeds from regulatory settlement | | | 0.00 | (b) | | | — | | | | 0.00 | (b) | | | 0.02 | | | | — | | |
| Net asset value, end of period | | $ | 11.66 | | | $ | 12.01 | | | $ | 10.09 | | | $ | 7.01 | | | $ | 12.40 | | |
| Total return | | | (1.78 | %) | | | 20.81 | % | | | 45.93 | % | | | (42.27 | %) | | | (7.29 | %) | |
| Ratios to average net assets(c) | |
| Expenses prior to fees waived or expenses reimbursed (including interest expense) | | | 0.91 | % | | | 0.93 | %(d) | | | 0.88 | % | | | 0.85 | %(d) | | | 0.80 | % | |
| Net expenses after fees waived or expenses reimbursed (including interest expense)(e) | | | 0.84 | %(f) | | | 0.93 | %(d)(f) | | | 0.87 | %(f) | | | 0.79 | %(d)(f) | | | 0.74 | %(f) | |
| Expenses prior to fees waived or expenses reimbursed (excluding interest expense) | | | 0.91 | % | | | 0.93 | % | | | 0.88 | % | | | 0.85 | % | | | 0.80 | % | |
| Net expenses after fees waived or expenses reimbursed (excluding interest expense)(e) | | | 0.84 | %(f) | | | 0.93 | %(f) | | | 0.87 | %(f) | | | 0.79 | %(f) | | | 0.74 | %(f) | |
| Net investment income | | | 1.37 | %(f) | | | 1.32 | %(f) | | | 1.21 | %(f) | | | 1.91 | %(f) | | | 1.61 | %(f) | |
| Supplemental data | |
| Net assets, end of period (in thousands) | | $ | 1,021,952 | | | $ | 1,366,011 | | | $ | 1,290,563 | | | $ | 907,353 | | | $ | 1,905,752 | | |
| Portfolio turnover | | | 74 | % | | | 79 | % | | | 61 | % | | | 61 | % | | | 62 | % | |
| Notes to Financial Highlights | |
(a) Net investment income per share reflects special dividends. The effect of these dividends amounted to $0.04 per share.
(b) Rounds to less than $0.01.
(c) In addition to the fees and expenses which the Fund bears directly, the Fund indirectly bears a pro rata share of the fees and expenses of the acquired funds in which it invests. Such indirect expenses are not included in the reported expense ratios.
(d) Includes interest expense which rounds to less than 0.01%.
(e) The Investment Manager and certain of its affiliates agreed to waive/reimburse certain fees and expenses, if applicable.
(f) The benefits derived from expense reductions had an impact of less than 0.01%.
The Accompanying Notes to Financial Statements are an integral part of this statement.
24
Notes to Financial Statements – Columbia Large Cap Value Fund
February 29, 2012
Note 1. Organization
Columbia Large Cap Value Fund (the Fund), a series of Columbia Funds Series Trust (the Trust), is a diversified fund. The Trust is registered under the Investment Company Act of 1940, as amended (the 1940 Act), as an open-end management investment company organized as a Delaware statutory trust.
Fund Shares
The Trust may issue an unlimited number of shares (without par value). The Fund offers Class A, Class B, Class C, Class I, Class R, Class W, Class Y and Class Z shares. All share classes have identical voting, dividend and liquidation rights. Each share class has its own expense structure and sales charges, as applicable.
Class A shares are subject to a maximum front-end sales charge of 5.75% based on the initial investment amount. Class A shares purchased without an initial sales charge in accounts aggregating $1 million to $50 million at the time of purchase are subject to a contingent deferred sales charge (CDSC) if the shares are sold within 18 months of purchase, charged as follows: 1.00% CDSC if redeemed within 12 months of purchase, and 0.50% CDSC if redeemed more than 12, but less than 18, months after purchase.
Class B shares may be subject to a maximum CDSC of 5.00% based upon the holding period after purchase. Class B shares will generally convert to Class A shares eight years after purchase. The Fund no longer accepts investments by new or existing investors in the Fund's Class B shares, except in connection with the reinvestment of any dividend and/or capital gain distributions in Class B shares of the Fund and exchanges by existing Class B shareholders of certain other funds within the Columbia Family of Funds.
Class C shares are subject to a 1.00% CDSC on shares redeemed within one year of purchase.
Class I shares are not subject to sales charges and are only available to the Columbia Family of Funds.
Class R shares are not subject to sales charges and are only available to qualifying institutional investors.
Class W shares are not subject to sales charges and are only available to investors purchasing through authorized investment programs managed by investment professionals, including discretionary managed account programs.
Class Y shares are not subject to sales charges and are only available to certain categories of investors which are subject to minimum initial investment requirements.
Class Z shares are not subject to sales charges, and are only available to certain investors, as described in the Fund's prospectus.
Note 2. Summary of Significant Accounting Policies
Use of Estimates
The preparation of financial statements in accordance with U.S. generally accepted accounting principles (GAAP) requires management to make certain estimates and assumptions that affect the reported amounts of assets and liabilities, the disclosure of contingent assets and liabilities at the date of the financial statements and the reported amounts of revenue and expenses during the reporting period. Actual results could differ from those estimates.
The following is a summary of significant accounting policies consistently followed by the Fund in the preparation of its financial statements.
Security Valuation
All equity securities are valued at the close of business of the New York Stock Exchange (NYSE). Equity securities are valued at the last quoted sales price on the principal exchange or market on which they trade, except for securities traded on the NASDAQ Stock Market, which are valued at the NASDAQ official close price. Unlisted securities or listed securities for which there were no sales during the day are valued at the mean of the latest quoted bid and asked prices on such exchanges or markets.
Debt securities generally are valued by pricing services approved by the Board of Trustees (the Board) based upon market transactions for normal, institutional-size trading units of similar securities. The services may use various pricing techniques which take into account appropriate factors such as yield, quality, coupon rate, maturity, type of issue, trading characteristics and other data, as well as broker quotes. Debt securities for which quotations are readily available may also be valued based upon an over-the-counter or exchange bid quotation.
25
Columbia Large Cap Value Fund, February 29, 2012
Foreign securities are valued based on quotations from the principal market in which such securities are normally traded. If any foreign share prices are not readily available as a result of limited share activity the securities are valued at the mean of the latest quoted bid and asked prices on such exchanges or markets. Foreign currency exchange rates are generally determined at 4:00 p.m. Eastern (U.S.) time. However, many securities markets and exchanges outside the U.S. close prior to the close of the NYSE; therefore, the closing prices for securities in such markets or on such exchanges may not fully reflect events that occur after such close but before the close of the NYSE. In those situations, foreign securities will be fair valued pursuant to the policy adopted by the Board, including utilizing a third party pricing service to determine these fair values. The third party pricing service takes into account multiple factors, including, but not limited to, movements in the U.S. securities markets, certain depositary receipts, futures contracts and foreign exchange rates that have occurred subsequent to the close of the foreign exchange, to determine a good faith estimate that reasonably reflects the current market conditions as of the close of the NYSE. The fair value of a security is likely to be different from the quoted or published price, if available.
Investments in other open-end investment companies, including money market funds, are valued at net asset value.
Short-term securities purchased within 60 days to maturity are valued at amortized cost, which approximates market value. The value of short-term securities originally purchased with maturities greater than 60 days is determined based on an amortized value to par upon reaching 60 days to maturity. Short-term securities maturing in more than 60 days from the valuation date are valued at the market price or approximate market value based on current interest rates.
Forward foreign currency exchange contracts are marked-to-market based upon foreign currency exchange rates provided by a pricing service.
Investments for which market quotations are not readily available, or that have quotations which management believes are not reliable, are valued at fair value as determined in good faith under consistently applied procedures established by and under the general supervision of the Board. If a security or class of securities (such as foreign securities) is valued at fair value, such value is likely to be different from the last quoted market price for the security. The determination of fair value often requires significant judgment. To determine fair value, management may use assumptions including but not limited to future cash flows and estimated risk premiums. Multiple inputs from various sources may be used to determine value.
Foreign Currency Transactions and Translation
The values of all assets and liabilities denominated in foreign currencies are translated into U.S. dollars at that day's exchange rates. Net realized and unrealized gains (losses) on foreign currency transactions and translations include gains (losses) arising from the fluctuation in exchange rates between trade and settlement dates on securities transactions, gains (losses) arising from the disposition of foreign currency and currency gains (losses) between the accrual and payment dates on dividends, interest income and foreign withholding taxes.
For financial statement purposes, the Fund does not distinguish that portion of gains (losses) on investments which is due to changes in foreign exchange rates from that which is due to changes in market prices of the investments. Such fluctuations are included with the net realized and unrealized gains (losses) on investments in the Statement of Operations.
Derivative Instruments
The Fund invests in certain derivative instruments as detailed below to meet its investment objectives. Derivatives are instruments whose values depend on, or are derived from, in whole or in part, the value of one or more other assets, such as securities, currencies, commodities or indices. Derivative instruments may be used to maintain cash reserves while maintaining exposure to certain other assets, to offset anticipated declines in values of investments, to facilitate trading, to reduce transaction costs and to pursue higher investment returns. The Fund may also use derivative instruments to mitigate certain investment risks, such as foreign currency exchange rate risk, interest rate risk and credit risk. Derivatives may involve various risks, including the potential inability of the counterparty to fulfill its obligation under the terms of the contract, the potential for an illiquid secondary market and the potential for market movements which may expose the Fund to gains or losses in
26
Columbia Large Cap Value Fund, February 29, 2012
excess of the amount shown in the Statement of Assets and Liabilities.
The Fund and any counterparty are required to maintain an agreement that requires the Fund and that counterparty to monitor (on a daily basis) the net fair value of all derivatives entered into pursuant to the agreement between the Fund and such counterparty. If the net fair value of such derivatives between the Fund and that counterparty exceeds a certain threshold (as defined in the agreement), the Fund or the counterparty (as the case may be) is required to post cash and/or securities as collateral. Fair values of derivatives presented in the financial statements are not netted with the fair value of other derivatives or with any collateral amounts posted by the Fund or any counterparty.
Forward Foreign Currency Exchange Contracts
Forward foreign currency exchange contracts are agreements between two parties to buy and sell a currency at a set price on a future date. These contracts are intended to be used to minimize the exposure to foreign exchange rate fluctuations during the period between the trade and settlement dates of the contract. The Fund utilized forward foreign currency exchange contracts to hedge the currency exposure associated with some or all of the Fund's securities, to shift foreign currency exposure back to U.S. dollars, to shift investment exposure from one currency to another, and to shift U.S. dollar exposure to achieve a representative weighted mix of major currencies in its benchmark, and/or to recover an underweight country exposure in its portfolio.
The values of forward foreign currency exchange contracts fluctuate with changes in foreign currency exchange rates. The Fund will record a realized gain or loss when the forward foreign currency exchange contract is closed.
The use of forward foreign currency exchange contracts does not eliminate fluctuations in the prices of the Fund's portfolio securities. The risks of forward foreign currency exchange contracts include movement in the values of the foreign currencies relative to the U.S. dollar (or other foreign currencies) and the possibility that counterparties will not complete their contractual obligations, which may be in excess of the amount reflected, if any, in the Statement of Assets and Liabilities.
Effects of Derivative Transactions in the Financial Statements
The following tables are intended to provide additional information about the effect of derivatives on the financial statements of the Fund, including: the fair value of derivatives by risk category and the location of those fair values in the Statement of Assets and Liabilities; the impact of derivative transactions on the Fund's operations over the period including realized gains or losses and unrealized gains or losses. The derivative schedules following the Portfolio of Investments present additional information regarding derivative instruments outstanding at the end of the period, if any.
Fair Values of Derivative Instruments at February 29, 2012
At February 29, 2012, the fund had no outstanding derivatives.
Effect of Derivative Instruments in the Statement of Operations for the Year Ended February 29, 2012
Amount of Realized Gain (Loss) on Derivatives
| Risk Exposure Category | | Forward Foreign
Currency Exchange
Contracts | |
| Foreign exchange contracts | | $ | 38,358 | | |
Change in Unrealized Appreciation (Depreciation) on Derivatives Recognized in Income
| Risk Exposure Category | | Forward Foreign
Currency Exchange
Contracts | |
| Foreign exchange contracts | | $ | — | | |
Volume of Derivative Instruments for the Year Ended February 29, 2012
| | | Contracts
Opened | |
| Forward Foreign Currency Exchange Contracts | | | 3 | | |
Repurchase Agreements
The Fund may engage in repurchase agreement transactions with institutions that management has determined are creditworthy. The Fund, through the custodian, receives
27
Columbia Large Cap Value Fund, February 29, 2012
delivery of the underlying securities collateralizing a repurchase agreement. Management is responsible for determining that the collateral is at least equal, at all times, to the value of the repurchase obligation including interest. A repurchase agreement transaction involves certain risks in the event of default or insolvency of the counterparty. These risks include possible delays in or restrictions on a Fund's ability to dispose of the underlying securities and a possible decline in the value of the underlying securities during the period while the Fund seeks to assert its rights.
Security Transactions
Security transactions are accounted for on the trade date. Cost is determined and gains (losses) are based upon the specific identification method for both financial statement and federal income tax purposes.
Income Recognition
Corporate actions and dividend income are recorded on the ex-dividend date.
Interest income is recorded on the accrual basis.
The Fund receives distributions from holdings in real estate investment trusts (REITs) which report information on the character of their distributions annually. REIT distributions are allocated to dividend income, capital gain and return of capital based on estimates made by the Fund's management if actual information has not yet been reported. Return of capital is recorded as a reduction of the cost basis of securities held. Management's estimates are subsequently adjusted when the actual character of the distributions is disclosed by the REITs which could result in a proportionate increase in return of capital to shareholders.
Awards from class action litigation are recorded as a reduction of cost basis if the Fund still owns the applicable securities on the payment date. If the Fund no longer owns the applicable securities, the proceeds are recorded as realized gains.
Expenses
General expenses of the Trust are allocated to the Fund and other funds of the Trust based upon relative net assets or other expense allocation methodologies determined by the nature of the expense. Expenses directly attributable to the Fund are charged to the Fund. Expenses directly attributable to a specific class of shares are charged to that share class.
Determination of Class Net Asset Value
All income, expenses (other than class-specific expenses, which are charged to that share class, as shown in the Statement of Operations) and realized and unrealized gains (losses) are allocated to each class of the Fund on a daily basis, based on the relative net assets of each class, for purposes of determining the net asset value of each class.
Federal Income Tax Status
The Fund intends to qualify each year as a regulated investment company under Subchapter M of the Internal Revenue Code, as amended, and will distribute substantially all of its tax exempt or taxable income (including net short-term capital gains), if any, for its tax year, and as such will not be subject to federal income taxes. In addition, the Fund intends to distribute in each calendar year substantially all of its net investment income, capital gains and certain other amounts, if any, such that the Fund should not be subject to federal excise tax. Therefore, no federal income or excise tax provision is recorded.
Distributions to Shareholders
Distributions from net investment income, if any, are declared and paid each calendar quarter. Net realized capital gains, if any, are distributed along with the income dividend. Income distributions and capital gain distributions are determined in accordance with federal income tax regulations which may differ from GAAP.
Guarantees and Indemnifications
Under the Trust's organizational documents and, in some cases, by contract, its officers and trustees are indemnified against certain liabilities arising out of the performance of their duties to the Trust or its funds. In addition, certain of the Fund's contracts with its service providers contain general indemnification clauses. The Fund's maximum exposure under these arrangements is unknown since the amount of any future claims that may be made against the Fund cannot be
28
Columbia Large Cap Value Fund, February 29, 2012
determined, and the Fund has no historical basis for predicting the likelihood of any such claims.
Recent Accounting Pronouncement
Fair Value Measurements and Disclosures
In May 2011, the Financial Accounting and Standards Board (FASB) issued ASU No. 2011-04 modifying Topic 820, Fair Value Measurements and Disclosures. At the same time, the International Accounting Standards Board (IASB) issued International Financial Reporting Standard 13, Fair Value Measurement. The objective of the FASB and IASB is convergence of their guidance on fair value measurements and disclosures.
Specifically, ASU No. 2011-04 requires reporting entities to disclose i) the amounts of any transfers between Level 1 and Level 2, and the reasons for the transfers, ii) for Level 3 fair value measurements, a) quantitative information about significant unobservable inputs used, b) a description of the valuation processes used by the reporting entity and c) a narrative description of the sensitivity of the fair value measurement to changes in unobservable inputs if a change in those inputs might result in a significantly higher or lower fair value measurement. The effective date of ASU No. 2011-04 is for interim and annual periods beginning after December 15, 2011. At this time, management is evaluating the implications of this guidance and the impact it will have on the financial statement amounts and footnote disclosures, if any.
Note 4. Fees and Compensation Paid to Affiliates
Investment Management Fees
Under an Investment Management Services Agreement (IMSA), Columbia Management Investment Advisers, LLC (the Investment Manager), a wholly-owned subsidiary of Ameriprise Financial, Inc. (Ameriprise Financial), determines which securities will be purchased, held or sold. Effective July 1, 2011, the management fee is an annual fee that is equal to a percentage of the Fund's average daily net assets that declines from 0.71% to 0.54% as the Fund's net assets increase. Prior to July 1, 2011, the management fee was equal to a percentage of the Fund's average daily net assets that declined from 0.60% to 0.41% as the Fund's net assets increased. The effective management fee rate for the year ended February 29, 2012 was 0.60% of the Fund's average daily net assets.
Administration Fees
Under an Administrative Services Agreement, the Investment Manager serves as the Fund Administrator. Effective July 1, 2011, the Fund pays the Fund Administrator an annual fee for administration and accounting services equal to a percentage of the Fund's average daily net assets that declines from 0.06% to 0.03% as the Fund's net assets increase. Prior to July 1, 2011, the administration fee was equal to the annual rate of 0.17% of the Fund's average daily net assets, less the fees that were payable by the Fund as described under the Pricing and Bookkeeping Fees note below. The effective administration fee rate for the year ended February 29, 2012 was 0.10% of the Fund's average daily net assets.
Pricing and Bookkeeping Fees
Prior to July 25, 2011, the Fund had entered into a Financial Reporting Services Agreement (the Financial Reporting Services Agreement) with State Street Bank and Trust Company (State Street) and the Investment Manager pursuant to which State Street provided financial reporting services to the Fund. The Fund also entered into an Accounting Services Agreement (collectively with the Financial Reporting Services Agreement, the State Street Agreements) with State Street and the Investment Manager pursuant to which State Street provided accounting services to the Fund. Under the State Street Agreements, the Fund paid State Street an annual fee of $38,000 paid monthly plus an additional monthly fee based on an annualized percentage rate of average daily net assets of the Fund for the month. The aggregate fee did not exceed $140,000 per year (exclusive of out-of-pocket expenses and charges). The Fund also reimbursed State Street for certain out-of-pocket expenses and charges. Effective July 25, 2011, these services are provided under the Administrative Services Agreement discussed above.
Other Fees
Effective June 1, 2011, other expenses are for, among other things, certain expenses of the Fund or the Board, including: Fund boardroom and office expense, employee compensation, employee health and retirement benefits, and certain other expenses. Payment of these Fund and Board expenses is
29
Columbia Large Cap Value Fund, February 29, 2012
facilitated by a company providing limited administrative services to the Fund and the Board. For the period June 1, 2011 through February 29, 2012, other expenses paid to this company were $5,505.
Compensation of Board Members
Board members are compensated for their services to the Fund as disclosed in the Statement of Operations. Under a Deferred Compensation Plan (the Plan), the Board members who are not "interested persons" of the Fund, as defined under the 1940 Act, may elect to defer payment of up to 100% of their compensation. Deferred amounts are treated as though equivalent dollar amounts had been invested in shares of certain funds managed by the Investment Manager. The Fund's liability for these amounts is adjusted for market value changes and remains in the Fund until distributed in accordance with the Plan.
Compensation of Chief Compliance Officer
The Board has appointed a Chief Compliance Officer to the Fund in accordance with federal securities regulations. Effective April 1, 2011, the Fund's expenses associated with the Chief Compliance Officer are paid directly by Columbia. Prior to April 1, 2011, the Fund, along with other affiliated funds, paid its pro-rata share of the expenses for the Chief Compliance Officer. Such fees did not exceed $15,000 per year.
Transfer Agent Fees
Under a Transfer and Dividend Disbursing Agent Agreement, Columbia Management Investment Services Corp. (the Transfer Agent), an affiliate of the Investment Manager and a wholly-owned subsidiary of Ameriprise Financial, is responsible for providing transfer agency services to the Fund. The Transfer Agent has contracted with Boston Financial Data Services (BFDS) to serve as sub-transfer agent.
The Transfer Agent receives monthly account-based service fees based on the number of open accounts and is reimbursed by the Fund for the fees and expenses the Transfer Agent pays to financial intermediaries that maintain omnibus accounts with the Fund that is a percentage of the average aggregate value of the Fund's shares maintained in each such omnibus account (other than omnibus accounts for which American Enterprise Investment Services Inc. is the broker of record or accounts where the beneficial shareholder is a customer of Ameriprise Financial Services, Inc., which are paid a per account fee). The Transfer Agent pays the fees of BFDS for services as sub-transfer agent and is not entitled to reimbursement for such fees from the Fund (with the exception of out-of-pocket fees).
The Transfer Agent also receives compensation from fees for various shareholder services and reimbursements for certain out-of-pocket expenses. Class I shares do not pay transfer agent fees.
For the year ended February 29, 2012, the Fund's effective transfer agent fee rates as a percentage of average daily net assets of each class were as follows:
| Class A | | | 0.19 | % | |
| Class B | | | 0.19 | | |
| Class C | | | 0.18 | | |
| Class R | | | 0.16 | | |
| Class W | | | 0.15 | | |
| Class Y | | | 0.00 | * | |
| Class Z | | | 0.18 | | |
* Rounds to less than 0.01%.
An annual minimum account balance fee of $20 may apply to certain accounts with a value below the Fund's initial minimum investment requirements to reduce the impact of small accounts on transfer agent fees. These minimum account balance fees are recorded as part of expense reductions in the Statement of Operations. For the year ended February 29, 2012, these minimum account balance fees reduced total expenses by $36,791.
Distribution and Service Fees
The Fund has an agreement with Columbia Management Investment Distributors, Inc. (the Distributor), an affiliate of the Investment Manager and a wholly-owned subsidiary of Ameriprise Financial, for distribution and shareholder services. Pursuant to Rule 12b-1 under the 1940 Act, the Board has approved, and the Fund has adopted, distribution
30
Columbia Large Cap Value Fund, February 29, 2012
and shareholder service plans (the Plans) which set the distribution and service fees for the Fund. These fees are calculated daily and are intended to compensate the Distributor and/or eligible selling and/or servicing agents for selling shares of the Fund and providing services to investors.
The Plans require the payment of a monthly combined distribution and service fee to the Distributor at the maximum annual rate of 0.25% of the average daily net assets attributable to Class A shares of the Fund. The Plans also required the payment of a monthly service fee at the maximum annual rate of 0.25% of the average daily net assets attributable to Class B, Class C and Class W shares of the Fund and the payment of a monthly distribution fee at the maximum annual rates of 0.75%, 0.75%, 0.50% and 0.25% of the average daily net assets attributable to Class B, Class C, Class R and Class W shares, respectively.
The Fund may pay a distribution fee of up to 0.25% of the Fund's average daily net assets attributable to Class W shares and a service fee of up to 0.25% of the Fund's average daily net assets attributable to Class W shares, provided, however, that the aggregate fee shall not exceed 0.25% of the Fund's average daily net assets attributable to Class W shares.
Sales Charges
Sales charges, including front-end charges and CDSCs, received by the Distributor for distributing Fund shares were $125,422 for Class A, $12,360 for Class B and $2,168 for Class C shares for the year ended February 29, 2012.
Expenses Waived/Reimbursed by the Investment Manager and its Affiliates
Effective July 1, 2011, the Investment Manager and certain of its affiliates have contractually agreed to waive fees and/or reimburse expenses (excluding certain fees and expenses described below), through June 30, 2012, unless sooner terminated at the sole discretion of the Board, so that the Fund's net operating expenses, after giving effect to fees waived/expenses reimbursed and any balance credits and/or overdraft charges from the Fund's custodian, do not exceed the following annual rates as a percentage of the class' average daily net assets:
| Class A | | | 1.11 | % | |
| Class B | | | 1.86 | | |
| Class C | | | 1.86 | | |
| Class I | | | 0.75 | | |
| Class R | | | 1.36 | | |
| Class W | | | 1.11 | | |
| Class Y | | | 0.86 | | |
| Class Z | | | 0.86 | | |
Under the agreement, the following fees and expenses are excluded from the waiver/reimbursement commitment, and therefore will be paid by the Fund, if applicable: taxes (including foreign transaction taxes), expenses associated with investments in affiliated and non-affiliated pooled investment vehicles (including mutual funds and exchange traded funds), transaction costs and brokerage commissions, costs related to any securities lending program, dividend expenses associated with securities sold short, inverse floater program fees and expenses, transaction charges and interest on borrowed money, interest, extraordinary expenses and any other expenses the exclusion of which is specifically approved by the Board. This agreement may be modified or amended only with approval from all parties.
Prior to July 1, 2011, the Investment Manager voluntarily agreed to reimburse a portion of the Fund's expenses (excluding certain expenses, such as brokerage commissions, interest, taxes and extraordinary expenses, but including custodian charges relating to overdrafts, if any) so that the Fund's ordinary net operating expenses, after giving effect to fees waived/expenses reimbursed and any balance credits and/or overdraft charges
31
Columbia Large Cap Value Fund, February 29, 2012
from the Fund's custodian, did not exceed the following annual rates as a percentage of the class' average daily net assets:
| Class A | | | 1.25 | % | |
| Class B | | | 2.00 | | |
| Class C | | | 2.00 | | |
| Class I | | | 0.87 | | |
| Class R | | | 1.50 | | |
| Class W | | | 1.25 | | |
| Class Y | | | 1.00 | | |
| Class Z | | | 1.00 | | |
Note 5. Federal Tax Information
The timing and character of income and capital gain distributions are determined in accordance with income tax regulations, which may differ from GAAP because of temporary or permanent book to tax differences.
For the year ended February 29, 2012, these differences are primarily due to differing treatment for capital loss carryforwards deferral/reversal of wash sales losses, Trustees deferred compensation, foreign currency transactions, and post-October capital losses. To the extent these differences are permanent, reclassifications are made among the components of the Fund's net assets in the Statement of Assets and Liabilities. Temporary differences do not require reclassifications. In the Statement of Assets and Liabilities the following reclassifications were made:
| Undistributed net investment income | | $ | (38,018 | ) | |
| Accumulated net realized loss | | | 35,795 | | |
| Paid-in capital | | | 2,223 | | |
Net investment income and net realized gains (losses), as disclosed in the Statement of Operations, and net assets were not affected by this reclassification.
The tax character of distributions paid during the years indicated was as follows:
| Year ended | | February 29, 2012 | | February 28, 2011 | |
| Ordinary income | | $ | 16,444,671 | | | $ | 26,828,023 | | |
Short-term capital gain distributions, if any, are considered ordinary income distributions for tax purposes.
At February 29, 2012, the components of distributable earnings on a tax basis were as follows:
| Undistributed ordinary income | | $ | 4,245,295 | | |
| Unrealized appreciation | | | 180,640,823 | | |
At February 29, 2012, the cost of investments for federal income tax purposes was $1,470,740,170 and the aggregate gross unrealized appreciation and depreciation based on that cost was:
| Unrealized appreciation | | $ | 227,379,679 | | |
| Unrealized depreciation | | $ | (46,738,856 | ) | |
| Net unrealized appreciation/depreciation | | $ | 180,640,823 | | |
The following capital loss carryforward, determined at February 29, 2012, may be available to reduce taxable income arising from future net realized gains on investments, if any, to the extent permitted by the Internal Revenue Code:
| Year of Expiration | | Amount | |
| 2018 | | $ | 410,394,653 | | |
On December 22, 2010, the Regulated Investment Company Modernization Act of 2010 (the Act) was enacted, which changed various technical rules governing the tax treatment of regulated investment companies. The changes are generally effective for taxable years beginning after the date of enactment. Under the Act, the Fund will be permitted to carry forward capital losses incurred in taxable years beginning after the date of enactment for an unlimited period. However, any losses incurred during those future taxable years will be required to be utilized prior to the losses incurred in pre-enactment taxable years, which carry an expiration date. As a result of this ordering rule, pre-enactment capital loss carryforwards may be more likely to expire unused.
For the year ended February 29, 2012, $224,121,077 of capital loss carryforward was utilized.
32
Columbia Large Cap Value Fund, February 29, 2012
Under current tax rules, regulated investment companies can elect to treat certain late-year ordinary losses incurred and post-October capital losses (capital losses realized after October 31) as arising on the first day of the following taxable year. As of February 29, 2012, the Fund will elect to treat post-October capital losses of $7,414,614 as arising on March 1, 2012.
Management of the Fund has concluded that there are no significant uncertain tax positions that would require recognition in the financial statements. However, management's conclusion may be subject to review and adjustment at a later date based on factors including, but not limited to, new tax laws, regulations, and administrative interpretations (including relevant court decisions). Generally, the Fund's federal tax returns for the prior three fiscal years remain subject to examination by the Internal Revenue Service.
Note 6. Portfolio Information
The cost of purchases and proceeds from sales of securities, excluding short-term obligations, aggregated to $1,207,057,676 and $1,700,251,878, respectively, for the year ended February 29, 2012.
Note 7. Regulatory Settlements
During the year ended February 29, 2012, the Fund received payments of $7,701 resulting from certain regulatory settlements with third parties in which the Fund had participated. The payments have been included in "Proceeds from regulatory settlements" in the Statement of Changes in Net Assets.
Note 8. Lending of Portfolio Securities
Effective Juy 25, 2011, the Fund has entered into a Master Securities Lending Agreement (the Agreement) with JPMorgan Chase Bank, N.A. (JPMorgan). The Agreement, which replaces the previous security lending arrangement with State Street, authorizes JPMorgan as lending agent to lend securities to authorized borrowers in order to generate additional income on behalf of the Fund. Pursuant to the Agreement, the securities loaned are secured by cash or U.S. government securities equal to at least 100% of the market value of the loaned securities. Any additional collateral required to maintain those levels due to market fluctuations of the loaned securities is requested to be delivered the following business day. Cash collateral received is invested by the lending agent on behalf of the Fund into authorized investments pursuant to the Agreement. The investments made with the cash collateral are listed in the Portfolio of Investments. The values of such investments and any uninvested cash collateral are disclosed in the Statement of Assets and Liabilities along with the related obligation to return the collateral upon the return of the securities loaned. At February 29, 2012, securities valued at $156,909,311 were on loan, secured by U.S. government securities valued at $19,133 and by cash collateral of $160,891,975 invested in short-term securities or in cash equivalents (which does not reflect calls for collateral made to borrowers by JPMorgan at period end) that is partially or fully invested in short-term securities or other cash equivalents.
Risks of delay in recovery of securities or even loss of rights in the securities may occur should the borrower of the securities fail financially. Risks may also arise to the extent that the value of the securities loaned increases above the value of the collateral received. JPMorgan will indemnify the Fund from losses resulting from a borrower's failure to return a loaned security when due. Such indemnification does not extend to losses associated with declines in the value of cash collateral investments. The Investment Manager is not responsible for any losses incurred by the Fund in connection with the securities lending program. Loans are subject to termination by the Fund or the borrower at any time, and are, therefore, not considered to be illiquid investments.
Pursuant to the Agreement, the Fund receives income for lending its securities either in the form of fees or by earning interest on invested cash collateral, net of negotiated rebates paid to borrowers and fees paid to the lending agent for services provided and any other securities lending expenses. Net income earned from securities lending for the year ended February 29, 2012 is disclosed in the Statement of Operations. The Fund continues to earn and accrue interest and dividends on the securities loaned.
Prior to July 25, 2011, the Fund participated in a securities lending arrangement with State Street. Each security on loan was collateralized in an amount at least equal to the market value of the securities loaned plus accrued income from the investment of collateral. The income generated by the investment of the collateral, net of any fees remitted to State
33
Columbia Large Cap Value Fund, February 29, 2012
Street as the lending agent and borrower rebates, was paid to the Fund.
Note 9. Custody Credits
Prior to July 25, 2011, the Fund had an agreement with its custodian bank under which custody fees may have been reduced by balance credits. These credits are recorded as part of expense reductions on the Statement of Operations. The Fund could have invested a portion of the assets utilized in connection with the expense offset arrangement in an income-producing asset if they had not entered into such an agreement. Subsequent to this date, the Fund may invest its daily balance in an affiliated money market fund as detailed below. For the period March 1, 2011 through July 25, 2011, there were no credits.
Note 10. Affiliated Money Market Fund
Effective July 25, 2011, the Fund may invest its daily cash balances in Columbia Short-Term Cash Fund, an affiliated money market fund established for the exclusive use by the Fund and other affiliated funds. The income earned by the Fund from such investments is included as "Dividends from affiliates" in the Statement of Operations. As an investing fund, the Fund indirectly bears its proportionate share of the expenses of Columbia Short-Term Cash Fund.
Note 11. Shareholder Concentration
At February 29, 2012, two unaffiliated shareholder accounts owned 47.6% of the outstanding shares of the Fund. The Fund has no knowledge about whether any portion of those shares was owned beneficially. Subscription and redemption activity of these accounts may have a significant effect on the operations of the Fund.
Note 12. Line of Credit
The Fund has entered into a revolving credit facility with a syndicate of banks led by JPMorgan Chase Bank, N.A. (the Administrative Agent), whereby the Fund may borrow for the temporary funding of shareholder redemptions or for other temporary or emergency purposes. The credit facility became effective on July 25, 2011, replacing a prior credit facility. The credit facility agreement, as amended, which is a collective agreement between the Fund and certain other funds managed by the Investment Manager, severally and not jointly, permits collective borrowings up to $500 million. Pursuant to a December 13, 2011 amendment to the credit facility agreement, interest is charged to each participating fund based on its borrowings at a rate equal to the higher of (i) the overnight federal funds rate plus 1.00% or (i) the one-month LIBOR rate plus 1.00%. Each borrowing under the credit facility matures no later than 60 days after the date of borrowing. The Fund also pays a commitment fee equal to its pro rata share of the amount of the credit facility at a rate of 0.08% per annum. For the period July 25, 2011 through December 13, 2011, interest was charged to each participating fund based on its borrowings at a rate equal to the sum of the federal funds rate plus (i) 1.25% per annum plus (ii) if one-month LIBOR exceeds the federal funds rate, the amount of such excess. The Fund also paid a commitment fee equal to its pro rata share of the amount of the credit facility at a rate of 0.10% per annum.
For the period June 27, 2011 through July 24, 2011, the Fund and certain other funds managed by the Investment Manager participated in a $100 million committed, unsecured revolving credit facility provided by State Street. For the period May 16, 2011 through June 26, 2011, the collective borrowing amount of the credit facility was $150 million committed, unsecured revolving credit facility provided by State Street. For the period March 28, 2011 through May 15, 2011, the collective borrowing amount of the credit facility was $225 million. Prior to March 28, 2011, the collective borrowing amount of the credit facility was $280 million. Interest was charged to each fund based on its borrowings at a rate equal to the greater of the (i) federal funds rate plus 1.25% per annum or (ii) the overnight LIBOR rate plus 1.25% per annum. The Fund also paid a commitment fee equal to its pro rata share of the amount of the credit facility at a rate of 0.125% per annum. The Fund had no borrowings during the year ended February 29, 2012.
Note 13. Subsequent Events
Management has evaluated the events and transactions that have occurred through the date the financial statements were issued. Other than noted below, there were no items requiring adjustment of the financial statements or additional disclosure. On March 23, 2012, a group of unaffiliated shareholders of the Fund redeemed $137,646,441, which represented approximately 9% of the Fund's net assets as of that date. On April 20, 2012, the same group of unaffiliated
34
Columbia Large Cap Value Fund, February 29, 2012
shareholders redeemed $133,352,436, which represented approximately 10% of the Fund's net assets as of that date.
Note 14. Information Regarding Pending and Settled Legal Proceedings
In June 2004, an action captioned John E. Gallus et al. v. American Express Financial Corp. and American Express Financial Advisors Inc. was filed in the United States District Court for the District of Arizona. The plaintiffs allege that they are investors in several American Express Company mutual funds (currently branded as Columbia) and they purport to bring the action derivatively on behalf of those funds under the Investment Company Act of 1940. The plaintiffs allege that fees allegedly paid to the defendants by the funds for investment advisory and administrative services are excessive. The plaintiffs seek remedies including restitution and rescission of investment advisory and distribution agreements. The plaintiffs voluntarily agreed to transfer this case to the United States District Court for the District of Minnesota (the District Court). In response to defendants' motion to dismiss the complaint, the District Court dismissed one of plaintiffs' four claims and granted plaintiffs limited discovery. Defendants moved for summary judgment in April 2007. Summary judgment was granted in the defendants' favor on July 9, 2007. The plaintiffs filed a notice of appeal with the Eighth Circuit Court of Appeals (the Eighth Circuit) on August 8, 2007. On April 8, 2009, the Eighth Circuit reversed summary judgment and remanded to the District Court for further proceedings. On August 6, 2009, defendants filed a writ of certiorari with the U.S. Supreme Court (the Supreme Court), asking the Supreme Court to stay the District Court proceedings while the Supreme Court considered and ruled in a case captioned Jones v. Harris Associates, which involved issues of law similar to those presented in the Gallus case. On March 30, 2010, the Supreme Court issued its ruling in Jones v. Harris Associates, and on April 5, 2010, the Supreme Court vacated the Eighth Circuit's decision in the Gallus case and remanded the case to the Eighth Circuit for further consideration in light of the Supreme Court's decision in Jones v. Harris Associates. On June 4, 2010, the Eighth Circuit remanded the Gallus case to the District Court for further consideration in light of the Supreme Court's decision in Jones v. Harris Associates. On December 9, 2010, the District Court reinstated its July 9, 2007 summary judgment order in favor of the defendants. On January 10, 2011, plaintiffs filed a notice of appeal with the Eighth Circuit. In response to the plaintiffs' opening appellate brief filed on March 18, 2011, the defendants filed a response brief on May 4, 2011 with the Eighth Circuit. The plaintiffs filed a reply brief on May 26, 2011 and oral arguments took place on November 17, 2011. On March 30, 2012, the Eighth Circuit upheld the grant of summary judgment by the District Court in favor of the defendents.
In December 2005, without admitting or denying the allegations, American Express Financial Corporation (AEFC, which is now known as Ameriprise Financial, Inc. (Ameriprise Financial)) entered into settlement agreements with the Securities and Exchange Commission (SEC) and Minnesota Department of Commerce (MDOC) related to market timing activities. As a result, AEFC was censured and ordered to cease and desist from committing or causing any violations of certain provisions of the Investment Advisers Act of 1940, the Investment Company Act of 1940, and various Minnesota laws. AEFC agreed to pay disgorgement of $10 million and civil money penalties of $7 million. AEFC also agreed to retain an independent distribution consultant to assist in developing a plan for distribution of all disgorgement and civil penalties ordered by the SEC in accordance with various undertakings detailed at www.sec.gov/litigation/admin/ia-2451.pdf. Ameriprise Financial and its affiliates have cooperated with the SEC and the MDOC in these legal proceedings, and have made regular reports to the funds' Boards of Trustees.
Ameriprise Financial and certain of its affiliates have historically been involved in a number of legal, arbitration and regulatory proceedings, including routine litigation, class actions, and governmental actions, concerning matters arising in connection with the conduct of their business activities. Ameriprise Financial believes that the Funds are not currently the subject of, and that neither Ameriprise Financial nor any of its affiliates are the subject of, any pending legal, arbitration or regulatory proceedings that are likely to have a material adverse effect on the Funds or the ability of Ameriprise Financial or its affiliates to perform under their contracts with the Funds. Ameriprise Financial is required to make 10-Q, 10-K and, as necessary, 8-K filings with the Securities and Exchange Commission on legal and regulatory matters that relate to Ameriprise Financial and its affiliates. Copies of these filings may be obtained by accessing the SEC website at www.sec.gov.
35
Columbia Large Cap Value Fund, February 29, 2012
There can be no assurance that these matters, or the adverse publicity associated with them, will not result in increased fund redemptions, reduced sale of fund shares or other adverse consequences to the Funds. Further, although we believe proceedings are not likely to have a material adverse effect on the Funds or the ability of Ameriprise Financial or its affiliates to perform under their contracts with the Funds, these proceedings are subject to uncertainties and, as such, we are unable to estimate the possible loss or range of loss that may result. An adverse outcome in one or more of these proceedings could result in adverse judgments, settlements, fines, penalties or other relief that could have a material adverse effect on the consolidated financial condition or results of operations of Ameriprise Financial.
36
Report of Independent Registered Public Accounting Firm
To the Trustees of Columbia Funds Series Trust and the Shareholders of Columbia Large Cap Value Fund
In our opinion, the accompanying statement of assets and liabilities, including the investment portfolio, and the related statements of operations and of changes in net assets and the financial highlights present fairly, in all material respects, the financial position of Columbia Large Cap Value Fund (the "Fund") (a series of Columbia Funds Series Trust) at February 29, 2012, the results of its operations for the year then ended, the changes in its net assets for each of the two years in the period then ended and the financial highlights for each of the periods indicated, in conformity with accounting principles generally accepted in the United States of America. These financial statements and financial highlights (hereafter referred to as "financial statements") are the responsibility of the Fund's management. Our responsibility is to express an opinion on these financial statements based on our audits. We conducted our audits of these financial statements in accordance with the standards of the Public Company Accounting Oversight Board (United States). Those standards require that we plan and perform the audit to obtain reasonable assurance about whether the financial statements are free of material misstatement. An audit includes examining, on a test basis, evidence supporting the amounts and disclosures in the financial statements, assessing the accounting principles used and significant estimates made by management, and evaluating the overall financial statement presentation. We believe that our audits, which included confirmation of securities at February 29, 2012 by correspondence with the custodian, brokers and transfer agent, provide a reasonable basis for our opinion.
PricewaterhouseCoopers LLP
Minneapolis, Minnesota
April 20, 2012
37
Federal Income Tax Information (Unaudited) – Columbia Large Cap Value Fund
For non-corporate shareholders, 100% or the maximum amount allowable under the Jobs and Growth Tax Relief Reconciliation Act of 2003, of the ordinary income distributed by the Fund for the fiscal year ended February 29, 2012 may represent qualified dividend income.
100% of the ordinary income distributed by the Fund for the fiscal year ended February 29, 2012, qualifies for the corporate dividends received deduction.
The Fund will notify shareholders in January 2013 of amounts for use in preparing 2012 income tax returns.
38
Fund Governance
Shareholders elect the Board that oversees the funds' operations. The Board appoints officers who are responsible for day-to-day business decisions based on policies set by the Board. The following table provides basic biographical information about the funds' Board members, including their principal occupations during the past five years, although specific titles for individuals may have varied over the period. Under current Board policy, members may serve until the next Board meeting after he or she reaches the mandatory retirement age established by the Board, or the fifteenth anniversary of the first Board meeting they attended as a member of the Board.
On September 29, 2009, Ameriprise Financial, the parent company of Columbia Management, entered into an agreement with Bank of America, N.A. ("Bank of America") to acquire a portion of the asset management business of Columbia Management Group, LLC and certain of its affiliated companies (the "Transaction"). Following the Transaction, which became effective on May 1, 2010, various alignment activities have occurred with respect to the Fund Family. In connection with the Transaction, Mr. Edward J. Boudreau, Jr., Mr. William P. Carmichael, Mr. William A. Hawkins, Mr. R. Glenn Hilliard, Mr. John J. Nagorniak, Ms. Minor M. Shaw and Dr. Anthony M. Santomero, who were members prior to the Transaction of the Legacy Columbia Nations funds' Board ("Nations Funds"), which includes Columbia Funds Series Trust, Columbia Funds Variable Insurance Trust I and Columbia Funds Master Investment Trust, LLC., began service on the Board for the Legacy RiverSource funds ("RiverSource Funds") effective June 1, 2011, which resulted in an overall increase from twelve Trustees to sixteen for all mutual funds overseen by the Board.
Independent Board Members
| Name, Address, Age | | Position Held
with Funds
and Length
of Service | | Principal Occupation During Past Five Years | | Number of
Funds in the
Fund Family
Overseen by
Board Member | | Other Present or
Past Directorships/
Trusteeships
(Within Past 5 Years) | |
| Kathleen Blatz | | | | | | | | | |
|
901 S. Marquette Ave.
Minneapolis, MN 55402
Age 57 | | Board member since 1/06 for RiverSource Funds and since 6/11 for Nations Funds | | Attorney; Chief Justice, Minnesota Supreme Court, 1998-2006 | | | 153 | | | None | |
|
| Edward J. Boudreau, Jr. | |
|
225 Franklin Street
Mail Drop
BX32 05228
Boston, MA 02110
Age 67 | | Board member since 6/11 for RiverSource Funds and since 1/05 for Nations Funds | | Managing Director, E.J. Boudreau & Associates (consulting) since 2000 | | | 146 | | | Former Trustee, BofA Funds Series Trust (11 funds) | |
|
| Pamela G. Carlton | |
|
901 S. Marquette Ave.
Minneapolis, MN 55402
Age 57 | | Board member since 7/07 for RiverSource Funds and since 6/11 for Nations Funds | | President, Springboard-Partners in Cross Cultural Leadership (consulting company) | | | 153 | | | None | |
|
39
Fund Governance (continued)
Independent Board Members (continued)
| Name, Address, Age | | Position Held
with Funds
and Length
of Service | | Principal Occupation During Past Five Years | | Number of
Funds in the
Fund Family
Overseen by
Board Member | | Other Present or
Past Directorships/
Trusteeships
(Within Past 5 Years) | |
| William P. Carmichael | | | | | | | | | |
|
225 Franklin Street
Mail Drop
BX32 05228
Boston, MA 02110
Age 68 | | Board member since 6/11 for RiverSource Funds and since 1999 for Nations Funds | | Retired | | | 146 | | | Director, Cobra Electronics Corporation (electronic equipment manufacturer); The Finish Line (athletic shoes and apparel); McMoRan Exploration Company (oil and gas exploration and development); former Trustee, BofA Funds Series Trust (11 funds); former Director, Spectrum Brands, Inc. (consumer products); former Director, Simmons Company (bedding) | |
|
| Patricia M. Flynn | |
|
901 S. Marquette Ave.
Minneapolis, MN 55402
Age 61 | | Board member since 11/04 for RiverSource Funds and since 6/11 for Nations Funds | | Trustee Professor of Economics and Management, Bentley University; former Dean, McCallum Graduate School of Business, Bentley University | | | 153 | | | None | |
|
| William A. Hawkins | |
|
225 Franklin Street
Mail Drop
BX32 05228
Boston, MA 02110
Age 69 | | Board member since 6/11 for RiverSource Funds and since 1/05 for Nations Funds | | Managing Director, Overton Partners (financial consulting), since August 2010; President and Chief Executive Officer, California General Bank, N.A., January 2008-August 2010 | | | 146 | | | Trustee, BofA Funds Series Trust (11 funds) | |
|
| R. Glenn Hilliard | |
|
225 Franklin Street
Mail Drop
BX32 05228
Boston, MA 02110
Age 69 | | Board member since 6/11 for RiverSource Funds and since 1/05 for Nations Funds | | Chairman and Chief Executive Officer, Hilliard Group LLC (investing and consulting), since April 2003; Non-Executive Director & Chairman, CNO Financial Group, Inc. (formerly Conseco, Inc.) (insurance), September 2003-May 2011 | | | 146 | | | Chairman, BofA Fund Series Trust (11 funds); former Director, CNO Financial Group, Inc. (insurance) | |
|
40
Fund Governance (continued)
Independent Board Members (continued)
| Name, Address, Age | | Position Held
with Funds
and Length
of Service | | Principal Occupation During Past Five Years | | Number of
Funds in the
Fund Family
Overseen by
Board Member | | Other Present or
Past Directorships/
Trusteeships
(Within Past 5 Years) | |
| Stephen R. Lewis, Jr. | | | | | | | | | |
|
901 S. Marquette Ave.
Minneapolis, MN 55402
Age 73 | | Chair of the Board for RiverSource Funds since 1/07, Board member for RiverSource Funds since 1/02 and since 6/11 for Nations Funds | | President Emeritus and Professor of Economics Emeritus, Carleton College | | | 153 | | | Director, Valmont Industries, Inc. (manufactures irrigation systems) | |
|
| John F. Maher | |
|
901 S. Marquette Ave.
Minneapolis, MN 55402
Age 68 | | Board member since 12/06 for Legacy Seligman funds, since 12/08 for RiverSource Funds and since 6/11 for Nations Funds | | Retired President and Chief Executive Officer and former Director, Great Western Financial Corporation (financial services), 1986-1997 | | | 153 | | | None | |
|
| John J. Nagorniak | |
|
225 Franklin Street
Mail Drop
BX32 05228
Boston, MA 02110
Age 67 | | Board member since 6/11 for RiverSource Funds and since 1/08 for Nations Funds | | Retired; President and Director, Foxstone Financial, Inc. (consulting), 2000-2007; Director, Mellon Financial Corporation affiliates (investing), 2000-2007; Chairman, Franklin Portfolio Associates (investing—Mellon affiliate), 1982-2007 | | | 146 | | | Trustee, Research Foundation of CFA Institute; Director, MIT Investment Company; Trustee, MIT 401k Plan; former Trustee, BofA Funds Series Trust (11 funds) | |
|
| Catherine James Paglia | |
|
901 S. Marquette Ave.
Minneapolis, MN 55402
Age 59 | | Board member since 11/04 for RiverSource Funds and since 6/11 for Nations Funds | | Director, Enterprise Asset Management, Inc. (private real estate and asset management company) | | | 153 | | | None | |
|
41
Fund Governance (continued)
Independent Board Members (continued)
| Name, Address, Age | | Position Held
with Funds
and Length
of Service | | Principal Occupation During Past Five Years | | Number of
Funds in the
Fund Family
Overseen by
Board Member | | Other Present or
Past Directorships/
Trusteeships
(Within Past 5 Years) | |
| Leroy C. Richie | | | | | | | | | |
|
901 S. Marquette Ave.
Minneapolis, MN 55402
Age 70 | | Board member since 2000 for Legacy Seligman funds, since 11/08 for RiverSource Funds and since 6/11 for Nations Funds | | Counsel, Lewis & Munday, P.C. since 2004; former Vice President and General Counsel, Automotive Legal Affairs, Chrysler Corporation | | | 153 | | | Director, Digital Ally, Inc. (digital imaging); Director, Infinity, Inc. (oil and gas exploration and production); Director, OGE Energy Corp. (energy and energy services) | |
|
| Minor M. Shaw | |
|
225 Franklin Street
Mail Drop
BX32 05228
Boston, MA 02110
Age 64 | | Board member since 6/11 for RiverSource Funds and since 2003 for Nations Funds | | President—Micco LLC (private investments) | | | 146 | | | Former Trustee, BofA Funds Series Trust (11 funds); Board Member, Piedmont Natural Gas; Director, Blue Cross Blue Shield of South Carolina | |
|
| Alison Taunton-Rigby | |
|
901 S. Marquette Ave.
Minneapolis, MN 55402
Age 67 | | Board member since 11/02 for RiverSource Funds and since 6/11 for Nations Funds | | Chief Executive Officer and Director, RiboNovix, Inc. 2003-2010 (biotechnology); former President, Aquila Biopharmaceuticals | | | 153 | | | Director, Healthways, Inc. (health management programs); Director, ICI Mutual Insurance Company, RRG; Director, Abt Associates (government contractor) | |
|
42
Fund Governance (continued)
Interested Board Member Not Affiliated with Investment Manager*
| Name, Address, Age | | Position Held
with Funds
and Length
of Service | | Principal Occupation During Past Five Years | | Number of
Funds in the
Fund Family
Overseen by
Board Member | | Other Present or
Past Directorships/
Trusteeships
(Within Past 5 Years) | |
| Anthony M. Santomero* | | | | | | | | | |
|
225 Franklin Street
Mail Drop
BX32 05228
Boston, MA 02110
Age 65 | | Board member since 6/11 for RiverSource Funds and since 1/08 for Nations Funds | | Richard K. Mellon Professor Emeritus of Finance, The Wharton School, University of Pennsylvania, since 2002; Senior Advisor, McKinsey & Company (consulting), 2006-2008; President and Chief Executive Officer, Federal Reserve Bank of Philadelphia, 2000-2006 | | | 146 | | | Director, Renaissance Reinsurance Ltd.; Trustee, Penn Mutual Life Insurance Company; Director, Citigroup; Director, Citibank, N.A.; former Trustee, BofA Funds Series Trust (11 funds) | |
|
* Dr. Santomero is not an affiliated person of the Investment Manager or Ameriprise Financial. However, he is currently deemed by the funds to be an "interested person" (as defined in the 1940 Act) of the Funds because he serves as a Director of Citigroup, Inc. and Citibank N.A., companies that may directly or through subsidiaries and affiliates engage from time-to-time in brokerage execution, principal transactions and lending relationships with the funds or accounts advised/managed by the Investment Manager.
Interested Board Member Affiliated with Investment Manager*
| William F. Truscott | | | | | | | | | |
|
53600 Ameriprise Financial Center
Minneapolis, MN 55474
Age 51 | | Board member since 11/01 for RiverSource Funds and since 6/11 for Nations Funds; Senior Vice President since 2002 for RiverSource Funds and 5/10 for Nations Funds. | | Chairman of the Board and President, Columbia Management Investment Advisers, LLC since May 2010 and February 2012, respectively (previously President, Chairman of the Board and Chief Investment Officer, 2001-April 2010); Chief Executive Officer, U.S. Asset Management & President, Annuities, Ameriprise Financial, Inc. since May 2010 (previously President—U.S. Asset Management and Chief Investment Officer, 2005-April 2010); Director, President and Chief Executive Officer, Ameriprise Certificate Company since 2006; Director and Chief Executive Officer, Columbia Management Investment Distributors, Inc. since May 2010 and February 2012, respectively (previously Chairman of the Board and Chief Executive Officer, 2006-April 2010); Chairman of the Board and Chief Executive Officer, RiverSource Distributors, Inc. since 2006. | | | 153 | | | None | |
|
* Interested person (as defined under the 1940 Act) by reason of being an officer, director, security holder and/or employee of the Investment Manager or Ameriprise Financial.
The SAI has additional information about the Fund's Board members and is available, without charge, upon request by calling 800.345.6611; contacting your financial intermediary; or visiting columbiamanagement.com.
43
Fund Governance (continued)
Officers
| Name, Year of Birth and Address | | Principal Occupation(s) During the Past Five Years | |
| J. Kevin Connaughton (Born 1964) | |
|
225 Franklin Street
Boston, MA 02110
President (since 2009) | | Senior Vice President and General Manager—Mutual Fund Products, Columbia Management Investment Advisers, LLC since May 2010; President, Columbia Funds, since 2009, and RiverSource Funds, since May 2010 (previously Senior Vice President and Chief Financial Officer, Columbia Funds, from June 2008 to January 2009, Treasurer, Columbia Funds, from October 2003 to May 2008, and senior officer of various other affiliated funds since 2000); Managing Director, Columbia Management Advisors, LLC from December 2004 to April 2010. | |
|
| Michael G. Clarke (Born 1969) | |
|
225 Franklin Street
Boston, MA 02110
Treasurer (since 2011) and Chief Financial Officer (since 2009) | | Vice President, Columbia Management Investment Advisers, LLC since May 2010; Managing Director of Fund Administration, Columbia Management Advisors, LLC, from September 2004 to April 2010; senior officer of Columbia Funds and affiliated funds since 2002. | |
|
| Scott R. Plummer (Born 1959) | |
|
5228 Ameriprise Financial Center
Minneapolis, MN 55474
Senior Vice President and Chief Legal Officer (since 2010) | | Chief Legal Officer and Assistant Secretary, Columbia Management Investment Advisers, LLC since June 2005; Vice President and Lead Chief Counsel—Asset Management, Ameriprise Financial, Inc. since May 2010 (previously Vice President and Chief Counsel—Asset Management, from 2005 to April 2010, Vice President, Chief Counsel and Assistant Secretary, Columbia Management Investment Distributors, Inc. since 2008; Vice President, General Counsel and Secretary, Ameriprise Certificate Company since 2005; Chief Counsel, RiverSource Distributors, Inc. since 2006; Senior officer of Columbia Funds and affiliated funds, since 2006. | |
|
| Thomas P. McGuire (Born 1972) | |
|
225 Franklin Street
Boston, MA 02110
Chief Compliance Officer (since 2012) | | Vice President—Asset Management Compliance, Columbia Management Investment Advisers, LLC since March 2010; Chief Compliance Officer, Ameriprise Certificate Company, since September 2010; Compliance Executive, Bank of America, from June 2005 to April 2010. | |
|
| William F. Truscott (Born 1960) | |
|
53600 Ameriprise Financial Center
Minneapolis, MN 55474
Senior Vice President (since 2010) | | Chairman of the Board and President, Columbia Management Investment Advisers, LLC since May 2010 and February 2012, respectively (previously President, Chairman of the Board and Chief Investment Officer, from 2001 to April 2010); Chief Executive Officer, U.S. Asset Management & President, Annuities, Ameriprise Financial, Inc. since May 2010 (previously President—U.S. Asset Management and Chief Investment Officer from 2005 to April 2010); Director, President and Chief Executive Officer, Ameriprise Certificate Company since 2006; Director and Chief Executive Officer, Columbia Management Investment Distributors, Inc. since May 2010 and February 2012, respectively (previously Chairman of the Board and Chief Executive Officer from 2008 to April 2010); Chairman of the Board and Chief Executive Officer, RiverSource Distributors, Inc. since 2006. | |
|
| Paul D. Pearson (Born 1956) | |
|
10468 Ameriprise Financial Center
Minneapolis, MN 55474
Vice President and Assistant Treasurer (since 2011) | | Vice President—Investment Accounting, Columbia Management Investment Advisers, LLC, since May 2010; Vice President—Managed Assets, Investment Accounting, Ameriprise Financial Corporation, 1998-2010 | |
|
44
Fund Governance (continued)
Officers (continued)
| Name, Year of Birth and Address | | Principal Occupation(s) During the Past Five Years | |
| Colin Moore (Born 1958) | |
|
225 Franklin Street
Boston, MA 02110
Senior Vice President (since 2010) | | Director and Chief Investment Officer, Columbia Management Investment Advisers, LLC since May 2010; Manager, Managing Director and Chief Investment Officer of Columbia Management Advisors, LLC from 2007 to April 2010; Head of Equities, Columbia Management Advisors, LLC from 2002 to 2007. | |
|
| Christopher O. Petersen (Born 1970) | |
|
5228 Ameriprise Financial Center
Minneapolis, MN 55474
Vice President and Secretary (since 2011) | | Vice President and Chief Counsel, Ameriprise Financial since January 2010 (formerly Vice President and Group Counsel or Counsel from April 2004 to January 2010); Senior officer of Columbia Funds and affiliated funds, since 2007. | |
|
| Amy K. Johnson (Born 1965) | |
|
5228 Ameriprise Financial Center
Minneapolis, MN 55474
Vice President (since 2010) | | Senior Vice President and Chief Operating Officer, Columbia Management Investment Advisers, LLC since May 2010 (previously Chief Administrative Officer, from 2009 until April 2010, Vice President—Asset Management and Trust Company Services, from 2006 to 2009, and Vice President—Operations and Compliance from 2004 to 2006). | |
|
| Joseph F. DiMaria (Born 1968) | |
|
225 Franklin Street
Boston, MA 02110
Vice President (since 2011) and Chief Accounting Officer (since 2008) | | Vice President, Mutual Fund Administration, Columbia Management Investment Advisers, LLC, since May 2010; Director of Fund Administration, Columbia Management Advisors, LLC from January 2006 to April 2010. | |
|
| Paul B. Goucher (Born 1968) | |
|
100 Park Avenue
New York, NY 10017
Vice President and Assistant Secretary (since 2010) | | Vice President and Chief Counsel of Ameriprise Financial since January 2010 (formerly Vice President and Group Counsel from November 2008 to January 2010); Director, Managing Director and General Counsel of J. & W. Seligman & Co. Incorporated (Seligman) from July 2008 to November 2008 and Managing Director and Associate General Counsel of Seligman from January 2005 to July 2008. | |
|
| Michael E. DeFao (Born 1968) | |
|
225 Franklin Street
Boston, MA 02110
Vice President and Assistant Treasurer (since 2011) | | Vice President and Chief Counsel, Ameriprise Financial since May 2010; Associate General Counsel, Bank of America from June 2005 to April 2010 | |
|
| Stephen T. Welsh (Born 1957) | |
|
225 Franklin Street
Boston, MA 02110
Vice President (since 2006) | | President and Director, Columbia Management Investment Services Corp. since May 2010; President and Director, Columbia Management Services, Inc. from July 2004 to April 2010; Managing Director, Columbia Management Distributors, Inc. from August 2007 to April 2010. | |
|
45
This page intentionally left blank.
46
This page intentionally left blank.
47
This page intentionally left blank.
48
Important Information About This Report
The fund mails one shareholder report to each shareholder address. If you would like more than one report, please call shareholder services at 1-800-345-6611 and additional reports will be sent to you. This report has been prepared for shareholders of Columbia Large Cap Value Fund.
A description of the policies and procedures that the fund uses to determine how to vote proxies and a copy of the fund's voting records are available (i) at www.columbiamanagement.com, (ii) on the Securities and Exchange Commission's website at www.sec.gov, and (iii) without charge, upon request, by calling 1-800-368-0346. Information regarding how the fund voted proxies relating to portfolio securities during the 12-month period ended June 30 is available from the SEC's website. Information regarding how the fund voted proxies relating to portfolio securities is also available from the fund's website, www.columbiamanagement.com.
The fund files a complete schedule of portfolio holdings with the SEC for the first and third quarters of each fiscal year on Form N-Q. The fund's Form N-Q is available on the SEC's website at www.sec.gov and may be reviewed and copied at the SEC's Public Reference Room in Washington, D.C. Information on the operation of the Public Reference Room may be obtained by calling 1-800-SEC-0330.
Transfer Agent
Columbia Management Investment
Services Corp.
P.O. Box 8081
Boston, MA 02266-8081
1-800-345-6611
Distributor
Columbia Management Investment
Distributors, Inc.
225 Franklin Street
Boston, MA 02110
Investment Manager
Columbia Management Investment Advisers, LLC
225 Franklin Street
Boston, MA 02110
49

Columbia Large Cap Value Fund
P. O. Box 8081
Boston, MA 02266-8081
columbiamanagement.com
This information is for use with concurrent or prior delivery of a fund prospectus. Investors should consider the investment objectives, risks, charges and expenses of a mutual fund carefully before investing. For a free prospectus, which contains this and other important information about the funds, visit columbiamanagement.com. Read the prospectus carefully before investing. The Fund is distributed by Columbia Management Investment Distributors, Inc., member FINRA, and managed by Columbia Management Investment Advisers, LLC.
© 2012 Columbia Management Investment Advisers, LLC. All rights reserved.
C-1211 C (4/12)

Columbia Marsico Global Fund
Annual Report for the Period Ended February 29, 2012
Not FDIC insured • No bank guarantee • May lose value
Table of Contents
| Fund Profile | | | 1 | | |
|
| Performance Information | | | 2 | | |
|
| Fund Expense Example | | | 3 | | |
|
| Portfolio Managers' Report | | | 4 | | |
|
| Portfolio of Investments | | | 6 | | |
|
Statement of Assets and
Liabilities | | | 9 | | |
|
| Statement of Operations | | | 11 | | |
|
Statement of Changes in
Net Assets | | | 12 | | |
|
| Financial Highlights | | | 14 | | |
|
| Notes to Financial Statements | | | 18 | | |
|
Report of Independent Registered
Public Accounting Firm | | | 29 | | |
|
| Federal Income Tax Information | | | 30 | | |
|
| Fund Governance | | | 31 | | |
|
Important Information About
This Report | | | 41 | | |
|
The views expressed in this report reflect the current views of the respective parties. These views are not guarantees of future performance and involve certain risks, uncertainties and assumptions that are difficult to predict, so actual outcomes and results may differ significantly from the views expressed. These views are subject to change at any time based upon economic, market or other conditions and the respective parties disclaim any responsibility to update such views. These views may not be relied on as investment advice and, because investment decisions for a Columbia Fund are based on numerous factors, may not be relied on as an indication of trading intent on behalf of any particular Columbia Fund. References to specific securities should not be construed as a recommendation or investment advice.
President's Message

Dear Shareholders,
Americans were dispirited in the fourth quarter of 2011 by Washington's inability to reach a plan for deficit reduction and Europe's piecemeal attempt to address its own fiscal issues. Yet, there was sufficient good news to encourage risk taking, buoying both stocks and bonds to solid gains.
U.S. economic data surprised on the upside and fears of recession abated. With the bar of expectations set low, investors responded positively to the announcement that the economy had expanded by 1.8% in the third quarter. Consumer confidence improved, even though consumers remain under pressure with no real increase in disposable income and a continued decline in household net worth. Headline inflation—which tracks a broad range of consumer expenditures, including food and energy—declined. Even manufacturing held its ground.
Against this backdrop, the U.S. equity markets logged solid returns. The S&P 500 Index gained 11.82%, moving into positive territory for the year with quarterly advances in all ten sectors. Mid- and small-cap stocks did even better. Value outperformed growth across all market capitalizations. Energy stocks led the market, as the price of oil moved above $100 a barrel in December. Industrials and materials stocks rose, buoyed by improving economic data. The U.S. fixed-income markets logged modest but solid returns. High-yield bonds were the best performers as the economy showed signs of improvement. Emerging market bonds were strong performers, as inflation came under control in key regions. Municipal bonds and Treasuries eked out only modest gains, as investors moved away from quality in favor of riskier assets.
While fourth quarter gains were encouraging, challenges still remain. Columbia Management, however, remains strong and steadfast. Columbia Management is the eighth largest manager of long-term mutual fund assets with $326 billion under management as of December 31, 2011. The past year has been one of considerable change for the organization as we worked diligently to align products, services and resources in the integration of Columbia Management with RiverSource Investments. The strong line-up of talent, resources and capabilities that has resulted is highlighted by the success of our products. As of December 31, 2011, Columbia Management offers 52 funds rated either 4 or 5 stars by Morningstar.*
For more information about these and other funds offered by Columbia Management, including detailed, up-to-date fund performance and portfolio information, please visit us online at columbiamanagement.com. Other information and resources available on our website include:
g timely economic analysis and market commentary
g quarterly fund commentaries
g Columbia Management Investor, a quarterly newsletter for shareholders
Thank you for your continued support of the Columbia Funds. We look forward to serving your investment needs for many years to come.
Best Regards,

J. Kevin Connaughton
President, Columbia Funds
*All ratings are based on Class Z shares as of 12/31/2011. Out of 119 Class Z share Columbia funds rated by Morningstar, 7 funds received a 5-star Overall Rating and 45 funds received a 4-star Overall Rating. The Overall Morningstar Rating for a retail mutual fund is derived from a weighted average of the performance figures associated with its 3-, 5- and 10-year (if applicable) Morningstar Rating metrics. For share classes that do not have a 3-, 5-, or 10-year actual performance history, the fund's independent Morningstar Rating metric is then compared against the retail mutual fund universe breakpoints to determine its hypothetical rating.
For each fund with at least a three-year history, Morningstar calculates a Morningstar RatingTM based on a Morningstar Risk-Adjusted Return measure that accounts for variation in a fund's monthly performance (including the effects of sales charges/loads, and redemption fees), placing more emphasis on downward variations and rewarding consistent performance. The top 10% of funds in each category receive 5 stars, the next 22.5% receive 4 stars, the next 35% receive 3 stars, the next 22.5% receive 2 stars and the bottom 10% receive 1 star. (Each share class is counted as a fraction of one fund within this scale and rated separately, which may cause slight variations in the distribution percentages.)
The Morningstar RatingTM is for Class Z shares only; other classes may have different performance characteristics and may have different ratings. ©2012 Morningstar, Inc. All Rights Reserved. The Morningstar information contained herein: (1) is proprietary to Morningstar and/or its content providers; (2) may not be copied or distributed; and (3) is not warranted to be accurate, complete or timely. Neither Morningstar nor its content providers are responsible for any damages or losses arising from any use of this information.
Investors should consider the investment objectives, risks, charges and expenses of a mutual fund carefully before investing. For a free prospectus, which contains this and other important information about the funds, visit columbiamanagement.com. The prospectus should be read carefully before investing.
Columbia Funds are distributed by Columbia Management Investment Distributors, Inc., member FINRA, and managed by Columbia Management Investment Advisers, LLC.
© 2012 Columbia Management Investment Advisers, LLC. All rights reserved.
Fund Profile – Columbia Marsico Global Fund
Summary
g For the 12-month period that ended February 29, 2012, the fund's Class A shares returned –3.27% without sales charge.
g The fund's benchmark, the MSCI All Country World Index (Net), returned –1.49%.1
g Sector allocations hurt returns relative to the index, as the fund was underweight in the strongest-performing sectors. Stock selection in the energy and consumer discretionary sectors also hurt results. However, stock selection in the industrials, materials and health care sectors aided performance.
Portfolio Management
James G. Gendelman has managed the fund since 2008. He is associated with Marsico Capital Management, LLC (Marsico), investment subadviser to the fund.
Thomas F. Marsico has managed the fund since April 2008. He is associated with Marsico, investment subadviser to the fund.
Columbia Management Investment Advisers, LLC (the Investment Manager) retained Marsico to serve as investment subadviser to the Columbia Marsico funds. As an investment subadviser, Marsico makes the investment decisions and manages all or a portion of the fund. Marsico is an investment adviser registered with the Securities and Exchange Commission. Marsico is not affiliated with the Investment Manager.
1The MSCI All Country World Index (ACWI) (Net) is a free float-adjusted market capitalization index that is designed to measure equity market performance in the global developed and emerging markets.
Indices are not available for investment, are not professionally managed and do not reflect sales charges, fees, brokerage commissions, taxes or other expenses of investing. Securities in the fund may not match those in an index.
Performance data quoted represents past performance and current performance may be lower or higher. Past performance is no guarantee of future results. The investment return and principal value will fluctuate so that shares, when redeemed, may be worth more or less than the original cost. Please visit www.columbiamanagement.com for daily and most recent month-end performance updates.
Summary
1-year return as of 02/29/12
| | | | –3.27% | |
|
|  | | | Class A shares
(without sales charge) | |
|
| | | | –1.49% | |
|
|  | | | MSCI All Country World
Index (Net) | |
|
Morningstar Style BoxTM

The Morningstar Style BoxTM is based on the fund's portfolio holdings. For equity funds, the vertical axis shows the market capitalization of the stocks owned, and the horizontal axis shows investment style (value, blend, or growth). Information shown is based on the most recent data provided by Morningstar.
© 2012 Morningstar, Inc. All rights reserved. The Morningstar information contained herein: (1) is proprietary to Morningstar and/or its content providers; (2) may not be copied or distributed; and (3) is not warranted to be accurate, complete or timely. Neither Morningstar nor its content providers are responsible for any damages or losses arising from any use of this information.
1
Performance Information – Columbia Marsico Global Fund
Performance data quoted represents past performance and current performance may be lower or higher. Past performance is no guarantee of future results. The investment return and principal value will fluctuate so that shares, when redeemed, may be worth more or less than the original cost. Please visit www.columbiamanagement.com for daily and most recent month-end performance updates.
Performance of a $10,000 investment 04/30/08 – 02/29/12
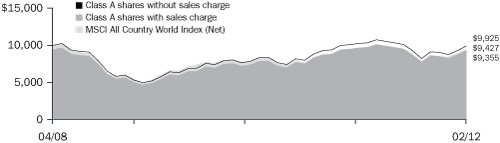
The chart above shows the change in value of a hypothetical $10,000 investment in Class A shares of Columbia Marsico Global Fund during the stated time period, and does not reflect the deduction of taxes that a shareholder may pay on fund distributions or on the redemption of fund shares.
Performance of a $10,000 investment 04/30/08 – 02/29/12 ($)
| Sales charge | | without | | with | |
| Class A | | | 9,925 | | | | 9,355 | | |
| Class C | | | 9,642 | | | | 9,642 | | |
| Class R | | | 9,825 | | | | n/a | | |
| Class Z | | | 10,016 | | | | n/a | | |
Average annual total return as of 02/29/12 (%)
| Share class | | A | | C | | R | | Z | |
| Inception | | 04/30/08 | | 04/30/08 | | 04/30/08 | | 04/30/08 | |
| Sales charge | | without | | with | | without | | with | | without | | without | |
| 1-year | | | –3.27 | | | | –8.83 | | | | –4.04 | | | | –4.99 | | | | –3.62 | | | | –3.12 | | |
| Life | | | –0.20 | | | | –1.73 | | | | –0.95 | | | | –0.95 | | | | –0.46 | | | | 0.04 | | |
The "with sales charge" returns include the maximum initial sales charge of 5.75% for Class A shares and 1.00% for Class C shares for the first year only. The "without sales charge" returns do not include the effect of sales charges. If they had, returns would be lower.
Performance results reflect any fee waivers or reimbursements of fund expenses by Columbia Management Investment Advisers, LLC and/or any of its affiliates. Absent these fee waivers or expense reimbursement arrangements, performance results would have been lower.
All results shown assume reinvestment of distributions. Class Z shares are sold at net asset value with no distribution and service (12b-1) fees. Class R shares are sold at net asset value with a distribution (12b-1) fee. Class R shares and Class Z shares have limited eligibility and the investment minimum requirements may vary. Please see the fund's prospectuses for details.
Performance for different share classes will vary based on differences in sales charges and fees associated with each class.
The tables do not reflect the deduction of taxes that a shareholder may pay on fund distributions or on the redemption of fund shares.
2
Fund Expense Example – Columbia Marsico Global Fund
As an investor, you incur two types of costs. There are transaction costs, which generally include sales charges on purchases and may include redemption fees. There are also ongoing costs, which generally include management fees, distribution and service (Rule 12b-1) fees, and other fund expenses. The following information is intended to help you understand your ongoing costs (in dollars) of investing in the Fund and to help you compare these costs with the ongoing costs of investing in other mutual funds.
Analyzing your fund's expenses
To illustrate these ongoing costs, we have provided examples and calculated the expenses paid by investors in each share class of the Fund during the period. The actual and hypothetical information in the table is based on an initial investment of $1,000 at the beginning of the period indicated and held for the entire period. Expense information is calculated two ways and each method provides you with different information. The amount listed in the "Actual" column is calculated using the Fund's actual operating expenses and total return for the period. You may use the Actual information, together with the amount invested, to estimate the expenses that you paid over the period. Simply divide your account value by $1,000 (for example, an $8,600 account value divided by $1,000 = 8.6), then multiply the results by the expenses paid during the period under the Actual column. The amount listed in the "Hypothetical" column assumes a 5% annual rate of return before expenses (which is not the Fund's actual return) and then applies the Fund's actual expense ratio for the period to the hypothetical return. You should not use the hypothetical account values and expenses to estimate either your actual account balance at the end of the period or the expenses you paid during the period. See "Compare with other funds" below for details on how to use the hypothetical data.
Compare with other funds
Since all mutual funds are required to include the same hypothetical calculations about expenses in shareholder reports, you can use this information to compare the ongoing cost of investing in the Fund with other funds. To do so, compare the hypothetical example with the 5% hypothetical examples that appear in the shareholder reports of other funds. As you compare hypothetical examples of other funds, it is important to note that hypothetical examples are meant to highlight the ongoing costs of investing in a fund only and do not reflect any transaction costs, such as sales charges, or redemption or exchange fees. Therefore, the hypothetical calculations are useful in comparing ongoing costs only, and will not help you determine the relative total costs of owning different funds. If transaction costs were included in these calculations, your costs would be higher.
September 1, 2011 – February 29, 2012
| | | Account value at the
beginning of the period ($) | | Account value at the
end of the period ($) | | Expenses paid
during the period ($) | | Fund's annualized
expense ratio (%) | |
| | | Actual | | Hypothetical | | Actual | | Hypothetical | | Actual | | Hypothetical | | Actual | |
| Class A | | | 1,000.00 | | | | 1,000.00 | | | | 1,069.40 | | | | 1,016.91 | | | | 8.23 | | | | 8.02 | | | | 1.60 | | |
| Class C | | | 1,000.00 | | | | 1,000.00 | | | | 1,064.80 | | | | 1,013.18 | | | | 12.06 | | | | 11.76 | | | | 2.35 | | |
| Class R | | | 1,000.00 | | | | 1,000.00 | | | | 1,067.50 | | | | 1,015.66 | | | | 9.51 | | | | 9.27 | | | | 1.85 | | |
| Class Z | | | 1,000.00 | | | | 1,000.00 | | | | 1,070.20 | | | | 1,018.15 | | | | 6.95 | | | | 6.77 | | | | 1.35 | | |
Expenses paid during the period are equal to the annualized expense ratio for each class as indicated above, multiplied by the average account value over the period and then multiplied by the number of days in the Fund's most recent fiscal half year and divided by 366.
Expenses do not include fees and expenses incurred indirectly by the Fund from the underlying funds in which the Fund may invest (also referred to as "acquired funds"), including affiliated and non-affiliated pooled investments vehicles (including mutual funds and exchange traded funds).
Had Columbia Management Investment Advisers, LLC and/or certain of its affiliates not waived/reimbursed certain fees and expenses, account value at the end of the period would have been reduced.
3
Portfolio Managers' Report – Columbia Marsico Global Fund
Performance data quoted represents past performance and current performance may be lower or higher. Past performance is no guarantee of future results. The investment return and principal value will fluctuate so that shares, when redeemed, may be worth more or less than the original cost. Please visit www.columbiamanagement.com for daily and most recent month-end performance updates.
Net asset value per share
as of 02/29/12 ($)
| Class A | | | 9.71 | | |
| Class C | | | 9.53 | | |
| Class R | | | 9.65 | | |
| Class Z | | | 9.76 | | |
Distributions declared per share
03/01/11 – 02/29/12 ($)
| Class A | | | 0.12 | | |
| Class C | | | 0.10 | | |
| Class R | | | 0.11 | | |
| Class Z | | | 0.12 | | |
For the 12-month period that ended February 29, 2012, the fund's Class A shares returned –3.27% without sales charge. The fund underperformed its benchmark, the MSCI All Country World Index ND (net of dividends), which returned –1.49%. The consumer staples and health care sectors were the strongest performers in the benchmark index, but the fund had few investments in these areas, which detracted from performance. Stock selection in the consumer discretionary and energy sectors also hurt results. Stock selection in the industrials, materials and health care sectors was strong and aided results.
In October 2011 the fund's management changed. Cory Gilchrist left the firm to pursue personal and charitable interests. Tom Marsico and Jim Gendelman continue to serve as co-portfolio managers of the fund.
Stock selection, sector weights hurt results
Stock selection in the energy sector was weak, with oil and gas exploration and production companies OGX Petróleo e Gás Participações and Ultra Petroleum each posting significant declines prior to being sold from the fund. Several consumer discretionary positions materially hurt results, including Hong Kong-based consumer goods firm Li & Fung (0.9% of net assets), General Motors and Walt Disney. The latter two positions were also sold during the period. Sector allocations also restrained results. The fund was underweight in the consumer staples and health care sectors, both of which were the strongest-performing sectors in the benchmark index.
Favorable stock selection in industrials, health care and materials
Stock selection was strong in the industrials sector. Several holdings posted double-digit returns, including aerospace components company Precision Castparts, engine manufacturer Cummins and Internet-based consumer banking information provider Bankrate (2.7%, 1.8% and 1.3% of net assets, respectively). In health care, Intuitive Surgical (4.1% of net assets), which makes a robotic system for assisting in minimally invasive surgeries, was among the fund's strongest performing individual positions. Other good performers included consumer electronics firm Apple and Latin American e-commerce company MercadoLibre (7.5% and 2.5% of net assets, respectively). In the materials sector, specialty chemicals firm Dow Chemical (1.8% of net assets) posted sharp stock price appreciation. Overall, the materials sector was a weak performer in the index, and the fund benefitted from having few investments in the group.
4
Portfolio Managers' Report (continued) – Columbia Marsico Global Fund
Fund positioning intended to reflect economic scenarios
By the end of the period, we sought to position the portfolio to reflect both uncertainty in Europe as well as a more constructive scenario in which the euro zone stabilizes and global growth reaccelerates. Hence, a number of holdings are more defensive in nature, with business models that have proven to be less susceptible to adverse macroeconomic conditions and that are capable of generating solid top-line growth and dependable revenues. Another segment of the portfolio is represented by cyclical companies that have the potential to benefit if the euro zone moves closer to a solution and global economic conditions continue to improve. A final segment of the portfolio consists of stocks selected from a purely bottom-up perspective, which we view as unique stories and compelling investments.
Source for all statistical data—Columbia Management Investment Advisers, LLC.
Source for all stock-specific commentary—Marsico Capital Management, LLC.
Portfolio characteristics and holdings are subject to change periodically and may not be representative of current characteristics and holdings. The outlook for this fund may differ from those presented for other Columbia Funds.
Equity securities are subject to stock market fluctuations that occur in response to economic and business developments.
International investing may involve certain risks, including currency fluctuations, risks associated with possible differences in financial accounting standards and other monetary and political risks. Significant levels of foreign taxes, including potentially confiscatory levels of taxation and withholding taxes, may also apply to some foreign investments.
Investing in emerging markets may involve greater risks than investing in more developed countries. In addition, concentration of investments in a single region may result in greater volatility.
Portfolio breakdown1
as of 02/29/12 (%)
| Consumer Discretionary | | | 30.2 | | |
| Consumer Staples | | | 8.9 | | |
| Energy | | | 4.2 | | |
| Financials | | | 11.2 | | |
| Health Care | | | 7.6 | | |
| Industrials | | | 9.4 | | |
| Information Technology | | | 22.1 | | |
| Materials | | | 4.5 | | |
| Other2 | | | 1.9 | | |
1Percentages indicated are based upon total investments. The Fund's portfolio composition is subject to change.
2Includes investments in affiliated money market fund.
Top 10 holdings1
as of 02/29/12 (%)
| Apple, Inc. | | | 7.5 | | |
| Samsung Electronics Co., Ltd. | | | 4.5 | | |
Cie Financiere Richemont SA,
Class A | | | 4.1 | | |
| Intuitive Surgical, Inc. | | | 4.0 | | |
| Wynn Macau Ltd. | | | 3.7 | | |
| Starbucks Corp. | | | 3.3 | | |
| Julius Baer Group Ltd. | | | 3.3 | | |
| Mead Johnson Nutrition Co. | | | 3.1 | | |
| Anheuser-Busch InBev NV | | | 3.1 | | |
| Wells Fargo & Co. | | | 3.0 | | |
1Percentages indicated are based upon total investments (excluding affiliated money market fund).
For further detail about these holdings, please refer to the section entitled "Portfolio of Investments."
Fund holdings are as of the date given, are subject to change at any time, and are not recommendations to buy or sell any security.
5
Portfolio of Investments – Columbia Marsico Global Fund
February 29, 2012
(Percentages represent value of investments compared to net assets)
| Issuer | | Shares | | Value | |
| Common Stocks 100.7% | |
| ARGENTINA 2.5% | |
| MercadoLibre, Inc. | | | 2,135 | | | $ | 207,757 | | |
| BELGIUM 3.1% | |
| Anheuser-Busch InBev NV | | | 3,860 | | | | 259,294 | | |
| BRAZIL 2.2% | |
| BR Malls Participacoes SA | | | 14,300 | | | | 185,531 | | |
| CHINA 5.7% | |
| Baidu, Inc., ADR(a) | | | 1,227 | | | | 167,731 | | |
| Wynn Macau Ltd. | | | 119,727 | | | | 313,183 | | |
| Total | | | 480,914 | | |
| DENMARK 2.8% | |
| Novozymes A/S, Class B | | | 7,970 | | | | 237,083 | | |
| GERMANY 1.8% | |
| Bayerische Motoren Werke AG | | | 1,676 | | | | 155,033 | | |
| HONG KONG 2.3% | |
| Hang Lung Properties Ltd. | | | 32,000 | | | | 120,613 | | |
| Li & Fung Ltd. | | | 32,000 | | | | 72,971 | | |
| Total | | | 193,584 | | |
| IRELAND 2.9% | |
| Accenture PLC, Class A | | | 4,129 | | | | 245,841 | | |
| ITALY 2.8% | |
| Prada SpA(a) | | | 42,800 | | | | 240,026 | | |
| JAPAN 2.4% | |
| FANUC CORP. | | | 1,100 | | | | 199,964 | | |
| NETHERLANDS 2.8% | |
| Sensata Technologies Holding NV(a) | | | 7,263 | | | | 235,321 | | |
| SOUTH KOREA 4.6% | |
| Samsung Electronics Co., Ltd. | | | 357 | | | | 383,905 | | |
| SPAIN 2.5% | |
| Inditex SA | | | 2,269 | | | | 209,523 | | |
| SWITZERLAND 10.4% | |
| Cie Financiere Richemont SA, Class A | | | 5,675 | | | | 348,454 | | |
| Julius Baer Group Ltd.(a) | | | 7,144 | | | | 279,932 | | |
| Nestlé SA, Registered Shares | | | 2,846 | | | | 173,962 | | |
| Roche Holding AG, Genusschein Shares | | | 435 | | | | 75,730 | | |
| Total | | | 878,078 | | |
| Issuer | | Shares | | Value | |
| Common Stocks (continued) | |
| UNITED KINGDOM 1.0% | |
| ARM Holdings PLC | | | 8,979 | | | $ | 81,351 | | |
| UNITED STATES 50.9% | |
| Apple, Inc.(a) | | | 1,171 | | | | 635,197 | | |
| Bankrate, Inc.(a) | | | 4,641 | | | | 110,641 | | |
| Biogen Idec, Inc.(a) | | | 2,033 | | | | 236,784 | | |
| Chipotle Mexican Grill, Inc.(a) | | | 259 | | | | 101,067 | | |
| Citigroup, Inc. | | | 3,899 | | | | 129,915 | | |
| Cummins, Inc. | | | 1,235 | | | | 148,904 | | |
| Dollar General Corp.(a) | | | 5,977 | | | | 251,393 | | |
| Dow Chemical Co. (The) | | | 4,513 | | | | 151,231 | | |
| Google, Inc., Class A(a) | | | 133 | | | | 82,227 | | |
| Halliburton Co. | | | 3,324 | | | | 121,625 | | |
| Home Depot, Inc. (The) | | | 2,860 | | | | 136,050 | | |
| Intuitive Surgical, Inc.(a) | | | 671 | | | | 343,297 | | |
| Lululemon Athletica, Inc.(a) | | | 1,904 | | | | 127,606 | | |
| Mead Johnson Nutrition Co. | | | 3,384 | | | | 263,106 | | |
| Occidental Petroleum Corp. | | | 2,359 | | | | 246,209 | | |
| Precision Castparts Corp. | | | 1,350 | | | | 226,030 | | |
| priceline.com, Inc.(a) | | | 382 | | | | 239,522 | | |
| Pricesmart, Inc. | | | 1,139 | | | | 73,614 | | |
| Starbucks Corp. | | | 5,799 | | | | 281,599 | | |
| Starwood Hotels & Resorts Worldwide, Inc. | | | 1,248 | | | | 67,267 | | |
| Tesla Motors, Inc.(a) | | | 2,021 | | | | 67,522 | | |
| Wells Fargo & Co. | | | 8,100 | | | | 253,449 | | |
| Total | | | 4,294,255 | | |
Total Common Stocks
(Cost: $6,993,984) | | $ | 8,487,460 | | |
| | | Shares | | Value | |
| Money Market Funds 1.9% | |
| Columbia Short-Term Cash Fund, 0.166%(b)(c) | | | 162,080 | | | $ | 162,080 | | |
Total Money Market Funds
(Cost: $162,080) | | $ | 162,080 | | |
Total Investments
(Cost: $7,156,064) | | | | | | $ | 8,649,540 | | |
| Other Assets & Liabilities, Net | | | | | | | (218,505 | ) | |
| Net Assets | | | | | | $ | 8,431,035 | | |
Investments in Derivatives
Forward Foreign Currency Exchange Contracts Open at February 29, 2012
| Counterparty | | Exchange Date | | Currency to be
Delivered | | Currency to be
Received | | Unrealized
Appreciation | | Unrealized
Depreciation | |
| J.P. Morgan Securities, Inc. | | March 5, 2012
| | $ | 140,125
(GBP) | | | $ | 223,229
(USD) | | | $ | 304
| | | $ | —
| | |
| J.P. Morgan Securities, Inc. | | March 5, 2012
| | | 200,703
(USD) | | | | 16,260,567
(JPY) | | | | —
| | | | (672
| ) | |
| Total | | | | | | | | $ | 304 | | | $ | (672 | ) | |
The Accompanying Notes to Financial Statements are an integral part of this statement.
6
Columbia Marsico Global Fund
February 29, 2012
Summary of Investments in Securities by Industry (unaudited)
The following table represents the portfolio investments of the Fund by industry classifications as a percentage of net assets at February 29, 2012:
| Industry | | Percentage of
Net Assets | | Value | |
| Aerospace & Defense | | | 2.7 | % | | $ | 226,031 | | |
| Automobiles | | | 2.6 | | | | 222,554 | | |
| Beverages | | | 3.1 | | | | 259,294 | | |
| Biotechnology | | | 2.8 | | | | 236,783 | | |
| Capital Markets | | | 3.3 | | | | 279,932 | | |
| Chemicals | | | 4.6 | | | | 388,314 | | |
| Commercial Banks | | | 3.0 | | | | 253,449 | | |
| Computers & Peripherals | | | 7.5 | | | | 635,197 | | |
| Distributors | | | 0.9 | | | | 72,971 | | |
| Diversified Financial Services | | | 1.6 | | | | 129,915 | | |
| Electrical Equipment | | | 2.8 | | | | 235,321 | | |
| Energy Equipment & Services | | | 1.5 | | | | 121,625 | | |
| Food & Staples Retailing | | | 0.9 | | | | 73,614 | | |
| Food Products | | | 5.2 | | | | 437,068 | | |
Summary of Investments in Securities by Industry (cont.)
| Industry | | Percentage of
Net Assets | | Value | |
| Health Care Equipment & Supplies | | | 4.1 | % | | $ | 343,297 | | |
| Hotels, Restaurants & Leisure | | | 9.1 | | | | 763,117 | | |
| Internet Software & Services | | | 6.7 | | | | 568,356 | | |
| IT Services | | | 2.9 | | | | 245,841 | | |
| Internet & Catalog Retail | | | 2.8 | | | | 239,522 | | |
| Machinery | | | 4.1 | | | | 348,868 | | |
| Multiline Retail | | | 3.0 | | | | 251,393 | | |
| Oil, Gas & Consumable Fuels | | | 2.9 | | | | 246,209 | | |
| Pharmaceuticals | | | 0.9 | | | | 75,730 | | |
| Real Estate Management & Development | | | 3.6 | | | | 306,144 | | |
| Semiconductors & Semiconductor Equipment | | | 5.5 | | | | 465,256 | | |
| Speciality Retail | | | 4.1 | | | | 345,573 | | |
| Textiles, Apparel & Luxury Goods | | | 8.5 | | | | 716,086 | | |
| Other(1) | | | 1.9 | | | | 162,080 | | |
| Total | | | | $ | 8,649,540 | | |
(1) Includes affiliated money market fund.
Notes to Portfolio of Investments
(a) Non-income producing.
(b) The rate shown is the seven-day current annualized yield at February 29, 2012.
(c) Investments in affiliates during the year ended February 29, 2012:
| Issuer | | Beginning
Cost | | Purchase
Cost | | Sales Cost/
Proceeds
from Sales | | Realized
Gain/Loss | | Ending
Cost | | Dividends
or Interest
Income | | Value | |
Columbia Short-Term
Cash Fund | | $ | — | | | $ | 4,970,932 | | | $ | (4,808,852 | ) | | $ | — | | | $ | 162,080 | | | $ | 429 | | | $ | 162,080 | | |
Abbreviation Legend
ADR American Depositary Receipt
Currency Legend
GBP Pound Sterling
JPY Japanese Yen
USD US Dollar
Fair Value Measurements
Generally accepted accounting principles (GAAP) require disclosure regarding the inputs and valuation techniques used to measure fair value and any changes in valuation inputs or techniques. In addition, investments shall be disclosed by major category.
The Fund categorizes its fair value measurements according to a three-level hierarchy that maximizes the use of observable inputs and minimizes the use of unobservable inputs by prioritizing that the most observable input be used when available. Observable inputs are those that market participants would use in pricing an investment based on market data obtained from sources independent of the reporting entity. Unobservable inputs are those that reflect the Fund's assumptions about the information market participants would use in pricing an investment. An investment's level within the fair value hierarchy is based on the lowest level of any input that is deemed significant to the asset or liability's fair value measurement. The input levels are not necessarily an indication of the risk or liquidity associated with investments at that level. For example, certain U.S. government securities are generally high quality and liquid, however, they are reflected as Level 2 because the inputs used to determine fair value may not always be quoted prices in an active market.
Fair value inputs are summarized in the three broad levels listed below:
• Level 1 — Valuations based on quoted prices for investments in active markets that the Fund has the ability to access at the measurement date (including NAV for open-end mutual funds). Valuation adjustments are not applied to Level 1 investments.
• Level 2 — Valuations based on other significant observable inputs (including quoted prices for similar securities, interest rates, prepayment speeds, credit risks, etc.).
The Accompanying Notes to Financial Statements are an integral part of this statement.
7
Columbia Marsico Global Fund
February 29, 2012
Fair Value Measurements (continued)
• Level 3 — Valuations based on significant unobservable inputs (including the Fund's own assumptions and judgment in determining the fair value of investments).
Inputs that are used in determining fair value of an investment may include price information, credit data, volatility statistics, and other factors. These inputs can be either observable or unobservable. The availability of observable inputs can vary between investments, and is affected by various factors such as the type of investment, and the volume and level of activity for that investment or similar investments in the marketplace. The inputs will be considered by the Investment Manager, along with any other relevant factors in the calculation of an investment's fair value. The Fund uses prices and inputs that are current as of the measurement date, which may include periods of market dislocations. During these periods, the availability of prices and inputs may be reduced for many investments. This condition could cause an investment to be reclassified between the various levels within the hierarchy.
Foreign equity securities actively traded in markets where there is a significant delay in the local close relative to the New York Stock Exchange (NYSE) are classified as Level 2. The values of these securities may include an adjustment to reflect the impact of significant market movements following the close of local trading, as described in Note 2 to the financial statements — Security Valuation.
Investments falling into the Level 3 category are primarily supported by quoted prices from brokers and dealers participating in the market for those investments. However, these may be classified as Level 3 investments due to lack of market transparency and corroboration to support these quoted prices. Additionally, valuation models may be used as the pricing source for any remaining investments classified as Level 3. These models rely on one or more significant unobservable inputs and/or significant assumptions by the Investment Manager. Inputs used in valuations may include, but are not limited to, financial statement analysis, capital account balances, discount rates and estimated cash flows, and comparable company data.
The following table is a summary of the inputs used to value the Fund's investments as of February 29, 2012:
| | | Fair Value at February 29, 2012 | |
| Description(a) | | Level 1
Quoted Prices
in Active
Markets for
Identical Assets | | Level 2
Other
Significant
Observable
Inputs(b) | | Level 3
Significant
Unobservable
Inputs | | Total | |
| Equity Securities | |
| Common Stocks | |
| Consumer Discretionary | | $ | 1,272,026 | | | $ | 1,339,190 | | | $ | — | | | $ | 2,611,216 | | |
| Consumer Staples | | | 336,720 | | | | 433,256 | | | | — | | | | 769,976 | | |
| Energy | | | 367,834 | | | | — | | | | — | | | | 367,834 | | |
| Financials | | | 568,895 | | | | 400,545 | | | | — | | | | 969,440 | | |
| Health Care | | | 580,081 | | | | 75,729 | | | | — | | | | 655,810 | | |
| Industrials | | | 610,256 | | | | 199,964 | | | | — | | | | 810,220 | | |
| Information Technology | | | 1,449,394 | | | | 465,256 | | | | — | | | | 1,914,650 | | |
| Materials | | | 151,231 | | | | 237,083 | | | | — | | | | 388,314 | | |
| Total Equity Securities | | | 5,336,437 | | | | 3,151,023 | | | | — | | | | 8,487,460 | | |
| Other | |
| Money Market Funds | | | 162,080 | | | | — | | | | — | | | | 162,080 | | |
| Total Other | | | 162,080 | | | | — | | | | — | | | | 162,080 | | |
| Investments in Securities | | | 5,498,517 | | | | 3,151,023 | | | | — | | | | 8,649,540 | | |
| Derivatives(c) | |
Assets
Forward Foreign Currency Exchange Contracts | | | — | | | | 304 | | | | — | | | | 304 | | |
Liabilities
Forward Foreign Currency Exchange Contracts | | | — | | | | (672 | ) | | | — | | | | (672 | ) | |
| Total | | $ | 5,498,517 | | | $ | 3,150,655 | | | $ | — | | | $ | 8,649,172 | | |
The Fund's assets assigned to the Level 2 input category are generally valued using the market approach, in which a security's value is determined through reference to prices and information from market transactions for similar or identical assets. These assets include certain foreign securities for which a third party statistical pricing service may be employed for purposes of fair market valuation. The models utilized by the third party statistical pricing service take into account a security's correlation to available market data including, but not limited to, intraday index, ADR, and ETF movements.
(a) See the Portfolio of Investments for all investment classifications not indicated in the table.
(b) There were no significant transfers between Levels 1 and 2 during the period.
(c) Derivative instruments are valued at unrealized appreciation (depreciation).
The Accompanying Notes to Financial Statements are an integral part of this statement.
8
Statement of Assets and Liabilities – Columbia Marsico Global Fund
February 29, 2012
| Assets | |
| Investments, at value | |
| Unaffiliated issuers (identified cost $6,993,984) | | $ | 8,487,460 | | |
| Affiliated issuers (identified cost $162,080) | | | 162,080 | | |
| Total investments (identified cost $7,156,064) | | | 8,649,540 | | |
| Unrealized appreciation on forward foreign currency exchange contracts | | | 304 | | |
| Receivable for: | |
| Investments sold | | | 222,925 | | |
| Capital shares sold | | | 390 | | |
| Dividends | | | 503 | | |
| Reclaims | | | 3,600 | | |
| Expense reimbursement due from Investment Manager | | | 474 | | |
| Prepaid expense | | | 4,884 | | |
| Total assets | | | 8,882,620 | | |
| Liabilities | |
| Unrealized depreciation on forward foreign currency exchange contracts | | | 672 | | |
| Payable for: | |
| Investments purchased | | | 317,668 | | |
| Capital shares purchased | | | 15,000 | | |
| Investment management fees | | | 185 | | |
| Distribution and service fees | | | 98 | | |
| Transfer agent fees | | | 715 | | |
| Administration fees | | | 51 | | |
| Chief compliance officer expenses | | | 117 | | |
| Other expenses | | | 117,079 | | |
| Total liabilities | | | 451,585 | | |
| Net assets applicable to outstanding capital stock | | $ | 8,431,035 | | |
The Accompanying Notes to Financial Statements are an integral part of this statement.
9
Statement of Assets and Liabilities (continued) – Columbia Marsico Global Fund
February 29, 2012
| Represented by | |
| Paid-in capital | | $ | 8,389,756 | | |
| Excess of distributions over net investment income | | | (20,057 | ) | |
| Accumulated net realized loss | | | (1,431,816 | ) | |
| Unrealized appreciation (depreciation) on: | |
| Investments | | | 1,493,476 | | |
| Foreign currency translations | | | 44 | | |
| Forward foreign currency exchange contracts | | | (368 | ) | |
| Total — representing net assets applicable to outstanding capital stock | | $ | 8,431,035 | | |
| Net assets applicable to outstanding shares | |
| Class A | | $ | 3,785,634 | | |
| Class C | | $ | 2,011,926 | | |
| Class R | | $ | 1,195,000 | | |
| Class Z | | $ | 1,438,475 | | |
| Shares outstanding | |
| Class A | | | 389,860 | | |
| Class C | | | 211,059 | | |
| Class R | | | 123,784 | | |
| Class Z | | | 147,319 | | |
| Net asset value per share | |
| Class A(a) | | $ | 9.71 | | |
| Class C | | $ | 9.53 | | |
| Class R | | $ | 9.65 | | |
| Class Z | | $ | 9.76 | | |
(a) The maximum offering price per share for Class A is $10.30. The offering price is calculated by dividing the net asset value by 1.0 minus the maximum sales charge of 5.75%.
The Accompanying Notes to Financial Statements are an integral part of this statement.
10
Statement of Operations – Columbia Marsico Global Fund
Year ended February 29, 2012
| Net investment income | |
| Income: | |
| Dividends | | $ | 97,726 | | |
| Interest | | | 37 | | |
| Dividends from affiliates | | | 429 | | |
| Foreign taxes withheld | | | (4,825 | ) | |
| Total income | | | 93,367 | | |
| Expenses: | |
| Investment management fees | | | 67,749 | | |
| Distribution fees | |
| Class C | | | 14,677 | | |
| Class R | | | 5,765 | | |
| Service fees | |
| Class C | | | 4,893 | | |
| Distribution and service fees — Class A | | | 9,830 | | |
| Transfer agent fees | |
| Class A | | | 3,573 | | |
| Class C | | | 1,785 | | |
| Class R | | | 1,052 | | |
| Class Z | | | 1,300 | | |
| Administration fees | | | 4,675 | | |
| Compensation of board members | | | 13,527 | | |
| Pricing and bookkeeping fees | | | 18,087 | | |
| Custodian fees | | | 17,271 | | |
| Printing and postage fees | | | 27,670 | | |
| Registration fees | | | 50,120 | | |
| Professional fees | | | 66,814 | | |
| Chief compliance officer expenses | | | 199 | | |
| Other | | | 7,373 | | |
| Total expenses | | | 316,360 | | |
| Fees waived or expenses reimbursed by Investment Manager and its affiliates | | | (166,867 | ) | |
| Total net expenses | | | 149,493 | | |
| Net investment loss | | | (56,126 | ) | |
| Realized and unrealized gain (loss) — net | |
| Net realized gain (loss) on: | |
| Investments | | | (243,498 | ) | |
| Foreign currency translations | | | 2,476 | | |
| Forward foreign currency exchange contracts | | | (6,510 | ) | |
| Net realized loss | | | (247,532 | ) | |
| Net change in unrealized appreciation (depreciation) on: | |
| Investments | | | (102,819 | ) | |
| Foreign currency translations | | | (596 | ) | |
| Forward foreign currency exchange contracts | | | (368 | ) | |
| Net change in unrealized depreciation | | | (103,783 | ) | |
| Net realized and unrealized loss | | | (351,315 | ) | |
| Net decrease in net assets from operations | | $ | (407,441 | ) | |
The Accompanying Notes to Financial Statements are an integral part of this statement.
11
Statement of Changes in Net Assets – Columbia Marsico Global Fund
| | | Year ended
February 29,
2012 | | Year ended
February 28,
2011 | |
| Operations | |
| Net investment loss | | $ | (56,126 | ) | | $ | (49,171 | ) | |
| Net realized gain (loss) | | | (247,532 | ) | | | 977,276 | | |
| Net change in unrealized appreciation (depreciation) | | | (103,783 | ) | | | 752,240 | | |
| Net increase (decrease) in net assets resulting from operations | | | (407,441 | ) | | | 1,680,345 | | |
| Distributions to shareholders from: | |
| Net investment income | |
| Class A | | | (4,805 | ) | | | (17,012 | ) | |
| Class C | | | (730 | ) | | | (1,385 | ) | |
| Class R | | | (1,118 | ) | | | (5,206 | ) | |
| Class Z | | | (2,247 | ) | | | (11,746 | ) | |
| Net realized gains | |
| Class A | | | (39,988 | ) | | | — | | |
| Class C | | | (20,597 | ) | | | — | | |
| Class R | | | (11,798 | ) | | | — | | |
| Class Z | | | (14,569 | ) | | | — | | |
| Tax return of capital | |
| Class A | | | (3,507 | ) | | | |
| Class C | | | (1,036 | ) | | | |
| Class R | | | (903 | ) | | | |
| Class Z | | | (1,497 | ) | | | |
| Total distributions to shareholders | | | (102,795 | ) | | | (35,349 | ) | |
| Increase in net assets from share transactions | | | 745,769 | | | | 1,014,017 | | |
| Total increase in net assets | | | 235,533 | | | | 2,659,013 | | |
| Net assets at beginning of year | | | 8,195,502 | | | | 5,536,489 | | |
| Net assets at end of year | | $ | 8,431,035 | | | $ | 8,195,502 | | |
| Excess of distributions over net investment income | | $ | (20,057 | ) | | $ | (74,637 | ) | |
The Accompanying Notes to Financial Statements are an integral part of this statement.
12
Statement of Changes in Net Assets (continued) – Columbia Marsico Global Fund
| | | Year ended February 29,
2012 | | Year ended February 28,
2011 | |
| | | Shares | | Dollars ($) | | Shares | | Dollars ($) | |
| Capital stock activity | |
| Class A shares | |
| Subscriptions | | | 206,746 | | | | 2,013,459 | | | | 250,144 | | | | 2,329,236 | | |
| Distributions reinvested | | | 2,568 | | | | 24,649 | | | | 545 | | | | 5,311 | | |
| Redemptions | | | (148,345 | ) | | | (1,331,799 | ) | | | (175,146 | ) | | | (1,567,235 | ) | |
| Net increase | | | 60,969 | | | | 706,309 | | | | 75,543 | | | | 767,312 | | |
| Class C shares | |
| Subscriptions | | | 28,078 | | | | 260,860 | | | | 154,538 | | | | 1,403,639 | | |
| Distributions reinvested | | | 775 | | | | 7,338 | | | | 37 | | | | 361 | | |
| Redemptions | | | (22,034 | ) | | | (190,106 | ) | | | (133,690 | ) | | | (1,210,582 | ) | |
| Net increase | | | 6,819 | | | | 78,092 | | | | 20,885 | | | | 193,418 | | |
| Class R shares | |
| Subscriptions | | | 877 | | | | 8,195 | | | | 122,480 | | | | 1,123,354 | | |
| Distributions reinvested | | | 16 | | | | 150 | | | | 3 | | | | 28 | | |
| Redemptions | | | — | | | | — | | | | (125,246 | ) | | | (1,148,510 | ) | |
| Net increase (decrease) | | | 893 | | | | 8,345 | | | | (2,763 | ) | | | (25,128 | ) | |
| Class Z shares | |
| Subscriptions | | | 3,282 | | | | 31,235 | | | | 134,998 | | | | 1,249,198 | | |
| Distributions reinvested | | | 237 | | | | 2,280 | | | | 149 | | | | 1,454 | | |
| Redemptions | | | (8,826 | ) | | | (80,492 | ) | | | (126,780 | ) | | | (1,172,237 | ) | |
| Net increase (decrease) | | | (5,307 | ) | | | (46,977 | ) | | | 8,367 | | | | 78,415 | | |
| Total net increase | | | 63,374 | | | | 745,769 | | | | 102,032 | | | | 1,014,017 | | |
The Accompanying Notes to Financial Statements are an integral part of this statement.
13
Financial Highlights – Columbia Marsico Global Fund
The following tables are intended to help you understand the Fund's financial performance. Certain information reflects financial results for a single share of a class held for the periods shown. Per share net investment income (loss) amounts are calculated based on average shares outstanding during the period. Total returns assume reinvestment of all dividends and distributions. Total returns do not reflect payments of sales charges, if any, and are not annualized for periods of less than one year.
| | | Year ended
Feb. 29, | | Year ended Feb. 28, | |
| | | 2012 | | 2011 | | 2010 | | 2009(a) | |
| Class A | |
| Per share data | |
| Net asset value, beginning of period | | $ | 10.16 | | | $ | 7.85 | | | $ | 4.98 | | | $ | 10.00 | | |
| Income from investment operations: | |
| Net investment income (loss) | | | (0.05 | ) | | | (0.05 | ) | | | (0.03 | ) | | | 0.01 | | |
| Net realized and unrealized gain (loss) | | | (0.28 | ) | | | 2.42 | | | | 2.93 | | | | (5.03 | ) | |
| Total from investment operations | | | (0.33 | ) | | | 2.37 | | | | 2.90 | | | | (5.02 | ) | |
| Less distributions to shareholders from: | |
| Net investment income | | | (0.01 | ) | | | (0.06 | ) | | | (0.03 | ) | | | — | | |
| Net realized gains | | | (0.10 | ) | | | — | | | | — | | | | — | | |
| Tax return of capital | | | (0.01 | ) | | | — | | | | — | | | | — | | |
| Total distributions to shareholders | | | (0.12 | ) | | | (0.06 | ) | | | (0.03 | ) | | | — | | |
| Redemption fees: | |
| Redemption fees added to paid-in-capital | | | — | | | | — | | | | 0.00 | (b) | | | 0.00 | (b) | |
| Net asset value, end of period | | $ | 9.71 | | | $ | 10.16 | | | $ | 7.85 | | | $ | 4.98 | | |
| Total return | | | (3.27 | %) | | | 30.23 | % | | | 58.22 | % | | | (50.20 | %) | |
| Ratios to average net assets(c) | |
| Expenses prior to fees waived or expenses reimbursed | | | 3.58 | % | | | 5.38 | % | | | 5.44 | % | | | 8.79 | %(d) | |
| Net expenses after fees waived or expenses reimbursed(e) | | | 1.60 | % | | | 1.60 | %(f) | | | 1.60 | %(f) | | | 1.60 | %(d)(g) | |
| Net investment income (loss) | | | (0.50 | %) | | | (0.59 | %)(f) | | | (0.42 | %)(f) | | | 0.09 | %(d)(g) | |
| Supplemental data | |
| Net assets, end of period (in thousands) | | $ | 3,786 | | | $ | 3,343 | | | $ | 1,990 | | | $ | 1,113 | | |
| Portfolio turnover | | | 112 | % | | | 104 | % | | | 137 | % | | | 168 | % | |
| Notes to Financial Highlights | |
(a) For the period from April 30, 2008 (commencement of operations) to February 28, 2009.
(b) Rounds to less than $0.01.
(c) In addition to the fees and expenses which the Fund bears directly, the Fund indirectly bears a pro rata share of the fees and expenses of the acquired funds in which it invests. Such indirect expenses are not included in the reported expense ratios.
(d) Annualized.
(e) The Investment Manager and certain of its affiliates agreed to waive/reimburse certain fees and expenses, if applicable.
(f) The benefits derived from expense reductions had an impact of less than 0.01%.
(g) The benefits derived from expense reductions had an impact of 0.01%.
The Accompanying Notes to Financial Statements are an integral part of this statement.
14
Financial Highlights (continued) – Columbia Marsico Global Fund
| | | Year ended
Feb. 29, | | Year ended Feb. 28, | |
| | | 2012 | | 2011 | | 2010 | | 2009(a) | |
| Class C | |
| Per share data | |
| Net asset value, beginning of period | | $ | 10.04 | | | $ | 7.78 | | | $ | 4.95 | | | $ | 10.00 | | |
| Income from investment operations: | |
| Net investment loss | | | (0.11 | ) | | | (0.12 | ) | | | (0.08 | ) | | | (0.04 | ) | |
| Net realized and unrealized gain (loss) | | | (0.30 | ) | | | 2.39 | | | | 2.91 | | | | (5.01 | ) | |
| Total from investment operations | | | (0.41 | ) | | | 2.27 | | | | 2.83 | | | | (5.05 | ) | |
| Less distributions to shareholders from: | |
| Net investment income | | | (0.00 | )(b) | | | (0.01 | ) | | | — | | | | — | | |
| Net realized gains | | | (0.10 | ) | | | — | | | | — | | | | — | | |
| Tax return of capital | | | (0.00 | )(b) | | | — | | | | — | | | | — | | |
| Total distributions to shareholders | | | (0.10 | ) | | | (0.01 | ) | | | — | | | | — | | |
| Redemption fees: | |
| Redemption fees added to paid-in-capital | | | — | | | | — | | | | 0.00 | (b) | | | 0.00 | (b) | |
| Net asset value, end of period | | $ | 9.53 | | | $ | 10.04 | | | $ | 7.78 | | | $ | 4.95 | | |
| Total return | | | (4.04 | %) | | | 29.14 | % | | | 57.17 | % | | | (50.50 | %) | |
| Ratios to average net assets(c) | |
| Expenses prior to fees waived or expenses reimbursed | | | 4.32 | % | | | 6.13 | % | | | 6.19 | % | | | 9.54 | %(d) | |
| Net expenses after fees waived or expenses reimbursed(e) | | | 2.35 | % | | | 2.35 | %(f) | | | 2.35 | %(f) | | | 2.35 | %(d)(g) | |
| Net investment loss | | | (1.25 | %) | | | (1.33 | %)(f) | | | (1.15 | %)(f) | | | (0.63 | %)(d)(g) | |
| Supplemental data | |
| Net assets, end of period (in thousands) | | $ | 2,012 | | | $ | 2,051 | | | $ | 1,426 | | | $ | 886 | | |
| Portfolio turnover | | | 112 | % | | | 104 | % | | | 137 | % | | | 168 | % | |
| Notes to Financial Highlights | |
(a) For the period from April 30, 2008 (commencement of operations) to February 28, 2009.
(b) Rounds to less than $0.01.
(c) In addition to the fees and expenses which the Fund bears directly, the Fund indirectly bears a pro rata share of the fees and expenses of the acquired funds in which it invests. Such indirect expenses are not included in the reported expense ratios.
(d) Annualized.
(e) The Investment Manager and certain of its affiliates agreed to waive/reimburse certain fees and expenses, if applicable.
(f) The benefits derived from expense reductions had an impact of less than 0.01%.
(g) The benefits derived from expense reductions had an impact of 0.01%.
The Accompanying Notes to Financial Statements are an integral part of this statement.
15
Financial Highlights (continued) – Columbia Marsico Global Fund
| | | Year ended
Feb. 29, | | Year ended Feb. 28, | |
| | | 2012 | | 2011 | | 2010 | | 2009(a) | |
| Class R | |
| Per share data | |
| Net asset value, beginning of period | | $ | 10.13 | | | $ | 7.83 | | | $ | 4.97 | | | $ | 10.00 | | |
| Income from investment operations: | |
| Net investment loss | | | (0.07 | ) | | | (0.07 | ) | | | (0.05 | ) | | | (0.01 | ) | |
| Net realized and unrealized gain (loss) | | | (0.30 | ) | | | 2.41 | | | | 2.93 | | | | (5.02 | ) | |
| Total from investment operations | | | (0.37 | ) | | | 2.34 | | | | 2.88 | | | | (5.03 | ) | |
| Less distributions to shareholders from: | |
| Net investment income | | | (0.00 | )(b) | | | (0.04 | ) | | | (0.02 | ) | | | — | | |
| Net realized gains | | | (0.10 | ) | | | — | | | | — | | | | — | | |
| Tax return of capital | | | (0.01 | ) | | | — | | | | — | | | | — | | |
| Total distributions to shareholders | | | (0.11 | ) | | | (0.04 | ) | | | (0.02 | ) | | | — | | |
| Redemption fees: | |
| Redemption fees added to paid-in-capital | | | — | | | | — | | | | 0.00 | (b) | | | 0.00 | (b) | |
| Net asset value, end of period | | $ | 9.65 | | | $ | 10.13 | | | $ | 7.83 | | | $ | 4.97 | | |
| Total return | | | (3.62 | %) | | | 29.94 | % | | | 57.86 | % | | | (50.30 | %) | |
| Ratios to average net assets(c) | |
| Expenses prior to fees waived or expenses reimbursed | | | 3.82 | % | | | 5.63 | % | | | 5.69 | % | | | 9.04 | %(d) | |
| Net expenses after fees waived or expenses reimbursed(e) | | | 1.85 | % | | | 1.85 | %(f) | | | 1.85 | %(f) | | | 1.85 | %(d)(g) | |
| Net investment loss | | | (0.75 | %) | | | (0.82 | %)(f) | | | (0.62 | %)(f) | | | (0.12 | %)(d)(g) | |
| Supplemental data | |
| Net assets, end of period (in thousands) | | $ | 1,195 | | | $ | 1,245 | | | $ | 984 | | | $ | 621 | | |
| Portfolio turnover | | | 112 | % | | | 104 | % | | | 137 | % | | | 168 | % | |
| Notes to Financial Highlights | |
(a) For the period from April 30, 2008 (commencement of operations) to February 28, 2009.
(b) Rounds to less than $0.01.
(c) In addition to the fees and expenses which the Fund bears directly, the Fund indirectly bears a pro rata share of the fees and expenses of the acquired funds in which it invests. Such indirect expenses are not included in the reported expense ratios.
(d) Annualized.
(e) The Investment Manager and certain of its affiliates agreed to waive/reimburse certain fees and expenses, if applicable.
(f) The benefits derived from expense reductions had an impact of less than 0.01%.
(g) The benefits derived from expense reductions had an impact of 0.01%.
The Accompanying Notes to Financial Statements are an integral part of this statement.
16
Financial Highlights (continued) – Columbia Marsico Global Fund
| | | Year ended
Feb. 29, | | Year ended Feb. 28, | |
| | | 2012 | | 2011 | | 2010 | | 2009(a) | |
| Class Z | |
| Per share data | |
| Net asset value, beginning of period | | $ | 10.20 | | | $ | 7.88 | | | $ | 4.99 | | | $ | 10.00 | | |
| Income from investment operations: | |
| Net investment income (loss) | | | (0.02 | ) | | | (0.03 | ) | | | (0.01 | ) | | | 0.02 | | |
| Net realized and unrealized gain (loss) | | | (0.30 | ) | | | 2.43 | | | | 2.94 | | | | (5.03 | ) | |
| Total from investment operations | | | (0.32 | ) | | | 2.40 | | | | 2.93 | | | | (5.01 | ) | |
| Less distributions to shareholders from: | |
| Net investment income | | | (0.01 | ) | | | (0.08 | ) | | | (0.04 | ) | | | — | | |
| Net realized gains | | | (0.10 | ) | | | — | | | | — | | | | — | | |
| Tax return of capital | | | (0.01 | ) | | | — | | | | — | | | | — | | |
| Total distributions to shareholders | | | (0.12 | ) | | | (0.08 | ) | | | (0.04 | ) | | | — | | |
| Redemption fees: | |
| Redemption fees added to paid-in-capital | | | — | | | | — | | | | 0.00 | (b) | | | 0.00 | (b) | |
| Net asset value, end of period | | $ | 9.76 | | | $ | 10.20 | | | $ | 7.88 | | | $ | 4.99 | | |
| Total return | | | (3.12 | %) | | | 30.47 | % | | | 58.79 | % | | | (50.10 | %) | |
| Ratios to average net assets(c) | |
| Expenses prior to fees waived or expenses reimbursed | | | 3.32 | % | | | 5.13 | % | | | 5.19 | % | | | 8.54 | %(d) | |
| Net expenses after fees waived or expenses reimbursed(e) | | | 1.35 | % | | | 1.35 | %(f) | | | 1.35 | %(f) | | | 1.35 | %(d)(g) | |
| Net investment income (loss) | | | (0.25 | %) | | | (0.33 | %)(f) | | | (0.13 | %)(f) | | | 0.35 | %(d)(g) | |
| Supplemental data | |
| Net assets, end of period (in thousands) | | $ | 1,438 | | | $ | 1,557 | | | $ | 1,136 | | | $ | 707 | | |
| Portfolio turnover | | | 112 | % | | | 104 | % | | | 137 | % | | | 168 | % | |
| Notes to Financial Highlights | |
(a) For the period from April 30, 2008 (commencement of operations) to February 28, 2009.
(b) Rounds to less than $0.01.
(c) In addition to the fees and expenses which the Fund bears directly, the Fund indirectly bears a pro rata share of the fees and expenses of the acquired funds in which it invests. Such indirect expenses are not included in the reported expense ratios.
(d) Annualized.
(e) The Investment Manager and certain of its affiliates agreed to waive/reimburse certain fees and expenses, if applicable.
(f) The benefits derived from expense reductions had an impact of less than 0.01%.
(g) The benefits derived from expense reductions had an impact of 0.01%.
The Accompanying Notes to Financial Statements are an integral part of this statement.
17
Notes to Financial Statements – Columbia Marsico Global Fund
February 29, 2012
Note 1. Organization
Columbia Marsico Global Fund (the Fund), a series of Columbia Funds Series Trust (the Trust), is a diversified fund. The Trust is registered under the Investment Company Act of 1940, as amended (the 1940 Act), as an open-end management investment company organized as a Delaware statutory trust.
Fund Shares
The Trust may issue an unlimited number of shares (without par value). The Fund offers Class A, Class C, Class R and Class Z shares. All share classes have identical voting, dividend and liquidation rights. Each share class has its own expense structure and sales charges, as applicable.
Class A shares are subject to a maximum front-end sales charge of 5.75% based on the initial investment amount. Class A shares purchased without an initial sales charge in accounts aggregating $1 million to $50 million at the time of purchase are subject to a contingent deferred sales charge (CDSC) if the shares are sold within 18 months of purchase, charged as follows: 1.00% CDSC if redeemed within 12 months of purchase, and 0.50% CDSC if redeemed more than 12, but less than 18, months after purchase.
Class C shares are subject to a 1.00% CDSC on shares redeemed within one year of purchase.
Class R shares are not subject to sales charges and are only available to qualifying institutional investors.
Class Z shares are not subject to sales charges, and are only available to certain investors, as described in the Fund's prospectus.
Note 2. Summary of Significant Accounting Policies
Use of Estimates
The preparation of financial statements in accordance with U.S. generally accepted accounting principles (GAAP) requires management to make certain estimates and assumptions that affect the reported amounts of assets and liabilities, the disclosure of contingent assets and liabilities at the date of the financial statements and the reported amounts of revenue and expenses during the reporting period. Actual results could differ from those estimates.
The following is a summary of significant accounting policies consistently followed by the Fund in the preparation of its financial statements.
Security Valuation
All equity securities are valued at the close of business of the New York Stock Exchange (NYSE). Equity securities are valued at the last quoted sales price on the principal exchange or market on which they trade, except for securities traded on the NASDAQ Stock Market, which are valued at the NASDAQ official close price. Unlisted securities or listed securities for which there were no sales during the day are valued at the mean of the latest quoted bid and asked prices on such exchanges or markets.
Foreign securities are valued based on quotations from the principal market in which such securities are normally traded. If any foreign share prices are not readily available as a result of limited share activity the securities are valued at the mean of the latest quoted bid and asked prices on such exchanges or markets. Foreign currency exchange rates are generally determined at 4:00 p.m. Eastern (U.S.) time. However, many securities markets and exchanges outside the U.S. close prior to the close of the NYSE; therefore, the closing prices for securities in such markets or on such exchanges may not fully reflect events that occur after such close but before the close of the NYSE. In those situations, foreign securities will be fair valued pursuant to the policy adopted by the Board of Trustees (the Board), including utilizing a third party pricing service to determine these fair values. The third party pricing service takes into account multiple factors, including, but not limited to, movements in the U.S. securities markets, certain depositary receipts, futures contracts and foreign exchange rates that have occurred subsequent to the close of the foreign exchange, to determine a good faith estimate that reasonably reflects the current market conditions as of the close of the NYSE. The fair value of a security is likely to be different from the quoted or published price, if available.
Investments in other open-end investment companies, including money market funds, are valued at net asset value.
Short-term securities purchased within 60 days to maturity are valued at amortized cost, which approximates market value. The value of short-term securities originally purchased with maturities greater than 60 days is determined based on an amortized value to par upon reaching 60 days to maturity.
18
Columbia Marsico Global Fund, February 29, 2012
Short-term securities maturing in more than 60 days from the valuation date are valued at the market price or approximate market value based on current interest rates.
Forward foreign currency exchange contracts are marked-to-market based upon foreign currency exchange rates provided by a pricing service.
Investments for which market quotations are not readily available, or that have quotations which management believes are not reliable, are valued at fair value as determined in good faith under consistently applied procedures established by and under the general supervision of the Board. If a security or class of securities (such as foreign securities) is valued at fair value, such value is likely to be different from the last quoted market price for the security. The determination of fair value often requires significant judgment. To determine fair value, management may use assumptions including but not limited to future cash flows and estimated risk premiums. Multiple inputs from various sources may be used to determine value.
Foreign Currency Transactions and Translation
The values of all assets and liabilities denominated in foreign currencies are translated into U.S. dollars at that day's exchange rates. Net realized and unrealized gains (losses) on foreign currency transactions and translations include gains (losses) arising from the fluctuation in exchange rates between trade and settlement dates on securities transactions, gains (losses) arising from the disposition of foreign currency and currency gains (losses) between the accrual and payment dates on dividends, interest income and foreign withholding taxes.
For financial statement purposes, the Fund does not distinguish that portion of gains (losses) on investments which is due to changes in foreign exchange rates from that which is due to changes in market prices of the investments. Such fluctuations are included with the net realized and unrealized gains (losses) on investments in the Statement of Operations.
Derivative Instruments
The Fund invests in certain derivative instruments as detailed below to meet its investment objectives. Derivatives are instruments whose values depend on, or are derived from, in whole or in part, the value of one or more other assets, such as securities, currencies, commodities or indices. Derivative instruments may be used to maintain cash reserves while maintaining exposure to certain other assets, to offset anticipated declines in values of investments, to facilitate trading, to reduce transaction costs and to pursue higher investment returns. The Fund may also use derivative instruments to mitigate certain investment risks, such as foreign currency exchange rate risk, interest rate risk and credit risk. Derivatives may involve various risks, including the potential inability of the counterparty to fulfill its obligation under the terms of the contract, the potential for an illiquid secondary market and the potential for market movements which may expose the Fund to gains or losses in excess of the amount shown in the Statement of Assets and Liabilities.
The Fund and any counterparty are required to maintain an agreement that requires the Fund and that counterparty to monitor (on a daily basis) the net fair value of all derivatives entered into pursuant to the agreement between the Fund and such counterparty. If the net fair value of such derivatives between the Fund and that counterparty exceeds a certain threshold (as defined in the agreement), the Fund or the counterparty (as the case may be) is required to post cash and/or securities as collateral. Fair values of derivatives presented in the financial statements are not netted with the fair value of other derivatives or with any collateral amounts posted by the Fund or any counterparty.
Forward Foreign Currency Exchange Contracts
Forward foreign currency exchange contracts are agreements between two parties to buy and sell a currency at a set price on a future date. These contracts are intended to be used to minimize the exposure to foreign exchange rate fluctuations during the period between the trade and settlement dates of the contract. The Fund utilized forward foreign currency exchange contracts for the settlement of purchases and sales of securities.
The values of forward foreign currency exchange contracts fluctuate with changes in foreign currency exchange rates. The Fund will record a realized gain or loss when the forward foreign currency exchange contract is closed.
The use of forward foreign currency exchange contracts does not eliminate fluctuations in the prices of the Fund's portfolio securities. The risks of forward foreign currency exchange
19
Columbia Marsico Global Fund, February 29, 2012
contracts include movement in the values of the foreign currencies relative to the U.S. dollar (or other foreign currencies) and the possibility that counterparties will not complete their contractual obligations, which may be in excess of the amount reflected, if any, in the Statement of Assets and Liabilities.
Effects of Derivative Transactions in the Financial Statements
The following tables are intended to provide additional information about the effect of derivatives on the financial statements of the Fund, including: the fair value of derivatives by risk category and the location of those fair values in the Statement of Assets and Liabilities; the impact of derivative transactions on the Fund's operations over the period including realized gains or losses and unrealized gains or losses. The derivative schedules following the Portfolio of Investments present additional information regarding derivative instruments outstanding at the end of the period, if any.
| Fair Values of Derivative Instruments at February 29, 2012 | |
| | | Asset derivatives | | Liability derivatives | |
| Risk Exposure Category | | Statement of Assets
and Liabilities Location | | Fair Value | | Statement of Assets
and Liabilities Location | | Fair Value | |
| Foreign exchange contracts | | Unrealized appreciation on
forward foreign currency
exchange contracts | | $ | 304 | | | Unrealized depreciation on
forward foreign currency
exchange contracts | | $ | 672 | | |
Effect of Derivative Instruments in the Statement of Operations for the Year Ended February 29, 2012
Amount of Realized Gain (Loss) on Derivatives
| Risk Exposure Category | | Forward Foreign
Currency Exchange
Contracts | |
| Foreign exchange contracts | | $ | (6,510 | ) | |
Change in Unrealized Appreciation (Depreciation) on Derivatives Recognized in Income
| Risk Exposure Category | | Forward Foreign
Currency Exchange
Contracts | |
| Foreign exchange contracts | | $ | (368 | ) | |
Volume of Derivative Instruments for the Year Ended February 29, 2012
| | | Contracts
Opened | |
Forward Foreign Currency
Exchange Contracts | | | 102 | | |
Security Transactions
Security transactions are accounted for on the trade date. Cost is determined and gains (losses) are based upon the specific identification method for both financial statement and federal income tax purposes.
Income Recognition
Corporate actions and dividend income are recorded net of any non-reclaimable tax withholdings, on the ex-dividend date or upon receipt of ex-dividend notification in the case of certain foreign securities.
Interest income is recorded on the accrual basis.
20
Columbia Marsico Global Fund, February 29, 2012
Awards from class action litigation are recorded as a reduction of cost basis if the Fund still owns the applicable securities on the payment date. If the Fund no longer owns the applicable securities, the proceeds are recorded as realized gains.
Expenses
General expenses of the Trust are allocated to the Fund and other funds of the Trust based upon relative net assets or other expense allocation methodologies determined by the nature of the expense. Expenses directly attributable to the Fund are charged to the Fund. Expenses directly attributable to a specific class of shares are charged to that share class.
Determination of Class Net Asset Value
All income, expenses (other than class-specific expenses, which are charged to that share class, as shown in the Statement of Operations) and realized and unrealized gains (losses) are allocated to each class of the Fund on a daily basis, based on the relative net assets of each class, for purposes of determining the net asset value of each class.
Federal Income Tax Status
The Fund intends to qualify each year as a regulated investment company under Subchapter M of the Internal Revenue Code, as amended, and will distribute substantially all of its taxable income (including net short-term capital gains), if any, for its tax year, and as such will not be subject to federal income taxes. In addition, the Fund intends to distribute in each calendar year substantially all of its net investment income, capital gains and certain other amounts, if any, such that the Fund should not be subject to federal excise tax. Therefore, no federal income or excise tax provision is recorded.
Foreign Taxes
The Fund may be subject to foreign taxes on income, gains on investments or currency repatriation, a portion of which may be recoverable. The Fund will accrue such taxes and recoveries, as applicable, based upon its current interpretation of tax rules and regulations that exist in the markets in which it invests.
Realized gains in certain countries may be subject to foreign taxes at the Fund level, based on statutory rates. The Fund accrues for such foreign taxes on net realized and unrealized gains at the appropriate rate for each jurisdiction, as applicable.
Distributions to Shareholders
Distributions from net investment income, if any, are declared and paid semi-annually. Net realized capital gains, if any, are distributed along with the income dividend. Income distributions and capital gain distributions are determined in accordance with federal income tax regulations which may differ from GAAP.
Guarantees and Indemnifications
Under the Trust's organizational documents and, in some cases, by contract, its officers and trustees are indemnified against certain liabilities arising out of the performance of their duties to the Trust or its funds. In addition, certain of the Fund's contracts with its service providers contain general indemnification clauses. The Fund's maximum exposure under these arrangements is unknown since the amount of any future claims that may be made against the Fund cannot be determined, and the Fund has no historical basis for predicting the likelihood of any such claims.
Recent Accounting Pronouncement
Fair Value Measurements and Disclosures
In May 2011, the Financial Accounting and Standards Board (FASB) issued ASU No. 2011-04 modifying Topic 820, Fair Value Measurements and Disclosures. At the same time, the International Accounting Standards Board (IASB) issued International Financial Reporting Standard 13, Fair Value Measurement. The objective of the FASB and IASB is convergence of their guidance on fair value measurements and disclosures.
Specifically, ASU No. 2011-04 requires reporting entities to disclose i) the amounts of any transfers between Level 1 and Level 2, and the reasons for the transfers, ii) for Level 3 fair value measurements, a) quantitative information about significant unobservable inputs used, b) a description of the valuation processes used by the reporting entity and c) a narrative description of the sensitivity of the fair value measurement to changes in unobservable inputs if a change in those inputs might result in a significantly higher or lower
21
Columbia Marsico Global Fund, February 29, 2012
fair value measurement. The effective date of ASU No. 2011-04 is for interim and annual periods beginning after December 15, 2011. At this time, management is evaluating the implications of this guidance and the impact it will have on the financial statement amounts and footnote disclosures, if any.
Note 3. Fees and Compensation Paid to Affiliates
Investment Management Fees
Under an Investment Management Services Agreement, Columbia Management Investment Advisers, LLC (the Investment Manager), a wholly-owned subsidiary of Ameriprise Financial, Inc. (Ameriprise Financial), is responsible for the ultimate oversight of investments made by the Fund. The primary responsibility for the day-to-day portfolio management of the Fund is provided by the Fund's subadviser (see Subadvisory Agreement below). The Management fee is an annual fee that is equal to 0.80% of the Fund's average daily net assets.
Subadvisory Agreement
The Investment Manager has entered into a Subadvisory Agreement with Marsico Capital Management, LLC (Marsico) to subadvise the assets of the Fund. The Investment Manager compensates Marsico to manage the investments of the Fund's assets.
Administration Fees
Under an Administrative Services Agreement, the Investment Manager serves as the Fund Administrator. The Fund pays the Fund Administrator an annual fee for administration and accounting services equal to 0.22% of the Fund's average daily net assets, less the fees that were payable by the Fund as described under the Pricing and Bookkeeping Fees note below. In the event the administrator fee paid to the Investment Manager was not sufficient to cover the Pricing and Bookkeeping fees, the Investment Manager paid the additional Pricing and Bookkeeping fees on behalf of the Fund.
Pricing and Bookkeeping Fees
Prior to July 11, 2011, the Fund had entered into a Financial Reporting Services Agreement (the Financial Reporting Services Agreement) with State Street Bank and Trust Company (State Street) and the Investment Manager pursuant to which State Street provided financial reporting services to the Fund. The Fund also entered into an Accounting Services Agreement (collectively with the Financial Reporting Services Agreement, the State Street Agreements) with State Street and the Investment Manager pursuant to which State Street provided accounting services to the Fund. Under the State Street Agreements, the Fund paid State Street an annual fee of $38,000 paid monthly plus an additional monthly fee based on an annualized percentage rate of average daily net assets of the Fund for the month. The aggregate fee did not exceed $140,000 per year (exclusive of out-of-pocket expenses and charges). The Fund also reimbursed State Street for certain out-of-pocket expenses and charges. Effective July 11, 2011, these services are provided under the Administrative Services Agreement discussed above.
Other Fees
Effective June 1, 2011, other expenses are for, among other things, certain expenses of the Fund or the Board, including: Fund boardroom and office expense, employee compensation, employee health and retirement benefits, and certain other expenses. Payment of these Fund and Board expenses is facilitated by a company providing limited administrative services to the Fund and the Board. For the period June 1, 2011 through February 29, 2012, other expenses paid to this company were $1,243.
Compensation of Board Members
Board members are compensated for their services to the Fund as disclosed in the Statement of Operations. Under a Deferred Compensation Plan (the Plan), the Board members who are not "interested persons" of the Fund, as defined under the 1940 Act, may elect to defer payment of up to 100% of their compensation. Deferred amounts are treated as though equivalent dollar amounts had been invested in shares of certain funds managed by the Investment Manager. The Fund's liability for these amounts is adjusted for market value changes and remains in the Fund until distributed in accordance with the Plan.
Compensation of Chief Compliance Officer
The Board has appointed a Chief Compliance Officer to the Fund in accordance with federal securities regulations.
22
Columbia Marsico Global Fund, February 29, 2012
Effective April 1, 2011, the Fund's expenses associated with the Chief Compliance Officer are paid directly by the Investment Manager. Prior to April 1, 2011, the Fund, along with other affiliated funds, paid its pro-rata share of the expenses for the Chief Compliance Officer. Such fees did not exceed $15,000 per year.
Transfer Agent Fees
Under a Transfer and Dividend Disbursing Agent Agreement, Columbia Management Investment Services Corp. (the Transfer Agent), an affiliate of the Investment Manager and a wholly-owned subsidiary of Ameriprise Financial, is responsible for providing transfer agency services to the Fund. The Transfer Agent has contracted with Boston Financial Data Services (BFDS) to serve as sub-transfer agent.
The Transfer Agent receives monthly account-based service fees based on the number of open accounts and is reimbursed by the Fund for the fees and expenses the Transfer Agent pays to financial intermediaries that maintain omnibus accounts with the Fund that is a percentage of the average aggregate value of the Fund's shares maintained in each such omnibus account (other than omnibus accounts for which American Enterprise Investment Services Inc. is the broker of record or accounts where the beneficial shareholder is a customer of Ameriprise Financial Services, Inc., which are paid a per account fee). The Transfer Agent pays the fees of BFDS for services as sub-transfer agent and is not entitled to reimbursement for such fees from the Fund (with the exception of out-of-pocket fees).
The Transfer Agent also receives compensation from fees for various shareholder services and reimbursements for certain out-of-pocket expenses.
For the year ended February 29, 2012, the Fund's effective transfer agent fee rates as a percentage of average daily net assets of each class were as follows:
| Class A | | | 0.09 | % | |
| Class C | | | 0.09 | | |
| Class R | | | 0.09 | | |
| Class Z | | | 0.09 | | |
An annual minimum account balance fee of $20 may apply to certain accounts with a value below the Fund's initial minimum investment requirements to reduce the impact of small accounts on transfer agent fees. These minimum account balance fees are recorded as part of expense reductions in the Statement of Operations. For the year ended February 29, 2012, no minimum account balance fees were charged by the Fund.
Distribution and Service Fees
The Fund has an agreement with Columbia Management Investment Distributors, Inc. (the Distributor), an affiliate of the Investment Manager and a wholly-owned subsidiary of Ameriprise Financial, for distribution and shareholder services. Pursuant to Rule 12b-1 under the 1940 Act, the Board has approved, and the Fund has adopted, distribution and shareholder service plans (the Plans) which set the distribution and service fees for the Fund. These fees are calculated daily and are intended to compensate the Distributor and/or eligible selling and/or servicing agents for selling shares of the Fund and providing services to investors.
The Plans require the payment of a monthly combined distribution and service fee to the Distributor at the maximum annual rate of 0.25% of the average daily net assets attributable to Class A shares of the Fund. The Plans also required the payment of a monthly service fee at the maximum annual rate of 0.25% of the average daily net assets attributable to Class C shares of the Fund and the payment of a monthly distribution fee at the maximum annual rates of 0.75% and 0.50% of the average daily net assets attributable to Class C and Class R shares of the Fund.
Sales Charges
Sales charges, including front-end charges and CDSCs, received by the Distributor for distributing Fund shares were $36,999 for Class A and $200 for Class C shares for the year ended February 29, 2012.
Expenses Waived/Reimbursed by the Investment Manager and its Affiliates
Effective July 1, 2011, the Investment Manager and certain of its affiliates have contractually agreed to waive fees and/or reimburse expenses (excluding certain fees and expenses described below), through June 30, 2012, unless sooner
23
Columbia Marsico Global Fund, February 29, 2012
terminated at the sole discretion of the Board, so that the Fund's net operating expenses, after giving effect to fees waived/expenses reimbursed and any balance credits and/or overdraft charges from the Fund's custodian, do not exceed the following annual rates as a percentage of the class' average daily net assets:
| Class A | | | 1.60 | % | |
| Class C | | | 2.35 | | |
| Class R | | | 1.85 | | |
| Class Z | | | 1.35 | | |
Under the agreement, the following fees and expenses are excluded from the waiver/reimbursement commitment, and therefore will be paid by the Fund, if applicable: taxes (including foreign transaction taxes), expenses associated with investments in affiliated and non-affiliated pooled investment vehicles (including mutual funds and exchange traded funds), transaction costs and brokerage commissions, costs related to any securities lending program, dividend expenses associated with securities sold short, inverse floater program fees and expenses, transaction charges and interest on borrowed money, interest, extraordinary expenses and any other expenses the exclusion of which is specifically approved by the Board. This agreement may be modified or amended only with approval from all parties.
Prior to July 1, 2011, the Investment Manager voluntarily agreed to reimburse a portion of the Fund's expenses (excluding certain expenses, such as brokerage commissions, interest, taxes and extraordinary expenses, but including custodian charges relating to overdrafts, if any) so that the Fund's ordinary net operating expenses, after giving effect to fees waived/expenses reimbursed and any balance credits and/or overdraft charges from the Fund's custodian, did not exceed the following annual rates as a percentage of the class' average daily net assets:
| Class A | | | 1.60 | % | |
| Class C | | | 2.35 | | |
| Class R | | | 1.85 | | |
| Class Z | | | 1.35 | | |
Prior to May 1, 2011, the Investment Manager was entitled to recover from the Fund any fees waived and/or expenses reimbursed for a three year period following the date of such fee waiver and/or reimbursement under these arrangements if such recovery did not cause the Fund's expenses to exceed the expense limitations in effect at the time of recovery. Effective May 1, 2011, the Investment Manager has eliminated such fee recoupment provisions.
Note 4. Federal Tax Information
The timing and character of income and capital gain distributions are determined in accordance with income tax regulations, which may differ from GAAP because of temporary or permanent book to tax differences.
For the year ended February 29, 2012, these differences are primarily due to differing treatment for net operating loss reclassifications, post-October losses, capital loss carryforward limitations related to ownership changes, capital loss carryforwards, passive foreign investment company (PFIC) holdings, late year ordinary losses, foreign currency transactions and deferral/reversal of wash sales. To the extent these differences are permanent, reclassifications are made among the components of the Fund's net assets in the Statement of Assets and Liabilities. Temporary differences do not require reclassifications. In the Statement of Assets and Liabilities the following reclassifications were made:
| Excess of distributions over | |
| net investment income | | $ | 119,606 | | |
| Accumulated net realized loss | | | (38,734 | ) | |
| Paid-in capital | | | (80,872 | ) | |
Net investment income and net realized gains (losses), as disclosed in the Statement of Operations, and net assets were not affected by this reclassification.
The tax character of distributions paid during the years indicated was as follows:
| Year ended | | February 29,
2012 | | February 28,
2011 | |
| Ordinary income | | $ | 8,900 | | | $ | 35,349 | | |
| Long-term capital gains | | | 86,952 | | | | — | | |
| Tax return of capital | | | 6,943 | | | | — | | |
24
Columbia Marsico Global Fund, February 29, 2012
Short-term capital gain distributions, if any, are considered ordinary income distributions for tax purposes.
At February 29, 2012, the components of distributable earnings on a tax basis were as follows:
| Undistributed ordinary income | | $ | — | | |
| Undistributed long-term capital gains | | | — | | |
| Unrealized appreciation | | | 1,493,213 | | |
At February 29, 2012, the cost of investments for federal income tax purposes was $7,156,327 and the aggregate gross unrealized appreciation and depreciation based on that cost was:
| Unrealized appreciation | | $ | 1,516,443 | | |
| Unrealized depreciation | | $ | (23,230 | ) | |
| Net unrealized appreciation | | $ | 1,493,213 | | |
The following capital loss carryforward, determined at February 29, 2012, may be available to reduce taxable income arising from future net realized gains on investments, if any, to the extent permitted by the Internal Revenue Code:
| Year of Expiration | | Amount | |
| 2018 | | $ | 1,122,487 | | |
| Unlimited short-term | | | 207,373 | | |
| Total | | $ | 1,329,860 | | |
On December 22, 2010, the Regulated Investment Company Modernization Act of 2010 (the Act) was enacted, which changed various technical rules governing the tax treatment of regulated investment companies. The changes are generally effective for taxable years beginning after the date of enactment. Under the Act, the Fund will be permitted to carry forward capital losses incurred in taxable years beginning after the date of enactment for an unlimited period. However, any losses incurred during those future taxable years will be required to be utilized prior to the losses incurred in pre-enactment taxable years, which carry an expiration date. As a result of this ordering rule, pre-enactment capital loss carryforwards may be more likely to expire unused.
Under current tax rules, regulated investment companies can elect to treat certain late-year ordinary losses incurred and post-October capital losses (capital losses realized after October 31) as arising on the first day of the following taxable year. As of February 29, 2012, the Fund will elect to treat late year ordinary losses of $20,057 and post-October capital losses of $101,692 as arising on March 1, 2012.
Management of the Fund has concluded that there are no significant uncertain tax positions that would require recognition in the financial statements. However, management's conclusion may be subject to review and adjustment at a later date based on factors including, but not limited to, new tax laws, regulations, and administrative interpretations (including relevant court decisions). Generally, the Fund's federal tax returns for the prior three fiscal years remain subject to examination by the Internal Revenue Service.
Note 5. Portfolio Information
The cost of purchases and proceeds from sales of securities, excluding short-term obligations, aggregated to $10,001,047 and $9,090,440, respectively, for the year ended February 29, 2012.
Note 6. Lending of Portfolio Securities
Effective July 11, 2011, the Fund has entered into a Master Securities Lending Agreement (the Agreement) with JPMorgan Chase Bank, N.A. (JPMorgan). The Agreement, which replaces the previous securities lending arrangement with State Street, authorizes JPMorgan as lending agent to lend securities to authorized borrowers in order to generate additional income on behalf of the Fund. Pursuant to the Agreement, the securities loaned are secured by cash or U.S. government securities equal to at least 100% of the market value of the loaned securities. Any additional collateral required to maintain those levels due to market fluctuations of the loaned securities is requested to be delivered the following business day. Cash collateral received is invested by the lending agent on behalf of the Fund into authorized investments pursuant to the Agreement. The investments made with the cash collateral are listed in the Portfolio of Investments. The values of such investments and any uninvested cash collateral are disclosed in the Statement of Assets and Liabilities along with the related obligation to
25
Columbia Marsico Global Fund, February 29, 2012
return the collateral upon the return of the securities loaned. For the year ended February 29, 2012, the Fund did not participate in securities lending activity.
Risks of delay in recovery of securities or even loss of rights in the securities may occur should the borrower of the securities fail financially. Risks may also arise to the extent that the value of the securities loaned increases above the value of the collateral received. JPMorgan will indemnify the Fund from losses resulting from a borrower's failure to return a loaned security when due. Such indemnification does not extend to losses associated with declines in the value of cash collateral investments. The Investment Manager is not responsible for any losses incurred by the Fund in connection with the securities lending program. Loans are subject to termination by the Fund or the borrower at any time, and are, therefore, not considered to be illiquid investments.
Pursuant to the Agreement, the Fund receives income for lending its securities either in the form of fees or by earning interest on invested cash collateral, net of negotiated rebates paid to borrowers and fees paid to the lending agent for services provided and any other securities lending expenses. The Fund continues to earn and accrue interest and dividends on the securities loaned.
Prior to July 11, 2011, the Fund participated in a securities lending arrangement with State Street. Each security on loan was collateralized in an amount at least equal to the market value of the securities loaned plus accrued income from the investment of collateral. The income generated by the investment of the collateral, net of any fees remitted to State Street as the lending agent and borrower rebates, was paid to the Fund.
Note 7. Custody Credits
Prior to July 11, 2011, the Fund had an agreement with its custodian bank under which custody fees may have been reduced by balance credits. These credits are recorded as part of expense reductions on the Statement of Operations. The Fund could have invested a portion of the assets utilized in connection with the expense offset arrangement in an income-producing asset if they had not entered into such an agreement. Subsequent to this date, the Fund may invest its daily balance in an affiliated money market fund as detailed below. For the period March 1, 2011 through July 10, 2011, there were no custody credits.
Note 8. Affiliated Money Market Fund
Effective July 11, 2011, the Fund may invest its daily cash balances in Columbia Short-Term Cash Fund, an affiliated money market fund established for the exclusive use by the Fund and other affiliated funds. The income earned by the Fund from such investments is included as "Dividends from affiliates" in the Statement of Operations. As an investing fund, the Fund indirectly bears its proportionate share of the expenses of Columbia Short-Term Cash Fund.
Note 9. Shareholder Concentration
At February 29, 2012, affiliated shareholder accounts owned 55.8% of the outstanding shares of the Fund. Subscription and redemption activity by concentrated accounts may have a significant effect on the operations of the Fund.
Note 10. Line of Credit
The Fund has entered into a revolving credit facility with a syndicate of banks led by JPMorgan Chase Bank, N.A. (the Administrative Agent), whereby the Fund may borrow for the temporary funding of shareholder redemptions or for other temporary or emergency purposes. The credit facility became effective on July 11, 2011, replacing a prior credit facility. The credit facility agreement, as amended, which is a collective agreement between the Fund and certain other funds managed by the Investment Manager, severally and not jointly, permits collective borrowings up to $500 million. Pursuant to a December 13, 2011 amendment to the credit facility agreement, interest is charged to each participating fund based on its borrowings at a rate equal to the higher of (i) the overnight federal funds rate plus 1.00% or (i) the one-month LIBOR rate plus 1.00%. Each borrowing under the credit facility matures no later than 60 days after the date of borrowing. The Fund also pays a commitment fee equal to its pro rata share of the amount of the credit facility at a rate of 0.08% per annum. For the period July 11, 2011 through December 13, 2011, interest was charged to each participating fund based on its borrowings at a rate equal to the sum of the federal funds rate plus (i) 1.25% per annum plus (ii) if one-month LIBOR exceeds the federal funds rate, the amount of such excess. The Fund also paid a commitment fee equal to its pro rata share of the amount of the credit facility at a rate of 0.10% per annum.
26
Columbia Marsico Global Fund, February 29, 2012
Prior to July 11, 2011, the Fund and certain other funds managed by the Investment Manager participated in a committed, unsecured revolving credit facility provided by State Street. For the period June 27, 2011 through July 8, 2011, the collective borrowing amount of the credit facility was $100 million. For the period May 16, 2011 through June 26, 2011, the collective borrowing amount of the credit facility was $150 million. For the period March 28, 2011 through May 15, 2011, the collective borrowing amount of the credit facility was $225 million. Prior to March 28, 2011, the collective borrowing amount of the credit facility was $280 million. Interest was charged to each fund based on its borrowings at a rate equal to the greater of the (i) federal funds rate plus 1.25% per annum or (ii) the overnight LIBOR rate plus 1.25% per annum. The Fund also paid a commitment fee equal to its pro rata share of the amount of the credit facility at a rate of 0.125% per annum.
The Fund had no borrowings during the year ended February 29, 2012.
Note 11. Significant Risks
Foreign Securities Risk
Investing in foreign securities may include certain risks and considerations not typically associated with investing in U.S. securities, such as fluctuating currency values and changing local and regional economic, political and social conditions, which may result in greater market volatility. In addition, certain foreign securities may not be as liquid as U.S. securities. Investing in emerging markets may accentuate these risks.
Investments in emerging market countries are subject to additional risk. The risk of foreign investments is typically increased in less developed countries. These countries are also more likely to experience high levels of inflation, deflation or currency devaluation which could hurt their economies and securities markets.
Note 12. Subsequent Events
Management has evaluated the events and transactions that have occurred through the date the financial statements were issued and noted no items requiring adjustment of the financial statements or additional disclosure.
Note 13. Information Regarding Pending and Settled Legal Proceedings
In June 2004, an action captioned John E. Gallus et al. v. American Express Financial Corp. and American Express Financial Advisors Inc. was filed in the United States District Court for the District of Arizona. The plaintiffs allege that they are investors in several American Express Company mutual funds (currently branded as Columbia) and they purport to bring the action derivatively on behalf of those funds under the Investment Company Act of 1940. The plaintiffs allege that fees allegedly paid to the defendants by the funds for investment advisory and administrative services are excessive. The plaintiffs seek remedies including restitution and rescission of investment advisory and distribution agreements. The plaintiffs voluntarily agreed to transfer this case to the United States District Court for the District of Minnesota (the District Court). In response to defendants' motion to dismiss the complaint, the District Court dismissed one of plaintiffs' four claims and granted plaintiffs limited discovery. Defendants moved for summary judgment in April 2007. Summary judgment was granted in the defendants' favor on July 9, 2007. The plaintiffs filed a notice of appeal with the Eighth Circuit Court of Appeals (the Eighth Circuit) on August 8, 2007. On April 8, 2009, the Eighth Circuit reversed summary judgment and remanded to the District Court for further proceedings. On August 6, 2009, defendants filed a writ of certiorari with the U.S. Supreme Court (the Supreme Court), asking the Supreme Court to stay the District Court proceedings while the Supreme Court considered and rule in a case captioned Jones v. Harris Associates, which involved issues of law similar to those presented in the Gallus case. On March 30, 2010, the Supreme Court issued its ruling in Jones v. Harris Associates, and on April 5, 2010, the Supreme Court vacated the Eighth Circuit's decision in the Gallus case and remanded the case to the Eighth Circuit for further consideration in light of the Supreme Court's decision in Jones v. Harris Associates. On June 4, 2010, the Eighth Circuit remanded the Gallus case to the District Court for further consideration in light of the Supreme Court's decision in Jones v. Harris Associates. On December 9, 2010, the District Court reinstated its July 9, 2007 summary judgment order in favor of the defendants. On January 10, 2011, plaintiffs filed a notice of appeal with the Eighth Circuit. In response to the plaintiffs' opening appellate brief filed on March 18, 2011, the defendants filed a response
27
Columbia Marsico Global Fund, February 29, 2012
brief on May 4, 2011 with the Eighth Circuit. The plaintiffs filed a reply brief on May 26, 2011 and oral arguments took place on November 17, 2011. On March 30, 2012, the Eighth Circuit upheld the grant of summary judgment by the District Court in favor of the defendants.
In December 2005, without admitting or denying the allegations, American Express Financial Corporation (AEFC, which is now known as Ameriprise Financial, Inc. (Ameriprise Financial)) entered into settlement agreements with the Securities and Exchange Commission (SEC) and Minnesota Department of Commerce (MDOC) related to market timing activities. As a result, AEFC was censured and ordered to cease and desist from committing or causing any violations of certain provisions of the Investment Advisers Act of 1940, the Investment Company Act of 1940, and various Minnesota laws. AEFC agreed to pay disgorgement of $10 million and civil money penalties of $7 million. AEFC also agreed to retain an independent distribution consultant to assist in developing a plan for distribution of all disgorgement and civil penalties ordered by the SEC in accordance with various undertakings detailed at www.sec.gov/litigation/admin/ia-2451.pdf. Ameriprise Financial and its affiliates have cooperated with the SEC and the MDOC in these legal proceedings, and have made regular reports to the funds' Boards of Trustees.
Ameriprise Financial and certain of its affiliates have historically been involved in a number of legal, arbitration and regulatory proceedings, including routine litigation, class actions, and governmental actions, concerning matters arising in connection with the conduct of their business activities. Ameriprise Financial believes that the Funds are not currently the subject of, and that neither Ameriprise Financial nor any of its affiliates are the subject of, any pending legal, arbitration or regulatory proceedings that are likely to have a material adverse effect on the Funds or the ability of Ameriprise Financial or its affiliates to perform under their contracts with the Funds. Ameriprise Financial is required to make 10-Q, 10-K and, as necessary, 8-K filings with the Securities and Exchange Commission on legal and regulatory matters that relate to Ameriprise Financial and its affiliates. Copies of these filings may be obtained by accessing the SEC website at www.sec.gov.
There can be no assurance that these matters, or the adverse publicity associated with them, will not result in increased fund redemptions, reduced sale of fund shares or other adverse consequences to the Funds. Further, although we believe proceedings are not likely to have a material adverse effect on the Funds or the ability of Ameriprise Financial or its affiliates to perform under their contracts with the Funds, these proceedings are subject to uncertainties and, as such, we are unable to estimate the possible loss or range of loss that may result. An adverse outcome in one or more of these proceedings could result in adverse judgments, settlements, fines, penalties or other relief that could have a material adverse effect on the consolidated financial condition or results of operations of Ameriprise Financial.
28
Report of Independent Registered Public Accounting Firm
To the Trustees of Columbia Funds Series Trust and the Shareholders of Columbia Marsico Global Fund
In our opinion, the accompanying statement of assets and liabilities, including the investment portfolio, and the related statements of operations and of changes in net assets and the financial highlights present fairly, in all material respects, the financial position of Columbia Marsico Global Fund (the "Fund") (a series of Columbia Funds Series Trust) at February 29, 2012, the results of its operations for the year then ended, the changes in its net assets for each of the two years in the period then ended and the financial highlights for each of the periods indicated, in conformity with accounting principles generally accepted in the United States of America. These financial statements and financial highlights (hereafter referred to as "financial statements") are the responsibility of the Fund's management. Our responsibility is to express an opinion on these financial statements based on our audits. We conducted our audits of these financial statements in accordance with the standards of the Public Company Accounting Oversight Board (United States). Those standards require that we plan and perform the audit to obtain reasonable assurance about whether the financial statements are free of material misstatement. An audit includes examining, on a test basis, evidence supporting the amounts and disclosures in the financial statements, assessing the accounting principles used and significant estimates made by management, and evaluating the overall financial statement presentation. We believe that our audits, which included confirmation of securities at February 29, 2012 by correspondence with the custodian, brokers and transfer agent, provide a reasonable basis for our opinion.
PricewaterhouseCoopers LLP
Minneapolis, Minnesota
April 20, 2012
29
Federal Income Tax Information (Unaudited) – Columbia Marsico Global Fund
26.06% of the ordinary income distributed by the Fund for the fiscal year ended February 29, 2012, qualifies for the corporate dividends received deduction.
For non-corporate shareholders 100.00%, or the maximum amount allowable under the Jobs and Growth Tax Relief Reconciliation Act of 2003, of ordinary income distributed by the Fund for the fiscal year ended February 29, 2012 may represent qualified dividend income.
The Fund will notify shareholders in January 2013 of amounts for use in preparing 2012 income tax returns.
30
Fund Governance
Shareholders elect the Board that oversees the funds' operations. The Board appoints officers who are responsible for day-to-day business decisions based on policies set by the Board. The following table provides basic biographical information about the funds' Board members, including their principal occupations during the past five years, although specific titles for individuals may have varied over the period. Under current Board policy, members may serve until the next Board meeting after he or she reaches the mandatory retirement age established by the Board, or the fifteenth anniversary of the first Board meeting they attended as a member of the Board.
On September 29, 2009, Ameriprise Financial, the parent company of Columbia Management, entered into an agreement with Bank of America, N.A. ("Bank of America") to acquire a portion of the asset management business of Columbia Management Group, LLC and certain of its affiliated companies (the "Transaction"). Following the Transaction, which became effective on May 1, 2010, various alignment activities have occurred with respect to the Fund Family. In connection with the Transaction, Mr. Edward J. Boudreau, Jr., Mr. William P. Carmichael, Mr. William A. Hawkins, Mr. R. Glenn Hilliard, Mr. John J. Nagorniak, Ms. Minor M. Shaw and Dr. Anthony M. Santomero, who were members prior to the Transaction of the Legacy Columbia Nations funds' Board ("Nations Funds"), which includes Columbia Funds Series Trust, Columbia Funds Variable Insurance Trust I and Columbia Funds Master Investment Trust, LLC., began service on the Board for the Legacy RiverSource funds ("RiverSource Funds") effective June 1, 2011, which resulted in an overall increase from twelve Trustees to sixteen for all mutual funds overseen by the Board.
Independent Board Members
| Name, Address, Age | | Position Held
with Funds
and Length
of Service | | Principal Occupation During Past Five Years | | Number of
Funds in the
Fund Family
Overseen by
Board Member | | Other Present or
Past Directorships/
Trusteeships
(Within Past 5 Years) | |
| Kathleen Blatz | | | | | | | | | |
|
901 S. Marquette Ave.
Minneapolis, MN 55402
Age 57 | | Board member since 1/06 for RiverSource Funds and since 6/11 for Nations Funds | | Attorney; Chief Justice, Minnesota Supreme Court, 1998-2006 | | | 153 | | | None | |
|
| Edward J. Boudreau, Jr. | | | | | | | | | |
|
225 Franklin Street
Mail Drop
BX32 05228
Boston, MA 02110
Age 67 | | Board member since 6/11 for RiverSource Funds and since 1/05 for Nations Funds | | Managing Director, E.J. Boudreau & Associates (consulting) since 2000 | | | 146 | | | Former Trustee, BofA Funds Series Trust (11 funds) | |
|
| Pamela G. Carlton | | | | | | | | | |
|
901 S. Marquette Ave.
Minneapolis, MN 55402
Age 57 | | Board member since 7/07 for RiverSource Funds and since 6/11 for Nations Funds | | President, Springboard-Partners in Cross Cultural Leadership (consulting company) | | | 153 | | | None | |
|
31
Fund Governance (continued)
Independent Board Members (continued)
| Name, Address, Age | | Position Held
with Funds
and Length
of Service | | Principal Occupation During Past Five Years | | Number of
Funds in the
Fund Family
Overseen by
Board Member | | Other Present or
Past Directorships/
Trusteeships
(Within Past 5 Years) | |
| William P. Carmichael | | | | | | | | | |
|
225 Franklin Street
Mail Drop
BX32 05228
Boston, MA 02110
Age 68 | | Board member since 6/11 for RiverSource Funds and since 1999 for Nations Funds | | Retired | | | 146 | | | Director, Cobra Electronics Corporation (electronic equipment manufacturer); The Finish Line (athletic shoes and apparel); McMoRan Exploration Company (oil and gas exploration and development); former Trustee, BofA Funds Series Trust (11 funds); former Director, Spectrum Brands, Inc. (consumer products); former Director, Simmons Company (bedding) | |
|
| Patricia M. Flynn | | | | | | | | | |
|
901 S. Marquette Ave.
Minneapolis, MN 55402
Age 61 | | Board member since 11/04 for RiverSource Funds and since 6/11 for Nations Funds | | Trustee Professor of Economics and Management, Bentley University; former Dean, McCallum Graduate School of Business, Bentley University | | | 153 | | | None | |
|
| William A. Hawkins | | | | | | | | | |
|
225 Franklin Street
Mail Drop
BX32 05228
Boston, MA 02110
Age 69 | | Board member since 6/11 for RiverSource Funds and since 1/05 for Nations Funds | | Managing Director, Overton Partners (financial consulting), since August 2010; President and Chief Executive Officer, California General Bank, N.A., January 2008-August 2010 | | | 146 | | | Trustee, BofA Funds Series Trust (11 funds) | |
|
| R. Glenn Hilliard | | | | | | | | | |
|
225 Franklin Street
Mail Drop
BX32 05228
Boston, MA 02110
Age 69 | | Board member since 6/11 for RiverSource Funds and since 1/05 for Nations Funds | | Chairman and Chief Executive Officer, Hilliard Group LLC (investing and consulting), since April 2003; Non-Executive Director & Chairman, CNO Financial Group, Inc. (formerly Conseco, Inc.) (insurance), September 2003-May 2011 | | | 146 | | | Chairman, BofA Fund Series Trust (11 funds); former Director, CNO Financial Group, Inc. (insurance) | |
|
32
Fund Governance (continued)
Independent Board Members (continued)
| Name, Address, Age | | Position Held
with Funds
and Length
of Service | | Principal Occupation During Past Five Years | | Number of
Funds in the
Fund Family
Overseen by
Board Member | | Other Present or
Past Directorships/
Trusteeships
(Within Past 5 Years) | |
| Stephen R. Lewis, Jr. | | | | | | | | | |
|
901 S. Marquette Ave.
Minneapolis, MN 55402
Age 73 | | Chair of the Board for RiverSource Funds since 1/07, Board member for RiverSource Funds since 1/02 and since 6/11 for Nations Funds | | President Emeritus and Professor of Economics Emeritus, Carleton College | | | 153 | | | Director, Valmont Industries, Inc. (manufactures irrigation systems) | |
|
| John F. Maher | | | | | | | | | |
|
901 S. Marquette Ave.
Minneapolis, MN 55402
Age 68 | | Board member since 12/06 for Legacy Seligman funds, since 12/08 for RiverSource Funds and since 6/11 for Nations Funds | | Retired President and Chief Executive Officer and former Director, Great Western Financial Corporation (financial services), 1986-1997 | | | 153 | | | None | |
|
| John J. Nagorniak | | | | | | | | | |
|
225 Franklin Street
Mail Drop
BX32 05228
Boston, MA 02110
Age 67 | | Board member since 6/11 for RiverSource Funds and since 1/08 for Nations Funds | | Retired; President and Director, Foxstone Financial, Inc. (consulting), 2000-2007; Director, Mellon Financial Corporation affiliates (investing), 2000-2007; Chairman, Franklin Portfolio Associates (investing—Mellon affiliate), 1982-2007 | | | 146 | | | Trustee, Research Foundation of CFA Institute; Director, MIT Investment Company; Trustee, MIT 401k Plan; former Trustee, BofA Funds Series Trust (11 funds) | |
|
| Catherine James Paglia | | | | | | | | | |
|
901 S. Marquette Ave.
Minneapolis, MN 55402
Age 59 | | Board member since 11/04 for RiverSource Funds and since 6/11 for Nations Funds | | Director, Enterprise Asset Management, Inc. (private real estate and asset management company) | | | 153 | | | None | |
|
33
Fund Governance (continued)
Independent Board Members (continued)
| Name, Address, Age | | Position Held
with Funds
and Length
of Service | | Principal Occupation During Past Five Years | | Number of
Funds in the
Fund Family
Overseen by
Board Member | | Other Present or
Past Directorships/
Trusteeships
(Within Past 5 Years) | |
| Leroy C. Richie | | | | | | | | | |
|
901 S. Marquette Ave.
Minneapolis, MN 55402
Age 70 | | Board member since 2000 for Legacy Seligman funds, since 11/08 for RiverSource Funds and since 6/11 for Nations Funds | | Counsel, Lewis & Munday, P.C. since 2004; former Vice President and General Counsel, Automotive Legal Affairs, Chrysler Corporation | | | 153 | | | Director, Digital Ally, Inc. (digital imaging); Director, Infinity, Inc. (oil and gas exploration and production); Director, OGE Energy Corp. (energy and energy services) | |
|
| Minor M. Shaw | | | | | | | | | |
|
225 Franklin Street
Mail Drop
BX32 05228
Boston, MA 02110
Age 64 | | Board member since 6/11 for RiverSource Funds and since 2003 for Nations Funds | | President—Micco LLC (private investments) | | | 146 | | | Former Trustee, BofA Funds Series Trust (11 funds); Board Member, Piedmont Natural Gas; Director, Blue Cross Blue Shield of South Carolina | |
|
| Alison Taunton-Rigby | | | | | | | | | |
|
901 S. Marquette Ave.
Minneapolis, MN 55402
Age 67 | | Board member since 11/02 for RiverSource Funds and since 6/11 for Nations Funds | | Chief Executive Officer and Director, RiboNovix, Inc. 2003-2010 (biotechnology); former President, Aquila Biopharmaceuticals | | | 153 | | | Director, Healthways, Inc. (health management programs); Director, ICI Mutual Insurance Company, RRG; Director, Abt Associates (government contractor) | |
|
34
Fund Governance (continued)
Interested Board Member Not Affiliated with Investment Manager*
| Name, Address, Age | | Position Held
with Funds
and Length
of Service | | Principal Occupation During Past Five Years | | Number of
Funds in the
Fund Family
Overseen by
Board Member | | Other Present or
Past Directorships/
Trusteeships
(Within Past 5 Years) | |
| Anthony M. Santomero* | | | | | | | | | |
|
225 Franklin Street
Mail Drop
BX32 05228
Boston, MA 02110
Age 65 | | Board member since 6/11 for RiverSource Funds and since 1/08 for Nations Funds | | Richard K. Mellon Professor Emeritus of Finance, The Wharton School, University of Pennsylvania, since 2002; Senior Advisor, McKinsey & Company (consulting), 2006-2008; President and Chief Executive Officer, Federal Reserve Bank of Philadelphia, 2000-2006 | | | 146 | | | Director, Renaissance Reinsurance Ltd.; Trustee, Penn Mutual Life Insurance Company; Director, Citigroup; Director, Citibank, N.A.; former Trustee, BofA Funds Series Trust (11 funds) | |
|
* Dr. Santomero is not an affiliated person of the Investment Manager or Ameriprise Financial. However, he is currently deemed by the funds to be an "interested person" (as defined in the 1940 Act) of the Funds because he serves as a Director of Citigroup, Inc. and Citibank N.A., companies that may directly or through subsidiaries and affiliates engage from time-to-time in brokerage execution, principal transactions and lending relationships with the funds or accounts advised/managed by the Investment Manager.
Interested Board Member Affiliated with Investment Manager*
| William F. Truscott | | | | | | | | | |
|
53600 Ameriprise Financial Center
Minneapolis, MN 55474
Age 51 | | Board member since 11/01 for RiverSource Funds and since 6/11 for Nations Funds; Senior Vice President since 2002 for RiverSource Funds and 5/10 for Nations Funds | | Chairman of the Board and President, Columbia Management Investment Advisers, LLC since May 2010 and February 2012, respectively (previously President, Chairman of the Board and Chief Investment Officer, 2001-April 2010); Chief Executive Officer, U.S. Asset Management & President, Annuities, Ameriprise Financial, Inc. since May 2010 (previously President—U.S. Asset Management and Chief Investment Officer, 2005-April 2010); Director, President and Chief Executive Officer, Ameriprise Certificate Company since 2006; Director and Chief Executive Officer, Columbia Management Investment Distributors, Inc. since May 2010 and February 2012, respectively (previously Chairman of the Board and Chief Executive Officer, 2006-April 2010); Chairman of the Board and Chief Executive Officer, RiverSource Distributors, Inc. since 2006. | | | 153 | | | None | |
|
* Interested person (as defined under the 1940 Act) by reason of being an officer, director, security holder and/or employee of the Investment Manager or Ameriprise Financial.
The SAI has additional information about the Fund's Board members and is available, without charge, upon request by calling 800.345.6611; contacting your financial intermediary; or visiting columbiamanagement.com.
35
Fund Governance (continued)
Officers
| Name, Year of Birth and Address | | Principal Occupation(s) During the Past Five Years | |
| J. Kevin Connaughton (Born 1964) | |
|
225 Franklin Street
Boston, MA 02110
President (since 2009) | | Senior Vice President and General Manager—Mutual Fund Products, Columbia Management Investment Advisers, LLC since May 2010; President, Columbia Funds, since 2009, and RiverSource Funds, since May 2010 (previously Senior Vice President and Chief Financial Officer, Columbia Funds, from June 2008 to January 2009, Treasurer, Columbia Funds, from October 2003 to May 2008, and senior officer of various other affiliated funds since 2000); Managing Director, Columbia Management Advisors, LLC from December 2004 to April 2010. | |
|
| Michael G. Clarke (Born 1969) | |
|
225 Franklin Street
Boston, MA 02110
Treasurer (since 2011) and Chief Financial Officer (since 2009) | | Vice President, Columbia Management Investment Advisers, LLC since May 2010; Managing Director of Fund Administration, Columbia Management Advisors, LLC, from September 2004 to April 2010; senior officer of Columbia Funds and affiliated funds since 2002. | |
|
| Scott R. Plummer (Born 1959) | |
|
5228 Ameriprise Financial Center
Minneapolis, MN 55474
Senior Vice President and Chief Legal Officer (since 2010) | | Chief Legal Officer and Assistant Secretary, Columbia Management Investment Advisers, LLC since June 2005; Vice President and Lead Chief Counsel—Asset Management, Ameriprise Financial, Inc. since May 2010 (previously Vice President and Chief Counsel—Asset Management, from 2005 to April 2010, Vice President, Chief Counsel and Assistant Secretary, Columbia Management Investment Distributors, Inc. since 2008; Vice President, General Counsel and Secretary, Ameriprise Certificate Company since 2005; Chief Counsel, RiverSource Distributors, Inc. since 2006; Senior officer of Columbia Funds and affiliated funds, since 2006. | |
|
| Thomas P. McGuire (Born 1972) | |
|
225 Franklin Street
Boston, MA 02110
Chief Compliance Officer (since 2012) | | Vice President—Asset Management Compliance, Columbia Management Investment Advisers, LLC since March 2010; Chief Compliance Officer, Ameriprise Certificate Company, since September 2010; Compliance Executive, Bank of America, from June 2005 to April 2010. | |
|
| William F. Truscott (Born 1960) | |
|
53600 Ameriprise Financial Center
Minneapolis, MN 55474
Senior Vice President (since 2010) | | Chairman of the Board and President, Columbia Management Investment Advisers, LLC since May 2010 and February 2012, respectively (previously President, Chairman of the Board and Chief Investment Officer, from 2001 to April 2010); Chief Executive Officer, U.S. Asset Management & President, Annuities, Ameriprise Financial, Inc. since May 2010 (previously President—U.S. Asset Management and Chief Investment Officer from 2005 to April 2010); Director, President and Chief Executive Officer, Ameriprise Certificate Company since 2006; Director and Chief Executive Officer, Columbia Management Investment Distributors, Inc. since May 2010 and February 2012, respectively (previously Chairman of the Board and Chief Executive Officer from 2008 to April 2010); Chairman of the Board and Chief Executive Officer, RiverSource Distributors, Inc. since 2006. | |
|
| Paul D. Pearson (Born 1956) | |
|
10468 Ameriprise Financial Center
Minneapolis, MN 55474
Vice President and Assistant Treasurer
(since 2011) | | Vice President—Investment Accounting, Columbia Management Investment Advisers, LLC, since May 2010; Vice President—Managed Assets, Investment Accounting, Ameriprise Financial Corporation, 1998-2010 | |
|
36
Fund Governance (continued)
Officers (continued)
| Name, Year of Birth and Address | | Principal Occupation(s) During the Past Five Years | |
| Colin Moore (Born 1958) | |
|
225 Franklin Street
Boston, MA 02110
Senior Vice President (since 2010) | | Director and Chief Investment Officer, Columbia Management Investment Advisers, LLC since May 2010; Manager, Managing Director and Chief Investment Officer of Columbia Management Advisors, LLC from 2007 to April 2010; Head of Equities, Columbia Management Advisors, LLC from 2002 to 2007. | |
|
| Christopher O. Petersen (Born 1970) | |
|
5228 Ameriprise Financial Center
Minneapolis, MN 55474
Vice President and Secretary (since 2011) | | Vice President and Chief Counsel, Ameriprise Financial since January 2010 (formerly Vice President and Group Counsel or Counsel from April 2004 to January 2010); Senior officer of Columbia Funds and affiliated funds, since 2007. | |
|
| Amy K. Johnson (Born 1965) | |
|
5228 Ameriprise Financial Center
Minneapolis, MN 55474
Vice President (since 2010) | | Senior Vice President and Chief Operating Officer, Columbia Management Investment Advisers, LLC since May 2010 (previously Chief Administrative Officer, from 2009 until April 2010, Vice President—Asset Management and Trust Company Services, from 2006 to 2009, and Vice President—Operations and Compliance from 2004 to 2006). | |
|
| Joseph F. DiMaria (Born 1968) | |
|
225 Franklin Street
Boston, MA 02110
Vice President (since 2011) and Chief Accounting Officer (since 2008) | | Vice President, Mutual Fund Administration, Columbia Management Investment Advisers, LLC, since May 2010; Director of Fund Administration, Columbia Management Advisors, LLC from January 2006 to April 2010. | |
|
| Paul B. Goucher (Born 1968) | |
|
100 Park Avenue
New York, NY 10017
Vice President and Assistant Secretary (since 2010) | | Vice President and Chief Counsel of Ameriprise Financial since January 2010 (formerly Vice President and Group Counsel from November 2008 to January 2010); Director, Managing Director and General Counsel of J. & W. Seligman & Co. Incorporated (Seligman) from July 2008 to November 2008 and Managing Director and Associate General Counsel of Seligman from January 2005 to July 2008. | |
|
| Michael E. DeFao (Born 1968) | |
|
225 Franklin Street
Boston, MA 02110
Vice President and Assistant Treasurer (since 2011) | | Vice President and Chief Counsel, Ameriprise Financial since May 2010; Associate General Counsel, Bank of America from June 2005 to April 2010. | |
|
| Stephen T. Welsh (Born 1957) | |
|
225 Franklin Street
Boston, MA 02110
Vice President (since 2006) | | President and Director, Columbia Management Investment Services Corp. since May 2010; President and Director, Columbia Management Services, Inc. from July 2004 to April 2010; Managing Director, Columbia Management Distributors, Inc. from August 2007 to April 2010. | |
|
37
This page intentionally left blank.
38
This page intentionally left blank.
39
This page intentionally left blank.
40
Important Information About This Report
The fund mails one shareholder report to each shareholder address. If you would like more than one report, please call shareholder services at 1-800-345-6611 and additional reports will be sent to you. This report has been prepared for shareholders of Columbia Marsico Global Fund.
A description of the policies and procedures that the fund uses to determine how to vote proxies and a copy of the fund's voting records are available (i) at www.columbiamanagement.com, (ii) on the Securities and Exchange Commission's website at www.sec.gov, and (iii) without charge, upon request, by calling 1-800-368-0346. Information regarding how the fund voted proxies relating to portfolio securities during the 12-month period ended June 30 is available from the SEC's website. Information regarding how the fund voted proxies relating to portfolio securities is also available from the fund's website, www.columbiamanagement.com.
The fund files a complete schedule of portfolio holdings with the SEC for the first and third quarters of each fiscal year on Form N-Q. The fund's Form N-Q is available on the SEC's website at www.sec.gov and may be reviewed and copied at the SEC's Public Reference Room in Washington, D.C. Information on the operation of the Public Reference Room may be obtained by calling 1-800-SEC-0330.
Transfer Agent
Columbia Management Investment
Services Corp.
P.O. Box 8081
Boston, MA 02266-8081
1-800-345-6611
Distributor
Columbia Management Investment
Distributors, Inc.
225 Franklin Street
Boston, MA 02110
Investment Manager
Columbia Management Investment Advisers, LLC
225 Franklin Street
Boston, MA 02110
41

Columbia Marsico Global Fund
P. O. Box 8081
Boston, MA 02266-8081
columbiamanagement.com
This information is for use with concurrent or prior delivery of a fund prospectus. Investors should consider the investment objectives, risks, charges and expenses of a mutual fund carefully before investing. For a free prospectus, which contains this and other important information about the funds, visit columbiamanagement.com. Read the prospectus carefully before investing. The Fund is distributed by Columbia Management Investment Distributors, Inc., member FINRA, and managed by Columbia Management Investment Advisers, LLC.
© 2012 Columbia Management Investment Advisers, LLC. All rights reserved.
C-1686 C (4/12)

Columbia Marsico Growth Fund
Annual Report for the Period Ended February 29, 2012
Not FDIC insured • No bank guarantee • May lose value
Table of Contents
| Fund Profile | | | 1 | | |
|
| Performance Information | | | 2 | | |
|
| Understanding Your Expenses | | | 3 | | |
|
| Portfolio Managers' Report | | | 4 | | |
|
| Portfolio of Investments | | | 6 | | |
|
Statement of Assets and
Liabilities | | | 10 | | |
|
| Statement of Operations | | | 12 | | |
|
Statement of Changes in
Net Assets | | | 13 | | |
|
| Financial Highlights | | | 15 | | |
|
| Notes to Financial Statements | | | 22 | | |
|
Report of Independent Registered
Public Accounting Firm | | | 33 | | |
|
| Fund Governance | | | 34 | | |
|
Important Information About
This Report | | | 41 | | |
|
The views expressed in this report reflect the current views of the respective parties. These views are not guarantees of future performance and involve certain risks, uncertainties and assumptions that are difficult to predict, so actual outcomes and results may differ significantly from the views expressed. These views are subject to change at any time based upon economic, market or other conditions and the respective parties disclaim any responsibility to update such views. These views may not be relied on as investment advice and, because investment decisions for a Columbia Fund are based on numerous factors, may not be relied on as an indication of trading intent on behalf of any particular Columbia Fund. References to specific securities should not be construed as a recommendation or investment advice.
President's Message

Dear Shareholders,
Americans were dispirited in the fourth quarter of 2011 by Washington's inability to reach a plan for deficit reduction and Europe's piecemeal attempt to address its own fiscal issues. Yet, there was sufficient good news to encourage risk taking, buoying both stocks and bonds to solid gains.
U.S. economic data surprised on the upside and fears of recession abated. With the bar of expectations set low, investors responded positively to the announcement that the economy had expanded by 1.8% in the third quarter. Consumer confidence improved, even though consumers remain under pressure with no real increase in disposable income and a continued decline in household net worth. Headline inflation—which tracks a broad range of consumer expenditures, including food and energy—declined. Even manufacturing held its ground.
Against this backdrop, the U.S. equity markets logged solid returns. The S&P 500 Index gained 11.82%, moving into positive territory for the year with quarterly advances in all ten sectors. Mid- and small-cap stocks did even better. Value outperformed growth across all market capitalizations. Energy stocks led the market, as the price of oil moved above $100 a barrel in December. Industrials and materials stocks rose, buoyed by improving economic data. The U.S. fixed-income markets logged modest but solid returns. High-yield bonds were the best performers as the economy showed signs of improvement. Emerging market bonds were strong performers, as inflation came under control in key regions. Municipal bonds and Treasuries eked out only modest gains, as investors moved away from quality in favor of riskier assets.
While fourth quarter gains were encouraging, challenges still remain. Columbia Management, however, remains strong and steadfast. Columbia Management is the eighth largest manager of long-term mutual fund assets with $326 billion under management as of December 31, 2011. The past year has been one of considerable change for the organization as we worked diligently to align products, services and resources in the integration of Columbia Management with RiverSource Investments. The strong line-up of talent, resources and capabilities that has resulted is highlighted by the success of our products. As of December 31, 2011, Columbia Management offers 52 funds rated either 4 or 5 stars by Morningstar.*
For more information about these and other funds offered by Columbia Management, including detailed, up-to-date fund performance and portfolio information, please visit us online at columbiamanagement.com. Other information and resources available on our website include:
g timely economic analysis and market commentary
g quarterly fund commentaries
g Columbia Management Investor, a quarterly newsletter for shareholders
Thank you for your continued support of the Columbia Funds. We look forward to serving your investment needs for many years to come.
Best Regards,

J. Kevin Connaughton
President, Columbia Funds
*All ratings are based on Class Z shares as of 12/31/2011. Out of 119 Class Z share Columbia funds rated by Morningstar, 7 funds received a 5-star Overall Rating and 45 funds received a 4-star Overall Rating. The Overall Morningstar Rating for a retail mutual fund is derived from a weighted average of the performance figures associated with its 3-, 5- and 10-year (if applicable) Morningstar Rating metrics. For share classes that do not have a 3-, 5-, or 10-year actual performance history, the fund's independent Morningstar Rating metric is then compared against the retail mutual fund universe breakpoints to determine its hypothetical rating.
For each fund with at least a three-year history, Morningstar calculates a Morningstar RatingTM based on a Morningstar Risk-Adjusted Return measure that accounts for variation in a fund's monthly performance (including the effects of sales charges/loads, and redemption fees), placing more emphasis on downward variations and rewarding consistent performance. The top 10% of funds in each category receive 5 stars, the next 22.5% receive 4 stars, the next 35% receive 3 stars, the next 22.5% receive 2 stars and the bottom 10% receive 1 star. (Each share class is counted as a fraction of one fund within this scale and rated separately, which may cause slight variations in the distribution percentages.)
The Morningstar RatingTM is for Class Z shares only; other classes may have different performance characteristics and may have different ratings. ©2012 Morningstar, Inc. All Rights Reserved. The Morningstar information contained herein: (1) is proprietary to Morningstar and/or its content providers; (2) may not be copied or distributed; and (3) is not warranted to be accurate, complete or timely. Neither Morningstar nor its content providers are responsible for any damages or losses arising from any use of this information.
Investors should consider the investment objectives, risks, charges and expenses of a mutual fund carefully before investing. For a free prospectus, which contains this and other important information about the funds, visit columbiamanagement.com. The prospectus should be read carefully before investing.
Columbia Funds are distributed by Columbia Management Investment Distributors, Inc., member FINRA, and managed by Columbia Management Investment Advisers, LLC.
© 2012 Columbia Management Investment Advisers, LLC. All rights reserved.
Fund Profile – Columbia Marsico Growth Fund
Summary
g For the 12-month period that ended February 29, 2012, the fund's Class A shares returned 5.00% without sales charge.
g The fund's benchmark, the S&P 500 Index, returned 5.12%.1
g Investments in the consumer discretionary, industrials and materials sectors aided performance. Underweight positions in the three strongest sectors in the S&P 500 Index—utilities, consumer staples and health care—detracted from results.
Portfolio Management
Thomas F. Marsico has managed the fund since December 1997 and is Chief Executive Officer of Marsico Capital Management, LLC (Marsico), investment subadviser to the fund. In 2010, A. Douglas Rao and Coralie Witter joined Thomas F. Marsico as co-managers of the fund.
Columbia Management Investment Advisers, LLC (the Investment Manager) retained Marsico to serve as investment subadviser to the Columbia Marsico funds. As an investment subadviser, Marsico makes the investment decisions and manages all or a portion of the fund. Marsico is an investment adviser registered with the Securities and Exchange Commission. Marsico is not affiliated with the Investment Manager.
1The Standard and Poor's (S&P) 500 Index tracks the performance of 500 widely held large-capitalization U.S. stocks.
Indices are not available for investment, are not professionally managed and do not reflect sales charges, fees, brokerage commissions, taxes or other expenses of investing. Securities in the fund may not match those in an index.
Performance data quoted represents past performance and current performance may be lower or higher. Past performance is no guarantee of future results. The investment return and principal value will fluctuate so that shares, when redeemed, may be worth more or less than the original cost. Please visit www.columbiamanagement.com for daily and most recent month-end performance updates.
Summary
1-year return as of 02/29/12
| | +5.00% | |
|
|  | | | Class A shares
(without sales charges) | |
|
| | | | +5.12% | |
|
|  | | | S&P 500 Index | |
|
Morningstar Style BoxTM

The Morningstar Style BoxTM is based on the fund's portfolio holdings. For equity funds, the vertical axis shows the market capitalization of the stocks owned, and the horizontal axis shows investment style (value, blend, or growth). Information shown is based on the most recent data provided by Morningstar.
© 2012 Morningstar, Inc. All rights reserved. The Morningstar information contained herein: (1) is proprietary to Morningstar and/or its content providers; (2) may not be copied or distributed; and (3) is not warranted to be accurate, complete or timely. Neither Morningstar nor its content providers are responsible for any damages or losses arising from any use of this information.
1
Performance Information – Columbia Marsico Growth Fund
Performance data quoted represents past performance and current performance may be lower or higher. Past performance is no guarantee of future results. The investment return and principal value will fluctuate so that shares, when redeemed, may be worth more or less than the original cost. Please visit www.columbiamanagement.com for daily and most recent month-end performance updates.
Performance of a $10,000 investment 03/01/02 – 02/29/12
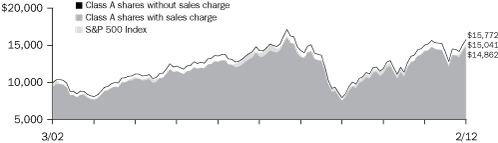
The chart above shows the change in value of a hypothetical $10,000 investment in Class A shares of Columbia Marsico Growth Fund during the stated time period, and does not reflect the deduction of taxes that a shareholder may pay on fund distributions or on the redemption of fund shares.
Performance of a $10,000 investment 03/01/02 – 02/29/12 ($)
| Sales charge | | without | | with | |
| Class A | | | 15,772 | | | | 14,862 | | |
| Class B | | | 14,636 | | | | 14,636 | | |
| Class C | | | 14,640 | | | | 14,640 | | |
| Class I* | | | 15,898 | | | | n/a | | |
| Class R* | | | 15,360 | | | | n/a | | |
| Class W* | | | 15,780 | | | | n/a | | |
| Class Z | | | 16,174 | | | | n/a | | |
Average annual total return as of 02/29/12 (%)
| Share class | | A | | B | | C | | I* | | R* | | W* | | Z | |
| Inception | | 12/31/97 | | 12/31/97 | | 12/31/97 | | 09/27/10 | | 01/23/06 | | 09/27/10 | | 12/31/97 | |
| Sales charge | | without | | with | | without | | with | | without | | with | | without | | without | | without | | without | |
| 1-year | | | 5.00 | | | | –1.02 | | | | 4.25 | | | | –0.75 | | | | 4.19 | | | | 3.19 | | | | 5.66 | | | | 4.78 | | | | 5.00 | | | | 5.29 | | |
| 5-year | | | 2.02 | | | | 0.81 | | | | 1.26 | | | | 0.88 | | | | 1.25 | | | | 1.25 | | | | 2.18 | | | | 1.75 | | | | 2.02 | | | | 2.27 | | |
| 10-year | | | 4.66 | | | | 4.04 | | | | 3.88 | | | | 3.88 | | | | 3.89 | | | | 3.89 | | | | 4.75 | | | | 4.39 | | | | 4.67 | | | | 4.93 | | |
The "with sales charge" returns include the maximum initial sales charge of 5.75% for Class A shares, the applicable contingent deferred sales charge of 5.00% in the first year, declining to 1.00% in the sixth year, and eliminated thereafter for Class B shares and 1.00% for Class C shares for the first year only. The "without sales charge" returns do not include the effect of sales charges. If they had, returns would be lower.
Performance results reflect any fee waivers or reimbursements of fund expenses by Columbia Management Investment Advisers, LLC and/or any of its affiliates. Absent these fee waivers or expense reimbursement arrangements, performance results would have been lower.
All results shown assume reinvestment of distributions. Class I and Class Z shares are sold at net asset value with no distribution and service (Rule 12b-1) fees. Class R shares are sold at net asset value with distribution (Rule 12b-1) fees and Class W shares are sold at net asset value with service (Rule 12b-1) fees. Class I, Class R, Class W and Class Z shares have limited eligibility and the investment minimum requirements may vary. Please see the fund's prospectuses for details. Performance for different share classes will vary based on differences in sales charges and fees associated with each class.
Class R shares were initially offered by the Fund on January 23, 2006.
Class I shares and Class W shares were initially offered by the Fund on September 27, 2010.
The tables do not reflect the deduction of taxes that a shareholder may pay on fund distributions or on the redemption of fund shares.
*The returns shown for periods prior to the share class inception date (including returns since inception, which are since fund inception) include the returns of the fund's Class A shares, the fund's oldest share class. These returns are adjusted to reflect any higher class-related operating expenses of the newer share classes, as applicable. Please visit columbiamanagement.com/mutual-funds/appended-performance for more information.
2
Understanding Your Expenses – Columbia Marsico Growth Fund
As an investor, you incur two types of costs. There are transaction costs, which generally include sales charges on purchases and may include redemption fees. There are also ongoing costs, which generally include management fees, distribution and service (Rule 12b-1) fees, and other fund expenses. The following information is intended to help you understand your ongoing costs (in dollars) of investing in the Fund and to help you compare these costs with the ongoing costs of investing in other mutual funds.
Analyzing your fund's expenses
To illustrate these ongoing costs, we have provided examples and calculated the expenses paid by investors in each share class of the Fund during the period. The actual and hypothetical information in the table is based on an initial investment of $1,000 at the beginning of the period indicated and held for the entire period. Expense information is calculated two ways and each method provides you with different information. The amount listed in the "Actual" column is calculated using the Fund's actual operating expenses and total return for the period. You may use the Actual information, together with the amount invested, to estimate the expenses that you paid over the period. Simply divide your account value by $1,000 (for example, an $8,600 account value divided by $1,000 = 8.6), then multiply the results by the expenses paid during the period under the Actual column. The amount listed in the "Hypothetical" column assumes a 5% annual rate of return before expenses (which is not the Fund's actual return) and then applies the Fund's actual expense ratio for the period to the hypothetical return. You should not use the hypothetical account values and expenses to estimate either your actual account balance at the end of the period or the expenses you paid during the period. See "Compare with other funds" below for details on how to use the hypothetical data.
Compare with other funds
Since all mutual funds are required to include the same hypothetical calculations about expenses in shareholder reports, you can use this information to compare the ongoing cost of investing in the Fund with other funds. To do so, compare the hypothetical example with the 5% hypothetical examples that appear in the shareholder reports of other funds. As you compare hypothetical examples of other funds, it is important to note that hypothetical examples are meant to highlight the ongoing costs of investing in a fund only and do not reflect any transaction costs, such as sales charges, or redemption or exchange fees. Therefore, the hypothetical calculations are useful in comparing ongoing costs only, and will not help you determine the relative total costs of owning different funds. If transaction costs were included in these calculations, your costs would be higher.
September 1, 2011 – February 29, 2012
| | | Account value at the
beginning of the period ($) | | Account value at the
end of the period ($) | | Expenses paid
during the period ($) | | Fund's annualized
expense ratio (%) | |
| | | Actual | | Hypothetical | | Actual | | Hypothetical | | Actual | | Hypothetical | | Actual | |
| Class A | | | 1,000.00 | | | | 1,000.00 | | | | 1,119.80 | | | | 1,018.45 | | | | 6.80 | | | | 6.47 | | | | 1.29 | | |
| Class B | | | 1,000.00 | | | | 1,000.00 | | | | 1,115.90 | | | | 1,014.72 | | | | 10.73 | | | | 10.22 | | | | 2.04 | | |
| Class C | | | 1,000.00 | | | | 1,000.00 | | | | 1,115.70 | | | | 1,014.72 | | | | 10.73 | | | | 10.22 | | | | 2.04 | | |
| Class I | | | 1,000.00 | | | | 1,000.00 | | | | 1,125.00 | | | | 1,020.59 | | | | 4.54 | | | | 4.32 | | | | 0.86 | | |
| Class R | | | 1,000.00 | | | | 1,000.00 | | | | 1,118.80 | | | | 1,017.21 | | | | 8.11 | | | | 7.72 | | | | 1.54 | | |
| Class W | | | 1,000.00 | | | | 1,000.00 | | | | 1,120.30 | | | | 1,018.40 | | | | 6.85 | | | | 6.52 | | | | 1.30 | | |
| Class Z | | | 1,000.00 | | | | 1,000.00 | | | | 1,121.50 | | | | 1,019.69 | | | | 5.49 | | | | 5.22 | | | | 1.04 | | |
Expenses paid during the period are equal to the annualized expense ratio for each class as indicated above, multiplied by the average account value over the period and then multiplied by the number of days in the Fund's most recent fiscal half year and divided by 366.
Expenses do not include fees and expenses incurred indirectly by the Fund from the underlying funds in which the Fund may invest (also referred to as "acquired funds"), including affiliated and non-affiliated pooled investments vehicles (including mutual funds and exchange traded funds).
Had Columbia Management Investment Advisers, LLC and/or certain of its affiliates not waived/reimbursed certain fees and expenses, account value at the end of the period would have been reduced.
3
Portfolio Managers' Report – Columbia Marsico Growth Fund
Performance data quoted represents past performance and current performance may be lower or higher. Past performance is no guarantee of future results. The investment return and principal value will fluctuate so that shares, when redeemed, may be worth more or less than the original cost. Please visit www.columbiamanagement.com for daily and most recent month-end performance updates.
Net asset value per share
as of 02/29/12 ($)
| Class A | | | 22.25 | | |
| Class B | | | 20.13 | | |
| Class C | | | 20.15 | | |
| Class I | | | 22.77 | | |
| Class R | | | 21.94 | | |
| Class W | | | 22.26 | | |
| Class Z | | | 22.71 | | |
For the 12-month period that ended February 29, 2012, the fund's Class A shares returned 5.00% without sales charge. The fund's benchmark, the S&P 500 Index, returned 5.12%. Stock selection and an emphasis on the consumer discretionary sector relative to the index aided performance. Stock selection in the industrials and materials sectors also was strong. The fund had less exposure than the index to the three strongest-performing sectors—utilities, consumer staples and health care—which detracted from performance. Specific stocks in information technology, health care and energy also disappointed.
U.S. economy picks up momentum
During the first half of the 12-month period, a series of natural disasters in Japan, Europe's debt problems and wrangling in Washington over the federal budget and the national debt dominated world headlines. U.S. economic news was lackluster and job growth was disappointing. However, the pace of growth picked up in the second half of the period and, as fears of a lapse back into recession faded, prospects brightened. Consumer confidence improved even though consumers remain under pressure, with no real increase in disposable income and a continued decline in household net worth. The labor markets added more than a million new jobs from September 2011 through February 2012, and the jobless rate fell to 8.3%. A modest slowdown in manufacturing activity late in the summer of 2011 raised concern that this lynchpin of the recovery was ready to turn downward. However, manufacturing activity stabilized and the manufacturing expansion continued into 2012. Housing continues to be the one nagging weak spot in the economy. Yet, home sales edged modestly higher over the year, and there is hope that a bottom in the housing market is in sight.
Consumer discretionary, underweight in financials aid results
As the economy improved, the consumer discretionary sector was a strong performer, and the fund benefited from an overweight in the sector relative to the index. In addition, several individual consumer names were strong performers, including retailer TJX, specialty coffee retailer Starbucks, restaurant operator YUM! Brands and online travel reservations firm priceline.com (4.5%, 3.0%, 1.7% and 3.2% of net assets, respectively). In the industrials and materials sectors, Union Pacific, the largest public railroad in the U.S., Precision Castparts, which manufactures complex metal components for industrial applications, and industrial gas supplier Praxair (2.9%, 2.3% and 2.5% of net assets, respectively) contributed positively to results.
With the regulatory climate for the financial services sector becoming considerably more complex, we significantly reduced the fund's allocation to financials during the period. This decision aided performance as the sector was the weakest performer in the index.
Sector positioning, stock selection disappointed
The fund had few investments in the three strongest-performing sectors of the S&P 500 Index: utilities, consumer staples and health care. This positioning hurt performance. Elsewhere in the portfolio, certain stocks detracted from return. In information technology, Chinese Internet television firm Youku.com (0.6% of net assets), enterprise software provider Oracle and Acme Packet, which sells
4
Portfolio Managers' Report (continued) – Columbia Marsico Growth Fund
telecommunications equipment used for the delivery of real-time audio and video via Internet, all posted double-digit losses. We sold Oracle and Acme Packet from the portfolio. Within health care, Agilent Technologies, a leading provider of test and measurement products, declined sharply and was sold. Energy sector holding Halliburton (2.6% of net assets), which provides oilfield service, had a negative return as well.
Portfolio activity
During the 12-month period, we took a number of steps aimed at reducing the fund's emphasis on economically-sensitive companies. We pared exposure to industrials and materials and pulled back significantly from financial stocks. We increased investments in companies that we believe have durable franchises with dependable revenue streams that we think are capable of compounding their earnings growth even in a choppy economic environment. These companies span a variety of industries but share several common factors, such as an established global footprint, high quality assets, solid top-line unit growth and an ability to gain market share.
Looking ahead
At the end of the period, the portfolio was positioned to balance the uncertainty in Europe against a more constructive scenario in which the euro zone stabilizes and global growth accelerates. Hence, a number of holdings are more defensive in nature, with business models that have proven to be less susceptible to adverse macroeconomic conditions and with the potential to generate solid top-line growth and dependable revenues. Another segment of the portfolio is represented by cyclical companies that should benefit if the euro zone moves closer to a solution and global economic conditions continue to improve. A final segment of the portfolio consists of stocks selected from a purely bottom-up perspective, which we view as unique stories and compelling investments.
Source for all statistical data—Columbia Management Investment Advisers, LLC.
Source for all stock-specific commentary—Marsico Capital Management, LLC.
Portfolio characteristics and holdings are subject to change periodically and may not be representative of current characteristics and holdings. The outlook for the fund may differ from those presented for other Columbia Funds.
The fund normally invests in a core portfolio of 35-50 stocks. By maintaining a relatively concentrated portfolio, the fund may be subject to a greater risk than a fund that is more fully diversified.
International investing may involve certain risks, including currency fluctuations, risks associated with possible differences in financial accounting standards and other monetary and political risks. Significant levels of foreign taxes, including potentially confiscatory levels of taxation and withholding taxes, may also apply to some foreign investments.
Portfolio breakdown1
as of 02/29/12 (%)
| Consumer Discretionary | | | 36.2 | | |
| Consumer Staples | | | 3.5 | | |
| Energy | | | 9.1 | | |
| Financials | | | 5.2 | | |
| Health Care | | | 5.2 | | |
| Industrials | | | 10.6 | | |
| Information Technology | | | 20.5 | | |
| Materials | | | 8.3 | | |
| Other2 | | | 1.4 | | |
1Percentages indicated are based upon total investments (excluding Investments of Cash Collateral Received for Securities on Loan). The Fund's portfolio composition is subject to change.
2Includes investments in affiliated money market fund.
Top 10 holdings1
as of 02/29/12 (%)
| Apple, Inc. | | | 6.2 | | |
| TJX Companies, Inc. | | | 4.6 | | |
| Visa, Inc., Class A | | | 3.7 | | |
| Monsanto Co. | | | 3.6 | | |
| Nike, Inc., Class B | | | 3.5 | | |
| priceline.com, Inc. | | | 3.2 | | |
| McDonald's Corp. | | | 3.0 | | |
| Starbucks Corp. | | | 3.0 | | |
| Baidu, Inc., ADR | | | 2.9 | | |
| Occidental Petroleum Corp. | | | 2.9 | | |
1Percentages indicated are based upon total investments (excluding Investments of Cash Collateral Received for Securities on Loan and affiliated money market fund).
For further detail about these holdings, please refer to the section entitled "Portfolio of Investments."
Fund holdings are as of the date given, are subject to change at any time, and are not recommendations to buy or sell any security.
5
Portfolio of Investments – Columbia Marsico Growth Fund
February 29, 2012
(Percentages represent value of investments compared to net assets)
| Issuer | | Shares | | Value | |
| Common Stocks 98.9% | |
| CONSUMER DISCRETIONARY 36.5% | |
| Distributors 0.9% | |
| Li & Fung Ltd. | | | 12,758,000 | | | $ | 29,092,628 | | |
| Hotels, Restaurants & Leisure 10.4% | |
| McDonald's Corp. | | | 980,280 | | | | 97,322,198 | | |
| Starbucks Corp. | | | 1,959,518 | | | | 95,154,194 | | |
| Wynn Resorts Ltd.(a) | | | 731,155 | | | | 86,671,114 | | |
| Yum! Brands, Inc. | | | 838,115 | | | | 55,516,738 | | |
| Total | | | 334,664,244 | | |
| Internet & Catalog Retail 4.0% | |
| Amazon.com, Inc.(a)(b) | | | 146,305 | | | | 26,289,545 | | |
| priceline.com, Inc.(b) | | | 162,328 | | | | 101,782,903 | | |
| Total | | | 128,072,448 | | |
| Media 4.2% | |
| British Sky Broadcasting Group PLC | | | 4,044,222 | | | | 43,107,485 | | |
| Time Warner, Inc. | | | 2,454,710 | | | | 91,339,759 | | |
| Total | | | 134,447,244 | | |
| Multiline Retail 0.4% | |
| Dollar Tree, Inc.(b) | | | 143,558 | | | | 12,706,319 | | |
| Specialty Retail 8.1% | |
| AutoZone, Inc.(b) | | | 40,030 | | | | 14,990,434 | | |
| Home Depot, Inc. (The) | | | 1,138,914 | | | | 54,178,139 | | |
| O'Reilly Automotive, Inc.(b) | | | 520,220 | | | | 44,999,030 | | |
| TJX Companies, Inc. | | | 3,984,234 | | | | 145,862,807 | | |
| Total | | | 260,030,410 | | |
| Textiles, Apparel & Luxury Goods 8.5% | |
| Cie Financiere Richemont SA, ADR | | | 11,394,821 | | | | 69,622,356 | | |
| Coach, Inc. | | | 882,120 | | | | 66,017,861 | | |
| Deckers Outdoor Corp.(a)(b) | | | 248,945 | | | | 18,611,128 | | |
| Lululemon Athletica, Inc.(a)(b) | | | 131,851 | | | | 8,836,654 | | |
| Nike, Inc., Class B | | | 1,031,558 | | | | 111,325,740 | | |
| Total | | | 274,413,739 | | |
| TOTAL CONSUMER DISCRETIONARY | | | 1,173,427,032 | | |
| CONSUMER STAPLES 3.6% | |
| Food Products 2.4% | |
| Mead Johnson Nutrition Co. | | | 963,569 | | | | 74,917,490 | | |
| Personal Products 1.2% | |
| Estee Lauder Companies, Inc. (The), Class A | | | 675,486 | | | | 39,542,950 | | |
| TOTAL CONSUMER STAPLES | | | 114,460,440 | | |
| ENERGY 9.1% | |
| Energy Equipment & Services 4.8% | |
| Halliburton Co. | | | 2,299,414 | | | | 84,135,558 | | |
| National Oilwell Varco, Inc. | | | 868,859 | | | | 71,706,934 | | |
| Total | | | 155,842,492 | | |
| Oil, Gas & Consumable Fuels 4.3% | |
| Anadarko Petroleum Corp. | | | 319,123 | | | | 26,844,627 | | |
| Continental Resources, Inc.(a)(b) | | | 188,926 | | | | 17,131,809 | | |
| Occidental Petroleum Corp. | | | 902,327 | | | | 94,175,869 | | |
| Total | | | 138,152,305 | | |
| TOTAL ENERGY | | | 293,994,797 | | |
| Issuer | | Shares | | Value | |
| Common Stocks (continued) | |
| FINANCIALS 4.7% | |
| Commercial Banks 4.7% | |
| U.S. Bancorp | | | 2,420,374 | | | $ | 71,158,996 | | |
| Wells Fargo & Co. | | | 2,519,981 | | | | 78,850,205 | | |
| Total | | | 150,009,201 | | |
| TOTAL FINANCIALS | | | 150,009,201 | | |
| HEALTH CARE 5.3% | |
| Biotechnology 2.6% | |
| Biogen Idec, Inc.(a)(b) | | | 707,045 | | | | 82,349,531 | | |
| Pharmaceuticals 2.7% | |
| Allergan, Inc.(a) | | | 495,803 | | | | 44,418,991 | | |
| Bristol-Myers Squibb Co. | | | 1,350,380 | | | | 43,441,725 | | |
| Total | | | 87,860,716 | | |
| TOTAL HEALTH CARE | | | 170,210,247 | | |
| INDUSTRIALS 10.7% | |
| Aerospace & Defense 2.2% | |
| Precision Castparts Corp. | | | 435,049 | | | | 72,840,254 | | |
| Electrical Equipment 0.9% | |
| Rockwell Automation, Inc.(a) | | | 359,103 | | | | 28,721,058 | | |
| Industrial Conglomerates 1.9% | |
| Danaher Corp.(a) | | | 1,159,543 | | | | 61,258,657 | | |
| Machinery 2.8% | |
| Cummins, Inc.(a) | | | 468,205 | | | | 56,451,477 | | |
| Eaton Corp. | | | 644,196 | | | | 33,620,589 | | |
| Total | | | 90,072,066 | | |
| Road & Rail 2.9% | |
| Union Pacific Corp. | | | 838,515 | | | | 92,446,279 | | |
| TOTAL INDUSTRIALS | | | 345,338,314 | | |
| INFORMATION TECHNOLOGY 20.7% | |
| Communications Equipment 1.9% | |
| QUALCOMM, Inc. | | | 1,004,007 | | | | 62,429,155 | | |
| Computers & Peripherals 6.2% | |
| Apple, Inc.(b) | | | 366,210 | | | | 198,646,952 | | |
| Internet Software & Services 5.1% | |
| Baidu, Inc., ADR(b) | | | 690,507 | | | | 94,392,307 | | |
| Google, Inc., Class A(b) | | | 81,005 | | | | 50,081,341 | | |
| Youku, Inc., ADR(a)(b) | | | 733,183 | | | | 18,432,221 | | |
| Total | | | 162,905,869 | | |
| IT Services 6.0% | |
| Accenture PLC, Class A | | | 1,243,996 | | | | 74,067,522 | | |
| Visa, Inc., Class A | | | 1,010,132 | | | | 117,549,061 | | |
| Total | | | 191,616,583 | | |
| Software 1.5% | |
| Check Point Software Technologies Ltd.(a)(b) | | | 680,859 | | | | 39,598,759 | | |
| VMware, Inc., Class A(b) | | | 98,384 | | | | 9,729,194 | | |
| Total | | | 49,327,953 | | |
| TOTAL INFORMATION TECHNOLOGY | | | 664,926,512 | | |
The Accompanying Notes to Financial Statements are an integral part of this statement.
6
Columbia Marsico Growth Fund
February 29, 2012
| Issuer | | Shares | | Value | |
| Common Stocks (continued) | |
| MATERIALS 8.3% | |
| Chemicals 8.3% | |
| Dow Chemical Co. (The) | | | 1,170,546 | | | $ | 39,224,997 | | |
| Monsanto Co. | | | 1,497,038 | | | | 115,840,800 | | |
| PPG Industries, Inc. | | | 349,165 | | | | 31,861,306 | | |
| Praxair, Inc.(a) | | | 743,499 | | | | 81,041,391 | | |
| Total | | | 267,968,494 | | |
| TOTAL MATERIALS | | | 267,968,494 | | |
Total Common Stocks
(Cost: $2,246,177,275) | | $ | 3,180,335,037 | | |
| Preferred Stocks 0.6% | |
| FINANCIALS 0.6% | |
| Commercial Banks 0.6% | |
| Wells Fargo & Co., 8.000%(a) | | | 687,425 | | | | 20,107,181 | | |
| TOTAL FINANCIALS | | | 20,107,181 | | |
Total Preferred Stocks
(Cost: $13,207,874) | | $ | 20,107,181 | | |
| | | Shares | | Value | |
| Money Market Funds 1.4% | |
| Columbia Short-Term Cash Fund, 0.166%(c)(d) | | | 43,906,157 | | | | 43,906,157 | | |
Total Money Market Funds
(Cost: $43,906,157) | | $ | 43,906,157 | | |
| Issuer | | Effective
Yield | | Par/
Principal/
Shares | | Value | |
| Investments of Cash Collateral Received for Securities on Loan 2.4% | |
| Asset-Backed Commercial Paper 0.3% | |
Antalis US Funding Corp.
03/01/12 | | | 0.350 | % | | $ | 4,999,660 | | | | 4,999,660 | | |
Aspen Funding Corp.
05/11/12 | | | 0.471 | % | | | 4,993,929 | | | | 4,993,929 | | |
| Total | | | 9,993,589 | | |
| Certificates of Deposit 1.0% | |
Australia and New Zealand Bank Group, Ltd.
03/09/12 | | | 0.500 | % | | | 5,000,000 | | | | 5,000,000 | | |
DZ Bank AG
03/12/12 | | | 0.250 | % | | | 5,000,000 | | | | 5,000,000 | | |
| Issuer | | Effective
Yield | | Par/
Principal/
Shares | | Value | |
| Investments of Cash Collateral Received for Securities on Loan (continued) | |
| Certificates of Deposit (cont.) | |
FMS Wertmanagement Anstalt Des Oeffentlichen Rechts
03/09/12 | | | 0.330 | % | | $ | 3,000,000 | | | $ | 3,000,000 | | |
Hong Kong Shanghai Bank Corp., Ltd.
03/12/12 | | | 0.250 | % | | | 5,000,000 | | | | 5,000,000 | | |
National Australia Bank
08/16/12 | | | 0.344 | % | | | 3,000,000 | | | | 3,000,000 | | |
Skandinaviska Enskilda Banken
04/16/12 | | | 0.360 | % | | | 5,000,000 | | | | 5,000,000 | | |
United Overseas Bank Ltd.
03/16/12 | | | 0.250 | % | | | 4,000,000 | | | | 4,000,000 | | |
| Total | | | 30,000,000 | | |
| Commercial Paper 0.4% | |
Development Bank of Singapore Ltd.
08/02/12 | | | 0.551 | % | | | 3,989,367 | | | | 3,989,367 | | |
State Development Bank of NorthRhine-Westphalia
03/13/12 | | | 0.240 | % | | | 3,999,227 | | | | 3,999,227 | | |
Suncorp Metway Ltd.
04/10/12 | | | 0.480 | % | | | 4,995,933 | | | | 4,995,933 | | |
| Total | | | 12,984,527 | | |
| Repurchase Agreements 0.7% | |
Citigroup Global Markets, Inc.
dated 02/29/12, matures 03/01/12,
repurchase price $5,000,018(e)
| | | 0.130 | % | | | 5,000,000 | | | | 5,000,000 | | |
Credit Suisse Securities (USA) LLC
dated 02/29/12, matures 03/01/12,
repurchase price $12,958,010(e)
| | | 0.160 | % | | | 12,957,953 | | | | 12,957,953 | | |
Morgan Stanley
dated 02/29/12, matures 03/01/12,
repurchase price $5,000,025(e)
| | | 0.180 | % | | | 5,000,000 | | | | 5,000,000 | | |
| Total | | | 22,957,953 | | |
Total Investments of Cash Collateral Received for Securities
on Loan
(Cost: $75,936,069) | | $ | 75,936,069 | | |
Total Investments
(Cost: $2,379,227,375) | | | | | | | | | | $ | 3,320,284,444 | | |
| Other Assets & Liabilities, Net | | | | | | | | | | | (104,767,117 | ) | |
| Net Assets | | $ | 3,215,517,327 | | |
| Notes to Portfolio of Investments | |
(a) At February 29, 2012, security was partially or fully on loan.
(b) Non-income producing.
(c) The rate shown is the seven-day current annualized yield at February 29, 2012.
(d) Investments in affiliates during the year ended February 29, 2012:
| Issuer | | Beginning
Cost | | Purchase
Cost | | Sales Cost/
Proceeds
from Sales | | Realized
Gain/Loss | | Ending
Cost | | Dividends
or Interest
Income | | Value | |
Columbia Short-Term
Cash Fund | | $ | — | | | $ | 1,023,895,839 | | | $ | (979,989,682 | ) | | $ | — | | | $ | 43,906,157 | | | $ | 92,823 | | | $ | 43,906,157 | | |
The Accompanying Notes to Financial Statements are an integral part of this statement.
7
Columbia Marsico Growth Fund
February 29, 2012
| Notes to Portfolio of Investments (continued) | |
(e) The table below represents securities received as collateral for repurchase agreements. This collateral is deposited with the Fund's custodian and, pursuant to the terms of the repurchase agreement, must have an aggregate market value greater than or equal to the repurchase price plus accrued interest at all times. The value of securities and/or cash held as collateral for repurchase agreements is monitored on a daily basis to ensure the proper level of collateral.
Citigroup Global Markets, Inc. (0.130%)
| Security Description | | Value | |
| Fannie Mae REMICS | | $ | 2,392,734 | | |
| Fannie Mae-Aces | | | 264,929 | | |
| Freddie Mac REMICS | | | 1,919,413 | | |
| Government National Mortgage Association | | | 522,924 | | |
| Total Market Value of Collateral Securities | | $ | 5,100,000 | | |
Credit Suisse Securities (USA) LLC (0.160%)
| Security Description | | Value | |
| Ginnie Mae I Pool | | $ | 9,276,635 | | |
| Ginnie Mae II Pool | | | 3,940,507 | | |
| Total Market Value of Collateral Securities | | $ | 13,217,142 | | |
Morgan Stanley (0.180%)
| Security Description | | Value | |
| Freddie Mac Gold Pool | | $ | 2,725,246 | | |
| Freddie Mac Non Gold Pool | | | 2,374,754 | | |
| Total Market Value of Collateral Securities | | $ | 5,100,000 | | |
| Abbreviation Legend | |
ADR American Depositary Receipt
Generally accepted accounting principles (GAAP) require disclosure regarding the inputs and valuation techniques used to measure fair value and any changes in valuation inputs or techniques. In addition, investments shall be disclosed by major category.
The Fund categorizes its fair value measurements according to a three-level hierarchy that maximizes the use of observable inputs and minimizes the use of unobservable inputs by prioritizing that the most observable input be used when available. Observable inputs are those that market participants would use in pricing an investment based on market data obtained from sources independent of the reporting entity. Unobservable inputs are those that reflect the Fund's assumptions about the information market participants would use in pricing an investment. An investment's level within the fair value hierarchy is based on the lowest level of any input that is deemed significant to the asset or liability's fair value measurement. The input levels are not necessarily an indication of the risk or liquidity associated with investments at that level. For example, certain U.S. government securities are generally high quality and liquid, however, they are reflected as Level 2 because the inputs used to determine fair value may not always be quoted prices in an active market.
Fair value inputs are summarized in the three broad levels listed below:
• Level 1 — Valuations based on quoted prices for investments in active markets that the Fund has the ability to access at the measurement date (including NAV for open-end mutual funds). Valuation adjustments are not applied to Level 1 investments.
• Level 2 — Valuations based on other significant observable inputs (including quoted prices for similar securities, interest rates, prepayment speeds, credit risks, etc.).
• Level 3 — Valuations based on significant unobservable inputs (including the Fund's own assumptions and judgment in determining the fair value of investments).
Inputs that are used in determining fair value of an investment may include price information, credit data, volatility statistics, and other factors. These inputs can be either observable or unobservable. The availability of observable inputs can vary between investments, and is affected by various factors such as the type of investment, and the volume and level of activity for that investment or similar investments in the marketplace. The inputs will be considered by the Investment Manager, along with any other relevant factors in the calculation of an investment's fair value. The Fund uses prices and inputs that are current as of the measurement date, which may include periods of market dislocations. During these periods, the availability of prices and inputs may be reduced for many investments. This condition could cause an investment to be reclassified between the various levels within the hierarchy.
The Accompanying Notes to Financial Statements are an integral part of this statement.
8
Columbia Marsico Growth Fund
February 29, 2012
| Fair Value Measurements (continued) | |
Foreign equity securities actively traded in markets where there is a significant delay in the local close relative to the New York Stock Exchange (NYSE) are classified as Level 2. The values of these securities may include an adjustment to reflect the impact of significant market movements following the close of local trading, as described in Note 2 to the financial statements — Security Valuation.
Investments falling into the Level 3 category are primarily supported by quoted prices from brokers and dealers participating in the market for those investments. However, these may be classified as Level 3 investments due to lack of market transparency and corroboration to support these quoted prices. Additionally, valuation models may be used as the pricing source for any remaining investments classified as Level 3. These models rely on one or more significant unobservable inputs and/or significant assumptions by the Investment Manager. Inputs used in valuations may include, but are not limited to, financial statement analysis, capital account balances, discount rates and estimated cash flows, and comparable company data.
The following table is a summary of the inputs used to value the Fund's investments as of February 29, 2012:
| | | Fair value at February 29, 2012 | |
| Description(a) | | Level 1
Quoted Prices
In Active
Markets For
Identical Assets | | Level 2
Other
Significant
Observable
Inputs(b) | | Level 3
Significant
Unobservable
Inputs | | Total | |
| Equity Securities | |
| Common Stocks | |
| Consumer Discretionary | | $ | 1,101,226,918 | | | $ | 72,200,114 | | | $ | — | | | $ | 1,173,427,032 | | |
| Consumer Staples | | | 114,460,440 | | | | — | | | | — | | | | 114,460,440 | | |
| Energy | | | 293,994,797 | | | | — | | | | — | | | | 293,994,797 | | |
| Financials | | | 150,009,201 | | | | — | | | | — | | | | 150,009,201 | | |
| Health Care | | | 170,210,247 | | | | — | | | | — | | | | 170,210,247 | | |
| Industrials | | | 345,338,314 | | | | — | | | | — | | | | 345,338,314 | | |
| Information Technology | | | 664,926,512 | | | | — | | | | — | | | | 664,926,512 | | |
| Materials | | | 267,968,494 | | | | — | | | | — | | | | 267,968,494 | | |
| Preferred Stocks | |
| Financials | | | 20,107,181 | | | | — | | | | — | | | | 20,107,181 | | |
| Total Equity Securities | | | 3,128,242,104 | | | | 72,200,114 | | | | — | | | | 3,200,442,218 | | |
| Other | |
| Money Market Funds | | | 43,906,157 | | | | — | | | | — | | | | 43,906,157 | | |
| Investments of Cash Collateral Received for Securities on Loan | | | — | | | | 75,936,069 | | | | — | | | | 75,936,069 | | |
| Total Other | | | 43,906,157 | | | | 75,936,069 | | | | — | | | | 119,842,226 | | |
| Total | | $ | 3,172,148,261 | | | $ | 148,136,183 | | | $ | — | | | $ | 3,320,284,444 | | |
The Fund's assets assigned to the Level 2 input category are generally valued using the market approach, in which a security's value is determined through reference to prices and information from market transactions for similar or identical assets. These assets include certain foreign securities for which a third party statistical pricing service may be employed for purposes of fair market valuation. The models utilized by the third party statistical pricing service take into account a security's correlation to available market data including, but not limited to, intraday index, ADR, and ETF movements.
(a) See the Portfolio of Investments for all investment classifications not indicated in the table.
(b) There were no significant transfers between Levels 1 and 2 during the period.
The Accompanying Notes to Financial Statements are an integral part of this statement.
9
Statement of Assets and Liabilities – Columbia Marsico Growth Fund
February 29, 2012
| Assets | |
| Investments, at value* | |
| Unaffiliated issuers (identified cost $2,259,385,149) | | $ | 3,200,442,218 | | |
| Affiliated issuers (identified cost $43,906,157) | | | 43,906,157 | | |
| Investment of cash collateral received for securities on loan | |
| Short-term securities (identified cost $52,978,116) | | | 52,978,116 | | |
| Repurchase agreements (identified cost $22,957,953) | | | 22,957,953 | | |
| Total investments (identified cost $2,379,227,375) | | | 3,320,284,444 | | |
| Receivable for: | |
| Investments sold | | | 15,200,189 | | |
| Capital shares sold | | | 1,728,679 | | |
| Dividends | | | 4,225,099 | | |
| Interest | | | 25,227 | | |
| Prepaid expense | | | 33,266 | | |
| Total assets | | | 3,341,496,904 | | |
| Liabilities | |
| Due upon return of securities on loan | | | 75,936,069 | | |
| Payable for: | |
| Investments purchased | | | 38,005,215 | | |
| Capital shares purchased | | | 11,412,899 | | |
| Investment management fees | | | 57,170 | | |
| Distribution and service fees | | | 15,153 | | |
| Transfer agent fees | | | 137,145 | | |
| Administration fees | | | 19,509 | | |
| Expense reimbursement due to Investment Manager | | | 115,783 | | |
| Other expenses | | | 280,634 | | |
| Total liabilities | | | 125,979,577 | | |
| Net assets applicable to outstanding capital stock | | $ | 3,215,517,327 | | |
The Accompanying Notes to Financial Statements are an integral part of this statement.
10
Statement of Assets and Liabilities (continued) – Columbia Marsico Growth Fund
February 29, 2012
| Represented by | |
| Paid-in capital | | $ | 2,789,898,671 | | |
| Undistributed net investment income | | | 5,079,542 | | |
| Accumulated net realized loss | | | (520,517,955 | ) | |
| Unrealized appreciation (depreciation) on: | |
| Investments | | | 941,057,069 | | |
| Total — representing net assets applicable to outstanding capital stock | | $ | 3,215,517,327 | | |
| *Value of securities on loan | | $ | 84,854,299 | | |
| Net assets applicable to outstanding shares | |
| Class A | | $ | 728,788,063 | | |
| Class B | | $ | 27,040,588 | | |
| Class C | | $ | 330,212,887 | | |
| Class I | | $ | 3,119 | | |
| Class R | | $ | 21,165,937 | | |
| Class W | | $ | 3,094 | | |
| Class Z | | $ | 2,108,303,639 | | |
| Shares outstanding | |
| Class A | | | 32,750,855 | | |
| Class B | | | 1,343,484 | | |
| Class C | | | 16,384,528 | | |
| Class I | | | 137 | | |
| Class R | | | 964,774 | | |
| Class W | | | 139 | | |
| Class Z | | | 92,839,032 | | |
| Net asset value per share | |
| Class A(a) | | $ | 22.25 | | |
| Class B | | $ | 20.13 | | |
| Class C | | $ | 20.15 | | |
| Class I | | $ | 22.77 | | |
| Class R | | $ | 21.94 | | |
| Class W | | $ | 22.26 | | |
| Class Z | | $ | 22.71 | | |
(a) The maximum offering price per share for Class A is $23.61. The offering price is calculated by dividing the net asset value by 1.0 minus the maximum sales charge of 5.75%.
The Accompanying Notes to Financial Statements are an integral part of this statement.
11
Statement of Operations – Columbia Marsico Growth Fund
Year ended February 29, 2012
| Net investment income | |
| Income: | |
| Dividends | | $ | 44,708,298 | | |
| Interest | | | 5,087 | | |
| Dividends from affiliates | | | 92,823 | | |
| Income from securities lending — net | | | 116,064 | | |
| Foreign taxes withheld | | | (276,927 | ) | |
| Total income | | | 44,645,345 | | |
| Expenses: | |
| Investment management fees | | | 21,081,118 | | |
| Distribution fees | |
| Class B | | | 243,598 | | |
| Class C | | | 2,571,587 | | |
| Class R | | | 106,312 | | |
| Service fees | |
| Class B | | | 81,199 | | |
| Class C | | | 856,523 | | |
| Class W | | | 8 | | |
| Distribution and service fees — Class A | | | 2,052,770 | | |
| Transfer agent fees | |
| Class A | | | 1,581,913 | | |
| Class B | | | 63,301 | | |
| Class C | | | 658,740 | | |
| Class R | | | 40,198 | | |
| Class W | | | 5 | | |
| Class Z | | | 3,866,307 | | |
| Administration fees | | | 7,140,171 | | |
| Compensation of board members | | | 62,428 | | |
| Pricing and bookkeeping fees | | | 59,396 | | |
| Custodian fees | | | 87,235 | | |
| Printing and postage fees | | | 219,359 | | |
| Registration fees | | | 146,001 | | |
| Professional fees | | | 89,605 | | |
| Line of credit interest expense | | | 1,667 | | |
| Chief compliance officer expenses | | | 407 | | |
| Other | | | 212,845 | | |
| Total expenses | | | 41,222,693 | | |
| Fees waived or expenses reimbursed by Investment Manager and its affiliates | | | (1,653,534 | ) | |
| Expense reductions | | | (4,231 | ) | |
| Total net expenses | | | 39,564,928 | | |
| Net investment income | | | 5,080,417 | | |
| Realized and unrealized gain (loss) — net | |
| Net realized gain (loss) on: | |
| Investments | | | 285,743,900 | | |
| Foreign currency translations | | | 107,659 | | |
| Forward foreign currency exchange contracts | | | (108,534 | ) | |
| Net realized gain | | | 285,743,025 | | |
| Net change in unrealized appreciation (depreciation) on: | |
| Investments | | | (152,622,301 | ) | |
| Net change in unrealized depreciation | | | (152,622,301 | ) | |
| Net realized and unrealized gain | | | 133,120,724 | | |
| Net increase in net assets resulting from operations | | $ | 138,201,141 | | |
The Accompanying Notes to Financial Statements are an integral part of this statement.
12
Statement of Changes in Net Assets – Columbia Marsico Growth Fund
| | | Year ended
February 29,
2012 | | Year ended
February 28,
2011(a) | |
| Operations | |
| Net investment income | | $ | 5,080,417 | | | $ | 481,433 | | |
| Net realized gain | | | 285,743,025 | | | | 472,052,740 | | |
| Net change in unrealized appreciation (depreciation) | | | (152,622,301 | ) | | | 316,671,986 | | |
| Net increase in net assets resulting from operations | | | 138,201,141 | | | | 789,206,159 | | |
| Distributions to shareholders from: | |
| Net investment income | |
| Class I | | | — | | | | (5 | ) | |
| Class Z | | | — | | | | (1,185,515 | ) | |
| Total distributions to shareholders | | | — | | | | (1,185,520 | ) | |
| Decrease in net assets from share transactions | | | (471,969,904 | ) | | | (946,407,700 | ) | |
| Proceeds from regulatory settlements (Note 6) | | | — | | | | 22,206 | | |
| Total decrease in net assets | | | (333,768,763 | ) | | | (158,364,855 | ) | |
| Net assets at beginning of year | | | 3,549,286,090 | | | | 3,707,650,945 | | |
| Net assets at end of year | | $ | 3,215,517,327 | | | $ | 3,549,286,090 | | |
| Undistributed net investment income | | $ | 5,079,542 | | | $ | — | | |
(a) Class I and Class W shares are for the period from September 27, 2010 (commencement of operations) to February 28, 2011.
The Accompanying Notes to Financial Statements are an integral part of this statement.
13
Statement of Changes in Net Assets (continued) – Columbia Marsico Growth Fund
| | | Year ended February 29,
2012 | | Year ended February 28,
2011(a) | |
| | | Shares | | Dollars ($) | | Shares | | Dollars ($) | |
| Capital stock activity | |
| Class A shares | |
| Subscriptions(b) | | | 5,762,153 | | | | 117,329,302 | | | | 8,317,114 | | | | 152,607,078 | | |
| Redemptions | | | (21,227,889 | ) | | | (438,105,302 | ) | | | (53,801,705 | ) | | | (945,181,516 | ) | |
| Net decrease | | | (15,465,736 | ) | | | (320,776,000 | ) | | | (45,484,591 | ) | | | (792,574,438 | ) | |
| Class B shares | |
| Subscriptions | | | 28,105 | | | | 533,083 | | | | 40,027 | | | | 690,242 | | |
| Redemptions(b) | | | (842,848 | ) | | | (15,772,245 | ) | | | (992,338 | ) | | | (16,524,125 | ) | |
| Net decrease | | | (814,743 | ) | | | (15,239,162 | ) | | | (952,311 | ) | | | (15,833,883 | ) | |
| Class C shares | |
| Subscriptions | | | 745,332 | | | | 14,022,626 | | | | 1,011,381 | | | | 17,351,175 | | |
| Redemptions | | | (4,551,349 | ) | | | (85,153,704 | ) | | | (6,731,226 | ) | | | (112,137,465 | ) | |
| Net decrease | | | (3,806,017 | ) | | | (71,131,078 | ) | | | (5,719,845 | ) | | | (94,786,290 | ) | |
| Class I shares | |
| Subscriptions | | | 748,324 | | | | 14,748,479 | | | | 644,301 | | | | 13,156,499 | | |
| Redemptions | | | (1,268,025 | ) | | | (26,235,246 | ) | | | (124,463 | ) | | | (2,621,750 | ) | |
| Net increase (decrease) | | | (519,701 | ) | | | (11,486,767 | ) | | | 519,838 | | | | 10,534,749 | | |
| Class R shares | |
| Subscriptions | | | 395,608 | | | | 8,029,454 | | | | 376,788 | | | | 7,024,980 | | |
| Redemptions | | | (412,020 | ) | | | (8,328,400 | ) | | | (290,095 | ) | | | (5,277,968 | ) | |
| Net increase (decrease) | | | (16,412 | ) | | | (298,946 | ) | | | 86,693 | | | | 1,747,012 | | |
| Class W shares | |
| Subscriptions | | | — | | | | — | | | | 147 | | | | 2,650 | | |
| Redemptions | | | — | | | | — | | | | (8 | ) | | | (153 | ) | |
| Net increase | | | — | | | | — | | | | 139 | | | | 2,497 | | |
| Class Z shares | |
| Subscriptions | | | 27,905,610 | | | | 591,479,176 | | | | 30,141,519 | | | | 555,508,512 | | |
| Distributions reinvested | | | — | | | | — | | | | 39,761 | | | | 809,020 | | |
| Redemptions | | | (30,752,853 | ) | | | (644,517,127 | ) | | | (32,963,943 | ) | | | (611,814,879 | ) | |
| Net decrease | | | (2,847,243 | ) | | | (53,037,951 | ) | | | (2,782,663 | ) | | | (55,497,347 | ) | |
| Total net decrease | | | (23,469,852 | ) | | | (471,969,904 | ) | | | (54,332,740 | ) | | | (946,407,700 | ) | |
(a) Class I and Class W shares are for the period from September 27, 2010 (commencement of operations) to February 28, 2011.
(b) Includes conversions of Class B shares to Class A shares, if any.
The Accompanying Notes to Financial Statements are an integral part of this statement.
14
Financial Highlights – Columbia Marsico Growth Fund
The following tables are intended to help you understand the Fund's financial performance. Certain information reflects financial results for a single share of a class held for the periods shown. Per share net investment income (loss) amounts are calculated based on average shares outstanding during the period. Total returns assume reinvestment of all dividends and distributions. Total returns do not reflect payment of sales charges, if any, and are not annualized for periods of less than one year.
| | | Year ended
Feb. 29, | | Year ended Feb. 28, | | Year ended
Feb. 29, | | Year ended
March 31, | |
| | | 2012 | | 2011 | | 2010 | | 2009(a)(b) | | 2008(a)(c) | | 2007(a) | |
| Class A | |
| Per share data | |
| Net asset value, beginning of period | | $ | 21.19 | | | $ | 16.75 | | | $ | 11.30 | | | $ | 20.26 | | | $ | 20.22 | | | $ | 19.53 | | |
| Income from investment operations: | |
| Net investment income (loss) | | | 0.02 | | | | (0.01 | ) | | | 0.03 | | | | 0.06 | | | | 0.06 | | | | 0.00 | (d) | |
| Net realized and unrealized gain (loss) | | | 1.04 | | | | 4.45 | | | | 5.50 | | | | (9.01 | ) | | | (0.01 | ) | | | 0.69 | | |
| Total from investment operations | | | 1.06 | | | | 4.44 | | | | 5.53 | | | | (8.95 | ) | | | 0.05 | | | | 0.69 | | |
| Less distributions to shareholders from: | |
| Net investment income | | | — | | | | — | | | | (0.08 | ) | | | (0.01 | ) | | | (0.01 | ) | | | — | | |
| Total distributions to shareholders | | | — | | | | — | | | | (0.08 | ) | | | (0.01 | ) | | | (0.01 | ) | | | — | | |
| Proceeds from regulatory settlement | | | — | | | | 0.00 | (d) | | | 0.00 | (d) | | | — | | | | — | | | | — | | |
| Net asset value, end of period | | $ | 22.25 | | | $ | 21.19 | | | $ | 16.75 | | | $ | 11.30 | | | $ | 20.26 | | | $ | 20.22 | | |
| Total return | | | 5.00 | % | | | 26.51 | % | | | 49.09 | % | | | (44.21 | %) | | | 0.24 | % | | | 3.53 | % | |
| Ratios to average net assets(e) | |
Expenses prior to fees waived or expenses reimbursed
(including interest expense) | | | 1.33 | %(f) | | | 1.30 | %(f) | | | 1.28 | %(f) | | | 1.26 | % | | | 1.21 | %(g) | | | 1.23 | % | |
Net expenses after fees waived or expenses reimbursed
(including interest expense)(h) | | | 1.28 | %(f)(i) | | | 1.30 | %(f)(i) | | | 1.28 | %(f)(i) | | | 1.24 | %(i) | | | 1.20 | %(g)(i) | | | 1.22 | %(i) | |
Expenses prior to fees waived or expenses reimbursed
(excluding interest expense) | | | 1.33 | % | | | 1.30 | % | | | 1.28 | % | | | 1.26 | % | | | 1.21 | %(g) | | | 1.23 | % | |
Net expenses after fees waived or expenses reimbursed
(excluding interest expense)(h) | | | 1.28 | %(i) | | | 1.30 | %(i) | | | 1.28 | %(i) | | | 1.24 | %(i) | | | 1.20 | %(g)(i) | | | 1.22 | %(i) | |
| Net investment income (loss) | | | 0.08 | %(i) | | | (0.05 | %)(i) | | | 0.23 | %(i) | | | 0.36 | %(i) | | | 0.29 | %(g)(i) | | | 0.01 | %(i) | |
| Supplemental data | |
| Net assets, end of period (in thousands) | | $ | 728,788 | | | $ | 1,021,724 | | | $ | 1,569,860 | | | $ | 1,383,438 | | | $ | 3,024,016 | | | $ | 2,864,153 | | |
| Portfolio turnover | | | 65 | % | | | 67 | % | | | 69 | % | | | 21 | %(j) | | | — | | | | — | | |
| Turnover of Columbia Marsico Growth Master Portfolio | | | — | | | | — | | | | — | | | | 54 | % | | | 58 | % | | | 42 | % | |
| Notes to Financial Highlights | |
(a) The per share amounts and percentages reflect income and expenses assuming inclusion of the Fund's proportionate share of the income and expenses of Columbia Marsico Growth Master Portfolio.
(b) Effective November 10, 2008, the Fund converted to a stand-alone fund. Prior to November 10, 2008, the Fund operated in a master-feeder structure.
(c) For the period from April 1, 2007 to February 29, 2008. During the period, the Fund's fiscal year end was changed from March 31 to February 29.
(d) Rounds to less than $0.01.
(e) In addition to the fees and expenses which the Fund bears directly, the Fund indirectly bears a pro rata share of the fees and expenses of the acquired funds in which it invests. Such indirect expenses are not included in the reported expense ratios.
(f) Includes interest expense which rounds to less than 0.01%.
(g) Annualized.
(h) The Investment Manager and certain of its affiliates agreed to waive/reimburse certain fees and expenses, if applicable.
(i) The benefits derived from expense reductions had an impact of less than 0.01%.
(j) Amount represents results after the Fund's conversion to a stand-alone structure on November 10, 2008.
The Accompanying Notes to Financial Statements are an integral part of this statement.
15
Financial Highlights (continued) – Columbia Marsico Growth Fund
| | | Year ended
Feb. 29, | | Year ended Feb. 28, | | Year ended
Feb. 29, | | Year ended
March 31, | |
| | | 2012 | | 2011 | | 2010 | | 2009(a)(b) | | 2008(a)(c) | | 2007(a) | |
| Class B | |
| Per share data | |
| Net asset value, beginning of period | | $ | 19.31 | | | $ | 15.38 | | | $ | 10.42 | | | $ | 18.83 | | | $ | 18.92 | | | $ | 18.40 | | |
| Income from investment operations: | |
| Net investment loss | | | (0.13 | ) | | | (0.13 | ) | | | (0.07 | ) | | | (0.06 | ) | | | (0.09 | ) | | | (0.13 | ) | |
| Net realized and unrealized gain (loss) | | | 0.95 | | | | 4.06 | | | | 5.07 | | | | (8.35 | ) | | | (0.00 | )(d) | | | 0.65 | | |
| Total from investment operations | | | 0.82 | | | | 3.93 | | | | 5.00 | | | | (8.41 | ) | | | (0.09 | ) | | | 0.52 | | |
| Less distributions to shareholders from: | |
| Net investment income | | | — | | | | — | | | | (0.04 | ) | | | — | | | | — | | | | — | | |
| Total distributions to shareholders | | | — | | | | — | | | | (0.04 | ) | | | — | | | | — | | | | — | | |
| Proceeds from regulatory settlement | | | — | | | | 0.00 | (d) | | | 0.00 | (d) | | | — | | | | — | | | | — | | |
| Net asset value, end of period | | $ | 20.13 | | | $ | 19.31 | | | $ | 15.38 | | | $ | 10.42 | | | $ | 18.83 | | | $ | 18.92 | | |
| Total return | | | 4.25 | % | | | 25.55 | % | | | 48.10 | % | | | (44.66 | %) | | | (0.48 | %) | | | 2.83 | % | |
| Ratios to average net assets(e) | |
Expenses prior to fees waived or expenses reimbursed
(including interest expense) | | | 2.09 | %(f) | | | 2.05 | %(f) | | | 2.03 | %(f) | | | 2.01 | % | | | 1.96 | %(g) | | | 1.98 | % | |
Net expenses after fees waived or expenses reimbursed
(including interest expense)(h) | | | 2.03 | %(f)(i) | | | 2.05 | %(f)(i) | | | 2.03 | %(f)(i) | | | 1.99 | %(i) | | | 1.95 | %(g)(i) | | | 1.97 | %(i) | |
Expenses prior to fees waived or expenses reimbursed
(excluding interest expense) | | | 2.09 | % | | | 2.05 | % | | | 2.03 | % | | | 2.01 | % | | | 1.96 | %(g) | | | 1.98 | % | |
Net expenses after fees waived or expenses reimbursed
(excluding interest expense)(h) | | | 2.03 | %(i) | | | 2.05 | %(i) | | | 2.03 | %(i) | | | 1.99 | %(i) | | | 1.95 | %(g)(i) | | | 1.97 | %(i) | |
| Net investment loss | | | (0.68 | %)(i) | | | (0.78 | %)(i) | | | (0.52 | %)(i) | | | (0.39 | %)(i) | | | (0.46 | %)(g)(i) | | | (0.71 | %)(i) | |
| Supplemental data | |
| Net assets, end of period (in thousands) | | $ | 27,041 | | | $ | 41,675 | | | $ | 47,847 | | | $ | 44,407 | | | $ | 118,307 | | | $ | 156,923 | | |
| Portfolio turnover | | | 65 | % | | | 67 | % | | | 69 | % | | | 21 | %(j) | | | — | | | | — | | |
| Turnover of Columbia Marsico Growth Master Portfolio | | | — | | | | — | | | | — | | | | 54 | % | | | 58 | % | | | 42 | % | |
| Notes to Financial Highlights | |
(a) The per share amounts and percentages reflect income and expenses assuming inclusion of the Fund's proportionate share of the income and expenses of Columbia Marsico Growth Master Portfolio.
(b) Effective November 10, 2008, the Fund converted to a stand-alone fund. Prior to November 10, 2008, the Fund operated in a master-feeder structure.
(c) For the period from April 1, 2007 to February 29, 2008. During the period, the Fund's fiscal year end was changed from March 31 to February 29.
(d) Rounds to less than $0.01.
(e) In addition to the fees and expenses which the Fund bears directly, the Fund indirectly bears a pro rata share of the fees and expenses of the acquired funds in which it invests. Such indirect expenses are not included in the reported expense ratios.
(f) Includes interest expense which rounds to less than 0.01%.
(g) Annualized.
(h) The Investment Manager and certain of its affiliates agreed to waive/reimburse certain fees and expenses, if applicable.
(i) The benefits derived from expense reductions had an impact of less than 0.01%.
(j) Amount represents results after the Fund's conversion to a stand-alone structure on November 10, 2008.
The Accompanying Notes to Financial Statements are an integral part of this statement.
16
Financial Highlights (continued) – Columbia Marsico Growth Fund
| | | Year ended
Feb. 29, | | Year ended Feb. 28, | | Year ended
Feb. 29, | | Year ended
March 31, | |
| | | 2012 | | 2011 | | 2010 | | 2009(a)(b) | | 2008(a)(c) | | 2007(a) | |
| Class C | |
| Per share data | |
| Net asset value, beginning of period | | $ | 19.34 | | | $ | 15.40 | | | $ | 10.44 | | | $ | 18.86 | | | $ | 18.94 | | | $ | 18.43 | | |
| Income from investment operations: | |
| Net investment loss | | | (0.13 | ) | | | (0.13 | ) | | | (0.07 | ) | | | (0.06 | ) | | | (0.08 | ) | | | (0.13 | ) | |
| Net realized and unrealized gain (loss) | | | 0.94 | | | | 4.07 | | | | 5.07 | | | | (8.36 | ) | | | (0.00 | )(d) | | | 0.64 | | |
| Total from investment operations | | | 0.81 | | | | 3.94 | | | | 5.00 | | | | (8.42 | ) | | | (0.08 | ) | | | 0.51 | | |
| Less distributions to shareholders from: | |
| Net investment income | | | — | | | | — | | | | (0.04 | ) | | | — | | | | — | | | | — | | |
| Total distributions to shareholders | | | — | | | | — | | | | (0.04 | ) | | | — | | | | — | | | | — | | |
| Proceeds from regulatory settlement | | | — | | | | 0.00 | (d) | | | 0.00 | (d) | | | — | | | | — | | | | — | | |
| Net asset value, end of period | | $ | 20.15 | | | $ | 19.34 | | | $ | 15.40 | | | $ | 10.44 | | | $ | 18.86 | | | $ | 18.94 | | |
| Total return | | | 4.19 | % | | | 25.58 | % | | | 48.00 | % | | | (44.64 | %) | | | (0.42 | %) | | | 2.77 | % | |
| Ratios to average net assets(e) | |
Expenses prior to fees waived or expenses reimbursed
(including interest expense) | | | 2.09 | %(f) | | | 2.05 | %(f) | | | 2.03 | %(f) | | | 2.01 | % | | | 1.96 | %(g) | | | 1.98 | % | |
Net expenses after fees waived or expenses reimbursed
(including interest expense)(h) | | | 2.03 | %(f)(i) | | | 2.05 | %(f)(i) | | | 2.03 | %(f)(i) | | | 1.99 | %(i) | | | 1.95 | %(g)(i) | | | 1.97 | %(i) | |
Expenses prior to fees waived or expenses reimbursed
(excluding interest expense) | | | 2.09 | % | | | 2.05 | % | | | 2.03 | % | | | 2.01 | % | | | 1.96 | %(g) | | | 1.98 | % | |
Net expenses after fees waived or expenses reimbursed
(excluding interest expense)(h) | | | 2.03 | %(i) | | | 2.05 | %(i) | | | 2.03 | %(i) | | | 1.99 | %(i) | | | 1.95 | %(g)(i) | | | 1.97 | %(i) | |
| Net investment loss | | | (0.67 | %)(i) | | | (0.78 | %)(i) | | | (0.52 | %)(i) | | | (0.39 | %)(i) | | | (0.46 | %)(g)(i) | | | (0.74 | %)(i) | |
| Supplemental data | |
| Net assets, end of period (in thousands) | | $ | 330,213 | | | $ | 390,384 | | | $ | 399,082 | | | $ | 384,025 | | | $ | 891,076 | | | $ | 832,852 | | |
| Portfolio turnover | | | 65 | % | | | 67 | % | | | 69 | % | | | 21 | %(j) | | | — | | | | — | | |
| Turnover of Columbia Marsico Growth Master Portfolio | | | — | | | | — | | | | — | | | | 54 | % | | | 58 | % | | | 42 | % | |
| Notes to Financial Highlights | |
(a) The per share amounts and percentages reflect income and expenses assuming inclusion of the Fund's proportionate share of the income and expenses of Columbia Marsico Growth Master Portfolio.
(b) Effective November 10, 2008, the Fund converted to a stand-alone fund. Prior to November 10, 2008, the Fund operated in a master-feeder structure.
(c) For the period from April 1, 2007 to February 29, 2008. During the period, the Fund's fiscal year end was changed from March 31 to February 29.
(d) Rounds to less than $0.01.
(e) In addition to the fees and expenses which the Fund bears directly, the Fund indirectly bears a pro rata share of the fees and expenses of the acquired funds in which it invests. Such indirect expenses are not included in the reported expense ratios.
(f) Includes interest expense which rounds to less than 0.01%.
(g) Annualized.
(h) The Investment Manager and certain of its affiliates agreed to waive/reimburse certain fees and expenses, if applicable.
(i) The benefits derived from expense reductions had an impact of less than 0.01%.
(j) Amount represents results after the Fund's conversion to a stand-alone structure on November 10, 2008.
The Accompanying Notes to Financial Statements are an integral part of this statement.
17
Financial Highlights (continued) – Columbia Marsico Growth Fund
| | | Year ended
Feb. 29,
2012 | | Year ended
Feb. 28,
2011(a) | |
| Class I | |
| Per share data | |
| Net asset value, beginning of period | | $ | 21.55 | | | $ | 18.29 | | |
| Income from investment operations: | |
| Net investment income | | | 0.13 | | | | 0.01 | | |
| Net realized and unrealized gain | | | 1.09 | | | | 3.29 | | |
| Total from investment operations | | | 1.22 | | | | 3.30 | | |
| Less distributions to shareholders from: | |
| Net investment income | | | — | | | | (0.04 | ) | |
| Total distributions to shareholders | | | — | | | | (0.04 | ) | |
| Net asset value, end of period | | $ | 22.77 | | | $ | 21.55 | | |
| Total return | | | 5.66 | % | | | 18.05 | % | |
| Ratios to average net assets(b) | |
| Expenses prior to fees waived or expenses reimbursed (including interest expense) | | | 0.89 | %(c) | | | 0.88 | %(c)(d) | |
| Net expenses after fees waived or expenses reimbursed (including interest expense)(e) | | | 0.88 | %(c)(f) | | | 0.88 | %(c)(d)(f) | |
| Expenses prior to fees waived or expenses reimbursed (excluding interest expense) | | | 0.89 | % | | | 0.88 | %(d) | |
| Net expenses after fees waived or expenses reimbursed (excluding interest expense)(e) | | | 0.88 | %(f) | | | 0.88 | %(d)(f) | |
| Net investment income | | | 0.64 | %(f) | | | 0.06 | %(d)(f) | |
| Supplemental data | |
| Net assets, end of period (in thousands) | | $ | 3 | | | $ | 11,201 | | |
| Portfolio turnover | | | 65 | % | | | 67 | % | |
| Notes to Financial Highlights | |
(a) For the period from September 27, 2010 (commencement of operations) to February 28, 2011.
(b) In addition to the fees and expenses which the Fund bears directly, the Fund indirectly bears a pro rata share of the fees and expenses of the acquired funds in which it invests. Such indirect expenses are not included in the reported expense ratios.
(c) Includes interest expense which rounds to less than 0.01%.
(d) Annualized.
(e) The Investment Manager and certain of its affiliates agreed to waive/reimburse certain fees and expenses, if applicable.
(f) The benefits derived from expense reductions had an impact of less than 0.01%.
The Accompanying Notes to Financial Statements are an integral part of this statement.
18
Financial Highlights (continued) – Columbia Marsico Growth Fund
| | | Year ended
Feb. 29, | | Year ended Feb. 28, | | Year ended
Feb. 29, | | Year ended
March 31, | |
| | | 2012 | | 2011 | | 2010 | | 2009(a)(b) | | 2008(a)(c) | | 2007(a) | |
| Class R | |
| Per share data | |
| Net asset value, beginning of period | | $ | 20.94 | | | $ | 16.60 | | | $ | 11.20 | | | $ | 20.13 | | | $ | 20.14 | | | $ | 19.49 | | |
| Income from investment operations: | |
| Net investment income (loss) | | | (0.03 | ) | | | (0.05 | ) | | | (0.00 | )(d) | | | 0.02 | | | | 0.01 | | | | (0.08 | ) | |
| Net realized and unrealized gain (loss) | | | 1.03 | | | | 4.39 | | | | 5.45 | | | | (8.95 | ) | | | (0.02 | ) | | | 0.73 | | |
| Total from investment operations | | | 1.00 | | | | 4.34 | | | | 5.45 | | | | (8.93 | ) | | | (0.01 | ) | | | 0.65 | | |
| Less distributions to shareholders from: | |
| Net investment income | | | — | | | | — | | | | (0.05 | ) | | | — | | | | — | | | | — | | |
| Total distributions to shareholders | | | — | | | | — | | | | (0.05 | ) | | | — | | | | — | | | | — | | |
| Proceeds from regulatory settlement | | | — | | | | 0.00 | (d) | | | 0.00 | (d) | | | — | | | | — | | | | — | | |
| Net asset value, end of period | | $ | 21.94 | | | $ | 20.94 | | | $ | 16.60 | | | $ | 11.20 | | | $ | 20.13 | | | $ | 20.14 | | |
| Total return | | | 4.78 | % | | | 26.14 | % | | | 48.79 | % | | | (44.36 | %) | | | (0.05 | %) | | | 3.34 | % | |
| Ratios to average net assets(e) | |
Expenses prior to fees waived or expenses reimbursed
(including interest expense) | | | 1.58 | %(f) | | | 1.55 | %(f) | | | 1.53 | %(f) | | | 1.51 | % | | | 1.46 | %(g) | | | 1.48 | % | |
Net expenses after fees waived or expenses reimbursed
(including interest expense)(h) | | | 1.53 | %(f)(i) | | | 1.55 | %(f)(i) | | | 1.53 | %(f)(i) | | | 1.49 | %(i) | | | 1.45 | %(g)(i) | | | 1.47 | %(i) | |
Expenses prior to fees waived or expenses reimbursed
(excluding interest expense) | | | 1.58 | % | | | 1.55 | % | | | 1.53 | % | | | 1.51 | % | | | 1.46 | %(g) | | | 1.48 | % | |
Net expenses after fees waived or expenses reimbursed
(excluding interest expense)(h) | | | 1.53 | %(i) | | | 1.55 | %(i) | | | 1.53 | %(i) | | | 1.49 | %(i) | | | 1.45 | %(g)(i) | | | 1.47 | %(i) | |
| Net investment income (loss) | | | (0.16 | %)(i) | | | (0.27 | %)(i) | | | (0.02 | %)(i) | | | 0.15 | %(i) | | | 0.06 | %(g)(i) | | | (0.42 | %)(i) | |
| Supplemental data | |
| Net assets, end of period (in thousands) | | $ | 21,166 | | | $ | 20,548 | | | $ | 14,848 | | | $ | 9,941 | | | $ | 11,860 | | | $ | 3,669 | | |
| Portfolio turnover | | | 65 | % | | | 67 | % | | | 69 | % | | | 21 | %(j) | | | — | | | | — | | |
| Turnover of Columbia Marsico Growth Master Portfolio | | | — | | | | — | | | | — | | | | 54 | % | | | 58 | % | | | 42 | % | |
| Notes to Financial Highlights | |
(a) The per share amounts and percentages reflect income and expenses assuming inclusion of the Fund's proportionate share of the income and expenses of Columbia Marsico Growth Master Portfolio.
(b) Effective November 10, 2008, the Fund converted to a stand-alone fund. Prior to November 10, 2008, the Fund operated in a master-feeder structure.
(c) For the period from April 1, 2007 to February 29, 2008. During the period, the Fund's fiscal year end was changed from March 31 to February 29.
(d) Rounds to less than $0.01.
(e) In addition to the fees and expenses which the Fund bears directly, the Fund indirectly bears a pro rata share of the fees and expenses of the acquired funds in which it invests. Such indirect expenses are not included in the reported expense ratios.
(f) Includes interest expense which rounds to less than 0.01%.
(g) Annualized.
(h) The Investment Manager and certain of its affiliates agreed to waive/reimburse certain fees and expenses, if applicable.
(i) The benefits derived from expense reductions had an impact of less than 0.01%.
(j) Amount represents results after the Fund's conversion to a stand-alone structure on November 10, 2008.
The Accompanying Notes to Financial Statements are an integral part of this statement.
19
Financial Highlights (continued) – Columbia Marsico Growth Fund
| | | Year ended
Feb. 29,
2012 | | Year ended
Feb. 28,
2011(a) | |
| Class W | |
| Per share data | |
| Net asset value, beginning of period | | $ | 21.20 | | | $ | 17.98 | | |
| Income from investment operations: | |
| Net investment income | | | 0.02 | | | | 0.01 | | |
| Net realized and unrealized gain | | | 1.04 | | | | 3.21 | | |
| Total from investment operations | | | 1.06 | | | | 3.22 | | |
| Net asset value, end of period | | $ | 22.26 | | | $ | 21.20 | | |
| Total return | | | 5.00 | % | | | 17.91 | % | |
| Ratios to average net assets(b) | |
| Expenses prior to fees waived or expenses reimbursed (including interest expense) | | | 1.29 | %(c) | | | 1.28 | %(c)(d) | |
| Net expenses after fees waived or expenses reimbursed (including interest expense)(e) | | | 1.26 | %(c)(f) | | | 1.28 | %(c)(d)(f) | |
| Expenses prior to fees waived or expenses reimbursed (excluding interest expense) | | | 1.29 | % | | | 1.28 | %(d) | |
| Net expenses after fees waived or expenses reimbursed (excluding interest expense)(e) | | | 1.26 | %(f) | | | 1.28 | %(d)(f) | |
| Net investment income | | | 0.11 | %(f) | | | 0.17 | %(d)(f) | |
| Supplemental data | |
| Net assets, end of period (in thousands) | | $ | 3 | | | $ | 3 | | |
| Portfolio turnover | | | 65 | % | | | 67 | % | |
| Notes to Financial Highlights | |
(a) For the period from September 27, 2010 (commencement of operations) to February 28, 2011.
(b) In addition to the fees and expenses which the Fund bears directly, the Fund indirectly bears a pro rata share of the fees and expenses of the acquired funds in which it invests. Such indirect expenses are not included in the reported expense ratios.
(c) Includes interest expense which rounds to less than 0.01%.
(d) Annualized.
(e) The Investment Manager and certain of its affiliates agreed to waive/reimburse certain fees and expenses, if applicable.
(f) The benefits derived from expense reductions had an impact of less than 0.01%.
The Accompanying Notes to Financial Statements are an integral part of this statement.
20
Financial Highlights (continued) – Columbia Marsico Growth Fund
| | | Year ended
Feb. 29, | | Year ended Feb. 28, | | Year ended
Feb. 29, | | Year ended
March 31, | |
| | | 2012 | | 2011 | | 2010 | | 2009(a)(b) | | 2008(a)(c) | | 2007(a) | |
| Class Z | |
| Per share data | |
| Net asset value, beginning of period | | $ | 21.57 | | | $ | 17.02 | | | $ | 11.47 | | | $ | 20.63 | | | $ | 20.58 | | | $ | 19.82 | | |
| Income from investment operations: | |
| Net investment income | | | 0.07 | | | | 0.04 | | | | 0.07 | | | | 0.11 | | | | 0.11 | | | | 0.05 | | |
| Net realized and unrealized gain (loss) | | | 1.07 | | | | 4.52 | | | | 5.60 | | | | (9.17 | ) | | | (0.01 | ) | | | 0.71 | | |
| Total from investment operations | | | 1.14 | | | | 4.56 | | | | 5.67 | | | | (9.06 | ) | | | 0.10 | | | | 0.76 | | |
| Less distributions to shareholders from: | |
| Net investment income | | | — | | | | (0.01 | ) | | | (0.12 | ) | | | (0.10 | ) | | | (0.05 | ) | | | — | | |
| Total distributions to shareholders | | | — | | | | (0.01 | ) | | | (0.12 | ) | | | (0.10 | ) | | | (0.05 | ) | | | — | | |
| Proceeds from regulatory settlement | | | — | | | | 0.00 | (d) | | | 0.00 | (d) | | | — | | | | — | | | | — | | |
| Net asset value, end of period | | $ | 22.71 | | | $ | 21.57 | | | $ | 17.02 | | | $ | 11.47 | | | $ | 20.63 | | | $ | 20.58 | | |
| Total return | | | 5.29 | % | | | 26.81 | % | | | 49.55 | % | | | (44.09 | %) | | | 0.46 | % | | | 3.83 | % | |
| Ratios to average net assets(e) | |
Expenses prior to fees waived or expenses reimbursed
(including interest expense) | | | 1.08 | %(f) | | | 1.05 | %(f) | | | 1.03 | %(f) | | | 1.01 | % | | | 0.96 | %(g) | | | 0.98 | % | |
Net expenses after fees waived or expenses reimbursed
(including interest expense)(h) | | | 1.03 | %(f)(i) | | | 1.05 | %(f)(i) | | | 1.03 | %(f)(i) | | | 0.99 | %(i) | | | 0.95 | %(g)(i) | | | 0.97 | %(i) | |
Expenses prior to fees waived or expenses reimbursed
(excluding interest expense) | | | 1.08 | % | | | 1.05 | % | | | 1.03 | % | | | 1.01 | % | | | 0.96 | %(g) | | | 0.98 | % | |
Net expenses after fees waived or expenses reimbursed
(excluding interest expense)(h) | | | 1.03 | %(i) | | | 1.05 | %(i) | | | 1.03 | %(i) | | | 0.99 | %(i) | | | 0.95 | %(g)(i) | | | 0.97 | %(i) | |
| Net investment income | | | 0.34 | %(i) | | | 0.24 | %(i) | | | 0.48 | %(i) | | | 0.63 | %(i) | | | 0.54 | %(g)(i) | | | 0.25 | %(i) | |
| Supplemental data | |
| Net assets, end of period (in thousands) | | $ | 2,108,304 | | | $ | 2,063,751 | | | $ | 1,676,013 | | | $ | 1,329,782 | | | $ | 2,335,800 | | | $ | 2,044,397 | | |
| Portfolio turnover | | | 65 | % | | | 67 | % | | | 69 | % | | | 21 | %(j) | | | — | | | | — | | |
| Turnover of Columbia Marsico Growth Master Portfolio | | | — | | | | — | | | | — | | | | 54 | % | | | 58 | % | | | 42 | % | |
| Notes to Financial Highlights | |
(a) The per share amounts and percentages reflect income and expenses assuming inclusion of the Fund's proportionate share of the income and expenses of Columbia Marsico Growth Master Portfolio.
(b) Effective November 10, 2008, the Fund converted to a stand-alone fund. Prior to November 10, 2008, the Fund operated in a master-feeder structure.
(c) For the period from April 1, 2007 to February 29, 2008. During the period, the Fund's fiscal year end was changed from March 31 to February 29.
(d) Rounds to less than $0.01.
(e) In addition to the fees and expenses which the Fund bears directly, the Fund indirectly bears a pro rata share of the fees and expenses of the acquired funds in which it invests. Such indirect expenses are not included in the reported expense ratios.
(f) Includes interest expense which rounds to less than 0.01%.
(g) Annualized.
(h) The Investment Manager and certain of its affiliates agreed to waive/reimburse certain fees and expenses, if applicable.
(i) The benefits derived from expense reductions had an impact of less than 0.01%.
(j) Amount represents results after the Fund's conversion to a stand-alone structure on November 10, 2008.
The Accompanying Notes to Financial Statements are an integral part of this statement.
21
Notes to Financial Statements – Columbia Marsico Growth Fund
February 29, 2012
Note 1. Organization
Columbia Marsico Growth Fund (the Fund), a series of Columbia Funds Series Trust (the Trust), is a diversified fund. The Trust is registered under the Investment Company Act of 1940, as amended (the 1940 Act), as an open-end management investment company organized as a Delaware statutory trust.
Fund Shares
The Trust may issue an unlimited number of shares (without par value). The Fund offers Class A, Class B, Class C, Class I, Class R, Class W and Class Z shares. All share classes have identical voting, dividend and liquidation rights. Each share class has its own expense structure and sales charges, as applicable.
Class A shares are subject to a maximum front-end sales charge of 5.75% based on the initial investment amount. Class A shares purchased without an initial sales charge in accounts aggregating $1 million to $50 million at the time of purchase are subject to a contingent deferred sales charge (CDSC) if the shares are sold within 18 months of purchase, charged as follows: 1.00% CDSC if redeemed within 12 months of purchase, and 0.50% CDSC if redeemed more than 12, but less than 18, months after purchase.
Class B shares may be subject to a maximum CDSC of 5.00% based upon the holding period after purchase. Class B shares will generally convert to Class A shares eight years after purchase. The Fund no longer accepts investments by new or existing investors in the Fund's Class B shares, except in connection with the reinvestment of any dividend and/or capital gain distributions in Class B shares of the Fund and exchanges by existing Class B shareholders of certain other funds within the Columbia Family of Funds.
Class C shares are subject to a 1.00% CDSC on shares redeemed within one year of purchase.
Class I shares are not subject to sales charges and are only available to the Columbia Family of Funds.
Class R shares are not subject to sales charges and are only available to qualifying institutional investors.
Class W shares are not subject to sales charges and are only available to investors purchasing through authorized investment programs managed by investment professionals, including discretionary managed account programs.
Class Z shares are not subject to sales charges, and are only available to certain investors, as described in the Fund's prospectus.
Note 2. Summary of Significant Accounting Policies
Use of Estimates
The preparation of financial statements in accordance with U.S. generally accepted accounting principles (GAAP) requires management to make certain estimates and assumptions that affect the reported amounts of assets and liabilities, the disclosure of contingent assets and liabilities at the date of the financial statements and the reported amounts of revenue and expenses during the reporting period. Actual results could differ from those estimates.
The following is a summary of significant accounting policies consistently followed by the Fund in the preparation of its financial statements.
Security Valuation
All equity securities are valued at the close of business of the New York Stock Exchange (NYSE). Equity securities are valued at the last quoted sales price on the principal exchange or market on which they trade, except for securities traded on the NASDAQ Stock Market, which are valued at the NASDAQ official close price. Unlisted securities or listed securities for which there were no sales during the day are valued at the mean of the latest quoted bid and asked prices on such exchanges or markets.
Foreign securities are valued based on quotations from the principal market in which such securities are normally traded. If any foreign share prices are not readily available as a result of limited share activity the securities are valued at the mean of the latest quoted bid and asked prices on such exchanges or markets. Foreign currency exchange rates are generally determined at 4:00 p.m. Eastern (U.S.) time. However, many securities markets and exchanges outside the U.S. close prior to the close of the NYSE; therefore, the closing prices for securities in such markets or on such exchanges may not fully reflect events that occur after such close but before the close of the NYSE. In those situations, foreign securities will be fair valued pursuant to the policy adopted by the Board of Trustees (the Board), including utilizing a third party pricing
22
Columbia Marsico Growth Fund, February 29, 2012
service to determine these fair values. The third party pricing service takes into account multiple factors, including, but not limited to, movements in the U.S. securities markets, certain depositary receipts, futures contracts and foreign exchange rates that have occurred subsequent to the close of the foreign exchange, to determine a good faith estimate that reasonably reflects the current market conditions as of the close of the NYSE. The fair value of a security is likely to be different from the quoted or published price, if available.
Investments in other open-end investment companies, including money market funds, are valued at net asset value.
Short-term securities purchased within 60 days to maturity are valued at amortized cost, which approximates market value. The value of short-term securities originally purchased with maturities greater than 60 days is determined based on an amortized value to par upon reaching 60 days to maturity. Short-term securities maturing in more than 60 days from the valuation date are valued at the market price or approximate market value based on current interest rates.
Forward foreign currency exchange contracts are marked-to-market based upon foreign currency exchange rates provided by a pricing service.
Investments for which market quotations are not readily available, or that have quotations which management believes are not reliable, are valued at fair value as determined in good faith under consistently applied procedures established by and under the general supervision of the Board. If a security or class of securities (such as foreign securities) is valued at fair value, such value is likely to be different from the last quoted market price for the security. The determination of fair value often requires significant judgment. To determine fair value, management may use assumptions including but not limited to future cash flows and estimated risk premiums. Multiple inputs from various sources may be used to determine value.
Foreign Currency Transactions and Translation
The values of all assets and liabilities denominated in foreign currencies are translated into U.S. dollars at that day's exchange rates. Net realized and unrealized gains (losses) on foreign currency transactions and translations include gains (losses) arising from the fluctuation in exchange rates between trade and settlement dates on securities transactions, gains (losses) arising from the disposition of foreign currency and currency gains (losses) between the accrual and payment dates on dividends, interest income and foreign withholding taxes.
For financial statement purposes, the Fund does not distinguish that portion of gains (losses) on investments which is due to changes in foreign exchange rates from that which is due to changes in market prices of the investments. Such fluctuations are included with the net realized and unrealized gains (losses) on investments in the Statement of Operations.
Derivative Instruments
The Fund invests in certain derivative instruments as detailed below to meet its investment objectives. Derivatives are instruments whose values depend on, or are derived from, in whole or in part, the value of one or more other assets, such as securities, currencies, commodities or indices. Derivative instruments may be used to maintain cash reserves while maintaining exposure to certain other assets, to offset anticipated declines in values of investments, to facilitate trading, to reduce transaction costs and to pursue higher investment returns. The Fund may also use derivative instruments to mitigate certain investment risks, such as foreign currency exchange rate risk, interest rate risk and credit risk. Derivatives may involve various risks, including the potential inability of the counterparty to fulfill its obligation under the terms of the contract, the potential for an illiquid secondary market and the potential for market movements which may expose the Fund to gains or losses in excess of the amount shown in the Statement of Assets and Liabilities.
The Fund and any counterparty are required to maintain an agreement that requires the Fund and that counterparty to monitor (on a daily basis) the net fair value of all derivatives entered into pursuant to the agreement between the Fund and such counterparty. If the net fair value of such derivatives between the Fund and that counterparty exceeds a certain threshold (as defined in the agreement), the Fund or the counterparty (as the case may be) is required to post cash and/or securities as collateral. Fair values of derivatives presented in the financial statements are not netted with the fair value of other derivatives or with any collateral amounts posted by the Fund or any counterparty.
Forward Foreign Currency Exchange Contracts
Forward foreign currency exchange contracts are agreements between two parties to buy and sell a currency at a set price
23
Columbia Marsico Growth Fund, February 29, 2012
on a future date. These contracts are intended to be used to minimize the exposure to foreign exchange rate fluctuations during the period between the trade and settlement dates of the contract. The Fund utilized forward foreign currency exchange contracts for the settlement of purchases and sales of securities.
The values of forward foreign currency exchange contracts fluctuate with changes in foreign currency exchange rates. The Fund will record a realized gain or loss when the forward foreign currency exchange contract is closed.
The use of forward foreign currency exchange contracts does not eliminate fluctuations in the prices of the Fund's portfolio securities. The risks of forward foreign currency exchange contracts include movement in the values of the foreign currencies relative to the U.S. dollar (or other foreign currencies) and the possibility that counterparties will not complete their contractual obligations, which may be in excess of the amount reflected, if any, in the Statement of Assets and Liabilities.
Effects of Derivative Transactions in the Financial Statements
The following tables are intended to provide additional information about the effect of derivatives on the financial statements of the Fund, including: the fair value of derivatives by risk category and the location of those fair values in the Statement of Assets and Liabilities; the impact of derivative transactions on the Fund's operations over the period including realized gains or losses and unrealized gains or losses. The derivative schedules following the Portfolio of Investments present additional information regarding derivative instruments outstanding at the end of the period, if any.
Fair Values of Derivative Instruments at February 29, 2012
At February 29, 2012, the Fund had no outstanding derivatives.
Effect of Derivative Instruments in the Statement of Operations for the Year Ended February 29, 2012
Amount of Realized Gain (Loss) on Derivatives Recognized in Income
| Risk Exposure Category | | Forward Foreign
Currency Exchange
Contracts | |
| Foreign exchange contracts | | $ | (108,534 | ) | |
Change in Unrealized Appreciation (Depreciation) on Derivatives Recognized in Income
| Risk Exposure Category | | Forward Foreign
Currency Exchange
Contracts | |
| Foreign exchange contracts | | $ | — | | |
Volume of Derivative Instruments for the Year Ended February 29, 2012
| | | Contracts
Opened | |
Forward Foreign Currency
Exchange Contracts | | | 16 | | |
Repurchase Agreements
The Fund may engage in repurchase agreement transactions with institutions that management has determined are creditworthy. The Fund, through the custodian, receives delivery of the underlying securities collateralizing a repurchase agreement. Management is responsible for determining that the collateral is at least equal, at all times, to the value of the repurchase obligation including interest. A repurchase agreement transaction involves certain risks in the event of default or insolvency of the counterparty. These risks include possible delays in or restrictions on a Fund's ability to dispose of the underlying securities and a possible decline in the value of the underlying securities during the period while the Fund seeks to assert its rights.
Security Transactions
Security transactions are accounted for on the trade date. Cost is determined and gains (losses) are based upon the specific identification method for both financial statement and federal income tax purposes.
24
Columbia Marsico Growth Fund, February 29, 2012
Income Recognition
Corporate actions and dividend income are recorded net of any non-reclaimable tax withholdings, on the ex-dividend date or upon receipt of ex-dividend notification in the case of certain foreign securities.
Interest income is recorded on the accrual basis.
Awards from class action litigation are recorded as a reduction of cost basis if the Fund still owns the applicable securities on the payment date. If the Fund no longer owns the applicable securities, the proceeds are recorded as realized gains.
Expenses
General expenses of the Trust are allocated to the Fund and other funds of the Trust based upon relative net assets or other expense allocation methodologies determined by the nature of the expense. Expenses directly attributable to the Fund are charged to the Fund. Expenses directly attributable to a specific class of shares are charged to that share class.
Determination of Class Net Asset Value
All income, expenses (other than class-specific expenses, which are charged to that share class, as shown in the Statement of Operations) and realized and unrealized gains (losses) are allocated to each class of the Fund on a daily basis, based on the relative net assets of each class, for purposes of determining the net asset value of each class.
Federal Income Tax Status
The Fund intends to qualify each year as a regulated investment company under Subchapter M of the Internal Revenue Code, as amended, and will distribute substantially all of its taxable income (including net short-term capital gains), if any, for its tax year, and as such will not be subject to federal income taxes. In addition, the Fund intends to distribute in each calendar year substantially all of its net investment income, capital gains and certain other amounts, if any, such that the Fund should not be subject to federal excise tax. Therefore, no federal income or excise tax provision is recorded.
Distributions to Shareholders
Distributions from net investment income, if any, are declared and paid semi-annually. Net realized capital gains, if any, are distributed along with the income dividend. Income distributions and capital gain distributions are determined in accordance with federal income tax regulations which may differ from GAAP.
Guarantees and Indemnifications
Under the Trust's organizational documents and, in some cases, by contract, its officers and trustees are indemnified against certain liabilities arising out of the performance of their duties to the Trust or its funds. In addition, certain of the Fund's contracts with its service providers contain general indemnification clauses. The Fund's maximum exposure under these arrangements is unknown since the amount of any future claims that may be made against the Fund cannot be determined, and the Fund has no historical basis for predicting the likelihood of any such claims.
Recent Accounting Pronouncement
Fair Value Measurements and Disclosures
In May 2011, the Financial Accounting and Standards Board (FASB) issued ASU No. 2011-04 modifying Topic 820, Fair Value Measurements and Disclosures. At the same time, the International Accounting Standards Board (IASB) issued International Financial Reporting Standard 13, Fair Value Measurement. The objective of the FASB and IASB is convergence of their guidance on fair value measurements and disclosures.
Specifically, ASU No. 2011-04 requires reporting entities to disclose i) the amounts of any transfers between Level 1 and Level 2, and the reasons for the transfers, ii) for Level 3 fair value measurements, a) quantitative information about significant unobservable inputs used, b) a description of the valuation processes used by the reporting entity and c) a narrative description of the sensitivity of the fair value measurement to changes in unobservable inputs if a change in those inputs might result in a significantly higher or lower fair value measurement. The effective date of ASU No. 2011-04 is for interim and annual periods beginning after December 15, 2011. At this time, management is evaluating the implications of this guidance and the impact it will have on the financial statement amounts and footnote disclosures, if any.
25
Columbia Marsico Growth Fund, February 29, 2012
Note 3. Fees and Compensation Paid to Affiliates
Investment Management Fees
Under an Investment Management Services Agreement, Columbia Management Investment Advisers, LLC (the Investment Manager), a wholly-owned subsidiary of Ameriprise Financial, Inc. (Ameriprise Financial), is responsible for the ultimate oversight of investments made by of the Fund. The primary responsibility for the day-to-day portfolio management of the Fund is provided by the Fund's subadviser (see Subadvisory Agreement below). The management fee is an annual fee that is equal to a percentage of the Fund's average daily net assets that declines from 0.75% to 0.56% as the Fund's net assets increase. The effective management fee rate for the year ended February 29, 2012 was 0.65% of the Fund's average daily net assets.
To the extent that the Fund is not benefitting from a separate contractual expense limitation arrangement, the Investment Manager has contractually agreed to waive a portion of its management fee through June 30, 2012. In the absence of a separate contractual expense limitation arrangement, the management fee waiver for the Fund would be calculated as follows:
| Fund average daily net assets* | | Management
fee waiver | |
| Assets up to $18 billion | | | 0.00 | % | |
Assets in excess of $18 billion
and up to $21 billion | | | 0.05 | | |
| Assets in excess of $21 billion | | | 0.10 | | |
* For purposes of the calculation, "Assets" are aggregate assets of the Fund and other affiliated funds managed by the Investment Manager and sub-advised by Marsico Capital Management, LLC.
For the year ended February 29, 2012, no management fees were waived for the Fund.
Subadvisory Agreement
The Investment Manager has entered into a Subadvisory Agreement with Marsico Capital Management, LLC (Marsico) to subadvise the assets of the Fund. The Investment Manager compensates Marsico to manage the investments of the Fund's assets.
Administration Fees
Under an Administrative Services Agreement, the Investment Manager serves as the Fund Administrator. The Fund pays the Fund Administrator an annual fee for administration and accounting services equal to 0.22% of the Fund's average daily net assets, less the fees that were payable by the Fund as described under the Pricing and Bookkeeping Fees note below.
Pricing and Bookkeeping Fees
Prior to July 11, 2011, the Fund had entered into a Financial Reporting Services Agreement (the Financial Reporting Services Agreement) with State Street Bank and Trust Company (State Street) and the Investment Manager pursuant to which State Street provided financial reporting services to the Fund. The Fund also entered into an Accounting Services Agreement (collectively with the Financial Reporting Services Agreement, the State Street Agreements) with State Street and the Investment Manager pursuant to which State Street provided accounting services to the Fund. Under the State Street Agreements, the Fund paid State Street an annual fee of $38,000 paid monthly plus an additional monthly fee based on an annualized percentage rate of average daily net assets of the Fund for the month. The aggregate fee did not exceed $140,000 per year (exclusive of out-of-pocket expenses and charges). The Fund also reimbursed State Street for certain out-of-pocket expenses and charges. Effective July 11, 2011, these services are provided under the Administrative Services Agreement discussed above.
Other Fees
Effective June 1, 2011, other expenses are for, among other things, certain expenses of the Fund or the Board, including: Fund boardroom and office expense, employee compensation, employee health and retirement benefits, and certain other expenses. Payment of these Fund and Board expenses is facilitated by a company providing limited administrative services to the Fund and the Board. For the period June 1, 2011 through February 29, 2012, other expenses paid to this company were $10,051.
Compensation of Board Members
Board members are compensated for their services to the Fund as disclosed in the Statement of Operations. Under a Deferred Compensation Plan (the Plan), the Board members who are not "interested persons" of the Fund, as defined
26
Columbia Marsico Growth Fund, February 29, 2012
under the 1940 Act, may elect to defer payment of up to 100% of their compensation. Deferred amounts are treated as though equivalent dollar amounts had been invested in shares of certain funds managed by the Investment Manager. The Fund's liability for these amounts is adjusted for market value changes and remains in the Fund until distributed in accordance with the Plan.
Compensation of Chief Compliance Officer
The Board has appointed a Chief Compliance Officer to the Fund in accordance with federal securities regulations. Effective April 1, 2011, the Fund's expenses associated with the Chief Compliance Officer are paid directly by the Investment Manager. Prior to April 1, 2011, the Fund, along with other affiliated funds, paid its pro-rata share of the expenses for the Chief Compliance Officer. Such fees did not exceed $15,000 per year.
Transfer Agent Fees
Under a Transfer and Dividend Disbursing Agent Agreement, Columbia Management Investment Services Corp. (the Transfer Agent), an affiliate of the Investment Manager and a wholly-owned subsidiary of Ameriprise Financial, is responsible for providing transfer agency services to the Fund. The Transfer Agent has contracted with Boston Financial Data Services (BFDS) to serve as sub-transfer agent.
The Transfer Agent receives monthly account-based service fees based on the number of open accounts and is reimbursed by the Fund for the fees and expenses the Transfer Agent pays to financial intermediaries that maintain omnibus accounts with the Fund that is a percentage of the average aggregate value of the Fund's shares maintained in each such omnibus account (other than omnibus accounts for which American Enterprise Investment Services Inc. is the broker of record or accounts where the beneficial shareholder is a customer of Ameriprise Financial Services, Inc., which are paid a per account fee). The Transfer Agent pays the fees of BFDS for services as sub-transfer agent and is not entitled to reimbursement for such fees from the Fund (with the exception of out-of-pocket fees).
The Transfer Agent also receives compensation from fees for various shareholder services and reimbursements for certain out-of-pocket expenses. Class I shares do not pay transfer agent fees.
For the year ended February 29, 2012, the Fund's effective transfer agent fee rates as a percentage of average daily net assets of each class were as follows:
| Class A | | | 0.19 | % | |
| Class B | | | 0.20 | | |
| Class C | | | 0.19 | | |
| Class R | | | 0.19 | | |
| Class W | | | 0.17 | | |
| Class Z | | | 0.19 | | |
An annual minimum account balance fee of $20 may apply to certain accounts with a value below the Fund's initial minimum investment requirements to reduce the impact of small accounts on transfer agent fees. These minimum account balance fees are recorded as part of expense reductions in the Statement of Operations. For the year ended February 29, 2012, these minimum account balance fees reduced total expenses by $4,091.
Distribution and Service Fees
The Fund has an agreement with Columbia Management Investment Distributors, Inc. (the Distributor), an affiliate of the Investment Manager and a wholly-owned subsidiary of Ameriprise Financial, for distribution and shareholder services. Pursuant to Rule 12b-1 under the 1940 Act, the Board has approved, and the Fund has adopted, distribution and shareholder service plans (the Plans) which set the distribution and service fees for the Fund. These fees are calculated daily and are intended to compensate the Distributor and/or eligible selling and/or servicing agents for selling shares of the Fund and providing services to investors.
The Plans require the payment of a monthly combined distribution and service fee to the Distributor at the maximum annual rate of 0.25% of the average daily net assets attributable to Class A shares of the Fund. The Plans also required the payment of a monthly service fee at the maximum annual rate of 0.25% of the average daily net assets attributable to Class B, Class C and Class W shares of the Fund and the payment of a monthly distribution fee at the maximum annual rates of 0.75%, 0.75%, 0.50% and 0.25% of the average daily net assets attributable to Class B, Class C, Class R and Class W shares, respectively.
27
Columbia Marsico Growth Fund, February 29, 2012
The Fund may pay a distribution fee of up to 0.25% of the Fund's average daily net assets attributable to Class W shares and a service fee of up to 0.25% of the Fund's average daily net assets attributable to Class W shares, provided, however, that the aggregate fee shall not exceed 0.25% of the Fund's average daily net assets attributable to Class W shares.
Sales Charges
Sales charges, including front-end charges and CDSCs, received by the Distributor for distributing Fund shares were $225,750 for Class A, $19,348 for Class B and $13,676 for Class C shares for the year ended February 29, 2012.
Expenses Waived/Reimbursed by the Investment Manager and its Affiliates
Effective July 1, 2011, the Investment Manager and certain of its affiliates have contractually agreed to waive fees and/or reimburse expenses (excluding certain fees and expenses described below), through June 30, 2012, unless sooner terminated at the sole discretion of the Board, so that the Fund's net operating expenses, after giving effect to fees waived/expenses reimbursed and any balance credits and/or overdraft charges from the Fund's custodian, do not exceed the following annual rates as a percentage of the class' average daily net assets:
| Class A | | | 1.29 | % | |
| Class B | | | 2.04 | | |
| Class C | | | 2.04 | | |
| Class I | | | 0.87 | | |
| Class R | | | 1.54 | | |
| Class W | | | 1.29 | | |
| Class Z | | | 1.04 | | |
Under the agreement, the following fees and expenses are excluded from the waiver/reimbursement commitment, and therefore will be paid by the Fund, if applicable: taxes (including foreign transaction taxes), expenses associated with investments in affiliated and non-affiliated pooled investment vehicles (including mutual funds and exchange traded funds), transaction costs and brokerage commissions, costs related to any securities lending program, dividend expenses associated with securities sold short, inverse floater program fees and expenses, transaction charges and interest on borrowed money, interest, extraordinary expenses and any other expenses the exclusion of which is specifically approved by the Board. This agreement may be modified or amended only with approval from all parties.
Prior to July 1, 2011, the Investment Manager voluntarily agreed to reimburse a portion of the Fund's expenses (excluding certain expenses, such as brokerage commissions, interest, taxes and extraordinary expenses, but including custodian charges relating to overdrafts, if any) so that the Fund's ordinary net operating expenses, after giving effect to fees waived/expenses reimbursed and any balance credits and/or overdraft charges from the Fund's custodian, did not exceed the following annual rates as a percentage of the class' average daily net assets:
| Class A | | | 1.45 | % | |
| Class B | | | 2.20 | | |
| Class C | | | 2.20 | | |
| Class I | | | 1.07 | | |
| Class R | | | 1.70 | | |
| Class W | | | 1.45 | | |
| Class Z | | | 1.20 | | |
Note 4. Federal Tax Information
The timing and character of income and capital gain distributions are determined in accordance with income tax regulations, which may differ from GAAP because of temporary or permanent book to tax differences.
For the year ended February 29, 2012, these differences are primarily due to differing treatment for deferral/reversal of wash sales, deferred trustees expense, capital loss carryforwards, late year ordinary losses and post-October losses. To the extent these differences are permanent, reclassifications are made among the components of the Fund's net assets in the Statement of Assets and Liabilities. Temporary differences do not require reclassifications. In the Statement of Assets and Liabilities the following reclassifications were made:
| Undistributed net investment income | | $ | (875 | ) | |
| Accumulated net realized loss | | | 875 | | |
| Paid-in capital | | | — | | |
28
Columbia Marsico Growth Fund, February 29, 2012
Net investment income and net realized gains (losses), as disclosed in the Statement of Operations, and net assets were not affected by this reclassification.
The tax character of distributions paid during the years indicated was as follows:
| Year ended | | February 29,
2012 | | February 28,
2011 | |
| Ordinary income | | $ | — | | | $ | 1,185,520 | | |
Short-term capital gain distributions, if any, are considered ordinary income distributions for tax purposes.
At February 29, 2012, the components of distributable earnings on a tax basis were as follows:
| Undistributed ordinary income | | $ | 5,422,996 | | |
| Undistributed long-term capital gains | | | — | | |
| Unrealized appreciation | | | 906,268,507 | | |
At February 29, 2012, the cost of investments for federal income tax purposes was $2,414,015,937 and the aggregate gross unrealized appreciation and depreciation based on that cost was:
| Unrealized appreciation | | $ | 934,446,959 | | |
| Unrealized depreciation | | $ | (28,178,452 | ) | |
| Net unrealized appreciation | | $ | 906,268,507 | | |
The following capital loss carryforward, determined at February 29, 2012, may be available to reduce taxable income arising from future net realized gains on investments, if any, to the extent permitted by the Internal Revenue Code:
| Year of expiration | | Amount | |
| 2017 | | $ | 142,094,569 | | |
| 2018 | | | 322,911,728 | | |
| Total | | $ | 465,006,297 | | |
On December 22, 2010, the Regulated Investment Company Modernization Act of 2010 (the Act) was enacted, which changed various technical rules governing the tax treatment of regulated investment companies. The changes are generally effective for taxable years beginning after the date of enactment. Under the Act, the Fund will be permitted to carry forward capital losses incurred in taxable years beginning after the date of enactment for an unlimited period. However, any losses incurred during those future taxable years will be required to be utilized prior to the losses incurred in pre-enactment taxable years, which carry an expiration date. As a result of this ordering rule, pre-enactment capital loss carryforwards may be more likely to expire unused.
For the year ended February 29, 2012, $312,633,455 of capital loss carryforward was utilized.
Under current tax rules, regulated investment companies can elect to treat certain late-year ordinary losses incurred and post-October capital losses (capital losses realized after October 31) as arising on the first day of the following taxable year. As of February 29, 2012, the Fund will elect to treat late year ordinary losses of $219,033 and post-October capital losses of $20,723,096 as arising on March 1, 2012.
Management of the Fund has concluded that there are no significant uncertain tax positions that would require recognition in the financial statements. However, management's conclusion may be subject to review and adjustment at a later date based on factors including, but not limited to, new tax laws, regulations, and administrative interpretations (including relevant court decisions). Generally, the Fund's federal tax returns for the prior three fiscal years remain subject to examination by the Internal Revenue Service.
Note 5. Portfolio Information
The cost of purchases and proceeds from sales of securities, excluding short-term obligations, aggregated to $2,078,584,700 and $2,486,019,310, respectively, for the year ended February 29, 2012.
Note 6. Regulatory Settlements
During the year ended February 28, 2011, the Fund received payments of $22,206 resulting from certain regulatory settlements with third parties in which the Fund had participated. The payments have been included in "Proceeds
29
Columbia Marsico Growth Fund, February 29, 2012
from regulatory settlements" in the Statement of Changes in Net Assets.
Note 7. Lending of Portfolio Securities
Effective July 11, 2011, the Fund has entered into a Master Securities Lending Agreement (the Agreement) with JPMorgan Chase Bank, N.A. (JPMorgan). The Agreement, which replaces the previous security lending arrangement with State Street, authorizes JPMorgan as lending agent to lend securities to authorized borrowers in order to generate additional income on behalf of the Fund. Pursuant to the Agreement, the securities loaned are secured by cash or U.S. government securities equal to at least 100% of the market value of the loaned securities. Any additional collateral required to maintain those levels due to market fluctuations of the loaned securities is requested to be delivered the following business day. Cash collateral received is invested by the lending agent on behalf of the Fund into authorized investments pursuant to the Agreement. The investments made with the cash collateral are listed in the Portfolio of Investments. The values of such investments and any uninvested cash collateral are disclosed in the Statement of Assets and Liabilities along with the related obligation to return the collateral upon the return of the securities loaned. At February 29, 2012, securities valued at $84,854,299 were on loan, secured by U.S. government securities valued at $11,374,238 and by cash collateral of $75,936,069 (which does not reflect calls for collateral made to borrowers by JPMorgan at period end) that is partially or fully invested in short-term securities or other cash equivalents.
Risks of delay in recovery of securities or even loss of rights in the securities may occur should the borrower of the securities fail financially. Risks may also arise to the extent that the value of the securities loaned increases above the value of the collateral received. JPMorgan will indemnify the Fund from losses resulting from a borrower's failure to return a loaned security when due. Such indemnification does not extend to losses associated with declines in the value of cash collateral investments. The Investment Manager is not responsible for any losses incurred by the Fund in connection with the securities lending program. Loans are subject to termination by the Fund or the borrower at any time, and are, therefore, not considered to be illiquid investments.
Pursuant to the Agreement, the Fund receives income for lending its securities either in the form of fees or by earning interest on invested cash collateral, net of negotiated rebates paid to borrowers and fees paid to the lending agent for services provided and any other securities lending expenses. Net income earned from securities lending for the year ended February 29, 2012 is disclosed in the Statement of Operations. The Fund continues to earn and accrue interest and dividends on the securities loaned.
Prior to July 11, 2011, the Fund participated in a securities lending arrangement with State Street. Each security on loan was collateralized in an amount at least equal to the market value of the securities loaned plus accrued income from the investment of collateral. The income generated by the investment of the collateral, net of any fees remitted to State Street as the lending agent and borrower rebates, was paid to the Fund.
Note 8. Custody Credits
Prior to July 11, 2011, the Fund had an agreement with its custodian bank under which custody fees may have been reduced by balance credits. These credits are recorded as part of expense reductions on the Statement of Operations. The Fund could have invested a portion of the assets utilized in connection with the expense offset arrangement in an income-producing asset if they had not entered into such an agreement. Subsequent to this date, the Fund may invest its daily balance in an affiliated money market fund as detailed below. For the period March 1, 2011 through July 10, 2011, these credits reduced total expenses by $140.
Note 9. Affiliated Money Market Fund
Effective July 11, 2011, the Fund may invest its daily cash balances in Columbia Short-Term Cash Fund, an affiliated money market fund established for the exclusive use by the Fund and other affiliated funds. The income earned by the Fund from such investments is included as "Dividends from affiliates" in the Statement of Operations. As an investing fund, the Fund indirectly bears its proportionate share of the expenses of Columbia Short-Term Cash Fund.
Note 10. Shareholder Concentration
At February 29, 2012, two unaffiliated shareholder accounts owned 39.3% of the outstanding shares of the Fund. The Fund
30
Columbia Marsico Growth Fund, February 29, 2012
has no knowledge about whether any portion of those shares was owned beneficially by such accounts. Subscription and redemption activity by concentrated accounts may have a significant effect on the operations of the Fund.
Note 11. Line of Credit
The Fund has entered into a revolving credit facility with a syndicate of banks led by JPMorgan Chase Bank, N.A. (the Administrative Agent), whereby the Fund may borrow for the temporary funding of shareholder redemptions or for other temporary or emergency purposes. The credit facility became effective on July 11, 2011, replacing a prior credit facility. The credit facility agreement, as amended, which is a collective agreement between the Fund and certain other funds managed by the Investment Manager, severally and not jointly, permits collective borrowings up to $500 million. Pursuant to a December 13, 2011 amendment to the credit facility agreement, interest is charged to each participating fund based on its borrowings at a rate equal to the higher of (i) the overnight federal funds rate plus 1.00% or (i) the one-month LIBOR rate plus 1.00%. Each borrowing under the credit facility matures no later than 60 days after the date of borrowing. The Fund also pays a commitment fee equal to its pro rata share of the amount of the credit facility at a rate of 0.08% per annum. For the period July 11, 2011 through December 13, 2011, interest was charged to each participating fund based on its borrowings at a rate equal to the sum of the federal funds rate plus (i) 1.25% per annum plus (ii) if one-month LIBOR exceeds the federal funds rate, the amount of such excess. The Fund also paid a commitment fee equal to its pro rata share of the amount of the credit facility at a rate of 0.10% per annum.
Prior to July 11, 2011, the Fund and certain other funds managed by the Investment Manager participated in a committed, unsecured revolving credit facility provided by State Street. For the period June 27, 2011 through July 8, 2011, the collective borrowing amount of the credit facility was $100 million. For the period May 16, 2011 through June 26, 2011, the collective borrowing amount of the credit facility was $150 million. For the period March 28, 2011 through May 15, 2011, the collective borrowing amount of the credit facility was $225 million. Prior to March 28, 2011, the collective borrowing amount of the credit facility was $280 million. Interest was charged to each fund based on its borrowings at a rate equal to the greater of the (i) federal funds rate plus 1.25% per annum or (ii) the overnight LIBOR rate plus 1.25% per annum. The Fund also paid a commitment fee equal to its pro rata share of the amount of the credit facility at a rate of 0.125% per annum.
For the year ended February 29, 2012, the average daily loan balance outstanding on days when borrowing existed was $4,163,636 at a weighted average interest rate of 1.33%.
Note 12. Significant Risks
Foreign Securities Risk
Investing in foreign securities may include certain risks and considerations not typically associated with investing in U.S. securities, such as fluctuating currency values and changing local and regional economic, political and social conditions, which may result in greater market volatility. In addition, certain foreign securities may not be as liquid as U.S. securities. Investing in emerging markets may accentuate these risks.
Investments in emerging market countries are subject to additional risk. The risk of foreign investments is typically increased in less developed countries. These countries are also more likely to experience high levels of inflation, deflation or currency devaluation which could hurt their economies and securities markets.
Note 13. Subsequent Events
Management has evaluated the events and transactions that have occurred through the date the financial statements were issued and noted no items requiring adjustment of the financial statements or additional disclosure.
Note 14. Information Regarding Pending and Settled Legal Proceedings
In June 2004, an action captioned John E. Gallus et al. v. American Express Financial Corp. and American Express Financial Advisors Inc. was filed in the United States District Court for the District of Arizona. The plaintiffs allege that they are investors in several American Express Company mutual funds (currently branded as Columbia) and they purport to bring the action derivatively on behalf of those funds under the Investment Company Act of 1940. The plaintiffs allege that fees allegedly paid to the defendants by the funds for investment advisory and administrative services
31
Columbia Marsico Growth Fund, February 29, 2012
are excessive. The plaintiffs seek remedies including restitution and rescission of investment advisory and distribution agreements. The plaintiffs voluntarily agreed to transfer this case to the United States District Court for the District of Minnesota (the District Court). In response to defendants' motion to dismiss the complaint, the District Court dismissed one of plaintiffs' four claims and granted plaintiffs limited discovery. Defendants moved for summary judgment in April 2007. Summary judgment was granted in the defendants' favor on July 9, 2007. The plaintiffs filed a notice of appeal with the Eighth Circuit Court of Appeals (the Eighth Circuit) on August 8, 2007. On April 8, 2009, the Eighth Circuit reversed summary judgment and remanded to the District Court for further proceedings. On August 6, 2009, defendants filed a writ of certiorari with the U.S. Supreme Court (the Supreme Court), asking the Supreme Court to stay the District Court proceedings while the Supreme Court considered and rule in a case captioned Jones v. Harris Associates, which involved issues of law similar to those presented in the Gallus case. On March 30, 2010, the Supreme Court issued its ruling in Jones v. Harris Associates, and on April 5, 2010, the Supreme Court vacated the Eighth Circuit's decision in the Gallus case and remanded the case to the Eighth Circuit for further consideration in light of the Supreme Court's decision in Jones v. Harris Associates. On June 4, 2010, the Eighth Circuit remanded the Gallus case to the District Court for further consideration in light of the Supreme Court's decision in Jones v. Harris Associates. On December 9, 2010, the District Court reinstated its July 9, 2007 summary judgment order in favor of the defendants. On January 10, 2011, plaintiffs filed a notice of appeal with the Eighth Circuit. In response to the plaintiffs' opening appellate brief filed on March 18, 2011, the defendants filed a response brief on May 4, 2011 with the Eighth Circuit. The plaintiffs filed a reply brief on May 26, 2011 and oral arguments took place on November 17, 2011. On March 30, 2012, the Eighth Circuit upheld the grant of summary judgment by the District Court in favor of the defendants.
In December 2005, without admitting or denying the allegations, American Express Financial Corporation (AEFC, which is now known as Ameriprise Financial, Inc. (Ameriprise Financial)) entered into settlement agreements with the Securities and Exchange Commission (SEC) and Minnesota Department of Commerce (MDOC) related to market timing activities. As a result, AEFC was censured and ordered to cease and desist from committing or causing any violations of certain provisions of the Investment Advisers Act of 1940, the Investment Company Act of 1940, and various Minnesota laws. AEFC agreed to pay disgorgement of $10 million and civil money penalties of $7 million. AEFC also agreed to retain an independent distribution consultant to assist in developing a plan for distribution of all disgorgement and civil penalties ordered by the SEC in accordance with various undertakings detailed at www.sec.gov/litigation/admin/ia-2451.pdf. Ameriprise Financial and its affiliates have cooperated with the SEC and the MDOC in these legal proceedings, and have made regular reports to the funds' Boards of Trustees.
Ameriprise Financial and certain of its affiliates have historically been involved in a number of legal, arbitration and regulatory proceedings, including routine litigation, class actions, and governmental actions, concerning matters arising in connection with the conduct of their business activities. Ameriprise Financial believes that the Funds are not currently the subject of, and that neither Ameriprise Financial nor any of its affiliates are the subject of, any pending legal, arbitration or regulatory proceedings that are likely to have a material adverse effect on the Funds or the ability of Ameriprise Financial or its affiliates to perform under their contracts with the Funds. Ameriprise Financial is required to make 10-Q, 10-K and, as necessary, 8-K filings with the Securities and Exchange Commission on legal and regulatory matters that relate to Ameriprise Financial and its affiliates. Copies of these filings may be obtained by accessing the SEC website at www.sec.gov.
There can be no assurance that these matters, or the adverse publicity associated with them, will not result in increased fund redemptions, reduced sale of fund shares or other adverse consequences to the Funds. Further, although we believe proceedings are not likely to have a material adverse effect on the Funds or the ability of Ameriprise Financial or its affiliates to perform under their contracts with the Funds, these proceedings are subject to uncertainties and, as such, we are unable to estimate the possible loss or range of loss that may result. An adverse outcome in one or more of these proceedings could result in adverse judgments, settlements, fines, penalties or other relief that could have a material adverse effect on the consolidated financial condition or results of operations of Ameriprise Financial.
32
Report of Independent Registered Public Accounting Firm
To the Trustees of Columbia Funds Series Trust and the Shareholders of Columbia Marsico Growth Fund
In our opinion, the accompanying statement of assets and liabilities, including the investment portfolio, and the related statements of operations and of changes in net assets and the financial highlights present fairly, in all material respects, the financial position of Columbia Marsico Growth Fund (the "Fund") (a series of Columbia Funds Series Trust) at February 29, 2012, the results of its operations for the year then ended, the changes in its net assets for each of the two years in the period then ended and the financial highlights for each of the periods indicated, in conformity with accounting principles generally accepted in the United States of America. These financial statements and financial highlights (hereafter referred to as "financial statements") are the responsibility of the Fund's management. Our responsibility is to express an opinion on these financial statements based on our audits. We conducted our audits of these financial statements in accordance with the standards of the Public Company Accounting Oversight Board (United States). Those standards require that we plan and perform the audit to obtain reasonable assurance about whether the financial statements are free of material misstatement. An audit includes examining, on a test basis, evidence supporting the amounts and disclosures in the financial statements, assessing the accounting principles used and significant estimates made by management, and evaluating the overall financial statement presentation. We believe that our audits, which included confirmation of securities at February 29, 2012 by correspondence with the custodian, brokers and transfer agent, provide a reasonable basis for our opinion.
PricewaterhouseCoopers LLP
Minneapolis, Minnesota
April 20, 2012
33
Fund Governance
Shareholders elect the Board that oversees the funds' operations. The Board appoints officers who are responsible for day-to-day business decisions based on policies set by the Board. The following table provides basic biographical information about the funds' Board members, including their principal occupations during the past five years, although specific titles for individuals may have varied over the period. Under current Board policy, members may serve until the next Board meeting after he or she reaches the mandatory retirement age established by the Board, or the fifteenth anniversary of the first Board meeting they attended as a member of the Board.
On September 29, 2009, Ameriprise Financial, the parent company of Columbia Management, entered into an agreement with Bank of America, N.A. ("Bank of America") to acquire a portion of the asset management business of Columbia Management Group, LLC and certain of its affiliated companies (the "Transaction"). Following the Transaction, which became effective on May 1, 2010, various alignment activities have occurred with respect to the Fund Family. In connection with the Transaction, Mr. Edward J. Boudreau, Jr., Mr. William P. Carmichael, Mr. William A. Hawkins, Mr. R. Glenn Hilliard, Mr. John J. Nagorniak, Ms. Minor M. Shaw and Dr. Anthony M. Santomero, who were members prior to the Transaction of the Legacy Columbia Nations funds' Board ("Nations Funds"), which includes Columbia Funds Series Trust, Columbia Funds Variable Insurance Trust I and Columbia Funds Master Investment Trust, LLC., began service on the Board for the Legacy RiverSource funds ("RiverSource Funds") effective June 1, 2011, which resulted in an overall increase from twelve Trustees to sixteen for all mutual funds overseen by the Board.
Independent Board Members
| Name, Address, Age | | Position Held
with Funds
and Length
of Service | | Principal Occupation During Past Five Years | | Number of
Funds in the
Fund Family
Overseen by
Board Member | | Other Present or
Past Directorships/
Trusteeships
(Within Past 5 Years) | |
| Kathleen Blatz | | | | | | | | | |
|
901 S. Marquette Ave.
Minneapolis, MN 55402
Age 57 | | Board member since 1/06 for RiverSource Funds and since 6/11 for Nations Funds | | Attorney; Chief Justice, Minnesota Supreme Court, 1998-2006 | | | 153 | | | None | |
|
| Edward J. Boudreau, Jr. | | | | | | | | | |
|
225 Franklin Street
Mail Drop
BX32 05228
Boston, MA 02110
Age 67 | | Board member since 6/11 for RiverSource Funds and since 1/05 for Nations Funds | | Managing Director, E.J. Boudreau & Associates (consulting) since 2000 | | | 146 | | | Former Trustee, BofA Funds Series Trust (11 funds) | |
|
| Pamela G. Carlton | | | | | | | | | |
|
901 S. Marquette Ave.
Minneapolis, MN 55402
Age 57 | | Board member since 7/07 for RiverSource Funds and since 6/11 for Nations Funds | | President, Springboard-Partners in Cross Cultural Leadership (consulting company) | | | 153 | | | None | |
|
34
Fund Governance (continued)
Independent Board Members (continued)
| Name, Address, Age | | Position Held
with Funds
and Length
of Service | | Principal Occupation During Past Five Years | | Number of
Funds in the
Fund Family
Overseen by
Board Member | | Other Present or
Past Directorships/
Trusteeships
(Within Past 5 Years) | |
| William P. Carmichael | | | | | | | | | |
|
225 Franklin Street
Mail Drop
BX32 05228
Boston, MA 02110
Age 68 | | Board member since 6/11 for RiverSource Funds and since 1999 for Nations Funds | | Retired | | | 146 | | | Director, Cobra Electronics Corporation (electronic equipment manufacturer); The Finish Line (athletic shoes and apparel); McMoRan Exploration Company (oil and gas exploration and development); former Trustee, BofA Funds Series Trust (11 funds); former Director, Spectrum Brands, Inc. (consumer products); former Director, Simmons Company (bedding) | |
|
| Patricia M. Flynn | | | | | | | | | |
|
901 S. Marquette Ave.
Minneapolis, MN 55402
Age 61 | | Board member since 11/04 for RiverSource Funds and since 6/11 for Nations Funds | | Trustee Professor of Economics and Management, Bentley University; former Dean, McCallum Graduate School of Business, Bentley University | | | 153 | | | None | |
|
| William A. Hawkins | | | | | | | | | |
|
225 Franklin Street
Mail Drop
BX32 05228
Boston, MA 02110
Age 69 | | Board member since 6/11 for RiverSource Funds and since 1/05 for Nations Funds | | Managing Director, Overton Partners (financial consulting), since August 2010; President and Chief Executive Officer, California General Bank, N.A., January 2008-August 2010 | | | 146 | | | Trustee, BofA Funds Series Trust (11 funds) | |
|
| R. Glenn Hilliard | | | | | | | | | |
|
225 Franklin Street
Mail Drop
BX32 05228
Boston, MA 02110
Age 69 | | Board member since 6/11 for RiverSource Funds and since 1/05 for Nations Funds | | Chairman and Chief Executive Officer, Hilliard Group LLC (investing and consulting), since April 2003; Non-Executive Director & Chairman, CNO Financial Group, Inc. (formerly Conseco, Inc.) (insurance), September 2003-May 2011 | | | 146 | | | Chairman, BofA Fund Series Trust (11 funds); former Director, CNO Financial Group, Inc. (insurance) | |
|
35
Fund Governance (continued)
Independent Board Members (continued)
| Name, Address, Age | | Position Held
with Funds
and Length
of Service | | Principal Occupation During Past Five Years | | Number of
Funds in the
Fund Family
Overseen by
Board Member | | Other Present or
Past Directorships/
Trusteeships
(Within Past 5 Years) | |
| Stephen R. Lewis, Jr. | | | | | | | | | |
|
901 S. Marquette Ave.
Minneapolis, MN 55402
Age 73 | | Chair of the Board for RiverSource Funds since 1/07, Board member for RiverSource Funds since 1/02 and since 6/11 for Nations Funds | | President Emeritus and Professor of Economics Emeritus, Carleton College | | | 153 | | | Director, Valmont Industries, Inc. (manufactures irrigation systems) | |
|
| John F. Maher | | | | | | | | | |
|
901 S. Marquette Ave.
Minneapolis, MN 55402
Age 68 | | Board member since 12/06 for Legacy Seligman funds, since 12/08 for RiverSource Funds and since 6/11 for Nations Funds | | Retired President and Chief Executive Officer and former Director, Great Western Financial Corporation (financial services), 1986-1997 | | | 153 | | | None | |
|
| John J. Nagorniak | | | | | | | | | |
|
225 Franklin Street
Mail Drop
BX32 05228
Boston, MA 02110
Age 67 | | Board member since 6/11 for RiverSource Funds and since 1/08 for Nations Funds | | Retired; President and Director, Foxstone Financial, Inc. (consulting), 2000-2007; Director, Mellon Financial Corporation affiliates (investing), 2000-2007; Chairman, Franklin Portfolio Associates (investing—Mellon affiliate), 1982-2007 | | | 146 | | | Trustee, Research Foundation of CFA Institute; Director, MIT Investment Company; Trustee, MIT 401k Plan; former Trustee, BofA Funds Series Trust (11 funds) | |
|
| Catherine James Paglia | | | | | | | | | |
|
901 S. Marquette Ave.
Minneapolis, MN 55402
Age 59 | | Board member since 11/04 for RiverSource Funds and since 6/11 for Nations Funds | | Director, Enterprise Asset Management, Inc. (private real estate and asset management company) | | | 153 | | | None | |
|
36
Fund Governance (continued)
Independent Board Members (continued)
| Name, Address, Age | | Position Held
with Funds
and Length
of Service | | Principal Occupation During Past Five Years | | Number of
Funds in the
Fund Family
Overseen by
Board Member | | Other Present or
Past Directorships/
Trusteeships
(Within Past 5 Years) | |
| Leroy C. Richie | | | | | | | | | |
|
901 S. Marquette Ave.
Minneapolis, MN 55402
Age 70 | | Board member since 2000 for Legacy Seligman funds, since 11/08 for RiverSource Funds and since 6/11 for Nations Funds | | Counsel, Lewis & Munday, P.C. since 2004; former Vice President and General Counsel, Automotive Legal Affairs, Chrysler Corporation | | | 153 | | | Director, Digital Ally, Inc. (digital imaging); Director, Infinity, Inc. (oil and gas exploration and production); Director, OGE Energy Corp. (energy and energy services) | |
|
| Minor M. Shaw | | | | | | | | | |
|
225 Franklin Street
Mail Drop
BX32 05228
Boston, MA 02110
Age 64 | | Board member since 6/11 for RiverSource Funds and since 2003 for Nations Funds | | President—Micco LLC (private investments) | | | 146 | | | Former Trustee, BofA Funds Series Trust (11 funds); Board Member, Piedmont Natural Gas; Director, Blue Cross Blue Shield of South Carolina | |
|
| Alison Taunton-Rigby | | | | | | | | | |
|
901 S. Marquette Ave.
Minneapolis, MN 55402
Age 67 | | Board member since 11/02 for RiverSource Funds and since 6/11 for Nations Funds | | Chief Executive Officer and Director, RiboNovix, Inc. 2003-2010 (biotechnology); former President, Aquila Biopharmaceuticals | | | 153 | | | Director, Healthways, Inc. (health management programs); Director, ICI Mutual Insurance Company, RRG; Director, Abt Associates (government contractor) | |
|
37
Fund Governance (continued)
Interested Board Member Not Affiliated with Investment Manager*
| Name, Address, Age | | Position Held
with Funds
and Length
of Service | | Principal Occupation During Past Five Years | | Number of
Funds in the
Fund Family
Overseen by
Board Member | | Other Present or
Past Directorships/
Trusteeships
(Within Past 5 Years) | |
| Anthony M. Santomero* | | | | | | | | | |
|
225 Franklin Street
Mail Drop
BX32 05228
Boston, MA 02110
Age 65 | | Board member since 6/11 for RiverSource Funds and since 1/08 for Nations Funds | | Richard K. Mellon Professor Emeritus of Finance, The Wharton School, University of Pennsylvania, since 2002; Senior Advisor, McKinsey & Company (consulting), 2006-2008; President and Chief Executive Officer, Federal Reserve Bank of Philadelphia, 2000-2006 | | | 146 | | | Director, Renaissance Reinsurance Ltd.; Trustee, Penn Mutual Life Insurance Company; Director, Citigroup; Director, Citibank, N.A.; former Trustee, BofA Funds Series Trust (11 funds) | |
|
* Dr. Santomero is not an affiliated person of the Investment Manager or Ameriprise Financial. However, he is currently deemed by the funds to be an "interested person" (as defined in the 1940 Act) of the Funds because he serves as a Director of Citigroup, Inc. and Citibank N.A., companies that may directly or through subsidiaries and affiliates engage from time-to-time in brokerage execution, principal transactions and lending relationships with the funds or accounts advised/managed by the Investment Manager.
Interested Board Member Affiliated with Investment Manager*
| William F. Truscott | | | | | | | | | |
|
53600 Ameriprise Financial Center
Minneapolis, MN 55474
Age 51 | | Board member since 11/01 for RiverSource Funds and since 6/11 for Nations Funds; Senior Vice President since 2002 for RiverSource Funds and 5/10 for Nations Funds | | Chairman of the Board and President, Columbia Management Investment Advisers, LLC since May 2010 and February 2012, respectively (previously President, Chairman of the Board and Chief Investment Officer, 2001-April 2010); Chief Executive Officer, U.S. Asset Management & President, Annuities, Ameriprise Financial, Inc. since May 2010 (previously President—U.S. Asset Management and Chief Investment Officer, 2005-April 2010); Director, President and Chief Executive Officer, Ameriprise Certificate Company since 2006; Director and Chief Executive Officer, Columbia Management Investment Distributors, Inc. since May 2010 and February 2012, respectively (previously Chairman of the Board and Chief Executive Officer, 2006-April 2010); Chairman of the Board and Chief Executive Officer, RiverSource Distributors, Inc. since 2006. | | | 153 | | | None | |
|
* Interested person (as defined under the 1940 Act) by reason of being an officer, director, security holder and/or employee of the Investment Manager or Ameriprise Financial.
The SAI has additional information about the Fund's Board members and is available, without charge, upon request by calling 800.345.6611; contacting your financial intermediary; or visiting columbiamanagement.com.
38
Fund Governance (continued)
Officers
| Name, Year of Birth and Address | | Principal Occupation(s) During the Past Five Years | |
| J. Kevin Connaughton (Born 1964) | |
|
225 Franklin Street
Boston, MA 02110
President (since 2009) | | Senior Vice President and General Manager—Mutual Fund Products, Columbia Management Investment Advisers, LLC since May 2010; President, Columbia Funds, since 2009, and RiverSource Funds, since May 2010 (previously Senior Vice President and Chief Financial Officer, Columbia Funds, from June 2008 to January 2009, Treasurer, Columbia Funds, from October 2003 to May 2008, and senior officer of various other affiliated funds since 2000); Managing Director, Columbia Management Advisors, LLC from December 2004 to April 2010. | |
|
| Michael G. Clarke (Born 1969) | |
|
225 Franklin Street
Boston, MA 02110
Treasurer (since 2011) and Chief Financial Officer (since 2009) | | Vice President, Columbia Management Investment Advisers, LLC since May 2010; Managing Director of Fund Administration, Columbia Management Advisors, LLC, from September 2004 to April 2010; senior officer of Columbia Funds and affiliated funds since 2002. | |
|
| Scott R. Plummer (Born 1959) | |
|
5228 Ameriprise Financial Center
Minneapolis, MN 55474
Senior Vice President and Chief Legal Officer (since 2010) | | Chief Legal Officer and Assistant Secretary, Columbia Management Investment Advisers, LLC since June 2005; Vice President and Lead Chief Counsel—Asset Management, Ameriprise Financial, Inc. since May 2010 (previously Vice President and Chief Counsel—Asset Management, from 2005 to April 2010, Vice President, Chief Counsel and Assistant Secretary, Columbia Management Investment Distributors, Inc. since 2008; Vice President, General Counsel and Secretary, Ameriprise Certificate Company since 2005; Chief Counsel, RiverSource Distributors, Inc. since 2006; Senior officer of Columbia Funds and affiliated funds, since 2006. | |
|
| Thomas P. McGuire (Born 1972) | |
|
225 Franklin Street
Boston, MA 02110
Chief Compliance Officer (since 2012) | | Vice President—Asset Management Compliance, Columbia Management Investment Advisers, LLC since March 2010; Chief Compliance Officer, Ameriprise Certificate Company, since September 2010; Compliance Executive, Bank of America, from June 2005 to April 2010. | |
|
| William F. Truscott (Born 1960) | |
|
53600 Ameriprise Financial Center
Minneapolis, MN 55474
Senior Vice President (since 2010) | | Chairman of the Board and President, Columbia Management Investment Advisers, LLC since May 2010 and February 2012, respectively (previously President, Chairman of the Board and Chief Investment Officer, from 2001 to April 2010); Chief Executive Officer, U.S. Asset Management & President, Annuities, Ameriprise Financial, Inc. since May 2010 (previously President—U.S. Asset Management and Chief Investment Officer from 2005 to April 2010; Director, President and Chief Executive Officer, Ameriprise Certificate Company since 2006; Director and Chief Executive Officer, Columbia Management Investment Distributors, Inc. since May 2010 and February 2012, respectively (previously Chairman of the Board and Chief Executive Officer from 2008 to April 2010); Chairman of the Board and Chief Executive Officer, RiverSource Distributors, Inc. since 2006. | |
|
| Paul D. Pearson (Born 1956) | |
|
10468 Ameriprise Financial Center
Minneapolis, MN 55474
Vice President and Assistant Treasurer
(since 2011) | | Vice President—Investment Accounting, Columbia Management Investment Advisers, LLC, since May 2010; Vice President—Managed Assets, Investment Accounting, Ameriprise Financial Corporation, 1998-2010 | |
|
39
Fund Governance (continued)
Officers (continued)
| Name, Year of Birth and Address | | Principal Occupation(s) During the Past Five Years | |
| Colin Moore (Born 1958) | |
|
225 Franklin Street
Boston, MA 02110
Senior Vice President (since 2010) | | Director and Chief Investment Officer, Columbia Management Investment Advisers, LLC since May 2010; Manager, Managing Director and Chief Investment Officer of Columbia Management Advisors, LLC from 2007 to April 2010; Head of Equities, Columbia Management Advisors, LLC from 2002 to 2007. | |
|
| Christopher O. Petersen (Born 1970) | |
|
5228 Ameriprise Financial Center
Minneapolis, MN 55474
Vice President and Secretary (since 2011) | | Vice President and Chief Counsel, Ameriprise Financial since January 2010 (formerly Vice President and Group Counsel or Counsel from April 2004 to January 2010); Senior officer of Columbia Funds and affiliated funds, since 2007. | |
|
| Amy K. Johnson (Born 1965) | |
|
5228 Ameriprise Financial Center
Minneapolis, MN 55474
Vice President (since 2010) | | Senior Vice President and Chief Operating Officer, Columbia Management Investment Advisers, LLC since May 2010 (previously Chief Administrative Officer, from 2009 until April 2010, Vice President—Asset Management and Trust Company Services, from 2006 to 2009, and Vice President—Operations and Compliance from 2004 to 2006). | |
|
| Joseph F. DiMaria (Born 1968) | |
|
225 Franklin Street
Boston, MA 02110
Vice President (since 2011) and Chief Accounting Officer (since 2008) | | Vice President, Mutual Fund Administration, Columbia Management Investment Advisers, LLC, since May 2010; Director of Fund Administration, Columbia Management Advisors, LLC from January 2006 to April 2010. | |
|
| Paul B. Goucher (Born 1968) | |
|
100 Park Avenue
New York, NY 10017
Vice President and Assistant Secretary (since 2010) | | Vice President and Chief Counsel of Ameriprise Financial since January 2010 (formerly Vice President and Group Counsel from November 2008 to January 2010); Director, Managing Director and General Counsel of J. & W. Seligman & Co. Incorporated (Seligman) from July 2008 to November 2008 and Managing Director and Associate General Counsel of Seligman from January 2005 to July 2008. | |
|
| Michael E. DeFao (Born 1968) | |
|
225 Franklin Street
Boston, MA 02110
Vice President and Assistant Treasurer (since 2011) | | Vice President and Chief Counsel, Ameriprise Financial since May 2010; Associate General Counsel, Bank of America from June 2005 to April 2010. | |
|
| Stephen T. Welsh (Born 1957) | |
|
225 Franklin Street
Boston, MA 02110
Vice President (since 2006) | | President and Director, Columbia Management Investment Services Corp. since May 2010; President and Director, Columbia Management Services, Inc. from July 2004 to April 2010; Managing Director, Columbia Management Distributors, Inc. from August 2007 to April 2010. | |
|
40
Important Information About This Report
The fund mails one shareholder report to each shareholder address. If you would like more than one report, please call shareholder services at 1-800-345-6611 and additional reports will be sent to you. This report has been prepared for shareholders of Columbia Marsico Growth Fund.
A description of the policies and procedures that the fund uses to determine how to vote proxies and a copy of the fund's voting records are available (i) at www.columbiamanagement.com, (ii) on the Securities and Exchange Commission's website at www.sec.gov, and (iii) without charge, upon request, by calling 1-800-368-0346. Information regarding how the fund voted proxies relating to portfolio securities during the 12-month period ended June 30 is available from the SEC's website. Information regarding how the fund voted proxies relating to portfolio securities is also available from the fund's website, www.columbiamanagement.com.
The fund files a complete schedule of portfolio holdings with the SEC for the first and third quarters of each fiscal year on Form N-Q. The fund's Form N-Q is available on the SEC's website at www.sec.gov and may be reviewed and copied at the SEC's Public Reference Room in Washington, D.C. Information on the operation of the Public Reference Room may be obtained by calling 1-800-SEC-0330.
Transfer Agent
Columbia Management Investment
Services Corp.
P.O. Box 8081
Boston, MA 02266-8081
1-800-345-6611
Distributor
Columbia Management Investment
Distributors, Inc.
225 Franklin Street
Boston, MA 02110
Investment Manager
Columbia Management Investment Advisers, LLC
225 Franklin Street
Boston, MA 02110
41

Columbia Marsico Growth Fund
P. O. Box 8081
Boston, MA 02266-8081
columbiamanagement.com
This information is for use with concurrent or prior delivery of a fund prospectus. Investors should consider the investment objectives, risks, charges and expenses of a mutual fund carefully before investing. For a free prospectus, which contains this and other important information about the funds, visit columbiamanagement.com. Read the prospectus carefully before investing. The Fund is distributed by Columbia Management Investment Distributors, Inc., member FINRA, and managed by Columbia Management Investment Advisers, LLC.
© 2012 Columbia Management Investment Advisers, LLC. All rights reserved.
C-1246 C (4/12)

Columbia Marsico International Opportunities Fund
Annual Report for the Period Ended February 29, 2012
Not FDIC insured • No bank guarantee • May lose value
Table of Contents
| Fund Profile | | | 1 | | |
|
| Performance Information | | | 2 | | |
|
| Understanding Your Expenses | | | 3 | | |
|
| Portfolio Managers' Report | | | 4 | | |
|
| Portfolio of Investments | | | 6 | | |
|
Statement of Assets and
Liabilities | | | 11 | | |
|
| Statement of Operations | | | 13 | | |
|
Statement of Changes in
Net Assets | | | 14 | | |
|
| Financial Highlights | | | 16 | | |
|
| Notes to Financial Statements | | | 22 | | |
|
Report of Independent Registered
Public Accounting Firm | | | 34 | | |
|
| Federal Income Tax Information | | | 35 | | |
|
| Fund Governance | | | 36 | | |
|
Important Information About
This Report | | | 45 | | |
|
The views expressed in this report reflect the current views of the respective parties. These views are not guarantees of future performance and involve certain risks, uncertainties and assumptions that are difficult to predict, so actual outcomes and results may differ significantly from the views expressed. These views are subject to change at any time based upon economic, market or other conditions and the respective parties disclaim any responsibility to update such views. These views may not be relied on as investment advice and, because investment decisions for a Columbia Fund are based on numerous factors, may not be relied on as an indication of trading intent on behalf of any particular Columbia Fund. References to specific securities should not be construed as a recommendation or investment advice.
President's Message

Dear Shareholders,
Americans were dispirited in the fourth quarter of 2011 by Washington's inability to reach a plan for deficit reduction and Europe's piecemeal attempt to address its own fiscal issues. Yet, there was sufficient good news to encourage risk taking, buoying both stocks and bonds to solid gains.
U.S. economic data surprised on the upside and fears of recession abated. With the bar of expectations set low, investors responded positively to the announcement that the economy had expanded by 1.8% in the third quarter. Consumer confidence improved, even though consumers remain under pressure with no real increase in disposable income and a continued decline in household net worth. Headline inflation—which tracks a broad range of consumer expenditures, including food and energy—declined. Even manufacturing held its ground.
Against this backdrop, the U.S. equity markets logged solid returns. The S&P 500 Index gained 11.82%, moving into positive territory for the year with quarterly advances in all ten sectors. Mid- and small-cap stocks did even better. Value outperformed growth across all market capitalizations. Energy stocks led the market, as the price of oil moved above $100 a barrel in December. Industrials and materials stocks rose, buoyed by improving economic data. The U.S. fixed-income markets logged modest but solid returns. High-yield bonds were the best performers as the economy showed signs of improvement. Emerging market bonds were strong performers, as inflation came under control in key regions. Municipal bonds and Treasuries eked out only modest gains, as investors moved away from quality in favor of riskier assets.
While fourth quarter gains were encouraging, challenges still remain. Columbia Management, however, remains strong and steadfast. Columbia Management is the eighth largest manager of long-term mutual fund assets with $326 billion under management as of December 31, 2011. The past year has been one of considerable change for the organization as we worked diligently to align products, services and resources in the integration of Columbia Management with RiverSource Investments. The strong line-up of talent, resources and capabilities that has resulted is highlighted by the success of our products. As of December 31, 2011, Columbia Management offers 52 funds rated either 4 or 5 stars by Morningstar.*
For more information about these and other funds offered by Columbia Management, including detailed, up-to-date fund performance and portfolio information, please visit us online at columbiamanagement.com. Other information and resources available on our website include:
g timely economic analysis and market commentary
g quarterly fund commentaries
g Columbia Management Investor, a quarterly newsletter for shareholders
Thank you for your continued support of the Columbia Funds. We look forward to serving your investment needs for many years to come.
Best Regards,

J. Kevin Connaughton
President, Columbia Funds
*All ratings are based on Class Z shares as of 12/31/2011. Out of 119 Class Z share Columbia funds rated by Morningstar, 7 funds received a 5-star Overall Rating and 45 funds received a 4-star Overall Rating. The Overall Morningstar Rating for a retail mutual fund is derived from a weighted average of the performance figures associated with its 3-, 5- and 10-year (if applicable) Morningstar Rating metrics. For share classes that do not have a 3-, 5-, or 10-year actual performance history, the fund's independent Morningstar Rating metric is then compared against the retail mutual fund universe breakpoints to determine its hypothetical rating.
For each fund with at least a three-year history, Morningstar calculates a Morningstar RatingTM based on a Morningstar Risk-Adjusted Return measure that accounts for variation in a fund's monthly performance (including the effects of sales charges/loads, and redemption fees), placing more emphasis on downward variations and rewarding consistent performance. The top 10% of funds in each category receive 5 stars, the next 22.5% receive 4 stars, the next 35% receive 3 stars, the next 22.5% receive 2 stars and the bottom 10% receive 1 star. (Each share class is counted as a fraction of one fund within this scale and rated separately, which may cause slight variations in the distribution percentages.)
The Morningstar RatingTM is for Class Z shares only; other classes may have different performance characteristics and may have different ratings. ©2012 Morningstar, Inc. All Rights Reserved. The Morningstar information contained herein: (1) is proprietary to Morningstar and/or its content providers; (2) may not be copied or distributed; and (3) is not warranted to be accurate, complete or timely. Neither Morningstar nor its content providers are responsible for any damages or losses arising from any use of this information.
Investors should consider the investment objectives, risks, charges and expenses of a mutual fund carefully before investing. For a free prospectus, which contains this and other important information about the funds, visit columbiamanagement.com. The prospectus should be read carefully before investing.
Columbia Funds are distributed by Columbia Management Investment Distributors, Inc., member FINRA, and managed by Columbia Management Investment Advisers, LLC.
© 2012 Columbia Management Investment Advisers, LLC. All rights reserved.
Fund Profile – Columbia Marsico International Opportunities Fund
Summary
g For the 12-month period that ended February 29, 2012, the fund's Class A shares returned –6.02% without sales charge.
g In a difficult period for international stocks, the fund held up better than its benchmark, the MSCI EAFE Index (Net).1
g Sector allocations and stock selection in the information technology and industrials sectors aided performance. The impact of currency fluctuations and stock selection in the consumer discretionary and energy sectors detracted from results.
Portfolio Management
James G. Gendelman has managed the fund since 2000. He is associated with Marsico Capital Management, LLC (Marsico), investment subadviser to the fund. In 2010, Munish Malhotra joined James G. Gendelman as co-manager of the fund.
Columbia Management Investment Advisers, LLC (the Investment Manager) retained Marsico to serve as investment subadviser to the Columbia Marsico funds. As an investment subadviser, Marsico makes the investment decisions and manages all or a portion of the fund. Marsico is an investment adviser registered with the Securities and Exchange Commission. Marsico is not affiliated with the Investment Manager.
1The MSCI Europe, Australasia and Far East (EAFE) Index (Net) is a free float-adjusted market capitalization index that is designed to measure the equity market performance of developed markets, excluding the U.S. and Canada. As of May 27, 2010, the MSCI EAFE Index (Net) consisted of the following 22 developed market country indices: Australia, Austria, Belgium, Denmark, Finland, France, Germany, Greece, Hong Kong, Ireland, Israel, Italy, Japan the Netherlands, new Zealand, Norway, Portugal, Singapore, Spain, Sweden, Switzerland and the United Kingdom.
Indices are not available for investment, are not professionally managed and do not reflect sales charges, fees, brokerage commissions, taxes or other expenses of investing. Securities in the fund may not match those in an index.
Performance data quoted represents past performance and current performance may be lower or higher. Past performance is no guarantee of future results. The investment return and principal value will fluctuate so that shares, when redeemed, may be worth more or less than the original cost. Please visit www.columbiamanagement.com for daily and most recent month-end performance updates.
Summary
1-year return as of 02/29/12
| | | | –6.02% | |
|
|  | | | Class A shares
(without sales charge) | |
|
| | | | –7.45% | |
|
|  | | | MSCI EAFE Index (Net) | |
|
Morningstar Style BoxTM

The Morningstar Style BoxTM is based on the fund's portfolio holdings. For equity funds, the vertical axis shows the market capitalization of the stocks owned, and the horizontal axis shows investment style (value, blend, or growth). Information shown is based on the most recent data provided by Morningstar.
© 2012 Morningstar, Inc. All rights reserved. The Morningstar information contained herein: (1) is proprietary to Morningstar and/or its content providers; (2) may not be copied or distributed; and (3) is not warranted to be accurate, complete or timely. Neither Morningstar nor its content providers are responsible for any damages or losses arising from any use of this information.
1
Performance Information – Columbia Marsico International Opportunities Fund
Performance data quoted represents past performance and current performance may be lower or higher. Past performance is no guarantee of future results. The investment return and principal value will fluctuate so that shares, when redeemed, may be worth more or less than the original cost. Please visit www.columbiamanagement.com for daily and most recent month-end performance updates.
Performance of a $10,000 investment 03/01/02 – 02/29/12

The chart above shows the change in value of a hypothetical $10,000 investment in Class A shares of Columbia Marsico International Opportunities Fund during the stated time period, and does not reflect the deduction of taxes that a shareholder may pay on fund distributions or on the redemption of fund shares.
Performance of a $10,000 investment 03/01/02 – 02/29/12 ($)
| Sales charge | | without | | with | |
| Class A | | | 19,865 | | | | 18,729 | | |
| Class B | | | 18,413 | | | | 18,413 | | |
| Class C | | | 18,428 | | | | 18,428 | | |
| Class I* | | | 20,091 | | | | n/a | | |
| Class R* | | | 19,381 | | | | n/a | | |
| Class Z | | | 20,369 | | | | n/a | | |
Average annual total return as of 02/29/12 (%)
| Share class | | A | | B | | C | | I* | | R* | | Z | |
| Inception | | 08/01/00 | | 08/01/00 | | 08/01/00 | | 09/27/10 | | 01/23/06 | | 08/01/00 | |
| Sales charge | | without | | with | | without | | with | | without | | with | | without | | without | | without | |
| 1-year | | | –6.02 | | | | –11.43 | | | | –6.78 | | | | –11.44 | | | | –6.78 | | | | –7.71 | | | | –5.11 | | | | –6.28 | | | | –5.84 | | |
| 5-year | | | –2.17 | | | | –3.33 | | | | –2.91 | | | | –3.25 | | | | –2.91 | | | | –2.91 | | | | –1.95 | | | | –2.42 | | | | –1.94 | | |
| 10-year | | | 7.10 | | | | 6.48 | | | | 6.29 | | | | 6.29 | | | | 6.30 | | | | 6.30 | | | | 7.23 | | | | 6.84 | | | | 7.37 | | |
The "with sales charge" returns include the maximum initial sales charge of 5.75% for Class A shares and the applicable contingent deferred sales charge of 5.00% in the first year, declining to 1.00% in the sixth year and eliminated thereafter for Class B shares and 1.00% for Class C shares for the first year only. The "without sales charge" returns do not include the effect of sales charges. If they had, returns would be lower.
Performance results reflect any fee waivers or reimbursements of fund expenses by Columbia Management Investment Advisers, LLC and/or any of its affiliates. Absent these fee waivers or expense reimbursement arrangements, performance results would have been lower.
All results shown assume reinvestment of distributions. Class I and Class Z shares are sold at net asset value with no distribution and service (Rule 12b-1) fees. Class R shares are sold at net asset value with a distribution (12b-1) fee. Class I, Class R and Class Z shares have limited eligibility and the investment minimum requirements may vary. Please see the fund's prospectuses for details. Performance for different share classes will vary based on differences in sales charges and fees associated with each class.
The tables do not reflect the deduction of taxes that a shareholder may pay on fund distributions or on the redemption of fund shares.
*The returns shown for periods prior to the share class inception date (including returns since inception, which are since Fund inception) include the returns of the Fund's Class A shares, the fund's oldest share class. These returns are adjusted to reflect any higher class-related operating expenses of the newer share classes, as applicable. Please visit columbiamanagement.com/mutual-fund/appended-performance for more information.
2
Understanding Your Expenses – Columbia Marsico International Opportunities Fund
As an investor, you incur two types of costs. There are transaction costs, which generally include sales charges on purchases and may include redemption fees. There are also ongoing costs, which generally include management fees, distribution and service (Rule 12b-1) fees, and other fund expenses. The following information is intended to help you understand your ongoing costs (in dollars) of investing in the Fund and to help you compare these costs with the ongoing costs of investing in other mutual funds.
Analyzing your fund's expenses
To illustrate these ongoing costs, we have provided examples and calculated the expenses paid by investors in each share class of the Fund during the period. The actual and hypothetical information in the table is based on an initial investment of $1,000 at the beginning of the period indicated and held for the entire period. Expense information is calculated two ways and each method provides you with different information. The amount listed in the "Actual" column is calculated using the Fund's actual operating expenses and total return for the period. You may use the Actual information, together with the amount invested, to estimate the expenses that you paid over the period. Simply divide your account value by $1,000 (for example, an $8,600 account value divided by $1,000 = 8.6), then multiply the results by the expenses paid during the period under the Actual column. The amount listed in the "Hypothetical" column assumes a 5% annual rate of return before expenses (which is not the Fund's actual return) and then applies the Fund's actual expense ratio for the period to the hypothetical return. You should not use the hypothetical account values and expenses to estimate either your actual account balance at the end of the period or the expenses you paid during the period. See "Compare with other funds" below for details on how to use the hypothetical data.
Compare with other funds
Since all mutual funds are required to include the same hypothetical calculations about expenses in shareholder reports, you can use this information to compare the ongoing cost of investing in the Fund with other funds. To do so, compare the hypothetical example with the 5% hypothetical examples that appear in the shareholder reports of other funds. As you compare hypothetical examples of other funds, it is important to note that hypothetical examples are meant to highlight the ongoing costs of investing in a fund only and do not reflect any transaction costs, such as sales charges, or redemption or exchange fees. Therefore, the hypothetical calculations are useful in comparing ongoing costs only, and will not help you determine the relative total costs of owning different funds. If transaction costs were included in these calculations, your costs would be higher.
September 1, 2011 - February 29, 2012
| | | Account value at the
beginning of the period ($) | | Account value at the
end of the period ($) | | Expenses paid
during the period ($) | | Fund's annualized
expense ratio (%) | |
| | | Actual | | Hypothetical | | Actual | | Hypothetical | | Actual | | Hypothetical | | Actual | |
| Class A | | | 1,000.00 | | | | 1,000.00 | | | | 1,064.40 | | | | 1,017.50 | | | | 7.60 | | | | 7.42 | | | | 1.48 | % | |
| Class B | | | 1,000.00 | | | | 1,000.00 | | | | 1,060.10 | | | | 1,013.67 | | | | 11.52 | | | | 11.27 | | | | 2.25 | % | |
| Class C | | | 1,000.00 | | | | 1,000.00 | | | | 1,060.10 | | | | 1,013.72 | | | | 11.47 | | | | 11.22 | | | | 2.24 | % | |
| Class I | | | 1,000.00 | | | | 1,000.00 | | | | 1,065.70 | | | | 1,019.44 | | | | 5.60 | | | | 5.47 | | | | 1.09 | % | |
| Class R | | | 1,000.00 | | | | 1,000.00 | | | | 1,062.70 | | | | 1,016.21 | | | | 8.92 | | | | 8.72 | | | | 1.74 | % | |
| Class Z | | | 1,000.00 | | | | 1,000.00 | | | | 1,065.20 | | | | 1,018.60 | | | | 6.47 | | | | 6.32 | | | | 1.26 | % | |
Expenses paid during the period are equal to the annualized expense ratio for each class as indicated above, multiplied by the average account value over the period and then multiplied by the number of days in the Fund's most recent fiscal half year and divided by 366.
Expenses do not include fees and expenses incurred indirectly by the Fund from the underlying funds in which the Fund may invest (also referred to as "acquired funds"), including affiliated and non-affiliated pooled investments vehicles (including mutual funds and exchange traded funds).
Had Columbia Management Investment Advisers, LLC and/or certain of its affiliates not waived/reimbursed certain fees and expenses, account value at the end of the period would have been reduced.
3
Portfolio Managers' Report – Columbia Marsico International Opportunities Fund
Performance data quoted represents past performance and current performance may be lower or higher. Past performance is no guarantee of future results. The investment return and principal value will fluctuate so that shares, when redeemed, may be worth more or less than the original cost. Please visit www.columbiamanagement.com for daily and most recent month-end performance updates.
Net asset value per share
as of 02/29/12 ($)
| Class A | | | 11.24 | | |
| Class B | | | 10.58 | | |
| Class C | | | 10.59 | | |
| Class I | | | 11.52 | | |
| Class R | | | 11.19 | | |
| Class Z | | | 11.44 | | |
For the 12-month period that ended February 29, 2012, the fund's Class A shares returned –6.02% without sales charge. The fund's benchmark, the MSCI EAFE Index (Net), returned –7.45%. The fund's stock selection in the information technology and industrials sectors helped mitigate losses in the consumer discretionary and energy sectors. An underweight allocation to the weak-performing financials, utilities and materials sectors also benefited results. The impact of currency activity was negative for the period.
Stock selection delivered mixed results
Stock selection in the information technology and industrials sectors aided results. Argentinean e-commerce company MercadoLibre (1.5% of net assets) experienced a strong stock price gain. Semiconductor positions Taiwan Semiconductor Manufacturing and ASML Holding (2.0% and 1.5% of net assets, respectively) posted solid results. In the industrials sector, jet engine manufacturer Rolls-Royce, Canadian National Railway and Japan-based industrial robotics company FANUC (1.2%, 2.5% and 2.0% of net assets, respectively) each posted strong returns.
Materials holdings were led by ThyssenKrupp, a diversified materials and technology conglomerate, and Novozymes (1.1% of net assets), a biotechnology company. ThyssenKrupp was sold. Brazilian real estate company BR Malls Participações (1.7% of net assets) was a meaningful contributor to performance.
Stock selection in the consumer discretionary and energy sectors hurt performance. In the former, Hong Kong-based manufacturer, exporter and distributor of retail goods Li & Fung (1.0% of net assets), casino firm Genting Singapore and Brazilian professional education company Anhanguera Educacional Participações all declined markedly in price. The latter two stocks were sold from the fund. Oil and gas exploration firms OGX Petróleo e Gás Participações and Pacific Rubiales Energy (2.3% and 1.1% of net assets, respectively) declined sharply as well.
In the financials sector, Citigroup (1.5% of net assets), which has a growing emerging markets presence, and Barclays were poor performers. We sold Barclays from the portfolio. Meanwhile, an overweight allocation to the weak-performing information technology sector and underweights in the strong consumer staples and health care sectors restrained fund performance.
Currency fluctuations hurt results
Fluctuations in currencies were an additional source of fund underperformance during the period. From early April through early August 2011, about half of the fund's Japanese yen-denominated holdings were hedged into U.S. dollars. This was a capital preservation strategy based on our view that the yen was significantly overvalued relative to the dollar on a purchasing power parity basis. However, the yen continued to appreciate versus the dollar and other major currencies. Thus, the hedge detracted from performance. We unwound the hedge after Standard & Poor's downgraded its rating on long-term U.S. government debt in August, as we thought currencies such as the yen might continue to strengthen against the dollar and euro.
4
Portfolio Managers' Report (continued) – Columbia Marsico International Opportunities Fund
Looking ahead
During the period, we increased the fund's allocation to the information technology and health care sectors, while reducing its weight in the materials, financials and industrials sectors. Within financials, we significantly cut the fund's exposure to European financial companies. In general, we are focusing on investments with company- and industry-specific growth drivers rather than macro-dependent growth catalysts. We are emphasizing firms that we believe are capable of compounding their earnings growth even in an environment of slower global economic growth. These firms have established global footprints, high quality assets, strong balance sheets, solid top-line growth and an ability to gain market share.
Source for all statistical data—Columbia Management Investment Advisers, LLC.
Source for all stock-specific commentary—Marsico Capital Management, LLC.
Portfolio characteristics and holdings are subject to change periodically and may not be representative of current characteristics and holdings. The outlook for this fund may differ from those presented for other Columbia Funds.
Equity investments are subject to stock market fluctuations that occur in response to economic and business developments.
International investing may involve certain risks, including currency fluctuations, risks associated with possible differences in financial accounting standards and other monetary and political risks. Significant levels of foreign taxes, including potentially confiscatory levels of taxation and withholding taxes, may also apply to some foreign investments.
Investing in emerging markets may involve greater risks than investing in more developed countries. In addition, concentration of investments in a single region may result in greater volatility.
Country breakdown1
(at 02/29/12) (%)
| Argentina | | | 2.5 | | |
| Belgium | | | 2.6 | | |
| Brazil | | | 4.0 | | |
| Canada | | | 4.3 | | |
| China | | | 7.0 | | |
| Denmark | | | 3.1 | | |
| France | | | 4.7 | | |
| Germany | | | 4.6 | | |
| Hong Kong | | | 2.8 | | |
| India | | | 0.9 | | |
| Ireland | | | 3.2 | | |
| Israel | | | 1.0 | | |
| Japan | | | 10.9 | | |
| Mexico | | | 1.0 | | |
| Netherlands | | | 5.5 | | |
| South Korea | | | 1.7 | | |
| Spain | | | 1.6 | | |
| Sweden | | | 3.1 | | |
| Switzerland | | | 11.6 | | |
| Taiwan | | | 2.0 | | |
| United Kingdom | | | 15.0 | | |
| United States | | | 5.1 | | |
| Other2 | | | 1.8 | | |
1Percentages indicated are based upon total investments (excluding Investments of Cash Collateral Received for Securities on Loan). The Fund's portfolio composition is subject to change.
2Includes investments in affiliated money market fund.
Top 10 holdings1
(at 02/29/12) (%)
Standard Chartered PLC
(United Kingdom) | | | 2.8 | | |
| Honda Motor Co., Ltd. (Japan) | | | 2.7 | | |
Anheuser-Bush InBev NV
(Belgium) | | | 2.6 | | |
Millicom International
Cellular SA, SDR (Sweden) | | | 2.6 | | |
Nestlé SA, Registered Shares
(Switzerland) | | | 2.6 | | |
Canadian National Railway Co.
(Canada) | | | 2.6 | | |
Roche Holding AG, Genusschein
Shares (Switzerland) | | | 2.6 | | |
Julius Baer Group Ltd.
(Switzerland) | | | 2.5 | | |
British Sky Broadcasting
Group PLC (United Kingdom) | | | 2.5 | | |
China Unicom Hong Kong Ltd.
(Hong Kong) | | | 2.5 | | |
1Percentages indicated are based upon total investments (excluding Investments of Cash Collateral Received for Securities on Loan and affiliated Money Market Fund).
For further detail about these holdings, please refer to the section entitled "Portfolio of Investments."
Fund holdings are as of the date given, are subject to change at any time, and are not recommendations to buy or sell any security.
5
Portfolio of Investments – Columbia Marsico International Opportunities Fund
February 29, 2012
(Percentages represent value of investments compared to net assets)
| Issuer | | Shares | | Value | |
| Common Stocks 98.3% | |
| ARGENTINA 2.5% | |
| Arcos Dorados Holdings, Inc., Class A | | | 277,259 | | | $ | 5,827,984 | | |
| MercadoLibre, Inc. | | | 92,364 | | | | 8,987,941 | | |
| Total | | | 14,815,925 | | |
| BELGIUM 2.6% | |
| Anheuser-Busch InBev NV | | | 229,233 | | | | 15,398,621 | | |
| BRAZIL 4.0% | |
| BR Malls Participacoes SA | | | 758,400 | | | | 9,839,657 | | |
| OGX Petroleo e Gas Participacoes SA(a) | | | 1,391,300 | | | | 13,797,548 | | |
| Total | | | 23,637,205 | | |
| CANADA 4.3% | |
| Canadian National Railway Co. | | | 194,994 | | | | 15,012,588 | | |
| IMAX Corp.(a)(b) | | | 151,884 | | | | 3,876,080 | | |
| Pacific Rubiales Energy Corp. | | | 234,282 | | | | 6,802,690 | | |
| Total | | | 25,691,358 | | |
| CHINA 7.0% | |
| Baidu, Inc., ADR(a) | | | 95,852 | | | | 13,102,968 | | |
| Belle International Holdings Ltd. | | | 4,705,000 | | | | 7,735,072 | | |
| China Unicom Hong Kong Ltd. | | | 8,002,000 | | | | 14,303,076 | | |
| CNOOC Ltd. | | | 2,681,300 | | | | 6,088,182 | | |
| Total | | | 41,229,298 | | |
| DENMARK 3.1% | |
| Novo Nordisk A/S, Class B | | | 84,386 | | | | 11,832,852 | | |
| Novozymes A/S, Class B(b) | | | 212,469 | | | | 6,320,309 | | |
| Total | | | 18,153,161 | | |
| FRANCE 4.7% | |
| Pernod-Ricard SA | | | 60,613 | | | | 6,271,407 | | |
| Publicis Groupe SA | | | 111,396 | | | | 6,094,573 | | |
| Schneider Electric SA | | | 140,404 | | | | 9,541,940 | | |
| Unibail-Rodamco SE | | | 31,032 | | | | 5,994,868 | | |
| Total | | | 27,902,788 | | |
| GERMANY 4.6% | |
| Adidas AG | | | 115,002 | | | | 9,036,745 | | |
| Bayerische Motoren Werke AG | | | 126,619 | | | | 11,712,454 | | |
| Infineon Technologies AG(a) | | | 631,716 | | | | 6,388,850 | | |
| Total | | | 27,138,049 | | |
| HONG KONG 2.8% | |
| Hang Lung Properties Ltd. | | | 2,837,000 | | | | 10,693,062 | | |
| Li & Fung Ltd. | | | 2,670,000 | | | | 6,088,518 | | |
| Total | | | 16,781,580 | | |
| INDIA 0.9% | |
| ICICI Bank Ltd., ADR | | | 150,548 | | | | 5,464,892 | | |
| IRELAND 3.2% | |
| Accenture PLC, Class A | | | 203,320 | | | | 12,105,673 | | |
| CRH PLC | | | 323,478 | | | | 6,937,093 | | |
| Total | | | 19,042,766 | | |
| ISRAEL 1.0% | |
| Check Point Software Technologies Ltd.(a)(b) | | | 101,920 | | | | 5,927,667 | | |
| JAPAN 10.9% | |
| Canon, Inc. | | | 206,200 | | | | 9,403,388 | | |
| FANUC CORP. | | | 66,200 | | | | 12,034,190 | | |
| Honda Motor Co., Ltd. | | | 404,400 | | | | 15,532,111 | | |
| Hoya Corp. | | | 267,300 | | | | 6,241,078 | | |
| Marubeni Corp. | | | 856,000 | | | | 6,120,627 | | |
| Rakuten, Inc. | | | 8,882 | | | | 8,827,954 | | |
| Sumitomo Realty & Development Co., Ltd. | | | 270,000 | | | | 6,328,396 | | |
| Total | | | 64,487,744 | | |
| Issuer | | Shares | | Value | |
| Common Stocks (continued) | |
| MEXICO 1.0% | |
| Wal-Mart de Mexico SAB de CV, Class V(b) | | | 1,970,300 | | | $ | 6,132,830 | | |
| NETHERLANDS 5.5% | |
| ASML Holding NV | | | 196,447 | | | | 9,029,555 | | |
| LyondellBasell Industries NV, Class A | | | 172,612 | | | | 7,453,386 | | |
| Sensata Technologies Holding NV(a)(b) | | | 363,388 | | | | 11,773,772 | | |
| Yandex NV, Class A(a) | | | 197,117 | | | | 4,198,592 | | |
| Total | | | 32,455,305 | | |
| SOUTH KOREA 1.7% | |
| Samsung Electronics Co., Ltd. | | | 9,613 | | | | 10,337,473 | | |
| SPAIN 1.6% | |
| Inditex SA | | | 101,097 | | | | 9,335,467 | | |
| SWEDEN 3.1% | |
| Elekta AB, Class B | | | 65,066 | | | | 3,048,371 | | |
| Millicom International Cellular SA, SDR | | | 136,726 | | | | 15,321,957 | | |
| Total | | | 18,370,328 | | |
| SWITZERLAND 11.6% | |
| Julius Baer Group Ltd. | | | 377,196 | | | | 14,780,146 | | |
| Nestlé SA, Registered Shares | | | 247,432 | | | | 15,124,339 | | |
| Roche Holding AG, Genusschein Shares | | | 85,571 | | | | 14,897,129 | | |
| Swatch Group AG (The) | | | 26,540 | | | | 12,033,501 | | |
| Xstrata PLC | | | 628,027 | | | | 11,989,538 | | |
| Total | | | 68,824,653 | | |
| TAIWAN 2.0% | |
Taiwan Semiconductor
Manufacturing Co., Ltd., ADR | | | 815,554 | | | | 11,841,844 | | |
| UNITED KINGDOM 15.1 | |
| ARM Holdings PLC | | | 824,962 | | | | 7,474,301 | | |
| British Sky Broadcasting Group PLC | | | 1,369,768 | | | | 14,600,399 | | |
| Experian PLC | | | 604,156 | | | | 9,087,691 | | |
| Reed Elsevier PLC | | | 686,951 | | | | 6,016,251 | | |
| Rolls-Royce Holdings PLC(a) | | | 555,532 | | | | 7,194,099 | | |
| Shire PLC | | | 276,913 | | | | 9,683,089 | | |
| Standard Chartered PLC | | | 643,441 | | | | 16,557,544 | | |
| Tullow Oil PLC | | | 533,923 | | | | 12,528,917 | | |
| Weir Group PLC (The) | | | 174,384 | | | | 5,842,623 | | |
| Total | | | 88,984,914 | | |
| UNITED STATES 5.1% | |
| Citigroup, Inc. | | | 275,183 | | | | 9,169,098 | | |
| Las Vegas Sands Corp.(a) | | | 124,524 | | | | 6,924,780 | | |
| Perrigo Co. | | | 29,723 | | | | 3,063,252 | | |
| Wynn Resorts Ltd. | | | 94,980 | | | | 11,258,929 | | |
| Total | | | 30,416,059 | | |
Total Common Stocks
(Cost: $467,172,769) | | $ | 582,369,927 | | |
| Money Market Funds 1.8% | |
| Columbia Short-Term Cash Fund, 0.166%(c)(d) | | | 10,488,856 | | | $ | 10,488,856 | | |
Total Money Market Funds
(Cost: $10,488,856) | | $ | 10,488,856 | | |
The Accompanying Notes to Financial Statements are an integral part of this statement.
6
Columbia Marsico International Opportunities Fund
February 29, 2012
(Percentages represent value of investments compared to net assets)
| Issuer | | Effective
Yield | | Par/
Principal/
Shares | | Value | |
| Investments of Cash Collateral Received for Securities on Loan 2.5% | |
| Repurchase Agreements 2.5% | |
Credit Suisse Securities (USA) LLC
dated 02/29/12, matures 03/01/12,
repurchase price $7,761,107(e) | | | 0.160 | % | | $ | 7,761,073 | | | $ | 7,761,073 | | |
Morgan Stanley
dated 02/29/12, matures 03/01/12,
repurchase price $5,000,025(e) | | | 0.180 | % | | | 5,000,000 | | | | 5,000,000 | | |
Pershing LLC
dated 02/29/12, matures 03/01/12,
repurchase price $2,000,016(e) | | | 0.290 | % | | | 2,000,000 | | | | 2,000,000 | | |
| Total | | | 14,761,073 | | |
Total Investments of Cash Collateral Received for Securities
on Loan
(Cost: $14,761,073) | | $ | 14,761,073 | | |
Total Investments
(Cost: $492,422,698) | | | | | | | | | | $ | 607,619,856 | | |
| Other Assets & Liabilities, Net | | | | | | | | | | | (15,585,625 | ) | |
| Net Assets | | $ | 592,034,231 | | |
Investments in Derivatives
Forward Foreign Currency Exchange Contracts Open at February 29, 2012
| Counterparty | | Exchange Date | | Currency to be
Delivered | | Currency to be
Received | | Unrealized
Appreciation | | Unrealized
Depreciation | |
| UBS Securities LLC | | March 1, 2012 | | | 318,019
(USD) | | | | 25,488,098
(JPY) | | | $ | —
| | | $ | (3,474
| ) | |
| J.P. Morgan Securities, Inc. | | March 5, 2012 | | | 2,644,326
(CHF) | | | | 2,925,852
(USD) | | | | 2,975
| | | | —
| | |
| J.P. Morgan Securities, Inc. | | March 5, 2012 | | | 457,409
(USD) | | | | 287,124
(GBP) | | | | —
| | | | (623
| ) | |
| Total | | | | | | | | $ | 2,975 | | | $ | (4,097 | ) | |
Summary of Investments in Securities by Industry (unaudited)
The following table represents the portfolio investments of the Fund by industry classifications as a percentage of net assets at February 29, 2012:
| Industry | | Percentage of
Net Assets | |
Value | |
| Aerospace & Defense | | | 1.2 | % | | $ | 7,194,099 | | |
| Automobiles | | | 4.6 | | | | 27,244,565 | | |
| Beverages | | | 3.7 | | | | 21,670,029 | | |
| Capital Markets | | | 2.5 | | | | 14,780,146 | | |
| Chemicals | | | 2.3 | | | | 13,773,695 | | |
| Commercial Banks | | | 3.7 | | | | 22,022,436 | | |
| Construction Materials | | | 1.2 | | | | 6,937,093 | | |
| Distributors | | | 1.0 | | | | 6,088,518 | | |
| Diversified Financial Services | | | 1.5 | | | | 9,169,098 | | |
| Diversified Telecommunication Services | | | 2.4 | | | | 14,303,076 | | |
| Electrical Equipment | | | 3.6 | | | | 21,315,711 | | |
Electronic Equipment, Instruments &
Components | | | 1.1 | | | | 6,241,078 | | |
| Food & Staples Retailing | | | 1.0 | | | | 6,132,830 | | |
| Food Products | | | 2.6 | | | | 15,124,339 | | |
| Health Care Equipment & Supplies | | | 0.5 | | | | 3,048,371 | | |
| Hotels, Restaurants & Leisure | | | 4.1 | | | | 24,011,693 | | |
| Internet & Catalog Retail | | | 1.5 | | | | 8,827,953 | | |
Summary of Investments in Securities by Industry (cont.)
| Industry | | Percentage of
Net Assets | |
Value | |
| Internet Software & Services | | | 4.4 | % | | $ | 26,289,501 | | |
| IT Services | | | 2.0 | | | | 12,105,673 | | |
| Machinery | | | 3.0 | | | | 17,876,813 | | |
| Media | | | 5.2 | | | | 30,587,303 | | |
| Metals & Mining | | | 2.0 | | | | 11,989,538 | | |
| Office Electronics | | | 1.6 | | | | 9,403,388 | | |
| Oil, Gas & Consumable Fuels | | | 6.6 | | | | 39,217,338 | | |
| Pharmaceuticals | | | 6.7 | | | | 39,476,322 | | |
| Professional Services | | | 1.5 | | | | 9,087,690 | | |
| Real Estate Investment Trusts (REITs) | | | 1.0 | | | | 5,994,868 | | |
| Real Estate Management & Development | | | 4.5 | | | | 26,861,115 | | |
| Road & Rail | | | 2.5 | | | | 15,012,588 | | |
| Semiconductors & Semiconductor Equipment | | | 7.6 | | | | 45,072,024 | | |
| Software | | | 1.0 | | | | 5,927,667 | | |
| Specialty Retail | | | 2.9 | | | | 17,070,538 | | |
| Textiles, Apparel & Luxury Goods | | | 3.6 | | | | 21,070,245 | | |
| Trading Companies & Distributors | | | 1.0 | | | | 6,120,628 | | |
| Wireless Telecommunication Services | | | 2.6 | | | | 15,321,958 | | |
| Other(1) | | | 4.3 | | | | 25,249,929 | | |
| Total | | | | $ | 607,619,856 | | |
(1) Includes affiliated money market funds.
The Accompanying Notes to Financial Statements are an integral part of this statement.
7
Columbia Marsico International Opportunities Fund
February 29, 2012
Notes to Portfolio of Investments
(a) Non-income producing.
(b) At February 29, 2012, security was partially or fully on loan.
(c) The rate shown is the seven-day current annualized yield at February 29, 2012.
(d) Investments in affiliates during the year ended February 29, 2012:
| Issuer | | Beginning
Cost | | Purchase
Cost | | Sales Cost/
Proceeds
from Sales | | Realized
Gain/Loss | | Ending
Cost | | Dividends
or Interest
Income | | Value | |
Columbia Short-Term
Cash Fund | | $ | — | | | $ | 282,769,928 | | | $ | (272,281,072 | ) | | $ | — | | | $ | 10,488,856 | | | $ | 12,972 | | | $ | 10,488,856 | | |
(e) The table below represents securities received as collateral for repurchase agreements. This collateral is deposited with the Fund's custodian and, pursuant to the terms of the repurchase agreement, must have an aggregate market value greater than or equal to the repurchase price plus accrued interest at all times. The value of securities and/or cash held as collateral for repurchase agreements is monitored on a daily basis to ensure the proper level of collateral.
Credit Suisse Securities (USA) LLC (0.160%)
| Security Description | | Value | |
| Ginnie Mae I Pool | | $ | 5,556,174 | | |
| Ginnie Mae II Pool | | | 2,360,138 | | |
| Total Market Value of Collateral Securities | | $ | 7,916,312 | | |
Morgan Stanley (0.180%)
| Security Description | | Value | |
| Freddie Mac Gold Pool | | $ | 2,725,246 | | |
| Freddie Mac Non Gold Pool | | | 2,374,754 | | |
| Total Market Value of Collateral Securities | | $ | 5,100,000 | | |
Pershing LLC (0.290%)
| Security Description | | Value | |
| Fannie Mae Pool | | $ | 326,507 | | |
| Fannie Mae REMICS | | | 275,343 | | |
| Fannie Mae-Aces | | | 2,775 | | |
| Federal Farm Credit Bank | | | 24,674 | | |
| Federal Home Loan Banks | | | 26,538 | | |
| Federal Home Loan Mortgage Corp | | | 62,556 | | |
| Federal National Mortgage Association | | | 77,156 | | |
| Freddie Mac Gold Pool | | | 132,490 | | |
| Freddie Mac Non Gold Pool | | | 37,004 | | |
| Freddie Mac Reference REMIC | | | 9 | | |
| Freddie Mac REMICS | | | 256,456 | | |
| Ginnie Mae I Pool | | | 334,671 | | |
| Ginnie Mae II Pool | | | 298,381 | | |
| Government National Mortgage Association | | | 107,067 | | |
| United States Treasury Note/Bond | | | 73,837 | | |
| United States Treasury Strip Coupon | | | 4,536 | | |
| Total Market Value of Collateral Securities | | $ | 2,040,000 | | |
Abbreviation Legend
ADR American Depositary Receipt
SDR Swedish Depositary Receipt
The Accompanying Notes to Financial Statements are an integral part of this statement.
8
Columbia Marsico International Opportunities Fund
February 29, 2012
Currency Legend
CHF Swiss Franc
GBP Pound Sterling
JPY Japanese Yen
USD US Dollar
Fair Value Measurements
Generally accepted accounting principles (GAAP) require disclosure regarding the inputs and valuation techniques used to measure fair value and any changes in valuation inputs or techniques. In addition, investments shall be disclosed by major category.
The Fund categorizes its fair value measurements according to a three-level hierarchy that maximizes the use of observable inputs and minimizes the use of unobservable inputs by prioritizing that the most observable input be used when available. Observable inputs are those that market participants would use in pricing an investment based on market data obtained from sources independent of the reporting entity. Unobservable inputs are those that reflect the Fund's assumptions about the information market participants would use in pricing an investment. An investment's level within the fair value hierarchy is based on the lowest level of any input that is deemed significant to the asset or liability's fair value measurement. The input levels are not necessarily an indication of the risk or liquidity associated with investments at that level. For example, certain U.S. government securities are generally high quality and liquid, however, they are reflected as Level 2 because the inputs used to determine fair value may not always be quoted prices in an active market.
Fair value inputs are summarized in the three broad levels listed below:
• Level 1 — Valuations based on quoted prices for investments in active markets that the Fund has the ability to access at the measurement date (including NAV for open-end mutual funds). Valuation adjustments are not applied to Level 1 investments.
• Level 2 — Valuations based on other significant observable inputs (including quoted prices for similar securities, interest rates, prepayment speeds, credit risks, etc.).
• Level 3 — Valuations based on significant unobservable inputs (including the Fund's own assumptions and judgment in determining the fair value of investments).
Inputs that are used in determining fair value of an investment may include price information, credit data, volatility statistics, and other factors. These inputs can be either observable or unobservable. The availability of observable inputs can vary between investments, and is affected by various factors such as the type of investment, and the volume and level of activity for that investment or similar investments in the marketplace. The inputs will be considered by the Investment Manager, along with any other relevant factors in the calculation of an investment's fair value. The Fund uses prices and inputs that are current as of the measurement date, which may include periods of market dislocations. During these periods, the availability of prices and inputs may be reduced for many investments. This condition could cause an investment to be reclassified between the various levels within the hierarchy.
Foreign equity securities actively traded in markets where there is a significant delay in the local close relative to the New York Stock Exchange (NYSE) are classified as Level 2. The values of these securities may include an adjustment to reflect the impact of significant market movements following the close of local trading, as described in Note 2 to the financial statements — Security Valuation.
Investments falling into the Level 3 category are primarily supported by quoted prices from brokers and dealers participating in the market for those investments. However, these may be classified as Level 3 investments due to lack of market transparency and corroboration to support these quoted prices. Additionally, valuation models may be used as the pricing source for any remaining investments classified as Level 3. These models rely on one or more significant unobservable inputs and/or significant assumptions by the Investment Manager. Inputs used in valuations may include, but are not limited to, financial statement analysis, capital account balances, discount rates and estimated cash flows, and comparable company data.
The Accompanying Notes to Financial Statements are an integral part of this statement.
9
Columbia Marsico International Opportunities Fund
February 29, 2012
Fair Value Measurements (continued)
The following table is a summary of the inputs used to value the Fund's investments as of February 29, 2012:
| | | Fair Value at February 29, 2012 | |
| Description(a) | | Level 1
Quoted Prices
in Active
Markets for
Identical Assets | | Level 2
Other
Significant
Observable
Inputs(b) | | Level 3
Significant
Unobservable
Inputs | | Total | |
| Equity Securities | |
| Common Stocks | |
| Consumer Discretionary | | $ | 27,887,773 | | | $ | 107,013,043 | | | $ | — | | | $ | 134,900,816 | | |
| Consumer Staples | | | 6,132,830 | | | | 36,794,368 | | | | — | | | | 42,927,198 | | |
| Energy | | | 20,600,238 | | | | 18,617,100 | | | | — | | | | 39,217,338 | | |
| Financials | | | 24,473,648 | | | | 54,354,016 | | | | — | | | | 78,827,664 | | |
| Health Care | | | 3,063,252 | | | | 39,461,440 | | | | — | | | | 42,524,692 | | |
| Industrials | | | 26,786,359 | | | | 49,821,169 | | | | — | | | | 76,607,528 | | |
| Information Technology | | | 56,164,685 | | | | 48,874,646 | | | | — | | | | 105,039,331 | | |
| Materials | | | 7,453,386 | | | | 25,246,941 | | | | — | | | | 32,700,327 | | |
| Telecommunication Services | | | — | | | | 29,625,033 | | | | — | | | | 29,625,033 | | |
| Total Equity Securities | | | 172,562,171 | | | | 409,807,756 | | | | — | | | | 582,369,927 | | |
| Other | |
| Money Market Funds | | | 10,488,856 | | | | — | | | | — | | | | 10,488,856 | | |
| Investments of Cash Collateral Received for Securities on Loan | | | — | | | | 14,761,073 | | | | — | | | | 14,761,073 | | |
| Total Other | | | 10,488,856 | | | | 14,761,073 | | | | — | | | | 25,249,929 | | |
| Investments in Securities | | | 183,051,027 | | | | 424,568,829 | | | | — | | | | 607,619,856 | | |
| Derivatives(c) | |
| Assets | |
| Forward Foreign Currency Exchange Contracts | | | — | | | | 2,975 | | | | — | | | | 2,975 | | |
| Liabilities | |
| Forward Foreign Currency Exchange Contracts | | | — | | | | (4,097 | ) | | | — | | | | (4,097 | ) | |
| Total | | $ | 183,051,027 | | | $ | 424,567,707 | | | $ | — | | | $ | 607,618,734 | | |
The Fund's assets assigned to the Level 2 input category are generally valued using the market approach, in which a security's value is determined through reference to prices and information from market transactions for similar or identical assets. These assets include certain foreign securities for which a third party statistical pricing service may be employed for purposes of fair market valuation. The models utilized by the third party statistical pricing service take into account a security's correlation to available market data including, but not limited to, intraday index, ADR, and ETF movements.
(a) See the Portfolio of Investments for all investment classifications not indicated in the table.
(b) There were no significant transfers between Levels 1 and 2 during the period.
(c) Derivative instruments are valued at unrealized appreciation (depreciation).
The Accompanying Notes to Financial Statements are an integral part of this statement.
10
Statement of Assets and Liabilities – Columbia Marsico International Opportunities Fund
February 29, 2012
| Assets | |
| Investments, at value* | |
| Unaffiliated issuers (identified cost $467,172,769) | | $ | 582,369,927 | | |
| Affiliated issuers (identified cost $10,488,856) | | | 10,488,856 | | |
| Investment of cash collateral received for securities on loan | |
| Repurchase agreements (identified cost $14,761,073) | | | 14,761,073 | | |
| Total investments (identified cost $492,422,698) | | | 607,619,856 | | |
| Unrealized appreciation on forward foreign currency exchange contracts | | | 2,975 | | |
| Receivable for: | |
| Investments sold | | | 3,141,358 | | |
| Capital shares sold | | | 142,677 | | |
| Dividends | | | 228,514 | | |
| Interest | | | 2,147 | | |
| Reclaims | | | 212,965 | | |
| Prepaid expense | | | 13,846 | | |
| Total assets | | | 611,364,338 | | |
| Liabilities | |
| Due upon return of securities on loan | | | 14,761,073 | | |
| Unrealized depreciation on forward foreign currency exchange contracts | | | 4,097 | | |
| Payable for: | |
| Investments purchased | | | 3,048,948 | | |
| Capital shares purchased | | | 1,068,318 | | |
| Investment management fees | | | 13,088 | | |
| Distribution and service fees | | | 1,653 | | |
| Transfer agent fees | | | 110,375 | | |
| Administration fees | | | 3,599 | | |
| Chief compliance officer expenses | | | 30 | | |
| Other expenses | | | 318,926 | | |
| Total liabilities | | | 19,330,107 | | |
| Net assets applicable to outstanding capital stock | | $ | 592,034,231 | | |
The Accompanying Notes to Financial Statements are an integral part of this statement.
11
Statement of Assets and Liabilities (continued) – Columbia Marsico International Opportunities Fund
February 29, 2012
| Represented by | |
| Paid-in capital | | $ | 1,213,567,354 | | |
| Excess of distributions over net investment income | | | (5,656,758 | ) | |
| Accumulated net realized loss | | | (731,062,114 | ) | |
| Unrealized appreciation (depreciation) on: | |
| Investments | | | 115,197,158 | | |
| Foreign currency translations | | | (10,287 | ) | |
| Forward foreign currency exchange contracts | | | (1,122 | ) | |
| Total — representing net assets applicable to outstanding capital stock | | $ | 592,034,231 | | |
| *Value of securities on loan | | $ | 14,162,596 | | |
| Net assets applicable to outstanding shares | |
| Class A | | $ | 99,757,318 | | |
| Class B | | $ | 8,381,219 | | |
| Class C | | $ | 25,608,152 | | |
| Class I | | $ | 2,581 | | |
| Class R | | $ | 1,640,388 | | |
| Class Z | | $ | 456,644,573 | | |
| Shares outstanding | |
| Class A | | | 8,874,602 | | |
| Class B | | | 791,920 | | |
| Class C | | | 2,417,915 | | |
| Class I | | | 224 | | |
| Class R | | | 146,564 | | |
| Class Z | | | 39,899,843 | | |
| Net asset value per share | |
| Class A(a) | | $ | 11.24 | | |
| Class B | | $ | 10.58 | | |
| Class C | | $ | 10.59 | | |
| Class I | | $ | 11.52 | | |
| Class R | | $ | 11.19 | | |
| Class Z | | $ | 11.44 | | |
(a) The maximum offering price per share for Class A is $11.93. The offering price is calculated by dividing the net asset value by 1.0 minus the maximum sales charge of 5.75%.
The Accompanying Notes to Financial Statements are an integral part of this statement.
12
Statement of Operations – Columbia Marsico International Opportunities Fund
Year ended February 29, 2012
| Net investment income | |
| Income: | |
| Dividends | | $ | 15,466,786 | | |
| Interest | | | 3,041 | | |
| Dividends from affiliates | | | 12,972 | | |
| Income from securities lending — net | | | 70,677 | | |
| Foreign taxes withheld | | | (1,529,117 | ) | |
| Total income | | | 14,024,359 | | |
| Expenses: | |
| Investment management fees | | | 6,822,834 | | |
| Distribution fees | |
| Class B | | | 81,657 | | |
| Class C | | | 232,453 | | |
| Class R | | | 11,301 | | |
| Service fees | |
| Class B | | | 27,219 | | |
| Class C | | | 77,485 | | |
| Distribution and service fees — Class A | | | 280,993 | | |
| Transfer agent fees | |
| Class A | | | 210,460 | | |
| Class B | | | 19,397 | | |
| Class C | | | 58,809 | | |
| Class R | | | 4,017 | | |
| Class Z | | | 1,267,710 | | |
| Administration fees | | | 1,825,542 | | |
| Compensation of board members | | | 27,125 | | |
| Pricing and bookkeeping fees | | | 54,903 | | |
| Custodian fees | | | 303,030 | | |
| Printing and postage fees | | | 102,082 | | |
| Registration fees | | | 67,870 | | |
| Professional fees | | | 78,716 | | |
| Chief compliance officer expenses | | | 198 | | |
| Other | | | 43,408 | | |
| Total expenses | | | 11,597,209 | | |
| Fees waived or expenses reimbursed by Investment Manager and its affiliates | | | (100 | ) | |
| Expense reductions | | | (1,151 | ) | |
| Total net expenses | | | 11,595,958 | | |
| Net investment income | | | 2,428,401 | | |
| Realized and unrealized gain (loss) — net | |
| Net realized gain (loss) on: | |
| Investments | | | 46,904,319 | | |
| Foreign currency translations | | | (5,111,672 | ) | |
| Forward foreign currency exchange contracts | | | (3,362,094 | ) | |
| Net realized gain | | | 38,430,553 | | |
| Net change in unrealized appreciation (depreciation) on: | |
| Investments | | | (139,690,247 | ) | |
| Foreign currency translations | | | (141,662 | ) | |
| Forward foreign currency exchange contracts | | | (1,122 | ) | |
| Net change in unrealized depreciation | | | (139,833,031 | ) | |
| Net realized and unrealized loss | | | (101,402,478 | ) | |
| Net decrease in net assets from operations | | $ | (98,974,077 | ) | |
The Accompanying Notes to Financial Statements are an integral part of this statement.
13
Statement of Changes in Net Assets – Columbia Marsico International Opportunities Fund
| | | Year ended
February 29,
2012 | | Year ended
February 28,
2011(a) | |
| Operations | |
| Net investment income | | $ | 2,428,401 | | | $ | 6,866,186 | | |
| Net realized gain | | | 38,430,553 | | | | 108,195,264 | | |
| Net change in unrealized appreciation (depreciation) | | | (139,833,031 | ) | | | 111,833,971 | | |
| Net increase (decrease) in net assets resulting from operations | | | (98,974,077 | ) | | | 226,895,421 | | |
| Distributions to shareholders from: | |
| Class A | | | — | | | | (2,126,667 | ) | |
| Class B | | | — | | | | (145,433 | ) | |
| Class C | | | — | | | | (384,816 | ) | |
| Class I | | | — | | | | (45 | ) | |
| Class R | | | — | | | | (47,942 | ) | |
| Class Z | | | — | | | | (16,573,174 | ) | |
| Total distributions to shareholders | | | — | | | | (19,278,077 | ) | |
| Increase (decrease) in net assets from share transactions | | | (488,348,486 | ) | | | (231,232,918 | ) | |
| Total decrease in net assets | | | (587,322,563 | ) | | | (23,615,574 | ) | |
| Net assets at beginning of year | | | 1,179,356,794 | | | | 1,202,972,368 | | |
| Net assets at end of year | | $ | 592,034,231 | | | $ | 1,179,356,794 | | |
| Excess of distributions over net investment income | | $ | (5,656,758 | ) | | $ | (17,430,894 | ) | |
(a) Class I shares are for the period from September 27, 2010 (commencement of operations) to February 28, 2011.
The Accompanying Notes to Financial Statements are an integral part of this statement.
14
Statement of Changes in Net Assets (continued) – Columbia Marsico International Opportunities Fund
| | | Year ended February 29,
2012 | | Year ended February 28,
2011(a) | |
| | | Shares | | Dollars ($) | | Shares | | Dollars ($) | |
| Capital stock activity | |
| Class A shares | |
| Subscriptions(b) | | | 1,273,100 | | | | 13,913,096 | | | | 2,119,700 | | | | 22,676,105 | | |
| Distributions reinvested | | | — | | | | — | | | | 146,443 | | | | 1,688,472 | | |
| Redemptions | | | (4,255,513 | ) | | | (46,769,929 | ) | | | (7,292,262 | ) | | | (77,771,444 | ) | |
| Net decrease | | | (2,982,413 | ) | | | (32,856,833 | ) | | | (5,026,119 | ) | | | (53,406,867 | ) | |
| Class B shares | |
| Subscriptions | | | 8,257 | | | | 87,801 | | | | 14,408 | | | | 152,091 | | |
| Distributions reinvested | | | — | | | | — | | | | 7,480 | | | | 81,905 | | |
| Redemptions(b) | | | (526,165 | ) | | | (5,413,370 | ) | | | (585,741 | ) | | | (5,911,646 | ) | |
| Net decrease | | | (517,908 | ) | | | (5,325,569 | ) | | | (563,853 | ) | | | (5,677,650 | ) | |
| Class C shares | |
| Subscriptions | | | 64,246 | | | | 671,759 | | | | 222,454 | | | | 2,296,758 | | |
| Distributions reinvested | | | — | | | | — | | | | 26,131 | | | | 286,394 | | |
| Redemptions | | | (1,150,108 | ) | | | (11,781,850 | ) | | | (1,418,826 | ) | | | (14,386,031 | ) | |
| Net decrease | | | (1,085,862 | ) | | | (11,110,091 | ) | | | (1,170,241 | ) | | | (11,802,879 | ) | |
| Class I shares | |
| Subscriptions | | | 479 | | | | 5,731 | | | | 3,437,886 | | | | 40,775,054 | | |
| Redemptions | | | (2,806,050 | ) | | | (33,452,888 | ) | | | (632,091 | ) | | | (7,449,298 | ) | |
| Net increase (decrease) | | | (2,805,571 | ) | | | (33,447,157 | ) | | | 2,805,795 | | | | 33,325,756 | | |
| Class R shares | |
| Subscriptions | | | 20,559 | | | | 222,038 | | | | 61,056 | | | | 665,184 | | |
| Distributions reinvested | | | — | | | | — | | | | 4,027 | | | | 46,355 | | |
| Redemptions | | | (126,968 | ) | | | (1,340,977 | ) | | | (145,225 | ) | | | (1,633,266 | ) | |
| Net decrease | | | (106,409 | ) | | | (1,118,939 | ) | | | (80,142 | ) | | | (921,727 | ) | |
| Class Z shares | |
| Subscriptions | | | 6,287,545 | | | | 72,299,881 | | | | 15,136,249 | | | | 163,525,915 | | |
| Distributions reinvested | | | — | | | | — | | | | 530,078 | | | | 6,179,224 | | |
| Redemptions | | | (44,241,556 | ) | | | (476,789,778 | ) | | | (33,235,664 | ) | | | (362,454,690 | ) | |
| Net decrease | | | (37,954,011 | ) | | | (404,489,897 | ) | | | (17,569,337 | ) | | | (192,749,551 | ) | |
| Total net decrease | | | (45,452,174 | ) | | | (488,348,486 | ) | | | (21,603,897 | ) | | | (231,232,918 | ) | |
(a) Class I shares are for the period from September 27, 2010 (commencement of operations) to February 28, 2011.
(b) Includes conversions of Class B to Class A shares, if any.
The Accompanying Notes to Financial Statements are an integral part of this statement.
15
Financial Highlights – Columbia Marsico International Opportunities Fund
The following tables are intended to help you understand the Fund's financial performance. Certain information reflects financial results for a single share of class held for the periods shown. Per share net investment income (loss) amounts are calculated based on average shares outstanding during the period. Total returns assume reinvestment of all dividends and distributions. Total returns do not reflect payment of sales charges, it any, and are not annualized for periods of less than one year.
| | | Year ended
Feb. 29, | | Year ended Feb. 28, | | Year ended
Feb. 29, | |
| | | 2012 | | 2011 | | 2010 | | 2009 | | 2008 | |
| Class A | |
| Per share data | |
| Net asset value, beginning of period | | $ | 11.96 | | | $ | 10.00 | | | $ | 6.76 | | | $ | 14.58 | | | $ | 14.85 | | |
| Income from investment operations: | |
| Net investment income | | | 0.01 | | | | 0.05 | | | | 0.05 | | | | 0.12 | (a) | | | 0.14 | (b) | |
| Net realized and unrealized gain (loss) | | | (0.73 | ) | | | 2.08 | | | | 3.44 | | | | (7.82 | ) | | | 1.54 | | |
| Total from investment operations | | | (0.72 | ) | | | 2.13 | | | | 3.49 | | | | (7.70 | ) | | | 1.68 | | |
| Less distributions to shareholders from: | |
| Net investment income | | | — | | | | (0.17 | ) | | | (0.25 | ) | | | — | | | | (0.16 | ) | |
| Net realized gains | | | — | | | | — | | | | — | | | | (0.12 | ) | | | (1.79 | ) | |
| Total distributions to shareholders | | | — | | | | (0.17 | ) | | | (0.25 | ) | | | (0.12 | ) | | | (1.95 | ) | |
| Redemption fees: | |
| Redemption fees added to paid-in capital | | | — | | | | — | | | | 0.00 | (c) | | | 0.00 | (c) | | | 0.00 | (c) | |
| Net asset value, end of period | | $ | 11.24 | | | $ | 11.96 | | | $ | 10.00 | | | $ | 6.76 | | | $ | 14.58 | | |
| Total return | | | (6.02 | %) | | | 21.39 | % | | | 51.97 | % | | | (53.26 | %) | | | 10.55 | % | |
| Ratios to average net assets(d) | |
| Expenses prior to fees waived or expenses reimbursed (including interest expense) | | | 1.53 | % | | | 1.51 | %(e) | | | 1.47 | % | | | 1.52 | % | | | 1.44 | % | |
| Net expenses after fees waived or expenses reimbursed (including interest expense)(f) | | | 1.53 | %(g) | | | 1.51 | %(e)(g) | | | 1.47 | %(g) | | | 1.52 | %(g) | | | 1.44 | %(g) | |
| Expenses prior to fees waived or expenses reimbursed (excluding interest expense) | | | 1.53 | % | | | 1.51 | % | | | 1.47 | % | | | 1.52 | % | | | 1.44 | % | |
| Net expenses after fees waived or expenses reimbursed (excluding interest expense)(f) | | | 1.53 | %(g) | | | 1.51 | %(g) | | | 1.47 | %(g) | | | 1.52 | %(g) | | | 1.44 | %(g) | |
| Net investment income | | | 0.06 | %(g) | | | 0.47 | %(g) | | | 0.50 | %(g) | | | 1.05 | %(g) | | | 0.90 | %(g) | |
| Supplemental data | |
| Net assets, end of period (in thousands) | | $ | 99,757 | | | $ | 141,821 | | | $ | 168,801 | | | $ | 198,012 | | | $ | 599,356 | | |
| Portfolio turnover | | | 86 | % | | | 105 | % | | | 116 | % | | | 117 | % | | | 116 | % | |
Notes to Financial Highlights
(a) Net investment income per share reflects special dividends. The effect of these dividends amounted to $0.03 per share.
(b) Net investment income per share reflects special dividends. The effect of these dividends amounted to $0.04 per share.
(c) Rounds to less than $0.01.
(d) In addition to the fees and expenses which the Fund bears directly, the Fund indirectly bears a pro rata share of the fees and expenses of the acquired funds in which it invests. Such indirect expenses are not included in the reported expense ratios.
(e) Includes interest expense which rounds to less than 0.01%.
(f) The Investment Manager and certain of its affiliates agreed to waive/reimburse certain fees and expenses, if applicable.
(g) The benefits derived from expense reductions had an impact of less than 0.01%.
The Accompanying Notes to Financial Statements are an integral part of this statement.
16
Financial Highlights (continued) – Columbia Marsico International Opportunities Fund
| | | Year ended
Feb. 29, | | Year ended Feb. 28, | | Year ended
Feb. 29, | |
| | | 2012 | | 2011 | | 2010 | | 2009 | | 2008 | |
| Class B | |
| Per share data | |
| Net asset value, beginning of period | | $ | 11.35 | | | $ | 9.51 | | | $ | 6.38 | | | $ | 13.87 | | | $ | 14.23 | | |
| Income from investment operations: | |
| Net investment income (loss) | | | (0.07 | ) | | | (0.03 | ) | | | (0.03 | ) | | | 0.03 | (a) | | | 0.03 | (b) | |
| Net realized and unrealized gain (loss) | | | (0.70 | ) | | | 1.98 | | | | 3.27 | | | | (7.40 | ) | | | 1.46 | | |
| Total from investment operations | | | (0.77 | ) | | | 1.95 | | | | 3.24 | | | | (7.37 | ) | | | 1.49 | | |
| Less distributions to shareholders from: | |
| Net investment income | | | — | | | | (0.11 | ) | | | (0.11 | ) | | | — | | | | (0.06 | ) | |
| Net realized gains | | | — | | | | — | | | | — | | | | (0.12 | ) | | | (1.79 | ) | |
| Total distributions to shareholders | | | — | | | | (0.11 | ) | | | (0.11 | ) | | | (0.12 | ) | | | (1.85 | ) | |
| Redemption fees: | |
| Redemption fees added to paid-in capital | | | — | | | | — | | | | 0.00 | (c) | | | 0.00 | (c) | | | 0.00 | (c) | |
| Net asset value, end of period | | $ | 10.58 | | | $ | 11.35 | | | $ | 9.51 | | | $ | 6.38 | | | $ | 13.87 | | |
| Total return | | | (6.78 | %) | | | 20.50 | % | | | 50.91 | % | | | (53.60 | %) | | | 9.68 | % | |
| Ratios to average net assets(d) | |
| Expenses prior to fees waived or expenses reimbursed (including interest expense) | | | 2.27 | % | | | 2.26 | %(e) | | | 2.22 | % | | | 2.27 | % | | | 2.19 | % | |
| Net expenses after fees waived or expenses reimbursed (including interest expense)(f) | | | 2.27 | %(g) | | | 2.26 | %(e)(g) | | | 2.22 | %(g) | | | 2.27 | %(g) | | | 2.19 | %(g) | |
| Expenses prior to fees waived or expenses reimbursed (excluding interest expense) | | | 2.27 | % | | | 2.26 | % | | | 2.22 | % | | | 2.27 | % | | | 2.19 | % | |
| Net expenses after fees waived or expenses reimbursed (excluding interest expense)(f) | | | 2.27 | %(g) | | | 2.26 | %(g) | | | 2.22 | %(g) | | | 2.27 | %(g) | | | 2.19 | %(g) | |
| Net investment income (loss) | | | (0.65 | %)(g) | | | (0.27 | %)(g) | | | (0.35 | %)(g) | | | 0.32 | %(g) | | | 0.22 | %(g) | |
| Supplemental data | |
| Net assets, end of period (in thousands) | | $ | 8,381 | | | $ | 14,862 | | | $ | 17,810 | | | $ | 15,281 | | | $ | 44,224 | | |
| Portfolio turnover | | | 86 | % | | | 105 | % | | | 116 | % | | | 117 | % | | | 116 | % | |
Notes to Financial Highlights
(a) Net investment income per share reflects special dividends. The effect of these dividends amounted to $0.03 per share.
(b) Net investment income per share reflects special dividends. The effect of these dividends amounted to $0.04 per share.
(c) Rounds to less than $0.01.
(d) In addition to the fees and expenses which the Fund bears directly, the Fund indirectly bears a pro rata share of the fees and expenses of the acquired funds in which it invests. Such indirect expenses are not included in the reported expense ratios.
(e) Includes interest expense which rounds to less than 0.01%.
(f) The Investment Manager and certain of its affiliates agreed to waive/reimburse certain fees and expenses, if applicable.
(g) The benefits derived from expense reductions had an impact of less than 0.01%.
The Accompanying Notes to Financial Statements are an integral part of this statement.
17
Financial Highlights (continued) – Columbia Marsico International Opportunities Fund
| | | Year ended
Feb. 29, | | Year ended Feb. 28, | | Year ended
Feb. 29, | |
| | | 2012 | | 2011 | | 2010 | | 2009 | | 2008 | |
| Class C | |
| Per share data | |
| Net asset value, beginning of period | | $ | 11.36 | | | $ | 9.51 | | | $ | 6.39 | | | $ | 13.88 | | | $ | 14.24 | | |
| Income from investment operations: | |
| Net investment income (loss) | | | (0.07 | ) | | | (0.03 | ) | | | (0.03 | ) | | | 0.03 | (a) | | | 0.02 | (b) | |
| Net realized and unrealized gain (loss) | | | (0.70 | ) | | | 1.99 | | | | 3.26 | | | | (7.40 | ) | | | 1.47 | | |
| Total from investment operations | | | (0.77 | ) | | | 1.96 | | | | 3.23 | | | | (7.37 | ) | | | 1.49 | | |
| Less distributions to shareholders from: | |
| Net investment income | | | — | | | | (0.11 | ) | | | (0.11 | ) | | | — | | | | (0.06 | ) | |
| Net realized gains | | | — | | | | — | | | | — | | | | (0.12 | ) | | | (1.79 | ) | |
| Total distributions to shareholders | | | — | | | | (0.11 | ) | | | (0.11 | ) | | | (0.12 | ) | | | (1.85 | ) | |
| Redemption fees: | |
| Redemption fees added to paid-in capital | | | — | | | | — | | | | 0.00 | (c) | | | 0.00 | (c) | | | 0.00 | (c) | |
| Net asset value, end of period | | $ | 10.59 | | | $ | 11.36 | | | $ | 9.51 | | | $ | 6.39 | | | $ | 13.88 | | |
| Total return | | | (6.78 | %) | | | 20.60 | % | | | 50.67 | % | | | (53.57 | %) | | | 9.67 | % | |
| Ratios to average net assets(d) | |
| Expenses prior to fees waived or expenses reimbursed (including interest expense) | | | 2.28 | % | | | 2.26 | %(e) | | | 2.22 | % | | | 2.27 | % | | | 2.19 | % | |
| Net expenses after fees waived or expenses reimbursed (including interest expense)(f) | | | 2.28 | %(g) | | | 2.26 | %(e)(g) | | | 2.22 | %(g) | | | 2.27 | %(g) | | | 2.19 | %(g) | |
| Expenses prior to fees waived or expenses reimbursed (excluding interest expense) | | | 2.28 | % | | | 2.26 | % | | | 2.22 | % | | | 2.27 | % | | | 2.19 | % | |
| Net expenses after fees waived or expenses reimbursed (excluding interest expense)(f) | | | 2.28 | %(g) | | | 2.26 | %(g) | | | 2.22 | %(g) | | | 2.27 | %(g) | | | 2.19 | %(g) | |
| Net investment income (loss) | | | (0.68 | %)(g) | | | (0.30 | %)(g) | | | (0.35 | %)(g) | | | 0.30 | %(g) | | | 0.16 | %(g) | |
| Supplemental data | |
| Net assets, end of period (in thousands) | | $ | 25,608 | | | $ | 39,789 | | | $ | 44,466 | | | $ | 38,668 | | | $ | 109,553 | | |
| Portfolio turnover | | | 86 | % | | | 105 | % | | | 116 | % | | | 117 | % | | | 116 | % | |
Notes to Financial Highlights
(a) Net investment income per share reflects special dividends. The effect of these dividends amounted to $0.03 per share.
(b) Net investment income per share reflects special dividends. The effect of these dividends amounted to $0.04 per share.
(c) Rounds to less than $0.01.
(d) In addition to the fees and expenses which the Fund bears directly, the Fund indirectly bears a pro rata share of the fees and expenses of the acquired funds in which it invests. Such indirect expenses are not included in the reported expense ratios.
(e) Includes interest expense which rounds to less than 0.01%.
(f) The Investment Manager and certain of its affiliates agreed to waive/reimburse certain fees and expenses, if applicable.
(g) The benefits derived from expense reductions had an impact of less than 0.01%.
The Accompanying Notes to Financial Statements are an integral part of this statement.
18
Financial Highlights (continued) – Columbia Marsico International Opportunities Fund
| | | Year ended
Feb. 29,
2012 | | Year ended
Feb. 28,
2011(a) | |
| Class I | |
| Per share data | |
| Net asset value, beginning of period | | $ | 12.14 | | | $ | 11.18 | | |
| Income from investment operations: | |
| Net investment income (loss) | | | 0.12 | | | | (0.01 | ) | |
| Net realized and unrealized gain (loss) | | | (0.74 | ) | | | 1.17 | | |
| Total from investment operations | | | (0.62 | ) | | | 1.16 | | |
| Less distributions to shareholders from: | |
| Net investment income | | | — | | | | (0.20 | ) | |
| Total distributions to shareholders | | | — | | | | (0.20 | ) | |
| Net asset value, end of period | | $ | 11.52 | | | $ | 12.14 | | |
| Total return | | | (5.11 | %) | | | 10.44 | % | |
| Ratios to average net assets(b) | |
| Expenses prior to fees waived or expenses reimbursed (including interest expense) | | | 1.12 | % | | | 1.10 | %(c)(d) | |
| Net expenses after fees waived or expenses reimbursed (including interest expense)(e) | | | 1.12 | %(f) | | | 1.10 | %(c)(d)(f) | |
| Expenses prior to fees waived or expenses reimbursed (excluding interest expense) | | | 1.12 | % | | | 1.10 | %(c) | |
| Net expenses after fees waived or expenses reimbursed (excluding interest expense)(e) | | | 1.12 | %(f) | | | 1.10 | %(c)(f) | |
| Net investment income (loss) | | | 1.00 | %(f) | | | (0.24 | %)(c)(f) | |
| Supplemental data | |
| Net assets, end of period (in thousands) | | $ | 3 | | | $ | 34,072 | | |
| Portfolio turnover | | | 86 | % | | | 105 | % | |
Notes to Financial Highlights
(a) Class I shares are for the period from September 27, 2010 (commencement of operations) to February 28, 2011.
(b) In addition to the fees and expenses which the Fund bears directly, the Fund indirectly bears a pro rata share of the fees and expenses of the acquired funds in which it invests. Such indirect expenses are not included in the reported expense ratios.
(c) Annualized.
(d) Includes interest expense which rounds to less than 0.01%.
(e) The Investment Manager and certain of its affiliates agreed to waive/reimburse certain fees and expenses, if applicable.
(f) The benefits derived from expense reductions had an impact of less than 0.01%.
The Accompanying Notes to Financial Statements are an integral part of this statement.
19
Financial Highlights (continued) – Columbia Marsico International Opportunities Fund
| | | Year ended
Feb. 29, | | Year ended Feb. 28, | | Year ended
Feb. 29, | |
| | | 2012 | | 2011 | | 2010 | | 2009 | | 2008 | |
| Class R | |
| Per share data | |
| Net asset value, beginning of period | | $ | 11.94 | | | $ | 9.99 | | | $ | 6.73 | | | $ | 14.56 | | | $ | 14.84 | | |
| Income from investment operations: | |
| Net investment income (loss) | | | (0.02 | ) | | | 0.01 | | | | 0.01 | | | | 0.06 | (a) | | | 0.08 | (b) | |
| Net realized and unrealized gain (loss) | | | (0.73 | ) | | | 2.09 | | | | 3.45 | | | | (7.77 | ) | | | 1.56 | | |
| Total from investment operations | | | (0.75 | ) | | | 2.10 | | | | 3.46 | | | | (7.71 | ) | | | 1.64 | | |
| Less distributions to shareholders from: | |
| Net investment income | | | — | | | | (0.15 | ) | | | (0.20 | ) | | | — | | | | (0.13 | ) | |
| Net realized gains | | | — | | | | — | | | | — | | | | (0.12 | ) | | | (1.79 | ) | |
| Total distributions to shareholders | | | — | | | | (0.15 | ) | | | (0.20 | ) | | | (0.12 | ) | | | (1.92 | ) | |
| Redemption fees: | |
| Redemption fees added to paid-in capital | | | — | | | | — | | | | 0.00 | (c) | | | 0.00 | (c) | | | 0.00 | (c) | |
| Net asset value, end of period | | $ | 11.19 | | | $ | 11.94 | | | $ | 9.99 | | | $ | 6.73 | | | $ | 14.56 | | |
| Total return | | | (6.28 | %) | | | 21.08 | % | | | 51.73 | % | | | (53.40 | %) | | | 10.26 | % | |
| Ratios to average net assets(d) | |
| Expenses prior to fees waived or expenses reimbursed (including interest expense) | | | 1.77 | % | | | 1.76 | %(e) | | | 1.72 | % | | | 1.77 | % | | | 1.69 | % | |
| Net expenses after fees waived or expenses reimbursed (including interest expense)(f) | | | 1.77 | %(g) | | | 1.76 | %(e)(g) | | | 1.72 | %(g) | | | 1.77 | %(g) | | | 1.69 | %(g) | |
| Expenses prior to fees waived or expenses reimbursed (excluding interest expense) | | | 1.77 | % | | | 1.76 | % | | | 1.72 | % | | | 1.77 | % | | | 1.69 | % | |
| Net expenses after fees waived or expenses reimbursed (excluding interest expense)(f) | | | 1.77 | %(g) | | | 1.76 | %(g) | | | 1.72 | %(g) | | | 1.77 | %(g) | | | 1.69 | %(g) | |
| Net investment income (loss) | | | (0.17 | %)(g) | | | 0.12 | %(g) | | | 0.15 | %(g) | | | 0.58 | %(g) | | | 0.51 | %(g) | |
| Supplemental data | |
| Net assets, end of period (in thousands) | | $ | 1,640 | | | $ | 3,020 | | | $ | 3,327 | | | $ | 2,592 | | | $ | 3,724 | | |
| Portfolio turnover | | | 86 | % | | | 105 | % | | | 116 | % | | | 117 | % | | | 116 | % | |
Notes to Financial Highlights
(a) Net investment income per share reflects special dividends. The effect of these dividends amounted to $0.03 per share.
(b) Net investment income per share reflects special dividends. The effect of these dividends amounted to $0.04 per share.
(c) Rounds to less than $0.01.
(d) In addition to the fees and expenses which the Fund bears directly, the Fund indirectly bears a pro rata share of the fees and expenses of the acquired funds in which it invests. Such indirect expenses are not included in the reported expense ratios.
(e) Includes interest expense which rounds to less than 0.01%.
(f) The Investment Manager and certain of its affiliates agreed to waive/reimburse certain fees and expenses, if applicable.
(g) The benefits derived from expense reductions had an impact of less than 0.01%.
The Accompanying Notes to Financial Statements are an integral part of this statement.
20
Financial Highlights (continued) – Columbia Marsico International Opportunities Fund
| | | Year ended
Feb. 29, | | Year ended Feb. 28, | | Year ended
Feb. 29, | |
| | | 2012 | | 2011 | | 2010 | | 2009 | | 2008 | |
| Class Z | |
| Per share data | |
| Net asset value, beginning of period | | $ | 12.15 | | | $ | 10.15 | | | $ | 6.87 | | | $ | 14.79 | | | $ | 15.04 | | |
| Income from investment operations: | |
| Net investment income | | | 0.04 | | | | 0.07 | | | | 0.06 | | | | 0.15 | (a) | | | 0.20 | (b) | |
| Net realized and unrealized gain (loss) | | | (0.75 | ) | | | 2.13 | | | | 3.52 | | | | (7.95 | ) | | | 1.54 | | |
| Total from investment operations | | | (0.71 | ) | | | 2.20 | | | | 3.58 | | | | (7.80 | ) | | | 1.74 | | |
| Less distributions to shareholders from: | |
| Net investment income | | | — | | | | (0.20 | ) | | | (0.30 | ) | | | — | | | | (0.20 | ) | |
| Net realized gains | | | — | | | | — | | | | — | | | | (0.12 | ) | | | (1.79 | ) | |
| Total distributions to shareholders | | | — | | | | (0.20 | ) | | | (0.30 | ) | | | (0.12 | ) | | | (1.99 | ) | |
| Redemption fees: | |
| Redemption fees added to paid-in capital | | | — | | | | — | | | | 0.00 | (c) | | | 0.00 | (c) | | | 0.00 | (c) | |
| Net asset value, end of period | | $ | 11.44 | | | $ | 12.15 | | | $ | 10.15 | | | $ | 6.87 | | | $ | 14.79 | | |
| Total return | | | (5.84 | %) | | | 21.75 | % | | | 52.47 | % | | | (53.17 | %) | | | 10.77 | % | |
| Ratios to average net assets(d) | |
| Expenses prior to fees waived or expenses reimbursed (including interest expense) | | | 1.28 | % | | | 1.26 | %(e) | | | 1.22 | % | | | 1.27 | % | | | 1.19 | % | |
| Net expenses after fees waived or expenses reimbursed (including interest expense)(f) | | | 1.28 | %(g) | | | 1.26 | %(e)(g) | | | 1.22 | %(g) | | | 1.27 | %(g) | | | 1.19 | %(g) | |
| Expenses prior to fees waived or expenses reimbursed (excluding interest expense) | | | 1.28 | % | | | 1.26 | % | | | 1.22 | % | | | 1.27 | % | | | 1.19 | % | |
| Net expenses after fees waived or expenses reimbursed (excluding interest expense)(f) | | | 1.28 | %(g) | | | 1.26 | %(g) | | | 1.22 | %(g) | | | 1.27 | %(g) | | | 1.19 | %(g) | |
| Net investment income | | | 0.38 | %(g) | | | 0.67 | %(g) | | | 0.65 | %(g) | | | 1.32 | %(g) | | | 1.23 | %(g) | |
| Supplemental data | |
| Net assets, end of period (in thousands) | | $ | 456,645 | | | $ | 945,793 | | | $ | 968,569 | | | $ | 824,068 | | | $ | 2,491,232 | | |
| Portfolio turnover | | | 86 | % | | | 105 | % | | | 116 | % | | | 117 | % | | | 116 | % | |
Notes to Financial Highlights
(a) Net investment income per share reflects special dividends. The effect of these dividends amounted to $0.03 per share.
(b) Net investment income per share reflects special dividends. The effect of these dividends amounted to $0.04 per share.
(c) Rounds to less than $0.01.
(d) In addition to the fees and expenses which the Fund bears directly, the Fund indirectly bears a pro rata share of the fees and expenses of the acquired funds in which it invests. Such indirect expenses are not included in the reported expense ratios.
(e) Includes interest expense which rounds to less than 0.01%.
(f) The Investment Manager and certain of its affiliates agreed to waive/reimburse certain fees and expenses, if applicable.
(g) The benefits derived from expense reductions had an impact of less than 0.01%.
The Accompanying Notes to Financial Statements are an integral part of this statement.
21
Notes to Financial Statements – Columbia Marsico International Opportunities Fund
February 29, 2012
Note 1. Organization
Columbia Marsico International Opportunities Fund (the Fund), a series of Columbia Funds Series Trust (the Trust), is a diversified fund. The Trust is registered under the Investment Company Act of 1940, as amended (the 1940 Act), as an open-end management investment company organized as a Delaware statutory trust.
Fund Shares
The Trust may issue an unlimited number of shares (without par value). The Fund offers Class A, Class B, Class C, Class I, Class R and Class Z shares. All share classes have identical voting, dividend and liquidation rights. Each share class has its own expense structure and sales charges, as applicable.
Class A shares are subject to a maximum front-end sales charge of 5.75% based on the initial investment amount. Class A shares purchased without an initial sales charge in accounts aggregating $1 million to $50 million at the time of purchase are subject to a contingent deferred sales charge (CDSC) if the shares are sold within 18 months of purchase, charged as follows: 1.00% CDSC if redeemed within 12 months of purchase, and 0.50% CDSC if redeemed more than 12, but less than 18, months after purchase.
Class B shares may be subject to a maximum CDSC of 5.00% based upon the holding period after purchase. Class B shares will generally convert to Class A shares eight years after purchase. The Fund no longer accepts investments by new or existing investors in the Fund's Class B shares, except in connection with the reinvestment of any dividend and/or capital gain distributions in Class B shares of the Fund and exchanges by existing Class B shareholders of certain other funds within the Columbia Family of Funds.
Class C shares are subject to a 1.00% CDSC on shares redeemed within one year of purchase.
Class I shares are not subject to sales charges and are only available to the Columbia Family of Funds.
Class R shares are not subject to sales charges and are only available to qualifying institutional investors.
Class Z shares are not subject to sales charges, and are only available to certain investors, as described in the Fund's prospectus.
Note 2. Summary of Significant Accounting Policies
Use of Estimates
The preparation of financial statements in accordance with U.S. generally accepted accounting principles (GAAP) requires management to make certain estimates and assumptions that affect the reported amounts of assets and liabilities, the disclosure of contingent assets and liabilities at the date of the financial statements and the reported amounts of revenue and expenses during the reporting period. Actual results could differ from those estimates.
The following is a summary of significant accounting policies consistently followed by the Fund in the preparation of its financial statements.
Security Valuation
All equity securities are valued at the close of business of the New York Stock Exchange (NYSE). Equity securities are valued at the last quoted sales price on the principal exchange or market on which they trade, except for securities traded on the NASDAQ Stock Market, which are valued at the NASDAQ official close price. Unlisted securities or listed securities for which there were no sales during the day are valued at the mean of the latest quoted bid and asked prices on such exchanges or markets.
Foreign securities are valued based on quotations from the principal market in which such securities are normally traded. If any foreign share prices are not readily available as a result of limited share activity the securities are valued at the mean of the latest quoted bid and asked prices on such exchanges or markets. Foreign currency exchange rates are generally determined at 4:00 p.m. Eastern (U.S.) time. However, many securities markets and exchanges outside the U.S. close prior to the close of the NYSE; therefore, the closing prices for securities in such markets or on such exchanges may not fully reflect events that occur after such close but before the close of the NYSE. In those situations, foreign securities will be fair valued pursuant to the policy adopted by the Board of Trustees (the Board), including utilizing a third party pricing service to determine these fair values. The third party pricing service takes into account multiple factors, including, but not limited to, movements in the U.S. securities markets, certain depositary receipts, futures contracts and foreign exchange
22
Columbia Marsico International Opportunities Fund, February 29, 2012
rates that have occurred subsequent to the close of the foreign exchange, to determine a good faith estimate that reasonably reflects the current market conditions as of the close of the NYSE. The fair value of a security is likely to be different from the quoted or published price, if available.
Investments in other open-end investment companies, including money market funds, are valued at net asset value.
Short-term securities purchased within 60 days to maturity are valued at amortized cost, which approximates market value. The value of short-term securities originally purchased with maturities greater than 60 days is determined based on an amortized value to par upon reaching 60 days to maturity. Short-term securities maturing in more than 60 days from the valuation date are valued at the market price or approximate market value based on current interest rates.
Forward foreign currency exchange contracts are marked-to-market based upon foreign currency exchange rates provided by a pricing service.
Investments for which market quotations are not readily available, or that have quotations which management believes are not reliable, are valued at fair value as determined in good faith under consistently applied procedures established by and under the general supervision of the Board. If a security or class of securities (such as foreign securities) is valued at fair value, such value is likely to be different from the last quoted market price for the security. The determination of fair value often requires significant judgment. To determine fair value, management may use assumptions including but not limited to future cash flows and estimated risk premiums. Multiple inputs from various sources may be used to determine value.
Foreign Currency Transactions and Translation
The values of all assets and liabilities denominated in foreign currencies are translated into U.S. dollars at that day's exchange rates. Net realized and unrealized gains (losses) on foreign currency transactions and translations include gains (losses) arising from the fluctuation in exchange rates between trade and settlement dates on securities transactions, gains (losses) arising from the disposition of foreign currency and currency gains (losses) between the accrual and payment dates on dividends, interest income and foreign withholding taxes.
For financial statement purposes, the Fund does not distinguish that portion of gains (losses) on investments which is due to changes in foreign exchange rates from that which is due to changes in market prices of the investments. Such fluctuations are included with the net realized and unrealized gains (losses) on investments in the Statement of Operations.
Derivative Instruments
The Fund invests in certain derivative instruments as detailed below to meet its investment objectives. Derivatives are instruments whose values depend on, or are derived from, in whole or in part, the value of one or more other assets, such as securities, currencies, commodities or indices. Derivative instruments may be used to maintain cash reserves while maintaining exposure to certain other assets, to offset anticipated declines in values of investments, to facilitate trading, to reduce transaction costs and to pursue higher investment returns. The Fund may also use derivative instruments to mitigate certain investment risks, such as foreign currency exchange rate risk, interest rate risk and credit risk. Derivatives may involve various risks, including the potential inability of the counterparty to fulfill its obligation under the terms of the contract, the potential for an illiquid secondary market and the potential for market movements which may expose the Fund to gains or losses in excess of the amount shown in the Statement of Assets and Liabilities.
The Fund and any counterparty are required to maintain an agreement that requires the Fund and that counterparty to monitor (on a daily basis) the net fair value of all derivatives entered into pursuant to the agreement between the Fund and such counterparty. If the net fair value of such derivatives between the Fund and that counterparty exceeds a certain threshold (as defined in the agreement), the Fund or the counterparty (as the case may be) is required to post cash and/or securities as collateral. Fair values of derivatives presented in the financial statements are not netted with the fair value of other derivatives or with any collateral amounts posted by the Fund or any counterparty.
Forward Foreign Currency Exchange Contracts
Forward foreign currency exchange contracts are agreements between two parties to buy and sell a currency at a set price
23
Columbia Marsico International Opportunities Fund, February 29, 2012
on a future date. These contracts are intended to be used to minimize the exposure to foreign exchange rate fluctuations during the period between the trade and settlement dates of the contract. The Fund utilized forward foreign currency exchange contracts for the settlement of purchase and sales of securities and to hedge the currency exposure associated with some or all of the Fund's securities.
The values of forward foreign currency exchange contracts fluctuate with changes in foreign currency exchange rates. The Fund will record a realized gain or loss when the forward foreign currency exchange contract is closed.
The use of forward foreign currency exchange contracts does not eliminate fluctuations in the prices of the Fund's portfolio securities. The risks of forward foreign currency exchange contracts include movement in the values of the foreign currencies relative to the U.S. dollar (or other foreign currencies) and the possibility that counterparties will not complete their contractual obligations, which may be in excess of the amount reflected, if any, in the Statement of Assets and Liabilities.
Effects of Derivative Transactions in the Financial Statements
The following tables are intended to provide additional information about the effect of derivatives on the financial statements of the Fund, including: the fair value of derivatives by risk category and the location of those fair values in the Statement of Assets and Liabilities; the impact of derivative transactions on the Fund's operations over the period including realized gains or losses and unrealized gains or losses. The derivative schedules following the Portfolio of Investments present additional information regarding derivative instruments outstanding at the end of the period, if any.
| Fair Values of Derivative Instruments at February 29, 2012 | |
| | | Asset derivatives | | Liability derivatives | |
| Risk Exposure Category | | Statement of Assets
and Liabilities Location | | Fair Value | | Statement of Assets
and Liabilities Location | | Fair Value | |
| Foreign exchange contracts | | Unrealized appreciation on
forward foreign currency
exchange contracts | | $ | 2,975 | | | Unrealized depreciation on
forward foreign currency
exchange contracts | | $ | 4,097 | | |
Effect of Derivative Instruments in the Statement of Operations for the Year Ended February 29, 2012
Amount of Realized Gain (Loss) on Derivatives
| Risk Exposure Category | | Forward Foreign
Currency Exchange
Contracts | |
| Foreign exchange contracts | | $ | (3,362,094 | ) | |
Change in Unrealized Appreciation (Depreciation) on Derivatives Recognized in Income
| Risk Exposure Category | | Forward Foreign
Currency Exchange
Contracts | |
| Foreign exchange contracts | | $ | (1,122 | ) | |
Volume of Derivative Instruments for the Year Ended February 29, 2012
| | | Contracts
Opened | |
| Forward Foreign Currency Exchange Contracts | | | 1,019 | | |
Repurchase Agreements
The Fund may engage in repurchase agreement transactions with institutions that management has determined are creditworthy. The Fund, through the custodian, receives delivery of the underlying securities collateralizing a repurchase agreement. Management is responsible for determining that the collateral is at least equal, at all times, to the value of the repurchase obligation including interest. A repurchase agreement transaction involves certain risks in the event of default or insolvency of the counterparty. These risks
24
Columbia Marsico International Opportunities Fund, February 29, 2012
include possible delays in or restrictions on a Fund's ability to dispose of the underlying securities and a possible decline in the value of the underlying securities during the period while the Fund seeks to assert its rights.
Security Transactions
Security transactions are accounted for on the trade date. Cost is determined and gains (losses) are based upon the specific identification method for both financial statement and federal income tax purposes.
Income Recognition
Corporate actions and dividend income are recorded net of any non-reclaimable tax withholdings, on the ex-dividend date or upon receipt of ex-dividend notification in the case of certain foreign securities.
Interest income is recorded on the accrual basis.
Awards from class action litigation are recorded as a reduction of cost basis if the Fund still owns the applicable securities on the payment date. If the Fund no longer owns the applicable securities, the proceeds are recorded as realized gains.
Expenses
General expenses of the Trust are allocated to the Fund and other funds of the Trust based upon relative net assets or other expense allocation methodologies determined by the nature of the expense. Expenses directly attributable to the Fund are charged to the Fund. Expenses directly attributable to a specific class of shares are charged to that share class.
Determination of Class Net Asset Value
All income, expenses (other than class-specific expenses, which are charged to that share class, as shown in the Statement of Operations) and realized and unrealized gains (losses) are allocated to each class of the Fund on a daily basis, based on the relative net assets of each class, for purposes of determining the net asset value of each class.
Federal Income Tax Status
The Fund intends to qualify each year as a regulated investment company under Subchapter M of the Internal Revenue Code, as amended, and will distribute substantially all of its taxable income (including net short-term capital gains), if any, for its tax year, and as such will not be subject to federal income taxes. In addition, the Fund intends to distribute in each calendar year substantially all of its net investment income, capital gains and certain other amounts, if any, such that the Fund should not be subject to federal excise tax. Therefore, no federal income or excise tax provision is recorded.
Foreign Taxes
The Fund may be subject to foreign taxes on income, gains on investments or currency repatriation, a portion of which may be recoverable. The Fund will accrue such taxes and recoveries, as applicable, based upon its current interpretation of tax rules and regulations that exist in the markets in which it invests.
Realized gains in certain countries may be subject to foreign taxes at the Fund level, based on statutory rates. The Fund accrues for such foreign taxes on net realized and unrealized gains at the appropriate rate for each jurisdiction, as applicable.
Distributions to Shareholders
Distributions from net investment income, if any, are declared and paid semi-annually. Net realized capital gains, if any, are distributed along with the income dividend. Income distributions and capital gain distributions are determined in accordance with federal income tax regulations which may differ from GAAP.
Guarantees and Indemnifications
Under the Trust's organizational documents and, in some cases, by contract, its officers and trustees are indemnified against certain liabilities arising out of the performance of their duties to the Trust or its funds. In addition, certain of the Fund's contracts with its service providers contain general indemnification clauses. The Fund's maximum exposure under these arrangements is unknown since the amount of any future claims that may be made against the Fund cannot be determined, and the Fund has no historical basis for predicting the likelihood of any such claims.
25
Columbia Marsico International Opportunities Fund, February 29, 2012
Recent Accounting Pronouncement
Fair Value Measurements and Disclosures
In May 2011, the Financial Accounting and Standards Board (FASB) issued ASU No. 2011-04 modifying Topic 820, Fair Value Measurements and Disclosures. At the same time, the International Accounting Standards Board (IASB) issued International Financial Reporting Standard 13, Fair Value Measurement. The objective of the FASB and IASB is convergence of their guidance on fair value measurements and disclosures.
Specifically, ASU No. 2011-04 requires reporting entities to disclose i) the amounts of any transfers between Level 1 and Level 2, and the reasons for the transfers, ii) for Level 3 fair value measurements, a) quantitative information about significant unobservable inputs used, b) a description of the valuation processes used by the reporting entity and c) a narrative description of the sensitivity of the fair value measurement to changes in unobservable inputs if a change in those inputs might result in a significantly higher or lower fair value measurement. The effective date of ASU No. 2011-04 is for interim and annual periods beginning after December 15, 2011. At this time, management is evaluating the implications of this guidance and the impact it will have on the financial statement amounts and footnote disclosures, if any.
Note 3. Fees and Compensation Paid to Affiliates
Investment Management Fees
Under an Investment Management Services Agreement, Columbia Management Investment Advisers, LLC (the Investment Manager), a wholly-owned subsidiary of Ameriprise Financial, Inc. (Ameriprise Financial), is responsible for the ultimate oversight of investments made by the Fund. The primary responsibility for the day-to-day portfolio management of the Fund is provided by the Fund's subadviser (see Subadvisory Agreement below). The Management fee is an annual fee that is equal to 0.80% of the Fund's average daily net assets.
To the extent that the Fund is not benefitting from a separate contractual expense limitation arrangement, the Investment Manager has contractually agreed to waive a portion of its management fee through June 30, 2012. In the absence of a separate contractual expense limitation arrangement, the management fee waiver for the Fund would be calculated as follows:
| Fund Average Daily Net Assets* | | Management
Fee Waiver | |
| Assets up to $6 billion | | | 0.00 | % | |
Assets in excess of $6 billion
and up to $10 billion | | | 0.05 | | |
| Assets in excess of $10 billion | | | 0.10 | | |
* For purposes of the calculation, "Assets" are aggregate assets of the Fund and other affiliated funds managed by the Investment Manager and sub-advised by Marsico Capital Management, LLC.
For the year ended February 29, 2012, no management fees were waived for the Fund.
Subadvisory Agreement
The Investment Manager has entered into a Subadvisory Agreement with Marsico Capital Management, LLC (Marsico) to subadvise the assets of the Fund. The Investment Manager compensates Marsico to manage the investments of the Fund's assets.
Administration Fees
Under an Administrative Services Agreement, the Investment Manager serves as the Fund Administrator. The Fund pays the Fund Administrator an annual fee for administration and accounting services equal to 0.22% of the Fund's average daily net assets, less the fees that were payable by the Fund as described under the Pricing and Bookkeeping Fees note below.
Pricing and Bookkeeping Fees
Prior to July 11, 2011, the Fund had entered into a Financial Reporting Services Agreement (the Financial Reporting Services Agreement) with State Street Bank and Trust Company (State Street) and the Investment Manager pursuant to which State Street provided financial reporting services to the Fund. The Fund also entered into an Accounting Services Agreement (collectively with the Financial Reporting Services Agreement, the State Street Agreements) with State Street and the Investment Manager pursuant to which State Street provided accounting services to the Fund. Under the State Street Agreements, the Fund paid State Street an annual fee of $38,000 paid monthly plus an additional monthly fee
26
Columbia Marsico International Opportunities Fund, February 29, 2012
based on an annualized percentage rate of average daily net assets of the Fund for the month. The aggregate fee did not exceed $140,000 per year (exclusive of out-of-pocket expenses and charges). The Fund also reimbursed State Street for certain out-of-pocket expenses and charges. Effective July 11, 2011, these services are provided under the Administrative Services Agreement discussed above.
Other Fees
Effective June 1, 2011, other expenses are for, among other things, certain expenses of the Fund or the Board, including: Fund boardroom and office expense, employee compensation, employee health and retirement benefits, and certain other expenses. Payment of these Fund and Board expenses is facilitated by a company providing limited administrative services to the Fund and the Board. For the period June 1, 2011 through February 29, 2012, other expenses paid to this company were $3,458.
Compensation of Board Members
Board members are compensated for their services to the Fund as disclosed in the Statement of Operations. Under a Deferred Compensation Plan (the Plan), the Board members who are not "interested persons" of the Fund, as defined under the 1940 Act, may elect to defer payment of up to 100% of their compensation. Deferred amounts are treated as though equivalent dollar amounts had been invested in shares of certain funds managed by the Investment Manager. The Fund's liability for these amounts is adjusted for market value changes and remains in the Fund until distributed in accordance with the Plan.
Compensation of Chief Compliance Officer
The Board has appointed a Chief Compliance Officer to the Fund in accordance with federal securities regulations. Effective April 1, 2011, the Fund's expenses associated with the Chief Compliance Officer are paid directly by Columbia. Prior to April 1, 2011, the Fund, along with other affiliated funds, paid its pro-rata share of the expenses for the Chief Compliance Officer. Such fees did not exceed $15,000 per year.
Transfer Agent Fees
Under a Transfer and Dividend Disbursing Agent Agreement, Columbia Management Investment Services Corp. (the Transfer Agent), an affiliate of the Investment Manager and a wholly-owned subsidiary of Ameriprise Financial, is responsible for providing transfer agency services to the Fund. The Transfer Agent has contracted with Boston Financial Data Services (BFDS) to serve as sub-transfer agent.
The Transfer Agent receives monthly account-based service fees based on the number of open accounts and is reimbursed by the Fund for the fees and expenses the Transfer Agent pays to financial intermediaries that maintain omnibus accounts with the Fund that is a percentage of the average aggregate value of the Fund's shares maintained in each such omnibus account (other than omnibus accounts for which American Enterprise Investment Services Inc. is the broker of record or accounts where the beneficial shareholder is a customer of Ameriprise Financial Services, Inc., which are paid a per account fee). The Transfer Agent pays the fees of BFDS for services as sub-transfer agent and is not entitled to reimbursement for such fees from the Fund (with the exception of out-of-pocket fees).
The Transfer Agent also receives compensation from fees for various shareholder services and reimbursements for certain out-of-pocket expenses. Class I shares do not pay transfer agent fees.
For the year ended February 29, 2012, the Fund's effective transfer agent fee rates as a percentage of average daily net assets of each class were as follows:
| Class A | | | 0.19 | % | |
| Class B | | | 0.18 | | |
| Class C | | | 0.19 | | |
| Class R | | | 0.18 | | |
| Class Z | | | 0.18 | | |
An annual minimum account balance fee of $20 may apply to certain accounts with a value below the Fund's initial minimum investment requirements to reduce the impact of small accounts on transfer agent fees. These minimum account balance fees are recorded as part of expense reductions in the Statement of Operations. For the year ended February 29, 2012, these minimum account balance fees reduced total expenses by $1,140.
27
Columbia Marsico International Opportunities Fund, February 29, 2012
Distribution and Service Fees
The Fund has an agreement with Columbia Management Investment Distributors, Inc. (the Distributor), an affiliate of the Investment Manager and a wholly-owned subsidiary of Ameriprise Financial, for distribution and shareholder services. Pursuant to Rule 12b-1 under the 1940 Act, the Board has approved, and the Fund has adopted, distribution and shareholder service plans (the Plans) which set the distribution and service fees for the Fund. These fees are calculated daily and are intended to compensate the Distributor and/or eligible selling and/or servicing agents for selling shares of the Fund and providing services to investors.
The Plans require the payment of a monthly combined distribution and service fee to the Distributor at the maximum annual rate of 0.25% of the average daily net assets attributable to Class A shares of the Fund. The Plans also required the payment of a monthly service fee at the maximum annual rate of 0.25% of the average daily net assets attributable to Class B and Class C shares of the Fund and the payment of a monthly distribution fee at the maximum annual rates of 0.75%, 0.75% and 0.50% of the average daily net assets attributable to Class B, Class C and Class R shares, respectively.
Sales Charges
Sales charges, including front-end charges and CDSCs, received by the Distributor for distributing Fund shares were $21,012 for Class A, $19,493 for Class B and $781 for Class C shares for the year ended February 29, 2012.
Expenses Waived/Reimbursed by the Investment Manager and its Affiliates
Effective July 1, 2011, the Investment Manager and certain of its affiliates have contractually agreed to waive fees and/or reimburse expenses (excluding certain fees and expenses described below), through June 30, 2012, unless sooner terminated at the sole discretion of the Board, so that the Fund's net operating expenses, after giving effect to fees waived/expenses reimbursed and any balance credits and/or overdraft charges from the Fund's custodian, do not exceed the following annual rates as a percentage of the class' average daily net assets:
| Class A | | | 1.60 | % | |
| Class B | | | 2.35 | | |
| Class C | | | 2.35 | | |
| Class I | | | 1.25 | | |
| Class R | | | 1.85 | | |
| Class Z | | | 1.35 | | |
Under the agreement, the following fees and expenses are excluded from the waiver/reimbursement commitment, and therefore will be paid by the Fund, if applicable: taxes (including foreign transaction taxes), expenses associated with investments in affiliated and non-affiliated pooled investment vehicles (including mutual funds and exchange traded funds), transaction costs and brokerage commissions, costs related to any securities lending program, dividend expenses associated with securities sold short, inverse floater program fees and expenses, transaction charges and interest on borrowed money, interest, extraordinary expenses and any other expenses the exclusion of which is specifically approved by the Board. This agreement may be modified or amended only with approval from all parties.
Prior to July 1, 2011, the Investment Manager voluntarily agreed to reimburse a portion of the Fund's expenses (excluding certain expenses, such as brokerage commissions, interest, taxes and extraordinary expenses, but including custodian charges relating to overdrafts, if any) so that the Fund's ordinary net operating expenses, after giving effect to fees waived/expenses reimbursed and any balance credits and/or overdraft charges from the Fund's custodian, did not exceed the following annual rates as a percentage of the class' average daily net assets:
| Class A | | | 1.60 | % | |
| Class B | | | 2.35 | | |
| Class C | | | 2.35 | | |
| Class I | | | 1.21 | | |
| Class R | | | 1.85 | | |
| Class Z | | | 1.35 | | |
28
Columbia Marsico International Opportunities Fund, February 29, 2012
Note 4. Federal Tax Information
The timing and character of income and capital gain distributions are determined in accordance with income tax regulations, which may differ from GAAP because of temporary or permanent book to tax differences.
For the Year Ended February 29, 2012, these differences are primarily due to differing treatment for deferral/reversal of wash sales, passive foreign investment companies (PFIC) adjustments, post-October losses, foreign currency transactions, recognition of unrealized appreciation (depreciation) for certain derivative investments, net operating loss reclassifications, and capital loss carryforward. To the extent these differences are permanent, reclassifications are made among the components of the Fund's net assets in the Statement of Assets and Liabilities. Temporary differences do not require reclassifications. In the Statement of Assets and Liabilities the following reclassifications were made:
Excess of distributions over net
investment income | | $ | 9,345,735 | | |
| Accumulated net realized loss | | | 7,846,260 | | |
| Paid-in capital | | | (17,191,995 | ) | |
Net investment income and net realized gains (losses), as disclosed in the Statement of Operations, and net assets were not affected by this reclassification.
The tax character of distributions paid during the years indicated was as follows:
| | | Year ended
February 29, | | Year ended
February 28, | |
| | | 2012 | | 2011 | |
| Ordinary income | | $ | — | | | $ | 19,278,077 | | |
Short-term capital gain distributions, if any, are considered ordinary income distributions for tax purposes.
At February 29, 2012, the components of distributable earnings on a tax basis were as follows:
| Undistributed ordinary income | | $ | — | | |
| Undistributed accumulated long-term gain | | | — | | |
| Unrealized appreciation | | | 101,411,633 | | |
At February 29, 2012, the cost of investments for federal income tax purposes was $506,210,575 and the aggregate gross unrealized appreciation and depreciation based on that cost was:
| Unrealized appreciation | | $ | 107,544,632 | | |
| Unrealized depreciation | | $ | (6,135,351 | ) | |
| Net unrealized appreciation/depreciation | | $ | 101,409,281 | | |
The following capital loss carryforward, determined at February 29, 2012, may be available to reduce taxable income arising from future net realized gains on investments, if any, to the extent permitted by the Internal Revenue Code:
| Year of Expiration | | Amount | |
| 2017 | | $ | 289,767,420 | | |
| 2018 | | | 420,548,594 | | |
| Total | | $ | 710,316,014 | | |
On December 22, 2010, the Regulated Investment Company Modernization Act of 2010 (the Act) was enacted, which changed various technical rules governing the tax treatment of regulated investment companies. The changes are generally effective for taxable years beginning after the date of enactment. Under the Act, the Fund will be permitted to carry forward capital losses incurred in taxable years beginning after the date of enactment for an unlimited period. However, any losses incurred during those future taxable years will be required to be utilized prior to the losses incurred in pre-enactment taxable years, which carry an expiration date. As a result of this ordering rule, pre-enactment capital loss carryforwards may be more likely to expire unused.
Management of the Fund has concluded that there are no significant uncertain tax positions that would require recognition in the financial statements. However,
29
Columbia Marsico International Opportunities Fund, February 29, 2012
management's conclusion may be subject to review and adjustment at a later date based on factors including, but not limited to, new tax laws, regulations, and administrative interpretations (including relevant court decisions). Generally, the Fund's federal tax returns for the prior three fiscal years remain subject to examination by the Internal Revenue Service.
For the year ended February 29, 2012, $58,117,110 of capital loss carryforward was utilized.
Under current tax rules, regulated investment companies can elect to treat certain late-year ordinary losses incurred and post-October capital losses (capital losses realized after October 31) as arising on the first day of the following taxable year. As of February 29, 2012, the Fund will elect to treat post-October capital losses of $12,567,186 as arising on March 1, 2012.
Note 5. Portfolio Information
The cost of purchases and proceeds from sales of securities, excluding short-term obligations, aggregated to $725,288,704 and $1,207,621,207, respectively, for the year ended February 29, 2012.
Note 6. Lending of Portfolio Securities
Effective July 11, 2011, the Fund has entered into a Master Securities Lending Agreement (the Agreement) with JPMorgan Chase Bank, N.A. (JPMorgan). The Agreement, which replaces the previous securities lending arrangement with State Street, authorizes JPMorgan as lending agent to lend securities to authorized borrowers in order to generate additional income on behalf of the Fund. Pursuant to the Agreement, the securities loaned are secured by cash or U.S. government securities equal to at least 100% of the market value of the loaned securities. Any additional collateral required to maintain those levels due to market fluctuations of the loaned securities is requested to be delivered the following business day. Cash collateral received is invested by the lending agent on behalf of the Fund into authorized investments pursuant to the Agreement. The investments made with the cash collateral are listed in the Portfolio of Investments. The values of such investments and any uninvested cash collateral are disclosed in the Statement of Assets and Liabilities along with the related obligation to return the collateral upon the return of the securities loaned. At February 29, 2012, securities valued at $14,162,596 were on loan, secured by cash collateral of $14,761,073 (which does not reflect calls for collateral made to borrowers by JPMorgan at period end) that is partially or fully invested in short-term securities or other cash equivalents.
Risks of delay in recovery of securities or even loss of rights in the securities may occur should the borrower of the securities fail financially. Risks may also arise to the extent that the value of the securities loaned increases above the value of the collateral received. JPMorgan will indemnify the Fund from losses resulting from a borrower's failure to return a loaned security when due. Such indemnification does not extend to losses associated with declines in the value of cash collateral investments. The Investment Manager is not responsible for any losses incurred by the Fund in connection with the securities lending program. Loans are subject to termination by the Fund or the borrower at any time, and are, therefore, not considered to be illiquid investments.
Pursuant to the Agreement, the Fund receives income for lending its securities either in the form of fees or by earning interest on invested cash collateral, net of negotiated rebates paid to borrowers and fees paid to the lending agent for services provided and any other securities lending expenses Net income earned from securities lending for the year ended February 29, 2012 is disclosed in the Statement of Operations. The Fund continues to earn and accrue interest and dividends on the securities loaned.
Prior to July 11, 2011, the Fund participated in a securities lending arrangement with State Street. Each security on loan was collateralized in an amount at least equal to the market value of the securities loaned plus accrued income from the investment of collateral. The income generated by the investment of the collateral, net of any fees remitted to State Street as the lending agent and borrower rebates, was paid to the Fund.
Note 7. Custody Credits
Prior to July 11, 2011, the Fund had an agreement with its custodian bank under which custody fees may have been reduced by balance credits. These credits are recorded as part of expense reductions on the Statement of Operations. The Fund could have invested a portion of the assets utilized in connection with the expense offset arrangement in an
30
Columbia Marsico International Opportunities Fund, February 29, 2012
income-producing asset if they had not entered into such an agreement. Subsequent to this date, the Fund may invest its daily balance in an affiliated money market fund as detailed below. For the period March 1, 2010 through July 10, 2011, these credits reduced total expenses by $11.
Note 8. Affiliated Money Market Fund
Effective July 11, 2011, the Fund may invest its daily cash balances in Columbia Short-Term Cash Fund, an affiliated money market fund established for the exclusive use by the Fund and other affiliated funds. The income earned by the Fund from such investments is included as "Dividends from affiliates" in the Statement of Operations. As an investing fund, the Fund indirectly bears its proportionate share of the expenses of Columbia Short-Term Cash Fund.
Note 9. Shareholder Concentration
At February 29, 2012, two unaffiliated shareholder accounts owned an aggregate of 63.0% of the outstanding shares of the Fund. The Fund has no knowledge about whether any portion of those shares was owned beneficially. Subscription and redemption activity of these accounts may have a significant effect on the operations of the Fund.
Note 10. Line of Credit
The Fund has entered into a revolving credit facility with a syndicate of banks led by JPMorgan Chase Bank, N.A. (the Administrative Agent), whereby the Fund may borrow for the temporary funding of shareholder redemptions or for other temporary or emergency purposes. The credit facility became effective on July 11, 2011, replacing a prior credit facility. The credit facility agreement, as amended, which is a collective agreement between the Fund and certain other funds managed by the Investment Manager, severally and not jointly, permits collective borrowings up to $500 million. Pursuant to a December 13, 2011 amendment to the credit facility agreement, interest is charged to each participating fund based on its borrowings at a rate equal to the higher of (i) the overnight federal funds rate plus 1.00% or (i) the one-month LIBOR rate plus 1.00%. Each borrowing under the credit facility matures no later than 60 days after the date of borrowing. The Fund also pays a commitment fee equal to its pro rata share of the amount of the credit facility at a rate of 0.08% per annum. For the period July 11, 2011 through December 13, 2011, interest was charged to each participating fund based on its borrowings at a rate equal to the sum of the federal funds rate plus (i) 1.25% per annum plus (ii) if one-month LIBOR exceeds the federal funds rate, the amount of such excess. The Fund also paid a commitment fee equal to its pro rata share of the amount of the credit facility at a rate of 0.10% per annum.
Prior to July 11, 2011, the Fund and certain other funds managed by the Investment Manager participated in a committed, unsecured revolving credit facility provided by State Street. For the period June 27, 2011 through July 8, 2011, the collective borrowing amount of the credit facility was $100 million. For the period May 16, 2011 through June 26, 2011, the collective borrowing amount of the credit facility was $150 million. For the period March 28, 2011 through May 15, 2011, the collective borrowing amount of the credit facility was $225 million. Prior to March 28, 2011, the collective borrowing amount of the credit facility was $280 million. Interest was charged to each fund based on its borrowings at a rate equal to the greater of the (i) federal funds rate plus 1.25% per annum or (ii) the overnight LIBOR rate plus 1.25% per annum. The Fund also paid a commitment fee equal to its pro rata share of the amount of the credit facility at a rate of 0.125% per annum.
The Fund had no borrowings during the year ended February 29, 2012.
Note 11. Significant Risks
Foreign Securities Risk
Investing in foreign securities may include certain risks and considerations not typically associated with investing in U.S. securities, such as fluctuating currency values and changing local and regional economic, political and social conditions, which may result in greater market volatility. In addition, certain foreign securities may not be as liquid as U.S. securities. Investing in emerging markets may accentuate these risks.
Investments in emerging market countries are subject to additional risk. The risk of foreign investments is typically increased in less developed countries. These countries are also more likely to experience high levels of inflation, deflation or currency devaluation which could hurt their economies and securities markets.
31
Columbia Marsico International Opportunities Fund, February 29, 2012
Note 12. Subsequent Events
Management has evaluated the events and transactions that have occurred through the date the financial statements were issued. Other than noted below, there were no items requiring adjustment of the financial statements or additional disclosure. On March 8, 2012, an unaffiliated shareholder of the Fund redeemed $68,759,536, which represented approximately 12% of the Fund's net assets as of that date.
Note 13. Information Regarding Pending and Settled Legal Proceedings
In June 2004, an action captioned John E. Gallus et al. v. American Express Financial Corp. and American Express Financial Advisors Inc. was filed in the United States District Court for the District of Arizona. The plaintiffs allege that they are investors in several American Express Company mutual funds (currently branded as Columbia) and they purport to bring the action derivatively on behalf of those funds under the Investment Company Act of 1940. The plaintiffs allege that fees allegedly paid to the defendants by the funds for investment advisory and administrative services are excessive. The plaintiffs seek remedies including restitution and rescission of investment advisory and distribution agreements. The plaintiffs voluntarily agreed to transfer this case to the United States District Court for the District of Minnesota (the District Court). In response to defendants' motion to dismiss the complaint, the District Court dismissed one of plaintiffs' four claims and granted plaintiffs limited discovery. Defendants moved for summary judgment in April 2007. Summary judgment was granted in the defendants' favor on July 9, 2007. The plaintiffs filed a notice of appeal with the Eighth Circuit Court of Appeals (the Eighth Circuit) on August 8, 2007. On April 8, 2009, the Eighth Circuit reversed summary judgment and remanded to the District Court for further proceedings. On August 6, 2009, defendants filed a writ of certiorari with the U.S. Supreme Court (the Supreme Court), asking the Supreme Court to stay the District Court proceedings while the Supreme Court considered and ruled in a case captioned Jones v. Harris Associates, which involves issues of law similar to those presented in the Gallus case. On March 30, 2010, the Supreme Court issued its ruling in Jones v. Harris Associates, and on April 5, 2010, the Supreme Court vacated the Eighth Circuit's decision in the Gallus case and remanded the case to the Eighth Circuit for further consideration in light of the Supreme Court's decision in Jones v. Harris Associates. On June 4, 2010, the Eighth Circuit remanded the Gallus case to the District Court for further consideration in light of the Supreme Court's decision in Jones v. Harris Associates. On December 9, 2010, the District Court reinstated its July 9, 2007 summary judgment order in favor of the defendants. On January 10, 2011, plaintiffs filed a notice of appeal with the Eighth Circuit. In response to the plaintiffs' opening appellate brief filed on March 18, 2011, the defendants filed a response brief on May 4, 2011 with the Eighth Circuit. The plaintiffs filed a reply brief on May 26, 2011 and oral arguments took place on November 17, 2011. On March 30, 2012, the Eighth Circuit upheld the grant of summary judgment by the District Court in favor of the defendants.
In December 2005, without admitting or denying the allegations, American Express Financial Corporation (AEFC, which is now known as Ameriprise Financial, Inc. (Ameriprise Financial)) entered into settlement agreements with the Securities and Exchange Commission (SEC) and Minnesota Department of Commerce (MDOC) related to market timing activities. As a result, AEFC was censured and ordered to cease and desist from committing or causing any violations of certain provisions of the Investment Advisers Act of 1940, the Investment Company Act of 1940, and various Minnesota laws. AEFC agreed to pay disgorgement of $10 million and civil money penalties of $7 million. AEFC also agreed to retain an independent distribution consultant to assist in developing a plan for distribution of all disgorgement and civil penalties ordered by the SEC in accordance with various undertakings detailed at www.sec.gov/litigation/admin/ia-2451.pdf. Ameriprise Financial and its affiliates have cooperated with the SEC and the MDOC in these legal proceedings, and have made regular reports to the funds' Boards of Trustees.
Ameriprise Financial and certain of its affiliates have historically been involved in a number of legal, arbitration and regulatory proceedings, including routine litigation, class actions, and governmental actions, concerning matters arising in connection with the conduct of their business activities. Ameriprise Financial believes that the Funds are not currently the subject of, and that neither Ameriprise Financial nor any of its affiliates are the subject of, any pending legal, arbitration or regulatory proceedings that are likely to have a material adverse effect on the Funds or the ability of Ameriprise Financial or its affiliates to perform under their
32
Columbia Marsico International Opportunities Fund, February 29, 2012
contracts with the Funds. Ameriprise Financial is required to make 10-Q, 10-K and, as necessary, 8-K filings with the Securities and Exchange Commission on legal and regulatory matters that relate to Ameriprise Financial and its affiliates. Copies of these filings may be obtained by accessing the SEC website at www.sec.gov.
There can be no assurance that these matters, or the adverse publicity associated with them, will not result in increased fund redemptions, reduced sale of fund shares or other adverse consequences to the Funds. Further, although we believe proceedings are not likely to have a material adverse effect on the Funds or the ability of Ameriprise Financial or its affiliates to perform under their contracts with the Funds, these proceedings are subject to uncertainties and, as such, we are unable to estimate the possible loss or range of loss that may result. An adverse outcome in one or more of these proceedings could result in adverse judgments, settlements, fines, penalties or other relief that could have a material adverse effect on the consolidated financial condition or results of operations of Ameriprise Financial.
33
Report of Independent Registered Public Accounting Firm
To the Trustees of Columbia Funds Series Trust and the Shareholders of Columbia Marsico International Opportunities Fund
In our opinion, the accompanying statement of assets and liabilities, including the investment portfolio, and the related statements of operations and of changes in net assets and the financial highlights present fairly, in all material respects, the financial position of Columbia Marsico International Opportunities Fund (the "Fund") (a series of Columbia Funds Series Trust) at February 29, 2012, the results of its operations for the year then ended, the changes in its net assets for each of the two years in the period then ended and the financial highlights for each of the periods indicated, in conformity with accounting principles generally accepted in the United States of America. These financial statements and financial highlights (hereafter referred to as "financial statements") are the responsibility of the Fund's management. Our responsibility is to express an opinion on these financial statements based on our audits. We conducted our audits of these financial statements in accordance with the standards of the Public Company Accounting Oversight Board (United States). Those standards require that we plan and perform the audit to obtain reasonable assurance about whether the financial statements are free of material misstatement. An audit includes examining, on a test basis, evidence supporting the amounts and disclosures in the financial statements, assessing the accounting principles used and significant estimates made by management, and evaluating the overall financial statement presentation. We believe that our audits, which included confirmation of securities at February 29, 2012 by correspondence with the custodian, brokers and transfer agent provide a reasonable basis for our opinion.
PricewaterhouseCoopers LLP
Minneapolis, Minnesota
April 20, 2012
34
Federal Income Tax Information (Unaudited) – Columbia Marsico International Opportunities Fund
Foreign taxes paid during the fiscal year ended February 29, 2012 of $1,459,679 are expected to be passed through to shareholders. This represents $0.03 per share. Eligible shareholders may claim this amount as a foreign tax credit.
Gross income derived from sources within foreign countries was $14,639,182 ($0.28 per share) for the fiscal year ended February 29, 2012.
The Fund will notify shareholders in January 2013 of amounts for use in preparing 2012 income tax returns.
35
Fund Governance
Shareholders elect the Board that oversees the funds' operations. The Board appoints officers who are responsible for day-to-day business decisions based on policies set by the Board. The following table provides basic biographical information about the funds' Board members, including their principal occupations during the past five years, although specific titles for individuals may have varied over the period. Under current Board policy, members may serve until the next Board meeting after he or she reaches the mandatory retirement age established by the Board, or the fifteenth anniversary of the first Board meeting they attended as a member of the Board.
On September 29, 2009, Ameriprise Financial, the parent company of Columbia Management, entered into an agreement with Bank of America, N.A. ("Bank of America") to acquire a portion of the asset management business of Columbia Management Group, LLC and certain of its affiliated companies (the "Transaction"). Following the Transaction, which became effective on May 1, 2010, various alignment activities have occurred with respect to the Fund Family. In connection with the Transaction, Mr. Edward J. Boudreau, Jr., Mr. William P. Carmichael, Mr. William A. Hawkins, Mr. R. Glenn Hilliard, Mr. John J. Nagorniak, Ms. Minor M. Shaw and Dr. Anthony M. Santomero, who were members prior to the Transaction of the Legacy Columbia Nations funds' Board ("Nations Funds"), which includes Columbia Funds Series Trust, Columbia Funds Variable Insurance Trust I and Columbia Funds Master Investment Trust, LLC., began service on the Board for the Legacy RiverSource funds ("RiverSource Funds") effective June 1, 2011, which resulted in an overall increase from twelve Trustees to sixteen for all mutual funds overseen by the Board.
Independent Board Members
| Name, Address, Age | | Position Held
with Funds
and Length
of Service | | Principal Occupation During Past Five Years | | Number of
Funds in the
Fund Family
Overseen by
Board Member | | Other Present or
Past Directorships/
Trusteeships
(Within Past 5 Years) | |
| Kathleen Blatz | |
|
901 S. Marquette Ave.
Minneapolis, MN 55402
Age 57 | | Board member since 1/06 for RiverSource Funds and since 6/11 for Nations Funds | | Attorney; Chief Justice, Minnesota Supreme Court, 1998-2006 | | | 153 | | | None | |
|
| Edward J. Boudreau, Jr. | |
|
225 Franklin Street
Mail Drop
BX32 05228
Boston, MA 02110
Age 67 | | Board member since 6/11 for RiverSource Funds and since 1/05 for Nations Funds | | Managing Director, E.J. Boudreau & Associates (consulting) since 2000 | | | 146 | | | Former Trustee, BofA Funds Series Trust (11 funds) | |
|
| Pamela G. Carlton | |
|
901 S. Marquette Ave.
Minneapolis, MN 55402
Age 57 | | Board member since 7/07 for RiverSource Funds and since 6/11 for Nations Funds | | President, Springboard-Partners in Cross Cultural Leadership (consulting company) | | | 153 | | | None | |
|
36
Fund Governance (continued)
Independent Board Members (continued)
| Name, Address, Age | | Position Held
with Funds
and Length
of Service | | Principal Occupation During Past Five Years | | Number of
Funds in the
Fund Family
Overseen by
Board Member | | Other Present or
Past Directorships/
Trusteeships
(Within Past 5 Years) | |
| William P. Carmichael | |
|
225 Franklin Street
Mail Drop
BX32 05228
Boston, MA 02110
Age 68 | | Board member since 6/11 for RiverSource Funds and since 1999 for Nations Funds | | Retired | | | 146 | | | Director, Cobra Electronics Corporation (electronic equipment manufacturer); The Finish Line (athletic shoes and apparel); McMoRan Exploration Company (oil and gas exploration and development); former Trustee, BofA Funds Series Trust (11 funds); former Director, Spectrum Brands, Inc. (consumer products); former Director, Simmons Company (bedding) | |
|
| Patricia M. Flynn | |
|
901 S. Marquette Ave.
Minneapolis, MN 55402
Age 61 | | Board member since 11/04 for RiverSource Funds and since 6/11 for Nations Funds | | Trustee Professor of Economics and Management, Bentley University; former Dean, McCallum Graduate School of Business, Bentley University | | | 153 | | | None | |
|
| William A. Hawkins | |
|
225 Franklin Street
Mail Drop
BX32 05228
Boston, MA 02110
Age 69 | | Board member since 6/11 for RiverSource Funds and since 1/05 for Nations Funds | | Managing Director, Overton Partners (financial consulting), since August 2010; President and Chief Executive Officer, California General Bank, N.A., January 2008-August 2010 | | | 146 | | | Trustee, BofA Funds Series Trust (11 funds) | |
|
| R. Glenn Hilliard | |
|
225 Franklin Street
Mail Drop
BX32 05228
Boston, MA 02110
Age 69 | | Board member since 6/11 for RiverSource Funds and since 1/05 for Nations Funds | | Chairman and Chief Executive Officer, Hilliard Group LLC (investing and consulting), since April 2003; Non-Executive Director & Chairman, CNO Financial Group, Inc. (formerly Conseco, Inc.) (insurance), September 2003-May 2011 | | | 146 | | | Chairman, BofA Fund Series Trust (11 funds); former Director, CNO Financial Group, Inc. (insurance) | |
|
37
Fund Governance (continued)
Independent Board Members (continued)
| Name, Address, Age | | Position Held
with Funds
and Length
of Service | | Principal Occupation During Past Five Years | | Number of
Funds in the
Fund Family
Overseen by
Board Member | | Other Present or
Past Directorships/
Trusteeships
(Within Past 5 Years) | |
| Stephen R. Lewis, Jr. | |
|
901 S. Marquette Ave.
Minneapolis, MN 55402
Age 73 | | Chair of the Board for RiverSource Funds since 1/07, Board member for RiverSource Funds since 1/02 and since 6/11 for Nations Funds | | President Emeritus and Professor of Economics Emeritus, Carleton College | | | 153 | | | Director, Valmont Industries, Inc. (manufactures irrigation systems) | |
|
| John F. Maher | |
|
901 S. Marquette Ave.
Minneapolis, MN 55402
Age 68 | | Board member since 12/06 for Legacy Seligman funds, since 12/08 for RiverSource Funds and since 6/11 for Nations Funds | | Retired President and Chief Executive Officer and former Director, Great Western Financial Corporation (financial services), 1986-1997 | | | 153 | | | None | |
|
| John J. Nagorniak | |
|
225 Franklin Street
Mail Drop
BX32 05228
Boston, MA 02110
Age 67 | | Board member since 6/11 for RiverSource Funds and since 1/08 for Nations Funds | | Retired; President and Director, Foxstone Financial, Inc. (consulting), 2000-2007; Director, Mellon Financial Corporation affiliates (investing), 2000-2007; Chairman, Franklin Portfolio Associates (investing—Mellon affiliate), 1982-2007 | | | 146 | | | Trustee, Research Foundation of CFA Institute; Director, MIT Investment Company; Trustee, MIT 401k Plan; former Trustee, BofA Funds Series Trust (11 funds) | |
|
| Catherine James Paglia | |
|
901 S. Marquette Ave.
Minneapolis, MN 55402
Age 59 | | Board member since 11/04 for RiverSource Funds and since 6/11 for Nations Funds | | Director, Enterprise Asset Management, Inc. (private real estate and asset management company) | | | 153 | | | None | |
|
38
Fund Governance (continued)
Independent Board Members (continued)
| Name, Address, Age | | Position Held
with Funds
and Length
of Service | | Principal Occupation During Past Five Years | | Number of
Funds in the
Fund Family
Overseen by
Board Member | | Other Present or
Past Directorships/
Trusteeships
(Within Past 5 Years) | |
| Leroy C. Richie | |
|
901 S. Marquette Ave.
Minneapolis, MN 55402
Age 70 | | Board member since 2000 for Legacy Seligman funds, since 11/08 for RiverSource Funds and since 6/11 for Nations Funds | | Counsel, Lewis & Munday, P.C. since 2004; former Vice President and General Counsel, Automotive Legal Affairs, Chrysler Corporation | | | 153 | | | Director, Digital Ally, Inc. (digital imaging); Director, Infinity, Inc. (oil and gas exploration and production); Director, OGE Energy Corp. (energy and energy services) | |
|
| Minor M. Shaw | |
|
225 Franklin Street
Mail Drop
BX32 05228
Boston, MA 02110
Age 64 | | Board member since 6/11 for RiverSource Funds and since 2003 for Nations Funds | | President—Micco LLC (private investments) | | | 146 | | | Former Trustee, BofA Funds Series Trust (11 funds); Board Member, Piedmont Natural Gas; Director, Blue Cross Blue Shield of South Carolina | |
|
| Alison Taunton-Rigby | |
|
901 S. Marquette Ave.
Minneapolis, MN 55402
Age 67 | | Board member since 11/02 for RiverSource Funds and since 6/11 for Nations Funds | | Chief Executive Officer and Director, RiboNovix, Inc. 2003-2010 (biotechnology); former President, Aquila Biopharmaceuticals | | | 153 | | | Director, Healthways, Inc. (health management programs); Director, ICI Mutual Insurance Company, RRG; Director, Abt Associates (government contractor) | |
|
39
Fund Governance (continued)
Interested Board Member Not Affiliated with Investment Manager*
| Name, Address, Age | | Position Held
with Funds
and Length
of Service | | Principal Occupation During Past Five Years | | Number of
Funds in the
Fund Family
Overseen by
Board Member | | Other Present or
Past Directorships/
Trusteeships
(Within Past 5 Years) | |
| Anthony M. Santomero* | |
|
225 Franklin Street
Mail Drop
BX32 05228
Boston, MA 02110
Age 65 | | Board member since 6/11 for RiverSource Funds and since 1/08 for Nations Funds | | Richard K. Mellon Professor Emeritus of Finance, The Wharton School, University of Pennsylvania, since 2002; Senior Advisor, McKinsey & Company (consulting), 2006-2008; President and Chief Executive Officer, Federal Reserve Bank of Philadelphia, 2000-2006 | | | 146 | | | Director, Renaissance Reinsurance Ltd.; Trustee, Penn Mutual Life Insurance Company; Director, Citigroup; Director, Citibank, N.A.; former Trustee, BofA Funds Series Trust (11 funds) | |
|
* Dr. Santomero is not an affiliated person of the Investment Manager or Ameriprise Financial. However, he is currently deemed by the funds to be an "interested person" (as defined in the 1940 Act) of the Funds because he serves as a Director of Citigroup, Inc. and Citibank N.A., companies that may directly or through subsidiaries and affiliates engage from time-to-time in brokerage execution, principal transactions and lending relationships with the funds or accounts advised/managed by the Investment Manager.
Interested Board Member Affiliated with Investment Manager*
| William F. Truscott | |
|
53600 Ameriprise Financial Center
Minneapolis, MN 55474
Age 51 | | Board member since 11/01 for RiverSource Funds and since 6/11 for Nations Funds; Senior Vice President since 2002 for RiverSource Funds and 5/10 for Nations Funds | | Chairman of the Board and President, Columbia Management Investment Advisers, LLC since May 2010 and February 2012, respectively (previously President, Chairman of the Board and Chief Investment Officer, 2001-April 2010); Chief Executive Officer, U.S. Asset Management & President, Annuities, Ameriprise Financial, Inc. since May 2010 (previously President—U.S. Asset Management and Chief Investment Officer, 2005-April 2010); Director, President and Chief Executive Officer, Ameriprise Certificate Company since 2006; Director and Chief Executive Officer, Columbia Management Investment Distributors, Inc. since May 2010 and February 2012, respectively (previously Chairman of the Board and Chief Executive Officer, 2006-April 2010); Chairman of the Board and Chief Executive Officer, RiverSource Distributors, Inc., since 2006. | | | 153 | | | None | |
|
* Interested person (as defined under the 1940 Act) by reason of being an officer, director, security holder and/or employee of the Investment Manager or Ameriprise Financial.
The SAI has additional information about the Fund's Board members and is available, without charge, upon request by calling 800.345.6611; contacting your financial intermediary; or visiting columbiamanagement.com.
40
Fund Governance (continued)
Officers
| Name, Year of Birth and Address | | Principal Occupation(s) During the Past Five Years | |
| J. Kevin Connaughton (Born 1964) | |
|
225 Franklin Street
Boston, MA 02110
President (since 2009) | | Senior Vice President and General Manager—Mutual Fund Products, Columbia Management Investment Advisers, LLC since May 2010; President, Columbia Funds, since 2009, and RiverSource Funds, since May 2010 (previously Senior Vice President and Chief Financial Officer, Columbia Funds, from June 2008 to January 2009, Treasurer, Columbia Funds, from October 2003 to May 2008, and senior officer of various other affiliated funds since 2000); Managing Director, Columbia Management Advisors, LLC from December 2004 to April 2010. | |
|
| Michael G. Clarke (Born 1969) | |
|
225 Franklin Street
Boston, MA 02110
Treasurer (since 2011) and Chief Financial Officer (since 2009) | | Vice President, Columbia Management Investment Advisers, LLC since May 2010; Managing Director of Fund Administration, Columbia Management Advisors, LLC, from September 2004 to April 2010; senior officer of Columbia Funds and affiliated funds since 2002. | |
|
| Scott R. Plummer (Born 1959) | |
|
5228 Ameriprise Financial Center
Minneapolis, MN 55474
Senior Vice President and Chief Legal Officer (since 2010) | | Chief Legal Officer and Assistant Secretary, Columbia Management Investment Advisers, LLC since June 2005; Vice President and Lead Chief Counsel—Asset Management, Ameriprise Financial, Inc. since May 2010 (previously Vice President and Chief Counsel—Asset Management, from 2005 to April 2010, Vice President, Chief Counsel and Assistant Secretary, Columbia Management Investment Distributors, Inc. since 2008; Vice President, General Counsel and Secretary, Ameriprise Certificate Company since 2005; Chief Counsel, RiverSource Distributors, Inc. since 2006; Senior officer of Columbia Funds and affiliated funds, since 2006. | |
|
| Thomas P. McGuire (Born 1972) | |
|
225 Franklin Street
Boston, MA 02110
Interim Chief Compliance Officer (since 2012) | | Vice President—Asset Management Compliance, Columbia Management Investment Advisers, LLC since March 2010; Chief Compliance Officer, Ameriprise Certificate Company, since September 2010; Compliance Executive, Bank of America, from June 2005 to April 2010. | |
|
| William F. Truscott (Born 1960) | |
|
53600 Ameriprise Financial Center
Minneapolis, MN 55474
Senior Vice President (since 2010) | | Chairman of the Board and President, Columbia Management Investment Advisers, LLC since May 2010 and February 2012, respectively (previously President, Chairman of the Board and Chief Investment Officer, from 2001 to April 2010); Chief Executive Officer, U.S. Asset Management & President, Annuities, Ameriprise Financial, Inc. since May 2010 (previously President—U.S. Asset Management and Chief Investment Officer from 2005 to April 2010, Director, President and Chief Executive Officer, Ameriprise Certificate Company since 2006; Director and Chief Executive Officer, Columbia Management Investment Distributors, Inc. since May 2010 and February 2012, respectively (previously Chairman of the Board and Chief Executive Officer from 2008 to April 2010); Chairman of the Board and Chief Executive Officer, RiverSource Distributors, Inc. since 2006. | |
|
| Paul D. Pearson (Born 1956) | |
|
10468 Ameriprise Financial Center
Minneapolis, MN 55474
Vice President and Assistant Treasurer (since 2011) | | Vice President—Investment Accounting, Columbia Management Investment Advisers, LLC, since May 2010; Vice President—Managed Assets, Investment Accounting, Ameriprise Financial Corporation, 1998-2010. | |
|
41
Fund Governance (continued)
Officers (continued)
| Name, Year of Birth and Address | | Principal Occupation(s) During the Past Five Years | |
| Colin Moore (Born 1958) | |
|
225 Franklin Street
Boston, MA 02110
Senior Vice President (since 2010) | | Director and Chief Investment Officer, Columbia Management Investment Advisers, LLC since May 2010; Manager, Managing Director and Chief Investment Officer of Columbia Management Advisors, LLC from 2007 to April 2010; Head of Equities, Columbia Management Advisors, LLC from 2002 to 2007. | |
|
| Christopher O. Petersen (Born 1970) | |
|
5228 Ameriprise Financial Center
Minneapolis, MN 55474
Vice President and Secretary (since 2011) | | Vice President and Chief Counsel, Ameriprise Financial since January 2010 (formerly Vice President and Group Counsel or Counsel from April 2004 to January 2010); Senior officer of Columbia Funds and affiliated funds, since 2007. | |
|
| Amy K. Johnson (Born 1965) | |
|
5228 Ameriprise Financial Center
Minneapolis, MN 55474
Vice President (since 2010) | | Senior Vice President and Chief Operating Officer, Columbia Management Investment Advisers, LLC since May 2010 (previously Chief Administrative Officer, from 2009 until April 2010, Vice President—Asset Management and Trust Company Services, from 2006 to 2009, and Vice President—Operations and Compliance from 2004 to 2006). | |
|
| Joseph F. DiMaria (Born 1968) | |
|
225 Franklin Street
Boston, MA 02110
Vice President (since 2011) and Chief Accounting Officer (since 2008) | | Vice President, Mutual Fund Administration, Columbia Management Investment Advisers, LLC, since May 2010; Director of Fund Administration, Columbia Management Advisors, LLC from January 2006 to April 2010. | |
|
| Paul B. Goucher (Born 1968) | |
|
100 Park Avenue
New York, NY 10017
Vice President and Assistant Secretary (since 2010) | | Vice President and Chief Counsel of Ameriprise Financial since January 2010 (formerly Vice President and Group Counsel from November 2008 to January 2010); Director, Managing Director and General Counsel of J. & W. Seligman & Co. Incorporated (Seligman) from July 2008 to November 2008 and Managing Director and Associate General Counsel of Seligman from January 2005 to July 2008. | |
|
| Michael E. DeFao (Born 1968) | |
|
225 Franklin Street
Boston, MA 02110
Vice President and Assistant Treasurer (since 2011) | | Vice President and Chief Counsel, Ameriprise Financial since May 2010; Associate General Counsel, Bank of America from June 2005 to April 2010 | |
|
| Stephen T. Welsh (Born 1957) | |
|
225 Franklin Street
Boston, MA 02110
Vice President (since 2006) | | President and Director, Columbia Management Investment Services Corp. since May 2010; President and Director, Columbia Management Services, Inc. from July 2004 to April 2010; Managing Director, Columbia Management Distributors, Inc. from August 2007 to April 2010. | |
|
42
This page intentionally left blank.
43
This page intentionally left blank.
44
Important Information About This Report
The fund mails one shareholder report to each shareholder address. If you would like more than one report, please call shareholder services at 1-800-345-6611 and additional reports will be sent to you. This report has been prepared for shareholders of Columbia Marsico International Opportunities Fund.
A description of the policies and procedures that the fund uses to determine how to vote proxies and a copy of the fund's voting records are available (i) at www.columbiamanagement.com, (ii) on the Securities and Exchange Commission's website at www.sec.gov, and (iii) without charge, upon request, by calling 1-800-368-0346. Information regarding how the fund voted proxies relating to portfolio securities during the 12-month period ended June 30 is available from the SEC's website. Information regarding how the fund voted proxies relating to portfolio securities is also available from the fund's website, www.columbiamanagement.com.
The fund files a complete schedule of portfolio holdings with the SEC for the first and third quarters of each fiscal year on Form N-Q. The fund's Form N-Q is available on the SEC's website at www.sec.gov and may be reviewed and copied at the SEC's Public Reference Room in Washington, D.C. Information on the operation of the Public Reference Room may be obtained by calling 1-800-SEC-0330.
Transfer Agent
Columbia Management Investment
Services Corp.
P.O. Box 8081
Boston, MA 02266-8081
1-800-345-6611
Distributor
Columbia Management Investment
Distributors, Inc.
225 Franklin Street
Boston, MA 02110
Investment Manager
Columbia Management Investment Advisers, LLC
225 Franklin Street
Boston, MA 02110
45

Columbia Marsico International Opportunities Fund
P. O. Box 8081
Boston, MA 02266-8081
columbiamanagement.com
This information is for use with concurrent or prior delivery of a fund prospectus. Investors should consider the investment objectives, risks, charges and expenses of a mutual fund carefully before investing. For a free prospectus, which contains this and other important information about the funds, visit columbiamanagement.com. Read the prospectus carefully before investing. The Fund is distributed by Columbia Management Investment Distributors, Inc., member FINRA, and managed by Columbia Management Investment Advisers, LLC.
© 2012 Columbia Management Investment Advisers, LLC. All rights reserved.
C-1276 C (4/12)

Columbia Mid Cap Value Fund
Annual Report for the Period Ended February 29, 2012
Not FDIC insured • No bank guarantee • May lose value
Table of Contents
| Fund Profile | | | 1 | | |
|
| Performance Information | | | 2 | | |
|
| Understanding Your Expenses | | | 3 | | |
|
| Portfolio Manager's Report | | | 4 | | |
|
| Portfolio of Investments | | | 6 | | |
|
Statement of Assets and
Liabilities | | | 13 | | |
|
| Statement of Operations | | | 15 | | |
|
Statement of Changes in
Net Assets | | | 16 | | |
|
| Financial Highlights | | | 18 | | |
|
| Notes to Financial Statements | | | 27 | | |
|
Report of Independent Registered
Public Accounting Firm | | | 38 | | |
|
| Federal Income Tax Information | | | 39 | | |
|
| Fund Governance | | | 40 | | |
|
Important Information About
This Report | | | 49 | | |
|
The views expressed in this report reflect the current views of the respective parties. These views are not guarantees of future performance and involve certain risks, uncertainties and assumptions that are difficult to predict, so actual outcomes and results may differ significantly from the views expressed. These views are subject to change at any time based upon economic, market or other conditions and the respective parties disclaim any responsibility to update such views. These views may not be relied on as investment advice and, because investment decisions for a Columbia Fund are based on numerous factors, may not be relied on as an indication of trading intent on behalf of any particular Columbia Fund. References to specific securities should not be construed as a recommendation or investment advice.
President's Message

Dear Shareholders,
Americans were dispirited in the fourth quarter of 2011 by Washington's inability to reach a plan for deficit reduction and Europe's piecemeal attempt to address its own fiscal issues. Yet, there was sufficient good news to encourage risk taking, buoying both stocks and bonds to solid gains.
U.S. economic data surprised on the upside and fears of recession abated. With the bar of expectations set low, investors responded positively to the announcement that the economy had expanded by 1.8% in the third quarter. Consumer confidence improved, even though consumers remain under pressure with no real increase in disposable income and a continued decline in household net worth. Headline inflation—which tracks a broad range of consumer expenditures, including food and energy—declined. Even manufacturing held its ground.
Against this backdrop, the U.S. equity markets logged solid returns. The S&P 500 Index gained 11.82%, moving into positive territory for the year with quarterly advances in all ten sectors. Mid- and small-cap stocks did even better. Value outperformed growth across all market capitalizations. Energy stocks led the market, as the price of oil moved above $100 a barrel in December. Industrials and materials stocks rose, buoyed by improving economic data. The U.S. fixed-income markets logged modest but solid returns. High-yield bonds were the best performers as the economy showed signs of improvement. Emerging market bonds were strong performers, as inflation came under control in key regions. Municipal bonds and Treasuries eked out only modest gains, as investors moved away from quality in favor of riskier assets.
While fourth quarter gains were encouraging, challenges still remain. Columbia Management, however, remains strong and steadfast. Columbia Management is the eighth largest manager of long-term mutual fund assets with $326 billion under management as of December 31, 2011. The past year has been one of considerable change for the organization as we worked diligently to align products, services and resources in the integration of Columbia Management with RiverSource Investments. The strong line-up of talent, resources and capabilities that has resulted is highlighted by the success of our products. As of December 31, 2011, Columbia Management offers 52 funds rated either 4 or 5 stars by Morningstar.*
For more information about these and other funds offered by Columbia Management, including detailed, up-to-date fund performance and portfolio information, please visit us online at columbiamanagement.com. Other information and resources available on our website include:
g timely economic analysis and market commentary
g quarterly fund commentaries
g Columbia Management Investor, a quarterly newsletter for shareholders
Thank you for your continued support of the Columbia Funds. We look forward to serving your investment needs for many years to come.
Best Regards,

J. Kevin Connaughton
President, Columbia Funds
* All ratings are based on Class Z shares as of 12/31/2011. Out of 119 Class Z share Columbia funds rated by Morningstar, 7 funds received a 5-star Overall Rating and 45 funds received a 4-star Overall Rating. The Overall Morningstar Rating for a retail mutual fund is derived from a weighted average of the performance figures associated with its 3-, 5- and 10-year (if applicable) Morningstar Rating metrics. For share classes that do not have a 3-, 5-, or 10-year actual performance history, the fund's independent Morningstar Rating metric is then compared against the retail mutual fund universe breakpoints to determine its hypothetical rating.
For each fund with at least a three-year history, Morningstar calculates a Morningstar RatingTM based on a Morningstar Risk-Adjusted Return measure that accounts for variation in a fund's monthly performance (including the effects of sales charges/loads, and redemption fees), placing more emphasis on downward variations and rewarding consistent performance. The top 10% of funds in each category receive 5 stars, the next 22.5% receive 4 stars, the next 35% receive 3 stars, the next 22.5% receive 2 stars and the bottom 10% receive 1 star. (Each share class is counted as a fraction of one fund within this scale and rated separately, which may cause slight variations in the distribution percentages.)
The Morningstar RatingTM is for Class Z shares only; other classes may have different performance characteristics and may have different ratings. ©2012 Morningstar, Inc. All Rights Reserved. The Morningstar information contained herein: (1) is proprietary to Morningstar and/or its content providers; (2) may not be copied or distributed; and (3) is not warranted to be accurate, complete or timely. Neither Morningstar nor its content providers are responsible for any damages or losses arising from any use of this information.
Investors should consider the investment objectives, risks, charges and expenses of a mutual fund carefully before investing. For a free prospectus, which contains this and other important information about the funds, visit columbiamanagement.com. The prospectus should be read carefully before investing.
Columbia Funds are distributed by Columbia Management Investment Distributors, Inc., member FINRA, and managed by Columbia Management Investment Advisers, LLC.
© 2012 Columbia Management Investment Advisers, LLC. All rights reserved.
Fund Profile – Columbia Mid Cap Value Fund
Summary
g For the 12-month period that ended February 29, 2012, the fund's Class A shares returned –1.75% without sales charge.
g The fund lagged its benchmark, the Russell Midcap Value Index,1 which returned 1.45%.
g Most of the underperformance came from disappointing stock selection, particularly in the industrials and consumer staples sectors.
Portfolio Management
Lori J. Ensinger has co-managed the fund since its inception in 2001 and transitioned to Columbia Management Investment Advisers, LLC (the Investment Manager) as part of its acquisition of the long-term asset management business of the fund's previous investment adviser from Bank of America in May of 2010.
David I. Hoffman has co-managed the fund since 2004 and transitioned to the Investment Manager as part of its acquisition of the long-term asset management business of the fund's previous investment adviser from Bank of America in May of 2010.
Noah J. Petrucci has co-managed the fund since 2002 and transitioned to the Investment Manager as part of its acquisition of the long-term asset management business of the fund's previous investment manager from Bank of America in May of 2010.
1The Russell Midcap Value Index measures the performance of those Russell Midcap companies with lower price-to-book ratios and lower forecasted growth values. The stocks are also members of the Russell 1000 Value Index.
Indices are not available for investment, are not professionally managed and do not reflect sales charges, fees, brokerage commissions, taxes or other expenses of investing. Securities in the fund may not match those in an index.
Performance data quoted represents past performance and current performance may be lower or higher. Past performance is no guarantee of future results. The investment return and principal value will fluctuate so that shares, when redeemed, may be worth more or less than the original cost. Please visit www.columbiamanagement.com for daily and most recent month-end performance updates.
Summary
1-year return as of 02/29/12
| | | | –1.75% | |
|
|  | | | Class A shares
(without sales charge) | |
|
| | | | +1.45% | |
|
|  | | | Russell Midcap Value Index | |
|
Morningstar Style BoxTM
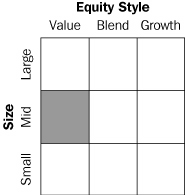
The Morningstar Style BoxTM is based on the fund's portfolio holdings. For equity funds, the vertical axis shows the market capitalization of the stocks owned, and the horizontal axis shows investment style (value, blend, or growth). Information shown is based on the most recent data provided by Morningstar.
© 2012 Morningstar, Inc. All rights reserved. The Morningstar information contained herein: (1) is proprietary to Morningstar and/or its content providers; (2) may not be copied or distributed; and (3) is not warranted to be accurate, complete or timely. Neither Morningstar nor its content providers are responsible for any damages or losses arising from any use of this information.
1
Performance Information – Columbia Mid Cap Value Fund
Performance data quoted represents past performance and current performance may be lower or higher. Past performance is no guarantee of future results. The investment return and principal value will fluctuate so that shares, when redeemed, may be worth more or less than the original cost. Please visit www.columbiamanagement.com for daily and most recent month-end performance updates.
Performance of a $10,000 investment 03/01/02 – 02/29/12
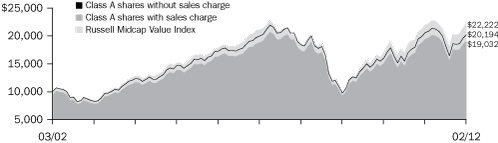
The chart above shows the change in value of a hypothetical $10,000 investment in Class A shares of Columbia Mid Cap Value during the stated time period, and does not reflect the deduction of taxes that a shareholder may pay on fund distributions or on the redemption of fund shares.
Performance of a $10,000 investment 03/01/02 – 02/29/12 ($)
| Sales charge | | without | | with | |
| Class A | | | 20,194 | | | | 19,032 | | |
| Class B | | | 18,728 | | | | 18,728 | | |
| Class C | | | 18,719 | | | | 18,719 | | |
| Class I* | | | 20,321 | | | | n/a | | |
| Class R* | | | 19,689 | | | | n/a | | |
| Class R4* | | | 20,219 | | | | n/a | | |
| Class W* | | | 20,180 | | | | n/a | | |
| Class Y* | | | 20,347 | | | | n/a | | |
| Class Z | | | 20,686 | | | | n/a | | |
Average annual total return as of 02/29/12 (%)
| Share class | | A | | B | | C | | I* | | R* | | R4* | | W* | | Y* | | Z | |
| Inception | | 11/20/01 | | 11/20/01 | | 11/20/01 | | 09/27/10 | | 01/23/06 | | 03/07/11 | | 09/27/10 | | 07/15/09 | | 11/20/01 | |
| Sales charge | | without | | with | | without | | with | | without | | with | | without | | without | | without | | without | | without | | without | |
| 1-year | | | –1.75 | | | | –7.41 | | | | –2.55 | | | | –7.41 | | | | –2.54 | | | | –3.51 | | | | –1.32 | | | | –2.04 | | | | –1.63 | | | | –1.74 | | | | –1.40 | | | | –1.50 | | |
| 5-year | | | 0.27 | | | | –0.91 | | | | –0.49 | | | | –0.87 | | | | –0.49 | | | | –0.49 | | | | 0.39 | | | | 0.01 | | | | 0.29 | | | | 0.27 | | | | 0.42 | | | | 0.52 | | |
| 10-year | | | 7.28 | | | | 6.65 | | | | 6.48 | | | | 6.48 | | | | 6.47 | | | | 6.47 | | | | 7.35 | | | | 7.01 | | | | 7.29 | | | | 7.27 | | | | 7.36 | | | | 7.54 | | |
The "with sales charge" returns include the maximum initial sales charge of 5.75% for Class A shares and the applicable contingent deferred sales charge of 5.00% in the first year, declining to 1.00% in the sixth year and eliminated thereafter for Class B shares and 1.00% for Class C shares in the first year only. The "without sales charge" returns do not include the effect of sales charges. If they had, returns would be lower.
Performance results reflect any fee waivers or reimbursements of fund expenses by Columbia Management Investment Advisers, LLC and/or any of its affiliates. Absent these fee waivers or expense reimbursement arrangements, performance results would have been lower.
All results shown assume reinvestment of distributions. Class I, Class Y and Class Z shares are sold at net asset value with no distribution and service (Rule 12b-1) fees. Class R and Class W shares are sold at net asset value with distribution and/or service (Rule 12b-1) fees. Class I, Class R, Class R4, Class W, Class Y, and Class Z shares have limited eligibility and the investment minimum requirements may vary. Please see the fund's prospectuses for details. Performance for different share classes will vary based on differences in sales charges and fees associated with each class.
The tables do not reflect the deduction of taxes that a shareholder may pay on fund distributions or on the redemption of fund shares.
*The returns shown for periods prior to the share class inception date (including returns since inception, which are since fund inception) include the returns of the fund's oldest share class. These returns are adjusted to reflect any higher class-related operating expenses of the newer share classes, as applicable. Please visit columbiamanagement.com/mutual-funds/appended-performance for more information.
2
Understanding Your Expenses – Columbia Mid Cap Value Fund
As an investor, you incur two types of costs. There are transaction costs, which generally include sales charges on purchases and may include redemption fees. There are also ongoing costs, which generally include management fees, distribution and service (Rule 12b-1) fees, and other fund expenses. The following information is intended to help you understand your ongoing costs (in dollars) of investing in the Fund and to help you compare these costs with the ongoing costs of investing in other mutual funds.
Analyzing your fund's expenses
To illustrate these ongoing costs, we have provided examples and calculated the expenses paid by investors in each share class of the Fund during the period. The actual and hypothetical information in the table is based on an initial investment of $1,000 at the beginning of the period indicated and held for the entire period. Expense information is calculated two ways and each method provides you with different information. The amount listed in the "Actual" column is calculated using the Fund's actual operating expenses and total return for the period. You may use the Actual information, together with the amount invested, to estimate the expenses that you paid over the period. Simply divide your account value by $1,000 (for example, an $8,600 account value divided by $1,000 = 8.6), then multiply the results by the expenses paid during the period under the Actual column. The amount listed in the "Hypothetical" column assumes a 5% annual rate of return before expenses (which is not the Fund's actual return) and then applies the Fund's actual expense ratio for the period to the hypothetical return. You should not use the hypothetical account values and expenses to estimate either your actual account balance at the end of the period or the expenses you paid during the period. See "Compare with other funds" below for details on how to use the hypothetical data.
Compare with other funds
Since all mutual funds are required to include the same hypothetical calculations about expenses in shareholder reports, you can use this information to compare the ongoing cost of investing in the Fund with other funds. To do so, compare the hypothetical example with the 5% hypothetical examples that appear in the shareholder reports of other funds. As you compare hypothetical examples of other funds, it is important to note that hypothetical examples are meant to highlight the ongoing costs of investing in a fund only and do not reflect any transaction costs, such as sales charges, or redemption or exchange fees. Therefore, the hypothetical calculations are useful in comparing ongoing costs only, and will not help you determine the relative total costs of owning different funds. If transaction costs were included in these calculations, your costs would be higher.
September 1, 2011 – February 29, 2012
| | | Account value at the
beginning of the period ($) | | Account value at the
end of the period ($) | | Expenses paid
during the period ($) | | Fund's annualized
expense ratio (%) | |
| | | Actual | | Hypothetical | | Actual | | Hypothetical | | Actual | | Hypothetical | | Actual | |
| Class A | | | 1,000.00 | | | | 1,000.00 | | | | 1,116.10 | | | | 1,018.90 | | | | 6.31 | | | | 6.02 | | | | 1.20 | % | |
| Class B | | | 1,000.00 | | | | 1,000.00 | | | | 1,112.30 | | | | 1,015.17 | | | | 10.24 | | | | 9.77 | | | | 1.95 | % | |
| Class C | | | 1,000.00 | | | | 1,000.00 | | | | 1,111.80 | | | | 1,015.17 | | | | 10.24 | | | | 9.77 | | | | 1.95 | % | |
| Class I | | | 1,000.00 | | | | 1,000.00 | | | | 1,118.70 | | | | 1,021.23 | | | | 3.85 | | | | 3.67 | | | | 0.73 | % | |
| Class R | | | 1,000.00 | | | | 1,000.00 | | | | 1,114.70 | | | | 1,017.65 | | | | 7.62 | | | | 7.27 | | | | 1.45 | % | |
| Class R4 | | | 1,000.00 | | | | 1,000.00 | | | | 1,117.00 | | | | 1,019.94 | | | | 5.21 | | | | 4.97 | | | | 0.99 | % | |
| Class W | | | 1,000.00 | | | | 1,000.00 | | | | 1,116.30 | | | | 1,018.70 | | | | 6.52 | | | | 6.22 | | | | 1.24 | % | |
| Class Y | | | 1,000.00 | | | | 1,000.00 | | | | 1,118.20 | | | | 1,020.74 | | | | 4.37 | | | | 4.17 | | | | 0.83 | % | |
| Class Z | | | 1,000.00 | | | | 1,000.00 | | | | 1,118.30 | | | | 1,020.14 | | | | 5.00 | | | | 4.77 | | | | 0.95 | % | |
Expenses paid during the period are equal to the annualized expense ratio for each class as indicated above, multiplied by the average account value over the period and then multiplied by the number of days in the Fund's most recent fiscal half year and divided by 366.
Expenses do not include fees and expenses incurred indirectly by the Fund from the underlying funds in which the Fund may invest (also referred to as "acquired funds"), including affiliated and non-affiliated pooled investments vehicles (including mutual funds and exchange traded funds).
Had Columbia Management Investment Advisers, LLC and/or certain of its affiliates not waived/reimbursed certain fees and expenses, account value at the end of the period would have been reduced.
3
Portfolio Managers' Report – Columbia Mid Cap Value Fund
Performance data quoted represents past performance and current performance may be lower or higher. Past performance is no guarantee of future results. The investment return and principal value will fluctuate so that shares, when redeemed, may be worth more or less than the original cost. Please visit www.columbiamanagement.com for daily and most recent month-end performance updates.
Net asset value per share
as of 02/29/12 ($)
| Class A | | | 13.91 | | |
| Class B | | | 13.52 | | |
| Class C | | | 13.57 | | |
| Class I | | | 13.91 | | |
| Class R | | | 13.89 | | |
| Class R4 | | | 13.94 | | |
| Class W | | | 13.91 | | |
| Class Y | | | 13.91 | | |
| Class Z | | | 13.93 | | |
Distributions declared per share
03/01/11 – 02/29/12 ($)
| Class A | | | 0.07 | | |
| Class B | | | 0.01 | | |
| Class C | | | 0.01 | | |
| Class I | | | 0.13 | | |
| Class R | | | 0.04 | | |
| Class R4 | | | 0.08 | | |
| Class W | | | 0.07 | | |
| Class Y | | | 0.12 | | |
| Class Z | | | 0.11 | | |
For the 12-month period that ended February 29, 2012, the fund's Class A shares returned –1.75% without sales charge. The fund's benchmark, the Russell Midcap Value Index, returned 1.45%. The fund remained focused on attractively valued stocks where we see the potential for improvement in operating margins. However, stock selection hampered results versus the index in a year where macro concerns moved the market.
More volatility for stocks
Although equity market returns were modestly positive, the year was volatile. Headwinds began last spring with a tsunami and earthquake disaster in Japan, an uprising in the Arab world and accelerating sovereign debt problems in Europe. Stocks were further pressured over the summer by concerns over an economic slowdown in China and, in the United States, by sluggish economic growth, the federal budget debacle and an historic federal government credit rating downgrade. Stocks plunged in the third quarter, with the Russell MidCap Value Index declining 18.5%. The market began a sustained rally in October, as recession fears eased and Europe began taking steps to address its issues. The Russell index returned 13.4% in the fourth quarter and continued to gain in the first few months of 2012. In a year that favored companies with stable businesses and high yields, larger-cap stocks beat smaller caps, and more defensive areas, such as consumer staples and utilities, outpaced more economically sensitive sectors, including industrials, materials and energy.
Disappointing results in industrials and consumer staples
Stock selection in the industrials sector was the biggest detractor from relative performance. Our emphasis on construction and engineering companies, including Foster Wheeler (position eliminated), detracted from performance as investors began fearing that slowing global economic growth would dampen government spending on infrastructure projects. An underweight and disappointing stock selection in the consumer staples sector also had a negative impact. Detractors there included an underweight in tobacco company Lorillard (0.5% of net assets), whose outperformance was driven by continued solid fundamentals in its core business, as well as diminishing concerns over the likelihood of a ban on menthol cigarettes. The fund continues to hold a position in Lorillard. Elsewhere, disappointments included coal producer Peabody Energy (0.5% of net assets) within energy, injectable drug manufacturer Hospira (position eliminated) within health care and life insurer Lincoln National (position eliminated) within financials. Peabody's stock sank due to competition from low natural gas prices, while shares of Hospira tumbled when quality control problems surfaced at its plants. We sold Hospira before period end. Lincoln National's stock fell as low interest rates hurt its investment portfolios. An underweight in the more defensive utilities sector further eroded relative results.
4
Portfolio Managers' Report (continued) – Columbia Mid Cap Value Fund
Positive contribution from consumer discretionary and financials
Investments in the consumer discretionary sector, particularly among specialty and multi-line retailers, aided relative performance. Standouts included athletic apparel retailer Foot Locker (1.3% of net assets), whose strong sales, dividend increase and expanded stock repurchase program attracted investors. An underweight in the weak performing financials sector aided results, as did positive stock selection. Winners included credit card issuer Discover Financial Services (1.1% of net assets), whose stock benefited from growing market share, declining credit costs and an increase in consumer spending in the second half of the year. Elsewhere, top contributors included Cabot Oil and Gas (0.3% of net assets), an independent oil and gas company, whose sharp rally was fueled by accelerating production growth, higher well productivity and increased investor interest in Marcellus Shale (position eliminated). Shares of Equity Residential (position eliminated), an apartment real estate investment trust, climbed nicely, as growing demand for apartment rentals and the company's relatively strong dividend attracted investors.
Positioned for more market volatility
We remain cautiously optimistic that the past year's macro concerns will ease. However, we expect some of these headwinds to linger, which could be a source of future market volatility. For that reason, the fund ended the period with less exposure to economically sensitive areas than it had a year earlier. We are optimistic about prospects for value stocks, which lagged growth stocks over the past year. Going forward, we remain focused on attractively valued securities issued by companies whose operating margins appear to have bottomed and seem ripe for incremental improvement.
Equity securities are subject to stock market fluctuations that occur in response to economic and business developments.
Stocks of mid-cap companies pose special risks, including possible illiquidity and greater price volatility than stocks of larger, more established companies.
Value stocks are stocks of companies that may have experienced adverse business or industry developments or may be subject to special risks that have caused the stocks to be out of favor. If the manager's assessment of a company's prospects is wrong, the price of its stock may not approach the value the manager has placed on it.
Portfolio breakdown1
(as of February 29, 2012)
| STOCKS | | | 94.9 | % | |
| Consumer Discretionary | | | 12.0 | | |
| Consumer Staples | | | 5.4 | | |
| Energy | | | 7.5 | | |
| Financials | | | 28.8 | | |
| Health Care | | | 5.7 | | |
| Industrials | | | 11.7 | | |
| Information Technology | | | 6.0 | | |
| Materials | | | 6.5 | | |
| Utilities | | | 11.3 | | |
| Exchange-Traded Funds | | | 2.2 | | |
| Other2 | | | 2.9 | | |
1Percentages indicated are based upon total investments (excluding Investments of Cash Collateral Received for Securities on Loan). The Fund's portfolio composition is subject to change.
2Includes investments in affiliated money market fund.
Top ten holdings1
(as of February 29, 2012)
iShares Russell Midcap
Value Index Fund | | | 2.2 | % | |
Reinsurance Group of
America, Inc. | | | 1.9 | | |
| Liberty Interactive Corp., Class A | | | 1.6 | | |
| Spectra Energy Corp. | | | 1.6 | | |
| Edison International | | | 1.5 | | |
| Sempra Energy | | | 1.5 | | |
| UDR, Inc. | | | 1.5 | | |
| Diebold, Inc. | | | 1.5 | | |
| JM Smucker Co. (The) | | | 1.5 | | |
| Fifth Third Bancorp | | | 1.4 | | |
1Percentages indicated are based upon total investments (excluding Investments of Cash Collateral Received for Securities on Loan and affiliated money market fund).
For further detail about these holdings, please refer to the section entitled "Portfolio of Investments."
5
Portfolio of Investments – Columbia Mid Cap Value Fund
February 29, 2012
(Percentages represent value of investments compared to net assets)
| Issuer | | Shares | | Value | |
| Common Stocks 94.9% | |
| CONSUMER DISCRETIONARY 12.0% | |
| Auto Components 1.2% | |
| BorgWarner, Inc.(a)(b) | | | 227,800 | | | $ | 18,870,952 | | |
| Tenneco, Inc.(a)(b) | | | 766,610 | | | | 29,514,485 | | |
| Total | | | 48,385,437 | | |
| Automobiles 0.7% | |
| Harley-Davidson, Inc. | | | 594,536 | | | | 27,693,487 | | |
| Distributors 0.8% | |
| Genuine Parts Co.(a) | | | 551,500 | | | | 34,568,020 | | |
| Hotels, Restaurants & Leisure 1.9% | |
| Darden Restaurants, Inc.(a) | | | 449,529 | | | | 22,921,484 | | |
| International Game Technology | | | 1,455,034 | | | | 21,854,611 | | |
| Royal Caribbean Cruises Ltd. | | | 1,019,225 | | | | 29,037,720 | | |
| Starwood Hotels & Resorts Worldwide, Inc.(a) | | | 91,500 | | | | 4,931,850 | | |
| Total | | | 78,745,665 | | |
| Household Durables 0.8% | |
| D.R. Horton, Inc.(a) | | | 2,156,125 | | | | 30,918,833 | | |
| Internet & Catalog Retail 2.4% | |
| Expedia, Inc.(a) | | | 964,150 | | | | 32,829,307 | | |
| Liberty Interactive Corp., Class A(b) | | | 3,335,400 | | | | 62,572,104 | | |
| Total | | | 95,401,411 | | |
| Leisure Equipment & Products 0.7% | |
| Mattel, Inc.(a) | | | 915,450 | | | | 29,697,198 | | |
| Media 0.9% | |
| DISH Network Corp., Class A | | | 1,229,623 | | | | 35,868,103 | | |
| Multiline Retail 0.8% | |
| Macy's, Inc. | | | 861,400 | | | | 32,707,358 | | |
| Specialty Retail 1.8% | |
| Foot Locker, Inc. | | | 1,741,400 | | | | 50,796,638 | | |
| Limited Brands, Inc.(a) | | | 452,750 | | | | 21,066,457 | | |
| Total | | | 71,863,095 | | |
| TOTAL CONSUMER DISCRETIONARY | | | 485,848,607 | | |
| CONSUMER STAPLES 5.4% | |
| Beverages 0.1% | |
| Beam, Inc. | | | 86,350 | | | | 4,756,158 | | |
| Food & Staples Retailing 0.7% | |
| Safeway, Inc.(a) | | | 1,341,400 | | | | 28,773,030 | | |
| Food Products 2.5% | |
| Hershey Co. (The)(a) | | | 332,900 | | | | 20,207,030 | | |
| JM Smucker Co. (The) | | | 759,765 | | | | 57,225,500 | | |
| Post Holdings, Inc.(b) | | | 122,900 | | | | 3,827,106 | | |
| Ralcorp Holdings, Inc.(b) | | | 245,800 | | | | 18,336,680 | | |
| Total | | | 99,596,316 | | |
| Household Products 1.6% | |
| Clorox Co. (The) | | | 348,650 | | | | 23,572,226 | | |
| Energizer Holdings, Inc.(a)(b) | | | 522,400 | | | | 39,937,480 | | |
| Total | | | 63,509,706 | | |
| Tobacco 0.5% | |
| Lorillard, Inc. | | | 166,900 | | | | 21,877,252 | | |
| TOTAL CONSUMER STAPLES | | | 218,512,462 | | |
| Issuer | | Shares | | Value | |
| Common Stocks (continued) | |
| ENERGY 7.4% | |
| Energy Equipment & Services 3.2% | |
| Cameron International Corp.(a)(b) | | | 368,550 | | | $ | 20,531,920 | | |
| Dresser-Rand Group, Inc.(b) | | | 343,250 | | | | 18,027,490 | | |
| Rowan Companies, Inc.(b) | | | 1,284,332 | | | | 47,353,321 | | |
| Superior Energy Services, Inc.(b) | | | 890,100 | | | | 26,115,534 | | |
| Weatherford International Ltd.(a)(b) | | | 1,179,400 | | | | 18,846,812 | | |
| Total | | | 130,875,077 | | |
| Oil, Gas & Consumable Fuels 4.2% | |
| Cabot Oil & Gas Corp. | | | 297,650 | | | | 10,382,032 | | |
| Cimarex Energy Co.(a) | | | 322,090 | | | | 25,983,000 | | |
| Noble Energy, Inc. | | | 198,900 | | | | 19,422,585 | | |
| Peabody Energy Corp. | | | 574,905 | | | | 20,052,687 | | |
| Spectra Energy Corp.(a) | | | 1,980,562 | | | | 62,150,036 | | |
| Whiting Petroleum Corp.(a)(b) | | | 546,666 | | | | 32,056,494 | | |
| Total | | | 170,046,834 | | |
| TOTAL ENERGY | | | 300,921,911 | | |
| FINANCIALS 28.8% | |
| Capital Markets 2.3% | |
| Raymond James Financial, Inc.(a) | | | 1,281,150 | | | | 45,314,276 | | |
| TD Ameritrade Holding Corp.(a) | | | 2,587,350 | | | | 48,305,824 | | |
| Total | | | 93,620,100 | | |
| Commercial Banks 8.9% | |
| CIT Group, Inc.(b) | | | 1,003,600 | | | | 40,856,556 | | |
| City National Corp.(a) | | | 814,287 | | | | 38,271,489 | | |
| Comerica, Inc.(a) | | | 1,514,575 | | | | 44,967,732 | | |
| Cullen/Frost Bankers, Inc.(a) | | | 879,025 | | | | 49,647,332 | | |
| Fifth Third Bancorp | | | 4,110,476 | | | | 55,943,578 | | |
| Huntington Bancshares, Inc. | | | 7,132,383 | | | | 41,688,779 | | |
| SVB Financial Group(a)(b) | | | 770,177 | | | | 45,656,092 | | |
| Zions Bancorporation(a) | | | 2,285,158 | | | | 43,418,002 | | |
| Total | | | 360,449,560 | | |
| Consumer Finance 1.1% | |
| Discover Financial Services | | | 1,429,390 | | | | 42,895,994 | | |
| Insurance 6.3% | |
| Axis Capital Holdings Ltd. | | | 1,498,800 | | | | 46,237,980 | | |
| Hartford Financial Services Group, Inc.(a) | | | 1,987,168 | | | | 41,154,249 | | |
| Principal Financial Group, Inc.(a) | | | 1,703,077 | | | | 47,107,110 | | |
| Reinsurance Group of America, Inc. | | | 1,262,380 | | | | 72,801,455 | | |
| XL Group PLC | | | 2,220,623 | | | | 46,188,958 | | |
| Total | | | 253,489,752 | | |
| Real Estate Investment Trusts (REITs) 8.4% | |
| Alexandria Real Estate Equities, Inc.(a) | | | 460,200 | | | | 32,991,738 | | |
| General Growth Properties, Inc.(a) | | | 1,969,563 | | | | 32,044,790 | | |
| Host Hotels & Resorts, Inc.(a) | | | 3,331,697 | | | | 52,574,179 | | |
| ProLogis, Inc.(a) | | | 1,392,472 | | | | 46,870,607 | | |
| Rayonier, Inc.(a) | | | 831,959 | | | | 37,038,815 | | |
| Rouse Properties, Inc.(a)(b) | | | 77,320 | | | | 1,131,191 | | |
| Taubman Centers, Inc. | | | 782,500 | | | | 54,047,275 | | |
| UDR, Inc. | | | 2,380,700 | | | | 59,565,114 | | |
| Weyerhaeuser Co.(a) | | | 1,084,611 | | | | 22,657,524 | | |
| Total | | | 338,921,233 | | |
The Accompanying Notes to Financial Statements are an integral part of this statement.
6
Columbia Mid Cap Value Fund
February 29, 2012
(Percentages represent value of investments compared to net assets)
| Issuer | | Shares | | Value | |
| Common Stocks (continued) | |
| FINANCIALS (cont.) | |
| Real Estate Management & Development 0.8% | |
| CBRE Group, Inc., Class A(b) | | | 1,872,411 | | | $ | 34,321,294 | | |
| Thrifts & Mortgage Finance 1.0% | |
| People's United Financial, Inc.(a) | | | 3,275,050 | | | | 41,232,880 | | |
| TOTAL FINANCIALS | | | 1,164,930,813 | | |
| HEALTH CARE 5.7% | |
| Health Care Equipment & Supplies 3.0% | |
| Cooper Companies, Inc. (The)(a) | | | 313,675 | | | | 24,930,889 | | |
| Teleflex, Inc. | | | 864,925 | | | | 51,264,105 | | |
| Zimmer Holdings, Inc.(a)(b) | | | 698,850 | | | | 42,455,137 | | |
| Total | | | 118,650,131 | | |
| Health Care Providers & Services 1.5% | |
| Coventry Health Care, Inc.(b) | | | 997,200 | | | | 32,598,468 | | |
| Quest Diagnostics, Inc. | | | 499,886 | | | | 29,018,382 | | |
| Total | | | 61,616,850 | | |
| Life Sciences Tools & Services 0.5% | |
| Agilent Technologies, Inc.(b) | | | 463,825 | | | | 20,232,047 | | |
| Sequenom, Inc.(b) | | | 1,891 | | | | 8,169 | | |
| Total | | | 20,240,216 | | |
| Pharmaceuticals 0.7% | |
| Watson Pharmaceuticals, Inc.(b) | | | 496,700 | | | | 28,967,544 | | |
| TOTAL HEALTH CARE | | | 229,474,741 | | |
| INDUSTRIALS 11.7% | |
| Building Products 0.8% | |
| Owens Corning(b) | | | 1,065,804 | | | | 33,732,697 | | |
| Electrical Equipment 1.5% | |
| Babcock & Wilcox Co. (The)(b) | | | 907,100 | | | | 23,348,754 | | |
| Cooper Industries PLC | | | 609,875 | | | | 37,336,547 | | |
| Total | | | 60,685,301 | | |
| Industrial Conglomerates 0.5% | |
| Carlisle Companies, Inc.(a) | | | 428,000 | | | | 20,886,400 | | |
| Machinery 5.0% | |
| AGCO Corp.(a)(b) | | | 764,442 | | | | 39,468,140 | | |
| Crane Co. | | | 869,100 | | | | 42,212,187 | | |
| Kennametal, Inc.(a) | | | 677,625 | | | | 31,218,184 | | |
| Parker Hannifin Corp.(a) | | | 495,750 | | | | 44,523,308 | | |
| Stanley Black & Decker, Inc. | | | 614,333 | | | | 47,180,774 | | |
| Total | | | 204,602,593 | | |
| Professional Services 1.0% | |
| Manpower, Inc. | | | 905,318 | | | | 38,992,046 | | |
| Road & Rail 2.6% | |
| Con-way, Inc.(a) | | | 974,773 | | | | 28,804,542 | | |
| Hertz Global Holdings, Inc.(a)(b) | | | 2,947,450 | | | | 42,148,535 | | |
| Ryder System, Inc. | | | 630,700 | | | | 33,572,161 | | |
| Total | | | 104,525,238 | | |
| Trading Companies & Distributors 0.3% | |
| AerCap Holdings NV(b) | | | 884,894 | | | | 11,574,414 | | |
| TOTAL INDUSTRIALS | | | 474,998,689 | | |
| INFORMATION TECHNOLOGY 6.1% | |
| Communications Equipment 0.1% | |
| Tellabs, Inc. | | | 1,408,600 | | | | 5,578,056 | | |
| Issuer | | Shares | | Value | |
| Common Stocks (continued) | |
| INFORMATION TECHNOLOGY (cont.) | |
| Computers & Peripherals 1.5% | |
| Diebold, Inc.(a) | | | 1,497,550 | | | $ | 58,599,132 | | |
| Electronic Equipment, Instruments & Components 0.9% | |
| Arrow Electronics, Inc.(b) | | | 855,525 | | | | 34,349,329 | | |
| Semiconductors & Semiconductor Equipment 1.7% | |
| Atmel Corp.(a)(b) | | | 1,968,500 | | | | 19,901,535 | | |
| Avago Technologies Ltd. | | | 550,000 | | | | 20,685,500 | | |
| International Rectifier Corp.(a)(b) | | | 434,900 | | | | 9,763,505 | | |
| Lam Research Corp.(a)(b) | | | 211,600 | | | | 8,823,720 | | |
| Novellus Systems, Inc.(b) | | | 237,700 | | | | 11,048,296 | | |
| Total | | | 70,222,556 | | |
| Software 1.9% | |
| Autodesk, Inc.(b) | | | 884,950 | | | | 33,495,357 | | |
| Nuance Communications, Inc.(a)(b) | | | 1,634,125 | | | | 42,356,520 | | |
| Total | | | 75,851,877 | | |
| TOTAL INFORMATION TECHNOLOGY | | | 244,600,950 | | |
| MATERIALS 6.5% | |
| Chemicals 4.0% | |
| Albemarle Corp.(a) | | | 330,050 | | | | 21,954,926 | | |
| Celanese Corp., Class A | | | 1,130,450 | | | | 53,775,507 | | |
| International Flavors & Fragrances, Inc.(a) | | | 774,200 | | | | 44,152,626 | | |
| Methanex Corp. | | | 348,200 | | | | 10,912,588 | | |
| PPG Industries, Inc.(a) | | | 336,769 | | | | 30,730,171 | | |
| Total | | | 161,525,818 | | |
| Containers & Packaging 1.3% | |
| Packaging Corp. of America | | | 1,707,700 | | | | 50,616,228 | | |
| Metals & Mining 1.2% | |
| Steel Dynamics, Inc.(a) | | | 1,736,000 | | | | 25,710,160 | | |
| United States Steel Corp.(a) | | | 878,575 | | | | 23,914,811 | | |
| Total | | | 49,624,971 | | |
| TOTAL MATERIALS | | | 261,767,017 | | |
| UTILITIES 11.3% | |
| Electric Utilities 3.6% | |
| Edison International | | | 1,452,900 | | | | 60,832,923 | | |
| Northeast Utilities(a) | | | 1,008,525 | | | | 36,206,048 | | |
| NV Energy, Inc.(a) | | | 3,096,000 | | | | 48,545,280 | | |
| Total | | | 145,584,251 | | |
| Gas Utilities 0.8% | |
| Questar Corp.(a) | | | 1,650,100 | | | | 31,714,922 | | |
| Independent Power Producers & Energy Traders 1.0% | |
| AES Corp. (The)(b) | | | 2,873,104 | | | | 38,959,290 | | |
| Multi-Utilities 5.9% | |
| CMS Energy Corp.(a) | | | 2,341,300 | | | | 50,127,233 | | |
| Public Service Enterprise Group, Inc.(a) | | | 928,857 | | | | 28,590,218 | | |
| SCANA Corp.(a) | | | 1,057,900 | | | | 47,605,500 | | |
| Sempra Energy(a) | | | 1,010,149 | | | | 59,841,227 | | |
| Wisconsin Energy Corp. | | | 1,579,796 | | | | 53,839,448 | | |
| Total | | | 240,003,626 | | |
| TOTAL UTILITIES | | | 456,262,089 | | |
Total Common Stocks
(Cost: $3,126,627,181) | | $ | 3,837,317,279 | | |
The Accompanying Notes to Financial Statements are an integral part of this statement.
7
Columbia Mid Cap Value Fund
February 29, 2012
(Percentages represent value of investments compared to net assets)
| Issuer | | Shares | | Value | |
| Exchange-Traded Funds 2.2% | |
| iShares Russell Midcap Value Index Fund | | | 1,850,000 | | | $ | 87,449,500 | | |
Total Exchange-Traded Funds
(Cost: $86,883,450) | | $ | 87,449,500 | | |
| Rights —% | |
| FINANCIALS —% | |
| Real Estate Investment Trusts (REITs) —% | |
| Rouse Properties, Inc.(b)(c) | | | 77,320 | | | $ | — | | |
| TOTAL FINANCIALS | | | — | | |
Total Rights
(Cost: $—) | | $ | — | | |
| | | Shares | | Value | |
| Money Market Funds 2.9% | |
Columbia Short-Term Cash
Fund, 0.166%(d)(e) | | | 119,191,310 | | | $ | 119,191,310 | | |
Total Money Market Funds
(Cost: $119,191,310) | | $ | 119,191,310 | | |
| Issuer | | Effective
Yield | | Par/
Principal/
Shares | | Value | |
Investments of Cash Collateral Received for Securities
on Loan 21.9% | |
| Asset-Backed Commercial Paper 1.9% | |
Atlantic Asset Securitization LLC
03/01/12 | | | 0.300 | % | | $ | 4,999,708 | | | $ | 4,999,708 | | |
Atlantis One
04/11/12 | | | 0.511 | % | | | 4,993,554 | | | | 4,993,554 | | |
| 04/17/12 | | | 0.471 | % | | | 19,976,239 | | | | 19,976,239 | | |
Barton Capital Corporation
03/07/12 | | | 0.270 | % | | | 24,998,688 | | | | 24,998,688 | | |
KELLS FUNDING, LLC
03/22/12 | | | 0.480 | % | | | 4,995,267 | | | | 4,995,267 | | |
| 06/04/12 | | | 0.491 | % | | | 2,995,998 | | | | 2,995,998 | | |
| 07/02/12 | | | 0.601 | % | | | 4,989,250 | | | | 4,989,250 | | |
Rheingold Securitization
03/09/12 | | | 0.570 | % | | | 9,998,258 | | | | 9,998,258 | | |
| Total | | | 77,946,962 | | |
| Certificates of Deposit 9.9% | |
ABM AMRO Bank N.V.
03/21/12 | | | 0.310 | % | | | 9,997,503 | | | | 9,997,503 | | |
Australia and New Zealand Bank Group, Ltd.
03/09/12 | | | 0.500 | % | | | 5,000,000 | | | | 5,000,000 | | |
| 05/16/12 | | | 0.470 | % | | | 10,000,000 | | | | 10,000,000 | | |
Bank of Nova Scotia
05/03/12 | | | 0.394 | % | | | 14,000,000 | | | | 14,000,000 | | |
| 07/26/12 | | | 0.324 | % | | | 10,000,000 | | | | 10,000,000 | | |
Barclays Bank PLC
04/18/12 | | | 0.600 | % | | | 25,000,000 | | | | 25,000,000 | | |
Branch Banking & Trust Corporation
07/12/12 | | | 0.420 | % | | | 20,000,000 | | | | 20,000,000 | | |
Credit Suisse
03/15/12 | | | 0.560 | % | | | 10,000,000 | | | | 10,000,000 | | |
| 03/20/12 | | | 0.590 | % | | | 15,000,000 | | | | 15,000,000 | | |
| Issuer | | Effective
Yield | | Par/
Principal/
Shares | | Value | |
Investments of Cash Collateral Received for Securities
on Loan (continued) | |
| Certificates of Deposit (continued) | |
DZ Bank AG
03/12/12 | | | 0.250 | % | | $ | 10,000,000 | | | $ | 10,000,000 | | |
DnB NOR ASA
03/01/12 | | | 0.450 | % | | | 5,000,000 | | | | 5,000,000 | | |
| 03/15/12 | | | 0.520 | % | | | 20,000,000 | | | | 20,000,000 | | |
FMS Wertmanagement Anstalt Des Oeffentlichen Rechts
03/09/12 | | | 0.330 | % | | | 10,000,000 | | | | 10,000,000 | | |
Hong Kong Shanghai Bank Corp., Ltd.
03/12/12 | | | 0.250 | % | | | 10,000,000 | | | | 10,000,000 | | |
Mitsubishi UFJ Trust and Banking Corp.
05/31/12 | | | 0.390 | % | | | 10,000,128 | | | | 10,000,128 | | |
National Australia Bank
04/30/12 | | | 0.394 | % | | | 8,000,000 | | | | 8,000,000 | | |
| 08/16/12 | | | 0.344 | % | | | 15,000,000 | | | | 15,000,000 | | |
National Bank of Canada
05/08/12 | | | 0.410 | % | | | 15,000,000 | | | | 15,000,000 | | |
Nordea Bank AB
03/13/12 | | | 0.520 | % | | | 15,000,000 | | | | 15,000,000 | | |
Norinchukin Bank
05/21/12 | | | 0.470 | % | | | 20,000,000 | | | | 20,000,000 | | |
Rabobank
03/16/12 | | | 0.530 | % | | | 14,979,931 | | | | 14,979,931 | | |
| 04/23/12 | | | 0.500 | % | | | 10,000,000 | | | | 10,000,000 | | |
| 07/31/12 | | | 0.660 | % | | | 5,000,000 | | | | 5,000,000 | | |
Skandinaviska Enskilda Banken
03/19/12 | | | 0.410 | % | | | 5,000,000 | | | | 5,000,000 | | |
Standard Chartered Bank PLC
03/30/12 | | | 0.625 | % | | | 14,976,340 | | | | 14,976,340 | | |
| 04/03/12 | | | 0.570 | % | | | 28,000,000 | | | | 28,000,000 | | |
Sumitomo Trust & Banking Co., Ltd.
05/29/12 | | | 0.370 | % | | | 12,000,000 | | | | 12,000,000 | | |
Svenska Handelsbanken
07/26/12 | | | 0.590 | % | | | 5,000,252 | | | | 5,000,252 | | |
Union Bank of Switzerland
03/02/12 | | | 0.530 | % | | | 8,000,000 | | | | 8,000,000 | | |
| 04/09/12 | | | 0.590 | % | | | 10,000,000 | | | | 10,000,000 | | |
| 04/13/12 | | | 0.580 | % | | | 10,000,000 | | | | 10,000,000 | | |
| 04/17/12 | | | 0.580 | % | | | 5,000,000 | | | | 5,000,000 | | |
United Overseas Bank Ltd.
03/16/12 | | | 0.250 | % | | | 10,000,000 | | | | 10,000,000 | | |
Westpac Banking Corp.
05/11/12 | | | 0.423 | % | | | 5,000,000 | | | | 5,000,000 | | |
| Total | | | 399,954,154 | | |
| Commercial Paper 4.8% | |
Caisse d'Amortissement de la Dette Sociale
05/02/12 | | | 0.671 | % | | | 14,974,596 | | | | 14,974,596 | | |
Development Bank of Singapore Ltd.
08/02/12 | | | 0.551 | % | | | 19,946,834 | | | | 19,946,834 | | |
DnB NOR ASA
04/10/12 | | | 0.521 | % | | | 9,986,278 | | | | 9,986,278 | | |
ERSTE ABWICKLUNGSANSTALT
04/23/12 | | | 0.671 | % | | | 9,983,064 | | | | 9,983,064 | | |
Foreningsparbanken (Swedbank)
03/21/12 | | | 0.425 | % | | | 11,992,350 | | | | 11,992,350 | | |
| 04/02/12 | | | 0.400 | % | | | 9,993,222 | | | | 9,993,222 | | |
| 03/19/12 | | | 0.440 | % | | | 9,992,789 | | | | 9,992,789 | | |
The Accompanying Notes to Financial Statements are an integral part of this statement.
8
Columbia Mid Cap Value Fund
February 29, 2012
(Percentages represent value of investments compared to net assets)
| Issuer | | Effective
Yield | | Par/
Principal/
Shares | | Value | |
Investments of Cash Collateral Received for Securities
on Loan (continued) | |
| Commercial Paper (cont.) | |
HSBC Bank PLC
04/13/12 | | | 0.481 | % | | $ | 7,980,480 | | | $ | 7,980,480 | | |
Mitsubishi UFJ Trust and Banking Corp.
05/03/12 | | | 0.430 | % | | | 11,989,823 | | | | 11,989,823 | | |
Nordea Bank AB
08/14/12 | | | 0.592 | % | | | 4,985,168 | | | | 4,985,168 | | |
| 07/24/12 | | | 0.627 | % | | | 11,962,083 | | | | 11,962,083 | | |
Skandinaviska Enskilda Banken AB
03/27/12 | | | 0.400 | % | | | 14,989,833 | | | | 14,989,833 | | |
| 05/03/12 | | | 0.350 | % | | | 4,996,840 | | | | 4,996,840 | | |
State Development Bank of NorthRhine-Westphalia
03/13/12 | | | 0.240 | % | | | 4,999,033 | | | | 4,999,033 | | |
Suncorp Metway Ltd.
04/02/12 | | | 0.480 | % | | | 9,992,000 | | | | 9,992,000 | | |
| 04/11/12 | | | 0.480 | % | | | 9,991,600 | | | | 9,991,600 | | |
| 04/10/12 | | | 0.480 | % | | | 4,995,933 | | | | 4,995,933 | | |
The Commonwealth Bank of Australia
04/23/12 | | | 0.451 | % | | | 4,988,438 | | | | 4,988,438 | | |
| 08/16/12 | | | 0.307 | % | | | 5,000,000 | | | | 5,000,000 | | |
Westpac Securities NZ Ltd.
04/20/12 | | | 0.531 | % | | | 11,967,670 | | | | 11,967,670 | | |
| Total | | | 195,708,034 | | |
| Other Short-Term Obligations 0.6% | |
Natixis Financial Products LLC
03/01/12 | | | 0.470 | % | | | 25,000,000 | | | | 25,000,000 | | |
| Issuer | | Effective
Yield | | Par/
Principal/
Shares | | Value | |
Investments of Cash Collateral Received for Securities
on Loan (continued) | |
| Repurchase Agreements 4.7% | |
Credit Suisse Securities (USA) LLC
dated 02/29/12, matures 03/01/12,
repurchase price $8,895,408(f)
03/01/12 | | | 0.160 | % | | $ | 8,895,368 | | | $ | 8,895,368 | | |
Mizuho Securities USA, Inc.
dated 02/29/12, matures 03/01/12,
repurchase price $20,000,122(f)
03/01/12 | | | 0.220 | % | | | 20,000,000 | | | | 20,000,000 | | |
Natixis Financial Products, Inc.
dated 02/29/12, matures 03/01/12,
repurchase price $35,000,214(f)
03/01/12 | | | 0.220 | % | | | 35,000,000 | | | | 35,000,000 | | |
RBS Securities, Inc.
dated 02/29/12, matures 03/01/12,
repurchase price $40,000,222(f)
03/01/12 | | | 0.200 | % | | | 40,000,000 | | | | 40,000,000 | | |
Royal Bank of Canada
dated02/29/12, matures 03/01/12,
repurchase price $10,000,053(f)
03/01/12 | | | 0.190 | % | | | 10,000,000 | | | | 10,000,000 | | |
Societe Generale
dated 02/29/12, matures 03/01/12,
repurchase price $75,000,417(f)
03/01/12 | | | 0.200 | % | | | 75,000,000 | | | | 75,000,000 | | |
| Total | | | 188,895,368 | | |
Total Investments of Cash Collateral Received for Securities
on Loan
(Cost: $887,504,518) | | $ | 887,504,518 | | |
Total Investments
(Cost: $4,220,206,459) | | | | | | | | | | $ | 4,931,462,607 | | |
| Other Assets & Liabilities, Net | | | | | | | | | | | (886,588,097 | ) | |
| Net Assets | | $ | 4,044,874,510 | | |
| Notes to Portfolio of Investments | |
(a) At February 29, 2012, security was partially or fully on loan.
(b) Non-income producing.
(c) Negligible market value.
(d) The rate shown is the seven-day current annualized yield at February 29, 2012.
(e) Investments in affiliates during the year ended February 29, 2012:
| Issuer | | Beginning
Cost | | Purchase
Cost | | Sales Cost/
Proceeds
from Sales | | Realized
Gain/Loss | | Ending
Cost | | Dividends
or Interest
Income | | Value | |
Columbia Short-Term
Cash Fund | | $ | — | | | $ | 1,209,590,507 | | | $ | (1,090,399,197 | ) | | $ | — | | | $ | 119,191,310 | | | $ | 173,932 | | | $ | 119,191,310 | | |
The Accompanying Notes to Financial Statements are an integral part of this statement.
9
Columbia Mid Cap Value Fund
February 29, 2012
| Notes to Portfolio of Investments (continued) | |
(f) The table below represents securities received as collateral for repurchase agreements. This collateral is deposited with the Fund's custodian and, pursuant to the terms of the repurchase agreement, must have an aggregate market value greater than or equal to the repurchase price plus accrued interest at all times. The value of securities and/or cash held as collateral for repurchase agreements is monitored on a daily basis to ensure the proper level of collateral.
| Credit Suisse Securities (USA) LLC (0.160%) | |
| Security Description | | Value | |
| Ginnie Mae I Pool | | $ | 6,368,219 | | |
| Ginnie Mae II Pool | | | 2,705,077 | | |
| Total Market Value of Collateral Securities | | $ | 9,073,296 | | |
| Mizuho Securities USA, Inc. (0.220%) | |
| Security Description | | Value | |
| Fannie Mae Pool | | $ | 6,461,367 | | |
| Freddie Mac Gold Pool | | | 105,718 | | |
| Freddie Mac REMICS | | | 1,195,426 | | |
| Ginnie Mae I Pool | | | 8,005,327 | | |
| Ginnie Mae II Pool | | | 3,818,525 | | |
| Government National Mortgage Association | | | 813,637 | | |
| Total Market Value of Collateral Securities | | $ | 20,400,000 | | |
| Natixis Financial Products, Inc. (0.220%) | |
| Security Description | | Value | |
| Fannie Mae Pool | | $ | 1,760,737 | | |
| Fannie Mae REMICS | | | 13,113,371 | | |
| Freddie Mac Gold Pool | | | 1,612,106 | | |
| Freddie Mac REMICS | | | 7,732,274 | | |
| Government National Mortgage Association | | | 2,308,073 | | |
| United States Treasury Note/Bond | | | 9,173,657 | | |
| Total Market Value of Collateral Securities | | $ | 35,700,218 | | |
| RBS Securities, Inc. (0.200%) | |
| Security Description | | Value | |
| United States Treasury Note/Bond | | $ | 40,800,152 | | |
| Total Market Value of Collateral Securities | | $ | 40,800,152 | | |
| Royal Bank of Canada (0.190%) | |
| Security Description | | Value | |
| Fannie Mae Pool | | $ | 7,375,600 | | |
| Freddie Mac Gold Pool | | | 1,819,540 | | |
| Freddie Mac Non Gold Pool | | | 1,004,860 | | |
| Total Market Value of Collateral Securities | | $ | 10,200,000 | | |
| Societe Generale (0.200%) | |
| Security Description | | Value | |
| Fannie Mae REMICS | | $ | 11,709,455 | | |
| Freddie Mac REMICS | | | 19,950,096 | | |
| Freddie Mac Strips | | | 2,025,938 | | |
| Government National Mortgage Association | | | 42,814,511 | | |
| Total Market Value of Collateral Securities | | $ | 76,500,000 | | |
The Accompanying Notes to Financial Statements are an integral part of this statement.
10
Columbia Mid Cap Value Fund
February 29, 2012
Generally accepted accounting principles (GAAP) require disclosure regarding the inputs and valuation techniques used to measure fair value and any changes in valuation inputs or techniques. In addition, investments shall be disclosed by major category.
The Fund categorizes its fair value measurements according to a three-level hierarchy that maximizes the use of observable inputs and minimizes the use of unobservable inputs by prioritizing that the most observable input be used when available. Observable inputs are those that market participants would use in pricing an investment based on market data obtained from sources independent of the reporting entity. Unobservable inputs are those that reflect the Fund's assumptions about the information market participants would use in pricing an investment. An investment's level within the fair value hierarchy is based on the lowest level of any input that is deemed significant to the asset or liability's fair value measurement. The input levels are not necessarily an indication of the risk or liquidity associated with investments at that level. For example, certain U.S. government securities are generally high quality and liquid, however, they are reflected as Level 2 because the inputs used to determine fair value may not always be quoted prices in an active market.
Fair value inputs are summarized in the three broad levels listed below:
• Level 1 — Valuations based on quoted prices for investments in active markets that the Fund has the ability to access at the measurement date (including NAV for open-end mutual funds). Valuation adjustments are not applied to Level 1 investments.
• Level 2 — Valuations based on other significant observable inputs (including quoted prices for similar securities, interest rates, prepayment speeds, credit risks, etc.).
• Level 3 — Valuations based on significant unobservable inputs (including the Fund's own assumptions and judgment in determining the fair value of investments).
Inputs that are used in determining fair value of an investment may include price information, credit data, volatility statistics, and other factors. These inputs can be either observable or unobservable. The availability of observable inputs can vary between investments, and is affected by various factors such as the type of investment, and the volume and level of activity for that investment or similar investments in the marketplace. The inputs will be considered by the Investment Manager, along with any other relevant factors in the calculation of an investment's fair value. The Fund uses prices and inputs that are current as of the measurement date, which may include periods of market dislocations. During these periods, the availability of prices and inputs may be reduced for many investments. This condition could cause an investment to be reclassified between the various levels within the hierarchy.
Investments falling into the Level 3 category are primarily supported by quoted prices from brokers and dealers participating in the market for those investments. However, these may be classified as Level 3 investments due to lack of market transparency and corroboration to support these quoted prices. Additionally, valuation models may be used as the pricing source for any remaining investments classified as Level 3. These models rely on one or more significant unobservable inputs and/or significant assumptions by the Investment Manager. Inputs used in valuations may include, but are not limited to, financial statement analysis, capital account balances, discount rates and estimated cash flows, and comparable company data.
The Accompanying Notes to Financial Statements are an integral part of this statement.
11
Columbia Mid Cap Value Fund
February 29, 2012
| Fair Value Measurements(continued) | |
The following table is a summary of the inputs used to value the Fund's investments as of February 29, 2012:
| | | Fair value at February 29, 2012 | |
| Description(a) | | Level 1
Quoted Prices
in Active
Markets for
Identical Assets | | Level 2
Other
Significant
Observable
Inputs(b) | | Level 3
Significant
Unobservable
Inputs | | Total | |
| Equity Securities | |
| Common Stocks | |
| Consumer Discretionary | | $ | 485,848,607 | | | $ | — | | | $ | — | | | $ | 485,848,607 | | |
| Consumer Staples | | | 218,512,462 | | | | — | | | | — | | | | 218,512,462 | | |
| Energy | | | 300,921,911 | | | | — | | | | — | | | | 300,921,911 | | |
| Financials | | | 1,164,930,813 | | | | — | | | | — | | | | 1,164,930,813 | | |
| Health Care | | | 229,474,741 | | | | — | | | | — | | | | 229,474,741 | | |
| Industrials | | | 474,998,689 | | | | — | | | | — | | | | 474,998,689 | | |
| Information Technology | | | 244,600,950 | | | | — | | | | — | | | | 244,600,950 | | |
| Materials | | | 261,767,017 | | | | — | | | | — | | | | 261,767,017 | | |
| Utilities | | | 456,262,089 | | | | — | | | | — | | | | 456,262,089 | | |
| Total Equity Securities | | | 3,837,317,279 | | | | — | | | | — | | | | 3,837,317,279 | | |
| Other | |
| Exchange-Traded Funds | | | 87,449,500 | | | | — | | | | — | | | | 87,449,500 | | |
| Money Market Funds | | | 119,191,310 | | | | — | | | | — | | | | 119,191,310 | | |
| Investments of Cash Collateral Received for Securities on Loan | | | — | | | | 887,504,518 | | | | — | | | | 887,504,518 | | |
| Total Other | | | 206,640,810 | | | | 887,504,518 | | | | — | | | | 1,094,145,328 | | |
| Total | | $ | 4,043,958,089 | | | $ | 887,504,518 | | | $ | — | | | $ | 4,931,462,607 | | |
The Fund's assets assigned to the Level 2 input category are generally valued using the market approach, in which a security's value is determined through reference to prices and information from market transactions for similar or identical assets.
(a) See the Portfolio of Investments for all investment classifications not indicated in the table.
(b) There were no significant transfers between Levels 1 and 2 during the period.
The Accompanying Notes to Financial Statements are an integral part of this statement.
12
Statement of Assets and Liabilities – Columbia Mid Cap Value Fund
February 29, 2012
| Assets | |
| Investments, at value* | | | | | |
| Unaffiliated issuers (identified cost $3,213,510,631) | | $ | 3,924,766,779 | | |
| Affiliated issuers (identified cost $119,191,310) | | | 119,191,310 | | |
| Investment of cash collateral received for securities on loan | |
| Short-term securities (identified cost $698,609,150) | | | 698,609,150 | | |
| Repurchase agreements (identified cost $188,895,368) | | | 188,895,368 | | |
| Total investments (identified cost $4,220,206,459) | | | 4,931,462,607 | | |
| Receivable for: | |
| Investments sold | | | 23,877,718 | | |
| Capital shares sold | | | 3,450,766 | | |
| Dividends | | | 5,672,573 | | |
| Interest | | | 219,624 | | |
| Prepaid expense | | | 55,621 | | |
| Other assets | | | 982 | | |
| Total assets | | | 4,964,739,891 | | |
| Liabilities | |
| Due upon return of securities on loan | | | 887,504,518 | | |
| Payable for: | |
| Investments purchased | | | 10,278,919 | | |
| Capital shares purchased | | | 21,114,150 | | |
| Investment management fees | | | 72,814 | | |
| Distribution and service fees | | | 13,492 | | |
| Transfer agent fees | | | 476,168 | | |
| Administration fees | | | 5,471 | | |
| Plan administration fees | | | 2 | | |
| Chief compliance officer expenses | | | 1,316 | | |
| Other expenses | | | 398,531 | | |
| Total liabilities | | | 919,865,381 | | |
| Net assets applicable to outstanding capital stock | | $ | 4,044,874,510 | | |
The Accompanying Notes to Financial Statements are an integral part of this statement.
13
Statement of Assets and Liabilities (continued) – Columbia Mid Cap Value Fund
February 29, 2012
| Represented by | |
| Paid-in capital | | $ | 3,651,537,738 | | |
| Undistributed net investment income | | | 1,785,156 | | |
| Accumulated net realized loss | | | (319,704,532 | ) | |
| Unrealized appreciation (depreciation) on: | |
| Investments | | | 711,256,148 | | |
| Total — representing net assets applicable to outstanding capital stock | | $ | 4,044,874,510 | | |
| *Value of securities on loan | | $ | 862,324,180 | | |
| Net assets applicable to outstanding shares | |
| Class A | | $ | 1,135,303,053 | | |
| Class B | | $ | 22,739,776 | | |
| Class C | | $ | 125,462,846 | | |
| Class I | | $ | 143,561,960 | | |
| Class R | | $ | 80,096,047 | | |
| Class R4 | | $ | 11,985 | | |
| Class W | | $ | 77,367,468 | | |
| Class Y | | $ | 31,907 | | |
| Class Z | | $ | 2,460,299,468 | | |
| Shares outstanding | |
| Class A | | | 81,631,711 | | |
| Class B | | | 1,681,569 | | |
| Class C | | | 9,243,613 | | |
| Class I | | | 10,321,177 | | |
| Class R | | | 5,767,371 | | |
| Class R4 | | | 860 | | |
| Class W | | | 5,561,672 | | |
| Class Y | | | 2,294 | | |
| Class Z | | | 176,661,892 | | |
| Net asset value per share | |
| Class A(a) | | $ | 13.91 | | |
| Class B | | $ | 13.52 | | |
| Class C | | $ | 13.57 | | |
| Class I | | $ | 13.91 | | |
| Class R | | $ | 13.89 | | |
| Class R4 | | $ | 13.94 | | |
| Class W | | $ | 13.91 | | |
| Class Y | | $ | 13.91 | | |
| Class Z | | $ | 13.93 | | |
(a) The maximum offering price per share for Class A is $14.76. The offering price is calculated by dividing the net asset value by 1.0 minus the maximum sales charge of 5.75%.
The Accompanying Notes to Financial Statements are an integral part of this statement.
14
Statement of Operations – Columbia Mid Cap Value Fund
Year ended February 29, 2012
| Net investment income | |
| Income: | |
| Dividends | | $ | 76,164,091 | | |
| Interest | | | 8,383 | | |
| Dividends from affiliates | | | 173,932 | | |
| Income from securities lending — net | | | 1,395,375 | | |
| Foreign taxes withheld | | | (6,557 | ) | |
| Total income | | | 77,735,224 | | |
| Expenses: | |
| Investment management fees | | | 27,755,883 | | |
| Distribution fees | |
| Class B | | | 232,721 | | |
| Class C | | | 1,054,785 | | |
| Class R | | | 1,006,459 | | |
| Service fees | |
| Class B | | | 77,691 | | |
| Class C | | | 351,467 | | |
| Class W | | | 139,462 | | |
| Distribution and service fees — Class A | | | 3,169,923 | | |
| Transfer agent fees | |
| Class A | | | 2,586,027 | | |
| Class B | | | 63,400 | | |
| Class C | | | 285,363 | | |
| Class R | | | 457,980 | | |
| Class R4 | | | 5 | | |
| Class W | | | 114,992 | | |
| Class Y | | | 27 | | |
| Class Z | | | 5,213,257 | | |
| Administration fees | | | 3,145,380 | | |
| Plan administration fees | |
| Class R4 | | | 22 | | |
| Compensation of board members | | | 94,050 | | |
| Pricing and bookkeeping fees | | | 9,536 | | |
| Custodian fees | | | 50,434 | | |
| Printing and postage fees | | | 576,194 | | |
| Registration fees | | | 183,279 | | |
| Professional fees | | | 98,501 | | |
| Chief compliance officer expenses | | | 2,134 | | |
| Other | | | 181,151 | | |
| Total expenses | | | 46,850,123 | | |
| Fees waived or expenses reimbursed by Investment Manager and its affiliates | | | (94,391 | ) | |
| Expense reductions | | | (18,489 | ) | |
| Total net expenses | | | 46,737,243 | | |
| Net investment income | | | 30,997,981 | | |
| Realized and unrealized gain (loss) — net | |
| Net realized gain (loss) on: | |
| Investments | | | 337,226,375 | | |
| Net realized gain | | | 337,226,375 | | |
| Net change in unrealized appreciation (depreciation) on: | |
| Investments | | | (519,995,492 | ) | |
| Net change in unrealized depreciation | | | (519,995,492 | ) | |
| Net realized and unrealized loss | | | (182,769,117 | ) | |
| Net decrease in net assets from operations | | $ | (151,771,136 | ) | |
The Accompanying Notes to Financial Statements are an integral part of this statement.
15
Statement of Changes in Net Assets – Columbia Mid Cap Value Fund
| | | February 29,
2012(a) | | February 28,
2011(b) | |
| Operations | |
| Net investment income | | $ | 30,997,981 | | | $ | 51,904,525 | | |
| Net realized gain | | | 337,226,375 | | | | 330,692,067 | | |
| Net change in unrealized appreciation (depreciation) | | | (519,995,492 | ) | | | 792,952,174 | | |
| Net increase (decrease) in net assets resulting from operations | | | (151,771,136 | ) | | | 1,175,548,766 | | |
| Distributions to shareholders from: | |
| Net investment income | |
| Class A | | | (6,764,702 | ) | | | (16,528,260 | ) | |
| Class B | | | (28,753 | ) | | | (347,528 | ) | |
| Class C | | | (142,957 | ) | | | (1,183,149 | ) | |
| Class I | | | (1,231,267 | ) | | | (59,745 | ) | |
| Class R | | | (447,096 | ) | | | (2,956,981 | ) | |
| Class R4 | | | (64 | ) | | | — | | |
| Class W | | | (424,228 | ) | | | (8 | ) | |
| Class Y | | | (273 | ) | | | (255 | ) | |
| Class Z | | | (20,394,685 | ) | | | (36,251,311 | ) | |
| Total distributions to shareholders | | | (29,434,025 | ) | | | (57,327,237 | ) | |
| Increase (decrease) in net assets from share transactions | | | (850,671,076 | ) | | | (428,527,709 | ) | |
| Proceeds from regulatory settlements (Note 6) | | | 236,136 | | | | 17,400 | | |
| Total increase (decrease) in net assets | | | (1,031,640,101 | ) | | | 689,711,220 | | |
| Net assets at beginning of year | | | 5,076,514,611 | | | | 4,386,803,391 | | |
| Net assets at end of year | | $ | 4,044,874,510 | | | $ | 5,076,514,611 | | |
| Undistributed net investment income | | $ | 1,785,156 | | | $ | 125,040 | | |
(a) Class R4 shares are for the period from March 7, 2011 (commencement of operations) to February 29, 2012.
(b) Class I and Class W shares are for the period from September 27, 2010 (commencement of operations) to February 28, 2011.
The Accompanying Notes to Financial Statements are an integral part of this statement.
16
Statement of Changes in Net Assets (continued) – Columbia Mid Cap Value Fund
| Year ended, | | February 29,
2012(a) | | February 28,
2011(b) | |
| | | Shares | | Dollars ($) | | Shares | | Dollars ($) | |
| Capital stock activity | |
| Class A shares | |
| Subscriptions(c) | | | 15,646,891 | | | | 208,981,808 | | | | 24,098,682 | | | | 295,808,915 | | |
| Fund merger | | | 764,899 | | | | 10,800,090 | | | | — | | | | — | | |
| Distributions reinvested | | | 476,451 | | | | 6,016,193 | | | | 1,205,192 | | | | 14,542,969 | | |
| Redemptions | | | (41,399,061 | ) | | | (555,805,689 | ) | | | (48,053,020 | ) | | | (588,007,438 | ) | |
| Net decrease | | | (24,510,820 | ) | | | (330,007,598 | ) | | | (22,749,146 | ) | | | (277,655,554 | ) | |
| Class B shares | |
| Subscriptions | | | 22,692 | | | | 303,307 | | | | 41,301 | | | | 494,268 | | |
| Fund merger | | | 52,469 | | | | 721,378 | | | | — | | | | — | | |
| Distributions reinvested | | | 2,011 | | | | 24,476 | | | | 23,648 | | | | 276,486 | | |
| Redemptions(c) | | | (1,610,786 | ) | | | (20,994,752 | ) | | | (3,076,618 | ) | | | (36,566,848 | ) | |
| Net decrease | | | (1,533,614 | ) | | | (19,945,591 | ) | | | (3,011,669 | ) | | | (35,796,094 | ) | |
| Class C shares | |
| Subscriptions | | | 599,445 | | | | 7,805,828 | | | | 990,308 | | | | 12,037,780 | | |
| Fund merger | | | 21,768 | | | | 300,577 | | | | — | | | | — | | |
| Distributions reinvested | | | 8,906 | | | | 108,836 | | | | 73,776 | | | | 866,581 | | |
| Redemptions | | | (3,830,772 | ) | | | (49,672,691 | ) | | | (5,192,512 | ) | | | (61,998,199 | ) | |
| Net decrease | | | (3,200,653 | ) | | | (41,457,450 | ) | | | (4,128,428 | ) | | | (49,093,838 | ) | |
| Class I shares | |
| Subscriptions | | | 4,374,216 | | | | 60,352,741 | | | | 11,027,366 | | | | 149,685,114 | | |
| Fund merger | | | 262,588 | | | | 3,708,890 | | | | — | | | | — | | |
| Distributions reinvested | | | 95,462 | | | | 1,231,178 | | | | 4,539 | | | | 59,734 | | |
| Redemptions | | | (4,985,662 | ) | | | (67,344,843 | ) | | | (457,332 | ) | | | (6,244,962 | ) | |
| Net increase (decrease) | | | (253,396 | ) | | | (2,052,034 | ) | | | 10,574,573 | | | | 143,499,886 | | |
| Class R shares | |
| Subscriptions | | | 6,538,656 | | | | 90,315,959 | | | | 10,065,747 | | | | 122,653,544 | | |
| Distributions reinvested | | | 34,160 | | | | 436,403 | | | | 241,993 | | | | 2,923,279 | | |
| Redemptions | | | (24,491,543 | ) | | | (311,990,808 | ) | | | (11,316,146 | ) | | | (139,432,480 | ) | |
| Net decrease | | | (17,918,727 | ) | | | (221,238,446 | ) | | | (1,008,406 | ) | | | (13,855,657 | ) | |
| Class R4 shares | |
| Subscriptions | | | 178 | | | | 2,500 | | | | — | | | | — | | |
| Fund merger | | | 681 | | | | 9,625 | | | | — | | | | — | | |
| Distributions reinvested | | | 1 | | | | 10 | | | | — | | | | — | | |
| Net increase | | | 860 | | | | 12,135 | | | | — | | | | — | | |
| Class W shares | |
| Subscriptions | | | 2,155,313 | | | | 27,938,697 | | | | 226 | | | | 2,650 | | |
| Fund merger | | | 7,276,910 | | | | 102,861,296 | | | | — | | | | — | | |
| Distributions reinvested | | | 33,667 | | | | 424,192 | | | | — | | | | — | | |
| Redemptions | | | (3,904,432 | ) | | | (51,206,898 | ) | | | (12 | ) | | | (153 | ) | |
| Net increase | | | 5,561,458 | | | | 80,017,287 | | | | 214 | | | | 2,497 | | |
| Class Y shares | |
| Subscriptions | | | — | | | | — | | | | 1,130 | | | | 13,781 | | |
| Distributions reinvested | | | 11 | | | | 138 | | | | 17 | | | | 201 | | |
| Net increase | | | 11 | | | | 138 | | | | 1,147 | | | | 13,982 | | |
| Class Z shares | |
| Subscriptions | | | 38,601,255 | | | | 513,775,179 | | | | 55,584,335 | | | | 673,554,891 | | |
| Distributions reinvested | | | 1,140,867 | | | | 14,563,073 | | | | 2,057,565 | | | | 24,860,995 | | |
| Redemptions | | | (63,576,970 | ) | | | (844,337,769 | ) | | | (73,199,198 | ) | | | (894,058,817 | ) | |
| Net decrease | | | (23,834,848 | ) | | | (315,999,517 | ) | | | (15,557,298 | ) | | | (195,642,931 | ) | |
| Total net decrease | | | (65,689,729 | ) | | | (850,671,076 | ) | | | (35,879,013 | ) | | | (428,527,709 | ) | |
(a) Class R4 shares are for the period from March 7, 2011 (commencement of operations) to February 29, 2012.
(b) Class I and Class W shares are for the period from September 27, 2010 (commencement of operations) to February 28, 2011.
(c) Includes conversions of Class B shares to Class A shares, if any.
The Accompanying Notes to Financial Statements are an integral part of this statement.
17
Financial Highlights – Columbia Mid Cap Value Fund
The following tables are intended to help you understand the Fund's financial performance. Certain information reflects financial results for a single share of a class held for the periods shown. Per share net investment income (loss) amounts are calculated based on average shares outstanding during the period. Total returns assume reinvestment of all dividends and distributions. Total returns do not reflect payment of sales changes, if any, and are not annualized for periods of less than one year.
| | | Year ended
Feb. 29, | | Year ended Feb. 28, | | Year ended
Feb. 29, | |
| | | 2012 | | 2011 | | 2010 | | 2009 | | 2008 | |
| Class A | |
| Per share data | |
| Net asset value, beginning of period | | $ | 14.24 | | | $ | 11.18 | | | $ | 6.87 | | | $ | 13.12 | | | $ | 15.21 | | |
| Income from investment operations: | |
| Net investment income | | | 0.07 | | | | 0.13 | (a) | | | 0.07 | | | | 0.11 | | | | 0.13 | | |
| Net realized and unrealized gain (loss) | | | (0.33 | ) | | | 3.07 | | | | 4.32 | | | | (6.25 | ) | | | (1.19 | ) | |
| Total from investment operations | | | (0.26 | ) | | | 3.20 | | | | 4.39 | | | | (6.14 | ) | | | (1.06 | ) | |
| Less distributions to shareholders from: | |
| Net investment income | | | (0.07 | ) | | | (0.14 | ) | | | (0.07 | ) | | | (0.10 | ) | | | (0.16 | ) | |
| Net realized gains | | | — | | | | — | | | | — | | | | — | | | | (0.87 | ) | |
| Tax return of capital | | | — | | | | — | | | | (0.01 | ) | | | (0.01 | ) | | | — | | |
| Total distributions to shareholders | | | (0.07 | ) | | | (0.14 | ) | | | (0.08 | ) | | | (0.11 | ) | | | (1.03 | ) | |
| Proceeds from regulatory settlement | | | 0.00 | (b) | | | 0.00 | (b) | | | 0.00 | (b) | | | — | | | | — | | |
| Net asset value, end of period | | $ | 13.91 | | | $ | 14.24 | | | $ | 11.18 | | | $ | 6.87 | | | $ | 13.12 | | |
| Total return | | | (1.75 | %)(c) | | | 28.87 | % | | | 64.09 | % | | | (47.05 | %) | | | (7.88 | %) | |
| Ratios to average net assets(d) | |
| Expenses prior to fees waived or expenses reimbursed | | | 1.18 | % | | | 1.13 | % | | | 1.17 | % | | | 1.17 | % | | | 1.10 | % | |
| Net expenses after fees waived or expenses reimbursed(e) | | | 1.18 | %(f) | | | 1.13 | %(f) | | | 1.17 | %(f) | | | 1.17 | %(f) | | | 1.10 | %(f) | |
| Net investment income | | | 0.59 | %(f) | | | 1.05 | %(f) | | | 0.71 | %(f) | | | 0.97 | %(f) | | | 0.83 | %(f) | |
| Supplemental data | |
| Net assets, end of period (in thousands) | | $ | 1,135,303 | | | $ | 1,511,519 | | | $ | 1,441,388 | | | $ | 966,440 | | | $ | 1,677,414 | | |
| | | | 39 | % | | | 50 | % | | | 56 | % | | | 46 | % | | | 24 | % | |
| Notes to Financial Highlights | |
(a) Net investment income per share reflects special dividends. The effect of these dividends amounted to $0.08 per share.
(b) Rounds to less than $0.01.
(c) During the year ended February 29, 2012, the Fund received proceeds from a regulatory settlement. Had the Fund not received these proceeds, the total return would have been lower by 0.01%.
(d) In addition to the fees and expenses which the Fund bears directly, the Fund indirectly bears a pro rata share of the fees and expenses of the acquired funds in which it invests. Such indirect expenses are not included in the reported expense ratios.
(e) The Investment Manager and certain of its affiliates agreed to waive/reimburse certain fees and expenses, if applicable.
(f) The benefits derived from expense reductions had an impact of less than 0.01%.
The Accompanying Notes to Financial Statements are an integral part of this statement.
18
Financial Highlights (continued) – Columbia Mid Cap Value Fund
| | | Year ended
Feb. 29, | | Year ended Feb. 28, | | Year ended
Feb. 29, | |
| | | 2012 | | 2011 | | 2010 | | 2009 | | 2008 | |
| Class B | |
| Per share data | |
| Net asset value, beginning of period | | $ | 13.89 | | | $ | 10.94 | | | $ | 6.73 | | | $ | 12.86 | | | $ | 14.94 | | |
| Income from investment operations: | |
| Net investment income (loss) | | | (0.02 | ) | | | 0.03 | (a) | | | 0.00 | (b) | | | 0.02 | | | | 0.03 | | |
| Net realized and unrealized gain (loss) | | | (0.34 | ) | | | 3.01 | | | | 4.23 | | | | (6.11 | ) | | | (1.19 | ) | |
| Total from investment operations | | | (0.36 | ) | | | 3.04 | | | | 4.23 | | | | (6.09 | ) | | | (1.16 | ) | |
| Less distributions to shareholders from: | |
| Net investment income | | | (0.01 | ) | | | (0.09 | ) | | | (0.02 | ) | | | (0.03 | ) | | | (0.05 | ) | |
| Net realized gains | | | — | | | | — | | | | — | | | | — | | | | (0.87 | ) | |
| Tax return of capital | | | — | | | | — | | | | (0.00 | )(b) | | | (0.01 | ) | | | — | | |
| Total distributions to shareholders | | | (0.01 | ) | | | (0.09 | ) | | | (0.02 | ) | | | (0.04 | ) | | | (0.92 | ) | |
| Proceeds from regulatory settlement | | | 0.00 | (b) | | | 0.00 | (b) | | | 0.00 | (b) | | | — | | | | — | | |
| Net asset value, end of period | | $ | 13.52 | | | $ | 13.89 | | | $ | 10.94 | | | $ | 6.73 | | | $ | 12.86 | | |
| Total return | | | (2.55 | %)(c) | | | 27.89 | % | | | 62.86 | % | | | (47.41 | %) | | | (8.61 | %) | |
| Ratios to average net assets(d) | |
| Expenses prior to fees waived or expenses reimbursed | | | 1.93 | % | | | 1.88 | % | | | 1.92 | % | | | 1.92 | % | | | 1.85 | % | |
| Net expenses after fees waived or expenses reimbursed(e) | | | 1.93 | %(f) | | | 1.88 | %(f) | | | 1.92 | %(f) | | | 1.92 | %(f) | | | 1.85 | %(f) | |
| Net investment income (loss) | | | (0.19 | %)(f) | | | 0.28 | %(f) | | | (0.01 | %)(f) | | | 0.18 | %(f) | | | 0.18 | %(f) | |
| Supplemental data | |
| Net assets, end of period (in thousands) | | $ | 22,740 | | | $ | 44,651 | | | $ | 68,110 | | | $ | 66,254 | | | $ | 179,087 | | |
| Portfolio turnover | | | 39 | % | | | 50 | % | | | 56 | % | | | 46 | % | | | 24 | % | |
| Notes to Financial Highlights | |
(a) Net investment income per share reflects special dividends. The effect of these dividends amounted to $0.08 per share.
(b) Rounds to less than $0.01.
(c) During the year ended February 29, 2012, the Fund received proceeds from a regulatory settlement. Had the Fund not received these proceeds, the total return would have been lower by 0.01%.
(d) In addition to the fees and expenses which the Fund bears directly, the Fund indirectly bears a pro rata share of the fees and expenses of the acquired funds in which it invests. Such indirect expenses are not included in the reported expense ratios.
(e) The Investment Manager and certain of its affiliates agreed to waive/reimburse certain fees and expenses, if applicable.
(f) The benefits derived from expense reductions had an impact of less than 0.01%.
The Accompanying Notes to Financial Statements are an integral part of this statement.
19
Financial Highlights (continued) – Columbia Mid Cap Value Fund
| | | Year ended
Feb. 29, | | Year ended Feb. 28, | | Year ended
Feb. 29, | |
| | | 2012 | | 2011 | | 2010 | | 2009 | | 2008 | |
| Class C | |
| Per share data | |
| Net asset value, beginning of period | | $ | 13.94 | | | $ | 10.98 | | | $ | 6.75 | | | $ | 12.90 | | | $ | 14.99 | | |
| Income from investment operations: | |
| Net investment income (loss)(b) | | | (0.02 | ) | | | 0.04 | (a) | | | 0.00 | (b) | | | 0.02 | | | | 0.01 | | |
| Net realized and unrealized gain (loss) | | | (0.34 | ) | | | 3.01 | | | | 4.25 | | | | (6.13 | ) | | | (1.18 | ) | |
| Total from investment operations | | | (0.36 | ) | | | 3.05 | | | | 4.25 | | | | (6.11 | ) | | | (1.17 | ) | |
| Less distributions to shareholders from: | |
| Net investment income | | | (0.01 | ) | | | (0.09 | ) | | | (0.02 | ) | | | (0.03 | ) | | | (0.05 | ) | |
| Net realized gains | | | — | | | | — | | | | — | | | | — | | | | (0.87 | ) | |
| Tax return of capital | | | — | | | | — | | | | (0.00 | )(b) | | | (0.01 | ) | | | — | | |
| Total distributions to shareholders | | | (0.01 | ) | | | (0.09 | ) | | | (0.02 | ) | | | (0.04 | ) | | | (0.92 | ) | |
| Proceeds from regulatory settlement | | | 0.00 | (b) | | | 0.00 | (b) | | | 0.00 | (b) | | | — | | | | — | | |
| Net asset value, end of period | | $ | 13.57 | | | $ | 13.94 | | | $ | 10.98 | | | $ | 6.75 | | | $ | 12.90 | | |
| Total return | | | (2.54 | %)(c) | | | 27.88 | % | | | 62.97 | % | | | (47.42 | %) | | | (8.65 | %) | |
| Ratios to average net assets(d) | |
| Expenses prior to fees waived or expenses reimbursed | | | 1.93 | % | | | 1.88 | % | | | 1.92 | % | | | 1.92 | % | | | 1.85 | % | |
| Net expenses after fees waived or expenses reimbursed(e) | | | 1.93 | %(f) | | | 1.88 | %(f) | | | 1.92 | %(f) | | | 1.92 | %(f) | | | 1.85 | %(f) | |
| Net investment income (loss) | | | (0.17 | %)(f) | | | 0.30 | %(f) | | | (0.03 | %)(f) | | | 0.19 | %(f) | | | 0.07 | %(f) | |
| Supplemental data | |
| Net assets, end of period (in thousands) | | $ | 125,463 | | | $ | 173,457 | | | $ | 181,941 | | | $ | 144,370 | | | $ | 318,190 | | |
| Portfolio turnover | | | 39 | % | | | 50 | % | | | 56 | % | | | 46 | % | | | 24 | % | |
| Notes to Financial Highlights | |
(a) Net investment income per share reflects special dividends. The effect of these dividends amounted to $0.08 per share.
(b) Rounds to less than $0.01.
(c) During the ended February 29, 2012, the Fund received proceeds from a regulatory settlement. Had the Fund not received these proceeds, the total return would have been lower by 0.01%.
(d) In addition to the fees and expenses which the Fund bears directly, the Fund indirectly bears a pro rata share of the fees and expenses of the acquired funds in which it invests. Such indirect expenses are not included in the reported expense ratios.
(e) The Investment Manager and certain of its affiliates agreed to waive/reimburse certain fees and expenses, if applicable.
(f) The benefits derived from expense reductions had an impact of less than 0.01%.
The Accompanying Notes to Financial Statements are an integral part of this statement.
20
Financial Highlights (continued) – Columbia Mid Cap Value Fund
| | | Year ended
Feb. 29,
2012 | | Year ended
Feb. 28,
2011(a) | |
| Class I | |
| Per share data | |
| Net asset value, beginning of period | | $ | 14.24 | | | $ | 11.68 | | |
| Income from investment operations: | |
| Net investment income | | | 0.13 | | | | 0.03 | | |
| Net realized and unrealized gain (loss) | | | (0.33 | ) | | | 2.58 | | |
| Total from investment operations | | | (0.20 | ) | | | 2.61 | | |
| Less distributions to shareholders from: | |
| Net investment income | | | (0.13 | ) | | | (0.05 | ) | |
| Total distributions to shareholders | | | (0.13 | ) | | | (0.05 | ) | |
| Proceeds from regulatory settlement | | | 0.00 | (b) | | | — | | |
| Net asset value, end of period | | $ | 13.91 | | | $ | 14.24 | | |
| Total return | | | (1.32 | %)(c) | | | 22.40 | % | |
| Ratios to average net assets(d) | |
| Expenses prior to fees waived or expenses reimbursed | | | 0.73 | % | | | 0.72 | %(e) | |
| Net expenses after fees waived or expenses reimbursed(f) | | | 0.73 | % | | | 0.72 | %(e) | |
| Net investment income | | | 1.03 | % | | | 0.53 | %(e) | |
| Supplemental data | |
| Net assets, end of period (in thousands) | | $ | 143,562 | | | $ | 150,603 | | |
| Portfolio turnover | | | 39 | % | | | 50 | % | |
| Notes to Financial Highlights | |
(a) For the period from September 27, 2010 (commencement of operations) to February 28, 2011.
(b) Rounds to less than $0.01.
(c) During the year ended February 29, 2012, the Fund received proceeds from a regulatory settlement. Had the Fund not received these proceeds, the total return would have been lower by 0.01%.
(d) In addition to the fees and expenses which the Fund bears directly, the Fund indirectly bears a pro rata share of the fees and expenses of the acquired funds in which it invests. Such indirect expenses are not included in the reported expense ratios.
(e) Annualized.
(f) The Investment Manager and certain of its affiliates agreed to waive/reimburse certain fees and expenses, if applicable.
The Accompanying Notes to Financial Statements are an integral part of this statement.
21
Financial Highlights (continued) – Columbia Mid Cap Value Fund
| | | Year ended
Feb. 29, | | Year ended Feb. 28, | | Year ended
Feb. 29, | |
| | | 2012 | | 2011 | | 2010 | | 2009 | | 2008 | |
| Class R | |
| Per share data | |
| Net asset value, beginning of period | | $ | 14.23 | | | $ | 11.18 | | | $ | 6.87 | | | $ | 13.11 | | | $ | 15.21 | | |
| Income from investment operations: | |
| Net investment income | | | 0.01 | | | | 0.10 | (a) | | | 0.04 | | | | 0.09 | | | | 0.05 | | |
| Net realized and unrealized gain (loss) | | | (0.31 | ) | | | 3.07 | | | | 4.33 | | | | (6.24 | ) | | | (1.16 | ) | |
| Total from investment operations | | | (0.30 | ) | | | 3.17 | | | | 4.37 | | | | (6.15 | ) | | | (1.11 | ) | |
| Less distributions to shareholders from: | |
| Net investment income | | | (0.04 | ) | | | (0.12 | ) | | | (0.05 | ) | | | (0.08 | ) | | | (0.12 | ) | |
| Net realized gains | | | — | | | | — | | | | — | | | | — | | | | (0.87 | ) | |
| Tax return of capital | | | — | | | | — | | | | (0.01 | ) | | | (0.01 | ) | | | — | | |
| Total distributions to shareholders | | | (0.04 | ) | | | (0.12 | ) | | | (0.06 | ) | | | (0.09 | ) | | | (0.99 | ) | |
| Proceeds from regulatory settlement | | | 0.00 | (b) | | | 0.00 | (b) | | | 0.00 | (b) | | | — | | | | — | | |
| Net asset value, end of period | | $ | 13.89 | | | $ | 14.23 | | | $ | 11.18 | | | $ | 6.87 | | | $ | 13.11 | | |
| Total return | | | (2.04 | %)(c) | | | 28.53 | % | | | 63.69 | % | | | (47.13 | %) | | | (8.17 | %) | |
| Ratios to average net assets(d) | |
| Expenses prior to fees waived or expenses reimbursed | | | 1.45 | % | | | 1.38 | % | | | 1.42 | % | | | 1.42 | % | | | 1.35 | % | |
| Net expenses after fees waived or expenses reimbursed(e) | | | 1.43 | %(f) | | | 1.38 | %(f) | | | 1.42 | %(f) | | | 1.42 | %(f) | | | 1.35 | %(f) | |
| Net investment income | | | 0.15 | %(f) | | | 0.80 | %(f) | | | 0.44 | %(f) | | | 0.94 | %(f) | | | 0.35 | %(f) | |
| Supplemental data | |
| Net assets, end of period (in thousands) | | $ | 80,096 | | | $ | 337,001 | | | $ | 276,046 | | | $ | 145,227 | | | $ | 46,252 | | |
| Portfolio turnover | | | 39 | % | | | 50 | % | | | 56 | % | | | 46 | % | | | 24 | % | |
| Notes to Financial Highlights | |
(a) Net investment income per share reflects special dividends. The effect of these dividends amounted to $0.08 per share.
(b) Rounds to less than $0.01.
(c) During the year ended February 29, 2012, the Fund received proceeds from a regulatory settlement. Had the Fund not received these proceeds, the total return would have been lower by 0.01%.
(d) In addition to the fees and expenses which the Fund bears directly, the Fund indirectly bears a pro rata share of the fees and expenses of the acquired funds in which it invests. Such indirect expenses are not included in the reported expense ratios.
(e) The Investment Manager and certain of its affiliates agreed to waive/reimburse certain fees and expenses, if applicable.
(f) The benefits derived from expense reductions had an impact of less than 0.01%.
The Accompanying Notes to Financial Statements are an integral part of this statement.
22
Financial Highlights (continued) – Columbia Mid Cap Value Fund
| | | Year ended
Feb. 29,
2012(a) | |
| Class R4 | |
| Per share data | |
| Net asset value, beginning of period | | $ | 14.06 | | |
| Income from investment operations: | |
| Net investment income | | | 0.11 | | |
| Net realized and unrealized gain | | | (0.15 | ) | |
| Total from investment operations | | | (0.04 | ) | |
| Less distributions to shareholders from: | |
| Net investment income | | | (0.08 | ) | |
| Total distributions to shareholders | | | (0.08 | ) | |
| Proceeds from regulatory settlement | | | 0.00 | (b) | |
| Net asset value, end of period | | $ | 13.94 | | |
| Total return | | | (0.23 | %)(c) | |
| Ratios to average net assets(d) | |
| Expenses prior to fees waived or expenses reimbursed | | | 1.05 | %(e) | |
| Net expenses after fees waived or expenses reimbursed(f) | | | 1.03 | %(e) | |
| Net investment income | | | 0.86 | %(e) | |
| Supplemental data | |
| Net assets, end of period (in thousands) | | $ | 12 | | |
| Portfolio turnover | | | 39 | % | |
| Notes to Financial Highlights | |
(a) For the period from March 7, 2011 (commencement of operations) to February 29, 2012.
(b) Rounds to less than $0.01.
(c) During the year ended February 29, 2012, the Fund received proceeds from a regulatory settlement. Had the Fund not received these proceeds, the total return would have been lower by 0.01%.
(d) In addition to the fees and expenses which the Fund bears directly, the Fund indirectly bears a pro rata share of the fees and expenses of the acquired funds in which it invests. Such indirect expenses are not included in the reported expense ratios.
(e) Annualized.
(f) The Investment Manager and certain of its affiliates agreed to waive/reimburse certain fees and expenses, if applicable.
The Accompanying Notes to Financial Statements are an integral part of this statement.
23
Financial Highlights (continued) – Columbia Mid Cap Value Fund
| | | Year ended
Feb. 29,
2012 | | Year ended
Feb. 28,
2011(a) | |
| Class W | |
| Per share data | |
| Net asset value, beginning of period | | $ | 14.24 | | | $ | 11.69 | | |
| Income from investment operations: | |
| Net investment income | | | 0.09 | | | | 0.02 | | |
| Net realized and unrealized gain (loss) | | | (0.35 | ) | | | 2.57 | | |
| Total from investment operations | | | (0.26 | ) | | | 2.59 | | |
| Less distributions to shareholders from: | |
| Net investment income | | | (0.07 | ) | | | (0.04 | ) | |
| Total distributions to shareholders | | | (0.07 | ) | | | (0.04 | ) | |
| Proceeds from regulatory settlement | | | 0.00 | (b) | | | — | | |
| Net asset value, end of period | | $ | 13.91 | | | $ | 14.24 | | |
| Total return | | | (1.74 | %)(c) | | | 22.17 | % | |
| Ratios to average net assets(d) | |
| Expenses prior to fees waived or expenses reimbursed | | | 1.19 | % | | | 1.14 | %(e) | |
| Net expenses after fees waived or expenses reimbursed(f) | | | 1.19 | %(g) | | | 1.14 | %(e)(g) | |
| Net investment income | | | 0.69 | %(g) | | | 0.34 | %(e)(g) | |
| Supplemental data | |
| Net assets, end of period (in thousands) | | $ | 77,367 | | | $ | 3 | | |
| Portfolio turnover | | | 39 | % | | | 50 | % | |
| Notes to Financial Highlights | |
(a) For the period from September 27, 2010 (commencement of operations) to February 28, 2011.
(b) Rounds to less than $0.01.
(c) During the year ended February 29, 2012, the Fund received proceeds from a regulatory settlement. Had the Fund not received these proceeds, the total return would have been lower by 0.01%.
(d) In addition to the fees and expenses which the Fund bears directly, the Fund indirectly bears a pro rata share of the fees and expenses of the acquired funds in which it invests. Such indirect expenses are not included in the reported expense ratios.
(e) Annualized.
(f) The Investment Manager and certain of its affiliates agreed to waive/reimburse certain fees and expenses, if applicable.
(g) The benefits derived from expense reductions had an impact of less than 0.01%.
The Accompanying Notes to Financial Statements are an integral part of this statement.
24
Financial Highlights (continued) – Columbia Mid Cap Value Fund
| | | Year ended
Feb. 29, | | Year ended Feb. 28, | |
| | | 2012 | | 2011 | | 2010(a) | |
| Class Y | |
| Per share data | |
| Net asset value, beginning of period | | $ | 14.24 | | | $ | 11.18 | | | $ | 8.86 | | |
| Income from investment operations | |
| Net investment income | | | 0.13 | | | | 0.16 | (b) | | | 0.08 | | |
| Net realized and unrealized gain (loss) | | | (0.34 | ) | | | 3.08 | | | | 2.31 | | |
| Total from investment operations | | | (0.21 | ) | | | 3.24 | | | | 2.39 | | |
| Less distributions to shareholders from: | |
| Net investment income | | | (0.12 | ) | | | (0.18 | ) | | | (0.06 | ) | |
| Tax return of capital | | | — | | | | — | | | | (0.01 | ) | |
| Total distributions to shareholders | | | (0.12 | ) | | | (0.18 | ) | | | (0.07 | ) | |
| Proceeds from regulatory settlement | | | 0.00 | (c) | | | 0.00 | (c) | | | 0.00 | (c) | |
| Net asset value, end of period | | $ | 13.91 | | | $ | 14.24 | | | $ | 11.18 | | |
| Total return | | | (1.40 | %)(d) | | | 29.23 | % | | | 27.00 | % | |
| Ratios to average net assets(e) | |
| Expenses prior to fees waived or expenses reimbursed | | | 0.82 | % | | | 0.81 | % | | | 0.76 | %(f) | |
| Net expenses after fees waived or expenses reimbursed(g) | | | 0.82 | % | | | 0.81 | %(h) | | | 0.76 | %(f)(h) | |
| Net investment income | | | 0.97 | % | | | 1.25 | %(h) | | | 1.28 | %(f)(h) | |
| Supplemental data | |
| Net assets, end of period (in thousands) | | $ | 32 | | | $ | 33 | | | $ | 13 | | |
| Portfolio turnover | | | 39 | % | | | 50 | % | | | 56 | % | |
| Notes to Financial Highlights | |
(a) For the period from July 15, 2009 (commencement of operations) to February 28, 2010.
(b) Net investment income per share reflects special dividends. The effect of these dividends amounted to $0.08 per share.
(c) Rounds to less than $0.01.
(d) During the year ended February 29, 2012, the Fund received proceeds from a regulatory settlement. Had the Fund not received these proceeds, the total return would have been lower by 0.01%.
(e) In addition to the fees and expenses which the Fund bears directly, the Fund indirectly bears a pro rata share of the fees and expenses of the acquired funds in which it invests. Such indirect expenses are not included in the reported expense ratios.
(f) Annualized.
(g) The Investment Manager and certain of its affiliates agreed to waive/reimburse certain fees and expenses, if applicable.
(h) The benefits derived from expense reductions had an impact of less than 0.01%.
The Accompanying Notes to Financial Statements are an integral part of this statement.
25
Financial Highlights (continued) – Columbia Mid Cap Value Fund
| | | Year ended
Feb. 29, | | Year ended Feb. 28, | | Year ended
Feb. 29, | |
| | | 2012 | | 2011 | | 2010 | | 2009 | | 2008 | |
| Class Z | |
| Per share data | |
| Net asset value, beginning of period | | $ | 14.26 | | | $ | 11.20 | | | $ | 6.88 | | | $ | 13.13 | | | $ | 15.23 | | |
| Income from investment operations: | |
| Net investment income | | | 0.11 | | | | 0.16 | (a) | | | 0.09 | | | | 0.14 | | | | 0.17 | | |
| Net realized and unrealized gain (loss) | | | (0.33 | ) | | | 3.07 | | | | 4.33 | | | | (6.25 | ) | | | (1.21 | ) | |
| Total from investment operations | | | (0.22 | ) | | | 3.23 | | | | 4.42 | | | | (6.11 | ) | | | (1.04 | ) | |
| Less distributions to shareholders from: | |
| Net investment income | | | (0.11 | ) | | | (0.17 | ) | | | (0.09 | ) | | | (0.13 | ) | | | (0.19 | ) | |
| Net realized gains | | | — | | | | — | | | | — | | | | — | | | | (0.87 | ) | |
| Tax return of capital | | | — | | | | — | | | | (0.01 | ) | | | (0.01 | ) | | | — | | |
| Total distributions to shareholders | | | (0.11 | ) | | | (0.17 | ) | | | (0.10 | ) | | | (0.14 | ) | | | (1.06 | ) | |
| Proceeds from regulatory settlement | | | 0.00 | (b) | | | 0.00 | (b) | | | 0.00 | (b) | | | — | | | | — | | |
| Net asset value, end of period | | $ | 13.93 | | | $ | 14.26 | | | $ | 11.20 | | | $ | 6.88 | | | $ | 13.13 | | |
| Total return | | | (1.50 | %)(c) | | | 29.14 | % | | | 64.55 | % | | | (46.87 | %) | | | (7.70 | %) | |
| Ratios to average net assets(d) | |
| Expenses prior to fees waived or expenses reimbursed | | | 0.93 | % | | | 0.88 | % | | | 0.92 | % | | | 0.92 | % | | | 0.85 | % | |
| Net expenses after fees waived or expenses reimbursed(e) | | | 0.93 | %(f) | | | 0.88 | %(f) | | | 0.92 | %(f) | | | 0.92 | %(f) | | | 0.85 | %(f) | |
| Net investment income | | | 0.85 | %(f) | | | 1.30 | %(f) | | | 0.95 | %(f) | | | 1.23 | %(f) | | | 1.10 | %(f) | |
| Supplemental data | |
| Net assets, end of period (in thousands) | | $ | 2,460,299 | | | $ | 2,859,249 | | | $ | 2,419,305 | | | $ | 1,459,522 | | | $ | 2,109,483 | | |
| Portfolio turnover | | | 39 | % | | | 50 | % | | | 56 | % | | | 46 | % | | | 24 | % | |
| Notes to Financial Highlights | |
(a) Net investment income per share reflects special dividends. The effect of these dividends amounted to $0.08 per share.
(b) Rounds to less than $0.01.
(c) During the year ended February 29, 2012, the Fund received proceeds from a regulatory settlement. Had the Fund not received these proceeds, the total return would have been lower by 0.01%.
(d) In addition to the fees and expenses which the Fund bears directly, the Fund indirectly bears a pro rata share of the fees and expenses of the acquired funds in which it invests. Such indirect expenses are not included in the reported expense ratios.
(e) The Investment Manager and certain of its affiliates agreed to waive/reimburse certain fees and expenses, if applicable.
(f) The benefits derived from expense reductions had an impact of less than 0.01%.
The Accompanying Notes to Financial Statements are an integral part of this statement.
26
Notes to Financial Statements – Columbia Mid Cap Value Fund
February 29, 2012
Note 1. Organization
Columbia Mid Cap Value Fund (the Fund), a series of Columbia Funds Series Trust (the Trust), is a diversified fund. The Trust is registered under the Investment Company Act of 1940, as amended (the 1940 Act), as an open-end management investment company organized as a Delaware statutory trust.
Fund Shares
The Trust may issue an unlimited number of shares (without par value). The Fund offers Class A, Class B, Class C, Class I, Class R, Class R4, Class W, Class Y and Class Z shares. All share classes have identical voting, dividend and liquidation rights. Each share class has its own expense structure and sales charges, as applicable.
Class A shares are subject to a maximum front-end sales charge of 5.75% based on the initial investment amount. Class A shares purchased without an initial sales charge in accounts aggregating $1 million to $50 million at the time of purchase are subject to a contingent deferred sales charge (CDSC) if the shares are sold within 18 months of purchase, charged as follows: 1.00% CDSC if redeemed within 12 months of purchase, and 0.50% CDSC if redeemed more than 12, but less than 18, months after purchase.
Class B shares may be subject to a maximum CDSC of 5.00% based upon the holding period after purchase. Class B shares will generally convert to Class A shares eight years after purchase. The Fund no longer accepts investments by new or existing investors in the Fund's Class B shares, except in connection with the reinvestment of any dividend and/or capital gain distributions in Class B shares of the Fund and exchanges by existing Class B shareholders of certain other funds within the Columbia Family of Funds.
Class C shares are subject to a 1.00% CDSC on shares redeemed within one year of purchase.
Class I shares are not subject to sales charges and are only available to the Columbia Family of Funds.
Class R shares are not subject to sales charges and are only available to qualifying institutional investors.
The Fund is authorized to issue Class R4 shares, which are not subject to sales charges; however, this share class is closed to new investors. Class R4 shares commenced operations on March 7, 2011.
Class W shares are not subject to sales charges and are only available to investors purchasing through authorized investment programs managed by investment professionals, including discretionary managed account programs.
Class Y shares are not subject to sales charges and are only available to certain categories of investors which are subject to minimum initial investment requirements.
Class Z shares are not subject to sales charges, and are only available to certain investors, as described in the Fund's prospectus.
Note 2. Summary of Significant Accounting Policies
Use of Estimates
The preparation of financial statements in accordance with U.S. generally accepted accounting principles (GAAP) requires management to make certain estimates and assumptions that affect the reported amounts of assets and liabilities, the disclosure of contingent assets and liabilities at the date of the financial statements and the reported amounts of revenue and expenses during the reporting period. Actual results could differ from those estimates.
The following is a summary of significant accounting policies consistently followed by the Fund in the preparation of its financial statements.
Security Valuation
All equity securities are valued at the close of business of the New York Stock Exchange (NYSE). Equity securities are valued at the last quoted sales price on the principal exchange or market on which they trade, except for securities traded on the NASDAQ Stock Market, which are valued at the NASDAQ official close price. Unlisted securities or listed securities for which there were no sales during the day are valued at the mean of the latest quoted bid and asked prices on such exchanges or markets.
Foreign securities are valued based on quotations from the principal market in which such securities are normally traded. If any foreign share prices are not readily available as a result of limited share activity the securities are valued at the mean
27
Columbia Mid Cap Value Fund, February 29, 2012
of the latest quoted bid and asked prices on such exchanges or markets. Foreign currency exchange rates are generally determined at 4:00 p.m. Eastern (U.S.) time. However, many securities markets and exchanges outside the U.S. close prior to the close of the NYSE; therefore, the closing prices for securities in such markets or on such exchanges may not fully reflect events that occur after such close but before the close of the NYSE. In those situations, foreign securities will be fair valued pursuant to the policy adopted by the Board of Trustees (the Board), including utilizing a third party pricing service to determine these fair values. The third party pricing service takes into account multiple factors, including, but not limited to, movements in the U.S. securities markets, certain depositary receipts, futures contracts and foreign exchange rates that have occurred subsequent to the close of the foreign exchange, to determine a good faith estimate that reasonably reflects the current market conditions as of the close of the NYSE. The fair value of a security is likely to be different from the quoted or published price, if available.
Investments in other open-end investment companies, including money market funds, are valued at net asset value.
Short-term securities purchased within 60 days to maturity are valued at amortized cost, which approximates market value. The value of short-term securities originally purchased with maturities greater than 60 days is determined based on an amortized value to par upon reaching 60 days to maturity. Short-term securities maturing in more than 60 days from the valuation date are valued at the market price or approximate market value based on current interest rates.
Investments for which market quotations are not readily available, or that have quotations which management believes are not reliable, are valued at fair value as determined in good faith under consistently applied procedures established by and under the general supervision of the Board. If a security or class of securities (such as foreign securities) is valued at fair value, such value is likely to be different from the last quoted market price for the security. The determination of fair value often requires significant judgment. To determine fair value, management may use assumptions including but not limited to future cash flows and estimated risk premiums. Multiple inputs from various sources may be used to determine value.
Repurchase Agreements
The Fund may engage in repurchase agreement transactions with institutions that management has determined are creditworthy. The Fund, through the custodian, receives delivery of the underlying securities collateralizing a repurchase agreement. Management is responsible for determining that the collateral is at least equal, at all times, to the value of the repurchase obligation including interest. A repurchase agreement transaction involves certain risks in the event of default or insolvency of the counterparty. These risks include possible delays in or restrictions on a Fund's ability to dispose of the underlying securities and a possible decline in the value of the underlying securities during the period while the Fund seeks to assert its rights.
Security Transactions
Security transactions are accounted for on the trade date. Cost is determined and gains (losses) are based upon the specific identification method for both financial statement and federal income tax purposes.
Income Recognition
Interest income is recorded on the accrual basis.
Corporate actions and dividend income are recorded net of any non-reclaimable tax withholdings on the ex-dividend date or upon receipt of ex-dividend notification in the case of certain foreign securities.
The Fund receives distributions from holdings in real estate investment trusts (REITs) which report information on the character of their distributions annually. REIT distributions are allocated to dividend income, capital gain and return of capital based on estimates made by the Fund's management if actual information has not yet been reported. Return of capital is recorded as a reduction of the cost basis of securities held. Management's estimates are subsequently adjusted when the actual character of the distributions is disclosed by the REITs which could result in a proportionate increase in return of capital to shareholders.
Awards from class action litigation are recorded as a reduction of cost basis if the Fund still owns the applicable securities on the payment date. If the Fund no longer owns the applicable securities, the proceeds are recorded as realized gains.
28
Columbia Mid Cap Value Fund, February 29, 2012
Expenses
General expenses of the Trust are allocated to the Fund and other funds of the Trust based upon relative net assets or other expense allocation methodologies determined by the nature of the expense. Expenses directly attributable to the Fund are charged to the Fund. Expenses directly attributable to a specific class of shares are charged to that share class.
Determination of Class Net Asset Value
All income, expenses (other than class-specific expenses, which are charged to that share class, as shown in the Statement of Operations) and realized and unrealized gains (losses) are allocated to each class of the Fund on a daily basis, based on the relative net assets of each class, for purposes of determining the net asset value of each class.
Federal Income Tax Status
The Fund intends to qualify each year as a regulated investment company under Subchapter M of the Internal Revenue Code, as amended, and will distribute substantially all of its tax exempt or taxable income (including net short-term capital gains), if any, for its tax year, and as such will not be subject to federal income taxes. In addition, the Fund intends to distribute in each calendar year substantially all of its net investment income, capital gains and certain other amounts, if any, such that the Fund should not be subject to federal excise tax. Therefore, no federal income or excise tax provision is recorded.
Distributions to Shareholders
Distributions from net investment income, if any, are declared and paid each calendar quarter. Net realized capital gains, if any, are distributed along with the income dividend. Income distributions and capital gain distributions are determined in accordance with federal income tax regulations which may differ from GAAP.
Guarantees and Indemnifications
Under the Trust's organizational documents and, in some cases, by contract, its officers and trustees are indemnified against certain liabilities arising out of the performance of their duties to the Trust or its funds. In addition, certain of the Fund's contracts with its service providers contain general indemnification clauses. The Fund's maximum exposure under these arrangements is unknown since the amount of any future claims that may be made against the Fund cannot be determined, and the Fund has no historical basis for predicting the likelihood of any such claims.
Recent Accounting Pronouncement
Fair Value Measurements and Disclosures
In May 2011, the Financial Accounting and Standards Board (FASB) issued ASU No. 2011-04 modifying Topic 820, Fair Value Measurements and Disclosures. At the same time, the International Accounting Standards Board (IASB) issued International Financial Reporting Standard 13, Fair Value Measurement. The objective of the FASB and IASB is convergence of their guidance on fair value measurements and disclosures.
Specifically, ASU No. 2011-04 requires reporting entities to disclose i) the amounts of any transfers between Level 1 and Level 2, and the reasons for the transfers, ii) for Level 3 fair value measurements, a) quantitative information about significant unobservable inputs used, b) a description of the valuation processes used by the reporting entity and c) a narrative description of the sensitivity of the fair value measurement to changes in unobservable inputs if a change in those inputs might result in a significantly higher or lower fair value measurement. The effective date of ASU No. 2011-04 is for interim and annual periods beginning after December 15, 2011. At this time, management is evaluating the implications of this guidance and the impact it will have on the financial statement amounts and footnote disclosures, if any.
Note 3. Fees and Compensation Paid to Affiliates
Investment Management Fees
Under an Investment Management Services Agreement (IMSA), Columbia Management Investment Advisers, LLC (the Investment Manager), a wholly-owned subsidiary of Ameriprise Financial, Inc. (Ameriprise Financial), determines which securities will be purchased, held or sold. Effective April 30, 2011, the management fee is an annual fee that is equal to a percentage of the Fund's average daily net assets that declines from 0.76% to 0.62% as the Fund's net assets increase. Prior to April 30, 2011, the management fee was
29
Columbia Mid Cap Value Fund, February 29, 2012
equal to a percentage of the Fund's average daily net assets that declined from 0.65% to 0.50% as the Fund's net assets increased. The effective management fee rate for the year ended February 29, 2012 was 0.63% of the Fund's average daily net assets.
Administration Fees
Under an Administrative Services Agreement, the Investment Manager serves as the Fund Administrator. Effective April 30, 2011, the Fund pays the Fund Administrator an annual fee for administration and accounting services equal to a percentage of the Fund's average daily net assets that declines from 0.06% to 0.03% as the Fund's net assets increase. Prior to April 30, 2011, the administration fee was equal to the annual rate of 0.17% of the Fund's average daily net assets, less the fees that were payable by the Fund as described under the Pricing and Bookkeeping Fees note below. The annualized effective administration fee rate for the year ended February 29, 2012 was 0.07% of the Fund's average daily net assets.
Pricing and Bookkeeping Fees
Prior to March 28, 2011, the Fund had entered into a Financial Reporting Services Agreement (the Financial Reporting Services Agreement) with State Street Bank and Trust Company (State Street) and the Investment Manager pursuant to which State Street provided financial reporting services to the Fund. The Fund also entered into an Accounting Services Agreement (collectively with the Financial Reporting Services Agreement, the State Street Agreements) with State Street and the Investment Manager pursuant to which State Street provided accounting services to the Fund. Under the State Street Agreements, the Fund paid State Street an annual fee of $38,000 paid monthly plus an additional monthly fee based on an annualized percentage rate of average daily net assets of the Fund for the month. The aggregate fee did not exceed $140,000 per year (exclusive of out-of-pocket expenses and charges). The Fund also reimbursed State Street for certain out-of-pocket expenses and charges. Effective March 28, 2011, these services are provided under the Administrative Services Agreement discussed above.
Other Fees
Effective June 1, 2011, other expenses are for, among other things, certain expenses of the Fund or the Board, including: Fund boardroom and office expense, employee compensation, employee health and retirement benefits, and certain other expenses. Payment of these Fund and Board expenses is facilitated by a company providing limited administrative services to the Fund and the Board. For the period June 1, 2011 through February 29, 2012, other expenses paid to this company were $12,999.
Compensation of Board Members
Board members are compensated for their services to the Fund as disclosed in the Statement of Operations. Under a Deferred Compensation Plan (the Plan), the Board members who are not "interested persons" of the Fund, as defined under the 1940 Act, may elect to defer payment of up to 100% of their compensation. Deferred amounts are treated as though equivalent dollar amounts had been invested in shares of certain funds managed by the Investment Manager. The Fund's liability for these amounts is adjusted for market value changes and remains in the Fund until distributed in accordance with the Plan.
Compensation of Chief Compliance Officer
The Board has appointed a Chief Compliance Officer to the Fund in accordance with federal securities regulations. Effective April 1, 2011, the Fund's expenses associated with the Chief Compliance Officer are paid directly by the Investment Manager. Prior to April 1, 2011, the Fund, along with other affiliated funds, paid its pro-rata share of the expenses for the Chief Compliance Officer. Such fees did not exceed $15,000 per year.
Transfer Agent Fees
Under a Transfer and Dividend Disbursing Agent Agreement, Columbia Management Investment Services Corp. (the Transfer Agent), an affiliate of the Investment Manager and a wholly-owned subsidiary of Ameriprise Financial, is responsible for providing transfer agency services to the Fund. The Transfer Agent has contracted with Boston Financial Data Services (BFDS) to serve as sub-transfer agent.
30
Columbia Mid Cap Value Fund, February 29, 2012
The Transfer Agent receives monthly account-based service fees based on the number of open accounts and is reimbursed by the Fund for the fees and expenses the Transfer Agent pays to financial intermediaries that maintain omnibus accounts with the Fund that is a percentage of the average aggregate value of the Fund's shares maintained in each such omnibus account (other than omnibus accounts for which American Enterprise Investment Services Inc. is the broker of record or accounts where the beneficial shareholder is a customer of Ameriprise Financial Services, Inc., which are paid a per account fee). The Transfer Agent pays the fees of BFDS for services as sub-transfer agent and is not entitled to reimbursement for such fees from the Fund (with the exception of out-of-pocket fees).
The Transfer Agent also receives compensation from fees for various shareholder services and reimbursements for certain out-of-pocket expenses. Class I shares do not pay transfer agent fees. Total transfer agent fees for Class R4 shares are subject to an annual limitation of not more than 0.05% of the average daily net assets attributable to each share class.
For the year ended February 29, 2012, the Fund's effective transfer agent fee rates as a percentage of average daily net assets of each class were as follows:
| Class A | | | 0.20 | % | |
| Class B | | | 0.20 | | |
| Class C | | | 0.20 | | |
| Class R | | | 0.23 | | |
| Class R4 | | | 0.05 | | |
| Class W | | | 0.21 | | |
| Class Y | | | 0.09 | | |
| Class Z | | | 0.20 | | |
An annual minimum account balance fee of $20 may apply to certain accounts with a value below the Fund's initial minimum investment requirements to reduce the impact of small accounts on transfer agent fees. These minimum account balance fees are recorded as part of expense reductions in the Statement of Operations. For the year ended February 29, 2012, these minimum account balance fees reduced total expenses by $18,489.
Plan Administration Fees
Under a Plan Administration Services Agreement with the Transfer Agent, the Fund pays an annual fee at a rate of 0.25% of the Fund's average daily net assets attributable to Class R4 shares for the provision of various administrative, recordkeeping, communication and educational services.
Distribution and Service Fees
The Fund has an agreement with Columbia Management Investment Distributors, Inc. (the Distributor), an affiliate of the Investment Manager and a wholly-owned subsidiary of Ameriprise Financial, for distribution and shareholder services. Pursuant to Rule 12b-1 under the 1940 Act, the Board has approved, and the Fund has adopted, distribution and shareholder service plans (the Plans) which set the distribution and service fees for the Fund. These fees are calculated daily and are intended to compensate the Distributor and/or eligible selling and/or servicing agents for selling shares of the Fund and providing services to investors.
The Plans require the payment of a monthly combined distribution and service fee to the Distributor at the maximum annual rate of 0.25% of the average daily net assets attributable to Class A shares of the Fund. The Plans also required the payment of a monthly service fee at the maximum annual rate of 0.25% of the average daily net assets attributable to Class B, Class C and Class W shares of the Fund and the payment of a monthly distribution fee at the maximum annual rates of 0.75%, 0.75%. 0.50% and 0.25% of the average daily net assets attributable to Class B, Class C, Class R and Class W shares, respectively.
The Fund may pay a distribution fee of up to 0.25% of the Fund's average daily net assets attributable to Class W shares and a service fee of up to 0.25% of the Fund's average daily net assets attributable to Class W shares, provided, however, that the aggregate fee shall not exceed 0.25% of the Fund's average daily net assets attributable to Class W shares.
Sales Charges
Sales charges, including front-end charges and CDSCs, received by the Distributor for distributing Fund shares were $180,474 for Class A, $33,200 for Class B, $9,366 for Class C shares for the year ended February 29, 2012.
31
Columbia Mid Cap Value Fund, February 29, 2012
Expenses Waived/Reimbursed by the Investment Manager and its Affiliates
Effective April 30, 2011, the Investment Manager and certain of its affiliates have contractually agreed to waive fees and/or reimburse expenses (excluding certain fees and expenses described below as well as any reorganization costs allocated to the Fund), through June 30, 2012, unless sooner terminated at the sole discretion of the Board, so that the Fund's net operating expenses, after giving effect to fees waived/expenses reimbursed and any balance credits and/or overdraft charges from the Fund's custodian, do not exceed the following annual rates as a percentage of the class' average daily net assets:
| Class A | | | 1.19 | % | |
| Class B | | | 1.94 | | |
| Class C | | | 1.94 | | |
| Class I | | | 0.80 | | |
| Class R | | | 1.44 | | |
| Class R4 | | | 1.10 | | |
| Class W | | | 1.19 | | |
| Class Y | | | 0.94 | | |
| Class Z | | | 0.94 | | |
Under the agreement, the following fees and expenses are excluded from the waiver/reimbursement commitment, and therefore will be paid by the Fund, if applicable: taxes (including foreign transaction taxes), expenses associated with investments in affiliated and non-affiliated pooled investment vehicles (including mutual funds and exchange traded funds), transaction costs and brokerage commissions, costs related to any securities lending program, dividend expenses associated with securities sold short, inverse floater program fees and expenses, transaction charges and interest on borrowed money, interest, extraordinary expenses and any other expenses the exclusion of which is specifically approved by the Board. This agreement may be modified or amended only with approval from all parties. Reorganization (see Note 12) costs were allocated to the Fund only to the extent they are expected to be offset by the anticipated reduction in expenses borne by the Fund's shareholders during the first year following the Reorganization.
Prior to April 30, 2011, the Investment Manager voluntarily agreed to reimburse a portion of the Fund's expenses so that the Fund's ordinary operating expenses (excluding certain expenses, such as brokerage commissions, interest, taxes and extraordinary expenses, but including custodian charges relating to overdrafts, if any), after giving effect to any balance credits from the Fund's custodian, did not exceed the following annual rates as a percentage of the class' average daily net assets:
| Class A | | | 1.30 | % | |
| Class B | | | 2.05 | | |
| Class C | | | 2.05 | | |
| Class I | | | 0.91 | | |
| Class R | | | 1.55 | | |
| Class R4 | | | 1.21 | | |
| Class W | | | 1.30 | | |
| Class Y | | | 1.05 | | |
| Class Z | | | 1.05 | | |
Note 4. Federal Tax Information
The timing and character of income and capital gain distributions are determined in accordance with income tax regulations, which may differ from GAAP because of temporary or permanent book to tax differences.
For the year ended February 29, 2012, these differences are primarily due to differing treatment for Return of Capital sales basis adjustment, non-deductible merger expense, proceeds from litigation settlements, capital loss carryforwards, Trustees' deferred compensation and deferral/reversal of wash sale losses. To the extent these differences are permanent, reclassifications are made among the components of the Fund's net assets in the Statement of Assets and Liabilities. Temporary differences do not require reclassifications. In the Statement of Assets and Liabilities the following reclassifications were made:
| Undistributed net investment income | | $ | 105,911 | | |
| Accumulated net realized loss | | | 929,746 | | |
| Paid-in capital | | | (1,035,657 | ) | |
32
Columbia Mid Cap Value Fund, February 29, 2012
Net investment income and net realized gains (losses), as disclosed in the Statement of Operations, and net assets were not affected by this reclassification.
The tax character of distributions paid during the years indicated was as follows:
| Year ended February 29, | | 2012 | | 2011 | |
| Ordinary income | | $ | 29,434,025 | | | $ | 57,327,237 | | |
Short-term capital gain distributions, if any, are considered ordinary income distributions for tax purposes.
At February 29, 2012, the components of distributable earnings on a tax basis were as follows:
| Undistributed ordinary income | | $ | 1,844,299 | | |
| Undistributed accumulated long-term gain | | | — | | |
| Unrealized appreciation | | | 695,865,015 | | |
At February 29, 2012, the cost of investments for federal income tax purposes was $4,235,597,592 and the aggregate gross unrealized appreciation and depreciation based on that cost was:
| Unrealized appreciation | | $ | 808,827,694 | | |
| Unrealized depreciation | | $ | (112,962,679 | ) | |
| Net unrealized app/depreciation | | $ | 695,865,015 | | |
The following capital loss carry forward, determined at February 29, 2012, may be available to reduce taxable income arising from future net realized gains on investments, if any, to the extent permitted by the Internal Revenue Code:
| Year of expiration | | Amount | |
| 2018 | | $ | 304,313,399 | | |
On December 22, 2010, the Regulated Investment Company Modernization Act of 2010 (the Act) was enacted, which changed various technical rules governing the tax treatment of regulated investment companies. The changes are generally effective for taxable years beginning after the date of enactment. Under the Act, the Fund will be permitted to carry forward capital losses incurred in taxable years beginning after the date of enactment for an unlimited period. However, any losses incurred during those future taxable years will be required to be utilized prior to the losses incurred in pre-enactment taxable years, which carry an expiration date. As a result of this ordering rule, pre-enactment capital loss carryforwards may be more likely to expire unused.
Columbia Mid Cap Value Fund acquired unrealized capital gains as a result of the merger with Riversource Disciplined Small & Mid Cap Equity Fund (Note 12). Due to the acquisition of unrealized capital gains the yearly utilization of the Fund's capital loss carryforward may be limited by the Internal Revenue Code.
For the year ended February 29, 2012, $332,777,382 of capital loss carryforward was utilized.
Management of the Fund has concluded that there are no significant uncertain tax positions that would require recognition in the financial statements. However, management's conclusion may be subject to review and adjustment at a later date based on factors including, but not limited to, new tax laws, regulations, and administrative interpretations (including relevant court decisions). Generally, the Fund's federal tax returns for the prior three fiscal years remain subject to examination by the Internal Revenue Service.
Note 5. Portfolio Information
The cost of purchases and proceeds from sales of securities, excluding short-term obligations, aggregated to $1,711,522,372 and $2,647,848,434, respectively, for the year ended February 29, 2012. Transactions to realign the Fund's portfolio following the merger as described in Note 12 are excluded for purposes of calculating the Fund's portfolio turnover rate. These realignment transactions amounted to cost of purchases and proceeds from sales of $107,716,147 and $116,980,620, respectively.
Note 6. Regulatory Settlements
During the year ended February 29, 2012, the Fund received payments of $236,136 resulting from certain regulatory settlements with third parties in which the Fund had participated. The payments have been included in "Proceeds
33
Columbia Mid Cap Value Fund, February 29, 2012
from regulatory settlements" in the Statement of Changes in Net Assets.
During the year ended February 28, 2011, the Fund received payments of $17,400 resulting from certain regulatory settlements with third parties in which the Fund had participated. The payments have been included in "Proceeds from regulatory settlements" in the Statement of Changes in Net Assets.
Note 7. Lending of Portfolio Securities
Effective March 28, 2011, the Fund has entered into a Master Securities Lending Agreement (the Agreement) with JPMorgan Chase Bank, N.A. (JPMorgan). The Agreement, which replaces the previous security lending arrangement with State Street, authorizes JPMorgan as lending agent to lend securities to authorized borrowers in order to generate additional income on behalf of the Fund. Pursuant to the Agreement, the securities loaned are secured by cash or U.S. government securities equal to at least 100% of the market value of the loaned securities. Any additional collateral required to maintain those levels due to market fluctuations of the loaned securities is requested to be delivered the following business day. Cash collateral received is invested by the lending agent on behalf of the Fund into authorized investments pursuant to the Agreement. The investments made with the cash collateral are listed in the Portfolio of Investments. The values of such investments and any uninvested cash collateral are disclosed in the Statement of Assets and Liabilities along with the related obligation to return the collateral upon the return of the securities loaned.
At February 29, 2012, securities valued at $862,324,180 were on loan, secured by cash collateral of $887,504,518 (which does not reflect calls for collateral made to borrowers by JPMorgan at period end) that is partially or fully invested in short-term securities or other cash equivalents.
Risks of delay in recovery of securities or even loss of rights in the securities may occur should the borrower of the securities fail financially. Risks may also arise to the extent that the value of the securities loaned increases above the value of the collateral received. JPMorgan will indemnify the Fund from losses resulting from a borrower's failure to return a loaned security when due. Such indemnification does not extend to losses associated with declines in the value of cash collateral investments. The Investment Manager is not responsible for any losses incurred by the Fund in connection with the securities lending program. Loans are subject to termination by the Fund or the borrower at any time, and are, therefore, not considered to be illiquid investments.
Pursuant to the Agreement, the Fund receives income for lending its securities either in the form of fees or by earning interest on invested cash collateral, net of negotiated rebates paid to borrowers and fees paid to the lending agent for services provided and any other securities lending expenses. Net income earned from securities lending for the year ended February 29, 2012 is disclosed in the Statement of Operations. The Fund continues to earn and accrue interest and dividends on the securities loaned.
Prior to March 28, 2011, the Fund participated in a securities lending arrangement with State Street. Each security on loan was collateralized in an amount at least equal to the market value of the securities loaned plus accrued income from the investment of collateral. The income generated by the investment of the collateral, net of any fees remitted to State Street as the lending agent and borrower rebates, was paid to the Fund.
Note 8. Custody Credits
Prior to March 28, 2011, the Fund had an agreement with its custodian bank under which custody fees may have been reduced by balance credits. These credits are recorded as part of expense reductions on the Statement of Operations. The Fund could have invested a portion of the assets utilized in connection with the expense offset arrangement in an income-producing asset if they had not entered into such an agreement. Subsequent to this date, the Fund may invest its daily balance in an affiliated money market fund as detailed below. For the period March 1, 2011 through March 27, 2011, there were no custody credits.
Note 9. Affiliated Money Market Fund
Effective March 28, 2011, the Fund may invest its daily cash balances in Columbia Short-Term Cash Fund, an affiliated money market fund established for the exclusive use by the Fund and other affiliated funds. The income earned by the Fund from such investments is included as "Dividends from affiliates" in the Statement of Operations. As an investing fund, the Fund indirectly bears its proportionate share of the expenses of Columbia Short-Term Cash Fund.
34
Columbia Mid Cap Value Fund, February 29, 2012
Note 10. Shareholder Concentration
At February 29, 2012, two unaffiliated shareholder accounts owned an aggregate of 32.0% of the outstanding shares of the Fund. The Fund has no knowledge about whether any portion of those shares was owned beneficially by such accounts. Subscription and redemption activity by concentrated accounts of these accounts may have a significant effect on the operations of the Fund.
Note 11. Line of Credit
The Fund has entered into a revolving credit facility with a syndicate of banks led by JPMorgan Chase Bank, N.A. (the Administrative Agent), whereby the Fund may borrow for the temporary funding of shareholder redemptions or for other temporary or emergency purposes. The credit facility became effective on March 28, 2011, replacing a prior credit facility. The credit facility agreement, as amended, which is a collective agreement between the Fund and certain other funds managed by the Investment Manager, severally and not jointly, permits collective borrowings up to $500 million. Pursuant to a December 13, 2011 amendment to the credit facility agreement, interest is charged to each participating fund based on its borrowings at a rate equal to the higher of (i) the overnight federal funds rate plus 1.00% or (i) the one-month LIBOR rate plus 1.00%. Each borrowing under the credit facility matures no later than 60 days after the date of borrowing. The Fund also pays a commitment fee equal to its pro rata share of the amount of the credit facility at a rate of 0.08% per annum. For the period March 28, 2011 through December 13, 2011, interest was charged to each participating fund based on its borrowings at a rate equal to the sum of the federal funds rate plus (i) 1.25% per annum plus (ii) if one-month LIBOR exceeds the federal funds rate, the amount of such excess. The Fund also paid a commitment fee equal to its pro rata share of the amount of the credit facility at a rate of 0.10% per annum.
Prior to March 28, 2011, the Fund and certain other funds managed by the Investment Manager participated in a $280 million committed, unsecured revolving credit facility provided by State Street. Interest was charged to each fund based on its borrowings at a rate equal to the greater of the (i) federal funds rate plus 1.25% per annum or (ii) the overnight LIBOR rate plus 1.25% per annum. The Fund also paid a commitment fee equal to its pro rata share of the amount of the credit facility at a rate of 0.125% per annum.
The Fund had no borrowings during the year ended February 29, 2012.
Note 12. Fund Merger
At the close of business on June 3, 2011, the Fund acquired the assets and assumed the identified liabilities of RiverSource Disciplined Small & Mid Cap Equity Fund, a series of RiverSource Dimensions Series, Inc. The reorganization was completed after shareholders of RiverSource Disciplined Small & Mid Cap Equity Fund approved the plan on February 15, 2011. The purpose of the transaction was to combine two funds managed by the Investment Manager with comparable investment objectives and strategies.
The aggregate net assets of the Fund immediately before the acquisition were $4,928,664,500 and the combined net assets immediately after the acquisition were $5,047,066,356.
The merger was accomplished by a tax-free exchange of 15,504,454 shares of RiverSouce Disciplined Small & Mid Cap Equity Fund valued at $118,401,856 (including $19,533,720 of unrealized appreciation).
In exchange for RiverSource Disciplined Small & Mid Cap Equity Fund shares, Columbia Mid Cap Value Fund issued the following number of shares:
| | | Shares | |
| Class A | | | 764,899 | | |
| Class B | | | 52,469 | | |
| Class C | | | 21,768 | | |
| Class I | | | 262,588 | | |
| Class R4 | | | 681 | | |
| Class W | | | 7,276,910 | | |
For financial reporting purposes, net assets received and shares issued by the Fund were recorded at fair value; however, RiverSource Disciplined Small & Mid Cap Equity Fund's cost of investments was carried forward.
The financial statements reflect the operations of the Fund for the period prior to the merger and the combined fund for the
35
Columbia Mid Cap Value Fund, February 29, 2012
period subsequent to the merger. Because the combined investment portfolios have been managed as a single integrated portfolio since the merger was completed, it is not practicable to separate the amounts of revenue and earnings of RiverSource Disciplined Small & Mid Cap Equity that have been included in the combined Fund's Statement of Operations since the merger was completed.
Assuming the merger had been completed on March 1, 2011, the Fund's pro-forma net investment income, net gain on investments, net change in unrealized depreciation and net decrease in net assets from operations for the year ended September 29, 2012 would have been approximately $37.0 million, $343.4 million, $(529.2) million and $(148.8) million, respectively.
Note 13. Subsequent Events
Management has evaluated the events and transactions that have occurred through the date the financial statements were issued and noted no items requiring adjustment of the financial statements or additional disclosure.
Note 14. Information Regarding Pending and Settled Legal Proceedings
In June 2004, an action captioned John E. Gallus et al. v. American Express Financial Corp. and American Express Financial Advisors Inc. was filed in the United States District Court for the District of Arizona. The plaintiffs allege that they are investors in several American Express Company mutual funds (currently branded as Columbia) and they purport to bring the action derivatively on behalf of those funds under the Investment Company Act of 1940. The plaintiffs allege that fees allegedly paid to the defendants by the funds for investment advisory and administrative services are excessive. The plaintiffs seek remedies including restitution and rescission of investment advisory and distribution agreements. The plaintiffs voluntarily agreed to transfer this case to the United States District Court for the District of Minnesota (the District Court). In response to defendants' motion to dismiss the complaint, the District Court dismissed one of plaintiffs' four claims and granted plaintiffs limited discovery. Defendants moved for summary judgment in April 2007. Summary judgment was granted in the defendants' favor on July 9, 2007. The plaintiffs filed a notice of appeal with the Eighth Circuit Court of Appeals (the Eighth Circuit) on August 8, 2007. On April 8, 2009, the Eighth Circuit reversed summary judgment and remanded to the District Court for further proceedings. On August 6, 2009, defendants filed a writ of certiorari with the U.S. Supreme Court (the Supreme Court), asking the Supreme Court to stay the District Court proceedings while the Supreme Court considered and ruled in a case captioned Jones v. Harris Associates, which involved issues of law similar to those presented in the Gallus case. On March 30, 2010, the Supreme Court issued its ruling in Jones v. Harris Associates, and on April 5, 2010, the Supreme Court vacated the Eighth Circuit's decision in the Gallus case and remanded the case to the Eighth Circuit for further consideration in light of the Supreme Court's decision in Jones v. Harris Associates. On June 4, 2010, the Eighth Circuit remanded the Gallus case to the District Court for further consideration in light of the Supreme Court's decision in Jones v. Harris Associates. On December 9, 2010, the District Court reinstated its July 9, 2007 summary judgment order in favor of the defendants. On January 10, 2011, plaintiffs filed a notice of appeal with the Eighth Circuit. In response to the plaintiffs' opening appellate brief filed on March 18, 2011, the defendants filed a response brief on May 4, 2011 with the Eighth Circuit. The plaintiffs filed a reply brief on May 26, 2011 and oral arguments took place on November 17, 2011. On March 30, 2012, the Eighth Circuit upheld the grant of summary judgment by the District Court in favor of the defendants.
In December 2005, without admitting or denying the allegations, American Express Financial Corporation (AEFC, which is now known as Ameriprise Financial, Inc. (Ameriprise Financial)) entered into settlement agreements with the Securities and Exchange Commission (SEC) and Minnesota Department of Commerce (MDOC) related to market timing activities. As a result, AEFC was censured and ordered to cease and desist from committing or causing any violations of certain provisions of the Investment Advisers Act of 1940, the Investment Company Act of 1940, and various Minnesota laws. AEFC agreed to pay disgorgement of $10 million and civil money penalties of $7 million. AEFC also agreed to retain an independent distribution consultant to assist in developing a plan for distribution of all disgorgement and civil penalties ordered by the SEC in accordance with various undertakings detailed at www.sec.gov/litigation/admin/ia-2451.pdf. Ameriprise Financial and its affiliates have cooperated with the
36
Columbia Mid Cap Value Fund, February 29, 2012
SEC and the MDOC in these legal proceedings, and have made regular reports to the funds' Boards of Trustees.
Ameriprise Financial and certain of its affiliates have historically been involved in a number of legal, arbitration and regulatory proceedings, including routine litigation, class actions, and governmental actions, concerning matters arising in connection with the conduct of their business activities. Ameriprise Financial believes that the Funds are not currently the subject of, and that neither Ameriprise Financial nor any of its affiliates are the subject of, any pending legal, arbitration or regulatory proceedings that are likely to have a material adverse effect on the Funds or the ability of Ameriprise Financial or its affiliates to perform under their contracts with the Funds. Ameriprise Financial is required to make 10-Q, 10-K and, as necessary, 8-K filings with the Securities and Exchange Commission on legal and regulatory matters that relate to Ameriprise Financial and its affiliates. Copies of these filings may be obtained by accessing the SEC website at www.sec.gov.
There can be no assurance that these matters, or the adverse publicity associated with them, will not result in increased fund redemptions, reduced sale of fund shares or other adverse consequences to the Funds. Further, although we believe proceedings are not likely to have a material adverse effect on the Funds or the ability of Ameriprise Financial or its affiliates to perform under their contracts with the Funds, these proceedings are subject to uncertainties and, as such, we are unable to estimate the possible loss or range of loss that may result. An adverse outcome in one or more of these proceedings could result in adverse judgments, settlements, fines, penalties or other relief that could have a material adverse effect on the consolidated financial condition or results of operations of Ameriprise Financial.
37
Report of Independent Registered Public Accounting Firm
To the Trustees of Columbia Funds Series Trust and the Shareholders of Columbia Mid Cap Value Fund
In our opinion, the accompanying statement of assets and liabilities, including the investment portfolio, and the related statements of operations and of changes in net assets and the financial highlights present fairly, in all material respects, the financial position of Mid Cap Value Fund (the "Fund") (a series of Columbia Funds Series Trust) at February 29, 2012, the results of its operations for the year then ended, the changes in its net assets for each of the two years in the period then ended and the financial highlights for each of the periods indicated, in conformity with accounting principles generally accepted in the United States of America. These financial statements and financial highlights (hereafter referred to as "financial statements") are the responsibility of the Fund's management. Our responsibility is to express an opinion on these financial statements based on our audits. We conducted our audits of these financial statements in accordance with the standards of the Public Company Accounting Oversight Board (United States). Those standards require that we plan and perform the audit to obtain reasonable assurance about whether the financial statements are free of material misstatement. An audit includes examining, on a test basis, evidence supporting the amounts and disclosures in the financial statements, assessing the accounting principles used and significant estimates made by management, and evaluating the overall financial statement presentation. We believe that our audits, which included confirmation of securities at February 29, 2012 by correspondence with the custodian, transfer agent and brokers, provide a reasonable basis for our opinion.
PricewaterhouseCoopers LLP
Minneapolis, Minnesota
April 20, 2012
38
Federal Income Tax Information (Unaudited) – Columbia Mid Cap Value Fund
For non-corporate shareholders, 100% or the maximum amount allowable under the Jobs and Growth Tax Relief Reconciliation Act of 2003, of the ordinary income distributed by the Fund for the fiscal year ended February 29, 2012 may represent qualified dividend income.
100% of the ordinary income distributed by the Fund for the fiscal year ended February 29, 2012, qualifies for the corporate dividends received deduction.
The Fund will notify shareholders in January 2013 of amounts for use in preparing 2012 income tax returns.
39
Fund Governance
Shareholders elect the Board that oversees the funds' operations. The Board appoints officers who are responsible for day-to-day business decisions based on policies set by the Board. The following table provides basic biographical information about the funds' Board members, including their principal occupations during the past five years, although specific titles for individuals may have varied over the period. Under current Board policy, members may serve until the next Board meeting after he or she reaches the mandatory retirement age established by the Board, or the fifteenth anniversary of the first Board meeting they attended as a member of the Board.
On September 29, 2009, Ameriprise Financial, the parent company of Columbia Management, entered into an agreement with Bank of America, N.A. ("Bank of America") to acquire a portion of the asset management business of Columbia Management Group, LLC and certain of its affiliated companies (the "Transaction"). Following the Transaction, which became effective on May 1, 2010, various alignment activities have occurred with respect to the Fund Family. In connection with the Transaction, Mr. Edward J. Boudreau, Jr., Mr. William P. Carmichael, Mr. William A. Hawkins, Mr. R. Glenn Hilliard, Mr. John J. Nagorniak, Ms. Minor M. Shaw and Dr. Anthony M. Santomero, who were members prior to the Transaction of the Legacy Columbia Nations funds' Board ("Nations Funds"), which includes Columbia Funds Series Trust, Columbia Funds Variable Insurance Trust I and Columbia Funds Master Investment Trust, LLC., began service on the Board for the Legacy RiverSource funds ("RiverSource Funds") effective June 1, 2011, which resulted in an overall increase from twelve Trustees to sixteen for all mutual funds overseen by the Board.
Independent Board Members
| Name, Address, Age | | Position Held
with Funds
and Length
of Service | | Principal Occupation During Past Five Years | | Number of
Funds in the
Fund Family
Overseen by
Board Member | | Other Present or
Past Directorships/
Trusteeships
(Within Past 5 Years) | |
| Kathleen Blatz | |
|
901 S. Marquette Ave.
Minneapolis, MN 55402
Age 57 | | Board member since 1/06 for RiverSource Funds and since 6/11 for Nations Funds | | Attorney; Chief Justice, Minnesota Supreme Court, 1998-2006 | | | 153 | | | None | |
|
| Edward J. Boudreau, Jr. | |
|
225 Franklin Street
Mail Drop
BX32 05228
Boston, MA 02110
Age 67 | | Board member since 6/11 for RiverSource Funds and since 1/05 for Nations Funds | | Managing Director, E.J. Boudreau & Associates (consulting) since 2000 | | | 146 | | | Former Trustee, BofA Funds Series Trust (11 funds) | |
|
| Pamela G. Carlton | |
|
901 S. Marquette Ave.
Minneapolis, MN 55402
Age 57 | | Board member since 7/07 for RiverSource Funds and since 6/11 for Nations Funds | | President, Springboard-Partners in Cross Cultural Leadership (consulting company) | | | 153 | | | None | |
|
40
Fund Governance (continued)
Independent Board Members (continued)
| Name, Address, Age | | Position Held
with Funds
and Length
of Service | | Principal Occupation During Past Five Years | | Number of
Funds in the
Fund Family
Overseen by
Board Member | | Other Present or
Past Directorships/
Trusteeships
(Within Past 5 Years) | |
| William P. Carmichael | |
|
225 Franklin Street
Mail Drop
BX32 05228
Boston, MA 02110
Age 68 | | Board member since 6/11 for RiverSource Funds and since 1999 for Nations Funds | | Retired | | | 146 | | | Director, Cobra Electronics Corporation (electronic equipment manufacturer); The Finish Line (athletic shoes and apparel); McMoRan Exploration Company (oil and gas exploration and development); former Trustee, BofA Funds Series Trust (11 funds); former Director, Spectrum Brands, Inc. (consumer products); former Director, Simmons Company (bedding) | |
|
| Patricia M. Flynn | |
|
901 S. Marquette Ave.
Minneapolis, MN 55402
Age 61 | | Board member since 11/04 for RiverSource Funds and since 6/11 for Nations Funds | | Trustee Professor of Economics and Management, Bentley University; former Dean, McCallum Graduate School of Business, Bentley University | | | 153 | | | None | |
|
| William A. Hawkins | |
|
225 Franklin Street
Mail Drop
BX32 05228
Boston, MA 02110
Age 69 | | Board member since 6/11 for RiverSource Funds and since 1/05 for Nations Funds | | Managing Director, Overton Partners (financial consulting), since August 2010; President and Chief Executive Officer, California General Bank, N.A., January 2008-August 2010 | | | 146 | | | Trustee, BofA Funds Series Trust (11 funds) | |
|
| R. Glenn Hilliard | |
|
225 Franklin Street
Mail Drop
BX32 05228
Boston, MA 02110
Age 69 | | Board member since 6/11 for RiverSource Funds and since 1/05 for Nations Funds | | Chairman and Chief Executive Officer, Hilliard Group LLC (investing and consulting), since April 2003; Non-Executive Director & Chairman, CNO Financial Group, Inc. (formerly Conseco, Inc.) (insurance), September 2003-May 2011 | | | 146 | | | Chairman, BofA Fund Series Trust (11 funds); former Director, CNO Financial Group, Inc. (insurance) | |
|
41
Fund Governance (continued)
Independent Board Members (continued)
| Name, Address, Age | | Position Held
with Funds
and Length
of Service | | Principal Occupation During Past Five Years | | Number of
Funds in the
Fund Family
Overseen by
Board Member | | Other Present or
Past Directorships/
Trusteeships
(Within Past 5 Years) | |
| Stephen R. Lewis, Jr. | |
|
901 S. Marquette Ave.
Minneapolis, MN 55402
Age 73 | | Chair of the Board for RiverSource Funds since 1/07, Board member for RiverSource Funds since 1/02 and since 6/11 for Nations Funds | | President Emeritus and Professor of Economics Emeritus, Carleton College | | | 153 | | | Director, Valmont Industries, Inc. (manufactures irrigation systems) | |
|
| John F. Maher | |
|
901 S. Marquette Ave.
Minneapolis, MN 55402
Age 68 | | Board member since 12/06 for Legacy Seligman funds, since 12/08 for RiverSource Funds and since 6/11 for Nations Funds | | Retired President and Chief Executive Officer and former Director, Great Western Financial Corporation (financial services), 1986-1997 | | | 153 | | | None | |
|
| John J. Nagorniak | |
|
225 Franklin Street
Mail Drop
BX32 05228
Boston, MA 02110
Age 67 | | Board member since 6/11 for RiverSource Funds and since 1/08 for Nations Funds | | Retired; President and Director, Foxstone Financial, Inc. (consulting), 2000-2007; Director, Mellon Financial Corporation affiliates (investing), 2000-2007; Chairman, Franklin Portfolio Associates (investing—Mellon affiliate), 1982-2007 | | | 146 | | | Trustee, Research Foundation of CFA Institute; Director, MIT Investment Company; Trustee, MIT 401k Plan; former Trustee, BofA Funds Series Trust (11 funds) | |
|
| Catherine James Paglia | |
|
901 S. Marquette Ave.
Minneapolis, MN 55402
Age 59 | | Board member since 11/04 for RiverSource Funds and since 6/11 for Nations Funds | | Director, Enterprise Asset Management, Inc. (private real estate and asset management company) | | | 153 | | | None | |
|
42
Fund Governance (continued)
Independent Board Members (continued)
| Name, Address, Age | | Position Held
with Funds
and Length
of Service | | Principal Occupation During Past Five Years | | Number of
Funds in the
Fund Family
Overseen by
Board Member | | Other Present or
Past Directorships/
Trusteeships
(Within Past 5 Years) | |
| Leroy C. Richie | |
|
901 S. Marquette Ave.
Minneapolis, MN 55402
Age 70 | | Board member since 2000 for Legacy Seligman funds, since 11/08 for RiverSource Funds and since 6/11 for Nations Funds | | Counsel, Lewis & Munday, P.C. since 2004; former Vice President and General Counsel, Automotive Legal Affairs, Chrysler Corporation | | | 153 | | | Director, Digital Ally, Inc. (digital imaging); Director, Infinity, Inc. (oil and gas exploration and production); Director, OGE Energy Corp. (energy and energy services) | |
|
| Minor M. Shaw | |
|
225 Franklin Street
Mail Drop
BX32 05228
Boston, MA 02110
Age 64 | | Board member since 6/11 for RiverSource Funds and since 2003 for Nations Funds | | President—Micco LLC (private investments) | | | 146 | | | Former Trustee, BofA Funds Series Trust (11 funds); Board Member, Piedmont Natural Gas; Director, Blue Cross Blue Shield of South Carolina | |
|
| Alison Taunton-Rigby | |
|
901 S. Marquette Ave.
Minneapolis, MN 55402
Age 67 | | Board member since 11/02 for RiverSource Funds and since 6/11 for Nations Funds | | Chief Executive Officer and Director, RiboNovix, Inc. 2003-2010 (biotechnology); former President, Aquila Biopharmaceuticals | | | 153 | | | Director, Healthways, Inc. (health management programs); Director, ICI Mutual Insurance Company, RRG; Director, Abt Associates (government contractor) | |
|
43
Fund Governance (continued)
Interested Board Member Not Affiliated with Investment Manager*
| Name, Address, Age | | Position Held
with Funds
and Length
of Service | | Principal Occupation During Past Five Years | | Number of
Funds in the
Fund Family
Overseen by
Board Member | | Other Present or
Past Directorships/
Trusteeships
(Within Past 5 Years) | |
| Anthony M. Santomero* | | | | | | | | | |
|
225 Franklin Street
Mail Drop
BX32 05228
Boston, MA 02110
Age 65 | | Board member since 6/11 for RiverSource Funds and since 1/08 for Nations Funds | | Richard K. Mellon Professor Emeritus of Finance, The Wharton School, University of Pennsylvania, since 2002; Senior Advisor, McKinsey & Company (consulting), 2006-2008; President and Chief Executive Officer, Federal Reserve Bank of Philadelphia, 2000-2006 | | | 146 | | | Director, Renaissance Reinsurance Ltd.; Trustee, Penn Mutual Life Insurance Company; Director, Citigroup; Director, Citibank, N.A.; former Trustee, BofA Funds Series Trust (11 funds) | |
|
* Dr. Santomero is not an affiliated person of the Investment Manager or Ameriprise Financial. However, he is currently deemed by the funds to be an "interested person" (as defined in the 1940 Act) of the Funds because he serves as a Director of Citigroup, Inc. and Citibank N.A., companies that may directly or through subsidiaries and affiliates engage from time-to-time in brokerage execution, principal transactions and lending relationships with the funds or accounts advised/managed by the Investment Manager.
| Interested Board Member Affiliated with Investment Manager* | | | | | | | | | |
|
| William F. Truscott | | | | | | | | | |
|
53600 Ameriprise Financial Center
Minneapolis, MN 55474
Age 51 | | Board member since 11/01 for RiverSource Funds and since 6/11 for Nations Funds; Senior Vice President since 2002 for RiverSource Funds and 5/10 for Nations Funds | | Chairman of the Board and President, Columbia Management Investment Advisers, LLC since May 2010 and February 2012, respectively (previously President, Chairman of the Board and Chief Investment Officer, 2001-April 2010); Chief Executive Officer, U.S. Asset Management & President, Annuities, Ameriprise Financial, Inc. since May 2010 (previously President—U.S. Asset Management and Chief Investment Officer, 2005-April 2010); Director, President and Chief Executive Officer, Ameriprise Certificate Company since 2006; Director and Chief Executive Officer, Columbia Management Investment Distributors, Inc. since May 2010 and February 2012, respectively (previously Chairman of the Board and Chief Executive Officer, 2006-April 2010); Chairman of the Board and Chief Executive Officer, RiverSource Distributors, Inc. since 2006. | | | 153 | | | None | |
|
* Interested person (as defined under the 1940 Act) by reason of being an officer, director, security holder and/or employee of the Investment Manager or Ameriprise Financial.
The SAI has additional information about the Fund's Board members and is available, without charge, upon request by calling 800.345.6611; contacting your financial intermediary; or visiting columbiamanagement.com.
44
Fund Governance (continued)
Officers
| Name, Year of Birth and Address | | Principal Occupation(s) During the Past Five Years | |
| J. Kevin Connaughton (Born 1964) | |
|
225 Franklin Street
Boston, MA 02110
President (since 2009) | | Senior Vice President and General Manager—Mutual Fund Products, Columbia Management Investment Advisers, LLC since May 2010; President, Columbia Funds, since 2009, and RiverSource Funds, since May 2010 (previously Senior Vice President and Chief Financial Officer, Columbia Funds, from June 2008 to January 2009, Treasurer, Columbia Funds, from October 2003 to May 2008, and senior officer of various other affiliated funds since 2000); Managing Director, Columbia Management Advisors, LLC from December 2004 to April 2010. | |
|
| Michael G. Clarke (Born 1969) | |
|
225 Franklin Street
Boston, MA 02110
Treasurer (since 2011) and Chief Financial Officer (since 2009) | | Vice President, Columbia Management Investment Advisers, LLC since May 2010; Managing Director of Fund Administration, Columbia Management Advisors, LLC, from September 2004 to April 2010; senior officer of Columbia Funds and affiliated funds since 2002. | |
|
| Scott R. Plummer (Born 1959) | |
|
5228 Ameriprise Financial Center
Minneapolis, MN 55474
Senior Vice President and Chief Legal Officer (since 2010) | | Chief Legal Officer and Assistant Secretary, Columbia Management Investment Advisers, LLC since June 2005; Vice President and Lead Chief Counsel—Asset Management, Ameriprise Financial, Inc. since May 2010 (previously Vice President and Chief Counsel—Asset Management, from 2005 to April 2010); Vice President, Chief Counsel and Assistant Secretary, Columbia Management Investment Distributors, Inc. since 2008; Vice President, General Counsel and Secretary, Ameriprise Certificate Company since 2005; Chief Counsel, RiverSource Distributors, Inc. since 2006; Senior officer of Columbia Funds and affiliated funds, since 2006. | |
|
| Thomas P. McGuire (Born 1972) | |
|
225 Franklin Street
Boston, MA 02110
Chief Compliance Officer (since 2012) | | Vice President—Asset Management Compliance, Columbia Management Investment Advisers, LLC since March 2010; Chief Compliance Officer, Ameriprise Certificate Company, since September 2010; Compliance Executive, Bank of America, from June 2005 to April 2010. | |
|
| William F. Truscott (Born 1960) | |
|
53600 Ameriprise Financial Center
Minneapolis, MN 55474
Senior Vice President (since 2010) | | Chairman of the Board and President, Columbia Management Investment Advisers, LLC since May 2010 and February 2012, respectively (previously President, Chairman of the Board and Chief Investment Officer, from 2001 to April 2010); Chief Executive Officer, U.S. Asset Management & President, Annuities, Ameriprise Financial, Inc. since May 2010 (previously President—U.S. Asset Management and Chief Investment Officer from 2005 to April 2010); Director, President and Chief Executive Officer, Ameriprise Certificate Company since 2006; Director and Chief Executive Officer, Columbia Management Investment Distributors, Inc. since May 2010 and February 2012, respectively (previously Chairman of the Board and Chief Executive Officer from 2008 to April 2010); Chairman of the Board and Chief Executive Officer, RiverSource Distributors, Inc. since 2006. | |
|
| Paul D. Pearson (Born 1956) | |
|
10468 Ameriprise Financial Center
Minneapolis, MN 55474
Vice President and Assistant Treasurer (since 2011) | | Vice President—Investment Accounting, Columbia Management Investment Advisers, LLC, since May 2010; Vice President—Managed Assets, Investment Accounting, Ameriprise Financial Corporation, 1998-2010 | |
|
45
Fund Governance (continued)
Officers (continued)
| Name, Year of Birth and Address | | Principal Occupation(s) During the Past Five Years | |
| Colin Moore (Born 1958) | |
|
225 Franklin Street
Boston, MA 02110
Senior Vice President (since 2010) | | Director and Chief Investment Officer, Columbia Management Investment Advisers, LLC since May 2010; Manager, Managing Director and Chief Investment Officer of Columbia Management Advisors, LLC from 2007 to April 2010; Head of Equities, Columbia Management Advisors, LLC from 2002 to 2007. | |
|
| Christopher O. Petersen (Born 1970) | |
|
5228 Ameriprise Financial Center
Minneapolis, MN 55474
Vice President and Secretary (since 2011) | | Vice President and Chief Counsel, Ameriprise Financial since January 2010 (formerly Vice President and Group Counsel or Counsel from April 2004 to January 2010); Senior officer of Columbia Funds and affiliated funds, since 2007. | |
|
| Amy K. Johnson (Born 1965) | |
|
5228 Ameriprise Financial Center
Minneapolis, MN 55474
Vice President (since 2010) | | Senior Vice President and Chief Operating Officer, Columbia Management Investment Advisers, LLC since May 2010 (previously Chief Administrative Officer, from 2009 until April 2010, Vice President—Asset Management and Trust Company Services, from 2006 to 2009, and Vice President—Operations and Compliance from 2004 to 2006). | |
|
| Joseph F. DiMaria (Born 1968) | |
|
225 Franklin Street
Boston, MA 02110
Vice President (since 2011) and Chief Accounting Officer (since 2008) | | Vice President, Mutual Fund Administration, Columbia Management Investment Advisers, LLC, since May 2010; Director of Fund Administration, Columbia Management Advisors, LLC from January 2006 to April 2010. | |
|
| Paul B. Goucher (Born 1968) | |
|
100 Park Avenue
New York, NY 10017
Vice President and Assistant Secretary (since 2010) | | Vice President and Chief Counsel of Ameriprise Financial since January 2010 (formerly Vice President and Group Counsel from November 2008 to January 2010); Director, Managing Director and General Counsel of J. & W. Seligman & Co. Incorporated (Seligman) from July 2008 to November 2008 and Managing Director and Associate General Counsel of Seligman from January 2005 to July 2008. | |
|
| Michael E. DeFao (Born 1968) | |
|
225 Franklin Street
Boston, MA 02110
Vice President and Assistant Treasurer (since 2011) | | Vice President and Chief Counsel, Ameriprise Financial since May 2010; Associate General Counsel, Bank of America from June 2005 to April 2010 | |
|
| Stephen T. Welsh (Born 1957) | |
|
225 Franklin Street
Boston, MA 02110
Vice President (since 2006) | | President and Director, Columbia Management Investment Services Corp. since May 2010; President and Director, Columbia Management Services, Inc. from July 2004 to April 2010; Managing Director, Columbia Management Distributors, Inc. from August 2007 to April 2010. | |
|
46
This page intentionally left blank.
47
This page intentionally left blank.
48
Important Information About This Report
The fund mails one shareholder report to each shareholder address. If you would like more than one report, please call shareholder services at 1-800-345-6611 and additional reports will be sent to you. This report has been prepared for shareholders of Columbia Mid Cap Value Fund.
A description of the policies and procedures that the fund uses to determine how to vote proxies and a copy of the fund's voting records are available (i) at www.columbiamanagement.com, (ii) on the Securities and Exchange Commission's website at www.sec.gov, and (iii) without charge, upon request, by calling 1-800-368-0346. Information regarding how the fund voted proxies relating to portfolio securities during the 12-month period ended June 30 is available from the SEC's website. Information regarding how the fund voted proxies relating to portfolio securities is also available from the fund's website, www.columbiamanagement.com.
The fund files a complete schedule of portfolio holdings with the SEC for the first and third quarters of each fiscal year on Form N-Q. The fund's Form N-Q is available on the SEC's website at www.sec.gov and may be reviewed and copied at the SEC's Public Reference Room in Washington, D.C. Information on the operation of the Public Reference Room may be obtained by calling 1-800-SEC-0330.
Transfer Agent
Columbia Management Investment
Services Corp.
P.O. Box 8081
Boston, MA 02266-8081
1-800-345-6611
Distributor
Columbia Management Investment
Distributors, Inc.
225 Franklin Street
Boston, MA 02110
Investment Manager
Columbia Management Investment Advisers, LLC
225 Franklin Street
Boston, MA 02110
49

Columbia Mid Cap Value Fund
P. O. Box 8081
Boston, MA 02266-8081
columbiamanagement.com
This information is for use with concurrent or prior delivery of a fund prospectus. Investors should consider the investment objectives, risks, charges and expenses of a mutual fund carefully before investing. For a free prospectus, which contains this and other important information about the funds, visit columbiamanagement.com. Read the prospectus carefully before investing. The Fund is distributed by Columbia Management Investment Distributors, Inc., member FINRA, and managed by Columbia Management Investment Advisers, LLC.
© 2012 Columbia Management Investment Advisers, LLC. All rights reserved.
C-1216 C (4/12)

Columbia Multi-Advisor International Equity Fund
Annual Report for the Period Ended February 29, 2012
Not FDIC insured • No bank guarantee • May lose value
Table of Contents
| Fund Profile | | | 1 | | |
|
| Performance Information | | | 2 | | |
|
| Understanding Your Expenses | | | 3 | | |
|
| Portfolio Manager's Report | | | 4 | | |
|
| Portfolio of Investments | | | 7 | | |
|
Statement of Assets and
Liabilities | | | 18 | | |
|
| Statement of Operations | | | 20 | | |
|
Statement of Changes in
Net Assets | | | 21 | | |
|
| Financial Highlights | | | 23 | | |
|
| Notes to Financial Statements | | | 32 | | |
|
Report of Independent Registered
Public Accounting Firm | | | 46 | | |
|
| Federal Income Tax Information | | | 47 | | |
|
| Fund Governance | | | 48 | | |
|
Important Information About
This Report | | | 57 | | |
|
The views expressed in this report reflect the current views of the respective parties. These views are not guarantees of future performance and involve certain risks, uncertainties and assumptions that are difficult to predict, so actual outcomes and results may differ significantly from the views expressed. These views are subject to change at any time based upon economic, market or other conditions and the respective parties disclaim any responsibility to update such views. These views may not be relied on as investment advice and, because investment decisions for a Columbia Fund are based on numerous factors, may not be relied on as an indication of trading intent on behalf of any particular Columbia Fund. References to specific securities should not be construed as a recommendation or investment advice.
President's Message

Dear Shareholders,
Americans were dispirited in the fourth quarter of 2011 by Washington's inability to reach a plan for deficit reduction and Europe's piecemeal attempt to address its own fiscal issues. Yet, there was sufficient good news to encourage risk taking, buoying both stocks and bonds to solid gains.
U.S. economic data surprised on the upside and fears of recession abated. With the bar of expectations set low, investors responded positively to the announcement that the economy had expanded by 1.8% in the third quarter. Consumer confidence improved, even though consumers remain under pressure with no real increase in disposable income and a continued decline in household net worth. Headline inflation—which tracks a broad range of consumer expenditures, including food and energy—declined. Even manufacturing held its ground.
Against this backdrop, the U.S. equity markets logged solid returns. The S&P 500 Index gained 11.82%, moving into positive territory for the year with quarterly advances in all ten sectors. Mid- and small-cap stocks did even better. Value outperformed growth across all market capitalizations. Energy stocks led the market, as the price of oil moved above $100 a barrel in December. Industrials and materials stocks rose, buoyed by improving economic data. The U.S. fixed-income markets logged modest but solid returns. High-yield bonds were the best performers as the economy showed signs of improvement. Emerging market bonds were strong performers, as inflation came under control in key regions. Municipal bonds and Treasuries eked out only modest gains, as investors moved away from quality in favor of riskier assets.
While fourth quarter gains were encouraging, challenges still remain. Columbia Management, however, remains strong and steadfast. Columbia Management is the eighth largest manager of long-term mutual fund assets with $326 billion under management as of December 31, 2011. The past year has been one of considerable change for the organization as we worked diligently to align products, services and resources in the integration of Columbia Management with RiverSource Investments. The strong line-up of talent, resources and capabilities that has resulted is highlighted by the success of our products. As of December 31, 2011, Columbia Management offers 52 funds rated either 4 or 5 stars by Morningstar.*
For more information about these and other funds offered by Columbia Management, including detailed, up-to-date fund performance and portfolio information, please visit us online at columbiamanagement.com. Other information and resources available on our website include:
g timely economic analysis and market commentary
g quarterly fund commentaries
g Columbia Management Investor, a quarterly newsletter for shareholders
Thank you for your continued support of the Columbia Funds. We look forward to serving your investment needs for many years to come.
Best Regards,

J. Kevin Connaughton
President, Columbia Funds
*All ratings are based on Class Z shares as of 12/31/2011. Out of 119 Class Z share Columbia funds rated by Morningstar, 7 funds received a 5-star Overall Rating and 45 funds received a 4-star Overall Rating. The Overall Morningstar Rating for a retail mutual fund is derived from a weighted average of the performance figures associated with its 3-, 5- and 10-year (if applicable) Morningstar Rating metrics. For share classes that do not have a 3-, 5-, or 10-year actual performance history, the fund's independent Morningstar Rating metric is then compared against the retail mutual fund universe breakpoints to determine its hypothetical rating.
For each fund with at least a three-year history, Morningstar calculates a Morningstar RatingTM based on a Morningstar Risk-Adjusted Return measure that accounts for variation in a fund's monthly performance (including the effects of sales charges/loads, and redemption fees), placing more emphasis on downward variations and rewarding consistent performance. The top 10% of funds in each category receive 5 stars, the next 22.5% receive 4 stars, the next 35% receive 3 stars, the next 22.5% receive 2 stars and the bottom 10% receive 1 star. (Each share class is counted as a fraction of one fund within this scale and rated separately, which may cause slight variations in the distribution percentages.)
The Morningstar RatingTM is for Class Z shares only; other classes may have different performance characteristics and may have different ratings. ©2012 Morningstar, Inc. All Rights Reserved. The Morningstar information contained herein: (1) is proprietary to Morningstar and/or its content providers; (2) may not be copied or distributed; and (3) is not warranted to be accurate, complete or timely. Neither Morningstar nor its content providers are responsible for any damages or losses arising from any use of this information.
Investors should consider the investment objectives, risks, charges and expenses of a mutual fund carefully before investing. For a free prospectus, which contains this and other important information about the funds, visit columbiamanagement.com. The prospectus should be read carefully before investing.
Columbia Funds are distributed by Columbia Management Investment Distributors, Inc., member FINRA, and managed by Columbia Management Investment Advisers, LLC.
© 2012 Columbia Management Investment Advisers, LLC. All rights reserved.
Fund Profile – Columbia Multi-Advisor International Equity Fund
Summary
g For the 12-month period that ended February 29, 2012, the fund's Class A shares returned –6.26% without sales charge.
g The fund outperformed its benchmark, the MSCI EAFE Index (Net)1, which returned –7.45%.
g In a difficult year for international investing, the fund held up better than its benchmark by taking advantage of a robust rally in emerging and Asia/Pacific markets in the closing months of the period. Emerging markets are not included in the index.
Portfolio Management
Columbia Management Investment Advisers, LLC (Columbia) is the investment manager of the fund. Columbia retains Threadneedle International Limited (Threadneedle) and Marsico Capital Management LLC (Marsico) to serve as investment subadvisers to the fund. As investment subadvisers, Threadneedle and Marsico make investment decisions and manage a portion of the fund's assets independently of each other and the adviser. Threadneedle manages approximately one-half of the fund's assets. Dan Ison has managed Threadneedle's portion of the fund since April 2011. Marsico manages approximately one quarter of the fund. James G. Gendelman has managed or co-managed Marsico's portion of the fund since 2000. Munish Malhotra has co-managed Marsico's portion of the fund since 2010. Columbia manages approximately one quarter of the fund. Fred Copper has co-managed Columbia's portion of the fund since July 2009. Colin Moore has co-managed Columbia's portion of the fund since July 2009.
1The MSCI Europe, Australasia, Far East (MSCI EAFE) Index (Net) is a free float-adjusted market capitalization index that is designed to measure the equity market performance of developed markets in 22 developed-market countries, excluding the U.S. and Canada.
Indices are not available for investment, are not professionally managed and do not reflect sales charges, fees, brokerage commissions, taxes or other expenses of investing. Securities in the fund may not match those in an index.
Performance data quoted represents past performance and current performance may be lower or higher. Past performance is no guarantee of future results. The investment return and principal value will fluctuate so that shares, when redeemed, may be worth more or less than the original cost. Please visit www.columbiamanagement.com for daily and most recent month-end performance updates.
Summary
1-year return as of 02/29/12
| | | | –6.26% | |
|
|  | | | Class A shares
(without sales charge) | |
|
| | | | –7.45% | |
|
|  | | | MSCI EAFE Index (Net) | |
|
Morningstar Style BoxTM

The Morningstar Style BoxTM is based on the fund's portfolio holdings. For equity funds, the vertical axis shows the market capitalization of the stocks owned, and the horizontal axis shows investment style (value, blend, or growth). Information shown is based on the most recent data provided by Morningstar.
© 2012 Morningstar, Inc. All rights reserved. The Morningstar information contained herein: (1) is proprietary to Morningstar and/or its content providers; (2) may not be copied or distributed; and (3) is not warranted to be accurate, complete or timely. Neither Morningstar nor its content providers are responsible for any damages or losses arising from any use of this information.
1
Performance Information – Columbia Multi-Advisor International Equity Fund
Performance data quoted represents past performance and current performance may be lower or higher. Past performance is no guarantee of future results. The investment return and principal value will fluctuate so that shares, when redeemed, may be worth more or less than the original cost. Please visit www.columbiamanagement.com for daily and most recent month-end performance updates.
Performance of a $10,000 investment 03/01/02 – 02/29/12
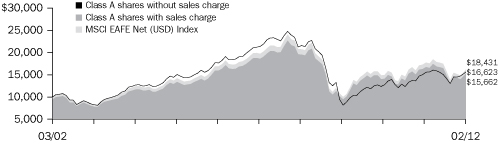
The chart above shows the change in value of a hypothetical $10,000 investment in Class A shares of Columbia Multi-Advisor International Equity Fund during the stated time period, and does not reflect the deduction of taxes that a shareholder may pay on fund distributions or on the redemption of fund shares.
Performance of a $10,000 investment 03/01/02 – 02/29/12 ($)
| Sales charge | | without | | with | |
| Class A | | | 16,623 | | | | 15,662 | | |
| Class B | | | 15,288 | | | | 15,288 | | |
| Class C | | | 15,532 | | | | 15,532 | | |
| Class I* | | | 16,950 | | | | n/a | | |
| Class R* | | | 16,063 | | | | n/a | | |
| Class R4* | | | 16,713 | | | | n/a | | |
| Class W* | | | 16,526 | | | | n/a | | |
| Class Y* | | | 16,922 | | | | n/a | | |
| Class Z | | | 16,893 | | | | n/a | | |
Average annual total return as of 02/29/12 (%)
| Share class | | A | | B | | C | | I* | | R* | | R4* | | W* | | Y* | | Z | |
| Inception | | 06/03/92 | | 06/07/93 | | 06/17/92 | | 09/27/10 | | 01/23/06 | | 03/07/11 | | 09/27/10 | | 03/07/11 | | 12/02/91 | |
| Sales charge | | without | | with | | without | | with | | without | | with | | without | | without | | without | | without | | without | | without | |
| 1-year | | | –6.26 | | | | –11.65 | | | | –6.97 | | | | –11.62 | | | | –6.96 | | | | –7.89 | | | | –5.78 | | | | –6.51 | | | | –6.10 | | | | –6.26 | | | | –5.86 | | | | –6.02 | | |
| 5-year | | | –3.36 | | | | –4.49 | | | | –4.08 | | | | –4.40 | | | | –4.07 | | | | –4.07 | | | | –3.04 | | | | –3.60 | | | | –3.20 | | | | –3.31 | | | | –3.07 | | | | –3.10 | | |
| 10-year | | | 5.21 | | | | 4.59 | | | | 4.34 | | | | 4.34 | | | | 4.50 | | | | 4.50 | | | | 5.42 | | | | 4.85 | | | | 5.27 | | | | 5.15 | | | | 5.40 | | | | 5.38 | | |
The "with sales charge" returns include the maximum initial sales charge of 5.75% for Class A shares and the applicable contingent deferred sales charge of 5.00% in the first year, declining to 1.00% in the sixth year and eliminated thereafter for Class B shares and 1.00% for Class C shares for the first year only. The "without sales charge" returns do not include the effect of sales charges. If they had, returns would have been lower.
Performance results reflect any fee waivers or reimbursements of fund expenses by Columbia Management Investment Advisers, LLC and/or any of its affiliates. Absent these fee waivers or expense reimbursement arrangements, performance results would have been lower.
All results shown assume reinvestment of distributions. Class I shares, Class R4 shares, Class Y shares and Class Z shares are sold at net asset value with no distribution and service (12b-1) fees. Class R shares are sold at net asset value with a distribution (12b-1) fee. Class W shares are sold at net asset value with a service (Rule 12b-1) fee. Class I shares, Class R shares, Class R4 shares, Class W shares, Class Y shares and Class Z shares have limited eligibility and the investment minimum requirements may vary. Please see the fund's prospectuses for details. Performance for different share classes will vary based on differences in sales charges and fees associated with each class.
The tables do not reflect the deduction of taxes that a shareholder may pay on fund distributions or on the redemption of fund shares.
*The returns shown for periods prior to the share class inception date (including returns since inception, which are since fund inception) include the returns of the fund's oldest share class. These returns are adjusted to reflect any higher class-related operating expenses of the newer share classes, as applicable. Please visit columbiamanagement.com/mutual-funds/appended-performance for more information.
2
Understanding Your Expenses – Columbia Multi-Advisor International Equity Fund
As an investor, you incur two types of costs. There are transaction costs, which generally include sales charges on purchases and may include redemption fees. There are also ongoing costs, which generally include management fees, distribution and service (Rule 12b-1) fees, and other fund expenses. The following information is intended to help you understand your ongoing costs (in dollars) of investing in the Fund and to help you compare these costs with the ongoing costs of investing in other mutual funds.
Analyzing your fund's expenses
To illustrate these ongoing costs, we have provided examples and calculated the expenses paid by investors in each share class of the Portfolio during the period. The actual and hypothetical information in the table is based on an initial investment of $1,000 at the beginning of the period indicated and held for the entire period. Expense information is calculated two ways and each method provides you with different information. The amount listed in the "Actual" column is calculated using the Fund's actual operating expenses and total return for the period. You may use the Actual information, together with the amount invested, to estimate the expenses that you paid over the period. Simply divide your account value by $1,000 (for example, an $8,600 account value divided by $1,000 = 8.6), then multiply the results by the expenses paid during the period under the Actual column. The amount listed in the "Hypothetical" column assumes a 5% annual rate of return before expenses (which is not the Portfolio's actual return) and then applies the Fund's actual expense ratio for the period to the hypothetical return. You should not use the hypothetical account values and expenses to estimate either your actual account balance at the end of the period or the expenses you paid during the period. See "Compare with other funds" below for details on how to use the hypothetical data.
In addition to the ongoing expenses which the Fund bears directly, the Fund's shareholders indirectly bear the Fund's allocable share of the costs and expenses of each underlying fund in which the Fund invests. You can also estimate the effective expenses paid during the period, which includes the indirect fees associated with investing in the underlying funds, by using the amounts listed in the effective expenses paid during the period column.
Compare with other funds
Since all mutual funds are required to include the same hypothetical calculations about expenses in shareholder reports, you can use this information to compare the ongoing cost of investing in the Fund with other funds. To do so, compare the hypothetical example with the 5% hypothetical examples that appear in the shareholder reports of other funds. As you compare hypothetical examples of other funds, it is important to note that hypothetical examples are meant to highlight the ongoing costs of investing in a fund only and do not reflect any transaction costs, such as sales charges, or redemption or exchange fees. Therefore, the hypothetical calculations are useful in comparing ongoing costs only, and will not help you determine the relative total costs of owning different funds. If transaction costs were included in these calculations, your costs would be higher.
September 1, 2011 – February 29, 2012
| | | Account value at the
beginning of the period ($) | | Account value at the
end of the period ($) | | Expenses paid
during the period ($) | | Fund's annualized
expense ratio (%) | |
| | | Actual | | Hypothetical | | Actual | | Hypothetical | | Actual | | Hypothetical | | Actual | |
| Class A | | | 1,000.00 | | | | 1,000.00 | | | | 1,061.80 | | | | 1,018.00 | | | | 7.07 | | | | 6.92 | | | | 1.38 | | |
| Class B | | | 1,000.00 | | | | 1,000.00 | | | | 1,058.20 | | | | 1,014.27 | | | | 10.90 | | | | 10.67 | | | | 2.13 | | |
| Class C | | | 1,000.00 | | | | 1,000.00 | | | | 1,057.90 | | | | 1,014.07 | | | | 11.10 | | | | 10.87 | | | | 2.17 | | |
| Class I | | | 1,000.00 | | | | 1,000.00 | | | | 1,064.50 | | | | 1,020.54 | | | | 4.47 | | | | 4.37 | | | | 0.87 | | |
| Class R | | | 1,000.00 | | | | 1,000.00 | | | | 1,060.10 | | | | 1,016.81 | | | | 8.30 | | | | 8.12 | | | | 1.62 | | |
| Class R4 | | | 1,000.00 | | | | 1,000.00 | | | | 1,062.80 | | | | 1,018.85 | | | | 6.21 | | | | 6.07 | | | | 1.21 | | |
| Class W | | | 1,000.00 | | | | 1,000.00 | | | | 1,061.80 | | | | 1,017.95 | | | | 7.13 | | | | 6.97 | | | | 1.39 | | |
| Class Y | | | 1,000.00 | | | | 1,000.00 | | | | 1,064.50 | | | | 1,020.29 | | | | 4.72 | | | | 4.62 | | | | 0.92 | | |
| Class Z | | | 1,000.00 | | | | 1,000.00 | | | | 1,062.70 | | | | 1,019.39 | | | | 5.64 | | | | 5.52 | | | | 1.10 | | |
Expenses paid during the period are equal to the annualized expense ratio for each class as indicated above, multiplied by the average account value over the period and then multiplied by the number of days in the Fund's most recent fiscal half year and divided by 366.
Expenses do not include fees and expenses incurred indirectly by the Fund from the underlying funds in which the Fund may invest (also referred to as "acquired funds"), including affiliated and non-affiliated pooled investments vehicles (including mutual funds and exchange traded funds).
Had Columbia Management Investment Advisers, LLC and/or any of its affiliates not waived/reimbursed a portion of fees and expenses, account value at the end of the period would have been reduced.
3
Portfolio Manager's Report – Columbia Multi-Advisor International Equity Fund
Performance data quoted represents past performance and current performance may be lower or higher. Past performance is no guarantee of future results. The investment return and principal value will fluctuate so that shares, when redeemed, may be worth more or less than the original cost. Please visit www.columbiamanagement.com for daily and most recent month-end performance updates.
Net asset value per share
as of 02/29/12 ($)
| Class A | | | 11.68 | | |
| Class B | | | 10.55 | | |
| Class C | | | 10.42 | | |
| Class I | | | 11.89 | | |
| Class R | | | 11.64 | | |
| Class R4 | | | 11.85 | | |
| Class W | | | 11.68 | | |
| Class Y | | | 11.89 | | |
| Class Z | | | 11.86 | | |
Top 10 holdings1
(at February 29, 2012) (%)
Nestlé SA, Registered Shares
(Switzerland) | | | 2.6 | | |
BG Group PLC
(United Kingdom) | | | 2.0 | | |
Anheuser-Busch InBev NV
(Belgium) | | | 1.8 | | |
Standard Chartered PLC
(United Kingdom) | | | 1.7 | | |
Samsung Electronics Co., Ltd.
(South Korea) | | | 1.6 | | |
Novo Nordisk A/S, Class B
(Denmark) | | | 1.5 | | |
Bayerische Motoren Werke AG
(Germany) | | | 1.3 | | |
GlaxoSmithKline PLC
(United Kingdom) | | | 1.2 | | |
| Diageo PLC (United Kingdom) | | | 1.1 | | |
Fresenius Medical Care
AG & Co., KGaA (Germany) | | | 1.1 | | |
1Percentages indicated are based upon total investments (excluding Investments of Cash Collateral Received for Securities on Loan and affiliated money market fund).
For further detail about these holdings, please refer to the section entitled "Portfolio of Investments."
Fund holdings are as of the date given, are subject to change at any time, and are not recommendations to buy or sell any securities.
For the 12-month period that ended February 29, 2012, the fund's Class A shares returned –6.26% without sales charge. The fund's benchmark, the MSCI EAFE Index (Net), returned –7.45%. Amid great volatility in the capital markets, the fund held up better than its EAFE benchmark as increased exposure to emerging market and Asia-Pacific opportunities proved successful when markets rallied late in the period. Emerging markets, and many of the Asia-Pacific stocks in the portfolios, are not included in the index.
Europe's debt crisis weighed on foreign stock markets
Stock markets that are highly exposed to the European sovereign debt crisis endured turmoil during the 12-month period. Tensions over European government debt eased somewhat in the final months of the period, following interventions by the European Central Bank, and overseas markets recovered somewhat, led by a robust surge in emerging markets. Despite this late recovery, many international equity benchmarks still produced negative returns for the 12 months.
Fund gained tactical flexibility with revised strategy
Less than three months into the period, the investment team implemented a revised strategy. The fund was divided into four thematic sub-portfolios, three of which centered on a geographic region—Europe, emerging markets and Asia-Pacific—and a fourth on international multi-cap stocks. Threadneedle manages the European portfolio. Columbia manages the emerging markets and Asia-Pacific portfolios. Marsico manages the international multi-cap portfolio, which has exposure to securities from all regions and companies of all sizes. The revised strategy also includes an active currency component managed by Columbia, which gives the fund the potential to invest in currency contracts to take advantage of changes in relative currency values. This increased flexibility to reposition investments tactically, especially in emerging and Asia-Pacific markets, helped the fund minimize losses as those markets rallied late in the period. The fund's currency exposure also helped support results.
Individual stocks also made a positive contribution to return, led by Samsung Electronics of South Korea in the information technology sector and Anheuser Busch/Inbev, the Belgium-based brewer (1.6% and 1.8% of net assets, respectively). Some of the fund's more defensive holdings, notably food products company Nestle and pharmaceutical companies Novartis and Roche (2.5%, 0.4% and 0.5% of net assets, respectively), held back results. All three are Switzerland-based global companies.
European Portfolio
In the Threadneedle-managed portion of the fund, investments in German automobile companies BMW and Volkswagen (1.3% and 0.6% of net assets, respectively) benefitted the fund's performance in Europe, which also was helped by exposure to the French aerospace industry. The de-emphasis of European commercial banks,
4
Portfolio Manager's Report (continued) – Columbia Multi-Advisor International Equity Fund
especially in Spain, was an effort to mitigate the effects of the European sovereign debt crisis. However, an overweight in Norway, notably in commercial banks, proved to be detrimental to results.
International Multi-Cap Portfolio
In the Marsico-managed portion of the fund, stock selection in industrials and technology companies aided performance. However, an overweight in technology partially offset the benefit of these gains as the sector was an underperformer for the period.
Stock selection in consumer discretionary and energy hurt performance. However, an underweight in financials, utilities and materials sectors aided results, as all three underperformed. Underweights in consumer staples and health care detracted from results, as both sectors were strong performers. Currency fluctuations were an additional source of underperformance for the portfolio during the period, primarily the result of an appreciating yen, which hurt Japanese yen-denominated holdings that were partially hedged into U.S. dollars.
Asia-Pacific Portfolio
An overweight in Thailand supported results in the Asia-Pacific portfolio, managed by Columbia. A position in Total Access, a Thai wireless telecommunications provider (0.05% of net assets) delivered solid gains. Selections in South Korea also helped, notably in Samsung Electronics and in the chemical industry. However, a decision to underweight Japanese heavy equipment manufacturer Komatsu detracted from the fund's performance relative to the benchmark.
Emerging Markets Portfolio
Emphasis on Brazil, combined with a decision to de-emphasize Brazilian oil and natural gas giant Petrobras, had a positive impact in the emerging markets portfolio, managed by Columbia. An overweight in Thailand also helped, especially in financials selections. Stock-picking in the Russian metals and mining industry contributed to holding back results.
Currency component
The fund uses long and short positions in an attempt to take advantage of potential return opportunities in the highly liquid market for currencies of larger developed countries. During the period, currency made a positive contribution to return.
Looking ahead to a year of transition
We anticipate that 2012 will be a year of change. Global growth is not likely to benefit from government austerity programs in the United States and Europe or by the efforts by both financial corporations and individual households to reduce their indebtedness. On the positive side, we believe many corporations have shown signs of improved profitability and appear to be in improving financial condition. Analyzing the risks and
Country breakdown1
(at February 29, 2012) (%)
| Argentina | | | 0.5 | | |
| Australia | | | 2.8 | | |
| Belgium | | | 1.8 | | |
| Brazil | | | 2.4 | | |
| Canada | | | 0.9 | | |
| Chile | | | 0.2 | | |
| China | | | 5.8 | | |
| Denmark | | | 1.7 | | |
| Finland | | | 0.6 | | |
| France | | | 5.9 | | |
| Germany | | | 9.6 | | |
| Hong Kong | | | 2.0 | | |
| India | | | 1.4 | | |
| Indonesia | | | 1.1 | | |
| Ireland | | | 0.6 | | |
| Israel | | | 0.2 | | |
| Italy | | | 0.5 | | |
| Japan | | | 10.8 | | |
| Malaysia | | | 0.4 | | |
| Malta | | | 0.0 | * | |
| Mexico | | | 0.4 | | |
| Netherlands | | | 3.7 | | |
| Norway | | | 0.4 | | |
| Panama | | | 0.0 | * | |
| Philippine Islands | | | 0.6 | | |
| Poland | | | 0.1 | | |
| Portugal | | | 0.5 | | |
| Russian Federation | | | 0.7 | | |
| Singapore | | | 0.5 | | |
| South Africa | | | 0.5 | | |
| South Korea | | | 4.0 | | |
| Spain | | | 2.0 | | |
| Sweden | | | 2.9 | | |
| Switzerland | | | 7.0 | | |
| Taiwan | | | 2.9 | | |
| Thailand | | | 1.4 | | |
| Turkey | | | 0.1 | | |
| United Kingdom | | | 20.1 | | |
| United States | | | 2.1 | | |
| Other2 | | | 0.9 | | |
*Rounds to less than 0.1%.
1Percentages indicated are based upon total investments (excluding Investments of Cash Collateral Received for Securities on Loan). The Fund's portfolio composition is subject to change.
2Includes investments in affiliated money market fund.
5
Portfolio Manager's Report (continued) – Columbia Multi-Advisor International Equity Fund
rewards, we believe there are likely to be more opportunities in Asia and in the emerging markets than in Europe, but it is difficult to be overly optimistic about the global outlook.
Sources for all statistical data—Columbia Management Investment Advisers, LLC.
Source for all stock-specific commentary—Threadneedle International Limited, Marsico Capital Management, LLC and Columbia Management Investment Advisers, LLC.
Portfolio characteristics and holdings are subject to change periodically and may not be representative of current characteristics and holdings. The outlook for the fund may differ from those presented for other Columbia Funds.
Equity securities are subject to stock market fluctuations that occur in response to economic and business developments, including investment values that may fall, sometimes rapidly or unpredictably, or fail to rise.
International investing may involve certain risks, including currency fluctuations, risks associated with possible differences in financial accounting standards and other monetary and political risks. Significant levels of foreign taxes, including potentially confiscatory levels of taxation and withholding taxes, may also apply to some foreign investments.
Investing in emerging markets may involve greater risks than investing in more developed countries. In addition, concentration of investments in a single region may result in greater volatility.
6
Portfolio of Investments – Columbia Multi-Advisor International Equity Fund
February 29, 2012
(Percentages represent value of investments compared to net assets)
| Issuer | | Shares | | Value | |
| Common Stocks 96.2% | |
| ARGENTINA 0.5% | |
| Arcos Dorados Holdings, Inc., Class A | | | 165,981 | | | $ | 3,488,921 | | |
| MercadoLibre, Inc. | | | 56,455 | | | | 5,493,636 | | |
| YPF SA, ADR | | | 21,727 | | | | 569,899 | | |
| Total | | | 9,552,456 | | |
| AUSTRALIA 2.8% | |
| Australia & New Zealand Banking Group Ltd. | | | 268,657 | | | | 6,284,638 | | |
| BHP Billiton Ltd.(a) | | | 233,271 | | | | 9,031,194 | | |
| BHP Billiton Ltd., ADR | | | 9,636 | | | | 740,237 | | |
| Challenger Ltd.(a) | | | 883,204 | | | | 3,894,321 | | |
| Commonwealth Bank of Australia(a) | | | 67,978 | | | | 3,589,965 | | |
| Iluka Resources Ltd.(a) | | | 192,085 | | | | 3,406,565 | | |
| Monadelphous Group Ltd.(a) | | | 145,681 | | | | 3,712,966 | | |
| National Australia Bank Ltd. | | | 231,670 | | | | 5,848,262 | | |
| Rio Tinto Ltd.(a) | | | 29,791 | | | | 2,140,220 | | |
| Telstra Corp., Ltd. | | | 1,805,820 | | | | 6,371,376 | | |
| Westpac Banking Corp. | | | 248,876 | | | | 5,552,098 | | |
| Total | | | 50,571,842 | | |
| BELGIUM 1.8% | |
| Anheuser-Busch InBev NV | | | 474,999 | | | | 31,907,839 | | |
| BRAZIL 2.1% | |
| Banco Bradesco SA, ADR | | | 161,746 | | | | 2,934,072 | | |
| BR Malls Participacoes SA | | | 557,800 | | | | 7,237,026 | | |
| Cia de Bebidas das Americas, ADR | | | 52,468 | | | | 2,099,245 | | |
| Cia Hering | | | 29,000 | | | | 778,512 | | |
| Fleury SA | | | 44,300 | | | | 624,289 | | |
| Itaú Unibanco Holding SA, ADR | | | 224,057 | | | | 4,716,400 | | |
| Localiza Rent a Car SA | | | 37,300 | | | | 692,893 | | |
| Mills Estruturas e Servicos de Engenharia SA | | | 77,500 | | | | 1,028,971 | | |
| Multiplus SA | | | 30,500 | | | | 613,463 | | |
| Odontoprev SA | | | 42,800 | | | | 739,482 | | |
| OGX Petroleo e Gas Participacoes SA(b) | | | 1,000,900 | | | | 9,925,944 | | |
| Raia Drogasil SA | | | 91,100 | | | | 875,324 | | |
| Telefonica Brasil SA, ADR | | | 42,081 | | | | 1,238,444 | | |
| Vale SA | | | 136,800 | | | | 3,482,037 | | |
| Total | | | 36,986,102 | | |
| CANADA 0.9% | |
| Canadian National Railway Co. | | | 118,631 | | | | 9,133,401 | | |
| IMAX Corp.(a)(b) | | | 87,739 | | | | 2,239,099 | | |
| Neo Material Technologies, Inc.(b) | | | 104,800 | | | | 922,541 | | |
| Pacific Rubiales Energy Corp. | | | 142,599 | | | | 4,140,552 | | |
| Total | | | 16,435,593 | | |
| CHILE 0.2% | |
| Banco Santander Chile, ADR | | | 21,473 | | | | 1,739,528 | | |
| ENTEL Chile SA | | | 50,676 | | | | 1,014,766 | | |
| SACI Falabella | | | 140,036 | | | | 1,394,436 | | |
| Total | | | 4,148,730 | | |
| CHINA 5.8% | |
| AAC Technologies Holdings, Inc. | | | 273,046 | | | | 697,918 | | |
| AutoNavi Holdings Ltd., ADR(a)(b) | | | 33,237 | | | | 398,844 | | |
| Baidu, Inc., ADR(b) | | | 69,227 | | | | 9,463,331 | | |
| Bank of China Ltd., Class H | | | 9,764,000 | | | | 4,235,553 | | |
| Belle International Holdings Ltd. | | | 3,876,000 | | | | 6,372,187 | | |
| China Coal Energy Co., Ltd., Class H | | | 1,123,000 | | | | 1,432,772 | | |
China Communications Construction Co., Ltd.,
Class H | | | 6,455,000 | | | | 6,585,715 | | |
| Issuer | | Shares | | Value | |
| Common Stocks (continued) | |
| CHINA (cont.) | |
| China Construction Bank Corp., Class H | | | 2,297,000 | | | $ | 1,919,922 | | |
China High Precision Automation
Group Ltd.(a)(c)(d) | | | 593,000 | | | | 136,166 | | |
China Merchants Holdings International
Co., Ltd. | | | 292,000 | | | | 1,006,026 | | |
| China Milk Products Group Ltd.(b)(c)(d) | | | 7,426,000 | | | | 237,509 | | |
| China Mobile Ltd., ADR(a) | | | 114,508 | | | | 6,070,069 | | |
China National Building Material Co., Ltd.,
Class H(a) | | | 492,000 | | | | 705,763 | | |
| China Shenhua Energy Co., Ltd., Class H | | | 1,036,500 | | | | 4,762,397 | | |
| China Unicom Hong Kong Ltd.(a) | | | 5,386,000 | | | | 9,627,139 | | |
| China Vanke Co., Ltd., Class B | | | 3,315,670 | | | | 4,274,728 | | |
| CITIC Securities Co. Ltd., Class H(a)(b) | | | 591,500 | | | | 1,310,174 | | |
| CNOOC Ltd. | | | 5,169,089 | | | | 11,736,977 | | |
| ENN Energy Holdings Ltd. | | | 284,000 | | | | 974,687 | | |
| Guangdong Investment Ltd.(a) | | | 6,982,000 | | | | 4,580,630 | | |
Industrial & Commercial Bank of China,
Class H | | | 17,122,000 | | | | 12,493,325 | | |
| NetQin Mobile, Inc., ADR(a)(b) | | | 64,561 | | | | 473,878 | | |
New Oriental Education & Technology
Group, ADR(b) | | | 30,612 | | | | 811,524 | | |
| PetroChina Co., Ltd., Class H | | | 4,374,000 | | | | 6,581,215 | | |
Sany Heavy Equipment International Holdings
Co., Ltd. | | | 666,000 | | | | 584,464 | | |
| SINA Corp.(b) | | | 21,523 | | | | 1,464,855 | | |
| Spreadtrum Communications, Inc., ADR(a) | | | 193,349 | | | | 2,683,684 | | |
| Yanzhou Coal Mining Co., Ltd., Class H(a) | | | 434,000 | | | | 1,073,547 | | |
| Zijin Mining Group Co., Ltd., Class H(a) | | | 2,204,000 | | | | 1,051,402 | | |
| Total | | | 103,746,401 | | |
| DENMARK 1.7% | |
| Novo Nordisk A/S, Class B | | | 186,592 | | | | 26,164,476 | | |
| Novozymes A/S, Class B(a) | | | 126,780 | | | | 3,771,321 | | |
| Total | | | 29,935,797 | | |
| FINLAND 0.6% | |
| KONE OYJ, Class B(a) | | | 171,928 | | | | 10,213,767 | | |
| FRANCE 5.9% | |
| Air Liquide SA | | | 96,173 | | | | 12,496,640 | | |
| BNP Paribas SA | | | 302,539 | | | | 14,766,563 | | |
| Cap Gemini SA | | | 141,447 | | | | 4,677,652 | | |
| Edenred | | | 469,144 | | | | 12,519,557 | | |
| Eutelsat Communications SA | | | 253,519 | | | | 9,453,993 | | |
| Pernod-Ricard SA | | | 36,831 | | | | 3,810,770 | | |
| Publicis Groupe SA | | | 334,868 | | | | 18,320,922 | | |
| Safran SA | | | 213,272 | | | | 7,147,596 | | |
| Schneider Electric SA | | | 276,871 | | | | 18,816,318 | | |
| Unibail-Rodamco SE | | | 18,857 | | | | 3,642,860 | | |
| Total | | | 105,652,871 | | |
| GERMANY 8.0% | |
| Adidas AG | | | 69,880 | | | | 5,491,102 | | |
| Allianz SE, Registered Shares | | | 157,352 | | | | 19,083,528 | | |
| BASF SE | | | 208,002 | | | | 18,262,271 | | |
| Bayerische Motoren Werke AG | | | 245,211 | | | | 22,682,398 | | |
| Brenntag AG | | | 70,418 | | | | 8,209,063 | | |
| Deutsche Bank AG, Registered Shares | | | 180,597 | | | | 8,434,559 | | |
| Fresenius Medical Care AG & Co. KGaA | | | 273,984 | | | | 19,193,211 | | |
| Infineon Technologies AG(b) | | | 377,274 | | | | 3,815,555 | | |
| Kabel Deutschland Holding AG(b) | | | 221,582 | | | | 13,305,276 | | |
The Accompanying Notes to Financial Statements are an integral part of this statement.
7
Columbia Multi-Advisor International Equity Fund
February 29, 2012
(Percentages represent value of investments compared to net assets)
| Issuer | | Shares | | Value | |
| Common Stocks (continued) | |
| GERMANY (cont.) | |
| Linde AG | | | 58,179 | | | $ | 9,673,479 | | |
| SAP AG | | | 232,186 | | | | 15,668,136 | | |
| Total | | | 143,818,578 | | |
| HONG KONG 2.0% | |
| Cheung Kong Holdings Ltd. | | | 403,000 | | | | 5,872,188 | | |
| First Pacific Co., Ltd. | | | 3,745,969 | | | | 4,192,642 | | |
| Foxconn International Holdings Ltd.(b) | | | 601,000 | | | | 420,574 | | |
| Hang Lung Properties Ltd.(a) | | | 1,720,000 | | | | 6,482,928 | | |
| Hongkong Land Holdings Ltd. | | | 559,000 | | | | 3,079,786 | | |
| Jardine Matheson Holdings Ltd. | | | 54,400 | | | | 2,768,817 | | |
| Li & Fung Ltd. | | | 1,624,000 | | | | 3,703,279 | | |
| Swire Pacific Ltd., Class A | | | 356,300 | | | | 4,043,261 | | |
| Swire Properties Ltd.(b) | | | 249,410 | | | | 614,184 | | |
| Trinity Ltd. | | | 5,076,000 | | | | 3,991,189 | | |
| Total | | | 35,168,848 | | |
| INDIA 1.4% | |
| Ashok Leyland Ltd. | | | 2,190,873 | | | | 1,262,617 | | |
| Asian Paints Ltd. | | | 16,355 | | | | 1,057,698 | | |
| Bank of Baroda | | | 222,244 | | | | 3,634,978 | | |
| Cairn India Ltd.(b) | | | 105,792 | | | | 795,095 | | |
| Cummins India Ltd. | | | 57,445 | | | | 544,487 | | |
| HDFC Bank Ltd., ADR | | | 132,465 | | | | 4,550,173 | | |
| ICICI Bank Ltd., ADR | | | 116,949 | | | | 4,245,249 | | |
| ITC Ltd. | | | 171,442 | | | | 725,019 | | |
| Larsen & Toubro Ltd. | | | 19,425 | | | | 516,969 | | |
| Oil & Natural Gas Corp., Ltd. | | | 724,941 | | | | 4,329,184 | | |
| Sobha Developers Ltd. | | | 64,686 | | | | 373,596 | | |
| Titan Industries Ltd. | | | 744,099 | | | | 3,458,501 | | |
| Total | | | 25,493,566 | | |
| INDONESIA 1.1% | |
| PT Ace Hardware Indonesia Tbk | | | 2,164,000 | | | | 1,036,122 | | |
| PT AKR Corporindo Tbk | | | 2,569,500 | | | | 1,023,099 | | |
| PT Astra International Tbk | | | 101,500 | | | | 794,663 | | |
| PT Bank Rakyat Indonesia Persero Tbk | | | 4,765,500 | | | | 3,632,457 | | |
| PT Bank Tabungan Pensiunan Nasional Tbk(b) | | | 1,383,000 | | | | 512,347 | | |
| PT Gudang Garam Tbk | | | 177,000 | | | | 1,109,857 | | |
| PT Indo Tambangraya Megah Tbk | | | 226,000 | | | | 1,082,480 | | |
| PT Indocement Tunggal Prakarsa Tbk | | | 1,617,500 | | | | 3,119,744 | | |
| PT Media Nusantara Citra Tbk | | | 6,682,500 | | | | 1,235,499 | | |
| PT Nippon Indosari Corpindo Tbk | | | 1,342,500 | | | | 533,610 | | |
| PT Perusahaan Gas Negara Tbk | | | 13,641,500 | | | | 5,647,494 | | |
| PT Sumber Alfaria Trijaya Tbk(b) | | | 1,728,500 | | | | 785,297 | | |
| Total | | | 20,512,669 | | |
| IRELAND 0.6% | |
| Accenture PLC, Class A | | | 122,666 | | | | 7,303,533 | | |
| CRH PLC | | | 197,791 | | | | 4,241,694 | | |
| Total | | | 11,545,227 | | |
| ISRAEL 0.2% | |
| Check Point Software Technologies Ltd.(a)(b) | | | 62,539 | | | | 3,637,268 | | |
| ITALY 0.5% | |
| Saipem SpA | | | 177,534 | | | | 8,980,985 | | |
| JAPAN 10.7% | |
| Aeon Co., Ltd.(a) | | | 110,800 | | | | 1,409,694 | | |
| Aeon Delight Co., Ltd.(a) | | | 169,000 | | | | 3,187,280 | | |
| Aisin Seiki Co., Ltd. | | | 126,600 | | | | 4,497,705 | | |
| Arnest One Corp. | | | 385,800 | | | | 4,572,816 | | |
| Issuer | | Shares | | Value | |
| Common Stocks (continued) | |
| JAPAN (cont.) | |
| Asahi Glass Co., Ltd. | | | 304,000 | | | $ | 2,744,522 | | |
| Autobacs Seven Co., Ltd. | | | 95,200 | | | | 4,561,007 | | |
| Canon, Inc. | | | 287,000 | | | | 13,088,130 | | |
| Daiichikosho Co., Ltd. | | | 166,100 | | | | 3,343,657 | | |
| Exedy Corp. | | | 79,700 | | | | 2,382,292 | | |
| FANUC Corp. | | | 76,000 | | | | 13,815,686 | | |
| Fuji Heavy Industries Ltd.(a) | | | 425,000 | | | | 3,249,540 | | |
| Fuji Machine Manufacturing Co., Ltd.(a) | | | 186,000 | | | | 3,876,396 | | |
| Fuyo General Lease Co., Ltd. | | | 123,700 | | | | 4,433,944 | | |
| Hitachi Ltd. | | | 1,320,907 | | | | 7,750,270 | | |
| Honda Motor Co., Ltd. | | | 325,900 | | | | 12,517,100 | | |
| Hoya Corp. | | | 160,000 | | | | 3,735,774 | | |
| Inpex Corp. | | | 144 | | | | 1,021,757 | | |
| ITOCHU Corp. | | | 662,800 | | | | 7,544,004 | | |
| Japan Tobacco, Inc. | | | 470 | | | | 2,496,864 | | |
| JX Holdings, Inc. | | | 525,000 | | | | 3,298,620 | | |
| K's Holdings Corp.(a) | | | 65,300 | | | | 2,180,780 | | |
| Kansai Paint Co., Ltd.(a) | | | 355,000 | | | | 3,363,243 | | |
| Kinki Sharyo Co. Ltd.(a) | | | 385,000 | | | | 1,442,899 | | |
| Lawson, Inc.(a) | | | 38,500 | | | | 2,266,073 | | |
| Mandom Corp. | | | 100,600 | | | | 2,478,260 | | |
| Marubeni Corp. | | | 520,000 | | | | 3,718,138 | | |
| Mitsubishi UFJ Financial Group, Inc. | | | 1,796,100 | | | | 9,282,452 | | |
| Mitsui & Co., Ltd. | | | 327,800 | | | | 5,650,106 | | |
| Nissan Motor Co., Ltd. | | | 585,500 | | | | 6,039,710 | | |
| Nitto Denko Corp. | | | 79,700 | | | | 3,303,827 | | |
| NTT DoCoMo, Inc. | | | 3,551 | | | | 6,057,049 | | |
| ORIX Corp. | | | 60,310 | | | | 5,812,352 | | |
| Rakuten, Inc. | | | 5,426 | | | | 5,392,983 | | |
| Santen Pharmaceutical Co., Ltd. | | | 57,700 | | | | 2,289,637 | | |
| Shinko Plantech Co., Ltd. | | | 439,900 | | | | 3,873,508 | | |
| SoftBank Corp. | | | 104,100 | | | | 3,105,401 | | |
| Sumitomo Mitsui Financial Group, Inc. | | | 233,500 | | | | 7,925,145 | | |
| Sumitomo Realty & Development Co., Ltd. | | | 164,000 | | | | 3,843,915 | | |
| THK Co., Ltd. | | | 114,200 | | | | 2,419,511 | | |
| Toshiba Machine Co., Ltd.(a) | | | 265,000 | | | | 1,393,772 | | |
| Toyota Motor Corp. | | | 158,700 | | | | 6,597,088 | | |
| Ubic, Inc. | | | 4,080 | | | | 934,915 | | |
| Total | | | 192,897,822 | | |
| MALAYSIA 0.4% | |
| AMMB Holdings Bhd | | | 361,800 | | | | 738,829 | | |
| Genting Bhd | | | 1,100,400 | | | | 3,887,809 | | |
| Hartalega Holdings Bhd | | | 917,700 | | | | 2,555,068 | | |
| RHB Capital Bhd | | | 268,100 | | | | 710,059 | | |
| Total | | | 7,891,765 | | |
| MALTA —% | |
| BGP Holdings PLC(b)(c)(d) | | | 2,232,232 | | | | 3 | | |
| MEXICO 0.4% | |
| Alfa SAB de CV, Class A | | | 95,700 | | | | 1,281,470 | | |
Fomento Economico Mexicano SAB
de CV, ADR(a) | | | 16,077 | | | | 1,183,267 | | |
| Grupo Mexico SAB de CV, Class B | | | 452,736 | | | | 1,426,126 | | |
| Wal-Mart de Mexico SAB de CV, Class V | | | 1,176,700 | | | | 3,662,641 | | |
| Total | | | 7,553,504 | | |
The Accompanying Notes to Financial Statements are an integral part of this statement.
8
Columbia Multi-Advisor International Equity Fund
February 29, 2012
(Percentages represent value of investments compared to net assets)
| Issuer | | Shares | | Value | |
| Common Stocks (continued) | |
| NETHERLANDS 3.6% | |
| ASML Holding NV | | | 333,934 | | | $ | 15,349,053 | | |
| European Aeronautic Defence and Space Co. NV | | | 288,009 | | | | 10,461,969 | | |
| ING Groep NV-CVA(b) | | | 1,931,206 | | | | 17,130,666 | | |
| Koninklijke DSM NV | | | 153,608 | | | | 8,544,215 | | |
| LyondellBasell Industries NV, Class A | | | 105,544 | | | | 4,557,390 | | |
| Sensata Technologies Holding NV(b) | | | 221,413 | | | | 7,173,781 | | |
| Yandex NV, Class A(b) | | | 117,699 | | | | 2,506,989 | | |
| Total | | | 65,724,063 | | |
| NORWAY 0.4% | |
| Subsea 7 SA(b) | | | 284,989 | | | | 6,847,608 | | |
| PANAMA —% | |
| Copa Holdings SA, Class A | | | 10,847 | | | | 776,320 | | |
| PHILIPPINES 0.6% | |
| Aboitiz Power Corp. | | | 3,961,100 | | | | 2,962,351 | | |
| Metropolitan Bank & Trust | | | 1,858,640 | | | | 3,515,027 | | |
| Puregold Price Club, Inc.(b) | | | 4,685,700 | | | | 2,339,836 | | |
| SM Investments Corp. | | | 61,910 | | | | 923,114 | | |
| Universal Robina Corp. | | | 1,199,200 | | | | 1,485,349 | | |
| Total | | | 11,225,677 | | |
| POLAND 0.1% | |
| Eurocash SA | | | 103,158 | | | | 1,065,160 | | |
| PORTUGAL 0.5% | |
| Galp Energia SGPS SA | | | 499,383 | | | | 8,709,140 | | |
| RUSSIAN FEDERATION 0.7% | |
| Eurasia Drilling Co., Ltd., GDR(e) | | | 31,332 | | | | 922,728 | | |
| Gazprom OAO, ADR | | | 224,509 | | | | 2,974,744 | | |
| Globaltrans Investment PLC, GDR(e) | | | 68,001 | | | | 1,187,978 | | |
| Lukoil OAO, ADR | | | 40,412 | | | | 2,578,286 | | |
| Magnit OJSC, GDR(e) | | | 27,325 | | | | 805,268 | | |
| NovaTek OAO, GDR(e) | | | 15,419 | | | | 2,237,297 | | |
| Novolipetsk Steel OJSC, GDR(e) | | | 24,425 | | | | 585,467 | | |
| Pharmstandard OJSC, GDR(a)(b)(e) | | | 30,585 | | | | 563,987 | | |
| Total | | | 11,855,755 | | |
| SINGAPORE 0.4% | |
| Amtek Engineering Ltd. | | | 2,101,000 | | | | 1,217,189 | | |
| DBS Group Holdings Ltd. | | | 166,000 | | | | 1,876,905 | | |
| Fraser and Neave Ltd. | | | 367,000 | | | | 1,958,183 | | |
| Sakari Resources Ltd. | | | 195,000 | | | | 411,486 | | |
| SembCorp Industries Ltd. | | | 313,000 | | | | 1,317,508 | | |
| Wing Tai Holdings Ltd. | | | 1,186,000 | | | | 1,207,638 | | |
| Total | | | 7,988,909 | | |
| SOUTH AFRICA 0.5% | |
| AVI Ltd. | | | 279,625 | | | | 1,623,843 | | |
| Barloworld Ltd. | | | 93,234 | | | | 1,105,300 | | |
| Clicks Group Ltd. | | | 141,554 | | | | 820,632 | | |
| Gold Fields Ltd., ADR | | | 63,580 | | | | 977,225 | | |
| Life Healthcare Group Holdings Ltd. | | | 296,763 | | | | 857,232 | | |
| Mr. Price Group Ltd. | | | 99,387 | | | | 1,176,744 | | |
| MTN Group Ltd. | | | 122,409 | | | | 2,198,218 | | |
| Sasol Ltd. | | | 11,892 | | | | 631,891 | | |
| Total | | | 9,391,085 | | |
| SOUTH KOREA 4.0% | |
| Capro Corp. | | | 152,170 | | | | 3,621,001 | | |
| Cheil Industries, Inc. | | | 12,272 | | | | 1,045,616 | | |
| Dongbu Insurance Co., Ltd. | | | 65,957 | | | | 2,871,730 | | |
| Issuer | | Shares | | Value | |
| Common Stocks (continued) | |
| SOUTH KOREA (cont.) | |
| Hankook Tire Co., Ltd. | | | 16,610 | | | $ | 634,785 | | |
| Huchems Fine Chemical Corp. | | | 54,440 | | | | 1,111,915 | | |
| Hynix Semiconductor, Inc.(b) | | | 43,760 | | | | 1,174,420 | | |
| Hyundai Home Shopping Network Corp. | | | 18,892 | | | | 2,445,158 | | |
| Hyundai Mobis | | | 17,111 | | | | 4,356,559 | | |
| Hyundai Motor Co. | | | 45,141 | | | | 8,694,875 | | |
| Iljin Display Co., Ltd. | | | 48,350 | | | | 587,174 | | |
| JNK Heaters Co., Ltd. | | | 106,739 | | | | 1,788,454 | | |
| KP Chemical Corp.(b) | | | 176,740 | | | | 2,627,738 | | |
| LG Chem Ltd. | | | 6,965 | | | | 2,474,119 | | |
| LG Corp. | | | 12,153 | | | | 756,840 | | |
| LG Household & Health Care Ltd. | | | 1,937 | | | | 890,599 | | |
| LS Corp. | | | 13,972 | | | | 1,074,396 | | |
| NCSoft Corp. | | | 2,209 | | | | 546,234 | | |
| Neowiz Games Corp.(b) | | | 25,414 | | | | 895,397 | | |
| Samsung Electronics Co., Ltd. | | | 26,217 | | | | 28,192,816 | | |
| Seegene, Inc.(b) | | | 7,543 | | | | 466,972 | | |
| SFA Engineering Corp. | | | 18,161 | | | | 989,549 | | |
| Shinhan Financial Group Co., Ltd. | | | 62,930 | | | | 2,427,949 | | |
| SK Innovation Co., Ltd. | | | 7,802 | | | | 1,287,521 | | |
| Youngone Corp. | | | 69,770 | | | | 1,513,271 | | |
| Total | | | 72,475,088 | | |
| SPAIN 2.0% | |
| Amadeus IT Holding SA, Class A | | | 472,084 | | | | 8,994,089 | | |
| Banco Bilbao Vizcaya Argentaria SA | | | 1,444,818 | | | | 12,952,856 | | |
| Inditex SA | | | 146,970 | | | | 13,571,456 | | |
| Total | | | 35,518,401 | | |
| SWEDEN 2.8% | |
| Atlas Copco AB, Class A(a) | | | 499,342 | | | | 13,025,394 | | |
| Elekta AB, Class B | | | 39,603 | | | | 1,855,418 | | |
| Millicom International Cellular SA, SDR | | | 82,488 | | | | 9,243,872 | | |
| Svenska Handelsbanken AB, Class A(a) | | | 305,753 | | | | 10,267,549 | | |
| Swedish Match AB | | | 206,788 | | | | 7,897,371 | | |
| Volvo AB B Shares | | | 603,374 | | | | 8,804,220 | | |
| Total | | | 51,093,824 | | |
| SWITZERLAND 7.0% | |
| Julius Baer Group Ltd.(b) | | | 229,479 | | | | 8,991,965 | | |
| Nestlé SA, Registered Shares | | | 743,331 | | | | 45,436,282 | | |
| Novartis AG, Registered Shares | | | 144,052 | | | | 7,848,263 | | |
| Roche Holding AG, Genusschein Shares | | | 52,322 | | | | 9,108,782 | | |
| SGS SA, Registered Shares(a) | | | 3,930 | | | | 7,363,049 | | |
| Swatch Group AG (The) | | | 16,012 | | | | 7,260,000 | | |
| Swatch Group AG (The), Registered Shares | | | 193,472 | | | | 15,375,966 | | |
| UBS AG, Registered Shares(b) | | | 581,807 | | | | 8,135,137 | | |
| Xstrata PLC | | | 853,854 | | | | 16,300,756 | | |
| Total | | | 125,820,200 | | |
| TAIWAN 2.9% | |
| AU Optronics Corp. | | | 1,510,000 | | | | 811,036 | | |
| Catcher Technology Co., Ltd. | | | 470,000 | | | | 3,419,311 | | |
| Chinatrust Financial Holding Co., Ltd. | | | 1,137,000 | | | | 768,720 | | |
| CTCI Corp. | | | 3,266,000 | | | | 5,283,556 | | |
| Epistar Corp. | | | 252,000 | | | | 656,440 | | |
| Far EasTone Telecommunications Co., Ltd. | | | 740,000 | | | | 1,549,876 | | |
| Formosa Chemicals & Fibre Corp. | | | 363,000 | | | | 1,132,446 | | |
| Fubon Financial Holding Co., Ltd. | | | 865,254 | | | | 1,012,500 | | |
| Giant Manufacturing Co., Ltd. | | | 179,000 | | | | 767,133 | | |
The Accompanying Notes to Financial Statements are an integral part of this statement.
9
Columbia Multi-Advisor International Equity Fund
February 29, 2012
(Percentages represent value of investments compared to net assets)
| Issuer | | Shares | | Value | |
| Common Stocks (continued) | |
| TAIWAN (cont.) | |
| Gigabyte Technology Co., Ltd. | | | 5,950,000 | | | $ | 5,069,974 | | |
| Hiwin Technologies Corp. | | | 30,000 | | | | 333,906 | | |
| Hon Hai Precision Industry Co., Ltd. | | | 1,357,000 | | | | 4,707,590 | | |
| Huaku Development Co., Ltd. | | | 1,686,737 | | | | 4,400,015 | | |
| MediaTek, Inc. | | | 112,000 | | | | 1,142,111 | | |
| Simplo Technology Co., Ltd. | | | 91,000 | | | | 651,362 | | |
| Taiwan Semiconductor Manufacturing Co., Ltd. | | | 844,049 | | | | 2,310,023 | | |
Taiwan Semiconductor Manufacturing Co.,
Ltd., ADR | | | 1,067,155 | | | | 15,495,091 | | |
| Tong Hsing Electronic Industries Ltd. | | | 181,000 | | | | 600,130 | | |
| TSRC Corp. | | | 348,500 | | | | 885,932 | | |
| United Microelectronics Corp. | | | 1,710,000 | | | | 900,265 | | |
| Total | | | 51,897,417 | | |
| THAILAND 1.4% | |
Bangkok Bank PCL, Foreign Registered
Shares(a) | | | 1,352,800 | | | | 8,067,954 | | |
| CP ALL PCL, Foreign Registered Shares | | | 492,500 | | | | 1,076,332 | | |
Home Product Center PCL, Foreign Registered
Shares(a) | | | 2,284,528 | | | | 926,503 | | |
| Kasikornbank PCL, Foreign Registered Shares | | | 605,000 | | | | 2,920,068 | | |
LPN Development PCL, Foreign Registered
Shares | | | 6,988,312 | | | | 3,382,084 | | |
| LPN Development PCL - NVDR | | | 164,400 | | | | 79,851 | | |
| PTT PCL, Foreign Registered Shares(a) | | | 595,300 | | | | 7,115,787 | | |
| Siam Cement PCL, NVDR | | | 122,000 | | | | 1,433,941 | | |
Total Access Communication PCL, Foreign
Registered Shares | | | 282,600 | | | | 645,753 | | |
| Total Access Communication PCL, NVDR | | | 73,300 | | | | 167,494 | | |
| Total | | | 25,815,767 | | |
| TURKEY 0.1% | |
| Tofas Turk Otomobil Fabrikasi AS | | | 289,023 | | | | 1,226,724 | | |
| Turkiye Garanti Bankasi AS | | | 371,016 | | | | 1,405,094 | | |
| Total | | | 2,631,818 | | |
| UNITED KINGDOM 20.0% | |
| Aggreko PLC | | | 296,882 | | | | 10,452,211 | | |
| ARM Holdings PLC | | | 1,277,933 | | | | 11,578,298 | | |
| Barclays PLC | | | 3,136,464 | | | | 12,225,012 | | |
| BG Group PLC | | | 1,460,096 | | | | 35,249,504 | | |
| British American Tobacco PLC | | | 242,724 | | | | 12,267,974 | | |
| British Sky Broadcasting Group PLC | | | 832,330 | | | | 8,871,831 | | |
| Burberry Group PLC | | | 260,880 | | | | 5,860,280 | | |
| Experian PLC | | | 1,247,769 | | | | 18,768,891 | | |
| Diageo PLC | | | 843,276 | | | | 20,170,472 | | |
| GlaxoSmithKline PLC | | | 995,256 | | | | 21,961,104 | | |
| Johnson Matthey PLC | | | 294,571 | | | | 10,816,050 | | |
| Legal & General Group PLC | | | 5,509,547 | | | | 10,588,287 | | |
| Persimmon PLC | | | 1,548,156 | | | | 16,637,305 | | |
| Prudential PLC | | | 817,029 | | | | 9,261,157 | | |
| Reed Elsevier PLC | | | 421,544 | | | | 3,691,842 | | |
| Rio Tinto PLC | | | 260,847 | | | | 14,872,937 | | |
| Rolls-Royce Holdings PLC(b) | | | 331,486 | | | | 4,292,719 | | |
| Shire PLC | | | 525,265 | | | | 18,367,458 | | |
| Smith & Nephew PLC | | | 838,856 | | | | 8,247,433 | | |
| Standard Chartered PLC | | | 1,143,101 | | | | 29,415,199 | | |
| Tullow Oil PLC | | | 772,909 | | | | 18,136,909 | | |
| Unilever PLC | | | 542,153 | | | | 17,517,603 | | |
| Issuer | | Shares | | Value | |
| Common Stocks (continued) | |
| UNITED KINGDOM (cont.) | |
| Vodafone Group PLC | | | 5,895,713 | | | $ | 15,884,167 | | |
| Weir Group PLC (The) | | | 516,218 | | | | 17,295,551 | | |
| Wolseley PLC | | | 229,163 | | | | 8,881,057 | | |
| Total | | | 361,311,251 | | |
| UNITED STATES 1.6% | |
| Citigroup, Inc. | | | 167,416 | | | | 5,578,301 | | |
| Freeport-McMoRan Copper & Gold, Inc. | | | 130,292 | | | | 5,545,227 | | |
| Las Vegas Sands Corp.(b) | | | 76,409 | | | | 4,249,104 | | |
| Newmont Mining Corp. | | | 66,607 | | | | 3,956,456 | | |
| Perrigo Co. | | | 18,167 | | | | 1,872,291 | | |
| Wynn Resorts Ltd.(a) | | | 57,303 | | | | 6,792,698 | | |
| Total | | | 27,994,077 | | |
Total Common Stocks
(Cost: $1,512,262,475) | | $ | 1,734,793,193 | | |
| Preferred Stocks 1.9% | |
| BRAZIL 0.3% | |
| Gerdau SA | | | 120,900 | | | $ | 1,257,402 | | |
| Petroleo Brasileiro SA | | | 305,300 | | | | 4,352,159 | | |
| Total | | | 5,609,561 | | |
| GERMANY 1.6% | |
| Henkel AG & Co. KGaA | | | 146,359 | | | | 9,525,458 | | |
| Hugo Boss AG | | | 73,427 | | | | 7,644,182 | | |
| Volkswagen AG | | | 59,799 | | | | 11,181,709 | | |
| Total | | | 28,351,349 | | |
Total Preferred Stocks
(Cost: $28,271,477) | | $ | 33,960,910 | | |
| Exchange-Traded Funds 0.5% | |
| iShares MSCI Emerging Markets Index Fund | | | 87,128 | | | $ | 3,860,642 | | |
| iShares MSCI Japan Index Fund(a) | | | 215,453 | | | | 2,152,375 | | |
| iShares MSCI Pacific ex-Japan Index Fund(a) | | | 76,938 | | | | 3,406,814 | | |
Total Exchange-Traded Funds
(Cost: $8,965,932) | | $ | 9,419,831 | | |
| Rights —% | |
| TAIWAN —% | |
| Chinatrust Financial Holding Co., Ltd.(b)(c) | | | 45,119 | | | $ | 5,679 | | |
Total Rights
(Cost: $—) | | $ | 5,679 | | |
| Money Market Funds 0.9% | |
| Columbia Short-Term Cash Fund, 0.166%(f)(g) | | | 16,462,496 | | | $ | 16,462,496 | | |
Total Money Market Funds
(Cost: $16,462,496) | | $ | 16,462,496 | | |
The Accompanying Notes to Financial Statements are an integral part of this statement.
10
Columbia Multi-Advisor International Equity Fund
February 29, 2012
(Percentages represent value of investments compared to net assets)
| Issuer | | Effective
Yield | | Par/
Principal/
Shares | | Value | |
| Investments of Cash Collateral Received for Securities on Loan 3.6% | |
| Asset-Backed Commercial Paper 0.1% | |
Rhein-Main Securitisation Ltd.
03/21/12 | | | 0.700 | % | | $ | 1,998,950 | | | $ | 1,998,950 | | |
| Certificates of Deposit 0.6% | |
Barclays Bank PLC
04/18/12 | | | 0.600 | % | | | 3,000,000 | | | | 3,000,000 | | |
Credit Suisse
03/20/12 | | | 0.590 | % | | | 4,000,000 | | | | 4,000,000 | | |
Standard Chartered Bank PLC
04/03/12 | | | 0.570 | % | | | 4,000,000 | | | | 4,000,000 | | |
| Total | | | 11,000,000 | | |
| Commercial Paper 0.1% | |
Svenska Handelsbank
03/15/12 | | | 0.501 | % | | | 1,997,500 | | | | 1,997,500 | | |
| Repurchase Agreements 2.8% | |
Citigroup Global Markets, Inc.(h)
dated 02/29/12, matures 03/01/12,
repurchase price $4,000,014 | | | 0.130 | % | | | 4,000,000 | | | | 4,000,000 | | |
| repurchase price $5,000,018 | | | 0.130 | % | | | 5,000,000 | | | | 5,000,000 | | |
Credit Suisse Securities (USA) LLC
dated 02/29/12, matures 03/01/12,
repurchase price $8,745,839(h) | | | 0.160 | % | | | 8,745,801 | | | | 8,745,801 | | |
| Issuer | | Effective
Yield | | Par/
Principal/
Shares | | Value | |
| Investments of Cash Collateral Received for Securities on Loan (continued) | |
| Repurchase Agreements (cont.) | |
Mizuho Securities USA, Inc.
dated 02/29/12, matures 03/01/12,
repurchase price $2,500,015(h) | | | 0.220 | % | | $ | 2,500,000 | | | $ | 2,500,000 | | |
Natixis Financial Products, Inc.
dated 02/29/12, matures 03/01/12,
repurchase price $15,000,092(h) | | | 0.220 | % | | | 15,000,000 | | | | 15,000,000 | | |
Pershing LLC
dated 02/29/12, matures 03/01/12,
repurchase price $5,000,040(h) | | | 0.290 | % | | | 5,000,000 | | | | 5,000,000 | | |
Royal Bank of Canada
dated 02/29/12, matures 03/01/12,
repurchase price $10,000,053(h) | | | 0.190 | % | | | 10,000,000 | | | | 10,000,000 | | |
| Total | | | 50,245,801 | | |
Total Investments of Cash Collateral Received for Securities
on Loan
(Cost: $65,242,251) | | $ | 65,242,251 | | |
Total Investments
(Cost: $1,631,204,631) | | | | | | | | $ | 1,859,884,360 | | |
| Other Assets & Liabilities, Net | | | | | | | | | (56,355,121 | ) | |
| Net Assets | | $ | 1,803,529,239 | | |
| Investments in Derivatives | |
At February 29, 2012, $264,000 was held in a margin deposit account as collateral to cover initial margin requirements on open futures contracts.
Futures Contracts Outstanding at February 29, 2012
| Contract Description | | Number of
Contracts
Long (Short) | | Notional
Market Value | | Expiration
Date | | Unrealized
Appreciation | | Unrealized
Depreciation | |
| E-Mini MSCI EAFE Index | | | 44 | | | | 3,433,540 | | | March 2012 | | $ | 85,621 | | | $ | — | | |
Forward Foreign Currency Exchange Contracts Open at February 29, 2012
| Counterparty | | Exchange Date | | Currency to be
Delivered | | Currency to be
Received | | Unrealized
Appreciation | | Unrealized
Depreciation | |
| Barclays Capital | | April 12, 2012
| | | 30,495,000
(BRL) | | | | 17,417,752
(USD) | | | $ | —
| | | $ | (165,815
| ) | |
| Barclays Capital | | April 12, 2012 | | | 15,744,000
(CAD) | | | | 15,729,607
(USD) | | | | —
| | | | (167,510
| ) | |
| Barclays Capital | | April 12, 2012
| | | 79,616,000
(DKK) | | | | 13,947,581
(USD) | | | | —
| | | | (323,198
| ) | |
| Barclays Capital | | April 12, 2012
| | | 95,664,785,000
(IDR) | | | | 10,470,043
(USD) | | | | —
| | | | (90,392
| ) | |
| Barclays Capital | | April 12, 2012
| | | 875,639,000
(INR) | | | | 17,415,255
(USD) | | | | —
| | | | (257,047
| ) | |
| Barclays Capital | | April 12, 2012
| | | 73,086,468,000
(KRW) | | | | 64,297,060
(USD) | | | | —
| | | | (828,684
| ) | |
| Barclays Capital | | April 12, 2012
| | | 26,640,000
(MYR) | | | | 8,690,263
(USD) | | | | —
| | | | (176,431
| ) | |
| Barclays Capital | | April 12, 2012
| | | 523,505,000
(PHP) | | | | 12,160,395
(USD) | | | | —
| | | | (45,412
| ) | |
| Barclays Capital | | April 12, 2012 | | | 647,740,000
(THB) | | | | 20,939,419
(USD) | | | | —
| | | | (401,533
| ) | |
| Barclays Capital | | April 12, 2012 | | | 1,394,520,000
(TWD) | | | | 47,128,084
(USD) | | | | —
| | | | (329,348
| ) | |
The Accompanying Notes to Financial Statements are an integral part of this statement.
11
Columbia Multi-Advisor International Equity Fund
February 29, 2012
Forward Foreign Currency Exchange Contracts Open at February 29, 2012 (cont.)
| Counterparty | | Exchange Date | | Currency to be
Delivered | | Currency to be
Received | | Unrealized
Appreciation | | Unrealized
Depreciation | |
| Barclays Capital | | April 12, 2012 | | | 87,471,581
(USD) | | | | 82,197,000
(AUD) | | | $ | 261,214
| | | $ | —
| | |
| Barclays Capital | | April 12, 2012
| | | 26,135,260
(USD) | | | | 24,230,000
(CHF) | | | | 659,272
| | | | —
| | |
| Barclays Capital | | April 12, 2012
| | | 52,300,490
(USD) | | | | 40,177,000
(EUR) | | | | 1,236,524
| | | | —
| | |
| Barclays Capital | | April 12, 2012
| | | 5,165,697
(USD) | | | | 3,294,000
(GBP) | | | | 73,165
| | | | —
| | |
| Barclays Capital | | April 12, 2012
| | | 182,578,760
(USD) | | | | 14,409,606,000
(JPY) | | | | —
| | | | (5,253,889
| ) | |
| Barclays Capital | | April 12, 2012
| | | 8,733,190
(USD) | | | | 50,778,000
(NOK) | | | | 335,358
| | | | —
| | |
| Barclays Capital | | April 12, 2012
| | | 6,969,884
(USD) | | | | 47,182,000
(SEK) | | | | 148,875
| | | | —
| | |
| Barclays Capital | | April 12, 2012
| | | 26,160,191
(USD) | | | | 33,112,000
(SGD) | | | | 316,376
| | | | —
| | |
| Barclays Capital | | April 13, 2012
| | | 120,887,000
(CHF) | | | | 134,227,912
(USD) | | | | 563,977
| | | | —
| | |
| HSBC Securities (USA), Inc. | | April 13, 2012
| | | 167,178,000
(EUR) | | | | 223,880,598
(USD) | | | | 1,122,727
| | | | —
| | |
| Citigroup Global Markets Inc. | | April 13, 2012
| | | 7,242,580,000
(JPY) | | | | 89,508,497
(USD) | | | | 390,165
| | | | —
| | |
| UBS Securities LLC | | April 13, 2012
| | | 223,220,003
(USD) | | | | 207,577,000
(AUD) | | | | —
| | | | (1,384,527
| ) | |
| Goldman, Sachs & Co. | | April 13, 2012
| | | 89,446,156
(USD) | | | | 497,987,000
(NOK) | | | | —
| | | | (468,108
| ) | |
| State Street Bank & Trust Company | | April 13, 2012
| | | 134,011,132
(USD) | | | | 882,667,000
(SEK) | | | | —
| | | | (778,176
| ) | |
| Total | | | | | | | | $ | 5,107,653 | | | $ | (10,670,070 | ) | |
Summary of Investments in Securities by Industry (Unaudited)
The following table represents the portfolio investments of the Fund by industry classifications as a percentage of net assets at February 29, 2012:
| Industry | | Percentage of
Net Assets | | Value | |
| Aerospace & Defense | | | 1.2 | % | | $ | 21,902,284 | | |
| Airlines | | | 0.0 | * | | | 776,320 | | |
| Auto Components | | | 0.7 | | | | 11,871,340 | | |
| Automobiles | | | 4.0 | | | | 72,983,807 | | |
| Beverages | | | 3.3 | | | | 59,171,593 | | |
| Biotechnology | | | 0.0 | * | | | 466,972 | | |
| Building Products | | | 0.2 | | | | 2,744,522 | | |
| Capital Markets | | | 1.5 | | | | 26,871,834 | | |
| Chemicals | | | 5.0 | | | | 89,667,442 | | |
| Commercial Banks | | | 10.2 | | | | 184,421,199 | | |
| Commercial Services & Supplies | | | 1.5 | | | | 26,772,512 | | |
| Communications Equipment | | | 0.0 | * | | | 697,918 | | |
| Computers & Peripherals | | | 0.5 | | | | 9,140,646 | | |
| Construction & Engineering | | | 0.9 | | | | 16,099,206 | | |
| Construction Materials | | | 0.5 | | | | 9,501,142 | | |
| Distributors | | | 0.2 | | | | 3,703,279 | | |
| Diversified Consumer Services | | | 0.0 | * | | | 811,524 | | |
| Diversified Financial Services | | | 2.9 | | | | 52,213,387 | | |
| Diversified Telecommunication Services | | | 1.0 | | | | 17,236,959 | | |
| Electrical Equipment | | | 1.5 | | | | 27,064,496 | | |
Electronic Equipment, Instruments &
Components | | | 1.1 | | | | 19,151,088 | | |
Summary of Investments in Securities by Industry (cont.)
| Industry | | Percentage of
Net Assets | | Value | |
| Energy Equipment & Services | | | 1.1 | % | | $ | 20,624,829 | | |
| Food & Staples Retailing | | | 0.8 | | | | 15,106,256 | | |
| Food Products | | | 3.7 | | | | 66,834,195 | | |
| Gas Utilities | | | 0.4 | | | | 6,622,181 | | |
| Health Care Equipment & Supplies | | | 0.7 | | | | 12,657,919 | | |
| Health Care Providers & Services | | | 1.2 | | | | 21,414,214 | | |
| Hotels, Restaurants & Leisure | | | 1.0 | | | | 18,418,531 | | |
| Household Durables | | | 1.2 | | | | 21,210,121 | | |
| Household Products | | | 0.6 | | | | 10,416,056 | | |
Independent Power Producers & Energy
Traders | | | 0.2 | | | | 2,962,351 | | |
| Industrial Conglomerates | | | 0.5 | | | | 9,005,932 | | |
| Insurance | | | 2.3 | | | | 41,804,702 | | |
| Internet & Catalog Retail | | | 0.4 | | | | 7,838,141 | | |
| Internet Software & Services | | | 1.0 | | | | 18,928,811 | | |
| IT Services | | | 1.2 | | | | 21,910,190 | | |
| Leisure Equipment & Products | | | 0.0 | * | | | 767,133 | | |
| Machinery | | | 4.3 | | | | 78,018,315 | | |
| Media | | | 3.4 | | | | 60,462,119 | | |
| Metals & Mining | | | 3.6 | | | | 64,773,253 | | |
| Multiline Retail | | | 0.1 | | | | 1,394,436 | | |
| Office Electronics | | | 0.7 | | | | 13,088,130 | | |
| Oil, Gas & Consumable Fuels | | | 7.5 | | | | 134,435,163 | | |
| Personal Products | | | 0.1 | | | | 2,478,260 | | |
| Pharmaceuticals | | | 4.9 | | | | 88,175,997 | | |
The Accompanying Notes to Financial Statements are an integral part of this statement.
12
Columbia Multi-Advisor International Equity Fund
February 29, 2012
Summary of Investments in Securities by Industry (cont.)
| Industry | | Percentage of
Net Assets | | Value | |
| Professional Services | | | 1.4 | % | | $ | 26,131,940 | | |
| Real Estate Investment Trusts (REITs) | | | 0.2 | | | | 3,642,863 | | |
| Real Estate Management & Development | | | 2.5 | | | | 44,891,199 | | |
| Road & Rail | | | 0.6 | | | | 11,014,271 | | |
| Semiconductors & Semiconductor Equipment | | | 4.7 | | | | 83,884,930 | | |
| Software | | | 1.2 | | | | 21,619,757 | | |
| Specialty Retail | | | 1.7 | | | | 30,603,311 | | |
| Textiles, Apparel & Luxury Goods | | | 2.8 | | | | 50,594,493 | | |
| Tobacco | | | 1.4 | | | | 24,497,085 | | |
Summary of Investments in Securities by Industry (cont.)
| Industry | | Percentage of
Net Assets | | Value | |
| Trading Companies & Distributors | | | 2.1 | % | | $ | 37,159,738 | | |
| Transportation Infrastructure | | | 0.1 | | | | 1,006,026 | | |
| Water Utilities | | | 0.3 | | | | 4,580,630 | | |
| Wireless Telecommunication Services | | | 2.5 | | | | 45,936,665 | | |
| Other(1) | | | 4.5 | | | | 81,704,747 | | |
| Total | | | | $ | 1,859,884,360 | | |
* Rounds to less than 0.1%.
(1) Includes affiliated money market fund.
| Notes to Portfolio of Investments | |
(a) At February 29, 2012, security was partially or fully on loan.
(b) Non-income producing.
(c) Identifies issues considered to be illiquid as to their marketability. The aggregate value of such securities at February 29, 2012 was $379,357, representing 0.02% of net assets. Information concerning such security holdings at February 29, 2012 was as follows:
| Security Description | | Acquisition
Dates | | Cost | |
| BGP Holdings PLC | | 02/04/09-05/14/09 | | $ | — | | |
| China High Precision Automation Group Ltd. | | 04/18/11-07/14/11 | | | 426,768 | | |
| China Milk Products Group Ltd. | | 09/11/06-07/02/09 | | | 4,479,619 | | |
| Chinatrust Financial Holding Co., Ltd. | | 02/01/12 | | | — | | |
(d) Represents fair value as determined in good faith under procedures approved by the Board of Trustees. At February 29, 2012, the value of these securities amounted to $373,678, which represents 0.02% of net assets.
(e) Security exempt from registration pursuant to Rule 144A under the Securities Act of 1933. This security may be resold in transactions exempt from registration, normally to qualified institutional buyers. At February 29, 2012, the value of these securities amounted to $6,302,725 or 0.35% of net assets.
(f) The rate shown is the seven-day current annualized yield at February 29, 2012.
(g) Investments in affiliates during the year ended February 29, 2012:
| Issuer | | Beginning
Cost | | Purchase
Cost | | Sales Cost/
Proceeds
from Sales | | Realized
Gain/Loss | | Ending
Cost | | Dividends
or Interest
Income | | Value | |
Columbia Short-Term
Cash Fund | | $ | — | | | $ | 1,340,308,493 | | | $ | (1,323,845,997 | ) | | $ | — | | | $ | 16,462,496 | | | $ | 59,070 | | | $ | 16,462,496 | | |
The Accompanying Notes to Financial Statements are an integral part of this statement.
13
Columbia Multi-Advisor International Equity Fund
February 29, 2012
| Notes to Portfolio of Investments (continued) | |
(h) The table below represents securities received as collateral for repurchase agreements. This collateral is deposited with the Fund's custodian and, pursuant to the terms of the repurchase agreement, must have an aggregate market value greater than or equal to the repurchase price plus accrued interest at all times. The value of securities and/or cash held as collateral for repurchase agreements is monitored on a daily basis to ensure the proper level of collateral.
Citigroup Global Markets, Inc. (0.130%)
| Security Description | | Value | |
| Fannie Mae REMICS | | $ | 1,914,187 | | |
| Fannie Mae-Aces | | | 211,943 | | |
| Freddie Mac REMICS | | | 1,535,531 | | |
| Government National Mortgage Association | | | 418,339 | | |
| Total Market Value of Collateral Securities | | $ | 4,080,000 | | |
Citigroup Global Markets, Inc. (0.130%)
| Security Description | | Value | |
| Fannie Mae REMICS | | $ | 2,392,734 | | |
| Fannie Mae-Aces | | | 264,929 | | |
| Freddie Mac REMICS | | | 1,919,413 | | |
| Government National Mortgage Association | | | 522,924 | | |
| Total Market Value of Collateral Securities | | $ | 5,100,000 | | |
Credit Suisse Securities (USA) LLC (0.160%)
| Security Description | | Value | |
| Ginnie Mae I Pool | | $ | 6,261,143 | | |
| Ginnie Mae II Pool | | | 2,659,594 | | |
| Total Market Value of Collateral Securities | | $ | 8,920,737 | | |
Mizuho Securities USA, Inc. (0.220%)
| Security Description | | Value | |
| Fannie Mae Pool | | $ | 807,671 | | |
| Freddie Mac Gold Pool | | | 13,215 | | |
| Freddie Mac REMICS | | | 149,428 | | |
| Ginnie Mae I Pool | | | 1,000,665 | | |
| Ginnie Mae II Pool | | | 477,316 | | |
| Government National Mortgage Association | | | 101,705 | | |
| Total Market Value of Collateral Securities | | $ | 2,550,000 | | |
Natixis Financial Products, Inc. (0.220%)
| Security Description | | Value | |
| Fannie Mae Pool | | $ | 754,601 | | |
| Fannie Mae REMICS | | | 5,620,016 | | |
| Freddie Mac Gold Pool | | | 690,903 | | |
| Freddie Mac REMICS | | | 3,313,832 | | |
| Government National Mortgage Association | | | 989,174 | | |
| United States Treasury Note/Bond | | | 3,931,567 | | |
| Total Market Value of Collateral Securities | | $ | 15,300,093 | | |
The Accompanying Notes to Financial Statements are an integral part of this statement.
14
Columbia Multi-Advisor International Equity Fund
February 29, 2012
| Notes to Portfolio of Investments (continued) | |
Pershing LLC (0.290%)
| Security Description | | Value | |
| Fannie Mae Pool | | $ | 816,268 | | |
| Fannie Mae REMICS | | | 688,358 | | |
| Fannie Mae-Aces | | | 6,936 | | |
| Federal Farm Credit Bank | | | 61,684 | | |
| Federal Home Loan Banks | | | 66,346 | | |
| Federal Home Loan Mortgage Corp | | | 156,390 | | |
| Federal National Mortgage Association | | | 192,890 | | |
| Freddie Mac Gold Pool | | | 331,226 | | |
| Freddie Mac Non Gold Pool | | | 92,509 | | |
| Freddie Mac Reference REMIC | | | 22 | | |
| Freddie Mac REMICS | | | 641,140 | | |
| Ginnie Mae I Pool | | | 836,677 | | |
| Ginnie Mae II Pool | | | 745,953 | | |
| Government National Mortgage Association | | | 267,669 | | |
| United States Treasury Note/Bond | | | 184,593 | | |
| United States Treasury Strip Coupon | | | 11,339 | | |
| Total Market Value of Collateral Securities | | $ | 5,100,000 | | |
Royal Bank of Canada (0.190%)
| Security Description | | Value | |
| Fannie Mae Pool | | $ | 7,375,600 | | |
| Freddie Mac Gold Pool | | | 1,819,540 | | |
| Freddie Mac Non Gold Pool | | | 1,004,860 | | |
| Total Market Value of Collateral Securities | | $ | 10,200,000 | | |
| Abbreviation Legend | |
ADR American Depositary Receipt
GDR Global Depositary Receipt
NVDR Non-voting Depository Receipt
SDR Swedish Depositary Receipt
AUD Australian Dollar
BRL Brazilian Real
CAD Canadian Dollar
CHF Swiss Franc
DKK Danish Krone
EUR Euro
GBP Pound Sterling
HKD Hong Kong Dollar
IDR Indonesian Rupiah
INR Indian Rupee
JPY Japanese Yen
KRW Korean Won
MXN Mexican Peso
MYR Malaysia Ringgits
NOK Norwegian Krone
PHP Philippine Peso
PLN Polish Zloty
SEK Swedish Krona
SGD Singapore Dollar
THB Thailand Baht
TWD Taiwan Dollar
USD US Dollar
ZAR South African Rand
The Accompanying Notes to Financial Statements are an integral part of this statement.
15
Columbia Multi-Advisor International Equity Fund
February 29, 2012
Generally accepted accounting principles (GAAP) require disclosure regarding the inputs and valuation techniques used to measure fair value and any changes in valuation inputs or techniques. In addition, investments shall be disclosed by major category.
The Fund categorizes its fair value measurements according to a three-level hierarchy that maximizes the use of observable inputs and minimizes the use of unobservable inputs by prioritizing that the most observable input be used when available. Observable inputs are those that market participants would use in pricing an investment based on market data obtained from sources independent of the reporting entity. Unobservable inputs are those that reflect the Fund's assumptions about the information market participants would use in pricing an investment. An investment's level within the fair value hierarchy is based on the lowest level of any input that is deemed significant to the asset or liability's fair value measurement. The input levels are not necessarily an indication of the risk or liquidity associated with investments at that level. For example, certain U.S. government securities are generally high quality and liquid, however, they are reflected as Level 2 because the inputs used to determine fair value may not always be quoted prices in an active market.
Fair value inputs are summarized in the three broad levels listed below:
• Level 1 — Valuations based on quoted prices for investments in active markets that the Fund has the ability to access at the measurement date (including NAV for open-end mutual funds). Valuation adjustments are not applied to Level 1 investments.
• Level 2 — Valuations based on other significant observable inputs (including quoted prices for similar securities, interest rates, prepayment speeds, credit risks, etc.).
• Level 3 — Valuations based on significant unobservable inputs (including the Fund's own assumptions and judgment in determining the fair value of investments).
Inputs that are used in determining fair value of an investment may include price information, credit data, volatility statistics, and other factors. These inputs can be either observable or unobservable. The availability of observable inputs can vary between investments, and is affected by various factors such as the type of investment, and the volume and level of activity for that investment or similar investments in the marketplace. The inputs will be considered by the Investment Manager, along with any other relevant factors in the calculation of an investment's fair value. The Fund uses prices and inputs that are current as of the measurement date, which may include periods of market dislocations. During these periods, the availability of prices and inputs may be reduced for many investments. This condition could cause an investment to be reclassified between the various levels within the hierarchy.
Foreign equity securities actively traded in markets where there is a significant delay in the local close relative to the New York Stock Exchange (NYSE) are classified as Level 2. The values of these securities may include an adjustment to reflect the impact of significant market movements following the close of local trading, as described in Note 2 to the financial statements — Security Valuation.
Investments falling into the Level 3 category are primarily supported by quoted prices from brokers and dealers participating in the market for those investments. However, these may be classified as Level 3 investments due to lack of market transparency and corroboration to support these quoted prices. Additionally, valuation models may be used as the pricing source for any remaining investments classified as Level 3. These models rely on one or more significant unobservable inputs and/or significant assumptions by the Investment Manager. Inputs used in valuations may include, but are not limited to, financial statement analysis, capital account balances, discount rates and estimated cash flows, and comparable company data.
The following table is a summary of the inputs used to value the Fund's investments as of February 29, 2012:
| | | Fair value at February 29, 2012 | |
| Description(a) | | Level 1
Quoted Prices
in Active
Markets for
Identical Assets | | Level 2
Other
Significant
Observable
Inputs(b) | | Level 3
Significant
Unobservable
Inputs | | Total | |
| Equity Securities | |
| Common Stocks | |
| Consumer Discretionary | | $ | 18,359,858 | | | $ | 243,472,486 | | | $ | — | | | $ | 261,832,344 | | |
| Consumer Staples | | | 7,820,476 | | | | 160,920,003 | | | | 237,509 | | | | 168,977,988 | | |
| Energy | | | 17,214,681 | | | | 133,493,153 | | | | — | | | | 150,707,834 | | |
| Financials | | | 31,000,749 | | | | 313,418,922 | | | | 3 | | | | 344,419,674 | | |
| Health Care | | | 3,236,062 | | | | 119,479,039 | | | | — | | | | 122,715,101 | | |
| Industrials | | | 20,700,299 | | | | 236,995,262 | | | | — | | | | 257,695,561 | | |
| Information Technology | | | 48,921,109 | | | | 139,364,196 | | | | 136,166 | | | | 188,421,471 | | |
| Materials | | | 21,607,239 | | | | 141,077,195 | | | | — | | | | 162,684,434 | | |
| Telecommunication Services | | | 7,308,513 | | | | 55,865,111 | | | | — | | | | 63,173,624 | | |
| Utilities | | | — | | | | 14,165,162 | | | | — | | | | 14,165,162 | | |
The Accompanying Notes to Financial Statements are an integral part of this statement.
16
Columbia Multi-Advisor International Equity Fund
February 29, 2012
| Fair Value Measurements (continued) | |
| | | Fair value at February 29, 2012 | |
| Description(a) | | Level 1
Quoted Prices
in Active
Markets for
Identical Assets | | Level 2
Other
Significant
Observable
Inputs(b) | | Level 3
Significant
Unobservable
Inputs | | Total | |
| Equity Securities (cont.) | |
| Preferred Stocks | |
| Consumer Discretionary | | $ | — | | | $ | 18,825,892 | | | $ | — | | | $ | 18,825,892 | | |
| Consumer Staples | | | — | | | | 9,525,458 | | | | — | | | | 9,525,458 | | |
| Energy | | | 4,352,158 | | | | — | | | | — | | | | 4,352,158 | | |
| Materials | | | 1,257,402 | | | | — | | | | — | | | | 1,257,402 | | |
| Exchange-Traded Funds | | | 9,419,831 | | | | — | | | | — | | | | 9,419,831 | | |
| Rights | |
| Financials | | | — | | | | 5,679 | | | | — | | | | 5,679 | | |
| Total Equity Securities | | | 191,198,377 | | | | 1,586,607,558 | | | | 373,678 | | | | 1,778,179,613 | | |
| Other | |
| Money Market Funds | | | 16,462,496 | | | | — | | | | — | | | | 16,462,496 | | |
| Investments of Cash Collateral Received for Securities on Loan | | | — | | | | 65,242,251 | | | | — | | | | 65,242,251 | | |
| Total Other | | | 16,462,496 | | | | 65,242,251 | | | | — | | | | 81,704,747 | | |
| Investments in Securities | | | 207,660,873 | | | | 1,651,849,809 | | | | 373,678 | | | | 1,859,884,360 | | |
| Derivatives(c) | |
| Assets | |
| Futures Contracts | | | 85,621 | | | | — | | | | — | | | | 85,621 | | |
| Forward Foreign Currency Exchange Contracts | | | — | | | | 5,107,653 | | | | — | | | | 5,107,653 | | |
| Liabilities | |
| Forward Foreign Currency Exchange Contracts | | | — | | | | (10,670,070 | ) | | | — | | | | (10,670,070 | ) | |
| Total | | $ | 207,746,494 | | | $ | 1,646,287,392 | | | $ | 373,678 | | | $ | 1,854,407,564 | | |
The Fund's assets assigned to the Level 2 input category are generally valued using the market approach, in which a security's value is determined through reference to prices and information from market transactions for similar or identical assets. These assets include certain foreign securities for which a third party statistical pricing service may be employed for purposes of fair market valuation. The models utilized by the third party statistical pricing service take into account a security's correlation to available market data including, but not limited to, intraday index, ADR, and ETF movements.
(a) See the Portfolio of Investments for all investment classifications not indicated in the table.
(b) There were no significant transfers between Levels 1 and 2 during the period.
(c) Derivative instruments are valued at unrealized appreciation (depreciation).
The following table is a reconciliation of Level 3 assets for which significant unobservable inputs were used to determine fair value.
| | | Common Stocks | |
| Balance as of February 28, 2011 | | $ | — | | |
| Accrued discounts/premiums | | | — | | |
| Realized gain (loss) | | | — | | |
| Change in unrealized appreciation (depreciation)** | | | 289,389 | | |
| Sales | | | — | | |
| Purchases | | | 663,067 | | |
| Transfers into Level 3 | | | — | | |
| Transfers out of Level 3 | | | — | | |
| Balance as of February 29, 2012 | | $ | 373,678 | | |
** Change in unrealized appreciation (depreciation) relating to securities held at February 29, 2012 was $289,389.
Transfers in and/or out of Level 3 are determined based on the fair value at the beginning of the period for security positions held throughout the period.
The Fund's assets assigned to the Level 3 category are valued utilizing the valuation technique deemed the most appropriate in the circumstances. Certain common stocks classified as Level 3 securities are valued using the market approach. To determine fair value for these securities, management considered various factors which may have included, but were not limited to, the halt price of the security, the movement in observed market prices for other securities from the issuer, the movement in certain foreign or domestic market indices, models utilized by the third party statistical pricing service, and the position of the security within the respective company's capital structure.
The Accompanying Notes to Financial Statements are an integral part of this statement.
17
Statement of Assets and Liabilities – Columbia Multi-Advisor International Equity Fund
February 29, 2012
| Assets | |
| Investments, at value* | |
| Unaffiliated issuers (identified cost $1,549,499,884) | | $ | 1,778,179,613 | | |
| Affiliated issuers (identified cost $16,462,496) | | | 16,462,496 | | |
| Investment of cash collateral received for securities on loan | |
| Short-term securities (identified cost $14,996,450) | | | 14,996,450 | | |
| Repurchase agreements (identified cost $50,245,801) | | | 50,245,801 | | |
| Total investments (identified cost $1,631,204,631) | | | 1,859,884,360 | | |
| Foreign currency (identified cost $267,136) | | | 267,672 | | |
| Margin deposits on futures contracts | | | 264,000 | | |
| Unrealized appreciation on forward foreign currency exchange contracts | | | 5,107,653 | | |
| Receivable for: | |
| Investments sold | | | 82,837,500 | | |
| Capital shares sold | | | 2,176,881 | | |
| Dividends | | | 3,182,332 | | |
| Interest | | | 35,219 | | |
| Reclaims | | | 2,664,139 | | |
| Expense reimbursement due from Investment Manager | | | 590,729 | | |
| Prepaid expense | | | 24,419 | | |
| Trustees' deferred compensation plan | | | 120,467 | | |
| Total assets | | | 1,957,155,371 | | |
| Liabilities | |
| Disbursements in excess of cash | | | 310,737 | | |
| Due upon return of securities on loan | | | 65,242,251 | | |
| Unrealized depreciation on forward foreign currency exchange contracts | | | 10,670,070 | | |
| Payable for: | |
| Investments purchased | | | 71,245,767 | | |
| Capital shares purchased | | | 3,985,398 | | |
| Variation margin on futures contracts | | | 42,240 | | |
| Foreign capital gains taxes deferred | | | 964,814 | | |
| Investment management fees | | | 36,273 | | |
| Distribution and service fees | | | 4,832 | | |
| Transfer agent fees | | | 574,846 | | |
| Administration fees | | | 3,692 | | |
| Plan administration fees | | | 27 | | |
| Chief compliance officer expenses | | | 882 | | |
| Other expenses | | | 423,836 | | |
| Trustees' deferred compensation plan | | | 120,467 | | |
| Total liabilities | | | 153,626,132 | | |
| Net assets applicable to outstanding capital stock | | $ | 1,803,529,239 | | |
The Accompanying Notes to Financial Statements are an integral part of this statement.
18
Statement of Assets and Liabilities (continued) – Columbia Multi-Advisor International Equity Fund
February 29, 2012
| Represented by | |
| Paid-in capital | | $ | 2,646,178,926 | | |
| Undistributed net investment income | | | 9,873,179 | | |
| Accumulated net realized loss | | | (1,074,518,205 | ) | |
| Unrealized appreciation (depreciation) on: | |
| Investments | | | 228,679,729 | | |
| Foreign currency translations | | | (242,780 | ) | |
| Forward foreign currency exchange contracts | | | (5,562,417 | ) | |
| Futures contracts | | | 85,621 | | |
| Foreign capital gains tax | | | (964,814 | ) | |
| Total — representing net assets applicable to outstanding capital stock | | $ | 1,803,529,239 | | |
| *Value of securities on loan | | $ | 61,946,678 | | |
| Net assets applicable to outstanding shares | |
| Class A | | $ | 356,707,859 | | |
| Class B | | $ | 11,838,332 | | |
| Class C | | $ | 15,058,451 | | |
| Class I | | $ | 78,467,005 | | |
| Class R | | $ | 1,899,008 | | |
| Class R4 | | $ | 134,789 | | |
| Class W | | $ | 232,776,725 | | |
| Class Y | | $ | 12,780,492 | | |
| Class Z | | $ | 1,093,866,578 | | |
| Shares outstanding | |
| Class A | | | 30,547,131 | | |
| Class B | | | 1,122,575 | | |
| Class C | | | 1,445,567 | | |
| Class I | | | 6,600,391 | | |
| Class R | | | 163,087 | | |
| Class R4 | | | 11,376 | | |
| Class W | | | 19,936,270 | | |
| Class Y | | | 1,074,523 | | |
| Class Z | | | 92,209,409 | | |
| Net asset value per share | |
| Class A(a) | | $ | 11.68 | | |
| Class B | | $ | 10.55 | | |
| Class C | | $ | 10.42 | | |
| Class I | | $ | 11.89 | | |
| Class R | | $ | 11.64 | | |
| Class R4 | | $ | 11.85 | | |
| Class W | | $ | 11.68 | | |
| Class Y | | $ | 11.89 | | |
| Class Z | | $ | 11.86 | | |
(a) The maximum offering price per share for Class A is $12.39. The offering price is calculated by dividing the net asset value by 1.0 minus the maximum sales charge of 5.75%.
The Accompanying Notes to Financial Statements are an integral part of this statement.
19
Statement of Operations – Columbia Multi-Advisor International Equity Fund
Year ended February 29, 2012
| Net investment income | |
| Income: | |
| Dividends | | $ | 56,514,462 | | |
| Interest | | | 17,166 | | |
| Dividends from affiliates | | | 59,070 | | |
| Income from securities lending — net | | | 695,592 | | |
| Foreign taxes withheld | | | (7,104,438 | ) | |
| Total income | | | 50,181,852 | | |
| Expenses: | |
| Investment management fees | | | 13,957,643 | | |
| Distribution fees | |
| Class B | | | 102,699 | | |
| Class C | | | 114,145 | | |
| Class R | | | 8,649 | | |
| Service fees | |
| Class B | | | 34,109 | | |
| Class C | | | 37,436 | | |
| Class W | | | 430,843 | | |
| Distribution and service fees — Class A | | | 846,695 | | |
| Transfer agent fees | |
| Class A | | | 829,818 | | |
| Class B | | | 33,713 | | |
| Class C | | | 37,200 | | |
| Class R | | | 4,203 | | |
| Class R4 | | | 71 | | |
| Class W | | | 426,364 | | |
| Class Y | | | 37 | | |
| Class Z | | | 2,939,114 | | |
| Administration fees | | | 1,516,047 | | |
| Plan administration fees | |
| Class R4 | | | 345 | | |
| Compensation of board members | | | 35,734 | | |
| Stockholders' meeting fees | | | 15,411 | | |
| Pricing and bookkeeping fees | | | 10,528 | | |
| Custodian fees | | | 666,195 | | |
| Printing and postage fees | | | 341,035 | | |
| Registration fees | | | 95,203 | | |
| Professional fees | | | 121,578 | | |
| Chief compliance officer expenses | | | 1,104 | | |
| Other | | | 106,298 | | |
| Total expenses | | | 22,712,217 | | |
| Fees waived or expenses reimbursed by Investment Manager and its affiliates | | | (590,729 | ) | |
| Expense reductions | | | (46,193 | ) | |
| Total net expenses | | | 22,075,295 | | |
| Net investment income | | | 28,106,557 | | |
| Realized and unrealized gain (loss) — net | |
| Net realized gain (loss) on: | |
| Investments | | | 25,286,830 | | |
| Foreign currency translations | | | (1,971,349 | ) | |
| Forward foreign currency exchange contracts | | | (3,871,618 | ) | |
| Futures contracts | | | (7 | ) | |
| Net realized gain | | | 19,443,856 | | |
| Net change in unrealized appreciation (depreciation) on: | |
| Investments | | | (256,233,193 | ) | |
| Foreign currency translations | | | (923,166 | ) | |
| Forward foreign currency exchange contracts | | | (5,562,417 | ) | |
| Futures contracts | | | 85,621 | | |
| Foreign capital gains tax | | | (784,438 | ) | |
| Net change in unrealized depreciation | | | (263,417,593 | ) | |
| Net realized and unrealized loss | | | (243,973,737 | ) | |
| Net decrease in net assets from operations | | $ | (215,867,180 | ) | |
The Accompanying Notes to Financial Statements are an integral part of this statement.
20
Statement of Changes in Net Assets – Columbia Multi-Advisor International Equity Fund
| | | Year ended
February 29,
2012 | | Year ended
February 28,
2011(a) | |
| Operations | |
| Net investment income | | $ | 28,106,557 | | | $ | 20,536,745 | | |
| Net realized gain | | | 19,443,856 | | | | 119,854,478 | | |
| Net change in unrealized appreciation (depreciation) | | | (263,417,593 | ) | | | 85,101,266 | | |
| Net increase (decrease) in net assets resulting from operations | | | (215,867,180 | ) | | | 225,492,489 | | |
| Distributions to shareholders from: | |
| Net investment income | |
| Class A | | | — | | | | (433,393 | ) | |
| Class B | | | — | | | | (10,544 | ) | |
| Class C | | | — | | | | (16,975 | ) | |
| Class I | | | — | | | | (1,236,199 | ) | |
| Class R | | | — | | | | (4,251 | ) | |
| Class W | | | — | | | | (47 | ) | |
| Class Z | | | — | | | | (24,765,796 | ) | |
| Total distributions to shareholders | | | — | | | | (26,467,205 | ) | |
| Increase (decrease) in net assets from share transactions | | | 764,294,162 | | | | (350,430,216 | ) | |
| Proceeds from regulatory settlements (Note 6) | | | 3,493,349 | | | | 25,379 | | |
| Total increase (decrease) in net assets | | | 551,920,331 | | | | (151,379,553 | ) | |
| Net assets at beginning of year | | | 1,251,608,908 | | | | 1,402,988,461 | | |
| Net assets at end of year | | $ | 1,803,529,239 | | | $ | 1,251,608,908 | | |
| Undistributed (excess of distributions over) net investment income | | $ | 9,873,179 | | | $ | (16,333,263 | ) | |
(a) Class I and Class W are for the period from September 27, 2010 (commencement of operations) to February 28, 2011.
The Accompanying Notes to Financial Statements are an integral part of this statement.
21
Statement of Changes in Net Assets (continued) – Columbia Multi-Advisor International Equity Fund
| | | Year ended February 29,
2012(a) | | Year ended February 28,
2011(b) | |
| | | Shares | | Dollars ($) | | Shares | | Dollars ($) | |
| Capital stock activity | |
| Class A shares | |
| Subscriptions(c) | | | 1,249,749 | | | | 14,338,616 | | | | 123,232 | | | | 1,389,139 | | |
| Fund merger | | | 34,476,734 | | | | 434,440,590 | | | | — | | | | — | | |
| Distributions reinvested | | | — | | | | — | | | | 17,800 | | | | 208,966 | | |
| Redemptions | | | (7,159,583 | ) | | | (80,561,789 | ) | | | (430,140 | ) | | | (4,834,791 | ) | |
| Net increase (decrease) | | | 28,566,900 | | | | 368,217,417 | | | | (289,108 | ) | | | (3,236,686 | ) | |
| Class B shares | |
| Subscriptions | | | 17,098 | | | | 179,680 | | | | 1,231 | | | | 13,349 | | |
| Fund merger | | | 1,930,534 | | | | 22,137,479 | | | | — | | | | — | | |
| Distributions reinvested | | | — | | | | — | | | | 400 | | | | 4,281 | | |
| Redemptions(c) | | | (894,164 | ) | | | (9,505,958 | ) | | | (54,571 | ) | | | (549,739 | ) | |
| Net increase (decrease) | | | 1,053,468 | | | | 12,811,201 | | | | (52,940 | ) | | | (532,109 | ) | |
| Class C shares | |
| Subscriptions | | | 114,245 | | | | 1,138,984 | | | | 7,336 | | | | 76,021 | | |
| Fund merger | | | 1,792,925 | | | | 20,291,719 | | | | — | | | | — | | |
| Distributions reinvested | | | — | | | | — | | | | 899 | | | | 9,503 | | |
| Redemptions | | | (575,170 | ) | | | (5,732,863 | ) | | | (74,067 | ) | | | (699,511 | ) | |
| Net increase (decrease) | | | 1,332,000 | | | | 15,697,840 | | | | (65,832 | ) | | | (613,987 | ) | |
| Class I shares | |
| Subscriptions | | | 15,900,534 | | | | 196,608,468 | | | | 12,969,724 | | | | 156,597,095 | | |
| Fund merger | | | 19,889,124 | | | | 254,159,984 | | | | — | | | | — | | |
| Distributions reinvested | | | — | | | | — | | | | 104,053 | | | | 1,236,146 | | |
| Redemptions | | | (32,917,296 | ) | | | (361,648,370 | ) | | | (9,345,748 | ) | | | (113,450,533 | ) | |
| Net increase | | | 2,872,362 | | | | 89,120,082 | | | | 3,728,029 | | | | 44,382,708 | | |
| Class R shares | |
| Subscriptions | | | 77,654 | | | | 830,832 | | | | 5,742 | | | | 65,854 | | |
| Fund merger | | | 166,754 | | | | 2,099,341 | | | | — | | | | — | | |
| Distributions reinvested | | | — | | | | — | | | | 269 | | | | 3,150 | | |
| Redemptions | | | (104,347 | ) | | | (1,167,905 | ) | | | (10,045 | ) | | | (105,779 | ) | |
| Net increase (decrease) | | | 140,061 | | | | 1,762,268 | | | | (4,034 | ) | | | (36,775 | ) | |
| Class R4 shares | |
| Subscriptions | | | 289 | | | | 3,528 | | | | — | | | | — | | |
| Fund merger | | | 14,235 | | | | 181,792 | | | | — | | | | — | | |
| Redemptions | | | (3,148 | ) | | | (34,474 | ) | | | — | | | | — | | |
| Net increase | | | 11,376 | | | | 150,846 | | | | — | | | | — | | |
| Class W shares | |
| Subscriptions | | | 10,868,215 | | | | 115,323,128 | | | | 230 | | | | 2,650 | | |
| Fund merger | | | 15,438,672 | | | | 194,596,937 | | | | — | | | | — | | |
| Redemptions | | | (6,370,835 | ) | | | (70,049,348 | ) | | | (12 | ) | | | (153 | ) | |
| Net increase | | | 19,936,052 | | | | 239,870,717 | | | | 218 | | | | 2,497 | | |
| Class Y shares | |
| Subscriptions | | | 199 | | | | 2,602 | | | | — | | | | — | | |
| Fund merger | | | 1,172,264 | | | | 14,983,504 | | | | — | | | | — | | |
| Redemptions | | | (97,940 | ) | | | (1,226,184 | ) | | | — | | | | — | | |
| Net increase | | | 1,074,523 | | | | 13,759,922 | | | | — | | | | — | | |
| Class Z shares | |
| Subscriptions | | | 10,955,590 | | | | 121,624,727 | | | | 7,999,032 | | | | 90,843,065 | | |
| Fund merger | | | 27,157,783 | | | | 346,893,533 | | | | — | | | | — | | |
| Distributions reinvested | | | — | | | | — | | | | 1,165,024 | | | | 13,840,489 | | |
| Redemptions | | | (39,228,298 | ) | | | (445,614,391 | ) | | | (43,054,867 | ) | | | (495,079,418 | ) | |
| Net decrease | | | (1,114,925 | ) | | | 22,903,869 | | | | (33,890,811 | ) | | | (390,395,864 | ) | |
| Total net increase (decrease) | | | 53,871,817 | | | | 764,294,162 | | | | (30,574,478 | ) | | | (350,430,216 | ) | |
(a) Class R4 and Class Y are for the period from March 7, 2011 (commencement of operations) to February 29, 2012.
(b) Class I and Class W are for the period from September 27, 2010 (commencement of operations) to February 28, 2011.
(c) Includes conversions of Class B shares to Class A shares, if any.
The Accompanying Notes to Financial Statements are an integral part of this statement.
22
Financial Highlights – Columbia Multi-Advisor International Equity Fund
The following tables are intended to help you understand the Fund's financial performance. Certain information reflects financial results for a single share of a class held for the periods shown. Per share net investment income (loss) amounts are calculated based on average shares outstanding during the period. Total returns assume reinvestment of all dividends and distributions. Total returns do not reflect payment of sales charges, if any, and are not annualized for periods of less than one year.
| | | Year ended
Feb. 29, | | Year ended Feb. 28, | | Year ended
Feb. 29, | |
| | | 2012 | | 2011 | | 2010 | | 2009 | | 2008 | |
| Class A | |
| Per share data | |
| Net asset value, beginning of period | | $ | 12.46 | | | $ | 10.68 | | | $ | 7.44 | | | $ | 15.77 | | | $ | 17.12 | | |
| Income from investment operations: | |
| Net investment income | | | 0.14 | | | | 0.14 | | | | 0.13 | | | | 0.26 | | | | 0.28 | | |
| Net realized and unrealized gain (loss) | | | (0.94 | ) | | | 1.85 | | | | 3.51 | | | | (8.33 | ) | | | 0.76 | | |
| Total from investment operations | | | (0.80 | ) | | | 1.99 | | | | 3.64 | | | | (8.07 | ) | | | 1.04 | | |
| Less distributions to shareholders from: | |
| Net investment income | | | — | | | | (0.21 | ) | | | (0.43 | ) | | | (0.07 | ) | | | (0.28 | ) | |
| Net realized gains | | | — | | | | — | | | | — | | | | (0.19 | ) | | | (2.11 | ) | |
| Total distributions to shareholders | | | — | | | | (0.21 | ) | | | (0.43 | ) | | | (0.26 | ) | | | (2.39 | ) | |
| Proceeds from regulatory settlement | | | 0.02 | | | | 0.00 | (a) | | | 0.03 | | | | — | | | | — | | |
| Redemption fees: | |
| Redemption fees added to paid-in-capital | | | — | | | | — | | | | 0.00 | (a) | | | 0.00 | (a) | | | 0.00 | (a) | |
| Net asset value, end of period | | $ | 11.68 | | | $ | 12.46 | | | $ | 10.68 | | | $ | 7.44 | | | $ | 15.77 | | |
| Total return | | | (6.26 | %)(b) | | | 18.80 | % | | | 49.61 | % | | | (51.87 | %) | | | 5.14 | % | |
| Ratios to average net assets(c) | |
Expenses prior to fees waived or expenses reimbursed
(including interest expense) | | | 1.36 | % | | | 1.33 | %(d) | | | 1.26 | %(d) | | | 1.27 | % | | | 1.19 | %(d) | |
Net expenses after fees waived or expenses reimbursed
(including interest expense)(e) | | | 1.32 | %(f) | | | 1.33 | %(d)(f) | | | 1.26 | %(d)(f) | | | 1.27 | %(f) | | | 1.19 | %(d)(f) | |
Expenses prior to fees waived or expenses reimbursed
(excluding interest expense) | | | 1.36 | % | | | 1.33 | % | | | 1.26 | % | | | 1.27 | % | | | 1.19 | % | |
Net expenses after fees waived or expenses reimbursed
(excluding interest expense)(e) | | | 1.32 | %(f) | | | 1.33 | %(f) | | | 1.26 | %(f) | | | 1.27 | %(f) | | | 1.19 | %(f) | |
| Net investment income | | | 1.20 | %(f) | | | 1.27 | %(f) | | | 1.26 | %(f) | | | 2.05 | %(f) | | | 1.56 | %(f) | |
| Supplemental data | |
| Net assets, end of period (in thousands) | | $ | 356,708 | | | $ | 24,668 | | | $ | 24,243 | | | $ | 16,936 | | | $ | 41,660 | | |
| Portfolio turnover | | | 112 | % | | | 92 | % | | | 127 | % | | | 83 | % | | | 78 | % | |
Notes to Financial Highlights
(a) Rounds to less than $0.01.
(b) During the year ended February 29, 2012, the Fund received proceeds from a regulatory settlement. Had the Fund not received these proceeds, the total return would have been lower by 0.19%.
(c) In addition to the fees and expenses which the Fund bears directly, the Fund indirectly bears a pro rata share of the fees and expenses of the acquired funds in which it invests. Such indirect expenses are not included in the reported expense ratios.
(d) Includes interest expense which rounds to less than 0.01%.
(e) The Investment Manager and certain of its affiliates agreed to waive/reimburse certain fees and expenses, if applicable.
(f) The benefits derived from expense reductions had an impact of less than 0.01%.
The Accompanying Notes to Financial Statements are an integral part of this statement.
23
Financial Highlights (continued) – Columbia Multi-Advisor International Equity Fund
| | | Year ended
Feb. 29, | | Year ended Feb. 28, | | Year ended
Feb. 29, | |
| | | 2012 | | 2011 | | 2010 | | 2009 | | 2008 | |
| Class B | |
| Per share data | |
| Net asset value, beginning of period | | $ | 11.34 | | | $ | 9.75 | | | $ | 6.82 | | | $ | 14.47 | | | $ | 15.89 | | |
| Income from investment operations: | |
| Net investment income | | | 0.06 | | | | 0.07 | | | | 0.06 | | | | 0.17 | | | | 0.15 | | |
| Net realized and unrealized gain (loss) | | | (0.87 | ) | | | 1.66 | | | | 3.20 | | | | (7.63 | ) | | | 0.70 | | |
| Total from investment operations | | | (0.81 | ) | | | 1.73 | | | | 3.26 | | | | (7.46 | ) | | | 0.85 | | |
| Less distributions to shareholders from: | |
| Net investment income | | | — | | | | (0.14 | ) | | | (0.36 | ) | | | — | | | | (0.16 | ) | |
| Net realized gains | | | — | | | | — | | | | — | | | | (0.19 | ) | | | (2.11 | ) | |
| Total distributions to shareholders | | | — | | | | (0.14 | ) | | | (0.36 | ) | | | (0.19 | ) | | | (2.27 | ) | |
| Proceeds from regulatory settlement | | | 0.02 | | | | 0.00 | (a) | | | 0.03 | | | | — | | | | — | | |
| Redemption fees: | |
| Redemption fees added to paid-in-capital | | | — | | | | — | | | | 0.00 | (a) | | | 0.00 | (a) | | | 0.00 | (a) | |
| Net asset value, end of period | | $ | 10.55 | | | $ | 11.34 | | | $ | 9.75 | | | $ | 6.82 | | | $ | 14.47 | | |
| Total return | | | (6.97 | %)(b) | | | 17.88 | % | | | 48.47 | % | | | (52.23 | %) | | | 4.40 | % | |
| Ratios to average net assets(c) | |
Expenses prior to fees waived or expenses reimbursed
(including interest expense) | | | 2.11 | % | | | 2.08 | %(d) | | | 2.01 | %(d) | | | 2.02 | % | | | 1.94 | %(d) | |
Net expenses after fees waived or expenses reimbursed
(including interest expense)(e) | | | 2.06 | %(f) | | | 2.08 | %(d)(f) | | | 2.01 | %(d)(f) | | | 2.02 | %(f) | | | 1.94 | %(d)(f) | |
Expenses prior to fees waived or expenses reimbursed
(excluding interest expense) | | | 2.11 | % | | | 2.08 | % | | | 2.01 | % | | | 2.02 | % | | | 1.94 | % | |
Net expenses after fees waived or expenses reimbursed
(excluding interest expense)(e) | | | 2.06 | %(f) | | | 2.08 | %(f) | | | 2.01 | %(f) | | | 2.02 | %(f) | | | 1.94 | %(f) | |
| Net investment income | | | 0.62 | %(f) | | | 0.70 | %(f) | | | 0.60 | %(f) | | | 1.44 | %(f) | | | 0.89 | %(f) | |
| Supplemental data | |
| Net assets, end of period (in thousands) | | $ | 11,838 | | | $ | 784 | | | $ | 1,190 | | | $ | 1,098 | | | $ | 3,545 | | |
| Portfolio turnover | | | 112 | % | | | 92 | % | | | 127 | % | | | 83 | % | | | 78 | % | |
Notes to Financial Highlights
(a) Rounds to less than $0.01.
(b) During the year ended February 29, 2012, the Fund received proceeds from a regulatory settlement. Had the Fund not received these proceeds, the total return would have been lower by 0.20%.
(c) In addition to the fees and expenses which the Fund bears directly, the Fund indirectly bears a pro rata share of the fees and expenses of the acquired funds in which it invests. Such indirect expenses are not included in the reported expense ratios.
(d) Includes interest expense which rounds to less than 0.01%.
(e) The Investment Manager and certain of its affiliates agreed to waive/reimburse certain fees and expenses, if applicable.
(f) The benefits derived from expense reductions had an impact of less than 0.01%.
The Accompanying Notes to Financial Statements are an integral part of this statement.
24
Financial Highlights (continued) – Columbia Multi-Advisor International Equity Fund
| | | Year ended
Feb. 29, | | Year ended Feb. 28, | | Year ended
Feb. 29, | |
| | | 2012 | | 2011 | | 2010 | | 2009 | | 2008 | |
| Class C | |
| Per share data | |
| Net asset value, beginning of period | | $ | 11.20 | | | $ | 9.63 | | | $ | 6.73 | | | $ | 14.29 | | | $ | 15.72 | | |
| Income from investment operations: | |
| Net investment income | | | 0.05 | | | | 0.07 | | | | 0.05 | | | | 0.16 | | | | 0.13 | | |
| Net realized and unrealized gain (loss) | | | (0.85 | ) | | | 1.64 | | | | 3.18 | | | | (7.53 | ) | | | 0.71 | | |
| Total from investment operations | | | (0.80 | ) | | | 1.71 | | | | 3.23 | | | | (7.37 | ) | | | 0.84 | | |
| Less distributions to shareholders from: | |
| Net investment income | | | — | | | | (0.14 | ) | | | (0.36 | ) | | | — | | | | (0.16 | ) | |
| Net realized gains | | | — | | | | — | | | | — | | | | (0.19 | ) | | | (2.11 | ) | |
| Total distributions to shareholders | | | — | | | | (0.14 | ) | | | (0.36 | ) | | | (0.19 | ) | | | (2.27 | ) | |
| Proceeds from regulatory settlement | | | 0.02 | | | | 0.00 | (a) | | | 0.03 | | | | — | | | | — | | |
| Redemption fees: | |
| Redemption fees added to paid-in-capital | | | — | | | | — | | | | 0.00 | (a) | | | 0.00 | (a) | | | 0.00 | (a) | |
| Net asset value, end of period | | $ | 10.42 | | | $ | 11.20 | | | $ | 9.63 | | | $ | 6.73 | | | $ | 14.29 | | |
| Total return | | | (6.96 | %)(b) | | | 17.89 | % | | | 48.67 | % | | | (52.26 | %) | | | 4.37 | % | |
| Ratios to average net assets(c) | |
Expenses prior to fees waived or expenses reimbursed
(including interest expense) | | | 2.10 | % | | | 2.08 | %(d) | | | 2.01 | %(d) | | | 2.02 | % | | | 1.94 | %(d) | |
Net expenses after fees waived or expenses reimbursed
(including interest expense)(e) | | | 2.07 | %(f) | | | 2.08 | %(d)(f) | | | 2.01 | %(d)(f) | | | 2.02 | %(f) | | | 1.94 | %(d)(f) | |
Expenses prior to fees waived or expenses reimbursed
(excluding interest expense) | | | 2.10 | % | | | 2.08 | % | | | 2.01 | % | | | 2.02 | % | | | 1.94 | % | |
Net expenses after fees waived or expenses reimbursed
(excluding interest expense)(e) | | | 2.07 | %(f) | | | 2.08 | %(f) | | | 2.01 | %(f) | | | 2.02 | %(f) | | | 1.94 | %(f) | |
| Net investment income | | | 0.48 | %(f) | | | 0.72 | %(f) | | | 0.55 | %(f) | | | 1.38 | %(f) | | | 0.79 | %(f) | |
| Supplemental data | |
| Net assets, end of period (in thousands) | | $ | 15,058 | | | $ | 1,272 | | | $ | 1,728 | | | $ | 1,349 | | | $ | 3,863 | | |
| Portfolio turnover | | | 112 | % | | | 92 | % | | | 127 | % | | | 83 | % | | | 78 | % | |
Notes to Financial Highlights
(a) Rounds to less than $0.01.
(b) During the year ended February 29, 2012, the Fund received proceeds from a regulatory settlement. Had the Fund not received these proceeds, the total return would have been lower by 0.19%.
(c) In addition to the fees and expenses which the Fund bears directly, the Fund indirectly bears a pro rata share of the fees and expenses of the acquired funds in which it invests. Such indirect expenses are not included in the reported expense ratios.
(d) Includes interest expense which rounds to less than 0.01%.
(e) The Investment Manager and certain of its affiliates agreed to waive/reimburse certain fees and expenses, if applicable.
(f) The benefits derived from expense reductions had an impact of less than 0.01%.
The Accompanying Notes to Financial Statements are an integral part of this statement.
25
Financial Highlights (continued) – Columbia Multi-Advisor International Equity Fund
| | | Year ended
Feb. 29,
2012 | | Year ended
Feb. 28,
2011(a) | |
| Class I | |
| Per share data | |
| Net asset value, beginning of period | | $ | 12.62 | | | $ | 11.64 | | |
| Income from investment operations: | |
| Net investment income | | | 0.22 | | | | 0.02 | | |
| Net realized and unrealized gain (loss) | | | (0.97 | ) | | | 1.21 | | |
| Total from investment operations | | | (0.75 | ) | | | 1.23 | | |
| Less distributions to shareholders from: | |
| Net investment income | | | — | | | | (0.25 | ) | |
| Total distributions to shareholders | | | — | | | | (0.25 | ) | |
| Proceeds from regulatory settlement | | | 0.02 | | | | 0.00 | (b) | |
| Net asset value, end of period | | $ | 11.89 | | | $ | 12.62 | | |
| Total return | | | (5.78 | %)(c) | | | 10.69 | % | |
| Ratios to average net assets(d) | |
| Expenses prior to fees waived or expenses reimbursed (including interest expense) | | | 0.84 | % | | | 0.95 | %(e)(f) | |
| Net expenses after fees waived or expenses reimbursed (including interest expense)(g) | | | 0.84 | % | | | 0.95 | %(e)(f)(h) | |
| Expenses prior to fees waived or expenses reimbursed (excluding interest expense) | | | 0.84 | % | | | 0.95 | %(f) | |
| Net expenses after fees waived or expenses reimbursed (excluding interest expense)(g) | | | 0.84 | % | | | 0.95 | %(f)(h) | |
| Net investment income | | | 1.87 | % | | | 0.32 | %(f)(h) | |
| Supplemental data | |
| Net assets, end of period (in thousands) | | $ | 78,467 | | | $ | 47,056 | | |
| Portfolio turnover | | | 112 | % | | | 92 | % | |
Notes to Financial Highlights
(a) For the period from September 27, 2010 (commencement of operations) to February 28, 2011.
(b) Rounds to less than $0.01.
(c) During the year ended February 29, 2012, the Fund received proceeds from a regulatory settlement. Had the Fund not received these proceeds, the total return would have been lower by 0.19%.
(d) In addition to the fees and expenses which the Fund bears directly, the Fund indirectly bears a pro rata share of the fees and expenses of the acquired funds in which it invests. Such indirect expenses are not included in the reported expense ratios.
(e) Includes interest expense which rounds to less than 0.01%.
(f) Annualized.
(g) The Investment Manager and certain of its affiliates agreed to waive/reimburse certain fees and expenses, if applicable.
(h) The benefits derived from expense reductions had an impact of less than 0.01%.
The Accompanying Notes to Financial Statements are an integral part of this statement.
26
Financial Highlights (continued) – Columbia Multi-Advisor International Equity Fund
| | | Year ended
Feb. 29, | | Year ended Feb. 28, | | Year ended
Feb. 29, | |
| | | 2012 | | 2011 | | 2010 | | 2009 | | 2008 | |
| Class R | |
| Per share data | |
| Net asset value, beginning of period | | $ | 12.45 | | | $ | 10.68 | | | $ | 7.44 | | | $ | 15.76 | | | $ | 17.12 | | |
| Income from investment operations: | |
| Net investment income | | | 0.11 | | | | 0.13 | | | | 0.09 | | | | 0.21 | | | | 0.06 | | |
| Net realized and unrealized gain (loss) | | | (0.94 | ) | | | 1.83 | | | | 3.53 | | | | (8.30 | ) | | | 0.93 | | |
| Total from investment operations | | | (0.83 | ) | | | 1.96 | | | | 3.62 | | | | (8.09 | ) | | | 0.99 | | |
| Less distributions to shareholders from: | |
| Net investment income | | | — | | | | (0.19 | ) | | | (0.41 | ) | | | (0.04 | ) | | | (0.24 | ) | |
| Net realized gains | | | — | | | | — | | | | — | | | | (0.19 | ) | | | (2.11 | ) | |
| Total distributions to shareholders | | | — | | | | (0.19 | ) | | | (0.41 | ) | | | (0.23 | ) | | | (2.35 | ) | |
| Proceeds from regulatory settlement | | | 0.02 | | | | 0.00 | (a) | | | 0.03 | | | | — | | | | — | | |
| Redemption fees: | |
| Redemption fees added to paid-in-capital | | | — | | | | — | | | | 0.00 | (a) | | | 0.00 | (a) | | | 0.00 | (a) | |
| Net asset value, end of period | | $ | 11.64 | | | $ | 12.45 | | | $ | 10.68 | | | $ | 7.44 | | | $ | 15.76 | | |
| Total return | | | (6.51 | %)(b) | | | 18.47 | % | | | 49.28 | % | | | (52.00 | %) | | | 4.87 | % | |
| Ratios to average net assets(c) | |
Expenses prior to fees waived or expenses reimbursed
(including interest expense) | | | 1.62 | % | | | 1.58 | %(d) | | | 1.51 | %(d) | | | 1.52 | % | | | 1.44 | %(d) | |
Net expenses after fees waived or expenses reimbursed
(including interest expense)(e) | | | 1.57 | %(f) | | | 1.58 | %(d)(f) | | | 1.51 | %(d)(f) | | | 1.52 | %(f) | | | 1.44 | %(d)(f) | |
Expenses prior to fees waived or expenses reimbursed
(excluding interest expense) | | | 1.62 | % | | | 1.58 | % | | | 1.51 | % | | | 1.52 | % | | | 1.44 | % | |
Net expenses after fees waived or expenses reimbursed
(excluding interest expense)(e) | | | 1.57 | %(f) | | | 1.58 | %(f) | | | 1.51 | %(f) | | | 1.52 | %(f) | | | 1.44 | %(f) | |
| Net investment income | | | 0.98 | %(f) | | | 1.13 | %(f) | | | 0.86 | %(f) | | | 1.70 | %(f) | | | 0.31 | %(f) | |
| Supplemental data | |
| Net assets, end of period (in thousands) | | $ | 1,899 | | | $ | 287 | | | $ | 289 | | | $ | 112 | | | $ | 196 | | |
| Portfolio turnover | | | 112 | % | | | 92 | % | | | 127 | % | | | 83 | % | | | 78 | % | |
Notes to Financial Highlights
(a) Rounds to less than $0.01.
(b) During the year ended February 29, 2012, the Fund received proceeds from a regulatory settlement. Had the Fund not received these proceeds, the total return would have been lower by 0.19%.
(c) In addition to the fees and expenses which the Fund bears directly, the Fund indirectly bears a pro rata share of the fees and expenses of the acquired funds in which it invests. Such indirect expenses are not included in the reported expense ratios.
(d) Includes interest expense which rounds to less than 0.01%.
(e) The Investment Manager and certain of its affiliates agreed to waive/reimburse certain fees and expenses, if applicable.
(f) The benefits derived from expense reductions had an impact of less than 0.01%.
The Accompanying Notes to Financial Statements are an integral part of this statement.
27
Financial Highlights (continued) – Columbia Multi-Advisor International Equity Fund
| | | Year ended
Feb. 29, 2012(a) | |
| Class R4 | |
| Per share data | |
| Net asset value, beginning of period | | $ | 12.54 | | |
| Income from investment operations: | |
| Net investment income | | | 0.15 | | |
| Net realized and unrealized loss | | | (0.86 | ) | |
| Total from investment operations | | | (0.71 | ) | |
| Proceeds from regulatory settlement | | | 0.02 | | |
| Net asset value, end of period | | $ | 11.85 | | |
| Total return | | | (5.50 | %)(b) | |
| Ratios to average net assets(c) | |
| Expenses prior to fees waived or expenses reimbursed (including interest expense) | | | 1.21 | %(d) | |
| Net expenses after fees waived or expenses reimbursed (including interest expense)(e) | | | 1.21 | %(d) | |
| Expenses prior to fees waived or expenses reimbursed (excluding interest expense) | | | 1.21 | %(d) | |
| Net expenses after fees waived or expenses reimbursed (excluding interest expense)(e) | | | 1.21 | %(d) | |
| Net investment income | | | 1.33 | %(d) | |
| Supplemental data | |
| Net assets, end of period (in thousands) | | $ | 135 | | |
| Portfolio turnover | | | 112 | % | |
Notes to Financial Highlights
(a) For the period from March 7, 2011 (commencement of operations) to February 29, 2012.
(b) During the year ended February 29, 2012, the Fund received proceeds from a regulatory settlement. Had the Fund not received these proceeds, the total return would have been lower by 0.19%.
(c) In addition to the fees and expenses which the Fund bears directly, the Fund indirectly bears a pro rata share of the fees and expenses of the acquired funds in which it invests. Such indirect expenses are not included in the reported expense ratios.
(d) Annualized.
(e) The Investment Manager and certain of its affiliates agreed to waive/reimburse certain fees and expenses, if applicable.
The Accompanying Notes to Financial Statements are an integral part of this statement.
28
Financial Highlights (continued) – Columbia Multi-Advisor International Equity Fund
| | | Year ended
Feb. 29,
2012 | | Year ended
Feb. 28,
2011(a) | |
| Class W | |
| Per share data | |
| Net asset value, beginning of period | | $ | 12.46 | | | $ | 11.48 | | |
| Income from investment operations: | |
| Net investment income | | | 0.12 | | | | 0.02 | | |
| Net realized and unrealized gain (loss) | | | (0.92 | ) | | | 1.17 | | |
| Total from investment operations | | | (0.80 | ) | | | 1.19 | | |
| Less distributions to shareholders from: | |
| Net investment income | | | — | | | | (0.21 | ) | |
| Total distributions to shareholders | | | — | | | | (0.21 | ) | |
| Proceeds from regulatory settlement | | | 0.02 | | | | 0.00 | (b) | |
| Net asset value, end of period | | $ | 11.68 | | | $ | 12.46 | | |
| Total return | | | (6.26 | %)(c) | | | 10.52 | % | |
| Ratios to average net assets(d) | |
| Expenses prior to fees waived or expenses reimbursed (including interest expense) | | | 1.38 | % | | | 1.30 | %(e)(f) | |
| Net expenses after fees waived or expenses reimbursed (including interest expense)(g) | | | 1.33 | %(h) | | | 1.30 | %(e)(f)(h) | |
| Expenses prior to fees waived or expenses reimbursed (excluding interest expense) | | | 1.38 | % | | | 1.30 | %(f) | |
| Net expenses after fees waived or expenses reimbursed (excluding interest expense)(g) | | | 1.33 | %(h) | | | 1.30 | %(f)(h) | |
| Net investment income | | | 1.06 | %(h) | | | 0.33 | %(f)(h) | |
| Supplemental data | |
| Net assets, end of period (in thousands) | | $ | 232,777 | | | $ | 3 | | |
| Portfolio turnover | | | 112 | % | | | 92 | % | |
Notes to Financial Highlights
(a) For the period from September 27, 2010 (commencement of operations) to February 28, 2011.
(b) Rounds to less than $0.01.
(c) During the year ended February 29, 2012, the Fund received proceeds from a regulatory settlement. Had the Fund not received these proceeds, the total return would have been lower by 0.19%.
(d) In addition to the fees and expenses which the Fund bears directly, the Fund indirectly bears a pro rata share of the fees and expenses of the acquired funds in which it invests. Such indirect expenses are not included in the reported expense ratios.
(e) Includes interest expense which rounds to less than 0.01%.
(f) Annualized.
(g) The Investment Manager and certain of its affiliates agreed to waive/reimburse certain fees and expenses, if applicable.
(h) The benefits derived from expense reductions had an impact of less than 0.01%.
The Accompanying Notes to Financial Statements are an integral part of this statement.
29
Financial Highlights (continued) – Columbia Multi-Advisor International Equity Fund
| | | Year ended
Feb. 29, 2012(a) | |
| Class Y | |
| Per share data | |
| Net asset value, beginning of period | | $ | 12.55 | | |
| Income from investment operations: | |
| Net investment income | | | 0.18 | | |
| Net realized and unrealized loss | | | (0.86 | ) | |
| Total from investment operations | | | (0.68 | ) | |
| Proceeds from regulatory settlement | | | 0.02 | | |
| Net asset value, end of period | | $ | 11.89 | | |
| Total return | | | (5.26 | %)(b) | |
| Ratios to average net assets(c) | |
| Expenses prior to fees waived or expenses reimbursed (including interest expense) | | | 0.88 | %(d) | |
| Net expenses after fees waived or expenses reimbursed (including interest expense)(e) | | | 0.88 | %(d) | |
| Expenses prior to fees waived or expenses reimbursed (excluding interest expense) | | | 0.88 | %(d) | |
| Net expenses after fees waived or expenses reimbursed (excluding interest expense)(e) | | | 0.88 | %(d) | |
| Net investment income | | | 1.64 | %(d) | |
| Supplemental data | |
| Net assets, end of period (in thousands) | | $ | 12,780 | | |
| Portfolio turnover | | | 112 | % | |
Notes to Financial Highlights
(a) For the period from March 7, 2011 (commencement of operations) to February 29, 2012.
(b) During the year ended February 29, 2012, the Fund received proceeds from a regulatory settlement. Had the Fund not received these proceeds, the total return would have been lower by 0.19%.
(c) In addition to the fees and expenses which the Fund bears directly, the Fund indirectly bears a pro rata share of the fees and expenses of the acquired funds in which it invests. Such indirect expenses are not included in the reported expense ratios.
(d) Annualized.
(e) The Investment Manager and certain of its affiliates agreed to waive/reimburse certain fees and expenses, if applicable.
The Accompanying Notes to Financial Statements are an integral part of this statement.
30
Financial Highlights (continued) – Columbia Multi-Advisor International Equity Fund
| | | Year ended
Feb. 29, | | Year ended Feb. 28, | | Year ended
Feb. 29, | |
| | | 2012 | | 2011 | | 2010 | | 2009 | | 2008 | |
| Class Z | |
| Per share data | |
| Net asset value, beginning of period | | $ | 12.62 | | | $ | 10.81 | | | $ | 7.52 | | | $ | 15.96 | | | $ | 17.29 | | |
| Income from investment operations: | |
| Net investment income | | | 0.18 | | | | 0.18 | | | | 0.17 | | | | 0.29 | | | | 0.32 | | |
| Net realized and unrealized gain (loss) | | | (0.96 | ) | | | 1.87 | | | | 3.55 | | | | (8.43 | ) | | | 0.78 | | |
| Total from investment operations | | | (0.78 | ) | | | 2.05 | | | | 3.72 | | | | (8.14 | ) | | | 1.10 | | |
| Less distributions to shareholders from: | |
| Net investment income | | | — | | | | (0.24 | ) | | | (0.46 | ) | | | (0.11 | ) | | | (0.32 | ) | |
| Net realized gains | | | — | | | | — | | | | — | | | | (0.19 | ) | | | (2.11 | ) | |
| Total distributions to shareholders | | | — | | | | (0.24 | ) | | | (0.46 | ) | | | (0.30 | ) | | | (2.43 | ) | |
| Proceeds from regulatory settlement | | | 0.02 | | | | 0.00 | (a) | | | 0.03 | | | | — | | | | — | | |
| Redemption fees: | |
| Redemption fees added to paid-in-capital | | | — | | | | — | | | | 0.00 | (a) | | | 0.00 | (a) | | | 0.00 | (a) | |
| Net asset value, end of period | | $ | 11.86 | | | $ | 12.62 | | | $ | 10.81 | | | $ | 7.52 | | | $ | 15.96 | | |
| Total return | | | (6.02 | %)(b) | | | 19.08 | % | | | 50.09 | % | | | (51.76 | %) | | | 5.42 | % | |
| Ratios to average net assets(c) | |
Expenses prior to fees waived or expenses reimbursed
(including interest expense) | | | 1.11 | % | | | 1.08 | %(d) | | | 1.01 | %(d) | | | 1.02 | % | | | 0.94 | %(d) | |
Net expenses after fees waived or expenses reimbursed
(including interest expense)(e) | | | 1.08 | %(f) | | | 1.08 | %(d)(f) | | | 1.01 | %(d)(f) | | | 1.02 | %(f) | | | 0.94 | %(d)(f) | |
Expenses prior to fees waived or expenses reimbursed
(excluding interest expense) | | | 1.11 | % | | | 1.08 | % | | | 1.01 | % | | | 1.02 | % | | | 0.94 | % | |
Net expenses after fees waived or expenses reimbursed
(excluding interest expense)(e) | | | 1.08 | %(f) | | | 1.08 | %(f) | | | 1.01 | %(f) | | | 1.02 | %(f) | | | 0.94 | %(f) | |
| Net investment income | | | 1.53 | %(f) | | | 1.58 | %(f) | | | 1.59 | %(f) | | | 2.28 | %(f) | | | 1.79 | %(f) | |
| Supplemental data | |
| Net assets, end of period (in thousands) | | $ | 1,093,867 | | | $ | 1,177,541 | | | $ | 1,375,538 | | | $ | 1,155,598 | | | $ | 2,549,057 | | |
| Portfolio turnover | | | 112 | % | | | 92 | % | | | 127 | % | | | 83 | % | | | 78 | % | |
Notes to Financial Highlights
(a) Rounds to less than $0.01.
(b) During the year ended February 29, 2012, the Fund received proceeds from a regulatory settlement. Had the Fund not received these proceeds, the total return would have been lower by 0.19%.
(c) In addition to the fees and expenses which the Fund bears directly, the Fund indirectly bears a pro rata share of the fees and expenses of the acquired funds in which it invests. Such indirect expenses are not included in the reported expense ratios.
(d) Includes interest expense which rounds to less than 0.01%.
(e) The Investment Manager and certain of its affiliates agreed to waive/reimburse certain fees and expenses, if applicable.
(f) The benefits derived from expense reductions had an impact of less than 0.01%.
The Accompanying Notes to Financial Statements are an integral part of this statement.
31
Notes to Financial Statements – Columbia Multi-Advisor International Equity Fund
February 29, 2012
Note 1. Organization
Columbia Multi-Advisor International Equity Fund (the Fund), a series of Columbia Funds Series Trust (the Trust), is a diversified fund. The Trust is registered under the Investment Company Act of 1940, as amended (the 1940 Act), as an open-end management investment company organized as a Delaware statutory trust.
Fund Shares
The Trust may issue an unlimited number of shares (without par value). The Fund offers Class A, Class B, Class C, Class I, Class R, Class R4, Class W, Class Y and Class Z shares. All share classes have identical voting, dividend and liquidation rights. Each share class has its own expense structure and sales charges, as applicable.
Class A shares are subject to a maximum front-end sales charge of 5.75% based on the initial investment amount. Class A shares purchased without an initial sales charge in accounts aggregating $1 million to $50 million at the time of purchase are subject to a contingent deferred sales charge (CDSC) if the shares are sold within 18 months of purchase, charged as follows: 1.00% CDSC if redeemed within 12 months of purchase, and 0.50% CDSC if redeemed more than 12, but less than 18, months after purchase.
Class B shares may be subject to a maximum CDSC of 5.00% based upon the holding period after purchase. Class B shares will generally convert to Class A shares eight years after purchase. The Fund no longer accepts investments by new or existing investors in the Fund's Class B shares, except in connection with the reinvestment of any dividend and/or capital gain distributions in Class B shares of the Fund and exchanges by existing Class B shareholders of certain other funds within the Columbia Family of Funds.
Class C shares are subject to a 1.00% CDSC on shares redeemed within one year of purchase.
Class I shares are not subject to sales charges and are only available to the Columbia Family of Funds.
Class R shares are not subject to sales charges and are only available to qualifying institutional investors.
The Fund is authorized to issue Class R4 shares, which are not subject to sales charges; however, this share class is closed to new investors. Class R4 shares commenced operations on March 7, 2011.
Class W shares are not subject to sales charges and are only available to investors purchasing through authorized investment programs managed by investment professionals, including discretionary managed account programs.
Class Y shares are not subject to sales charges and are only available to certain categories of investors which are subject to minimum initial investment requirements. Class Y commenced operations on March 7, 2011.
Class Z shares are not subject to sales charges, and are only available to certain investors, as described in the Fund's prospectus.
Note 2. Summary of Significant Accounting Policies
Use of Estimates
The preparation of financial statements in accordance with U.S. generally accepted accounting principles (GAAP) requires management to make certain estimates and assumptions that affect the reported amounts of assets and liabilities, the disclosure of contingent assets and liabilities at the date of the financial statements and the reported amounts of revenue and expenses during the reporting period. Actual results could differ from those estimates.
The following is a summary of significant accounting policies consistently followed by the Fund in the preparation of its financial statements.
Security Valuation
All equity securities are valued at the close of business of the New York Stock Exchange (NYSE). Equity securities are valued at the last quoted sales price on the principal exchange or market on which they trade, except for securities traded on the NASDAQ Stock Market, which are valued at the NASDAQ official close price. Unlisted securities or listed securities for which there were no sales during the day are valued at the mean of the latest quoted bid and asked prices on such exchanges or markets.
Foreign securities are valued based on quotations from the principal market in which such securities are normally traded. If any foreign share prices are not readily available as a result
32
Columbia Multi-Advisor International Equity Fund, February 29, 2012
of limited share activity the securities are valued at the mean of the latest quoted bid and asked prices on such exchanges or markets. Foreign currency exchange rates are generally determined at 4:00 p.m. Eastern (U.S.) time. However, many securities markets and exchanges outside the U.S. close prior to the close of the NYSE; therefore, the closing prices for securities in such markets or on such exchanges may not fully reflect events that occur after such close but before the close of the NYSE. In those situations, foreign securities will be fair valued pursuant to the policy adopted by the Board of Trustees (the Board), including utilizing a third party pricing service to determine these fair values. The third party pricing service takes into account multiple factors, including, but not limited to, movements in the U.S. securities markets, certain depositary receipts, futures contracts and foreign exchange rates that have occurred subsequent to the close of the foreign exchange, to determine a good faith estimate that reasonably reflects the current market conditions as of the close of the NYSE. The fair value of a security is likely to be different from the quoted or published price, if available.
Investments in other open-end investment companies, including money market funds, are valued at net asset value.
Short-term securities purchased within 60 days to maturity are valued at amortized cost, which approximates market value. The value of short-term securities originally purchased with maturities greater than 60 days is determined based on an amortized value to par upon reaching 60 days to maturity. Short-term securities maturing in more than 60 days from the valuation date are valued at the market price or approximate market value based on current interest rates.
Forward foreign currency exchange contracts are marked-to-market based upon foreign currency exchange rates provided by a pricing service.
Futures and options on futures contracts are valued based upon the settlement price established each day by the board of trade or exchange on which they are traded.
Investments for which market quotations are not readily available, or that have quotations which management believes are not reliable, are valued at fair value as determined in good faith under consistently applied procedures established by and under the general supervision of the Board. If a security or class of securities (such as foreign securities) is valued at fair value, such value is likely to be different from the last quoted market price for the security. The determination of fair value often requires significant judgment. To determine fair value, management may use assumptions including but not limited to future cash flows and estimated risk premiums. Multiple inputs from various sources may be used to determine value.
Foreign Currency Transactions and Translation
The values of all assets and liabilities denominated in foreign currencies are translated into U.S. dollars at that day's exchange rates. Net realized and unrealized gains (losses) on foreign currency transactions and translations include gains (losses) arising from the fluctuation in exchange rates between trade and settlement dates on securities transactions, gains (losses) arising from the disposition of foreign currency and currency gains (losses) between the accrual and payment dates on dividends, interest income and foreign withholding taxes.
For financial statement purposes, the Fund does not distinguish that portion of gains (losses) on investments which is due to changes in foreign exchange rates from that which is due to changes in market prices of the investments. Such fluctuations are included with the net realized and unrealized gains (losses) on investments in the Statement of Operations.
Derivative Instruments
The Fund invests in certain derivative instruments as detailed below to meet its investment objectives. Derivatives are instruments whose values depend on, or are derived from, in whole or in part, the value of one or more other assets, such as securities, currencies, commodities or indices. Derivative instruments may be used to maintain cash reserves while maintaining exposure to certain other assets, to offset anticipated declines in values of investments, to facilitate trading, to reduce transaction costs and to pursue higher investment returns. The Fund may also use derivative instruments to mitigate certain investment risks, such as foreign currency exchange rate risk, interest rate risk and credit risk. Derivatives may involve various risks, including the potential inability of the counterparty to fulfill its obligation under the terms of the contract, the potential for an illiquid secondary market and the potential for market movements which may expose the Fund to gains or losses in excess of the amount shown in the Statement of Assets and Liabilities.
33
Columbia Multi-Advisor International Equity Fund, February 29, 2012
The Fund and any counterparty are required to maintain an agreement that requires the Fund and that counterparty to monitor (on a daily basis) the net fair value of all derivatives entered into pursuant to the agreement between the Fund and such counterparty. If the net fair value of such derivatives between the Fund and that counterparty exceeds a certain threshold (as defined in the agreement), the Fund or the counterparty (as the case may be) is required to post cash and/or securities as collateral. Fair values of derivatives presented in the financial statements are not netted with the fair value of other derivatives or with any collateral amounts posted by the Fund or any counterparty.
Forward Foreign Currency Exchange Contracts
Forward foreign currency exchange contracts are agreements between two parties to buy and sell a currency at a set price on a future date. These contracts are intended to be used to minimize the exposure to foreign exchange rate fluctuations during the period between the trade and settlement dates of the contract. The Fund entered into forward foreign currency exchange contracts to facilitate the settlement of purchases and sales of securities and to hedge the currency exposure associated with some or all of the Fund's securities.
The values of forward foreign currency exchange contracts fluctuate with changes in foreign currency exchange rates. The Fund will record a realized gain or loss when the forward foreign currency exchange contract is closed.
The use of forward foreign currency exchange contracts does not eliminate fluctuations in the prices of the Fund's portfolio securities. The risks of forward foreign currency exchange contracts include movement in the values of the foreign currencies relative to the U.S. dollar (or other foreign currencies) and the possibility that counterparties will not complete their contractual obligations, which may be in excess of the amount reflected, if any, in the Statement of Assets and Liabilities.
Futures Contracts
Futures contracts represent commitments for the future purchase or sale of an asset at a specified price on a specified date. The Fund bought and sold futures contracts to maintain appropriate equity market exposure while keeping sufficient cash to accommodate daily redemptions. Upon entering into futures contracts, the Fund bears risks which may include interest rates, exchange rates or securities prices moving unexpectedly, in which case, the Fund may not achieve the anticipated benefits of the futures contracts and may realize a loss. Additional risks include counterparty credit risk, the possibility of an illiquid market, and that a change in the value of the contract or option may not correlate with changes in the value of the underlying asset.
Upon entering into a futures contract, the Fund pledges cash or securities with the broker in an amount sufficient to meet the initial margin requirement. Subsequent payments (variation margin) are made or received by the Fund each day. The variation margin payments are equal to the daily change in the contract value and are recorded as variation margin receivable or payable and are offset in unrealized gains or losses. The Fund recognizes a realized gain or loss when the contract is closed or expires. Futures contracts involve, to varying degrees, risk of loss in excess of the variation margin disclosed in the Statement of Assets and Liabilities.
Effects of Derivative Transactions in the Financial Statements
The following tables are intended to provide additional information about the effect of derivatives on the financial statements of the Fund, including: the fair value of derivatives by risk category and the location of those fair values in the Statement of Assets and Liabilities; the impact of derivative transactions on the Fund's operations over the period including realized gains or losses and unrealized gains or losses. The derivative schedules following the Portfolio of Investments present additional information regarding derivative instruments outstanding at the end of the period, if any.
34
Columbia Multi-Advisor International Equity Fund, February 29, 2012
| Fair Values of Derivative Instruments at February 29, 2012 | |
| | | Asset derivatives | | Liability derivatives | |
| Risk Exposure Category | | Statement of Assets
and Liabilities Location | | Fair Value | | Statement of Assets
and Liabilities Location | | Fair Value | |
Equity contracts
| | Net assets—unrealized
appreciation on futures
contracts | | $ | 85,621 | * | | Net assets—unrealized
depreciation on futures
contracts | | $ | — | * | |
Foreign exchange contracts
| | Unrealized appreciation on
forward foreign currency
exchange contracts | | | 5,107,653 | | | Unrealized depreciation on
forward foreign currency
exchange contracts | | | 10,670,670 | | |
| Total | | | | $ | 5,193,274 | | | | | $ | 10,670,670 | | |
* Includes cumulative appreciation (depreciation) of futures contracts as reported in the Futures Contracts Outstanding table following the Portfolio of Investments. Only the current day's variation margin is reported in receivables or payables in the Statement of Assets and Liabilities.
Effect of Derivative Instruments in the Statement of Operations for the Year Ended February 29, 2012
Amount of Realized Gain (Loss) on Derivatives Recognized in Income
| Risk Exposure Category | | Forward Foreign Currency
Exchange Contracts | | Futures Contracts | | Total | |
| Equity contracts | | $ | — | | | $ | (7 | ) | | $ | (7 | ) | |
| Foreign exchange contracts | | | (3,871,618 | ) | | | — | | | $ | (3,871,618 | ) | |
| Total | | $ | (3,871,618 | ) | | $ | (7 | ) | | $ | (3,871,625 | ) | |
Change in Unrealized Appreciation (Depreciation) on Derivatives Recognized in Income
| Risk Exposure Category | | Forward Foreign Currency
Exchange Contracts | | Futures Contracts | | Total | |
| Equity contracts | | $ | — | | | $ | 85,621 | | | $ | 85,621 | | |
| Foreign exchange contracts | | | (5,562,417 | ) | | | — | | | $ | (5,562,417 | ) | |
| Total | | $ | (5,562,417 | ) | | $ | 85,621 | | | $ | (5,476,796 | ) | |
Volume of Derivative Instruments for the Year Ended February 29, 2012
| | | Contracts
Opened | |
Forward Foreign Currency
Exchange Contracts | | | 6,104 | | |
| Futures Contracts | | | 44 | | |
Repurchase Agreements
The Fund may engage in repurchase agreement transactions with institutions that management has determined are creditworthy. The Fund, through the custodian, receives delivery of the underlying securities collateralizing a repurchase agreement. Management is responsible for determining that the collateral is at least equal, at all times, to the value of the repurchase obligation including interest. A repurchase agreement transaction involves certain risks in the event of default or insolvency of the counterparty. These risks include possible delays in or restrictions on a Fund's ability to dispose of the underlying securities and a possible decline in the value of the underlying securities during the period while the Fund seeks to assert its rights.
35
Columbia Multi-Advisor International Equity Fund, February 29, 2012
Security Transactions
Security transactions are accounted for on the trade date. Cost is determined and gains (losses) are based upon the specific identification method for both financial statement and federal income tax purposes.
Income Recognition
Corporate actions and dividend income are recorded net of any non-reclaimable tax withholdings, on the ex-dividend date or upon receipt of ex-dividend notification in the case of certain foreign securities.
Interest income is recorded on the accrual basis.
Awards from class action litigation are recorded as a reduction of cost basis if the Fund still owns the applicable securities on the payment date. If the Fund no longer owns the applicable securities, the proceeds are recorded as realized gains.
Expenses
General expenses of the Trust are allocated to the Fund and other funds of the Trust based upon relative net assets or other expense allocation methodologies determined by the nature of the expense. Expenses directly attributable to the Fund are charged to the Fund. Expenses directly attributable to a specific class of shares are charged to that share class.
Determination of Class Net Asset Value
All income, expenses (other than class-specific expenses, which are charged to that share class, as shown in the Statement of Operations) and realized and unrealized gains (losses) are allocated to each class of the Fund on a daily basis, based on the relative net assets of each class, for purposes of determining the net asset value of each class.
Federal Income Tax Status
The Fund intends to qualify each year as a regulated investment company under Subchapter M of the Internal Revenue Code, as amended, and will distribute substantially all of its taxable income (including net short-term capital gains), if any, for its tax year, and as such will not be subject to federal income taxes. In addition, the Fund intends to distribute in each calendar year substantially all of its net investment income, capital gains and certain other amounts, if any, such that the Fund should not be subject to federal excise tax. Therefore, no federal income or excise tax provision is recorded.
Foreign Taxes
The Fund may be subject to foreign taxes on income, gains on investments or currency repatriation, a portion of which may be recoverable. The Fund will accrue such taxes and recoveries, as applicable, based upon its current interpretation of tax rules and regulations that exist in the markets in which it invests.
Realized gains in certain countries may be subject to foreign taxes at the Fund level, based on statutory rates. The Fund accrues for such foreign taxes on net realized and unrealized gains at the appropriate rate for each jurisdiction, as applicable.
Distributions to Shareholders
Distributions from net investment income, if any, are declared and paid semi-annually. Net realized capital gains, if any, are distributed along with the income dividend. Income distributions and capital gain distributions are determined in accordance with federal income tax regulations which may differ from GAAP.
Guarantees and Indemnifications
Under the Trust's organizational documents and, in some cases, by contract, its officers and trustees are indemnified against certain liabilities arising out of the performance of their duties to the Trust or its funds. In addition, certain of the Fund's contracts with its service providers contain general indemnification clauses. The Fund's maximum exposure under these arrangements is unknown since the amount of any future claims that may be made against the Fund cannot be determined, and the Fund has no historical basis for predicting the likelihood of any such claims.
Recent Accounting Pronouncement
Fair Value Measurements and Disclosures
In May 2011, the Financial Accounting and Standards Board (FASB) issued ASU No. 2011-04 modifying Topic 820, Fair Value Measurements and Disclosures. At the same time, the International Accounting Standards Board (IASB) issued International Financial Reporting Standard 13, Fair Value Measurement. The objective of the FASB and IASB is convergence of their guidance on fair value measurements and disclosures.
36
Columbia Multi-Advisor International Equity Fund, February 29, 2012
Specifically, ASU No. 2011-04 requires reporting entities to disclose i) the amounts of any transfers between Level 1 and Level 2, and the reasons for the transfers, ii) for Level 3 fair value measurements, a) quantitative information about significant unobservable inputs used, b) a description of the valuation processes used by the reporting entity and c) a narrative description of the sensitivity of the fair value measurement to changes in unobservable inputs if a change in those inputs might result in a significantly higher or lower fair value measurement. The effective date of ASU No. 2011-04 is for interim and annual periods beginning after December 15, 2011. At this time, management is evaluating the implications of this guidance and the impact it will have on the financial statement amounts and footnote disclosures, if any.
Note 3. Fees and Compensation Paid to Affiliates
Investment Management
The Fund is a "multi-manager" fund. Under an Investment Management Services Agreement, Columbia Management Investment Advisers, LLC (the Investment Manager or Columbia), a wholly-owned subsidiary of Ameriprise Financial, Inc. (Ameriprise Financial), is responsible for the ultimate oversight of investments made by the Fund. The primary responsibility for the day-to-day portfolio management of the Fund is provided by the Fund's subadvisers (see Subadvisory Agreement below) and by Columbia, for the portion of the Fund which it manages. Effective April 1, 2011, the management fee is an annual fee that is equal to a percentage of the Fund's average daily net assets that declines from 0.79% to 0.62% as the Fund's net assets increase. Prior to April 1, 2011, the management fee was equal to a percentage of the Fund's average daily net assets that declined from 0.70% to 0.51% as the Fund's net assets increased. The effective management fee rate for the year ended February 29, 2012 was 0.72% of the Fund's average daily net assets.
To the extent that the Fund is not benefitting from a separate contractual expense limitation arrangement, the Investment Manager has contractually agreed to waive a portion of its management fee through June 30, 2012. In the absence of a separate contractual expense limitation arrangement, the management fee waiver for the Fund would be calculated as follows:
| Fund Average Daily Net Assets* | | Management
Fee Waiver | |
| Assets up to $6 billion | | | 0.00 | % | |
Assets in excess of $6 billion
and up to $10 billion | | | 0.05 | | |
| Assets in excess of $10 billion | | | 0.10 | | |
* For purposes of the calculation, "Assets" are aggregate assets of the Fund and other affiliated funds managed by the Investment Manager and sub-advised by Marsico Capital Management, LLC (Marsico).
For the year ended February 29, 2012, no management fees were waived for the Fund.
Subadvisory Agreement
The Investment Manager has entered into Subadvisory Agreements with Marsico Capital Management (MCM Marsico) and Threadneedle International Limited (TI or Threadneedle), each of which subadvises a portion of the assets of the Fund. New investments in the Fund, net of any redemptions, are allocated in accordance with the Investment Manager's determination, subject to the oversight of the Board, of the allocation that is in the best interests of the shareholders. Each subadviser's proportionate share of investments in the Fund will vary due to market fluctuations. The Investment Manager compensates each subadviser to manage the investment of the Fund's assets.
Administration Fees
Under an Administrative Services Agreement, the Investment Manager serves as the Fund Administrator. Effective April 1, 2011, the Fund pays the Fund Administrator an annual fee for administration and accounting services equal to a percentage of the Fund's average daily net assets that declines from 0.08% to 0.05% as the Fund's net assets increase. Prior to April 1, 2011, the administration fee was equal to the annual rate of 0.17% of the Fund's average daily net assets, less the fees that were payable by the Fund as described under the Pricing and Bookkeeping Fees note below. The effective administration fee rate for the year ended February 29, 2012 was 0.08% of the Fund's average daily net assets.
37
Columbia Multi-Advisor International Equity Fund, February 29, 2012
Pricing and Bookkeeping Fees
Prior to March 28, 2011, the Fund had entered into a Financial Reporting Services Agreement (the Financial Reporting Services Agreement) with State Street Bank and Trust Company (State Street) and the Investment Manager pursuant to which State Street provided financial reporting services to the Fund. The Fund also entered into an Accounting Services Agreement (collectively with the Financial Reporting Services Agreement, the State Street Agreements) with State Street and the Investment Manager pursuant to which State Street provided accounting services to the Fund. Under the State Street Agreements, the Fund paid State Street an annual fee of $38,000 paid monthly plus an additional monthly fee based on an annualized percentage rate of average daily net assets of the Fund for the month. The aggregate fee did not exceed $140,000 per year (exclusive of out-of-pocket expenses and charges). The Fund also reimbursed State Street for certain out-of-pocket expenses and charges. Effective March 28, 2011, these services are provided under the Administrative Services Agreement discussed above.
Other Fees
Effective June 1, 2011, other expenses are for, among other things, certain expenses of the Fund or the Board, including: Fund boardroom and office expense, employee compensation, employee health and retirement benefits, and certain other expenses. Payment of these Fund and Board expenses is facilitated by a company providing limited administrative services to the Fund and the Board. For the period June 1, 2011 through February 29, 2012, other expenses paid to this company were $6,748.
Compensation of Board Members
Board members are compensated for their services to the Fund as disclosed in the Statement of Operations. Under a Deferred Compensation Plan (the Plan), the Board members who are not "interested persons" of the Fund, as defined under the 1940 Act, may elect to defer payment of up to 100% of their compensation. Deferred amounts are treated as though equivalent dollar amounts had been invested in shares of certain funds managed by the Investment Manager. The Fund's liability for these amounts is adjusted for market value changes and remains in the Fund until distributed in accordance with the Plan.
Compensation of Chief Compliance Officer
The Board has appointed a Chief Compliance Officer to the Fund in accordance with federal securities regulations. Effective April 1, 2011, the Fund's expenses associated with the Chief Compliance Officer are paid directly by the Investment Manager. Prior to April 1, 2011, the Fund, along with other affiliated funds, paid its pro-rata share of the expenses for the Chief Compliance Officer. Such fees did not exceed $15,000 per year.
Transfer Agent Fees
Under a Transfer and Dividend Disbursing Agent Agreement, Columbia Management Investment Services Corp. (the Transfer Agent), an affiliate of the Investment Manager and a wholly-owned subsidiary of Ameriprise Financial, is responsible for providing transfer agency services to the Fund. The Transfer Agent has contracted with Boston Financial Data Services (BFDS) to serve as sub-transfer agent.
The Transfer Agent receives monthly account-based service fees based on the number of open accounts and is reimbursed by the Fund for the fees and expenses the Transfer Agent pays to financial intermediaries that maintain omnibus accounts with the Fund that is a percentage of the average aggregate value of the Fund's shares maintained in each such omnibus account (other than omnibus accounts for which American Enterprise Investment Services Inc. is the broker of record or accounts where the beneficial shareholder is a customer of Ameriprise Financial Services, Inc., which are paid a per account fee). The Transfer Agent pays the fees of BFDS for services as sub-transfer agent and is not entitled to reimbursement for such fees from the Fund (with the exception of out-of-pocket fees).
The Transfer Agent also receives compensation from fees for various shareholder services and reimbursements for certain out-of-pocket expenses. Class I shares do not pay transfer agent fees. Total transfer agent fees for Class R4 shares are subject to an annual limitation of not more than 0.05% of the average daily net assets attributable to each share class.
38
Columbia Multi-Advisor International Equity Fund, February 29, 2012
For the year ended February 29, 2012, the Fund's effective transfer agent fee rates as a percentage of average daily net assets of each class were as follows:
| Class A | | | 0.24 | % | |
| Class B | | | 0.25 | | |
| Class C | | | 0.24 | | |
| Class R | | | 0.24 | | |
| Class R4 | | | 0.05 | | |
| Class W | | | 0.25 | | |
| Class Y | | | 0.00 | * | |
| Class Z | | | 0.24 | | |
* Rounds to less than 0.01%.
An annual minimum account balance fee of $20 may apply to certain accounts with a value below the Fund's initial minimum investment requirements to reduce the impact of small accounts on transfer agent fees. These minimum account balance fees are recorded as part of expense reductions in the Statement of Operations. For the year ended February 29, 2012, these minimum account balance fees reduced total expenses by $46,193.
Plan Administration Fees
Under a Plan Administration Services Agreement with the Transfer Agent, the Fund pays an annual fee at a rate of 0.25% of the Fund's average daily net assets attributable to Class R4 shares for the provision of various administrative, recordkeeping, communication and educational services.
Distribution and Service Fees
The Fund has an agreement with Columbia Management Investment Distributors, Inc. (the Distributor), an affiliate of the Investment Manager and a wholly-owned subsidiary of Ameriprise Financial, for distribution and shareholder services. Pursuant to Rule 12b-1 under the 1940 Act, the Board has approved, and the Fund has adopted, distribution and shareholder service plans (the Plans) which set the distribution and service fees for the Fund. These fees are calculated daily and are intended to compensate the Distributor and/or eligible selling and/or servicing agents for selling shares of the Fund and providing services to investors.
The Plans require the payment of a monthly combined distribution and service fee to the Distributor at the maximum annual rate of 0.25% of the average daily net assets attributable to Class A shares of the Fund. The Plans also required the payment of a monthly service fee at the maximum annual rate of 0.25% of the average daily net assets attributable to Class B, Class C and Class W shares of the Fund and the payment of a monthly distribution fee at the maximum annual rates of 0.75%, 0.75%, 0.50% and 0.25% of the average daily net assets attributable to Class B, Class C, Class R and Class W shares, respectively.
The Fund may pay a distribution fee of up to 0.25% of the Fund's average daily net assets attributable to Class W shares and a service fee of up to 0.25% of the Fund's average daily net assets attributable to Class W shares, provided, however, that the aggregate fee shall not exceed 0.25% of the Fund's average daily net assets attributable to Class W shares.
Sales Charges
Sales charges, including front-end charges and CDSCs, received by the Distributor for distributing Fund shares were $105,885 for Class A, $7,341 for Class B and $504 for Class C shares for the year ended February 29, 2012.
Expenses Waived/Reimbursed by the Investment Manager and its Affiliates
Effective April 1, 2011, the Investment Manager and certain of its affiliates have contractually agreed to waive fees and/or reimburse expenses (excluding certain fees and expenses described below), through June 30, 2012, unless sooner terminated at the sole discretion of the Board, so that the Fund's net operating expenses, after giving effect to fees waived/expenses reimbursed and any balance credits and/or overdraft charges from the Fund's custodian, do not exceed the following annual rates as a percentage of the class' average daily net assets:
| Class A | | | 1.32 | % | |
| Class B | | | 2.07 | | |
| Class C | | | 2.07 | | |
| Class I | | | 0.94 | | |
| Class R | | | 1.57 | | |
| Class R4 | | | 1.24 | | |
| Class W | | | 1.32 | | |
| Class Y | | | 1.07 | | |
| Class Z | | | 1.07 | | |
39
Columbia Multi-Advisor International Equity Fund, February 29, 2012
Under the agreement, the following fees and expenses are excluded from the waiver/reimbursement commitment, and therefore will be paid by the Fund, if applicable: taxes (including foreign transaction taxes), expenses associated with investments in affiliated and non-affiliated pooled investment vehicles (including mutual funds and exchange traded funds), transaction costs and brokerage commissions, costs related to any securities lending program, dividend expenses associated with securities sold short, inverse floater program fees and expenses, transaction charges and interest on borrowed money, interest, extraordinary expenses and any other expenses the exclusion of which is specifically approved by the Board. This agreement may be modified or amended only with approval from all parties.
Prior to April 1, 2011, the Investment Manager voluntarily agreed to reimburse a portion of the Fund's expenses so that the Fund's ordinary operating expenses (excluding certain expenses, such as brokerage commissions, interest, taxes and extraordinary expenses, but including custodian charges relating to overdrafts, if any), after giving effect to any balance credits from the Fund's custodian, did not exceed the following annual rates as a percentage of the class' average daily net assets:
| Class A | | | 1.60 | % | |
| Class B | | | 2.35 | | |
| Class C | | | 2.35 | | |
| Class I | | | 1.24 | | |
| Class R | | | 1.85 | | |
| Class W | | | 1.60 | | |
| Class Z | | | 1.35 | | |
Note 4. Federal Tax Information
The timing and character of income and capital gain distributions are determined in accordance with income tax regulations, which may differ from GAAP because of temporary or permanent book to tax differences.
For the year ended February 29, 2012, these differences are primarily due to differing treatment for capital loss carryforward limitations related to ownership changes, deferral/reversal of wash sales, passive foreign investment company (PFIC) holdings, deferral/reversal of post-October losses, foreign currency transactions, proceeds from litigation settlements, and recognition of unrealized appreciation (depreciation) for certain derivative investments. To the extent these differences are permanent, reclassifications are made among the components of the Fund's net assets in the Statement of Assets and Liabilities. Temporary differences do not require reclassifications. In the Statement of Assets and Liabilities the following reclassifications were made:
| Undistributed net investment income | | $ | 13,070,219 | | |
| Accumulated net realized loss | | | 324,505,186 | | |
| Paid-in capital | | | (337,575,405 | ) | |
Net investment income and net realized gains (losses), as disclosed in the Statement of Operations, and net assets were not affected by this reclassification.
The tax character of distributions paid during the years indicated was as follows:
| | | Year ended
February 29,
2012 | | Year ended
February 28,
2011 | |
| Ordinary income | | $ | — | | | $ | 26,467,205 | | |
Short-term capital gain distributions, if any, are considered ordinary income distributions for tax purposes.
At February 29, 2012, the components of distributable earnings on a tax basis were as follows:
| Undistributed ordinary income | | $ | 12,682,832 | | |
| Undistributed accumulated long-term gain | | | — | | |
| Accumulated realized gain/loss | | | — | | |
| Unrealized appreciation | | | 178,658,267 | | |
At February 29, 2012, the cost of investments for federal income tax purposes was $1,679,831,024 and the aggregate
40
Columbia Multi-Advisor International Equity Fund, February 29, 2012
gross unrealized appreciation and depreciation based on that cost was:
| Unrealized appreciation | | $ | 213,706,458 | | |
| Unrealized depreciation | | | (33,653,122 | ) | |
| Net unrealized appreciation | | $ | 180,053,336 | | |
The following capital loss carryforward, determined at February 29, 2012, may be available to reduce taxable income arising from future net realized gains on investments, if any, to the extent permitted by the Internal Revenue Code:
| Year of Expiration | | Amount | |
| 2017 | | $ | 432,857,320 | | |
| 2018 | | | 553,108,969 | | |
| Total | | $ | 985,966,289 | | |
On December 22, 2010, the Regulated Investment Company Modernization Act of 2010 (the Act) was enacted, which changed various technical rules governing the tax treatment of regulated investment companies. The changes are generally effective for taxable years beginning after the date of enactment. Under the Act, the Fund will be permitted to carry forward capital losses incurred in taxable years beginning after the date of enactment for an unlimited period. However, any losses incurred during those future taxable years will be required to be utilized prior to the losses incurred in pre-enactment taxable years, which carry an expiration date. As a result of this ordering rule, pre-enactment capital loss carryforwards may be more likely to expire unused.
For the year ended February 29, 2012, capital loss carryforwards of $324,204,292 were permanently lost and $80,631,157 were utilized to offset current year gains.
Under current tax rules, regulated investment companies can elect to treat certain late-year ordinary losses incurred and post-October capital losses (capital losses realized after October 31) as arising on the first day of the following taxable year. As of February 29, 2012, the Fund will elect to treat post-October capital loss of $46,670,782 as arising on March 1, 2012.
Columbia Multi Advisor International Equity Fund acquired capital loss carryforwards in connection with the merger with Columbia International Stock Fund, Columbia International Growth Fund, Threadneedle International Opportunity Fund, and Riversource Disciplined International Equity Fund of $218,058,552, $131,115,041, $107,220,365, and $383,816,845 respectively (Note 12). In addition to the acquired capital loss carryforwards, the Fund also acquired unrealized capital gains as a result of the merger. The yearly utilization of the acquired capital loss carryforwards may be limited by the Internal Revenue Code. Any capital loss carryforwards acquired as part of a merger that are permanently lost due to the provisions under the Internal Revenue Code are included as being expired.
Management of the Fund has concluded that there are no significant uncertain tax positions that would require recognition in the financial statements. However, management's conclusion may be subject to review and adjustment at a later date based on factors including, but not limited to, new tax laws, regulations, and administrative interpretations (including relevant court decisions). Generally, the Fund's federal tax returns for the prior three fiscal years remain subject to examination by the Internal Revenue Service.
Note 5. Portfolio Information
The cost of purchases and proceeds from sales of securities, excluding short-term obligations, aggregated to $2,107,841,345 and $2,523,100,926, respectively, for the year ended February 29, 2012.
Transactions to realign the Fund's portfolio following the merger as described in Note 12 are excluded for purposes of calculating the Fund's portfolio turnover rate. These realignment transactions amounted to cost of purchases and proceeds from sales of $1,078,374,891 and $1,144,467,702, respectively.
Note 6. Regulatory Settlements
During the year ended February 29, 2012, the Fund received $3,493,349 as a result of a settlement of administrative proceedings brought by the Securities and Exchange Commission against an unaffiliated third party relating to market timing and /or late trading of mutual funds. This amount represented the Fund's portion of the proceeds from the settlements (the Fund was not a party to the proceeding). The proceeds received by the Fund were recorded as an increase to additional paid in capital.The payments have been
41
Columbia Multi-Advisor International Equity Fund, February 29, 2012
included in "Proceeds from regulatory settlements" in the Statement of Changes in Net Assets.
During the year ended February 28, 2011 the Fund received payments of $25,379 resulting from certain regulatory settlements with third parties in which the Fund had participated. The payments have been included in "Proceeds from regulatory settlements" in the Statement of Changes in Net Assets.
Note 7. Lending of Portfolio Securities
Effective March 28, 2011, the Fund has entered into a Master Securities Lending Agreement (the Agreement) with JPMorgan Chase Bank, N.A. (JPMorgan). The Agreement, which replaces the previous securities lending arrangement with State Street, authorizes JPMorgan as lending agent to lend securities to authorized borrowers in order to generate additional income on behalf of the Fund. Pursuant to the Agreement, the securities loaned are secured by cash or U.S. government securities equal to at least 100% of the market value of the loaned securities. Any additional collateral required to maintain those levels due to market fluctuations of the loaned securities is requested to be delivered the following business day. Cash collateral received is invested by the lending agent on behalf of the Fund into authorized investments pursuant to the Agreement. The investments made with the cash collateral are listed in the Portfolio of Investments. The values of such investments and any uninvested cash collateral are disclosed in the Statement of Assets and Liabilities along with the related obligation to return the collateral upon the return of the securities loaned.
At February 29, 2012, securities valued at $61,946,678 were on loan, secured by cash collateral of $65,242,251 (which does not reflect calls for collateral made to borrowers by JPMorgan at period end) that is partially or fully invested in short-term securities or other cash equivalents.
Risks of delay in recovery of securities or even loss of rights in the securities may occur should the borrower of the securities fail financially. Risks may also arise to the extent that the value of the securities loaned increases above the value of the collateral received. JPMorgan will indemnify the Fund from losses resulting from a borrower's failure to return a loaned security when due. Such indemnification does not extend to losses associated with declines in the value of cash collateral investments. The Investment Manager is not responsible for any losses incurred by the Fund in connection with the securities lending program. Loans are subject to termination by the Fund or the borrower at any time, and are, therefore, not considered to be illiquid investments.
Pursuant to the Agreement, the Fund receives income for lending its securities either in the form of fees or by earning interest on invested cash collateral, net of negotiated rebates paid to borrowers and fees paid to the lending agent for services provided and any other securities lending expenses. Net income earned from securities lending for the year ended February 29, 2012 is disclosed in the Statement of Operations. The Fund continues to earn and accrue interest and dividends on the securities loaned.
Prior to March 28, 2011, the Fund participated in a securities lending arrangement with State Street. Each security on loan was collateralized in an amount at least equal to the market value of the securities loaned plus accrued income from the investment of collateral. The income generated by the investment of the collateral, net of any fees remitted to State Street as the lending agent and borrower rebates, was paid to the Fund.
Note 8. Custody Credits
Prior to March 28, 2011, the Fund had an agreement with its custodian bank under which custody fees may have been reduced by balance credits. These credits are recorded as part of expense reductions on the Statement of Operations. The Fund could have invested a portion of the assets utilized in connection with the expense offset arrangement in an income-producing asset if they had not entered into such an agreement. Subsequent to this date, the Fund may invest its daily balance in an affiliated money market fund as detailed below. For the period March 1, 2011 through March 27, 2011, there were no custody credits.
Note 9. Affiliated Money Market Fund
Effective March 28, 2011, the Fund may invest its daily cash balances in Columbia Short-Term Cash Fund, an affiliated money market fund established for the exclusive use by the Fund and other affiliated funds. The income earned by the Fund from such investments is included as "Dividends from affiliates" in the Statement of Operations. As an investing fund, the Fund indirectly bears its proportionate share of the expenses of Columbia Short-Term Cash Fund.
42
Columbia Multi-Advisor International Equity Fund, February 29, 2012
Note 10. Shareholder Concentration
At February 29, 2012, two unaffiliated shareholder accounts owned 53.1% of the outstanding shares of the Fund. The Fund has no knowledge about whether any portion of those shares was owned beneficially by such account. Affiliated shareholder accounts owned 12.0% of the outstanding shares of the Fund. Subscription and redemption activity by concentrated accounts may have a significant effect on the operations of the Fund.
Note 11. Line of Credit
The Fund has entered into a revolving credit facility with a syndicate of banks led by JPMorgan Chase Bank, N.A. (the Administrative Agent), whereby the Fund may borrow for the temporary funding of shareholder redemptions or for other temporary or emergency purposes. The credit facility became effective on March 28, 2011, replacing a prior credit facility. The credit facility agreement, as amended, which is a collective agreement between the Fund and certain other funds managed by the Investment Manager, severally and not jointly, permits collective borrowings up to $500 million. Pursuant to a December 13, 2011 amendment to the credit facility agreement, interest is charged to each participating fund based on its borrowings at a rate equal to the higher of (i) the overnight federal funds rate plus 1.00% or (i) the one-month LIBOR rate plus 1.00%. Each borrowing under the credit facility matures no later than 60 days after the date of borrowing. The Fund also pays a commitment fee equal to its pro rata share of the amount of the credit facility at a rate of 0.08% per annum. For the period March 28, 2011 through December 13, 2011, interest was charged to each participating fund based on its borrowings at a rate equal to the sum of the federal funds rate plus (i) 1.25% per annum plus (ii) if one-month LIBOR exceeds the federal funds rate, the amount of such excess. The Fund also paid a commitment fee equal to its pro rata share of the amount of the credit facility at a rate of 0.10% per annum.
Prior to March 28, 2011, the Fund and certain other funds managed by the Investment Manager participated in a $280 million committed, unsecured revolving credit facility provided by State Street. Interest was charged to each fund based on its borrowings at a rate equal to the greater of the (i) federal funds rate plus 1.25% per annum or (ii) the overnight LIBOR rate plus 1.25% per annum. The Fund also paid a commitment fee equal to its pro rata share of the amount of the credit facility at a rate of 0.125% per annum.
Note 12. Fund Merger
At the close of business on April 8, 2011, the Fund acquired the assets and assumed the identified liabilities of RiverSource Disciplined International Equity Fund, Threadneedle International Opportunity Fund, Columbia International Stock Fund and Columbia International Growth Fund (the acquired funds). The reorganization was completed after shareholders approved the plan on February 15, 2011. The purpose of the transaction was to combine certain funds managed by the Investment Manager with comparable investment objectives and strategies.
The aggregate net assets of the Fund immediately before the acquisition were $1,220,172,344 and the combined net assets immediately after the acquisition were $2,509,957,223.
The merger was accomplished by a tax-free exchange of 48,647,948 shares of RiverSource Disciplined International Equity Fund valued at $370,503,572 (including $51,911,561 of unrealized appreciation), 42,719,884 shares of Threadneedle International Opportunity Fund valued at $404,664,438 (including $79,018,855 of unrealized appreciation), 30,636,953 shares of Columbia International Stock Fund valued at $379,467,637 (including $70,789,734 of unrealized appreciation), and 9,357,405 shares of Columbia International Growth Fund valued at $135,149,232 (including $32,859,049 of unrealized appreciation).
In exchange for shares of the acquired funds, the Fund issued the following number of shares:
| | | Shares | |
| Class A | | | 34,476,734 | | |
| Class B | | | 1,930,534 | | |
| Class C | | | 1,792,925 | | |
| Class I | | | 19,889,124 | | |
| Class R | | | 166,754 | | |
| Class R4 | | | 14,235 | | |
| Class W | | | 15,438,672 | | |
| Class Y | | | 1,172,264 | | |
| Class Z | | | 27,157,783 | | |
43
Columbia Multi-Advisor International Equity Fund, February 29, 2012
For financial reporting purposes, net assets received and shares issued by the Fund were recorded at fair value; however, RiverSource Disciplined International Equity Fund, Threadneedle International Opportunity Fund, Columbia International Stock Fund and Columbia International Growth Fund's cost of investments was carried forward.
The financial statements reflect the operations of the Fund for the period prior to the merger and the combined fund for the period subsequent to the merger. Because the combined investment portfolios have been managed as a single integrated portfolio since the merger was completed, it is not practicable to separate the amounts of revenue and earnings of RiverSource Disciplined International Equity Fund, Threadneedle International Opportunity Fund, Columbia International Stock Fund and Columbia International Growth Fund that have been included in the combined Fund's Statement of Operations since the merger was completed.
Assuming the merger had been completed on March 1, 2011 the Fund's pro-forma net investment income, net gain on investments, net change in unrealized depreciation and net decrease in net assets from operations for the six months ended August 31, 2011 would have been approximately $35.1 million, $37.2 million, $(286.6) million and $(214.3) million, respectively.
Note 13. Significant Risks
Foreign Securities Risk
Investing in foreign securities may include certain risks and considerations not typically associated with investing in U.S. securities, such as fluctuating currency values and changing local and regional economic, political and social conditions, which may result in greater market volatility. In addition, certain foreign securities may not be as liquid as U.S. securities. Investing in emerging markets may accentuate these risks.
Investments in emerging market countries are subject to additional risk. The risk of foreign investments is typically increased in less developed countries. These countries are also more likely to experience high levels of inflation, deflation or currency devaluation which could hurt their economies and securities markets.
Note 14. Subsequent Events
Management has evaluated the events and transactions that have occurred through the date the financial statements were issued. Other than as noted below, there were no items requiring adjustment of the financial statements or additional disclosure.
On March 23, 2012, a group of unaffiliated shareholders of the Fund redeemed $239,388,854, which represented approximately 14% of the Fund's net assets as of that date.
Note 15. Information Regarding Pending and Settled Legal Proceedings
In June 2004, an action captioned John E. Gallus et al. v. American Express Financial Corp. and American Express Financial Advisors Inc. was filed in the United States District Court for the District of Arizona. The plaintiffs allege that they are investors in several American Express Company mutual funds (currently branded as Columbia) and they purport to bring the action derivatively on behalf of those funds under the Investment Company Act of 1940. The plaintiffs allege that fees allegedly paid to the defendants by the funds for investment advisory and administrative services are excessive. The plaintiffs seek remedies including restitution and rescission of investment advisory and distribution agreements. The plaintiffs voluntarily agreed to transfer this case to the United States District Court for the District of Minnesota (the District Court). In response to defendants' motion to dismiss the complaint, the District Court dismissed one of plaintiffs' four claims and granted plaintiffs limited discovery. Defendants moved for summary judgment in April 2007. Summary judgment was granted in the defendants' favor on July 9, 2007. The plaintiffs filed a notice of appeal with the Eighth Circuit Court of Appeals (the Eighth Circuit) on August 8, 2007. On April 8, 2009, the Eighth Circuit reversed summary judgment and remanded to the District Court for further proceedings. On August 6, 2009, defendants filed a writ of certiorari with the U.S. Supreme Court (the Supreme Court), asking the Supreme Court to stay the District Court proceedings while the Supreme Court considered and ruled in a case captioned Jones v. Harris Associates, which involved issues of law similar to those presented in the Gallus case. On March 30, 2010, the Supreme Court issued its ruling in Jones v. Harris Associates, and on April 5, 2010, the Supreme Court vacated the Eighth Circuit's decision in the Gallus case and remanded the
44
Columbia Multi-Advisor International Equity Fund, February 29, 2012
case to the Eighth Circuit for further consideration in light of the Supreme Court's decision in Jones v. Harris Associates. On June 4, 2010, the Eighth Circuit remanded the Gallus case to the District Court for further consideration in light of the Supreme Court's decision in Jones v. Harris Associates. On December 9, 2010, the District Court reinstated its July 9, 2007 summary judgment order in favor of the defendants. On January 10, 2011, plaintiffs filed a notice of appeal with the Eighth Circuit. In response to the plaintiffs' opening appellate brief filed on March 18, 2011, the defendants filed a response brief on May 4, 2011 with the Eighth Circuit. The plaintiffs filed a reply brief on May 26, 2011 and oral arguments took place on November 17, 2011. On March 30, 2012, the Eighth Circuit upheld the grant of summary judgement by the District Court in favor of the defendants.
In December 2005, without admitting or denying the allegations, American Express Financial Corporation (AEFC, which is now known as Ameriprise Financial, Inc. (Ameriprise Financial)) entered into settlement agreements with the Securities and Exchange Commission (SEC) and Minnesota Department of Commerce (MDOC) related to market timing activities. As a result, AEFC was censured and ordered to cease and desist from committing or causing any violations of certain provisions of the Investment Advisers Act of 1940, the Investment Company Act of 1940, and various Minnesota laws. AEFC agreed to pay disgorgement of $10 million and civil money penalties of $7 million. AEFC also agreed to retain an independent distribution consultant to assist in developing a plan for distribution of all disgorgement and civil penalties ordered by the SEC in accordance with various undertakings detailed at www.sec.gov/litigation/admin/ia-2451.pdf. Ameriprise Financial and its affiliates have cooperated with the SEC and the MDOC in these legal proceedings, and have made regular reports to the funds' Boards of Trustees.
Ameriprise Financial and certain of its affiliates have historically been involved in a number of legal, arbitration and regulatory proceedings, including routine litigation, class actions, and governmental actions, concerning matters arising in connection with the conduct of their business activities. Ameriprise Financial believes that the Funds are not currently the subject of, and that neither Ameriprise Financial nor any of its affiliates are the subject of, any pending legal, arbitration or regulatory proceedings that are likely to have a material adverse effect on the Funds or the ability of Ameriprise Financial or its affiliates to perform under their contracts with the Funds. Ameriprise Financial is required to make 10-Q, 10-K and, as necessary, 8-K filings with the Securities and Exchange Commission on legal and regulatory matters that relate to Ameriprise Financial and its affiliates. Copies of these filings may be obtained by accessing the SEC website at www.sec.gov.
There can be no assurance that these matters, or the adverse publicity associated with them, will not result in increased fund redemptions, reduced sale of fund shares or other adverse consequences to the Funds. Further, although we believe proceedings are not likely to have a material adverse effect on the Funds or the ability of Ameriprise Financial or its affiliates to perform under their contracts with the Funds, these proceedings are subject to uncertainties and, as such, we are unable to estimate the possible loss or range of loss that may result. An adverse outcome in one or more of these proceedings could result in adverse judgments, settlements, fines, penalties or other relief that could have a material adverse effect on the consolidated financial condition or results of operations of Ameriprise Financial.
45
Report of Independent Registered Public Accounting Firm
To the Trustees of Columbia Funds Series Trust and the Shareholders of Columbia Multi-Advisor International Equity Fund
In our opinion, the accompanying statement of assets and liabilities, including the investment portfolio, and the related statements of operations and of changes in net assets and the financial highlights present fairly, in all material respects, the financial position of Columbia Multi-Advisor International Equity Fund (the "Fund") (a series of Columbia Funds Series Trust) at February 29, 2012, the results of its operations for the year then ended, the changes in its net assets for each of the two years in the period then ended and the financial highlights for each of the periods indicated, in conformity with accounting principles generally accepted in the United States of America. These financial statements and financial highlights (hereafter referred to as "financial statements") are the responsibility of the Fund's management. Our responsibility is to express an opinion on these financial statements based on our audits. We conducted our audits of these financial statements in accordance with the standards of the Public Company Accounting Oversight Board (United States). Those standards require that we plan and perform the audit to obtain reasonable assurance about whether the financial statements are free of material misstatement. An audit includes examining, on a test basis, evidence supporting the amounts and disclosures in the financial statements, assessing the accounting principles used and significant estimates made by management, and evaluating the overall financial statement presentation. We believe that our audits, which included confirmation of securities at February 29, 2012 by correspondence with the custodian, brokers and transfer agent, provide a reasonable basis for our opinion.
PricewaterhouseCoopers LLP
Minneapolis, Minnesota
April 24, 2012
46
Federal Income Tax Information (Unaudited) – Columbia Multi-Advisor International Equity Fund
Foreign taxes paid during the fiscal year ended February 29, 2012, of $5,631,501 are being passed through to shareholders. This represents $0.04 per share. Eligible shareholders may claim this amount as a foreign tax credit.
Gross income derived from sources within foreign countries was $54,838,458 ($0.36 per share) for the fiscal year ended February 29, 2012.
The Fund will notify shareholders in January 2013 of amounts for use in preparing 2012 income tax returns.
47
Fund Governance
Shareholders elect the Board that oversees the funds' operations. The Board appoints officers who are responsible for day-to-day business decisions based on policies set by the Board. The following table provides basic biographical information about the funds' Board members, including their principal occupations during the past five years, although specific titles for individuals may have varied over the period. Under current Board policy, members may serve until the next Board meeting after he or she reaches the mandatory retirement age established by the Board, or the fifteenth anniversary of the first Board meeting they attended as a member of the Board.
On Sept. 29, 2009, Ameriprise Financial, the parent company of Columbia Management, entered into an agreement with Bank of America, N.A. ("Bank of America") to acquire a portion of the asset management business of Columbia Management Group, LLC and certain of its affiliated companies (the "Transaction"). Following the Transaction, which became effective on May 1, 2010, various alignment activities have occurred with respect to the Fund Family. In connection with the Transaction, Mr. Edward J. Boudreau, Jr., Mr. William P. Carmichael, Mr. William A. Hawkins, Mr. R. Glenn Hilliard, Mr. John J. Nagorniak, Ms. Minor M. Shaw and Dr. Anthony M. Santomero, who were members prior to the Transaction of the Legacy Columbia Nations funds' Board ("Nations Funds"), which includes Columbia Funds Series Trust, Columbia Funds Variable Insurance Trust I and Columbia Funds Master Investment Trust, LLC., began service on the Board for the Legacy RiverSource funds ("RiverSource Funds") effective June 1, 2011, which resulted in an overall increase from twelve Trustees to sixteen for all mutual funds overseen by the Board.
Independent Board Members
| Name, Address, Age | | Position Held
with Funds
and Length
of Service | | Principal Occupation During Past Five Years | | Number of
Funds in the
Fund Family
Overseen by
Board Member | | Other Present or
Past Directorships/
Trusteeships
(Within Past 5 Years) | |
| Kathleen Blatz | | | | | | | | | |
|
901 S. Marquette Ave.
Minneapolis, MN 55402
Age 57 | | Board member since 1/06 for RiverSource Funds and since 6/11 for Nations Funds | | Attorney; Chief Justice, Minnesota Supreme Court, 1998-2006 | | | 153 | | | None | |
|
| Edward J. Boudreau, Jr. | | | | | | | | | |
|
225 Franklin Street
Mail Drop
BX32 05228
Boston, MA 02110
Age 67 | | Board member since 6/11 for RiverSource Funds and since 1/05 for Nations Funds | | Managing Director, E.J. Boudreau & Associates (consulting) since 2000 | | | 146 | | | Former Trustee, BofA Funds Series Trust (11 funds) | |
|
| Pamela G. Carlton | | | | | | | | | |
|
901 S. Marquette Ave.
Minneapolis, MN 55402
Age 57 | | Board member since 7/07 for RiverSource Funds and since 6/11 for Nations Funds | | President, Springboard-Partners in Cross Cultural Leadership (consulting company) | | | 153 | | | None | |
|
48
Fund Governance (continued)
Independent Board Members (continued)
| Name, Address, Age | | Position Held
with Funds
and Length
of Service | | Principal Occupation During Past Five Years | | Number of
Funds in the
Fund Family
Overseen by
Board Member | | Other Present or
Past Directorships/
Trusteeships
(Within Past 5 Years) | |
| William P. Carmichael | | | | | | | | | |
|
225 Franklin Street
Mail Drop
BX32 05228
Boston, MA 02110
Age 68 | | Board member since 6/11 for RiverSource Funds and since 1999 for Nations Funds | | Retired | | | 146 | | | Director, Cobra Electronics Corporation (electronic equipment manufacturer); The Finish Line (athletic shoes and apparel); McMoRan Exploration Company (oil and gas exploration and development); Former Trustee, BofA Funds Series Trust (11 funds); former Director, Spectrum Brands, Inc. (consumer products); former Director, Simmons Company (bedding) | |
|
| Patricia M. Flynn | | | | | | | | | |
|
901 S. Marquette Ave.
Minneapolis, MN 55402
Age 61 | | Board member since 11/04 for RiverSource Funds and since 6/11 for Nations Funds | | Trustee Professor of Economics and Management, Bentley University; former Dean, McCallum Graduate School of Business, Bentley University | | | 153 | | | None | |
|
| William A. Hawkins | | | | | | | | | |
|
225 Franklin Street
Mail Drop
BX32 05228
Boston, MA 02110
Age 68 | | Board member since 6/11 for RiverSource Funds and since 1/05 for Nations Funds | | Managing Director, Overton Partners (financial consulting), since August 2010; President and Chief Executive Officer, California General Bank, N.A., January 2008-August 2010 | | | 146 | | | Trustee, BofA Funds Series Trust (11 funds) | |
|
| R. Glenn Hilliard | | | | | | | | | |
|
225 Franklin Street
Mail Drop
BX32 05228
Boston, MA 02110
Age 69 | | Board member since 6/11 for RiverSource Funds and since 1/05 for Nations Funds | | Chairman and Chief Executive Officer, Hilliard Group LLC (investing and consulting), since April 2003; Non-Executive Director & Chairman, CNO Financial Group, Inc. (formerly Conseco, Inc.) (insurance), September 2003-May 2011 | | | 146 | | | Chairman, BofA Fund Series Trust (11 funds); former Director, CNO Financial Group, Inc. (insurance) | |
|
49
Fund Governance (continued)
Independent Board Members (continued)
| Name, Address, Age | | Position Held
with Funds
and Length
of Service | | Principal Occupation During Past Five Years | | Number of
Funds in the
Fund Family
Overseen by
Board Member | | Other Present or
Past Directorships/
Trusteeships
(Within Past 5 Years) | |
| Stephen R. Lewis, Jr. | | | | | | | | | |
|
901 S. Marquette Ave.
Minneapolis, MN 55402
Age 73 | | Chair of the Board for RiverSource Funds since 1/07, Board member for RiverSource Funds since 1/02 and since 6/11 for Nations Funds | | President Emeritus and Professor of Economics Emeritus, Carleton College | | | 153 | | | Valmont Industries, Inc. (manufactures irrigation systems) | |
|
| John F. Maher | | | | | | | | | |
|
901 S. Marquette Ave.
Minneapolis, MN 55402
Age 68 | | Board member since 12/06 for Legacy Seligman funds, since 12/08 for RiverSource Funds and since 6/11 for Nations Funds | | Retired President and Chief Executive Officer and former Director, Great Western Financial Corporation (financial services), 1986-1997 | | | 153 | | | None | |
|
| John J. Nagorniak | | | | | | | | | |
|
225 Franklin Street
Mail Drop
BX32 05228
Boston, MA 02110
Age 67 | | Board member since 6/11 for RiverSource Funds and since 1/08 for Nations Funds | | Retired; President and Director, Foxstone Financial, Inc. (consulting), 2000-2007; Director, Mellon Financial Corporation affiliates (investing), 2000-2007; Chairman, Franklin Portfolio Associates (investing—Mellon affiliate) 1982-2007 | | | 146 | | | Trustee, Research Foundation of CFA Institute; Director, MIT Investment Company; Trustee, MIT 401k Plan; former Trustee, BofA Funds Series Trust (11 funds) | |
|
| Catherine James Paglia | | | | | | | | | |
|
901 S. Marquette Ave.
Minneapolis, MN 55402
Age 59 | | Board member since 11/04 for RiverSource Funds and since 6/11 for Nations Funds | | Director, Enterprise Asset Management, Inc. (private real estate and asset management company) | | | 153 | | | None | |
|
50
Fund Governance (continued)
Independent Board Members (continued)
| Name, Address, Age | | Position Held
with Funds
and Length
of Service | | Principal Occupation During Past Five Years | | Number of
Funds in the
Fund Family
Overseen by
Board Member | | Other Present or
Past Directorships/
Trusteeships
(Within Past 5 Years) | |
| Leroy C. Richie | | | | | | | | | |
|
901 S. Marquette Ave.
Minneapolis, MN 55402
Age 70 | | Board member since 2000 for Legacy Seligman funds, since 11/08 for RiverSource Funds and since 6/11 for Nations Funds | | Counsel, Lewis & Munday, P.C. since 2004; former Vice President and General Counsel, Automotive Legal Affairs, Chrysler Corporation | | | 153 | | | Digital Ally, Inc. (digital imaging); Infinity, Inc. (oil and gas exploration and production); OGE Energy Corp. (energy and energy services) | |
|
| Minor M. Shaw | | | | | | | | | |
|
225 Franklin Street
Mail Drop
BX32 05228
Boston, MA 02110
Age 64 | | Board member since 6/11 for RiverSource Funds and since 2003 for Nations Funds | | President—Micco LLC (private investments) | | | 146 | | | Former Trustee, BofA Funds Series Trust (11 funds); Piedmont Natural Gas; Director, Blue Cross Blue Shield of South Carolina | |
|
| Alison Taunton-Rigby | | | | | | | | | |
|
901 S. Marquette Ave
Minneapolis, MN 55402
Age 67 | | Board member since 11/02 for RiverSource Funds and since 6/11 for Nations Funds | | Chief Executive Officer and Director, RiboNovix, Inc. 2003-2010 (biotechnology); former President, Aquila Biopharmaceuticals | | | 153 | | | Director, Healthways, Inc. (health management programs); Director, ICI Mutual Insurance Company RRG; Director, Abt Associates (government contractor) | |
|
51
Fund Governance (continued)
Interested Board Member Not Affiliated with Investment Manager*
| Name, Address, Age | | Position Held
with Funds
and Length
of Service | | Principal Occupation During Past Five Years | | Number of
Funds in the
Fund Family
Overseen by
Board Member | | Other Present or
Past Directorships/
Trusteeships
(Within Past 5 Years) | |
| Anthony M. Santomero* | | | | | | | | | |
|
225 Franklin Street
Mail Drop
BX32 05228
Boston, MA 02110
Age 65 | | Board member since 6/11 for RiverSource Funds and since 1/08 for Nations Funds | | Richard K. Mellon Professor Emeritus of Finance, The Wharton School, University of Pennsylvania, since 2002; Senior Advisor, McKinsey & Company (consulting), 2006-2008; President and Chief Executive Officer, Federal Reserve Bank of Philadelphia, 2000-2006 | | | 146 | | | Director, Renaissance Reinsurance Ltd.; Trustee, Penn Mutual Life Insurance Company; Director, Citigroup; Director, Citibank, N.A.; former Trustee, BofA Funds Series Trust (11 funds) | |
|
* Dr. Santomero is not an affiliated person of the investment manager or Ameriprise Financial. However, he is currently deemed by the funds to be an "interested person" (as defined in the 1940 Act) of the funds because he serves as a Director of Citigroup, Inc. and Citibank N.A., companies that may directly or through subsidiaries and affiliates engage from time-to-time in brokerage execution, principal transactions and lending relationships with the funds or accounts advised/managed by the investment manager.
Interested Board Member Affiliated with Investment Manager*
| William F. Truscott | | | | | | | | | |
|
53600 Ameriprise Financial Center
Minneapolis, MN 55474
Age 51 | | Board member since 11/01 for RiverSource Funds and since 6/11 for Nations Funds; Senior Vice President since 2002 | | Chairman of the Board and President, Columbia Management Investment Advisers, LLC since May 2010 and February 2012, respectively (previously President, Chairman of the Board and Chief Investment Officer, 2001-April 2010); Chief Executive Officer, U.S. Asset Management & President, Annuities, Ameriprise Financial, Inc. since May 2010 (previously President—U.S. Asset Management and Chief Investment Officer, 2005-April 2010); Director, President and Chief Executive Officer, Ameriprise Certificate Company since 2006; Director and Chief Executive Officer, Columbia Management Investment Distributors, Inc. since May 2010 and February 2012, respectively (previously Chairman of the Board and Chief Executive Officer, 2006-April 2010). | | | 153 | | | None | |
|
* Interested person (as defined under the 1940 Act) by reason of being an officer, director, security holder and/or employee of the investment manager or Ameriprise Financial.
The SAI has additional information about the Fund's Board members and is available, without charge, upon request by calling 800.345.6611; contacting your financial intermediary; or visiting columbiamanagement.com.
52
Fund Governance (continued)
Officers
| Name, Year of Birth and Address | | Principal Occupation(s) During the Past Five Years | |
| J. Kevin Connaughton (Born 1964) | |
|
225 Franklin Street
Boston, MA 02110
President (since 2009) | | Senior Vice President and General Manager—Mutual Fund Products, Columbia Management Investment Advisers, LLC since May 2010; President, Columbia Funds, since 2009, and RiverSource Funds, since May 2010 (previously Senior Vice President and Chief Financial Officer, Columbia Funds, from June 2008 to January 2009, Treasurer, Columbia Funds, from October 2003 to May 2008, and senior officer of various other affiliated funds since 2000); Managing Director, Columbia Management Advisors, LLC from December 2004 to April 2010. | |
|
| Michael G. Clarke (Born 1969) | |
|
225 Franklin Street
Boston, MA 02110
Treasurer (since 2011) and Chief Financial Officer (since 2009) | | Vice President, Columbia Management Investment Advisers, LLC since May 2010; Managing Director of Fund Administration, Columbia Management Advisors, LLC, from September 2004 to April 2010; senior officer of Columbia Funds and affiliated funds since 2002. | |
|
| Scott R. Plummer (Born 1959) | |
|
5228 Ameriprise Financial Center
Minneapolis, MN 55474
Senior Vice President and Chief Legal Officer (since 2010) | | Chief Legal Officer and Assistant Secretary, Columbia Management Investment Advisers, LLC since June 2005; Vice President and Lead Chief Counsel—Asset Management, Ameriprise Financial, Inc. since May 2010 (previously Vice President and Chief Counsel—Asset Management, from 2005 to April 2010; Vice President, Chief Counsel and Assistant Secretary, Columbia Management Investment Distributors, Inc. since 2008; Vice President, General Counsel and Secretary, Ameriprise Certificate Company since 2005; Chief Counsel, RiverSource Distributors, Inc. since 2006; Senior officer of Columbia Funds and affiliated funds, since 2006. | |
|
| Thomas P. McGuire (Born 1971) | |
|
225 Franklin Street
Boston, MA 02110
Interim Chief Compliance Officer (since 2012) | | Vice President—Asset Management Compliance, Columbia Management Investment Advisers, LLC since March 2010; Chief Compliance Officer, Ameriprise Certificate Company, since September 2010; Compliance Executive Bank of America, from June 2005 to April 2010. | |
|
| William F. Truscott (Born 1960) | |
|
53600 Ameriprise Financial Center
Minneapolis, MN 55474
Senior Vice President (since 2010) | | Chairman of the Board and President, Columbia Management Investment Advisers, LLC since May 2010 and February 2012, respectively (previously President, Chairman of the Board and Chief Investment Officer, from 2001 to April 2010); Chief Executive Officer, U.S. Asset Management & President, Annuities, Ameriprise Financial, Inc. since May 2010 (previously President—U.S. Asset Management and Chief Investment Officer from 2005 to April 2010, and Senior Vice President—Chief Investment Officer, from 2001 to 2005); Director, President and Chief Executive Officer, Ameriprise Certificate Company since 2006; Director and Chief Executive Officer, Columbia Management Investment Distributors, Inc. since May 2010 and February 2012, respectively (previously Chairman of the Board and Chief Executive Officer from 2008 to April 2010); Chairman of the Board and Chief Executive Officer, RiverSource Distributors, Inc. since 2006. | |
|
53
Fund Governance (continued)
Officers (continued)
| Name, Year of Birth and Address | | Principal Occupation(s) During the Past Five Years | |
| Colin Moore (Born 1958) | |
|
225 Franklin Street
Boston, MA 02110
Senior Vice President (since 2010) | | Director and Chief Investment Officer, Columbia Management Investment Advisers, LLC since May 2010; Manager, Managing Director and Chief Investment Officer of Columbia Management Advisors, LLC from 2007 to April 2010; Head of Equities, Columbia Management Advisors, LLC from 2002 to 2007. | |
|
| Christopher O. Petersen (Born 1970) | |
|
5228 Ameriprise Financial Center
Minneapolis, MN 55474
Vice President and Secretary (since 2011) | | Vice President and Chief Counsel, Ameriprise Financial since January 2010 (formerly Vice President and Group Counsel or Counsel from April 2004 to January 2010); Senior officer of Columbia Funds and affiliated funds, since 2007. | |
|
| Amy Johnson (Born 1965) | |
|
5228 Ameriprise Financial Center
Minneapolis, MN 55474
Vice President (since 2010) | | Senior Vice President and Chief Operating Officer, Columbia Management Investment Advisers, LLC since May 2010 (previously Chief Administrative Officer, from 2009 until April 2010, Vice President—Asset Management and Trust Company Services, from 2006 to 2009, and Vice President—Operations and Compliance from 2004 to 2006). | |
|
| Joseph F. DiMaria (Born 1968) | |
|
225 Franklin Street
Boston, MA 02110
Vice President (since 2011) and Chief Accounting Officer (since 2008) | | Vice President, Mutual Fund Administration, Columbia Management Investment Advisers, LLC, since May 2010; Director of Fund Administration, Columbia Management Advisors, LLC from January 2006 to April 2010; Head of Tax/Compliance and Assistant Treasurer, Columbia Management Advisors, LLC, from November 2004 to December 2005. | |
|
| Paul B. Goucher (Born 1968) | |
|
5228 Ameriprise Financial Center
Minneapolis, MN 55474
Vice President and Assistant Treasurer (since 2010) | | Vice President and Chief Counsel of Ameriprise Financial since January 2010 (formerly Vice President and Group Counsel from November 2008 to January 2010); Director, Managing Director and General Counsel of J. & W. Seligman & Co. Incorporated (Seligman) from July 2008 to November 2008 and Managing Director and Associate General Counsel of Seligman from January 2005 to July 2008. | |
|
| Michael E. DeFao (Born 1968) | |
|
5228 Ameriprise Financial Center
Minneapolis, MN 55474
Vice President and Assistant Treasurer (since 2011) | | Vice President and Chief Counsel, Ameriprise Financial since May 2010; Associate General Counsel Bank of America from June 2005 to April 2010 | |
|
| Stephen T. Welsh (Born 1957) | |
|
225 Franklin Street
Boston, MA 02110
Vice President (since 2006) | | President and Director, Columbia Management Investment Services Corp. since May 2010; President and Director, Columbia Management Services, Inc. from July 2004 to April 2010; Managing Director, Columbia Management Distributors, Inc. from August 2007 to April 2010. | |
|
54
This page intentionally left blank.
55
This page intentionally left blank.
56
Important Information About This Report
The fund mails one shareholder report to each shareholder address. If you would like more than one report, please call shareholder services at 1-800-345-6611 and additional reports will be sent to you. This report has been prepared for shareholders of Columbia Multi-Advisor International Equity Fund.
A description of the policies and procedures that the fund uses to determine how to vote proxies and a copy of the fund's voting records are available (i) at www.columbiamanagement.com, (ii) on the Securities and Exchange Commission's website at www.sec.gov, and (iii) without charge, upon request, by calling 1-800-368-0346. Information regarding how the fund voted proxies relating to portfolio securities during the 12-month period ended June 30 is available from the SEC's website. Information regarding how the fund voted proxies relating to portfolio securities is also available from the fund's website, www.columbiamanagement.com.
The fund files a complete schedule of portfolio holdings with the SEC for the first and third quarters of each fiscal year on Form N-Q. The fund's Form N-Q is available on the SEC's website at www.sec.gov and may be reviewed and copied at the SEC's Public Reference Room in Washington, D.C. Information on the operation of the Public Reference Room may be obtained by calling 1-800-SEC-0330.
Transfer Agent
Columbia Management Investment
Services Corp.
P.O. Box 8081
Boston, MA 02266-8081
1-800-345-6611
Distributor
Columbia Management Investment
Distributors, Inc.
225 Franklin Street
Boston, MA 02110
Investment Manager
Columbia Management Investment Advisers, LLC
225 Franklin Street
Boston, MA 02110
57

Columbia Multi-Advisor International Equity Fund
P. O. Box 8081
Boston, MA 02266-8081
columbiamanagement.com
This information is for use with concurrent or prior delivery of a fund prospectus. Investors should consider the investment objectives, risks, charges and expenses of a mutual fund carefully before investing. For a free prospectus, which contains this and other important information about the funds, visit columbiamanagement.com. Read the prospectus carefully before investing. The Fund is distributed by Columbia Management Investment Distributors, Inc., member FINRA, and managed by Columbia Management Investment Advisers, LLC.
© 2012 Columbia Management Investment Advisers, LLC. All rights reserved.
C-1671 C (4/12)

Columbia Small Cap Growth Fund II
Annual Report for the Period Ended February 29, 2012
Not FDIC insured • No bank guarantee • May lose value
Table of Contents
| Fund Profile | | | 1 | | |
|
| Performance Information | | | 2 | | |
|
| Understanding Your Expenses | | | 3 | | |
|
| Portfolio Managers' Report | | | 4 | | |
|
| Portfolio of Investments | | | 6 | | |
|
Statement of Assets and
Liabilities | | | 11 | | |
|
| Statement of Operations | | | 13 | | |
|
Statement of Changes in
Net Assets | | | 14 | | |
|
| Financial Highlights | | | 16 | | |
|
| Notes to Financial Statements | | | 21 | | |
|
Report of Independent Registered
Public Accounting Firm | | | 31 | | |
|
| Fund Governance | | | 32 | | |
|
Important Information About
This Report | | | 41 | | |
|
The views expressed in this report reflect the current views of the respective parties. These views are not guarantees of future performance and involve certain risks, uncertainties and assumptions that are difficult to predict, so actual outcomes and results may differ significantly from the views expressed. These views are subject to change at any time based upon economic, market or other conditions and the respective parties disclaim any responsibility to update such views. These views may not be relied on as investment advice and, because investment decisions for a Columbia Fund are based on numerous factors, may not be relied on as an indication of trading intent on behalf of any particular Columbia Fund. References to specific securities should not be construed as a recommendation or investment advice.
President's Message

Dear Shareholders,
Americans were dispirited in the fourth quarter of 2011 by Washington's inability to reach a plan for deficit reduction and Europe's piecemeal attempt to address its own fiscal issues. Yet, there was sufficient good news to encourage risk taking, buoying both stocks and bonds to solid gains.
U.S. economic data surprised on the upside and fears of recession abated. With the bar of expectations set low, investors responded positively to the announcement that the economy had expanded by 1.8% in the third quarter. Consumer confidence improved, even though consumers remain under pressure with no real increase in disposable income and a continued decline in household net worth. Headline inflation—which tracks a broad range of consumer expenditures, including food and energy—declined. Even manufacturing held its ground.
Against this backdrop, the U.S. equity markets logged solid returns. The S&P 500 Index gained 11.82%, moving into positive territory for the year with quarterly advances in all ten sectors. Mid- and small-cap stocks did even better. Value outperformed growth across all market capitalizations. Energy stocks led the market, as the price of oil moved above $100 a barrel in December. Industrials and materials stocks rose, buoyed by improving economic data. The U.S. fixed-income markets logged modest but solid returns. High-yield bonds were the best performers as the economy showed signs of improvement. Emerging market bonds were strong performers, as inflation came under control in key regions. Municipal bonds and Treasuries eked out only modest gains, as investors moved away from quality in favor of riskier assets.
While fourth quarter gains were encouraging, challenges still remain. Columbia Management, however, remains strong and steadfast. Columbia Management is the eighth largest manager of long-term mutual fund assets with $326 billion under management as of December 31, 2011. The past year has been one of considerable change for the organization as we worked diligently to align products, services and resources in the integration of Columbia Management with RiverSource Investments. The strong line-up of talent, resources and capabilities that has resulted is highlighted by the success of our products. As of December 31, 2011, Columbia Management offers 52 funds rated either 4 or 5 stars by Morningstar.*
For more information about these and other funds offered by Columbia Management, including detailed, up-to-date fund performance and portfolio information, please visit us online at columbiamanagement.com. Other information and resources available on our website include:
g timely economic analysis and market commentary
g quarterly fund commentaries
g Columbia Management Investor, a quarterly newsletter for shareholders
Thank you for your continued support of the Columbia Funds. We look forward to serving your investment needs for many years to come.
Best Regards,

J. Kevin Connaughton
President, Columbia Funds
*All ratings are based on Class Z shares as of 12/31/2011. Out of 119 Class Z share Columbia funds rated by Morningstar, 7 funds received a 5-star Overall Rating and 45 funds received a 4-star Overall Rating. The Overall Morningstar Rating for a retail mutual fund is derived from a weighted average of the performance figures associated with its 3-, 5- and 10-year (if applicable) Morningstar Rating metrics. For share classes that do not have a 3-, 5-, or 10-year actual performance history, the fund's independent Morningstar Rating metric is then compared against the retail mutual fund universe breakpoints to determine its hypothetical rating.
For each fund with at least a three-year history, Morningstar calculates a Morningstar RatingTM based on a Morningstar Risk-Adjusted Return measure that accounts for variation in a fund's monthly performance (including the effects of sales charges/loads, and redemption fees), placing more emphasis on downward variations and rewarding consistent performance. The top 10% of funds in each category receive 5 stars, the next 22.5% receive 4 stars, the next 35% receive 3 stars, the next 22.5% receive 2 stars and the bottom 10% receive 1 star. (Each share class is counted as a fraction of one fund within this scale and rated separately, which may cause slight variations in the distribution percentages.)
The Morningstar RatingTM is for Class Z shares only; other classes may have different performance characteristics and may have different ratings. © 2012 Morningstar, Inc. All Rights Reserved. The Morningstar information contained herein: (1) is proprietary to Morningstar and/or its content providers; (2) may not be copied or distributed; and (3) is not warranted to be accurate, complete or timely. Neither Morningstar nor its content providers are responsible for any damages or losses arising from any use of this information.
Investors should consider the investment objectives, risks, charges and expenses of a mutual fund carefully before investing. For a free prospectus, which contains this and other important information about the funds, visit columbiamanagement.com. The prospectus should be read carefully before investing.
Columbia Funds are distributed by Columbia Management Investment Distributors, Inc., member FINRA, and managed by Columbia Management Investment Advisers, LLC.
© 2012 Columbia Management Investment Advisers, LLC. All rights reserved.
Fund Profile – Columbia Small Cap Growth Fund II
Summary
g For the 12-month period that ended February 29, 2012, the fund's Class A shares returned –0.41% without sales charge.
g The fund lagged its benchmark, the Russell 2000 Growth Index.1
g Stock selection, especially in the financials and technology sectors, hampered performance relative to the index.
Portfolio Management
Wayne M. Collette has co-managed the fund since 2010. From 2001 until joining Columbia Management Investment Advisers, LLC (the Investment Manager) in May 2010, Mr. Collette was associated with the fund's previous investment adviser as an investment professional.
George J. Myers has co-managed the fund since 2010. From 2004 until joining the Investment Manager in May 2010, Mr. Myers was associated with the fund's previous investment adviser as an investment professional.
Lawrence W. Lin has co-managed the fund since 2010. From 2006 until joining the Investment Manager in May 2010, Mr. Lin was associated with the fund's previous investment adviser as an investment professional.
Brian D. Neigut has co-managed the fund since 2010. From 2007 until joining the Investment Manager in May 2010, Mr. Neigut was associated with the fund's previous investment adviser as an investment professional.
1The Russell 2000 Growth Index measures the performance of those Russell 2000 Index companies with higher price-to-book ratios and higher forecasted growth values.
Indices are not available for investment, are not professionally managed and do not reflect sales charges, fees, brokerage commissions, taxes or other expenses of investing. Securities in the fund may not match those in an index.
Performance data quoted represents past performance and current performance may be lower or higher. Past performance is no guarantee of future results. The investment return and principal value will fluctuate so that shares, when redeemed, may be worth more or less than the original cost. Please visit www.columbiamanagement.com for daily and most recent month-end performance updates.
Summary
1-year return as of 02/29/12
| | –0.41% | |
|
|  | | | Class A shares
(without sales charge) | |
|
| | | | +2.38% | |
|
|  | | | Russell 2000 Growth
Index | |
|
Morningstar Style BoxTM
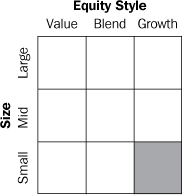
The Morningstar Style BoxTM is based on the fund's portfolio holdings. For equity funds, the vertical axis shows the market capitalization of the stocks owned, and the horizontal axis shows investment style (value, blend, or growth). Information shown is based on the most recent data provided by Morningstar.
© 2012 Morningstar, Inc. All rights reserved. The Morningstar information contained herein: (1) is proprietary to Morningstar and/or its content providers; (2) may not be copied or distributed; and (3) is not warranted to be accurate, complete or timely. Neither Morningstar nor its content providers are responsible for any damages or losses arising from any use of this information.
1
Performance Information – Columbia Small Cap Growth Fund II
Performance data quoted represents past performance and current performance may be lower or higher. Past performance is no guarantee of future results. The investment return and principal value will fluctuate so that shares, when redeemed, may be worth more or less than the original cost. Please visit www.columbiamanagement.com for daily and most recent month-end performance updates.
Performance of a $10,000 investment 03/01/02 – 02/29/12
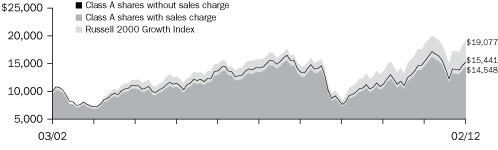
The chart above shows the change in value of a hypothetical $10,000 investment in Class A shares of Columbia Small Cap Growth Fund II during the stated time period, and does not reflect the deduction of taxes that a shareholder may pay on fund distributions or on the redemption of fund shares.
Performance of a $10,000 investment 03/01/02 – 02/29/12 ($)
| Sales charge | | without | | with | |
| Class A | | | 15,441 | | | | 14,548 | | |
| Class B | | | 14,308 | | | | 14,308 | | |
| Class C | | | 14,308 | | | | 14,308 | | |
| Class I* | | | 15,463 | | | | n/a | | |
| Class Z | | | 15,818 | | | | n/a | | |
Average annual total return as of 02/29/12 (%)
| Share class | | A | | B | | C | | I* | | Z | |
| Inception | | 12/12/95 | | 12/12/95 | | 09/22/97 | | 11/16/11 | | 12/12/95 | |
Sales
charge | | without | | with | | without | | with | | without | | with | | without | | without | |
| 1-year | | | –0.41 | | | | –6.12 | | | | –1.22 | | | | –6.16 | | | | –1.19 | | | | –2.18 | | | | –0.27 | | | | –0.23 | | |
| 5-year | | | 1.61 | | | | 0.41 | | | | 0.83 | | | | 0.50 | | | | 0.83 | | | | 0.83 | | | | 1.63 | | | | 1.84 | | |
| 10-year | | | 4.44 | | | | 3.82 | | | | 3.65 | | | | 3.65 | | | | 3.65 | | | | 3.65 | | | | 4.45 | | | | 4.69 | | |
The "with sales charge" returns include the maximum initial sales charge of 5.75% for Class A, the applicable contingent deferred sales charge of 5.00% in the first year, declining to 1.00% in the sixth year and eliminated thereafter for Class B shares and 1.00% for Class C shares for the first year only. The "without sales charge" returns do not include the effect of sales charges. If they had, returns would be lower.
Performance results reflect any fee waivers or reimbursements of fund expenses by Columbia Management Investment Advisers, LLC and/or any of its affiliates. Absent these fee waivers or expense reimbursement arrangements, performance results would have been lower.
All results shown assume reinvestment of distributions. Class I and Class Z shares are sold at net asset value with no distribution and service (Rule 12b-1) fees. Class I and Class Z shares have limited eligibility and the investment minimum requirements may vary. Please see the fund's prospectuses for details. Performance for different share classes will vary based on differences in sales charges and fees associated with each class.
The tables do not reflect the deduction of taxes that a shareholder may pay on fund distributions or on the redemption of fund shares.
*The returns shown for periods prior to the share class inception date (including returns since inception, which are since fund inception) include the returns of the fund's oldest share class. These returns are adjusted to reflect any higher class-related operating expenses of the newer share classes, as applicable. Please visit columbiamanagement.com/mutual-funds/appended-performance for more information.
2
Understanding Your Expenses – Columbia Small Cap Growth Fund II
As an investor, you incur two types of costs. There are transaction costs, which generally include sales charges on purchases and may include redemption fees. There are also ongoing costs, which generally include management fees, distribution and service (Rule 12b-1) fees, and other fund expenses. The following information is intended to help you understand your ongoing costs (in dollars) of investing in the Fund and to help you compare these costs with the ongoing costs of investing in other mutual funds.
Analyzing your fund's expenses
To illustrate these ongoing costs, we have provided examples and calculated the expenses paid by investors in each share class of the Fund during the period. The actual and hypothetical information in the table is based on an initial investment of $1,000 at the beginning of the period indicated and held for the entire period. Expense information is calculated two ways and each method provides you with different information. The amount listed in the "Actual" column is calculated using the Fund's actual operating expenses and total return for the period. You may use the Actual information, together with the amount invested, to estimate the expenses that you paid over the period. Simply divide your account value by $1,000 (for example, an $8,600 account value divided by $1,000 = 8.6), then multiply the results by the expenses paid during the period under the Actual column. The amount listed in the "Hypothetical" column assumes a 5% annual rate of return before expenses (which is not the Fund's actual return) and then applies the Fund's actual expense ratio for the period to the hypothetical return. You should not use the hypothetical account values and expenses to estimate either your actual account balance at the end of the period or the expenses you paid during the period. See "Compare with other funds" below for details on how to use the hypothetical data.
Compare with other funds
Since all mutual funds are required to include the same hypothetical calculations about expenses in shareholder reports, you can use this information to compare the ongoing cost of investing in the Fund with other funds. To do so, compare the hypothetical example with the 5% hypothetical examples that appear in the shareholder reports of other funds. As you compare hypothetical examples of other funds, it is important to note that hypothetical examples are meant to highlight the ongoing costs of investing in a fund only and do not reflect any transaction costs, such as sales charges, or redemption or exchange fees. Therefore, the hypothetical calculations are useful in comparing ongoing costs only, and will not help you determine the relative total costs of owning different funds. If transaction costs were included in these calculations, your costs would be higher.
September 1, 2011 – February 29, 2012
| | | Account value at the
beginning of the period ($) | | Account value at the
end of the period ($) | | Expenses paid
during the period ($) | | Fund's annualized
expense ratio (%) | |
| | | Actual | | Hypothetical | | Actual | | Hypothetical | | Actual | | Hypothetical | | Actual | |
| Class A | | | 1,000.00 | | | | 1,000.00 | | | | 1,098.80 | | | | 1,018.10 | | | | 7.10 | | | | 6.82 | | | | 1.36 | | |
| Class B | | | 1,000.00 | | | | 1,000.00 | | | | 1,093.80 | | | | 1,014.37 | | | | 10.98 | | | | 10.57 | | | | 2.11 | | |
| Class C | | | 1,000.00 | | | | 1,000.00 | | | | 1,094.60 | | | | 1,014.37 | | | | 10.99 | | | | 10.57 | | | | 2.11 | | |
| Class I | | | 1,000.00 | | | | 1,000.00 | | | | 1,100.40 | * | | | 1,020.34 | | | | 2.73 | * | | | 4.57 | | | | 0.91 | | |
| Class Z | | | 1,000.00 | | | | 1,000.00 | | | | 1,099.10 | | | | 1,019.34 | | | | 5.79 | | | | 5.57 | | | | 1.11 | | |
*For the period November 16, 2011 through Februay 29, 2012. Class I shares commenced operations on November 16, 2011.
Expenses paid during the period are equal to the annualized expense ratio for each class as indicated above, multiplied by the average account value over the period and then multiplied by the number of days in the Fund's most recent fiscal half year and divided by 366.
Expenses do not include fees and expenses incurred indirectly by the Fund from the underlying funds in which the Fund may invest (also referred to as "acquired funds"), including affiliated and non-affiliated pooled investments vehicles (including mutual funds and exchange traded funds).
Had Columbia Management Investment Advisers, LLC and/or certain of its affiliates not waived/reimbursed certain fees and expenses, account value at the end of the period would have been reduced.
3
Portfolio Managers' Report – Columbia Small Cap Growth Fund II
Performance data quoted represents past performance and current performance may be lower or higher. Past performance is no guarantee of future results. The investment return and principal value will fluctuate so that shares, when redeemed, may be worth more or less than the original cost. Please visit www.columbiamanagement.com for daily and most recent month-end performance updates.
Net asset value per share
as of 02/29/12 ($)
| Class A | | | 12.12 | | |
| Class B | | | 10.50 | | |
| Class C | | | 10.76 | | |
| Class I | | | 12.76 | | |
| Class Z | | | 12.75 | | |
For the 12-month period that ended February 29, 2012, the fund's Class A shares returned –0.41% without sales charge. The Russell 2000 Growth Index returned 2.38%. Stock selection within financials had the biggest negative impact on relative performance, followed by security selection in the technology and materials sectors. The fund's sector weights remained close to those in the Russell index.
Year of extreme market volatility
The past year was a challenge for managers who focus on stock selection, as macro events rather than company-specific metrics drove market returns. Stocks got off to a strong start last spring, but were soon shaken by unrest in the Middle East as well as by the reverberations of an earthquake and tsunami disaster in Japan. Heading into the summer, Europe's sovereign debt problems began to accelerate and global economic growth slowed, pressuring returns. Congress's wrangling about the U.S. federal budget deficit and Standard & Poor's historic downgrade of the country's credit rating further unsettled the market, leading to a steep decline in the third quarter of 2011.
Economically-sensitive sectors and small-cap stocks were among the hardest hit during this period. In October, the stock market began a turnaround, buoyed by signs of improving U.S. economic growth and progress in Europe. Stocks continued to climb into the new year, as substantial new job creation, declining headline inflation and an increase in manufacturing activity encouraged investors. Large-cap stocks came out ahead of small cap for the year; and in an environment of scarce earnings growth, growth stocks outpaced value.
Biggest disappointments from financials and technology sectors
The fund lost the most ground versus the Russell index from investments in the financials sector, although no one stock stood out as a leading detractor. Stock picks in information technology and materials also hampered performance. In technology, shares of BroadSoft (position eliminated), whose software enables telecommunications and cable providers to deliver voice and multimedia services over Internet protocol-based networks, fell sharply after the company lowered its pricing to gain market share and ended up with a revenue shortfall. In the materials sector, disappointments included Stillwater Mining, a palladium and platinum miner whose shares declined as investors began anticipating higher costs and slower economic growth. We sold the stake before period end. Elsewhere, detractors included snack food maker Diamond Foods (position eliminated) in the consumer staples sector and independent oil and gas producer Magnum Hunter Resources (0.02% of net assets) within energy. Shares of Diamond Foods tumbled as questions over its accounting practices derailed a planned acquisition, while Magnum's stock suffered from an earnings miss late in the period.
4
Portfolio Managers' Report (continued) – Columbia Small Cap Growth Fund II
Gains from industrials and consumer discretionary
Stock selection in the industrials and consumer discretionary sectors helped performance relative to the Russell index. While no one industrials stock was a top contributor, several consumer discretionary stocks were noteworthy. They included Tempur-Pedic International, Pier 1 Imports and Polaris Industries (1.3%, 1.1% and 0.6% of net assets, respectively). The stock of premium bedding manufacturer Tempur-Pedic, which is not included in the benchmark, produced sharp gains, buoyed by the popularity of the company's new Cloud mattresses and a vigorous marketing campaign. Shares of specialty retailer Pier I were lifted by better-than-expected revenues and earnings. The stock of Polaris, which designs, engineers and manufactures off-road vehicles, saw steep gains, as strong earnings, a successful acquisition and a dividend increase attracted investors. Elsewhere, an investment in HMS Holdings (1.6% of net assets), a company that helps eliminate fraud and abuse in the health care system, climbed sharply after a recent acquisition gave the firm a stronghold on both Medicare and Medicaid audits.
Cautious outlook
At period end, the portfolio was positioned to benefit from a modestly expanding economic environment as well as slightly higher employment numbers. While we believe the odds of recession have been reduced, we nevertheless expect 2012 economic growth to be lower than its long-term trend. With that backdrop in mind, we plan to focus the fund on companies whose earnings growth is not dependent on the economy; businesses that are expanding their profit margins and market share and firms whose products and services can command premium pricing.
Portfolio characteristics and holdings are subject to change periodically and may not be representative of current characteristics and holdings. The outlook for the fund may differ from those presented for other Columbia Funds.
Equity securities are subject to stock market fluctuations that occur in response to economic and business developments.
Stocks of small-cap companies pose special risks, including possible illiquidity and greater price volatility than stocks of larger, more established companies.
Portfolio breakdown1
as of February 29, 2012 (%)
| Consumer Discretionary | | | 16.6 | | |
| Consumer Staples | | | 2.9 | | |
| Energy | | | 9.6 | | |
| Financials | | | 7.3 | | |
| Health Care | | | 19.5 | | |
| Industrials | | | 18.5 | | |
| Information Technology | | | 21.5 | | |
| Materials | | | 0.9 | | |
| Utilities | | | 0.6 | | |
| Other2 | | | 2.6 | | |
1Percentages indicated are based upon total investments. The Fund's portfolio composition is subject to change.
2Includes investments in affiliated money market fund.
Top 10 holdings1
as of February 29, 2012 (%)
| Brookdale Senior Living, Inc. | | | 1.9 | | |
| Domino's Pizza, Inc. | | | 1.8 | | |
| HMS Holdings Corp. | | | 1.6 | | |
| Energy XXI Bermuda Ltd. | | | 1.5 | | |
| Aspen Technology, Inc. | | | 1.4 | | |
| ServiceSource International, Inc. | | | 1.4 | | |
| Elizabeth Arden, Inc. | | | 1.3 | | |
| Catalyst Health Solutions, Inc. | | | 1.3 | | |
| Signature Bank | | | 1.3 | | |
| Tempur-Pedic International, Inc. | | | 1.3 | | |
1Percentages indicated are based upon total investments (excluding affiliated money market fund).
For further detail about these holdings, please refer to the section entitled "Portfolio of Investments."
Fund holdings are as of the date given, are subject to change at any time, and are not recommendations to buy or sell any security.
5
Portfolio of Investments – Columbia Small Cap Growth Fund II
February 29, 2012
(Percentages represent value of investments compared to net assets)
| Issuer | | Shares | | Value | |
| Common Stocks 100.5% | |
| CONSUMER DISCRETIONARY 17.1% | |
| Auto Components 0.7% | |
| Tenneco, Inc.(a) | | | 55,654 | | | $ | 2,142,679 | | |
| Diversified Consumer Services 0.7% | |
| Bridgepoint Education, Inc.(a) | | | 48,578 | | | | 1,183,360 | | |
| Grand Canyon Education, Inc.(a) | | | 68,129 | | | | 1,165,687 | | |
| Total | | | 2,349,047 | | |
| Hotels, Restaurants & Leisure 2.8% | |
| BJ's Restaurants, Inc.(a) | | | 62,861 | | | | 3,121,049 | | |
| Domino's Pizza, Inc.(a) | | | 143,627 | | | | 5,523,894 | | |
| Total | | | 8,644,943 | | |
| Household Durables 1.8% | |
| Tempur-Pedic International, Inc.(a) | | | 49,555 | | | | 3,914,845 | | |
| Toll Brothers, Inc.(a) | | | 76,557 | | | | 1,796,027 | | |
| Total | | | 5,710,872 | | |
| Internet & Catalog Retail 0.5% | |
| Shutterfly, Inc.(a) | | | 56,365 | | | | 1,542,147 | | |
| Leisure Equipment & Products 1.1% | |
| Arctic Cat, Inc.(a) | | | 44,055 | | | | 1,620,343 | | |
| Polaris Industries, Inc. | | | 26,357 | | | | 1,741,143 | | |
| Total | | | 3,361,486 | | |
| Media 2.1% | |
| Cinemark Holdings, Inc. | | | 121,996 | | | | 2,552,156 | | |
| Entercom Communications Corp.(a) | | | 50,345 | | | | 352,415 | | |
| IMAX Corp.(a) | | | 113,670 | | | | 2,900,859 | | |
| National CineMedia, Inc. | | | 46,742 | | | | 743,665 | | |
| Total | | | 6,549,095 | | |
| Multiline Retail 0.5% | |
| Gordmans Stores, Inc.(a) | | | 98,278 | | | | 1,490,877 | | |
| Specialty Retail 5.0% | |
| Asbury Automotive Group, Inc.(a) | | | 83,957 | | | | 2,177,005 | | |
| Body Central Corp.(a) | | | 88,439 | | | | 2,462,142 | | |
| DSW, Inc., Class A | | | 29,356 | | | | 1,655,678 | | |
| hhgregg, Inc.(a) | | | 92,015 | | | | 1,051,731 | | |
| Lumber Liquidators Holdings, Inc.(a) | | | 66,713 | | | | 1,460,348 | | |
| Pier 1 Imports, Inc.(a) | | | 198,806 | | | | 3,413,499 | | |
| Rent-A-Center, Inc. | | | 49,944 | | | | 1,769,017 | | |
| Select Comfort Corp.(a) | | | 54,556 | | | | 1,614,312 | | |
| Total | | | 15,603,732 | | |
| Textiles, Apparel & Luxury Goods 1.9% | |
| CROCS, Inc.(a) | | | 136,365 | | | | 2,679,572 | | |
| G-III Apparel Group Ltd.(a) | | | 35,363 | | | | 881,246 | | |
| Gildan Activewear, Inc. | | | 100,354 | | | | 2,506,843 | | |
| Total | | | 6,067,661 | | |
| TOTAL CONSUMER DISCRETIONARY | | | 53,462,539 | | |
| CONSUMER STAPLES 3.0% | |
| Food Products 0.5% | |
| Post Holdings, Inc.(a) | | | 49,934 | | | | 1,554,945 | | |
| Personal Products 2.5% | |
| Elizabeth Arden, Inc.(a) | | | 111,740 | | | | 4,151,141 | | |
| Nu Skin Enterprises, Inc., Class A | | | 65,711 | | | | 3,795,467 | | |
| Total | | | 7,946,608 | | |
| TOTAL CONSUMER STAPLES | | | 9,501,553 | | |
| Issuer | | Shares | | Value | |
| Common Stocks (continued) | |
| ENERGY 9.9% | |
| Energy Equipment & Services 2.7% | |
| CARBO Ceramics, Inc. | | | 17,273 | | | $ | 1,583,070 | | |
| Dril-Quip, Inc.(a) | | | 21,228 | | | | 1,485,748 | | |
| Key Energy Services, Inc.(a) | | | 193,589 | | | | 3,302,628 | | |
| Superior Energy Services, Inc.(a) | | | 69,939 | | | | 2,052,011 | | |
| Total | | | 8,423,457 | | |
| Oil, Gas & Consumable Fuels 7.2% | |
| Carrizo Oil & Gas, Inc.(a) | | | 62,206 | | | | 1,752,343 | | |
| Cheniere Energy, Inc.(a) | | | 65,700 | | | | 988,128 | | |
| Energy XXI Bermuda Ltd.(a) | | | 129,448 | | | | 4,845,239 | | |
| Golar LNG Ltd. | | | 47,840 | | | | 2,031,765 | | |
| Kodiak Oil & Gas Corp.(a) | | | 157,058 | | | | 1,521,892 | | |
| McMoRan Exploration Co.(a) | | | 117,733 | | | | 1,648,262 | | |
| Oasis Petroleum, Inc.(a) | | | 80,412 | | | | 2,578,813 | | |
| Resolute Energy Corp.(a) | | | 154,297 | | | | 1,721,954 | | |
| Rosetta Resources, Inc.(a) | | | 38,030 | | | | 1,941,051 | | |
| Western Refining, Inc. | | | 95,668 | | | | 1,736,374 | | |
| World Fuel Services Corp. | | | 37,105 | | | | 1,545,794 | | |
| Total | | | 22,311,615 | | |
| TOTAL ENERGY | | | 30,735,072 | | |
| FINANCIALS 7.5% | |
| Capital Markets 0.5% | |
| Financial Engines, Inc.(a) | | | 71,446 | | | | 1,646,830 | | |
| Commercial Banks 1.6% | |
| Glacier Bancorp, Inc. | | | 67,173 | | | | 926,988 | | |
| Signature Bank(a) | | | 67,698 | | | | 4,018,553 | | |
| Total | | | 4,945,541 | | |
| Consumer Finance 1.5% | |
| DFC Global Corp.(a) | | | 175,647 | | | | 3,145,838 | | |
| First Cash Financial Services, Inc.(a) | | | 37,988 | | | | 1,605,373 | | |
| Total | | | 4,751,211 | | |
| Real Estate Investment Trusts (REITs) 3.9% | |
| DiamondRock Hospitality Co. | | | 186,921 | | | | 1,861,733 | | |
| Home Properties, Inc. | | | 53,112 | | | | 3,060,844 | | |
| Omega Healthcare Investors, Inc. | | | 108,618 | | | | 2,212,549 | | |
| Sabra Health Care REIT, Inc. | | | 110,592 | | | | 1,579,254 | | |
| Summit Hotel Properties, Inc. | | | 182,252 | | | | 1,678,541 | | |
| Tanger Factory Outlet Centers | | | 56,777 | | | | 1,662,430 | | |
| Total | | | 12,055,351 | | |
| TOTAL FINANCIALS | | | 23,398,933 | | |
| HEALTH CARE 20.1% | |
| Biotechnology 6.1% | |
| Alkermes PLC(a) | | | 180,844 | | | | 3,184,663 | | |
| Amarin Corp. PLC, ADR(a) | | | 261,404 | | | | 2,025,881 | | |
| Ardea Biosciences, Inc.(a) | | | 71,398 | | | | 1,522,205 | | |
| Ariad Pharmaceuticals, Inc.(a) | | | 142,659 | | | | 2,045,730 | | |
| Exact Sciences Corp.(a) | | | 140,021 | | | | 1,314,797 | | |
| Idenix Pharmaceuticals, Inc.(a) | | | 193,495 | | | | 2,277,436 | | |
| Ironwood Pharmaceuticals, Inc.(a) | | | 98,460 | | | | 1,318,380 | | |
| Momenta Pharmaceuticals, Inc.(a) | | | 62,333 | | | | 913,802 | | |
| Onyx Pharmaceuticals, Inc.(a) | | | 63,198 | | | | 2,421,747 | | |
| Rigel Pharmaceuticals, Inc.(a) | | | 184,325 | | | | 1,843,250 | | |
| Total | | | 18,867,891 | | |
The Accompanying Notes to Financial Statements are an integral part of this statement.
6
Columbia Small Cap Growth Fund II
February 29, 2012
(Percentages represent value of investments compared to net assets)
| Issuer | | Shares | | Value | |
| Common Stocks (continued) | |
| HEALTH CARE (cont.) | |
| Health Care Equipment & Supplies 4.5% | |
| Align Technology, Inc.(a) | | | 140,734 | | | $ | 3,604,197 | | |
| Insulet Corp.(a) | | | 157,415 | | | | 3,104,224 | | |
| Masimo Corp.(a) | | | 145,856 | | | | 3,179,661 | | |
| NxStage Medical, Inc.(a) | | | 88,691 | | | | 1,773,820 | | |
| Volcano Corp.(a) | | | 86,526 | | | | 2,425,324 | | |
| Total | | | 14,087,226 | | |
| Health Care Providers & Services 5.8% | |
| Brookdale Senior Living, Inc.(a) | | | 324,207 | | | | 6,043,218 | | |
| Catalyst Health Solutions, Inc.(a) | | | 66,540 | | | | 4,126,811 | | |
| HMS Holdings Corp.(a) | | | 157,161 | | | | 5,063,727 | | |
| IPC The Hospitalist Co., Inc.(a) | | | 75,034 | | | | 2,728,987 | | |
| Total | | | 17,962,743 | | |
| Health Care Technology 0.8% | |
| athenahealth, Inc.(a) | | | 34,473 | | | | 2,436,207 | | |
| Omnicell, Inc.(a) | | | 11,217 | | | | 167,358 | | |
| Total | | | 2,603,565 | | |
| Life Sciences Tools & Services 0.5% | |
| ICON PLC, ADR(a) | | | 78,130 | | | | 1,654,794 | | |
| Pharmaceuticals 2.4% | |
| Impax Laboratories, Inc.(a) | | | 137,650 | | | | 3,214,127 | | |
| MAP Pharmaceuticals, Inc.(a) | | | 90,374 | | | | 1,450,503 | | |
| Salix Pharmaceuticals Ltd.(a) | | | 56,388 | | | | 2,781,056 | | |
| Total | | | 7,445,686 | | |
| TOTAL HEALTH CARE | | | 62,621,905 | | |
| INDUSTRIALS 19.1% | |
| Aerospace & Defense 1.9% | |
| Hexcel Corp.(a) | | | 152,657 | | | | 3,857,643 | | |
| LMI Aerospace, Inc.(a) | | | 105,635 | | | | 2,149,672 | | |
| Total | | | 6,007,315 | | |
| Building Products 0.5% | |
| USG Corp.(a) | | | 117,092 | | | | 1,668,561 | | |
| Commercial Services & Supplies 1.7% | |
| Portfolio Recovery Associates, Inc.(a) | | | 34,869 | | | | 2,431,416 | | |
| Tetra Tech, Inc.(a) | | | 115,029 | | | | 2,825,112 | | |
| Total | | | 5,256,528 | | |
| Construction & Engineering 0.5% | |
| Great Lakes Dredge & Dock Corp. | | | 221,597 | | | | 1,571,123 | | |
| Electrical Equipment 1.6% | |
| Acuity Brands, Inc. | | | 39,650 | | | | 2,465,833 | | |
| Regal-Beloit Corp. | | | 36,296 | | | | 2,449,980 | | |
| Total | | | 4,915,813 | | |
| Machinery 4.5% | |
| Chart Industries, Inc.(a) | | | 27,656 | | | | 1,891,394 | | |
| Lindsay Corp. | | | 51,946 | | | | 3,407,138 | | |
| Proto Labs, Inc.(a) | | | 36,890 | | | | 1,134,367 | | |
| Tennant Co. | | | 63,603 | | | | 2,610,267 | | |
| Trinity Industries, Inc. | | | 60,196 | | | | 2,092,413 | | |
| Woodward, Inc. | | | 62,528 | | | | 2,736,851 | | |
| Total | | | 13,872,430 | | |
| Issuer | | Shares | | Value | |
| Common Stocks (continued) | |
| INDUSTRIALS (cont.) | |
| Professional Services 3.4% | |
| Acacia Research Corp.(a) | | | 85,618 | | | $ | 3,381,911 | | |
| Advisory Board Co. (The)(a) | | | 32,594 | | | | 2,638,159 | | |
| Corporate Executive Board Co. (The) | | | 44,784 | | | | 1,855,849 | | |
| CoStar Group, Inc.(a) | | | 45,734 | | | | 2,743,125 | | |
| Total | | | 10,619,044 | | |
| Road & Rail 2.9% | |
| Avis Budget Group, Inc.(a) | | | 158,330 | | | | 2,042,457 | | |
| Genesee & Wyoming, Inc., Class A(a) | | | 49,776 | | | | 2,957,690 | | |
| Knight Transportation, Inc. | | | 94,146 | | | | 1,612,721 | | |
| Roadrunner Transportation Systems, Inc.(a) | | | 142,124 | | | | 2,536,913 | | |
| Total | | | 9,149,781 | | |
| Trading Companies & Distributors 2.1% | |
| TAL International Group, Inc. | | | 64,351 | | | | 2,319,210 | | |
| United Rentals, Inc.(a) | | | 58,247 | | | | 2,427,735 | | |
| Watsco, Inc. | | | 22,806 | | | | 1,628,120 | | |
| Total | | | 6,375,065 | | |
| TOTAL INDUSTRIALS | | | 59,435,660 | | |
| INFORMATION TECHNOLOGY 22.2% | |
| Communications Equipment 1.2% | |
| Netgear, Inc.(a) | | | 97,065 | | | | 3,646,732 | | |
| Electronic Equipment, Instruments & Components 0.6% | |
| Universal Display Corp.(a) | | | 43,869 | | | | 1,812,228 | | |
| Internet Software & Services 3.5% | |
| Ancestry.com, Inc.(a) | | | 73,397 | | | | 1,671,984 | | |
| Bankrate, Inc.(a) | | | 65,647 | | | | 1,565,025 | | |
| Constant Contact, Inc.(a) | | | 82,435 | | | | 2,492,834 | | |
| DealerTrack Holdings, Inc.(a) | | | 67,975 | | | | 1,893,104 | | |
| LogMeIn, Inc.(a) | | | 87,119 | | | | 3,211,206 | | |
| Total | | | 10,834,153 | | |
| IT Services 2.7% | |
| Jack Henry & Associates, Inc. | | | 54,088 | | | | 1,824,929 | | |
| ServiceSource International, Inc.(a) | | | 256,850 | | | | 4,315,080 | | |
| Wright Express Corp.(a) | | | 40,080 | | | | 2,480,150 | | |
| Total | | | 8,620,159 | | |
| Semiconductors & Semiconductor Equipment 5.5% | |
| Cavium, Inc.(a) | | | 45,674 | | | | 1,631,932 | | |
| Cirrus Logic, Inc.(a) | | | 44,479 | | | | 1,048,815 | | |
| Entegris, Inc.(a) | | | 208,954 | | | | 1,888,944 | | |
| Kulicke & Soffa Industries, Inc.(a) | | | 55,506 | | | | 624,998 | | |
| Mellanox Technologies Ltd.(a) | | | 55,637 | | | | 2,123,664 | | |
| Omnivision Technologies, Inc.(a) | | | 167,130 | | | | 2,735,918 | | |
| Semtech Corp.(a) | | | 117,169 | | | | 3,363,922 | | |
| Volterra Semiconductor Corp.(a) | | | 118,983 | | | | 3,656,348 | | |
| Total | | | 17,074,541 | | |
| Software 8.7% | |
| ACI Worldwide, Inc.(a) | | | 51,684 | | | | 1,952,622 | | |
| Aspen Technology, Inc.(a) | | | 216,777 | | | | 4,456,935 | | |
| CommVault Systems, Inc.(a) | | | 54,915 | | | | 2,831,967 | | |
| Kenexa Corp.(a) | | | 57,270 | | | | 1,591,533 | | |
| Monitise PLC(a) | | | 1,924,009 | | | | 1,178,449 | | |
| Parametric Technology Corp.(a) | | | 83,422 | | | | 2,227,367 | | |
| QLIK Technologies, Inc.(a) | | | 57,594 | | | | 1,743,370 | | |
| RealPage, Inc.(a) | | | 85,184 | | | | 1,689,199 | | |
| Sourcefire, Inc.(a) | | | 33,489 | | | | 1,507,675 | | |
The Accompanying Notes to Financial Statements are an integral part of this statement.
7
Columbia Small Cap Growth Fund II
February 29, 2012
(Percentages represent value of investments compared to net assets)
| Issuer | | Shares | | Value | |
| Common Stocks (continued) | |
| INFORMATION TECHNOLOGY (cont.) | |
| Software (cont.) | |
| Synchronoss Technologies, Inc.(a) | | | 76,863 | | | $ | 2,571,836 | | |
| Take-Two Interactive Software, Inc.(a) | | | 142,334 | | | | 2,199,060 | | |
| TIBCO Software, Inc.(a) | | | 107,407 | | | | 3,111,581 | | |
| Total | | | 27,061,594 | | |
| TOTAL INFORMATION TECHNOLOGY | | | 69,049,407 | | |
| MATERIALS 1.0% | |
| Chemicals 0.6% | |
| Intrepid Potash, Inc.(a) | | | 68,269 | | | | 1,726,523 | | |
| Metals & Mining 0.4% | |
| Globe Specialty Metals, Inc. | | | 93,862 | | | | 1,334,718 | | |
| TOTAL MATERIALS | | | 3,061,241 | | |
| UTILITIES 0.6% | |
| Electric Utilities 0.6% | |
| UIL Holdings Corp. | | | 52,319 | | | | 1,844,245 | | |
| TOTAL UTILITIES | | | 1,844,245 | | |
Total Common Stocks
(Cost: $271,852,427) | | | | $ | 313,110,555 | | |
| Issuer | | Shares | | Value | |
| Warrants —% | |
| ENERGY —% | |
| Oil, Gas & Consumable Fuels —% | |
| Magnum Hunter Resources Corp.(a)(b) | | | 34,795 | | | $ | 60,780 | | |
| TOTAL ENERGY | | | 60,780 | | |
Total Warrants
(Cost: $30,196) | | | | $ | 60,780 | | |
| | | Shares | | Value | |
| Money Market Funds 2.7% | |
| Columbia Short-Term Cash Fund, 0.166%(c)(d) | | | 8,309,425 | | | $ | 8,309,425 | | |
Total Money Market Funds
(Cost: $8,309,425) | | $ | 8,309,425 | | |
Total Investments
(Cost: $280,192,048) | | | | $ | 321,480,760 | | |
| Other Assets & Liabilities, Net | | | | | (9,945,853 | ) | |
| Net Assets | | $ | 311,534,907 | | |
| Notes to Portfolio of Investments | |
(a) Non-income producing.
(b) Identifies issues considered to be illiquid as to their marketability. The aggregate value of such securities at February 29, 2012 was $60,780, representing 0.02% of net assets. Information concerning such security holdings at February 29, 2012 was as follows:
| Security Description | | Acquisition Dates | | Cost | |
| Magnum Hunter Resources Corp. | | 03/07/11 – 06/29/11 | | $ | 30,196 | | |
(c) The rate shown is the seven-day current annualized yield at February 29, 2012.
(d) Investments in affiliates during the year ended February 29, 2012:
| Issuer | | Beginning
Cost | | Purchase
Cost | | Sales Cost/
Proceeds
from Sales | | Realized
Gain/Loss | | Ending
Cost | | Dividends
or Interest
Income | |
Value | |
| Columbia Short-Term Cash Fund | | $ | — | | | $ | 126,872,283 | | | $ | (118,562,858 | ) | | $ | — | | | $ | 8,309,425 | | | $ | 9,542 | | | $ | 8,309,425 | | |
Abbreviation Legend
ADR American Depositary Receipt
The Accompanying Notes to Financial Statements are an integral part of this statement.
8
Columbia Small Cap Growth Fund II
February 29, 2012
Generally accepted accounting principles (GAAP) require disclosure regarding the inputs and valuation techniques used to measure fair value and any changes in valuation inputs or techniques. In addition, investments shall be disclosed by major category.
The Fund categorizes its fair value measurements according to a three-level hierarchy that maximizes the use of observable inputs and minimizes the use of unobservable inputs by prioritizing that the most observable input be used when available. Observable inputs are those that market participants would use in pricing an investment based on market data obtained from sources independent of the reporting entity. Unobservable inputs are those that reflect the Fund's assumptions about the information market participants would use in pricing an investment. An investment's level within the fair value hierarchy is based on the lowest level of any input that is deemed significant to the asset or liability's fair value measurement. The input levels are not necessarily an indication of the risk or liquidity associated with investments at that level. For example, certain U.S. government securities are generally high quality and liquid, however, they are reflected as Level 2 because the inputs used to determine fair value may not always be quoted prices in an active market.
Fair value inputs are summarized in the three broad levels listed below:
• Level 1 — Valuations based on quoted prices for investments in active markets that the Fund has the ability to access at the measurement date (including NAV for open-end mutual funds). Valuation adjustments are not applied to Level 1 investments.
• Level 2 — Valuations based on other significant observable inputs (including quoted prices for similar securities, interest rates, prepayment speeds, credit risks, etc.).
• Level 3 — Valuations based on significant unobservable inputs (including the Fund's own assumptions and judgment in determining the fair value of investments).
Inputs that are used in determining fair value of an investment may include price information, credit data, volatility statistics, and other factors. These inputs can be either observable or unobservable. The availability of observable inputs can vary between investments, and is affected by various factors such as the type of investment, and the volume and level of activity for that investment or similar investments in the marketplace. The inputs will be considered by the Investment Manager, along with any other relevant factors in the calculation of an investment's fair value. The Fund uses prices and inputs that are current as of the measurement date, which may include periods of market dislocations. During these periods, the availability of prices and inputs may be reduced for many investments. This condition could cause an investment to be reclassified between the various levels within the hierarchy.
Foreign equity securities actively traded in markets where there is a significant delay in the local close relative to the New York Stock Exchange (NYSE) are classified as Level 2. The values of these securities may include an adjustment to reflect the impact of significant market movements following the close of local trading, as described in Note 2 to the financial statements – Security Valuation.
Investments falling into the Level 3 category are primarily supported by quoted prices from brokers and dealers participating in the market for those investments. However, these may be classified as Level 3 investments due to lack of market transparency and corroboration to support these quoted prices. Additionally, valuation models may be used as the pricing source for any remaining investments classified as Level 3. These models rely on one or more significant unobservable inputs and/or significant assumptions by the Investment Manager. Inputs used in valuations may include, but are not limited to, financial statement analysis, capital account balances, discount rates and estimated cash flows, and comparable company data.
The Accompanying Notes to Financial Statements are an integral part of this statement.
9
Columbia Small Cap Growth Fund II
February 29, 2012
| Fair Value Measurements (continued) | |
The following table is a summary of the inputs used to value the Fund's investments as of February 29, 2012:
| | | Fair value at February 29, 2012 | |
| Description(a) | | Level 1
quoted prices
in active
markets for
identical assets | | Level 2
other
significant
observable
inputs(b) | | Level 3
significant
unobservable
inputs | | Total | |
| Equity Securities | |
| Common Stocks | |
| Consumer Discretionary | | $ | 53,462,539 | | | $ | — | | | $ | — | | | $ | 53,462,539 | | |
| Consumer Staples | | | 9,501,553 | | | | — | | | | — | | | | 9,501,553 | | |
| Energy | | | 30,735,072 | | | | — | | | | — | | | | 30,735,072 | | |
| Financials | | | 23,398,933 | | | | — | | | | — | | | | 23,398,933 | | |
| Health Care | | | 62,621,905 | | | | — | | | | — | | | | 62,621,905 | | |
| Industrials | | | 59,435,660 | | | | — | | | | — | | | | 59,435,660 | | |
| Information Technology | | | 67,870,958 | | | | 1,178,449 | | | | — | | | | 69,049,407 | | |
| Materials | | | 3,061,241 | | | | — | | | | — | | | | 3,061,241 | | |
| Utilities | | | 1,844,245 | | | | — | | | | — | | | | 1,844,245 | | |
| Warrants | |
| Energy | | | — | | | | 60,780 | | | | — | | | | 60,780 | | |
| Total Equity Securities | | | 311,932,106 | | | | 1,239,229 | | | | — | | | | 313,171,335 | | |
| Other | |
| Money Market Funds | | | 8,309,425 | | | | — | | | | — | | | | 8,309,425 | | |
| Total Other | | | 8,309,425 | | | | — | | | | — | | | | 8,309,425 | | |
| Total | | $ | 320,241,531 | | | $ | 1,239,229 | | | $ | — | | | $ | 321,480,760 | | |
The Fund's assets assigned to the Level 2 input category are generally valued using the market approach, in which a security's value is determined through reference to prices and information from market transactions for similar or identical assets. These assets include certain foreign securities for which a third party statistical pricing service may be employed for purposes of fair market valuation. The models utilized by the third party statistical pricing service take into account a security's correlation to available market data including, but not limited to, intraday index, ADR, and ETF movements.
(a) See the Portfolio of Investments for all investment classifications not indicated in the table.
(b) There were no significant transfers between Levels 1 and 2 during the period.
The Accompanying Notes to Financial Statements are an integral part of this statement.
10
Statement of Assets and Liabilities – Columbia Small Cap Growth Fund II
February 29, 2012
| Assets | |
| Investments, at value | |
| Unaffiliated issuers (identified cost $271,882,623) | | $ | 313,171,335 | | |
| Affiliated issuers (identified cost $8,309,425) | | | 8,309,425 | | |
| Total investments (identified cost $280,192,048) | | | 321,480,760 | | |
| Cash | | | 3 | | |
| Receivable for: | |
| Investments sold | | | 6,717,395 | | |
| Capital shares sold | | | 119,177 | | |
| Dividends | | | 98,894 | | |
| Reclaims | | | 673 | | |
| Expense reimbursement due from Investment Manager | | | 1,391 | | |
| Prepaid expense | | | 10,256 | | |
| Trustees' deferred compensation plan | | | 8,027 | | |
| Total assets | | | 328,436,576 | | |
| Liabilities | |
| Payable for: | |
| Investments purchased | | | 9,010,585 | | |
| Capital shares purchased | | | 7,572,126 | | |
| Investment management fees | | | 6,190 | | |
| Distribution and service fees | | | 971 | | |
| Transfer agent fees | | | 65,028 | | |
| Administration fees | | | 1,035 | | |
| Chief compliance officer expenses | | | 187 | | |
| Other expenses | | | 237,520 | | |
| Trustees' deferred compensation plan | | | 8,027 | | |
| Total liabilities | | | 16,901,669 | | |
| Net assets applicable to outstanding capital stock | | $ | 311,534,907 | | |
The Accompanying Notes to Financial Statements are an integral part of this statement.
11
Statement of Assets and Liabilities (continued) – Columbia Small Cap Growth Fund II
February 29, 2012
| Represented by | |
| Paid-in capital | | $ | 304,280,470 | | |
| Excess of distributions over net investment income | | | (793,098 | ) | |
| Accumulated net realized loss | | | (33,241,175 | ) | |
| Unrealized appreciation (depreciation) on: | |
| Investments | | | 41,288,712 | | |
| Foreign currency translations | | | (2 | ) | |
| Total — representing net assets applicable to outstanding capital stock | | $ | 311,534,907 | | |
| Net assets applicable to outstanding shares | |
| Class A | | $ | 127,493,954 | | |
| Class B | | $ | 1,027,299 | | |
| Class C | | $ | 2,026,686 | | |
| Class I | | $ | 2,781 | | |
| Class Z | | $ | 180,984,187 | | |
| Shares outstanding | |
| Class A | | | 10,523,349 | | |
| Class B | | | 97,819 | | |
| Class C | | | 188,387 | | |
| Class I | | | 218 | | |
| Class Z | | | 14,190,264 | | |
| Net asset value per share | |
| Class A(a) | | $ | 12.12 | | |
| Class B | | $ | 10.50 | | |
| Class C | | $ | 10.76 | | |
| Class I | | $ | 12.76 | | |
| Class Z | | $ | 12.75 | | |
(a) The maximum offering price per share for Class A is $12.86. The offering price is calculated by dividing the net asset value by 1.0 minus the maximum sales charge of 5.75%.
The Accompanying Notes to Financial Statements are an integral part of this statement.
12
Statement of Operations – Columbia Small Cap Growth Fund II
Year ended February 29, 2012
| Net investment income | |
| Income: | |
| Dividends | | $ | 1,223,835 | | |
| Interest | | | 867 | | |
| Dividends from affiliates | | | 9,542 | | |
| Foreign taxes withheld | | | (4,720 | ) | |
| Total income | | | 1,229,524 | | |
| Expenses: | |
| Investment management fees | | | 2,342,947 | | |
| Distribution fees | |
| Class B | | | 10,777 | | |
| Class C | | | 16,498 | | |
| Service fees | |
| Class B | | | 3,592 | | |
| Class C | | | 5,499 | | |
| Distribution and service fees — Class A | | | 329,401 | | |
| Transfer agent fees | |
| Class A | | | 251,664 | | |
| Class B | | | 2,709 | | |
| Class C | | | 4,145 | | |
| Class Z | | | 376,619 | | |
| Administration fees | | | 358,982 | | |
| Compensation of board members | | | 26,267 | | |
| Pricing and bookkeeping fees | | | 33,332 | | |
| Custodian fees | | | 19,435 | | |
| Printing and postage fees | | | 111,653 | | |
| Registration fees | | | 57,767 | | |
| Professional fees | | | 68,542 | | |
| Chief compliance officer expenses | | | 293 | | |
| Other | | | 18,768 | | |
| Total expenses | | | 4,038,890 | | |
| Fees waived or expenses reimbursed by Investment Manager and its affiliates | | | (1,273 | ) | |
| Expense reductions | | | (15,937 | ) | |
| Total net expenses | | | 4,021,680 | | |
| Net investment loss | | | (2,792,156 | ) | |
| Realized and unrealized gain (loss) – net | |
| Net realized gain (loss) on: | |
| Investments | | | 42,096,239 | | |
| Foreign currency translations | | | (9,117 | ) | |
| Net realized gain | | | 42,087,122 | | |
| Net change in unrealized appreciation (depreciation) on: | |
| Investments | | | (42,049,512 | ) | |
| Foreign currency translations | | | (2 | ) | |
| Net change in unrealized depreciation | | | (42,049,514 | ) | |
| Net realized and unrealized gain | | | 37,608 | | |
| Net decrease in net assets from operations | | $ | (2,754,548 | ) | |
The Accompanying Notes to Financial Statements are an integral part of this statement.
13
Statement of Changes in Net Assets – Columbia Small Cap Growth Fund II
| | | Year ended
February 29,
2012 | | Year ended
February 28,
2011 | |
| Operations | |
| Net investment loss | | $ | (2,792,156 | ) | | $ | (2,989,266 | ) | |
| Net realized gain | | | 42,087,122 | | | | 60,578,029 | | |
| Net change in unrealized appreciation (depreciation) | | | (42,049,514 | ) | | | 51,745,305 | | |
| Net increase (decrease) in net assets resulting from operations | | | (2,754,548 | ) | | | 109,334,068 | | |
| Decrease in net assets from share transactions | | | (56,617,816 | ) | | | (79,890,367 | ) | |
| Proceeds from regulatory settlements (Note 6) | | | 950,234 | | | | 76,427 | | |
| Total increase (decrease) in net assets | | | (58,422,130 | ) | | | 29,520,128 | | |
| Net assets at beginning of year | | | 369,957,037 | | | | 340,436,909 | | |
| Net assets at end of year | | $ | 311,534,907 | | | $ | 369,957,037 | | |
| Excess of distributions over net investment income | | $ | (793,098 | ) | | $ | — | | |
The Accompanying Notes to Financial Statements are an integral part of this statement.
14
Statement of Changes in Net Assets (continued) – Columbia Small Cap Growth Fund II
| | | Year ended February 29,
2012(a) | | Year ended February 28,
2011 | |
| | | Shares | | Dollars($) | | Shares | | Dollars($) | |
| Capital stock activity | |
| Class A shares | |
| Subscriptions(b) | | | 289,854 | | | | 3,448,311 | | | | 501,743 | | | | 5,160,391 | | |
| Redemptions | | | (1,744,440 | ) | | | (20,573,515 | ) | | | (1,967,790 | ) | | | (20,070,759 | ) | |
| Net decrease | | | (1,454,586 | ) | | | (17,125,204 | ) | | | (1,466,047 | ) | | | (14,910,368 | ) | |
| Class B shares | |
| Subscriptions | | | — | | | | — | | | | 2,064 | | | | 18,422 | | |
| Redemptions(b) | | | (91,823 | ) | | | (931,997 | ) | | | (237,996 | ) | | | (2,096,092 | ) | |
| Net decrease | | | (91,823 | ) | | | (931,997 | ) | | | (235,932 | ) | | | (2,077,670 | ) | |
| Class C shares | |
| Subscriptions | | | 16,314 | | | | 179,734 | | | | 21,187 | | | | 198,146 | | |
| Redemptions | | | (69,145 | ) | | | (731,862 | ) | | | (106,855 | ) | | | (954,620 | ) | |
| Net decrease | | | (52,831 | ) | | | (552,128 | ) | | | (85,668 | ) | | | (756,474 | ) | |
| Class I shares | |
| Subscriptions | | | 992,391 | | | | 11,207,102 | | | | — | | | | — | | |
| Redemptions | | | (992,173 | ) | | | (12,766,009 | ) | | | — | | | | — | | |
| Net increase (decrease) | | | 218 | | | | (1,558,907 | ) | | | — | | | | — | | |
| Class Z shares | |
| Subscriptions | | | 2,825,452 | | | | 34,934,986 | | | | 1,643,660 | | | | 17,140,701 | | |
| Redemptions | | | (5,808,519 | ) | | | (71,384,566 | ) | | | (7,440,236 | ) | | | (79,286,556 | ) | |
| Net decrease | | | (2,983,067 | ) | | | (36,449,580 | ) | | | (5,796,576 | ) | | | (62,145,855 | ) | |
| Total net decrease | | | (4,582,089 | ) | | | (56,617,816 | ) | | | (7,584,223 | ) | | | (79,890,367 | ) | |
(a) Class I shares are for the period from November 16, 2011 (commencement of operations) to February 29, 2012.
(b) Includes conversions of Class B shares to Class A shares, if any.
The Accompanying Notes to Financial Statements are an integral part of this statement.
15
Financial Highlights – Columbia Small Cap Growth Fund II
The following tables are intended to help you understand the Fund's financial performance. Certain information reflects financial results for a single share of a class held for the periods shown. Per share net investment income (loss) amounts are calculated based on average shares outstanding during the period. Total returns assume reinvestment of all dividends and distributions. Total returns do not reflect payment of sales charges, if any, and are not annualized for periods of less than one year.
| | | Year ended
Feb. 29, | | Year ended
Feb. 28, | | Year ended
Feb. 29, | | Year ended
March 31, | |
| | | 2012 | | 2011 | | 2010 | | 2009 | | 2008(a)(b)(c) | | 2007(a) | |
| Class A | |
| Per share data | |
| Net asset value, beginning of period | | $ | 12.17 | | | $ | 8.92 | | | $ | 5.99 | | | $ | 10.57 | | | $ | 13.79 | | | $ | 17.56 | | |
| Income from investment operations: | |
| Net investment loss | | | (0.11 | ) | | | (0.10 | ) | | | (0.07 | ) | | | (0.07 | ) | | | (0.10 | ) | | | (0.12 | ) | |
| Net realized and unrealized gain (loss) | | | 0.03 | | | | 3.35 | | | | 2.99 | | | | (4.51 | ) | | | (0.41 | ) | | | (0.24 | )(d) | |
| Total from investment operations | | | (0.08 | ) | | | 3.25 | | | | 2.92 | | | | (4.58 | ) | | | (0.51 | ) | | | (0.36 | ) | |
| Less distributions to shareholders from: | |
| Net realized gains | | | — | | | | — | | | | — | | | | — | | | | (2.69 | ) | | | (3.41 | ) | |
| Tax return of capital | | | — | | | | — | | | | — | | | | — | | | | (0.02 | ) | | | — | | |
| Total distributions to shareholders | | | — | | | | — | | | | — | | | | — | | | | (2.71 | ) | | | (3.41 | ) | |
| Proceeds from regulatory settlement | | | 0.03 | | | | 0.00 | (e) | | | 0.01 | | | | — | | | | — | | | | — | | |
| Net asset value, end of period | | $ | 12.12 | | | $ | 12.17 | | | $ | 8.92 | | | $ | 5.99 | | | $ | 10.57 | | | $ | 13.79 | | |
| Total return | | | (0.41 | %)(f) | | | 36.43 | % | | | 48.91 | % | | | (43.33 | %) | | | (6.45 | %) | | | (0.03 | %) | |
| Ratios to average net assets(g) | |
Expenses prior to fees waived or expenses reimbursed
(including interest expense) | | | 1.35 | % | | | 1.32 | %(h) | | | 1.37 | %(h) | | | 1.32 | %(h) | | | 1.24 | %(h)(i) | | | 1.26 | % | |
Net expenses after fees waived or expenses reimbursed
(including interest expense)(j) | | | 1.34 | %(k) | | | 1.32 | %(h)(k) | | | 1.36 | %(h)(k) | | | 1.27 | %(h)(k) | | | 1.20 | %(h)(i)(k) | | | 1.23 | %(k) | |
Expenses prior to fees waived or expenses reimbursed
(excluding interest expense) | | | 1.35 | % | | | 1.32 | % | | | 1.37 | % | | | 1.32 | % | | | 1.24 | %(i) | | | 1.26 | % | |
Net expenses after fees waived or expenses reimbursed
(excluding interest expense)(j) | | | 1.34 | %(k) | | | 1.32 | %(k) | | | 1.36 | %(k) | | | 1.27 | %(k) | | | 1.20 | %(i)(k) | | | 1.23 | %(k) | |
| Net investment loss | | | (0.98 | %)(k) | | | (1.00 | %)(k) | | | (0.90 | %)(k) | | | (0.80 | %)(k) | | | (0.85 | %)(i)(k) | | | (0.81 | %)(k) | |
| Supplemental data | |
| Net assets, end of period (in thousands) | | $ | 127,494 | | | $ | 145,802 | | | $ | 119,894 | | | $ | 90,647 | | | $ | 173,675 | | | $ | 207,258 | | |
| Portfolio turnover | | | 112 | % | | | 147 | % | | | 105 | % | | | 130 | % | | | 3 | %(l) | | | — | | |
| Turnover of Columbia Small Cap Growth Master Portfolio | | | — | | | | — | | | | — | | | | — | | | | 199 | % | | | 188 | % | |
Notes to Financial Highlights
(a) The per share amounts and percentages reflect income and expenses assuming inclusion of the Fund's proportionate share of the income and expenses of Columbia Small Cap Growth Master Portfolio.
(b) For the period from April 1, 2007 to February 29, 2008. In 2008, the Fund's fiscal year end was changed from March 31 to February 29.
(c) Effective February 28, 2008, the Fund converted to a stand-alone fund. Prior to February 28, 2008, the Fund operated in a master-feeder structure.
(d) The amount shown for a share outstanding does not correspond with the aggregate net gain on investments for the period due to timing of repurchases of Fund shares in relation to fluctuating market value of the investments in the Fund.
(e) Rounds to less than $0.01.
(f) During the year ended February 29, 2012, the Fund received proceeds from regulatory settlements. Had the Fund not received these proceeds, the total return would have been lower by 0.32%.
(g) In addition to the fees and expenses which the Fund bears directly, the Fund indirectly bears a pro rata share of the fees and expenses of the acquired funds in which it invests. Such indirect expenses are not included in the reported expense ratios.
(h) Includes interest expense which rounds to less than 0.01%.
(i) Annualized.
(j) The Investment Manager and certain of its affiliates agreed to waive/reimburse certain fees and expenses, if applicable.
(k) The benefits derived from expense reductions had an impact of less than 0.01%.
(l) Amount represents results after the Fund's conversion to a stand-alone structure on February 28, 2008.
The Accompanying Notes to Financial Statements are an integral part of this statement.
16
Financial Highlights (continued) – Columbia Small Cap Growth Fund II
| | | Year ended
Feb. 29, | | Year ended
Feb. 28, | | Year ended
Feb. 29, | | Year ended
March 31, | |
| | | 2012 | | 2011 | | 2010 | | 2009 | | 2008(a)(b)(c) | | 2007(a) | |
| Class B | |
| Per share data | |
| Net asset value, beginning of period | | $ | 10.63 | | | $ | 7.85 | | | $ | 5.31 | | | $ | 9.44 | | | $ | 12.49 | | | $ | 16.21 | | |
| Income from investment operations: | |
| Net investment loss | | | (0.18 | ) | | | (0.15 | ) | | | (0.12 | ) | | | (0.13 | ) | | | (0.13 | ) | | | (0.21 | ) | |
| Net realized and unrealized gain (loss) | | | 0.02 | | | | 2.93 | | | | 2.65 | | | | (4.00 | ) | | | (0.40 | ) | | | (0.22 | )(d) | |
| Total from investment operations | | | (0.16 | ) | | | 2.78 | | | | 2.53 | | | | (4.13 | ) | | | (0.53 | ) | | | (0.43 | ) | |
| Less distributions to shareholders from: | |
| Net realized gains | | | — | | | | — | | | | — | | | | — | | | | (2.50 | ) | | | (3.29 | ) | |
| Tax return of capital | | | — | | | | — | | | | — | | | | — | | | | (0.02 | ) | | | — | | |
| Total distributions to shareholders | | | — | | | | — | | | | — | | | | — | | | | (2.52 | ) | | | (3.29 | ) | |
| Proceeds from regulatory settlement | | | 0.03 | | | | 0.00 | (e) | | | 0.01 | | | | — | | | | — | | | | — | | |
| Net asset value, end of period | | $ | 10.50 | | | $ | 10.63 | | | $ | 7.85 | | | $ | 5.31 | | | $ | 9.44 | | | $ | 12.49 | | |
| Total return | | | (1.22 | %)(f) | | | 35.41 | % | | | 47.83 | % | | | (43.75 | %) | | | (7.15 | %) | | | (0.69 | %) | |
| Ratios to average net assets(g) | |
Expenses prior to fees waived or expenses reimbursed
(including interest expense) | | | 2.10 | % | | | 2.07 | %(h) | | | 2.12 | %(h) | | | 2.07 | %(h) | | | 1.99 | %(h)(i) | | | 2.01 | % | |
Net expenses after fees waived or expenses reimbursed
(including interest expense)(j) | | | 2.09 | %(k) | | | 2.07 | %(h)(k) | | | 2.11 | %(h)(k) | | | 2.02 | %(h)(k) | | | 1.95 | %(h)(i)(k) | | | 1.98 | %(k) | |
Expenses prior to fees waived or expenses reimbursed
(excluding interest expense) | | | 2.10 | % | | | 2.07 | % | | | 2.12 | % | | | 2.07 | % | | | 1.99 | %(i) | | | 2.01 | % | |
Net expenses after fees waived or expenses reimbursed
(excluding interest expense)(j) | | | 2.09 | %(k) | | | 2.07 | %(k) | | | 2.11 | %(k) | | | 2.02 | %(k) | | | 1.95 | %(i)(k) | | | 1.98 | %(k) | |
| Net investment loss | | | (1.74 | %)(k) | | | (1.74 | %)(k) | | | (1.66 | %)(k) | | | (1.54 | %)(k) | | | (1.60 | %)(i)(k) | | | (1.58 | %)(k) | |
| Supplemental data | |
| Net assets, end of period (in thousands) | | $ | 1,027 | | | $ | 2,016 | | | $ | 3,340 | | | $ | 3,362 | | | $ | 9,184 | | | $ | 13,018 | | |
| Portfolio turnover | | | 112 | % | | | 147 | % | | | 105 | % | | | 130 | % | | | 3 | %(l) | | | — | | |
| Turnover of Columbia Small Cap Growth Master Portfolio | | | — | | | | — | | | | — | | | | — | | | | 199 | % | | | 188 | % | |
Notes to Financial Highlights
(a) The per share amounts and percentages reflect income and expenses assuming inclusion of the Fund's proportionate share of the income and expenses of Columbia Small Cap Growth Master Portfolio.
(b) For the period from April 1, 2007 to February 29, 2008. In 2008, the Fund's fiscal year end was changed from March 31 to February 29.
(c) Effective February 28, 2008, the Fund converted to a stand-alone fund. Prior to February 28, 2008, the Fund operated in a master-feeder structure.
(d) The amount shown for a share outstanding does not correspond with the aggregate net gain on investments for the period due to timing of repurchases of Fund shares in relation to fluctuating market value of the investments in the Fund.
(e) Rounds to less than $0.01.
(f) During the year ended February 29, 2012, the Fund received proceeds from regulatory settlements. Had the Fund not received these proceeds, the total return would have been lower by 0.34%.
(g) In addition to the fees and expenses which the Fund bears directly, the Fund indirectly bears a pro rata share of the fees and expenses of the acquired funds in which it invests. Such indirect expenses are not included in the reported expense ratios.
(h) Includes interest expense which rounds to less than 0.01%.
(i) Annualized.
(j) The Investment Manager and certain of its affiliates agreed to waive/reimburse certain fees and expenses, if applicable.
(k) The benefits derived from expense reductions had an impact of less than 0.01%.
(l) Amount represents results after the Fund's conversion to a stand-alone structure on February 28, 2008.
The Accompanying Notes to Financial Statements are an integral part of this statement.
17
Financial Highlights (continued) – Columbia Small Cap Growth Fund II
| | | Year ended
Feb. 29, | | Year ended
Feb. 28, | | Year ended
Feb. 29, | | Year ended
March 31, | |
| | | 2012 | | 2011 | | 2010 | | 2009 | | 2008(a)(b)(c) | | 2007(a) | |
| Class C | |
| Per share data | |
| Net asset value, beginning of period | | $ | 10.89 | | | $ | 8.04 | | | $ | 5.44 | | | $ | 9.67 | | | $ | 12.74 | | | $ | 16.47 | | |
| Income from investment operations: | |
| Net investment loss | | | (0.19 | ) | | | (0.16 | ) | | | (0.12 | ) | | | (0.13 | ) | | | (0.17 | ) | | | (0.21 | ) | |
| Net realized and unrealized gain (loss) | | | 0.03 | | | | 3.01 | | | | 2.71 | | | | (4.10 | ) | | | (0.38 | ) | | | (0.23 | )(d) | |
| Total from investment operations | | | (0.16 | ) | | | 2.85 | | | | 2.59 | | | | (4.23 | ) | | | (0.55 | ) | | | (0.44 | ) | |
| Less distributions to shareholders from: | |
| Net realized gains | | | — | | | | — | | | | — | | | | — | | | | (2.50 | ) | | | (3.29 | ) | |
| Tax return of capital | | | — | | | | — | | | | — | | | | — | | | | (0.02 | ) | | | — | | |
| Total distributions to shareholders | | | — | | | | — | | | | — | | | | — | | | | (2.52 | ) | | | (3.29 | ) | |
| Proceeds from regulatory settlement | | | 0.03 | | | | 0.00 | (e) | | | 0.01 | | | | — | | | | — | | | | — | | |
| Net asset value, end of period | | $ | 10.76 | | | $ | 10.89 | | | $ | 8.04 | | | $ | 5.44 | | | $ | 9.67 | | | $ | 12.74 | | |
| Total return | | | (1.19 | %)(f) | | | 35.45 | % | | | 47.79 | % | | | (43.74 | %) | | | (7.17 | %) | | | (0.74 | %) | |
| Ratios to average net assets(g) | |
Expenses prior to fees waived or expenses reimbursed
(including interest expense) | | | 2.10 | % | | | 2.07 | %(h) | | | 2.12 | %(h) | | | 2.07 | %(h) | | | 1.99 | %(h)(i) | | | 2.01 | % | |
Net expenses after fees waived or expenses reimbursed
(including interest expense)(j) | | | 2.10 | %(k) | | | 2.07 | %(h)(k) | | | 2.11 | %(h)(k) | | | 2.02 | %(h)(k) | | | 1.95 | %(h)(i)(k) | | | 1.98 | %(k) | |
Expenses prior to fees waived or expenses reimbursed
(excluding interest expense) | | | 2.10 | % | | | 2.07 | % | | | 2.12 | % | | | 2.07 | % | | | 1.99 | %(i) | | | 2.01 | % | |
Net expenses after fees waived or expenses reimbursed
(excluding interest expense)(j) | | | 2.10 | %(k) | | | 2.07 | %(k) | | | 2.11 | %(k) | | | 2.02 | %(k) | | | 1.95 | %(i)(k) | | | 1.98 | %(k) | |
| Net investment loss | | | (1.73 | %)(k) | | | (1.75 | %)(k) | | | (1.66 | %)(k) | | | (1.55 | %)(k) | | | (1.60 | %)(i)(k) | | | (1.57 | %)(k) | |
| Supplemental data | |
| Net assets, end of period (in thousands) | | $ | 2,027 | | | $ | 2,627 | | | $ | 2,629 | | | $ | 2,081 | | | $ | 3,689 | | | $ | 4,998 | | |
| Portfolio turnover | | | 112 | % | | | 147 | % | | | 105 | % | | | 130 | % | | | 3 | %(l) | | | — | | |
| Turnover of Columbia Small Cap Growth Master Portfolio | | | — | | | | — | | | | — | | | | — | | | | 199 | % | | | 188 | % | |
Notes to Financial Highlights
(a) The per share amounts and percentages reflect income and expenses assuming inclusion of the Fund's proportionate share of the income and expenses of Columbia Small Cap Growth Master Portfolio.
(b) For the period from April 1, 2007 to February 29, 2008. In 2008, the Fund's fiscal year end was changed from March 31 to February 29.
(c) Effective February 28, 2008, the Fund converted to a stand-alone fund. Prior to February 28, 2008, the Fund operated in a master-feeder structure.
(d) The amount shown for a share outstanding does not correspond with the aggregate net gain on investments for the period due to timing of repurchases of Fund shares in relation to fluctuating market value of the investments in the Fund.
(e) Rounds to less than $0.01.
(f) During the year ended February 29, 2012, the Fund received proceeds from regulatory settlements. Had the Fund not received these proceeds, the total return would have been lower by 0.32%.
(g) In addition to the fees and expenses which the Fund bears directly, the Fund indirectly bears a pro rata share of the fees and expenses of the acquired funds in which it invests. Such indirect expenses are not included in the reported expense ratios.
(h) Includes interest expense which rounds to less than 0.01%.
(i) Annualized.
(j) The Investment Manager and certain of its affiliates agreed to waive/reimburse certain fees and expenses, if applicable.
(k) The benefits derived from expense reductions had an impact of less than 0.01%.
(l) Amount represents results after the Fund's conversion to a stand-alone structure on February 28, 2008.
The Accompanying Notes to Financial Statements are an integral part of this statement.
18
Financial Highlights (continued) – Columbia Small Cap Growth Fund II
| | | Year ended
Feb. 29,
2012(a) | |
| Class I | |
| Per share data | |
| Net asset value, beginning of period | | $ | 11.47 | | |
| Income from investment operations: | |
| Net investment loss | | | (0.02 | ) | |
| Net realized and unrealized gain | | | 1.28 | | |
| Total from investment operations | | | 1.26 | | |
| Proceeds from regulatory settlement | | | 0.03 | | |
| Net asset value, end of period | | $ | 12.76 | | |
| Total return | | | 11.25 | %(b) | |
| Ratios to average net assets(c) | |
| Expenses prior to fees waived or expenses reimbursed | | | 0.91 | %(d) | |
| Net expenses after fees waived or expenses reimbursed(e) | | | 0.91 | %(d)(f) | |
| Net investment loss | | | (0.56 | %)(d)(f) | |
| Supplemental data | |
| Net assets, end of period (in thousands) | | $ | 3 | | |
| Portfolio turnover | | | 112 | % | |
Notes to Financial Highlights
(a) For the period from November 16, 2011 (commencement of operations) to February 29, 2012.
(b) During the year ended February 29, 2012, the Fund received proceeds from regulatory settlements. Had the Fund not received these proceeds, the total return would have been lower by 0.31%.
(c) In addition to the fees and expenses which the Fund bears directly, the Fund indirectly bears a pro rata share of the fees and expenses of the acquired funds in which it invests. Such indirect expenses are not included in the reported expense ratios.
(d) Annualized.
(e) The Investment Manager and certain of its affiliates agreed to waive/reimburse certain fees and expenses, if applicable.
(f) The benefits derived from expense reductions had an impact of less than 0.01%.
The Accompanying Notes to Financial Statements are an integral part of this statement.
19
Financial Highlights (continued) – Columbia Small Cap Growth Fund II
| | | Year ended
Feb. 29, | | Year ended
Feb. 28, | | Year ended
Feb. 29, | | Year ended
March 31, | |
| | | 2012 | | 2011 | | 2010 | | 2009 | | 2008(a)(b)(c) | | 2007(a) | |
| Class Z | |
| Per share data | |
| Net asset value, beginning of period | | $ | 12.78 | | | $ | 9.34 | | | $ | 6.25 | | | $ | 11.01 | | | $ | 14.30 | | | $ | 18.06 | | |
| Income from investment operations: | |
| Net investment loss | | | (0.09 | ) | | | (0.08 | ) | | | (0.06 | ) | | | (0.05 | ) | | | (0.07 | ) | | | (0.08 | ) | |
| Net realized and unrealized gain (loss) | | | 0.02 | | | | 3.52 | | | | 3.14 | | | | (4.71 | ) | | | (0.44 | ) | | | (0.23 | )(d) | |
| Total from investment operations | | | (0.07 | ) | | | 3.44 | | | | 3.08 | | | | (4.76 | ) | | | (0.51 | ) | | | (0.31 | ) | |
| Less distributions to shareholders from: | |
| Net realized gains | | | — | | | | — | | | | — | | | | — | | | | (2.76 | ) | | | (3.45 | ) | |
| Tax return of capital | | | — | | | | — | | | | — | | | | — | | | | (0.02 | ) | | | — | | |
| Total distributions to shareholders | | | — | | | | — | | | | — | | | | — | | | | (2.78 | ) | | | (3.45 | ) | |
| Proceeds from regulatory settlement | | | 0.04 | | | | 0.00 | (e) | | | 0.01 | | | | — | | | | — | | | | — | | |
| Net asset value, end of period | | $ | 12.75 | | | $ | 12.78 | | | $ | 9.34 | | | $ | 6.25 | | | $ | 11.01 | | | $ | 14.30 | | |
| Total return | | | (0.23 | %)(f) | | | 36.83 | % | | | 49.44 | % | | | (43.23 | %) | | | (6.31 | %) | | | 0.33 | % | |
| Ratios to average net assets(g) | |
Expenses prior to fees waived or expenses reimbursed
(including interest expense) | | | 1.10 | % | | | 1.07 | %(h) | | | 1.12 | %(h) | | | 1.07 | %(h) | | | 0.99 | %(h)(i) | | | 1.01 | % | |
Net expenses after fees waived or expenses reimbursed
(including interest expense)(j) | | | 1.09 | %(k) | | | 1.07 | %(h)(k) | | | 1.11 | %(h)(k) | | | 1.02 | %(h)(k) | | | 0.95 | %(h)(i)(k) | | | 0.98 | %(k) | |
Expenses prior to fees waived or expenses reimbursed
(excluding interest expense) | | | 1.10 | % | | | 1.07 | % | | | 1.12 | % | | | 1.07 | % | | | 0.99 | %(i) | | | 1.01 | % | |
Net expenses after fees waived or expenses reimbursed
(excluding interest expense)(j) | | | 1.09 | %(k) | | | 1.07 | %(k) | | | 1.11 | %(k) | | | 1.02 | %(k) | | | 0.95 | %(i)(k) | | | 0.98 | %(k) | |
| Net investment loss | | | (0.73 | %)(k) | | | (0.75 | %)(k) | | | (0.65 | %)(k) | | | (0.54 | %)(k) | | | (0.59 | %)(i)(k) | | | (0.56 | %)(k) | |
| Supplemental data | |
| Net assets, end of period (in thousands) | | $ | 180,984 | | | $ | 219,512 | | | $ | 214,574 | | | $ | 143,511 | | | $ | 279,900 | | | $ | 378,164 | | |
| Portfolio turnover | | | 112 | % | | | 147 | % | | | 105 | % | | | 130 | % | | | 3 | %(l) | | | — | | |
| Turnover of Columbia Small Cap Growth Master Portfolio | | | — | | | | — | | | | — | | | | — | | | | 199 | % | | | 188 | % | |
Notes to Financial Highlights
(a) The per share amounts and percentages reflect income and expenses assuming inclusion of the Fund's proportionate share of the income and expenses of Columbia Small Cap Growth Master Portfolio.
(b) For the period from April 1, 2007 to February 29, 2008. In 2008, the Fund's fiscal year end was changed from March 31 to February 29.
(c) Effective February 28, 2008, the Fund converted to a stand-alone fund. Prior to February 28, 2008, the Fund operated in a master-feeder structure.
(d) The amount shown for a share outstanding does not correspond with the aggregate net gain on investments for the period due to timing of repurchases of Fund shares in relation to fluctuating market value of the investments in the Fund.
(e) Rounds to less than $0.01.
(f) During the year ended February 29, 2012, the Fund received proceeds from regulatory settlements. Had the Fund not received these proceeds, the total return would have been lower by 0.32%.
(g) In addition to the fees and expenses which the Fund bears directly, the Fund indirectly bears a pro rata share of the fees and expenses of the acquired funds in which it invests. Such indirect expenses are not included in the reported expense ratios.
(h) Includes interest expense which rounds to less than 0.01%.
(i) Annualized.
(j) The Investment Manager and certain of its affiliates agreed to waive/reimburse certain fees and expenses, if applicable.
(k) The benefits derived from expense reductions had an impact of less than 0.01%.
(l) Amount represents results after the Fund's conversion to a stand-alone structure on February 28, 2008.
The Accompanying Notes to Financial Statements are an integral part of this statement.
20
Notes to Financial Statements – Columbia Small Cap Growth Fund II
February 29, 2012
Note 1. Organization
Columbia Small Cap Growth Fund II (the Fund), a series of Columbia Funds Series Trust (the Trust), is a diversified fund. The Trust is registered under the Investment Company Act of 1940, as amended (the 1940 Act), as an open-end management investment company organized as a Delaware statutory trust.
Fund Shares
The Trust may issue an unlimited number of shares (without par value). The Fund offers Class A, Class B, Class C, Class I and Class Z shares. All share classes have identical voting, dividend and liquidation rights. Each share class has its own expense structure and sales charges, as applicable.
Effective April 29, 2011, the Fund is closed to new investors and new accounts, subject to certain limited exceptions.
On December 8, 2011, an affiliated fund of funds managed by Columbia Management Investment Advisers, LLC (the Investment Manager), a wholly-owned subsidiary of Ameriprise Financial, Inc. (Ameriprise Financial), exchanged Class Z shares valued at $11,149,900 for Class I shares.
Class A shares are subject to a maximum front-end sales charge of 5.75% based on the initial investment amount. Class A shares purchased without an initial sales charge in accounts aggregating $1 million to $50 million at the time of purchase are subject to a contingent deferred sales charge (CDSC) if the shares are sold within 18 months of purchase, charged as follows: 1.00% CDSC if redeemed within 12 months of purchase, and 0.50% CDSC if redeemed more than 12, but less than 18, months after purchase.
Class B shares may be subject to a maximum CDSC of 5.00% based upon the holding period after purchase. Class B shares will generally convert to Class A shares eight years after purchase.
Class C shares are subject to a 1.00% CDSC on shares redeemed within one year of purchase.
Class I shares are not subject to sales charges and are only available to the Columbia Family of Funds. Class I shares commenced operations on November 16, 2011.
Class Z shares are not subject to sales charges, and are only available to certain investors, as described in the Fund's prospectus.
Note 2. Summary of Significant Accounting Policies
Use of Estimates
The preparation of financial statements in accordance with U.S. generally accepted accounting principles (GAAP) requires management to make certain estimates and assumptions that affect the reported amounts of assets and liabilities, the disclosure of contingent assets and liabilities at the date of the financial statements and the reported amounts of revenue and expenses during the reporting period. Actual results could differ from those estimates.
The following is a summary of significant accounting policies consistently followed by the Fund in the preparation of its financial statements.
Security Valuation
All equity securities are valued at the close of business of the New York Stock Exchange (NYSE). Equity securities are valued at the last quoted sales price on the principal exchange or market on which they trade, except for securities traded on the NASDAQ Stock Market, which are valued at the NASDAQ official close price. Unlisted securities or listed securities for which there were no sales during the day are valued at the mean of the latest quoted bid and asked prices on such exchanges or markets.
Foreign securities are valued based on quotations from the principal market in which such securities are normally traded. If any foreign share prices are not readily available as a result of limited share activity the securities are valued at the mean of the latest quoted bid and asked prices on such exchanges or markets. Foreign currency exchange rates are generally determined at 4:00 p.m. Eastern (U.S.) time. However, many securities markets and exchanges outside the U.S. close prior to the close of the NYSE; therefore, the closing prices for securities in such markets or on such exchanges may not fully reflect events that occur after such close but before the close of the NYSE. In those situations, foreign securities will be fair valued pursuant to the policy adopted by the Board of Trustees (the Board), including utilizing a third party pricing service to determine these fair values. The third party pricing service takes into account multiple factors, including, but not limited to, movements in the U.S. securities markets, certain depositary receipts, futures contracts and foreign exchange
21
Columbia Small Cap Growth Fund II, February 29, 2012
rates that have occurred subsequent to the close of the foreign exchange, to determine a good faith estimate that reasonably reflects the current market conditions as of the close of the NYSE. The fair value of a security is likely to be different from the quoted or published price, if available.
Investments in other open-end investment companies, including money market funds, are valued at net asset value.
Short-term securities purchased within 60 days to maturity are valued at amortized cost, which approximates market value. The value of short-term securities originally purchased with maturities greater than 60 days is determined based on an amortized value to par upon reaching 60 days to maturity. Short-term securities maturing in more than 60 days from the valuation date are valued at the market price or approximate market value based on current interest rates.
Forward foreign currency exchange contracts are marked-to-market based upon foreign currency exchange rates provided by a pricing service.
Investments for which market quotations are not readily available, or that have quotations which management believes are not reliable, are valued at fair value as determined in good faith under consistently applied procedures established by and under the general supervision of the Board. If a security or class of securities (such as foreign securities) is valued at fair value, such value is likely to be different from the last quoted market price for the security. The determination of fair value often requires significant judgment. To determine fair value, management may use assumptions including but not limited to future cash flows and estimated risk premiums. Multiple inputs from various sources may be used to determine value.
Foreign Currency Transactions and Translation
The values of all assets and liabilities denominated in foreign currencies are translated into U.S. dollars at that day's exchange rates. Net realized and unrealized gains (losses) on foreign currency transactions and translations include gains (losses) arising from the fluctuation in exchange rates between trade and settlement dates on securities transactions, gains (losses) arising from the disposition of foreign currency and currency gains (losses) between the accrual and payment dates on dividends, interest income and foreign withholding taxes.
For financial statement purposes, the Fund does not distinguish that portion of gains (losses) on investments which is due to changes in foreign exchange rates from that which is due to changes in market prices of the investments. Such fluctuations are included with the net realized and unrealized gains (losses) on investments in the Statement of Operations.
Repurchase Agreements
The Fund may engage in repurchase agreement transactions with institutions that management has determined are creditworthy. The Fund, through the custodian, receives delivery of the underlying securities collateralizing a repurchase agreement. Management is responsible for determining that the collateral is at least equal, at all times, to the value of the repurchase obligation including interest. A repurchase agreement transaction involves certain risks in the event of default or insolvency of the counterparty. These risks include possible delays in or restrictions on a Fund's ability to dispose of the underlying securities and a possible decline in the value of the underlying securities during the period while the Fund seeks to assert its rights.
Security Transactions
Security transactions are accounted for on the trade date. Cost is determined and gains (losses) are based upon the specific identification method for both financial statement and federal income tax purposes.
Income Recognition
Corporate actions and dividend income are recorded on the ex-dividend date.
Interest income is recorded on the accrual basis.
The Fund receives distributions from holdings in real estate investment trusts (REITs) which report information on the character of their distributions annually. REIT distributions are allocated to dividend income, capital gain and return of capital based on estimates made by the Fund's management if actual information has not yet been reported. Return of capital is recorded as a reduction of the cost basis of securities held. Management's estimates are subsequently adjusted when the actual character of the distributions is disclosed by the REITs which could result in a proportionate increase in return of capital to shareholders.
22
Columbia Small Cap Growth Fund II, February 29, 2012
Awards from class action litigation are recorded as a reduction of cost basis if the Fund still owns the applicable securities on the payment date. If the Fund no longer owns the applicable securities, the proceeds are recorded as realized gains.
Expenses
General expenses of the Trust are allocated to the Fund and other funds of the Trust based upon relative net assets or other expense allocation methodologies determined by the nature of the expense. Expenses directly attributable to the Fund are charged to the Fund. Expenses directly attributable to a specific class of shares are charged to that share class.
Determination of Class Net Asset Value
All income, expenses (other than class-specific expenses, which are charged to that share class, as shown in the Statement of Operations) and realized and unrealized gains (losses) are allocated to each class of the Fund on a daily basis, based on the relative net assets of each class, for purposes of determining the net asset value of each class.
Federal Income Tax Status
The Fund intends to qualify each year as a regulated investment company under Subchapter M of the Internal Revenue Code, as amended, and will distribute substantially all of its taxable income (including net short-term capital gains), if any, for its tax year, and as such will not be subject to federal income taxes. In addition, the Fund intends to distribute in each calendar year substantially all of its net investment income, capital gains and certain other amounts, if any, such that the Fund should not be subject to federal excise tax. Therefore, no federal income or excise tax provision is recorded.
Distributions to Shareholders
Distributions from net investment income are declared and paid annually. Net realized capital gains, if any, are distributed along with the income dividend. Income distributions and capital gain distributions are determined in accordance with federal income tax regulations which may differ from GAAP.
Guarantees and Indemnifications
Under the Trust's organizational documents and, in some cases, by contract, its officers and trustees are indemnified against certain liabilities arising out of the performance of their duties to the Trust or its funds. In addition, certain of the Fund's contracts with its service providers contain general indemnification clauses. The Fund's maximum exposure under these arrangements is unknown since the amount of any future claims that may be made against the Fund cannot be determined, and the Fund has no historical basis for predicting the likelihood of any such claims.
Recent Accounting Pronouncement
Fair Value Measurements and Disclosures
In May 2011, the Financial Accounting and Standards Board (FASB) issued ASU No. 2011-04 modifying Topic 820, Fair Value Measurements and Disclosures. At the same time, the International Accounting Standards Board (IASB) issued International Financial Reporting Standard 13, Fair Value Measurement. The objective of the FASB and IASB is convergence of their guidance on fair value measurements and disclosures.
Specifically, ASU No. 2011-04 requires reporting entities to disclose i) the amounts of any transfers between Level 1 and Level 2, and the reasons for the transfers, ii) for Level 3 fair value measurements, a) quantitative information about significant unobservable inputs used, b) a description of the valuation processes used by the reporting entity and c) a narrative description of the sensitivity of the fair value measurement to changes in unobservable inputs if a change in those inputs might result in a significantly higher or lower fair value measurement. The effective date of ASU No. 2011-04 is for interim and annual periods beginning after December 15, 2011. At this time, management is evaluating the implications of this guidance and the impact it will have on the financial statement amounts and footnote disclosures, if any.
Note 3. Fees and Compensation Paid to Affiliates
Investment Management Fees
Under an Investment Management Services Agreement, the Investment Manager determines which securities will be purchased, held or sold. The management fee is an annual fee that is equal to a percentage of the Fund's average daily net assets that declines from 0.70% to 0.60% as the Fund's net assets increase. The effective management fee rate for the
23
Columbia Small Cap Growth Fund II, February 29, 2012
year ended February 29, 2012 was 0.70% of the Fund's average daily net assets.
Administration Fees
Under an Administrative Services Agreement, the Investment Manager serves as the Fund Administrator. The Fund pays the Fund Administrator an annual fee for administration and accounting services equal to 0.12% of the Fund's average daily net assets, less the fees that were payable by the Fund as described under the Pricing and Bookkeeping Fees note below.
Pricing and Bookkeeping Fees
Prior to June 27, 2011, the Fund had entered into a Financial Reporting Services Agreement (the Financial Reporting Services Agreement) with State Street Bank and Trust Company (State Street) and the Investment Manager pursuant to which State Street provided financial reporting services to the Fund. The Fund also entered into an Accounting Services Agreement (collectively with the Financial Reporting Services Agreement, the State Street Agreements) with State Street and the Investment Manager pursuant to which State Street provided accounting services to the Fund. Under the State Street Agreements, the Fund paid State Street an annual fee of $38,000 paid monthly plus an additional monthly fee based on an annualized percentage rate of average daily net assets of the Fund for the month. The aggregate fee did not exceed $140,000 per year (exclusive of out-of-pocket expenses and charges). The Fund also reimbursed State Street for certain out-of-pocket expenses and charges. Effective June 27, 2011, these services are provided under the Administrative Services Agreement discussed above.
Other Fees
Effective June 1, 2011, other expenses are for, among other things, certain expenses of the Fund or the Board, including: Fund boardroom and office expense, employee compensation, employee health and retirement benefits, and certain other expenses. Payment of these Fund and Board expenses is facilitated by a company providing limited administrative services to the Fund and the Board. For the period June 1, 2011 through February 29, 2012, other expenses paid to this company were $2,116.
Compensation of Board Members
Board members are compensated for their services to the Fund as disclosed in the Statement of Operations. Under a Deferred Compensation Plan (the Plan), the Board members who are not "interested persons" of the Fund, as defined under the 1940 Act, may elect to defer payment of up to 100% of their compensation. Deferred amounts are treated as though equivalent dollar amounts had been invested in shares of certain funds managed by the Investment Manager. The Fund's liability for these amounts is adjusted for market value changes and remains in the Fund until distributed in accordance with the Plan.
Compensation of Chief Compliance Officer
The Board has appointed a Chief Compliance Officer to the Fund in accordance with federal securities regulations. Effective April 1, 2011, the Fund's expenses associated with the Chief Compliance Officer are paid directly by the Investment Manager. Prior to April 1, 2011, the Fund, along with other affiliated funds, paid its pro-rata share of the expenses for the Chief Compliance Officer. Such fees did not exceed $15,000 per year.
Transfer Agent Fees
Under a Transfer and Dividend Disbursing Agent Agreement, Columbia Management Investment Services Corp. (the Transfer Agent), an affiliate of the Investment Manager and a wholly-owned subsidiary of Ameriprise Financial, is responsible for providing transfer agency services to the Fund. The Transfer Agent has contracted with Boston Financial Data Services (BFDS) to serve as sub-transfer agent.
The Transfer Agent receives monthly account-based service fees based on the number of open accounts and is reimbursed by the Fund for the fees and expenses the Transfer Agent pays to financial intermediaries that maintain omnibus accounts with the Fund that is a percentage of the average aggregate value of the Fund's shares maintained in each such omnibus account (other than omnibus accounts for which American Enterprise Investment Services Inc. is the broker of record or accounts where the beneficial shareholder is a customer of Ameriprise Financial Services, Inc., which are paid a per account fee). The Transfer Agent pays the fees of BFDS for services as sub-transfer agent and is not entitled to
24
Columbia Small Cap Growth Fund II, February 29, 2012
reimbursement for such fees from the Fund (with the exception of out-of-pocket fees).
The Transfer Agent also receives compensation from fees for various shareholder services and reimbursements for certain out-of-pocket expenses. Class I shares do not pay transfer agent fees.
For the year ended February 29, 2012, the Fund's effective transfer agent fee rates as a percentage of average daily net assets of each class were as follows:
| Class A | | | 0.19 | % | |
| Class B | | | 0.19 | | |
| Class C | | | 0.19 | | |
| Class Z | | | 0.19 | | |
An annual minimum account balance fee of $20 may apply to certain accounts with a value below the Fund's initial minimum investment requirements to reduce the impact of small accounts on transfer agent fees. These minimum account balance fees are recorded as part of expense reductions in the Statement of Operations. For the year ended February 29, 2012, these minimum account balance fees reduced total expenses by $15,932.
Distribution and Service Fees
The Fund has an agreement with Columbia Management Investment Distributors, Inc. (the Distributor), an affiliate of the Investment Manager and a wholly-owned subsidiary of Ameriprise Financial, for distribution and shareholder services. Pursuant to Rule 12b-1 under the 1940 Act, the Board has approved, and the Fund has adopted, distribution and shareholder service plans (the Plans) which set the distribution and service fees for the Fund. These fees are calculated daily and are intended to compensate the Distributor and/or eligible selling and/or servicing agents for selling shares of the Fund and providing services to investors.
The Plans require the payment of a monthly combined distribution and service fee to the Distributor at the maximum annual rate of 0.25% of the average daily net assets attributable to Class A shares of the Fund. The Plans also require the payment of a monthly service fee at the maximum annual rate of 0.25% of the average daily net assets attributable to Class B and Class C shares of the Fund and the payment of a monthly distribution fee at the maximum annual rate of 0.75% of the average daily net assets attributable to Class B and Class C shares of the Fund.
Sales Charges
Sales charges, including front-end charges and CDSCs, received by the Distributor for distributing Fund shares were $10,949 for Class A, $820 for Class B, and $6 Class C shares for the year ended February 29, 2012.
Expenses Waived/Reimbursed by the Investment Manager and its Affiliates
Effective July 1, 2011, the Investment Manager and certain of its affiliates have contractually agreed to waive fees and/or reimburse expenses (excluding certain fees and expenses described below), through June 30, 2012, unless sooner terminated at the sole discretion of the Board, so that the Fund's net operating expenses, after giving effect to fees waived/expenses reimbursed and any balance credits and/or overdraft charges from the Fund's custodian, do not exceed the following annual rates as a percentage of the class' average daily net assets:
| Class A | | | 1.35 | % | |
| Class B | | | 2.10 | | |
| Class C | | | 2.10 | | |
| Class I | | | 0.97 | | |
| Class Z | | | 1.10 | | |
Under the agreement, the following fees and expenses are excluded from the waiver/reimbursement commitment, and therefore will be paid by the Fund, if applicable: taxes (including foreign transaction taxes), expenses associated with investments in affiliated and non-affiliated pooled investment vehicles (including mutual funds and exchange traded funds), transaction costs and brokerage commissions, costs related to any securities lending program, dividend expenses associated with securities sold short, inverse floater program fees and expenses, transaction charges and interest on borrowed money, interest, extraordinary expenses and any other expenses the exclusion of which is specifically approved by the Board. This agreement may be modified or amended only with approval from all parties.
25
Columbia Small Cap Growth Fund II, February 29, 2012
Prior to July 1, 2011, the Investment Manager voluntarily agreed to reimburse a portion of the Fund's expenses (excluding certain expenses, such as distribution and services fees, brokerage commissions, interest, taxes and extraordinary expenses, but including custodian charges relating to overdrafts, if any) so that the Fund's ordinary net operating expenses, after giving effect to fees waived/expenses reimbursed and any balance credits and/or overdraft charges from the Fund's custodian, did not exceed 1.10% of the Fund's average daily net assets on an annualized basis.
Prior to May 1, 2011, the Investment Manager was entitled to recover from the Fund any fees waived and/or expenses reimbursed for a three year period following the date of such fee waiver and/or reimbursement under these arrangements if such recovery did not cause the Fund's expenses to exceed the expense limitations in effect at the time of recovery. Effective May 1, 2011, the Investment Manager has eliminated such fee recoupment provisions.
Note 4. Federal Tax Information
The timing and character of income and capital gain distributions are determined in accordance with income tax regulations, which may differ from GAAP because of temporary or permanent book to tax differences.
For the year ended February 29, 2012, these differences are primarily due to differing treatment for net operating losses, deferral/reversal of wash sales, passive foreign investment company (PFIC) holdings, capital loss carryforwards, deferred trustees expense, proceeds from litigation settlements, foreign currency translations and late year ordinary losses. To the extent these differences are permanent, reclassifications are made among the components of the Fund's net assets in the Statement of Assets and Liabilities. Temporary differences do not require reclassifications. In the Statement of Assets and Liabilities the following reclassifications were made:
Excess of distributions over net
investment income | | $ | 1,999,058 | | |
| Accumulated net realized loss | | | (208,548 | ) | |
| Paid-in capital | | | (1,790,510 | ) | |
Net investment income and net realized gains (losses), as disclosed in the Statement of Operations, and net assets were not affected by this reclassification.
For the years ended 2012 and 2011, there were no distributions.
At February 29, 2012, the components of distributable earnings on a tax basis were as follows:
| Undistributed ordinary income | | $ | — | | |
| Undistributed accumulated long-term gain | | | — | | |
| Unrealized appreciation | | | 40,587,895 | | |
At February 29, 2012, the cost of investments for federal income tax purposes was $280,892,865 and the aggregate gross unrealized appreciation and depreciation based on that cost was:
| Unrealized appreciation | | $ | 48,503,069 | | |
| Unrealized depreciation | | | (7,915,174 | ) | |
| Net unrealized appreciation | | $ | 40,587,895 | | |
The following capital loss carryforward, determined at February 29, 2012, may be available to reduce taxable income arising from future net realized gains on investments, if any, to the extent permitted by the Internal Revenue Code:
| Year of expiration | | Amount | |
| | 2018 | | | $ | 32,560,524 | | |
On December 22, 2010, the Regulated Investment Company Modernization Act of 2010 (the Act) was enacted, which changed various technical rules governing the tax treatment of regulated investment companies. The changes are generally effective for taxable years beginning after the date of enactment. Under the Act, the Fund will be permitted to carry forward capital losses incurred in taxable years beginning after the date of enactment for an unlimited period. However, any losses incurred during those future taxable years will be required to be utilized prior to the losses incurred in pre-enactment taxable years, which carry an expiration date.
26
Columbia Small Cap Growth Fund II, February 29, 2012
As a result of this ordering rule, pre-enactment capital loss carryforwards may be more likely to expire unused.
For the year ended February 29, 2012, $41,857,085 of capital loss carryforward was utilized.
Under current tax rules, regulated investment companies can elect to treat certain late-year ordinary losses incurred and post-October capital losses (capital losses realized after October 31) as arising on the first day of the following taxable year. As of February 29, 2012, the Fund will elect to treat late year losses of $713,352 as arising on March 1, 2012.
Management of the Fund has concluded that there are no significant uncertain tax positions that would require recognition in the financial statements. However, management's conclusion may be subject to review and adjustment at a later date based on factors including, but not limited to, new tax laws, regulations, and administrative interpretations (including relevant court decisions). Generally, the Fund's federal tax returns for the prior three fiscal years remain subject to examination by the Internal Revenue Service.
Note 5. Portfolio Information
The cost of purchases and proceeds from sales of securities, excluding short-term obligations, aggregated to $372,989,171 and $426,922,637, respectively, for the year ended February 29, 2012.
Note 6. Regulatory Settlements
During the year ended February 29, 2012, the Fund received payments of $950,234 resulting from certain regulatory settlements with third parties in which the Fund had participated. The payments have been included in "Proceeds from regulatory settlements" in the Statement of Changes in Net Assets.
During the year ended February 28, 2011, the Fund received payments of $76,427 resulting from certain regulatory settlements with third parties in which the Fund had participated. The payments have been included in "Proceeds from regulatory settlements" in the Statement of Changes in Net Assets.
Note 7. Lending of Portfolio Securities
Effective June 27, 2011, the Fund has entered into a Master Securities Lending Agreement (the Agreement) with JPMorgan Chase Bank, N.A. (JPMorgan). The Agreement, which replaces the previous security lending arrangement with State Street, authorizes JPMorgan as lending agent to lend securities to authorized borrowers in order to generate additional income on behalf of the Fund. Pursuant to the Agreement, the securities loaned are secured by cash or U.S. government securities equal to at least 100% of the market value of the loaned securities. Any additional collateral required to maintain those levels due to market fluctuations of the loaned securities is requested to be delivered the following business day. Cash collateral received is invested by the lending agent on behalf of the Fund into authorized investments pursuant to the Agreement. The investments made with the cash collateral are listed in the Portfolio of Investments. The values of such investments and any uninvested cash collateral are disclosed in the Statement of Assets and Liabilities along with the related obligation to return the collateral upon the return of the securities loaned. For the year ended February 29, 2012, the Fund did not participate in securities lending activity.
Risks of delay in recovery of securities or even loss of rights in the securities may occur should the borrower of the securities fail financially. Risks may also arise to the extent that the value of the securities loaned increases above the value of the collateral received. JPMorgan will indemnify the Fund from losses resulting from a borrower's failure to return a loaned security when due. Such indemnification does not extend to losses associated with declines in the value of cash collateral investments. The Investment Manager is not responsible for any losses incurred by the Fund in connection with the securities lending program. Loans are subject to termination by the Fund or the borrower at any time, and are, therefore, not considered to be illiquid investments.
Pursuant to the Agreement, the Fund receives income for lending its securities either in the form of fees or by earning interest on invested cash collateral, net of negotiated rebates paid to borrowers and fees paid to the lending agent for services provided and any other securities lending expenses. The Fund continues to earn and accrue interest and dividends on the securities loaned.
27
Columbia Small Cap Growth Fund II, February 29, 2012
Prior to June 27, 2011, the Fund participated in a securities lending arrangement with State Street. Each security on loan was collateralized in an amount at least equal to the market value of the securities loaned plus accrued income from the investment of collateral. The income generated by the investment of the collateral, net of any fees remitted to State Street as the lending agent and borrower rebates, was paid to the Fund.
Note 8. Custody Credits
Prior to June 27, 2011, the Fund had an agreement with its custodian bank under which custody fees may have been reduced by balance credits. These credits are recorded as part of expense reductions on the Statement of Operations. The Fund could have invested a portion of the assets utilized in connection with the expense offset arrangement in an income-producing asset if they had not entered into such an agreement. Subsequent to this date, the Fund may invest its daily balance in an affiliated money market fund as detailed below. For the period March 1, 2011 through June 26, 2011, these credits reduced total expenses by $5.
Note 9. Affiliated Money Market Fund
Effective June 27, 2011, the Fund may invest its daily cash balances in Columbia Short-Term Cash Fund, an affiliated money market fund established for the exclusive use by the Fund and other affiliated funds. The income earned by the Fund from such investments is included as "Dividends from affiliates" in the Statement of Operations. As an investing fund, the Fund indirectly bears its proportionate share of the expenses of Columbia Short-Term Cash Fund.
Note 10. Shareholder Concentration
At February 29, 2012, one unaffiliated shareholder account owned 42.5% of the outstanding shares of the Fund. The Fund has no knowledge about whether any portion of those shares was owned beneficially by such accounts. Subscription and redemption activity by concentrated accounts may have a significant effect on the operations of the Fund.
Note 11. Line of Credit
The Fund has entered into a revolving credit facility with a syndicate of banks led by JPMorgan Chase Bank, N.A. (the Administrative Agent), whereby the Fund may borrow for the temporary funding of shareholder redemptions or for other temporary or emergency purposes. The credit facility became effective on June 27, 2011, replacing a prior credit facility. The credit facility agreement, as amended, which is a collective agreement between the Fund and certain other funds managed by the Investment Manager, severally and not jointly, permits collective borrowings up to $500 million. Pursuant to a December 13, 2011 amendment to the credit facility agreement, interest is charged to each participating fund based on its borrowings at a rate equal to the higher of (i) the overnight federal funds rate plus 1.00% or (i) the one-month LIBOR rate plus 1.00%. Each borrowing under the credit facility matures no later than 60 days after the date of borrowing. The Fund also pays a commitment fee equal to its pro rata share of the amount of the credit facility at a rate of 0.08% per annum. For the period June 27, 2011 through December 12, 2011, interest was charged to each participating fund based on its borrowings at a rate equal to the sum of the federal funds rate plus (i) 1.25% per annum plus (ii) if one-month LIBOR exceeds the federal funds rate, the amount of such excess. The Fund also paid a commitment fee equal to its pro rata share of the amount of the credit facility at a rate of 0.10% per annum.
For the period May 16, 2011 through June 26, 2011, the Fund and certain other funds managed by the Investment Manager participated in a $150 million committed, unsecured revolving credit facility provided by State Street. For the period March 28, 2011 through May 15, 2011, the collective borrowing amount of the credit facility was $225 million. Prior to March 28, 2011, the collective borrowing amount of the credit facility was $280 million. Interest was charged to each fund based on its borrowings at a rate equal to the greater of the (i) federal funds rate plus 1.25% per annum or (ii) the overnight LIBOR rate plus 1.25% per annum. The Fund also paid a commitment fee equal to its pro rata share of the amount of the credit facility at a rate of 0.125% per annum.
The Fund had no borrowings during the year ended February 29, 2012.
Note 12. Subsequent Events
Management has evaluated the events and transactions that have occurred through the date the financial statements were
28
Columbia Small Cap Growth Fund II, February 29, 2012
issued and noted no items requiring adjustment of the financial statements or additional disclosure.
Note 13. Information Regarding Pending and Settled Legal Proceedings
In June 2004, an action captioned John E. Gallus et al. v. American Express Financial Corp. and American Express Financial Advisors Inc. was filed in the United States District Court for the District of Arizona. The plaintiffs allege that they are investors in several American Express Company mutual funds (currently branded as Columbia) and they purport to bring the action derivatively on behalf of those funds under the Investment Company Act of 1940. The plaintiffs allege that fees allegedly paid to the defendants by the funds for investment advisory and administrative services are excessive. The plaintiffs seek remedies including restitution and rescission of investment advisory and distribution agreements. The plaintiffs voluntarily agreed to transfer this case to the United States District Court for the District of Minnesota (the District Court). In response to defendants' motion to dismiss the complaint, the District Court dismissed one of plaintiffs' four claims and granted plaintiffs limited discovery. Defendants moved for summary judgment in April 2007. Summary judgment was granted in the defendants' favor on July 9, 2007. The plaintiffs filed a notice of appeal with the Eighth Circuit Court of Appeals (the Eighth Circuit) on August 8, 2007. On April 8, 2009, the Eighth Circuit reversed summary judgment and remanded to the District Court for further proceedings. On August 6, 2009, defendants filed a writ of certiorari with the U.S. Supreme Court (the Supreme Court), asking the Supreme Court to stay the District Court proceedings while the Supreme Court considered and ruled in a case captioned Jones v. Harris Associates, which involved issues of law similar to those presented in the Gallus case. On March 30, 2010, the Supreme Court issued its ruling in Jones v. Harris Associates, and on April 5, 2010, the Supreme Court vacated the Eighth Circuit's decision in the Gallus case and remanded the case to the Eighth Circuit for further consideration in light of the Supreme Court's decision in Jones v. Harris Associates. On June 4, 2010, the Eighth Circuit remanded the Gallus case to the District Court for further consideration in light of the Supreme Court's decision in Jones v. Harris Associates. On December 9, 2010, the District Court reinstated its July 9, 2007 summary judgment order in favor of the defendants. On January 10, 2011, plaintiffs filed a notice of appeal with the Eighth Circuit. In response to the plaintiffs' opening appellate brief filed on March 18, 2011, the defendants filed a response brief on May 4, 2011 with the Eighth Circuit. The plaintiffs filed a reply brief on May 26, 2011 and oral arguments took place on November 17, 2011. On March 30, 2012, the Eighth Circuit upheld the grant of summary judgment by the District Court in favor of the defendants.
In December 2005, without admitting or denying the allegations, American Express Financial Corporation (AEFC, which is now known as Ameriprise Financial, Inc. (Ameriprise Financial)) entered into settlement agreements with the Securities and Exchange Commission (SEC) and Minnesota Department of Commerce (MDOC) related to market timing activities. As a result, AEFC was censured and ordered to cease and desist from committing or causing any violations of certain provisions of the Investment Advisers Act of 1940, the Investment Company Act of 1940, and various Minnesota laws. AEFC agreed to pay disgorgement of $10 million and civil money penalties of $7 million. AEFC also agreed to retain an independent distribution consultant to assist in developing a plan for distribution of all disgorgement and civil penalties ordered by the SEC in accordance with various undertakings detailed at www.sec.gov/litigation/admin/ia-2451.pdf. Ameriprise Financial and its affiliates have cooperated with the SEC and the MDOC in these legal proceedings, and have made regular reports to the funds' Boards of Trustees.
Ameriprise Financial and certain of its affiliates have historically been involved in a number of legal, arbitration and regulatory proceedings, including routine litigation, class actions, and governmental actions, concerning matters arising in connection with the conduct of their business activities. Ameriprise Financial believes that the Funds are not currently the subject of, and that neither Ameriprise Financial nor any of its affiliates are the subject of, any pending legal, arbitration or regulatory proceedings that are likely to have a material adverse effect on the Funds or the ability of Ameriprise Financial or its affiliates to perform under their contracts with the Funds. Ameriprise Financial is required to make 10-Q, 10-K and, as necessary, 8-K filings with the Securities and Exchange Commission on legal and regulatory matters that relate to Ameriprise Financial and its affiliates.
29
Columbia Small Cap Growth Fund II, February 29, 2012
Copies of these filings may be obtained by accessing the SEC website at www.sec.gov.
There can be no assurance that these matters, or the adverse publicity associated with them, will not result in increased fund redemptions, reduced sale of fund shares or other adverse consequences to the Funds. Further, although we believe proceedings are not likely to have a material adverse effect on the Funds or the ability of Ameriprise Financial or its affiliates to perform under their contracts with the Funds, these proceedings are subject to uncertainties and, as such, we are unable to estimate the possible loss or range of loss that may result. An adverse outcome in one or more of these proceedings could result in adverse judgments, settlements, fines, penalties or other relief that could have a material adverse effect on the consolidated financial condition or results of operations of Ameriprise Financial.
30
Report of Independent Registered Public Accounting Firm
To the Trustees of Columbia Funds Series Trust and the Shareholders of Columbia Small Cap Growth Fund II
In our opinion, the accompanying statement of assets and liabilities, including the investment portfolio, and the related statements of operations and of changes in net assets and the financial highlights present fairly, in all material respects, the financial position of Columbia Small Cap Growth Fund II (the "Fund") (a series of Columbia Funds Series Trust) at February 29, 2012, the results of its operations for the year then ended, the changes in its net assets for each of the two years in the period then ended and the financial highlights for each of the periods indicated, in conformity with accounting principles generally accepted in the United States of America. These financial statements and financial highlights (hereafter referred to as "financial statements") are the responsibility of the Fund's management. Our responsibility is to express an opinion on these financial statements based on our audits. We conducted our audits of these financial statements in accordance with the standards of the Public Company Accounting Oversight Board (United States). Those standards require that we plan and perform the audit to obtain reasonable assurance about whether the financial statements are free of material misstatement. An audit includes examining, on a test basis, evidence supporting the amounts and disclosures in the financial statements, assessing the accounting principles used and significant estimates made by management, and evaluating the overall financial statement presentation. We believe that our audits, which included confirmation of securities at February 29, 2012 by correspondence with the custodian, transfer agent and brokers, provide a reasonable basis for our opinion.
PricewaterhouseCoopers LLP
Minneapolis, Minnesota
April 20, 2012
31
Fund Governance
Shareholders elect the Board that oversees the funds' operations. The Board appoints officers who are responsible for day-to-day business decisions based on policies set by the Board. The following table provides basic biographical information about the funds' Board members, including their principal occupations during the past five years, although specific titles for individuals may have varied over the period. Under current Board policy, members may serve until the next Board meeting after he or she reaches the mandatory retirement age established by the Board, or the fifteenth anniversary of the first Board meeting they attended as a member of the Board.
On September 29, 2009, Ameriprise Financial, the parent company of Columbia Management, entered into an agreement with Bank of America, N.A. ("Bank of America") to acquire a portion of the asset management business of Columbia Management Group, LLC and certain of its affiliated companies (the "Transaction"). Following the Transaction, which became effective on May 1, 2010, various alignment activities have occurred with respect to the Fund Family. In connection with the Transaction, Mr. Edward J. Boudreau, Jr., Mr. William P. Carmichael, Mr. William A. Hawkins, Mr. R. Glenn Hilliard, Mr. John J. Nagorniak, Ms. Minor M. Shaw and Dr. Anthony M. Santomero, who were members prior to the Transaction of the Legacy Columbia Nations funds' Board ("Nations Funds"), which includes Columbia Funds Series Trust, Columbia Funds Variable Insurance Trust I and Columbia Funds Master Investment Trust, LLC., began service on the Board for the Legacy RiverSource funds ("RiverSource Funds") effective June 1, 2011, which resulted in an overall increase from twelve Trustees to sixteen for all mutual funds overseen by the Board.
Independent Board Members
| Name, Address, Age | | Position Held
with Funds
and Length
of Service | | Principal Occupation During Past Five Years | | Number of
Funds in the
Fund Family
Overseen by
Board Member | | Other Present or
Past Directorships/
Trusteeships
(Within Past 5 Years) | |
| Kathleen Blatz | | | | | | | | | |
|
901 S. Marquette Ave.
Minneapolis, MN 55402
Age 57 | | Board member since 1/06 for RiverSource Funds and since 6/11 for Nations Funds | | Attorney; Chief Justice, Minnesota Supreme Court, 1998-2006 | | | 153 | | | None | |
|
| Edward J. Boudreau, Jr. | | | | | | | | | |
|
225 Franklin Street
Mail Drop
BX32 05228
Boston, MA 02110
Age 67 | | Board member since 6/11 for RiverSource Funds and since 1/05 for Nations Funds | | Managing Director, E.J. Boudreau & Associates (consulting) since 2000 | | | 146 | | | Former Trustee, BofA Funds Series Trust (11 funds) | |
|
| Pamela G. Carlton | | | | | | | | | |
|
901 S. Marquette Ave.
Minneapolis, MN 55402
Age 57 | | Board member since 7/07 for RiverSource Funds and since 6/11 for Nations Funds | | President, Springboard-Partners in Cross Cultural Leadership (consulting company) | | | 153 | | | None | |
|
32
Fund Governance (continued)
Independent Board Members (continued)
| Name, Address, Age | | Position Held
with Funds
and Length
of Service | | Principal Occupation During Past Five Years | | Number of
Funds in the
Fund Family
Overseen by
Board Member | | Other Present or
Past Directorships/
Trusteeships
(Within Past 5 Years) | |
| William P. Carmichael | | | | | | | | | |
|
225 Franklin Street
Mail Drop
BX32 05228
Boston, MA 02110
Age 68 | | Board member since 6/11 for RiverSource Funds and since 1999 for Nations Funds | | Retired | | | 146 | | | Director, Cobra Electronics Corporation (electronic equipment manufacturer); The Finish Line (athletic shoes and apparel); McMoRan Exploration Company (oil and gas exploration and development); former Trustee, BofA Funds Series Trust (11 funds); former Director, Spectrum Brands, Inc. (consumer products); former Director, Simmons Company (bedding) | |
|
| Patricia M. Flynn | | | | | | | | | |
|
901 S. Marquette Ave.
Minneapolis, MN 55402
Age 61 | | Board member since 11/04 for RiverSource Funds and since 6/11 for Nations Funds | | Trustee Professor of Economics and Management, Bentley University; former Dean, McCallum Graduate School of Business, Bentley University | | | 153 | | | None | |
|
| William A. Hawkins | | | | | | | | | |
|
225 Franklin Street
Mail Drop
BX32 05228
Boston, MA 02110
Age 69 | | Board member since 6/11 for RiverSource Funds and since 1/05 for Nations Funds | | Managing Director, Overton Partners (financial consulting), since August 2010; President and Chief Executive Officer, California General Bank, N.A., January 2008-August 2010 | | | 146 | | | Trustee, BofA Funds Series Trust (11 funds) | |
|
| R. Glenn Hilliard | | | | | | | | | |
|
225 Franklin Street
Mail Drop
BX32 05228
Boston, MA 02110
Age 69 | | Board member since 6/11 for RiverSource Funds and since 1/05 for Nations Funds | | Chairman and Chief Executive Officer, Hilliard Group LLC (investing and consulting), since April 2003; Non-Executive Director & Chairman, CNO Financial Group, Inc. (formerly Conseco, Inc.) (insurance), September 2003-May 2011 | | | 146 | | | Chairman, BofA Fund Series Trust (11 funds); former Director, CNO Financial Group, Inc. (insurance) | |
|
33
Fund Governance (continued)
Independent Board Members (continued)
| Name, Address, Age | | Position Held
with Funds
and Length
of Service | | Principal Occupation During Past Five Years | | Number of
Funds in the
Fund Family
Overseen by
Board Member | | Other Present or
Past Directorships/
Trusteeships
(Within Past 5 Years) | |
| Stephen R. Lewis, Jr. | | | | | | | | | |
|
901 S. Marquette Ave.
Minneapolis, MN 55402
Age 73 | | Chair of the Board for RiverSource Funds since 1/07, Board member for RiverSource Funds since 1/02 and since 6/11 for Nations Funds | | President Emeritus and Professor of Economics Emeritus, Carleton College | | | 153 | | | Director, Valmont Industries, Inc. (manufactures irrigation systems) | |
|
| John F. Maher | | | | | | | | | |
|
901 S. Marquette Ave.
Minneapolis, MN 55402
Age 68 | | Board member since 12/06 for Legacy Seligman funds, since 12/08 for RiverSource Funds and since 6/11 for Nations Funds | | Retired President and Chief Executive Officer and former Director, Great Western Financial Corporation (financial services), 1986-1997 | | | 153 | | | None | |
|
| John J. Nagorniak | | | | | | | | | |
|
225 Franklin Street
Mail Drop
BX32 05228
Boston, MA 02110
Age 67 | | Board member since 6/11 for RiverSource Funds and since 1/08 for Nations Funds | | Retired; President and Director, Foxstone Financial, Inc. (consulting), 2000-2007; Director, Mellon Financial Corporation affiliates (investing), 2000-2007; Chairman, Franklin Portfolio Associates (investing—Mellon affiliate), 1982-2007 | | | 146 | | | Trustee, Research Foundation of CFA Institute; Director, MIT Investment Company; Trustee, MIT 401k Plan; former Trustee, BofA Funds Series Trust (11 funds) | |
|
| Catherine James Paglia | | | | | | | | | |
|
901 S. Marquette Ave.
Minneapolis, MN 55402
Age 59 | | Board member since 11/04 for RiverSource Funds and since 6/11 for Nations Funds | | Director, Enterprise Asset Management, Inc. (private real estate and asset management company) | | | 153 | | | None | |
|
34
Fund Governance (continued)
Independent Board Members (continued)
| Name, Address, Age | | Position Held
with Funds
and Length
of Service | | Principal Occupation During Past Five Years | | Number of
Funds in the
Fund Family
Overseen by
Board Member | | Other Present or
Past Directorships/
Trusteeships
(Within Past 5 Years) | |
| Leroy C. Richie | | | | | | | | | |
|
901 S. Marquette Ave.
Minneapolis, MN 55402
Age 70 | | Board member since 2000 for Legacy Seligman funds, since 11/08 for RiverSource Funds and since 6/11 for Nations Funds | | Counsel, Lewis & Munday, P.C. since 2004; former Vice President and General Counsel, Automotive Legal Affairs, Chrysler Corporation | | | 153 | | | Director, Digital Ally, Inc. (digital imaging); Director, Infinity, Inc. (oil and gas exploration and production); Director, OGE Energy Corp. (energy and energy services) | |
|
| Minor M. Shaw | | | | | | | | | |
|
225 Franklin Street
Mail Drop
BX32 05228
Boston, MA 02110
Age 64 | | Board member since 6/11 for RiverSource Funds and since 2003 for Nations Funds | | President—Micco LLC (private investments) | | | 146 | | | Former Trustee, BofA Funds Series Trust (11 funds); Board Member, Piedmont Natural Gas; Director, Blue Cross Blue Shield of South Carolina | |
|
| Alison Taunton-Rigby | | | | | | | | | |
|
901 S. Marquette Ave.
Minneapolis, MN 55402
Age 67 | | Board member since 11/02 for RiverSource Funds and since 6/11 for Nations Funds | | Chief Executive Officer and Director, RiboNovix, Inc. 2003-2010 (biotechnology); former President, Aquila Biopharmaceuticals | | | 153 | | | Director, Healthways, Inc. (health management programs); Director, ICI Mutual Insurance Company, RRG; Director, Abt Associates (government contractor) | |
|
35
Fund Governance (continued)
Interested Board Member Not Affiliated with Investment Manager*
| Name, Address, Age | | Position Held
with Funds
and Length
of Service | | Principal Occupation During Past Five Years | | Number of
Funds in the
Fund Family
Overseen by
Board Member | | Other Present or
Past Directorships/
Trusteeships
(Within Past 5 Years) | |
| Anthony M. Santomero* | | | | | | | | | |
|
225 Franklin Street
Mail Drop
BX32 05228
Boston, MA 02110
Age 65 | | Board member since 6/11 for RiverSource Funds and since 1/08 for Nations Funds | | Richard K. Mellon Professor Emeritus of Finance, The Wharton School, University of Pennsylvania, since 2002; Senior Advisor, McKinsey & Company (consulting), 2006-2008; President and Chief Executive Officer, Federal Reserve Bank of Philadelphia, 2000-2006 | | | 146 | | | Director, Renaissance Reinsurance Ltd.; Trustee, Penn Mutual Life Insurance Company; Director, Citigroup; Director, Citibank, N.A.; former Trustee, BofA Funds Series Trust (11 funds) | |
|
* Dr. Santomero is not an affiliated person of the Investment Manager or Ameriprise Financial. However, he is currently deemed by the funds to be an "interested person" (as defined in the 1940 Act) of the Funds because he serves as a Director of Citigroup, Inc. and Citibank N.A., companies that may directly or through subsidiaries and affiliates engage from time-to-time in brokerage execution, principal transactions and lending relationships with the funds or accounts advised/managed by the Investment Manager.
Interested Board Member Affiliated with Investment Manager*
| William F. Truscott | | | | | | | | | |
|
53600 Ameriprise Financial Center
Minneapolis, MN 55474
Age 51 | | Board member since 11/01 for RiverSource Funds and since 6/11 for Nations Funds; Senior Vice President since 2002 for RiverSource Funds and 5/10 for Nations Funds | | Chairman of the Board and President, Columbia Management Investment Advisers, LLC since May 2010 and February 2012, respectively (previously President, Chairman of the Board and Chief Investment Officer, 2001-April 2010); Chief Executive Officer, U.S. Asset Management & President, Annuities, Ameriprise Financial, Inc. since May 2010 (previously President—U.S. Asset Management and Chief Investment Officer, 2005-April 2010); Director, President and Chief Executive Officer, Ameriprise Certificate Company since 2006; Director and Chief Executive Officer, Columbia Management Investment Distributors, Inc. since May 2010 and February 2012, respectively (previously Chairman of the Board and Chief Executive Officer, 2006-April 2010); Chairman of the Board and Chief Executive Officer, RiverSource Distributors, Inc. since 2006. | | | 153 | | | None | |
|
* Interested person (as defined under the 1940 Act) by reason of being an officer, director, security holder and/or employee of the Investment Manager or Ameriprise Financial.
The SAI has additional information about the Fund's Board members and is available, without charge, upon request by calling 800.345.6611; contacting your financial intermediary; or visiting columbiamanagement.com.
36
Fund Governance (continued)
Officers
| Name, Year of Birth and Address | | Principal Occupation(s) During the Past Five Years | |
| J. Kevin Connaughton (Born 1964) | |
|
225 Franklin Street
Boston, MA 02110
President (since 2009) | | Senior Vice President and General Manager—Mutual Fund Products, Columbia Management Investment Advisers, LLC since May 2010; President, Columbia Funds, since 2009, and RiverSource Funds, since May 2010 (previously Senior Vice President and Chief Financial Officer, Columbia Funds, from June 2008 to January 2009, Treasurer, Columbia Funds, from October 2003 to May 2008, and senior officer of various other affiliated funds since 2000); Managing Director, Columbia Management Advisors, LLC from December 2004 to April 2010. | |
|
| Michael G. Clarke (Born 1969) | |
|
225 Franklin Street
Boston, MA 02110
Treasurer (since 2011) and Chief Financial Officer (since 2009) | | Vice President, Columbia Management Investment Advisers, LLC since May 2010; Managing Director of Fund Administration, Columbia Management Advisors, LLC, from September 2004 to April 2010; senior officer of Columbia Funds and affiliated funds since 2002. | |
|
| Scott R. Plummer (Born 1959) | |
|
5228 Ameriprise Financial Center
Minneapolis, MN 55474
Senior Vice President and Chief Legal Officer (since 2010) | | Chief Legal Officer and Assistant Secretary, Columbia Management Investment Advisers, LLC since June 2005; Vice President and Lead Chief Counsel—Asset Management, Ameriprise Financial, Inc. since May 2010 (previously Vice President and Chief Counsel—Asset Management, from 2005 to April 2010, Vice President, Chief Counsel and Assistant Secretary, Columbia Management Investment Distributors, Inc. since 2008; Vice President, General Counsel and Secretary, Ameriprise Certificate Company since 2005; Chief Counsel, RiverSource Distributors, Inc. since 2006; Senior officer of Columbia Funds and affiliated funds, since 2006. | |
|
| Thomas P. McGuire (Born 1972) | |
|
225 Franklin Street
Boston, MA 02110
Chief Compliance Officer (since 2012) | | Vice President—Asset Management Compliance, Columbia Management Investment Advisers, LLC since March 2010; Chief Compliance Officer, Ameriprise Certificate Company, since September 2010; Compliance Executive, Bank of America, from June 2005 to April 2010. | |
|
| William F. Truscott (Born 1960) | |
|
53600 Ameriprise Financial Center
Minneapolis, MN 55474
Senior Vice President (since 2010) | | Chairman of the Board and President, Columbia Management Investment Advisers, LLC since May 2010 and February 2012, respectively (previously President, Chairman of the Board and Chief Investment Officer, from 2001 to April 2010); Chief Executive Officer, U.S. Asset Management & President, Annuities, Ameriprise Financial, Inc. since May 2010 (previously President—U.S. Asset Management and Chief Investment Officer from 2005 to April 2010; Director, President and Chief Executive Officer, Ameriprise Certificate Company since 2006; Director and Chief Executive Officer, Columbia Management Investment Distributors, Inc. since May 2010 and February 2012, respectively (previously Chairman of the Board and Chief Executive Officer from 2008 to April 2010); Chairman of the Board and Chief Executive Officer, RiverSource Distributors, Inc. since 2006. | |
|
| Paul D. Pearson (Born 1956) | |
|
10468 Ameriprise Financial Center
Minneapolis, MN 55474
Vice President and Assistant Treasurer
(since 2011) | | Vice President—Investment Accounting, Columbia Management Investment Advisers, LLC, since May 2010; Vice President—Managed Assets, Investment Accounting, Ameriprise Financial Corporation, 1998-2010 | |
|
37
Fund Governance (continued)
Officers (continued)
| Name, Year of Birth and Address | | Principal Occupation(s) During the Past Five Years | |
| Colin Moore (Born 1958) | |
|
225 Franklin Street
Boston, MA 02110
Senior Vice President (since 2010) | | Director and Chief Investment Officer, Columbia Management Investment Advisers, LLC since May 2010; Manager, Managing Director and Chief Investment Officer of Columbia Management Advisors, LLC from 2007 to April 2010; Head of Equities, Columbia Management Advisors, LLC from 2002 to 2007. | |
|
| Christopher O. Petersen (Born 1970) | |
|
5228 Ameriprise Financial Center
Minneapolis, MN 55474
Vice President and Secretary (since 2011) | | Vice President and Chief Counsel, Ameriprise Financial since January 2010 (formerly Vice President and Group Counsel or Counsel from April 2004 to January 2010); Senior officer of Columbia Funds and affiliated funds, since 2007. | |
|
| Amy K. Johnson (Born 1965) | |
|
5228 Ameriprise Financial Center
Minneapolis, MN 55474
Vice President (since 2010) | | Senior Vice President and Chief Operating Officer, Columbia Management Investment Advisers, LLC since May 2010 (previously Chief Administrative Officer, from 2009 until April 2010, Vice President—Asset Management and Trust Company Services, from 2006 to 2009, and Vice President—Operations and Compliance from 2004 to 2006). | |
|
| Joseph F. DiMaria (Born 1968) | |
|
225 Franklin Street
Boston, MA 02110
Vice President (since 2011) and Chief Accounting Officer (since 2008) | | Vice President, Mutual Fund Administration, Columbia Management Investment Advisers, LLC, since May 2010; Director of Fund Administration, Columbia Management Advisors, LLC from January 2006 to April 2010. | |
|
| Paul B. Goucher (Born 1968) | |
|
100 Park Avenue
New York, NY 10017
Vice President and Assistant Secretary (since 2010) | | Vice President and Chief Counsel of Ameriprise Financial since January 2010 (formerly Vice President and Group Counsel from November 2008 to January 2010); Director, Managing Director and General Counsel of J. & W. Seligman & Co. Incorporated (Seligman) from July 2008 to November 2008 and Managing Director and Associate General Counsel of Seligman from January 2005 to July 2008. | |
|
| Michael E. DeFao (Born 1968) | |
|
225 Franklin Street
Boston, MA 02110
Vice President and Assistant Treasurer (since 2011) | | Vice President and Chief Counsel, Ameriprise Financial since May 2010; Associate General Counsel, Bank of America from June 2005 to April 2010. | |
|
| Stephen T. Welsh (Born 1957) | |
|
225 Franklin Street
Boston, MA 02110
Vice President (since 2006) | | President and Director, Columbia Management Investment Services Corp. since May 2010; President and Director, Columbia Management Services, Inc. from July 2004 to April 2010; Managing Director, Columbia Management Distributors, Inc. from August 2007 to April 2010. | |
|
38
This page intentionally left blank.
39
This page intentionally left blank.
40
Important Information About This Report
The fund mails one shareholder report to each shareholder address. If you would like more than one report, please call shareholder services at 1-800-345-6611 and additional reports will be sent to you. This report has been prepared for shareholders of Columbia Small Cap Growth Fund II.
A description of the policies and procedures that the fund uses to determine how to vote proxies and a copy of the fund's voting records are available (i) at www.columbiamanagement.com, (ii) on the Securities and Exchange Commission's website at www.sec.gov, and (iii) without charge, upon request, by calling 1-800-368-0346. Information regarding how the fund voted proxies relating to portfolio securities during the 12-month period ended June 30 is available from the SEC's website. Information regarding how the fund voted proxies relating to portfolio securities is also available from the fund's website, www.columbiamanagement.com.
The fund files a complete schedule of portfolio holdings with the SEC for the first and third quarters of each fiscal year on Form N-Q. The fund's Form N-Q is available on the SEC's website at www.sec.gov and may be reviewed and copied at the SEC's Public Reference Room in Washington, D.C. Information on the operation of the Public Reference Room may be obtained by calling 1-800-SEC-0330.
Transfer Agent
Columbia Management Investment
Services Corp.
P.O. Box 8081
Boston, MA 02266-8081
1-800-345-6611
Distributor
Columbia Management Investment
Distributors, Inc.
225 Franklin Street
Boston, MA 02110
Investment Manager
Columbia Management Investment Advisers, LLC
225 Franklin Street
Boston, MA 02110
41

Columbia Small Cap Growth Fund II
P. O. Box 8081
Boston, MA 02266-8081
columbiamanagement.com
This information is for use with concurrent or prior delivery of a fund prospectus. Investors should consider the investment objectives, risks, charges and expenses of a mutual fund carefully before investing. For a free prospectus, which contains this and other important information about the funds, visit columbiamanagement.com. Read the prospectus carefully before investing. The Fund is distributed by Columbia Management Investment Distributors, Inc., member FINRA, and managed by Columbia Management Investment Advisers, LLC.
© 2012 Columbia Management Investment Advisers, LLC. All rights reserved.
C-1251 C (4/12)

Columbia Overseas Value Fund
Annual Report for the Period Ended February 29, 2012
Not FDIC insured • No bank guarantee • May lose value
Table of Contents
| Fund Profile | | | 1 | | |
|
| Performance Information | | | 2 | | |
|
| Fund Expense Example | | | 3 | | |
|
| Portfolio Managers' Report | | | 4 | | |
|
| Portfolio of Investments | | | 6 | | |
|
Statement of Assets and
Liabilities | | | 11 | | |
|
| Statement of Operations | | | 13 | | |
|
Statement of Changes in
Net Assets | | | 14 | | |
|
| Financial Highlights | | | 15 | | |
|
| Notes to Financial Statements | | | 18 | | |
|
Report of Independent Registered
Public Accounting Firm | | | 30 | | |
|
| Federal Income Tax Information | | | 31 | | |
|
| Fund Governance | | | 32 | | |
|
Important Information About
This Report | | | 41 | | |
|
The views expressed in this report reflect the current views of the respective parties. These views are not guarantees of future performance and involve certain risks, uncertainties and assumptions that are difficult to predict, so actual outcomes and results may differ significantly from the views expressed. These views are subject to change at any time based upon economic, market or other conditions and the respective parties disclaim any responsibility to update such views. These views may not be relied on as investment advice and, because investment decisions for a Columbia Fund are based on numerous factors, may not be relied on as an indication of trading intent on behalf of any particular Columbia Fund. References to specific securities should not be construed as a recommendation or investment advice.
President's Message

Dear Shareholders,
Americans were dispirited in the fourth quarter of 2011 by Washington's inability to reach a plan for deficit reduction and Europe's piecemeal attempt to address its own fiscal issues. Yet, there was sufficient good news to encourage risk taking, buoying both stocks and bonds to solid gains.
U.S. economic data surprised on the upside and fears of recession abated. With the bar of expectations set low, investors responded positively to the announcement that the economy had expanded by 1.8% in the third quarter. Consumer confidence improved, even though consumers remain under pressure with no real increase in disposable income and a continued decline in household net worth. Headline inflation—which tracks a broad range of consumer expenditures, including food and energy—declined. Even manufacturing held its ground.
Against this backdrop, the U.S. equity markets logged solid returns. The S&P 500 Index gained 11.82%, moving into positive territory for the year with quarterly advances in all ten sectors. Mid- and small-cap stocks did even better. Value outperformed growth across all market capitalizations. Energy stocks led the market, as the price of oil moved above $100 a barrel in December. Industrials and materials stocks rose, buoyed by improving economic data. The U.S. fixed-income markets logged modest but solid returns. High-yield bonds were the best performers as the economy showed signs of improvement. Emerging market bonds were strong performers, as inflation came under control in key regions. Municipal bonds and Treasuries eked out only modest gains, as investors moved away from quality in favor of riskier assets.
While fourth quarter gains were encouraging, challenges still remain. Columbia Management, however, remains strong and steadfast. Columbia Management is the eighth largest manager of long-term mutual fund assets with $326 billion under management as of December 31, 2011. The past year has been one of considerable change for the organization as we worked diligently to align products, services and resources in the integration of Columbia Management with RiverSource Investments. The strong line-up of talent, resources and capabilities that has resulted is highlighted by the success of our products. As of December 31, 2011, Columbia Management offers 52 funds rated either 4 or 5 stars by Morningstar.*
For more information about these and other funds offered by Columbia Management, including detailed, up-to-date fund performance and portfolio information, please visit us online at columbiamanagement.com. Other information and resources available on our website include:
g timely economic analysis and market commentary
g quarterly fund commentaries
g Columbia Management Investor, a quarterly newsletter for shareholders
Thank you for your continued support of the Columbia Funds. We look forward to serving your investment needs for many years to come.
Best Regards,

J. Kevin Connaughton
President, Columbia Funds
*All ratings are based on Class Z shares as of 12/31/2011. Out of 119 Class Z share Columbia funds rated by Morningstar, 7 funds received a 5-star Overall Rating and 45 funds received a 4-star Overall Rating. The Overall Morningstar Rating for a retail mutual fund is derived from a weighted average of the performance figures associated with its 3-, 5- and 10-year (if applicable) Morningstar Rating metrics. For share classes that do not have a 3-, 5-, or 10-year actual performance history, the fund's independent Morningstar Rating metric is then compared against the retail mutual fund universe breakpoints to determine its hypothetical rating.
For each fund with at least a three-year history, Morningstar calculates a Morningstar RatingTM based on a Morningstar Risk-Adjusted Return measure that accounts for variation in a fund's monthly performance (including the effects of sales charges/loads, and redemption fees), placing more emphasis on downward variations and rewarding consistent performance. The top 10% of funds in each category receive 5 stars, the next 22.5% receive 4 stars, the next 35% receive 3 stars, the next 22.5% receive 2 stars and the bottom 10% receive 1 star. (Each share class is counted as a fraction of one fund within this scale and rated separately, which may cause slight variations in the distribution percentages.)
The Morningstar RatingTM is for Class Z shares only; other classes may have different performance characteristics and may have different ratings. ©2012 Morningstar, Inc. All Rights Reserved. The Morningstar information contained herein: (1) is proprietary to Morningstar and/or its content providers; (2) may not be copied or distributed; and (3) is not warranted to be accurate, complete or timely. Neither Morningstar nor its content providers are responsible for any damages or losses arising from any use of this information.
Investors should consider the investment objectives, risks, charges and expenses of a mutual fund carefully before investing. For a free prospectus, which contains this and other important information about the funds, visit columbiamanagement.com. The prospectus should be read carefully before investing.
Columbia Funds are distributed by Columbia Management Investment Distributors, Inc., member FINRA, and managed by Columbia Management Investment Advisers, LLC.
© 2012 Columbia Management Investment Advisers, LLC. All rights reserved.
Fund Profile – Columbia Overseas Value Fund
Summary
g For the 12-month period that ended February 29, 2012, the fund's Class Z shares returned –6.17%.
g The fund held up better than its benchmark, the MSCI EAFE Value Index (Net)1, which returned –9.85%.
g Good stock selection helped minimize the fund's losses as the European sovereign debt crisis created a difficult environment for foreign stock investing.
Portfolio Management
Colin Moore has managed the fund since November 2011. From 2002 until joining Columbia Management Investment Advisers, LLC (the Investment Manager) in May 2010, Mr. Moore was associated with the fund's previous investment adviser as an investment professional.
Fred Copper has managed the fund since 2008. From September 2005 until joining the Investment Manager in May 2010, Mr. Copper was associated with the fund's previous investment adviser as an investment professional.
1The MSCI Europe, Australasia, Far East (EAFE) Value Index (Net) is a subset of the MSCI EAFE Index, and constituents of the index include securities from Europe, Australasia and the Far East. The index generally represents approximately 50% of the free float-adjusted market capitalization of the MSCI EAFE Index, and consists of those securities classified by Morgan Stanley Capital International, Inc. (MSCI) as most representing the value style, such as, higher book value-to-price ratios, higher forward earnings-to-price ratios, higher dividend yields and lower forecasted growth rates than securities representing the growth style.
Indices are not available for investment, are not professionally managed and do not reflect sales charges, fees, brokerage commissions, taxes or other expenses of investing. Securities in the fund may not match those in an index.
Performance data quoted represents past performance and current performance may be lower or higher. Past performance is no guarantee of future results. The investment return and principal value will fluctuate so that shares, when redeemed, may be worth more or less than the original cost. Please visit www.columbiamanagement.com for daily and most recent month-end performance updates.
Summary
1-year return as of 02/29/12
| | | | –6.17% | |
|
|  | | | Class Z shares
(without sales charge) | |
|
| | | | –9.85% | |
|
|  | | | MSCI EAFE Value Index (Net) | |
|
Morningstar Style BoxTM
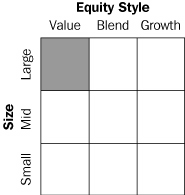
The Morningstar Style BoxTM is based on the fund's portfolio holdings. For equity funds, the vertical axis shows the market capitalization of the stocks owned, and the horizontal axis shows investment style (value, blend, or growth). Information shown is based on the most recent data provided by Morningstar.
© 2012 Morningstar, Inc. All rights reserved. The Morningstar information contained herein: (1) is proprietary to Morningstar and/or its content providers; (2) may not be copied or distributed; and (3) is not warranted to be accurate, complete or timely. Neither Morningstar nor its content providers are responsible for any damages or losses arising from any use of this information.
1
Performance Information – Columbia Overseas Value Fund
Performance data quoted represents past performance and current performance may be lower or higher. Past performance is no guarantee of future results. The investment return and principal value will fluctuate so that shares, when redeemed, may be worth more or less than the original cost. Please visit www.columbiamanagement.com for daily and most recent month-end performance updates.
Performance of a $10,000 investment 03/31/08 – 02/29/12
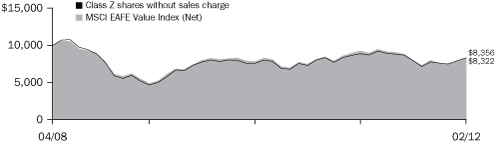
The chart above shows the change in value of a hypothetical $10,000 investment in Class Z shares of Columbia Overseas Value Fund during the stated time period, and does not reflect the deduction of taxes that a shareholder may pay on fund distributions or on the redemption of fund shares.
Performance of a $10,000 investment 03/31/08 – 02/29/12 ($)
| Sales charge: | | without | | with | |
| Class I* | | | 8,327 | | | | n/a | | |
| Class W* | | | 8,280 | | | | n/a | | |
| Class Z | | | 8,322 | | | | n/a | | |
Average annual total return as of 02/29/12 (%)
| Share class | | I* | | W* | | Z | |
| Inception | | 03/31/11 | | 03/31/11 | | 03/31/08 | |
| Sales charge | | without | | without | | without | |
| 1-year | | | –6.10 | | | | –6.36 | | | | –6.17 | | |
| Life | | | –4.57 | | | | –4.71 | | | | –4.58 | | |
The Fund commenced operations on March 31, 2008. The returns shown have not been adjusted to reflect differences in expenses. If differences in expenses were reflected, the return shown would have been lower.
All results shown assume reinvestment of distributions. Class I and Class Z shares are sold at net asset value with no distribution and service (Rule 12b-1) fees. Class W shares are sold at net asset value with service (Rule 12b-1) fees. Class Z shares have limited eligibility and the investment minimum requirements may vary. Please see the fund's prospectuses for details. Performance for different share classes will vary based on differences in sales charges and fees associated with each class.
Performance results reflect any fee waivers or reimbursements of fund expenses by Columbia Management Investment Advisers, LLC and/or any of its affiliates. Absent these fee waivers or expense reimbursement arrangements, performance results would have been lower.
Class I and Class W shares were initially offered on March 31, 2011.
The tables do not reflect the deduction of taxes that a shareholder may pay on fund distributions or on the redemption of fund shares.
*The returns shown for periods prior to the share class inception date (including returns since inception) include the returns of the fund's oldest share class. These returns are adjusted to reflect any higher class-related operating expenses of the newer share classes, as applicable. Please visit columbiamanagement.com/mutual-funds/appended-performance for more information.
2
Fund Expense Example – Columbia Overseas Value Fund
As an investor, you incur two types of costs. There are transaction costs, which generally include sales charges on purchases and may include redemption fees. There are also ongoing costs, which generally include management fees, distribution and service (Rule 12b-1) fees, and other fund expenses. The following information is intended to help you understand your ongoing costs (in dollars) of investing in the Fund and to help you compare these costs with the ongoing costs of investing in other mutual funds.
Analyzing your fund's expenses
To illustrate these ongoing costs, we have provided examples and calculated the expenses paid by investors in each share class of the Fund during the period. The actual and hypothetical information in the table is based on an initial investment of $1,000 at the beginning of the period indicated and held for the entire period. Expense information is calculated two ways and each method provides you with different information. The amount listed in the "Actual" column is calculated using the Fund's actual operating expenses and total return for the period. You may use the Actual information, together with the amount invested, to estimate the expenses that you paid over the period. Simply divide your account value by $1,000 (for example, an $8,600 account value divided by $1,000 = 8.6), then multiply the results by the expenses paid during the period under the Actual column. The amount listed in the "Hypothetical" column assumes a 5% annual rate of return before expenses (which is not the Fund's actual return) and then applies the Fund's actual expense ratio for the period to the hypothetical return. You should not use the hypothetical account values and expenses to estimate either your actual account balance at the end of the period or the expenses you paid during the period. See "Compare with other funds" below for details on how to use the hypothetical data.
Compare with other funds
Since all mutual funds are required to include the same hypothetical calculations about expenses in shareholder reports, you can use this information to compare the ongoing cost of investing in the Fund with other funds. To do so, compare the hypothetical example with the 5% hypothetical examples that appear in the shareholder reports of other funds. As you compare hypothetical examples of other funds, it is important to note that hypothetical examples are meant to highlight the ongoing costs of investing in a fund only and do not reflect any transaction costs, such as sales charges, or redemption or exchange fees. Therefore, the hypothetical calculations are useful in comparing ongoing costs only, and will not help you determine the relative total costs of owning different funds. If transaction costs were included in these calculations, your costs would be higher.
09/01/11 – 02/29/12
| | | Account value at the
beginning of the period ($) | | Account value at the
end of the period ($) | | Expenses paid
during the period ($) | | Fund's annualized
expense ratio (%) | |
| | | Actual | | Hypothetical | | Actual | | Hypothetical | | Actual | | Hypothetical | | Actual | |
| Class I | | | 1,000.00 | | | | 1,000.00 | | | | 1,047.70 | * | | | 1,021.18 | | | | 4.09 | * | | | 3.72 | | | | 0.74 | | |
| Class W | | | 1,000.00 | | | | 1,000.00 | | | | 1,046.30 | * | | | 1,020.14 | | | | 5.25 | * | | | 4.77 | | | | 0.95 | | |
| Class Z | | | 1,000.00 | | | | 1,000.00 | | | | 1,047.00 | | | | 1,021.13 | | | | 3.82 | | | | 3.77 | | | | 0.75 | | |
Expenses paid during the period are equal to the annualized expense ratio for each class as indicated above, multiplied by the average account value over the period and then multiplied by the number of days in the Fund's most recent fiscal half year and divided by 366.
Expenses do not include fees and expenses incurred indirectly by the Fund from the underlying funds in which the Fund may invest (also referred to as "acquired funds"), including affiliated and non-affiliated pooled investments vehicles (including mutual funds and exchange traded funds).
Had Columbia Management Investment Advisers, LLC and/or any of its affiliates not waived/reimbursed a portion of fees and expenses, account value at the end of the period would have been reduced.
*For the period March 31, 2011 through February 29, 2012. Class I and Class W shares commenced operations on March 31, 2011.
3
Portfolio Managers' Report – Columbia Overseas Value Fund
Performance data quoted represents past performance and current performance may be lower or higher. Past performance is no guarantee of future results. The investment return and principal value will fluctuate so that shares, when redeemed, may be worth more or less than the original cost. Please visit www.columbiamanagement.com for daily and most recent month-end performance updates.
Net asset value per share
as of 02/29/12 ($)
| Class I | | | 7.22 | | |
| Class W | | | 7.22 | | |
| Class Z | | | 7.23 | | |
Distributions declared per share
03/01/11 – 02/29/12 ($)
| Class I | | | 0.25 | | |
| Class W | | | 0.23 | | |
| Class Z | | | 0.24 | | |
For the 12-month period that ended February 29, 2012, the fund's Class Z shares returned –6.17%. The fund's benchmark, the MSCI EAFE Value Index (Net), returned –9.85%. In a period during which foreign stocks produced generally weak results, stock selection helped minimize the fund's losses. An underweight in financial and utility stocks also aided returns.
Europe's debt crisis weighed on foreign stock markets
Stock markets that are highly exposed to the European sovereign debt crisis endured turmoil during the 12-month period. Tensions over European government debt eased somewhat in the final months of the period, following interventions by the European Central Bank, and overseas markets recovered somewhat, led by a robust surge in emerging markets. Despite this late recovery, most international equity benchmarks still produced negative returns for the 12 months.
Sector allocations, stock selection drove results
As debt problems in Europe proved to be the single most powerful drag on the markets, a decision to underweight financials stocks, especially European banks, supported relative results. The fund's modest exposure to utilities also helped as the group was plagued by worries about nuclear safety following the meltdown of the plant owned by Tokyo Electric Power (TEPCO). The fund held no investment in TEPCO. By country, an out-of-benchmark investment in U.S.-based stocks was positive for returns. We held U.S. stocks because we believed it had dealt more successfully with banking industry problems than had European nations. In addition, relative performance was aided by underweights relative to the benchmark in the United Kingdom and Japan and lack of exposure to Greece.
Certain individual securities made positive contributions to return. South Korean consumer apparel manufacturer Youngone Corp. was well positioned to benefit when wage inflation in China encouraged clothing companies to look elsewhere. Youngone Corp., which maintained its manufacturing base in low-cost Bangladesh, benefited from this movement. While we sold the position in Youngone Corp. to take profits, we retained an interest by establishing a stake in Youngone Holdings (1.0% of net assets), which is an investor in Youngone Corp., and whose stock price looked more attractive. Hyundai Home Shopping (1.1% of net assets), a Korean television shopping network whose upscale products attract customers in Korea's expanding middle class, also delivered a solid return. Hyundai Home Shopping's buying relationship with former parent firm Hyundai Department Stores gave the network a competitive advantage in bargaining with suppliers. Electromagnetic GeoServices (0.8% of net assets), a Norwegian energy service firm involved in deepwater oil and gas exploration, was another solid performer. The company is the world's leading supplier of a sophisticated technology that produces three-dimensional maps of underwater oil and gas deposits, increasing the efficiency and effectiveness of underwater energy exploration activities.
4
Portfolio Managers' Report (continued) – Columbia Overseas Value Fund
Consumer, agricultural products disappointed
Pandora, a Danish costume jewelry company, was a noteworthy disappointment. Pandora's charm bracelets had been a major driver of growth, but the company had no adequate replacement when fashion fads changed. We sold the position in Pandora. Asian Citrus (0.7% of net assets), the largest citrus fruit producer in China, was another significant disappointment. The company was dragged down in a controversy surrounding two other companies involved in agricultural or forest products in China. However, we believe that Asian Citrus stock had been unfairly punished, and we retained the position because we liked its long-term growth potential.
Looking ahead
We have positioned the fund conservatively, placing even more emphasis on companies that we believe have shown consistent ability to produce stable cash flows and that maintain solid balance sheets and relatively little debt. We have taken a conservative stance even though we see some encouraging developments in the global economy. Leading indicators are increasingly positive for both U.S. and European economies, while generally accommodative central bank monetary policies support economic expansion.
However, the market rally of the first two months of 2012 may mean that most of the favorable economic news already is reflected in stock prices. And, we believe the European sovereign debt crisis is not over. The European Central Bank may have addressed worries about financial liquidity, but governments still have not resolved the underlying political and fiscal issues that caused the crisis.
Given these concerns, we have de-emphasized European investments and have underweighted highly cyclical stocks that are dependent on robust economic growth. We intend to keep the fund conservatively positioned until we see concrete evidence of change.
Portfolio characteristics and holdings are subject to change periodically and may not be representative of current characteristics and holdings. The outlook for the fund may differ from those presented for other Columbia Funds.
Equity securities are subject to stock market fluctuations that occur in response to economic and business developments.
International investing may involve certain risks, including currency fluctuations, risks associated with possible differences in financial accounting standards and other monetary and political risks. Significant levels of foreign taxes, including potentially confiscatory levels of taxation and withholding taxes, may also apply to some foreign investments.
Investing in emerging markets may involve greater risks than investing in more developed countries. In addition, concentration of investments in a single region may result in greater volatility.
Value stocks are securities of companies that may have experienced adverse business or industry developments or may be subject to special risks that have caused the stocks to be out of favor. If the manager's assessment of a company's prospects is wrong, the price of the company's stock may not approach the value the manager has placed on it.
Country breakdown1
as of 02/29/12 (%)
| Australia | | | 7.8 | | |
| Brazil | | | 1.1 | | |
| Canada | | | 3.0 | | |
| China | | | 1.0 | | |
| France | | | 7.9 | | |
| Germany | | | 7.5 | | |
| Hong Kong | | | 2.5 | | |
| Ireland | | | 2.3 | | |
| Israel | | | 0.8 | | |
| Italy | | | 3.2 | | |
| Japan | | | 20.5 | | |
| Netherlands | | | 2.6 | | |
| Norway | | | 4.0 | | |
| Philippines | | | 0.4 | | |
| Singapore | | | 0.9 | | |
| South Korea | | | 2.4 | | |
| Spain | | | 2.8 | | |
| Sweden | | | 3.7 | | |
| Switzerland | | | 5.6 | | |
| Taiwan | | | 0.6 | | |
| Thailand | | | 1.4 | | |
| United Kingdom | | | 17.9 | | |
| United States | | | 0.1 | | |
1Percentages indicated are based upon total investments. The Fund's portfolio composition is subject to change.
Top 10 holdings
as of 02/29/12 (%)
| Royal Dutch Shell PLC | | | 4.4 | | |
| Total SA | | | 3.5 | | |
| HSBC Holdings PLC | | | 2.5 | | |
| Sanofi | | | 2.5 | | |
Australia & New Zealand
Banking Group Ltd. | | | 2.2 | | |
| BP PLC | | | 2.2 | | |
| Banco Santander SA | | | 2.1 | | |
| Vodafone Group PLC | | | 2.1 | | |
Sumitomo Mitsui Financial
Group, Inc. | | | 2.0 | | |
| Novartis AG, Registered Shares | | | 1.7 | | |
The Fund is actively managed and the composition of its portfolio will change over time. Information provided is calculated as a percentages of total investments.
5
Portfolio of Investments – Columbia Overseas Value Fund
February 29, 2012
(Percentages represent value of investments compared to net assets)
| Issuer | | Shares | | Value | |
| Common Stocks 99.8% | |
| AUSTRALIA 7.7% | |
| AGL Energy Ltd. | | | 11,780 | | | $ | 175,989 | | |
| Australia & New Zealand Banking Group Ltd. | | | 28,819 | | | | 674,157 | | |
| Commonwealth Bank of Australia | | | 8,852 | | | | 467,480 | | |
| Iluka Resources Ltd. | | | 8,476 | | | | 150,319 | | |
| Macmahon Holdings Ltd.(a) | | | 199,363 | | | | 174,573 | | |
| National Australia Bank Ltd. | | | 12,339 | | | | 311,485 | | |
| Telstra Corp., Ltd. | | | 89,226 | | | | 314,811 | | |
| Westpac Banking Corp. | | | 5,513 | | | | 122,988 | | |
| Total | | | 2,391,802 | | |
| BRAZIL 1.1% | |
| Cia de Saneamento Basico do Estado de Sao Paulo | | | 5,100 | | | | 191,349 | | |
| Telefonica Brasil SA, ADR | | | 4,824 | | | | 141,970 | | |
| Total | | | 333,319 | | |
| CANADA 3.0% | |
| Centerra Gold, Inc. | | | 11,470 | | | | 230,687 | | |
| Cott Corp.(a) | | | 32,279 | | | | 211,750 | | |
| First Quantum Minerals Ltd. | | | 7,310 | | | | 167,263 | | |
| Neo Material Technologies, Inc.(a) | | | 12,929 | | | | 113,812 | | |
| Yamana Gold, Inc. | | | 11,876 | | | | 206,168 | | |
| Total | | | 929,680 | | |
| CHINA 1.0% | |
China Communications Construction Co., Ltd.,
Class H | | | 213,000 | | | | 217,313 | | |
| Spreadtrum Communications, Inc., ADR | | | 6,951 | | | | 96,480 | | |
| Total | | | 313,793 | | |
| FRANCE 7.9% | |
| Alcatel-Lucent(a) | | | 55,579 | | | | 139,358 | | |
| BNP Paribas SA | | | 9,413 | | | | 459,437 | | |
| Sanofi | | | 10,245 | | | | 757,679 | | |
| Total SA | | | 19,404 | | | | 1,085,523 | | |
| Total | | | 2,441,997 | | |
| GERMANY 7.5% | |
| Allianz SE, Registered Shares | | | 3,191 | | | | 387,002 | | |
| BASF SE | | | 2,142 | | | | 188,064 | | |
| Bayerische Motoren Werke AG | | | 2,963 | | | | 274,082 | | |
| Deutsche Bank AG, Registered Shares | | | 4,646 | | | | 216,986 | | |
| E.ON AG | | | 15,567 | | | | 358,075 | | |
| Freenet AG | | | 24,302 | | | | 329,280 | | |
| KHD Humboldt Wedag International AG(a) | | | 45,833 | | | | 378,592 | | |
| Kloeckner & Co. SE | | | 11,080 | | | | 171,164 | | |
| Total | | | 2,303,245 | | |
| HONG KONG 2.5% | |
| Asian Citrus Holdings Ltd. | | | 352,000 | | | | 211,763 | | |
| Cheung Kong Holdings Ltd. | | | 22,500 | | | | 327,852 | | |
| Hongkong Land Holdings Ltd. | | | 42,000 | | | | 231,397 | | |
| Total | | | 771,012 | | |
| IRELAND 2.3% | |
| DCC PLC | | | 9,172 | | | | 235,538 | | |
| Jazz Pharmaceuticals PLC(a) | | | 4,336 | | | | 227,510 | | |
| Smurfit Kappa Group PLC(a) | | | 22,989 | | | | 234,336 | | |
| Total | | | 697,384 | | |
| ISRAEL 0.8% | |
| Teva Pharmaceutical Industries Ltd., ADR | | | 5,635 | | | | 252,504 | | |
| Issuer | | Shares | | Value | |
| Common Stocks (continued) | |
| ITALY 3.2% | |
| Enel SpA | | | 53,588 | | | $ | 215,043 | | |
| ENI SpA | | | 16,268 | | | | 375,174 | | |
| Recordati SpA | | | 30,941 | | | | 234,969 | | |
| UniCredit SpA | | | 29,224 | | | | 152,081 | | |
| Total | | | 977,267 | | |
| JAPAN 20.5% | |
| Aeon Co., Ltd. | | | 20,800 | | | | 264,636 | | |
| Aeon Delight Co., Ltd. | | | 10,500 | | | | 198,026 | | |
| Arnest One Corp. | | | 19,700 | | | | 233,500 | | |
| Canon, Inc. | | | 5,900 | | | | 269,059 | | |
| Daiichikosho Co., Ltd. | | | 16,900 | | | | 340,203 | | |
| Exedy Corp. | | | 4,100 | | | | 122,552 | | |
| Fuji Machine Manufacturing Co., Ltd. | | | 11,900 | | | | 248,006 | | |
| Fuyo General Lease Co., Ltd. | | | 8,700 | | | | 311,846 | | |
| Hitachi Ltd. | | | 64,000 | | | | 375,513 | | |
| ITOCHU Corp. | | | 28,400 | | | | 323,249 | | |
| Japan Petroleum Exploration Co. | | | 4,300 | | | | 209,353 | | |
| K's Holdings Corp. | | | 5,600 | | | | 187,019 | | |
| Kansai Paint Co., Ltd. | | | 16,000 | | | | 151,583 | | |
| Kato Sangyo Co., Ltd. | | | 8,400 | | | | 161,373 | | |
| Kinki Sharyo Co. Ltd. | | | 52,000 | | | | 194,885 | | |
| Kobe Steel Ltd. | | | 66,000 | | | | 114,751 | | |
| Mandom Corp. | | | 8,100 | | | | 199,542 | | |
| Mitsubishi UFJ Financial Group, Inc. | | | 60,100 | | | | 310,604 | | |
| Nissan Motor Co., Ltd. | | | 43,200 | | | | 445,628 | | |
| NTT DoCoMo, Inc. | | | 202 | | | | 344,558 | | |
| Santen Pharmaceutical Co., Ltd. | | | 6,500 | | | | 257,931 | | |
| Shinko Plantech Co., Ltd. | | | 32,900 | | | | 289,699 | | |
| SoftBank Corp. | | | 5,900 | | | | 176,003 | | |
| Sumitomo Mitsui Financial Group, Inc. | | | 17,900 | | | | 607,538 | | |
| Total | | | 6,337,057 | | |
| NETHERLANDS 2.6% | |
| ING Groep NV-CVA(a) | �� | | 37,578 | | | | 333,334 | | |
| Koninklijke Ahold NV | | | 23,179 | | | | 320,548 | | |
| Wereldhave NV | | | 1,795 | | | | 134,162 | | |
| Total | | | 788,044 | | |
| NORWAY 4.0% | |
| Atea ASA | | | 19,591 | | | | 233,084 | | |
| DNB ASA | | | 20,235 | | | | 259,753 | | |
| Electromagnetic GeoServices AS(a) | | | 65,339 | | | | 243,148 | | |
| Kongsberg Automotive Holding ASA(a) | | | 337,189 | | | | 117,637 | | |
| Marine Harvest ASA | | | 310,801 | | | | 166,816 | | |
| Statoil Fuel & Retail ASA(a) | | | 33,127 | | | | 216,326 | | |
| Total | | | 1,236,764 | | |
| PHILIPPINES 0.4% | |
| Energy Development Corp. | | | 1,064,700 | | | | 135,572 | | |
| SINGAPORE 0.9% | |
| DBS Group Holdings Ltd. | | | 25,000 | | | | 282,666 | | |
| SOUTH KOREA 2.4% | |
| Hyundai Home Shopping Network Corp. | | | 2,516 | | | | 325,641 | | |
| LG Fashon Corp. | | | 3,357 | | | | 125,785 | | |
| Youngone Holdings Co., Ltd. | | | 5,980 | | | | 297,307 | | |
| Total | | | 748,733 | | |
The Accompanying Notes to Financial Statements are an integral part of this statement.
6
Columbia Overseas Value Fund
February 29, 2012
| Issuer | | Shares | | Value | |
| Common Stocks (continued) | |
| SPAIN 2.8% | |
| Banco Santander SA | | | 79,291 | | | $ | 657,816 | | |
| Telefonica SA | | | 12,129 | | | | 207,003 | | |
| Total | | | 864,819 | | |
| SWEDEN 3.7% | |
| MQ Holding AB | | | 65,957 | | | | 246,213 | | |
| Nordea Bank AB | | | 33,743 | | | | 325,354 | | |
| Saab AB, Class B | | | 12,916 | | | | 260,787 | | |
| Svenska Cellulosa AB, Class B | | | 17,539 | | | | 313,310 | | |
| Total | | | 1,145,664 | | |
| SWITZERLAND 5.6% | |
| Baloise Holding AG | | | 3,318 | | | | 261,127 | | |
| Nestlé SA, Registered Shares | | | 3,400 | | | | 207,826 | | |
| Novartis AG, Registered Shares | | | 9,528 | | | | 519,106 | | |
| Tyco International Ltd. | | | 4,177 | | | | 216,452 | | |
| Zurich Financial Services AG(a) | | | 2,034 | | | | 512,153 | | |
| Total | | | 1,716,664 | | |
| TAIWAN 0.6% | |
| Huaku Development Co., Ltd. | | | 73,694 | | | | 192,238 | | |
| THAILAND 1.4% | |
| Bangkok Bank PCL, Foreign Registered Shares | | | 36,900 | | | | 220,067 | | |
| PTT PCL, Foreign Registered Shares | | | 18,200 | | | | 217,550 | | |
| Total | | | 437,617 | | |
| UNITED KINGDOM 17.9% | |
| AstraZeneca PLC | | | 6,856 | | | | 306,220 | | |
| Aviva PLC | | | 52,462 | | | | 307,390 | | |
| Barclays PLC | | | 72,927 | | | | 284,248 | | |
| BP PLC | | | 85,387 | | | | 668,887 | | |
| Issuer | | Shares | | Value | |
| Common Stocks (continued) | |
| UNITED KINGDOM (cont.) | |
| Bwin.Party Digital Entertainment PLC | | | 64,934 | | | $ | 163,736 | | |
| Centrica PLC | | | 64,729 | | | | 313,051 | | |
| GlaxoSmithKline PLC | | | 5,650 | | | | 124,672 | | |
| HSBC Holdings PLC | | | 86,178 | | | | 761,320 | | |
| ICAP PLC | | | 36,621 | | | | 224,186 | | |
| Intermediate Capital Group PLC | | | 37,964 | | | | 163,494 | | |
| Lancashire Holdings Ltd. | | | 17,272 | | | | 210,344 | | |
| Royal Dutch Shell PLC, Class B | | | 36,869 | | | | 1,366,366 | | |
| Vodafone Group PLC | | | 240,520 | | | | 648,006 | | |
| Total | | | 5,541,920 | | |
Total Common Stocks
(Cost: $30,306,735) | | $ | 30,839,761 | | |
| Issuer | | Contracts | | Exercise
Price | | Expiration
Date | | Value | |
| Options Purchased Calls 0.1% | |
CBOE SPX Volatility
Index | | | 80 | | | | 20 | | | 03/21/2012 | | | 18,800 | | |
Total Options Purchased Calls
(Cost: $30,740) | | | | | | | | | | | | | | | $18,800 | | |
Total Investments
(Cost: $30,337,475) | | | | | | | | | | | | | | $ | 30,858,561 | | |
| Other Assets & Liabilities, Net | | | | | | | | | | | | | | | 40,630 | | |
| Net Assets | | | | | | | | | | | | | | $ | 30,899,191 | | |
Investments in Derivatives
| Forward Foreign Currency Exchange Contracts Open at February 29, 2012 | |
| Counterparty | | Exchange Date | | Currency to be
Delivered | | Currency to be
Received | | Unrealized
Appreciation | | Unrealized
Depreciation | |
| Morgan Stanley | | April 12, 2012
| | | 245,349
(USD) | | | | 231,000
(AUD) | | | $ | 1,209
| | | $ | —
| | |
| Morgan Stanley | | April 12, 2012
| | | 244,476
(USD) | | | | 227,000
(CHF) | | | | 6,550
| | | | —
| | |
| Morgan Stanley | | April 12, 2012
| | | 1,921,762
(USD) | | | | 1,479,000
(EUR) | | | | 49,048
| | | | —
| | |
| Morgan Stanley | | April 12, 2012
| | | 1,408,555
(USD) | | | | 899,000
(GBP) | | | | 21,238
| | | | —
| | |
| Morgan Stanley | | April 12, 2012
| | | 365,595
(USD) | | | | 28,831,000
(JPY) | | | | —
| | | | (10,800.00
| ) | |
| Morgan Stanley | | April 12, 2012
| | | 304,564
(USD) | | | | 387,000
(SGD) | | | | 4,883
| | | | —
| | |
| Morgan Stanley | | April 12, 2012
| | | 859,000
(CAD) | | | | 855,338
(AUD) | | | | —
| | | | (12,016
| ) | |
| Morgan Stanley | | April 12, 2012
| | | 831,280,000
(KRW) | | | | 731,715
(USD) | | | | —
| | | | (9,020.00
| ) | |
| Morgan Stanley | | April 12, 2012
| | | 5,342,000
(NOK) | | | | 917,264
(USD) | | | | —
| | | | (36,775.00
| ) | |
| Morgan Stanley | | April 12, 2012
| | | 3,103,000
(SEK) | | | | 456,802
(USD) | | | | —
| | | | (11,375.00
| ) | |
| Morgan Stanley | | April 12, 2012
| | | 13,251,000
(THB) | | | | 426,489
(USD) | | | | —
| | | | (10,089.00
| ) | |
| Morgan Stanley | | April 12, 2012
| | | 5,434,000
(TWD) | | | | 183,333
(USD) | | | | —
| | | | (1,593.00
| ) | |
| Total | | | | | | | | $ | 82,928 | | | $ | (91,668 | ) | |
The Accompanying Notes to Financial Statements are an integral part of this statement.
7
Columbia Overseas Value Fund
February 29, 2012
PORTFOLIO BREAKDOWN(1)
as of 02/29/12 (%) (Unaudited)
| Stocks | | | 99.9 | | |
| Aerospace & Defense | | | 0.8 | | |
| Auto Components | | | 0.8 | | |
| Automobiles | | | 2.3 | | |
| Beverages | | | 0.7 | | |
| Capital Markets | | | 2.0 | | |
| Chemicals | | | 1.5 | | |
| Commercial Banks | | | 19.1 | | |
| Commercial Services & Supplies | | | 0.5 | | |
| Communications Equipment | | | 0.5 | | |
| Construction & Engineering | | | 2.5 | | |
| Containers & Packaging | | | 0.8 | | |
| Diversified Financial Services | | | 2.1 | | |
| Diversified Telecommunication Services | | | 2.2 | | |
| Electric Utilities | | | 1.9 | | |
| Electronic Equipment, Instruments & Components | | | 1.2 | | |
| Energy Equipment & Services | | | 1.7 | | |
| Food & Staples Retailing | | | 2.4 | | |
| Food Products | | | 1.9 | | |
| Hotels, Restaurants & Leisure | | | 0.5 | | |
| Household Durables | | | 0.8 | | |
| Independent Power Producers & Energy Traders | | | 0.4 | | |
| Industrial Conglomerates | | | 1.5 | | |
| Insurance | | | 5.4 | | |
| Internet & Catalog Retail | | | 1.1 | | |
| IT Services | | | 0.8 | | |
| Machinery | | | 1.4 | | |
| Media | | | 1.1 | | |
| Metals & Mining | | | 2.8 | | |
| Multi-Utilities | | | 1.6 | | |
| Office Electronics | | | 0.9 | | |
| Oil, Gas & Consumable Fuels | | | 12.7 | | |
| Paper & Forest Products | | | 1.0 | | |
| Personal Products | | | 0.6 | | |
| Pharmaceuticals | | | 8.7 | | |
| Real Estate Investment Trusts (REITs) | | | 0.4 | | |
| Real Estate Management & Development | | | 2.4 | | |
| Semiconductors & Semiconductor Equipment | | | 0.3 | | |
| Specialty Retail | | | 2.1 | | |
| Textiles, Apparel & Luxury Goods | | | 1.4 | | |
| Trading Companies & Distributors | | | 1.6 | | |
| Water Utilities | | | 0.6 | | |
| Wireless Telecommunication Services | | | 4.9 | | |
| Options Purchased Calls | | | 0.1 | | |
(1) Percentages indicated are based upon total investments. The Fund's composition is subject to changes.
Notes to Portfolio of Investments
(a) Non-income producing.
Investments in affiliates during the year ended February 29, 2012:
| Issuer | | Beginning
Cost | | Purchase
Cost | | Sales Cost/
Proceeds
from Sales | | Realized
Gain/Loss | | Ending
Cost | | Dividends
or Interest
Income | | Value | |
Columbia Short-Term
Cash Fund | | $ | — | | | $ | 6,249,475 | | | $ | (6,249,475 | ) | | $ | — | | | $ | — | | | $ | 133 | | | $ | — | | |
Abbreviation Legend
ADR American Depositary Receipt
Currency Legend
AUD Australian Dollar
BRL Brazilian Real
CAD Canadian Dollar
CHF Swiss Franc
EUR Euro
GBP Pound Sterling
HKD Hong Kong Dollar
JPY Japanese Yen
KRW Korean Won
NOK Norwegian Krone
PHP Philippine Peso
SEK Swedish Krona
SGD Singapore Dollar
THB Thailand Baht
TWD Taiwan Dollar
USD US Dollar
The Accompanying Notes to Financial Statements are an integral part of this statement.
8
Columbia Overseas Value Fund
February 29, 2012
Fair Value Measurements
Generally accepted accounting principles (GAAP) require disclosure regarding the inputs and valuation techniques used to measure fair value and any changes in valuation inputs or techniques. In addition, investments shall be disclosed by major category.
The Fund categorizes its fair value measurements according to a three-level hierarchy that maximizes the use of observable inputs and minimizes the use of unobservable inputs by prioritizing that the most observable input be used when available. Observable inputs are those that market participants would use in pricing an investment based on market data obtained from sources independent of the reporting entity. Unobservable inputs are those that reflect the Fund's assumptions about the information market participants would use in pricing an investment. An investment's level within the fair value hierarchy is based on the lowest level of any input that is deemed significant to the asset or liability's fair value measurement. The input levels are not necessarily an indication of the risk or liquidity associated with investments at that level. For example, certain U.S. government securities are generally high quality and liquid, however, they are reflected as Level 2 because the inputs used to determine fair value may not always be quoted prices in an active market.
Fair value inputs are summarized in the three broad levels listed below:
• Level 1 — Valuations based on quoted prices for investments in active markets that the Fund has the ability to access at the measurement date (including NAV for open-end mutual funds). Valuation adjustments are not applied to Level 1 investments.
• Level 2 — Valuations based on other significant observable inputs (including quoted prices for similar securities, interest rates, prepayment speeds, credit risks, etc.).
• Level 3 — Valuations based on significant unobservable inputs (including the Fund's own assumptions and judgment in determining the fair value of investments).
Inputs that are used in determining fair value of an investment may include price information, credit data, volatility statistics, and other factors. These inputs can be either observable or unobservable. The availability of observable inputs can vary between investments, and is affected by various factors such as the type of investment, and the volume and level of activity for that investment or similar investments in the marketplace. The inputs will be considered by the Investment Manager, along with any other relevant factors in the calculation of an investment's fair value. The Fund uses prices and inputs that are current as of the measurement date, which may include periods of market dislocations. During these periods, the availability of prices and inputs may be reduced for many investments. This condition could cause an investment to be reclassified between the various levels within the hierarchy.
Foreign equity securities actively traded in markets where there is a significant delay in the local close relative to the New York Stock Exchange (NYSE) are classified as Level 2. The values of these securities may include an adjustment to reflect the impact of significant market movements following the close of local trading, as described in Note 2 to the financial statements — Security Valuation.
Investments falling into the Level 3 category are primarily supported by quoted prices from brokers and dealers participating in the market for those investments. However, these may be classified as Level 3 investments due to lack of market transparency and corroboration to support these quoted prices. Additionally, valuation models may be used as the pricing source for any remaining investments classified as Level 3. These models rely on one or more significant unobservable inputs and/or significant assumptions by the Investment Manager. Inputs used in valuations may include, but are not limited to, financial statement analysis, capital account balances, discount rates and estimated cash flows, and comparable company data.
The Accompanying Notes to Financial Statements are an integral part of this statement.
9
Columbia Overseas Value Fund
February 29, 2012
Fair Value Measurements (continued)
The following table is a summary of the inputs used to value the Fund's investments as of February 29, 2012:
| | | Fair Value at February 29, 2012 | |
| Description(a) | | Level 1
Quoted Prices
in Active
Markets for
Identical Assets | | Level 2
Other
Significant
Observable
Inputs(b) | | Level 3
Significant
Unobservable
Inputs | | Total | |
| Equity Securities | |
| Common Stocks | |
| Consumer Discretionary | | $ | — | | | $ | 3,095,631 | | | $ | — | | | $ | 3,095,631 | | |
| Consumer Staples | | | 211,750 | | | | 1,532,504 | | | | — | | | | 1,744,254 | | |
| Energy | | | — | | | | 4,455,699 | | | | — | | | | 4,455,699 | | |
| Financials | | | — | | | | 9,710,506 | | | | — | | | | 9,710,506 | | |
| Health Care | | | 480,014 | | | | 2,200,577 | | | | — | | | | 2,680,591 | | |
| Industrials | | | 216,452 | | | | 2,402,134 | | | | — | | | | 2,618,586 | | |
| Information Technology | | | 96,480 | | | | 1,017,014 | | | | — | | | | 1,113,494 | | |
| Materials | | | 717,929 | | | | 1,152,364 | | | | — | | | | 1,870,293 | | |
| Telecommunication Services | | | 141,970 | | | | 2,019,660 | | | | — | | | | 2,161,630 | | |
| Utilities | | | 191,348 | | | | 1,197,729 | | | | — | | | | 1,389,077 | | |
| Total Equity Securities | | | 2,055,943 | | | | 28,783,818 | | | | — | | | | 30,839,761 | | |
| Other | |
| Options Purchased Calls | | | 18,800 | | | | — | | | | — | | | | 18,800 | | |
| Total Other | | | 18,800 | | | | — | | | | — | | | | 18,800 | | |
| Investments in Securities | | | 2,074,743 | | | | 28,783,818 | | | | — | | | | 30,858,561 | | |
| Derivatives(c) | |
| Assets | |
| Forward Foreign Currency Exchange Contracts | | | — | | | | 82,928 | | | | — | | | | 82,928 | | |
| Liabilities | |
| Forward Foreign Currency Exchange Contracts | | | — | | | | (91,668 | ) | | | — | | | | (91,668 | ) | |
| Total | | $ | 2,074,743 | | | $ | 28,775,078 | | | $ | — | | | $ | 30,849,821 | | |
The Fund's assets assigned to the Level 2 input category are generally valued using the market approach, in which a security's value is determined through reference to prices and information from market transactions for similar or identical assets. These assets include certain foreign securities for which a third party statistical pricing service may be employed for purposes of fair market valuation. The models utilized by the third party statistical pricing service take into account a security's correlation to available market data including, but not limited to, intraday index, ADR, and ETF movements.
(a) See the Portfolio of Investments for all investment classifications not indicated in the table.
(b) There were no significant transfers between Levels 1 and 2 during the period.
(c) Derivative instruments are valued at unrealized appreciation (depreciation).
The Accompanying Notes to Financial Statements are an integral part of this statement.
10
Statement of Assets and Liabilities – Columbia Overseas Value Fund
February 29, 2012
| Assets | |
| Investments, at value | |
| (identified cost $30,337,475) | | $ | 30,858,561 | | |
| Foreign currency (identified cost $14) | | | 14 | | |
| Unrealized appreciation on forward foreign currency exchange contracts | | | 82,928 | | |
| Receivable for: | |
| Investments sold | | | 177,753 | | |
| Dividends | | | 126,221 | | |
| Reclaims | | | 24,469 | | |
| Expense reimbursement due from Investment Manager | | | 1,133 | | |
| Prepaid expense | | | 4,375 | | |
| Total assets | | | 31,275,454 | | |
| Liabilities | |
| Bank overdraft | | | 43,891 | | |
| Unrealized depreciation on forward foreign currency exchange contracts | | | 91,668 | | |
| Payable for: | |
| Investments purchased | | | 80,814 | | |
| Capital shares purchased | | | 24,537 | | |
| Foreign capital gains taxes deferred | | | 21,792 | | |
| Investment management fees | | | 675 | | |
| Transfer agent fees | | | 3,443 | | |
| Administration fees | | | 68 | | |
| Chief compliance officer expenses | | | 118 | | |
| Other expenses | | | 109,257 | | |
| Total liabilities | | | 376,263 | | |
| Net assets applicable to outstanding capital stock | | $ | 30,899,191 | | |
The Accompanying Notes to Financial Statements are an integral part of this statement.
11
Statement of Assets and Liabilities (continued) – Columbia Overseas Value Fund
February 29, 2012
| Represented by | |
| Paid-in capital | | $ | 36,284,329 | | |
| Excess of distributions over net investment income | | | (73,962 | ) | |
| Accumulated net realized loss | | | (5,801,030 | ) | |
| Unrealized appreciation (depreciation) on: | |
| Investments | | | 521,086 | | |
| Foreign currency translations | | | (700 | ) | |
| Forward foreign currency exchange contracts | | | (8,740 | ) | |
| Foreign capital gains tax | | | (21,792 | ) | |
| Total — representing net assets applicable to outstanding capital stock | | $ | 30,899,191 | | |
| Net assets applicable to outstanding shares | |
| Class I | | $ | 28,375,563 | | |
| Class W | | $ | 2,295 | | |
| Class Z | | $ | 2,521,333 | | |
| Shares outstanding | |
| Class I | | | 3,932,241 | | |
| Class W | | | 318 | | |
| Class Z | | | 348,949 | | |
| Net asset value per share | |
| Class I | | $ | 7.22 | | |
| Class W | | $ | 7.22 | | |
| Class Z | | $ | 7.23 | | |
The Accompanying Notes to Financial Statements are an integral part of this statement.
12
Statement of Operations – Columbia Overseas Value Fund
Year ended February 29, 2012
| Net investment income | |
| Income: | |
| Dividends | | $ | 1,536,043 | | |
| Dividends from affiliates | | | 133 | | |
| Interest | | | 8 | | |
| Foreign taxes withheld | | | (146,193 | ) | |
| Total income | | | 1,389,991 | | |
| Expenses: | |
| Investment management fees | | | 256,950 | | |
| Service fees | |
| Class W | | | 5 | | |
| Transfer agent fees | |
| Class W | | | 1 | | |
| Class Z | | | 3,493 | | |
| Administration fees | | | 9,224 | | |
| Compensation of board members | | | 12,222 | | |
| Pricing and bookkeeping fees | | | 17,395 | | |
| Custodian fees | | | 77,321 | | |
| Printing and postage fees | | | 62,126 | | |
| Registration fees | | | 38,089 | | |
| Professional fees | | | 84,433 | | |
| Chief compliance officer expenses | | | 199 | | |
| Other | | | 12,488 | | |
| Total expenses | | | 573,946 | | |
| Fees waived or expenses reimbursed by Investment Manager and its affiliates | | | (295,200 | ) | |
| Total net expenses | | | 278,746 | | |
| Net investment income | | | 1,111,245 | | |
| Realized and unrealized gain (loss) — net | |
| Net realized gain (loss) on: | |
| Investments | | | (3,146,333 | ) | |
| Foreign currency translations | | | 138,580 | | |
| Forward foreign currency exchange contracts | | | (208,901 | ) | |
| Futures contracts | | | 8,066 | | |
| Options contracts written | | | (27,984 | ) | |
| Net realized loss | | | (3,236,572 | ) | |
| Net change in unrealized appreciation (depreciation) on: | |
| Investments | | | (334,391 | ) | |
| Foreign currency translations | | | 8 | | |
| Forward foreign currency exchange contracts | | | (16,873 | ) | |
| Foreign capital gains tax | | | (20,733 | ) | |
| Net change in unrealized depreciation | | | (371,989 | ) | |
| Net realized and unrealized loss | | | (3,608,561 | ) | |
| Net decrease in net assets from operations | | $ | (2,497,316 | ) | |
The Accompanying Notes to Financial Statements are an integral part of this statement.
13
Statement of Changes in Net Assets – Columbia Overseas Value Fund
| | | Year ended
February 29,
2012 | | Year ended
February 28,
2011 | |
| Operations | |
| Net investment income | | $ | 1,111,245 | | | $ | 170,691 | | |
| Net realized gain (loss) | | | (3,236,572 | ) | | | 20,383 | | |
| Net change in unrealized appreciation (depreciation) | | | (371,989 | ) | | | 1,090,811 | | |
| Net increase (decrease) in net assets resulting from operations | | | (2,497,316 | ) | | | 1,281,885 | | |
| Distributions to shareholders from: | |
| Net investment income | |
| Class I | | | (970,671 | ) | | | — | | |
| Class W | | | (74 | ) | | | — | | |
| Class Z | | | (80,114 | ) | | | (165,101 | ) | |
| Total distributions to shareholders | | | (1,050,859 | ) | | | (165,101 | ) | |
| Increase (decrease) in net assets from share transactions | | | 25,757,219 | | | | 1,838 | | |
| Total increase in net assets | | | 22,209,044 | | | | 1,118,622 | | |
| Net assets at beginning of year | | | 8,690,147 | | | | 7,571,525 | | |
| Net assets at end of year | | $ | 30,899,191 | | | $ | 8,690,147 | | |
| Excess of distributions over net investment income | | $ | (73,962 | ) | | $ | (88,280 | ) | |
| | | Year ended
February 29, 2012(a) | | Year ended
February 28, 2011 | |
| | | Shares | | Dollars ($) | | Shares | | Dollars ($) | |
| Capital stock activity | |
| Class I shares | |
| Subscriptions | | | 5,156,913 | | | | 40,043,379 | | | | — | | | | — | | |
| Distributions reinvested | | | 156,044 | | | | 970,591 | | | | — | | | | — | | |
| Redemptions | | | (1,380,716 | ) | | | (10,437,922 | ) | | | — | | | | — | | |
| Net increase | | | 3,932,241 | | | | 30,576,048 | | | | — | | | | — | | |
| Class W shares | |
| Subscriptions | | | 318 | | | | 2,500 | | | | — | | | | — | | |
| Net increase | | | 318 | | | | 2,500 | | | | — | | | | — | | |
| Class Z shares | |
| Subscriptions | | | — | | | | — | | | | 1,067,133 | | | | 8,184,910 | | |
| Distributions reinvested | | | 12,859 | | | | 80,114 | | | | 22,767 | | | | 165,101 | | |
| Redemptions | | | (750,789 | ) | | | (4,901,443 | ) | | | (1,088,418 | ) | | | (8,348,173 | ) | |
| Net increase (decrease) | | | (737,930 | ) | | | (4,821,329 | ) | | | 1,482 | | | | 1,838 | | |
| Total net increase | | | 3,194,629 | | | | 25,757,219 | | | | 1,482 | | | | 1,838 | | |
(a) Class I and Class W are for the period from March 31, 2011 (commencement of operations) to February 29, 2012.
The Accompanying Notes to Financial Statements are an integral part of this statement.
14
Financial Highlights – Columbia Overseas Value Fund
The following tables are intended to help you understand the Fund's financial performance. Certain information reflects financial results for a single share of a class held for the periods shown. Per share net investment income (loss) amounts are calculated based on average shares outstanding during the period. Total returns assume reinvestment of all dividends and distributions. Total returns do not reflect payment of sales charges, if any, and are not annualized for periods of less than one year.
| | | Year ended
Feb. 29,
2012(a) | |
| Class I | |
| Per share data | |
| Net asset value, beginning of period | | $ | 7.87 | | |
| Income from investment operations: | |
| Net investment income | | | 0.22 | | |
| Net realized and unrealized loss | | | (0.62 | ) | |
| Total from investment operations | | | (0.40 | ) | |
| Less distributions to shareholders from: | |
| Net investment income | | | (0.25 | ) | |
| Total distributions to shareholders | | | (0.25 | ) | |
| Net asset value, end of period | | $ | 7.22 | | |
| Total return | | | (4.55 | %) | |
| Ratios to average net assets(b) | |
| Expenses prior to fees waived or expenses reimbursed | | | 1.76 | %(c) | |
| Net expenses after fees waived or expenses reimbursed(d) | | | 0.84 | %(c) | |
| Net investment income | | | 3.37 | %(c) | |
| Supplemental data | |
| Net assets, end of period (in thousands) | | $ | 28,376 | | |
| Portfolio turnover | | | 96 | % | |
Notes to Financial Highlights
(a) For the period from March 31, 2011 (commencement of operations) to February 29, 2012.
(b) In addition to the fees and expenses which the Fund bears directly, the Fund indirectly bears a pro rata share of the fees and expenses of the acquired funds in which it invests. Such indirect expenses are not included in the reported expense ratios.
(c) Annualized.
(d) The Investment Manager and certain of its affiliates agreed to waive/reimburse certain fees and expenses, if applicable.
The Accompanying Notes to Financial Statements are an integral part of this statement.
15
Financial Highlights (continued) – Columbia Overseas Value Fund
| | | Year ended
Feb. 29,
2012(a) | |
| Class W | |
| Per share data | |
| Net asset value, beginning of period | | $ | 7.87 | | |
| Income from investment operations: | |
| Net investment income | | | 0.22 | | |
| Net realized and unrealized loss | | | (0.64 | ) | |
| Total from investment operations | | | (0.42 | ) | |
| Less distributions to shareholders from: | |
| Net investment income | | | (0.23 | ) | |
| Total distributions to shareholders | | | (0.23 | ) | |
| Net asset value, end of period | | $ | 7.22 | | |
| Total return | | | (4.81 | %) | |
| Ratios to average net assets(b) | |
| Expenses prior to fees waived or expenses reimbursed | | | 2.09 | %(c) | |
| Net expenses after fees waived or expenses reimbursed(d) | | | 1.12 | %(c) | |
| Net investment income | | | 3.24 | %(c) | |
| Supplemental data | |
| Net assets, end of period (in thousands) | | $ | 2 | | |
| Portfolio turnover | | | 96 | % | |
Notes to Financial Highlights
(a) For the period from March 31, 2011 (commencement of operations) to February 29, 2012.
(b) In addition to the fees and expenses which the Fund bears directly, the Fund indirectly bears a pro rata share of the fees and expenses of the acquired funds in which it invests. Such indirect expenses are not included in the reported expense ratios.
(c) Annualized.
(d) The Investment Manager and certain of its affiliates agreed to waive/reimburse certain fees and expenses, if applicable.
The Accompanying Notes to Financial Statements are an integral part of this statement.
16
Financial Highlights (continued) – Columbia Overseas Value Fund
| | | Year ended
Feb. 29, | | Year ended Feb. 28, | |
| | | 2012 | | 2011 | | 2010 | | 2009(a) | |
| Class Z | |
| Per share data | |
| Net asset value, beginning of period | | $ | 8.00 | | | $ | 6.98 | | | $ | 4.46 | | | $ | 10.00 | | |
| Income from investment operations: | |
| Net investment income | | | 0.32 | | | | 0.16 | | | | 0.17 | | | | 0.27 | | |
| Net realized and unrealized gain (loss) | | | (0.85 | ) | | | 1.01 | | | | 2.63 | | | | (5.56 | ) | |
| Total from investment operations | | | (0.53 | ) | | | 1.17 | | | | 2.80 | | | | (5.29 | ) | |
| Less distributions to shareholders from: | |
| Net investment income | | | (0.24 | ) | | | (0.15 | ) | | | (0.28 | ) | | | (0.23 | ) | |
| Tax return of capital | | | — | | | | — | | | | — | | | | (0.02 | ) | |
| Total distributions to shareholders | | | (0.24 | ) | | | (0.15 | ) | | | (0.28 | ) | | | (0.25 | ) | |
| Net asset value, end of period | | $ | 7.23 | | | $ | 8.00 | | | $ | 6.98 | | | $ | 4.46 | | |
| Total return | | | (6.17 | %) | | | 17.06 | % | | | 62.60 | % | | | (53.41 | %) | |
| Ratios to average net assets(b) | |
| Expenses prior to fees waived or expenses reimbursed | | | 1.87 | % | | | 3.65 | % | | | 3.02 | % | | | 3.99 | %(c) | |
| Net expenses after fees waived or expenses reimbursed(d) | | | 0.98 | % | | | 1.15 | %(e) | | | 1.14 | %(e) | | | 1.10 | %(c)(e) | |
| Net investment income | | | 3.80 | % | | | 2.18 | %(e) | | | 2.46 | %(e) | | | 3.72 | %(c)(e) | |
| Supplemental data | |
| Net assets, end of period (in thousands) | | $ | 2,521 | | | $ | 8,690 | | | $ | 7,572 | | | $ | 4,664 | | |
| Portfolio turnover | | | 96 | % | | | 48 | % | | | 62 | % | | | 66 | % | |
Notes to Financial Highlights
(a) For the period from March 31, 2008 (commencement of operations) to February 28, 2009.
(b) In addition to the fees and expenses which the Fund bears directly, the Fund indirectly bears a pro rata share of the fees and expenses of the acquired funds in which it invests. Such indirect expenses are not included in the reported expense ratios.
(c) Annualized.
(d) The Investment Manager and certain of its affiliates agreed to waive/reimburse certain fees and expenses, if applicable.
(e) The benefits derived from expense reductions had an impact of less than 0.01%.
The Accompanying Notes to Financial Statements are an integral part of this statement.
17
Notes to Financial Statements – Columbia Overseas Value Fund
February 29, 2012
Note 1. Organization
Columbia Overseas Value Fund (the Fund), a series of Columbia Funds Series Trust (the Trust), is a diversified fund. The Trust is registered under the Investment Company Act of 1940, as amended (the 1940 Act), as an open-end management investment company organized as a Delaware statutory trust.
Fund Shares
The Trust may issue an unlimited number of shares (without par value). The Fund offers Class I, Class W and Class Z shares. All share classes have identical voting, dividend and liquidation rights. Each share class has its own expense structure and sales charges, as applicable.
The Fund is authorized to issue Class A and Class C shares, which would be subject to sales charges, and Class R shares, which would not be subject to sales charges; however these share classes are not currently offered for sale and have not commenced operations.
Class I shares are not subject to sales charges and are only available to the Columbia Family of Funds. Class I shares commenced operations on March 31, 2011.
Class W shares are not subject to sales charges and are only available to investors purchasing through authorized investment programs managed by investment professionals, including discretionary managed account programs. Class W shares commenced operations on March 31, 2011.
Class Z shares are not subject to sales charges, and are only available to certain investors, as described in the Fund's prospectus.
Note 2. Summary of Significant Accounting Policies
Use of Estimates
The preparation of financial statements in accordance with U.S. generally accepted accounting principles (GAAP) requires management to make certain estimates and assumptions that affect the reported amounts of assets and liabilities, the disclosure of contingent assets and liabilities at the date of the financial statements and the reported amounts of revenue and expenses during the reporting period. Actual results could differ from those estimates.
The following is a summary of significant accounting policies consistently followed by the Fund in the preparation of its financial statements.
Security Valuation
All equity securities are valued at the close of business of the New York Stock Exchange (NYSE). Equity securities are valued at the last quoted sales price on the principal exchange or market on which they trade, except for securities traded on the NASDAQ Stock Market, which are valued at the NASDAQ official close price. Unlisted securities or listed securities for which there were no sales during the day are valued at the mean of the latest quoted bid and asked prices on such exchanges or markets.
Foreign securities are valued based on quotations from the principal market in which such securities are normally traded. If any foreign share prices are not readily available as a result of limited share activity the securities are valued at the mean of the latest quoted bid and asked prices on such exchanges or markets. Foreign currency exchange rates are generally determined at 4:00 p.m. Eastern (U.S.) time. However, many securities markets and exchanges outside the U.S. close prior to the close of the NYSE; therefore, the closing prices for securities in such markets or on such exchanges may not fully reflect events that occur after such close but before the close of the NYSE. In those situations, foreign securities will be fair valued pursuant to the policy adopted by the Board of Trustees (the Board), including utilizing a third party pricing service to determine these fair values. The third party pricing service takes into account multiple factors, including, but not limited to, movements in the U.S. securities markets, certain depositary receipts, futures contracts and foreign exchange rates that have occurred subsequent to the close of the foreign exchange, to determine a good faith estimate that reasonably reflects the current market conditions as of the close of the NYSE. The fair value of a security is likely to be different from the quoted or published price, if available.
Investments in other open-end investment companies, including money market funds, are valued at net asset value.
Short-term securities purchased within 60 days to maturity are valued at amortized cost, which approximates market value. The value of short-term securities originally purchased with maturities greater than 60 days is determined based on an amortized value to par upon reaching 60 days to maturity.
18
Columbia Overseas Value Fund, February 29, 2012
Short-term securities maturing in more than 60 days from the valuation date are valued at the market price or approximate market value based on current interest rates.
Forward foreign currency exchange contracts are marked-to-market based upon foreign currency exchange rates provided by a pricing service.
Futures and options on futures contracts are valued based upon the settlement price established each day by the board of trade or exchange on which they are traded.
Option contracts are valued at the mean of the latest quoted bid and asked prices on their primary exchanges. Option contracts, including over-the-counter (OTC) option contracts, with no readily available market value are valued using quotations obtained from independent brokers as of the close of the NYSE.
Investments for which market quotations are not readily available, or that have quotations which management believes are not reliable, are valued at fair value as determined in good faith under consistently applied procedures established by and under the general supervision of the Board. If a security or class of securities (such as foreign securities) is valued at fair value, such value is likely to be different from the last quoted market price for the security. The determination of fair value often requires significant judgment. To determine fair value, management may use assumptions including but not limited to future cash flows and estimated risk premiums. Multiple inputs from various sources may be used to determine value.
Foreign Currency Transactions and Translation
The values of all assets and liabilities denominated in foreign currencies are translated into U.S. dollars at that day's exchange rates. Net realized and unrealized gains (losses) on foreign currency transactions and translations include gains (losses) arising from the fluctuation in exchange rates between trade and settlement dates on securities transactions, gains (losses) arising from the disposition of foreign currency and currency gains (losses) between the accrual and payment dates on dividends, interest income and foreign withholding taxes.
For financial statement purposes, the Fund does not distinguish that portion of gains (losses) on investments which is due to changes in foreign exchange rates from that which is due to changes in market prices of the investments. Such fluctuations are included with the net realized and unrealized gains (losses) on investments in the Statement of Operations.
Derivative Instruments
The Fund invests in certain derivative instruments as detailed below to meet its investment objectives. Derivatives are instruments whose values depend on, or are derived from, in whole or in part, the value of one or more other assets, such as securities, currencies, commodities or indices. Derivative instruments may be used to maintain cash reserves while maintaining exposure to certain other assets, to offset anticipated declines in values of investments, to facilitate trading, to reduce transaction costs and to pursue higher investment returns. The Fund may also use derivative instruments to mitigate certain investment risks, such as foreign currency exchange rate risk, interest rate risk and credit risk. Derivatives may involve various risks, including the potential inability of the counterparty to fulfill its obligation under the terms of the contract, the potential for an illiquid secondary market and the potential for market movements which may expose the Fund to gains or losses in excess of the amount shown in the Statement of Assets and Liabilities.
The Fund and any counterparty are required to maintain an agreement that requires the Fund and that counterparty to monitor (on a daily basis) the net fair value of all derivatives entered into pursuant to the agreement between the Fund and such counterparty. If the net fair value of such derivatives between the Fund and that counterparty exceeds a certain threshold (as defined in the agreement), the Fund or the counterparty (as the case may be) is required to post cash and/or securities as collateral. Fair values of derivatives presented in the financial statements are not netted with the fair value of other derivatives or with any collateral amounts posted by the Fund or any counterparty.
Forward Foreign Currency Exchange Contracts
Forward foreign currency exchange contracts are agreements between two parties to buy and sell a currency at a set price on a future date. These contracts are intended to be used to minimize the exposure to foreign exchange rate fluctuations during the period between the trade and settlement dates of the contract. The Fund utilized forward foreign currency
19
Columbia Overseas Value Fund, February 29, 2012
exchange to shift investment exposure from one currency to another.
The values of forward foreign currency exchange contracts fluctuate with changes in foreign currency exchange rates. The Fund will record a realized gain or loss when the forward foreign currency exchange contract is closed.
The use of forward foreign currency exchange contracts does not eliminate fluctuations in the prices of the Fund's portfolio securities. The risks of forward foreign currency exchange contracts include movement in the values of the foreign currencies relative to the U.S. dollar (or other foreign currencies) and the possibility that counterparties will not complete their contractual obligations, which may be in excess of the amount reflected, if any, in the Statement of Assets and Liabilities.
Futures Contracts
Futures contracts represent commitments for the future purchase or sale of an asset at a specified price on a specified date. The Fund sold currency futures contracts to offset the fund's active currency exposures back to the benchmark. Upon entering into futures contracts, the Fund bears risks which may include interest rates, exchange rates or securities prices moving unexpectedly, in which case, the Fund may not achieve the anticipated benefits of the futures contracts and may realize a loss. Additional risks include counterparty credit risk, the possibility of an illiquid market, and that a change in the value of the contract or option may not correlate with changes in the value of the underlying asset.
Upon entering into a futures contract, the Fund pledges cash or securities with the broker in an amount sufficient to meet the initial margin requirement. Subsequent payments (variation margin) are made or received by the Fund each day. The variation margin payments are equal to the daily change in the contract value and are recorded as variation margin receivable or payable and are offset in unrealized gains or losses. The Fund recognizes a realized gain or loss when the contract is closed or expires. Futures contracts involve, to varying degrees, risk of loss in excess of the variation margin disclosed in the Statement of Assets and Liabilities.
Options
Options are contracts which entitle the holder to purchase or sell securities or other identified assets at a specified price, or in the case of index option contracts, to receive or pay the difference between the index value and the strike price of the index option contract. The Fund wrote covered call and purchased put options to decrease the Fund's exposure to equity risk and to increase return on instruments. Completion of transactions for option contracts traded in the OTC market depends upon the performance of the other party. Cash collateral may be collected or posted by the Fund to secure certain OTC option contract trades. Cash collateral held or posted by the Fund for such option contract trades must be returned to the counterparty or the Fund upon closure, exercise or expiration of the contract.
Option contracts purchased are recorded as investments and options contracts written are recorded as liabilities of the Fund. The Fund will realize a gain or loss when the option contract expires or is exercised. When option contracts on debt securities or futures are exercised, the Fund will realize a gain or loss. When other option contracts are exercised, the proceeds on sales for a written call or purchased put option contract, or the purchase cost for a written put or purchased call option contract, is adjusted by the amount of premium received or paid.
The risk in buying an option contract is that the Fund pays a premium whether or not the option contract is exercised. The Fund also has the additional risk of being unable to enter into a closing transaction if a liquid secondary market does not exist. The risk in writing a call option contract is that the Fund gives up the opportunity for profit if the market price of the security increases. The risk in writing a put option contract is that the Fund may incur a loss if the market price of the security decreases and the option contract is exercised. The Fund's maximum payout in the case of written put option contracts represents the maximum potential amount of future payments (undiscounted) that the Fund could be required to make under the contract. For OTC options contracts, the transaction is also subject to counterparty credit risk. The maximum payout amount may be offset by the subsequent sale, if any, of assets obtained upon the exercise of the put option contracts by holders of the option contracts or proceeds received upon entering into the contracts.
20
Columbia Overseas Value Fund, February 29, 2012
Contracts and premiums associated with options contracts written for the year ended February 29, 2012 are as follows:
| | | Written Options | |
| | | Contracts | | Premiums | |
| Balance at February 28, 2011 | | | — | | | $ | — | | |
| Opened | | | 464 | | | | 85,912 | | |
| Closed | | | (464 | ) | | | (85,912 | ) | |
| Balance at February 29, 2012 | | | — | | | $ | — | | |
Effects of Derivative Transactions in the Financial Statements
The following tables are intended to provide additional information about the effect of derivatives on the financial statements of the Fund, including: the fair value of derivatives by risk category and the location of those fair values in the Statement of Assets and Liabilities; the impact of derivative transactions on the Fund's operations over the period including realized gains or losses and unrealized gains or losses. The derivative schedules following the Portfolio of Investments present additional information regarding derivative instruments outstanding at the end of the period, if any.
Fair Values of Derivative Instruments at February 29, 2012
| | | Asset derivatives | | Liability derivatives | |
| Risk Exposure Category | | Statement of Assets and
Liabilities Location | | Fair Value | | Statement of Assets and
Liabilities Location | | Fair Value | |
Foreign exchange contracts
| | Unrealized appreciation on
forward foreign currency
exchange contracts | | $ | 82,928 | | | Unrealized depreciation on
forward foreign currency
exchange contracts | | $ | 91,668 | | |
Effect of Derivative Instruments in the Statement of Operations for the Year Ended February 29, 2012
| Amount of Realized Gain (Loss) on Derivatives Recognized in Income | |
| Risk Exposure Category | | Forward Foreign
Currency Exchange
Contracts | | Futures
Contracts | | Options Contracts
Written and
Purchased | | Total | |
| Equity contracts | | $ | — | | | $ | — | | | $ | (407 | ) | | $ | (407 | ) | |
| Foreign exchange contracts | | | (208,901 | ) | | | 8,066 | | | | — | | | $ | (200,835 | ) | |
| Interest rate contracts | | | — | | | | — | | | | (27,984 | ) | | $ | (27,984 | ) | |
| Total | | $ | (208,901 | ) | | $ | 8,066 | | | $ | (28,391 | ) | | $ | (229,226 | ) | |
| Change in Unrealized Appreciation (Depreciation) on Derivatives Recognized in Income | |
| Risk Exposure Category | | Forward Foreign
Currency Exchange
Contracts | | Futures
Contracts | | Options Contracts
Written and
Purchased | | Total | |
| Equity contracts | | $ | — | | | $ | — | | | $ | (11,940 | ) | | $ | (11,940 | ) | |
| Foreign exchange contracts | | | (16,873 | ) | | | — | | | | — | | | $ | (16,873 | ) | |
| Interest rate contracts | | | — | | | | — | | | | — | | | $ | — | | |
| Total | | $ | (16,873 | ) | | $ | — | | | $ | (11,940 | ) | | $ | (28,813 | ) | |
21
Columbia Overseas Value Fund, February 29, 2012
Volume of Derivative Instruments for the Year Ended February 29, 2012
| | | Contracts
Opened | |
| Forward Foreign Currency Exchange Contracts | | | 1,243 | | |
| Futures Contracts | | | 812 | | |
| Options Contracts | | | 654 | | |
Repurchase Agreements
The Fund may engage in repurchase agreement transactions with institutions that management has determined are creditworthy. The Fund, through the custodian, receives delivery of the underlying securities collateralizing a repurchase agreement. Management is responsible for determining that the collateral is at least equal, at all times, to the value of the repurchase obligation including interest. A repurchase agreement transaction involves certain risks in the event of default or insolvency of the counterparty. These risks include possible delays in or restrictions on a Fund's ability to dispose of the underlying securities and a possible decline in the value of the underlying securities during the period while the Fund seeks to assert its rights.
Security Transactions
Security transactions are accounted for on the trade date. Cost is determined and gains (losses) are based upon the specific identification method for both financial statement and federal income tax purposes.
Income Recognition
Corporate actions and dividend income are recorded net of any non-reclaimable tax withholdings, on the ex-dividend date or upon receipt of ex-dividend notification in the case of certain foreign securities.
Interest income is recorded on the accrual basis.
Awards from class action litigation are recorded as a reduction of cost basis if the Fund still owns the applicable securities on the payment date. If the Fund no longer owns the applicable securities, the proceeds are recorded as realized gains.
Expenses
General expenses of the Trust are allocated to the Fund and other funds of the Trust based upon relative net assets or other expense allocation methodologies determined by the nature of the expense. Expenses directly attributable to the Fund are charged to the Fund. Expenses directly attributable to a specific class of shares are charged to that share class.
Determination of Class Net Asset Value
All income, expenses (other than class-specific expenses, which are charged to that share class, as shown in the Statement of Operations) and realized and unrealized gains (losses) are allocated to each class of the Fund on a daily basis, based on the relative net assets of each class, for purposes of determining the net asset value of each class.
Federal Income Tax Status
The Fund intends to qualify each year as a regulated investment company under Subchapter M of the Internal Revenue Code, as amended, and will distribute substantially all of its tax exempt or taxable income (including net short-term capital gains), if any, for its tax year, and as such will not be subject to federal income taxes. In addition, the Fund intends to distribute in each calendar year substantially all of its net investment income, capital gains and certain other amounts, if any, such that the Fund should not be subject to federal excise tax. Therefore, no federal income or excise tax provision is recorded.
Foreign Taxes
The Fund may be subject to foreign taxes on income, gains on investments or currency repatriation, a portion of which may be recoverable. The Fund will accrue such taxes and recoveries, as applicable, based upon its current interpretation of tax rules and regulations that exist in the markets in which it invests.
Realized gains in certain countries may be subject to foreign taxes at the Fund level, based on statutory rates. The Fund accrues for such foreign taxes on net realized and unrealized gains at the appropriate rate for each jurisdiction, as applicable.
22
Columbia Overseas Value Fund, February 29, 2012
Distributions to Shareholders
Distributions from net investment income are declared and paid annually. Net realized capital gains, if any, are distributed along with the income dividend. Income distributions and capital gain distributions are determined in accordance with federal income tax regulations which may differ from GAAP.
Guarantees and Indemnifications
Under the Trust's organizational documents and, in some cases, by contract, its officers and trustees are indemnified against certain liabilities arising out of the performance of their duties to the Trust or its funds. In addition, certain of the Fund's contracts with its service providers contain general indemnification clauses. The Fund's maximum exposure under these arrangements is unknown since the amount of any future claims that may be made against the Fund cannot be determined, and the Fund has no historical basis for predicting the likelihood of any such claims.
Recent Accounting Pronouncement
Fair Value Measurements and Disclosures
In May 2011, the Financial Accounting and Standards Board (FASB) issued ASU No. 2011-04 modifying Topic 820, Fair Value Measurements and Disclosures. At the same time, the International Accounting Standards Board (IASB) issued International Financial Reporting Standard 13, Fair Value Measurement. The objective of the FASB and IASB is convergence of their guidance on fair value measurements and disclosures.
Specifically, ASU No. 2011-04 requires reporting entities to disclose i) the amounts of any transfers between Level 1 and Level 2, and the reasons for the transfers, ii) for Level 3 fair value measurements, a) quantitative information about significant unobservable inputs used, b) a description of the valuation processes used by the reporting entity and c) a narrative description of the sensitivity of the fair value measurement to changes in unobservable inputs if a change in those inputs might result in a significantly higher or lower fair value measurement. The effective date of ASU No. 2011-04 is for interim and annual periods beginning after December 15, 2011. At this time, management is evaluating the implications of this guidance and the impact it will have on the financial statement amounts and footnote disclosures, if any.
Note 3. Fees and Compensation Paid to Affiliates
Investment Management Fees
Under an Investment Management Services Agreement, Columbia Management Investment Advisers, LLC (the Investment Manager), a wholly-owned subsidiary of Ameriprise Financial, Inc. (Ameriprise Financial), determines which securities will be purchased, held or sold. Effective July 1, 2011, the management fee is an annual fee that is equal to a percentage of the Fund's average daily net assets that declines from 0.79% to 0.62% as the Fund's net assets increase. Prior to July 1, 2011, the management fee was equal to the annual rate of 0.82% of the Fund's average daily net assets. The effective management fee rate for the year ended February 29, 2012 was 0.80% of the Fund's average daily net assets.
Administration Fees
Under an Administrative Services Agreement, the Investment Manager serves as the Fund Administrator. Effective July 1, 2011, the Fund pays the Fund Administrator an annual fee for administration and accounting services equal to a percentage of the Fund's average daily net assets that declines from 0.08% to 0.05% as the Fund's net assets increase. Prior to July 1, 2011, the administration fee was equal to the annual rate of 0.05% of the Fund's average daily net assets, less the fees that were payable by the Fund as described under the Pricing and Bookkeeping Fees note below. The effective administration fee rate for the year ended February 29, 2012 was 0.07% of the Fund's average daily net assets.
Pricing and Bookkeeping Fees
Prior to June 27, 2011, the Fund had entered into a Financial Reporting Services Agreement (the Financial Reporting Services Agreement) with State Street Bank and Trust Company (State Street) and the Investment Manager pursuant to which State Street provided financial reporting services to the Fund. The Fund also entered into an Accounting Services Agreement (collectively with the Financial Reporting Services Agreement, the State Street Agreements) with State Street and the Investment Manager pursuant to which State Street provided accounting services to the Fund. Under the State Street Agreements, the Fund paid State Street an annual fee of $38,000 paid monthly plus an additional monthly fee
23
Columbia Overseas Value Fund, February 29, 2012
based on an annualized percentage rate of average daily net assets of the Fund for the month. The aggregate fee did not exceed $140,000 per year (exclusive of out-of-pocket expenses and charges). The Fund also reimbursed State Street for certain out-of-pocket expenses and charges. Effective June 27, 2011, these services are provided under the Administrative Services Agreement discussed above.
Other Fees
Effective June 1, 2011, other expenses are for, among other things, certain expenses of the Fund or the Board, including: Fund boardroom and office expense, employee compensation, employee health and retirement benefits, and certain other expenses. Payment of these Fund and Board expenses is facilitated by a company providing limited administrative services to the Fund and the Board. For the period June 1, 2011 through February 29, 2012, other expenses paid to this company were $1,318.
Compensation of Board Members
Board members are compensated for their services to the Fund as disclosed in the Statement of Operations. Under a Deferred Compensation Plan (the Plan), the Board members who are not "interested persons" of the Fund, as defined under the 1940 Act, may elect to defer payment of up to 100% of their compensation. Deferred amounts are treated as though equivalent dollar amounts had been invested in shares of certain funds managed by the Investment Manager. The Fund's liability for these amounts is adjusted for market value changes and remains in the Fund until distributed in accordance with the Plan.
Compensation of Chief Compliance Officer
The Board has appointed a Chief Compliance Officer to the Fund in accordance with federal securities regulations. Effective April 1, 2011, the Fund's expenses associated with the Chief Compliance Officer are paid directly by the Investment Manager. Prior to April 1, 2011, the Fund, along with other affiliated funds, paid its pro-rata share of the expenses for the Chief Compliance Officer. Such fees did not exceed $15,000 per year.
Transfer Agent Fees
Under a Transfer and Dividend Disbursing Agent Agreement, Columbia Management Investment Services Corp. (the Transfer Agent), an affiliate of the Investment Manager and a wholly-owned subsidiary of Ameriprise Financial, is responsible for providing transfer agency services to the Fund. The Transfer Agent has contracted with Boston Financial Data Services (BFDS) to serve as sub-transfer agent.
The Transfer Agent receives monthly account-based service fees based on the number of open accounts and is reimbursed by the Fund for the fees and expenses the Transfer Agent pays to financial intermediaries that maintain omnibus accounts with the Fund that is a percentage of the average aggregate value of the Fund's shares maintained in each such omnibus account (other than omnibus accounts for which American Enterprise Investment Services Inc. is the broker of record or accounts where the beneficial shareholder is a customer of Ameriprise Financial Services, Inc., which are paid a per account fee). The Transfer Agent pays the fees of BFDS for services as sub-transfer agent and is not entitled to reimbursement for such fees from the Fund (with the exception of out-of-pocket fees).
The Transfer Agent also receives compensation from fees for various shareholder services and reimbursements for certain out-of-pocket expenses. Class I shares do not pay transfer agent fees.
For the year ended February 29, 2012, the Fund's effective transfer agent fee rates as a percentage of average daily net assets of each class were as follows:
| Class W | | | 0.02 | % | |
| Class Z | | | 0.06 | | |
An annual minimum account balance fee of $20 may apply to certain accounts with a value below the Fund's initial minimum investment requirements to reduce the impact of small accounts on transfer agent fees. These minimum account balance fees are recorded as part of expense reductions in the Statement of Operations. For the year ended February 29, 2012, no minimum account balance fees were charged by the Fund.
24
Columbia Overseas Value Fund, February 29, 2012
Distribution and Service Fees
The Fund has an agreement with Columbia Management Investment Distributors, Inc. (the Distributor), an affiliate of the Investment Manager and a wholly-owned subsidiary of Ameriprise Financial, for distribution and shareholder services. Pursuant to Rule 12b-1 under the 1940 Act, the Board of Trustees has approved, and the Fund has adopted, a shareholder service plan (the Plan) which set the service fees for the Fund. These fees are calculated daily and are intended to compensate the Distributor and/or eligible selling and/or servicing agents for selling shares of the Fund and providing services to investors.
The Plan requires the payment of a monthly service fee to the Distributor at the maximum annual rate of 0.25% of the average daily net assets attributable to Class W shares of the Fund.
Expenses Waived/Reimbursed by the Investment Manager and its Affiliates
Effective July 1, 2011, the Investment Manager and certain of its affiliates have contractually agreed to waive fees and/or reimburse expenses (excluding certain fees and expenses described below), through June 30, 2012, unless sooner terminated at the sole discretion of the Board, so that the Fund's net operating expenses, after giving effect to fees waived/expenses reimbursed and any balance credits and/or overdraft charges from the Fund's custodian, do not exceed the following annual rates as a percentage of the class' average daily net assets:
| Class I | | | 0.80 | % | |
| Class W | | | 1.25 | | |
| Class Z | | | 1.00 | | |
Under the agreement, the following fees and expenses are excluded from the waiver/reimbursement commitment, and therefore will be paid by the Fund, if applicable: taxes (including foreign transaction taxes), expenses associated with investments in affiliated and non-affiliated pooled investment vehicles (including mutual funds and exchange traded funds), transaction costs and brokerage commissions, costs related to any securities lending program, dividend expenses associated with securities sold short, inverse floater program fees and expenses, transaction charges and interest on borrowed money, interest, extraordinary expenses and any other expenses the exclusion of which is specifically approved by the Board. This agreement may be modified or amended only with approval from all parties.
Prior to July 1, 2011, the Investment Manager voluntarily agreed to reimburse a portion of the Fund's expenses (excluding certain expenses, such as any distribution and service fees, brokerage commissions, interest, taxes and extraordinary expenses, but including custodian charges relating to overdrafts, if any) so that the Fund's ordinary net operating expenses, after giving effect to fees waived/expenses reimbursed and any balance credits and/or overdraft charges from the Fund's custodian, did not exceed 1.15% of the Fund's average daily net assets.
Note 4. Federal Tax Information
The timing and character of income and capital gain distributions are determined in accordance with income tax regulations, which may differ from GAAP because of temporary or permanent book to tax differences.
For the year ended February 29, 2012, these differences are primarily due to differing treatment for Recognition of unrealized appreciation (depreciation) for certain derivative investments, capital loss carryforwards, deferred trustees expense, post-October losses deferral/reversal of wash sales, passive foreign investment company (PFIC) holdings and foreign capital gains tax. To the extent these differences are permanent, reclassifications are made among the components of the Fund's net assets in the Statement of Assets and Liabilities. Temporary differences do not require reclassifications. In the Statement of Assets and Liabilities the following reclassifications were made:
Excess of distributions over
net investment income | | | $(46,068) | | |
| Accumulated net realized loss | | | 46,068 | | |
| Paid-in capital | | | — | | |
Net investment income and net realized gains (losses), as disclosed in the Statement of Operations, and net assets were not affected by this reclassification.
25
Columbia Overseas Value Fund, February 29, 2012
The tax character of distributions paid during the years indicated was as follows:
| | | Year ended
February 29,
2012 | | Year ended
February 28,
2011 | |
| Ordinary income | | $ | 1,050,859 | | | $ | 165,101 | | |
Short-term capital gain distributions, if any, are considered ordinary income distributions for tax purposes.
At February 29, 2012, the components of distributable earnings on a tax basis were as follows:
| Undistributed ordinary income | | $ | 61,432 | | |
| Undistributed accumulated long-term gain | | | — | | |
| Unrealized depreciation | | | (201,899 | ) | |
At February 29, 2012, the cost of investments for federal income tax purposes was $31,060,460 and the aggregate gross unrealized appreciation and depreciation based on that cost was:
| Unrealized appreciation | | $ | 2,219,170 | | |
| Unrealized depreciation | | $ | (2,421,069 | ) | |
| Net unrealized depreciation | | $ | (201,899 | ) | |
The following capital loss carryforward, determined at February 29, 2012, may be available to reduce taxable income arising from future net realized gains on investments, if any, to the extent permitted by the Internal Revenue Code:
| Year of Expiration | | Amount | |
| 2017 | | $ | 365,313 | | |
| 2018 | | | 2,028,503 | | |
| Unlimited short-term | | | 2,338,679 | | |
| Unlimited long-term | | | 105,742 | | |
| Total | | $ | 4,838,237 | | |
On December 22, 2010, the Regulated Investment Company Modernization Act of 2010 (the Act) was enacted, which changed various technical rules governing the tax treatment of regulated investment companies. The changes are generally effective for taxable years beginning after the date of enactment. Under the Act, the Fund will be permitted to carry forward capital losses incurred in taxable years beginning after the date of enactment for an unlimited period. However, any losses incurred during those future taxable years will be required to be utilized prior to the losses incurred in pre-enactment taxable years, which carry an expiration date. As a result of this ordering rule, pre-enactment capital loss carryforwards may be more likely to expire unused.
Under current tax rules, regulated investment companies can elect to treat certain late-year ordinary losses incurred and post-October capital losses (capital losses realized after October 31) as arising on the first day of the following taxable year. As of February 29, 2012, the Fund will elect to treat post-October capital losses of $372,856 as arising on March 1, 2012.
Management of the Fund has concluded that there are no significant uncertain tax positions that would require recognition in the financial statements. However, management's conclusion may be subject to review and adjustment at a later date based on factors including, but not limited to, new tax laws, regulations, and administrative interpretations (including relevant court decisions). Generally, the Fund's federal tax returns for the prior three fiscal years remain subject to examination by the Internal Revenue Service.
Note 5. Portfolio Information
The cost of purchases and proceeds from sales of securities, excluding short-term obligations, aggregated to $56,289,274 and $30,718,743, respectively, for the year ended February 29, 2012.
Note 6. Lending of Portfolio Securities
Effective June 27, 2011, the Fund has entered into a Master Securities Lending Agreement (the Agreement) with JPMorgan Chase Bank, N.A. (JPMorgan). The Agreement, which replaces the previous security lending arrangement with State Street, authorizes JPMorgan as lending agent to lend securities to authorized borrowers in order to generate additional income on behalf of the Fund. Pursuant to the Agreement, the securities loaned are secured by cash or U.S. government securities equal to at least 100% of the market value of the loaned securities. Any additional collateral
26
Columbia Overseas Value Fund, February 29, 2012
required to maintain those levels due to market fluctuations of the loaned securities is requested to be delivered the following business day. Cash collateral received is invested by the lending agent on behalf of the Fund into authorized investments pursuant to the Agreement. The investments made with the cash collateral are listed in the Portfolio of Investments. The values of such investments and any uninvested cash collateral are disclosed in the Statement of Assets and Liabilities along with the related obligation to return the collateral upon the return of the securities loaned.
For the year ended February 29, 2012, the Fund did not participate in securities lending activity.
Risks of delay in recovery of securities or even loss of rights in the securities may occur should the borrower of the securities fail financially. Risks may also arise to the extent that the value of the securities loaned increases above the value of the collateral received. JPMorgan will indemnify the Fund from losses resulting from a borrower's failure to return a loaned security when due. Such indemnification does not extend to losses associated with declines in the value of cash collateral investments. The Investment Manager is not responsible for any losses incurred by the Fund in connection with the securities lending program. Loans are subject to termination by the Fund or the borrower at any time, and are, therefore, not considered to be illiquid investments.
Pursuant to the Agreement, the Fund receives income for lending its securities either in the form of fees or by earning interest on invested cash collateral, net of negotiated rebates paid to borrowers and fees paid to the lending agent for services provided and any other securities lending expenses. [Delete if not applicable:] Net income earned from securities lending for the year ended February 29, 2012 is disclosed in the Statement of Operations. The Fund continues to earn and accrue interest and dividends on the securities loaned.
Prior to June 27, 2011, the Fund participated in a securities lending arrangement with State Street. Each security on loan was collateralized in an amount at least equal to the market value of the securities loaned plus accrued income from the investment of collateral. The income generated by the investment of the collateral, net of any fees remitted to State Street as the lending agent and borrower rebates, was paid to the Fund.
Note 7. Custody Credits
Prior to June 27, 2011, the Fund had an agreement with its custodian bank under which custody fees may have been reduced by balance credits. These credits are recorded as part of expense reductions on the Statement of Operations. The Fund could have invested a portion of the assets utilized in connection with the expense offset arrangement in an income-producing asset if they had not entered into such an agreement. Subsequent to this date, the Fund may invest its daily balance in an affiliated money market fund as detailed below. For the period March 1, 2011 through June 26, 2011, there were no custody credits.
Note 8. Affiliated Money Market Fund
Effective June 27, 2011, the Fund may invest its daily cash balances in Columbia Short-Term Cash Fund, an affiliated money market fund established for the exclusive use by the Fund and other affiliated funds. The income earned by the Fund from such investments is included as "Dividends from affiliates" in the Statement of Operations. As an investing fund, the Fund indirectly bears its proportionate share of the expenses of Columbia Short-Term Cash Fund.
Note 9. Shareholder Concentration
At February 29, 2012, affiliated shareholder accounts owned 100% of the outstanding shares of the Fund. Subscription and redemption activity by concentrated accounts may have a significant effect on the operations of the Fund.
Note 10. Line of Credit
The Fund has entered into a revolving credit facility with a syndicate of banks led by JPMorgan Chase Bank, N.A. (the Administrative Agent), whereby the Fund may borrow for the temporary funding of shareholder redemptions or for other temporary or emergency purposes. The credit facility became effective on June 27, 2011, replacing a prior credit facility. The credit facility agreement, as amended, which is a collective agreement between the Fund and certain other funds managed by the Investment Manager, severally and not jointly, permits collective borrowings up to $500 million. Pursuant to a December 13, 2011 amendment to the credit facility agreement, interest is charged to each participating fund based on its borrowings at a rate equal to the higher of (i) the overnight federal funds rate plus 1.00% or (i) the
27
Columbia Overseas Value Fund, February 29, 2012
one-month LIBOR rate plus 1.00%. Each borrowing under the credit facility matures no later than 60 days after the date of borrowing. The Fund also pays a commitment fee equal to its pro rata share of the amount of the credit facility at a rate of 0.08% per annum. For the period June 27, 2011 through December 12, 2011, interest was charged to each participating fund based on its borrowings at a rate equal to the sum of the federal funds rate plus (i) 1.25% per annum plus (ii) if one-month LIBOR exceeds the federal funds rate, the amount of such excess. The Fund also paid a commitment fee equal to its pro rata share of the amount of the credit facility at a rate of 0.10% per annum.
For the period May 16, 2011 through June 26, 2011, the Fund and certain other funds managed by the Investment Manager participated in a $150 million committed, unsecured revolving credit facility provided by State Street. For the period March 28, 2011 through May 15, 2011, the collective borrowing amount of the credit facility was $225 million. Prior to March 28, 2011, the collective borrowing amount of the credit facility was $280 million. Interest was charged to each fund based on its borrowings at a rate equal to the greater of the (i) federal funds rate plus 1.25% per annum or (ii) the overnight LIBOR rate plus 1.25% per annum. The Fund also paid a commitment fee equal to its pro rata share of the amount of the credit facility at a rate of 0.125% per annum.
The Fund had no borrowings during the year ended February 29, 2012.
Note 11. Significant Risks
Foreign Securities Risk
Investing in foreign securities may include certain risks and considerations not typically associated with investing in U.S. securities, such as fluctuating currency values and changing local and regional economic, political and social conditions, which may result in greater market volatility. In addition, certain foreign securities may not be as liquid as U.S. securities. Investing in emerging markets may accentuate these risks.
Investments in emerging market countries are subject to additional risk. The risk of foreign investments is typically increased in less developed countries. These countries are also more likely to experience high levels of inflation, deflation or currency devaluation which could hurt their economies and securities markets.
Note 12. Subsequent Events
Management has evaluated the events and transactions that have occurred through the date the financial statements were issued and noted no items requiring adjustment of the financial statements or additional disclosure.
Note 13. Information Regarding Pending and Settled Legal Proceedings
In June 2004, an action captioned John E. Gallus et al. v. American Express Financial Corp. and American Express Financial Advisors Inc. was filed in the United States District Court for the District of Arizona. The plaintiffs allege that they are investors in several American Express Company mutual funds (currently branded as Columbia) and they purport to bring the action derivatively on behalf of those funds under the Investment Company Act of 1940. The plaintiffs allege that fees allegedly paid to the defendants by the funds for investment advisory and administrative services are excessive. The plaintiffs seek remedies including restitution and rescission of investment advisory and distribution agreements. The plaintiffs voluntarily agreed to transfer this case to the United States District Court for the District of Minnesota (the District Court). In response to defendants' motion to dismiss the complaint, the District Court dismissed one of plaintiffs' four claims and granted plaintiffs limited discovery. Defendants moved for summary judgment in April 2007. Summary judgment was granted in the defendants' favor on July 9, 2007. The plaintiffs filed a notice of appeal with the Eighth Circuit Court of Appeals (the Eighth Circuit) on August 8, 2007. On April 8, 2009, the Eighth Circuit reversed summary judgment and remanded to the District Court for further proceedings. On August 6, 2009, defendants filed a writ of certiorari with the U.S. Supreme Court (the Supreme Court), asking the Supreme Court to stay the District Court proceedings while the Supreme Court considered and ruled in a case captioned Jones v. Harris Associates, which involved issues of law similar to those presented in the Gallus case. On March 30, 2010, the Supreme Court issued its ruling in Jones v. Harris Associates, and on April 5, 2010, the Supreme Court vacated the Eighth Circuit's decision in the Gallus case and remanded the case to the Eighth Circuit for further consideration in light of the
28
Columbia Overseas Value Fund, February 29, 2012
Supreme Court's decision in Jones v. Harris Associates. On June 4, 2010, the Eighth Circuit remanded the Gallus case to the District Court for further consideration in light of the Supreme Court's decision in Jones v. Harris Associates. On December 9, 2010, the District Court reinstated its July 9, 2007 summary judgment order in favor of the defendants. On January 10, 2011, plaintiffs filed a notice of appeal with the Eighth Circuit. In response to the plaintiffs' opening appellate brief filed on March 18, 2011, the defendants filed a response brief on May 4, 2011 with the Eighth Circuit. The plaintiffs filed a reply brief on May 26, 2011 and oral arguments took place on November 17, 2011. On March 30, 2012, the Eighth Circuit upheld the grant of summary judgment by the District Court in favor of the defendants.
In December 2005, without admitting or denying the allegations, American Express Financial Corporation (AEFC, which is now known as Ameriprise Financial, Inc. (Ameriprise Financial)) entered into settlement agreements with the Securities and Exchange Commission (SEC) and Minnesota Department of Commerce (MDOC) related to market timing activities. As a result, AEFC was censured and ordered to cease and desist from committing or causing any violations of certain provisions of the Investment Advisers Act of 1940, the Investment Company Act of 1940, and various Minnesota laws. AEFC agreed to pay disgorgement of $10 million and civil money penalties of $7 million. AEFC also agreed to retain an independent distribution consultant to assist in developing a plan for distribution of all disgorgement and civil penalties ordered by the SEC in accordance with various undertakings detailed at www.sec.gov/litigation/admin/ia-2451.pdf. Ameriprise Financial and its affiliates have cooperated with the SEC and the MDOC in these legal proceedings, and have made regular reports to the funds' Boards of Trustees.
Ameriprise Financial and certain of its affiliates have historically been involved in a number of legal, arbitration and regulatory proceedings, including routine litigation, class actions, and governmental actions, concerning matters arising in connection with the conduct of their business activities. Ameriprise Financial believes that the Funds are not currently the subject of, and that neither Ameriprise Financial nor any of its affiliates are the subject of, any pending legal, arbitration or regulatory proceedings that are likely to have a material adverse effect on the Funds or the ability of Ameriprise Financial or its affiliates to perform under their contracts with the Funds. Ameriprise Financial is required to make 10-Q, 10-K and, as necessary, 8-K filings with the Securities and Exchange Commission on legal and regulatory matters that relate to Ameriprise Financial and its affiliates. Copies of these filings may be obtained by accessing the SEC website at www.sec.gov.
There can be no assurance that these matters, or the adverse publicity associated with them, will not result in increased fund redemptions, reduced sale of fund shares or other adverse consequences to the Funds. Further, although we believe proceedings are not likely to have a material adverse effect on the Funds or the ability of Ameriprise Financial or its affiliates to perform under their contracts with the Funds, these proceedings are subject to uncertainties and, as such, we are unable to estimate the possible loss or range of loss that may result. An adverse outcome in one or more of these proceedings could result in adverse judgments, settlements, fines, penalties or other relief that could have a material adverse effect on the consolidated financial condition or results of operations of Ameriprise Financial.
29
Report of Independent Registered Public Accounting Firm
To the Trustees of Columbia Funds Series Trust and the Shareholders of Columbia Overseas Value Fund
In our opinion, the accompanying statement of assets and liabilities, including the investment portfolio, and the related statements of operations and of changes in net assets and the financial highlights present fairly, in all material respects, the financial position of Columbia Overseas Value Fund (the "Fund") (a series of Columbia Funds Series Trust) at February 29, 2012, the results of its operations for the year then ended, the changes in its net assets for each of the two years in the period then ended and the financial highlights for each of the periods indicated, in conformity with accounting principles generally accepted in the United States of America. These financial statements and financial highlights (hereafter referred to as "financial statements") are the responsibility of the Fund's management. Our responsibility is to express an opinion on these financial statements based on our audits. We conducted our audits of these financial statements in accordance with the standards of the Public Company Accounting Oversight Board (United States). Those standards require that we plan and perform the audit to obtain reasonable assurance about whether the financial statements are free of material misstatement. An audit includes examining, on a test basis, evidence supporting the amounts and disclosures in the financial statements, assessing the accounting principles used and significant estimates made by management, and evaluating the overall financial statement presentation. We believe that our audits, which included confirmation of securities at February 29, 2012 by correspondence with the custodian and brokers, provide a reasonable basis for our opinion.
PricewaterhouseCoopers LLP
Minneapolis, Minnesota
April 20, 2012
30
Federal Income Tax Information (Unaudited) – Columbia Overseas Value Fund
Foreign taxes paid during the fiscal year ended February 29, 2012, of $124,058 are being passed through to shareholders. This represents $0.03 per share. Eligible shareholders may claim this amount as a foreign tax credit.
Gross income derived from sources within foreign countries was $1,533,107 ($0.36 per share) for the fiscal year ended February 29, 2012.
For non-corporate shareholders 100.00% or the maximum amount allowable under the Jobs and Growth Tax Relief Reconciliation Act of 2003, of the ordinary income distributed by the Fund for the fiscal year February 29, 2012 may represent qualified dividend income.
The Fund will notify shareholders in January 2013 of amounts for use in preparing 2012 income tax returns.
31
Fund Governance
Shareholders elect the Board that oversees the funds' operations. The Board appoints officers who are responsible for day-to-day business decisions based on policies set by the Board. The following table provides basic biographical information about the funds' Board members, including their principal occupations during the past five years, although specific titles for individuals may have varied over the period. Under current Board policy, members may serve until the next Board meeting after he or she reaches the mandatory retirement age established by the Board, or the fifteenth anniversary of the first Board meeting they attended as a member of the Board.
On September 29, 2009, Ameriprise Financial, the parent company of Columbia Management, entered into an agreement with Bank of America, N.A. ("Bank of America") to acquire a portion of the asset management business of Columbia Management Group, LLC and certain of its affiliated companies (the "Transaction"). Following the Transaction, which became effective on May 1, 2010, various alignment activities have occurred with respect to the Fund Family. In connection with the Transaction, Mr. Edward J. Boudreau, Jr., Mr. William P. Carmichael, Mr. William A. Hawkins, Mr. R. Glenn Hilliard, Mr. John J. Nagorniak, Ms. Minor M. Shaw and Dr. Anthony M. Santomero, who were members prior to the Transaction of the Legacy Columbia Nations funds' Board ("Nations Funds"), which includes Columbia Funds Series Trust, Columbia Funds Variable Insurance Trust I and Columbia Funds Master Investment Trust, LLC., began service on the Board for the Legacy RiverSource funds ("RiverSource Funds") effective June 1, 2011, which resulted in an overall increase from twelve Trustees to sixteen for all mutual funds overseen by the Board.
Independent Board Members
| Name, Address, Age | | Position Held
with Funds
and Length
of Service | | Principal Occupation During Past Five Years | | Number of
Funds in the
Fund Family
Overseen by
Board Member | | Other Present or
Past Directorships/
Trusteeships
(Within Past 5 Years) | |
| Kathleen Blatz | | | | | | | | | |
|
901 S. Marquette Ave.
Minneapolis, MN 55402
Age 57 | | Board member since 1/06 for RiverSource Funds and since 6/11 for Nations Funds | | Attorney; Chief Justice, Minnesota Supreme Court, 1998-2006 | | | 153 | | | None | |
|
| Edward J. Boudreau, Jr. | | | | | | | | | |
|
225 Franklin Street
Mail Drop
BX32 05228
Boston, MA 02110
Age 67 | | Board member since 6/11 for RiverSource Funds and since 1/05 for Nations Funds | | Managing Director, E.J. Boudreau & Associates (consulting) since 2000 | | | 146 | | | Former Trustee, BofA Funds Series Trust (11 funds) | |
|
| Pamela G. Carlton | | | | | | | | | |
|
901 S. Marquette Ave.
Minneapolis, MN 55402
Age 57 | | Board member since 7/07 for RiverSource Funds and since 6/11 for Nations Funds | | President, Springboard-Partners in Cross Cultural Leadership (consulting company) | | | 153 | | | None | |
|
32
Fund Governance (continued)
Independent Board Members (continued)
| Name, Address, Age | | Position Held
with Funds
and Length
of Service | | Principal Occupation During Past Five Years | | Number of
Funds in the
Fund Family
Overseen by
Board Member | | Other Present or
Past Directorships/
Trusteeships
(Within Past 5 Years) | |
| William P. Carmichael | | | | | | | | | |
|
225 Franklin Street
Mail Drop
BX32 05228
Boston, MA 02110
Age 68 | | Board member since 6/11 for RiverSource Funds and since 1999 for Nations Funds | | Retired | | | 146 | | | Director, Cobra Electronics Corporation (electronic equipment manufacturer); The Finish Line (athletic shoes and apparel); McMoRan Exploration Company (oil and gas exploration and development); former Trustee, BofA Funds Series Trust (11 funds); former Director, Spectrum Brands, Inc. (consumer products); former Director, Simmons Company (bedding) | |
|
| Patricia M. Flynn | | | | | | | | | |
|
901 S. Marquette Ave.
Minneapolis, MN 55402
Age 61 | | Board member since 11/04 for RiverSource Funds and since 6/11 for Nations Funds | | Trustee Professor of Economics and Management, Bentley University; former Dean, McCallum Graduate School of Business, Bentley University | | | 153 | | | None | |
|
| William A. Hawkins | | | | | | | | | |
|
225 Franklin Street
Mail Drop
BX32 05228
Boston, MA 02110
Age 69 | | Board member since 6/11 for RiverSource Funds and since 1/05 for Nations Funds | | Managing Director, Overton Partners (financial consulting), since August 2010; President and Chief Executive Officer, California General Bank, N.A., January 2008-August 2010 | | | 146 | | | Trustee, BofA Funds Series Trust (11 funds) | |
|
| R. Glenn Hilliard | | | | | | | | | |
|
225 Franklin Street
Mail Drop
BX32 05228
Boston, MA 02110
Age 69 | | Board member since 6/11 for RiverSource Funds and since 1/05 for Nations Funds | | Chairman and Chief Executive Officer, Hilliard Group LLC (investing and consulting), since April 2003; Non-Executive Director & Chairman, CNO Financial Group, Inc. (formerly Conseco, Inc.) (insurance), September 2003-May 2011 | | | 146 | | | Chairman, BofA Fund Series Trust (11 funds); former Director, CNO Financial Group, Inc. (insurance) | |
|
33
Fund Governance (continued)
Independent Board Members (continued)
| Name, Address, Age | | Position Held
with Funds
and Length
of Service | | Principal Occupation During Past Five Years | | Number of
Funds in the
Fund Family
Overseen by
Board Member | | Other Present or
Past Directorships/
Trusteeships
(Within Past 5 Years) | |
| Stephen R. Lewis, Jr. | | | | | | | | | |
|
901 S. Marquette Ave.
Minneapolis, MN 55402
Age 73 | | Chair of the Board for RiverSource Funds since 1/07, Board member for RiverSource Funds since 1/02 and since 6/11 for Nations Funds | | President Emeritus and Professor of Economics Emeritus, Carleton College | | | 153 | | | Director, Valmont Industries, Inc. (manufactures irrigation systems) | |
|
| John F. Maher | | | | | | | | | |
|
901 S. Marquette Ave.
Minneapolis, MN 55402
Age 68 | | Board member since 12/06 for Legacy Seligman funds, since 12/08 for RiverSource Funds and since 6/11 for Nations Funds | | Retired President and Chief Executive Officer and former Director, Great Western Financial Corporation (financial services), 1986-1997 | | | 153 | | | None | |
|
| John J. Nagorniak | | | | | | | | | |
|
225 Franklin Street
Mail Drop
BX32 05228
Boston, MA 02110
Age 67 | | Board member since 6/11 for RiverSource Funds and since 1/08 for Nations Funds | | Retired; President and Director, Foxstone Financial, Inc. (consulting), 2000-2007; Director, Mellon Financial Corporation affiliates (investing), 2000-2007; Chairman, Franklin Portfolio Associates (investing—Mellon affiliate), 1982-2007 | | | 146 | | | Trustee, Research Foundation of CFA Institute; Director, MIT Investment Company; Trustee, MIT 401k Plan; former Trustee, BofA Funds Series Trust (11 funds) | |
|
| Catherine James Paglia | | | | | | | | | |
|
901 S. Marquette Ave.
Minneapolis, MN 55402
Age 59 | | Board member since 11/04 for RiverSource Funds and since 6/11 for Nations Funds | | Director, Enterprise Asset Management, Inc. (private real estate and asset management company) | | | 153 | | | None | |
|
34
Fund Governance (continued)
Independent Board Members (continued)
| Name, Address, Age | | Position Held
with Funds
and Length
of Service | | Principal Occupation During Past Five Years | | Number of
Funds in the
Fund Family
Overseen by
Board Member | | Other Present or
Past Directorships/
Trusteeships
(Within Past 5 Years) | |
| Leroy C. Richie | | | | | | | | | |
|
901 S. Marquette Ave.
Minneapolis, MN 55402
Age 70 | | Board member since 2000 for Legacy Seligman funds, since 11/08 for RiverSource Funds and since 6/11 for Nations Funds | | Counsel, Lewis & Munday, P.C. since 2004; former Vice President and General Counsel, Automotive Legal Affairs, Chrysler Corporation | | | 153 | | | Director, Digital Ally, Inc. (digital imaging); Director, Infinity, Inc. (oil and gas exploration and production); Director, OGE Energy Corp. (energy and energy services) | |
|
| Minor M. Shaw | | | | | | | | | |
|
225 Franklin Street
Mail Drop
BX32 05228
Boston, MA 02110
Age 64 | | Board member since 6/11 for RiverSource Funds and since 2003 for Nations Funds | | President—Micco LLC (private investments) | | | 146 | | | Former Trustee, BofA Funds Series Trust (11 funds); Board Member, Piedmont Natural Gas; Director, Blue Cross Blue Shield of South Carolina | |
|
| Alison Taunton-Rigby | | | | | | | | | |
|
901 S. Marquette Ave.
Minneapolis, MN 55402
Age 67 | | Board member since 11/02 for RiverSource Funds and since 6/11 for Nations Funds | | Chief Executive Officer and Director, RiboNovix, Inc. 2003-2010 (biotechnology); former President, Aquila Biopharmaceuticals | | | 153 | | | Director, Healthways, Inc. (health management programs); Director, ICI Mutual Insurance Company, RRG; Director, Abt Associates (government contractor) | |
|
35
Fund Governance (continued)
Interested Board Member Not Affiliated with Investment Manager*
| Name, Address, Age | | Position Held
with Funds
and Length
of Service | | Principal Occupation During Past Five Years | | Number of
Funds in the
Fund Family
Overseen by
Board Member | | Other Present or
Past Directorships/
Trusteeships
(Within Past 5 Years) | |
| Anthony M. Santomero* | | | | | | | | | |
|
225 Franklin Street
Mail Drop
BX32 05228
Boston, MA 02110
Age 65 | | Board member since 6/11 for RiverSource Funds and since 1/08 for Nations Funds | | Richard K. Mellon Professor Emeritus of Finance, The Wharton School, University of Pennsylvania, since 2002; Senior Advisor, McKinsey & Company (consulting), 2006-2008; President and Chief Executive Officer, Federal Reserve Bank of Philadelphia, 2000-2006 | | | 146 | | | Director, Renaissance Reinsurance Ltd.; Trustee, Penn Mutual Life Insurance Company; Director, Citigroup; Director, Citibank, N.A.; former Trustee, BofA Funds Series Trust (11 funds) | |
|
* Dr. Santomero is not an affiliated person of the Investment Manager or Ameriprise Financial. However, he is currently deemed by the funds to be an "interested person" (as defined in the 1940 Act) of the Funds because he serves as a Director of Citigroup, Inc. and Citibank N.A., companies that may directly or through subsidiaries and affiliates engage from time-to-time in brokerage execution, principal transactions and lending relationships with the funds or accounts advised/managed by the Investment Manager.
Interested Board Member Affiliated with Investment Manager*
| William F. Truscott | | | | | | | | | |
53600 Ameriprise Financial Center
Minneapolis, MN 55474
Age 51 | | Board member since 11/01 for RiverSource Funds and since 6/11 for Nations Funds; Senior Vice President since 2002 for RiverSource Funds and Nations Funds | | Chairman of the Board and President, Columbia Management Investment Advisers, LLC since May 2010 and February 2012, respectively (previously President, Chairman of the Board and Chief Investment Officer, 2001-April 2010); Chief Executive Officer, U.S. Asset Management & President, Annuities, Ameriprise Financial, Inc. since May 2010 (previously President—U.S. Asset Management and Chief Investment Officer, 2005-April 2010); Director, President and Chief Executive Officer, Ameriprise Certificate Company since 2006; Director and Chief Executive Officer, Columbia Management Investment Distributors, Inc. since May 2010 and February 2012, respectively (previously Chairman of the Board and Chief Executive Officer, 2006-April 2010); Chairman of the Board and Chief Executive Officer, RiverSource Distributors, Inc. since 2006. | | | 153 | | | None | |
|
* Interested person (as defined under the 1940 Act) by reason of being an officer, director, security holder and/or employee of the Investment Manager or Ameriprise Financial.
The SAI has additional information about the Fund's Board members and is available, without charge, upon request by calling 800.345.6611; contacting your financial intermediary; or visiting columbiamanagement.com.
36
Fund Governance (continued)
Officers
| Name, Year of Birth and Address | | Principal Occupation(s) During the Past Five Years | |
| J. Kevin Connaughton (Born 1964) | | | |
|
225 Franklin Street
Boston, MA 02110
President (since 2009) | | Senior Vice President and General Manager—Mutual Fund Products, Columbia Management Investment Advisers, LLC since May 2010; President, Columbia Funds, since 2009, and RiverSource Funds, since May 2010 (previously Senior Vice President and Chief Financial Officer, Columbia Funds, from June 2008 to January 2009, Treasurer, Columbia Funds, from October 2003 to May 2008, and senior officer of various other affiliated funds since 2000); Managing Director, Columbia Management Advisors, LLC from December 2004 to April 2010. | |
|
| Michael G. Clarke (Born 1969) | | | |
|
225 Franklin Street
Boston, MA 02110
Treasurer (since 2011) and Chief Financial Officer (since 2009) | | Vice President, Columbia Management Investment Advisers, LLC since May 2010; Managing Director of Fund Administration, Columbia Management Advisors, LLC, from September 2004 to April 2010; senior officer of Columbia Funds and affiliated funds since 2002. | |
|
| Scott R. Plummer (Born 1959) | | | |
|
5228 Ameriprise Financial Center
Minneapolis, MN 55474
Senior Vice President and Chief Legal Officer (since 2010) | | Chief Legal Officer and Assistant Secretary, Columbia Management Investment Advisers, LLC since June 2005; Vice President and Lead Chief Counsel—Asset Management, Ameriprise Financial, Inc. since May 2010 (previously Vice President and Chief Counsel—Asset Management, from 2005 to April 2010, Vice President, Chief Counsel and Assistant Secretary, Columbia Management Investment Distributors, Inc. since 2008; Vice President, General Counsel and Secretary, Ameriprise Certificate Company since 2005; Chief Counsel, RiverSource Distributors, Inc. since 2006; Senior officer of Columbia Funds and affiliated funds, since 2006. | |
|
| Thomas P. McGuire (Born 1972) | | | |
|
225 Franklin Street
Boston, MA 02110
Chief Compliance Officer (since 2012) | | Vice President—Asset Management Compliance, Columbia Management Investment Advisers, LLC since March 2010; Chief Compliance Officer, Ameriprise Certificate Company, since September 2010; Compliance Executive, Bank of America, from June 2005 to April 2010. | |
|
| William F. Truscott (Born 1960) | | | |
|
53600 Ameriprise Financial Center
Minneapolis, MN 55474
Senior Vice President (since 2010) | | Chairman of the Board and President, Columbia Management Investment Advisers, LLC since May 2010 and February 2012, respectively (previously President, Chairman of the Board and Chief Investment Officer, from 2001 to April 2010); Chief Executive Officer, U.S. Asset Management & President, Annuities, Ameriprise Financial, Inc. since May 2010 (previously President—U.S. Asset Management and Chief Investment Officer from 2005 to April 2010); Director, President and Chief Executive Officer, Ameriprise Certificate Company since 2006; Director and Chief Executive Officer, Columbia Management Investment Distributors, Inc. since May 2010 and February 2012, respectively (previously Chairman of the Board and Chief Executive Officer from 2008 to April 2010); Chairman of the Board and Chief Executive Officer, RiverSource Distributors, Inc. since 2006. | |
|
| Paul D. Pearson (Born 1956) | | | |
|
10468 Ameriprise Financial Center
Minneapolis, MN 55474
Vice President and Assistant Treasurer (since 2011) | | Vice President, Investment Accounting, Columbia Management Investment Advisers, LLC, since May 2010; Vice President—Managed Assets, Investment Accounting, Ameriprise Financial Corporation, 1998-2010. | |
|
37
Fund Governance (continued)
Officers (continued)
| Name, Year of Birth and Address | | Principal Occupation(s) During the Past Five Years | |
| Colin Moore (Born 1958) | |
|
225 Franklin Street
Boston, MA 02110
Senior Vice President (since 2010) | | Director and Chief Investment Officer, Columbia Management Investment Advisers, LLC since May 2010; Manager, Managing Director and Chief Investment Officer of Columbia Management Advisors, LLC from 2007 to April 2010; Head of Equities, Columbia Management Advisors, LLC from 2002 to 2007. | |
|
| Christopher O. Petersen (Born 1970) | |
|
5228 Ameriprise Financial Center
Minneapolis, MN 55474
Vice President and Secretary (since 2011) | | Vice President and Chief Counsel, Ameriprise Financial since January 2010 (formerly Vice President and Group Counsel or Counsel from April 2004 to January 2010); Senior officer of Columbia Funds and affiliated funds, since 2007. | |
|
| Amy K. Johnson (Born 1965) | |
|
5228 Ameriprise Financial Center
Minneapolis, MN 55474
Vice President (since 2010) | | Senior Vice President and Chief Operating Officer, Columbia Management Investment Advisers, LLC since May 2010 (previously Chief Administrative Officer, from 2009 until April 2010, Vice President—Asset Management and Trust Company Services, from 2006 to 2009, and Vice President—Operations and Compliance from 2004 to 2006). | |
|
| Joseph F. DiMaria (Born 1968) | |
|
225 Franklin Street
Boston, MA 02110
Vice President (since 2011) and Chief Accounting Officer (since 2008) | | Vice President, Mutual Fund Administration, Columbia Management Investment Advisers, LLC, since May 2010; Director of Fund Administration, Columbia Management Advisors, LLC from January 2006 to April 2010. | |
|
| Paul B. Goucher (Born 1968) | |
|
100 Park Avenue
New York, NY 10017
Vice President and Assistant Secretary (since 2010) | | Vice President and Chief Counsel of Ameriprise Financial since January 2010 (formerly Vice President and Group Counsel from November 2008 to January 2010); Director, Managing Director and General Counsel of J. & W. Seligman & Co. Incorporated (Seligman) from July 2008 to November 2008 and Managing Director and Associate General Counsel of Seligman from January 2005 to July 2008. | |
|
| Michael E. DeFao (Born 1968) | |
|
225 Franklin Street
Boston, MA 02110
Vice President and Assistant Treasurer (since 2011) | | Vice President and Chief Counsel, Ameriprise Financial since May 2010; Associate General Counsel, Bank of America from June 2005 to April 2010 | |
|
| Stephen T. Welsh (Born 1957) | |
|
225 Franklin Street
Boston, MA 02110
Vice President (since 2006) | | President and Director, Columbia Management Investment Services Corp. since May 2010; President and Director, Columbia Management Services, Inc. from July 2004 to April 2010; Managing Director, Columbia Management Distributors, Inc. from August 2007 to April 2010. | |
|
38
This page intentionally left blank.
39
This page intentionally left blank.
40
Important Information About This Report
The fund mails one shareholder report to each shareholder address. If you would like more than one report, please call shareholder services at 1-800-345-6611 and additional reports will be sent to you. This report has been prepared for shareholders of Columbia Overseas Value Fund.
A description of the policies and procedures that the fund uses to determine how to vote proxies and a copy of the fund's voting records are available (i) at www.columbiamanagement.com, (ii) on the Securities and Exchange Commission's website at www.sec.gov, and (iii) without charge, upon request, by calling 1-800-368-0346. Information regarding how the fund voted proxies relating to portfolio securities during the 12-month period ended June 30 is available from the SEC's website. Information regarding how the fund voted proxies relating to portfolio securities is also available from the fund's website, www.columbiamanagement.com.
The fund files a complete schedule of portfolio holdings with the SEC for the first and third quarters of each fiscal year on Form N-Q. The fund's Form N-Q is available on the SEC's website at www.sec.gov and may be reviewed and copied at the SEC's Public Reference Room in Washington, D.C. Information on the operation of the Public Reference Room may be obtained by calling 1-800-SEC-0330.
Transfer Agent
Columbia Management Investment
Services Corp.
P.O. Box 8081
Boston, MA 02266-8081
1-800-345-6611
Distributor
Columbia Management Investment
Distributors, Inc.
225 Franklin Street
Boston, MA 02110
Investment Manager
Columbia Management Investment Advisers, LLC
225 Franklin Street
Boston, MA 02110
41

Columbia Overseas Value Fund
P. O. Box 8081
Boston, MA 02266-8081
columbiamanagement.com
This information is for use with concurrent or prior delivery of a fund prospectus. Investors should consider the investment objectives, risks, charges and expenses of a mutual fund carefully before investing. For a free prospectus, which contains this and other important information about the funds, visit columbiamanagement.com. Read the prospectus carefully before investing. The Fund is distributed by Columbia Management Investment Distributors, Inc., member FINRA, and managed by Columbia Management Investment Advisers, LLC.
© 2012 Columbia Management Investment Advisers, LLC. All rights reserved.
C-1256 C (4/12)

Columbia Marsico 21st Century Fund
Annual Report for the Period Ended February 29, 2012
Not FDIC insured • No bank guarantee • May lose value
Table of Contents
| Fund Profile | | | 1 | | |
|
| Performance Information | | | 2 | | |
|
| Understanding Your Expenses | | | 3 | | |
|
| Portfolio Managers' Report | | | 4 | | |
|
| Portfolio of Investments | | | 6 | | |
|
Statement of Assets and
Liabilities | | | 11 | | |
|
| Statement of Operations | | | 13 | | |
|
Statement of Changes in
Net Assets | | | 14 | | |
|
| Financial Highlights | | | 16 | | |
|
| Notes to Financial Statements | | | 21 | | |
|
Report of Independent Registered
Public Accounting Firm | | | 32 | | |
|
| Fund Governance | | | 33 | | |
|
Important Information About
This Report | | | 41 | | |
|
The views expressed in this report reflect the current views of the respective parties. These views are not guarantees of future performance and involve certain risks, uncertainties and assumptions that are difficult to predict, so actual outcomes and results may differ significantly from the views expressed. These views are subject to change at any time based upon economic, market or other conditions and the respective parties disclaim any responsibility to update such views. These views may not be relied on as investment advice and, because investment decisions for a Columbia Fund are based on numerous factors, may not be relied on as an indication of trading intent on behalf of any particular Columbia Fund. References to specific securities should not be construed as a recommendation or investment advice.
President's Message

Dear Shareholders,
Americans were dispirited in the fourth quarter of 2011 by Washington's inability to reach a plan for deficit reduction and Europe's piecemeal attempt to address its own fiscal issues. Yet, there was sufficient good news to encourage risk taking, buoying both stocks and bonds to solid gains.
U.S. economic data surprised on the upside and fears of recession abated. With the bar of expectations set low, investors responded positively to the announcement that the economy had expanded by 1.8% in the third quarter. Consumer confidence improved, even though consumers remain under pressure with no real increase in disposable income and a continued decline in household net worth. Headline inflation—which tracks a broad range of consumer expenditures, including food and energy—declined. Even manufacturing held its ground.
Against this backdrop, the U.S. equity markets logged solid returns. The S&P 500 Index gained 11.82%, moving into positive territory for the year with quarterly advances in all ten sectors. Mid- and small-cap stocks did even better. Value outperformed growth across all market capitalizations. Energy stocks led the market, as the price of oil moved above $100 a barrel in December. Industrials and materials stocks rose, buoyed by improving economic data. The U.S. fixed-income markets logged modest but solid returns. High-yield bonds were the best performers as the economy showed signs of improvement. Emerging market bonds were strong performers, as inflation came under control in key regions. Municipal bonds and Treasuries eked out only modest gains, as investors moved away from quality in favor of riskier assets.
While fourth quarter gains were encouraging, challenges still remain. Columbia Management, however, remains strong and steadfast. Columbia Management is the eighth largest manager of long-term mutual fund assets with $326 billion under management as of December 31, 2011. The past year has been one of considerable change for the organization as we worked diligently to align products, services and resources in the integration of Columbia Management with RiverSource Investments. The strong line-up of talent, resources and capabilities that has resulted is highlighted by the success of our products. As of December 31, 2011, Columbia Management offers 52 funds rated either 4 or 5 stars by Morningstar.*
For more information about these and other funds offered by Columbia Management, including detailed, up-to-date fund performance and portfolio information, please visit us online at columbiamanagement.com. Other information and resources available on our website include:
g timely economic analysis and market commentary
g quarterly fund commentaries
g Columbia Management Investor, a quarterly newsletter for shareholders
Thank you for your continued support of the Columbia Funds. We look forward to serving your investment needs for many years to come.
Best Regards,

J. Kevin Connaughton
President, Columbia Funds
*All ratings are based on Class Z shares as of 12/31/2011. Out of 119 Class Z share Columbia funds rated by Morningstar, 7 funds received a 5-star Overall Rating and 45 funds received a 4-star Overall Rating. The Overall Morningstar Rating for a retail mutual fund is derived from a weighted average of the performance figures associated with its 3-, 5- and 10-year (if applicable) Morningstar Rating metrics. For share classes that do not have a 3-, 5-, or 10-year actual performance history, the fund's independent Morningstar Rating metric is then compared against the retail mutual fund universe breakpoints to determine its hypothetical rating.
For each fund with at least a three-year history, Morningstar calculates a Morningstar RatingTM based on a Morningstar Risk-Adjusted Return measure that accounts for variation in a fund's monthly performance (including the effects of sales charges/loads, and redemption fees), placing more emphasis on downward variations and rewarding consistent performance. The top 10% of funds in each category receive 5 stars, the next 22.5% receive 4 stars, the next 35% receive 3 stars, the next 22.5% receive 2 stars and the bottom 10% receive 1 star. (Each share class is counted as a fraction of one fund within this scale and rated separately, which may cause slight variations in the distribution percentages.)
The Morningstar RatingTM is for Class Z shares only; other classes may have different performance characteristics and may have different ratings. ©2012 Morningstar, Inc. All Rights Reserved. The Morningstar information contained herein: (1) is proprietary to Morningstar and/or its content providers; (2) may not be copied or distributed; and (3) is not warranted to be accurate, complete or timely. Neither Morningstar nor its content providers are responsible for any damages or losses arising from any use of this information.
Investors should consider the investment objectives, risks, charges and expenses of a mutual fund carefully before investing. For a free prospectus, which contains this and other important information about the funds, visit columbiamanagement.com. The prospectus should be read carefully before investing.
Columbia Funds are distributed by Columbia Management Investment Distributors, Inc., member FINRA, and managed by Columbia Management Investment Advisers, LLC.
© 2012 Columbia Management Investment Advisers, LLC. All rights reserved.
Fund Profile – Columbia Marsico 21st Century Fund
Summary
g For the 12-month period that ended February 29, 2012, the fund's Class A shares returned –6.82% without sales charge.
g The fund's benchmark, the Russell 3000 Index, returned 4.45%.1
g The fund's outsized stake in the financials sector hurt results compared to the benchmark as did underweights in health care and consumer staples.
Portfolio Management
Brandon Geisler has managed the fund since October 2011. He is with Marsico Capital Management, LLC (Marsico), investment subadviser to the fund.
Columbia Management Investment Advisers, LLC (the Investment Manager) retained Marsico to serve as investment subadviser to the Columbia Marsico funds. As an investment subadviser, Marsico makes the investment decisions and manages all or a portion of the fund. Marsico is an investment adviser registered with the Securities and Exchange Commission. Marsico is not affiliated with the Investment Manager.
1The Russell 3000 Index measures the performance of the 3,000 largest U.S. companies based on total market capitalization, which represents approximately 98% of the investable U.S. equity market.
Indices are not available for investment, are not professionally managed and do not reflect sales charges, fees, brokerage commissions, taxes or other expenses of investing. Securities in the fund may not match those in an index.
Performance data quoted represents past performance and current performance may be lower or higher. Past performance is no guarantee of future results. The investment return and principal value will fluctuate so that shares, when redeemed, may be worth more or less than the original cost. Please visit www.columbiamanagement.com for daily and most recent month-end performance updates.
Summary
1-year return as of 02/29/12
| | | | –6.82% | |
|
|  | | | Class A shares
(without sales charge) | |
|
| | | | +4.45% | |
|
|  | | | Russell 3000 Index | |
|
Morningstar Style BoxTM

The Morningstar Style BoxTM is based on the fund's portfolio holdings. For equity funds, the vertical axis shows the market capitalization of the stocks owned, and the horizontal axis shows investment style (value, blend, or growth). Information shown is based on the most recent data provided by Morningstar.
© 2012 Morningstar, Inc. All rights reserved. The Morningstar information contained herein: (1) is proprietary to Morningstar and/or its content providers; (2) may not be copied or distributed; and (3) is not warranted to be accurate, complete or timely. Neither Morningstar nor its content providers are responsible for any damages or losses arising from any use of this information.
1
Performance Information – Columbia Marsico 21st Century Fund
Performance data quoted represents past performance and current performance may be lower or higher. Past performance is no guarantee of future results. The investment return and principal value will fluctuate so that shares, when redeemed, may be worth more or less than the original cost. Please visit www.columbiamanagement.com for daily and most recent month-end performance updates.
Performance of a $10,000 investment 03/01/02 – 02/29/12
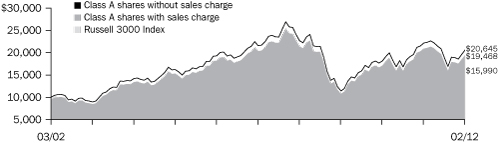
The chart above shows the change in value of a hypothetical $10,000 investment in Class A shares of Columbia Marsico 21st Century Fund during the stated time period, and does not reflect the deduction of taxes that a shareholder may pay on fund distributions or on the redemption of fund shares.
Performance of a $10,000 investment 03/01/02 – 02/29/12 ($)
| Sales charge | | without | | with | |
| Class A | | | 20,645 | | | | 19,468 | | |
| Class B | | | 19,139 | | | | 19,139 | | |
| Class C | | | 19,139 | | | | 19,139 | | |
| Class R* | | | 20,133 | | | | n/a | | |
| Class Z | | | 21,136 | | | | n/a | | |
Average annual total return as of 02/29/12 (%)
| Share class | | A | | B | | C | | R* | | Z | |
| Inception | | 04/10/00 | | 04/10/00 | | 04/10/00 | | 01/23/06 | | 04/10/00 | |
| Sales charge | | without | | with | | without | | with | | without | | with | | without | | without | |
| 1-year | | | –6.82 | | | | –12.19 | | | | –7.55 | | | | –12.17 | | | | –7.55 | | | | –8.47 | | | | –7.02 | | | | –6.67 | | |
| 5-year | | | –0.86 | | | | –2.03 | | | | –1.61 | | | | –1.99 | | | | –1.61 | | | | –1.61 | | | | –1.11 | | | | –0.63 | | |
| 10-year | | | 7.52 | | | | 6.89 | | | | 6.71 | | | | 6.71 | | | | 6.71 | | | | 6.71 | | | | 7.25 | | | | 7.77 | | |
The "with sales charge" returns include the maximum initial sales charge of 5.75% for Class A shares and the applicable contingent deferred sales charge of 5.00% in the first year, declining to 1.00% in the sixth year and eliminated thereafter for Class B shares and 1.00% for Class C shares for the first year only. The "without sales charge" returns do not include the effect of sales charges. If they had, returns would be lower.
Performance results reflect any fee waivers or reimbursements of fund expenses by the Columbia Management Investment Advisers, LLC and/or any of its affiliates. Absent these fee waivers or expense reimbursement arrangements, performance results would have been lower.
All results shown assume reinvestment of distributions. Class R shares are sold at net asset value with a distribution (12b-1) fee. Class Z shares are sold at net asset value with no distribution and service (12b-1) fees. Class R and Class Z shares have limited eligibility and the investment minimum requirements may vary. Please see the fund's prospectuses for details. Performance for different share classes will vary based on differences in sales charges and fees associated with each class.
The tables do not reflect the deduction of taxes that a shareholder may pay on fund distributions or on the redemption of fund shares.
*The returns shown for periods prior to the share class inception date (including returns since inception, which are since fund inception) include the returns of the fund's Class A shares, the fund's oldest share class. These returns are adjusted to reflect any higher class-related operating expenses of the newer share classes, as applicable. Please visit columbiamanagement.com/mutual-funds/appended-performance for more information.
2
Understanding Your Expenses – Columbia Marsico 21st Century Fund
As an investor, you incur two types of costs. There are transaction costs, which generally include sales charges on purchases and may include redemption fees. There are also ongoing costs, which generally include management fees, distribution and service (Rule 12b-1) fees, and other fund expenses. The following information is intended to help you understand your ongoing costs (in dollars) of investing in the Fund and to help you compare these costs with the ongoing costs of investing in other mutual funds.
Analyzing your fund's expenses
To illustrate these ongoing costs, we have provided examples and calculated the expenses paid by investors in each share class of the Fund during the period. The actual and hypothetical information in the table is based on an initial investment of $1,000 at the beginning of the period indicated and held for the entire period. Expense information is calculated two ways and each method provides you with different information. The amount listed in the "Actual" column is calculated using the Fund's actual operating expenses and total return for the period. You may use the Actual information, together with the amount invested, to estimate the expenses that you paid over the period. Simply divide your account value by $1,000 (for example, an $8,600 account value divided by $1,000 = 8.6), then multiply the results by the expenses paid during the period under the Actual column. The amount listed in the "Hypothetical" column assumes a 5% annual rate of return before expenses (which is not the Fund's actual return) and then applies the Fund's actual expense ratio for the period to the hypothetical return. You should not use the hypothetical account values and expenses to estimate either your actual account balance at the end of the period or the expenses you paid during the period. See "Compare with other funds" below for details on how to use the hypothetical data.
Compare with other funds
Since all mutual funds are required to include the same hypothetical calculations about expenses in shareholder reports, you can use this information to compare the ongoing cost of investing in the Fund with other funds. To do so, compare the hypothetical example with the 5% hypothetical examples that appear in the shareholder reports of other funds. As you compare hypothetical examples of other funds, it is important to note that hypothetical examples are meant to highlight the ongoing costs of investing in a fund only and do not reflect any transaction costs, such as sales charges, or redemption or exchange fees. Therefore, the hypothetical calculations are useful in comparing ongoing costs only, and will not help you determine the relative total costs of owning different funds. If transaction costs were included in these calculations, your costs would be higher.
September 1, 2011 - February 29, 2012
| | | Account value at the
beginning of the period ($) | | Account value at the
end of the period ($) | | Expenses paid
during the period ($) | | Fund's annualized
expense ratio (%) | |
| | | Actual | | Hypothetical | | Actual | | Hypothetical | | Actual | | Hypothetical | | Actual | |
| Class A | | | 1,000.00 | | | | 1,000.00 | | | | 1,100.50 | | | | 1,017.80 | | | | 7.42 | | | | 7.12 | | | | 1.42 | % | |
| Class B | | | 1,000.00 | | | | 1,000.00 | | | | 1,096.70 | | | | 1,014.12 | | | | 11.26 | | | | 10.82 | | | | 2.16 | % | |
| Class C | | | 1,000.00 | | | | 1,000.00 | | | | 1,096.70 | | | | 1,014.12 | | | | 11.26 | | | | 10.82 | | | | 2.16 | % | |
| Class R | | | 1,000.00 | | | | 1,000.00 | | | | 1,098.80 | | | | 1,016.71 | | | | 8.56 | | | | 8.22 | | | | 1.64 | % | |
| Class Z | | | 1,000.00 | | | | 1,000.00 | | | | 1,100.60 | | | | 1,019.10 | | | | 6.06 | | | | 5.82 | | | | 1.16 | % | |
Expenses paid during the period are equal to the annualized expense ratio for each class as indicated above, multiplied by the average account value over the period and then multiplied by the number of days in the Fund's most recent fiscal half year and divided by 366.
Expenses do not include fees and expenses incurred indirectly by the Fund from the underlying funds in which the Fund may invest (also referred to as "acquired funds"), including affiliated and non-affiliated pooled investments vehicles (including mutual funds and exchange traded funds).
3
Portfolio Manager's Report – Columbia Marsico 21st Century Fund
Performance data quoted represents past performance and current performance may be lower or higher. Past performance is no guarantee of future results. The investment return and principal value will fluctuate so that shares, when redeemed, may be worth more or less than the original cost. Please visit www.columbiamanagement.com for daily and most recent month-end performance updates.
Net asset value per share
as of 02/29/12 ($)
| Class A | | | 13.25 | | |
| Class B | | | 12.25 | | |
| Class C | | | 12.25 | | |
| Class R | | | 13.12 | | |
| Class Z | | | 13.57 | | |
Portfolio breakdown1
as of 02/29/12 (%)
| Consumer Discretionary | | | 26.5 | | |
| Consumer Staples | | | 1.3 | | |
| Energy | | | 10.7 | | |
| Financials | | | 11.6 | | |
| Health Care | | | 8.5 | | |
| Industrials | | | 16.0 | | |
| Information Technology | | | 21.6 | | |
| Materials | | | 3.8 | | |
1Percentages indicated are based upon total investments (excluding Investments of Cash Collateral Received for Securities on Loan). The Fund's portfolio composition is subject to change.
For the 12-month period that ended February 29, 2012, the fund's Class A shares returned –6.82% without sales charge. The fund underperformed its benchmark, the Russell 3000 Index, which returned 4.45%. Exposure to the weak-performing financials sector was a primary detractor from performance. Underweights in health care and consumer staples also hurt results.
In October 2011 the fund's management changed. Cory Gilchrist left the firm to pursue personal and charitable interests and Brandon Geisler, senior research analyst at Marsico Capital Management, became manager of the fund.
U.S. economy picks up momentum
During the first half of the 12-month period, a series of natural disasters in Japan, Europe's debt problems and wrangling in Washington over the federal budget and the national debt dominated world headlines. U.S. economic news was lackluster and job growth was disappointing. However, the pace of growth picked up in the second half of the period and, as fears of a lapse back into recession faded, prospects brightened. Consumer confidence improved even though consumers remain under pressure, with no real increase in disposable income and a continued decline in household net worth. The labor markets added more than a million new jobs from September 2011 through February 2012, and the jobless rate fell to 8.3%. A modest slowdown in manufacturing activity late in the summer of 2011 raised concern that this lynchpin of the recovery was ready to turn downward. However, manufacturing activity stabilized and the manufacturing expansion continued into 2012. Housing continues to be the one nagging weak spot in the economy. Yet, home sales edged modestly higher over the year, and there is hope that a bottom in the housing market is in sight.
Sector weights detracted from results relative to the index
During the period, the fund's sector weights, which are largely a result of the stock selection process, detracted from performance relative to the index. The fund had lower-than-benchmark allocations to health care and consumer staples, which performed well during the period. The fund had a greater stake in financials than the benchmark, and financials were weak performers. Stock selection within financials also hurt results. First Horizon National, First Niagara Financial (1.0% and 1.5% of net assets, respectively) and Wells Fargo materially detracted from performance. Diversified financials firm Jefferies Group was also a poor performer. Jefferies and Wells Fargo were sold from the portfolio. As the largest banks and financial institutions face more stringent regulations, we believe that the outlook and earnings visibility for some have deteriorated, and we reduced the fund's exposure to financials during the period. By contrast, the fund benefited from having more exposure than the index to the consumer discretionary sector, which was a strong performer during the period.
Stock selection generated mixed results
Stock selection in the energy and consumer discretionary sectors detracted from results. In energy, oil and gas exploration and production companies OGX Petróleo e Gás Participações S.A. and Ultra Petroleum each posted significant declines prior to being
4
Portfolio Manager's Report (continued) – Columbia Marsico 21st Century Fund
sold from the fund. Within consumer discretionary, we sold poor performers General Motors, Walt Disney and fashion retailer Rue21.
In health care, Intuitive Surgical (3.0% of net assets), which makes a robotic system for assisting in minimally invasive surgeries, was among the fund's strongest performing individual positions. Consumer electronics giant Apple, aerospace components company Precision Castparts and retailers Ross Stores and Ulta Salon Cosmetics & Fragrance (5.9%, 2.7%, 3.1% and 1.3% of net assets, respectively) were also notable strong performers.
Looking ahead
It has been a challenging year for the fund. We have taken steps to improve performance by adding more balance and breadth to the fund. In addition to significantly reducing the fund's financials exposure, we increased allocations to the energy, industrials, consumer discretionary and information technology sectors.
Source for all statistical data—Columbia Management Investment Advisers, LLC.
Source of all stock-specific commentary—Marsico Capital Management, LLC.
Portfolio characteristics and holdings are subject to change periodically and may not be representative of current characteristics and holdings. The outlook for this fund may differ from those presented for other Columbia Funds.
Equity securities are subject to stock market fluctuations that occur in response to economic and business developments.
The fund normally invests in a core portfolio of 35-50 stocks. By maintaining a relatively concentrated portfolio, the fund may be subject to greater risk than a fund that is more fully diversified.
International investing involves special risks, including foreign taxation, currency fluctuations, risks associated with possible differences in financial standards and other risks associated with future political and economic developments.
Top 10 holdings1
as of 02/29/12 (%)
| Apple, Inc. | | | 6.0 | | |
| National Oilwell Varco, Inc. | | | 4.2 | | |
| Occidental Petroleum Corp. | | | 4.0 | | |
Sensata Technologies
Holding NV | | | 3.7 | | |
| Wynn Resorts Ltd. | | | 3.4 | | |
| Ross Stores, Inc. | | | 3.2 | | |
| Intuitive Surgical, Inc. | | | 3.1 | | |
PNC Financial Services
Group, Inc. | | | 3.0 | | |
| Biogen Idec, Inc. | | | 3.0 | | |
| Precision Castparts Corp. | | | 2.8 | | |
1Percentages indicated are based upon total investments (excluding Investments of Cash Collateral Received for Securities on Loan).
For further detail about these holdings, please refer to the section entitled "Portfolio of Investments."
Fund holdings are as of the date given, are subject to change at any time, and are not recommendations to buy or sell any security.
5
Portfolio of Investments – Columbia Marsico 21st Century Fund
February 29, 2012
(Percentages represent value of investments compared to net assets)
| Issuer | | Shares | | Value | |
| Common Stocks 97.4% | |
| CONSUMER DISCRETIONARY 25.9% | |
| Auto Components 1.1% | |
| BorgWarner, Inc.(a)(b) | | | 229,648 | | | $ | 19,024,040 | | |
| Automobiles 0.9% | |
| Tesla Motors, Inc.(a)(b) | | | 444,964 | | | | 14,866,247 | | |
| Hotels, Restaurants & Leisure 8.4% | |
| Arcos Dorados Holdings, Inc., Class A | | | 566,371 | | | | 11,905,118 | | |
| Chipotle Mexican Grill, Inc.(a)(b) | | | 45,578 | | | | 17,785,447 | | |
| Vail Resorts, Inc.(a) | | | 398,321 | | | | 16,769,314 | | |
| Wynn Resorts Ltd. | | | 482,136 | | | | 57,152,402 | | |
| Yum! Brands, Inc. | | | 602,466 | | | | 39,907,348 | | |
| Total | | | 143,519,629 | | |
| Internet & Catalog Retail 3.6% | |
| Amazon.com, Inc.(a)(b) | | | 96,837 | | | | 17,400,641 | | |
| priceline.com, Inc.(b) | | | 70,603 | | | | 44,269,493 | | |
| Total | | | 61,670,134 | | |
| Media 0.9% | |
| Viacom, Inc., Class B | | | 337,915 | | | | 16,091,512 | | |
| Multiline Retail 1.6% | |
| Dollar Tree, Inc.(b) | | | 298,105 | | | | 26,385,274 | | |
| Specialty Retail 7.1% | |
| CarMax, Inc.(a)(b) | | | 848,982 | | | | 26,055,258 | | |
| O'Reilly Automotive, Inc.(b) | | | 224,432 | | | | 19,413,368 | | |
| Ross Stores, Inc. | | | 993,351 | | | | 52,975,409 | | |
| Ulta Salon Cosmetics & Fragrance, Inc.(a)(b) | | | 276,419 | | | | 23,009,117 | | |
| Total | | | 121,453,152 | | |
| Textiles, Apparel & Luxury Goods 2.3% | |
| Ralph Lauren Corp. | | | 220,717 | | | | 38,345,164 | | |
| TOTAL CONSUMER DISCRETIONARY | | | 441,355,152 | | |
| CONSUMER STAPLES 1.2% | |
| Beverages 1.2% | |
| Monster Beverage Corp.(b) | | | 363,992 | | | | 20,816,702 | | |
| TOTAL CONSUMER STAPLES | | | 20,816,702 | | |
| ENERGY 10.4% | |
| Energy Equipment & Services 6.5% | |
| Halliburton Co. | | | 1,125,731 | | | | 41,190,497 | | |
| National Oilwell Varco, Inc. | | | 854,505 | | | | 70,522,298 | | |
| Total | | | 111,712,795 | | |
| Oil, Gas & Consumable Fuels 3.9% | |
| Occidental Petroleum Corp. | | | 639,948 | | | | 66,791,372 | | |
| TOTAL ENERGY | | | 178,504,167 | | |
| FINANCIALS 11.3% | |
| Commercial Banks 8.7% | |
| City National Corp.(a) | | | 793,137 | | | | 37,277,439 | | |
| Columbia Banking System, Inc.(a) | | | 812,547 | | | | 17,185,369 | | |
| First Horizon National Corp.(a) | | | 1,864,595 | | | | 17,527,193 | | |
| First Niagara Financial Group, Inc.(a)(d) | | | 2,630,823 | | | | 25,150,668 | | |
| PNC Financial Services Group, Inc. | | | 849,885 | | | | 50,585,155 | | |
| Total | | | 147,725,824 | | |
| Consumer Finance 1.5% | |
| Capital One Financial Corp. | | | 515,300 | | | | 26,074,180 | | |
| Issuer | | Shares | | Value | |
| Common Stocks (continued) | |
| FINANCIALS (cont.) | |
| Real Estate Management & Development 1.1% | |
| Jones Lang LaSalle, Inc.(a) | | | 228,417 | | | $ | 18,595,428 | | |
| TOTAL FINANCIALS | | | 192,395,432 | | |
| HEALTH CARE 8.3% | |
| Biotechnology 2.9% | |
| Biogen Idec, Inc.(b) | | | 429,122 | | | | 49,979,839 | | |
| Health Care Equipment & Supplies 3.9% | |
| Intuitive Surgical, Inc.(a)(b) | | | 100,499 | | | | 51,417,299 | | |
| Varian Medical Systems, Inc.(a)(b) | | | 221,757 | | | | 14,469,644 | | |
| Total | | | 65,886,943 | | |
| Pharmaceuticals 1.5% | |
| Abbott Laboratories(a) | | | 449,680 | | | | 25,456,385 | | |
| TOTAL HEALTH CARE | | | 141,323,167 | | |
| INDUSTRIALS 15.6% | |
| Aerospace & Defense 3.5% | |
| Precision Castparts Corp.(a) | | | 279,243 | | | | 46,753,656 | | |
| TransDigm Group, Inc.(b) | | | 109,941 | | | | 13,059,891 | | |
| Total | | | 59,813,547 | | |
| Air Freight & Logistics 1.0% | |
| Expeditors International of Washington, Inc. | | | 399,183 | | | | 17,416,354 | | |
| Electrical Equipment 4.1% | |
| Roper Industries, Inc.(a) | | | 94,012 | | | | 8,603,978 | | |
| Sensata Technologies Holding NV(a)(b) | | | 1,872,804 | | | | 60,678,850 | | |
| Total | | | 69,282,828 | | |
| Machinery 2.0% | |
| Cummins, Inc.(a) | | | 182,979 | | | | 22,061,778 | | |
| Stanley Black & Decker, Inc. | | | 144,173 | | | | 11,072,487 | | |
| Total | | | 33,134,265 | | |
| Professional Services 1.2% | |
| Nielsen Holdings NV(b) | | | 700,633 | | | | 20,661,667 | | |
| Road & Rail 2.7% | |
| CSX Corp.(a) | | | 2,198,966 | | | | 46,200,276 | | |
| Trading Companies & Distributors 0.6% | |
| WW Grainger, Inc.(a) | | | 52,292 | | | | 10,862,617 | | |
| Transportation Infrastructure 0.5% | |
| Wesco Aircraft Holdings, Inc.(b) | | | 602,623 | | | | 8,864,584 | | |
| TOTAL INDUSTRIALS | | | 266,236,138 | | |
| INFORMATION TECHNOLOGY 21.0% | |
| Computers & Peripherals 6.0% | |
| Apple, Inc.(b) | | | 184,628 | | | | 100,149,613 | | |
| Fusion-io, Inc.(a)(b) | | | 94,720 | | | | 2,585,856 | | |
| Total | | | 102,735,469 | | |
| Internet Software & Services 3.6% | |
| Bankrate, Inc.(a)(b) | | | 1,206,250 | | | | 28,757,000 | | |
| Google, Inc., Class A(b) | | | 46,478 | | | | 28,735,024 | | |
| LinkedIn Corp., Class A(a)(b) | | | 48,000 | | | | 4,169,760 | | |
| Total | | | 61,661,784 | | |
| IT Services 4.0% | |
| Accenture PLC, Class A | | | 747,176 | | | | 44,486,859 | | |
| Mastercard, Inc., Class A | | | 55,608 | | | | 23,355,360 | | |
| Total | | | 67,842,219 | | |
The Accompanying Notes to Financial Statements are an integral part of this statement.
6
Columbia Marsico 21st Century Fund
February 29, 2012
(Percentages represent value of investments compared to net assets)
| Issuer | | Shares | | Value | |
| Common Stocks (continued) | |
| INFORMATION TECHNOLOGY (cont.) | |
| Semiconductors & Semiconductor Equipment 0.7% | |
| ARM Holdings PLC | | | 1,278,655 | | | $ | 11,584,839 | | |
| Software 6.7% | |
| ANSYS, Inc.(a)(b) | | | 632,711 | | | | 39,974,681 | | |
| Check Point Software Technologies Ltd.(a)(b) | | | 291,203 | | | | 16,936,366 | | |
| Informatica Corp.(a)(b) | | | 225,672 | | | | 11,094,036 | | |
| Red Hat, Inc.(b) | | | 526,333 | | | | 26,032,430 | | |
| VMware, Inc., Class A(b) | | | 216,306 | | | | 21,390,500 | | |
| Total | | | 115,428,013 | | |
| TOTAL INFORMATION TECHNOLOGY | | | 359,252,324 | | |
| MATERIALS 3.7% | |
| Chemicals 3.7% | |
| LyondellBasell Industries NV, Class A | | | 616,548 | | | | 26,622,543 | | |
| Monsanto Co. | | | 463,648 | | | | 35,877,082 | | |
| Total | | | 62,499,625 | | |
| TOTAL MATERIALS | | | 62,499,625 | | |
Total Common Stocks
(Cost: $1,273,026,968) | | $ | 1,662,382,707 | | |
| Issuer | | Effective
Yield | | Par/
Principal/
Shares | | Value | |
Investments of Cash Collateral Received for Securities
on Loan 16.7% | |
| Asset-Backed Commercial Paper 0.4% | |
Atlantis One
04/11/12 | | | 0.511 | % | | $ | 1,997,422 | | | $ | 1,997,422 | | |
KELLS FUNDING, LLC
07/02/12 | | | 0.601 | % | | | 4,989,250 | | | | 4,989,250 | | |
| Total | | | 6,986,672 | | |
| Certificates of Deposit 8.4% | |
ABM AMRO Bank N.V.
03/21/12 | | | 0.310 | % | | | 4,998,752 | | | | 4,998,752 | | |
Bank of Nova Scotia
07/26/12 | | | 0.324 | % | | | 10,000,000 | | | | 10,000,000 | | |
Barclays Bank PLC
04/18/12 | | | 0.600 | % | | | 11,000,000 | | | | 11,000,000 | | |
Branch Banking & Trust Corporation
07/12/12 | | | 0.420 | % | | | 10,000,000 | | | | 10,000,000 | | |
Canadian Imperial Bank
03/21/12 | | | 0.291 | % | | | 8,000,800 | | | | 8,000,800 | | |
Credit Suisse
03/20/12 | | | 0.590 | % | | | 10,000,000 | | | | 10,000,000 | | |
DZ Bank AG
03/12/12 | | | 0.250 | % | | | 10,000,000 | | | | 10,000,000 | | |
DnB NOR ASA
03/15/12 | | | 0.520 | % | | | 5,000,000 | | | | 5,000,000 | | |
Mitsubishi UFJ Trust and Banking Corp.
05/31/12 | | | 0.390 | % | | | 7,000,089 | | | | 7,000,089 | | |
National Australia Bank
04/30/12 | | | 0.394 | % | | | 5,000,000 | | | | 5,000,000 | | |
| Issuer | | Effective
Yield | | Par/
Principal/
Shares | | Value | |
Investments of Cash Collateral Received for Securities
on Loan (continued) | |
| Certificates of Deposit (cont.) | |
National Bank of Canada
05/08/12 | | | 0.410 | % | | $ | 9,000,000 | | | $ | 9,000,000 | | |
Nordea Bank AB
03/13/12 | | | 0.520 | % | | | 5,000,000 | | | | 5,000,000 | | |
Norinchukin Bank
05/21/12 | | | 0.470 | % | | | 6,000,000 | | | | 6,000,000 | | |
Rabobank
03/16/12 | | | 0.530 | % | | | 9,986,621 | | | | 9,986,621 | | |
| 04/23/12 | | | 0.500 | % | | | 2,000,000 | | | | 2,000,000 | | |
Standard Chartered Bank PLC
03/30/12 | | | 0.625 | % | | | 9,984,226 | | | | 9,984,226 | | |
| 04/03/12 | | | 0.570 | % | | | 7,500,000 | | | | 7,500,000 | | |
Svenska Handelsbanken
03/01/12 | | | 0.460 | % | | | 3,000,000 | | | | 3,000,000 | | |
Union Bank of Switzerland
03/02/12 | | | 0.530 | % | | | 5,000,000 | | | | 5,000,000 | | |
United Overseas Bank Ltd.
03/16/12 | | | 0.250 | % | | | 4,000,000 | | | | 4,000,000 | | |
| Total | | | 142,470,488 | | |
| Commercial Paper 5.1% | |
Australia and New Zealand Bank Group, Ltd.
04/25/12 | | | 0.461 | % | | | 9,976,617 | | | | 9,976,617 | | |
DnB NOR
04/10/12 | | | 0.521 | % | | | 9,986,278 | | | | 9,986,278 | | |
ERSTE ABWICKLUNGSANSTALT
03/06/12 | | | 0.550 | % | | | 4,995,875 | | | | 4,995,875 | | |
| 04/23/12 | | | 0.671 | % | | | 1,996,613 | | | | 1,996,613 | | |
Foreningsparbanken (Swedbank)
03/19/12 | | | 0.440 | % | | | 9,992,789 | | | | 9,992,789 | | |
| 03/21/12 | | | 0.425 | % | | | 4,996,813 | | | | 4,996,813 | | |
HSBC Bank PLC
04/13/12 | | | 0.481 | % | | | 11,970,720 | | | | 11,970,720 | | |
Skandinaviska Enskilda Banken AB
05/03/12 | | | 0.350 | % | | | 4,996,840 | | | | 4,996,840 | | |
Suncorp Metway Ltd.
04/10/12 | | | 0.480 | % | | | 4,995,933 | | | | 4,995,933 | | |
Svenska Handelsbank
03/29/12 | | | 0.506 | % | | | 4,993,617 | | | | 4,993,617 | | |
Toyota Motor Credit Corp.
04/26/12 | | | 0.562 | % | | | 6,979,964 | | | | 6,979,964 | | |
Westpac Securities NZ Ltd.
04/20/12 | | | 0.531 | % | | | 11,967,670 | | | | 11,967,670 | | |
| Total | | | 87,849,729 | | |
| Repurchase Agreements 2.8% | |
Credit Suisse Securities (USA) LLC
dated 02/29/12, matures 03/01/12,
repurchase price $12,416,143(c)
| | | 0.160 | % | | | 12,416,088 | | | | 12,416,088 | | |
Morgan Stanley
dated 02/29/12, matures 03/01/12,
repurchase price $5,000,025(c)
| | | 0.180 | % | | | 5,000,000 | | | | 5,000,000 | | |
RBS Securities, Inc.
dated 02/29/12, matures 03/01/12,
repurchase price $10,000,056(c)
| | | 0.200 | % | | | 10,000,000 | | | | 10,000,000 | | |
The Accompanying Notes to Financial Statements are an integral part of this statement.
7
Columbia Marsico 21st Century Fund
February 29, 2012
(Percentages represent value of investments compared to net assets)
| Issuer | | Effective
Yield | | Par/
Principal/
Shares | | Value | |
Investments of Cash Collateral Received for Securities
on Loan (continued) | |
| Repurchase Agreements (cont.) | |
Societe Generale
dated 02/29/12, matures 03/01/12,
repurchase price $20,000,111(c)
| | | 0.200 | % | | $ | 20,000,000 | | | $ | 20,000,000 | | |
| Total | | | 47,416,088 | | |
Total Investments of Cash Collateral Received for Securities
on Loan
(Cost: $284,722,977) | | $ | 284,722,977 | | |
Total Investments
(Cost: $1,557,749,945) | | | | | | $ | 1,947,105,684 | (d) | |
| Other Assets & Liabilities, Net | | | | | | | (240,499,149 | ) | |
| Net Assets | | $ | 1,706,606,535 | | |
| Investments in Derivatives | |
Forward Foreign Currency Exchange Contracts Open at February 29, 2012
| Counterparty | | Exchange Date | | Currency to be
Delivered | | Currency to be
Received | | Unrealized
Appreciation | | Unrealized
Depreciation | |
| Morgan Stanley | | March 2, 2012
| | | 220,838
(GBP) | | | | 350,731
(USD) | | | $ | —
| | | $ | (599
| ) | |
| JPMorgan | | March 5, 2012
| | | 219,067
(GBP) | | | | 348,989
(USD) | | | | 475
| | | | —
| | |
| Total | | | | | | | | $ | 475 | | | $ | (599 | ) | |
| Notes to Portfolio of Investments | |
(a) At February 29, 2012, security was partially or fully on loan.
(b) Non-income producing.
(c) The table below represents securities received as collateral for repurchase agreements. This collateral is deposited with the Fund's custodian and, pursuant to the terms of the repurchase agreement, must have an aggregate market value greater than or equal to the repurchase price plus accrued interest at all times. The value of securities and/or cash held as collateral for repurchase agreements is monitored on a daily basis to ensure the proper level of collateral.
Credit Suisse Securities (USA) LLC (0.160%)
| Security Description | | Value | |
| Ginnie Mae I Pool | | $ | 8,888,713 | | |
| Ginnie Mae II Pool | | | 3,775,726 | | |
| Total Market Value of Collateral Securities | | $ | 12,664,439 | | |
Morgan Stanley (0.180%)
| Security Description | | Value | |
| Freddie Mac Gold Pool | | $ | 2,725,246 | | |
| Freddie Mac Non Gold Pool | | | 2,374,754 | | |
| Total Market Value of Collateral Securities | | $ | 5,100,000 | | |
The Accompanying Notes to Financial Statements are an integral part of this statement.
8
Columbia Marsico 21st Century Fund
February 29, 2012
| Notes to Portfolio of Investments (continued) | |
RBS Securities, Inc. (0.200%)
| Security Description | | Value | |
| United States Treasury Note/Bond | | $ | 10,200,038 | | |
| Total Market Value of Collateral Securities | | $ | 10,200,038 | | |
Societe Generale (0.200%)
| Security Description | | Value | |
| Fannie Mae REMICS | | $ | 3,122,521 | | |
| Freddie Mac REMICS | | | 5,320,026 | | |
| Freddie Mac Strips | | | 540,250 | | |
| Government National Mortgage Association | | | 11,417,203 | | |
| Total Market Value of Collateral Securities | | $ | 20,400,000 | | |
(d) Affiliated investment. Investments are considered an affiliate of the Fund if the Fund owns more than 5% of the outstanding voting affiliated shares of the company or is under common control of another company. Investments in affiliates during the year ended February 29, 2012 were:
| Issuer | | Beginning
Cost | | Purchase
Cost | | Sales Cost/
Proceeds
from Sales | | Realized
Gain/Loss | | Ending
Cost | | Dividends
or Interest
Income | | Value | |
Columbia Short-Term
Cash Fund | | $ | — | | | $ | 1,138,593,919 | | | $ | (1,138,593,919 | ) | | $ | — | | | $ | — | | | $ | 68,593 | | | $ | — | | |
First Niagara Financial
Group, Inc. | | | 138,886,045 | | | | 4,598,144 | | | | (80,095,059 | ) | | | (32,478,410 | ) | | | 30,910,720 | | | | 2,741,224 | | | | 25,150,668 | * | |
| Park Sterling Corp. | | | 12,142,195 | | | | — | | | | (7,024,996 | ) | | | (5,117,199 | ) | | | — | | | | — | | | | — | | |
| Total | | $ | 151,028,240 | | | $ | 1,143,192,063 | | | $ | (1,225,713,974 | ) | | $ | (37,595,609 | ) | | $ | 30,910,720 | | | $ | 2,809,817 | | | $ | 25,150,668 | | |
* At February 29, 2012, the Fund owns less than five percent of the company's outstanding voting shares.
GBP British Pound Sterling
USD US Dollar
Generally accepted accounting principles (GAAP) require disclosure regarding the inputs and valuation techniques used to measure fair value and any changes in valuation inputs or techniques. In addition, investments shall be disclosed by major category.
The Fund categorizes its fair value measurements according to a three-level hierarchy that maximizes the use of observable inputs and minimizes the use of unobservable inputs by prioritizing that the most observable input be used when available. Observable inputs are those that market participants would use in pricing an investment based on market data obtained from sources independent of the reporting entity. Unobservable inputs are those that reflect the Fund's assumptions about the information market participants would use in pricing an investment. An investment's level within the fair value hierarchy is based on the lowest level of any input that is deemed significant to the asset or liability's fair value measurement. The input levels are not necessarily an indication of the risk or liquidity associated with investments at that level. For example, certain U.S. government securities are generally high quality and liquid, however, they are reflected as Level 2 because the inputs used to determine fair value may not always be quoted prices in an active market.
Fair value inputs are summarized in the three broad levels listed below:
• Level 1 — Valuations based on quoted prices for investments in active markets that the Fund has the ability to access at the measurement date (including NAV for open-end mutual funds). Valuation adjustments are not applied to Level 1 investments.
• Level 2 — Valuations based on other significant observable inputs (including quoted prices for similar securities, interest rates, prepayment speeds, credit risks, etc.).
• Level 3 — Valuations based on significant unobservable inputs (including the Fund's own assumptions and judgment in determining the fair value of investments).
The Accompanying Notes to Financial Statements are an integral part of this statement.
9
Columbia Marsico 21st Century Fund
February 29, 2012
| Fair Value Measurements (continued) | |
Inputs that are used in determining fair value of an investment may include price information, credit data, volatility statistics, and other factors. These inputs can be either observable or unobservable. The availability of observable inputs can vary between investments, and is affected by various factors such as the type of investment, and the volume and level of activity for that investment or similar investments in the marketplace. The inputs will be considered by the Investment Manager, along with any other relevant factors in the calculation of an investment's fair value. The Fund uses prices and inputs that are current as of the measurement date, which may include periods of market dislocations. During these periods, the availability of prices and inputs may be reduced for many investments. This condition could cause an investment to be reclassified between the various levels within the hierarchy.
Foreign equity securities actively traded in markets where there is a significant delay in the local close relative to the New York Stock Exchange (NYSE) are classified as Level 2. The values of these securities may include an adjustment to reflect the impact of significant market movements following the close of local trading, as described in Note 2 to the financial statements — Security Valuation.
Investments falling into the Level 3 category are primarily supported by quoted prices from brokers and dealers participating in the market for those investments. However, these may be classified as Level 3 investments due to lack of market transparency and corroboration to support these quoted prices. Additionally, valuation models may be used as the pricing source for any remaining investments classified as Level 3. These models rely on one or more significant unobservable inputs and/or significant assumptions by the Investment Manager. Inputs used in valuations may include, but are not limited to, financial statement analysis, capital account balances, discount rates and estimated cash flows, and comparable company data.
The following table is a summary of the inputs used to value the Fund's investments as of February 29, 2012:
| | | Fair Value at February 29, 2012 | |
| Description(a) | | Level 1
Quoted Prices
in Active
Markets for
Identical Assets | | Level 2
Other
Significant
Observable
Inputs(b) | | Level 3
Significant
Unobservable
Inputs | | Total | |
| Equity Securities | |
| Common Stocks | |
| Consumer Discretionary | | $ | 441,355,152 | | | $ | — | | | $ | — | | | $ | 441,355,152 | | |
| Consumer Staples | | | 20,816,702 | | | | — | | | | — | | | | 20,816,702 | | |
| Energy | | | 178,504,167 | | | | — | | | | — | | | | 178,504,167 | | |
| Financials | | | 192,395,432 | | | | — | | | | — | | | | 192,395,432 | | |
| Health Care | | | 141,323,167 | | | | — | | | | — | | | | 141,323,167 | | |
| Industrials | | | 266,236,138 | | | | — | | | | — | | | | 266,236,138 | | |
| Information Technology | | | 347,667,485 | | | | 11,584,839 | | | | — | | | | 359,252,324 | | |
| Materials | | | 62,499,625 | | | | — | | | | — | | | | 62,499,625 | | |
| Total Equity Securities | | | 1,650,797,868 | | | | 11,584,839 | | | | — | | | | 1,662,382,707 | | |
| Other | |
| Investments of Cash Collateral Received for Securities on Loan | | | — | | | | 284,722,977 | | | | — | | | | 284,722,977 | | |
| Total Other | | | — | | | | 284,722,977 | | | | — | | | | 284,722,977 | | |
| Investments in Securities | | | 1,650,797,868 | | | | 296,307,816 | | | | — | | | | 1,947,105,684 | | |
| Derivatives(c) | |
| Assets | |
| Forward Foreign Currency Exchange Contracts | | | — | | | | 475 | | | | — | | | | 475 | | |
| Liabilities | |
| Forward Foreign Currency Exchange Contracts | | | — | | | | (599 | ) | | | — | | | | (599 | ) | |
| Total | | $ | 1,650,797,868 | | | $ | 296,307,692 | | | $ | — | | | $ | 1,947,105,560 | | |
The Fund's assets assigned to the Level 2 input category are generally valued using the market approach, in which a security's value is determined through reference to prices and information from market transactions for similar or identical assets. These assets include certain foreign securities for which a third party statistical pricing service may be employed for purposes of fair market valuation. The models utilized by the third party statistical pricing service take into account a security's correlation to available market data including, but not limited to, intraday index, ADR, and ETF movements.
(a) See the Portfolio of Investments for all investment classifications not indicated in the table.
(b) There were no significant transfers between Levels 1 and 2 during the period.
(c) Derivative instruments are valued at unrealized appreciation (depreciation).
The Accompanying Notes to Financial Statements are an integral part of this statement.
10
Statement of Assets and Liabilities – Columbia Marsico 21st Century Fund
February 29, 2012
| Assets | |
| Investments, at value* | |
| Unaffiliated issuers (identified cost $1,273,026,968) | | $ | 1,662,382,707 | | |
| Investment of cash collateral received for securities on loan | |
| Short-term securities (identified cost $237,306,889) | | | 237,306,889 | | |
| Repurchase agreements (identified cost $47,416,088) | | | 47,416,088 | | |
| Total investments (identified cost $1,557,749,945) | | | 1,947,105,684 | | |
| Cash | | | 88,196 | | |
| Unrealized appreciation on forward foreign currency exchange contracts | | | 475 | | |
| Receivable for: | |
| Investments sold | | | 117,124,038 | | |
| Capital shares sold | | | 913,729 | | |
| Dividends | | | 798,730 | | |
| Interest | | | 175,193 | | |
| Reclaims | | | 18,272 | | |
| Prepaid expense | | | 19,578 | | |
| Total assets | | | 2,066,243,895 | | |
| Liabilities | |
| Due upon return of securities on loan | | | 284,722,977 | | |
| Unrealized depreciation on forward foreign currency exchange contracts | | | 599 | | |
| Payable for: | |
| Investments purchased | | | 11,027,274 | | |
| Capital shares purchased | | | 7,867,746 | | |
| Line of credit agreement | | | 55,000,000 | | |
| Line of credit interest expense | | | 5,803 | | |
| Investment management fees | | | 33,116 | | |
| Distribution and service fees | | | 17,465 | | |
| Transfer agent fees | | | 638,149 | | |
| Administration fees | | | 10,640 | | |
| Other expenses | | | 313,591 | | |
| Total liabilities | | | 359,637,360 | | |
| Net assets applicable to outstanding capital stock | | $ | 1,706,606,535 | | |
The Accompanying Notes to Financial Statements are an integral part of this statement.
11
Statement of Assets and Liabilities (continued) – Columbia Marsico 21st Century Fund
February 29, 2012
| Represented by | |
| Paid-in capital | | $ | 3,448,615,203 | | |
| Excess of distributions over net investment income | | | (1,213,625 | ) | |
| Accumulated net realized loss | | | (2,130,147,570 | ) | |
| Unrealized appreciation (depreciation) on: | |
| Investments | | | 389,355,739 | | |
| Foreign currency translations | | | (3,088 | ) | |
| Forward foreign currency exchange contracts | | | (124 | ) | |
| Total — representing net assets applicable to outstanding capital stock | | $ | 1,706,606,535 | | |
| *Value of securities on loan | | $ | 276,279,733 | | |
| Net assets applicable to outstanding shares | |
| Class A | | $ | 811,889,547 | | |
| Class B | | $ | 72,692,292 | | |
| Class C | | $ | 342,020,648 | | |
| Class R | | $ | 30,137,469 | | |
| Class Z | | $ | 449,866,579 | | |
| Shares outstanding | |
| Class A | | | 61,276,902 | | |
| Class B | | | 5,935,076 | | |
| Class C | | | 27,930,131 | | |
| Class R | | | 2,297,817 | | |
| Class Z | | | 33,140,791 | | |
| Net asset value per share | |
| Class A(a) | | $ | 13.25 | | |
| Class B | | $ | 12.25 | | |
| Class C | | $ | 12.25 | | |
| Class R | | $ | 13.12 | | |
| Class Z | | $ | 13.57 | | |
(a) The maximum offering price per share for Class A is $14.06. The offering price is calculated by dividing the net asset value by 1.0 minus the maximum sales charge of 5.75%.
The Accompanying Notes to Financial Statements are an integral part of this statement.
12
Statement of Operations – Columbia Marsico 21st Century Fund
Year ended February 29, 2012
| Net investment income | |
| Income: | |
| Dividends | | $ | 26,712,452 | | |
| Interest | | | 19,282 | | |
| Dividends from affiliates | | | 2,809,817 | | |
| Income from securities lending — net | | | 1,843,274 | | |
| Total income | | | 31,384,825 | | |
| Expenses: | |
| Investment management fees | | | 17,887,734 | | |
| Distribution fees | |
| Class B | | | 641,226 | | |
| Class C | | | 3,349,901 | | |
| Class R | | | 166,493 | | |
| Service fees | |
| Class B | | | 213,741 | | |
| Class C | | | 1,116,633 | | |
| Distribution and service fees — Class A | | | 2,984,467 | | |
| Transfer agent fees | |
| Class A | | | 2,451,995 | | |
| Class B | | | 170,983 | | |
| Class C | | | 902,860 | | |
| Class R | | | 65,721 | | |
| Class Z | | | 2,019,435 | | |
| Administration fees | | | 5,963,877 | | |
| Compensation of board members | | | 61,452 | | |
| Pricing and bookkeeping fees | | | 59,721 | | |
| Custodian fees | | | 132,210 | | |
| Printing and postage fees | | | 547,741 | | |
| Registration fees | | | 148,025 | | |
| Professional fees | | | 71,959 | | |
| Line of credit interest expense | | | 5,803 | | |
| Chief compliance officer expenses | | | 385 | | |
| Other | | | 114,620 | | |
| Total expenses | | | 39,076,982 | | |
| Expense reductions | | | (3,306 | ) | |
| Total net expenses | | | 39,073,676 | | |
| Net investment loss | | | (7,688,851 | ) | |
| Realized and unrealized gain (loss) — net | |
| Net realized gain (loss) on: | |
| Investments — unaffiliated issuers | | | 206,612,220 | | |
| Investments — affiliated issuers | | | (37,595,609 | ) | |
| Foreign currency translations | | | (1,796,213 | ) | |
| Forward foreign currency exchange contracts | | | (381,717 | ) | |
| Net realized gain | | | 166,838,681 | | |
| Net change in unrealized appreciation (depreciation) on: | |
| Investments | | | (507,820,873 | ) | |
| Foreign currency translations | | | 3,230 | | |
| Forward foreign currency exchange contracts | | | (124 | ) | |
| Net change in unrealized depreciation | | | (507,817,767 | ) | |
| Net realized and unrealized loss | | | (340,979,086 | ) | |
| Net decrease in net assets from operations | | $ | (348,667,937 | ) | |
The Accompanying Notes to Financial Statements are an integral part of this statement.
13
Statement of Changes in Net Assets – Columbia Marsico 21st Century Fund
| | | Year ended
February 29,
2012 | | Year ended
February 28,
2011 | |
| Operations | |
| Net investment loss | | $ | (7,688,851 | ) | | $ | (19,485,393 | ) | |
| Net realized gain | | | 166,838,681 | | | | 630,957,266 | | |
| Net change in unrealized appreciation (depreciation) | | | (507,817,767 | ) | | | 113,691,781 | | |
| Net increase (decrease) in net assets resulting from operations | | | (348,667,937 | ) | | | 725,163,654 | | |
| Increase (decrease) in net assets from share transactions | | | (1,639,855,848 | ) | | | (851,360,944 | ) | |
| Total decrease in net assets | | | (1,988,523,785 | ) | | | (126,197,290 | ) | |
| Net assets at beginning of year | | | 3,695,130,320 | | | | 3,821,327,610 | | |
| Net assets at end of year | | $ | 1,706,606,535 | | | $ | 3,695,130,320 | | |
| Excess of distributions over net investment income | | $ | (1,213,625 | ) | | $ | (1,779,018 | ) | |
The Accompanying Notes to Financial Statements are an integral part of this statement.
14
Statement of Changes in Net Assets (continued) – Columbia Marsico 21st Century Fund
| | | Year ended February 29,
2012 | | Year ended February 28,
2011 | |
| | | Shares | | Dollars ($) | | Shares | | Dollars ($) | |
| Capital stock activity | |
| Class A shares | |
| Subscriptions(a) | | | 9,300,938 | | | | 118,588,125 | | | | 13,938,171 | | | | 173,735,086 | | |
| Redemptions | | | (68,368,653 | ) | | | (877,841,428 | ) | | | (64,980,007 | ) | | | (805,949,132 | ) | |
| Net decrease | | | (59,067,715 | ) | | | (759,253,303 | ) | | | (51,041,836 | ) | | | (632,214,046 | ) | |
| Class B shares | |
| Subscriptions | | | 30,448 | | | | 364,279 | | | | 80,425 | | | | 948,498 | | |
| Redemptions(a) | | | (2,430,830 | ) | | | (28,976,210 | ) | | | (2,495,480 | ) | | | (28,921,410 | ) | |
| Net decrease | | | (2,400,382 | ) | | | (28,611,931 | ) | | | (2,415,055 | ) | | | (27,972,912 | ) | |
| Class C shares | |
| Subscriptions | | | 969,332 | | | | 11,921,869 | | | | 2,018,356 | | | | 23,544,061 | | |
| Redemptions | | | (17,334,797 | ) | | | (205,030,554 | ) | | | (18,259,296 | ) | | | (211,083,337 | ) | |
| Net decrease | | | (16,365,465 | ) | | | (193,108,685 | ) | | | (16,240,940 | ) | | | (187,539,276 | ) | |
| Class R shares | |
| Subscriptions | | | 589,190 | | | | 7,450,288 | | | | 934,045 | | | | 11,543,977 | | |
| Redemptions | | | (1,158,431 | ) | | | (14,729,624 | ) | | | (1,665,565 | ) | | | (20,572,486 | ) | |
| Net decrease | | | (569,241 | ) | | | (7,279,336 | ) | | | (731,520 | ) | | | (9,028,509 | ) | |
| Class Z shares | |
| Subscriptions | | | 26,656,902 | | | | 364,029,006 | | | | 34,981,539 | | | | 442,143,636 | | |
| Redemptions | | | (79,185,174 | ) | | | (1,015,631,599 | ) | | | (34,401,341 | ) | | | (436,749,837 | ) | |
| Net increase (decrease) | | | (52,528,272 | ) | | | (651,602,593 | ) | | | 580,198 | | | | 5,393,799 | | |
| Total net decrease | | | (130,931,075 | ) | | | (1,639,855,848 | ) | | | (69,849,153 | ) | | | (851,360,944 | ) | |
(a) Includes conversions of Class B shares to Class A shares, if any.
The Accompanying Notes to Financial Statements are an integral part of this statement.
15
Financial Highlights – Columbia Marsico 21st Century Fund
The following tables are intended to help you understand the Fund's financial performance. Certain information reflects financial results for a single share of a class held for the periods shown. Per share net investment income (loss) amounts are calculated based on average shares outstanding during the period. Total returns assume reinvestment of all dividends and distributions. Total returns do not reflect payment of sales charges, if any, and are not annualized for periods of less than one year.
| | | Year ended
Feb. 29, | | Year ended Feb. 28, | | Year ended
Feb. 29, | |
| | | 2012 | | 2011 | | 2010 | | 2009 | | 2008 | |
| Class A | |
| Per share data | |
| Net asset value, beginning of period | | $ | 14.22 | | | $ | 11.63 | | | $ | 7.31 | | | $ | 14.55 | | | $ | 14.28 | | |
| Income from investment operations: | |
| Net investment income (loss) | | | (0.03 | ) | | | (0.06 | ) | | | (0.03 | ) | | | 0.01 | | | | 0.02 | | |
| Net realized and unrealized gain (loss) | | | (0.94 | ) | | | 2.65 | | | | 4.35 | | | | (7.25 | ) | | | 0.77 | (a) | |
| Total from investment operations | | | (0.97 | ) | | | 2.59 | | | | 4.32 | | | | (7.24 | ) | | | 0.79 | | |
| Less distributions to shareholders from: | |
| Net realized gains | | | — | | | | — | | | | — | | | | — | | | | (0.49 | ) | |
| Tax return of capital | | | — | | | | — | | | | — | | | | — | | | | (0.03 | ) | |
| Total distributions to shareholders | | | — | | | | — | | | | — | | | | — | | | | (0.52 | ) | |
| Redemption fees: | |
| Redemption fees added to paid-in capital | | | — | | | | — | | | | — | | | | 0.00 | (b) | | | — | | |
| Net asset value, end of period | | $ | 13.25 | | | $ | 14.22 | | | $ | 11.63 | | | $ | 7.31 | | | $ | 14.55 | | |
| Total return | | | (6.82 | %) | | | 22.27 | %(c) | | | 59.10 | % | | | (49.76 | %) | | | 5.16 | % | |
| Ratios to average net assets(d) | |
| Expenses prior to fees waived or expenses reimbursed (including interest expense) | | | 1.37 | %(e) | | | 1.31 | % | | | 1.31 | % | | | 1.29 | % | | | 1.22 | % | |
| Net expenses after fees waived or expenses reimbursed (including interest expense)(f) | | | 1.37 | %(e)(g) | | | 1.31 | %(g) | | | 1.30 | %(g) | | | 1.25 | %(g) | | | 1.20 | %(g) | |
| Expenses prior to fees waived or expenses reimbursed (excluding interest expense) | | | 1.37 | % | | | 1.31 | % | | | 1.31 | % | | | 1.29 | % | | | 1.22 | % | |
| Net expenses after fees waived or expenses reimbursed (excluding interest expense)(f) | | | 1.37 | %(g) | | | 1.31 | %(g) | | | 1.30 | %(g) | | | 1.25 | %(g) | | | 1.20 | %(g) | |
| Net investment income (loss) | | | (0.23 | %)(g) | | | (0.47 | %)(g) | | | (0.35 | %)(g) | | | 0.12 | %(g) | | | 0.15 | %(g) | |
| Supplemental data | |
| Net assets, end of period (in thousands) | | $ | 811,890 | | | $ | 1,711,839 | | | $ | 1,993,000 | | | $ | 1,967,386 | | | $ | 5,062,299 | | |
| Portfolio turnover | | | 104 | % | | | 87 | % | | | 119 | % | | | 152 | % | | | 113 | % | |
Notes to Financial Highlights
(a) The amount shown for a share outstanding does not correspond with the aggregate net loss on investments for the period due to timing of repurchases of Fund shares in relation to fluctuating market values of the investments of the Fund.
(b) Rounds to less than $0.01.
(c) Total return includes a reimbursement of a loss experienced by the Fund due to a compliance violation. This reimbursement increased the total return by less than 0.01%.
(d) In addition to the fees and expenses which the Fund bears directly, the Fund indirectly bears a pro rata share of the fees and expenses of the acquired funds in which it invests. Such indirect expenses are not included in the reported expense ratios.
(e) Includes interest expense which rounds to less than 0.01%.
(f) The Investment Manager and certain of its affiliates agreed to waive/reimburse certain fees and expenses, if applicable.
(g) The benefits derived from expense reductions had an impact of less than 0.01%.
The Accompanying Notes to Financial Statements are an integral part of this statement.
16
Financial Highlights (continued) – Columbia Marsico 21st Century Fund
| | | Year ended
Feb. 29, | | Year ended Feb. 28, | | Year ended
Feb. 29, | |
| | | 2012 | | 2011 | | 2010 | | 2009 | | 2008 | |
| Class B | |
| Per share data | |
| Net asset value, beginning of period | | $ | 13.25 | | | $ | 10.91 | | | $ | 6.92 | | | $ | 13.86 | | | $ | 13.73 | | |
| Income from investment operations: | |
| Net investment loss | | | (0.12 | ) | | | (0.14 | ) | | | (0.10 | ) | | | (0.07 | ) | | | (0.08 | ) | |
| Net realized and unrealized gain (loss) | | | (0.88 | ) | | | 2.48 | | | | 4.09 | | | | (6.87 | ) | | | 0.73 | (a) | |
| Total from investment operations | | | (1.00 | ) | | | 2.34 | | | | 3.99 | | | | (6.94 | ) | | | 0.65 | | |
| Less distributions to shareholders from: | |
| Net realized gains | | | — | | | | — | | | | — | | | | — | | | | (0.49 | ) | |
| Tax return of capital | | | — | | | | — | | | | — | | | | — | | | | (0.03 | ) | |
| Total distributions to shareholders | | | — | | | | — | | | | — | | | | — | | | | (0.52 | ) | |
| Redemption fees: | |
| Redemption fees added to paid-in capital | | | — | | | | — | | | | — | | | | 0.00 | (b) | | | — | | |
| Net asset value, end of period | | $ | 12.25 | | | $ | 13.25 | | | $ | 10.91 | | | $ | 6.92 | | | $ | 13.86 | | |
| Total return | | | (7.55 | %) | | | 21.45 | %(c) | | | 57.66 | % | | | (50.07 | %) | | | 4.34 | % | |
| Ratios to average net assets(d) | |
| Expenses prior to fees waived or expenses reimbursed (including interest expense) | | | 2.12 | %(e) | | | 2.06 | % | | | 2.06 | % | | | 2.04 | % | | | 1.97 | % | |
| Net expenses after fees waived or expenses reimbursed (including interest expense)(f) | | | 2.12 | %(e)(g) | | | 2.06 | %(g) | | | 2.05 | %(g) | | | 2.00 | %(g) | | | 1.95 | %(g) | |
| Expenses prior to fees waived or expenses reimbursed (excluding interest expense) | | | 2.12 | % | | | 2.06 | % | | | 2.06 | % | | | 2.04 | % | | | 1.97 | % | |
| Net expenses after fees waived or expenses reimbursed (excluding interest expense)(f) | | | 2.12 | %(g) | | | 2.06 | %(g) | | | 2.05 | %(g) | | | 2.00 | %(g) | | | 1.95 | %(g) | |
| Net investment loss | | | (0.97 | %)(g) | | | (1.21 | %)(g) | | | (1.10 | %)(g) | | | (0.63 | %)(g) | | | (0.56 | %)(g) | |
| Supplemental data | |
| Net assets, end of period (in thousands) | | $ | 72,692 | | | $ | 110,427 | | | $ | 117,307 | | | $ | 95,889 | | | $ | 230,505 | | |
| Portfolio turnover | | | 104 | % | | | 87 | % | | | 119 | % | | | 152 | % | | | 113 | % | |
Notes to Financial Highlights
(a) The amount shown for a share outstanding does not correspond with the aggregate net loss on investments for the period due to timing of repurchases of Fund shares in relation to fluctuating market values of the investments of the Fund.
(b) Rounds to less than $0.01.
(c) Total return includes a reimbursement of a loss experienced by the Fund due to a compliance violation. This reimbursement increased the total return by less than 0.01%.
(d) In addition to the fees and expenses which the Fund bears directly, the Fund indirectly bears a pro rata share of the fees and expenses of the acquired funds in which it invests. Such indirect expenses are not included in the reported expense ratios.
(e) Includes interest expense which rounds to less than 0.01%.
(f) The Investment Manager and certain of its affiliates agreed to waive/reimburse certain fees and expenses, if applicable.
(g) The benefits derived from expense reductions had an impact of less than 0.01%.
The Accompanying Notes to Financial Statements are an integral part of this statement.
17
Financial Highlights (continued) – Columbia Marsico 21st Century Fund
| | | Year ended
Feb. 29, | | Year ended Feb. 28, | | Year ended
Feb. 29, | |
| | | 2012 | | 2011 | | 2010 | | 2009 | | 2008 | |
| Class C | |
| Per share data | |
| Net asset value, beginning of period | | $ | 13.25 | | | $ | 10.91 | | | $ | 6.91 | | | $ | 13.86 | | | $ | 13.73 | | |
| Income from investment operations: | |
| Net investment loss | | | (0.12 | ) | | | (0.14 | ) | | | (0.10 | ) | | | (0.07 | ) | | | (0.09 | ) | |
| Net realized and unrealized gain (loss) | | | (0.88 | ) | | | 2.48 | | | | 4.10 | | | | (6.88 | ) | | | 0.74 | (a) | |
| Total from investment operations | | | (1.00 | ) | | | 2.34 | | | | 4.00 | | | | (6.95 | ) | | | 0.65 | | |
| Less distributions to shareholders from: | |
| Net realized gains | | | — | | | | — | | | | — | | | | — | | | | (0.49 | ) | |
| Tax return of capital | | | — | | | | — | | | | — | | | | — | | | | (0.03 | ) | |
| Total distributions to shareholders | | | — | | | | — | | | | — | | | | — | | | | (0.52 | ) | |
| Redemption fees: | |
| Redemption fees added to paid-in capital | | | — | | | | — | | | | — | | | | 0.00 | (b) | | | — | | |
| Net asset value, end of period | | $ | 12.25 | | | $ | 13.25 | | | $ | 10.91 | | | $ | 6.91 | | | $ | 13.86 | | |
| Total return | | | (7.55 | %) | | | 21.45 | %(c) | | | 57.89 | % | | | (50.14 | %) | | | 4.34 | % | |
| Ratios to average net assets(d) | |
| Expenses prior to fees waived or expenses reimbursed (including interest expense) | | | 2.12 | %(e) | | | 2.06 | % | | | 2.06 | % | | | 2.04 | % | | | 1.97 | % | |
| Net expenses after fees waived or expenses reimbursed (including interest expense)(f) | | | 2.12 | %(e)(g) | | | 2.06 | %(g) | | | 2.05 | %(g) | | | 2.00 | %(g) | | | 1.95 | %(g) | |
| Expenses prior to fees waived or expenses reimbursed (excluding interest expense) | | | 2.12 | % | | | 2.06 | % | | | 2.06 | % | | | 2.04 | % | | | 1.97 | % | |
| Net expenses after fees waived or expenses reimbursed (excluding interest expense)(f) | | | 2.12 | %(g) | | | 2.06 | %(g) | | | 2.05 | %(g) | | | 2.00 | %(g) | | | 1.95 | %(g) | |
| Net investment loss | | | (0.97 | %)(g) | | | (1.22 | %)(g) | | | (1.10 | %)(g) | | | (0.63 | %)(g) | | | (0.60 | %)(g) | |
| Supplemental data | |
| Net assets, end of period (in thousands) | | $ | 342,021 | | | $ | 586,725 | | | $ | 660,457 | | | $ | 622,098 | | | $ | 1,418,014 | | |
| Portfolio turnover | | | 104 | % | | | 87 | % | | | 119 | % | | | 152 | % | | | 113 | % | |
Notes to Financial Highlights
(a) The amount shown for a share outstanding does not correspond with the aggregate net loss on investments for the period due to timing of repurchases of Fund shares in relation to fluctuating market values of the investments of the Fund.
(b) Rounds to less than $0.01.
(c) Total return includes a reimbursement of a loss experienced by the Fund due to a compliance violation. This reimbursement increased the total return by less than 0.01%.
(d) In addition to the fees and expenses which the Fund bears directly, the Fund indirectly bears a pro rata share of the fees and expenses of the acquired funds in which it invests. Such indirect expenses are not included in the reported expense ratios.
(e) Includes interest expense which rounds to less than 0.01%.
(f) The Investment Manager and certain of its affiliates agreed to waive/reimburse certain fees and expenses, if applicable.
(g) The benefits derived from expense reductions had an impact of less than 0.01%.
The Accompanying Notes to Financial Statements are an integral part of this statement.
18
Financial Highlights (continued) – Columbia Marsico 21st Century Fund
| | | Year ended
Feb. 29, | | Year ended Feb. 28, | | Year ended
Feb. 29, | |
| | | 2012 | | 2011 | | 2010 | | 2009 | | 2008 | |
| Class R | |
| Per share data | |
| Net asset value, beginning of period | | $ | 14.11 | | | $ | 11.57 | | | $ | 7.29 | | | $ | 14.55 | | | $ | 14.32 | | |
| Income from investment operations: | |
| Net investment loss | | | (0.06 | ) | | | (0.09 | ) | | | (0.06 | ) | | | (0.02 | ) | | | (0.02 | ) | |
| Net realized and unrealized gain (loss) | | | (0.93 | ) | | | 2.63 | | | | 4.34 | | | | (7.24 | ) | | | 0.77 | (a) | |
| Total from investment operations | | | (0.99 | ) | | | 2.54 | | | | 4.28 | | | | (7.26 | ) | | | 0.75 | | |
| Less distributions to shareholders from: | |
| Net realized gains | | | — | | | | — | | | | — | | | | — | | | | (0.49 | ) | |
| Tax return of capital | | | — | | | | — | | | | — | | | | — | | | | (0.03 | ) | |
| Total distributions to shareholders | | | — | | | | — | | | | — | | | | — | | | | (0.52 | ) | |
| Redemption fees: | |
| Redemption fees added to paid-in capital | | | — | | | | — | | | | — | | | | 0.00 | (b) | | | — | | |
| Net asset value, end of period | | $ | 13.12 | | | $ | 14.11 | | | $ | 11.57 | | | $ | 7.29 | | | $ | 14.55 | | |
| Total return | | | (7.02 | %) | | | 21.95 | %(c) | | | 58.71 | % | | | (49.90 | %) | | | 4.87 | % | |
| Ratios to average net assets(d) | |
| Expenses prior to fees waived or expenses reimbursed (including interest expense) | | | 1.62 | %(e) | | | 1.56 | % | | | 1.56 | % | | | 1.54 | % | | | 1.47 | % | |
| Net expenses after fees waived or expenses reimbursed (including interest expense)(f) | | | 1.62 | %(e)(g) | | | 1.56 | %(g) | | | 1.55 | %(g) | | | 1.50 | %(g) | | | 1.45 | %(g) | |
| Expenses prior to fees waived or expenses reimbursed (excluding interest expense) | | | 1.62 | % | | | 1.56 | % | | | 1.56 | % | | | 1.54 | % | | | 1.47 | % | |
| Net expenses after fees waived or expenses reimbursed (excluding interest expense)(f) | | | 1.62 | %(g) | | | 1.56 | %(g) | | | 1.55 | %(g) | | | 1.50 | %(g) | | | 1.45 | %(g) | |
| Net investment loss | | | (0.46 | %)(g) | | | (0.71 | %)(g) | | | (0.59 | %)(g) | | | (0.13 | %)(g) | | | (0.15 | %)(g) | |
| Supplemental data | |
| Net assets, end of period (in thousands) | | $ | 30,137 | | | $ | 40,468 | | | $ | 41,627 | | | $ | 42,429 | | | $ | 47,777 | | |
| Portfolio turnover | | | 104 | % | | | 87 | % | | | 119 | % | | | 152 | % | | | 113 | % | |
Notes to Financial Highlights
(a) The amount shown for a share outstanding does not correspond with the aggregate net loss on investments for the period due to timing of repurchases of Fund shares in relation to fluctuating market values of the investments of the Fund.
(b) Rounds to less than $0.01.
(c) Total return includes a reimbursement of a loss experienced by the Fund due to a compliance violation. This reimbursement increased the total return by less than 0.01%.
(d) In addition to the fees and expenses which the Fund bears directly, the Fund indirectly bears a pro rata share of the fees and expenses of the acquired funds in which it invests. Such indirect expenses are not included in the reported expense ratios.
(e) Includes interest expense which rounds to less than 0.01%.
(f) The Investment Manager and certain of its affiliates agreed to waive/reimburse certain fees and expenses, if applicable.
(g) The benefits derived from expense reductions had an impact of less than 0.01%.
The Accompanying Notes to Financial Statements are an integral part of this statement.
19
Financial Highlights (continued) – Columbia Marsico 21st Century Fund
| | | Year ended
Feb. 29, | | Year ended Feb. 28, | | Year ended
Feb. 29, | |
| | | 2012 | | 2011 | | 2010 | | 2009 | | 2008 | |
| Class Z | |
| Per share data | |
| Net asset value, beginning of period | | $ | 14.54 | | | $ | 11.86 | | | $ | 7.44 | | | $ | 14.76 | | | $ | 14.45 | | |
| Income from investment operations: | |
| Net investment income (loss) | | | 0.01 | | | | (0.03 | ) | | | (0.01 | ) | | | 0.05 | | | | 0.07 | | |
| Net realized and unrealized gain (loss) | | | (0.98 | ) | | | 2.71 | | | | 4.43 | | | | (7.37 | ) | | | 0.76 | (a) | |
| Total from investment operations | | | (0.97 | ) | | | 2.68 | | | | 4.42 | | | | (7.32 | ) | | | 0.83 | | |
| Less distributions to shareholders from: | |
| Net investment income | | | — | | | | — | | | | (0.00 | )(b) | | | — | | | | — | | |
| Net realized gains | | | — | | | | — | | | | — | | | | — | | | | (0.49 | ) | |
| Tax return of capital | | | — | | | | — | | | | — | | | | — | | | | (0.03 | ) | |
| Total distributions to shareholders | | | — | | | | — | | | | (0.00 | )(b) | | | — | | | | (0.52 | ) | |
| Redemption fees: | |
| Redemption fees added to paid-in capital | | | — | | | | — | | | | — | | | | 0.00 | (b) | | | — | | |
| Net asset value, end of period | | $ | 13.57 | | | $ | 14.54 | | | $ | 11.86 | | | $ | 7.44 | | | $ | 14.76 | | |
| Total return | | | (6.67 | %) | | | 22.60 | %(c) | | | 59.42 | % | | | (49.59 | %) | | | 5.38 | % | |
| Ratios to average net assets(d) | |
| Expenses prior to fees waived or expenses reimbursed (including interest expense) | | | 1.12 | %(e) | | | 1.06 | % | | | 1.06 | % | | | 1.04 | % | | | 0.97 | % | |
| Net expenses after fees waived or expenses reimbursed (including interest expense)(f) | | | 1.12 | %(e)(g) | | | 1.06 | %(g) | | | 1.05 | %(g) | | | 1.00 | %(g) | | | 0.95 | %(g) | |
| Expenses prior to fees waived or expenses reimbursed (excluding interest expense) | | | 1.12 | % | | | 1.06 | % | | | 1.06 | % | | | 1.04 | % | | | 0.97 | % | |
| Net expenses after fees waived or expenses reimbursed (excluding interest expense)(f) | | | 1.12 | %(g) | | | 1.06 | %(g) | | | 1.05 | %(g) | | | 1.00 | %(g) | | | 0.95 | %(g) | |
| Net investment income (loss) | | | 0.04 | %(g) | | | (0.20 | %)(g) | | | (0.10 | %)(g) | | | 0.37 | %(g) | | | 0.41 | %(g) | |
| Supplemental data | |
| Net assets, end of period (in thousands) | | $ | 449,867 | | | $ | 1,245,671 | | | $ | 1,008,937 | | | $ | 870,875 | | | $ | 1,614,313 | | |
| Portfolio turnover | | | 104 | % | | | 87 | % | | | 119 | % | | | 152 | % | | | 113 | % | |
Notes to Financial Highlights
(a) The amount shown for a share outstanding does not correspond with the aggregate net loss on investments for the period due to timing of repurchases of Fund shares in relation to fluctuating market values of the investments of the Fund.
(b) Rounds to less than $0.01.
(c) Total return includes a reimbursement of a loss experienced by the Fund due to a compliance violation. This reimbursement increased the total return by less than 0.01%.
(d) In addition to the fees and expenses which the Fund bears directly, the Fund indirectly bears a pro rata share of the fees and expenses of the acquired funds in which it invests. Such indirect expenses are not included in the reported expense ratios.
(e) Includes interest expense which rounds to less than 0.01%.
(f) The Investment Manager and certain of its affiliates agreed to waive/reimburse certain fees and expenses, if applicable.
(g) The benefits derived from expense reductions had an impact of less than 0.01%.
The Accompanying Notes to Financial Statements are an integral part of this statement.
20
Notes to Financial Statements – Columbia Marsico 21st Century Fund
February 29, 2012
Note 1. Organization
Columbia Marsico 21st Century Fund (the Fund), a series of Columbia Funds Series Trust (the Trust), is a diversified fund. The Trust is registered under the Investment Company Act of 1940, as amended (the 1940 Act), as an open-end management investment company organized as a Delaware statutory trust.
Fund Shares
The Trust may issue an unlimited number of shares (without par value). The Fund offers Class A, Class B, Class C, Class R and Class Z shares. All share classes have identical voting, dividend and liquidation rights. Each share class has its own expense structure and sales charges, as applicable.
Class A shares are subject to a maximum front-end sales charge of 5.75% based on the initial investment amount. Class A shares purchased without an initial sales charge in accounts aggregating $1 million to $50 million at the time of purchase are subject to a contingent deferred sales charge (CDSC) if the shares are sold within 18 months of purchase, charged as follows: 1.00% CDSC if redeemed within 12 months of purchase, and 0.50% CDSC if redeemed more than 12, but less than 18, months after purchase.
Class B shares may be subject to a maximum CDSC of 5.00% based upon the holding period after purchase. Class B shares will generally convert to Class A shares eight years after purchase. The Fund no longer accepts investments by new or existing investors in the Fund's Class B shares, except in connection with the reinvestment of any dividend and/or capital gain distributions in Class B shares of the Fund and exchanges by existing Class B shareholders of certain other funds within the Columbia Family of Funds.
Class C shares are subject to a 1.00% CDSC on shares redeemed within one year of purchase.
Class R shares are not subject to sales charges and are only available to qualifying institutional investors.
Class Z shares are not subject to sales charges, and are only available to certain investors, as described in the Fund's prospectus.
Note 2. Summary of Significant Accounting Policies
Use of Estimates
The preparation of financial statements in accordance with U.S. generally accepted accounting principles (GAAP) requires management to make certain estimates and assumptions that affect the reported amounts of assets and liabilities, the disclosure of contingent assets and liabilities at the date of the financial statements and the reported amounts of revenue and expenses during the reporting period. Actual results could differ from those estimates.
The following is a summary of significant accounting policies consistently followed by the Fund in the preparation of its financial statements.
Security Valuation
All equity securities are valued at the close of business of the New York Stock Exchange (NYSE). Equity securities are valued at the last quoted sales price on the principal exchange or market on which they trade, except for securities traded on the NASDAQ Stock Market, which are valued at the NASDAQ official close price. Unlisted securities or listed securities for which there were no sales during the day are valued at the mean of the latest quoted bid and asked prices on such exchanges or markets.
Foreign securities are valued based on quotations from the principal market in which such securities are normally traded. If any foreign share prices are not readily available as a result of limited share activity the securities are valued at the mean of the latest quoted bid and asked prices on such exchanges or markets. Foreign currency exchange rates are generally determined at 4:00 p.m. Eastern (U.S.) time. However, many securities markets and exchanges outside the U.S. close prior to the close of the NYSE; therefore, the closing prices for securities in such markets or on such exchanges may not fully reflect events that occur after such close but before the close of the NYSE. In those situations, foreign securities will be fair valued pursuant to the policy adopted by the Board of Trustees (the Board), including utilizing a third party pricing service to determine these fair values. The third party pricing service takes into account multiple factors, including, but not limited to, movements in the U.S. securities markets, certain depositary receipts, futures contracts and foreign exchange
21
Columbia Marsico 21st Century Fund, February 29, 2012
rates that have occurred subsequent to the close of the foreign exchange, to determine a good faith estimate that reasonably reflects the current market conditions as of the close of the NYSE. The fair value of a security is likely to be different from the quoted or published price, if available.
Investments in other open-end investment companies, including money market funds, are valued at net asset value.
Short-term securities purchased within 60 days to maturity are valued at amortized cost, which approximates market value. The value of short-term securities originally purchased with maturities greater than 60 days is determined based on an amortized value to par upon reaching 60 days to maturity. Short-term securities maturing in more than 60 days from the valuation date are valued at the market price or approximate market value based on current interest rates.
Forward foreign currency exchange contracts are marked-to-market based upon foreign currency exchange rates provided by a pricing service.
Investments for which market quotations are not readily available, or that have quotations which management believes are not reliable, are valued at fair value as determined in good faith under consistently applied procedures established by and under the general supervision of the Board. If a security or class of securities (such as foreign securities) is valued at fair value, such value is likely to be different from the last quoted market price for the security. The determination of fair value often requires significant judgment. To determine fair value, management may use assumptions including but not limited to future cash flows and estimated risk premiums. Multiple inputs from various sources may be used to determine value.
Foreign Currency Transactions and Translation
The values of all assets and liabilities denominated in foreign currencies are translated into U.S. dollars at that day's exchange rates. Net realized and unrealized gains (losses) on foreign currency transactions and translations include gains (losses) arising from the fluctuation in exchange rates between trade and settlement dates on securities transactions, gains (losses) arising from the disposition of foreign currency and currency gains (losses) between the accrual and payment dates on dividends, interest income and foreign withholding taxes.
For financial statement purposes, the Fund does not distinguish that portion of gains (losses) on investments which is due to changes in foreign exchange rates from that which is due to changes in market prices of the investments. Such fluctuations are included with the net realized and unrealized gains (losses) on investments in the Statement of Operations.
Derivative Instruments
The Fund invests in certain derivative instruments as detailed below to meet its investment objectives. Derivatives are instruments whose values depend on, or are derived from, in whole or in part, the value of one or more other assets, such as securities, currencies, commodities or indices. Derivative instruments may be used to maintain cash reserves while maintaining exposure to certain other assets, to offset anticipated declines in values of investments, to facilitate trading, to reduce transaction costs and to pursue higher investment returns. The Fund may also use derivative instruments to mitigate certain investment risks, such as foreign currency exchange rate risk, interest rate risk and credit risk. Derivatives may involve various risks, including the potential inability of the counterparty to fulfill its obligation under the terms of the contract, the potential for an illiquid secondary market and the potential for market movements which may expose the Fund to gains or losses in excess of the amount shown in the Statement of Assets and Liabilities.
The Fund and any counterparty are required to maintain an agreement that requires the Fund and that counterparty to monitor (on a daily basis) the net fair value of all derivatives entered into pursuant to the agreement between the Fund and such counterparty. If the net fair value of such derivatives between the Fund and that counterparty exceeds a certain threshold (as defined in the agreement), the Fund or the counterparty (as the case may be) is required to post cash and/or securities as collateral. Fair values of derivatives presented in the financial statements are not netted with the fair value of other derivatives or with any collateral amounts posted by the Fund or any counterparty.
Forward Foreign Currency Exchange Contracts
Forward foreign currency exchange contracts are agreements between two parties to buy and sell a currency at a set price on a future date. These contracts are intended to be used to minimize the exposure to foreign exchange rate fluctuations
22
Columbia Marsico 21st Century Fund, February 29, 2012
during the period between the trade and settlement dates of the contract. The Fund utilized forward foreign currency exchange contracts for the settlement of purchases and sales of securities.
The values of forward foreign currency exchange contracts fluctuate with changes in foreign currency exchange rates. The Fund will record a realized gain or loss when the forward foreign currency exchange contract is closed.
The use of forward foreign currency exchange contracts does not eliminate fluctuations in the prices of the Fund's portfolio securities. The risks of forward foreign currency exchange contracts include movement in the values of the foreign currencies relative to the U.S. dollar (or other foreign currencies) and the possibility that counterparties will not complete their contractual obligations, which may be in excess of the amount reflected, if any, in the Statement of Assets and Liabilities.
Effects of Derivative Transactions in the Financial Statements
The following tables are intended to provide additional information about the effect of derivatives on the financial statements of the Fund, including: the fair value of derivatives by risk category and the location of those fair values in the Statement of Assets and Liabilities; the impact of derivative transactions on the Fund's operations over the period including realized gains or losses and unrealized gains or losses. The derivative schedules following the Portfolio of Investments present additional information regarding derivative instruments outstanding at the end of the period, if any.
Fair Values of Derivative Instruments at February 29, 2012
| | | Asset Derivatives | | | | Liability Derivatives | | | |
| Risk Exposure Category | | Statement of
Assets and
Liabilities
Location | | Fair Value | | Statement of
Assets and
Liabilities
Location | | Fair Value | |
| Foreign exchange contracts | | Unrealized appreciation on | | | | Unrealized depreciation on | | | |
| | | forward foreign currency | | | | forward foreign currency | | | |
| | | exchange contracts | | $ | 475 | | | exchange contracts | | $ | 599 | | |
Effect of Derivative Instruments in the Statement of
Operations for the Year Ended February 29, 2012
Amount of Realized Gain (Loss) on Derivatives
| Risk Exposure Category | | Forward Foreign
Currency Exchange
Contracts | |
| Foreign exchange contracts | | $ | (381,717 | ) | |
Change in Unrealized Appreciation (Depreciation) on Derivatives Recognized in Income
| Risk Exposure Category | | Forward Foreign
Currency Exchange
Contracts | |
| Foreign exchange contracts | | $ | (124 | ) | |
Volume of Derivative Instruments for the Year
Ended February 29, 2012
| | | Contracts
Opened | |
| Forward Foreign Currency Exchange Contracts | | | 15 | | |
Repurchase Agreements
The Fund may engage in repurchase agreement transactions with institutions that management has determined are creditworthy. The Fund, through the custodian, receives delivery of the underlying securities collateralizing a repurchase agreement. Management is responsible for determining that the collateral is at least equal, at all times, to the value of the repurchase obligation including interest. A repurchase agreement transaction involves certain risks in the event of default or insolvency of the counterparty. These risks include possible delays in or restrictions on a Fund's ability to dispose of the underlying securities and a possible decline in the value of the underlying securities during the period while the Fund seeks to assert its rights.
Security Transactions
Security transactions are accounted for on the trade date. Cost is determined and gains (losses) are based upon the specific identification method for both financial statement and federal income tax purposes.
23
Columbia Marsico 21st Century Fund, February 29, 2012
Income Recognition
Corporate actions and dividend income are recorded net of any non-reclaimable tax withholdings, on the ex-dividend date or upon receipt of ex-dividend notification in the case of certain foreign securities.
Interest income is recorded on the accrual basis. Market premium and discount are amortized and accreted, respectively, on all debt securities, unless otherwise noted. Original issue discount is accreted to interest income over the life of the security with a corresponding increase in the cost basis, if any. For convertible securities, premiums attributable to the conversion feature are not amortized.
The Fund receives distributions from holdings in real estate investment trusts (REITs) which report information on the character of their distributions annually. REIT distributions are allocated to dividend income, capital gain and return of capital based on estimates made by the Fund's management if actual information has not yet been reported. Return of capital is recorded as a reduction of the cost basis of securities held. Management's estimates are subsequently adjusted when the actual character of the distributions is disclosed by the REITs which could result in a proportionate increase in return of capital to shareholders.
Awards from class action litigation are recorded as a reduction of cost basis if the Fund still owns the applicable securities on the payment date. If the Fund no longer owns the applicable securities, the proceeds are recorded as realized gains.
Expenses
General expenses of the Trust are allocated to the Fund and other funds of the Trust based upon relative net assets or other expense allocation methodologies determined by the nature of the expense. Expenses directly attributable to the Fund are charged to the Fund. Expenses directly attributable to a specific class of shares are charged to that share class.
Determination of Class Net Asset Value
All income, expenses (other than class-specific expenses, which are charged to that share class, as shown in the Statement of Operations) and realized and unrealized gains (losses) are allocated to each class of the Fund on a daily basis, based on the relative net assets of each class, for purposes of determining the net asset value of each class.
Federal Income Tax Status
The Fund intends to qualify each year as a regulated investment company under Subchapter M of the Internal Revenue Code, as amended, and will distribute substantially all of its tax exempt or taxable income (including net short-term capital gains), if any, for its tax year, and as such will not be subject to federal income taxes. In addition, the Fund intends to distribute in each calendar year substantially all of its net investment income, capital gains and certain other amounts, if any, such that the Fund should not be subject to federal excise tax. Therefore, no federal income or excise tax provision is recorded.
Distributions to Shareholders
Distributions from net investment income, if any, are declared and paid semi-annually. Net realized capital gains, if any, are distributed along with the income dividend. Income distributions and capital gain distributions are determined in accordance with federal income tax regulations which may differ from GAAP.
Guarantees and Indemnifications
Under the Trust's organizational documents and, in some cases, by contract, its officers and trustees are indemnified against certain liabilities arising out of the performance of their duties to the Trust or its funds. In addition, certain of the Fund's contracts with its service providers contain general indemnification clauses. The Fund's maximum exposure under these arrangements is unknown since the amount of any future claims that may be made against the Fund cannot be determined, and the Fund has no historical basis for predicting the likelihood of any such claims.
Recent Accounting Pronouncement
Fair Value Measurements and Disclosures
In May 2011, the Financial Accounting and Standards Board (FASB) issued ASU No. 2011-04 modifying Topic 820, Fair Value Measurements and Disclosures. At the same time, the International Accounting Standards Board (IASB) issued International Financial Reporting Standard 13, Fair Value Measurement. The objective of the FASB and IASB is convergence of their guidance on fair value measurements and disclosures.
24
Columbia Marsico 21st Century Fund, February 29, 2012
Specifically, ASU No. 2011-04 requires reporting entities to disclose i) the amounts of any transfers between Level 1 and Level 2, and the reasons for the transfers, ii) for Level 3 fair value measurements, a) quantitative information about significant unobservable inputs used, b) a description of the valuation processes used by the reporting entity and c) a narrative description of the sensitivity of the fair value measurement to changes in unobservable inputs if a change in those inputs might result in a significantly higher or lower fair value measurement. The effective date of ASU No. 2011-04 is for interim and annual periods beginning after December 15, 2011. At this time, management is evaluating the implications of this guidance and the impact it will have on the financial statement amounts and footnote disclosures, if any.
Note 3. Fees and Compensation Paid to Affiliates
Investment Management Fees
Under an Investment Management Services Agreement, Columbia Management Investment Advisers, LLC (the Investment Manager), a wholly-owned subsidiary of Ameriprise Financial, Inc. (Ameriprise Financial), is responsible for the ultimate oversight of investments made by the Fund. The primary responsibility for the day-to-day portfolio management of the Fund is provided by the Fund's subadviser (see Subadvisory Agreement below). The management fee is an annual fee that is equal to a percentage of the Fund's average daily net assets that declines from 0.75% to 0.56% as the Fund's net assets increase. The effective management fee rate for the year ended February 29, 2012 was 0.66% of the Fund's average daily net assets.
To the extent that the Fund is not benefitting from a separate contractual expense limitation arrangement, the Investment Manager has contractually agreed to waive a portion of its management fee through June 30, 2012. In the absence of a separate contractual expense limitation arrangement, the management fee waiver for the Fund would be calculated as follows:
| Fund Average Daily Net Assets* | | Management
Fee Waiver | |
| Assets up to $18 billion | | | 0.00 | % | |
Assets in excess of $18 billion
and up to $21 billion | | | 0.05 | | |
| Assets in excess of $21 billion | | | 0.10 | | |
* For purposes of the calculation, "Assets" are aggregate assets of the Fund and other affiliated funds managed by the Investment Manager and sub-advised by Marsico Capital Management, LLC.
For the year ended February 29, 2012, no management fees were waived for the Fund.
Subadvisory Agreement
The Investment Manager has entered into a Subadvisory Agreement with Marsico Capital Management, LLC (Marsico) to subadvise the assets of the Fund. The Investment Manager compensates Marsico to manage the investments of the Fund's assets.
Administration Fees
Under an Administrative Services Agreement, the Investment Manager serves as the Fund Administrator. The Fund pays the Fund Administrator an annual fee for administration and accounting services equal to 0.22% of the Fund's average daily net assets, less the fees that were payable by the Fund as described under the Pricing and Bookkeeping Fees note below.
Pricing and Bookkeeping Fees
Prior to July 11, 2011, the Fund had entered into a Financial Reporting Services Agreement (the Financial Reporting Services Agreement) with State Street Bank and Trust Company (State Street) and the Investment Manager pursuant to which State Street provided financial reporting services to the Fund. The Fund also entered into an Accounting Services Agreement (collectively with the Financial Reporting Services Agreement, the State Street Agreements) with State Street and the Investment Manager pursuant to which State Street provided accounting services to the Fund. Under the State Street Agreements, the Fund paid State Street an annual fee of $38,000 paid monthly plus an additional monthly fee based on an annualized percentage rate of average daily net assets of the Fund for the month. The aggregate fee did not exceed $140,000 per year (exclusive of out-of-pocket expenses and charges). The Fund also reimbursed State Street for certain out-of-pocket expenses and charges. Effective July 11, 2011, these services are provided under the Administrative Services Agreement discussed above.
Other Fees
Effective June 1, 2011, other expenses are for, among other things, certain expenses of the Fund or the Board, including: Fund boardroom and office expense, employee compensation, employee health and retirement benefits, and certain other
25
Columbia Marsico 21st Century Fund, February 29, 2012
expenses. Payment of these Fund and Board expenses is facilitated by a company providing limited administrative services to the Fund and the Board. For the period June 1, 2011 through February 29, 2012, other expenses paid to this company were $8,387.
Compensation of Board Members
Board members are compensated for their services to the Fund as disclosed in the Statement of Operations. Under a Deferred Compensation Plan (the Plan), the Board members who are not "interested persons" of the Fund, as defined under the 1940 Act, may elect to defer payment of up to 100% of their compensation. Deferred amounts are treated as though equivalent dollar amounts had been invested in shares of certain funds managed by the Investment Manager. The Fund's liability for these amounts is adjusted for market value changes and remains in the Fund until distributed in accordance with the Plan.
Compensation of Chief Compliance Officer
The Board has appointed a Chief Compliance Officer to the Fund in accordance with federal securities regulations. Effective April 1, 2011, the Fund's expenses associated with the Chief Compliance Officer are paid directly by the Investment Manager. Prior to April 1, 2011, the Fund, along with other affiliated funds, paid its pro-rata share of the expenses for the Chief Compliance Officer. Such fees did not exceed $15,000 per year.
Transfer Agent Fees
Under a Transfer and Dividend Disbursing Agent Agreement, Columbia Management Investment Services Corp. (the Transfer Agent), an affiliate of the Investment Manager and a wholly-owned subsidiary of Ameriprise Financial, is responsible for providing transfer agency services to the Fund. The Transfer Agent has contracted with Boston Financial Data Services (BFDS) to serve as sub-transfer agent.
The Transfer Agent receives monthly account-based service fees based on the number of open accounts and is reimbursed by the Fund for the fees and expenses the Transfer Agent pays to financial intermediaries that maintain omnibus accounts with the Fund that is a percentage of the average aggregate value of the Fund's shares maintained in each such omnibus account (other than omnibus accounts for which American Enterprise Investment Services Inc. is the broker of record or accounts where the beneficial shareholder is a customer of Ameriprise Financial Services, Inc., which are paid a per account fee). The Transfer Agent pays the fees of BFDS for services as sub-transfer agent and is not entitled to reimbursement for such fees from the Fund (with the exception of out-of-pocket fees).
The Transfer Agent also receives compensation from fees for various shareholder services and reimbursements for certain out-of-pocket expenses.
For the year ended February 29, 2012, the Fund's effective transfer agent fee rates as a percentage of average daily net assets of each class were as follows:
| Class A | | | 0.21 | % | |
| Class B | | | 0.20 | | |
| Class C | | | 0.20 | | |
| Class R | | | 0.20 | | |
| Class Z | | | 0.21 | | |
An annual minimum account balance fee of $20 may apply to certain accounts with a value below the Fund's initial minimum investment requirements to reduce the impact of small accounts on transfer agent fees. These minimum account balance fees are recorded as part of expense reductions in the Statement of Operations. For the year ended February 29, 2012, these minimum account balance fees reduced total expenses by $3,296.
Distribution and Service Fees
The Fund has an agreement with Columbia Management Investment Distributors, Inc. (the Distributor), an affiliate of the Investment Manager and a wholly-owned subsidiary of Ameriprise Financial, for distribution and shareholder services. Pursuant to Rule 12b-1 under the 1940 Act, the Board has approved, and the Fund has adopted, distribution and shareholder service plans (the Plans) which set the distribution and service fees for the Fund. These fees are calculated daily and are intended to compensate the Distributor and/or eligible selling and/or servicing agents for selling shares of the Fund and providing services to investors.
The Plans require the payment of a monthly combined distribution and service fee to the Distributor at the maximum annual rate of 0.25% of the average daily net assets attributable to Class A shares of the Fund. The Plans also required the payment of a monthly service fee at the
26
Columbia Marsico 21st Century Fund, February 29, 2012
maximum annual rate of 0.25% of the average daily net assets attributable to Class B and Class C shares of the Fund and the payment of a monthly distribution fee at the maximum annual rates of 0.75%, 0.75% and 0.50% of the average daily net assets attributable to Class B, Class C and Class R shares, respectively.
Sales Charges
Sales charges, including front-end charges and CDSCs, received by the Distributor for distributing Fund shares were $319,820 for Class A, $167,571 for Class B and $15,487 for Class C for the year ended February 29, 2012.
Expenses Waived/Reimbursed by the Investment Manager and its Affiliates
Effective July 1, 2011, the Investment Manager and certain of its affiliates have contractually agreed to waive fees and/or reimburse expenses (excluding certain fees and expenses described below), through June 30, 2012, unless sooner terminated at the sole discretion of the Board, so that the Fund's net operating expenses, after giving effect to fees waived/expenses reimbursed and any balance credits and/or overdraft charges from the Fund's custodian, do not exceed the following annual rates as a percentage of the class' average daily net assets:
| Class A | | | 1.45 | % | |
| Class B | | | 2.20 | | |
| Class C | | | 2.20 | | |
| Class R | | | 1.70 | | |
| Class Z | | | 1.20 | | |
Under the agreement, the following fees and expenses are excluded from the waiver/reimbursement commitment, and therefore will be paid by the Fund, if applicable: taxes (including foreign transaction taxes), expenses associated with investments in affiliated and non-affiliated pooled investment vehicles (including mutual funds and exchange traded funds), transaction costs and brokerage commissions, costs related to any securities lending program, dividend expenses associated with securities sold short, inverse floater program fees and expenses, transaction charges and interest on borrowed money, interest, extraordinary expenses and any other expenses the exclusion of which is specifically approved by the Board. This agreement may be modified or amended only with approval from all parties.
Note 4. Federal Tax Information
The timing and character of income and capital gain distributions are determined in accordance with income tax regulations, which may differ from GAAP because of temporary or permanent book to tax differences.
For the year ended February 29, 2012, these differences are primarily due to differing treatment for net operating loss reclassifications, deferral/reversal of wash sales, recognition of unrealized appreciation (depreciation) for certain derivative investments, late year ordinary losses, capital loss carryforward and deferred trustees expense. To the extent these differences are permanent, reclassifications are made among the components of the Fund's net assets in the Statement of Assets and Liabilities. Temporary differences do not require reclassifications. In the Statement of Assets and Liabilities the following reclassifications were made:
Excess of distributions over
net investment income | | $ | 8,254,244 | | |
| Accumulated net realized loss | | | 2,177,929 | | |
| Paid-in capital | | | (10,432,173 | ) | |
Net investment income and net realized gains (losses), as disclosed in the Statement of Operations, and net assets were not affected by this reclassification.
For the years ended 2011 and 2012 there were no distributions.
At February 29, 2012, the components of distributable earnings on a tax basis were as follows:
| Undistributed ordinary income | | $ | — | | |
| Undistributed accumulated long-term gain | | | — | | |
| Unrealized appreciation | | | 374,386,701 | | |
27
Columbia Marsico 21st Century Fund, February 29, 2012
At February 29, 2012, the cost of investments for federal income tax purposes was $1,572,718,983 and the aggregate gross unrealized appreciation and depreciation based on that cost was:
| Unrealized appreciation | | $ | 390,309,996 | | |
| Unrealized depreciation | | | (15,923,295 | ) | |
| Net unrealized appreciation | | $ | 374,386,701 | | |
The following capital loss carryforward, determined at February 29, 2012, may be available to reduce taxable income arising from future net realized gains on investments, if any, to the extent permitted by the Internal Revenue Code:
| Year of Expiration | | Amount | |
| 2017 | | $ | 588,195,840 | | |
| 2018 | | | 1,526,982,692 | | |
| Total | | $ | 2,115,178,532 | | |
On December 22, 2010, the Regulated Investment Company Modernization Act of 2010 (the Act) was enacted, which changed various technical rules governing the tax treatment of regulated investment companies. The changes are generally effective for taxable years beginning after the date of enactment. Under the Act, the Fund will be permitted to carry forward capital losses incurred in taxable years beginning after the date of enactment for an unlimited period. However, any losses incurred during those future taxable years will be required to be utilized prior to the losses incurred in pre-enactment taxable years, which carry an expiration date. As a result of this ordering rule, pre-enactment capital loss carryforwards may be more likely to expire unused.
For the year ended February 29, 2012, $67,610,199 of capital loss carryforward was utilized.
Under current tax rules, regulated investment companies can elect to treat certain late-year ordinary losses incurred and post-October capital losses (capital losses realized after October 31) as arising on the first day of the following taxable year. As of February 29, 2012, the Fund will elect to treat late year ordinary losses of $1,154,810 as arising on March 1, 2012.
Management of the Fund has concluded that there are no significant uncertain tax positions that would require recognition in the financial statements. However, management's conclusion may be subject to review and adjustment at a later date based on factors including, but not limited to, new tax laws, regulations, and administrative interpretations (including relevant court decisions). Generally, the Fund's federal tax returns for the prior three fiscal years remain subject to examination by the Internal Revenue Service.
Note 5. Portfolio Information
The cost of purchases and proceeds from sales of securities, excluding short-term obligations, aggregated to $2,776,799,289 and $4,285,623,421, respectively, for the year ended February 29, 2012.
Note 6. Lending of Portfolio Securities
Effective July 11, 2011, the Fund has entered into a Master Securities Lending Agreement (the Agreement) with JPMorgan Chase Bank, N.A. (JPMorgan). The Agreement, which replaces the previous security lending arrangement with State Street, authorizes JPMorgan as lending agent to lend securities to authorized borrowers in order to generate additional income on behalf of the Fund. Pursuant to the Agreement, the securities loaned are secured by cash or U.S. government securities equal to at least 100% of the market value of the loaned securities. Any additional collateral required to maintain those levels due to market fluctuations of the loaned securities is requested to be delivered the following business day. Cash collateral received is invested by the lending agent on behalf of the Fund into authorized investments pursuant to the Agreement. The investments made with the cash collateral are listed in the Portfolio of Investments. The values of such investments and any uninvested cash collateral are disclosed in the Statement of Assets and Liabilities along with the related obligation to return the collateral upon the return of the securities loaned. At February 29, 2012, securities valued at $276,279,733 were on loan, secured by cash collateral of $284,722,977 (which does not reflect calls for collateral made to borrowers by JPMorgan at period end) that is partially or fully invested in short-term securities or other cash equivalents.
Risks of delay in recovery of securities or even loss of rights in the securities may occur should the borrower of the
28
Columbia Marsico 21st Century Fund, February 29, 2012
securities fail financially. Risks may also arise to the extent that the value of the securities loaned increases above the value of the collateral received. JPMorgan will indemnify the Fund from losses resulting from a borrower's failure to return a loaned security when due. Such indemnification does not extend to losses associated with declines in the value of cash collateral investments. The Investment Manager is not responsible for any losses incurred by the Fund in connection with the securities lending program. Loans are subject to termination by the Fund or the borrower at any time, and are, therefore, not considered to be illiquid investments.
Pursuant to the Agreement, the Fund receives income for lending its securities either in the form of fees or by earning interest on invested cash collateral, net of negotiated rebates paid to borrowers and fees paid to the lending agent for services provided and any other securities lending expenses. Net income earned from securities lending for the year ended February 29, 2012 is disclosed in the Statement of Operations. The Fund continues to earn and accrue interest and dividends on the securities loaned.
Prior to July 11, 2011, the Fund participated in a securities lending arrangement with State Street. Each security on loan was collateralized in an amount at least equal to the market value of the securities loaned plus accrued income from the investment of collateral. The income generated by the investment of the collateral, net of any fees remitted to State Street as the lending agent and borrower rebates, was paid to the Fund.
Note 7. Custody Credits
Prior to July 11, 2011, the Fund had an agreement with its custodian bank under which custody fees may have been reduced by balance credits. These credits are recorded as part of expense reductions on the Statement of Operations. The Fund could have invested a portion of the assets utilized in connection with the expense offset arrangement in an income-producing asset if they had not entered into such an agreement. Subsequent to this date, the Fund may invest its daily balance in an affiliated money market fund as detailed below. For the period March 1, 2011 through July 11, 2011, custody credits reduced total expenses by $10.
Note 8. Affiliated Money Market Fund
Effective July 11, 2011, the Fund may invest its daily cash balances in Columbia Short-Term Cash Fund, an affiliated money market fund established for the exclusive use by the Fund and other affiliated funds. The income earned by the Fund from such investments is included as "Dividends from affiliates" in the Statement of Operations. As an investing fund, the Fund indirectly bears its proportionate share of the expenses of Columbia Short-Term Cash Fund.
Note 9. Shareholder Concentration
At February 29, 2012, one unaffiliated shareholder account owned 15.7% of the outstanding shares of the Fund. The Fund has no knowledge about whether any portion of those shares was owned beneficially by such accounts. Subscription and redemption activity by concentrated accounts may have a significant effect on the operations of the Fund.
Note 10. Line of Credit
The Fund has entered into a revolving credit facility with a syndicate of banks led by JPMorgan Chase Bank, N.A. (the Administrative Agent), whereby the Fund may borrow for the temporary funding of shareholder redemptions or for other temporary or emergency purposes. The credit facility became effective on July 11, 2011, replacing a prior credit facility. The credit facility agreement, as amended, which is a collective agreement between the Fund and certain other funds managed by the Investment Manager, severally and not jointly, permits collective borrowings up to $500 million. Pursuant to a December 13, 2011 amendment to the credit facility agreement, interest is charged to each participating fund based on its borrowings at a rate equal to the higher of (i) the overnight federal funds rate plus 1.00% or (i) the one-month LIBOR rate plus 1.00%. Each borrowing under the credit facility matures no later than 60 days after the date of borrowing. The Fund also pays a commitment fee equal to its pro rata share of the amount of the credit facility at a rate of 0.08% per annum. For the period July 11, 2011 through December 13, 2011, interest was charged to each participating fund based on its borrowings at a rate equal to the sum of the federal funds rate plus (i) 1.25% per annum plus (ii) if one-month LIBOR exceeds the federal funds rate, the amount of such excess. The Fund also paid a commitment fee equal to its pro rata share of the amount of the credit facility at a rate of 0.10% per annum.
29
Columbia Marsico 21st Century Fund, February 29, 2012
Prior to July 11, 2011, the Fund and certain other funds managed by the Investment Manager participated in a committed, unsecured revolving credit facility provided by State Street. For the period June 27, 2011 through July 8, 2011, the collective borrowing amount of the credit facility was $100 million. For the period May 16, 2011 through June 26, 2011, the collective borrowing amount of the credit facility was $150 million. For the period March 28, 2011 through May 15, 2011, the collective borrowing amount of the credit facility was $225 million. Prior to March 28, 2011, the collective borrowing amount of the credit facility was $280 million. Interest was charged to each fund based on its borrowings at a rate equal to the greater of the (i) federal funds rate plus 1.25% per annum or (ii) the overnight LIBOR rate plus 1.25% per annum. The Fund also paid a commitment fee equal to its pro rata share of the amount of the credit facility at a rate of 0.125% per annum. For the year ended February 29, 2012, the average daily loan balance outstanding on days when borrowing existed was $14,627,273 at a weighted average interest rate of 1.34%. At February 29, 2012, the Fund had an outstanding balance of $55,000,000 on the line of credit as disclosed on the Statement of Assets and Liabilities.
Note 11. Significant Risks
Foreign Securities Risk
Investing in foreign securities may include certain risks and considerations not typically associated with investing in U.S. securities, such as fluctuating currency values and changing local and regional economic, political and social conditions, which may result in greater market volatility. In addition, certain foreign securities may not be as liquid as U.S. securities. Investing in emerging markets may accentuate these risks.
Investments in emerging market countries are subject to additional risk. The risk of foreign investments is typically increased in less developed countries. These countries are also more likely to experience high levels of inflation, deflation or currency devaluation which could hurt their economies and securities markets.
Note 12. Subsequent Events
Management has evaluated the events and transactions that have occurred through the date the financial statements were issued and noted no items requiring adjustment of the financial statements or additional disclosure.
Note 13. Information Regarding Pending and Settled Legal Proceedings
In June 2004, an action captioned John E. Gallus et al. v. American Express Financial Corp. and American Express Financial Advisors Inc. was filed in the United States District Court for the District of Arizona. The plaintiffs allege that they are investors in several American Express Company mutual funds (currently branded as Columbia) and they purport to bring the action derivatively on behalf of those funds under the Investment Company Act of 1940. The plaintiffs allege that fees allegedly paid to the defendants by the funds for investment advisory and administrative services are excessive. The plaintiffs seek remedies including restitution and rescission of investment advisory and distribution agreements. The plaintiffs voluntarily agreed to transfer this case to the United States District Court for the District of Minnesota (the District Court). In response to defendants' motion to dismiss the complaint, the District Court dismissed one of plaintiffs' four claims and granted plaintiffs limited discovery. Defendants moved for summary judgment in April 2007. Summary judgment was granted in the defendants' favor on July 9, 2007. The plaintiffs filed a notice of appeal with the Eighth Circuit Court of Appeals (the Eighth Circuit) on August 8, 2007. On April 8, 2009, the Eighth Circuit reversed summary judgment and remanded to the District Court for further proceedings. On August 6, 2009, defendants filed a writ of certiorari with the U.S. Supreme Court (the Supreme Court), asking the Supreme Court to stay the District Court proceedings while the Supreme Court considered and ruled in a case captioned Jones v. Harris Associates, which involved issues of law similar to those presented in the Gallus case. On March 30, 2010, the Supreme Court issued its ruling in Jones v. Harris Associates, and on April 5, 2010, the Supreme Court vacated the Eighth Circuit's decision in the Gallus case and remanded the case to the Eighth Circuit for further consideration in light of the Supreme Court's decision in Jones v. Harris Associates. On June 4, 2010, the Eighth Circuit remanded the Gallus case to
30
Columbia Marsico 21st Century Fund, February 29, 2012
the District Court for further consideration in light of the Supreme Court's decision in Jones v. Harris Associates. On December 9, 2010, the District Court reinstated its July 9, 2007 summary judgment order in favor of the defendants. On January 10, 2011, plaintiffs filed a notice of appeal with the Eighth Circuit. In response to the plaintiffs' opening appellate brief filed on March 18, 2011, the defendants filed a response brief on May 4, 2011 with the Eighth Circuit. The plaintiffs filed a reply brief on May 26, 2011 and oral arguments took place on November 17, 2011. On March 30, 2012, the Eighth Circuit upheld the grant of summary judgement by the District Court in favor of the defendants.
In December 2005, without admitting or denying the allegations, American Express Financial Corporation (AEFC, which is now known as Ameriprise Financial, Inc. (Ameriprise Financial)) entered into settlement agreements with the Securities and Exchange Commission (SEC) and Minnesota Department of Commerce (MDOC) related to market timing activities. As a result, AEFC was censured and ordered to cease and desist from committing or causing any violations of certain provisions of the Investment Advisers Act of 1940, the Investment Company Act of 1940, and various Minnesota laws. AEFC agreed to pay disgorgement of $10 million and civil money penalties of $7 million. AEFC also agreed to retain an independent distribution consultant to assist in developing a plan for distribution of all disgorgement and civil penalties ordered by the SEC in accordance with various undertakings detailed at www.sec.gov/litigation/admin/ia-2451.pdf. Ameriprise Financial and its affiliates have cooperated with the SEC and the MDOC in these legal proceedings, and have made regular reports to the funds' Boards of Trustees.
Ameriprise Financial and certain of its affiliates have historically been involved in a number of legal, arbitration and regulatory proceedings, including routine litigation, class actions, and governmental actions, concerning matters arising in connection with the conduct of their business activities. Ameriprise Financial believes that the Funds are not currently the subject of, and that neither Ameriprise Financial nor any of its affiliates are the subject of, any pending legal, arbitration or regulatory proceedings that are likely to have a material adverse effect on the Funds or the ability of Ameriprise Financial or its affiliates to perform under their contracts with the Funds. Ameriprise Financial is required to make 10-Q, 10-K and, as necessary, 8-K filings with the Securities and Exchange Commission on legal and regulatory matters that relate to Ameriprise Financial and its affiliates. Copies of these filings may be obtained by accessing the SEC website at www.sec.gov.
There can be no assurance that these matters, or the adverse publicity associated with them, will not result in increased fund redemptions, reduced sale of fund shares or other adverse consequences to the Funds. Further, although we believe proceedings are not likely to have a material adverse effect on the Funds or the ability of Ameriprise Financial or its affiliates to perform under their contracts with the Funds, these proceedings are subject to uncertainties and, as such, we are unable to estimate the possible loss or range of loss that may result. An adverse outcome in one or more of these proceedings could result in adverse judgments, settlements, fines, penalties or other relief that could have a material adverse effect on the consolidated financial condition or results of operations of Ameriprise Financial.
31
Report of Independent Registered Public Accounting Firm
To the Trustees of Columbia Funds Series Trust and the Shareholders of Columbia Marsico 21st Century Fund
In our opinion, the accompanying statement of assets and liabilities, including the investment portfolio, and the related statements of operations and of changes in net assets and the financial highlights present fairly, in all material respects, the financial position of Columbia Marsico 21st Century Fund (the "Fund") (a series of Columbia Funds Series Trust) at February 29, 2012, the results of its operations for the year then ended, the changes in its net assets for each of the two years in the period then ended and the financial highlights for each of the periods indicated, in conformity with accounting principles generally accepted in the United States of America. These financial statements and financial highlights (hereafter referred to as "financial statements") are the responsibility of the Fund's management. Our responsibility is to express an opinion on these financial statements based on our audits. We conducted our audits of these financial statements in accordance with the standards of the Public Company Accounting Oversight Board (United States). Those standards require that we plan and perform the audit to obtain reasonable assurance about whether the financial statements are free of material misstatement. An audit includes examining, on a test basis, evidence supporting the amounts and disclosures in the financial statements, assessing the accounting principles used and significant estimates made by management, and evaluating the overall financial statement presentation. We believe that our audits, which included confirmation of securities at February 29, 2012 by correspondence with the custodian and brokers, provide a reasonable basis for our opinion.
PricewaterhouseCoopers LLP
Minneapolis, Minnesota
April 20, 2012
32
Fund Governance
Shareholders elect the Board that oversees the funds' operations. The Board appoints officers who are responsible for day-to-day business decisions based on policies set by the Board. The following table provides basic biographical information about the funds' Board members, including their principal occupations during the past five years, although specific titles for individuals may have varied over the period. Under current Board policy, members may serve until the next Board meeting after he or she reaches the mandatory retirement age established by the Board, or the fifteenth anniversary of the first Board meeting they attended as a member of the Board.
On September 29, 2009, Ameriprise Financial, the parent company of Columbia Management, entered into an agreement with Bank of America, N.A. ("Bank of America") to acquire a portion of the asset management business of Columbia Management Group, LLC and certain of its affiliated companies (the "Transaction"). Following the Transaction, which became effective on May 1, 2010, various alignment activities have occurred with respect to the Fund Family. In connection with the Transaction, Mr. Edward J. Boudreau, Jr., Mr. William P. Carmichael, Mr. William A. Hawkins, Mr. R. Glenn Hilliard, Mr. John J. Nagorniak, Ms. Minor M. Shaw and Dr. Anthony M. Santomero, who were members prior to the Transaction of the Legacy Columbia Nations funds' Board ("Nations Funds"), which includes Columbia Funds Series Trust, Columbia Funds Variable Insurance Trust I and Columbia Funds Master Investment Trust, LLC., began service on the Board for the Legacy RiverSource funds ("RiverSource Funds") effective June 1, 2011, which resulted in an overall increase from twelve Trustees to sixteen for all mutual funds overseen by the Board.
Independent Board Members
| Name, Address, Age | | Position Held
with Funds
and Length
of Service | | Principal Occupation During Past Five Years | | Number of
Funds in the
Fund Family
Overseen by
Board Member | | Other Present or
Past Directorships/
Trusteeships
(Within Past 5 Years) | |
| Kathleen Blatz | | | | | | | | | |
|
901 S. Marquette Ave.
Minneapolis, MN 55402
Age 57 | | Board member since 1/06 for RiverSource Funds and since 6/11 for Nations Funds | | Attorney; Chief Justice, Minnesota Supreme Court, 1998-2006 | | | 153 | | | None | |
|
| Edward J. Boudreau, Jr. | | | | | | | | | |
|
225 Franklin Street
Mail Drop
BX32 05228
Boston, MA 02110
Age 67 | | Board member since 6/11 for RiverSource Funds and since 1/05 for Nations Funds | | Managing Director, E.J. Boudreau & Associates (consulting) since 2000 | | | 146 | | | Former Trustee, BofA Funds Series Trust (11 funds) | |
|
| Pamela G. Carlton | | | | | | | | | |
|
901 S. Marquette Ave.
Minneapolis, MN 55402
Age 57 | | Board member since 7/07 for RiverSource Funds and since 6/11 for Nations Funds | | President, Springboard-Partners in Cross Cultural Leadership (consulting company) | | | 153 | | | None | |
|
33
Fund Governance (continued)
Independent Board Members (continued)
| Name, Address, Age | | Position Held
with Funds
and Length
of Service | | Principal Occupation During Past Five Years | | Number of
Funds in the
Fund Family
Overseen by
Board Member | | Other Present or
Past Directorships/
Trusteeships
(Within Past 5 Years) | |
| William P. Carmichael | | | | | | | | | |
|
225 Franklin Street
Mail Drop
BX32 05228
Boston, MA 02110
Age 68 | | Board member since 6/11 for RiverSource Funds and since 1999 for Nations Funds | | Retired | | | 146 | | | Director, Cobra Electronics Corporation (electronic equipment manufacturer); The Finish Line (athletic shoes and apparel); McMoRan Exploration Company (oil and gas exploration and development); former Trustee, BofA Funds Series Trust (11 funds); former Director, Spectrum Brands, Inc. (consumer products); former Director, Simmons Company (bedding) | |
|
| Patricia M. Flynn | | | | | | | | | |
|
901 S. Marquette Ave.
Minneapolis, MN 55402
Age 61 | | Board member since 11/04 for RiverSource Funds and since 6/11 for Nations Funds | | Trustee Professor of Economics and Management, Bentley University; former Dean, McCallum Graduate School of Business, Bentley University | | | 153 | | | None | |
|
| William A. Hawkins | | | | | | | | | |
|
225 Franklin Street
Mail Drop
BX32 05228
Boston, MA 02110
Age 69 | | Board member since 6/11 for RiverSource Funds and since 1/05 for Nations Funds | | Managing Director, Overton Partners (financial consulting), since August 2010; President and Chief Executive Officer, California General Bank, N.A., January 2008-August 2010 | | | 146 | | | Trustee, BofA Funds Series Trust (11 funds) | |
|
| R. Glenn Hilliard | | | | | | | | | |
|
225 Franklin Street
Mail Drop
BX32 05228
Boston, MA 02110
Age 69 | | Board member since 6/11 for RiverSource Funds and since 1/05 for Nations Funds | | Chairman and Chief Executive Officer, Hilliard Group LLC (investing and consulting), since April 2003; Non-Executive Director & Chairman, CNO Financial Group, Inc. (formerly Conseco, Inc.) (insurance), September 2003-May 2011 | | | 146 | | | Chairman, BofA Fund Series Trust (11 funds); former Director, CNO Financial Group, Inc. (insurance) | |
|
34
Fund Governance (continued)
Independent Board Members (continued)
| Name, Address, Age | | Position Held
with Funds
and Length
of Service | | Principal Occupation During Past Five Years | | Number of
Funds in the
Fund Family
Overseen by
Board Member | | Other Present or
Past Directorships/
Trusteeships
(Within Past 5 Years) | |
| Stephen R. Lewis, Jr. | | | | | | | | | |
|
901 S. Marquette Ave.
Minneapolis, MN 55402
Age 73 | | Chair of the Board for RiverSource Funds since 1/07, Board member for RiverSource Funds since 1/02 and since 6/11 for Nations Funds | | President Emeritus and Professor of Economics Emeritus, Carleton College | | | 153 | | | Director, Valmont Industries, Inc. (manufactures irrigation systems) | |
|
| John F. Maher | | | | | | | | | |
|
901 S. Marquette Ave.
Minneapolis, MN 55402
Age 68 | | Board member since 12/06 for Legacy Seligman funds, since 12/08 for RiverSource Funds and since 6/11 for Nations Funds | | Retired President and Chief Executive Officer and former Director, Great Western Financial Corporation (financial services), 1986-1997 | | | 153 | | | None | |
|
| John J. Nagorniak | | | | | | | | | |
|
225 Franklin Street
Mail Drop
BX32 05228
Boston, MA 02110
Age 67 | | Board member since 6/11 for RiverSource Funds and since 1/08 for Nations Funds | | Retired; President and Director, Foxstone Financial, Inc. (consulting), 2000-2007; Director, Mellon Financial Corporation affiliates (investing), 2000-2007; Chairman, Franklin Portfolio Associates (investing—Mellon affiliate), 1982-2007 | | | 146 | | | Trustee, Research Foundation of CFA Institute; Director, MIT Investment Company; Trustee, MIT 401k Plan; former Trustee, BofA Funds Series Trust (11 funds) | |
|
| Catherine James Paglia | | | | | | | | | |
|
901 S. Marquette Ave.
Minneapolis, MN 55402
Age 59 | | Board member since 11/04 for RiverSource Funds and since 6/11 for Nations Funds | | Director, Enterprise Asset Management, Inc. (private real estate and asset management company) | | | 153 | | | None | |
|
35
Fund Governance (continued)
Independent Board Members (continued)
| Name, Address, Age | | Position Held
with Funds
and Length
of Service | | Principal Occupation During Past Five Years | | Number of
Funds in the
Fund Family
Overseen by
Board Member | | Other Present or
Past Directorships/
Trusteeships
(Within Past 5 Years) | |
| Leroy C. Richie | | | | | | | | | |
|
901 S. Marquette Ave.
Minneapolis, MN 55402
Age 70 | | Board member since 2000 for Legacy Seligman funds, since 11/08 for RiverSource Funds and since 6/11 for Nations Funds | | Counsel, Lewis & Munday, P.C. since 2004; former Vice President and General Counsel, Automotive Legal Affairs, Chrysler Corporation | | | 153 | | | Director Digital Ally, Inc. (digital imaging); Director Infinity, Inc. (oil and gas exploration and production); Director OGE Energy Corp. (energy and energy services) | |
|
| Minor M. Shaw | | | | | | | | | |
|
225 Franklin Street
Mail Drop
BX32 05228
Boston, MA 02110
Age 64 | | Board member since 6/11 for RiverSource Funds and since 2003 for Nations Funds | | President—Micco LLC (private investments) | | | 146 | | | Former Trustee, BofA Funds Series Trust (11 funds); Board Member, Piedmont Natural Gas; Director, Blue Cross Blue Shield of South Carolina | |
|
| Alison Taunton-Rigby | | | | | | | | | |
|
901 S. Marquette Ave.
Minneapolis, MN 55402
Age 67 | | Board member since 11/02 for RiverSource Funds and since 6/11 for Nations Funds | | Chief Executive Officer and Director, RiboNovix, Inc. 2003-2010 (biotechnology); former President, Aquila Biopharmaceuticals | | | 153 | | | Director, Healthways, Inc. (health management programs); Director, ICI Mutual Insurance Company, RRG; Director, Abt Associates (government contractor) | |
|
36
Fund Governance (continued)
Interested Board Member Not Affiliated with Investment Manager*
| Name, Address, Age | | Position Held
with Funds
and Length
of Service | | Principal Occupation During Past Five Years | | Number of
Funds in the
Fund Family
Overseen by
Board Member | | Other Present or
Past Directorships/
Trusteeships
(Within Past 5 Years) | |
| Anthony M. Santomero* | | | | | | | | | |
|
225 Franklin Street
Mail Drop
BX32 05228
Boston, MA 02110
Age 65 | | Board member since 6/11 for RiverSource Funds and since 1/08 for Nations Funds | | Richard K. Mellon Professor Emeritus of Finance, The Wharton School, University of Pennsylvania, since 2002; Senior Advisor, McKinsey & Company (consulting), 2006-2008; President and Chief Executive Officer, Federal Reserve Bank of Philadelphia, 2000-2006 | | | 146 | | | Director, Renaissance Reinsurance Ltd.; Trustee, Penn Mutual Life Insurance Company; Director, Citigroup; Director, Citibank, N.A.; former Trustee, BofA Funds Series Trust (11 funds) | |
|
* Dr. Santomero is not an affiliated person of the Investment Manager or Ameriprise Financial. However, he is currently deemed by the funds to be an "interested person" (as defined in the 1940 Act) of the Funds because he serves as a Director of Citigroup, Inc. and Citibank N.A., companies that may directly or through subsidiaries and affiliates engage from time-to-time in brokerage execution, principal transactions and lending relationships with the funds or accounts advised/managed by the Investment Manager.
Interested Board Member Affiliated with Investment Manager*
| William F. Truscott | | | | | | | | | |
|
53600 Ameriprise Financial Center
Minneapolis, MN 55474
Age 51 | | Board member since 11/01 for RiverSource Funds and since 6/11 for Nations Funds; Senior Vice President since 2002 for RiverSource Funds and 5/10 for Nation Funds | | Chairman of the Board and President, Columbia Management Investment Advisers, LLC since May 2010 and February 2012, respectively (previously President, Chairman of the Board and Chief Investment Officer, 2001-April 2010); Chief Executive Officer, U.S. Asset Management & President, Annuities, Ameriprise Financial, Inc. since May 2010 (previously President—U.S. Asset Management and Chief Investment Officer, 2005-April 2010); Director, President and Chief Executive Officer, Ameriprise Certificate Company since 2006; Director and Chief Executive Officer, Columbia Management Investment Distributors, Inc. since May 2010 and February 2012, respectively (previously Chairman of the Board and Chief Executive Officer, 2006-April 2010); Chairman of the Board and Chief Executive Officer, RiverSource Distributors, Inc. since 2006 | | | 153 | | | None | |
|
* Interested person (as defined under the 1940 Act) by reason of being an officer, director, security holder and/or employee of the Investment Manager or Ameriprise Financial.
The SAI has additional information about the Fund's Board members and is available, without charge, upon request by calling 800.345.6611; contacting your financial intermediary; or visiting columbiamanagement.com.
37
Fund Governance (continued)
Officers
| Name, Year of Birth and Address | | Principal Occupation(s) During the Past Five Years | |
| J. Kevin Connaughton (Born 1964) | |
|
225 Franklin Street
Boston, MA 02110
President (since 2009) | | Senior Vice President and General Manager—Mutual Fund Products, Columbia Management Investment Advisers, LLC since May 2010; President, Columbia Funds, since 2009, and RiverSource Funds, since May 2010 (previously Senior Vice President and Chief Financial Officer, Columbia Funds, from June 2008 to January 2009, Treasurer, Columbia Funds, from October 2003 to May 2008, and senior officer of various other affiliated funds since 2000); Managing Director, Columbia Management Advisors, LLC from December 2004 to April 2010. | |
|
| Michael G. Clarke (Born 1969) | |
|
225 Franklin Street
Boston, MA 02110
Treasurer (since 2011) and Chief Financial Officer (since 2009) | | Vice President, Columbia Management Investment Advisers, LLC since May 2010; Managing Director of Fund Administration, Columbia Management Advisors, LLC, from September 2004 to April 2010; senior officer of Columbia Funds and affiliated funds since 2002. | |
|
| Scott R. Plummer (Born 1959) | |
|
5228 Ameriprise Financial Center
Minneapolis, MN 55474
Senior Vice President and Chief Legal Officer (since 2010) | | Chief Legal Officer and Assistant Secretary, Columbia Management Investment Advisers, LLC since June 2005; Vice President and Lead Chief Counsel—Asset Management, Ameriprise Financial, Inc. since May 2010 (previously Vice President and Chief Counsel—Asset Management, from 2005 to April 2010, Vice President, Chief Counsel and Assistant Secretary, Columbia Management Investment Distributors, Inc. since 2008; Vice President, General Counsel and Secretary, Ameriprise Certificate Company since 2005; Chief Counsel, RiverSource Distributors, Inc. since 2006; Senior officer of Columbia Funds and affiliated funds, since 2006. | |
|
| Thomas P. McGuire (Born 1972) | |
|
225 Franklin Street
Boston, MA 02110
Chief Compliance Officer (since 2012) | | Vice President—Asset Management Compliance, Columbia Management Investment Advisers, LLC since March 2010; Chief Compliance Officer, Ameriprise Certificate Company, since September 2010; Compliance Executive, Bank of America, from June 2005 to April 2010. | |
|
| William F. Truscott (Born 1960) | |
|
53600 Ameriprise Financial Center
Minneapolis, MN 55474
Senior Vice President (since 2010) | | Chairman of the Board and President, Columbia Management Investment Advisers, LLC since May 2010 and February 2012, respectively (previously President, Chairman of the Board and Chief Investment Officer, from 2001 to April 2010); Chief Executive Officer, U.S. Asset Management & President, Annuities, Ameriprise Financial, Inc. since May 2010 (previously President—U.S. Asset Management and Chief Investment Officer from 2005 to April 2010; Director, President and Chief Executive Officer, Ameriprise Certificate Company since 2006; Director and Chief Executive Officer, Columbia Management Investment Distributors, Inc. since May 2010 and February 2012, respectively (previously Chairman of the Board and Chief Executive Officer from 2008 to April 2010); Chairman of the Board and Chief Executive Officer, RiverSource Distributors, Inc. since 2006. | |
|
| Paul D. Pearson (Born 1956) | |
|
10468 Ameriprise Financial Center
Minneapolis, MN 55474
Vice President and Assistant Treasurer
(since 2011) | | Vice President—Investment Accounting, Columbia Management Investment Advisers, LLC, since May 2010; Vice President—Managed Assets, Investment Accounting, Ameriprise Financial Corporation, 1998-2010 | |
|
38
Fund Governance (continued)
Officers (continued)
| Name, Year of Birth and Address | | Principal Occupation(s) During the Past Five Years | |
| Colin Moore (Born 1958) | |
|
225 Franklin Street
Boston, MA 02110
Senior Vice President (since 2010) | | Director and Chief Investment Officer, Columbia Management Investment Advisers, LLC since May 2010; Manager, Managing Director and Chief Investment Officer of Columbia Management Advisors, LLC from 2007 to April 2010; Head of Equities, Columbia Management Advisors, LLC from 2002 to 2007. | |
|
| Christopher O. Petersen (Born 1970) | |
|
5228 Ameriprise Financial Center
Minneapolis, MN 55474
Vice President and Secretary (since 2011) | | Vice President and Chief Counsel, Ameriprise Financial since January 2010 (formerly Vice President and Group Counsel or Counsel from April 2004 to January 2010); Senior officer of Columbia Funds and affiliated funds, since 2007. | |
|
| Amy K. Johnson (Born 1965) | |
|
5228 Ameriprise Financial Center
Minneapolis, MN 55474
Vice President (since 2010) | | Senior Vice President and Chief Operating Officer, Columbia Management Investment Advisers, LLC since May 2010 (previously Chief Administrative Officer, from 2009 until April 2010, Vice President—Asset Management and Trust Company Services, from 2006 to 2009, and Vice President—Operations and Compliance from 2004 to 2006). | |
|
| Joseph F. DiMaria (Born 1968) | |
|
225 Franklin Street
Boston, MA 02110
Vice President (since 2011) and Chief Accounting Officer (since 2008) | | Vice President, Mutual Fund Administration, Columbia Management Investment Advisers, LLC, since May 2010; Director of Fund Administration, Columbia Management Advisors, LLC from January 2006 to April 2010. | |
|
| Paul B. Goucher (Born 1968) | |
|
100 Park Avenue
New York, NY 10017
Vice President and Assistant Secretary (since 2010) | | Vice President and Chief Counsel of Ameriprise Financial since January 2010 (formerly Vice President and Group Counsel from November 2008 to January 2010); Director, Managing Director and General Counsel of J. & W. Seligman & Co. Incorporated (Seligman) from July 2008 to November 2008 and Managing Director and Associate General Counsel of Seligman from January 2005 to July 2008. | |
|
| Michael E. DeFao (Born 1968) | |
|
225 Franklin Street
Boston, MA 02110
Vice President and Assistant Treasurer (since 2011) | | Vice President and Chief Counsel, Ameriprise Financial since May 2010; Associate General Counsel, Bank of America from June 2005 to April 2010 | |
|
| Stephen T. Welsh (Born 1957) | |
|
225 Franklin Street
Boston, MA 02110
Vice President (since 2006) | | President and Director, Columbia Management Investment Services Corp. since May 2010; President and Director, Columbia Management Services, Inc. from July 2004 to April 2010; Managing Director, Columbia Management Distributors, Inc. from August 2007 to April 2010. | |
|
39
This page intentionally left blank.
40
Important Information About This Report
The fund mails one shareholder report to each shareholder address. If you would like more than one report, please call shareholder services at 1-800-345-6611 and additional reports will be sent to you. This report has been prepared for shareholders of Columbia Marsico 21st Century Fund.
A description of the policies and procedures that the fund uses to determine how to vote proxies and a copy of the fund's voting records are available (i) at www.columbiamanagement.com, (ii) on the Securities and Exchange Commission's website at www.sec.gov, and (iii) without charge, upon request, by calling 1-800-368-0346. Information regarding how the fund voted proxies relating to portfolio securities during the 12-month period ended June 30 is available from the SEC's website. Information regarding how the fund voted proxies relating to portfolio securities is also available from the fund's website, www.columbiamanagement.com.
The fund files a complete schedule of portfolio holdings with the SEC for the first and third quarters of each fiscal year on Form N-Q. The fund's Form N-Q is available on the SEC's website at www.sec.gov and may be reviewed and copied at the SEC's Public Reference Room in Washington, D.C. Information on the operation of the Public Reference Room may be obtained by calling 1-800-SEC-0330.
Transfer Agent
Columbia Management Investment
Services Corp.
P.O. Box 8081
Boston, MA 02266-8081
1-800-345-6611
Distributor
Columbia Management Investment
Distributors, Inc.
225 Franklin Street
Boston, MA 02110
Investment Manager
Columbia Management Investment Advisers, LLC
225 Franklin Street
Boston, MA 02110
41

Columbia Marsico 21st Century Fund
P. O. Box 8081
Boston, MA 02266-8081
columbiamanagement.com
This information is for use with concurrent or prior delivery of a fund prospectus. Investors should consider the investment objectives, risks, charges and expenses of a mutual fund carefully before investing. For a free prospectus, which contains this and other important information about the funds, visit columbiamanagement.com. Read the prospectus carefully before investing. The Fund is distributed by Columbia Management Investment Distributors, Inc., member FINRA, and managed by Columbia Management Investment Advisers, LLC.
© 2012 Columbia Management Investment Advisers, LLC. All rights reserved.
C-1231 C (4/12)

Columbia Marsico Focused Equities Fund
Annual Report for the Period Ended February 29, 2012
Not FDIC insured • No bank guarantee • May lose value
Table of Contents
| Fund Profile | | | 1 | | |
|
| Performance Information | | | 2 | | |
|
| Fund Expense Example | | | 3 | | |
|
| Portfolio Managers' Report | | | 4 | | |
|
| Portfolio of Investments | | | 6 | | |
|
Statement of Assets and
Liabilities | | | 11 | | |
|
| Statement of Operations | | | 13 | | |
|
Statement of Changes in
Net Assets | | | 14 | | |
|
| Financial Highlights | | | 16 | | |
|
| Notes to Financial Statements | | | 21 | | |
|
Report of Independent Registered
Public Accounting Firm | | | 31 | | |
|
| Federal Income Tax Information | | | 32 | | |
|
| Fund Governance | | | 33 | | |
|
Important Information About
This Report | | | 41 | | |
|
The views expressed in this report reflect the current views of the respective parties. These views are not guarantees of future performance and involve certain risks, uncertainties and assumptions that are difficult to predict, so actual outcomes and results may differ significantly from the views expressed. These views are subject to change at any time based upon economic, market or other conditions and the respective parties disclaim any responsibility to update such views. These views may not be relied on as investment advice and, because investment decisions for a Columbia Fund are based on numerous factors, may not be relied on as an indication of trading intent on behalf of any particular Columbia Fund. References to specific securities should not be construed as a recommendation or investment advice.
President's Message

Dear Shareholders,
Americans were dispirited in the fourth quarter of 2011 by Washington's inability to reach a plan for deficit reduction and Europe's piecemeal attempt to address its own fiscal issues. Yet, there was sufficient good news to encourage risk taking, buoying both stocks and bonds to solid gains.
U.S. economic data surprised on the upside and fears of recession abated. With the bar of expectations set low, investors responded positively to the announcement that the economy had expanded by 1.8% in the third quarter. Consumer confidence improved, even though consumers remain under pressure with no real increase in disposable income and a continued decline in household net worth. Headline inflation—which tracks a broad range of consumer expenditures, including food and energy—declined. Even manufacturing held its ground.
Against this backdrop, the U.S. equity markets logged solid returns. The S&P 500 Index gained 11.82%, moving into positive territory for the year with quarterly advances in all ten sectors. Mid- and small-cap stocks did even better. Value outperformed growth across all market capitalizations. Energy stocks led the market, as the price of oil moved above $100 a barrel in December. Industrials and materials stocks rose, buoyed by improving economic data. The U.S. fixed-income markets logged modest but solid returns. High-yield bonds were the best performers as the economy showed signs of improvement. Emerging market bonds were strong performers, as inflation came under control in key regions. Municipal bonds and Treasuries eked out only modest gains, as investors moved away from quality in favor of riskier assets.
While fourth quarter gains were encouraging, challenges still remain. Columbia Management, however, remains strong and steadfast. Columbia Management is the eighth largest manager of long-term mutual fund assets with $326 billion under management as of December 31, 2011. The past year has been one of considerable change for the organization as we worked diligently to align products, services and resources in the integration of Columbia Management with RiverSource Investments. The strong line-up of talent, resources and capabilities that has resulted is highlighted by the success of our products. As of December 31, 2011, Columbia Management offers 52 funds rated either 4 or 5 stars by Morningstar.*
For more information about these and other funds offered by Columbia Management, including detailed, up-to-date fund performance and portfolio information, please visit us online at columbiamanagement.com. Other information and resources available on our website include:
g timely economic analysis and market commentary
g quarterly fund commentaries
g Columbia Management Investor, a quarterly newsletter for shareholders
Thank you for your continued support of the Columbia Funds. We look forward to serving your investment needs for many years to come.
Best Regards,

J. Kevin Connaughton
President, Columbia Funds
*All ratings are based on Class Z shares as of 12/31/2011. Out of 119 Class Z share Columbia funds rated by Morningstar, 7 funds received a 5-star Overall Rating and 45 funds received a 4-star Overall Rating. The Overall Morningstar Rating for a retail mutual fund is derived from a weighted average of the performance figures associated with its 3-, 5- and 10-year (if applicable) Morningstar Rating metrics. For share classes that do not have a 3-, 5-, or 10-year actual performance history, the fund's independent Morningstar Rating metric is then compared against the retail mutual fund universe breakpoints to determine its hypothetical rating.
For each fund with at least a three-year history, Morningstar calculates a Morningstar RatingTM based on a Morningstar Risk-Adjusted Return measure that accounts for variation in a fund's monthly performance (including the effects of sales charges/loads, and redemption fees), placing more emphasis on downward variations and rewarding consistent performance. The top 10% of funds in each category receive 5 stars, the next 22.5% receive 4 stars, the next 35% receive 3 stars, the next 22.5% receive 2 stars and the bottom 10% receive 1 star. (Each share class is counted as a fraction of one fund within this scale and rated separately, which may cause slight variations in the distribution percentages.)
The Morningstar RatingTM is for Class Z shares only; other classes may have different performance characteristics and may have different ratings. ©2012 Morningstar, Inc. All Rights Reserved. The Morningstar information contained herein: (1) is proprietary to Morningstar and/or its content providers; (2) may not be copied or distributed; and (3) is not warranted to be accurate, complete or timely. Neither Morningstar nor its content providers are responsible for any damages or losses arising from any use of this information.
Investors should consider the investment objectives, risks, charges and expenses of a mutual fund carefully before investing. For a free prospectus, which contains this and other important information about the funds, visit columbiamanagement.com. The prospectus should be read carefully before investing.
Columbia Funds are distributed by Columbia Management Investment Distributors, Inc., member FINRA, and managed by Columbia Management Investment Advisers, LLC.
© 2012 Columbia Management Investment Advisers, LLC. All rights reserved.
Fund Profile – Columbia Marsico Focused Equities Fund
Summary
g For the 12-month period that ended February 29, 2012, the fund's Class A shares returned 4.26% without sales charge.
g The fund's benchmark, the S&P 500 Index, returned 5.12%.1
g The fund was underrepresented in the strongest performing sectors of the S&P 500 Index. Stock selection in the energy and materials sectors also detracted from results.
Portfolio Management
Thomas F. Marsico has managed the fund since December 1997 and is Chief Investment Officer of Marsico Capital Management, LLC (Marsico), investment subadviser to the fund. In 2010, A. Douglas Rao and Coralie Witter joined Thomas F. Marsico as co-managers of the fund.
Columbia Management Investment Advisers, LLC (the Investment Manager) retained Marsico to serve as investment subadviser to the Columbia Marsico funds. As an investment subadviser, Marsico makes the investment decisions and manages all or a portion of the fund. Marsico is an investment adviser registered with the Securities and Exchange Commission. Marsico is not affiliated with the Investment Manager.
1The Standard & Poor's (S&P) 500 Index tracks the performance of 500 widely held, large-capitalization U.S. stocks.
Indices are not available for investment, are not professionally managed and do not reflect sales charges, fees, brokerage commissions, taxes or other expenses of investing. Securities in the fund may not match those in an index.
Performance data quoted represents past performance and current performance may be lower or higher. Past performance is no guarantee of future results. The investment return and principal value will fluctuate so that shares, when redeemed, may be worth more or less than the original cost. Please visit www.columbiamanagement.com for daily and most recent month-end performance updates.
Summary
1-year return as of 02/29/12
| | | | +4.26% | |
|
|  | | | Class A shares
(without sales charge) | |
|
| | | | +5.12% | |
|
|  | | | S&P 500 Index | |
|
Morningstar Style BoxTM

The Morningstar Style BoxTM is based on the fund's portfolio holdings. For equity funds, the vertical axis shows the market capitalization of the stocks owned, and the horizontal axis shows investment style (value, blend, or growth). Information shown is based on the most recent data provided by Morningstar.
© 2012 Morningstar, Inc. All rights reserved. The Morningstar information contained herein: (1) is proprietary to Morningstar and/or its content providers; (2) may not be copied or distributed; and (3) is not warranted to be accurate, complete or timely. Neither Morningstar nor its content providers are responsible for any damages or losses arising from any use of this information.
1
Performance Information – Columbia Marsico Focused Equities Fund
Performance data quoted represents past performance and current performance may be lower or higher. Past performance is no guarantee of future results. The investment return and principal value will fluctuate so that shares, when redeemed, may be worth more or less than the original cost. Please visit www.columbiamanagement.com for daily and most recent month-end performance updates.
Performance of a $10,000 investment 03/01/02 – 02/29/12
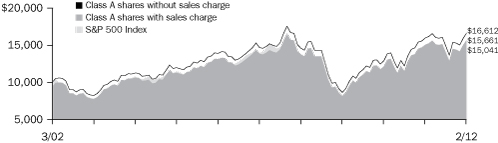
The chart above shows the change in value of a hypothetical $10,000 investment in Class A shares of Columbia Marsico Focused Equities Fund during the stated time period, and does not reflect the deduction of taxes that a shareholder may pay on fund distributions or on the redemption of fund shares.
Performance of a $10,000 investment 03/01/02 – 02/29/12 ($)
| Sales charge | | without | | with | |
| Class A | | | 16,612 | | | | 15,661 | | |
| Class B | | | 15,400 | | | | 15,400 | | |
| Class C | | | 15,413 | | | | 15,413 | | |
| Class I* | | | 16,773 | | | | n/a | | |
| Class Z | | | 17,027 | | | | n/a | | |
Average annual total return as of 02/29/12 (%)
| Share class | | A | | B | | C | | I* | | Z | |
| Inception | | 12/31/97 | | 12/31/97 | | 12/31/97 | | 09/27/10 | | 12/31/97 | |
| Sales charge | | without | | with | | without | | with | | without | | with | | without | | without | |
| 1-year | | | 4.26 | | | | –1.76 | | | | 3.44 | | | | –1.56 | | | | 3.47 | | | | 2.49 | | | | 5.04 | | | | 4.51 | | |
| 5-year | | | 2.57 | | | | 1.36 | | | | 1.80 | | | | 1.43 | | | | 1.81 | | | | 1.81 | | | | 2.77 | | | | 2.84 | | |
| 10-year | | | 5.21 | | | | 4.59 | | | | 4.41 | | | | 4.41 | | | | 4.42 | | | | 4.42 | | | | 5.31 | | | | 5.47 | | |
The "with sales charge" returns include the maximum initial sales charge of 5.75% for Class A shares and the applicable contingent deferred sales charge of 5.00% in the first year, declining to 1.00% in the sixth year and eliminated thereafter for Class B shares and 1.00% for Class C shares for the first year only. The "without sales charge" returns do not include the effect of sales charges. If they had, returns would be lower.
Performance results reflect any fee waivers or reimbursements of fund expenses by the Columbia Management Investment Advisers, LLC and/or any of its affiliates. Absent these fee waivers or expense reimbursement arrangements, performance results would have been lower.
All results shown assume the reinvestment of distributions. Class I shares and Class Z shares are sold at net asset value with no distribution and service (Rule 12b-1) fees. Class I shares and Class Z shares have limited eligibility and the investment minimum requirements may vary. Please see the fund's prospectuses for details. Performance for different share classes will vary based on differences in sales charges and fees associated with each class.
The tables do not reflect the deduction of taxes that a shareholder may pay on fund distributions or on the redemption of fund shares.
*The returns shown for periods prior to the share class inception date (including returns since inception, which are since fund inception) include the returns of the fund's Class A shares, the fund's oldest share class. These returns are adjusted to reflect any higher class-related operating expenses of the newer share classes, as applicable. Please visit columbiamanagement.com/mutual-funds/appended-performance for more information.
2
Fund Expense Example – Columbia Marsico Focused Equities Fund
As an investor, you incur two types of costs. There are transaction costs, which generally include sales charges on purchases and may include redemption fees. There are also ongoing costs, which generally include management fees, distribution and service (Rule 12b-1) fees, and other fund expenses. The following information is intended to help you understand your ongoing costs (in dollars) of investing in the Fund and to help you compare these costs with the ongoing costs of investing in other mutual funds.
Analyzing your fund's expenses
To illustrate these ongoing costs, we have provided examples and calculated the expenses paid by investors in each share class of the Fund during the period. The actual and hypothetical information in the table is based on an initial investment of $1,000 at the beginning of the period indicated and held for the entire period. Expense information is calculated two ways and each method provides you with different information. The amount listed in the "Actual" column is calculated using the Fund's actual operating expenses and total return for the period. You may use the Actual information, together with the amount invested, to estimate the expenses that you paid over the period. Simply divide your account value by $1,000 (for example, an $8,600 account value divided by $1,000 = 8.6), then multiply the results by the expenses paid during the period under the Actual column. The amount listed in the "Hypothetical" column assumes a 5% annual rate of return before expenses (which is not the Fund's actual return) and then applies the Fund's actual expense ratio for the period to the hypothetical return. You should not use the hypothetical account values and expenses to estimate either your actual account balance at the end of the period or the expenses you paid during the period. See "Compare with other funds" below for details on how to use the hypothetical data.
Compare with other funds
Since all mutual funds are required to include the same hypothetical calculations about expenses in shareholder reports, you can use this information to compare the ongoing cost of investing in the Fund with other funds. To do so, compare the hypothetical example with the 5% hypothetical examples that appear in the shareholder reports of other funds. As you compare hypothetical examples of other funds, it is important to note that hypothetical examples are meant to highlight the ongoing costs of investing in a fund only and do not reflect any transaction costs, such as sales charges, or redemption or exchange fees. Therefore, the hypothetical calculations are useful in comparing ongoing costs only, and will not help you determine the relative total costs of owning different funds. If transaction costs were included in these calculations, your costs would be higher.
09/01/11 – 02/29/12
| | | Account value at the
beginning of the period ($) | | Account value at the
end of the period ($) | | Expenses paid
during the period ($) | | Fund's annualized
expense ratio (%) | |
| | | Actual | | Hypothetical | | Actual | | Hypothetical | | Actual | | Hypothetical | | Actual | |
| Class A | | | 1,000.00 | | | | 1,000.00 | | | | 1,119.70 | | | | 1,017.85 | | | | 7.43 | | | | 7.07 | | | | 1.41 | | |
| Class B | | | 1,000.00 | | | | 1,000.00 | | | | 1,115.40 | | | | 1,014.02 | | | | 11.47 | | | | 10.92 | | | | 2.18 | | |
| Class C | | | 1,000.00 | | | | 1,000.00 | | | | 1,115.50 | | | | 1,014.12 | | | | 11.36 | | | | 10.82 | | | | 2.16 | | |
| Class I | | | 1,000.00 | | | | 1,000.00 | | | | 1,122.80 | | | | 1,020.39 | | | | 4.75 | | | | 4.52 | | | | 0.90 | | |
| Class Z | | | 1,000.00 | | | | 1,000.00 | | | | 1,121.00 | | | | 1,019.14 | | | | 6.06 | | | | 5.77 | | | | 1.15 | | |
Expenses paid during the period are equal to the annualized expense ratio for each class as indicated above, multiplied by the average account value over the period and then multiplied by the number of days in the Fund's most recent fiscal half year and divided by 366.
Expenses do not include fees and expenses incurred indirectly by the Fund from the underlying funds in which the Fund may invest (also referred to as "acquired funds"), including affiliated and non-affiliated pooled investments vehicles (including mutual funds and exchange traded funds).
3
Portfolio Managers' Report – Columbia Marsico Focused Equities Fund
Performance data quoted represents past performance and current performance may be lower or higher. Past performance is no guarantee of future results. The investment return and principal value will fluctuate so that shares, when redeemed, may be worth more or less than the original cost. Please visit www.columbiamanagement.com for daily and most recent month-end performance updates.
Net asset value per share
as of 02/29/12 ($)
| Class A | | | 24.18 | | |
| Class B | | | 21.88 | | |
| Class C | | | 21.96 | | |
| Class I | | | 24.81 | | |
| Class Z | | | 24.73 | | |
Distributions declared per share
03/01/11 – 02/29/12 ($)
| Class A | | | 0.32 | | |
| Class B | | | 0.31 | | |
| Class C | | | 0.31 | | |
| Class I | | | 0.40 | | |
| Class Z | | | 0.37 | | |
For the 12-month period that ended February 29, 2012, the fund's Class A shares returned 4.26% without sales charge. The fund's benchmark, the S&P 500 Index, returned 5.12%. Stock selection and an overweight in the consumer discretionary sector aided results, as did a reduction in the fund's stake in the financials sector. However, overall sector allocations detracted from performance, as the fund had lower exposure to the best-performing sectors of the S&P 500. Several energy and materials holdings hurt results as well.
U.S. economy picks up momentum
During the first half of the 12-month period, a series of natural disasters in Japan, Europe's debt problems and wrangling in Washington over the federal budget and the national debt dominated world headlines. U.S. economic news was lackluster and job growth was disappointing. However, the pace of growth picked up in the second half of the period and, as fears of a lapse back into recession faded, prospects brightened. Consumer confidence improved even though consumers remain under pressure, with no real increase in disposable income and a continued decline in household net worth. The labor markets added more than a million new jobs from September 2011 through February 2012, and the jobless rate fell to 8.3%. A modest slowdown in manufacturing activity late in the summer of 2011 raised concern that this lynchpin of the recovery was ready to turn downward. However, manufacturing activity stabilized and the manufacturing expansion continued into 2012. Housing continues to be the one nagging weak spot in the economy. Yet, home sales edged modestly higher over the year, and there is hope that a bottom in the housing market is in sight.
Sector positioning, stock selection detract
Against this economic backdrop, the fund had few investments in the three strongest-performing sectors of the S&P 500 Index: utilities, consumer staples and health care. This positioning hurt performance. In addition, a number of individual stocks in the energy and materials sectors were disappointing. In the latter, oil field service provider Halliburton (2.7% of net assets) and natural gas and oil firm EOG Resources posted double-digit negative returns. We sold EOG Resources from the portfolio. The prospects of slower global economic growth put downward pressure on the stock prices of many materials companies. Fund holdings Freeport-McMoRan Copper & Gold and Dow Chemical (1.2% and 2.4% of net assets, respectively) both succumbed to steep price declines. In the health care sector, Agilent Technologies, the world's largest test and measurement firm, had a negative return and was sold from the fund.
Stock selection and consumer discretionary exposure positive
Stock selection in the information technology and industrials sectors benefited fund performance. Within information technology, financial transactions processor Visa, Chinese internet search company Baidu and consumer electronics firm Apple (4.0%, 3.6% and 8.2% of net assets, respectively) each appreciated significantly. In industrials, Goodrich, which is among the world's largest suppliers of components and services to the aviation markets, engine company Cummins (3.3% of net assets) and Union Pacific, the largest public railroad in the US (2.9% of net assets) were strong contributors to performance. We sold Goodrich from the portfolio.
Fund results benefited from both an overweight position in the consumer discretionary sector (a strong performer in the S&P 500 Index) and from stock selection in that sector. Specialty coffee retailer Starbucks, restaurant operator Chipotle Mexican Grill
4
Portfolio Managers' Report (continued) – Columbia Marsico Focused Equities Fund
and online travel reservations company priceline.com (3.7%, 2.1% and 3.4% of net assets, respectively) were notably strong performers.
We viewed the regulatory climate for the financial services sector as becoming considerably more complex and significantly reduced the fund's allocation to the area during the period. This decision aided performance as the sector was the weakest performer in the S&P 500 Index.
Portfolio activity
During the 12-month period, we undertook a number of steps aimed at reducing the fund's emphasis on economically-sensitive companies. We pared exposure to industrials, materials and the commodity complex and pulled back significantly from financial stocks. We increased investments in companies that we believe have durable franchises with dependable revenue streams that we think are capable of compounding their earnings growth even in a choppy economic environment. These companies span a variety of industries but share several common factors, such as an established global footprint, high quality assets, solid top-line unit growth and an ability to gain market share.
Looking ahead
By the end of the period, we sought to position the portfolio to reflect uncertainty in Europe balanced against a more constructive scenario in which the euro zone stabilizes and global growth is reaccelerated. Hence, a number of holdings are more defensive in nature, with business models that have proven to be less susceptible to adverse macroeconomic conditions and with the potential for generating solid top-line growth and dependable revenues. Another segment of the portfolio is represented by cyclical companies that should benefit if the euro zone moves closer to a solution and global economic conditions continue to improve. A final segment of the portfolio consists of stocks selected from a purely bottom-up perspective, which we view as unique stories and compelling investments.
Source for all statistical data—Columbia Management Investment Advisers, LLC.
Source for all stock-specific commentary—Marsico Capital Management, LLC.
Portfolio characteristics and holdings are subject to change periodically and may not be representative of current characteristics and holdings. The outlook for this fund may differ from those presented for other Columbia Funds.
Equity securities are subject to stock market fluctuations that occur in response to economic and business developments.
The fund normally invests in a core portfolio of 20-30 common stocks. By maintaining a relatively concentrated portfolio, the fund may be subject to a greater risk than a fund that is more fully diversified.
International investing involves special risks, including foreign taxation, currency fluctuations, risks associated with possible differences in financial standards and other risks associated with future political and economic developments.
Investing in emerging markets may involve greater risks than investing in more developed countries. In addition, concentration of investments in a single region may result in greater volatility.
Portfolio Breakdown1
as of 02/29/12 (%)
| Consumer Discretionary | | | 30.1 | | |
| Consumer Staples | | | 3.0 | | |
| Energy | | | 9.3 | | |
| Financials | | | 7.3 | | |
| Health Care | | | 8.2 | | |
| Industrials | | | 8.6 | | |
| Information Technology | | | 22.7 | | |
| Materials | | | 6.2 | | |
| Other2 | | | 4.6 | | |
1Percentages indicated are based upon total investments (excluding Investments of Cash Collateral Received for Securities on Loan). The Fund's composition is subject to change.
2Includes investments in affiliated money market fund.
Top Ten Holdings1
as of 02/29/12 (%)
| Apple, Inc. | | | 8.4 | | |
| Visa, Inc., Class A | | | 4.1 | | |
| Wynn Resorts Ltd. | | | 4.0 | | |
| Nike, Inc., Class B | | | 3.9 | | |
| Starbucks Corp. | | | 3.8 | | |
| Baidu, Inc., ADR | | | 3.7 | | |
| priceline.com, Inc. | | | 3.5 | | |
| Allergan, Inc. | | | 3.4 | | |
| QUALCOMM, Inc. | | | 3.4 | | |
| Cummins, Inc. | | | 3.4 | | |
1Percentages indicated are based upon total investments (excluding Investments of Cash Collateral Received for Securities on Loan and affiliated money market fund).
Because the fund is actively managed, there is no guarantee the fund will continue to maintain the holdings breakdown listed.
The fund's holdings and their weights within the portfolio may change as market conditions change.
5
Portfolio of Investments – Columbia Marsico Focused Equities Fund
February 29, 2012
(Percentages represent value of investments compared to net assets)
| Issuer | | Shares | | Value | |
| Common Stocks 97.4% | |
| CONSUMER DISCRETIONARY 30.8% | |
| Automobiles 0.7% | |
| Tesla Motors, Inc.(a)(b) | | | 508,567 | | | $ | 16,991,223 | | |
| Hotels, Restaurants & Leisure 12.2% | |
| Chipotle Mexican Grill, Inc.(a)(b) | | | 134,970 | | | | 52,667,993 | | |
| McDonald's Corp. | | | 622,478 | | | | 61,799,616 | | |
| Starbucks Corp. | | | 1,858,665 | | | | 90,256,773 | | |
| Wynn Resorts Ltd. | | | 804,184 | | | | 95,327,971 | | |
| Total | | | 300,052,353 | | |
| Internet & Catalog Retail 3.5% | |
| priceline.com, Inc.(b) | | | 134,794 | | | | 84,518,534 | | |
| Media 4.9% | |
| British Sky Broadcasting Group PLC | | | 4,314,867 | | | | 45,992,298 | | |
| Time Warner, Inc. | | | 1,971,857 | | | | 73,372,799 | | |
| Total | | | 119,365,097 | | |
| Multiline Retail 2.4% | |
| Dollar General Corp.(b) | | | 1,423,212 | | | | 59,860,297 | | |
| Specialty Retail 3.3% | |
| Home Depot, Inc. (The) | | | 1,378,542 | | | | 65,577,243 | | |
| TJX Companies, Inc. | | | 399,994 | | | | 14,643,780 | | |
| Total | | | 80,221,023 | | |
| Textiles, Apparel & Luxury Goods 3.8% | |
| Nike, Inc., Class B | | | 862,092 | | | | 93,036,969 | | |
| TOTAL CONSUMER DISCRETIONARY | | | 754,045,496 | | |
| CONSUMER STAPLES 3.1% | |
| Food Products 3.1% | |
| Mead Johnson Nutrition Co. | | | 968,929 | | | | 75,334,230 | | |
| TOTAL CONSUMER STAPLES | | | 75,334,230 | | |
| ENERGY 9.5% | |
| Energy Equipment & Services 2.7% | |
| Halliburton Co. | | | 1,816,561 | | | | 66,467,967 | | |
| Oil, Gas & Consumable Fuels 6.8% | |
| Anadarko Petroleum Corp. | | | 492,901 | | | | 41,462,832 | | |
| Kinder Morgan, Inc.(a) | | | 1,355,973 | | | | 47,784,488 | | |
| Occidental Petroleum Corp. | | | 743,805 | | | | 77,630,928 | | |
| Total | | | 166,878,248 | | |
| TOTAL ENERGY | | | 233,346,215 | | |
| FINANCIALS 7.4% | |
| Commercial Banks 4.8% | |
| U.S. Bancorp | | | 1,905,626 | | | | 56,025,404 | | |
| Wells Fargo & Co. | | | 1,975,319 | | | | 61,807,732 | | |
| Total | | | 117,833,136 | | |
| Consumer Finance 2.6% | |
| American Express Co. | | | 1,215,541 | | | | 64,289,963 | | |
| TOTAL FINANCIALS | | | 182,123,099 | | |
| HEALTH CARE 8.4% | |
| Biotechnology 3.2% | |
| Biogen Idec, Inc.(b) | | | 673,689 | | | | 78,464,558 | | |
| Issuer | | Shares | | Value | |
| Common Stocks (continued) | |
| HEALTH CARE (cont.) | |
| Pharmaceuticals 5.2% | |
| Allergan, Inc. | | | 898,990 | | | $ | 80,540,514 | | |
| Bristol-Myers Squibb Co. | | | 1,413,900 | | | | 45,485,163 | | |
| Total | | | 126,025,677 | | |
| TOTAL HEALTH CARE | | | 204,490,235 | | |
| INDUSTRIALS 8.7% | |
| Aerospace & Defense 2.5% | |
| Precision Castparts Corp. | | | 373,088 | | | | 62,466,124 | | |
| Machinery 3.3% | |
| Cummins, Inc.(a) | | | 663,387 | | | | 79,984,570 | | |
| Road & Rail 2.9% | |
| Union Pacific Corp. | | | 648,200 | | | | 71,464,050 | | |
| TOTAL INDUSTRIALS | | | 213,914,744 | | |
| INFORMATION TECHNOLOGY 23.2% | |
| Communications Equipment 3.3% | |
| QUALCOMM, Inc. | | | 1,289,456 | | | | 80,178,374 | | |
| Computers & Peripherals 8.2% | |
| Apple, Inc.(b) | | | 370,664 | | | | 201,062,980 | | |
| Internet Software & Services 5.8% | |
| Baidu, Inc., ADR(b) | | | 637,401 | | | | 87,132,716 | | |
| Google, Inc., Class A(b) | | | 88,779 | | | | 54,887,617 | | |
| Total | | | 142,020,333 | | |
| IT Services 5.9% | |
| Accenture PLC, Class A | | | 798,038 | | | | 47,515,183 | | |
| Visa, Inc., Class A | | | 838,587 | | | | 97,586,369 | | |
| Total | | | 145,101,552 | | |
| TOTAL INFORMATION TECHNOLOGY | | | 568,363,239 | | |
| MATERIALS 6.3% | |
| Chemicals 5.1% | |
| Dow Chemical Co. (The) | | | 1,758,793 | | | | 58,937,153 | | |
| Monsanto Co. | | | 838,181 | | | | 64,858,446 | | |
| Total | | | 123,795,599 | | |
| Metals & Mining 1.2% | |
| Freeport-McMoRan Copper & Gold, Inc. | | | 716,433 | | | | 30,491,389 | | |
| TOTAL MATERIALS | | | 154,286,988 | | |
Total Common Stocks
(Cost: $1,794,035,388) | | $ | 2,385,904,246 | | |
| Money Market Funds 4.7% | |
Columbia Short-Term Cash Fund,
0.166%(c)(d) | | | 115,542,763 | | | | 115,542,763 | | |
Total Money Market Funds
(Cost: $115,542,763) | | $ | 115,542,763 | | |
The Accompanying Notes to Financial Statements are an integral part of this statement.
6
Columbia Marsico Focused Equities Fund
February 29, 2012
(Percentages represent value of investments compared to net assets)
| Issuer | | Effective
Yield | | Principal | | Value | |
| Investments of Cash Collateral Received for Securities on Loan 5.6% | |
| Asset-Backed Commercial Paper 0.9% | |
Antalis US Funding Corp.
03/01/12 | | | 0.350 | % | | $ | 7,999,456 | | | $ | 7,999,456 | | |
Rhein-Main Securitisation Ltd.
05/14/12 | | | 0.822 | % | | | 4,990,661 | | | | 4,990,661 | | |
Tasman Funding, Inc.
03/23/12 | | | 0.320 | % | | | 4,998,711 | | | | 4,998,711 | | |
| Total | | | 17,988,828 | | |
| Certificates of Deposit 1.0% | |
ABM AMRO Bank N.V.
03/21/12 | | | 0.310 | % | | | 4,998,752 | | | | 4,998,752 | | |
Australia and New Zealand Bank Group, Ltd.
03/09/12 | | | 0.500 | % | | | 3,000,000 | | | | 3,000,000 | | |
FMS Wertmanagement Anstalt Des Oeffentlichen Rechts
03/09/12 | | | 0.330 | % | | | 1,500,000 | | | | 1,500,000 | | |
Hong Kong Shanghai Bank Corp., Ltd.
03/12/12 | | | 0.250 | % | | | 2,000,000 | | | | 2,000,000 | | |
Mitsubishi UFJ Trust and Banking Corp.
05/31/12 | | | 0.390 | % | | | 5,000,064 | | | | 5,000,064 | | |
National Australia Bank
08/16/12 | | | 0.344 | % | | | 3,000,000 | | | | 3,000,000 | | |
Skandinaviska Enskilda Banken
04/16/12 | | | 0.360 | % | | | 3,000,000 | | | | 3,000,000 | | |
Standard Chartered Bank PLC
03/05/12 | | | 0.630 | % | | | 3,000,000 | | | | 3,000,000 | | |
| Total | | | 25,498,816 | | |
| Commercial Paper 0.5% | |
Skandinaviska Enskilda Banken AB
03/27/12 | | | 0.400 | % | | | 1,998,644 | | | | 1,998,644 | | |
Societe Generale
03/06/12 | | | 0.320 | % | | | 4,999,689 | | | | 4,999,689 | | |
State Development Bank of NorthRhine-Westphalia
03/13/12 | | | 0.240 | % | | | 3,999,227 | | | | 3,999,227 | | |
| Total | | | 10,997,560 | | |
| Issuer | | Effective
Yield | | Principal | | Value | |
| Investments of Cash Collateral Received for Securities on Loan (continued) | |
| Repurchase Agreements 3.2% | |
Citigroup Global Markets, Inc.(e)
dated 02/29/12, matures 03/01/12,
repurchase price $5,000,018 | | | 0.130 | % | | $ | 5,000,000 | | | $ | 5,000,000 | | |
| repurchase price $10,000,036 | | | 0.130 | % | | | 10,000,000 | | | | 10,000,000 | | |
Credit Suisse Securities (USA) LLC
dated 02/29/12, matures 03/01/12,
repurchase price $11,722,359(e) | | | 0.160 | % | | | 11,722,307 | | | | 11,722,307 | | |
Mizuho Securities USA, Inc.
dated 02/29/12, matures 03/01/12,
repurchase price $15,000,092(e) | | | 0.220 | % | | | 15,000,000 | | | | 15,000,000 | | |
Morgan Stanley
dated 02/29/12, matures 03/01/12,
repurchase price $5,000,025(e) | | | 0.180 | % | | | 5,000,000 | | | | 5,000,000 | | |
Natixis Financial Products, Inc.
dated 02/29/12, matures 03/01/12,
repurchase price $12,000,073(e) | | | 0.220 | % | | | 12,000,000 | | | | 12,000,000 | | |
RBS Securities, Inc.(e)
dated 02/29/12, matures 03/01/12,
repurchase price $10,000,056 | | | 0.200 | % | | | 10,000,000 | | | | 10,000,000 | | |
Societe Generale(e)
dated 02/29/12, matures 03/01/12,
repurchase price $10,000,053 | | | 0.190 | % | | | 10,000,000 | | | | 10,000,000 | | |
| Total | | | 78,722,307 | | |
Total Investments of Cash Collateral Received for Securities
on Loan
(Cost: $133,207,511) | | $ | 133,207,511 | | |
Total Investments
(Cost: $2,042,785,662) | | | | | | $ | 2,634,654,520 | | |
| Other Assets & Liabilities, Net | | | | | | | (182,863,353 | ) | |
| Net Assets | | $ | 2,451,791,167 | | |
| Notes to Portfolio of Investments | |
(a) At February 29, 2012, security was partially or fully on loan.
(b) Non-income producing.
(c) The rate shown is the seven-day current annualized yield at February 29, 2012.
(d) Investments in affiliates during the year ended February 29, 2012:
| Issuer | | Beginning
Cost | | Purchase | | Sales
Proceeds | | Realized
Gain/Loss | | Ending
Cost | | Dividends | | Value | |
Columbia Short-Term
Cash Fund | | $ | — | | | $ | 847,604,335 | | | $ | (732,061,572 | ) | | $ | — | | | $ | 115,542,763 | | | $ | 109,502 | | | $ | 115,542,763 | | |
The Accompanying Notes to Financial Statements are an integral part of this statement.
7
Columbia Marsico Focused Equities Fund
February 29, 2012
| Notes to Portfolio of Investments (continued) | |
(e) The table below represents securities received as collateral for repurchase agreements. This collateral is deposited with the Fund's custodian and, pursuant to the terms of the repurchase agreement, must have an aggregate market value greater than or equal to the repurchase price plus accrued interest at all times. The value of securities and/or cash held as collateral for repurchase agreements is monitored on a daily basis to ensure the proper level of collateral.
Citigroup Global Markets, Inc. (0.130%)
| Security Description | | Value | |
| Fannie Mae REMICS | | $ | 2,392,734 | | |
| Fannie Mae-Aces | | | 264,929 | | |
| Freddie Mac REMICS | | | 1,919,413 | | |
| Government National Mortgage Association | | | 522,924 | | |
| Total Market Value of Collateral Securities | | $ | 5,100,000 | | |
Citigroup Global Markets, Inc. (0.130%)
| Security Description | | Value | |
| Fannie Mae REMICS | | $ | 4,785,468 | | |
| Fannie Mae-Aces | | | 529,857 | | |
| Freddie Mac REMICS | | | 3,838,826 | | |
| Government National Mortgage Association | | | 1,045,849 | | |
| Total Market Value of Collateral Securities | | $ | 10,200,000 | | |
Credit Suisse Securities (USA) LLC (0.160%)
| Security Description | | Value | |
| Ginnie Mae I Pool | | $ | 8,392,033 | | |
| Ginnie Mae II Pool | | | 3,564,747 | | |
| Total Market Value of Collateral Securities | | $ | 11,956,780 | | |
Mizuho Securities USA, Inc. (0.220%)
| Security Description | | Value | |
| Fannie Mae Pool | | $ | 4,846,025 | | |
| Freddie Mac Gold Pool | | | 79,288 | | |
| Freddie Mac REMICS | | | 896,570 | | |
| Ginnie Mae I Pool | | | 6,003,995 | | |
| Ginnie Mae II Pool | | | 2,863,894 | | |
| Government National Mortgage Association | | | 610,228 | | |
| Total Market Value of Collateral Securities | | $ | 15,300,000 | | |
Morgan Stanley (0.180%)
| Security Description | | Value | |
| Freddie Mac Gold Pool | | $ | 2,725,246 | | |
| Freddie Mac Non Gold Pool | | | 2,374,754 | | |
| Total Market Value of Collateral Securities | | $ | 5,100,000 | | |
Natixis Financial Products, Inc. (0.220%)
| Security Description | | Value | |
| Fannie Mae Pool | | $ | 603,681 | | |
| Fannie Mae REMICS | | | 4,496,013 | | |
| Freddie Mac Gold Pool | | | 552,722 | | |
| Freddie Mac REMICS | | | 2,651,066 | | |
| Government National Mortgage Association | | | 791,339 | | |
| United States Treasury Note/Bond | | | 3,145,254 | | |
| Total Market Value of Collateral Securities | | $ | 12,240,075 | | |
The Accompanying Notes to Financial Statements are an integral part of this statement.
8
Columbia Marsico Focused Equities Fund
February 29, 2012
| Notes to Portfolio of Investments (continued) | |
RBS Securities, Inc. (0.200%)
| Security Description | | Value | |
| United States Treasury Note/Bond | | $ | 10,200,038 | | |
| Total Market Value of Collateral Securities | | $ | 10,200,038 | | |
Societe Generale (0.190%)
| Security Description | | Value | |
| Fannie Mae REMICS | | $ | 2,591,448 | | |
| Freddie Mac REMICS | | | 3,932,796 | | |
| Freddie Mac Strips | | | 257,306 | | |
| Government National Mortgage Association | | | 3,418,450 | | |
| Total Market Value of Collateral Securities | | $ | 10,200,000 | | |
| Abbreviation Legend | |
ADR American Depositary Receipt
Generally accepted accounting principles (GAAP) require disclosure regarding the inputs and valuation techniques used to measure fair value and any changes in valuation inputs or techniques. In addition, investments shall be disclosed by major category.
The Fund categorizes its fair value measurements according to a three-level hierarchy that maximizes the use of observable inputs and minimizes the use of unobservable inputs by prioritizing that the most observable input be used when available. Observable inputs are those that market participants would use in pricing an investment based on market data obtained from sources independent of the reporting entity. Unobservable inputs are those that reflect the Fund's assumptions about the information market participants would use in pricing an investment. An investment's level within the fair value hierarchy is based on the lowest level of any input that is deemed significant to the asset or liability's fair value measurement. The input levels are not necessarily an indication of the risk or liquidity associated with investments at that level. For example, certain U.S. government securities are generally high quality and liquid, however, they are reflected as Level 2 because the inputs used to determine fair value may not always be quoted prices in an active market.
Fair value inputs are summarized in the three broad levels listed below:
• Level 1 — Valuations based on quoted prices for investments in active markets that the Fund has the ability to access at the measurement date (including NAV for open-end mutual funds). Valuation adjustments are not applied to Level 1 investments.
• Level 2 — Valuations based on other significant observable inputs (including quoted prices for similar securities, interest rates, prepayment speeds, credit risks, etc.).
• Level 3 — Valuations based on significant unobservable inputs (including the Fund's own assumptions and judgment in determining the fair value of investments).
Inputs that are used in determining fair value of an investment may include price information, credit data, volatility statistics, and other factors. These inputs can be either observable or unobservable. The availability of observable inputs can vary between investments, and is affected by various factors such as the type of investment, and the volume and level of activity for that investment or similar investments in the marketplace. The inputs will be considered by the Investment Manager, along with any other relevant factors in the calculation of an investment's fair value. The Fund uses prices and inputs that are current as of the measurement date, which may include periods of market dislocations. During these periods, the availability of prices and inputs may be reduced for many investments. This condition could cause an investment to be reclassified between the various levels within the hierarchy.
Foreign equity securities actively traded in markets where there is a significant delay in the local close relative to the New York Stock Exchange (NYSE) are classified as Level 2. The values of these securities may include an adjustment to reflect the impact of significant market movements following the close of local trading, as described in Note 2 to the financial statements—Security Valuation.
Investments falling into the Level 3 category are primarily supported by quoted prices from brokers and dealers participating in the market for those investments. However, these may be classified as Level 3 investments due to lack of market transparency and corroboration to support these quoted prices. Additionally, valuation models may be used as the pricing source for any remaining investments classified as Level 3. These models rely on one or more significant unobservable inputs and/or significant assumptions by the Investment Manager. Inputs used in valuations may include, but are not limited to, financial statement analysis, capital account balances, discount rates and estimated cash flows, and comparable company data.
The Accompanying Notes to Financial Statements are an integral part of this statement.
9
Columbia Marsico Focused Equities Fund
February 29, 2012
| Fair Value Measurements (continued) | |
The following table is a summary of the inputs used to value the Fund's investments as of February 29, 2012:
| | | Fair value at February 29, 2012 | |
| Description(a) | | Level 1
quoted prices
in active
markets for
identical assets | | Level 2
other
significant
observable
inputs | | Level 3
significant
unobservable
inputs | | Total(b) | |
| Equity Securities | |
| Common Stocks | |
| Consumer Discretionary | | $ | 708,053,198 | | | $ | 45,992,298 | | | $ | — | | | $ | 754,045,496 | | |
| Consumer Staples | | | 75,334,230 | | | | — | | | | — | | | | 75,334,230 | | |
| Energy | | | 233,346,215 | | | | — | | | | — | | | | 233,346,215 | | |
| Financials | | | 182,123,099 | | | | — | | | | — | | | | 182,123,099 | | |
| Health Care | | | 204,490,235 | | | | — | | | | — | | | | 204,490,235 | | |
| Industrials | | | 213,914,744 | | | | — | | | | — | | | | 213,914,744 | | |
| Information Technology | | | 568,363,239 | | | | — | | | | — | | | | 568,363,239 | | |
| Materials | | | 154,286,988 | | | | — | | | | — | | | | 154,286,988 | | |
| Total Equity Securities | | | 2,339,911,948 | | | | 45,992,298 | | | | — | | | | 2,385,904,246 | | |
| Other | |
| Money Market Funds | | | 115,542,763 | | | | — | | | | — | | | | 115,542,763 | | |
| Investments of Cash Collateral Received for Securities on Loan | | | — | | | | 133,207,511 | | | | — | | | | 133,207,511 | | |
| Total Other | | | 115,542,763 | | | | 133,207,511 | | | | — | | | | 248,750,274 | | |
| Total | | $ | 2,455,454,711 | | | $ | 179,199,809 | | | $ | — | | | $ | 2,634,654,520 | | |
The Fund's assets assigned to the Level 2 input category are generally valued using the market approach, in which a security's value is determined through reference to prices and information from market transactions for similar or identical assets. These assets include certain foreign securities for which a third party statistical pricing service may be employed for purposes of fair market valuation. The models utilized by the third party statistical pricing service take into account a security's correlation to available market data including, but not limited to, intraday index, ADR, and ETF movements.
(a) See the Portfolio of Investments for all investment classifications not indicated in the table.
(b) There were no significant transfers between Levels 1 and 2 during the period.
The Accompanying Notes to Financial Statements are an integral part of this statement.
10
Statement of Assets and Liabilities – Columbia Marsico Focused Equities Fund
February 29, 2012
| Assets | |
| Investments, at value* | |
| Unaffiliated issuers (identified cost $1,794,035,388) | | $ | 2,385,904,246 | | |
| Affiliated issuers (identified cost $115,542,763) | | | 115,542,763 | | |
| Investment of cash collateral received for securities on loan | |
| Short-term securities (identified cost $54,485,204) | | | 54,485,204 | | |
| Repurchase agreements (identified cost $78,722,307) | | | 78,722,307 | | |
| Total investments (identified cost $2,042,785,662) | | | 2,634,654,520 | | |
| Foreign currency (identified cost $36) | | | 37 | | |
| Receivable for: | |
| Investments sold | | | 8,430,568 | | |
| Capital shares sold | | | 3,863,482 | | |
| Dividends | | | 2,756,200 | | |
| Interest | | | 476,801 | | |
| Prepaid expense | | | 15,735 | | |
| Other assets | | | 3,296 | | |
| Total assets | | | 2,650,200,639 | | |
| Liabilities | |
| Due upon return of securities on loan | | | 133,207,511 | | |
| Payable for: | |
| Investments purchased | | | 59,097,170 | | |
| Capital shares purchased | | | 5,181,988 | | |
| Investment management fees | | | 44,507 | | |
| Distribution and service fees | | | 15,673 | | |
| Transfer agent fees | | | 447,952 | | |
| Administration fees | | | 14,817 | | |
| Other expenses | | | 399,854 | | |
| Total liabilities | | | 198,409,472 | | |
| Net assets applicable to outstanding capital stock | | $ | 2,451,791,167 | | |
The Accompanying Notes to Financial Statements are an integral part of this statement.
11
Statement of Assets and Liabilities (continued) – Columbia Marsico Focused Equities Fund
February 29, 2012
| Represented by | |
| Paid-in capital | | $ | 1,752,025,602 | | |
| Overdistributed net investment income | | | (65,661 | ) | |
| Accumulated net realized gain | | | 107,962,273 | | |
| Unrealized appreciation (depreciation) on: | |
| Investments | | | 591,868,858 | | |
| Foreign currency translations | | | 95 | | |
| Total — representing net assets applicable to outstanding capital stock | | $ | 2,451,791,167 | | |
| *Value of securities on loan | | $ | 129,901,081 | | |
| Net assets applicable to outstanding shares | |
| Class A | | $ | 1,137,239,954 | | |
| Class B | | $ | 23,744,547 | | |
| Class C | | $ | 262,047,879 | | |
| Class I | | $ | 3,002 | | |
| Class Z | | $ | 1,028,755,785 | | |
| Shares outstanding | |
| Class A | | | 47,034,130 | | |
| Class B | | | 1,085,096 | | |
| Class C | | | 11,935,267 | | |
| Class I | | | 121 | | |
| Class Z | | | 41,598,831 | | |
| Net asset value per share | |
| Class A(a) | | $ | 24.18 | | |
| Class B | | $ | 21.88 | | |
| Class C | | $ | 21.96 | | |
| Class I | | $ | 24.81 | | |
| Class Z | | $ | 24.73 | | |
(a) The maximum offering price per share for Class A is $25.66. The offering price is calculated by dividing the net asset value by 1.0 minus the maximum sales charge of 5.75%.
The Accompanying Notes to Financial Statements are an integral part of this statement.
12
Statement of Operations – Columbia Marsico Focused Equities Fund
Year ended February 29, 2012
| Net investment income | |
| Income: | |
| Dividends | | $ | 35,311,465 | | |
| Interest | | | 16,342 | | |
| Dividends from affiliates | | | 109,502 | | |
| Income from securities lending — net | | | 1,578,129 | | |
| Foreign taxes withheld | | | (113,695 | ) | |
| Total income | | | 36,901,743 | | |
| Expenses: | |
| Investment management fees | | | 16,803,385 | | |
| Distribution fees | |
| Class B | | | 237,747 | | |
| Class C | | | 2,021,377 | | |
| Service fees | |
| Class B | | | 79,250 | | |
| Class C | | | 673,786 | | |
| Distribution and service fees — Class A | | | 2,961,588 | | |
| Transfer agent fees | |
| Class A | | | 2,338,222 | | |
| Class B | | | 64,524 | | |
| Class C | | | 532,877 | | |
| Class Z | | | 2,092,556 | | |
| Administration fees | | | 5,553,522 | | |
| Compensation of board members | | | 53,453 | | |
| Pricing and bookkeeping fees | | | 57,903 | | |
| Custodian fees | | | 65,385 | | |
| Printing and postage fees | | | 395,104 | | |
| Registration fees | | | 92,049 | | |
| Professional fees | | | 73,125 | | |
| Chief compliance officer expenses | | | 392 | | |
| Other | | | 115,501 | | |
| Total expenses | | | 34,211,746 | | |
| Expense reductions | | | (7,489 | ) | |
| Total net expenses | | | 34,204,257 | | |
| Net investment income | | | 2,697,486 | | |
| Realized and unrealized gain (loss) — net | |
| Net realized gain (loss) on: | |
| Investments | | | 300,120,594 | | |
| Foreign currency translations | | | (3,838 | ) | |
| Net realized gain | | | 300,116,756 | | |
| Net change in unrealized appreciation (depreciation) on: | |
| Investments | | | (219,767,938 | ) | |
| Foreign currency translations | | | 95 | | |
| Net change in unrealized depreciation | | | (219,767,843 | ) | |
| Net realized and unrealized gain | | | 80,348,913 | | |
| Net increase in net assets resulting from operations | | $ | 83,046,399 | | |
The Accompanying Notes to Financial Statements are an integral part of this statement.
13
Statement of Changes in Net Assets – Columbia Marsico Focused Equities Fund
| | | Year ended
February 29,
2012 | | Year ended
February 28,
2011(a) | |
| Operations | |
| Net investment income | | $ | 2,697,486 | | | $ | 451,679 | | |
| Net realized gain | | | 300,116,756 | | | | 355,221,185 | | |
| Net change in unrealized appreciation (depreciation) | | | (219,767,843 | ) | | | 234,751,445 | | |
| Net increase in net assets resulting from operations | | | 83,046,399 | | | | 590,424,309 | | |
| Distributions to shareholders from: | |
| Net investment income | |
| Class A | | | (573,926 | ) | | | — | | |
| Class I | | | (11 | ) | | | (7,895 | ) | |
| Class Z | | | (2,594,756 | ) | | | (1,790,234 | ) | |
| Net realized gains | |
| Class A | | | (14,846,323 | ) | | | — | | |
| Class B | | | (389,717 | ) | | | — | | |
| Class C | | | (3,789,432 | ) | | | — | | |
| Class I | | | (37 | ) | | | — | | |
| Class Z | | | (13,503,688 | ) | | | — | | |
| Total distributions to shareholders | | | (35,697,890 | ) | | | (1,798,129 | ) | |
| Increase (decrease) in net assets from share transactions | | | (445,676,081 | ) | | | (694,899,268 | ) | |
| Total decrease in net assets | | | (398,327,572 | ) | | | (106,273,088 | ) | |
| Net assets at beginning of year | | | 2,850,118,739 | | | | 2,956,391,827 | | |
| Net assets at end of year | | $ | 2,451,791,167 | | | $ | 2,850,118,739 | | |
| Overdistributed net investment income | | $ | (65,661 | ) | | $ | — | | |
(a) Class I shares are for the period September 27, 2010 (commencement of operations) to February 28, 2011.
The Accompanying Notes to Financial Statements are an integral part of this statement.
14
Statement of Changes in Net Assets (continued) – Columbia Marsico Focused Equities Fund
| | | Year ended February 29,
2012 | | Year ended February 28,
2011(a) | |
| | | Shares | | Dollars ($) | | Shares | | Dollars ($) | |
| Capital stock activity | |
| Class A shares | |
| Subscriptions(b) | | | 8,090,553 | | | | 184,044,149 | | | | 9,963,643 | | | | 207,634,441 | | |
| Distributions reinvested | | | 528,991 | | | | 11,637,803 | | | | — | | | | — | | |
| Redemptions | | | (19,811,566 | ) | | | (453,046,764 | ) | | | (35,990,551 | ) | | | (723,569,817 | ) | |
| Net decrease | | | (11,192,022 | ) | | | (257,364,812 | ) | | | (26,026,908 | ) | | | (515,935,376 | ) | |
| Class B shares | |
| Subscriptions | | | 22,816 | | | | 462,254 | | | | 13,532 | | | | 260,647 | | |
| Distributions reinvested | | | 7,804 | | | | 155,680 | | | | — | | | | — | | |
| Redemptions(b) | | | (1,049,502 | ) | | | (21,648,084 | ) | | | (1,513,860 | ) | | | (28,578,982 | ) | |
| Net decrease | | | (1,018,882 | ) | | | (21,030,150 | ) | | | (1,500,328 | ) | | | (28,318,335 | ) | |
| Class C shares | |
| Subscriptions | | | 514,678 | | | | 10,608,656 | | | | 687,503 | | | | 13,179,244 | | |
| Distributions reinvested | | | 84,636 | | | | 1,693,561 | | | | — | | | | — | | |
| Redemptions | | | (2,811,937 | ) | | | (58,086,548 | ) | | | (3,573,230 | ) | | | (67,265,749 | ) | |
| Net decrease | | | (2,212,623 | ) | | | (45,784,331 | ) | | | (2,885,727 | ) | | | (54,086,505 | ) | |
| Class I shares | |
| Subscriptions | | | 32,484 | | | | 791,497 | | | | 1,269,141 | | | | 29,036,582 | | |
| Distributions reinvested | | | — | | | | — | | | | 343 | | | | 7,887 | | |
| Redemptions | | | (1,232,495 | ) | | | (29,338,948 | ) | | | (69,352 | ) | | | (1,626,838 | ) | |
| Net increase (decrease) | | | (1,200,011 | ) | | | (28,547,451 | ) | | | 1,200,132 | | | | 27,417,631 | | |
| Class Z shares | |
| Subscriptions | | | 10,118,134 | | | | 240,278,094 | | | | 11,640,322 | | | | 247,955,191 | | |
| Distributions reinvested | | | 584,625 | | | | 13,148,224 | | | | 59,617 | | | | 1,370,596 | | |
| Redemptions | | | (14,883,910 | ) | | | (346,375,655 | ) | | | (17,270,945 | ) | | | (373,302,470 | ) | |
| Net decrease | | | (4,181,151 | ) | | | (92,949,337 | ) | | | (5,571,006 | ) | | | (123,976,683 | ) | |
| Total net decrease | | | (19,804,689 | ) | | | (445,676,081 | ) | | | (34,783,837 | ) | | | (694,899,268 | ) | |
(a) Class I shares are for the period September 27, 2010 (commencement of operations) to February 28, 2011.
(b) Includes conversions of Class B shares to Class A shares, if any.
The Accompanying Notes to Financial Statements are an integral part of this statement.
15
Financial Highlights – Columbia Marsico Focused Equities Fund
The following tables are intended to help you understand the Fund's financial performance. Certain information reflects financial results for a single share of a class held for the periods shown. Per share net investment income (loss) amounts are calculated based on average shares outstanding during the period. Total returns assume reinvestment of all dividends and distributions. Total returns do not reflect payment of sales charges, if any, and are not annualized for periods of less than one year.
| | | Year ended
Feb. 29, | | Year ended Feb. 28, | | Year ended
Feb. 29, | | Year ended
March 31, | |
| | | 2012 | | 2011 | | 2010 | | 2009 | | 2008(a)(b)(c) | | 2007(c) | |
| Class A | |
| Per share data | |
| Net asset value, beginning of period | | $ | 23.53 | | | $ | 18.99 | | | $ | 12.76 | | | $ | 21.59 | | | $ | 21.81 | | | $ | 21.10 | | |
| Income from investment operations: | |
| Net investment income (loss) | | | 0.02 | | | | 0.00 | (d) | | | 0.01 | | | | 0.07 | | | | 0.02 | | | | (0.04 | ) | |
| Net realized and unrealized gain (loss) | | | 0.95 | | | | 4.54 | | | | 6.25 | | | | (8.86 | ) | | | 0.02 | | | | 0.75 | | |
| Total from investment operations | | | 0.97 | | | | 4.54 | | | | 6.26 | | | | (8.79 | ) | | | 0.04 | | | | 0.71 | | |
| Less distributions to shareholders from: | |
| Net investment income | | | (0.01 | ) | | | — | | | | (0.02 | ) | | | (0.04 | ) | | | — | | | | — | | |
| Net realized gains | | | (0.31 | ) | | | — | | | | — | | | | — | | | | (0.26 | ) | | | — | | |
| Tax return of capital | | | — | | | | — | | | | (0.01 | ) | | | — | | | | — | | | | — | | |
| Total distributions to shareholders | | | (0.32 | ) | | | — | | | | (0.03 | ) | | | (0.04 | ) | | | (0.26 | ) | | | — | | |
| Proceeds from regulatory settlement | | | — | | | | — | | | | 0.00 | (d) | | | — | | | | — | | | | — | | |
| Net asset value, end of period | | $ | 24.18 | | | $ | 23.53 | | | $ | 18.99 | | | $ | 12.76 | | | $ | 21.59 | | | $ | 21.81 | | |
| Total return | | | 4.26 | % | | | 23.91 | % | | | 49.12 | % | | | (40.73 | %) | | | 0.00 | %(e) | | | 3.36 | % | |
| Ratios to average net assets(f) | |
Expenses prior to fees waived or expenses reimbursed
(including interest expense) | | | 1.36 | % | | | 1.30 | %(h) | | | 1.31 | %(h) | | | 1.31 | % | | | 1.25 | %(h)(i) | | | 1.28 | % | |
Net expenses after fees waived or expenses reimbursed
(including interest expense)(g)(j) | | | 1.36 | % | | | 1.30 | %(h) | | | 1.30 | %(h) | | | 1.26 | % | | | 1.22 | %(h)(i) | | | 1.24 | % | |
Expenses prior to fees waived or expenses reimbursed
(excluding interest expense) | | | 1.36 | % | | | 1.30 | % | | | 1.31 | % | | | 1.31 | % | | | 1.25 | %(i) | | | 1.28 | % | |
Net expenses after fees waived or expenses reimbursed
(excluding interest expense)(g)(j) | | | 1.36 | % | | | 1.30 | % | | | 1.30 | % | | | 1.26 | % | | | 1.22 | %(i) | | | 1.24 | % | |
| Net investment income (loss)(g) | | | 0.09 | % | | | 0.01 | % | | | 0.03 | % | | | 0.37 | % | | | 0.11 | %(i) | | | (0.19 | %) | |
| Supplemental data | |
| Net assets, end of period (in thousands) | | $ | 1,137,240 | | | $ | 1,370,199 | | | $ | 1,599,661 | | | $ | 1,312,382 | | | $ | 2,524,540 | | | $ | 2,488,288 | | |
| Portfolio turnover | | | 90 | % | | | 77 | % | | | 77 | % | | | 85 | % | | | 0 | %(e)(k) | | | — | | |
Turnover of Columbia Marsico Focused Equities
Master Portfolio | | | — | | | | — | | | | — | | | | — | | | | 82 | % | | | 52 | % | |
Notes to Financial Highlights
(a) For the period from April 1, 2007 to February 29, 2008. During the period, the Fund's fiscal year end was changed from March 31 to February 29.
(b) Effective February 28, 2008, the Fund converted to a stand-alone fund. Prior to February 28, 2008, the Fund operated in a master-feeder structure.
(c) The per share amounts and percentages reflect income and expenses assuming inclusion of the Fund's proportionate share of the income and expenses of Columbia Marsico Focused Equities Master Portfolio.
(d) Rounds to less than $0.01.
(e) Rounds to less than 0.01%.
(f) In addition to the fees and expenses which the Fund bears directly, the Fund indirectly bears a pro rata share of the fees and expenses of the acquired funds in which it invests. Such indirect expenses are not included in the reported expense ratios.
(g) The benefits derived from expense reductions had an impact of less than 0.01%.
(h) Includes interest expense which rounds to less than 0.01%.
(i) Annualized.
(j) The Investment Manager and certain of its affiliates agreed to waive/reimburse certain fees and expenses, if applicable.
(k) Amount represents results after the Fund's conversion to a stand-alone structure on February 28, 2008.
The Accompanying Notes to Financial Statements are an integral part of this statement.
16
Financial Highlights (continued) – Columbia Marsico Focused Equities Fund
| | | Year ended
Feb. 29, | | Year ended Feb. 28, | | Year ended
Feb. 29, | | Year ended
March 31, | |
| | | 2012 | | 2011 | | 2010 | | 2009 | | 2008(a)(b)(c) | | 2007(c) | |
| Class B | |
| Per share data | |
| Net asset value, beginning of period | | $ | 21.48 | | | $ | 17.46 | | | $ | 11.80 | | | $ | 20.07 | | | $ | 20.42 | | | $ | 19.91 | | |
| Income from investment operations: | |
| Net investment loss | | | (0.15 | ) | | | (0.14 | ) | | | (0.11 | ) | | | (0.07 | ) | | | (0.13 | ) | | | (0.17 | ) | |
| Net realized and unrealized gain (loss) | | | 0.86 | | | | 4.16 | | | | 5.77 | | | | (8.20 | ) | | | 0.04 | | | | 0.68 | | |
| Total from investment operations | | | 0.71 | | | | 4.02 | | | | 5.66 | | | | (8.27 | ) | | | (0.09 | ) | | | 0.51 | | |
| Less distributions to shareholders from: | |
| Net realized gains | | | (0.31 | ) | | | — | | | | — | | | | — | | | | (0.26 | ) | | | — | | |
| Tax return of capital | | | — | | | | — | | | | (0.00 | )(d) | | | — | | | | — | | | | — | | |
| Total distributions to shareholders | | | (0.31 | ) | | | — | | | | (0.00 | )(d) | | | — | | | | (0.26 | ) | | | — | | |
| Proceeds from regulatory settlement | | | — | | | | — | | | | 0.00 | (d) | | | — | | | | — | | | | — | | |
| Net asset value, end of period | | $ | 21.88 | | | $ | 21.48 | | | $ | 17.46 | | | $ | 11.80 | | | $ | 20.07 | | | $ | 20.42 | | |
| Total return | | | 3.44 | % | | | 23.02 | % | | | 48.02 | % | | | (41.21 | %) | | | (0.64 | %) | | | 2.56 | % | |
| Ratios to average net assets(e) | |
Expenses prior to fees waived or expenses reimbursed
(including interest expense) | | | 2.12 | % | | | 2.05 | %(g) | | | 2.06 | %(g) | | | 2.06 | % | | | 2.00 | %(g)(h) | | | 2.03 | % | |
Net expenses after fees waived or expenses reimbursed
(including interest expense)(f)(i) | | | 2.12 | % | | | 2.05 | %(g) | | | 2.05 | %(g) | | | 2.01 | % | | | 1.97 | %(g)(h) | | | 1.99 | % | |
Expenses prior to fees waived or expenses reimbursed
(excluding interest expense) | | | 2.12 | % | | | 2.05 | % | | | 2.06 | % | | | 2.06 | % | | | 2.00 | %(h) | | | 2.03 | % | |
Net expenses after fees waived or expenses reimbursed
(excluding interest expense)(f)(i) | | | 2.12 | % | | | 2.05 | % | | | 2.05 | % | | | 2.01 | % | | | 1.97 | %(h) | | | 1.99 | % | |
| Net investment loss(f) | | | (0.70 | %) | | | (0.74 | %) | | | (0.72 | %) | | | (0.40 | %) | | | (0.67 | %)(h) | | | (0.85 | %) | |
| Supplemental data | |
| Net assets, end of period (in thousands) | | $ | 23,745 | | | $ | 45,196 | | | $ | 62,935 | | | $ | 64,937 | | | $ | 196,114 | | | $ | 348,836 | | |
| Portfolio turnover | | | 90 | % | | | 77 | % | | | 77 | % | | | 85 | % | | | 0 | %(j)(k) | | | — | | |
Turnover of Columbia Marsico Focused Equities
Master Portfolio | | | — | | | | — | | | | — | | | | — | | | | 82 | % | | | 52 | % | |
Notes to Financial Highlights
(a) For the period from April 1, 2007 to February 29, 2008. During the period, the Fund's fiscal year end was changed from March 31 to February 29.
(b) Effective February 28, 2008, the Fund converted to a stand-alone fund. Prior to February 28, 2008, the Fund operated in a master-feeder structure.
(c) The per share amounts and percentages reflect income and expenses assuming inclusion of the Fund's proportionate share of the income and expenses of Columbia Marsico Focused Equities Master Portfolio.
(d) Rounds to less than $0.01.
(e) In addition to the fees and expenses which the Fund bears directly, the Fund indirectly bears a pro rata share of the fees and expenses of the acquired funds in which it invests. Such indirect expenses are not included in the reported expense ratios.
(f) The benefits derived from expense reductions had an impact of less than 0.01%.
(g) Includes interest expense which rounds to less than 0.01%.
(h) Annualized.
(i) The Investment Manager and certain of its affiliates agreed to waive/reimburse certain fees and expenses, if applicable.
(j) Rounds to less than 0.01%.
(k) Amount represents results after the Fund's conversion to a stand-alone structure on February 28, 2008.
The Accompanying Notes to Financial Statements are an integral part of this statement.
17
Financial Highlights (continued) – Columbia Marsico Focused Equities Fund
| | | Year ended
Feb. 29, | | Year ended Feb. 28, | | Year ended
Feb. 29, | | Year ended
March 31, | |
| | | 2012 | | 2011 | | 2010 | | 2009 | | 2008(a)(b)(c) | | 2007(c) | |
| Class C | |
| Per share data | |
| Net asset value, beginning of period | | $ | 21.55 | | | $ | 17.52 | | | $ | 11.84 | | | $ | 20.13 | | | $ | 20.49 | | | $ | 19.97 | | |
| Income from investment operations: | |
| Net investment loss | | | (0.14 | ) | | | (0.14 | ) | | | (0.11 | ) | | | (0.07 | ) | | | (0.15 | ) | | | (0.18 | ) | |
| Net realized and unrealized gain (loss) | | | 0.86 | | | | 4.17 | | | | 5.79 | | | | (8.22 | ) | | | 0.05 | | | | 0.70 | | |
| Total from investment operations | | | 0.72 | | | | 4.03 | | | | 5.68 | | | | (8.29 | ) | | | (0.10 | ) | | | 0.52 | | |
| Less distributions to shareholders from: | |
| Net realized gains | | | (0.31 | ) | | | — | | | | — | | | | — | | | | (0.26 | ) | | | — | | |
| Tax return of capital | | | — | | | | — | | | | (0.00 | )(d) | | | — | | | | — | | | | — | | |
| Total distributions to shareholders | | | (0.31 | ) | | | — | | | | (0.00 | )(d) | | | — | | | | (0.26 | ) | | | — | | |
| Proceeds from regulatory settlement | | | — | | | | — | | | | 0.00 | (d) | | | — | | | | — | | | | — | | |
| Net asset value, end of period | | $ | 21.96 | | | $ | 21.55 | | | $ | 17.52 | | | $ | 11.84 | | | $ | 20.13 | | | $ | 20.49 | | |
| Total return | | | 3.47 | % | | | 23.00 | % | | | 48.02 | % | | | (41.18 | %) | | | (0.69 | %) | | | 2.60 | % | |
| Ratios to average net assets(e) | |
Expenses prior to fees waived or expenses reimbursed
(including interest expense) | | | 2.11 | % | | | 2.05 | %(g) | | | 2.06 | %(g) | | | 2.06 | % | | | 2.00 | %(g)(h) | | | 2.03 | % | |
Net expenses after fees waived or expenses reimbursed
(including interest expense)(f)(i) | | | 2.11 | % | | | 2.05 | %(g) | | | 2.05 | %(g) | | | 2.01 | % | | | 1.97 | %(g)(h) | | | 1.99 | % | |
Expenses prior to fees waived or expenses reimbursed
(excluding interest expense) | | | 2.11 | % | | | 2.05 | % | | | 2.06 | % | | | 2.06 | % | | | 2.00 | %(h) | | | 2.03 | % | |
Net expenses after fees waived or expenses reimbursed
(excluding interest expense)(f)(i) | | | 2.11 | % | | | 2.05 | % | | | 2.05 | % | | | 2.01 | % | | | 1.97 | %(h) | | | 1.99 | % | |
| Net investment loss(f) | | | (0.66 | %) | | | (0.73 | %) | | | (0.72 | %) | | | (0.38 | %) | | | (0.74 | %)(h) | | | (0.92 | %) | |
| Supplemental data | |
| Net assets, end of period (in thousands) | | $ | 262,048 | | | $ | 304,857 | | | $ | 298,344 | | | $ | 258,191 | | | $ | 522,644 | | | $ | 582,805 | | |
| Portfolio turnover | | | 90 | % | | | 77 | % | | | 77 | % | | | 85 | % | | | 0 | %(j)(k) | | | — | | |
Turnover of Columbia Marsico Focused Equities
Master Portfolio | | | — | | | | — | | | | — | | | | — | | | | 82 | % | | | 52 | % | |
Notes to Financial Highlights
(a) For the period from April 1, 2007 to February 29, 2008. During the period, the Fund's fiscal year end was changed from March 31 to February 29.
(b) Effective February 28, 2008, the Fund converted to a stand-alone fund. Prior to February 28, 2008, the Fund operated in a master-feeder structure.
(c) The per share amounts and percentages reflect income and expenses assuming inclusion of the Fund's proportionate share of the income and expenses of Columbia Marsico Focused Equities Master Portfolio.
(d) Rounds to less than $0.01.
(e) In addition to the fees and expenses which the Fund bears directly, the Fund indirectly bears a pro rata share of the fees and expenses of the acquired funds in which it invests. Such indirect expenses are not included in the reported expense ratios.
(f) The benefits derived from expense reductions had an impact of less than 0.01%.
(g) Includes interest expense which rounds to less than 0.01%.
(h) Annualized.
(i) The Investment Manager and certain of its affiliates agreed to waive/reimburse certain fees and expenses, if applicable.
(j) Rounds to less than 0.01%.
(k) Amount represents results after the Fund's conversion to a stand-alone structure on February 28, 2008.
The Accompanying Notes to Financial Statements are an integral part of this statement.
18
Financial Highlights (continued) – Columbia Marsico Focused Equities Fund
| | | Year ended
Feb. 29,
2012 | | Year ended
Feb. 28,
2011(a) | |
| Class I | |
| Per share data | |
| Net asset value, beginning of period | | $ | 24.04 | | | $ | 20.59 | | |
| Income from investment operations: | |
| Net investment income | | | 0.10 | | | | 0.00 | (b) | |
| Net realized and unrealized gain | | | 1.07 | | | | 3.52 | | |
| Total from investment operations | | | 1.17 | | | | 3.52 | | |
| Less distributions to shareholders from: | |
| Net investment income | | | (0.09 | ) | | | (0.07 | ) | |
| Net realized gains | | | (0.31 | ) | | | — | | |
| Total distributions to shareholders | | | (0.40 | ) | | | (0.07 | ) | |
| Net asset value, end of period | | $ | 24.81 | | | $ | 24.04 | | |
| Total return | | | 5.04 | % | | | 17.09 | % | |
| Ratios to average net assets(c) | |
Expenses prior to fees waived or expenses reimbursed
(including interest expense) | | | 0.91 | % | | | 0.89 | %(e) | |
Net expenses after fees waived or expenses reimbursed
(including interest expense)(d)(f) | | | 0.91 | % | | | 0.89 | %(e) | |
Expenses prior to fees waived or expenses reimbursed
(excluding interest expense) | | | 0.91 | % | | | 0.89 | %(e) | |
Net expenses after fees waived or expenses reimbursed
(excluding interest expense)(d)(f) | | | 0.91 | % | | | 0.89 | %(e) | |
| Net investment income(d) | | | 0.44 | % | | | 0.00 | %(e)(g) | |
| Supplemental data | |
| Net assets, end of period (in thousands) | | $ | 3 | | | $ | 28,852 | | |
| Portfolio turnover | | | 90 | % | | | 77 | % | |
Notes to Financial Highlights
(a) For the period from September 27, 2010 (commencement of operations) to February 28, 2011.
(b) Rounds to less than $0.01.
(c) In addition to the fees and expenses which the Fund bears directly, the Fund indirectly bears a pro rata share of the fees and expenses of the acquired funds in which it invests. Such indirect expenses are not included in the reported expense ratios.
(d) The benefits derived from expense reductions had an impact of less than 0.01%.
(e) Annualized.
(f) The Investment Manager and certain of its affiliates agreed to waive/reimburse certain fees and expenses, if applicable.
(g) Rounds to less than 0.01%.
The Accompanying Notes to Financial Statements are an integral part of this statement.
19
Financial Highlights (continued) – Columbia Marsico Focused Equities Fund
| | | Year ended
Feb. 29, | | Year ended Feb. 28, | | Year ended
Feb. 29, | | Year ended
March 31, | |
| | | 2012 | | 2011 | | 2010 | | 2009 | | 2008(a)(b)(c) | | 2007(c) | |
| Class Z | |
| Per share data | |
| Net asset value, beginning of period | | $ | 24.05 | | | $ | 19.39 | | | $ | 13.02 | | | $ | 22.06 | | | $ | 22.22 | | | $ | 21.45 | | |
| Income from investment operations: | |
| Net investment income | | | 0.08 | | | | 0.06 | | | | 0.05 | | | | 0.13 | | | | 0.09 | | | | 0.01 | | |
| Net realized and unrealized gain (loss) | | | 0.97 | | | | 4.64 | | | | 6.39 | | | | (9.07 | ) | | | 0.01 | | | | 0.76 | | |
| Total from investment operations | | | 1.05 | | | | 4.70 | | | | 6.44 | | | | (8.94 | ) | | | 0.10 | | | | 0.77 | | |
| Less distributions to shareholders from: | |
| Net investment income | | | (0.06 | ) | | | (0.04 | ) | | | (0.05 | ) | | | (0.10 | ) | | | — | | | | — | | |
| Net realized gains | | | (0.31 | ) | | | — | | | | — | | | | — | | | | (0.26 | ) | | | — | | |
| Tax return of capital | | | — | | | | — | | | | (0.02 | ) | | | — | | | | — | | | | — | | |
| Total distributions to shareholders | | | (0.37 | ) | | | (0.04 | ) | | | (0.07 | ) | | | (0.10 | ) | | | (0.26 | ) | | | — | | |
| Proceeds from regulatory settlement | | | — | | | | — | | | | 0.00 | (d) | | | — | | | | — | | | | — | | |
| Net asset value, end of period | | $ | 24.73 | | | $ | 24.05 | | | $ | 19.39 | | | $ | 13.02 | | | $ | 22.06 | | | $ | 22.22 | | |
| Total return | | | 4.51 | % | | | 24.23 | % | | | 49.53 | % | | | (40.60 | %) | | | 0.27 | % | | | 3.59 | % | |
| Ratios to average net assets(e) | |
Expenses prior to fees waived or expenses reimbursed
(including interest expense) | | | 1.11 | % | | | 1.05 | %(g) | | | 1.06 | %(g) | | | 1.06 | % | | | 1.00 | %(g)(h) | | | 1.03 | % | |
Net expenses after fees waived or expenses reimbursed
(including interest expense)(f)(i) | | | 1.11 | % | | | 1.05 | %(g) | | | 1.05 | %(g) | | | 1.01 | % | | | 0.97 | %(g)(h) | | | 0.99 | % | |
Expenses prior to fees waived or expenses reimbursed
(excluding interest expense) | | | 1.11 | % | | | 1.05 | % | | | 1.06 | % | | | 1.06 | % | | | 1.00 | %(h) | | | 1.03 | % | |
Net expenses after fees waived or expenses reimbursed
(excluding interest expense)(f)(i) | | | 1.11 | % | | | 1.05 | % | | | 1.05 | % | | | 1.01 | % | | | 0.97 | %(h) | | | 0.99 | % | |
| Net investment income(f) | | | 0.34 | % | | | 0.28 | % | | | 0.28 | % | | | 0.65 | % | | | 0.40 | %(h) | | | 0.06 | % | |
| Supplemental data | |
| Net assets, end of period (in thousands) | | $ | 1,028,756 | | | $ | 1,101,015 | | | $ | 995,452 | | | $ | 874,565 | | | $ | 1,285,252 | | | $ | 1,247,610 | | |
| Portfolio turnover | | | 90 | % | | | 77 | % | | | 77 | % | | | 85 | % | | | 0 | %(j)(k) | | | — | | |
Turnover of Columbia Marsico Focused Equities
Master Portfolio | | | — | | | | — | | | | — | | | | — | | | | 82 | % | | | 52 | % | |
Notes to Financial Highlights
(a) For the period from April 1, 2007 to February 29, 2008. During the period, the Fund's fiscal year end was changed from March 31 to February 29.
(b) Effective February 28, 2008, the Fund converted to a stand-alone fund. Prior to February 28, 2008, the Fund operated in a master-feeder structure.
(c) The per share amounts and percentages reflect income and expenses assuming inclusion of the Fund's proportionate share of the income and expenses of Columbia Marsico Focused Equities Master Portfolio.
(d) Rounds to less than $0.01.
(e) In addition to the fees and expenses which the Fund bears directly, the Fund indirectly bears a pro rata share of the fees and expenses of the acquired funds in which it invests. Such indirect expenses are not included in the reported expense ratios.
(f) The benefits derived from expense reductions had an impact of less than 0.01%.
(g) Includes interest expense which rounds to less than 0.01%.
(h) Annualized.
(i) The Investment Manager and certain of its affiliates agreed to waive/reimburse certain fees and expenses, if applicable.
(j) Rounds to less than 0.01%.
(k) Amount represents results after the Fund's conversion to a stand-alone structure on February 28, 2008.
The Accompanying Notes to Financial Statements are an integral part of this statement.
20
Notes to Financial Statements – Columbia Marsico Focused Equities Fund
February 29, 2012
Note 1. Organization
Columbia Marsico Focused Equities Fund (the Fund), a series of Columbia Funds Series Trust (the Trust), is a non-diversified fund. The Trust is registered under the Investment Company Act of 1940, as amended (the 1940 Act), as an open-end management investment company organized as a Delaware statutory trust.
Fund Shares
The Trust may issue an unlimited number of shares (without par value). The Fund offers Class A, Class B, Class C, Class I and Class Z shares. All share classes have identical voting, dividend and liquidation rights. Each share class has its own expense structure and sales charges, as applicable.
Class A shares are subject to a maximum front-end sales charge of 5.75% based on the initial investment amount. Class A shares purchased without an initial sales charge in accounts aggregating $1 million to $50 million at the time of purchase are subject to a contingent deferred sales charge (CDSC) if the shares are sold within 18 months of purchase, charged as follows: 1.00% CDSC if redeemed within 12 months of purchase, and 0.50% CDSC if redeemed more than 12, but less than 18, months after purchase.
Class B shares may be subject to a maximum CDSC of 5.00% based upon the holding period after purchase. Class B shares will generally convert to Class A shares eight years after purchase. The Fund no longer accepts investments by new or existing investors in the Fund's Class B shares, except in connection with the reinvestment of any dividend and/or capital gain distributions in Class B shares of the Fund and exchanges by existing Class B shareholders of certain other funds within the Columbia Family of Funds.
Class C shares are subject to a 1.00% CDSC on shares redeemed within one year of purchase.
Class I shares are not subject to sales charges and are only available to the Columbia Family of Funds.
Class Z shares are not subject to sales charges, and are only available to certain investors, as described in the Fund's prospectus.
Note 2. Summary of Significant Accounting Policies
Use of Estimates
The preparation of financial statements in accordance with U.S. generally accepted accounting principles (GAAP) requires management to make certain estimates and assumptions that affect the reported amounts of assets and liabilities, the disclosure of contingent assets and liabilities at the date of the financial statements and the reported amounts of revenue and expenses during the reporting period. Actual results could differ from those estimates.
The following is a summary of significant accounting policies consistently followed by the Fund in the preparation of its financial statements.
Security Valuation
All equity securities are valued at the close of business of the New York Stock Exchange (NYSE). Equity securities are valued at the last quoted sales price on the principal exchange or market on which they trade, except for securities traded on the NASDAQ Stock Market, which are valued at the NASDAQ official close price. Unlisted securities or listed securities for which there were no sales during the day are valued at the mean of the latest quoted bid and asked prices on such exchanges or markets.
Foreign securities are valued based on quotations from the principal market in which such securities are normally traded. If any foreign share prices are not readily available as a result of limited share activity the securities are valued at the mean of the latest quoted bid and asked prices on such exchanges or markets. Foreign currency exchange rates are generally determined at 4:00 p.m. Eastern (U.S.) time. However, many securities markets and exchanges outside the U.S. close prior to the close of the NYSE; therefore, the closing prices for securities in such markets or on such exchanges may not fully reflect events that occur after such close but before the close of the NYSE. In those situations, foreign securities will be fair valued pursuant to the policy adopted by the Board of Trustees (the Board), including utilizing a third party pricing service to determine these fair values. The third party pricing service takes into account multiple factors, including, but not limited to, movements in the U.S. securities markets, certain depositary receipts, futures contracts and foreign exchange rates that have occurred subsequent to the close of the foreign
21
Columbia Marsico Focused Equities Fund, February 29, 2012
exchange, to determine a good faith estimate that reasonably reflects the current market conditions as of the close of the NYSE. The fair value of a security is likely to be different from the quoted or published price, if available.
Investments in other open-end investment companies, including money market funds, are valued at net asset value.
Short-term securities purchased within 60 days to maturity are valued at amortized cost, which approximates market value. The value of short-term securities originally purchased with maturities greater than 60 days is determined based on an amortized value to par upon reaching 60 days to maturity. Short-term securities maturing in more than 60 days from the valuation date are valued at the market price or approximate market value based on current interest rates.
Investments for which market quotations are not readily available, or that have quotations which management believes are not reliable, are valued at fair value as determined in good faith under consistently applied procedures established by and under the general supervision of the Board. If a security or class of securities (such as foreign securities) is valued at fair value, such value is likely to be different from the last quoted market price for the security. The determination of fair value often requires significant judgment. To determine fair value, management may use assumptions including but not limited to future cash flows and estimated risk premiums. Multiple inputs from various sources may be used to determine value.
Foreign Currency Transactions and Translation
The values of all assets and liabilities denominated in foreign currencies are translated into U.S. dollars at that day's exchange rates. Net realized and unrealized gains (losses) on foreign currency transactions and translations include gains (losses) arising from the fluctuation in exchange rates between trade and settlement dates on securities transactions, gains (losses) arising from the disposition of foreign currency and currency gains (losses) between the accrual and payment dates on dividends, interest income and foreign withholding taxes.
For financial statement purposes, the Fund does not distinguish that portion of gains (losses) on investments which is due to changes in foreign exchange rates from that which is due to changes in market prices of the investments. Such fluctuations are included with the net realized and unrealized gains (losses) on investments in the Statement of Operations.
Repurchase Agreements
The Fund may engage in repurchase agreement transactions with institutions that management has determined are creditworthy. The Fund, through the custodian, receives delivery of the underlying securities collateralizing a repurchase agreement. Management is responsible for determining that the collateral is at least equal, at all times, to the value of the repurchase obligation including interest. A repurchase agreement transaction involves certain risks in the event of default or insolvency of the counterparty. These risks include possible delays in or restrictions on a Fund's ability to dispose of the underlying securities and a possible decline in the value of the underlying securities during the period while the Fund seeks to assert its rights.
Security Transactions
Security transactions are accounted for on the trade date. Cost is determined and gains (losses) are based upon the specific identification method for both financial statement and federal income tax purposes.
Income Recognition
Corporate actions and dividend income are recorded net of any non-reclaimable tax withholdings, on the ex-dividend date or upon receipt of ex-dividend notification in the case of certain foreign securities.
Interest income is recorded on the accrual basis.
Awards from class action litigation are recorded as a reduction of cost if the Fund still owns the applicable securities on the payment date. If the Fund no longer owns the applicable securities, the proceeds are recorded as realized gains.
Expenses
General expenses of the Trust are allocated to the Fund and other funds of the Trust based upon relative net assets or other expense allocation methodologies determined by the nature of the expense. Expenses directly attributable to the Fund are charged to the Fund. Expenses directly attributable to a specific class of shares are charged to that share class.
22
Columbia Marsico Focused Equities Fund, February 29, 2012
Determination of Class Net Asset Value
All income, expenses (other than class-specific expenses, which are charged to that share class, as shown in the Statement of Operations) and realized and unrealized gains (losses) are allocated to each class of the Fund on a daily basis, based on the relative net assets of each class, for purposes of determining the net asset value of each class.
Federal Income Tax Status
The Fund intends to qualify each year as a regulated investment company under Subchapter M of the Internal Revenue Code, as amended, and will distribute substantially all of its tax exempt or taxable income (including net short-term capital gains), if any, for its tax year, and as such will not be subject to federal income taxes. In addition, the Fund intends to distribute in each calendar year substantially all of its net investment income, capital gains and certain other amounts, if any, such that the Fund should not be subject to federal excise tax. Therefore, no federal income or excise tax provision is recorded.
Distributions to Shareholders
Distributions from net investment income, if any, are declared and paid semi-annually. Net realized capital gains, if any, are distributed along with the income dividend. Income distributions and capital gain distributions are determined in accordance with federal income tax regulations which may differ from GAAP.
Guarantees and Indemnifications
Under the Trust's organizational documents and, in some cases, by contract, its officers and trustees are indemnified against certain liabilities arising out of the performance of their duties to the Trust or its funds. In addition, certain of the Fund's contracts with its service providers contain general indemnification clauses. The Fund's maximum exposure under these arrangements is unknown since the amount of any future claims that may be made against the Fund cannot be determined, and the Fund has no historical basis for predicting the likelihood of any such claims.
Recent Accounting Pronouncement
Fair Value Measurements and Disclosures
In May 2011, the Financial Accounting and Standards Board (FASB) issued ASU No. 2011-04 modifying Topic 820, Fair Value Measurements and Disclosures. At the same time, the International Accounting Standards Board (IASB) issued International Financial Reporting Standard 13, Fair Value Measurement. The objective of the FASB and IASB is convergence of their guidance on fair value measurements and disclosures.
Specifically, ASU No. 2011-04 requires reporting entities to disclose i) the amounts of any transfers between Level 1 and Level 2, and the reasons for the transfers, ii) for Level 3 fair value measurements, a) quantitative information about significant unobservable inputs used, b) a description of the valuation processes used by the reporting entity and c) a narrative description of the sensitivity of the fair value measurement to changes in unobservable inputs if a change in those inputs might result in a significantly higher or lower fair value measurement. The effective date of ASU No. 2011-04 is for interim and annual periods beginning after December 15, 2011. At this time, management is evaluating the implications of this guidance and the impact it will have on the financial statement amounts and footnote disclosures, if any.
Note 3. Fees and Compensation Paid to Affiliates
Investment Management Fees
Under an Investment Management Services Agreement, Columbia Management Investment Advisers, LLC (the Investment Manager), a wholly-owned subsidiary of Ameriprise Financial, Inc. (Ameriprise Financial), is responsible for the management of the Fund. Day-to-day portfolio management of the Fund is provided by the Fund's subadviser. See Subadvisory Agreement below. The Management fee is an annual fee that is equal to a percentage of the Fund's average daily net assets that declines from 0.75% to 0.56% as the Fund's net assets increase. The effective management fee rate for the year ended February 29, 2012 was 0.66% of the Fund's average daily net assets.
To the extent that the Fund is not benefitting from a separate contractual expense limitation arrangement, the Investment Manager has contractually agreed to waive a portion of its
23
Columbia Marsico Focused Equities Fund, February 29, 2012
management fee through June 30, 2012. In the absence of a separate contractual expense limitation arrangement, the management fee waiver for the Fund would be calculated as follows:
| Fund average daily net assets* | | Management
fee waiver | |
| Assets up to $18 billion | | | 0.00 | % | |
Assets in excess of $18 billion
and up to $21 billion | | | 0.05 | | |
| Assets in excess of $21 billion | | | 0.10 | | |
* For purposes of the calculation, "Assets" are aggregate assets of the Fund and other affiliated funds managed by the Investment Manager and sub-advised by Marsico Capital Management, LLC.
For the year ended February 29, 2012, no management fees were waived for the Fund.
Subadvisory Agreement
The Investment Manager has entered into a Subadvisory Agreement with Marsico Capital Management, LLC (Marsico) to subadvise the assets of the Fund. The Investment Manager compensates Marsico to manage the investments of the Fund's assets.
Administration Fees
Under an Administrative Services Agreement, the Investment Manager serves as the Fund Administrator. The Fund pays the Fund Administrator an annual fee for administration and accounting services equal to 0.22% of the Fund's average daily net assets, less the fees that were payable by the Fund as described under the Pricing and Bookkeeping Fees note below.
Pricing and Bookkeeping Fees
Prior to July 11, 2011, the Fund had entered into a Financial Reporting Services Agreement (the Financial Reporting Services Agreement) with State Street Bank and Trust Company (State Street) and the Investment Manager pursuant to which State Street provided financial reporting services to the Fund. The Fund also entered into an Accounting Services Agreement (collectively with the Financial Reporting Services Agreement, the State Street Agreements) with State Street and the Investment Manager pursuant to which State Street provided accounting services to the Fund. Under the State Street Agreements, the Fund paid State Street an annual fee of $38,000 paid monthly plus an additional monthly fee based on an annualized percentage rate of average daily net assets of the Fund for the month. The aggregate fee did not exceed $140,000 per year (exclusive of out-of-pocket expenses and charges). The Fund also reimbursed State Street for certain out-of-pocket expenses and charges. Effective July 11, 2011, these services are provided under the Administrative Services Agreement discussed above.
Other Fees
Effective June 1, 2011, other expenses are for, among other things, certain expenses of the Fund or the Board, including: Fund boardroom and office expense, employee compensation, employee health and retirement benefits, and certain other expenses. Payment of these Fund and Board expenses is facilitated by a company providing limited administrative services to the Fund and the Board. For the period June 1, 2011 through February 29, 2012, other expenses paid to this company were $8,069.
Compensation of Board Members
Board members are compensated for their services to the Fund as disclosed in the Statement of Operations. Under a Deferred Compensation Plan (the Plan), the Board members who are not "interested persons" of the Fund, as defined under the 1940 Act, may elect to defer payment of up to 100% of their compensation. Deferred amounts are treated as though equivalent dollar amounts had been invested in shares of certain funds managed by the Investment Manager. The Fund's liability for these amounts is adjusted for market value changes and remains in the Fund until distributed in accordance with the Plan.
Compensation of Chief Compliance Officer
The Board has appointed a Chief Compliance Officer to the Fund in accordance with federal securities regulations. Effective April 1, 2011, the Fund's expenses associated with the Chief Compliance Officer are paid directly by Columbia. Prior to April 1, 2011, the Fund, along with other affiliated funds, paid its pro-rata share of the expenses for the Chief Compliance Officer. Such fees did not exceed $15,000 per year.
24
Columbia Marsico Focused Equities Fund, February 29, 2012
Transfer Agent Fees
Under a Transfer and Dividend Disbursing Agent Agreement, Columbia Management Investment Services Corp. (the Transfer Agent), an affiliate of the Investment Manager and a wholly-owned subsidiary of Ameriprise Financial, is responsible for providing transfer agency services to the Fund. The Transfer Agent has contracted with Boston Financial Data Services (BFDS) to serve as sub-transfer agent.
The Transfer Agent receives monthly account-based service fees based on the number of open accounts and is reimbursed by the Fund for the fees and expenses the Transfer Agent pays to financial intermediaries that maintain omnibus accounts with the Fund that is a percentage of the average aggregate value of the Fund's shares maintained in each such omnibus account (other than omnibus accounts for which American Enterprise Investment Services Inc. is the broker of record or accounts where the beneficial shareholder is a customer of Ameriprise Financial Services, Inc., which are paid a per account fee). The Transfer Agent pays the fees of BFDS for services as sub-transfer agent and is not entitled to reimbursement for such fees from the Fund (with the exception of out-of-pocket fees).
The Transfer Agent also receives compensation from fees for various shareholder services and reimbursements for certain out-of-pocket expenses. Class I shares do not pay transfer agent fees.
For the year ended February 29, 2012, the Fund's effective transfer agent fee rates as a percentage of average daily net assets of each class were as follows:
| Class A | | | 0.20 | % | |
| Class B | | | 0.20 | | |
| Class C | | | 0.20 | | |
| Class Z | | | 0.20 | | |
An annual minimum account balance fee of $20 may apply to certain accounts with a value below the Fund's initial minimum investment requirements to reduce the impact of small accounts on transfer agent fees. These minimum account balance fees are recorded as part of expense reductions in the Statement of Operations. For the year ended February 29, 2012, these minimum account balance fees reduced total expenses by $6,555.
Distribution and Service Fees
The Fund has an agreement with Columbia Management Investment Distributors, Inc. (the Distributor), an affiliate of the Investment Manager and a wholly-owned subsidiary of Ameriprise Financial, for distribution and shareholder services. Pursuant to Rule 12b-1 under the 1940 Act, the Board has approved, and the Fund has adopted, distribution and shareholder service plans (the Plans) which set the distribution and service fees for the Fund. These fees are calculated daily and are intended to compensate the Distributor and/or eligible selling and/or servicing agents for selling shares of the Fund and providing services to investors.
The Plans require the payment of a monthly combined distribution and service fee to the Distributor at the maximum annual rate of 0.25% of the average daily net assets attributable to Class A shares of the Fund. The Plans also require the payment of a monthly service fee at the maximum annual rate of 0.25% of the average daily net assets attributable to Class B and Class C shares of the Fund and the payment of a monthly distribution fee at the maximum annual rate of 0.75% of the average daily net assets attributable to Class B and Class C shares of the Fund.
Sales Charges
Sales charges, including front-end charges and CDSCs, received by the Distributor for distributing Fund shares were $173,619 for Class A, $17,505 for Class B and $4,579 for Class C shares for the year ended February 29, 2012.
Expenses Waived/Reimbursed by the Investment Manager and its Affiliates
Effective July 1, 2011, the Investment Manager and certain of its affiliates have contractually agreed to waive fees and/or reimburse expenses (excluding certain fees and expenses described below), through June 30, 2012, unless sooner terminated at the sole discretion of the Board, so that the Fund's net operating expenses, after giving effect to fees waived/expenses reimbursed and any balance credits and/or overdraft charges from the Fund's custodian, do not exceed
25
Columbia Marsico Focused Equities Fund, February 29, 2012
the following annual rates as a percentage of the class' average daily net assets:
| Class A | | | 1.45 | % | |
| Class B | | | 2.20 | | |
| Class C | | | 2.20 | | |
| Class I | | | 1.02 | | |
| Class Z | | | 1.20 | | |
Under the agreement, the following fees and expenses are excluded from the waiver/reimbursement commitment, and therefore will be paid by the Fund, if applicable: taxes (including foreign transaction taxes), expenses associated with investments in affiliated and non-affiliated pooled investment vehicles (including mutual funds and exchange traded funds), transaction costs and brokerage commissions, costs related to any securities lending program, dividend expenses associated with securities sold short, inverse floater program fees and expenses, transaction charges and interest on borrowed money, interest, extraordinary expenses and any other expenses the exclusion of which is specifically approved by the Board. This agreement may be modified or amended only with approval from all parties.
Prior to July 1, 2011, the Investment Manager voluntarily agreed to reimburse a portion of the Fund's expenses (excluding certain expenses, such as brokerage commissions, interest, taxes and extraordinary expenses, but including custodian charges relating to overdrafts, if any) so that the Fund's ordinary net operating expenses, after giving effect to fees waived/expenses reimbursed and any balance credits and/or overdraft charges from the Fund's custodian, did not exceed the following annual rates as a percentage of the class' average daily net assets:
| Class A | | | 1.45 | % | |
| Class B | | | 2.20 | | |
| Class C | | | 2.20 | | |
| Class I | | | 1.08 | | |
| Class Z | | | 1.20 | | |
Note 4. Federal Tax Information
The timing and character of income and capital gain distributions are determined in accordance with income tax regulations, which may differ from GAAP because of temporary or permanent book to tax differences.
For the year ended February 29, 2012, these differences are primarily due to differing treatment for foreign currency transactions, distribution reclassifications, redemption-based payments treated as eligible for the dividends paid deduction, deferral/reversal of wash sale losses and deferred trustees' expense. To the extent these differences are permanent, reclassifications are made among the components of the Fund's net assets in the Statement of Assets and Liabilities. Temporary differences do not require reclassifications. In the Statement of Assets and Liabilities the following reclassifications were made:
| Overdistributed net investment income | | $ | 405,546 | | |
| Accumulated net realized gain | | | (7,348,913 | ) | |
| Paid-in capital | | | 6,943,367 | | |
Net investment income and net realized gains (losses), as disclosed in the Statement of Operations, and net assets were not affected by this reclassification.
The tax character of distributions paid during the years indicated was as follows:
| Year ended | | February 29,
2012 | | February 28,
2011 | |
| Ordinary income* | | $ | 2,759,309 | | | $ | 1,798,129 | | |
| Long-term capital gains | | $ | 32,938,581 | | | | — | | |
* Short-term capital gain distributions, if any, are considered ordinary income distributions for tax purposes.
At February 29, 2012, the components of distributable earnings on a tax basis were as follows:
| Undistributed long-term capital gains | | $ | 119,896,502 | | |
| Unrealized appreciation | | | 579,934,629 | | |
26
Columbia Marsico Focused Equities Fund, February 29, 2012
At February 29, 2012, the cost of investments for federal income tax purposes was $2,054,719,891 and the aggregate gross unrealized appreciation and depreciation based on that cost was:
| Unrealized appreciation | | $ | 603,013,661 | | |
| Unrealized depreciation | | $ | (23,079,032 | ) | |
| Net unrealized appreciation | | $ | 579,934,629 | | |
For the year ended February 29, 2012, $118,149,360 of capital loss carryforward was utilized.
On December 22, 2010, the Regulated Investment Company Modernization Act of 2010 (the Act) was enacted, which changed various technical rules governing the tax treatment of regulated investment companies. The changes are generally effective for taxable years beginning after the date of enactment. Under the Act, the Fund will be permitted to carry forward capital losses incurred in taxable years beginning after the date of enactment for an unlimited period. However, any losses incurred during those future taxable years will be required to be utilized prior to the losses incurred in pre-enactment taxable years, which carry an expiration date. As a result of this ordering rule, pre-enactment capital loss carryforwards may be more likely to expire unused.
Management of the Fund has concluded that there are no significant uncertain tax positions that would require recognition in the financial statements. However, management's conclusion may be subject to review and adjustment at a later date based on factors including, but not limited to, new tax laws, regulations, and administrative interpretations (including relevant court decisions). Generally, the Fund's federal tax returns for the prior three fiscal years remain subject to examination by the Internal Revenue Service.
Note 5. Portfolio Information
The cost of purchases and proceeds from sales of securities, excluding short-term obligations, aggregated to $2,215,989,174 and $2,577,183,127, respectively, for the year ended February 29, 2012.
Note 6. Lending of Portfolio Securities
Effective July 11, 2011, the Fund has entered into a Master Securities Lending Agreement (the Agreement) with JPMorgan Chase Bank, N.A. (JPMorgan). The Agreement, which replaces the previous security lending arrangement with State Street, authorizes JPMorgan as lending agent to lend securities to authorized borrowers in order to generate additional income on behalf of the Fund. Pursuant to the Agreement, the securities loaned are secured by cash or U.S. government securities equal to at least 100% of the market value of the loaned securities. Any additional collateral required to maintain those levels due to market fluctuations of the loaned securities is requested to be delivered the following business day. Cash collateral received is invested by the lending agent on behalf of the Fund into authorized investments pursuant to the Agreement. The investments made with the cash collateral are listed in the Portfolio of Investments. The values of such investments and any uninvested cash collateral are disclosed in the Statement of Assets and Liabilities along with the related obligation to return the collateral upon the return of the securities loaned.
At February 29, 2012, securities valued at $129,901,081 were on loan, secured by cash collateral of $133,207,511 (which does not reflect calls for collateral made to borrowers by JPMorgan at period end) that is partially or fully invested in short-term securities or other cash equivalents.
Risks of delay in recovery of securities or even loss of rights in the securities may occur should the borrower of the securities fail financially. Risks may also arise to the extent that the value of the securities loaned increases above the value of the collateral received. JPMorgan will indemnify the Fund from losses resulting from a borrower's failure to return a loaned security when due. Such indemnification does not extend to losses associated with declines in the value of cash collateral investments. The Investment Manager is not responsible for any losses incurred by the Fund in connection with the securities lending program. Loans are subject to termination by the Fund or the borrower at any time, and are, therefore, not considered to be illiquid investments.
Pursuant to the Agreement, the Fund receives income for lending its securities either in the form of fees or by earning interest on invested cash collateral, net of negotiated rebates paid to borrowers and fees paid to the lending agent for
27
Columbia Marsico Focused Equities Fund, February 29, 2012
services provided and any other securities lending expenses. Net income earned from securities lending for the year ended February 29, 2012 is disclosed in the Statement of Operations. The Fund continues to earn and accrue interest and dividends on the securities loaned.
Prior to July 11, 2011, the Fund participated in a securities lending arrangement with State Street. Each security on loan was collateralized in an amount at least equal to the market value of the securities loaned plus accrued income from the investment of collateral. The income generated by the investment of the collateral, net of any fees remitted to State Street as the lending agent and borrower rebates, was paid to the Fund.
Note 7. Custody Credits
Prior to July 11, 2011, the Fund had an agreement with its custodian bank under which custody fees may have been reduced by balance credits. These credits are recorded as part of expense reductions on the Statement of Operations. The Fund could have invested a portion of the assets utilized in connection with the expense offset arrangement in an income-producing asset if they had not entered into such an agreement. Subsequent to this date, the Fund may invest its daily balance in an affiliated money market fund as detailed below. For the period March 1, 2011 through July 10, 2011, these credits reduced total expenses by $934.
Note 8. Affiliated Money Market Fund
Effective July 11, 2011, the Fund may invest its daily cash balances in Columbia Short-Term Cash Fund, an affiliated money market fund established for the exclusive use by the Fund and other affiliated funds. The income earned by the Fund from such investments is included as "Dividends from affiliates" in the Statement of Operations. As an investing fund, the Fund indirectly bears its proportionate share of the expenses of Columbia Short-Term Cash Fund.
Note 9. Shareholder Concentration
At February 29, 2012, three unaffiliated shareholder accounts owned an aggregate of 51.0% of the outstanding shares of the Fund. The Fund has no knowledge about whether any portion of those shares was owned beneficially by such accounts. Subscription and redemption activity by concentrated accounts may have a significant effect on the operations of the Fund.
Note 10. Line of Credit
The Fund has entered into a revolving credit facility with a syndicate of banks led by JPMorgan Chase Bank, N.A. (the Administrative Agent), whereby the Fund may borrow for the temporary funding of shareholder redemptions or for other temporary or emergency purposes. The credit facility became effective on July 11, 2011, replacing a prior credit facility. The credit facility agreement, as amended, which is a collective agreement between the Fund and certain other funds managed by the Investment Manager, severally and not jointly, permits collective borrowings up to $500 million. Pursuant to a December 13, 2011 amendment to the credit facility agreement, interest is charged to each participating fund based on its borrowings at a rate equal to the higher of (i) the overnight federal funds rate plus 1.00% or (i) the one-month LIBOR rate plus 1.00%. Each borrowing under the credit facility matures no later than 60 days after the date of borrowing. The Fund also pays a commitment fee equal to its pro rata share of the amount of the credit facility at a rate of 0.08% per annum. For the period July 11, 2011 through December 13, 2011, interest was charged to each participating fund based on its borrowings at a rate equal to the sum of the federal funds rate plus (i) 1.25% per annum plus (ii) if one-month LIBOR exceeds the federal funds rate, the amount of such excess. The Fund also paid a commitment fee equal to its pro rata share of the amount of the credit facility at a rate of 0.10% per annum.
Prior to July 11, 2011, the Fund and certain other funds managed by the Investment Manager participated in a committed, unsecured revolving credit facility provided by State Street. For the period June 27, 2011 through July 8, 2011, the collective borrowing amount of the credit facility was $100 million. For the period May 16, 2011 through June 26, 2011, the collective borrowing amount of the credit facility was $150 million. For the period March 28, 2011 through May 15, 2011, the collective borrowing amount of the credit facility was $225 million. Prior to March 28, 2011, the collective borrowing amount of the credit facility was $280 million. Interest was charged to each fund based on its borrowings at a rate equal to the greater of the (i) federal funds rate plus 1.25% per annum or (ii) the overnight LIBOR rate plus 1.25% per annum. The Fund also paid a commitment
28
Columbia Marsico Focused Equities Fund, February 29, 2012
fee equal to its pro rata share of the amount of the credit facility at a rate of 0.125% per annum.
The Fund had no borrowings during the year ended February 29, 2012.
Note 11. Significant Risks
Non-Diversification Risk
A non-diversified fund is permitted to invest a greater percentage of its total assets in fewer issuers than a diversified fund. The Fund may, therefore, have a greater risk of loss from a few issuers than a similar fund that invests more broadly.
Foreign Securities Risk
Investing in foreign securities may include certain risks and considerations not typically associated with investing in U.S. securities, such as fluctuating currency values and changing local and regional economic, political and social conditions, which may result in greater market volatility. In addition, certain foreign securities may not be as liquid as U.S. securities. Investing in emerging markets may accentuate these risks.
Investments in emerging market countries are subject to additional risk. The risk of foreign investments is typically increased in less developed countries. These countries are also more likely to experience high levels of inflation, deflation or currency devaluation which could hurt their economies and securities markets.
Note 12. Subsequent Events
Management has evaluated the events and transactions that have occurred through the date the financial statements were issued. Other than noted below, there were no items requiring adjustment of the financial statements or additional disclosure.
On March 23, 2012, a group of unaffiliated shareholders of the Fund redeemed $368,803,706, which represented approximately 15% of the Fund's net assets as of that date.
Note 13. Information Regarding Pending and Settled Legal Proceedings
In June 2004, an action captioned John E. Gallus et al. v. American Express Financial Corp. and American Express Financial Advisors Inc. was filed in the United States District Court for the District of Arizona. The plaintiffs allege that they are investors in several American Express Company mutual funds (currently branded as Columbia) and they purport to bring the action derivatively on behalf of those funds under the Investment Company Act of 1940. The plaintiffs allege that fees allegedly paid to the defendants by the funds for investment advisory and administrative services are excessive. The plaintiffs seek remedies including restitution and rescission of investment advisory and distribution agreements. The plaintiffs voluntarily agreed to transfer this case to the United States District Court for the District of Minnesota (the District Court). In response to defendants' motion to dismiss the complaint, the District Court dismissed one of plaintiffs' four claims and granted plaintiffs limited discovery. Defendants moved for summary judgment in April 2007. Summary judgment was granted in the defendants' favor on July 9, 2007. The plaintiffs filed a notice of appeal with the Eighth Circuit Court of Appeals (the Eighth Circuit) on August 8, 2007. On April 8, 2009, the Eighth Circuit reversed summary judgment and remanded to the District Court for further proceedings. On August 6, 2009, defendants filed a writ of certiorari with the U.S. Supreme Court (the Supreme Court), asking the Supreme Court to stay the District Court proceedings while the Supreme Court considered and ruled in a case captioned Jones v. Harris Associates, which involved issues of law similar to those presented in the Gallus case. On March 30, 2010, the Supreme Court issued its ruling in Jones v. Harris Associates, and on April 5, 2010, the Supreme Court vacated the Eighth Circuit's decision in the Gallus case and remanded the case to the Eighth Circuit for further consideration in light of the Supreme Court's decision in Jones v. Harris Associates. On June 4, 2010, the Eighth Circuit remanded the Gallus case to the District Court for further consideration in light of the Supreme Court's decision in Jones v. Harris Associates. On December 9, 2010, the District Court reinstated its July 9, 2007 summary judgment order in favor of the defendants. On January 10, 2011, plaintiffs filed a notice of appeal with the Eighth Circuit. In response to the plaintiffs' opening appellate brief filed on March 18, 2011, the defendants filed a response
29
Columbia Marsico Focused Equities Fund, February 29, 2012
brief on May 4, 2011 with the Eighth Circuit. The plaintiffs filed a reply brief on May 26, 2011 and oral arguments took place on November 17, 2011. On March 30, 2012, the Eighth Circuit upheld the grant of summary judgment by the District Court in favor of the defendants.
In December 2005, without admitting or denying the allegations, American Express Financial Corporation (AEFC, which is now known as Ameriprise Financial, Inc. (Ameriprise Financial)) entered into settlement agreements with the Securities and Exchange Commission (SEC) and Minnesota Department of Commerce (MDOC) related to market timing activities. As a result, AEFC was censured and ordered to cease and desist from committing or causing any violations of certain provisions of the Investment Advisers Act of 1940, the Investment Company Act of 1940, and various Minnesota laws. AEFC agreed to pay disgorgement of $10 million and civil money penalties of $7 million. AEFC also agreed to retain an independent distribution consultant to assist in developing a plan for distribution of all disgorgement and civil penalties ordered by the SEC in accordance with various undertakings detailed at www.sec.gov/litigation/admin/ia-2451.pdf. Ameriprise Financial and its affiliates have cooperated with the SEC and the MDOC in these legal proceedings, and have made regular reports to the funds' Boards of Trustees.
Ameriprise Financial and certain of its affiliates have historically been involved in a number of legal, arbitration and regulatory proceedings, including routine litigation, class actions, and governmental actions, concerning matters arising in connection with the conduct of their business activities. Ameriprise Financial believes that the Funds are not currently the subject of, and that neither Ameriprise Financial nor any of its affiliates are the subject of, any pending legal, arbitration or regulatory proceedings that are likely to have a material adverse effect on the Funds or the ability of Ameriprise Financial or its affiliates to perform under their contracts with the Funds. Ameriprise Financial is required to make 10-Q, 10-K and, as necessary, 8-K filings with the Securities and Exchange Commission on legal and regulatory matters that relate to Ameriprise Financial and its affiliates. Copies of these filings may be obtained by accessing the SEC website at www.sec.gov.
There can be no assurance that these matters, or the adverse publicity associated with them, will not result in increased fund redemptions, reduced sale of fund shares or other adverse consequences to the Funds. Further, although we believe proceedings are not likely to have a material adverse effect on the Funds or the ability of Ameriprise Financial or its affiliates to perform under their contracts with the Funds, these proceedings are subject to uncertainties and, as such, we are unable to estimate the possible loss or range of loss that may result. An adverse outcome in one or more of these proceedings could result in adverse judgments, settlements, fines, penalties or other relief that could have a material adverse effect on the consolidated financial condition or results of operations of Ameriprise Financial.
30
Report of Independent Registered Public Accounting Firm
To the Trustees of Columbia Funds Series Trust and the Shareholders of Columbia Marsico Focused Equities Fund
In our opinion, the accompanying statement of assets and liabilities, including the investment portfolio, and the related statements of operations and of changes in net assets and the financial highlights present fairly, in all material respects, the financial position of Columbia Marsico Focused Equities Fund (the "Fund") (a series of Columbia Funds Series Trust) at February 29, 2012, the results of its operations for the year then ended, the changes in its net assets for the two years in the period then ended and the financial highlights for each of the periods indicated, in conformity with accounting principles generally accepted in the United States of America. These financial statements and financial highlights (hereafter referred to as "financial statements") are the responsibility of the Fund's management. Our responsibility is to express an opinion on these financial statements based on our audits. We conducted our audits of these financial statements in accordance with the standards of the Public Company Accounting Oversight Board (United States). Those standards require that we plan and perform the audit to obtain reasonable assurance about whether the financial statements are free of material misstatement. An audit includes examining, on a test basis, evidence supporting the amounts and disclosures in the financial statements, assessing the accounting principles used and significant estimates made by management, and evaluating the overall financial statement presentation. We believe that our audits, which included confirmation of securities at February 29, 2012 by correspondence with the custodian, brokers and transfer agent provide a reasonable basis for our opinion.
PricewaterhouseCoopers LLP
Minneapolis, Minnesota
April 20, 2012
31
Federal Income Tax Information (Unaudited) – Columbia Marsico Focused Equities Fund
The Fund hereby designates as a capital gain dividend with respect to the fiscal year ended February 29, 2012, $167,767,375, or, if subsequently determined to be different, the net capital gain of such year.
100.00% of the ordinary income distributed by the Fund for the fiscal year ended February 29, 2012, qualifies for the corporate dividends received deduction.
For non-corporate shareholders, 100.00% or the maximum amount allowable under the Jobs and Growth Tax Relief Reconciliation Act of 2003, of the ordinary income distributed by the Fund for the fiscal year ended February 29, 2012 may represent qualified dividend income.
The Fund will notify shareholders in January 2013 of amounts for use in preparing 2012 income tax returns.
32
Fund Governance
Shareholders elect the Board that oversees the funds' operations. The Board appoints officers who are responsible for day-to-day business decisions based on policies set by the Board. The following table provides basic biographical information about the funds' Board members, including their principal occupations during the past five years, although specific titles for individuals may have varied over the period. Under current Board policy, members may serve until the next Board meeting after he or she reaches the mandatory retirement age established by the Board, or the fifteenth anniversary of the first Board meeting they attended as a member of the Board.
On September 29, 2009, Ameriprise Financial, the parent company of Columbia Management, entered into an agreement with Bank of America, N.A. ("Bank of America") to acquire a portion of the asset management business of Columbia Management Group, LLC and certain of its affiliated companies (the "Transaction"). Following the Transaction, which became effective on May 1, 2010, various alignment activities have occurred with respect to the Fund Family. In connection with the Transaction, Mr. Edward J. Boudreau, Jr., Mr. William P. Carmichael, Mr. William A. Hawkins, Mr. R. Glenn Hilliard, Mr. John J. Nagorniak, Ms. Minor M. Shaw and Dr. Anthony M. Santomero, who were members prior to the Transaction of the Legacy Columbia Nations funds' Board ("Nations Funds"), which includes Columbia Funds Series Trust, Columbia Funds Variable Insurance Trust I and Columbia Funds Master Investment Trust, LLC., began service on the Board for the Legacy RiverSource funds ("RiverSource Funds") effective June 1, 2011, which resulted in an overall increase from twelve Trustees to sixteen for all mutual funds overseen by the Board.
Independent Board Members
| Name, Address, Age | | Position Held
with Funds
and Length
of Service | | Principal Occupation During Past Five Years | | Number of
Funds in the
Fund Family
Overseen by
Board Member | | Other Present or
Past Directorships/
Trusteeships
(Within Past 5 Years) | |
| Kathleen Blatz | | | | | | | | | |
|
901 S. Marquette Ave.
Minneapolis, MN 55402
Age 57 | | Board member since 1/06 for RiverSource Funds and since 6/11 for Nations Funds | | Attorney; Chief Justice, Minnesota Supreme Court, 1998-2006 | | | 153 | | | None | |
|
| Edward J. Boudreau, Jr. | | | | | | | | | |
|
225 Franklin Street
Mail Drop
BX32 05228
Boston, MA 02110
Age 67 | | Board member since 6/11 for RiverSource Funds and since 1/05 for Nations Funds | | Managing Director, E.J. Boudreau & Associates (consulting) since 2000 | | | 146 | | | Former Trustee, BofA Funds Series Trust (11 funds) | |
|
| Pamela G. Carlton | | | | | | | | | |
|
901 S. Marquette Ave.
Minneapolis, MN 55402
Age 57 | | Board member since 7/07 for RiverSource Funds and since 6/11 for Nations Funds | | President, Springboard-Partners in Cross Cultural Leadership (consulting company) | | | 153 | | | None | |
|
33
Fund Governance (continued)
Independent Board Members (continued)
| Name, Address, Age | | Position Held
with Funds
and Length
of Service | | Principal Occupation During Past Five Years | | Number of
Funds in the
Fund Family
Overseen by
Board Member | | Other Present or
Past Directorships/
Trusteeships
(Within Past 5 Years) | |
| William P. Carmichael | | | | | | | | | |
|
225 Franklin Street
Mail Drop
BX32 05228
Boston, MA 02110
Age 68 | | Board member since 6/11 for RiverSource Funds and since 1999 for Nations Funds | | Retired | | | 146 | | | Director, Cobra Electronics Corporation (electronic equipment manufacturer); The Finish Line (athletic shoes and apparel); McMoRan Exploration Company (oil and gas exploration and development); former Trustee, BofA Funds Series Trust (11 funds); former Director, Spectrum Brands, Inc. (consumer products); former Director, Simmons Company (bedding) | |
|
| Patricia M. Flynn | | | | | | | | | |
|
901 S. Marquette Ave.
Minneapolis, MN 55402
Age 61 | | Board member since 11/04 for RiverSource Funds and since 6/11 for Nations Funds | | Trustee Professor of Economics and Management, Bentley University; former Dean, McCallum Graduate School of Business, Bentley University | | | 153 | | | None | |
|
| William A. Hawkins | | | | | | | | | |
|
225 Franklin Street
Mail Drop
BX32 05228
Boston, MA 02110
Age 69 | | Board member since 6/11 for RiverSource Funds and since 1/05 for Nations Funds | | Managing Director, Overton Partners (financial consulting), since August 2010; President and Chief Executive Officer, California General Bank, N.A., January 2008-August 2010 | | | 146 | | | Trustee, BofA Funds Series Trust (11 funds) | |
|
| R. Glenn Hilliard | | | | | | | | | |
|
225 Franklin Street
Mail Drop
BX32 05228
Boston, MA 02110
Age 69 | | Board member since 6/11 for RiverSource Funds and since 1/05 for Nations Funds | | Chairman and Chief Executive Officer, Hilliard Group LLC (investing and consulting), since April 2003; Non-Executive Director & Chairman, CNO Financial Group, Inc. (formerly Conseco, Inc.) (insurance), September 2003-May 2011 | | | 146 | | | Chairman, BofA Fund Series Trust (11 funds); former Director, CNO Financial Group, Inc. (insurance) | |
|
34
Fund Governance (continued)
Independent Board Members (continued)
| Name, Address, Age | | Position Held
with Funds
and Length
of Service | | Principal Occupation During Past Five Years | | Number of
Funds in the
Fund Family
Overseen by
Board Member | | Other Present or
Past Directorships/
Trusteeships
(Within Past 5 Years) | |
| Stephen R. Lewis, Jr. | | | | | | | | | |
|
901 S. Marquette Ave.
Minneapolis, MN 55402
Age 73 | | Chair of the Board for RiverSource Funds since 1/07, Board member for RiverSource Funds since 1/02 and since 6/11 for Nations Funds | | President Emeritus and Professor of Economics Emeritus, Carleton College | | | 153 | | | Director, Valmont Industries, Inc. (manufactures irrigation systems) | |
|
| John F. Maher | | | | | | | | | |
|
901 S. Marquette Ave.
Minneapolis, MN 55402
Age 68 | | Board member since 12/06 for Legacy Seligman funds, since 12/08 for RiverSource Funds and since 6/11 for Nations Funds | | Retired President and Chief Executive Officer and former Director, Great Western Financial Corporation (financial services), 1986-1997 | | | 153 | | | None | |
|
| John J. Nagorniak | | | | | | | | | |
|
225 Franklin Street
Mail Drop
BX32 05228
Boston, MA 02110
Age 67 | | Board member since 6/11 for RiverSource Funds and since 1/08 for Nations Funds | | Retired; President and Director, Foxstone Financial, Inc. (consulting), 2000-2007; Director, Mellon Financial Corporation affiliates (investing), 2000-2007; Chairman, Franklin Portfolio Associates (investing—Mellon affiliate), 1982-2007 | | | 146 | | | Trustee, Research Foundation of CFA Institute; Director, MIT Investment Company; Trustee, MIT 401k Plan; former Trustee, BofA Funds Series Trust (11 funds) | |
|
| Catherine James Paglia | | | | | | | | | |
|
901 S. Marquette Ave.
Minneapolis, MN 55402
Age 59 | | Board member since 11/04 for RiverSource Funds and since 6/11 for Nations Funds | | Director, Enterprise Asset Management, Inc. (private real estate and asset management company) | | | 153 | | | None | |
|
35
Fund Governance (continued)
Independent Board Members (continued)
| Name, Address, Age | | Position Held
with Funds
and Length
of Service | | Principal Occupation During Past Five Years | | Number of
Funds in the
Fund Family
Overseen by
Board Member | | Other Present or
Past Directorships/
Trusteeships
(Within Past 5 Years) | |
| Leroy C. Richie | | | | | | | | | |
|
901 S. Marquette Ave.
Minneapolis, MN 55402
Age 70 | | Board member since 2000 for Legacy Seligman funds, since 11/08 for RiverSource Funds and since 6/11 for Nations Funds | | Counsel, Lewis & Munday, P.C. since 2004; former Vice President and General Counsel, Automotive Legal Affairs, Chrysler Corporation | | | 153 | | | Director, Digital Ally, Inc. (digital imaging); Director, Infinity, Inc. (oil and gas exploration and production); Director, OGE Energy Corp. (energy and energy services) | |
|
| Minor M. Shaw | | | | | | | | | |
|
225 Franklin Street
Mail Drop
BX32 05228
Boston, MA 02110
Age 64 | | Board member since 6/11 for RiverSource Funds and since 2003 for Nations Funds | | President—Micco LLC (private investments) | | | 146 | | | Former Trustee, BofA Funds Series Trust (11 funds); Board Member, Piedmont Natural Gas; Director, Blue Cross Blue Shield of South Carolina | |
|
| Alison Taunton-Rigby | | | | | | | | | |
|
901 S. Marquette Ave.
Minneapolis, MN 55402
Age 67 | | Board member since 11/02 for RiverSource Funds and since 6/11 for Nations Funds | | Chief Executive Officer and Director, RiboNovix, Inc. 2003-2010 (biotechnology); former President, Aquila Biopharmaceuticals | | | 153 | | | Director, Healthways, Inc. (health management programs); Director, ICI Mutual Insurance Company, RRG; Director, Abt Associates (government contractor) | |
|
36
Fund Governance (continued)
Interested Board Member Not Affiliated with Investment Manager*
| Name, Address, Age | | Position Held
with Funds
and Length
of Service | | Principal Occupation During Past Five Years | | Number of
Funds in the
Fund Family
Overseen by
Board Member | | Other Present or
Past Directorships/
Trusteeships
(Within Past 5 Years) | |
| Anthony M. Santomero* | | | | | | | | | |
|
225 Franklin Street
Mail Drop
BX32 05228
Boston, MA 02110
Age 65 | | Board member since 6/11 for RiverSource Funds and since 1/08 for Nations Funds | | Richard K. Mellon Professor Emeritus of Finance, The Wharton School, University of Pennsylvania, since 2002; Senior Advisor, McKinsey & Company (consulting), 2006-2008; President and Chief Executive Officer, Federal Reserve Bank of Philadelphia, 2000-2006 | | | 146 | | | Director, Renaissance Reinsurance Ltd.; Trustee, Penn Mutual Life Insurance Company; Director, Citigroup; Director, Citibank, N.A.; former Trustee, BofA Funds Series Trust (11 funds) | |
|
* Dr. Santomero is not an affiliated person of the Investment Manager or Ameriprise Financial. However, he is currently deemed by the funds to be an "interested person" (as defined in the 1940 Act) of the Funds because he serves as a Director of Citigroup, Inc. and Citibank N.A., companies that may directly or through subsidiaries and affiliates engage from time-to-time in brokerage execution, principal transactions and lending relationships with the funds or accounts advised/managed by the Investment Manager.
Interested Board Member Affiliated with Investment Manager*
| William F. Truscott | | | | | | | | | |
|
53600 Ameriprise Financial Center
Minneapolis, MN 55474
Age 51 | | Board member since 11/01 for RiverSource Funds and since 6/11 for Nations Funds; Senior Vice President since 2002 for RiverSource Funds and 5/10 for Nations Funds | | Chairman of the Board and President, Columbia Management Investment Advisers, LLC since May 2010 and February 2012, respectively (previously President, Chairman of the Board and Chief Investment Officer, 2001-April 2010); Chief Executive Officer, U.S. Asset Management & President, Annuities, Ameriprise Financial, Inc. since May 2010 (previously President—U.S. Asset Management and Chief Investment Officer, 2005-April 2010); Director, President and Chief Executive Officer, Ameriprise Certificate Company since 2006; Director and Chief Executive Officer, Columbia Management Investment Distributors, Inc. since May 2010 and February 2012, respectively (previously Chairman of the Board and Chief Executive Officer, 2006-April 2010); Chairman of the Board and Chief Executive Officer, RiverSource Distributors, Inc. since 2006. | | | 153 | | | None | |
|
* Interested person (as defined under the 1940 Act) by reason of being an officer, director, security holder and/or employee of the Investment Manager or Ameriprise Financial.
The SAI has additional information about the Fund's Board members and is available, without charge, upon request by calling 800.345.6611; contacting your financial intermediary; or visiting columbiamanagement.com.
37
Fund Governance (continued)
Officers
| Name, Year of Birth and Address | | Principal Occupation(s) During the Past Five Years | |
| J. Kevin Connaughton (Born 1964) | |
|
225 Franklin Street
Boston, MA 02110
President (since 2009) | | Senior Vice President and General Manager—Mutual Fund Products, Columbia Management Investment Advisers, LLC since May 2010; President, Columbia Funds, since 2009, and RiverSource Funds, since May 2010 (previously Senior Vice President and Chief Financial Officer, Columbia Funds, from June 2008 to January 2009, Treasurer, Columbia Funds, from October 2003 to May 2008, and senior officer of various other affiliated funds since 2000); Managing Director, Columbia Management Advisors, LLC from December 2004 to April 2010. | |
|
| Michael G. Clarke (Born 1969) | |
|
225 Franklin Street
Boston, MA 02110
Treasurer (since 2011) and Chief Financial Officer (since 2009) | | Vice President, Columbia Management Investment Advisers, LLC since May 2010; Managing Director of Fund Administration, Columbia Management Advisors, LLC, from September 2004 to April 2010; senior officer of Columbia Funds and affiliated funds since 2002. | |
|
| Scott R. Plummer (Born 1959) | |
|
5228 Ameriprise Financial Center
Minneapolis, MN 55474
Senior Vice President and Chief Legal Officer (since 2010) | | Chief Legal Officer and Assistant Secretary, Columbia Management Investment Advisers, LLC since June 2005; Vice President and Lead Chief Counsel—Asset Management, Ameriprise Financial, Inc. since May 2010 (previously Vice President and Chief Counsel—Asset Management, from 2005 to April 2010, Vice President, Chief Counsel and Assistant Secretary, Columbia Management Investment Distributors, Inc. since 2008; Vice President, General Counsel and Secretary, Ameriprise Certificate Company since 2005; Chief Counsel, RiverSource Distributors, Inc. since 2006; Senior officer of Columbia Funds and affiliated funds, since 2006. | |
|
| Thomas P. McGuire (Born 1972) | |
|
225 Franklin Street
Boston, MA 02110
Chief Compliance Officer (since 2012) | | Vice President—Asset Management Compliance, Columbia Management Investment Advisers, LLC since March 2010; Chief Compliance Officer, Ameriprise Certificate Company, since September 2010; Compliance Executive, Bank of America, from June 2005 to April 2010. | |
|
| William F. Truscott (Born 1960) | |
|
53600 Ameriprise Financial Center
Minneapolis, MN 55474
Senior Vice President (since 2010) | | Chairman of the Board and President, Columbia Management Investment Advisers, LLC since May 2010 and February 2012, respectively (previously President, Chairman of the Board and Chief Investment Officer, from 2001 to April 2010); Chief Executive Officer, U.S. Asset Management & President, Annuities, Ameriprise Financial, Inc. since May 2010 (previously President—U.S. Asset Management and Chief Investment Officer from 2005 to April 2010; Director, President and Chief Executive Officer, Ameriprise Certificate Company since 2006; Director and Chief Executive Officer, Columbia Management Investment Distributors, Inc. since May 2010 and February 2012, respectively (previously Chairman of the Board and Chief Executive Officer from 2008 to April 2010); Chairman of the Board and Chief Executive Officer, RiverSource Distributors, Inc. since 2006. | |
|
| Paul D. Pearson (Born 1956) | |
|
10468 Ameriprise Financial Center
Minneapolis, MN 55474
Vice President and Assistant Treasurer
(since 2011) | | Vice President—Investment Accounting, Columbia Management Investment Advisers, LLC, since May 2010; Vice President—Managed Assets, Investment Accounting, Ameriprise Financial Corporation, 1998-2010 | |
|
38
Fund Governance (continued)
Officers (continued)
| Name, Year of Birth and Address | | Principal Occupation(s) During the Past Five Years | |
| Colin Moore (Born 1958) | |
|
225 Franklin Street
Boston, MA 02110
Senior Vice President (since 2010) | | Director and Chief Investment Officer, Columbia Management Investment Advisers, LLC since May 2010; Manager, Managing Director and Chief Investment Officer of Columbia Management Advisors, LLC from 2007 to April 2010; Head of Equities, Columbia Management Advisors, LLC from 2002 to 2007. | |
|
| Christopher O. Petersen (Born 1970) | |
|
5228 Ameriprise Financial Center
Minneapolis, MN 55474
Vice President and Secretary (since 2011) | | Vice President and Chief Counsel, Ameriprise Financial since January 2010 (formerly Vice President and Group Counsel or Counsel from April 2004 to January 2010); Senior officer of Columbia Funds and affiliated funds, since 2007. | |
|
| Amy K. Johnson (Born 1965) | |
|
5228 Ameriprise Financial Center
Minneapolis, MN 55474
Vice President (since 2010) | | Senior Vice President and Chief Operating Officer, Columbia Management Investment Advisers, LLC since May 2010 (previously Chief Administrative Officer, from 2009 until April 2010, Vice President—Asset Management and Trust Company Services, from 2006 to 2009, and Vice President—Operations and Compliance from 2004 to 2006). | |
|
| Joseph F. DiMaria (Born 1968) | |
|
225 Franklin Street
Boston, MA 02110
Vice President (since 2011) and Chief Accounting Officer (since 2008) | | Vice President, Mutual Fund Administration, Columbia Management Investment Advisers, LLC, since May 2010; Director of Fund Administration, Columbia Management Advisors, LLC from January 2006 to April 2010. | |
|
| Paul B. Goucher (Born 1968) | |
|
100 Park Avenue
New York, NY 10017
Vice President and Assistant Secretary (since 2010) | | Vice President and Chief Counsel of Ameriprise Financial since January 2010 (formerly Vice President and Group Counsel from November 2008 to January 2010); Director, Managing Director and General Counsel of J. & W. Seligman & Co. Incorporated (Seligman) from July 2008 to November 2008 and Managing Director and Associate General Counsel of Seligman from January 2005 to July 2008. | |
|
| Michael E. DeFao (Born 1968) | |
|
225 Franklin Street
Boston, MA 02110
Vice President and Assistant Treasurer (since 2011) | | Vice President and Chief Counsel, Ameriprise Financial since May 2010; Associate General Counsel, Bank of America from June 2005 to April 2010. | |
|
| Stephen T. Welsh (Born 1957) | |
|
225 Franklin Street
Boston, MA 02110
Vice President (since 2006) | | President and Director, Columbia Management Investment Services Corp. since May 2010; President and Director, Columbia Management Services, Inc. from July 2004 to April 2010; Managing Director, Columbia Management Distributors, Inc. from August 2007 to April 2010. | |
|
39
This page intentionally left blank.
40
Important Information About This Report
The fund mails one shareholder report to each shareholder address. If you would like more than one report, please call shareholder services at 1-800-345-6611 and additional reports will be sent to you. This report has been prepared for shareholders of Columbia Marsico Focused Equities Fund.
A description of the policies and procedures that the fund uses to determine how to vote proxies and a copy of the fund's voting records are available (i) at www.columbiamanagement.com, (ii) on the Securities and Exchange Commission's website at www.sec.gov, and (iii) without charge, upon request, by calling 1-800-368-0346. Information regarding how the fund voted proxies relating to portfolio securities during the 12-month period ended June 30 is available from the SEC's website. Information regarding how the fund voted proxies relating to portfolio securities is also available from the fund's website, www.columbiamanagement.com.
The fund files a complete schedule of portfolio holdings with the SEC for the first and third quarters of each fiscal year on Form N-Q. The fund's Form N-Q is available on the SEC's website at www.sec.gov and may be reviewed and copied at the SEC's Public Reference Room in Washington, D.C. Information on the operation of the Public Reference Room may be obtained by calling 1-800-SEC-0330.
Transfer Agent
Columbia Management Investment
Services Corp.
P.O. Box 8081
Boston, MA 02266-8081
1-800-345-6611
Distributor
Columbia Management Investment
Distributors, Inc.
225 Franklin Street
Boston, MA 02110
Investment Manager
Columbia Management Investment Advisers, LLC
225 Franklin Street
Boston, MA 02110
41

Columbia Marsico Focused Equities Fund
P. O. Box 8081
Boston, MA 02266-8081
columbiamanagement.com
This information is for use with concurrent or prior delivery of a fund prospectus. Investors should consider the investment objectives, risks, charges and expenses of a mutual fund carefully before investing. For a free prospectus, which contains this and other important information about the funds, visit columbiamanagement.com. Read the prospectus carefully before investing. The Fund is distributed by Columbia Management Investment Distributors, Inc., member FINRA, and managed by Columbia Management Investment Advisers, LLC.
© 2012 Columbia Management Investment Advisers, LLC. All rights reserved.
C-1241 C (4/12)

Columbia Convertible Securities Fund
Annual Report for the Period Ended February 29, 2012
Not FDIC insured • No bank guarantee • May lose value
Table of Contents
| Fund Profile | | | 1 | | |
|
| Performance Information | | | 2 | | |
|
| Understanding Your Expenses | | | 3 | | |
|
| Portfolio Managers' Report | | | 4 | | |
|
| Portfolio of Investments | | | 6 | | |
|
Statement of Assets and
Liabilities | | | 14 | | |
|
| Statement of Operations | | | 16 | | |
|
Statement of Changes in
Net Assets | | | 17 | | |
|
| Financial Highlights | | | 19 | | |
|
| Notes to Financial Statements | | | 26 | | |
|
Report of Independent Registered
Public Accounting Firm | | | 36 | | |
|
| Federal Income Tax Information | | | 37 | | |
|
| Fund Governance | | | 38 | | |
|
Important Information About
This Report | | | 45 | | |
|
The views expressed in this report reflect the current views of the respective parties. These views are not guarantees of future performance and involve certain risks, uncertainties and assumptions that are difficult to predict, so actual outcomes and results may differ significantly from the views expressed. These views are subject to change at any time based upon economic, market or other conditions and the respective parties disclaim any responsibility to update such views. These views may not be relied on as investment advice and, because investment decisions for a Columbia Fund are based on numerous factors, may not be relied on as an indication of trading intent on behalf of any particular Columbia Fund. References to specific securities should not be construed as a recommendation or investment advice.
President's Message

Dear Shareholders,
Americans were dispirited in the fourth quarter of 2011 by Washington's inability to reach a plan for deficit reduction and Europe's piecemeal attempt to address its own fiscal issues. Yet, there was sufficient good news to encourage risk taking, buoying both stocks and bonds to solid gains.
U.S. economic data surprised on the upside and fears of recession abated. With the bar of expectations set low, investors responded positively to the announcement that the economy had expanded by 1.8% in the third quarter. Consumer confidence improved, even though consumers remain under pressure with no real increase in disposable income and a continued decline in household net worth. Headline inflation—which tracks a broad range of consumer expenditures, including food and energy—declined. Even manufacturing held its ground.
Against this backdrop, the U.S. equity markets logged solid returns. The S&P 500 Index gained 11.82%, moving into positive territory for the year with quarterly advances in all ten sectors. Mid- and small-cap stocks did even better. Value outperformed growth across all market capitalizations. Energy stocks led the market, as the price of oil moved above $100 a barrel in December. Industrials and materials stocks rose, buoyed by improving economic data. The U.S. fixed-income markets logged modest but solid returns. High-yield bonds were the best performers as the economy showed signs of improvement. Emerging market bonds were strong performers, as inflation came under control in key regions. Municipal bonds and Treasuries eked out only modest gains, as investors moved away from quality in favor of riskier assets.
While fourth quarter gains were encouraging, challenges still remain. Columbia Management, however, remains strong and steadfast. Columbia Management is the eighth largest manager of long-term mutual fund assets with $326 billion under management as of December 31, 2011. The past year has been one of considerable change for the organization as we worked diligently to align products, services and resources in the integration of Columbia Management with RiverSource Investments. The strong line-up of talent, resources and capabilities that has resulted is highlighted by the success of our products. As of December 31, 2011, Columbia Management offers 52 funds rated either 4 or 5 stars by Morningstar.*
For more information about these and other funds offered by Columbia Management, including detailed, up-to-date fund performance and portfolio information, please visit us online at columbiamanagement.com. Other information and resources available on our website include:
g timely economic analysis and market commentary
g quarterly fund commentaries
g Columbia Management Investor, a quarterly newsletter for shareholders
Thank you for your continued support of the Columbia Funds. We look forward to serving your investment needs for many years to come.
Best Regards,

J. Kevin Connaughton
President, Columbia Funds
*All ratings are based on Class Z shares as of 12/31/2011. Out of 119 Class Z share Columbia funds rated by Morningstar, 7 funds received a 5-star Overall Rating and 45 funds received a 4-star Overall Rating. The Overall Morningstar Rating for a retail mutual fund is derived from a weighted average of the performance figures associated with its 3-, 5- and 10-year (if applicable) Morningstar Rating metrics. For share classes that do not have a 3-, 5-, or 10-year actual performance history, the fund's independent Morningstar Rating metric is then compared against the retail mutual fund universe breakpoints to determine its hypothetical rating.
For each fund with at least a three-year history, Morningstar calculates a Morningstar RatingTM based on a Morningstar Risk-Adjusted Return measure that accounts for variation in a fund's monthly performance (including the effects of sales charges/loads, and redemption fees), placing more emphasis on downward variations and rewarding consistent performance. The top 10% of funds in each category receive 5 stars, the next 22.5% receive 4 stars, the next 35% receive 3 stars, the next 22.5% receive 2 stars and the bottom 10% receive 1 star. (Each share class is counted as a fraction of one fund within this scale and rated separately, which may cause slight variations in the distribution percentages.)
The Morningstar RatingTM is for Class Z shares only; other classes may have different performance characteristics and may have different ratings. ©2012 Morningstar, Inc. All Rights Reserved. The Morningstar information contained herein: (1) is proprietary to Morningstar and/or its content providers; (2) may not be copied or distributed; and (3) is not warranted to be accurate, complete or timely. Neither Morningstar nor its content providers are responsible for any damages or losses arising from any use of this information.
Investors should consider the investment objectives, risks, charges and expenses of a mutual fund carefully before investing. For a free prospectus, which contains this and other important information about the funds, visit columbiamanagement.com. The prospectus should be read carefully before investing.
Columbia Funds are distributed by Columbia Management Investment Distributors, Inc., member FINRA, and managed by Columbia Management Investment Advisers, LLC.
© 2012 Columbia Management Investment Advisers, LLC. All rights reserved.
Fund Profile – Columbia Convertible Securities Fund
Summary
g For the 12-month period that ended February 29, 2012, the fund's Class A shares returned –0.75% without sales charge.
g In a difficult environment, the fund held up better than its benchmark, the Bank of America Merrill Lynch (BofAML) All Convertibles All Qualities Index, which returned –1.10%.1
g Good security selection, especially in the information technology, materials and energy sectors, helped the fund's performance, while disappointments in the financials and health care groups detracted from results.
Portfolio Management
David L. King, lead manager, has co-managed the fund since 2010. From March 2010 until joining Columbia Management Investment Advisers, LLC (the Investment Manager) in May 2010, Mr. King was associated with the fund's previous investment adviser as an investment professional.
Yan Jin has co-managed the fund since 2006. From 2002 until joining the Investment Manager in May 2010, Mr. Jin was associated with the fund's previous investment adviser as an investment professional.
1The Bank of America Merrill Lynch All Convertibles All Qualities Index is a widely used index that measures convertible securities performance. It measures the performance of U.S. dollar-denominated convertible securities not currently in bankruptcy with a total market value greater than $50 million at issuance.
Indices are not available for investment, are not professionally managed and do not reflect sales charges, fees, brokerage commissions, taxes or other expenses of investing. Securities in the fund may not match those in an index.
Performance data quoted represents past performance and current performance may be lower or higher. Past performance is no guarantee of future results. The investment return and principal value will fluctuate so that shares, when redeemed, may be worth more or less than the original cost. Please visit www.columbiamanagement.com for daily and most recent month-end performance updates.
Summary
1-year return as of 02/29/12
| | | | –0.75% | |
|
|  | | | Class A shares
(without sales charge) | |
|
| | | | –1.10% | |
|
|  | | | BofAML All Convertibles
All Qualities Index | |
|
1
Performance Information – Columbia Convertible Securities Fund
Performance data quoted represents past performance and current performance may be lower or higher. Past performance is no guarantee of future results. The investment return and principal value will fluctuate so that shares, when redeemed, may be worth more or less than the original cost. Please visit www.columbiamanagement.com for daily and most recent month-end performance updates.
Performance of a $10,000 investment 03/01/02 – 02/29/12
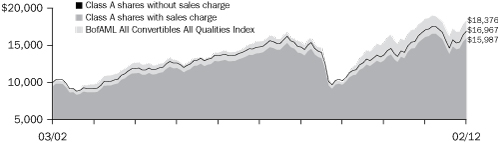
The chart above shows the change in value of a hypothetical $10,000 investment in Class A shares of Columbia Convertible Securities Fund during the stated time period, and does not reflect the deduction of taxes that a shareholder may pay on fund distributions or on the redemption of fund shares.
Performance of a $10,000 investment 03/01/02 – 02/29/12 ($)
| Sales charge | | without | | with | |
| Class A | | | 16,967 | | | | 15,987 | | |
| Class B | | | 15,732 | | | | 15,732 | | |
| Class C | | | 15,728 | | | | 15,728 | | |
| Class I* | | | 17,054 | | | | n/a | | |
| Class R* | | | 16,289 | | | | n/a | | |
| Class W* | | | 16,686 | | | | n/a | | |
| Class Z | | | 17,400 | | | | n/a | | |
Average annual total return as of 02/29/12 (%)
| Share class | | A | | B | | C | | I* | | R* | | W* | | Z | |
| Inception | | 09/25/87 | | 07/15/98 | | 10/21/96 | | 09/27/10 | | 11/16/11 | | 11/16/11 | | 05/21/99 | |
| Sales charge | | without | | with | | without | | with | | without | | with | | without | | without | | without | | without | |
| 1-year | | | –0.75 | | | | –6.46 | | | | –1.53 | | | | –6.35 | | | | –1.51 | | | | –2.47 | | | | –0.43 | | | | –1.05 | | | | –0.89 | | | | –0.56 | | |
| 5-year | | | 2.79 | | | | 1.58 | | | | 2.02 | | | | 1.69 | | | | 2.02 | | | | 2.02 | | | | 2.89 | | | | 2.38 | | | | 2.62 | | | | 3.07 | | |
| 10-year/Life | | | 5.43 | | | | 4.80 | | | | 4.64 | | | | 4.64 | | | | 4.63 | | | | 4.63 | | | | 5.48 | | | | 5.00 | | | | 5.25 | | | | 5.69 | | |
The "with sales charge" returns include the maximum initial sales charge of 5.75% for Class A shares and the applicable contingent deferred sales charge of 5.00% in the first year, declining to 1.00% in the sixth year, and eliminated thereafter for Class B shares and 1.00% for Class C shares for the first year only. The "without sales charge" returns do not include the effect of sales charges. If they had, returns would be lower.
Performance results reflect any fee waivers or reimbursements of fund expenses by Columbia Management Investment Advisers, LLC and/or any of its affiliates. Absent these fee waivers or expense reimbursement arrangements, performance results would have been lower.
All results shown assume the reinvestment of distributions. Class I and Z shares are sold at net asset value with no distribution and service (Rule 12b-1) fees. Class R shares are sold at net asset value with a distribution (12b-1) fee. Class W shares are sold at net asset value with a service (12b-1) fee. Class I, Class R, Class W and Class Z shares have limited eligibility and the investment minimum requirements may vary. Please see the fund's prospectuses for details.
Performance for different share classes will vary based on differences in sales charges and fees associated with each class.
The tables do not reflect the deduction of taxes that a shareholder may pay on fund distributions or on the redemption of fund shares.
*The returns shown for periods prior to the share class inception date (including returns since inception, which are since fund inception) include the returns of the fund's oldest share class. These returns are adjusted to reflect any higher class-related operating expenses of the newer share classes, as applicable. Please visit columbiamanagement.com/mutual-funds/appended-performance for more information.
2
Understanding Your Expenses – Columbia Convertible Securities Fund
As an investor, you incur two types of costs. There are transaction costs, which generally include sales charges on purchases and may include redemption fees. There are also ongoing costs, which generally include management fees, distribution and service (Rule 12b-1) fees, and other fund expenses. The following information is intended to help you understand your ongoing costs (in dollars) of investing in the Fund and to help you compare these costs with the ongoing costs of investing in other mutual funds.
Analyzing your fund's expenses
To illustrate these ongoing costs, we have provided examples and calculated the expenses paid by investors in each share class of the Fund during the period. The actual and hypothetical information in the table is based on an initial investment of $1,000 at the beginning of the period indicated and held for the entire period. Expense information is calculated two ways and each method provides you with different information. The amount listed in the "Actual" column is calculated using the Fund's actual operating expenses and total return for the period. You may use the Actual information, together with the amount invested, to estimate the expenses that you paid over the period. Simply divide your account value by $1,000 (for example, an $8,600 account value divided by $1,000 = 8.6), then multiply the results by the expenses paid during the period under the Actual column. The amount listed in the "Hypothetical" column assumes a 5% annual rate of return before expenses (which is not the Fund's actual return) and then applies the Fund's actual expense ratio for the period to the hypothetical return. You should not use the hypothetical account values and expenses to estimate either your actual account balance at the end of the period or the expenses you paid during the period. See "Compare with other funds" below for details on how to use the hypothetical data.
Compare with other funds
Since all mutual funds are required to include the same hypothetical calculations about expenses in shareholder reports, you can use this information to compare the ongoing cost of investing in the Fund with other funds. To do so, compare the hypothetical example with the 5% hypothetical examples that appear in the shareholder reports of other funds. As you compare hypothetical examples of other funds, it is important to note that hypothetical examples are meant to highlight the ongoing costs of investing in a fund only and do not reflect any transaction costs, such as sales charges, or redemption or exchange fees. Therefore, the hypothetical calculations are useful in comparing ongoing costs only, and will not help you determine the relative total costs of owning different funds. If transaction costs were included in these calculations, your costs would be higher.
September 1, 2011 – February 29, 2012
| | | Account value at the
beginning of the period ($) | | Account value at the
end of the period ($) | | Expenses paid
during the period ($) | | Fund's annualized
expense ratio (%) | |
| | | Actual | | Hypothetical | | Actual | | Hypothetical | | Actual | | Hypothetical | | Actual | |
| Class A | | | 1,000.00 | | | | 1,000.00 | | | | 1,086.00 | | | | 1,019.34 | | | | 5.76 | | | | 5.57 | | | | 1.11 | % | |
| Class B | | | 1,000.00 | | | | 1,000.00 | | | | 1,081.80 | | | | 1,015.61 | | | | 9.63 | | | | 9.32 | | | | 1.86 | % | |
| Class C | | | 1,000.00 | | | | 1,000.00 | | | | 1,082.80 | | | | 1,015.61 | | | | 9.63 | | | | 9.32 | | | | 1.86 | % | |
| Class I | | | 1,000.00 | | | | 1,000.00 | | | | 1,087.80 | | | | 1,021.13 | | | | 3.89 | | | | 3.77 | | | | 0.75 | % | |
| Class R | | | 1,000.00 | | | | 1,000.00 | | | | 1,095.70 | * | | | 1,018.90 | | | | 3.57 | * | | | 6.02 | | | | 1.20 | % | |
| Class W | | | 1,000.00 | | | | 1,000.00 | | | | 1,095.60 | * | | | 1,021.03 | | | | 2.29 | * | | | 3.87 | | | | 0.77 | % | |
| Class Z | | | 1,000.00 | | | | 1,000.00 | | | | 1,087.30 | | | | 1,020.59 | | | | 4.46 | | | | 4.32 | | | | 0.86 | % | |
* For the period November 16, 2011 through February 29, 2012. Class R and Class W shares commenced operations on November 16, 2011.
Expenses paid during the period are equal to the annualized expense ratio for each class as indicated above, multiplied by the average account value over the period and then multiplied by the number of days in the Fund's most recent fiscal half year and divided by 366.
Expenses do not include fees and expenses incurred indirectly by the Fund from the underlying funds in which the Fund may invest (also referred to as "acquired funds"), including affiliated and non-affiliated pooled investments vehicles (including mutual funds and exchange traded funds).
Had Columbia Management Investment Advisers, LLC and/or certain of its affiliates not waived/reimbursed certain fees and expenses, account value at the end of the period would have been reduced.
3
Portfolio Manager's Report – Columbia Convertible Securities Fund
Performance data quoted represents past performance and current performance may be lower or higher. Past performance is no guarantee of future results. The investment return and principal value will fluctuate so that shares, when redeemed, may be worth more or less than the original cost. Please visit www.columbiamanagement.com for daily and most recent month-end performance updates.
Net asset value per share
as of 02/29/12 ($)
| Class A | | | 14.99 | | |
| Class B | | | 14.72 | | |
| Class C | | | 14.95 | | |
| Class I | | | 15.02 | | |
| Class R | | | 14.99 | | |
| Class W | | | 14.98 | | |
| Class Z | | | 15.01 | | |
Distributions declared per share
03/01/11 – 02/29/12 ($)
| Class A | | | 0.42 | | |
| Class B | | | 0.31 | | |
| Class C | | | 0.31 | | |
| Class I | | | 0.46 | | |
| Class R | | | 0.12 | | |
| Class W | | | 0.13 | | |
| Class Z | | | 0.45 | | |
For the 12-month period that ended February 29, 2012, the fund's Class A shares returned negative 0.75% without sales charge. In a difficult environment, the fund held up better than its benchmark, the Bank of America Merrill Lynch All Convertibles All Qualities Index, which returned negative 1.10%. Successful security selection, led by holdings in the information technology, materials and energy sectors, helped the fund outperform the index during the period.
The U.S. economy picks up momentum
During the first half of the 12-month period, a series of natural disasters in Japan, Europe's debt problems and wrangling in Washington over the federal budget and the national debt dominated world headlines. U.S. economic news was lackluster and job growth was disappointing. However, the pace of growth picked up in the second half of the period and, as fears of a lapse back into recession faded, prospects brightened. Consumer confidence improved even though consumers remain under pressure, with no real increase in disposable income and a continued decline in household net worth. The labor markets added more than a million new jobs from September 2011 through February 2012, and the jobless rate fell to 8.3%. Headline inflation—which tracks a broad range of consumer expenditures, including food and energy—declined. Even manufacturing held its ground. A modest slowdown in manufacturing activity late in the summer of 2011 raised concern that this lynchpin of the recovery was ready to turn downward. However, manufacturing activity stabilized and the manufacturing expansion continued into 2012. Housing continues to be the one nagging weak spot in the economy. Yet, home sales edged modestly higher over the year, and there is hope that a bottom in the housing market is in sight.
Security selection drove results
Against this backdrop, the capital markets, including the convertibles market, endured a challenging and volatile period. Early in the period, convertibles struggled in the face of a host of questions about overall economic prospects. However, investors regained confidence in the closing months of the period and convertibles staged a comeback rally. Over the 12 months, we held to a consistent strategy, pursuing a bottom-up security selection process. Decisions about individual investments were heavily influenced by our professional analysis. Security selection drove returns, and sector weights had no material effect on relative performance.
Technology picks helped lift results
Several investments in convertibles issued by information technology corporations aided the fund's results relative to the index, led by voice recognition software company Nuance Communications and Equinix, operator of a global platform of data centers (1.1% and 1.2% of net assets, respectively). We took profits when software services company RightNow Technologies, a third strong technology performer, announced it was being acquired. In the materials sector, we posted a large profit in Molycorp when the stock price was peaking. We sold Molycorp convertible preferred and reallocated assets into a convertible bond. In energy, notable contributors included services provider Hornbeck Offshore and exploration-and-production firm Energy XXI (1.6% and 0.6% of net assets, respectively).
4
Portfolio Manager's Report (continued) – Columbia Convertible Securities Fund
Financials and health care holdings included disappointments
The fund's overweight in Citigroup (1.9% of net assets) held back performance when the global bank's stock dived amid intense market concerns about the effects of the sovereign debt crisis in Europe. Other financials holdings that produced disappointments included insurers Hartford Financial and MetLife (0.6% and 1.1% of net assets, respectively). Low interest rates on life and annuity products and heavy casualty losses from natural disasters handicapped insurers generally. Despite these setbacks, we maintained investments in all three companies because we believed they had good recovery potential. In health care, a notable laggard was pharmaceutical company Dendreon (2.3% of net assets). Slower-than-expected revenues from a new prostate cancer drug disappointed investors, but we retained our position because of the company's credit-worthiness and our expectation that the convertible bond should rebound in price as it approaches maturity in 2016.
Recovery in convertibles may continue
We believe the late-period rally in convertibles, which was driven by both higher stock prices and low issuance of new convertible securities, may continue. Given recent low interest rates, the convertible securities market shrunk as corporations chose to issue regular bonds rather than new convertibles. At the same time, the supply of existing convertibles contracted because of redemptions and conversions. The resulting imbalances in supply and demand relationships have been to the advantage of the owners of convertibles, who reap the benefits of higher prices. One other result, however, is that the normal defensive characteristics of convertibles may have been reduced. As prices have risen, the downside risks may have increased. Going forward, we expect to maintain our investment discipline and to continue to base our security selections on fundamental analysis of individual companies.
Most convertible securities are not investment grade and are therefore more speculative in nature than securities with higher ratings.
Portfolio breakdown1
(as of February 29, 2012)
| Convertible Bonds | | | 76.5 | % | |
| Convertible Preferred Stocks | | | 22.4 | | |
| Common Stocks | | | 1.0 | | |
| Other2 | | | 0.1 | | |
1Percentages indicated are based upon total investments (excluding Investments of Cash Collateral Received for Securities on Loan). The Fund's portfolio composition is subject to change.
2Includes investments in affiliated money market fund.
Top 10 holdings1
(as of February 29, 2012)
| EMC Corp. | | | 2.7 | % | |
| Dendreon Corp. | | | 2.3 | | |
| MGM Resorts International | | | 2.1 | | |
| Intel Corp. | | | 2.1 | | |
| Gilead Sciences, Inc. | | | 2.0 | | |
| Citigroup, Inc. | | | 2.0 | | |
| Bank of America Corp. | | | 1.8 | | |
| Health Care REIT, Inc. | | | 1.7 | | |
| Mentor Graphics Corp. | | | 1.5 | | |
| DFC Global Corp. | | | 1.4 | | |
1Percentages indicated are based upon total investments (excluding Investments of Cash Collateral Received for Securities on Loan and affiliated money market fund.).
For further detail about these holdings, please refer to the section entitled "Portfolio of Investments."
Fund holdings are as of the date given, are subject to change at any time and are not recommendations to buy or sell any security.
5
Portfolio of Investments – Columbia Convertible Securities Fund
February 29, 2012
(Percentages represent value of investments compared to net assets)
| Issuer | | Shares | | Value | |
| Common Stocks 1.0% | |
| FINANCIALS 0.6% | |
| Insurance 0.6% | |
| Hartford Financial Services Group, Inc.(a) | | | 155,000 | | | $ | 3,210,050 | | |
| TOTAL FINANCIALS | | | 3,210,050 | | |
| HEALTH CARE 0.4% | |
| Health Care Providers & Services 0.4% | |
| Lincare Holdings, Inc.(a) | | | 92,000 | | | | 2,471,120 | | |
| TOTAL HEALTH CARE | | | 2,471,120 | | |
Total Common Stocks
(Cost: $5,595,343) | | $ | 5,681,170 | | |
| Convertible Preferred Stocks 21.9% | |
| CONSUMER DISCRETIONARY 2.0% | |
| Auto Components 0.7% | |
| Goodyear Tire & Rubber Co., (The), 5.875%(a) | | | 82,600 | | | $ | 3,866,713 | | |
| Automobiles 1.3% | |
| General Motors Co., 4.750% | | | 172,000 | | | | 7,342,250 | | |
| TOTAL CONSUMER DISCRETIONARY | | | 11,208,963 | | |
| CONSUMER STAPLES 1.6% | |
| Food Products 1.6% | |
2009 Dole Food Automatic Common Exchange
Security Trust, 7.000%(b) | | | 323,025 | | | | 3,053,587 | | |
| Bunge Ltd., 4.875% | | | 61,900 | | | | 6,166,014 | | |
| Total | | | 9,219,601 | | |
| TOTAL CONSUMER STAPLES | | | 9,219,601 | | |
| ENERGY 4.0% | |
| Oil, Gas & Consumable Fuels 4.0% | |
| Apache Corp., 6.000%(a) | | | 74,000 | | | | 4,477,000 | | |
| Chesapeake Energy Corp., 5.000% | | | 73,100 | | | | 6,268,325 | | |
| Chesapeake Energy Corp., 5.750%(b) | | | 5,500 | | | | 5,885,000 | | |
| Energy XXI Bermuda Ltd., 5.625% | | | 8,500 | | | | 3,319,292 | | |
| Whiting Petroleum Corp., 6.250%(a) | | | 10,500 | | | | 2,867,760 | | |
| Total | | | 22,817,377 | | |
| TOTAL ENERGY | | | 22,817,377 | | |
| FINANCIALS 9.5% | |
| Capital Markets 0.4% | |
| UBS AG, 6.750%(a) | | | 80,000 | | | | 2,186,000 | | |
| Commercial Banks 1.4% | |
| Fifth Third Bancorp, 8.500% | | | 54,700 | | | | 7,815,263 | | |
| Diversified Financial Services 4.0% | |
| AMG Capital Trust II, 5.150% | | | 50,200 | | | | 2,130,362 | | |
| Bank of America Corp., 7.250% | | | 10,500 | | | | 9,843,750 | | |
| Citigroup, Inc., 7.500% | | | 110,500 | | | | 10,938,395 | | |
| Total | | | 22,912,507 | | |
| Insurance 1.0% | |
| MetLife, Inc., 5.000%(a) | | | 83,000 | | | | 6,000,900 | | |
| Real Estate Investment Trusts (REITs) 2.7% | |
| Alexandria Real Estate Equities, Inc., 7.000% | | | 230,000 | | | | 5,975,400 | | |
| Health Care REIT, Inc., 6.500%(a) | | | 178,200 | | | | 9,422,325 | | |
| Total | | | 15,397,725 | | |
| TOTAL FINANCIALS | | | 54,312,395 | | |
| Issuer | | Shares | | Value | |
| Convertible Preferred Stocks (continued) | |
| HEALTH CARE 0.7% | |
| Health Care Providers & Services 0.7% | |
| Omnicare Capital Trust II, 4.000% | | | 86,000 | | | $ | 4,144,125 | | |
| TOTAL HEALTH CARE | | | 4,144,125 | | |
| INDUSTRIALS 1.8% | |
| Professional Services 0.9% | |
| Nielsen Holdings NV, 6.250% | | | 90,000 | | | | 5,148,450 | | |
| Road & Rail 0.9% | |
2010 Swift Mandatory Common Exchange
Security Trust, 6.000%(b) | | | 420,000 | | | | 4,887,540 | | |
| TOTAL INDUSTRIALS | | | 10,035,990 | | |
| INFORMATION TECHNOLOGY 0.4% | |
| IT Services 0.4% | |
| Unisys Corp., 6.250%(a) | | | 38,350 | | | | 2,262,650 | | |
| TOTAL INFORMATION TECHNOLOGY | | | 2,262,650 | | |
| UTILITIES 1.9% | |
| Electric Utilities 1.9% | |
| PPL Corp., 8.750%(a) | | | 100,000 | | | | 5,338,000 | | |
| PPL Corp., 9.500% | | | 101,100 | | | | 5,556,962 | | |
| Total | | | 10,894,962 | | |
| TOTAL UTILITIES | | | 10,894,962 | | |
Total Convertible Preferred Stocks
(Cost: $125,469,970) | | $ | 124,896,063 | | |
| Issuer | | Coupon
Rate | | Principal
Amount | | Value | |
| Convertible Bonds 75.1% | |
| Aerospace & Defense 0.9% | |
| Alliant Techsystems, Inc. | |
| 08/15/24 | | | 3.000 | % | | $ | 5,030,000 | | | $ | 5,250,063 | | |
| Airlines 1.3% | |
Air Lease Corp.
Senior Unsecured(a)(b) | |
| 12/01/18 | | | 3.875 | % | | | 2,780,000 | | | | 3,063,004 | | |
Continental Airlines, Inc.
Senior Unsecured | |
| 01/15/15 | | | 4.500 | % | | | 2,450,000 | | | | 3,234,000 | | |
U.S. Airways Group, Inc.
Senior Unsecured | |
| 05/15/14 | | | 7.250 | % | | | 720,000 | | | | 1,275,300 | | |
| Total | | | | | | | | | | | 7,572,304 | | |
| Automotive 2.8% | |
Ford Motor Co.
Senior Unsecured(a) | |
| 11/15/16 | | | 4.250 | % | | | 2,750,000 | | | | 4,359,300 | | |
Navistar International Corp.
Senior Subordinated Notes | |
| 10/15/14 | | | 3.000 | % | | | 5,500,000 | | | | 6,194,375 | | |
| TRW Automotive, Inc. | |
| 12/01/15 | | | 3.500 | % | | | 3,100,000 | | | | 5,341,672 | | |
| Total | | | | | | | | | | | 15,895,347 | | |
The Accompanying Notes to Financial Statements are an integral part of this statement.
6
Columbia Convertible Securities Fund
February 29, 2012
(Percentages represent value of investments compared to net assets)
| Issuer | | Coupon
Rate | | Principal
Amount | | Value | |
| Convertible Bonds (continued) | |
| Brokerage 1.1% | |
Knight Capital Group, Inc.
Senior Subordinated Notes | |
| 03/15/15 | | | 3.500 | % | | $ | 6,300,000 | | | $ | 6,063,435 | | |
| Building Materials 1.3% | |
Cemex SAB de CV(a)(b)
Subordinated Notes | |
| 03/15/16 | | | 3.250 | % | | | 3,270,000 | | | | 2,953,464 | | |
Cemex SAB de CV(b)
Subordinated Notes | |
| 03/15/18 | | | 3.750 | % | | | 1,500,000 | | | | 1,347,600 | | |
| MasTec, Inc. | |
| 06/15/14 | | | 4.000 | % | | | 2,306,000 | | | | 3,101,570 | | |
| Total | | | | | | | | | | | 7,402,634 | | |
| Chemicals 0.1% | |
ShengdaTech, Inc.
Senior Notes(b)(c)(d)(e) | |
| 12/15/15 | | | 6.500 | % | | | 2,430,000 | | | | 362,131 | | |
| Consumer Cyclical Services 1.7% | |
Avis Budget Group, Inc.
Senior Notes | |
| 10/01/14 | | | 3.500 | % | | | 5,300,000 | | | | 6,008,875 | | |
Coinstar, Inc.
Senior Unsecured | |
| 09/01/14 | | | 4.000 | % | | | 2,160,000 | | | | 3,388,500 | | |
| Total | | | | | | | | | | | 9,397,375 | | |
| Diversified Manufacturing 1.1% | |
Sterlite Industries India Ltd.
Senior Unsecured | |
| 10/30/14 | | | 4.000 | % | | | 6,420,000 | | | | 6,018,750 | | |
| Entertainment 0.7% | |
Take-Two Interactive Software, Inc.
Senior Unsecured(b) | |
| 12/01/16 | | | 1.750 | % | | | 3,940,000 | | | | 4,218,952 | | |
| Environmental 0.8% | |
Covanta Holding Corp.
Senior Unsecured | |
| 06/01/14 | | | 3.250 | % | | | 4,000,000 | | | | 4,625,000 | | |
| Gaming 2.1% | |
| MGM Resorts International | |
| 04/15/15 | | | 4.250 | % | | | 11,150,000 | | | | 11,958,375 | | |
| Health Care 8.6% | |
Alere, Inc.
Senior Subordinated Notes(a) | |
| 05/15/16 | | | 3.000 | % | | | 7,150,000 | | | | 7,051,687 | | |
Gilead Sciences, Inc.
Senior Unsecured | |
| 05/01/16 | | | 1.625 | % | | | 9,000,000 | | | | 11,208,150 | | |
Heartware International, Inc.
Senior Unsecured(a) | |
| 12/15/17 | | | 3.500 | % | | | 2,650,000 | | | | 2,875,250 | | |
Insulet Corp.
Senior Unsecured | |
| 06/15/16 | | | 3.750 | % | | | 4,220,000 | | | | 4,513,374 | | |
| Integra LifeSciences Holdings Corp.(b) | |
| 12/15/16 | | | 1.625 | % | | | 3,180,000 | | | | 2,828,849 | | |
Molina Healthcare, Inc.
Senior Unsecured | |
| 10/01/14 | | | 3.750 | % | | | 2,700,000 | | | | 3,476,250 | | |
| Issuer | | Coupon
Rate | | Principal
Amount | | Value | |
| Convertible Bonds (continued) | |
| Health Care (cont.) | |
NuVasive, Inc.
Senior Unsecured | |
| 07/01/17 | | | 2.750 | % | | $ | 6,680,000 | | | $ | 5,771,520 | | |
| Omnicare, Inc. | |
| 12/15/25 | | | 3.750 | % | | | 1,950,000 | | | | 2,788,500 | | |
Volcano Corp.
Senior Unsecured | |
| 09/01/15 | | | 2.875 | % | | | 2,620,000 | | | | 3,106,010 | | |
WebMD Health Corp.
Senior Unsecured | |
| 01/31/18 | | | 2.500 | % | | | 5,790,000 | | | | 5,211,000 | | |
| Total | | | | | | | | | | | 48,830,590 | | |
| Home Construction 1.1% | |
| Lennar Corp.(a)(b) | |
| 11/15/21 | | | 3.250 | % | | | 5,100,000 | | | | 6,355,875 | | |
| Independent Energy 1.6% | |
| Chesapeake Energy Corp.(a) | |
| 11/15/35 | | | 2.750 | % | | | 2,720,000 | | | | 2,726,800 | | |
| Endeavour International Corp.(b) | |
| 07/15/16 | | | 5.500 | % | | | 3,450,000 | | | | 3,385,312 | | |
Newpark Resources, Inc.
Senior Unsecured | |
| 10/01/17 | | | 4.000 | % | | | 2,950,000 | | | | 3,201,488 | | |
| Total | | | | | | | | | | | 9,313,600 | | |
| Lodging 0.5% | |
Home Inns & Hotels Management, Inc.
Senior Unsecured | |
| 12/15/15 | | | 2.000 | % | | | 200,000 | | | | 167,500 | | |
Home Inns & Hotels Management, Inc.(b)
Senior Unsecured | |
| 12/15/15 | | | 2.000 | % | | | 3,020,000 | | | | 2,529,250 | | |
| Total | | | | | | | | | | | 2,696,750 | | |
| Media Cable 0.9% | |
TiVo Inc.
Senior Unsecured(b) | |
| 03/15/16 | | | 4.000 | % | | | 3,900,000 | | | | 4,962,750 | | |
| Media Non-Cable 1.0% | |
Liberty Interactive LLC
Senior Unsecured | |
| 03/15/31 | | | 3.250 | % | | | 6,500,000 | | | | 5,687,500 | | |
| Metals 3.6% | |
Horsehead Holding Corp.
Senior Notes(b) | |
| 07/01/17 | | | 3.800 | % | | | 2,970,000 | | | | 3,155,684 | | |
Jaguar Mining, Inc.
Senior Unsecured | |
| 03/31/16 | | | 5.500 | % | | | 2,840,000 | | | | 2,967,800 | | |
James River Coal Co.
Senior Unsecured(a) | |
| 12/01/15 | | | 4.500 | % | | | 5,890,000 | | | | 3,631,592 | | |
Molycorp, Inc.
Senior Unsecured(b) | |
| 06/15/16 | | | 3.250 | % | | | 5,730,000 | | | | 4,904,307 | | |
| Steel Dynamics, Inc.(a) | |
| 06/15/14 | | | 5.125 | % | | | 5,270,000 | | | | 5,994,625 | | |
| Total | | | | | | | | | | | 20,654,008 | | |
The Accompanying Notes to Financial Statements are an integral part of this statement.
7
Columbia Convertible Securities Fund
February 29, 2012
(Percentages represent value of investments compared to net assets)
| Issuer | | Coupon
Rate | | Principal
Amount | | Value | |
| Convertible Bonds (continued) | |
| Non-Captive Consumer 1.4% | |
DFC Global Corp.
Senior Unsecured | |
| 04/01/28 | | | 3.000 | % | | $ | 6,903,000 | | | $ | 7,929,821 | | |
| Oil Field Services 1.6% | |
| Hornbeck Offshore Services, Inc.(a)(f) | |
| 11/15/26 | | | 1.625 | % | | | 4,620,000 | | | | 5,062,596 | | |
| Hornbeck Offshore Services, Inc.(b)(f) | |
| 11/15/26 | | | 1.625 | % | | | 3,710,000 | | | | 4,065,418 | | |
| Total | | | | | | | | | | | 9,128,014 | | |
| Other Financial Institutions 1.9% | |
Affiliated Managers Group, Inc.
Senior Unsecured(a) | |
| 08/15/38 | | | 3.950 | % | | | 3,770,000 | | | | 4,175,275 | | |
Ares Capital Corp.
Senior Unsecured(b) | |
| 06/01/16 | | | 5.125 | % | | | 6,210,000 | | | | 6,383,073 | | |
| Total | | | | | | | | | | | 10,558,348 | | |
| Other Industry 2.7% | |
| Altra Holdings, Inc.(b) | |
| 03/01/31 | | | 2.750 | % | | | 3,390,000 | | | | 3,339,150 | | |
Central European Distribution Corp.
Senior Unsecured(a) | |
| 03/15/13 | | | 3.000 | % | | | 1,910,000 | | | | 1,523,225 | | |
| General Cable Corp. | |
| 11/15/13 | | | 0.875 | % | | | 4,290,000 | | | | 4,214,925 | | |
General Cable Corp.(f)
Subordinated Notes | |
| 11/15/29 | | | 4.500 | % | | | 1,500,000 | | | | 1,642,500 | | |
JetBlue Airways Corp.
Senior Unsecured | |
| 10/15/38 | | | 5.500 | % | | | 1,420,000 | | | | 1,814,050 | | |
| WESCO International, Inc. | |
| 09/15/29 | | | 6.000 | % | | | 1,200,000 | | | | 2,806,500 | | |
| Total | | | | | | | | | | | 15,340,350 | | |
| Packaging 0.5% | |
| Owens-Brockway Glass Container, Inc.(b) | |
| 06/01/15 | | | 3.000 | % | | | 3,000,000 | | | | 2,962,500 | | |
| Pharmaceuticals 7.1% | |
Akorn, Inc.
Senior Notes(b) | |
| 06/01/16 | | | 3.500 | % | | | 1,845,000 | | | | 2,952,000 | | |
| Corsicanto Ltd.(b) | |
| 01/15/32 | | | 3.500 | % | | | 3,600,000 | | | | 4,059,000 | | |
Dendreon Corp.
Senior Unsecured | |
| 01/15/16 | | | 2.875 | % | | | 15,520,000 | | | | 12,917,808 | | |
Human Genome Sciences, Inc.
Senior Unsecured | |
| 11/15/18 | | | 3.000 | % | | | 4,200,000 | | | | 4,167,043 | | |
InterMune, Inc.
Senior Unsecured | |
| 09/15/18 | | | 2.500 | % | | | 3,187,000 | | | | 2,673,096 | | |
| Mylan, Inc. | |
| 09/15/15 | | | 3.750 | % | | | 2,580,000 | | | | 4,853,625 | | |
Salix Pharmaceuticals Ltd.
Senior Unsecured | |
| 05/15/15 | | | 2.750 | % | | | 2,100,000 | | | | 2,772,000 | | |
| Issuer | | Coupon
Rate | | Principal
Amount | | Value | |
| Convertible Bonds (continued) | |
| Pharmaceuticals (cont.) | |
Vertex Pharmaceuticals, Inc.
Senior Subordinated Notes | |
| 10/01/15 | | | 3.350 | % | | $ | 5,300,000 | | | $ | 5,962,500 | | |
| Total | | | | | | | | | | | 40,357,072 | | |
| Railroads 1.2% | |
Greenbrier Companies, Inc.
Senior Unsecured(a)(b) | |
| 04/01/18 | | | 3.500 | % | | | 6,650,000 | | | | 6,858,478 | | |
| REITs 3.4% | |
Boston Properties LP
Senior Unsecured | |
| 05/15/36 | | | 3.750 | % | | | 4,500,000 | | | | 5,062,500 | | |
| Digital Realty Trust LP(b) | |
| 04/15/29 | | | 5.500 | % | | | 1,550,000 | | | | 2,761,906 | | |
Forest City Enterprises, Inc.
Senior Unsecured(b) | |
| 08/15/18 | | | 4.250 | % | | | 5,790,000 | | | | 5,669,858 | | |
| SL Green Operating Partnership LP(a)(b) | |
| 10/15/17 | | | 3.000 | % | | | 5,250,000 | | | | 5,860,312 | | |
| Total | | | | | | | | | | | 19,354,576 | | |
| Retailers 0.8% | |
Charming Shoppes, Inc.
Senior Unsecured | |
| 05/01/14 | | | 1.125 | % | | | 4,830,000 | | | | 4,443,600 | | |
| Technology 17.2% | |
CACI International, Inc.
Senior Subordinated Notes | |
| 05/01/14 | | | 2.125 | % | | | 3,630,000 | | | | 4,383,225 | | |
Concur Technologies, Inc.
Senior Unsecured(b) | |
| 04/15/15 | | | 2.500 | % | | | 2,300,000 | | | | 2,998,625 | | |
DST Systems, Inc.
Senior Unsecured(f) | |
| 08/15/23 | | | 0.000 | % | | | 4,500,000 | | | | 5,484,375 | | |
Digital River, Inc.
Senior Unsecured | |
| 11/01/30 | | | 2.000 | % | | | 6,310,000 | | | | 5,915,625 | | |
EMC Corp.
Senior Unsecured | |
| 12/01/13 | | | 1.750 | % | | | 8,720,000 | | | | 15,325,400 | | |
Equinix, Inc.
Subordinated Notes | |
| 10/15/14 | | | 3.000 | % | | | 5,000,000 | | | | 6,906,250 | | |
| Intel Corp. | |
| 08/01/39 | | | 3.250 | % | | | 8,500,000 | | | | 11,634,375 | | |
Ixia
Senior Notes | |
| 12/15/15 | | | 3.000 | % | | | 4,000,000 | | | | 4,350,000 | | |
Lam Research Corp.
Senior Unsecured(a)(b) | |
| 05/15/18 | | | 1.250 | % | | | 4,400,000 | | | | 4,524,344 | | |
| Mentor Graphics Corp.(b) | |
| 04/01/31 | | | 4.000 | % | | | 8,000,000 | | | | 8,499,680 | | |
Micron Technology, Inc.
Senior Unsecured(b) | |
| 08/01/31 | | | 1.500 | % | | | 4,880,000 | | | | 5,324,080 | | |
The Accompanying Notes to Financial Statements are an integral part of this statement.
8
Columbia Convertible Securities Fund
February 29, 2012
(Percentages represent value of investments compared to net assets)
| Issuer | | Coupon
Rate | | Principal
Amount | | Value | |
| Convertible Bonds (continued) | |
| Technology (cont.) | |
Novellus Systems, Inc.
Senior Unsecured(b) | |
| 05/15/41 | | | 2.625 | % | | $ | 3,000,000 | | | $ | 3,945,000 | | |
Nuance Communications, Inc.
Senior Unsecured(a)(b) | |
| 11/01/31 | | | 2.750 | % | | | 5,340,000 | | | | 6,183,560 | | |
| ON Semiconductor Corp. | |
| 12/15/26 | | | 2.625 | % | | | 3,580,000 | | | | 4,215,450 | | |
Rovi Corp.
Senior Unsecured(a) | |
| 02/15/40 | | | 2.625 | % | | | 4,450,000 | | | | 4,833,990 | | |
Salesforce.com, Inc.
Senior Unsecured | |
| 01/15/15 | | | 0.750 | % | | | 2,000,000 | | | | 3,505,000 | | |
| Total | | | | | | | | | | | 98,028,979 | | |
| Textile 1.0% | |
Iconix Brand Group, Inc.
Senior Subordinated Notes(b) | |
| 06/01/16 | | | 2.500 | % | | | 5,790,000 | | | | 5,717,509 | | |
| Tobacco 0.6% | |
Vector Group Ltd.
Senior Unsecured(f) | |
| 06/15/26 | | | 3.875 | % | | | 3,153,000 | | | | 3,641,715 | | |
| Transportation Services 1.0% | |
DryShips, Inc.
Senior Unsecured | |
| 12/01/14 | | | 5.000 | % | | | 7,000,000 | | | | 5,923,750 | | |
| Wireless 1.5% | |
InterDigital, Inc.
Senior Unsecured(b) | |
| 03/15/16 | | | 2.500 | % | | | 5,330,000 | | | | 5,478,600 | | |
Leap Wireless International, Inc.
Senior Unsecured(a) | |
| 07/15/14 | | | 4.500 | % | | | 2,970,000 | | | | 2,821,500 | | |
| Total | | | | | | | | | 8,300,100 | | |
| Wirelines 2.0% | |
Ciena Corp.
Senior Unsecured(b) | |
| 10/15/18 | | | 3.750 | % | | | 6,100,000 | | | | 6,579,765 | | |
Comtech Telecommunications Corp.
Senior Unsecured | |
| 05/01/29 | | | 3.000 | % | | | 4,300,000 | | | | 4,873,749 | | |
| Total | | | | | | | | | | | 11,453,514 | | |
Total Convertible Bonds
(Cost: $409,086,762) | | $ | 427,263,765 | | |
| | | | | Shares | | Value | |
| Money Market Funds 0.1% | |
| Columbia Short-Term Cash Fund, 0.166%(g)(h) 368,531 | | $ | 368,531 | | |
Total Money Market Funds
(Cost: $368,531) | | $ | 368,531 | | |
| Issuer | | Effective
Yield | | Par/
Principal/
Shares | | Value | |
Investments of Cash Collateral Received for Securities
on Loan 6.9% | |
| Repurchase Agreements 6.9% | |
Citigroup Global Markets, Inc.
dated 02/29/12, matures 03/01/12,
repurchase price $10,000,036(i) | |
| | | | 0.130 | % | | $ | 10,000,000 | | | $ | 10,000,000 | | |
Credit Suisse Securities (USA) LLC
dated 02/29/12, matures 03/01/12,
repurchase price $5,478,595(i) | |
| | | | 0.160 | % | | | 5,478,571 | | | | 5,478,571 | | |
Mizuho Securities USA, Inc.
dated 02/29/12, matures 03/01/12,
repurchase price $5,000,031(i) | |
| | | | 0.220 | % | | | 5,000,000 | | | | 5,000,000 | | |
Natixis Financial Products, Inc.
dated 02/29/12, matures 03/01/12,
repurchase price $5,000,031(i) | |
| | | | 0.220 | % | | | 5,000,000 | | | | 5,000,000 | | |
Nomura Securities
dated 02/29/12, matures 03/01/12,
repurchase price $11,000,061(i) | |
| | | | 0.200 | % | | | 11,000,000 | | | | 11,000,000 | | |
Pershing LLC
dated 02/29/12, matures 03/01/12,
repurchase price $3,000,024(i) | |
| | | | 0.290 | % | | | 3,000,000 | | | | 3,000,000 | | |
| Total | | | | | | | | | | | 39,478,571 | | |
Total Investments of Cash Collateral Received for Securities
on Loan
(Cost: $39,478,571) | | $ | 39,478,571 | | |
Total Investments
(Cost: $579,999,177) | | | | | | | | | | $ | 597,688,100 | | |
| Other Assets & Liabilities, Net | | | | | | | | | | | (28,300,358 | ) | |
| Net Assets | | $ | 569,387,742 | | |
| Notes to Portfolio of Investments | |
(a) At February 29, 2012, security was partially or fully on loan.
(b) Security exempt from registration pursuant to Rule 144A under the Securities Act of 1933. This security may be resold in transactions exempt from registration, normally to qualified institutional buyers. At February 29, 2012, the value of these securities amounted to $148,056,163 or 26.00% of net assets.
The Accompanying Notes to Financial Statements are an integral part of this statement.
9
Columbia Convertible Securities Fund
February 29, 2012
| Notes to Portfolio of Investments (continued) | |
(c) Identifies issues considered to be illiquid as to their marketability. The aggregate value of such securities at February 29, 2012 was $362,131, representing 0.06% of net assets. Information concerning such security holdings at February 29, 2012 was as follows:
| Security Description | | Acquisition
Dates | | Cost | |
ShengdaTech, Inc.
Senior Notes
6.500% 12/15/15 | | 12/10/10-12/21/10 | | $ | 2,434,408 | | |
(d) Represents securities that have defaulted on payment of interest. The Fund has stopped accruing interest on these securities. At February 29, 2012, the value of these securities amounted to $362,131, which represents 0.06% of net assets.
(e) Represents fair value as determined in good faith under procedures approved by the Board of Trustees. At February 29, 2012, the value of these securities amounted to $362,131, which represents 0.06% of net assets.
(f) Variable rate security. The interest rate shown reflects the rate as of February 29, 2012.
(g) The rate shown is the seven-day current annualized yield at February 29, 2012.
(h) Investments in affiliates during the year ended February 29, 2012:
| Issuer | | Beginning
Cost | | Purchase
Cost | | Sales Cost/
Proceeds
from Sales | | Realized
Gain/Loss | | Ending
Cost | | Dividends
or Interest
Income | | Value | |
Columbia Short-Term
Cash Fund | | $ | — | | | $ | 210,720,967 | | | $ | (210,352,436 | ) | | $ | — | | | $ | 368,531 | | | $ | 12,506 | | | $ | 368,531 | | |
(i) The table below represents securities received as collateral for repurchase agreements. This collateral is deposited with the Fund's custodian and, pursuant to the terms of the repurchase agreement, must have an aggregate market value greater than or equal to the repurchase price plus accrued interest at all times. The value of securities and/or cash held as collateral for repurchase agreements is monitored on a daily basis to ensure the proper level of collateral.
Citigroup Global Markets, Inc. (0.130%)
| Security Description | | Value | |
| Fannie Mae REMICS | | $ | 4,785,468 | | |
| Fannie Mae-Aces | | | 529,857 | | |
| Freddie Mac REMICS | | | 3,838,826 | | |
| Government National Mortgage Association | | | 1,045,849 | | |
| Total Market Value of Collateral Securities | | $ | 10,200,000 | | |
Credit Suisse Securities (USA) LLC (0.160%)
| Security Description | | Value | |
| Ginnie Mae I Pool | | $ | 3,922,124 | | |
| Ginnie Mae II Pool | | | 1,666,031 | | |
| Total Market Value of Collateral Securities | | $ | 5,588,155 | | |
Mizuho Securities USA, Inc. (0.220%)
| Security Description | | Value | |
| Fannie Mae Pool | | $ | 1,615,342 | | |
| Freddie Mac Gold Pool | | | 26,429 | | |
| Freddie Mac REMICS | | | 298,857 | | |
| Ginnie Mae I Pool | | | 2,001,332 | | |
| Ginnie Mae II Pool | | | 954,631 | | |
| Government National Mortgage Association | | | 203,409 | | |
| Total Market Value of Collateral Securities | | $ | 5,100,000 | | |
The Accompanying Notes to Financial Statements are an integral part of this statement.
10
Columbia Convertible Securities Fund
February 29, 2012
| Notes to Portfolio of Investments (continued) | |
Natixis Financial Products, Inc. (0.220%)
| Security Description | | Value | |
| Fannie Mae Pool | | $ | 251,534 | | |
| Fannie Mae REMICS | | | 1,873,339 | | |
| Freddie Mac Gold Pool | | | 230,300 | | |
| Freddie Mac REMICS | | | 1,104,611 | | |
| Government National Mortgage Association | | | 329,725 | | |
| United States Treasury Note/Bond | | | 1,310,522 | | |
| Total Market Value of Collateral Securities | | $ | 5,100,031 | | |
Nomura Securities (0.200%)
| Security Description | | Value | |
| Ginnie Mae II Pool | | $ | 11,220,000 | | |
| Total Market Value of Collateral Securities | | $ | 11,220,000 | | |
Pershing LLC (0.290%)
| Security Description | | Value | |
| Fannie Mae Pool | | $ | 489,761 | | |
| Fannie Mae REMICS | | | 413,015 | | |
| Fannie Mae-Aces | | | 4,162 | | |
| Federal Farm Credit Bank | | | 37,011 | | |
| Federal Home Loan Banks | | | 39,808 | | |
| Federal Home Loan Mortgage Corp | | | 93,834 | | |
| Federal National Mortgage Association | | | 115,734 | | |
| Freddie Mac Gold Pool | | | 198,735 | | |
| Freddie Mac Non Gold Pool | | | 55,505 | | |
| Freddie Mac Reference REMIC | | | 13 | | |
| Freddie Mac REMICS | | | 384,684 | | |
| Ginnie Mae I Pool | | | 502,006 | | |
| Ginnie Mae II Pool | | | 447,572 | | |
| Government National Mortgage Association | | | 160,601 | | |
| United States Treasury Note/Bond | | | 110,756 | | |
| United States Treasury Strip Coupon | | | 6,803 | | |
| Total Market Value of Collateral Securities | | $ | 3,060,000 | | |
| Fair Value Measurements | |
Generally accepted accounting principles (GAAP) require disclosure regarding the inputs and valuation techniques used to measure fair value and any changes in valuation inputs or techniques. In addition, investments shall be disclosed by major category.
The Fund categorizes its fair value measurements according to a three-level hierarchy that maximizes the use of observable inputs and minimizes the use of unobservable inputs by prioritizing that the most observable input be used when available. Observable inputs are those that market participants would use in pricing an investment based on market data obtained from sources independent of the reporting entity. Unobservable inputs are those that reflect the Fund's assumptions about the information market participants would use in pricing an investment. An investment's level within the fair value hierarchy is based on the lowest level of any input that is deemed significant to the asset or liability's fair value measurement. The input levels are not necessarily an indication of the risk or liquidity associated with investments at that level. For example, certain U.S. government securities are generally high quality and liquid, however, they are reflected as Level 2 because the inputs used to determine fair value may not always be quoted prices in an active market.
Fair value inputs are summarized in the three broad levels listed below:
• Level 1 — Valuations based on quoted prices for investments in active markets that the Fund has the ability to access at the measurement date (including NAV for open-end mutual funds). Valuation adjustments are not applied to Level 1 investments.
• Level 2 — Valuations based on other significant observable inputs (including quoted prices for similar securities, interest rates, prepayment speeds, credit risks, etc.).
• Level 3 — Valuations based on significant unobservable inputs (including the Fund's own assumptions and judgment in determining the fair value of investments).
The Accompanying Notes to Financial Statements are an integral part of this statement.
11
Columbia Convertible Securities Fund
February 29, 2012
| Fair Value Measurements (continued) | |
Inputs that are used in determining fair value of an investment may include price information, credit data, volatility statistics, and other factors. These inputs can be either observable or unobservable. The availability of observable inputs can vary between investments, and is affected by various factors such as the type of investment, and the volume and level of activity for that investment or similar investments in the marketplace. The inputs will be considered by the Investment Manager, along with any other relevant factors in the calculation of an investment's fair value. The Fund uses prices and inputs that are current as of the measurement date, which may include periods of market dislocations. During these periods, the availability of prices and inputs may be reduced for many investments. This condition could cause an investment to be reclassified between the various levels within the hierarchy.
Investments falling into the Level 3 category are primarily supported by quoted prices from brokers and dealers participating in the market for those investments. However, these may be classified as Level 3 investments due to lack of market transparency and corroboration to support these quoted prices. Additionally, valuation models may be used as the pricing source for any remaining investments classified as Level 3. These models rely on one or more significant unobservable inputs and/or significant assumptions by the Investment Manager. Inputs used in valuations may include, but are not limited to, financial statement analysis, capital account balances, discount rates and estimated cash flows, and comparable company data.
The following table is a summary of the inputs used to value the Fund's investments as of February 29, 2012:
| | | Fair Value at February 29, 2012 | |
| Description(a) | | Level 1
Quoted Prices
in Active
Markets for
Identical Assets | | Level 2
Other
Significant
Observable
Inputs(b) | | Level 3
Significant
Unobservable
Inputs | | Total | |
| Equity Securities | |
| Common Stocks | |
| Financials | | $ | 3,210,050 | | | $ | — | | | $ | — | | | $ | 3,210,050 | | |
| Health Care | | | 2,471,120 | | | | — | | | | — | | | | 2,471,120 | | |
| Convertible Preferred Stocks | |
| Consumer Discretionary | | | — | | | | 11,208,963 | | | | — | | | | 11,208,963 | | |
| Consumer Staples | | | — | | | | 9,219,601 | | | | — | | | | 9,219,601 | | |
| Energy | | | 2,867,760 | | | | 19,949,617 | | | | — | | | | 22,817,377 | | |
| Financials | | | 5,975,400 | | | | 48,336,995 | | | | — | | | | 54,312,395 | | |
| Health Care | | | — | | | | 4,144,125 | | | | — | | | | 4,144,125 | | |
| Industrials | | | — | | | | 10,035,990 | | | | — | | | | 10,035,990 | | |
| Information Technology | | | — | | | | 2,262,650 | | | | — | | | | 2,262,650 | | |
| Utilities | | | — | | | | 10,894,962 | | | | — | | | | 10,894,962 | | |
| Total Equity Securities | | | 14,524,330 | | | | 116,052,903 | | | | — | | | | 130,577,233 | | |
| Bonds | |
| Convertible Bonds | | | — | | | | 426,901,634 | | | | 362,131 | | | | 427,263,765 | | |
| Total Bonds | | | — | | | | 426,901,634 | | | | 362,131 | | | | 427,263,765 | | |
| Other | |
| Money Market Funds | | | 368,531 | | | | — | | | | — | | | | 368,531 | | |
| Investments of Cash Collateral Received for Securities on Loan | | | — | | | | 39,478,571 | | | | — | | | | 39,478,571 | | |
| Total Other | | | 368,531 | | | | 39,478,571 | | | | — | | | | 39,847,102 | | |
| Total | | $ | 14,892,861 | | | $ | 582,433,108 | | | $ | 362,131 | | | $ | 597,688,100 | | |
The Fund's assets assigned to the Level 2 input category are generally valued using the market approach, in which a security's value is determined through reference to prices and information from market transactions for similar or identical assets.
The Fund's assets assigned to the Level 3 category are valued utilizing the valuation technique deemed the most appropriate in the circumstances. Certain Convertible Bonds classified as Level 3 are valued using a market approach. To determine fair value for these securities, management considered various factors which may have included, but were not limited to, trades of similar securities, estimated earnings of the respective company, market multiples derived from a set of comparable companies, and the position of the security within the respective company's capital structure.
(a) See the Portfolio of Investments for all investment classifications not indicated in the table.
(b) There were no significant transfers between Levels 1 and 2 during the period.
The Accompanying Notes to Financial Statements are an integral part of this statement.
12
Columbia Convertible Securities Fund
February 29, 2012
| Fair Value Measurements (continued) | |
The following table is a reconciliation of Level 3 assets for which significant unobservable inputs were used to determine fair value.
| | | Convertible Bonds | |
| Balance as of February 28, 2011 | | $ | — | | |
| Accrued discounts/premiums | | | — | | |
| Realized gain (loss) | | | — | | |
| Change in unrealized appreciation (depreciation)* | | | (2,016,232 | ) | |
| Sales | | | — | | |
| Purchases | | | — | | |
| Transfers into Level 3 | | | 2,378,363 | | |
| Transfers out of Level 3 | | | — | | |
| Balance as of February 29, 2012 | | $ | 362,131 | | |
* Change in unrealized appreciation (depreciation) relating to securities held at February 29, 2012 was $(2,016,232).
Financial Assets were transferred from Level 2 to Level 3 due to utilizing a market approach to value the assets. As a result, as of period end, management determined to fair value the security under consistently applied procedures established by and under the general supervision of the Board of Trustees.
Transfers in and/or out of Level 3 are determined based on the fair value at the beginning of the period for security positions held throughout the period.
The Accompanying Notes to Financial Statements are an integral part of this statement.
13
Statement of Assets and Liabilities – Columbia Convertible Securities Fund
February 29, 2012
| Assets | |
| Investments, at value* | |
| Unaffiliated issuers (identified cost $540,152,075) | | $ | 557,840,998 | | |
| Affiliated issuers (identified cost $368,531) | | | 368,531 | | |
| Investment of cash collateral received for securities on loan | |
| Repurchase agreements (identified cost $39,478,571) | | | 39,478,571 | | |
| Total investments (identified cost $579,999,177) | | | 597,688,100 | | |
| Receivable for: | |
| Investments sold | | | 20,882,351 | | |
| Capital shares sold | | | 230,192 | | |
| Dividends | | | 332,651 | | |
| Interest | | | 3,666,097 | | |
| Reclaims | | | 8,922 | | |
| Expense reimbursement due from Investment Manager | | | 1,810 | | |
| Prepaid expense | | | 8,922 | | |
| Total assets | | | 622,819,045 | | |
| Liabilities | |
| Due upon return of securities on loan | | | 39,478,571 | | |
| Due to custodian | | | 6,687,713 | | |
| Payable for: | |
| Investments purchased | | | 6,147,629 | | |
| Capital shares purchased | | | 901,550 | | |
| Investment management fees | | | 11,789 | | |
| Distribution and service fees | | | 2,229 | | |
| Transfer agent fees | | | 51,132 | | |
| Administration fees | | | 928 | | |
| Other expenses | | | 149,762 | | |
| Total liabilities | | | 53,431,303 | | |
| Net assets applicable to outstanding capital stock | | $ | 569,387,742 | | |
The Accompanying Notes to Financial Statements are an integral part of this statement.
14
Statement of Assets and Liabilities (continued) – Columbia Convertible Securities Fund
February 29, 2012
| Represented by | |
| Paid-in capital | | $ | 607,981,981 | | |
| Undistributed net investment income | | | 2,642,988 | | |
| Accumulated net realized loss | | | (58,926,150 | ) | |
| Unrealized appreciation (depreciation) on: | |
| Investments | | | 17,688,923 | | |
| Total — representing net assets applicable to outstanding capital stock | | $ | 569,387,742 | | |
| *Value of securities on loan | | $ | 37,676,682 | | |
| Net assets applicable to outstanding shares | |
| Class A | | $ | 198,720,618 | | |
| Class B | | $ | 3,101,914 | | |
| Class C | | $ | 20,126,584 | | |
| Class I | | $ | 186,159,898 | | |
| Class R | | $ | 2,067,797 | | |
| Class W | | $ | 28,830,485 | | |
| Class Z | | $ | 130,380,446 | | |
| Shares outstanding | |
| Class A | | | 13,256,950 | | |
| Class B | | | 210,696 | | |
| Class C | | | 1,346,623 | | |
| Class I | | | 12,393,274 | | |
| Class R | | | 137,990 | | |
| Class W | | | 1,924,267 | | |
| Class Z | | | 8,685,803 | | |
| Net asset value per share | |
| Class A(a) | | $ | 14.99 | | |
| Class B | | $ | 14.72 | | |
| Class C | | $ | 14.95 | | |
| Class I | | $ | 15.02 | | |
| Class R | | $ | 14.99 | | |
| Class W | | $ | 14.98 | | |
| Class Z | | $ | 15.01 | | |
(a) The maximum offering price per share for Class A is $15.90. The offering price is calculated by dividing the net asset value by 1.0 minus the maximum sales charge of 5.75%.
The Accompanying Notes to Financial Statements are an integral part of this statement.
15
Statement of Operations – Columbia Convertible Securities Fund
Year ended February 29, 2012
| Net investment income | |
| Income: | |
| Dividends | | $ | 7,704,214 | | |
| Interest | | | 12,989,000 | | |
| Dividends from affiliates | | | 12,506 | | |
| Income from securities lending — net | | | 150,524 | | |
| Foreign taxes withheld | | | (12,646 | ) | |
| Total income | | | 20,843,598 | | |
| Expenses: | |
| Investment management fees | | | 3,779,233 | | |
| Distribution fees | |
| Class B | | | 47,371 | | |
| Class C | | | 147,590 | | |
| Class R | | | 954 | | |
| Service fees | |
| Class B | | | 15,791 | | |
| Class C | | | 49,196 | | |
| Class W | | | 3,946 | | |
| Distribution and service fees — Class A | | | 510,716 | | |
| Transfer agent fees | |
| Class A | | | 353,286 | | |
| Class B | | | 10,774 | | |
| Class C | | | 34,012 | | |
| Class R | | | 356 | | |
| Class W | | | 2,955 | | |
| Class Z | | | 250,203 | | |
| Administration fees | | | 468,787 | | |
| Compensation of board members | | | 16,356 | | |
| Pricing and bookkeeping fees | | | 40,806 | | |
| Custodian fees | | | 16,250 | | |
| Registration fees | | | 108,516 | | |
| Chief compliance officer expenses | | | 140 | | |
| Other | | | 2,657 | | |
| Total expenses | | | 5,859,895 | | |
| Fees waived or expenses reimbursed by Investment Manager and its affiliates | | | (661,525 | ) | |
| Expense reductions | | | (2,273 | ) | |
| Total net expenses | | | 5,196,097 | | |
| Net investment income | | | 15,647,501 | | |
| Realized and unrealized gain (loss) — net | |
| Net realized gain (loss) on: | |
| Investments | | | 16,675,985 | | |
| Net realized gain | | | 16,675,985 | | |
| Net change in unrealized appreciation (depreciation) on: | |
| Investments | | | (40,544,999 | ) | |
| Net change in unrealized depreciation | | | (40,544,999 | ) | |
| Net realized and unrealized loss | | | (23,869,014 | ) | |
| Net decrease in net assets from operations | | $ | (8,221,513 | ) | |
The Accompanying Notes to Financial Statements are an integral part of this statement.
16
Statement of Changes in Net Assets – Columbia Convertible Securities Fund
| | | Year ended
February 29,
2012(a) | | Year ended
February 28,
2011(b) | |
| Operations | |
| Net investment income | | $ | 15,647,501 | | | $ | 13,930,644 | | |
| Net realized gain | | | 16,675,985 | | | | 39,036,443 | | |
| Net change in unrealized appreciation (depreciation) | | | (40,544,999 | ) | | | 41,939,324 | | |
| Net increase (decrease) in net assets resulting from operations | | | (8,221,513 | ) | | | 94,906,411 | | |
| Distributions to shareholders from: | |
| Net investment income | |
| Class A | | | (5,825,865 | ) | | | (7,009,024 | ) | |
| Class B | | | (130,520 | ) | | | (477,313 | ) | |
| Class C | | | (409,894 | ) | | | (567,892 | ) | |
| Class I | | | (4,448,990 | ) | | | (59,986 | ) | |
| Class R | | | (22 | ) | | | — | | |
| Class W | | | (23 | ) | | | — | | |
| Class Z | | | (4,429,884 | ) | | | (6,617,790 | ) | |
| Total distributions to shareholders | | | (15,245,198 | ) | | | (14,732,005 | ) | |
| Increase (decrease) in net assets from share transactions | | | 84,968,676 | | | | (6,388,716 | ) | |
| Total increase in net assets | | | 61,501,965 | | | | 73,785,690 | | |
| Net assets at beginning of year | | | 507,885,777 | | | | 434,100,087 | | |
| Net assets at end of year | | $ | 569,387,742 | | | $ | 507,885,777 | | |
| Undistributed net investment income | | $ | 2,642,988 | | | $ | 1,966,224 | | |
(a) Class R and Class W shares are for the period from November 16, 2011 (commencement of operations) to February 29, 2012.
(b) Class I shares are for the period from September 27, 2010 (commencement of operations) to February 28, 2011.
The Accompanying Notes to Financial Statements are an integral part of this statement.
17
Statement of Changes in Net Assets (continued) – Columbia Convertible Securities Fund
| | | Year ended February 29,
2012(a) | | Year ended February 28,
2011(b) | |
| | | Shares | | Dollars ($) | | Shares | | Dollars ($) | |
| Capital stock activity | |
| Class A shares | |
| Subscriptions(c) | | | 2,272,231 | | | | 33,487,733 | | | | 2,925,492 | | | | 41,348,161 | | |
| Distributions reinvested | | | 158,265 | | | | 2,252,369 | | | | 305,724 | | | | 4,103,577 | | |
| Redemptions | | | (3,615,035 | ) | | | (52,730,837 | ) | | | (3,610,304 | ) | | | (49,802,514 | ) | |
| Net decrease | | | (1,184,539 | ) | | | (16,990,735 | ) | | | (379,088 | ) | | | (4,350,776 | ) | |
| Class B shares | |
| Subscriptions | | | 21,036 | | | | 302,932 | | | | 26,723 | | | | 371,670 | | |
| Distributions reinvested | | | 2,689 | | | | 38,136 | | | | 19,289 | | | | 253,216 | | |
| Redemptions(c) | | | (604,151 | ) | | | (8,791,016 | ) | | | (1,155,008 | ) | | | (15,586,826 | ) | |
| Net decrease | | | (580,426 | ) | | | (8,449,948 | ) | | | (1,108,996 | ) | | | (14,961,940 | ) | |
| Class C shares | |
| Subscriptions | | | 338,701 | | | | 5,009,845 | | | | 189,350 | | | | 2,685,171 | | |
| Distributions reinvested | | | 13,798 | | | | 195,556 | | | | 20,947 | | | | 283,145 | | |
| Redemptions | | | (406,435 | ) | | | (5,811,801 | ) | | | (370,334 | ) | | | (5,152,765 | ) | |
| Net decrease | | | (53,936 | ) | | | (606,400 | ) | | | (160,037 | ) | | | (2,184,449 | ) | |
| Class I shares | |
| Subscriptions | | | 10,082,655 | | | | 149,501,517 | | | | 6,348,957 | | | | 93,563,351 | | |
| Distributions reinvested | | | 317,539 | | | | 4,448,906 | | | | 4,104 | | | | 59,960 | | |
| Redemptions | | | (3,325,698 | ) | | | (46,905,955 | ) | | | (1,034,283 | ) | | | (15,670,265 | ) | |
| Net increase | | | 7,074,496 | | | | 107,044,468 | | | | 5,318,778 | | | | 77,953,046 | | |
| Class R shares | |
| Subscriptions | | | 143,409 | | | | 2,071,722 | | | | — | | | | — | | |
| Redemptions | | | (5,419 | ) | | | (81,051 | ) | | | — | | | | — | | |
| Net increase | | | 137,990 | | | | 1,990,671 | | | | — | | | | — | | |
| Class W shares | |
| Subscriptions | | | 1,944,273 | | | | 29,221,765 | | | | — | | | | — | | |
| Redemptions | | | (20,006 | ) | | | (300,253 | ) | | | — | | | | — | | |
| Net increase | | | 1,924,267 | | | | 28,921,512 | | | | — | | | | — | | |
| Class Z shares | |
| Subscriptions | | | 4,751,824 | | | | 70,147,549 | | | | 4,958,784 | | | | 70,327,339 | | |
| Distributions reinvested | | | 90,235 | | | | 1,304,380 | | | | 184,776 | | | | 2,531,641 | | |
| Redemptions | | | (6,852,715 | ) | | | (98,392,821 | ) | | | (9,793,941 | ) | | | (135,703,577 | ) | |
| Net decrease | | | (2,010,656 | ) | | | (26,940,892 | ) | | | (4,650,381 | ) | | | (62,844,597 | ) | |
| Total net increase (decrease) | | | 5,307,196 | | | | 84,968,676 | | | | (979,724 | ) | | | (6,388,716 | ) | |
(a) Class R and Class W shares are for the period from November 16, 2011 (commencement of operations) to February 29, 2012.
(b) Class I shares are for the period from September 27, 2010 (commencement of operations) to February 28, 2011.
(c) Includes conversions of Class B shares to Class A shares, if any.
The Accompanying Notes to Financial Statements are an integral part of this statement.
18
Financial Highlights – Columbia Convertible Securities Fund
The following tables are intended to help you understand the Fund's financial performance. Certain information reflects financial results for a single share of a class held for the periods shown. Per share net investment income (loss) amounts are calculated based on average shares outstanding during the period. Total returns assume reinvestment of all dividends and distributions. Total returns do not reflect payments of sales charges, if any, and are not annualized for periods of less than one year.
| | | Year ended
Feb. 29, | | Year ended Feb. 28, | | Year ended
Feb. 29, | |
| | | 2012 | | 2011 | | 2010 | | 2009 | | 2008 | |
| Class A | |
| Per share data | |
| Net asset value, beginning of period | | $ | 15.55 | | | $ | 12.92 | | | $ | 9.93 | | | $ | 14.90 | | | $ | 16.62 | | |
| Income from investment operations: | |
| Net investment income | | | 0.42 | | | | 0.45 | | | | 0.34 | | | | 0.29 | | | | 0.32 | | |
| Net realized and unrealized gain (loss) | | | (0.56 | ) | | | 2.67 | | | | 2.99 | | | | (4.73 | ) | | | (0.27 | ) | |
| Total from investment operations | | | (0.14 | ) | | | 3.12 | | | | 3.33 | | | | (4.44 | ) | | | 0.05 | | |
| Less distributions to shareholders from: | |
| Net investment income | | | (0.42 | ) | | | (0.49 | ) | | | (0.34 | ) | | | (0.30 | ) | | | (0.38 | ) | |
| Net realized gains | | | — | | | | — | | | | — | | | | (0.23 | ) | | | (1.39 | ) | |
| Total distributions to shareholders | | | (0.42 | ) | | | (0.49 | ) | | | (0.34 | ) | | | (0.53 | ) | | | (1.77 | ) | |
| Proceeds from regulatory settlement | | | — | | | | — | | | | 0.00 | (a) | | | — | | | | — | | |
| Net asset value, end of period | | $ | 14.99 | | | $ | 15.55 | | | $ | 12.92 | | | $ | 9.93 | | | $ | 14.90 | | |
| Total return | | | (0.75 | %) | | | 24.72 | % | | | 33.91 | % | | | (30.64 | %) | | | (0.22 | %) | |
| Ratios to average net assets(b) | |
| Expenses prior to fees waived or expenses reimbursed (including interest expense) | | | 1.27 | % | | | 1.31 | %(c) | | | 1.24 | % | | | 1.24 | %(c) | | | 1.19 | %(c) | |
| Net expenses after fees waived or expenses reimbursed (including interest expense)(d) | | | 1.12 | %(e) | | | 1.15 | %(c)(e) | | | 1.20 | %(e) | | | 1.21 | %(c)(e) | | | 1.18 | %(c)(e) | |
| Expenses prior to fees waived or expenses reimbursed (excluding interest expense) | | | 1.27 | % | | | 1.31 | % | | | 1.24 | % | | | 1.24 | % | | | 1.19 | % | |
| Net expenses after fees waived or expenses reimbursed (excluding interest expense)(d) | | | 1.12 | %(e) | | | 1.15 | %(e) | | | 1.20 | %(e) | | | 1.21 | %(e) | | | 1.18 | %(e) | |
| Net investment income | | | 2.86 | %(e) | | | 3.27 | %(e) | | | 2.88 | %(e) | | | 2.33 | %(e) | | | 1.91 | %(e) | |
| Supplemental data | |
| Net assets, end of period (in thousands) | | $ | 198,721 | | | $ | 224,608 | | | $ | 191,414 | | | $ | 154,987 | | | $ | 274,370 | | |
| Portfolio turnover | | | 66 | % | | | 118 | % | | | 117 | % | | | 92 | % | | | 77 | % | |
| Notes to Financial Highlights | |
(a) Rounds to less than $0.01.
(b) In addition to the fees and expenses which the Fund bears directly, the Fund indirectly bears a pro rata share of the fees and expenses of the acquired funds in which it invests. Such indirect expenses are not included in the reported expense ratios.
(c) Includes interest expense which rounds to less than 0.01%.
(d) The Investment Manager and certain of its affiliates agreed to waive/reimburse certain fees and expenses, if applicable.
(e) The benefits derived from expense reductions had an impact of less than 0.01%.
The Accompanying Notes to Financial Statements are an integral part of this statement.
19
Financial Highlights (continued) – Columbia Convertible Securities Fund
| | | Year ended
Feb. 29, | | Year ended Feb. 28, | | Year ended
Feb. 29, | |
| | | 2012 | | 2011 | | 2010 | | 2009 | | 2008 | |
| Class B | |
| Per share data | |
| Net asset value, beginning of period | | $ | 15.28 | | | $ | 12.70 | | | $ | 9.77 | | | $ | 14.66 | | | $ | 16.37 | | |
| Income from investment operations: | |
| Net investment income | | | 0.30 | | | | 0.35 | | | | 0.24 | | | | 0.19 | | | | 0.19 | | |
| Net realized and unrealized gain (loss) | | | (0.55 | ) | | | 2.62 | | | | 2.94 | | | | (4.65 | ) | | | (0.26 | ) | |
| Total from investment operations | | | (0.25 | ) | | | 2.97 | | | | 3.18 | | | | (4.46 | ) | | | (0.07 | ) | |
| Less distributions to shareholders from: | |
| Net investment income | | | (0.31 | ) | | | (0.39 | ) | | | (0.25 | ) | | | (0.20 | ) | | | (0.25 | ) | |
| Net realized gains | | | — | | | | — | | | | — | | | | (0.23 | ) | | | (1.39 | ) | |
| Total distributions to shareholders | | | (0.31 | ) | | | (0.39 | ) | | | (0.25 | ) | | | (0.43 | ) | | | (1.64 | ) | |
| Proceeds from regulatory settlement | | | — | | | | — | | | | 0.00 | (a) | | | — | | | | — | | |
| Net asset value, end of period | | $ | 14.72 | | | $ | 15.28 | | | $ | 12.70 | | | $ | 9.77 | | | $ | 14.66 | | |
| Total return | | | (1.53 | %) | | | 23.83 | % | | | 32.86 | % | | | (31.14 | %) | | | (0.92 | %) | |
| Ratios to average net assets(b) | |
| Expenses prior to fees waived or expenses reimbursed (including interest expense) | | | 2.04 | % | | | 2.06 | %(c) | | | 1.99 | % | | | 1.99 | %(c) | | | 1.94 | %(c) | |
| Net expenses after fees waived or expenses reimbursed (including interest expense)(d) | | | 1.88 | %(e) | | | 1.90 | %(c)(e) | | | 1.95 | %(e) | | | 1.96 | %(c)(e) | | | 1.93 | %(c)(e) | |
| Expenses prior to fees waived or expenses reimbursed (excluding interest expense) | | | 2.04 | % | | | 2.06 | % | | | 1.99 | % | | | 1.99 | % | | | 1.94 | % | |
| Net expenses after fees waived or expenses reimbursed (excluding interest expense)(d) | | | 1.88 | %(e) | | | 1.90 | %(e) | | | 1.95 | %(e) | | | 1.96 | %(e) | | | 1.93 | %(e) | |
| Net investment income | | | 2.04 | %(e) | | | 2.61 | %(e) | | | 2.10 | %(e) | | | 1.53 | %(e) | | | 1.16 | %(e) | |
| Supplemental data | |
| Net assets, end of period (in thousands) | | $ | 3,102 | | | $ | 12,089 | | | $ | 24,126 | | | $ | 31,792 | | | $ | 74,074 | | |
| Portfolio turnover | | | 66 | % | | | 118 | % | | | 117 | % | | | 92 | % | | | 77 | % | |
| Notes to Financial Highlights | |
(a) Rounds to less than $0.01.
(b) In addition to the fees and expenses which the Fund bears directly, the Fund indirectly bears a pro rata share of the fees and expenses of the acquired funds in which it invests. Such indirect expenses are not included in the reported expense ratios.
(c) Includes interest expense which rounds to less than 0.01%.
(d) The Investment Manager and certain of its affiliates agreed to waive/reimburse certain fees and expenses, if applicable.
(e) The benefits derived from expense reductions had an impact of less than 0.01%.
The Accompanying Notes to Financial Statements are an integral part of this statement.
20
Financial Highlights (continued) – Columbia Convertible Securities Fund
| | | Year ended
Feb. 29, | | Year ended Feb. 28, | | Year ended
Feb. 29, | |
| | | 2012 | | 2011 | | 2010 | | 2009 | | 2008 | |
| Class C | |
| Per share data | |
| Net asset value, beginning of period | | $ | 15.51 | | | $ | 12.88 | | | $ | 9.91 | | | $ | 14.86 | | | $ | 16.58 | | |
| Income from investment operations: | |
| Net investment income | | | 0.31 | | | | 0.35 | | | | 0.25 | | | | 0.20 | | | | 0.19 | | |
| Net realized and unrealized gain (loss) | | | (0.56 | ) | | | 2.67 | | | | 2.97 | | | | (4.72 | ) | | | (0.27 | ) | |
| Total from investment operations | | | (0.25 | ) | | | 3.02 | | | | 3.22 | | | | (4.52 | ) | | | (0.08 | ) | |
| Less distributions to shareholders from: | |
| Net investment income | | | (0.31 | ) | | | (0.39 | ) | | | (0.25 | ) | | | (0.20 | ) | | | (0.25 | ) | |
| Net realized gains | | | — | | | | — | | | | — | | | | (0.23 | ) | | | (1.39 | ) | |
| Total distributions to shareholders | | | (0.31 | ) | | | (0.39 | ) | | | (0.25 | ) | | | (0.43 | ) | | | (1.64 | ) | |
| Proceeds from regulatory settlement | | | — | | | | — | | | | 0.00 | (a) | | | — | | | | — | | |
| Net asset value, end of period | | $ | 14.95 | | | $ | 15.51 | | | $ | 12.88 | | | $ | 9.91 | | | $ | 14.86 | | |
| Total return | | | (1.51 | %) | | | 23.88 | % | | | 32.80 | % | | | (31.13 | %) | | | (0.97 | %) | |
| Ratios to average net assets(b) | |
| Expenses prior to fees waived or expenses reimbursed (including interest expense) | | | 2.02 | % | | | 2.06 | %(c) | | | 1.99 | % | | | 1.99 | %(c) | | | 1.94 | %(c) | |
| Net expenses after fees waived or expenses reimbursed (including interest expense)(d) | | | 1.87 | %(e) | | | 1.90 | %(c)(e) | | | 1.95 | %(e) | | | 1.96 | %(c)(e) | | | 1.93 | %(c)(e) | |
| Expenses prior to fees waived or expenses reimbursed (excluding interest expense) | | | 2.02 | % | | | 2.06 | % | | | 1.99 | % | | | 1.99 | % | | | 1.94 | % | |
| Net expenses after fees waived or expenses reimbursed (excluding interest expense)(d) | | | 1.87 | %(e) | | | 1.90 | %(e) | | | 1.95 | %(e) | | | 1.96 | %(e) | | | 1.93 | %(e) | |
| Net investment income | | | 2.10 | %(e) | | | 2.53 | %(e) | | | 2.12 | %(e) | | | 1.54 | %(e) | | | 1.16 | %(e) | |
| Supplemental data | |
| Net assets, end of period (in thousands) | | $ | 20,127 | | | $ | 21,717 | | | $ | 20,103 | | | $ | 18,239 | | | $ | 38,320 | | |
| Portfolio turnover | | | 66 | % | | | 118 | % | | | 117 | % | | | 92 | % | | | 77 | % | |
| Notes to Financial Highlights | |
(a) Rounds to less than $0.01.
(b) In addition to the fees and expenses which the Fund bears directly, the Fund indirectly bears a pro rata share of the fees and expenses of the acquired funds in which it invests. Such indirect expenses are not included in the reported expense ratios.
(c) Includes interest expense which rounds to less than 0.01%.
(d) The Investment Manager and certain of its affiliates agreed to waive/reimburse certain fees and expenses, if applicable.
(e) The benefits derived from expense reductions had an impact of less than 0.01%.
The Accompanying Notes to Financial Statements are an integral part of this statement.
21
Financial Highlights (continued) – Columbia Convertible Securities Fund
| | | Year ended
Feb. 29,
2012 | | Year ended
Feb. 28,
2011(a) | |
| Class I | |
| Per share data | |
| Net asset value, beginning of period | | $ | 15.58 | | | $ | 13.69 | | |
| Income from investment operations: | |
| Net investment income | | | 0.47 | | | | 0.17 | | |
| Net realized and unrealized gain (loss) | | | (0.57 | ) | | | 1.86 | | |
| Total from investment operations | | | (0.10 | ) | | | 2.03 | | |
| Less distributions to shareholders from: | |
| Net investment income | | | (0.46 | ) | | | (0.14 | ) | |
| Total distributions to shareholders | | | (0.46 | ) | | | (0.14 | ) | |
| Net asset value, end of period | | $ | 15.02 | | | $ | 15.58 | | |
| Total return | | | (0.43 | %) | | | 14.92 | % | |
| Ratios to average net assets(b) | |
| Expenses prior to fees waived or expenses reimbursed | | | 0.84 | % | | | 0.90 | %(c) | |
| Net expenses after fees waived or expenses reimbursed(d) | | | 0.77 | % | | | 0.86 | %(c)(e) | |
| Net investment income | | | 3.28 | % | | | 2.63 | %(c)(e) | |
| Supplemental data | |
| Net assets, end of period (in thousands) | | $ | 186,160 | | | $ | 82,875 | | |
| Portfolio turnover | | | 66 | % | | | 118 | % | |
| Notes to Financial Highlights | |
(a) For the period from September 27, 2010 (commencement of operations) to February 28, 2011.
(b) In addition to the fees and expenses which the Fund bears directly, the Fund indirectly bears a pro rata share of the fees and expenses of the acquired funds in which it invests. Such indirect expenses are not included in the reported expense ratios.
(c) Annualized.
(d) The Investment Manager and certain of its affiliates agreed to waive/reimburse certain fees and expenses, if applicable.
(e) The benefits derived from expense reductions had an impact of less than 0.01%.
The Accompanying Notes to Financial Statements are an integral part of this statement.
22
Financial Highlights (continued) – Columbia Convertible Securities Fund
| | | Year ended
Feb. 29, 2012(a) | |
| Class R | |
| Per share data | |
| Net asset value, beginning of period | | $ | 13.80 | | |
| Income from investment operations: | |
| Net investment income | | | 0.11 | | |
| Net realized and unrealized gain | | | 1.20 | (b) | |
| Total from investment operations | | | 1.31 | | |
| Less distributions to shareholders from: | |
| Net investment income | | | (0.12 | ) | |
| Total distributions to shareholders | | | (0.12 | ) | |
| Net asset value, end of period | | $ | 14.99 | | |
| Total return | | | 9.57 | % | |
| Ratios to average net assets(c) | |
| Expenses prior to fees waived or expenses reimbursed | | | 1.28 | %(d) | |
| Net expenses after fees waived or expenses reimbursed(e) | | | 1.20 | %(d) | |
| Net investment income | | | 2.64 | %(d) | |
| Supplemental data | |
| Net assets, end of period (in thousands) | | $ | 2,068 | | |
| Portfolio turnover | | | 66 | % | |
| Notes to Financial Highlights | |
(a) For the period from November 16, 2011 (commencement of operations) to February 29, 2012.
(b) Calculation of the net gain per share (both realized and unrealized) does not correlate to the aggregate realized and unrealized gains presented in the Statement of Operations due to the timing of sales and repurchases of Fund shares in relation to fluctuations in the market value of the portfolio.
(c) In addition to the fees and expenses which the Fund bears directly, the Fund indirectly bears a pro rata share of the fees and expenses of the acquired funds in which it invests. Such indirect expenses are not included in the reported expense ratios.
(d) Annualized.
(e) The Investment Manager and certain of its affiliates agreed to waive/reimburse certain fees and expenses, if applicable.
The Accompanying Notes to Financial Statements are an integral part of this statement.
23
Financial Highlights (continued) – Columbia Convertible Securities Fund
| | | Year ended
Feb. 29, 2012(a) | |
| Class W | |
| Per share data | |
| Net asset value, beginning of period | | $ | 13.80 | | |
| Income from investment operations: | |
| Net investment income | | | 0.14 | | |
| Net realized and unrealized gain | | | 1.17 | (b) | |
| Total from investment operations | | | 1.31 | | |
| Less distributions to shareholders from: | |
| Net investment income | | | (0.13 | ) | |
| Total distributions to shareholders | | | (0.13 | ) | |
| Net asset value, end of period | | $ | 14.98 | | |
| Total return | | | 9.56 | % | |
| Ratios to average net assets(c) | |
| Expenses prior to fees waived or expenses reimbursed | | | 0.85 | %(d) | |
| Net expenses after fees waived or expenses reimbursed(e) | | | 0.77 | %(d) | |
| Net investment income | | | 3.44 | %(d) | |
| Supplemental data | |
| Net assets, end of period (in thousands) | | $ | 28,830 | | |
| Portfolio turnover | | | 66 | % | |
| Notes to Financial Highlights | |
(a) For the period from November 16, 2011 (commencement of operations) to February 29, 2012.
(b) Calculation of the net gain per share (both realized and unrealized) does not correlate to the aggregate realized and unrealized gains presented in the Statement of Operations due to the timing of sales and repurchases of Fund shares in relation to fluctuations in the market value of the portfolio.
(c) In addition to the fees and expenses which the Fund bears directly, the Fund indirectly bears a pro rata share of the fees and expenses of the acquired funds in which it invests. Such indirect expenses are not included in the reported expense ratios.
(d) Annualized.
(e) The Investment Manager and certain of its affiliates agreed to waive/reimburse certain fees and expenses, if applicable.
The Accompanying Notes to Financial Statements are an integral part of this statement.
24
Financial Highlights (continued) – Columbia Convertible Securities Fund
| | | Year ended
Feb. 29, | | Year ended Feb. 28, | | Year ended
Feb. 29, | |
| | | 2012 | | 2011 | | 2010 | | 2009 | | 2008 | |
| Class Z | |
| Per share data | |
| Net asset value, beginning of period | | $ | 15.58 | | | $ | 12.93 | | | $ | 9.94 | | | $ | 14.91 | | | $ | 16.62 | | |
| Income from investment operations: | |
| Net investment income | | | 0.45 | | | | 0.49 | | | | 0.37 | | | | 0.33 | | | | 0.36 | | |
| Net realized and unrealized gain (loss) | | | (0.57 | ) | | | 2.68 | | | | 2.99 | | | | (4.73 | ) | | | (0.26 | ) | |
| Total from investment operations | | | (0.12 | ) | | | 3.17 | | | | 3.36 | | | | (4.40 | ) | | | 0.10 | | |
| Less distributions to shareholders from: | |
| Net investment income | | | (0.45 | ) | | | (0.52 | ) | | | (0.37 | ) | | | (0.34 | ) | | | (0.42 | ) | |
| Net realized gains | | | — | | | | — | | | | — | | | | (0.23 | ) | | | (1.39 | ) | |
| Total distributions to shareholders | | | (0.45 | ) | | | (0.52 | ) | | | (0.37 | ) | | | (0.57 | ) | | | (1.81 | ) | |
| Proceeds from regulatory settlement | | | — | | | | — | | | | 0.00 | (a) | | | — | | | | — | | |
| Net asset value, end of period | | $ | 15.01 | | | $ | 15.58 | | | $ | 12.93 | | | $ | 9.94 | | | $ | 14.91 | | |
| Total return | | | (0.56 | %) | | | 25.17 | % | | | 34.20 | % | | | (30.43 | %) | | | 0.10 | % | |
| Ratios to average net assets(b) | |
| Expenses prior to fees waived or expenses reimbursed (including interest expense) | | | 1.02 | % | | | 1.06 | %(c) | | | 0.99 | % | | | 0.99 | %(c) | | | 0.94 | %(c) | |
| Net expenses after fees waived or expenses reimbursed (including interest expense)(d) | | | 0.87 | %(e) | | | 0.90 | %(c)(e) | | | 0.95 | %(e) | | | 0.96 | %(c)(e) | | | 0.93 | %(c)(e) | |
| Expenses prior to fees waived or expenses reimbursed (excluding interest expense) | | | 1.02 | % | | | 1.06 | % | | | 0.99 | % | | | 0.99 | % | | | 0.94 | % | |
| Net expenses after fees waived or expenses reimbursed (excluding interest expense)(d) | | | 0.87 | %(e) | | | 0.90 | %(e) | | | 0.95 | %(e) | | | 0.96 | %(e) | | | 0.93 | %(e) | |
| Net investment income | | | 3.08 | %(e) | | | 3.52 | %(e) | | | 3.12 | %(e) | | | 2.56 | %(e) | | | 2.16 | %(e) | |
| Supplemental data | |
| Net assets, end of period (in thousands) | | $ | 130,380 | | | $ | 166,597 | | | $ | 198,457 | | | $ | 190,168 | | | $ | 388,824 | | |
| Portfolio turnover | | | 66 | % | | | 118 | % | | | 117 | % | | | 92 | % | | | 77 | % | |
| Notes to Financial Highlights | |
(a) Rounds to less than $0.01.
(b) In addition to the fees and expenses which the Fund bears directly, the Fund indirectly bears a pro rata share of the fees and expenses of the acquired funds in which it invests. Such indirect expenses are not included in the reported expense ratios.
(c) Includes interest expense which rounds to less than 0.01%.
(d) The Investment Manager and certain of its affiliates agreed to waive/reimburse certain fees and expenses, if applicable.
(e) The benefits derived from expense reductions had an impact of less than 0.01%.
The Accompanying Notes to Financial Statements are an integral part of this statement.
25
Notes to Financial Statements – Columbia Convertible Securities Fund
February 29, 2012
Note 1. Organization
Columbia Convertible Securities Fund (the Fund), a series of Columbia Funds Series Trust (the Trust), is a diversified fund. The Trust is registered under the Investment Company Act of 1940, as amended (the 1940 Act), as an open-end management investment company organized as a Delaware statutory trust.
Fund Shares
The Trust may issue an unlimited number of shares (without par value). The Fund offers Class A, Class B, Class C, Class I, Class R, Class W and Class Z shares. All share classes have identical voting, dividend and liquidation rights. Each share class has its own expense structure and sales charges, as applicable.
Class A shares are subject to a maximum front-end sales charge of 5.75% based on the initial investment amount. Class A shares purchased without an initial sales charge in accounts aggregating $1 million to $50 million at the time of purchase are subject to a contingent deferred sales charge (CDSC) if the shares are sold within 18 months of purchase, charged as follows: 1.00% CDSC if redeemed within 12 months of purchase, and 0.50% CDSC if redeemed more than 12, but less than 18, months after purchase.
Class B shares may be subject to a maximum CDSC of 5.00% based upon the holding period after purchase. Class B shares will generally convert to Class A shares eight years after purchase. The Fund no longer accepts investments by new or existing investors in the Fund's Class B shares, except in connection with the reinvestment of any dividend and/or capital gain distributions in Class B shares of the Fund and exchanges by existing Class B shareholders of certain other funds within the Columbia Family of Funds.
Class C shares are subject to a 1.00% CDSC on shares redeemed within one year of purchase.
Class I shares are not subject to sales charges and are only available to the Columbia Family of Funds.
Class R shares are not subject to sales charges and are only available to qualifying institutional investors. Class R shares commenced operations on November 16, 2011.
Class W shares are not subject to sales charges and are only available to investors purchasing through authorized investment programs managed by investment professionals, including discretionary managed account programs. Class W shares commenced operations on November 16, 2011.
Class Z shares are not subject to sales charges, and are only available to certain investors, as described in the Fund's prospectus.
Note 2. Summary of Significant Accounting Policies
Use of Estimates
The preparation of financial statements in accordance with U.S. generally accepted accounting principles (GAAP) requires management to make certain estimates and assumptions that affect the reported amounts of assets and liabilities, the disclosure of contingent assets and liabilities at the date of the financial statements and the reported amounts of revenue and expenses during the reporting period. Actual results could differ from those estimates.
The following is a summary of significant accounting policies consistently followed by the Fund in the preparation of its financial statements.
Security Valuation
All equity securities are valued at the close of business of the New York Stock Exchange (NYSE). Equity securities are valued at the last quoted sales price on the principal exchange or market on which they trade, except for securities traded on the NASDAQ Stock Market, which are valued at the NASDAQ official close price. Unlisted securities or listed securities for which there were no sales during the day are valued at the mean of the latest quoted bid and asked prices on such exchanges or markets.
Debt securities generally are valued by pricing services approved by the Board of Trustees (the Board) based upon market transactions for normal, institutional-size trading units of similar securities. The services may use various pricing techniques which take into account appropriate factors such as yield, quality, coupon rate, maturity, type of issue, trading characteristics and other data, as well as broker quotes. Debt securities for which quotations are readily available may also be valued based upon an over-the-counter or exchange bid quotation.
26
Columbia Convertible Securities Fund, February 29, 2012
Foreign securities are valued based on quotations from the principal market in which such securities are normally traded. If any foreign share prices are not readily available as a result of limited share activity the securities are valued at the mean of the latest quoted bid and asked prices on such exchanges or markets. Foreign currency exchange rates are generally determined at 4:00 p.m. Eastern (U.S.) time. However, many securities markets and exchanges outside the U.S. close prior to the close of the NYSE; therefore, the closing prices for securities in such markets or on such exchanges may not fully reflect events that occur after such close but before the close of the NYSE. In those situations, foreign securities will be fair valued pursuant to the policy adopted by the Board, including utilizing a third party pricing service to determine these fair values. The third party pricing service takes into account multiple factors, including, but not limited to, movements in the U.S. securities markets, certain depositary receipts, futures contracts and foreign exchange rates that have occurred subsequent to the close of the foreign exchange, to determine a good faith estimate that reasonably reflects the current market conditions as of the close of the NYSE. The fair value of a security is likely to be different from the quoted or published price, if available.
Investments in other open-end investment companies, including money market funds, are valued at net asset value.
Short-term securities purchased within 60 days to maturity are valued at amortized cost, which approximates market value. The value of short-term securities originally purchased with maturities greater than 60 days is determined based on an amortized value to par upon reaching 60 days to maturity. Short-term securities maturing in more than 60 days from the valuation date are valued at the market price or approximate market value based on current interest rates.
Investments for which market quotations are not readily available, or that have quotations which management believes are not reliable, are valued at fair value as determined in good faith under consistently applied procedures established by and under the general supervision of the Board. If a security or class of securities (such as foreign securities) is valued at fair value, such value is likely to be different from the last quoted market price for the security. The determination of fair value often requires significant judgment. To determine fair value, management may use assumptions including but not limited to future cash flows and estimated risk premiums. Multiple inputs from various sources may be used to determine value.
Foreign Currency Transactions and Translation
The values of all assets and liabilities denominated in foreign currencies are translated into U.S. dollars at that day's exchange rates. Net realized and unrealized gains (losses) on foreign currency transactions and translations include gains (losses) arising from the fluctuation in exchange rates between trade and settlement dates on securities transactions, gains (losses) arising from the disposition of foreign currency and currency gains (losses) between the accrual and payment dates on dividends, interest income and foreign withholding taxes.
For financial statement purposes, the Fund does not distinguish that portion of gains (losses) on investments which is due to changes in foreign exchange rates from that which is due to changes in market prices of the investments. Such fluctuations are included with the net realized and unrealized gains (losses) on investments in the Statement of Operations.
Repurchase Agreements
The Fund may engage in repurchase agreement transactions with institutions that management has determined are creditworthy. The Fund, through the custodian, receives delivery of the underlying securities collateralizing a repurchase agreement. Management is responsible for determining that the collateral is at least equal, at all times, to the value of the repurchase obligation including interest. A repurchase agreement transaction involves certain risks in the event of default or insolvency of the counterparty. These risks include possible delays in or restrictions on a Fund's ability to dispose of the underlying securities and a possible decline in the value of the underlying securities during the period while the Fund seeks to assert its rights.
Security Transactions
Security transactions are accounted for on the trade date. Cost is determined and gains (losses) are based upon the specific identification method for both financial statement and federal income tax purposes.
27
Columbia Convertible Securities Fund, February 29, 2012
Income Recognition
Interest income is recorded on the accrual basis. Market premium and discount are amortized and accreted, respectively, on all debt securities, unless otherwise noted. Original issue discount is accreted to interest income over the life of the security with a corresponding increase in the cost basis, if any. For convertible securities, premiums attributable to the conversion feature are not amortized.
Corporate actions and dividend income are recorded net of any non-reclaimable tax withholdings, on the ex-dividend date or upon receipt of ex-dividend notification in the case of certain foreign securities.
The Fund receives distributions from holdings in real estate investment trusts (REITs) which report information on the character of their distributions annually. REIT distributions are allocated to dividend income, capital gain and return of capital based on estimates made by the Fund's management if actual information has not yet been reported. Return of capital is recorded as a reduction of the cost basis of securities held. Management's estimates are subsequently adjusted when the actual character of the distributions is disclosed by the REITs which could result in a proportionate increase in return of capital to shareholders.
Awards from class action litigation are recorded as a reduction of cost basis if the Fund still owns the applicable securities on the payment date. If the Fund no longer owns the applicable securities, the proceeds are recorded as realized gains.
Expenses
General expenses of the Trust are allocated to the Fund and other funds of the Trust based upon relative net assets or other expense allocation methodologies determined by the nature of the expense. Expenses directly attributable to the Fund are charged to the Fund. Expenses directly attributable to a specific class of shares are charged to that share class.
Determination of Class Net Asset Value
All income, expenses (other than class-specific expenses, which are charged to that share class, as shown in the Statement of Operations) and realized and unrealized gains (losses) are allocated to each class of the Fund on a daily basis, based on the relative net assets of each class, for purposes of determining the net asset value of each class.
Federal Income Tax Status
The Fund intends to qualify each year as a regulated investment company under Subchapter M of the Internal Revenue Code, as amended, and will distribute substantially all of its taxable income (including net short-term capital gains), if any, for its tax year, and as such will not be subject to federal income taxes. In addition, the Fund intends to distribute in each calendar year substantially all of its net investment income, capital gains and certain other amounts, if any, such that the Fund should not be subject to federal excise tax. Therefore, no federal income or excise tax provision is recorded.
Foreign Taxes
The Fund may be subject to foreign taxes on income, gains on investments or currency repatriation, a portion of which may be recoverable. The Fund will accrue such taxes and recoveries, as applicable, based upon its current interpretation of tax rules and regulations that exist in the markets in which it invests.
Realized gains in certain countries may be subject to foreign taxes at the Fund level, based on statutory rates. The Fund accrues for such foreign taxes on net realized and unrealized gains at the appropriate rate for each jurisdiction, as applicable.
Distributions to Shareholders
Distributions from net investment income, if any, are declared and paid each calendar quarter. Net realized capital gains, if any, are distributed along with the income dividend. Income distributions and capital gain distributions are determined in accordance with federal income tax regulations which may differ from GAAP.
Guarantees and Indemnifications
Under the Trust's organizational documents and, in some cases, by contract, its officers and trustees are indemnified against certain liabilities arising out of the performance of their duties to the Trust or its funds. In addition, certain of the Fund's contracts with its service providers contain general indemnification clauses. The Fund's maximum exposure
28
Columbia Convertible Securities Fund, February 29, 2012
under these arrangements is unknown since the amount of any future claims that may be made against the Fund cannot be determined, and the Fund has no historical basis for predicting the likelihood of any such claims.
Recent Accounting Pronouncement
Fair Value Measurements and Disclosures
In May 2011, the Financial Accounting and Standards Board (FASB) issued ASU No. 2011-04 modifying Topic 820, Fair Value Measurements and Disclosures. At the same time, the International Accounting Standards Board (IASB) issued International Financial Reporting Standard 13, Fair Value Measurement. The objective of the FASB and IASB is convergence of their guidance on fair value measurements and disclosures.
Specifically, ASU No. 2011-04 requires reporting entities to disclose i) the amounts of any transfers between Level 1 and Level 2, and the reasons for the transfers, ii) for Level 3 fair value measurements, a) quantitative information about significant unobservable inputs used, b) a description of the valuation processes used by the reporting entity and c) a narrative description of the sensitivity of the fair value measurement to changes in unobservable inputs if a change in those inputs might result in a significantly higher or lower fair value measurement. The effective date of ASU No. 2011-04 is for interim and annual periods beginning after December 15, 2011. At this time, management is evaluating the implications of this guidance and the impact it will have on the financial statement amounts and footnote disclosures, if any.
Note 3. Fees and Compensation Paid to Affiliates
Investment Management Fees
Under an Investment Management Services Agreement, Columbia Management Investment Advisers, LLC (the Investment Manager), a wholly-owned subsidiary of Ameriprise Financial, Inc. (Ameriprise Financial), determines which securities will be purchased, held or sold. Effective July 1, 2011, the management fee is an annual fee that is equal to a percentage of the Fund's average daily net assets that declines from 0.76% to 0.62% as the Fund's net assets increase. Prior to July 1, 2011, the management fee was equal to a percentage of the Fund's average daily net assets that declined from 0.65% to 0.50% as the Fund's net assets increased. The effective management fee rate for the year ended February 29, 2012 was 0.72% of the Fund's average daily net assets.
Administration Fees
Under an Administrative Services Agreement, the Investment Manager serves as the Fund Administrator. Effective July 1, 2011, the Fund pays the Fund Administrator an annual fee for administration and accounting services equal to a percentage of the Fund's average daily net assets that declines from 0.06% to 0.05% as the Fund's net assets increase. Prior to July 1, 2011, the administration fee was equal to the annual rate of 0.17% of the Fund's average daily net assets, less the fees that were payable by the Fund as described under the Pricing and Bookkeeping Fees note below. The effective administration fee rate for the year ended February 29, 2012 was 0.10% of the Fund's average daily net assets.
Pricing and Bookkeeping Fees
Prior to June 27, 2011, the Fund had entered into a Financial Reporting Services Agreement (the Financial Reporting Services Agreement) with State Street Bank and Trust Company (State Street) and the Investment Manager pursuant to which State Street provided financial reporting services to the Fund. The Fund also entered into an Accounting Services Agreement (collectively with the Financial Reporting Services Agreement, the State Street Agreements) with State Street and the Investment Manager pursuant to which State Street provided accounting services to the Fund. Under the State Street Agreements, the Fund paid State Street an annual fee of $38,000 paid monthly plus an additional monthly fee based on an annualized percentage rate of average daily net assets of the Fund for the month. The aggregate fee did not exceed $140,000 per year (exclusive of out-of-pocket expenses and charges). The Fund also reimbursed State Street for certain out-of-pocket expenses and charges. Effective June 27, 2011, these services are provided under the Administrative Services Agreement discussed above.
Other Fees
Effective June 1, 2011, other expenses are for, among other things, certain expenses of the Fund or the Board, including: Fund boardroom and office expense, employee compensation, employee health and retirement benefits, and certain other expenses. Payment of these Fund and Board expenses is
29
Columbia Convertible Securities Fund, February 29, 2012
facilitated by a company providing limited administrative services to the Fund and the Board. For the period June 1, 2011 through February 29, 2012, other expenses paid to this company were $2,657.
Compensation of Board Members
Board members are compensated for their services to the Fund as disclosed in the Statement of Operations. Under a Deferred Compensation Plan (the Plan), the Board members who are not "interested persons" of the Fund, as defined under the 1940 Act, may elect to defer payment of up to 100% of their compensation. Deferred amounts are treated as though equivalent dollar amounts had been invested in shares of certain funds managed by the Investment Manager. The Fund's liability for these amounts is adjusted for market value changes and remains in the Fund until distributed in accordance with the Plan.
Compensation of Chief Compliance Officer
The Board has appointed a Chief Compliance Officer to the Fund in accordance with federal securities regulations. Effective April 1, 2011, the Fund's expenses associated with the Chief Compliance Officer are paid directly by the Investment Manager. Prior to April 1, 2011, the Fund, along with other affiliated funds, paid its pro-rata share of the expenses for the Chief Compliance Officer. Such fees did not exceed $15,000 per year.
Transfer Agent Fees
Under a Transfer and Dividend Disbursing Agent Agreement, Columbia Management Investment Services Corp. (the Transfer Agent), an affiliate of the Investment Manager and a wholly-owned subsidiary of Ameriprise Financial, is responsible for providing transfer agency services to the Fund. The Transfer Agent has contracted with Boston Financial Data Services (BFDS) to serve as sub-transfer agent.
The Transfer Agent receives monthly account-based service fees based on the number of open accounts and is reimbursed by the Fund for the fees and expenses the Transfer Agent pays to financial intermediaries that maintain omnibus accounts with the Fund that is a percentage of the average aggregate value of the Fund's shares maintained in each such omnibus account (other than omnibus accounts for which American Enterprise Investment Services Inc. is the broker of record or accounts where the beneficial shareholder is a customer of Ameriprise Financial Services, Inc., which are paid a per account fee). The Transfer Agent pays the fees of BFDS for services as sub-transfer agent and is not entitled to reimbursement for such fees from the Fund (with the exception of out-of-pocket fees).
The Transfer Agent also receives compensation from fees for various shareholder services and reimbursements for certain out-of-pocket expenses. Class I shares do not pay transfer agent fees.
For the year ended February 29, 2012, the Fund's effective transfer agent fee rates as a percentage of average daily net assets of each class were as follows:
| Class A | | | 0.17 | % | |
| Class B | | | 0.17 | | |
| Class C | | | 0.17 | | |
| Class R | | | 0.19 | | |
| Class W | | | 0.19 | | |
| Class Z | | | 0.17 | | |
An annual minimum account balance fee of $20 may apply to certain accounts with a value below the Fund's initial minimum investment requirements to reduce the impact of small accounts on transfer agent fees. These minimum account balance fees are recorded as part of expense reductions in the Statement of Operations. For the year ended February 29, 2012, these minimum account balance fees reduced total expenses by $2,222.
Distribution and Service Fees
The Fund has an agreement with Columbia Management Investment Distributors, Inc. (the Distributor), an affiliate of the Investment Manager and a wholly-owned subsidiary of Ameriprise Financial, for distribution and shareholder services. Pursuant to Rule 12b-1 under the 1940 Act, the Board has approved, and the Fund has adopted, distribution and shareholder service plans (the Plans) which set the distribution and service fees for the Fund. These fees are calculated daily and are intended to compensate the Distributor and/or eligible selling and/or servicing agents for selling shares of the Fund and providing services to investors.
30
Columbia Convertible Securities Fund, February 29, 2012
The Plans require the payment of a monthly combined distribution and service fee to the Distributor at the maximum annual rate of 0.25% of the average daily net assets attributable to Class A shares of the Fund. The Plans also require the payment of a monthly service fee at the maximum annual rate of 0.25% of the average daily net assets attributable to Class B and Class C shares of the Fund and the payment of a monthly distribution fee at the maximum annual rate of 0.75%, 0.75% and 0.50% of the average daily net assets attributable to Class B, Class C and Class R shares, respectively.
The Fund may pay a distribution fee of up to 0.25% of the Fund's average daily net assets attributable to Class W shares and a service fee of up to 0.25% of the Fund's average daily net assets attributable to Class W shares, provided, however, that the aggregate fee shall not exceed 0.25% of the Fund's average daily net assets attributable to Class W shares.
Sales Charges
Sales charges, including front-end charges and CDSCs, received by the Distributor for distributing Fund shares were $173,003 for Class A, $2,291 for Class B and $2,396 for Class C shares for the year ended February 29, 2012.
Expenses Waived/Reimbursed by the Investment Manager and its Affiliates
Effective July 1, 2011, the Investment Manager and certain of its affiliates have contractually agreed to waive fees and/or reimburse expenses (excluding certain fees and expenses described below), through June 30, 2012, unless sooner terminated at the sole discretion of the Board, so that the Fund's net operating expenses, after giving effect to fees waived/expenses reimbursed and any balance credits and/or overdraft charges from the Fund's custodian, do not exceed the following annual rates as a percentage of the class' average daily net assets:
| Class A | | | 1.11 | % | |
| Class B | | | 1.86 | | |
| Class C | | | 1.86 | | |
| Class I | | | 0.75 | | |
| Class R | | | 1.36 | | |
| Class W | | | 1.11 | | |
| Class Z | | | 0.86 | | |
Under the agreement, the following fees and expenses are excluded from the waiver/reimbursement commitment, and therefore will be paid by the Fund, if applicable: taxes (including foreign transaction taxes), expenses associated with investments in affiliated and non-affiliated pooled investment vehicles (including mutual funds and exchange traded funds), transaction costs and brokerage commissions, costs related to any securities lending program, dividend expenses associated with securities sold short, inverse floater program fees and expenses, transaction charges and interest on borrowed money, interest, extraordinary expenses and any other expenses the exclusion of which is specifically approved by the Board. This agreement may be modified or amended only with approval from all parties.
| Class A | | | 1.15 | % | |
| Class B | | | 1.90 | | |
| Class C | | | 1.90 | | |
| Class I | | | 0.85 | | |
| Class Z | | | 0.90 | | |
Prior to July 1, 2011, the Investment Manager voluntarily agreed to reimburse a portion of the Fund's expenses (excluding certain expenses, such as brokerage commissions, interest, taxes and extraordinary expenses, but including custodian charges relating to overdrafts, if any) so that the Fund's ordinary net operating expenses, after giving effect to fees waived/expenses reimbursed and any balance credits and/or overdraft charges from the Fund's custodian, did not exceed the following annual rates as a percentage of the class' average daily net assets:
Note 4. Federal Tax Information
The timing and character of income and capital gain distributions are determined in accordance with income tax regulations, which may differ from GAAP because of temporary or permanent book to tax differences.
For the year ended February 29, 2012, these differences are primarily due to differing treatment for defaulted bonds, deferral/reversal of wash sales, deferred trustees expense, certain convertible preferred securities, capital loss carryforwards and post-October losses. To the extent these differences are permanent; reclassifications are made among
31
Columbia Convertible Securities Fund, February 29, 2012
the components of the Fund's net assets in the Statement of Assets and Liabilities. Temporary differences do not require reclassifications. In the Statement of Assets and Liabilities the following reclassifications were made:
| Undistributed net investment income | | $ | 274,461 | | |
| Accumulated net realized loss | | | (274,459 | ) | |
| Paid-in capital | | | (2 | ) | |
Net investment income and net realized gains (losses), as disclosed in the Statement of Operations, and net assets were not affected by this reclassification.
The tax character of distributions paid during the years indicated was as follows:
| Year ended | | February 29,
2012 | | February 28,
2011 | |
| Ordinary income | | $ | 15,245,198 | | | $ | 14,732,005 | | |
Short-term capital gain distributions, if any, are considered ordinary income distributions for tax purposes.
At February 29, 2012, the components of distributable earnings on a tax basis were as follows:
| Undistributed ordinary income | | $ | 3,461,189 | | |
| Undistributed accumulated long-term gain | | | — | | |
| Unrealized appreciation | | | 16,569,609 | | |
At February 29, 2012, the cost of investments for federal income tax purposes was $581,118,491 and the aggregate gross unrealized appreciation and depreciation based on that cost was:
| Unrealized appreciation | | $ | 34,977,689 | | |
| Unrealized depreciation | | $ | (18,408,080 | ) | |
| Net unrealized app/depreciation | | $ | 16,569,609 | | |
The following capital loss carryforward, determined at February 29, 2012, may be available to reduce taxable income arising from future net realized gains on investments, if any, to the extent permitted by the Internal Revenue Code:
| Year of Expiration | | Amount | |
| 2017 | | $ | 15,780,866 | | |
| 2018 | | | 39,523,679 | | |
| Total | | $ | 55,304,545 | | |
On December 22, 2010, the Regulated Investment Company Modernization Act of 2010 (the Act) was enacted, which changed various technical rules governing the tax treatment of regulated investment companies. The changes are generally effective for taxable years beginning after the date of enactment. Under the Act, the Fund will be permitted to carry forward capital losses incurred in taxable years beginning after the date of enactment for an unlimited period. However, any losses incurred during those future taxable years will be required to be utilized prior to the losses incurred in pre-enactment taxable years, which carry an expiration date. As a result of this ordering rule, pre-enactment capital loss carryforwards may be more likely to expire unused.
For the year ended February 29, 2012, $19,950,712 of capital loss carryforward was utilized.
Under current tax rules, regulated investment companies can elect to treat certain late-year ordinary losses incurred and post-October capital losses (capital losses realized after October 31) as arising on the first day of the following taxable year. As of February 29, 2012, the Fund will elect to treat post-October capital losses of $3,047,863 as arising on March 1, 2012.
Management of the Fund has concluded that there are no significant uncertain tax positions that would require recognition in the financial statements. However, management's conclusion may be subject to review and adjustment at a later date based on factors including, but not limited to, new tax laws, regulations, and administrative interpretations (including relevant court decisions). Generally, the Fund's federal tax returns for the prior three fiscal years remain subject to examination by the Internal Revenue Service.
32
Columbia Convertible Securities Fund, February 29, 2012
Note 5. Portfolio Information
The cost of purchases and proceeds from sales of securities, excluding short-term obligations, aggregated to $426,222,532 and $336,731,940, respectively, for the year ended February 29, 2012.
Note 6. Lending of Portfolio Securities
Effective June 27, 2011, the Fund has entered into a Master Securities Lending Agreement (the Agreement) with JPMorgan Chase Bank, N.A. (JPMorgan). The Agreement, which replaces the previous securities lending arrangement with State Street, authorizes JPMorgan as lending agent to lend securities to authorized borrowers in order to generate additional income on behalf of the Fund. Pursuant to the Agreement, the securities loaned are secured by cash or U.S. government securities equal to at least 100% of the market value of the loaned securities. Any additional collateral required to maintain those levels due to market fluctuations of the loaned securities is requested to be delivered the following business day. Cash collateral received is invested by the lending agent on behalf of the Fund into authorized investments pursuant to the Agreement. The investments made with the cash collateral are listed in the Portfolio of Investments. The values of such investments and any uninvested cash collateral are disclosed in the Statement of Assets and Liabilities along with the related obligation to return the collateral upon the return of the securities loaned.
At February 29, 2012, securities valued at $37,676,682 were on loan, by cash collateral of $39,478,571 (which does not reflect calls for collateral made to borrowers by JPMorgan at period end) that is partially or fully invested in short-term securities or other cash equivalents.
Risks of delay in recovery of securities or even loss of rights in the securities may occur should the borrower of the securities fail financially. Risks may also arise to the extent that the value of the securities loaned increases above the value of the collateral received. JPMorgan will indemnify the Fund from losses resulting from a borrower's failure to return a loaned security when due. Such indemnification does not extend to losses associated with declines in the value of cash collateral investments. The Investment Manager is not responsible for any losses incurred by the Fund in connection with the securities lending program. Loans are subject to termination by the Fund or the borrower at any time, and are, therefore, not considered to be illiquid investments.
Pursuant to the Agreement, the Fund receives income for lending its securities either in the form of fees or by earning interest on invested cash collateral, net of negotiated rebates paid to borrowers and fees paid to the lending agent for services provided and any other securities lending expenses. Net income earned from securities lending for the year ended February 29, 2012 is disclosed in the Statement of Operations. The Fund continues to earn and accrue interest and dividends on the securities loaned.
Prior to June 27, 2011, the Fund participated in a securities lending arrangement with State Street. Each security on loan was collateralized in an amount at least equal to the market value of the securities loaned plus accrued income from the investment of collateral. The income generated by the investment of the collateral, net of any fees remitted to State Street as the lending agent and borrower rebates, was paid to the Fund.
Note 7. Custody Credits
Prior to June 27, 2011, the Fund had an agreement with its custodian bank under which custody fees may have been reduced by balance credits. These credits are recorded as part of expense reductions on the Statement of Operations. The Fund could have invested a portion of the assets utilized in connection with the expense offset arrangement in an income-producing asset if they had not entered into such an agreement. Subsequent to this date, the Fund may invest its daily balance in an affiliated money market fund as detailed below. For the period March 1, 2011 through June 27, 2011, these credits reduced total expenses by $51.
Note 8. Affiliated Money Market Fund
Effective June 27, 2011, the Fund may invest its daily cash balances in Columbia Short-Term Cash Fund, an affiliated money market fund established for the exclusive use by the Fund and other affiliated funds. The income earned by the Fund from such investments is included as "Dividends from affiliates" in the Statement of Operations. As an investing fund, the Fund indirectly bears its proportionate share of the expenses of Columbia Short-Term Cash Fund.
33
Columbia Convertible Securities Fund, February 29, 2012
Note 9. Shareholder Concentration
At February 29, 2012, one unaffiliated shareholder account owned 37.6% of the outstanding shares of the Fund. The Fund has no knowledge about whether any portion of those shares was owned beneficially by such account. Affiliated shareholder accounts owned 36.1% of the outstanding shares of the Fund. Subscription and redemption activity by concentrated accounts may have a significant effect on the operations of the Fund.
Note 10. Line of Credit
The Fund has entered into a revolving credit facility with a syndicate of banks led by JPMorgan Chase Bank, N.A. (the Administrative Agent), whereby the Fund may borrow for the temporary funding of shareholder redemptions or for other temporary or emergency purposes. The credit facility became effective on June 27, 2011, replacing a prior credit facility. The credit facility agreement, as amended, which is a collective agreement between the Fund and certain other funds managed by the Investment Manager, severally and not jointly, permits collective borrowings up to $500 million. Pursuant to a December 13, 2011 amendment to the credit facility agreement, interest is charged to each participating fund based on its borrowings at a rate equal to the higher of (i) the overnight federal funds rate plus 1.00% or (i) the one-month LIBOR rate plus 1.00%. Each borrowing under the credit facility matures no later than 60 days after the date of borrowing. The Fund also pays a commitment fee equal to its pro rata share of the amount of the credit facility at a rate of 0.08% per annum. For the period June 27, 2011 through December 12, 2011, interest was charged to each participating fund based on its borrowings at a rate equal to the sum of the federal funds rate plus (i) 1.25% per annum plus (ii) if one-month LIBOR exceeds the federal funds rate, the amount of such excess. The Fund also paid a commitment fee equal to its pro rata share of the amount of the credit facility at a rate of 0.10% per annum.
For the period May 16, 2011 through June 26, 2011, the Fund and certain other funds managed by the Investment Manager participated in a $150 million committed, unsecured revolving credit facility provided by State Street. For the period March 28, 2011 through May 15, 2011, the collective borrowing amount of the credit facility was $225 million. Prior to March 28, 2011, the collective borrowing amount of the credit facility was $280 million. Interest was charged to each fund based on its borrowings at a rate equal to the greater of the (i) federal funds rate plus 1.25% per annum or (ii) the overnight LIBOR rate plus 1.25% per annum. The Fund also paid a commitment fee equal to its pro rata share of the amount of the credit facility at a rate of 0.125% per annum.
The Fund had no borrowings during the year ended February 29, 2012.
Note 11. Subsequent Events
Management has evaluated the events and transactions that have occurred through the date the financial statements were issued and noted no items requiring adjustment of the financial statements or additional disclosure.
Note 12. Information Regarding Pending and Settled Legal Proceedings
In June 2004, an action captioned John E. Gallus et al. v. American Express Financial Corp. and American Express Financial Advisors Inc. was filed in the United States District Court for the District of Arizona. The plaintiffs allege that they are investors in several American Express Company mutual funds (currently branded as Columbia) and they purport to bring the action derivatively on behalf of those funds under the Investment Company Act of 1940. The plaintiffs allege that fees allegedly paid to the defendants by the funds for investment advisory and administrative services are excessive. The plaintiffs seek remedies including restitution and rescission of investment advisory and distribution agreements. The plaintiffs voluntarily agreed to transfer this case to the United States District Court for the District of Minnesota (the District Court). In response to defendants' motion to dismiss the complaint, the District Court dismissed one of plaintiffs' four claims and granted plaintiffs limited discovery. Defendants moved for summary judgment in April 2007. Summary judgment was granted in the defendants' favor on July 9, 2007. The plaintiffs filed a notice of appeal with the Eighth Circuit Court of Appeals (the Eighth Circuit) on August 8, 2007. On April 8, 2009, the Eighth Circuit reversed summary judgment and remanded to the District Court for further proceedings. On August 6, 2009, defendants filed a writ of certiorari with the U.S. Supreme Court (the Supreme Court), asking the Supreme Court to stay
34
Columbia Convertible Securities Fund, February 29, 2012
the District Court proceedings while the Supreme Court considered and rules in a case captioned Jones v. Harris Associates, which involved issues of law similar to those presented in the Gallus case. On March 30, 2010, the Supreme Court issued its ruling in Jones v. Harris Associates, and on April 5, 2010, the Supreme Court vacated the Eighth Circuit's decision in the Gallus case and remanded the case to the Eighth Circuit for further consideration in light of the Supreme Court's decision in Jones v. Harris Associates. On June 4, 2010, the Eighth Circuit remanded the Gallus case to the District Court for further consideration in light of the Supreme Court's decision in Jones v. Harris Associates. On December 9, 2010, the District Court reinstated its July 9, 2007 summary judgment order in favor of the defendants. On January 10, 2011, plaintiffs filed a notice of appeal with the Eighth Circuit. In response to the plaintiffs' opening appellate brief filed on March 18, 2011, the defendants filed a response brief on May 4, 2011 with the Eighth Circuit. The plaintiffs filed a reply brief on May 26, 2011 and oral arguments took place on November 17, 2011. On March 30, 2012, the Eighth Circuit upheld the grant of summary judgment by the District Court in favor of the defendants.
In December 2005, without admitting or denying the allegations, American Express Financial Corporation (AEFC, which is now known as Ameriprise Financial, Inc. (Ameriprise Financial)) entered into settlement agreements with the Securities and Exchange Commission (SEC) and Minnesota Department of Commerce (MDOC) related to market timing activities. As a result, AEFC was censured and ordered to cease and desist from committing or causing any violations of certain provisions of the Investment Advisers Act of 1940, the Investment Company Act of 1940, and various Minnesota laws. AEFC agreed to pay disgorgement of $10 million and civil money penalties of $7 million. AEFC also agreed to retain an independent distribution consultant to assist in developing a plan for distribution of all disgorgement and civil penalties ordered by the SEC in accordance with various undertakings detailed at www.sec.gov/litigation/admin/ia-2451.pdf. Ameriprise Financial and its affiliates have cooperated with the SEC and the MDOC in these legal proceedings, and have made regular reports to the funds' Boards of Trustees.
Ameriprise Financial and certain of its affiliates have historically been involved in a number of legal, arbitration and regulatory proceedings, including routine litigation, class actions, and governmental actions, concerning matters arising in connection with the conduct of their business activities. Ameriprise Financial believes that the Funds are not currently the subject of, and that neither Ameriprise Financial nor any of its affiliates are the subject of, any pending legal, arbitration or regulatory proceedings that are likely to have a material adverse effect on the Funds or the ability of Ameriprise Financial or its affiliates to perform under their contracts with the Funds. Ameriprise Financial is required to make 10-Q, 10-K and, as necessary, 8-K filings with the Securities and Exchange Commission on legal and regulatory matters that relate to Ameriprise Financial and its affiliates. Copies of these filings may be obtained by accessing the SEC website at www.sec.gov.
There can be no assurance that these matters, or the adverse publicity associated with them, will not result in increased fund redemptions, reduced sale of fund shares or other adverse consequences to the Funds. Further, although we believe proceedings are not likely to have a material adverse effect on the Funds or the ability of Ameriprise Financial or its affiliates to perform under their contracts with the Funds, these proceedings are subject to uncertainties and, as such, we are unable to estimate the possible loss or range of loss that may result. An adverse outcome in one or more of these proceedings could result in adverse judgments, settlements, fines, penalties or other relief that could have a material adverse effect on the consolidated financial condition or results of operations of Ameriprise Financial.
35
Report of Independent Registered Public Accounting Firm
To the Trustees of Columbia Funds Series Trust and the Shareholders of Columbia Convertible Securities Fund
In our opinion, the accompanying statement of assets and liabilities, including the investment portfolio, and the related statements of operations and of changes in net assets and the financial highlights present fairly, in all material respects, the financial position of Columbia Convertible Securities Fund (the "Fund") (a series of Columbia Funds Series Trust) at February 29, 2012, the results of its operations for the year then ended, the changes in its net assets for each of the two years in the period then ended and the financial highlights for each of the periods indicated, in conformity with accounting principles generally accepted in the United States of America. These financial statements and financial highlights (hereafter referred to as "financial statements") are the responsibility of the Fund's management. Our responsibility is to express an opinion on these financial statements based on our audits. We conducted our audits of these financial statements in accordance with the standards of the Public Company Accounting Oversight Board (United States). Those standards require that we plan and perform the audit to obtain reasonable assurance about whether the financial statements are free of material misstatement. An audit includes examining, on a test basis, evidence supporting the amounts and disclosures in the financial statements, assessing the accounting principles used and significant estimates made by management, and evaluating the overall financial statement presentation. We believe that our audits, which included confirmation of securities at February 29, 2012 by correspondence with the custodian, transfer agent and brokers, provide a reasonable basis for our opinion.
PricewaterhouseCoopers LLP
Minneapolis, Minnesota
April 20, 2012
36
Federal Income Tax Information (Unaudited) – Columbia Convertible Securities Fund
For non-corporate shareholders, 31.74% or the maximum amount allowable under the Jobs and Growth Tax Relief Reconciliation Act of 2003, of the ordinary income distributed by the Fund for the fiscal year ended February 29, 2012 may represent qualified dividend income.
30.77% of the ordinary income distributed by the Fund for the fiscal year ended February 29, 2012, qualifies for the corporate dividends received deduction.
The Fund will notify shareholders in January 2013 of amounts for use in preparing 2012 income tax returns.
37
Fund Governance
Shareholders elect the Board that oversees the funds' operations. The Board appoints officers who are responsible for day-to-day business decisions based on policies set by the Board. The following table provides basic biographical information about the funds' Board members, including their principal occupations during the past five years, although specific titles for individuals may have varied over the period. Under current Board policy, members may serve until the next Board meeting after he or she reaches the mandatory retirement age established by the Board, or the fifteenth anniversary of the first Board meeting they attended as a member of the Board.
On September 29, 2009, Ameriprise Financial, the parent company of Columbia Management, entered into an agreement with Bank of America, N.A. ("Bank of America") to acquire a portion of the asset management business of Columbia Management Group, LLC and certain of its affiliated companies (the "Transaction"). Following the Transaction, which became effective on May 1, 2010, various alignment activities have occurred with respect to the Fund Family. In connection with the Transaction, Mr. Edward J. Boudreau, Jr., Mr. William P. Carmichael, Mr. William A. Hawkins, Mr. R. Glenn Hilliard, Mr. John J. Nagorniak, Ms. Minor M. Shaw and Dr. Anthony M. Santomero, who were members prior to the Transaction of the Legacy Columbia Nations funds' Board ("Nations Funds"), which includes Columbia Funds Series Trust, Columbia Funds Variable Insurance Trust I and Columbia Funds Master Investment Trust, LLC., began service on the Board for the Legacy RiverSource funds ("RiverSource Funds") effective June 1, 2011, which resulted in an overall increase from twelve Trustees to sixteen for all mutual funds overseen by the Board.
Independent Board Members
| Name, Address, Age | | Position Held
with Funds
and Length
of Service | | Principal Occupation During Past Five Years | | Number of
Funds in the
Fund Family
Overseen by
Board Member | | Other Present or
Past Directorships/
Trusteeships
(Within Past 5 Years) | |
| Kathleen Blatz | |
|
901 S. Marquette Ave.
Minneapolis, MN 55402
Age 57 | | Board member since 1/06 for RiverSource Funds and since 6/11 for Nations Funds | | Attorney; Chief Justice, Minnesota Supreme Court, 1998-2006 | | | 153 | | | None | |
|
| Edward J. Boudreau, Jr. | |
|
225 Franklin Street
Mail Drop
BX32 05228
Boston, MA 02110
Age 67 | | Board member since 6/11 for RiverSource Funds and since 1/05 for Nations Funds | | Managing Director, E.J. Boudreau & Associates (consulting) since 2000 | | | 146 | | | Former Trustee, BofA Funds Series Trust (11 funds) | |
|
| Pamela G. Carlton | |
|
901 S. Marquette Ave.
Minneapolis, MN 55402
Age 57 | | Board member since 7/07 for RiverSource Funds and since 6/11 for Nations Funds | | President, Springboard-Partners in Cross Cultural Leadership (consulting company) | | | 153 | | | None | |
|
38
Fund Governance (continued)
Independent Board Members (continued)
| Name, Address, Age | | Position Held
with Funds
and Length
of Service | | Principal Occupation During Past Five Years | | Number of
Funds in the
Fund Family
Overseen by
Board Member | | Other Present or
Past Directorships/
Trusteeships
(Within Past 5 Years) | |
| William P. Carmichael | |
|
225 Franklin Street
Mail Drop
BX32 05228
Boston, MA 02110
Age 68 | | Board member since 6/11 for RiverSource Funds and since 1999 for Nations Funds | | Retired | | | 146 | | | Director, Cobra Electronics Corporation (electronic equipment manufacturer); The Finish Line (athletic shoes and apparel); McMoRan Exploration Company (oil and gas exploration and development); former Trustee, BofA Funds Series Trust (11 funds); former Director, Spectrum Brands, Inc. (consumer products); former Director, Simmons Company (bedding) | |
|
| Patricia M. Flynn | |
|
901 S. Marquette Ave.
Minneapolis, MN 55402
Age 61 | | Board member since 11/04 for RiverSource Funds and since 6/11 for Nations Funds | | Trustee Professor of Economics and Management, Bentley University; former Dean, McCallum Graduate School of Business, Bentley University | | | 153 | | | None | |
|
| William A. Hawkins | |
|
225 Franklin Street
Mail Drop
BX32 05228
Boston, MA 02110
Age 69 | | Board member since 6/11 for RiverSource Funds and since 1/05 for Nations Funds | | Managing Director, Overton Partners (financial consulting), since August 2010; President and Chief Executive Officer, California General Bank, N.A., January 2008-August 2010 | | | 146 | | | Trustee, BofA Funds Series Trust (11 funds) | |
|
| R. Glenn Hilliard | |
|
225 Franklin Street
Mail Drop
BX32 05228
Boston, MA 02110
Age 69 | | Board member since 6/11 for RiverSource Funds and since 1/05 for Nations Funds | | Chairman and Chief Executive Officer, Hilliard Group LLC (investing and consulting), since April 2003; Non-Executive Director & Chairman, CNO Financial Group, Inc. (formerly Conseco, Inc.) (insurance), September 2003-May 2011 | | | 146 | | | Chairman, BofA Fund Series Trust (11 funds); former Director, CNO Financial Group, Inc. (insurance) | |
|
39
Fund Governance (continued)
Independent Board Members (continued)
| Name, Address, Age | | Position Held
with Funds
and Length
of Service | | Principal Occupation During Past Five Years | | Number of
Funds in the
Fund Family
Overseen by
Board Member | | Other Present or
Past Directorships/
Trusteeships
(Within Past 5 Years) | |
| Stephen R. Lewis, Jr. | |
|
901 S. Marquette Ave.
Minneapolis, MN 55402
Age 73 | | Chair of the Board for RiverSource Funds since 1/07, Board member for RiverSource Funds since 1/02 and since 6/11 for Nations Funds | | President Emeritus and Professor of Economics Emeritus, Carleton College | | | 153 | | | Director, Valmont Industries, Inc. (manufactures irrigation systems) | |
|
| John F. Maher | |
|
901 S. Marquette Ave.
Minneapolis, MN 55402
Age 68 | | Board member since 12/06 for Legacy Seligman funds, since 12/08 for RiverSource Funds and since 6/11 for Nations Funds | | Retired President and Chief Executive Officer and former Director, Great Western Financial Corporation (financial services), 1986-1997 | | | 153 | | | None | |
|
| John J. Nagorniak | |
|
225 Franklin Street
Mail Drop
BX32 05228
Boston, MA 02110
Age 67 | | Board member since 6/11 for RiverSource Funds and since 1/08 for Nations Funds | | Retired; President and Director, Foxstone Financial, Inc. (consulting), 2000-2007; Director, Mellon Financial Corporation affiliates (investing), 2000-2007; Chairman, Franklin Portfolio Associates (investing—Mellon affiliate), 1982-2007 | | | 146 | | | Trustee, Research Foundation of CFA Institute; Director, MIT Investment Company; Trustee, MIT 401k Plan; former Trustee, BofA Funds Series Trust (11 funds) | |
|
| Catherine James Paglia | |
|
901 S. Marquette Ave.
Minneapolis, MN 55402
Age 59 | | Board member since 11/04 for RiverSource Funds and since 6/11 for Nations Funds | | Director, Enterprise Asset Management, Inc. (private real estate and asset management company) | | | 153 | | | None | |
|
40
Fund Governance (continued)
Independent Board Members (continued)
| Name, Address, Age | | Position Held
with Funds
and Length
of Service | | Principal Occupation During Past Five Years | | Number of
Funds in the
Fund Family
Overseen by
Board Member | | Other Present or
Past Directorships/
Trusteeships
(Within Past 5 Years) | |
| Leroy C. Richie | |
|
901 S. Marquette Ave.
Minneapolis, MN 55402
Age 70 | | Board member since 2000 for Legacy Seligman funds, since 11/08 for RiverSource Funds and since 6/11 for Nations Funds | | Counsel, Lewis & Munday, P.C. since 2004; former Vice President and General Counsel, Automotive Legal Affairs, Chrysler Corporation | | | 153 | | | Director, Digital Ally, Inc. (digital imaging); Director, Infinity, Inc. (oil and gas exploration and production); Director, OGE Energy Corp. (energy and energy services) | |
|
| Minor M. Shaw | |
|
225 Franklin Street
Mail Drop
BX32 05228
Boston, MA 02110
Age 64 | | Board member since 6/11 for RiverSource Funds and since 2003 for Nations Funds | | President—Micco LLC (private investments) | | | 146 | | | Former Trustee, BofA Funds Series Trust (11 funds); Board Member, Piedmont Natural Gas; Director, Blue Cross Blue Shield of South Carolina | |
|
| Alison Taunton-Rigby | |
|
901 S. Marquette Ave.
Minneapolis, MN 55402
Age 67 | | Board member since 11/02 for RiverSource Funds and since 6/11 for Nations Funds | | Chief Executive Officer and Director, RiboNovix, Inc. 2003-2010 (biotechnology); former President, Aquila Biopharmaceuticals | | | 153 | | | Director, Healthways, Inc. (health management programs); Director, ICI Mutual Insurance Company, RRG; Director, Abt Associates (government contractor) | |
|
41
Fund Governance (continued)
Interested Board Member Not Affiliated with Investment Manager*
| Name, Address, Age | | Position Held
with Funds
and Length
of Service | | Principal Occupation During Past Five Years | | Number of
Funds in the
Fund Family
Overseen by
Board Member | | Other Present or
Past Directorships/
Trusteeships
(Within Past 5 Years) | |
| Anthony M. Santomero* | | | | | | | | | |
|
225 Franklin Street
Mail Drop
BX32 05228
Boston, MA 02110
Age 65 | | Board member since 6/11 for RiverSource Funds and since 1/08 for Nations Funds | | Richard K. Mellon Professor Emeritus of Finance, The Wharton School, University of Pennsylvania, since 2002; Senior Advisor, McKinsey & Company (consulting), 2006-2008; President and Chief Executive Officer, Federal Reserve Bank of Philadelphia, 2000-2006 | | | 146 | | | Director, Renaissance Reinsurance Ltd.; Trustee, Penn Mutual Life Insurance Company; Director, Citigroup; Director, Citibank, N.A.; former Trustee, BofA Funds Series Trust (11 funds) | |
|
| * | | | Dr. Santomero is not an affiliated person of the Investment Manager or Ameriprise Financial. However, he is currently deemed by the funds to be an "interested person" (as defined in the 1940 Act) of the Funds because he serves as a Director of Citigroup, Inc. and Citibank N.A., companies that may directly or through subsidiaries and affiliates engage from time-to-time in brokerage execution, principal transactions and lending relationships with the funds or accounts advised/managed by the Investment Manager. | |
|
| Interested Board Member Affiliated with Investment Manager* | | | | | | | |
|
| William F. Truscott | | | | | | | | | |
|
53600 Ameriprise Financial Center
Minneapolis, MN 55474
Age 51 | | Board member since 11/01 for RiverSource Funds and since 6/11 for Nations Funds; Senior Vice President since 2002 for RiverSource Funds and 5/10 for Nations Funds | | Chairman of the Board and President, Columbia Management Investment Advisers, LLC since May 2010 and February 2012, respectively (previously President, Chairman of the Board and Chief Investment Officer, 2001-April 2010); Chief Executive Officer, U.S. Asset Management & President, Annuities, Ameriprise Financial, Inc. since May 2010 (previously President—U.S. Asset Management and Chief Investment Officer, 2005-April 2010); Director, President and Chief Executive Officer, Ameriprise Certificate Company since 2006; Director and Chief Executive Officer, Columbia Management Investment Distributors, Inc. since May 2010 and February 2012, respectively (previously Chairman of the Board and Chief Executive Officer, 2006-April 2010); Chairman of the Board and Chief Executive Officer, Riversource Distributors, Inc. since 2006. | | | 153 | | | None | |
|
* Interested person (as defined under the 1940 Act) by reason of being an officer, director, security holder and/or employee of the Investment Manager or Ameriprise Financial.
The SAI has additional information about the Fund's Board members and is available, without charge, upon request by calling 800.345.6611; contacting your financial intermediary; or visiting columbiamanagement.com.
42
Fund Governance (continued)
Officers
| Name, Year of Birth and Address | | Principal Occupation(s) During the Past Five Years | |
| J. Kevin Connaughton (Born 1964) | |
|
225 Franklin Street
Boston, MA 02110
President (since 2009) | | Senior Vice President and General Manager—Mutual Fund Products, Columbia Management Investment Advisers, LLC since May 2010; President, Columbia Funds, since 2009, and RiverSource Funds, since May 2010 (previously Senior Vice President and Chief Financial Officer, Columbia Funds, from June 2008 to January 2009, Treasurer, Columbia Funds, from October 2003 to May 2008, and senior officer of various other affiliated funds since 2000); Managing Director, Columbia Management Advisors, LLC from December 2004 to April 2010. | |
|
Michael G. Clarke (Born 1969)
225 Franklin Street
Boston, MA 02110
Treasurer (since 2011) and Chief Financial Officer (since 2009) | | Vice President, Columbia Management Investment Advisers, LLC since May 2010; Managing Director of Fund Administration, Columbia Management Advisors, LLC, from September 2004 to April 2010; senior officer of Columbia Funds and affiliated funds since 2002. | |
|
Scott R. Plummer (Born 1959)
5228 Ameriprise Financial Center
Minneapolis, MN 55474
Senior Vice President and Chief Legal Officer (since 2010) | | Chief Legal Officer and Assistant Secretary, Columbia Management Investment Advisers, LLC since June 2005; Vice President and Lead Chief Counsel—Asset Management, Ameriprise Financial, Inc. since May 2010 (previously Vice President and Chief Counsel—Asset Management, from 2005 to April 2010, Vice President, Chief Counsel and Assistant Secretary, Columbia Management Investment Distributors, Inc. since 2008; Vice President, General Counsel and Secretary, Ameriprise Certificate Company since 2005; Chief Counsel, RiverSource Distributors, Inc. since 2006; Senior officer of Columbia Funds and affiliated funds, since 2006. | |
|
Thomas P. McGuire (Born 1972)
225 Franklin Street
Boston, MA 02110
Chief Compliance Officer (since 2012) | | Vice President—Asset Management Compliance, Columbia Management Investment Advisers, LLC since March 2010; Chief Compliance Officer, Ameriprise Certificate Company, since September 2010; Compliance Executive, Bank of America, from June 2005 to April 2010. | |
|
William F. Truscott (Born 1960)
53600 Ameriprise Financial Center
Minneapolis, MN 55474
Senior Vice President (since 2010) | | Chairman of the Board and President, Columbia Management Investment Advisers, LLC since May 2010 and February 2012, respectively (previously President, Chairman of the Board and Chief Investment Officer, from 2001 to April 2010); Chief Executive Officer, U.S. Asset Management & President, Annuities, Ameriprise Financial, Inc. since May 2010 (previously President—U.S. Asset Management and Chief Investment Officer from 2005 to April 2010); Director, President and Chief Executive Officer, Ameriprise Certificate Company since 2006; Director and Chief Executive Officer, Columbia Management Investment Distributors, Inc. since May 2010 and February 2012, respectively (previously Chairman of the Board and Chief Executive Officer from 2008 to April 2010); Chairman of the Board and Chief Executive Officer, RiverSource Distributors, Inc. since 2006. | |
|
Paul D. Pearson (Born 1956)
10468 Ameriprise Financial Center
Minneapolis, MN 55474
Vice President and Assistant Treasurer (since 2011) | | Vice President—Investment Accounting, Columbia Management Investment Advisers, LLC, since May 2010; Vice President—Managed Assets, Investment Accounting, Ameriprise Financial Corporation, 1998-2010 | |
|
43
Fund Governance (continued)
Officers (continued)
| Name, Year of Birth and Address | | Principal Occupation(s) During the Past Five Years | |
| Colin Moore (Born 1958) | |
|
225 Franklin Street
Boston, MA 02110
Senior Vice President (since 2010) | | Director and Chief Investment Officer, Columbia Management Investment Advisers, LLC since May 2010; Manager, Managing Director and Chief Investment Officer of Columbia Management Advisors, LLC from 2007 to April 2010; Head of Equities, Columbia Management Advisors, LLC from 2002 to 2007. | |
|
Christopher O. Petersen (Born 1970)
5228 Ameriprise Financial Center
Minneapolis, MN 55474
Vice President and Secretary (since 2011) | | Vice President and Chief Counsel, Ameriprise Financial since January 2010 (formerly Vice President and Group Counsel or Counsel from April 2004 to January 2010); Senior officer of Columbia Funds and affiliated funds, since 2007. | |
|
Amy K. Johnson (Born 1965)
5228 Ameriprise Financial Center
Minneapolis, MN 55474
Vice President (since 2010) | | Senior Vice President and Chief Operating Officer, Columbia Management Investment Advisers, LLC since May 2010 (previously Chief Administrative Officer, from 2009 until April 2010, Vice President—Asset Management and Trust Company Services, from 2006 to 2009, and Vice President—Operations and Compliance from 2004 to 2006). | |
|
Joseph F. DiMaria (Born 1968)
225 Franklin Street
Boston, MA 02110
Vice President (since 2011) and Chief Accounting Officer (since 2008) | | Vice President, Mutual Fund Administration, Columbia Management Investment Advisers, LLC, since May 2010; Director of Fund Administration, Columbia Management Advisors, LLC from January 2006 to April 2010. | |
|
Paul B. Goucher (Born 1968)
100 Park Avenue
New York, NY 10017
Vice President and Assistant Secretary (since 2010) | | Vice President and Chief Counsel of Ameriprise Financial since January 2010 (formerly Vice President and Group Counsel from November 2008 to January 2010); Director, Managing Director and General Counsel of J. & W. Seligman & Co. Incorporated (Seligman) from July 2008 to November 2008 and Managing Director and Associate General Counsel of Seligman from January 2005 to July 2008. | |
|
Michael E. DeFao (Born 1968)
225 Franklin Street
Boston, MA 02110
Vice President and Assistant Treasurer (since 2011) | | Vice President and Chief Counsel, Ameriprise Financial since May 2010; Associate General Counsel, Bank of America from June 2005 to April 2010 | |
|
Stephen T. Welsh (Born 1957)
225 Franklin Street
Boston, MA 02110
Vice President (since 2006) | | President and Director, Columbia Management Investment Services Corp. since May 2010; President and Director, Columbia Management Services, Inc. from July 2004 to April 2010; Managing Director, Columbia Management Distributors, Inc. from August 2007 to April 2010. | |
|
44
Important Information About This Report
The fund mails one shareholder report to each shareholder address. If you would like more than one report, please call shareholder services at 1-800-345-6611 and additional reports will be sent to you. This report has been prepared for shareholders of Columbia Convertible Securities Fund.
A description of the policies and procedures that the fund uses to determine how to vote proxies and a copy of the fund's voting records are available (i) at www.columbiamanagement.com, (ii) on the Securities and Exchange Commission's website at www.sec.gov, and (iii) without charge, upon request, by calling 1-800-368-0346. Information regarding how the fund voted proxies relating to portfolio securities during the 12-month period ended June 30 is available from the SEC's website. Information regarding how the fund voted proxies relating to portfolio securities is also available from the fund's website, www.columbiamanagement.com.
The fund files a complete schedule of portfolio holdings with the SEC for the first and third quarters of each fiscal year on Form N-Q. The fund's Form N-Q is available on the SEC's website at www.sec.gov and may be reviewed and copied at the SEC's Public Reference Room in Washington, D.C. Information on the operation of the Public Reference Room may be obtained by calling 1-800-SEC-0330.
Transfer Agent
Columbia Management Investment
Services Corp.
P.O. Box 8081
Boston, MA 02266-8081
1-800-345-6611
Distributor
Columbia Management Investment
Distributors, Inc.
225 Franklin Street
Boston, MA 02110
Investment Manager
Columbia Management Investment Advisers, LLC
225 Franklin Street
Boston, MA 02110
45

Columbia Convertible Securities Fund
P. O. Box 8081
Boston, MA 02266-8081
columbiamanagement.com
This information is for use with concurrent or prior delivery of a fund prospectus. Investors should consider the investment objectives, risks, charges and expenses of a mutual fund carefully before investing. For a free prospectus, which contains this and other important information about the funds, visit columbiamanagement.com. Read the prospectus carefully before investing. The Fund is distributed by Columbia Management Investment Distributors, Inc., member FINRA, and managed by Columbia Management Investment Advisers, LLC.
© 2012 Columbia Management Investment Advisers, LLC. All rights reserved.
C-1226 C (4/12)

Columbia Large Cap Core Fund
Annual Report for the Period Ended February 29, 2012
Not FDIC insured • No bank guarantee • May lose value
Table of Contents
| Fund Profile | | | 1 | | |
|
| Performance Information | | | 2 | | |
|
| Understanding Your Expenses | | | 3 | | |
|
| Portfolio Managers' Report | | | 4 | | |
|
| Portfolio of Investments | | | 6 | | |
|
Statement of Assets and
Liabilities | | | 10 | | |
|
| Statement of Operations | | | 12 | | |
|
Statement of Changes in
Net Assets | | | 13 | | |
|
| Financial Highlights | | | 15 | | |
|
| Notes to Financial Statements | | | 21 | | |
|
Report of Independent Registered
Public Accounting Firm | | | 33 | | |
|
| Federal Income Tax Information | | | 34 | | |
|
| Fund Governance | | | 35 | | |
|
Important Information About
This Report | | | 45 | | |
|
The views expressed in this report reflect the current views of the respective parties. These views are not guarantees of future performance and involve certain risks, uncertainties and assumptions that are difficult to predict, so actual outcomes and results may differ significantly from the views expressed. These views are subject to change at any time based upon economic, market or other conditions and the respective parties disclaim any responsibility to update such views. These views may not be relied on as investment advice and, because investment decisions for a Columbia Fund are based on numerous factors, may not be relied on as an indication of trading intent on behalf of any particular Columbia Fund. References to specific securities should not be construed as a recommendation or investment advice.
President's Message

Dear Shareholders,
Americans were dispirited in the fourth quarter of 2011 by Washington's inability to reach a plan for deficit reduction and Europe's piecemeal attempt to address its own fiscal issues. Yet, there was sufficient good news to encourage risk taking, buoying both stocks and bonds to solid gains.
U.S. economic data surprised on the upside and fears of recession abated. With the bar of expectations set low, investors responded positively to the announcement that the economy had expanded by 1.8% in the third quarter. Consumer confidence improved, even though consumers remain under pressure with no real increase in disposable income and a continued decline in household net worth. Headline inflation—which tracks a broad range of consumer expenditures, including food and energy—declined. Even manufacturing held its ground.
Against this backdrop, the U.S. equity markets logged solid returns. The S&P 500 Index gained 11.82%, moving into positive territory for the year with quarterly advances in all ten sectors. Mid- and small-cap stocks did even better. Value outperformed growth across all market capitalizations. Energy stocks led the market, as the price of oil moved above $100 a barrel in December. Industrials and materials stocks rose, buoyed by improving economic data. The U.S. fixed-income markets logged modest but solid returns. High-yield bonds were the best performers as the economy showed signs of improvement. Emerging market bonds were strong performers, as inflation came under control in key regions. Municipal bonds and Treasuries eked out only modest gains, as investors moved away from quality in favor of riskier assets.
While fourth quarter gains were encouraging, challenges still remain. Columbia Management, however, remains strong and steadfast. Columbia Management is the eighth largest manager of long-term mutual fund assets with $326 billion under management as of December 31, 2011. The past year has been one of considerable change for the organization as we worked diligently to align products, services and resources in the integration of Columbia Management with RiverSource Investments. The strong line-up of talent, resources and capabilities that has resulted is highlighted by the success of our products. As of December 31, 2011, Columbia Management offers 52 funds rated either 4 or 5 stars by Morningstar.*
For more information about these and other funds offered by Columbia Management, including detailed, up-to-date fund performance and portfolio information, please visit us online at columbiamanagement.com. Other information and resources available on our website include:
g timely economic analysis and market commentary
g quarterly fund commentaries
g Columbia Management Investor, a quarterly newsletter for shareholders
Thank you for your continued support of the Columbia Funds. We look forward to serving your investment needs for many years to come.
Best Regards,

J. Kevin Connaughton
President, Columbia Funds
*All ratings are based on Class Z shares as of 12/31/2011. Out of 119 Class Z share Columbia funds rated by Morningstar, 7 funds received a 5-star Overall Rating and 45 funds received a 4-star Overall Rating. The Overall Morningstar Rating for a retail mutual fund is derived from a weighted average of the performance figures associated with its 3-, 5- and 10-year (if applicable) Morningstar Rating metrics. For share classes that do not have a 3-, 5-, or 10-year actual performance history, the fund's independent Morningstar Rating metric is then compared against the retail mutual fund universe breakpoints to determine its hypothetical rating.
For each fund with at least a three-year history, Morningstar calculates a Morningstar RatingTM based on a Morningstar Risk-Adjusted Return measure that accounts for variation in a fund's monthly performance (including the effects of sales charges/loads, and redemption fees), placing more emphasis on downward variations and rewarding consistent performance. The top 10% of funds in each category receive 5 stars, the next 22.5% receive 4 stars, the next 35% receive 3 stars, the next 22.5% receive 2 stars and the bottom 10% receive 1 star. (Each share class is counted as a fraction of one fund within this scale and rated separately, which may cause slight variations in the distribution percentages.)
The Morningstar RatingTM is for Class Z shares only; other classes may have different performance characteristics and may have different ratings. ©2012 Morningstar, Inc. All Rights Reserved. The Morningstar information contained herein: (1) is proprietary to Morningstar and/or its content providers; (2) may not be copied or distributed; and (3) is not warranted to be accurate, complete or timely. Neither Morningstar nor its content providers are responsible for any damages or losses arising from any use of this information.
Investors should consider the investment objectives, risks, charges and expenses of a mutual fund carefully before investing. For a free prospectus, which contains this and other important information about the funds, visit columbiamanagement.com. The prospectus should be read carefully before investing.
Columbia Funds are distributed by Columbia Management Investment Distributors, Inc., member FINRA, and managed by Columbia Management Investment Advisers, LLC.
© 2012 Columbia Management Investment Advisers, LLC. All rights reserved.
Fund Profile – Columbia Large Cap Core Fund
Summary
g For the 12-month period that ended February 29, 2012, the fund's Class A shares returned 3.45% without sales charge.
g The S&P 500 Index returned 5.12% for the same period.1
g Under exposure to higher-yielding stocks and weak performance from energy names hurt returns relative to the index.
Portfolio Management
Peter Santoro, lead manager, has managed the fund since 2004. From 2003 until joining Columbia Management Investment Advisers, LLC (the Investment Manager) in May 2010, Mr. Santoro was associated with the fund's previous investment adviser as an investment professional.
Craig Leopold has co-managed the fund since 2004. From 2003 until joining the Investment Manager in May 2010, Mr. Leopold was associated with the fund's previous investment adviser as investment professional.
1The Standard & Poor's (S&P) 500 Index tracks the performance of 500 widely held, large-capitalization U.S. stocks.
Indices are not available for investment, are not professionally managed and do not reflect sales charges, fees, brokerage commissions, taxes or other expenses of investing. Securities in the fund may not match those in an index.
Performance data quoted represents past performance and current performance may be lower or higher. Past performance is no guarantee of future results. The investment return and principal value will fluctuate so that shares, when redeemed, may be worth more or less than the original cost. Please visit www.columbiamanagement.com for daily and most recent month-end performance updates.
Summary
1-year return as of 02/29/12
| | | | +3.45% | |
|
|  | | | Class A shares
(without sales charge) | |
|
| | | | +5.12% | |
|
|  | | | S&P 500 Index | |
|
Morningstar Style BoxTM
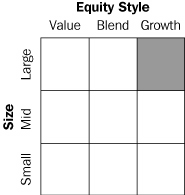
The Morningstar Style BoxTM is based on the fund's portfolio holdings. For equity funds, the vertical axis shows the market capitalization of the stocks owned, and the horizontal axis shows investment style (value, blend, or growth). Information shown is based on the most recent data provided by Morningstar.
© 2012 Morningstar, Inc. All rights reserved. The Morningstar information contained herein: (1) is proprietary to Morningstar and/or its content providers; (2) may not be copied or distributed; and (3) is not warranted to be accurate, complete or timely. Neither Morningstar nor its content providers are responsible for any damages or losses arising from any use of this information.
1
Performance Information – Columbia Large Cap Core Fund
Performance data quoted represents past performance and current performance may be lower or higher. Past performance is no guarantee of future results. The investment return and principal value will fluctuate so that shares, when redeemed, may be worth more or less than the original cost. Please visit www.columbiamanagement.com for daily and most recent month-end performance updates.
Performance of a $10,000 investment 03/01/02 – 02/29/12
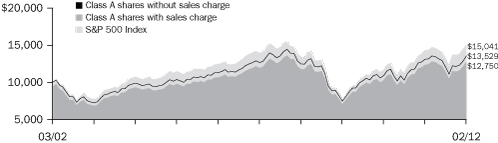
The chart above shows the change in value of a hypothetical $10,000 investment in Class A shares of Columbia Large Cap Core Fund during the stated time period, and does not reflect the deduction of taxes that a shareholder may pay on fund distributions or on the redemption of fund shares.
Performance of a $10,000 investment 03/01/02 – 02/29/12 ($)
| Sales charge | | without | | with | |
| Class A | | | 13,529 | | | | 12,750 | | |
| Class B | | | 12,533 | | | | 12,533 | | |
| Class C | | | 12,518 | | | | 12,518 | | |
| Class I* | | | 13,884 | | | | n/a | | |
| Class W* | | | 13,566 | | | | n/a | | |
| Class Z | | | 13,846 | | | | n/a | | |
Average annual total return as of 02/29/12 (%)
| Share class | | A | | B | | C | | I* | | W* | | Z | |
| Inception | | 08/02/99 | | 08/02/99 | | 08/02/99 | | 09/27/10 | | 09/27/10 | | 10/02/98 | |
| Sales charge | | without | | with | | without | | with | | without | | with | | without | | without | | without | |
| 1-year | | | 3.45 | | | | –2.51 | | | | 2.72 | | | | –2.28 | | | | 2.64 | | | | 1.64 | | | | 3.82 | | | | 3.48 | | | | 3.65 | | |
| 5-year | | | 1.40 | | | | 0.21 | | | | 0.64 | | | | 0.27 | | | | 0.63 | | | | 0.63 | | | | 1.69 | | | | 1.43 | | | | 1.63 | | |
| 10-year | | | 3.07 | | | | 2.46 | | | | 2.28 | | | | 2.28 | | | | 2.27 | | | | 2.27 | | | | 3.34 | | | | 3.10 | | | | 3.31 | | |
The "with sales charge" returns include the maximum initial sales charge of 5.75% for Class A shares and the applicable contingent deferred sales charge of 5.00% in the first year, declining to 1.00% in the sixth year and eliminated thereafter for Class B shares and 1.00% for Class C shares for the first year only. The "without sales charge" returns do not include the effect of sales charges. If they had, returns would be lower.
Performance results reflect any fee waivers or reimbursements of fund expenses by Columbia Management Investment Advisers, LLC and/or any of its affiliates. Absent these fee waivers or expense reimbursement arrangements, performance results would have been lower.
All results shown assume reinvestment of distributions. Class I and Class Z shares are sold at net asset value with no distribution and service (Rule 12b-1) fees. Class W shares are sold at net asset value with a distribution (12b-1) fee. Class I, Class W and Class Z shares have limited eligibility and the investment minimum requirements may vary. Please see the fund's prospectuses for details. Performance for different share classes will vary based on differences in sales charges and fees associated with each class.
The tables do not reflect the deduction of taxes that a shareholder may pay on fund distributions or on the redemption of fund shares.
*The returns shown for periods prior to the share class inception date (including returns since inception, which are since fund inception) include the returns of the fund's oldest share class. These returns are adjusted to reflect any higher class-related operating expenses of the newer share classes, as applicable. Please visit columbiamanagement.com/mutual-funds/appended-performance for more information.
2
Understanding Your Expenses – Columbia Large Cap Core Fund
As an investor, you incur two types of costs. There are transaction costs, which generally include sales charges on purchases and may include redemption fees. There are also ongoing costs, which generally include management fees, distribution and service (Rule 12b-1) fees, and other fund expenses. The following information is intended to help you understand your ongoing costs (in dollars) of investing in the Fund and to help you compare these costs with the ongoing costs of investing in other mutual funds.
Analyzing your fund's expenses
To illustrate these ongoing costs, we have provided examples and calculated the expenses paid by investors in each share class of the Fund during the period. The actual and hypothetical information in the table is based on an initial investment of $1,000 at the beginning of the period indicated and held for the entire period. Expense information is calculated two ways and each method provides you with different information. The amount listed in the "Actual" column is calculated using the Fund's actual operating expenses and total return for the period. You may use the Actual information, together with the amount invested, to estimate the expenses that you paid over the period. Simply divide your account value by $1,000 (for example, an $8,600 account value divided by $1,000 = 8.6), then multiply the results by the expenses paid during the period under the Actual column. The amount listed in the "Hypothetical" column assumes a 5% annual rate of return before expenses (which is not the Fund's actual return) and then applies the Fund's actual expense ratio for the period to the hypothetical return. You should not use the hypothetical account values and expenses to estimate either your actual account balance at the end of the period or the expenses you paid during the period. See "Compare with other funds" below for details on how to use the hypothetical data.
Compare with other funds
Since all mutual funds are required to include the same hypothetical calculations about expenses in shareholder reports, you can use this information to compare the ongoing cost of investing in the Fund with other funds. To do so, compare the hypothetical example with the 5% hypothetical examples that appear in the shareholder reports of other funds. As you compare hypothetical examples of other funds, it is important to note that hypothetical examples are meant to highlight the ongoing costs of investing in a fund only and do not reflect any transaction costs, such as sales charges, or redemption or exchange fees. Therefore, the hypothetical calculations are useful in comparing ongoing costs only, and will not help you determine the relative total costs of owning different funds. If transaction costs were included in these calculations, your costs would be higher.
September 1, 2011 – February 29, 2012
| | | Account value
at the beginning
of the period ($) | | Account value
at the end
of the period ($) | | Expenses
paid during
the period ($) | | Fund's
annualized
expense
ratio (%) | |
| | | Actual | | Hypothetical | | Actual | | Hypothetical | | Actual | | Hypothetical | | Actual | |
| Class A | | | 1,000.00 | | | | 1,000.00 | | | | 1,125.30 | | | | 1,019.10 | | | | 6.13 | | | | 5.82 | | | | 1.16 | | |
| Class B | | | 1,000.00 | | | | 1,000.00 | | | | 1,122.10 | | | | 1,015.37 | | | | 10.08 | | | | 9.57 | | | | 1.91 | | |
| Class C | | | 1,000.00 | | | | 1,000.00 | | | | 1,121.20 | | | | 1,015.37 | | | | 10.07 | | | | 9.57 | | | | 1.91 | | |
| Class I | | | 1,000.00 | | | | 1,000.00 | | | | 1,127.90 | | | | 1,021.03 | | | | 4.07 | | | | 3.87 | | | | 0.77 | | |
| Class W | | | 1,000.00 | | | | 1,000.00 | | | | 1,126.40 | | | | 1,019.29 | | | | 5.92 | | | | 5.62 | | | | 1.12 | | |
| Class Z | | | 1,000.00 | | | | 1,000.00 | | | | 1,127.40 | | | | 1,020.34 | | | | 4.81 | | | | 4.57 | | | | 0.91 | | |
Expenses paid during the period are equal to the annualized expense ratio for each class as indicated above, multiplied by the average account value over the period and then multiplied by the number of days in the Fund's most recent fiscal half year and divided by 366.
Expenses do not include fees and expenses incurred indirectly by the Fund from the underlying funds in which the Fund may invest (also referred to as "acquired funds"), including affiliated and non-affiliated pooled investments vehicles (including mutual funds and exchange traded funds).
Had Columbia Management Investment Advisers, LLC and/or certain of its affiliates not waived/reimbursed certain fees and expenses, account value at the end of the period would have been reduced.
3
Portfolio Managers' Report – Columbia Large Cap Core Fund
Performance data quoted represents past performance and current performance may be lower or higher. Past performance is no guarantee of future results. The investment return and principal value will fluctuate so that shares, when redeemed, may be worth more or less than the original cost. Please visit www.columbiamanagement.com for daily and most recent month-end performance updates.
Net asset value per share
as of 02/29/12 ($)
| Class A | | | 14.09 | | |
| Class B | | | 13.59 | | |
| Class C | | | 13.58 | | |
| Class I | | | 14.04 | | |
| Class W | | | 14.09 | | |
| Class Z | | | 14.04 | | |
Distributions declared per share
03/01/11 – 02/29/12 ($)
| Class A | | | 0.10 | | |
| Class B | | | 0.02 | | |
| Class C | | | 0.02 | | |
| Class I | | | 0.16 | | |
| Class W | | | 0.11 | | |
| Class Z | | | 0.14 | | |
For the 12-month period that ended February 29, 2012, the fund's Class A shares returned 3.45% without sales charge. The fund lagged its benchmark, the S&P 500 Index, which returned 5.12%. In an environment of low interest rates, we believe that income-hungry investors focused on the dividend-paying potential of stocks rather than on business fundamentals or growth prospects. Because our strategy generally seeks a more balanced total return approach, we were underexposed to the one-dimensional highest dividend-paying segment of the market, which outperformed during the 12-month period. Stock selection in the consumer discretionary, information technology and industrials sectors helped returns during the period, while certain energy holdings hurt.
The U.S. economy picks up momentum
During the first half of the 12-month period, a series of natural disasters in Japan, Europe's debt problems and wrangling in Washington over the federal budget and the national debt dominated world headlines. U.S. economic news was lackluster and job growth was disappointing. However, the pace of growth picked up in the second half of the period and, as fears of a lapse back into recession faded, prospects brightened. Consumer confidence improved even though consumers remain under pressure, with no real increase in disposable income and a continued decline in household net worth. The labor markets added more than a million new jobs from September 2011 through February 2012, and the jobless rate fell to 8.3%. Headline inflation—which tracks a broad range of consumer expenditures, including food and energy—remained below its long-term average. Even manufacturing held its ground. A modest slowdown in manufacturing activity late in the summer of 2011 raised concern that this lynchpin of the recovery was ready to turn downward. However, manufacturing activity stabilized and the manufacturing expansion continued into 2012. Housing continues to be the one nagging weak spot in the economy. Yet, home sales edged modestly higher over the year, and there is hope that a bottom in the housing market is in sight.
Stock selection generated mixed results
Energy stocks generally detracted from returns relative to the index. Oil service companies Schlumberger and Halliburton underperformed, as investors expressed concerns that falling natural gas prices in the United States would lead to reduced profitability due to potential rig closings. In light of these developments, we sold both stocks. Rising tensions in the Middle East, particularly in Egypt and Libya, hurt oil and gas producers Apache and Occidental Petroleum (2.0% of net assets). The increased risk of civil war in both countries drove fears of potential production disruptions. We sold Apache but retained the fund's position in Occidental, as we are more comfortable with its diversification outside of the Middle East, including a recent California shale discovery.
By contrast, stock picking in the consumer discretionary sector made a positive contribution to fund returns. Top contributors were retailers Macy's and Limited Brands, owner of Victoria's Secret (1.5% and 1.1% of net assets, respectively). We targeted these names because higher net worth shoppers are more protected from relatively high unemployment levels. Both companies also sought ways to reward shareholders with cash payouts over the past 12 months.
4
Portfolio Managers' Report (continued) – Columbia Large Cap Core Fund
We also owned Apple and Teradata, top performers in the information technology sector (5.2% and 0.7% of net assets, respectively). Apple's stock rose on the strength of iPad 2, iPhone 4 and an iPhone contract with Verizon Wireless. The company also benefited from lower prices on components, including memory chips, which increased profit margins. Analytic data solutions provider Teradata was a beneficiary of the move towards centralized data centers as companies migrated away from their old practice of storing data on multiple servers.
In the industrials sector, Goodrich and Union Pacific were top contributors. Goodrich, a supplier of systems and services to the aerospace and defense industries, was one of the fund's long-term holdings. It was acquired by United Technologies at an attractive price and is no longer in the portfolio. Western railroad company Union Pacific benefited from improving trends in basic industries, such as chemicals and automobiles. The company is also one of only two railroad companies operating in the Western United States, and its strong presence in Western ports helped increase its exposure to Asian boat-to-train trade. We sold the position when it reached our target price.
Looking forward
As the macroeconomic environment in the United States continues to stabilize, we believe it will create an ideal environment for managers who focus on stock selection. Companies that do a majority of their business in the United States look particularly appealing now, as Europe continues to work through its debt restructuring and Asian economic growth decelerates. Against this backdrop, we have positioned the fund in companies that we believe have good balance sheets and strong industry positions that are experiencing positive change that we believe can drive future success. To find these investments, we continue to draw on three independent and uncorrelated research sources—fundamental research, systematic models and portfolio management team input—while also continuing to focus on after-tax returns on behalf of shareholders.
Equity securities are subject to stock market fluctuations that occur in response to economic and business developments.
International investing may involve certain risks, including currency fluctuations, risks associated with possible differences in financial accounting standards and other monetary and political risks. Significant levels of foreign taxes, including potentially confiscatory levels of taxation and withholding taxes, may also apply to some foreign investments.
Portfolio breakdown1
as of 02/29/12 (%)
| Consumer Discretionary | | | 7.8 | | |
| Consumer Staples | | | 10.0 | | |
| Energy | | | 12.2 | | |
| Financials | | | 14.7 | | |
| Health Care | | | 12.6 | | |
| Industrials | | | 11.3 | | |
| Information Technology | | | 21.3 | | |
| Materials | | | 3.6 | | |
| Telecommunication Services | | | 3.3 | | |
| Utilities | | | 1.8 | | |
| Other2 | | | 1.4 | | |
1Percentages indicated are based upon total investments (excluding Investments of Cash Collateral Received for Securities on Loan). The Fund's portfolio composition is subject to change.
2Includes investments in affiliated money market fund.
Top ten holdings1
as of 02/29/12 (%)
| Apple, Inc. | | | 5.2 | | |
| Wells Fargo & Co. | | | 3.7 | | |
| Johnson & Johnson | | | 3.4 | | |
| Google, Inc., Class A | | | 3.1 | | |
| Chevron Corp. | | | 2.8 | | |
| General Electric Co. | | | 2.6 | | |
| Philip Morris International, Inc. | | | 2.6 | | |
| United Technologies Corp. | | | 2.5 | | |
| EMC Corp. | | | 2.3 | | |
| Accenture PLC, Class A | | | 2.3 | | |
1Percentages indicated are based upon total investments (excluding Investments of Cash Collateral Received for Securities on Loan and affiliated money market fund).
For further detail about these holdings, please refer to the section entitled "Portfolio of Investments."
Fund holdings are as of the date given, are subject to change at any time, and are not recommendations to buy or sell any security.
5
Portfolio of Investments – Columbia Large Cap Core Fund
February 29, 2012
(Percentages represent value of investments compared to net assets)
| Issuer | | Shares | | Value | |
| Common Stocks 97.8% | |
| CONSUMER DISCRETIONARY 7.8% | |
| Auto Components 0.4% | |
| Delphi Automotive PLC(a) | | | 67,810 | | | $ | 2,169,920 | | |
| Johnson Controls, Inc. | | | 66,350 | | | | 2,165,000 | | |
| Total | | | 4,334,920 | | |
| Household Durables 0.9% | |
| D.R. Horton, Inc.(b) | | | 664,035 | | | | 9,522,262 | | |
| Internet & Catalog Retail 2.9% | |
| Liberty Interactive Corp., Class A(a) | | | 1,031,273 | | | | 19,346,682 | | |
| priceline.com, Inc.(a) | | | 18,438 | | | | 11,560,995 | | |
| Total | | | 30,907,677 | | |
| Media 1.1% | |
| DISH Network Corp., Class A | | | 400,681 | | | | 11,687,865 | | |
| Multiline Retail 1.4% | |
| Macy's, Inc. | | | 412,625 | | | | 15,667,371 | | |
| Specialty Retail 1.1% | |
| Limited Brands, Inc.(b) | | | 257,617 | | | | 11,986,919 | | |
| TOTAL CONSUMER DISCRETIONARY | | | 84,107,014 | | |
| CONSUMER STAPLES 10.1% | |
| Beverages 3.5% | |
| Beam, Inc.(b) | | | 247,080 | | | | 13,609,166 | | |
| PepsiCo, Inc. | | | 378,139 | | | | 23,800,069 | | |
| Total | | | 37,409,235 | | |
| Food & Staples Retailing 1.0% | |
| Costco Wholesale Corp. | | | 128,910 | | | | 11,093,995 | | |
| Food Products 1.7% | |
| Kellogg Co. | | | 340,300 | | | | 17,814,705 | | |
| Tobacco 3.9% | |
| Lorillard, Inc. | | | 109,709 | | | | 14,380,656 | | |
| Philip Morris International, Inc.(b) | | | 327,126 | | | | 27,321,563 | | |
| Total | | | 41,702,219 | | |
| TOTAL CONSUMER STAPLES | | | 108,020,154 | | |
| ENERGY 12.3% | |
| Energy Equipment & Services 1.6% | |
| National Oilwell Varco, Inc. | | | 213,446 | | | | 17,615,698 | | |
| Oil, Gas & Consumable Fuels 10.7% | |
| Anadarko Petroleum Corp. | | | 245,958 | | | | 20,689,987 | | |
| Chevron Corp. | | | 273,377 | | | | 29,830,898 | | |
| Continental Resources, Inc.(a)(b) | | | 85,713 | | | | 7,772,455 | | |
| Occidental Petroleum Corp. | | | 209,486 | | | | 21,864,054 | | |
| Royal Dutch Shell PLC, ADR | | | 248,787 | | | | 18,183,842 | | |
| Williams Companies, Inc. (The) | | | 531,634 | | | | 15,885,224 | | |
| Total | | | 114,226,460 | | |
| TOTAL ENERGY | | | 131,842,158 | | |
| FINANCIALS 13.5% | |
| Capital Markets 3.0% | |
| BlackRock, Inc. | | | 93,351 | | | | 18,576,849 | | |
| Goldman Sachs Group, Inc. (The) | | | 118,738 | | | | 13,671,493 | | |
| Total | | | 32,248,342 | | |
| Issuer | | Shares | | Value | |
| Common Stocks (continued) | |
| FINANCIALS (cont.) | |
| Commercial Banks 7.1% | |
| Fifth Third Bancorp(b) | | | 1,139,740 | | | $ | 15,511,861 | | |
| PNC Financial Services Group, Inc. | | | 345,495 | | | | 20,563,862 | | |
| Wells Fargo & Co. | | | 1,261,950 | | | | 39,486,416 | | |
| Total | | | 75,562,139 | | |
| Diversified Financial Services 2.6% | |
| Citigroup, Inc. | | | 461,316 | | | | 15,371,049 | | |
| IntercontinentalExchange, Inc.(a) | | | 92,446 | | | | 12,753,850 | | |
| Total | | | 28,124,899 | | |
| Insurance 0.8% | |
| XL Group PLC | | | 399,318 | | | | 8,305,815 | | |
| TOTAL FINANCIALS | | | 144,241,195 | | |
| HEALTH CARE 12.7% | |
| Biotechnology 1.9% | |
| Biogen Idec, Inc.(a) | | | 114,093 | | | | 13,288,412 | | |
| Vertex Pharmaceuticals, Inc.(a) | | | 182,760 | | | | 7,113,019 | | |
| Total | | | 20,401,431 | | |
| Health Care Equipment & Supplies 1.8% | |
| Covidien PLC | | | 364,087 | | | | 19,023,546 | | |
| Health Care Providers & Services 2.2% | |
| CIGNA Corp. | | | 387,863 | | | | 17,108,637 | | |
| Express Scripts, Inc.(a)(b) | | | 124,490 | | | | 6,639,052 | | |
| Total | | | 23,747,689 | | |
| Pharmaceuticals 6.8% | |
| Allergan, Inc. | | | 148,882 | | | | 13,338,338 | | |
| Johnson & Johnson(b) | | | 551,770 | | | | 35,909,191 | | |
| Merck & Co., Inc. | | | 623,145 | | | | 23,785,445 | | |
| Total | | | 73,032,974 | | |
| TOTAL HEALTH CARE | | | 136,205,640 | | |
| INDUSTRIALS 11.3% | |
| Aerospace & Defense 2.5% | |
| United Technologies Corp. | | | 315,143 | | | | 26,431,044 | | |
| Construction & Engineering 0.5% | |
| KBR, Inc. | | | 160,351 | | | | 5,823,948 | | |
| Electrical Equipment 1.0% | |
| Rockwell Automation, Inc. | | | 132,650 | | | | 10,609,347 | | |
| Industrial Conglomerates 4.6% | |
| General Electric Co. | | | 1,451,616 | | | | 27,653,285 | | |
| Tyco International Ltd. | | | 421,414 | | | | 21,837,673 | | |
| Total | | | 49,490,958 | | |
| Machinery 2.7% | |
| Cummins, Inc.(b) | | | 92,331 | | | | 11,132,348 | | |
| Parker Hannifin Corp.(b) | | | 201,112 | | | | 18,061,869 | | |
| Total | | | 29,194,217 | | |
| TOTAL INDUSTRIALS | | | 121,549,514 | | |
The Accompanying Notes to Financial Statements are an integral part of this statement.
6
Columbia Large Cap Core Fund
February 29, 2012
(Percentages represent value of investments compared to net assets)
| Issuer | | Shares | | Value | |
| Common Stocks (continued) | |
| INFORMATION TECHNOLOGY 21.4% | |
| Communications Equipment 2.2% | |
| QUALCOMM, Inc. | | | 384,646 | | | $ | 23,917,288 | | |
| Computers & Peripherals 7.5% | |
| Apple, Inc.(a) | | | 102,404 | | | | 55,548,026 | | |
| EMC Corp.(a)(b) | | | 887,573 | | | | 24,576,896 | | |
| Total | | | 80,124,922 | | |
| Internet Software & Services 4.6% | |
| eBay, Inc.(a) | | | 462,533 | | | | 16,530,930 | | |
| Google, Inc., Class A(a) | | | 52,945 | | | | 32,733,246 | | |
| Total | | | 49,264,176 | | |
| IT Services 3.0% | |
| Accenture PLC, Class A | | | 410,940 | | | | 24,467,368 | | |
| Teradata Corp.(a) | | | 119,116 | | | | 7,927,170 | | |
| Total | | | 32,394,538 | | |
| Semiconductors & Semiconductor Equipment 2.2% | |
| Avago Technologies Ltd. | | | 403,240 | | | | 15,165,856 | | |
| Marvell Technology Group Ltd.(a) | | | 585,340 | | | | 8,780,100 | | |
| Total | | | 23,945,956 | | |
| Software 1.9% | |
| Check Point Software Technologies Ltd.(a) | | | 129,900 | | | | 7,554,984 | | |
| Intuit, Inc. | | | 210,115 | | | | 12,153,052 | | |
| Total | | | 19,708,036 | | |
| TOTAL INFORMATION TECHNOLOGY | | | 229,354,916 | | |
| MATERIALS 3.6% | |
| Chemicals 3.6% | |
| Celanese Corp., Class A | | | 211,651 | | | | 10,068,238 | | |
| Dow Chemical Co. (The) | | | 416,130 | | | | 13,944,516 | | |
| PPG Industries, Inc.(b) | | | 155,179 | | | | 14,160,084 | | |
| Total | | | 38,172,838 | | |
| TOTAL MATERIALS | | | 38,172,838 | | |
| TELECOMMUNICATION SERVICES 3.3% | |
| Diversified Telecommunication Services 1.9% | |
| Verizon Communications, Inc.(b) | | | 526,633 | | | | 20,069,984 | | |
| Wireless Telecommunication Services 1.4% | |
| Vodafone Group PLC, ADR | | | 549,260 | | | | 14,879,453 | | |
| TOTAL TELECOMMUNICATION SERVICES | | | 34,949,437 | | |
| UTILITIES 1.8% | |
| Multi-Utilities 1.8% | |
| Sempra Energy | | | 326,131 | | | | 19,320,000 | | |
| TOTAL UTILITIES | | | 19,320,000 | | |
Total Common Stocks
(Cost: $860,195,642) | | $ | 1,047,762,866 | | |
| Convertible Preferred Stocks 1.4% | |
| FINANCIALS 1.4% | |
| Diversified Financial Services 1.4% | |
| Bank of America Corp., 7.250% | | | 12,401,317 | | | $ | 14,540,625 | | |
| TOTAL FINANCIALS | | | 14,540,625 | | |
Total Convertible Preferred Stocks
(Cost: $12,401,317) | | $ | 14,540,625 | | |
| | | Shares | | Value | |
| Money Market Funds 1.5% | |
Columbia Short-Term Cash Fund,
0.166%(c)(d) | | | 15,535,546 | | | $ | 15,535,546 | | |
Total Money Market Funds
(Cost: $15,535,546) | | $ | 15,535,546 | | |
| Issuer | | Effective
Yield | | Par/
Principal/
Shares | | Value | |
Investments of Cash Collateral Received for Securities
on Loan 9.4% | |
| Asset-Backed Commercial Paper 1.2% | |
Atlantic Asset Securitization LLC
03/01/12 | | | 0.300 | % | | $ | 4,999,708 | | | $ | 4,999,708 | | |
Regency Markets No. 1 LLC
03/19/12 | | | 0.200 | % | | | 4,999,139 | | | | 4,999,139 | | |
Rhein-Main Securitisation Ltd.
04/13/12 | | | 0.771 | % | | | 3,058,070 | | | | 3,058,070 | | |
| Total | | | 13,056,917 | | |
| Certificates of Deposit 2.2% | |
ABM AMRO Bank N.V.
03/21/12 | | | 0.310 | % | | | 4,998,752 | | | | 4,998,752 | | |
DZ Bank AG
03/12/12 | | | 0.250 | % | | | 3,000,000 | | | | 3,000,000 | | |
Hong Kong Shanghai Bank Corp., Ltd.
03/12/12 | | | 0.250 | % | | | 2,000,000 | | | | 2,000,000 | | |
Norinchukin Bank
05/21/12 | | | 0.470 | % | | | 3,000,000 | | | | 3,000,000 | | |
Skandinaviska Enskilda Banken
04/16/12 | | | 0.360 | % | | | 5,000,000 | | | | 5,000,000 | | |
United Overseas Bank Ltd.
03/16/12 | | | 0.250 | % | | | 5,000,000 | | | | 5,000,000 | | |
| Total | | | 22,998,752 | | |
| Commercial Paper 1.1% | |
Mitsubishi UFJ Trust and Banking Corp.
05/03/12 | | | 0.430 | % | | | 2,997,456 | | | | 2,997,456 | | |
State Development Bank of NorthRhine-Westphalia
03/13/12 | | | 0.240 | % | | | 3,999,227 | | | | 3,999,227 | | |
Swedish National Housing Finance Corp. (SBAB)
03/15/12 | | | 0.350 | % | | | 4,998,541 | | | | 4,998,541 | | |
| Total | | | 11,995,224 | | |
| Repurchase Agreements 4.9% | |
Credit Suisse Securities (USA) LLC
dated 02/29/12, matures 03/01/12,
repurchase price $7,924,619(e)
| | | 0.160 | % | | | 7,924,584 | | | | 7,924,584 | | |
Natixis Financial Products, Inc.
dated 02/29/12, matures 03/01/12,
repurchase price $45,000,275(e)
| | | 0.220 | % | | | 45,000,000 | | | | 45,000,000 | | |
| Total | | | 52,924,584 | | |
Total Investments of Cash Collateral Received for Securities
on Loan
(Cost: $100,975,477) | | | | | | $ | 100,975,477 | | |
Total Investments
(Cost: $989,107,982) | | | | | | $ | 1,178,814,514 | | |
| Other Assets & Liabilities, Net | | | | | | | (107,794,949 | ) | |
| Net Assets | | $ | 1,071,019,565 | | |
The Accompanying Notes to Financial Statements are an integral part of this statement.
7
Columbia Large Cap Core Fund
February 29, 2012
| Notes to Portfolio of Investments | |
(a) Non-income producing.
(b) At February 29, 2012, security was partially or fully on loan.
(c) The rate shown is the seven-day current annualized yield at February 29, 2012.
(d) Investments in affiliates during the year ended February 29, 2012:
| Issuer | | Beginning
Cost | | Purchase
Cost | | Sales Cost/
Proceeds
from Sales | | Realized
Gain/Loss | | Ending
Cost | | Dividends
or Interest
Income | | Value | |
Columbia Short-Term
Cash Fund | | $ | — | | | $ | 241,439,677 | | | $ | (225,904,131 | ) | | $ | — | | | $ | 15,535,546 | | | $ | 17,021 | | | $ | 15,535,546 | | |
(e) The table below represents securities received as collateral for repurchase agreements. This collateral is deposited with the Fund's custodian and, pursuant to the terms of the repurchase agreement, must have an aggregate market value greater than or equal to the repurchase price plus accrued interest at all times. The value of securities and/or cash held as collateral for repurchase agreements is monitored on a daily basis to ensure the proper level of collateral.
Credit Suisse Securities (USA) LLC (0.160%)
| Security Description | | Value | |
| Ginnie Mae I Pool | | $ | 5,673,232 | | |
| Ginnie Mae II Pool | | | 2,409,862 | | |
| Total Market Value of Collateral Securities | | $ | 8,083,094 | | |
Natixis Financial Products, Inc. (0.220%)
| Security Description | | Value | |
| Fannie Mae Pool | | $ | 2,263,804 | | |
| Fannie Mae REMICS | | | 16,860,047 | | |
| Freddie Mac Gold Pool | | | 2,072,708 | | |
| Freddie Mac REMICS | | | 9,941,496 | | |
| Government National Mortgage Association | | | 2,967,523 | | |
| United States Treasury Note/Bond | | | 11,794,702 | | |
| Total Market Value of Collateral Securities | | $ | 45,900,280 | | |
| Abbreviation Legend | |
ADR American Depositary Receipt
Generally accepted accounting principles (GAAP) require disclosure regarding the inputs and valuation techniques used to measure fair value and any changes in valuation inputs or techniques. In addition, investments shall be disclosed by major category.
The Fund categorizes its fair value measurements according to a three-level hierarchy that maximizes the use of observable inputs and minimizes the use of unobservable inputs by prioritizing that the most observable input be used when available. Observable inputs are those that market participants would use in pricing an investment based on market data obtained from sources independent of the reporting entity. Unobservable inputs are those that reflect the Fund's assumptions about the information market participants would use in pricing an investment. An investment's level within the fair value hierarchy is based on the lowest level of any input that is deemed significant to the asset or liability's fair value measurement. The input levels are not necessarily an indication of the risk or liquidity associated with investments at that level. For example, certain U.S. government securities are generally high quality and liquid, however, they are reflected as Level 2 because the inputs used to determine fair value may not always be quoted prices in an active market.
Fair value inputs are summarized in the three broad levels listed below:
• Level 1 — Valuations based on quoted prices for investments in active markets that the Fund has the ability to access at the measurement date (including NAV for open-end mutual funds). Valuation adjustments are not applied to Level 1 investments.
• Level 2 — Valuations based on other significant observable inputs (including quoted prices for similar securities, interest rates, prepayment speeds, credit risks, etc.).
• Level 3 — Valuations based on significant unobservable inputs (including the Fund's own assumptions and judgment in determining the fair value of investments).
The Accompanying Notes to Financial Statements are an integral part of this statement.
8
Columbia Large Cap Core Fund
February 29, 2012
| Fair Value Measurements (continued) | |
Inputs that are used in determining fair value of an investment may include price information, credit data, volatility statistics, and other factors. These inputs can be either observable or unobservable. The availability of observable inputs can vary between investments, and is affected by various factors such as the type of investment, and the volume and level of activity for that investment or similar investments in the marketplace. The inputs will be considered by the Investment Manager, along with any other relevant factors in the calculation of an investment's fair value. The Fund uses prices and inputs that are current as of the measurement date, which may include periods of market dislocations. During these periods, the availability of prices and inputs may be reduced for many investments. This condition could cause an investment to be reclassified between the various levels within the hierarchy.
Investments falling into the Level 3 category are primarily supported by quoted prices from brokers and dealers participating in the market for those investments. However, these may be classified as Level 3 investments due to lack of market transparency and corroboration to support these quoted prices. Additionally, valuation models may be used as the pricing source for any remaining investments classified as Level 3. These models rely on one or more significant unobservable inputs and/or significant assumptions by the Investment Manager. Inputs used in valuations may include, but are not limited to, financial statement analysis, capital account balances, discount rates and estimated cash flows, and comparable company data.
The following table is a summary of the inputs used to value the Fund's investments as of February 29, 2012:
| | | Fair value at February 29, 2012 | |
| Description(a) | | Level 1
Quoted Prices
in Active
Markets for
Identical Assets(b) | | Level 2
Other
Significant
Observable
Inputs | | Level 3
Significant
Unobservable
Inputs | | Total | |
| Equity Securities | |
| Common Stocks | |
| Consumer Discretionary | | $ | 84,107,014 | | | $ | — | | | $ | — | | | $ | 84,107,014 | | |
| Consumer Staples | | | 108,020,154 | | | | — | | | | — | | | | 108,020,154 | | |
| Energy | | | 131,842,158 | | | | — | | | | — | | | | 131,842,158 | | |
| Financials | | | 144,241,195 | | | | — | | | | — | | | | 144,241,195 | | |
| Health Care | | | 136,205,640 | | | | — | | | | — | | | | 136,205,640 | | |
| Industrials | | | 121,549,514 | | | | — | | | | — | | | | 121,549,514 | | |
| Information Technology | | | 229,354,916 | | | | — | | | | — | | | | 229,354,916 | | |
| Materials | | | 38,172,838 | | | | — | | | | — | | | | 38,172,838 | | |
| Telecommunication Services | | | 34,949,437 | | | | — | | | | — | | | | 34,949,437 | | |
| Utilities | | | 19,320,000 | | | | — | | | | — | | | | 19,320,000 | | |
| Convertible Preferred Stocks | |
| Financials | | | — | | | | 14,540,625 | | | | — | | | | 14,540,625 | | |
| Total Equity Securities | | | 1,047,762,866 | | | | 14,540,625 | | | | — | | | | 1,062,303,491 | | |
| Other | |
| Money Market Funds | | | 15,535,546 | | | | — | | | | — | | | | 15,535,546 | | |
| Investments of Cash Collateral Received for Securities on Loan | | | — | | | | 100,975,477 | | | | — | | | | 100,975,477 | | |
| Total Other | | | 15,535,546 | | | | 100,975,477 | | | | — | | | | 116,511,023 | | |
| Total | | $ | 1,063,298,412 | | | $ | 115,516,102 | | | $ | — | | | $ | 1,178,814,514 | | |
The Fund's assets assigned to the Level 2 input category are generally valued using the market approach, in which a security's value is determined through reference to prices and information from market transactions for similar or identical assets.
(a) See the Portfolio of Investments for all investment classifications not indicated in the table.
(b) There were no significant transfers between Levels 1 and 2 during the period.
The Accompanying Notes to Financial Statements are an integral part of this statement.
9
Statement of Assets and Liabilities – Columbia Large Cap Core Fund
February 29, 2012
| Assets | |
| Investments, at value* | |
| Unaffiliated issuers (identified cost $872,596,959) | | $ | 1,062,303,491 | | |
| Affiliated issuers (identified cost $15,535,546) | | | 15,535,546 | | |
| Investment of cash collateral received for securities on loan | |
| Short-term securities (identified cost $48,050,893) | | | 48,050,893 | | |
| Repurchase agreements (identified cost $52,924,584) | | | 52,924,584 | | |
| Total investments (identified cost $989,107,982) | | | 1,178,814,514 | | |
| Cash | | | 257 | | |
| Receivable for: | |
| Investments sold | | | 11,846,337 | | |
| Capital shares sold | | | 598,465 | | |
| Dividends | | | 2,352,501 | | |
| Interest | | | 12,383 | | |
| Reclaims | | | 8,649 | | |
| Prepaid expense | | | 14,608 | | |
| Trustees' deferred compensation plan | | | 10,857 | | |
| Total assets | | | 1,193,658,571 | | |
| Liabilities | |
| Due upon return of securities on loan | | | 100,975,477 | | |
| Payable for: | |
| Investments purchased | | | 4,953,326 | | |
| Capital shares purchased | | | 16,332,749 | | |
| Investment management fees | | | 20,307 | | |
| Distribution and service fees | | | 915 | | |
| Transfer agent fees | | | 139,680 | | |
| Administration fees | | | 1,694 | | |
| Expense reimbursement due to Investment Manager | | | 4,767 | | |
| Other expenses | | | 199,234 | | |
| Trustees' deferred compensation plan | | | 10,857 | | |
| Total liabilities | | | 122,639,006 | | |
| Net assets applicable to outstanding capital stock | | $ | 1,071,019,565 | | |
The Accompanying Notes to Financial Statements are an integral part of this statement.
10
Statement of Assets and Liabilities (continued) – Columbia Large Cap Core Fund
February 29, 2012
| Represented by | |
| Paid-in capital | | $ | 938,057,968 | | |
| Undistributed net investment income | | | 1,382,613 | | |
| Accumulated net realized loss | | | (58,126,897 | ) | |
| Unrealized appreciation (depreciation) on: | |
| Investments | | | 189,706,532 | | |
| Foreign currency translations | | | (651 | ) | |
| Total — representing net assets applicable to outstanding capital stock | | $ | 1,071,019,565 | | |
| *Value of securities on loan | | $ | 98,046,888 | | |
| Net assets applicable to outstanding shares | |
| Class A | | $ | 119,434,384 | | |
| Class B | | $ | 813,251 | | |
| Class C | | $ | 2,649,173 | | |
| Class I | | $ | 122,827,779 | | |
| Class W | | $ | 2,987 | | |
| Class Z | | $ | 825,291,991 | | |
| Shares outstanding | |
| Class A | | | 8,476,451 | | |
| Class B | | | 59,863 | | |
| Class C | | | 195,081 | | |
| Class I | | | 8,746,726 | | |
| Class W | | | 212 | | |
| Class Z | | | 58,779,078 | | |
| Net asset value per share | |
| Class A(a) | | $ | 14.09 | | |
| Class B | | $ | 13.59 | | |
| Class C | | $ | 13.58 | | |
| Class I | | $ | 14.04 | | |
| Class W | | $ | 14.09 | | |
| Class Z | | $ | 14.04 | | |
(a) The maximum offering price per share for Class A is $14.95. The offering price is calculated by dividing the net asset value by 1.0 minus the maximum sales charge of 5.75%.
The Accompanying Notes to Financial Statements are an integral part of this statement.
11
Statement of Operations – Columbia Large Cap Core Fund
Year ended February 29, 2012
| Net investment income | |
| Income: | |
| Dividends | | $ | 22,951,098 | | |
| Interest | | | 1,625 | | |
| Dividends from affiliates | | | 17,021 | | |
| Income from securities lending — net | | | 45,514 | | |
| Foreign taxes withheld | | | (113,913 | ) | |
| Total income | | | 22,901,345 | | |
| Expenses: | |
| Investment management fees | | | 8,114,264 | | |
| Distribution fees | |
| Class B | | | 8,141 | | |
| Class C | | | 19,013 | | |
| Service fees | |
| Class B | | | 2,714 | | |
| Class C | | | 6,338 | | |
| Class W | | | 7 | | |
| Distribution and service fees — Class A | | | 297,732 | | |
| Transfer agent fees | |
| Class A | | | 226,699 | | |
| Class B | | | 2,161 | | |
| Class C | | | 4,812 | | |
| Class W | | | 5 | | |
| Class Z | | | 1,744,472 | | |
| Administration fees | | | 630,042 | | |
| Compensation of board members | | | 27,241 | | |
| Pricing and bookkeeping fees | | | 48,189 | | |
| Custodian fees | | | 24,256 | | |
| Printing and postage fees | | | 103,980 | | |
| Registration fees | | | 60,611 | | |
| Professional fees | | | 79,799 | | |
| Line of credit interest expense | | | 955 | | |
| Chief compliance officer expenses | | | 310 | | |
| Other | | | 57,399 | | |
| Total expenses | | | 11,459,140 | | |
| Fees waived or expenses reimbursed by Investment Manager and its affiliates | | | (446,143 | ) | |
| Expense reductions | | | (7,384 | ) | |
| Total net expenses | | | 11,005,613 | | |
| Net investment income | | | 11,895,732 | | |
| Realized and unrealized gain (loss) — net | |
| Net realized gain (loss) on: | |
| Investments | | | 60,688,642 | | |
| Options contracts written | | | 339,545 | | |
| Net realized gain | | | 61,028,187 | | |
| Net change in unrealized appreciation (depreciation) on: | |
| Investments | | | (49,265,107 | ) | |
| Foreign currency translations | | | (139 | ) | |
| Net change in unrealized depreciation | | | (49,265,246 | ) | |
| Net realized and unrealized gain | | | 11,762,941 | | |
| Net increase in net assets resulting from operations | | $ | 23,658,673 | | |
The Accompanying Notes to Financial Statements are an integral part of this statement.
12
Statement of Changes in Net Assets – Columbia Large Cap Core Fund
| | | Year ended
February 29,
2012 | | Year ended
February 28,
2011(a) | |
| Operations | |
| Net investment income | | $ | 11,895,732 | | | $ | 6,829,390 | | |
| Net realized gain | | | 61,028,187 | | | | 118,395,596 | | |
| Net change in unrealized appreciation (depreciation) | | | (49,265,246 | ) | | | 86,340,195 | | |
| Net increase in net assets resulting from operations | | | 23,658,673 | | | | 211,565,181 | | |
| Distributions to shareholders from: | |
| Net investment income | |
| Class A | | | (905,722 | ) | | | (597,562 | ) | |
| Class B | | | (1,257 | ) | | | — | | |
| Class C | | | (3,321 | ) | | | — | | |
| Class I | | | (1,919,215 | ) | | | (35,165 | ) | |
| Class W | | | (23 | ) | | | (10 | ) | |
| Class Z | | | (8,396,793 | ) | | | (7,052,482 | ) | |
| Total distributions to shareholders | | | (11,226,331 | ) | | | (7,685,219 | ) | |
| Increase (decrease) in net assets from share transactions | | | (185,782,787 | ) | | | (85,011,943 | ) | |
| Proceeds from regulatory settlements (Note 6) | | | 64,591 | | | | — | | |
| Total increase (decrease) in net assets | | | (173,285,854 | ) | | | 118,868,019 | | |
| Net assets at beginning of year | | | 1,244,305,419 | | | | 1,125,437,400 | | |
| Net assets at end of year | | $ | 1,071,019,565 | | | $ | 1,244,305,419 | | |
| Undistributed net investment income | | $ | 1,382,613 | | | $ | 659,266 | | |
(a) Class I and Class W shares are for the period from September 27, 2010 (commencement of operations) to February 28, 2011.
The Accompanying Notes to Financial Statements are an integral part of this statement.
13
Statement of Changes in Net Assets (continued) – Columbia Large Cap Core Fund
| | | Year ended
February 29, 2012 | | Year ended
February 29, 2011(a) | |
| | | Shares | | Dollars ($) | | Shares | | Dollars ($) | |
| Capital stock activity | |
| Class A shares | |
| Subscriptions(b) | | | 520,353 | | | | 6,582,973 | | | | 819,382 | | | | 9,808,839 | | |
| Fund merger | | | 34,275 | | | | 460,907 | | | | — | | | | — | | |
| Distributions reinvested | | | 15,512 | | | | 197,131 | | | | 18,628 | | | | 226,052 | | |
| Redemptions | | | (1,563,986 | ) | | | (20,552,117 | ) | | | (2,833,331 | ) | | | (34,605,798 | ) | |
| Net decrease | | | (993,846 | ) | | | (13,311,106 | ) | | | (1,995,321 | ) | | | (24,570,907 | ) | |
| Class B shares | |
| Subscriptions | | | 3,792 | | | | 49,240 | | | | 19,342 | | | | 224,627 | | |
| Distributions reinvested | | | 52 | | | | 637 | | | | — | | | | — | | |
| Redemptions(b) | | | (68,737 | ) | | | (872,316 | ) | | | (137,222 | ) | | | (1,629,043 | ) | |
| Net decrease | | | (64,893 | ) | | | (822,439 | ) | | | (117,880 | ) | | | (1,404,416 | ) | |
| Class C shares | |
| Subscriptions | | | 33,247 | | | | 403,474 | | | | 17,206 | | | | 201,746 | | |
| Fund merger | | | 14,642 | | | | 190,045 | | | | — | | | | — | | |
| Distributions reinvested | | | 171 | | | | 2,096 | | | | — | | | | — | | |
| Redemptions | | | (50,144 | ) | | | (616,794 | ) | | | (40,442 | ) | | | (466,541 | ) | |
| Net decrease | | | (2,084 | ) | | | (21,179 | ) | | | (23,236 | ) | | | (264,795 | ) | |
| Class I shares | |
| Subscriptions | | | 6,461,139 | | | | 87,125,127 | | | | 10,132,687 | | | | 135,559,701 | | |
| Distributions reinvested | | | 151,420 | | | | 1,919,181 | | | | 2,718 | | | | 35,146 | | |
| Redemptions | | | (7,777,573 | ) | | | (102,134,050 | ) | | | (223,665 | ) | | | (2,971,154 | ) | |
| Net increase (decrease) | | | (1,165,014 | ) | | | (13,089,742 | ) | | | 9,911,740 | | | | 132,623,693 | | |
| Class W shares | |
| Subscriptions | | | — | | | | — | | | | 224 | | | | 2,650 | | |
| Redemptions | | | — | | | | — | | | | (12 | ) | | | (153 | ) | |
| Net increase | | | — | | | | — | | | | 212 | | | | 2,497 | | |
| Class Z shares | |
| Subscriptions | | | 4,649,967 | | | | 61,005,623 | | | | 7,245,250 | | | | 84,819,566 | | |
| Fund merger | | | 7,530,591 | | | | 100,981,718 | | | | — | | | | — | | |
| Distributions reinvested | | | 330,829 | | | | 4,191,690 | | | | 209,444 | | | | 2,653,077 | | |
| Redemptions | | | (24,897,373 | ) | | | (324,717,352 | ) | | | (22,661,724 | ) | | | (278,870,658 | ) | |
| Net decrease | | | (12,385,986 | ) | | | (158,538,321 | ) | | | (15,207,030 | ) | | | (191,398,015 | ) | |
| Total net decrease | | | (14,611,823 | ) | | | (185,782,787 | ) | | | (7,431,515 | ) | | | (85,011,943 | ) | |
(a) Class I and Class W shares are for the period from September 27, 2010 (commencement of operations) to February 28, 2011.
(b) Includes conversions of Class B shares to Class A shares, if any.
The Accompanying Notes to Financial Statements are an integral part of this statement.
14
Financial Highlights – Columbia Large Cap Core Fund
The following tables are intended to help you understand the Fund's financial performance. Certain information reflects financial results for a single share of a class held for the periods shown. Per share net investment income (loss) amounts are calculated based on average shares outstanding during the period. Total returns assume reinvestment of all dividends and distributions. Total returns do not reflect payments of sales charges, if any, and are not annualized for periods of less than one year.
| | | Year ended
Feb. 29, | | Year ended Feb. 28, | | Year ended
Feb. 29, | | Year ended
March 31, | |
| | | 2012 | | 2011 | | 2010 | | 2009 | | 2008(a)(b)(c) | | 2007(a) | |
| Class A | |
| Per share data | |
| Net asset value, beginning of period | | $ | 13.73 | | | $ | 11.48 | | | $ | 7.95 | | | $ | 13.66 | | | $ | 14.86 | | | $ | 13.35 | | |
| Income from investment operations: | |
| Net investment income | | | 0.10 | | | | 0.05 | | | | 0.08 | | | | 0.13 | | | | 0.11 | | | | 0.14 | | |
| Net realized and unrealized gain (loss) | | | 0.36 | | | | 2.26 | | | | 3.57 | | | | (5.49 | ) | | | (0.41 | ) | | | 1.46 | | |
| Total from investment operations | | | 0.46 | | | | 2.31 | | | | 3.65 | | | | (5.36 | ) | | | (0.30 | ) | | | 1.60 | | |
| Less distributions to shareholders from: | |
| Net investment income | | | (0.10 | ) | | | (0.06 | ) | | | (0.12 | ) | | | (0.10 | ) | | | (0.14 | ) | | | (0.09 | ) | |
| Net realized gains | | | — | | | | — | | | | — | | | | (0.25 | ) | | | (0.76 | ) | | | — | | |
| Total distributions to shareholders | | | (0.10 | ) | | | (0.06 | ) | | | (0.12 | ) | | | (0.35 | ) | | | (0.90 | ) | | | (0.09 | ) | |
| Proceeds from regulatory settlement | | | 0.00 | (d) | | | — | | | | 0.00 | (d) | | | — | | | | — | | | | — | | |
| Net asset value, end of period | | $ | 14.09 | | | $ | 13.73 | | | $ | 11.48 | | | $ | 7.95 | | | $ | 13.66 | | | $ | 14.86 | | |
| Total return | | | 3.45 | %(e) | | | 20.16 | % | | | 45.99 | % | | | (40.12 | %) | | | (2.69 | %) | | | 12.00 | % | |
| Ratios to average net assets(f) | |
Expenses prior to fees waived or expenses reimbursed
(including interest expense) | | | 1.21 | %(g) | | | 1.20 | %(g) | | | 1.18 | %(g) | | | 1.15 | %(g) | | | 1.07 | %(g)(h) | | | 1.05 | %(g) | |
Net expenses after fees waived or expenses reimbursed
(including interest expense)(i) | | | 1.16 | %(g)(j) | | | 1.20 | %(g)(j) | | | 1.18 | %(g)(j) | | | 1.15 | %(g)(j) | | | 1.07 | %(g)(h)(j) | | | 1.05 | %(g)(j) | |
Expenses prior to fees waived or expenses reimbursed
(excluding interest expense) | | | 1.21 | % | | | 1.20 | % | | | 1.18 | % | | | 1.15 | % | | | 1.07 | %(h) | | | 1.05 | % | |
Net expenses after fees waived or expenses reimbursed
(excluding interest expense)(i) | | | 1.16 | %(j) | | | 1.20 | %(j) | | | 1.18 | %(j) | | | 1.15 | %(j) | | | 1.07 | %(h)(j) | | | 1.05 | %(j) | |
| Net investment income | | | 0.77 | %(j) | | | 0.38 | %(j) | | | 0.78 | %(j) | | | 1.10 | %(j) | | | 0.81 | %(h)(j) | | | 0.98 | %(j) | |
| Supplemental data | |
| Net assets, end of period (in thousands) | | $ | 119,434 | | | $ | 130,039 | | | $ | 131,652 | | | $ | 95,714 | | | $ | 172,569 | | | $ | 194,203 | | |
| Portfolio turnover | | | 197 | % | | | 171 | % | | | 165 | % | | | 156 | % | | | 0.00 | %(k)(l) | | | — | | |
| Portfolio turnover for Columbia Large Cap Core Master Portfolio | | | — | | | | — | | | | — | | | | — | | | | 98 | % | | | 148 | % | |
Notes to Financial Highlights
(a) The per share amounts and percentages reflect income and expenses assuming inclusion of the Fund's proportionate share of the income and expenses of Columbia Large Cap Core Master Portfolio.
(b) For the period from April 1, 2007 to February 29, 2008. During the period, the Fund's fiscal year end was changed from March 31 to February 29.
(c) Effective February 28, 2008, the Fund converted to a stand-alone fund. Prior to February 28, 2008, the Fund operated in a master-feeder structure.
(d) Rounds to less than $0.01.
(e) During the year ended February 29, 2012, the Fund received proceeds from a regulatory settlement. Had the Fund not received these proceeds, the total return would have been lower by 0.01%.
(f) In addition to the fees and expenses which the Fund bears directly, the Fund indirectly bears a pro rata share of the fees and expenses of the acquired funds in which it invests. Such indirect expenses are not included in the reported expense ratios.
(g) Includes interest expense which rounds to less than 0.01%.
(h) Annualized.
(i) The Investment Manager and certain of its affiliates agreed to waive/reimburse certain fees and expenses, if applicable.
(j) The benefits derived from expense reductions had an impact of less than 0.01%.
(k) Rounds to less than 0.01%
(l) Amount represents results after the Fund's conversion to a stand-alone structure on February 28, 2008.
The Accompanying Notes to Financial Statements are an integral part of this statement.
15
Financial Highlights (continued) – Columbia Large Cap Core Fund
| | | Year ended
Feb. 29, | | Year ended Feb. 28, | | Year ended
Feb. 29, | | Year ended
March 31, | |
| | | 2012 | | 2011 | | 2010 | | 2009 | | 2008(a)(b)(c) | | 2007(a) | |
| Class B | |
| Per share data | |
| Net asset value, beginning of period | | $ | 13.25 | | | $ | 11.11 | | | $ | 7.71 | | | $ | 13.23 | | | $ | 14.39 | | | $ | 12.95 | | |
| Income from investment operations: | |
| Net investment income (loss) | | | (0.00 | )(d) | | | (0.04 | ) | | | 0.00 | (d) | | | 0.03 | | | | 0.00 | (d) | | | 0.03 | | |
| Net realized and unrealized gain (loss) | | | 0.36 | | | | 2.18 | | | | 3.44 | | | | (5.28 | ) | | | (0.40 | ) | | | 1.41 | | |
| Total from investment operations | | | 0.36 | | | | 2.14 | | | | 3.44 | | | | (5.25 | ) | | | (0.40 | ) | | | 1.44 | | |
| Less distributions to shareholders from: | |
| Net investment income | | | (0.02 | ) | | | — | | | | (0.04 | ) | | | (0.02 | ) | | | (0.00 | )(d) | | | — | | |
| Net realized gains | | | — | | | | — | | | | — | | | | (0.25 | ) | | | (0.76 | ) | | | — | | |
| Total distributions to shareholders | | | (0.02 | ) | | | — | | | | (0.04 | ) | | | (0.27 | ) | | | (0.76 | ) | | | — | | |
| Proceeds from regulatory settlement | | | 0.00 | (d) | | | — | | | | 0.00 | (d) | | | — | | | | — | | | | — | | |
| Net asset value, end of period | | $ | 13.59 | | | $ | 13.25 | | | $ | 11.11 | | | $ | 7.71 | | | $ | 13.23 | | | $ | 14.39 | | |
| Total return | | | 2.72 | %(e) | | | 19.26 | % | | | 44.74 | % | | | (40.51 | %) | | | (3.34 | %) | | | 11.12 | % | |
| Ratios to average net assets(f) | |
Expenses prior to fees waived or expenses reimbursed
(including interest expense) | | | 1.96 | %(g) | | | 1.95 | %(g) | | | 1.93 | %(g) | | | 1.90 | %(g) | | | 1.82 | %(g)(h) | | | 1.80 | %(g) | |
Net expenses after fees waived or expenses reimbursed
(including interest expense)(i) | | | 1.91 | %(g)(j) | | | 1.95 | %(g)(j) | | | 1.93 | %(g)(j) | | | 1.90 | %(g)(j) | | | 1.82 | %(g)(h)(j) | | | 1.80 | %(g)(j) | |
Expenses prior to fees waived or expenses reimbursed
(excluding interest expense) | | | 1.96 | % | | | 1.95 | % | | | 1.93 | % | | | 1.90 | % | | | 1.82 | %(h) | | | 1.80 | % | |
Net expenses after fees waived or expenses reimbursed
(excluding interest expense)(i) | | | 1.91 | %(j) | | | 1.95 | %(j) | | | 1.93 | %(j) | | | 1.90 | %(j) | | | 1.82 | %(h)(j) | | | 1.80 | %(j) | |
| Net investment income (loss) | | | (0.04 | %)(j) | | | (0.36 | %)(j) | | | 0.04 | %(j) | | | 0.28 | %(j) | | | 0.03 | %(h)(j) | | | 0.21 | %(j) | |
| Supplemental data | |
| Net assets, end of period (in thousands) | | $ | 813 | | | $ | 1,653 | | | $ | 2,696 | | | $ | 3,300 | | | $ | 13,247 | | | $ | 25,523 | | |
| Portfolio turnover | | | 197 | % | | | 171 | % | | | 165 | % | | | 156 | % | | | 0.00 | %(k)(l) | | | — | | |
| Portfolio turnover for Columbia Large Cap Core Master Portfolio | | | — | | | | — | | | | — | | | | — | | | | 98 | % | | | 148 | % | |
Notes to Financial Highlights
(a) The per share amounts and percentages reflect income and expenses assuming inclusion of the Fund's proportionate share of the income and expenses of Columbia Large Cap Core Master Portfolio.
(b) For the period from April 1, 2007 to February 29, 2008. During the period, the Fund's fiscal year end was changed from March 31 to February 29.
(c) Effective February 28, 2008, the Fund converted to a stand-alone fund. Prior to February 28, 2008, the Fund operated in a master-feeder structure.
(d) Rounds to less than $0.01.
(e) During the year ended February 29, 2012, the Fund received proceeds from a regulatory settlement. Had the Fund not received these proceeds, the total return would have been lower by 0.01%.
(f) In addition to the fees and expenses which the Fund bears directly, the Fund indirectly bears a pro rata share of the fees and expenses of the acquired funds in which it invests. Such indirect expenses are not included in the reported expense ratios.
(g) Includes interest expense which rounds to less than 0.01%.
(h) Annualized.
(i) The Investment Manager and certain of its affiliates agreed to waive/reimburse certain fees and expenses, if applicable.
(j) The benefits derived from expense reductions had an impact of less than 0.01%.
(k) Rounds to less than 0.01%.
(l) Amount represents results after the Fund's conversion to a stand-alone structure on February 28, 2008.
The Accompanying Notes to Financial Statements are an integral part of this statement.
16
Financial Highlights (continued) – Columbia Large Cap Core Fund
| | | Year ended
Feb. 29, | | Year ended Feb. 28, | | Year ended
Feb. 29, | | Year ended
March 31, | |
| | | 2012 | | 2011 | | 2010 | | 2009 | | 2008(a)(b)(c) | | 2007(a) | |
| Class C | |
| Per share data | |
| Net asset value, beginning of period | | $ | 13.25 | | | $ | 11.11 | | | $ | 7.70 | | | $ | 13.23 | | | $ | 14.39 | | | $ | 12.94 | | |
| Income from investment operations: | |
| Net investment income (loss) | | | 0.00 | (d) | | | (0.04 | ) | | | 0.00 | (d) | | | 0.04 | | | | 0.01 | | | | 0.03 | | |
| Net realized and unrealized gain (loss) | | | 0.35 | | | | 2.18 | | | | 3.45 | | | | (5.30 | ) | | | (0.41 | ) | | | 1.42 | | |
| Total from investment operations | | | 0.35 | | | | 2.14 | | | | 3.45 | | | | (5.26 | ) | | | (0.40 | ) | | | 1.45 | | |
| Less distributions to shareholders from: | |
| Net investment income | | | (0.02 | ) | | | — | | | | (0.04 | ) | | | (0.02 | ) | | | (0.00 | )(d) | | | — | | |
| Net realized gains | | | — | | | | — | | | | — | | | | (0.25 | ) | | | (0.76 | ) | | | — | | |
| Total distributions to shareholders | | | (0.02 | ) | | | — | | | | (0.04 | ) | | | (0.27 | ) | | | (0.76 | ) | | | — | | |
| Proceeds from regulatory settlement | | | 0.00 | (d) | | | — | | | | 0.00 | (d) | | | — | | | | — | | | | — | | |
| Net asset value, end of period | | $ | 13.58 | | | $ | 13.25 | | | $ | 11.11 | | | $ | 7.70 | | | $ | 13.23 | | | $ | 14.39 | | |
| Total return | | | 2.64 | %(e) | | | 19.26 | % | | | 44.93 | % | | | (40.58 | %) | | | (3.34 | %) | | | 11.21 | % | |
| Ratios to average net assets(f) | |
Expenses prior to fees waived or expenses reimbursed
(including interest expense) | | | 1.96 | %(g) | | | 1.95 | %(g) | | | 1.93 | %(g) | | | 1.90 | %(g) | | | 1.82 | %(g)(h) | | | 1.80 | %(g) | |
Net expenses after fees waived or expenses reimbursed
(including interest expense)(i) | | | 1.91 | %(g)(j) | | | 1.95 | %(g)(j) | | | 1.93 | %(g)(j) | | | 1.90 | %(g)(j) | | | 1.82 | %(g)(h)(j) | | | 1.80 | %(g)(j) | |
Expenses prior to fees waived or expenses reimbursed
(excluding interest expense) | | | 1.96 | % | | | 1.95 | % | | | 1.93 | % | | | 1.90 | % | | | 1.82 | %(h) | | | 1.80 | % | |
Net expenses after fees waived or expenses reimbursed
(excluding interest expense)(i) | | | 1.91 | %(j) | | | 1.95 | %(j) | | | 1.93 | %(j) | | | 1.90 | %(j) | | | 1.82 | %(h)(j) | | | 1.80 | %(j) | |
| Net investment income (loss) | | | 0.02 | %(j) | | | (0.36 | %)(j) | | | 0.03 | %(j) | | | 0.39 | %(j) | | | 0.04 | %(h)(j) | | | 0.21 | %(j) | |
| Supplemental data | |
| Net assets, end of period (in thousands) | | $ | 2,649 | | | $ | 2,612 | | | $ | 2,449 | | | $ | 1,559 | | | $ | 2,168 | | | $ | 11,413 | | |
| Portfolio turnover | | | 197 | % | | | 171 | % | | | 165 | % | | | 156 | % | | | 0.00 | %(k)(l) | | | — | | |
| Portfolio turnover for Columbia Large Cap Core Master Portfolio | | | — | | | | — | | | | — | | | | — | | | | 98 | % | | | 148 | % | |
Notes to Financial Highlights
(a) The per share amounts and percentages reflect income and expenses assuming inclusion of the Fund's proportionate share of the income and expenses of Columbia Large Cap Core Master Portfolio.
(b) For the period from April 1, 2007 to February 29, 2008. During the period, the Fund's fiscal year end was changed from March 31 to February 29.
(c) Effective February 28, 2008, the Fund converted to a stand-alone fund. Prior to February 28, 2008, the Fund operated in a master-feeder structure.
(d) Rounds to less than $0.01.
(e) During the year ended February 29, 2012, the Fund received proceeds from a regulatory settlement. Had the Fund not received these proceeds, the total return would have been lower by 0.01%.
(f) In addition to the fees and expenses which the Fund bears directly, the Fund indirectly bears a pro rata share of the fees and expenses of the acquired funds in which it invests. Such indirect expenses are not included in the reported expense ratios.
(g) Includes interest expense which rounds to less than 0.01%.
(h) Annualized.
(i) The Investment Manager and certain of its affiliates agreed to waive/reimburse certain fees and expenses, if applicable.
(j) The benefits derived from expense reductions had an impact of less than 0.01%.
(k) Rounds to less than 0.01%.
(l) Amount represents results after the Fund's conversion to a stand-alone structure on February 28, 2008.
The Accompanying Notes to Financial Statements are an integral part of this statement.
17
Financial Highlights (continued) – Columbia Large Cap Core Fund
| | | Year ended
Feb. 29,
2012 | | Year ended
Feb. 28,
2011(a) | |
| Class I | |
| Per share data | |
| Net asset value, beginning of period | | $ | 13.69 | | | $ | 11.78 | | |
| Income from investment operations: | |
| Net investment income | | | 0.15 | | | | 0.04 | | |
| Net realized and unrealized gain | | | 0.36 | | | | 1.96 | | |
| Total from investment operations | | | 0.51 | | | | 2.00 | | |
| Less distributions to shareholders from: | |
| Net investment income | | | (0.16 | ) | | | (0.09 | ) | |
| Total distributions to shareholders | | | (0.16 | ) | | | (0.09 | ) | |
| Proceeds from regulatory settlement | | | 0.00 | (b) | | | — | | |
| Net asset value, end of period | | $ | 14.04 | | | $ | 13.69 | | |
| Total return | | | 3.82 | %(c) | | | 16.99 | % | |
| Ratios to average net assets(d) | |
| Expenses prior to fees waived or expenses reimbursed (including interest expense) | | | 0.76 | %(e) | | | 0.79 | %(e)(f) | |
| Net expenses after fees waived or expenses reimbursed (including interest expense)(g) | | | 0.76 | %(e)(h) | | | 0.79 | %(e)(f)(h) | |
| Expenses prior to fees waived or expenses reimbursed (excluding interest expense) | | | 0.76 | % | | | 0.79 | %(f) | |
| Net expenses after fees waived or expenses reimbursed (excluding interest expense)(g) | | | 0.76 | %(h) | | | 0.79 | %(f)(h) | |
| Net investment income | | | 1.18 | %(h) | | | 0.64 | %(f)(h) | |
| Supplemental data | |
| Net assets, end of period (in thousands) | | $ | 122,828 | | | $ | 135,677 | | |
| Portfolio turnover | | | 197 | % | | | 171 | % | |
Notes to Financial Highlights
(a) For the period from September 27, 2010 (commencement of operations) to February 28, 2011.
(b) Rounds to less than $0.01.
(c) During the year ended February 29, 2012, the Fund received proceeds from a regulatory settlement. Had the Fund not received these proceeds, the total return would have been lower by 0.01%.
(d) In addition to the fees and expenses which the Fund bears directly, the Fund indirectly bears a pro rata share of the fees and expenses of the acquired funds in which it invests. Such indirect expenses are not included in the reported expense ratios.
(e) Includes interest expense which rounds to less than 0.01%.
(f) Annualized.
(g) The Investment Manager and certain of its affiliates agreed to waive/reimburse certain fees and expenses, if applicable.
(h) The benefits derived from expense reductions had an impact of less than 0.01%.
The Accompanying Notes to Financial Statements are an integral part of this statement.
18
Financial Highlights (continued) – Columbia Large Cap Core Fund
| | | Year ended
Feb. 29,
2012 | | Year ended
Feb. 28,
2011(a) | |
| Class W | |
| Per share data | |
| Net asset value, beginning of period | | $ | 13.73 | | | $ | 11.80 | | |
| Income from investment operations: | |
| Net investment income | | | 0.11 | | | | 0.03 | | |
| Net realized and unrealized gain | | | 0.36 | | | | 1.95 | | |
| Total from investment operations | | | 0.47 | | | | 1.98 | | |
| Less distributions to shareholders from: | |
| Net investment income | | | (0.11 | ) | | | (0.05 | ) | |
| Total distributions to shareholders | | | (0.11 | ) | | | (0.05 | ) | |
| Proceeds from regulatory settlement | | | 0.00 | (b) | | | — | | |
| Net asset value, end of period | | $ | 14.09 | | | $ | 13.73 | | |
| Total return | | | 3.48 | %(c) | | | 16.77 | % | |
| Ratios to average net assets(d) | |
| Expenses prior to fees waived or expenses reimbursed (including interest expense) | | | 1.18 | %(e) | | | 1.16 | %(e)(f) | |
| Net expenses after fees waived or expenses reimbursed (including interest expense)(g) | | | 1.14 | %(e)(g) | | | 1.16 | %(e)(f)(h) | |
| Expenses prior to fees waived or expenses reimbursed (excluding interest expense) | | | 1.18 | % | | | 1.16 | %(f) | |
| Net expenses after fees waived or expenses reimbursed (excluding interest expense)(g) | | | 1.14 | %(h) | | | 1.16 | %(f)(h) | |
| Net investment income | | | 0.81 | %(h) | | | 0.50 | %(f)(h) | |
| Supplemental data | |
| Net assets, end of period (in thousands) | | $ | 3 | | | $ | 3 | | |
| Portfolio turnover | | | 197 | % | | | 171 | % | |
Notes to Financial Highlights
(a) For the period from September 27, 2010 (commencement of operations) to February 28, 2011.
(b) Rounds to less than $0.01.
(c) During the year ended February 29, 2012, the Fund received proceeds from a regulatory settlement. Had the Fund not received these proceeds, the total return would have been lower by 0.01%.
(d) In addition to the fees and expenses which the Fund bears directly, the Fund indirectly bears a pro rata share of the fees and expenses of the acquired funds in which it invests. Such indirect expenses are not included in the reported expense ratios.
(e) Includes interest expense which rounds to less than 0.01%.
(f) Annualized.
(g) The Investment Manager and certain of its affiliates agreed to waive/reimburse certain fees and expenses, if applicable.
(h) The benefits derived from expense reductions had an impact of less than 0.01%.
The Accompanying Notes to Financial Statements are an integral part of this statement.
19
Financial Highlights (continued) – Columbia Large Cap Core Fund
| | | Year ended
Feb. 29, | | Year ended Feb. 28, | | Year ended
Feb. 29, | | Year ended
March 31, | |
| | | 2012 | | 2011 | | 2010 | | 2009 | | 2008(a)(b)(c) | | 2007(a) | |
| Class Z | |
| Per share data | |
| Net asset value, beginning of period | | $ | 13.69 | | | $ | 11.45 | | | $ | 7.93 | | | $ | 13.66 | | | $ | 14.88 | | | $ | 13.39 | | |
| Income from investment operations: | |
| Net investment income | | | 0.13 | | | | 0.08 | | | | 0.11 | | | | 0.16 | | | | 0.15 | | | | 0.17 | | |
| Net realized and unrealized gain (loss) | | | 0.36 | | | | 2.25 | | | | 3.55 | | | | (5.48 | ) | | | (0.41 | ) | | | 1.47 | | |
| Total from investment operations | | | 0.49 | | | | 2.33 | | | | 3.66 | | | | (5.32 | ) | | | (0.26 | ) | | | 1.64 | | |
| Less distributions to shareholders from: | |
| Net investment income | | | (0.14 | ) | | | (0.09 | ) | | | (0.14 | ) | | | (0.16 | ) | | | (0.20 | ) | | | (0.15 | ) | |
| Net realized gains | | | — | | | | — | | | | — | | | | (0.25 | ) | | | (0.76 | ) | | | — | | |
| Total distributions to shareholders | | | (0.14 | ) | | | (0.09 | ) | | | (0.14 | ) | | | (0.41 | ) | | | (0.96 | ) | | | (0.15 | ) | |
| Proceeds from regulatory settlement | | | 0.00 | (d) | | | — | | | | 0.00 | (d) | | | — | | | | — | | | | — | | |
| Net asset value, end of period | | $ | 14.04 | | | $ | 13.69 | | | $ | 11.45 | | | $ | 7.93 | | | $ | 13.66 | | | $ | 14.88 | | |
| Total return | | | 3.65 | %(e) | | | 20.40 | % | | | 46.30 | % | | | (39.95 | %) | | | (2.43 | %) | | | 12.28 | % | |
| Ratios to average net assets(f) | |
Expenses prior to fees waived or expenses reimbursed
(including interest expense) | | | 0.95 | %(g) | | | 0.95 | %(g) | | | 0.93 | %(g) | | | 0.90 | %(g) | | | 0.82 | %(g)(h) | | | 0.80 | %(g) | |
Net expenses after fees waived or expenses reimbursed
(including interest expense)(i) | | | 0.91 | %(g)(j) | | | 0.95 | %(g)(j) | | | 0.93 | %(g)(j) | | | 0.90 | %(g)(j) | | | 0.82 | %(g)(h)(j) | | | 0.80 | %(g)(j) | |
Expenses prior to fees waived or expenses reimbursed
(excluding interest expense) | | | 0.95 | % | | | 0.95 | % | | | 0.93 | % | | | 0.90 | % | | | 0.82 | %(h) | | | 0.80 | % | |
Net expenses after fees waived or expenses reimbursed
(excluding interest expense)(i) | | | 0.91 | %(j) | | | 0.95 | %(j) | | | 0.93 | %(j) | | | 0.90 | %(j) | | | 0.82 | %(h)(j) | | | 0.80 | %(j) | |
| Net investment income | | | 0.99 | %(j) | | | 0.64 | %(j) | | | 1.03 | %(j) | | | 1.35 | %(j) | | | 1.06 | %(h)(j) | | | 1.23 | %(j) | |
| Supplemental data | |
| Net assets, end of period (in thousands) | | $ | 825,292 | | | $ | 974,320 | | | $ | 988,640 | | | $ | 712,304 | | | $ | 1,285,598 | | | $ | 1,466,653 | | |
| Portfolio turnover | | | 197 | % | | | 171 | % | | | 165 | % | | | 156 | % | | | 0.00 | %(k)(l) | | | — | | |
Portfolio turnover for Columbia Large Cap Core
Master Portfolio | | | — | | | | — | | | | — | | | | — | | | | 98 | % | | | 148 | % | |
Notes to Financial Highlights
(a) The per share amounts and percentages reflect income and expenses assuming inclusion of the Fund's proportionate share of the income and expenses of Columbia Large Cap Core Master Portfolio.
(b) For the period from April 1, 2007 to February 29, 2008. During the period, the Fund's fiscal year end was changed from March 31 to February 29.
(c) Effective February 28, 2008, the Fund converted to a stand-alone fund. Prior to February 28, 2008, the Fund operated in a master-feeder structure.
(d) Rounds to less than $0.01.
(e) During the year ended February 29, 2012, the Fund received proceeds from a regulatory settlement. Had the Fund not received these proceeds, the total return would have been lower by 0.01%.
(f) In addition to the fees and expenses which the Fund bears directly, the Fund indirectly bears a pro rata share of the fees and expenses of the acquired funds in which it invests. Such indirect expenses are not included in the reported expense ratios.
(g) Includes interest expense which rounds to less than 0.01%.
(h) Annualized.
(i) The Investment Manager and certain of its affiliates agreed to waive/reimburse certain fees and expenses, if applicable.
(j) The benefits derived from expense reductions had an impact of less than 0.01%.
(k) Rounds to less than 0.01%.
(l) Amount represents results after the Fund's conversion to a stand-alone structure on February 28, 2008
The Accompanying Notes to Financial Statements are an integral part of this statement.
20
Notes to Financial Statements – Columbia Large Cap Core Fund
February 29, 2012
Note 1. Organization
Columbia Large Cap Core Fund (the Fund), a series of Columbia Funds Series Trust (the Trust), is a diversified fund. The Trust is registered under the Investment Company Act of 1940, as amended (the 1940 Act), as an open-end management investment company organized as a Delaware statutory trust.
Fund Shares
The Trust may issue an unlimited number of shares (without par value). The Fund offers Class A, Class B, Class C, Class I, Class W and Class Z shares. All share classes have identical voting, dividend and liquidation rights. Each share class has its own expense structure and sales charges, as applicable.
Class A shares are subject to a maximum front-end sales charge of 5.75% based on the initial investment amount. Class A shares purchased without an initial sales charge in accounts aggregating $1 million to $50 million at the time of purchase are subject to a contingent deferred sales charge (CDSC) if the shares are sold within 18 months of purchase, charged as follows: 1.00% CDSC if redeemed within 12 months of purchase, and 0.50% CDSC if redeemed more than 12, but less than 18, months after purchase.
Class B shares may be subject to a maximum CDSC of 5.00% based upon the holding period after purchase. Class B shares will generally convert to Class A shares eight years after purchase. The Fund no longer accepts investments by new or existing investors in the Fund's Class B shares, except in connection with the reinvestment of any dividend and/or capital gain distributions in Class B shares of the Fund and exchanges by existing Class B shareholders of certain other funds within the Columbia Family of Funds.
Class C shares are subject to a 1.00% CDSC on shares redeemed within one year of purchase.
Class I shares are not subject to sales charges and are only available to the Columbia Family of Funds.
Class W shares are not subject to sales charges and are only available to investors purchasing through authorized investment programs managed by investment professionals, including discretionary managed account programs.
Class Z shares are not subject to sales charges, and are only available to certain investors, as described in the Fund's prospectus.
Note 2. Summary of Significant Accounting Policies
Use of Estimates
The preparation of financial statements in accordance with U.S. generally accepted accounting principles (GAAP) requires management to make certain estimates and assumptions that affect the reported amounts of assets and liabilities, the disclosure of contingent assets and liabilities at the date of the financial statements and the reported amounts of revenue and expenses during the reporting period. Actual results could differ from those estimates.
The following is a summary of significant accounting policies consistently followed by the Fund in the preparation of its financial statements.
Security Valuation
All equity securities are valued at the close of business of the New York Stock Exchange (NYSE). Equity securities are valued at the last quoted sales price on the principal exchange or market on which they trade, except for securities traded on the NASDAQ Stock Market, which are valued at the NASDAQ official close price. Unlisted securities or listed securities for which there were no sales during the day are valued at the mean of the latest quoted bid and asked prices on such exchanges or markets.
Foreign securities are valued based on quotations from the principal market in which such securities are normally traded. If any foreign share prices are not readily available as a result of limited share activity the securities are valued at the mean of the latest quoted bid and asked prices on such exchanges or markets. Foreign currency exchange rates are generally determined at 4:00 p.m. Eastern (U.S.) time. However, many securities markets and exchanges outside the U.S. close prior to the close of the NYSE; therefore, the closing prices for securities in such markets or on such exchanges may not fully reflect events that occur after such close but before the close of the NYSE. In those situations, foreign securities will be fair valued pursuant to the policy adopted by the Board of Trustees (the Board), including utilizing a third party pricing service to determine these fair values. The third party pricing
21
Columbia Large Cap Core Fund, February 29, 2012
service takes into account multiple factors, including, but not limited to, movements in the U.S. securities markets, certain depositary receipts, futures contracts and foreign exchange rates that have occurred subsequent to the close of the foreign exchange, to determine a good faith estimate that reasonably reflects the current market conditions as of the close of the NYSE. The fair value of a security is likely to be different from the quoted or published price, if available.
Investments in other open-end investment companies, including money market funds, are valued at net asset value.
Short-term securities purchased within 60 days to maturity are valued at amortized cost, which approximates market value. The value of short-term securities originally purchased with maturities greater than 60 days is determined based on an amortized value to par upon reaching 60 days to maturity. Short-term securities maturing in more than 60 days from the valuation date are valued at the market price or approximate market value based on current interest rates.
Option contracts are valued at the mean of the latest quoted bid and asked prices on their primary exchanges. Option contracts, including over-the-counter (OTC) option contracts, with no readily available market value are valued using quotations obtained from independent brokers as of the close of the NYSE.
Investments for which market quotations are not readily available, or that have quotations which management believes are not reliable, are valued at fair value as determined in good faith under consistently applied procedures established by and under the general supervision of the Board. If a security or class of securities (such as foreign securities) is valued at fair value, such value is likely to be different from the last quoted market price for the security. The determination of fair value often requires significant judgment. To determine fair value, management may use assumptions including but not limited to future cash flows and estimated risk premiums. Multiple inputs from various sources may be used to determine value.
Foreign Currency Transactions and Translation
The values of all assets and liabilities denominated in foreign currencies are translated into U.S. dollars at that day's exchange rates. Net realized and unrealized gains (losses) on foreign currency transactions and translations include gains (losses) arising from the fluctuation in exchange rates between trade and settlement dates on securities transactions, gains (losses) arising from the disposition of foreign currency and currency gains (losses) between the accrual and payment dates on dividends, interest income and foreign withholding taxes.
For financial statement purposes, the Fund does not distinguish that portion of gains (losses) on investments which is due to changes in foreign exchange rates from that which is due to changes in market prices of the investments. Such fluctuations are included with the net realized and unrealized gains (losses) on investments in the Statement of Operations.
Derivative Instruments
The Fund invests in certain derivative instruments as detailed below to meet its investment objectives. Derivatives are instruments whose values depend on, or are derived from, in whole or in part, the value of one or more other assets, such as securities, currencies, commodities or indices. Derivative instruments may be used to maintain cash reserves while maintaining exposure to certain other assets, to offset anticipated declines in values of investments, to facilitate trading, to reduce transaction costs and to pursue higher investment returns. The Fund may also use derivative instruments to mitigate certain investment risks, such as foreign currency exchange rate risk, interest rate risk and credit risk. Derivatives may involve various risks, including the potential inability of the counterparty to fulfill its obligation under the terms of the contract, the potential for an illiquid secondary market and the potential for market movements which may expose the Fund to gains or losses in excess of the amount shown in the Statement of Assets and Liabilities.
The Fund and any counterparty are required to maintain an agreement that requires the Fund and that counterparty to monitor (on a daily basis) the net fair value of all derivatives entered into pursuant to the agreement between the Fund and such counterparty. If the net fair value of such derivatives between the Fund and that counterparty exceeds a certain threshold (as defined in the agreement), the Fund or the counterparty (as the case may be) is required to post cash and/or securities as collateral. Fair values of derivatives presented in the financial statements are not netted with the
22
Columbia Large Cap Core Fund, February 29, 2012
fair value of other derivatives or with any collateral amounts posted by the Fund or any counterparty.
Options
Options are contracts which entitle the holder to purchase or sell securities or other identified assets at a specified price, or in the case of index option contracts, to receive or pay the difference between the index value and the strike price of the index option contract. The Fund purchased and wrote option contracts to generate yield by writing options with strike prices commensurate with values at which we are comfortable selling the underlying stock. Completion of transactions for option contracts traded in the OTC market depends upon the performance of the other party. Cash collateral may be collected or posted by the Fund to secure certain OTC option contract trades. Cash collateral held or posted by the Fund for such option contract trades must be returned to the counterparty or the Fund upon closure, exercise or expiration of the contract.
Option contracts purchased are recorded as investments and options contracts written are recorded as liabilities of the Fund. The Fund will realize a gain or loss when the option contract expires or is exercised. When option contracts on debt securities or futures are exercised, the Fund will realize a gain or loss. When other option contracts are exercised, the proceeds on sales for a written call or purchased put option contract, or the purchase cost for a written put or purchased call option contract, is adjusted by the amount of premium received or paid.
The risk in buying an option contract is that the Fund pays a premium whether or not the option contract is exercised. The Fund also has the additional risk of being unable to enter into a closing transaction if a liquid secondary market does not exist. The risk in writing a call option contract is that the Fund gives up the opportunity for profit if the market price of the security increases. The risk in writing a put option contract is that the Fund may incur a loss if the market price of the security decreases and the option contract is exercised. The Fund's maximum payout in the case of written put option contracts represents the maximum potential amount of future payments (undiscounted) that the Fund could be required to make under the contract. For OTC options contracts, the transaction is also subject to counterparty credit risk. The maximum payout amount may be offset by the subsequent sale, if any, of assets obtained upon the exercise of the put option contracts by holders of the option contracts or proceeds received upon entering into the contracts.
Contracts and premiums associated with options contracts written for the year ended February 29, 2012 are as follows:
| | | Calls | |
| | | Contracts | | Premiums | |
| Balance at February 28, 2011 | | | — | | | $ | — | | |
| Opened | | | 8,390 | | | | 390,063 | | |
| Exercised | | | (630 | ) | | | (50,518 | ) | |
| Expired | | | (7,760 | ) | | | (339,545 | ) | |
| Balance at February 29, 2012 | | | — | | | $ | — | | |
Effects of Derivative Transactions in the Financial Statements
The following tables are intended to provide additional information about the effect of derivatives on the financial statements of the Fund, including: the fair value of derivatives by risk category and the location of those fair values in the Statement of Assets and Liabilities; the impact of derivative transactions on the Fund's operations over the period including realized gains or losses and unrealized gains or losses. The derivative schedules following the Portfolio of Investments present additional information regarding derivative instruments outstanding at the end of the period, if any.
Fair Values of Derivative Instruments at
February 29, 2012
At February 29, 2012, the Fund had no outstanding derivatives.
Effect of Derivative Instruments in the Statement of
Operations for the Year Ended February 29, 2012
Amount of Realized Gain (Loss) on Derivatives
| Risk Exposure Category | | Options Contracts
Written and
Purchased | |
| Equity contracts | | $ | 339,545 | | |
23
Columbia Large Cap Core Fund, February 29, 2012
Change in Unrealized Appreciation (Depreciation) on Derivatives Recognized in Income
| Risk Exposure Category | | Options Contracts
Written and
Purchased | |
| Equity contracts | | $ | — | | |
Volume of Derivative Instruments for the Year Ended
February 29, 2012
| | | Contracts Opened | |
| Options Contracts | | | 8,390 | | |
Repurchase Agreements
The Fund may engage in repurchase agreement transactions with institutions that management has determined are creditworthy. The Fund, through the custodian, receives delivery of the underlying securities collateralizing a repurchase agreement. Management is responsible for determining that the collateral is at least equal, at all times, to the value of the repurchase obligation including interest. A repurchase agreement transaction involves certain risks in the event of default or insolvency of the counterparty. These risks include possible delays in or restrictions on a Fund's ability to dispose of the underlying securities and a possible decline in the value of the underlying securities during the period while the Fund seeks to assert its rights.
Security Transactions
Security transactions are accounted for on the trade date. Cost is determined and gains (losses) are based upon the specific identification method for both financial statement and federal income tax purposes.
Income Recognition
Corporate actions and dividend income are recorded net of any non-reclaimable tax withholdings, on the ex-dividend date or upon receipt of ex-dividend notification in the case of certain foreign securities.
Interest income is recorded on the accrual basis.
Awards from class action litigation are recorded as a reduction of cost basis if the Fund still owns the applicable securities on the payment date. If the Fund no longer owns the applicable securities, the proceeds are recorded as realized gains.
Expenses
General expenses of the Trust are allocated to the Fund and other funds of the Trust based upon relative net assets or other expense allocation methodologies determined by the nature of the expense. Expenses directly attributable to the Fund are charged to the Fund. Expenses directly attributable to a specific class of shares are charged to that share class.
Determination of Class Net Asset Value
All income, expenses (other than class-specific expenses, which are charged to that share class, as shown in the Statement of Operations) and realized and unrealized gains (losses) are allocated to each class of the Fund on a daily basis, based on the relative net assets of each class, for purposes of determining the net asset value of each class.
Federal Income Tax Status
The Fund intends to qualify each year as a regulated investment company under Subchapter M of the Internal Revenue Code, as amended, and will distribute substantially all of its taxable income (including net short-term capital gains), if any, for its tax year, and as such will not be subject to federal income taxes. In addition, the Fund intends to distribute in each calendar year substantially all of its net investment income, capital gains and certain other amounts, if any, such that the Fund should not be subject to federal excise tax. Therefore, no federal income or excise tax provision is recorded.
Distributions to Shareholders
Distributions from net investment income, if any, are declared and paid semi-annually. Net realized capital gains, if any, are distributed along with the income dividend. Income distributions and capital gain distributions are determined in accordance with federal income tax regulations which may differ from GAAP.
Guarantees and Indemnifications
Under the Trust's organizational documents and, in some cases, by contract, its officers and trustees are indemnified against certain liabilities arising out of the performance of their duties to the Trust or its funds. In addition, certain of the Fund's contracts with its service providers contain general indemnification clauses. The Fund's maximum exposure under these arrangements is unknown since the amount of any
24
Columbia Large Cap Core Fund, February 29, 2012
future claims that may be made against the Fund cannot be determined, and the Fund has no historical basis for predicting the likelihood of any such claims.
Recent Accounting Pronouncement
Fair Value Measurements and Disclosures
In May 2011, the Financial Accounting and Standards Board (FASB) issued ASU No. 2011-04 modifying Topic 820, Fair Value Measurements and Disclosures. At the same time, the International Accounting Standards Board (IASB) issued International Financial Reporting Standard 13, Fair Value Measurement. The objective of the FASB and IASB is convergence of their guidance on fair value measurements and disclosures.
Specifically, ASU No. 2011-04 requires reporting entities to disclose i) the amounts of any transfers between Level 1 and Level 2, and the reasons for the transfers, ii) for Level 3 fair value measurements, a) quantitative information about significant unobservable inputs used, b) a description of the valuation processes used by the reporting entity and c) a narrative description of the sensitivity of the fair value measurement to changes in unobservable inputs if a change in those inputs might result in a significantly higher or lower fair value measurement. The effective date of ASU No. 2011-04 is for interim and annual periods beginning after December 15, 2011. At this time, management is evaluating the implications of this guidance and the impact it will have on the financial statement amounts and footnote disclosures, if any.
Note 3. Fees and Compensation Paid to Affiliates
Investment Management Fees
Under an Investment Management Services Agreement, Columbia Management Investment Advisers, LLC (the Investment Manager), a wholly-owned subsidiary of Ameriprise Financial, Inc. (Ameriprise Financial), determines which securities will be purchased, held or sold. The management fee is an annual fee that is equal to a percentage of the Fund's average daily net assets that declines from 0.71% to 0.54% as the Fund's net assets increase. The effective management fee rate for the year ended February 29, 2012 was 0.68% of the Fund's average daily net assets.
Administration Fees
Under an Administrative Services Agreement, the Investment Manager serves as the Fund Administrator. The Fund pays the Fund Administrator an annual fee for administration and accounting services equal to a percentage of the Fund's average daily net assets that declines from 0.06% to 0.03% as the Fund's net assets increase. The effective administration fee rate for the year ended February 29, 2012 was 0.06% of the Fund's average daily net assets.
Pricing and Bookkeeping Fees
Prior to June 27, 2011, the Fund had entered into a Financial Reporting Services Agreement (the Financial Reporting Services Agreement) with State Street Bank and Trust Company (State Street) and the Investment Manager pursuant to which State Street provided financial reporting services to the Fund. The Fund also entered into an Accounting Services Agreement (collectively with the Financial Reporting Services Agreement, the State Street Agreements) with State Street and the Investment Manager pursuant to which State Street provided accounting services to the Fund. Under the State Street Agreements, the Fund paid State Street an annual fee of $38,000 paid monthly plus an additional monthly fee based on an annualized percentage rate of average daily net assets of the Fund for the month. The aggregate fee did not exceed $140,000 per year (exclusive of out-of-pocket expenses and charges). The Fund also reimbursed State Street for certain out-of-pocket expenses and charges. Effective June 27, 2011, these services are provided under the Administrative Services Agreement discussed above.
Other Fees
Effective June 1, 2011, other expenses are for, among other things, certain expenses of the Fund or the Board, including: Fund boardroom and office expense, employee compensation, employee health and retirement benefits, and certain other expenses. Payment of these Fund and Board expenses is facilitated by a company providing limited administrative services to the Fund and the Board. For the period June 1, 2011 through February 29, 2012, other expenses paid to this company were $4,466.
25
Columbia Large Cap Core Fund, February 29, 2012
Compensation of Board Members
Board members are compensated for their services to the Fund as disclosed in the Statement of Operations. Under a Deferred Compensation Plan (the Plan), the Board members who are not "interested persons" of the Fund, as defined under the 1940 Act, may elect to defer payment of up to 100% of their compensation. Deferred amounts are treated as though equivalent dollar amounts had been invested in shares of certain funds managed by the Investment Manager. The Fund's liability for these amounts is adjusted for market value changes and remains in the Fund until distributed in accordance with the Plan.
Compensation of Chief Compliance Officer
The Board has appointed a Chief Compliance Officer to the Fund in accordance with federal securities regulations. Effective April 1, 2011, the Fund's expenses associated with the Chief Compliance Officer are paid directly by the Investment Manager. Prior to April 1, 2011, the Fund, along with other affiliated funds, paid its pro-rata share of the expenses for the Chief Compliance Officer. Such fees did not exceed $15,000 per year.
Transfer Agent Fees
Under a Transfer and Dividend Disbursing Agent Agreement, Columbia Management Investment Services Corp. (the Transfer Agent), an affiliate of the Investment Manager and a wholly-owned subsidiary of Ameriprise Financial, is responsible for providing transfer agency services to the Fund. The Transfer Agent has contracted with Boston Financial Data Services (BFDS) to serve as sub-transfer agent.
The Transfer Agent receives monthly account-based service fees based on the number of open accounts and is reimbursed by the Fund for the fees and expenses the Transfer Agent pays to financial intermediaries that maintain omnibus accounts with the Fund that is a percentage of the average aggregate value of the Fund's shares maintained in each such omnibus account (other than omnibus accounts for which American Enterprise Investment Services Inc. is the broker of record or accounts where the beneficial shareholder is a customer of Ameriprise Financial Services, Inc., which are paid a per account fee). The Transfer Agent pays the fees of BFDS for services as sub-transfer agent and is not entitled to reimbursement for such fees from the Fund (with the exception of out-of-pocket fees).
The Transfer Agent also receives compensation from fees for various shareholder services and reimbursements for certain out-of-pocket expenses. Class I shares do not pay transfer agent fees.
For the year ended February 29, 2012, the Fund's effective transfer agent fee rates as a percentage of average daily net assets of each class were as follows:
| Class A | | | 0.19 | % | |
| Class B | | | 0.20 | | |
| Class C | | | 0.19 | | |
| Class W | | | 0.18 | | |
| Class Z | | | 0.19 | | |
An annual minimum account balance fee of $20 may apply to certain accounts with a value below the Fund's initial minimum investment requirements to reduce the impact of small accounts on transfer agent fees. These minimum account balance fees are recorded as part of expense reductions in the Statement of Operations. For the year ended February 29, 2012, these minimum account balance fees reduced total expenses by $7,382.
Distribution and Service Fees
The Fund has an agreement with Columbia Management Investment Distributors, Inc. (the Distributor), an affiliate of the Investment Manager and a wholly-owned subsidiary of Ameriprise Financial, for distribution and shareholder services. Pursuant to Rule 12b-1 under the 1940 Act, the Board has approved, and the Fund has adopted, distribution and shareholder service plans (the Plans) which set the distribution and service fees for the Fund. These fees are calculated daily and are intended to compensate the Distributor and/or eligible selling and/or servicing agents for selling shares of the Fund and providing services to investors.
The Plans require the payment of a monthly combined distribution and service fee to the Distributor at the maximum annual rate of 0.25% of the average daily net assets attributable to Class A shares of the Fund. The Plans also required the payment of a monthly service fee at the
26
Columbia Large Cap Core Fund, February 29, 2012
maximum annual rate of 0.25% of the average daily net assets attributable to Class B, Class C and Class W shares of the Fund and the payment of a monthly distribution fee at the maximum annual rate of 0.75% of the average daily net assets attributable to Class B and Class C shares and 0.25% of the average daily net assets attributable to Class W shares of the Fund.
The Fund may pay a distribution fee of up to 0.25% of the Fund's average daily net assets attributable to Class W shares and a service fee of up to 0.25% of the Fund's average daily net assets attributable to Class W shares, provided, however, that the aggregate fee shall not exceed 0.25% of the Fund's average daily net assets attributable to Class W shares.
Sales Charges
Sales charges, including front-end charges and CDSCs, received by the Distributor for distributing Fund shares were $24,212 for Class A, $1,097 for Class B and $324 for Class C shares for the year ended February 29, 2012.
Expenses Waived/Reimbursed by the Investment Manager and its Affiliates
The Investment Manager and certain of its affiliates have contractually agreed to waive fees and/or reimburse expenses (excluding certain fees and expenses described below), through June 30, 2012, unless sooner terminated at the sole discretion of the Board, so that the Fund's net operating expenses, after giving effect to fees waived/expenses reimbursed and any balance credits and/or overdraft charges from the Fund's custodian, do not exceed the following annual rates as a percentage of the class' average daily net assets:
| Class A | | | 1.16 | % | |
| Class B | | | 1.91 | | |
| Class C | | | 1.91 | | |
| Class I | | | 0.81 | | |
| Class W | | | 1.16 | | |
| Class Z | | | 0.91 | | |
Under the agreement, the following fees and expenses are excluded from the waiver/reimbursement commitment, and therefore will be paid by the Fund, if applicable: taxes (including foreign transaction taxes), expenses associated with investments in affiliated and non-affiliated pooled investment vehicles (including mutual funds and exchange traded funds), transaction costs and brokerage commissions, costs related to any securities lending program, dividend expenses associated with securities sold short, inverse floater program fees and expenses, transaction charges and interest on borrowed money, interest, extraordinary expenses and any other expenses the exclusion of which is specifically approved by the Board. This agreement may be modified or amended only with approval from all parties.
Note 4. Federal Tax Information
The timing and character of income and capital gain distributions are determined in accordance with income tax regulations, which may differ from GAAP because of temporary or permanent book to tax differences.
For the year ended February 29, 2012, these differences are primarily due to differing treatment for deferral/reversal of wash sale losses, Trustees' deferred compensation and post-October capital losses. To the extent these differences are permanent, reclassifications are made among the components of the Fund's net assets in the Statement of Assets and Liabilities. Temporary differences do not require reclassifications. In the Statement of Assets and Liabilities the following reclassifications were made:
| Undistributed net investment income | | $ | 53,946 | | |
| Accumulated net realized loss | | | — | | |
| Paid-in capital | | | (53,946 | ) | |
Net investment income and net realized gains (losses), as disclosed in the Statement of Operations, and net assets were not affected by this reclassification.
The tax character of distributions paid during the years indicated was as follows:
| Year ended | | February 29,
2012 | | February 28,
2011 | |
| Ordinary income | | $ | 11,226,331 | | | $ | 7,685,219 | | |
27
Columbia Large Cap Core Fund, February 29, 2012
Short-term capital gain distributions, if any, are considered ordinary income distributions for tax purposes.
At February 29, 2012, the components of distributable earnings on a tax basis were as follows:
| Undistributed ordinary income | | $ | 1,475,605 | | |
| Undistributed long-term capital gains | | | — | | |
| Unrealized appreciation | | | 187,945,595 | | |
At February 29, 2012, the cost of investments for federal income tax purposes was $990,868,919 and the aggregate gross unrealized appreciation and depreciation based on that cost was:
| Unrealized appreciation | | $ | 193,183,054 | | |
| Unrealized depreciation | | $ | (5,237,459 | ) | |
| Net unrealized appreciation | | $ | 187,945,595 | | |
The following capital loss carryforward, determined at February 29, 2012, may be available to reduce taxable income arising from future net realized gains on investments, if any, to the extent permitted by the Internal Revenue Code:
| Year of expiration | | Amount | |
| 2018 | | $ | 52,694,574 | | |
On December 22, 2010, the Regulated Investment Company Modernization Act of 2010 (the Act) was enacted, which changed various technical rules governing the tax treatment of regulated investment companies. The changes are generally effective for taxable years beginning after the date of enactment. Under the Act, the Fund will be permitted to carry forward capital losses incurred in taxable years beginning after the date of enactment for an unlimited period. However, any losses incurred during those future taxable years will be required to be utilized prior to the losses incurred in pre-enactment taxable years, which carry an expiration date. As a result of this ordering rule, pre-enactment capital loss carryforwards may be more likely to expire unused.
For the year ended February 29, 2012, $65,252,956 of capital loss carryforward was utilized.
Columbia Large Cap Core Fund acquired unrealized capital gains in connection with the merger with Columbia Blended Equity Fund (Note 12). Due to the acquisition of unrealized capital gains the yearly utilization of the Fund's capital loss carryforward may be limited by the Internal Revenue Code.
Under current tax rules, regulated investment companies can elect to treat certain late-year ordinary losses incurred and post-October capital losses (capital losses realized after October 31) as arising on the first day of the following taxable year. As of February 29, 2012, the Fund will elect to treat post-October capital losses of $3,671,386 as arising on March 1, 2012.
Management of the Fund has concluded that there are no significant uncertain tax positions that would require recognition in the financial statements. However, management's conclusion may be subject to review and adjustment at a later date based on factors including, but not limited to, new tax laws, regulations, and administrative interpretations (including relevant court decisions). Generally, the Fund's federal tax returns for the prior three fiscal years remain subject to examination by the Internal Revenue Service.
Note 5. Portfolio Information
The cost of purchases and proceeds from sales of securities, excluding short-term obligations, aggregated to $2,352,901,142 and $2,615,382,108, respectively, for the year ended February 29, 2012.
Transactions to realign the Fund's portfolio following the merger as described in Note 12 are excluded for purposes of calculating the Fund's portfolio turnover rate. These realignment transactions amounted to cost of purchases and proceeds from sales of $33,319,574 and $33,532,818, respectively.
Note 6. Regulatory Settlements
During the year ended February 29, 2012, the Fund received payments of $64,591 resulting from certain regulatory settlements with third parties in which the Fund had participated. The payments have been included in "Proceeds from regulatory settlements" in the Statement of Changes in Net Assets.
28
Columbia Large Cap Core Fund, February 29, 2012
Note 7. Lending of Portfolio Securities
Effective June 27, 2011, the Fund has entered into a Master Securities Lending Agreement (the Agreement) with JPMorgan Chase Bank, N.A. (JPMorgan). The Agreement, which replaces the previous security lending arrangement with State Street, authorizes JPMorgan as lending agent to lend securities to authorized borrowers in order to generate additional income on behalf of the Fund. Pursuant to the Agreement, the securities loaned are secured by cash or U.S. government securities equal to at least 100% of the market value of the loaned securities. Any additional collateral required to maintain those levels due to market fluctuations of the loaned securities is requested to be delivered the following business day. Cash collateral received is invested by the lending agent on behalf of the Fund into authorized investments pursuant to the Agreement. The investments made with the cash collateral are listed in the Portfolio of Investments. The values of such investments and any uninvested cash collateral are disclosed in the Statement of Assets and Liabilities along with the related obligation to return the collateral upon the return of the securities loaned. At February 29, 2012, securities valued at $98,046,888 were on loan, secured by cash collateral of $100,975,477 (which does not reflect calls for collateral made to borrowers by JPMorgan at period end) that is partially or fully invested in short-term securities or other cash equivalents.
Risks of delay in recovery of securities or even loss of rights in the securities may occur should the borrower of the securities fail financially. Risks may also arise to the extent that the value of the securities loaned increases above the value of the collateral received. JPMorgan will indemnify the Fund from losses resulting from a borrower's failure to return a loaned security when due. Such indemnification does not extend to losses associated with declines in the value of cash collateral investments. The Investment Manager is not responsible for any losses incurred by the Fund in connection with the securities lending program. Loans are subject to termination by the Fund or the borrower at any time, and are, therefore, not considered to be illiquid investments.
Pursuant to the Agreement, the Fund receives income for lending its securities either in the form of fees or by earning interest on invested cash collateral, net of negotiated rebates paid to borrowers and fees paid to the lending agent for services provided and any other securities lending expenses. Net income earned from securities lending for the year ended February 29, 2012 is disclosed in the Statement of Operations. The Fund continues to earn and accrue interest and dividends on the securities loaned.
Prior to June 27, 2011, the Fund participated in a securities lending arrangement with State Street. Each security on loan was collateralized in an amount at least equal to the market value of the securities loaned plus accrued income from the investment of collateral. The income generated by the investment of the collateral, net of any fees remitted to State Street as the lending agent and borrower rebates, was paid to the Fund.
Note 8. Custody Credits
Prior to June 27, 2011, the Fund had an agreement with its custodian bank under which custody fees may have been reduced by balance credits. These credits are recorded as part of expense reductions on the Statement of Operations. The Fund could have invested a portion of the assets utilized in connection with the expense offset arrangement in an income-producing asset if they had not entered into such an agreement. Subsequent to this date, the Fund may invest its daily balance in an affiliated money market fund as detailed below. For the period March 1, 2011 through June 26, 2011, these credits reduced total expenses by $2.
Note 9. Affiliated Money Market Fund
Effective June 27, 2011, the Fund may invest its daily cash balances in Columbia Short-Term Cash Fund, an affiliated money market fund established for the exclusive use by the Fund and other affiliated funds. The income earned by the Fund from such investments is included as "Dividends from affiliates" in the Statement of Operations. As an investing fund, the Fund indirectly bears its proportionate share of the expenses of Columbia Short-Term Cash Fund.
Note 10. Shareholder Concentration
At February 29, 2012, one unaffiliated shareholder account owned 44.2% of the outstanding shares of the Fund. The Fund has no knowledge about whether any portion of those shares was owned beneficially by such accounts. Affiliated shareholder accounts owned 38.6% of the outstanding shares of the Fund. Subscription and redemption activity by
29
Columbia Large Cap Core Fund, February 29, 2012
concentrated accounts may have a significant effect on the operations of the Fund.
Note 11. Line of Credit
The Fund has entered into a revolving credit facility with a syndicate of banks led by JPMorgan Chase Bank, N.A. (the Administrative Agent), whereby the Fund may borrow for the temporary funding of shareholder redemptions or for other temporary or emergency purposes. The credit facility became effective on June 27, 2011, replacing a prior credit facility. The credit facility agreement, as amended, which is a collective agreement between the Fund and certain other funds managed by the Investment Manager, severally and not jointly, permits collective borrowings up to $500 million. Pursuant to a December 13, 2011 amendment to the credit facility agreement, interest is charged to each participating fund based on its borrowings at a rate equal to the higher of (i) the overnight federal funds rate plus 1.00% or (i) the one-month LIBOR rate plus 1.00%. Each borrowing under the credit facility matures no later than 60 days after the date of borrowing. The Fund also pays a commitment fee equal to its pro rata share of the amount of the credit facility at a rate of 0.08% per annum. For the period June 27, 2011 through December 12, 2011, interest was charged to each participating fund based on its borrowings at a rate equal to the sum of the federal funds rate plus (i) 1.25% per annum plus (ii) if one-month LIBOR exceeds the federal funds rate, the amount of such excess. The Fund also paid a commitment fee equal to its pro rata share of the amount of the credit facility at a rate of 0.10% per annum.
For the period May 16, 2011 through June 26, 2011, the Fund and certain other funds managed by the Investment Manager participated in a $150 million committed, unsecured revolving credit facility provided by State Street. For the period March 28, 2011 through May 15, 2011, the collective borrowing amount of the credit facility was $225 million. Prior to March 28, 2011, the collective borrowing amount of the credit facility was $280 million. Interest was charged to each fund based on its borrowings at a rate equal to the greater of the (i) federal funds rate plus 1.25% per annum or (ii) the overnight LIBOR rate plus 1.25% per annum. The Fund also paid a commitment fee equal to its pro rata share of the amount of the credit facility at a rate of 0.125% per annum. For the year ended February 29, 2012, the average daily loan balance outstanding on days when borrowing existed was $23,000,000 at a weighted average interest rate of 1.50%.
Note 12. Fund Merger
At the close of business on March 11, 2011, the Fund acquired the assets and assumed the identified liabilities of Columbia Blended Equity Fund. The reorganization was completed after shareholders of Columbia Blended Equity Fund approved the plan on February 15, 2011. The purpose of the transaction was to combine two funds managed by the Investment Manager with comparable investment objectives and strategies.
The aggregate net assets of the Fund immediately before the acquisition were $1,218,171,435 and the combined net assets immediately after the acquisition were $1,319,804,105.
The merger was accomplished by a tax-free exchange of 6,625,629 shares of Columbia Blended Equity Fund valued at $101,632,670 (including $34,347,901 of unrealized appreciation).
In exchange for Columbia Blended Equity Fund shares, the Fund issued the following number of shares:
| | | Shares | |
| Class A | | | 34,275 | | |
| Class C | | | 14,642 | | |
| Class Z | | | 7,530,591 | | |
For financial reporting purposes, net assets received and shares issued by the Fund were recorded at fair value; however, Columbia Blended Equity Fund's cost of investments was carried forward.
The financial statements reflect the operations of the Fund for the period prior to the merger and the combined fund for the period subsequent to the merger. Because the combined investment portfolios have been managed as a single integrated portfolio since the merger was completed, it is not practicable to separate the amounts of revenue and earnings of Columbia Blended Equity Fund that have been included in the combined Fund's Statement of Operations since the merger was completed.
30
Columbia Large Cap Core Fund, February 29, 2012
Assuming the merger had been completed on March 1, 2011, the Fund's pro-forma net investment income, net gain on investments, net change in unrealized depreciation and net increase in net assets from operations for the year ended February 29, 2012 would have been approximately $11.9, $66.6, $(56.5) and $22.0 million, respectively.
Note 13. Significant Risks
Foreign Securities Risk
Investing in foreign securities may include certain risks and considerations not typically associated with investing in U.S. securities, such as fluctuating currency values and changing local and regional economic, political and social conditions, which may result in greater market volatility. In addition, certain foreign securities may not be as liquid as U.S. securities.
Note 14. Subsequent Events
Management has evaluated the events and transactions that have occurred through the date the financial statements were issued and noted no items requiring adjustment of the financial statements or additional disclosure.
Note 15. Information Regarding Pending and Settled Legal Proceedings
In June 2004, an action captioned John E. Gallus et al. v. American Express Financial Corp. and American Express Financial Advisors Inc. was filed in the United States District Court for the District of Arizona. The plaintiffs allege that they are investors in several American Express Company mutual funds (currently branded as Columbia) and they purport to bring the action derivatively on behalf of those funds under the Investment Company Act of 1940. The plaintiffs allege that fees allegedly paid to the defendants by the funds for investment advisory and administrative services are excessive. The plaintiffs seek remedies including restitution and rescission of investment advisory and distribution agreements. The plaintiffs voluntarily agreed to transfer this case to the United States District Court for the District of Minnesota (the District Court). In response to defendants' motion to dismiss the complaint, the District Court dismissed one of plaintiffs' four claims and granted plaintiffs limited discovery. Defendants moved for summary judgment in April 2007. Summary judgment was granted in the defendants' favor on July 9, 2007. The plaintiffs filed a notice of appeal with the Eighth Circuit Court of Appeals (the Eighth Circuit) on August 8, 2007. On April 8, 2009, the Eighth Circuit reversed summary judgment and remanded to the District Court for further proceedings. On August 6, 2009, defendants filed a writ of certiorari with the U.S. Supreme Court (the Supreme Court), asking the Supreme Court to stay the District Court proceedings while the Supreme Court considered and rule in a case captioned Jones v. Harris Associates, which involved issues of law similar to those presented in the Gallus case. On March 30, 2010, the Supreme Court issued its ruling in Jones v. Harris Associates, and on April 5, 2010, the Supreme Court vacated the Eighth Circuit's decision in the Gallus case and remanded the case to the Eighth Circuit for further consideration in light of the Supreme Court's decision in Jones v. Harris Associates. On June 4, 2010, the Eighth Circuit remanded the Gallus case to the District Court for further consideration in light of the Supreme Court's decision in Jones v. Harris Associates. On December 9, 2010, the District Court reinstated its July 9, 2007 summary judgment order in favor of the defendants. On January 10, 2011, plaintiffs filed a notice of appeal with the Eighth Circuit. In response to the plaintiffs' opening appellate brief filed on March 18, 2011, the defendants filed a response brief on May 4, 2011 with the Eighth Circuit. The plaintiffs filed a reply brief on May 26, 2011 and oral arguments took place on November 17, 2011. On March 30, 2012, the Eighth Circuit upheld the grant of summary judgment by the District Court in favor of the defendants.
In December 2005, without admitting or denying the allegations, American Express Financial Corporation (AEFC, which is now known as Ameriprise Financial, Inc. (Ameriprise Financial)) entered into settlement agreements with the Securities and Exchange Commission (SEC) and Minnesota Department of Commerce (MDOC) related to market timing activities. As a result, AEFC was censured and ordered to cease and desist from committing or causing any violations of certain provisions of the Investment Advisers Act of 1940, the Investment Company Act of 1940, and various Minnesota laws. AEFC agreed to pay disgorgement of $10 million and civil money penalties of $7 million. AEFC also agreed to retain an independent distribution consultant to assist in developing a plan for distribution of all disgorgement and civil penalties ordered by the SEC in accordance with
31
Columbia Large Cap Core Fund, February 29, 2012
various undertakings detailed at www.sec.gov/litigation/admin/ia-2451.pdf. Ameriprise Financial and its affiliates have cooperated with the SEC and the MDOC in these legal proceedings, and have made regular reports to the funds' Boards of Trustees.
Ameriprise Financial and certain of its affiliates have historically been involved in a number of legal, arbitration and regulatory proceedings, including routine litigation, class actions, and governmental actions, concerning matters arising in connection with the conduct of their business activities. Ameriprise Financial believes that the Funds are not currently the subject of, and that neither Ameriprise Financial nor any of its affiliates are the subject of, any pending legal, arbitration or regulatory proceedings that are likely to have a material adverse effect on the Funds or the ability of Ameriprise Financial or its affiliates to perform under their contracts with the Funds. Ameriprise Financial is required to make 10-Q, 10-K and, as necessary, 8-K filings with the Securities and Exchange Commission on legal and regulatory matters that relate to Ameriprise Financial and its affiliates. Copies of these filings may be obtained by accessing the SEC website at www.sec.gov.
There can be no assurance that these matters, or the adverse publicity associated with them, will not result in increased fund redemptions, reduced sale of fund shares or other adverse consequences to the Funds. Further, although we believe proceedings are not likely to have a material adverse effect on the Funds or the ability of Ameriprise Financial or its affiliates to perform under their contracts with the Funds, these proceedings are subject to uncertainties and, as such, we are unable to estimate the possible loss or range of loss that may result. An adverse outcome in one or more of these proceedings could result in adverse judgments, settlements, fines, penalties or other relief that could have a material adverse effect on the consolidated financial condition or results of operations of Ameriprise Financial.
32
Report of Independent Registered Public Accounting Firm
To the Trustees of Columbia Funds Series Trust and the Shareholders of Columbia Large Cap Core Fund
In our opinion, the accompanying statement of assets and liabilities, including the investment portfolio, and the related statements of operations and of changes in net assets and the financial highlights present fairly, in all material respects, the financial position of Columbia Large Cap Core Fund (the "Fund") (a series of Columbia Funds Series Trust) at February 29, 2012, the results of its operations for the year then ended, the changes in its net assets for each of the two years in the period then ended and the financial highlights for each of the periods indicated, in conformity with accounting principles generally accepted in the United States of America. These financial statements and financial highlights (hereafter referred to as "financial statements") are the responsibility of the Fund's management. Our responsibility is to express an opinion on these financial statements based on our audits. We conducted our audits of these financial statements in accordance with the standards of the Public Company Accounting Oversight Board (United States). Those standards require that we plan and perform the audit to obtain reasonable assurance about whether the financial statements are free of material misstatement. An audit includes examining, on a test basis, evidence supporting the amounts and disclosures in the financial statements, assessing the accounting principles used and significant estimates made by management, and evaluating the overall financial statement presentation. We believe that our audits, which included confirmation of securities at February 29, 2012 by correspondence with the custodian, brokers and transfer agent, provide a reasonable basis for our opinion.
PricewaterhouseCoopers LLP
Minneapolis, Minnesota
April 20, 2012
33
Federal Income Tax Information (Unaudited) – Columbia Large Cap Core Fund
For non-corporate shareholders 100.00%, or the maximum amount allowable under the Jobs and Growth Tax Relief Reconciliation Act of 2003, of the ordinary income distributed by the Fund for the fiscal year ended February 29, 2012 may represent qualified dividend income.
100.00% of the ordinary income distributed by the Fund for the fiscal year ended February 29, 2012, qualifies for the corporate dividends received deduction.
The Fund will notify shareholders in January 2013 of amounts for use in preparing 2012 income tax returns.
34
Fund Governance
Shareholders elect the Board that oversees the funds' operations. The Board appoints officers who are responsible for day-to-day business decisions based on policies set by the Board. The following table provides basic biographical information about the funds' Board members, including their principal occupations during the past five years, although specific titles for individuals may have varied over the period. Under current Board policy, members may serve until the next Board meeting after he or she reaches the mandatory retirement age established by the Board, or the fifteenth anniversary of the first Board meeting they attended as a member of the Board.
On September 29, 2009, Ameriprise Financial, the parent company of Columbia Management, entered into an agreement with Bank of America, N.A. ("Bank of America") to acquire a portion of the asset management business of Columbia Management Group, LLC and certain of its affiliated companies (the "Transaction"). Following the Transaction, which became effective on May 1, 2010, various alignment activities have occurred with respect to the Fund Family. In connection with the Transaction, Mr. Edward J. Boudreau, Jr., Mr. William P. Carmichael, Mr. William A. Hawkins, Mr. R. Glenn Hilliard, Mr. John J. Nagorniak, Ms. Minor M. Shaw and Dr. Anthony M. Santomero, who were members prior to the Transaction of the Legacy Columbia Nations funds' Board ("Nations Funds"), which includes Columbia Funds Series Trust, Columbia Funds Variable Insurance Trust I and Columbia Funds Master Investment Trust, LLC., began service on the Board for the Legacy RiverSource funds ("RiverSource Funds") effective June 1, 2011, which resulted in an overall increase from twelve Trustees to sixteen for all mutual funds overseen by the Board.
Independent Board Members
| Name, Address, Age | | Position Held
with Funds
and Length
of Service | | Principal Occupation During Past Five Years | | Number of
Funds in the
Fund Family
Overseen by
Board Member | | Other Present or
Past Directorships/
Trusteeships
(Within Past 5 Years) | |
| Kathleen Blatz | | | | | | | | | |
|
901 S. Marquette Ave.
Minneapolis, MN 55402
Age 57 | | Board member since 1/06 for RiverSource Funds and since 6/11 for Nations Funds | | Attorney; Chief Justice, Minnesota Supreme Court, 1998-2006 | | | 153 | | | None | |
|
| Edward J. Boudreau, Jr. | | | | | | | | | |
|
225 Franklin Street
Mail Drop
BX32 05228
Boston, MA 02110
Age 67 | | Board member since 6/11 for RiverSource Funds and since 1/05 for Nations Funds | | Managing Director, E.J. Boudreau & Associates (consulting) since 2000 | | | 146 | | | Former Trustee, BofA Funds Series Trust (11 funds) | |
|
| Pamela G. Carlton | | | | | | | | | |
|
901 S. Marquette Ave.
Minneapolis, MN 55402
Age 57 | | Board member since 7/07 for RiverSource Funds and since 6/11 for Nations Funds | | President, Springboard-Partners in Cross Cultural Leadership (consulting company) | | | 153 | | | None | |
|
35
Fund Governance (continued)
Independent Board Members (continued)
| Name, Address, Age | | Position Held
with Funds
and Length
of Service | | Principal Occupation During Past Five Years | | Number of
Funds in the
Fund Family
Overseen by
Board Member | | Other Present or
Past Directorships/
Trusteeships
(Within Past 5 Years) | |
| William P. Carmichael | | | | | | | | | |
|
225 Franklin Street
Mail Drop
BX32 05228
Boston, MA 02110
Age 68 | | Board member since 6/11 for RiverSource Funds and since 1999 for Nations Funds | | Retired | | | 146 | | | Director, Cobra Electronics Corporation (electronic equipment manufacturer); The Finish Line (athletic shoes and apparel); McMoRan Exploration Company (oil and gas exploration and development); former Trustee, BofA Funds Series Trust (11 funds); former Director, Spectrum Brands, Inc. (consumer products); former Director, Simmons Company (bedding) | |
|
| Patricia M. Flynn | | | | | | | | | |
|
901 S. Marquette Ave.
Minneapolis, MN 55402
Age 61 | | Board member since 11/04 for RiverSource Funds and since 6/11 for Nations Funds | | Trustee Professor of Economics and Management, Bentley University; former Dean, McCallum Graduate School of Business, Bentley University | | | 153 | | | None | |
|
| William A. Hawkins | | | | | | | | | |
|
225 Franklin Street
Mail Drop
BX32 05228
Boston, MA 02110
Age 69 | | Board member since 6/11 for RiverSource Funds and since 1/05 for Nations Funds | | Managing Director, Overton Partners (financial consulting), since August 2010; President and Chief Executive Officer, California General Bank, N.A., January 2008-August 2010 | | | 146 | | | Trustee, BofA Funds Series Trust (11 funds) | |
|
| R. Glenn Hilliard | | | | | | | | | |
|
225 Franklin Street
Mail Drop
BX32 05228
Boston, MA 02110
Age 69 | | Board member since 6/11 for RiverSource Funds and since 1/05 for Nations Funds | | Chairman and Chief Executive Officer, Hilliard Group LLC (investing and consulting), since April 2003; Non-Executive Director & Chairman, CNO Financial Group, Inc. (formerly Conseco, Inc.) (insurance), September 2003-May 2011 | | | 146 | | | Chairman, BofA Fund Series Trust (11 funds); former Director, CNO Financial Group, Inc. (insurance) | |
|
36
Fund Governance (continued)
Independent Board Members (continued)
| Name, Address, Age | | Position Held
with Funds
and Length
of Service | | Principal Occupation During Past Five Years | | Number of
Funds in the
Fund Family
Overseen by
Board Member | | Other Present or
Past Directorships/
Trusteeships
(Within Past 5 Years) | |
| Stephen R. Lewis, Jr. | | | | | | | | | |
|
901 S. Marquette Ave.
Minneapolis, MN 55402
Age 73 | | Chair of the Board for RiverSource Funds since 1/07, Board member for RiverSource Funds since 1/02 and since 6/11 for Nations Funds | | President Emeritus and Professor of Economics Emeritus, Carleton College | | | 153 | | | Director, Valmont Industries, Inc. (manufactures irrigation systems) | |
|
| John F. Maher | | | | | | | | | |
|
901 S. Marquette Ave.
Minneapolis, MN 55402
Age 68 | | Board member since 12/06 for Legacy Seligman funds, since 12/08 for RiverSource Funds and since 6/11 for Nations Funds | | Retired President and Chief Executive Officer and former Director, Great Western Financial Corporation (financial services), 1986-1997 | | | 153 | | | None | |
|
| John J. Nagorniak | | | | | | | | | |
|
225 Franklin Street
Mail Drop
BX32 05228
Boston, MA 02110
Age 67 | | Board member since 6/11 for RiverSource Funds and since 1/08 for Nations Funds | | Retired; President and Director, Foxstone Financial, Inc. (consulting), 2000-2007; Director, Mellon Financial Corporation affiliates (investing), 2000-2007; Chairman, Franklin Portfolio Associates (investing—Mellon affiliate), 1982-2007 | | | 146 | | | Trustee, Research Foundation of CFA Institute; Director, MIT Investment Company; Trustee, MIT 401k Plan; former Trustee, BofA Funds Series Trust (11 funds) | |
|
| Catherine James Paglia | | | | | | | | | |
|
901 S. Marquette Ave.
Minneapolis, MN 55402
Age 59 | | Board member since 11/04 for RiverSource Funds and since 6/11 for Nations Funds | | Director, Enterprise Asset Management, Inc. (private real estate and asset management company) | | | 153 | | | None | |
|
37
Fund Governance (continued)
Independent Board Members (continued)
| Name, Address, Age | | Position Held
with Funds
and Length
of Service | | Principal Occupation During Past Five Years | | Number of
Funds in the
Fund Family
Overseen by
Board Member | | Other Present or
Past Directorships/
Trusteeships
(Within Past 5 Years) | |
| Leroy C. Richie | | | | | | | | | |
|
901 S. Marquette Ave.
Minneapolis, MN 55402
Age 70 | | Board member since 2000 for Legacy Seligman funds, since 11/08 for RiverSource Funds and since 6/11 for Nations Funds | | Counsel, Lewis & Munday, P.C. since 2004; former Vice President and General Counsel, Automotive Legal Affairs, Chrysler Corporation | | | 153 | | | Director, Digital Ally, Inc. (digital imaging); Director, Infinity, Inc. (oil and gas exploration and production); Director, OGE Energy Corp. (energy and energy services) | |
|
| Minor M. Shaw | | | | | | | | | |
|
225 Franklin Street
Mail Drop
BX32 05228
Boston, MA 02110
Age 64 | | Board member since 6/11 for RiverSource Funds and since 2003 for Nations Funds | | President—Micco LLC (private investments) | | | 146 | | | Former Trustee, BofA Funds Series Trust (11 funds); Board Member, Piedmont Natural Gas; Director, Blue Cross Blue Shield of South Carolina | |
|
| Alison Taunton-Rigby | | | | | | | | | |
|
901 S. Marquette Ave.
Minneapolis, MN 55402
Age 67 | | Board member since 11/02 for RiverSource Funds and since 6/11 for Nations Funds | | Chief Executive Officer and Director, RiboNovix, Inc. 2003-2010 (biotechnology); former President, Aquila Biopharmaceuticals | | | 153 | | | Director, Healthways, Inc. (health management programs); Director, ICI Mutual Insurance Company, RRG; Director, Abt Associates (government contractor) | |
|
38
Fund Governance (continued)
Interested Board Member Not Affiliated with Investment Manager*
| Name, Address, Age | | Position Held
with Funds
and Length
of Service | | Principal Occupation During Past Five Years | | Number of
Funds in the
Fund Family
Overseen by
Board Member | | Other Present or
Past Directorships/
Trusteeships
(Within Past 5 Years) | |
| Anthony M. Santomero* | | | | | | | | | |
|
225 Franklin Street
Mail Drop
BX32 05228
Boston, MA 02110
Age 65 | | Board member since 6/11 for RiverSource Funds and since 1/08 for Nations Funds | | Richard K. Mellon Professor Emeritus of Finance, The Wharton School, University of Pennsylvania, since 2002; Senior Advisor, McKinsey & Company (consulting), 2006-2008; President and Chief Executive Officer, Federal Reserve Bank of Philadelphia, 2000-2006 | | | 146 | | | Director, Renaissance Reinsurance Ltd.; Trustee, Penn Mutual Life Insurance Company; Director, Citigroup; Director, Citibank, N.A.; former Trustee, BofA Funds Series Trust (11 funds) | |
|
* Dr. Santomero is not an affiliated person of the Investment Manager or Ameriprise Financial. However, he is currently deemed by the funds to be an "interested person" (as defined in the 1940 Act) of the Funds because he serves as a Director of Citigroup, Inc. and Citibank N.A., companies that may directly or through subsidiaries and affiliates engage from time-to-time in brokerage execution, principal transactions and lending relationships with the funds or accounts advised/managed by the Investment Manager.
Interested Board Member Affiliated with Investment Manager*
| William F. Truscott | | | | | | | | | |
|
53600 Ameriprise Financial Center
Minneapolis, MN 55474
Age 51 | | Board member since 11/01 for RiverSource Funds and since 6/11 for Nations Funds; Senior Vice President since 2002 for RiverSource Funds and 5/10 for Nations Funds | | Chairman of the Board and President, Columbia Management Investment Advisers, LLC since May 2010 and February 2012, respectively (previously President, Chairman of the Board and Chief Investment Officer, 2001-April 2010); Chief Executive Officer, U.S. Asset Management & President, Annuities, Ameriprise Financial, Inc. since May 2010 (previously President—U.S. Asset Management and Chief Investment Officer, 2005-April 2010); Director, President and Chief Executive Officer, Ameriprise Certificate Company since 2006; Director and Chief Executive Officer, Columbia Management Investment Distributors, Inc. since May 2010 and February 2012, respectively (previously Chairman of the Board and Chief Executive Officer, 2006-April 2010); Chairman of the Board and Chief Executive Officer, RiverSource Distributors, Inc. since 2006. | | | 153 | | | None | |
|
* Interested person (as defined under the 1940 Act) by reason of being an officer, director, security holder and/or employee of the Investment Manager or Ameriprise Financial.
The SAI has additional information about the Fund's Board members and is available, without charge, upon request by calling 800.345.6611; contacting your financial intermediary; or visiting columbiamanagement.com.
39
Fund Governance (continued)
Officers
| Name, Year of Birth and Address | | Principal Occupation(s) During the Past Five Years | |
| J. Kevin Connaughton (Born 1964) | |
|
225 Franklin Street
Boston, MA 02110
President (since 2009) | | Senior Vice President and General Manager—Mutual Fund Products, Columbia Management Investment Advisers, LLC since May 2010; President, Columbia Funds, since 2009, and RiverSource Funds, since May 2010 (previously Senior Vice President and Chief Financial Officer, Columbia Funds, from June 2008 to January 2009, Treasurer, Columbia Funds, from October 2003 to May 2008, and senior officer of various other affiliated funds since 2000); Managing Director, Columbia Management Advisors, LLC from December 2004 to April 2010. | |
|
| Michael G. Clarke (Born 1969) | |
|
225 Franklin Street
Boston, MA 02110
Treasurer (since 2011) and Chief Financial Officer (since 2009) | | Vice President, Columbia Management Investment Advisers, LLC since May 2010; Managing Director of Fund Administration, Columbia Management Advisors, LLC, from September 2004 to April 2010; senior officer of Columbia Funds and affiliated funds since 2002. | |
|
| Scott R. Plummer (Born 1959) | |
|
5228 Ameriprise Financial Center
Minneapolis, MN 55474
Senior Vice President and Chief Legal Officer (since 2010) | | Chief Legal Officer and Assistant Secretary, Columbia Management Investment Advisers, LLC since June 2005; Vice President and Lead Chief Counsel—Asset Management, Ameriprise Financial, Inc. since May 2010 (previously Vice President and Chief Counsel—Asset Management, from 2005 to April 2010, Vice President, Chief Counsel and Assistant Secretary, Columbia Management Investment Distributors, Inc. since 2008; Vice President, General Counsel and Secretary, Ameriprise Certificate Company since 2005; Chief Counsel, RiverSource Distributors, Inc. since 2006; Senior officer of Columbia Funds and affiliated funds, since 2006. | |
|
| Thomas P. McGuire (Born 1972) | |
|
225 Franklin Street
Boston, MA 02110
Chief Compliance Officer (since 2012) | | Vice President—Asset Management Compliance, Columbia Management Investment Advisers, LLC since March 2010; Chief Compliance Officer, Ameriprise Certificate Company, since September 2010; Compliance Executive, Bank of America, from June 2005 to April 2010. | |
|
| William F. Truscott (Born 1960) | |
|
53600 Ameriprise Financial Center
Minneapolis, MN 55474
Senior Vice President (since 2010) | | Chairman of the Board and President, Columbia Management Investment Advisers, LLC since May 2010 and February 2012, respectively (previously President, Chairman of the Board and Chief Investment Officer, from 2001 to April 2010); Chief Executive Officer, U.S. Asset Management & President, Annuities, Ameriprise Financial, Inc. since May 2010 (previously President—U.S. Asset Management and Chief Investment Officer from 2005 to April 2010); Director, President and Chief Executive Officer, Ameriprise Certificate Company since 2006; Director and Chief Executive Officer, Columbia Management Investment Distributors, Inc. since May 2010 and February 2012, respectively (previously Chairman of the Board and Chief Executive Officer from 2008 to April 2010); Chairman of the Board and Chief Executive Officer, RiverSource Distributors, Inc. since 2006. | |
|
| Paul D. Pearson (Born 1956) | |
|
10468 Ameriprise Financial Center
Minneapolis, MN 55474
Vice President and Assistant Treasurer
(since 2011) | | Vice President—Investment Accounting, Columbia Management Investment Advisers, LLC, since May 2010; Vice President—Managed Assets, Investment Accounting, Ameriprise Financial Corporation, 1998-2010 | |
|
40
Fund Governance (continued)
Officers (continued)
| Name, Year of Birth and Address | | Principal Occupation(s) During the Past Five Years | |
| Colin Moore (Born 1958) | |
|
225 Franklin Street
Boston, MA 02110
Senior Vice President (since 2010) | | Director and Chief Investment Officer, Columbia Management Investment Advisers, LLC since May 2010; Manager, Managing Director and Chief Investment Officer of Columbia Management Advisors, LLC from 2007 to April 2010; Head of Equities, Columbia Management Advisors, LLC from 2002 to 2007. | |
|
| Christopher O. Petersen (Born 1970) | |
|
5228 Ameriprise Financial Center
Minneapolis, MN 55474
Vice President and Secretary (since 2011) | | Vice President and Chief Counsel, Ameriprise Financial since January 2010 (formerly Vice President and Group Counsel or Counsel from April 2004 to January 2010); Senior officer of Columbia Funds and affiliated funds, since 2007. | |
|
| Amy K. Johnson (Born 1965) | |
|
5228 Ameriprise Financial Center
Minneapolis, MN 55474
Vice President (since 2010) | | Senior Vice President and Chief Operating Officer, Columbia Management Investment Advisers, LLC since May 2010 (previously Chief Administrative Officer, from 2009 until April 2010, Vice President—Asset Management and Trust Company Services, from 2006 to 2009, and Vice President—Operations and Compliance from 2004 to 2006). | |
|
| Joseph F. DiMaria (Born 1968) | |
|
225 Franklin Street
Boston, MA 02110
Vice President (since 2011) and Chief Accounting Officer (since 2008) | | Vice President, Mutual Fund Administration, Columbia Management Investment Advisers, LLC, since May 2010; Director of Fund Administration, Columbia Management Advisors, LLC from January 2006 to April 2010. | |
|
| Paul B. Goucher (Born 1968) | |
|
100 Park Avenue
New York, NY 10017
Vice President and Assistant Secretary (since 2010) | | Vice President and Chief Counsel of Ameriprise Financial since January 2010 (formerly Vice President and Group Counsel from November 2008 to January 2010); Director, Managing Director and General Counsel of J. & W. Seligman & Co. Incorporated (Seligman) from July 2008 to November 2008 and Managing Director and Associate General Counsel of Seligman from January 2005 to July 2008. | |
|
| Michael E. DeFao (Born 1968) | |
|
225 Franklin Street
Boston, MA 02110
Vice President and Assistant Treasurer (since 2011) | | Vice President and Chief Counsel, Ameriprise Financial since May 2010; Associate General Counsel, Bank of America from June 2005 to April 2010. | |
|
| Stephen T. Welsh (Born 1957) | |
|
225 Franklin Street
Boston, MA 02110
Vice President (since 2006) | | President and Director, Columbia Management Investment Services Corp. since May 2010; President and Director, Columbia Management Services, Inc. from July 2004 to April 2010; Managing Director, Columbia Management Distributors, Inc. from August 2007 to April 2010. | |
|
41
This page intentionally left blank.
This page intentionally left blank.
This page intentionally left blank.
Important Information About This Report
The fund mails one shareholder report to each shareholder address. If you would like more than one report, please call shareholder services at 1-800-345-6611 and additional reports will be sent to you. This report has been prepared for shareholders of Columbia Large Cap Core Fund.
A description of the policies and procedures that the fund uses to determine how to vote proxies and a copy of the fund's voting records are available (i) at www.columbiamanagement.com, (ii) on the Securities and Exchange Commission's website at www.sec.gov, and (iii) without charge, upon request, by calling 1-800-368-0346. Information regarding how the fund voted proxies relating to portfolio securities during the 12-month period ended June 30 is available from the SEC's website. Information regarding how the fund voted proxies relating to portfolio securities is also available from the fund's website, www.columbiamanagement.com.
The fund files a complete schedule of portfolio holdings with the SEC for the first and third quarters of each fiscal year on Form N-Q. The fund's Form N-Q is available on the SEC's website at www.sec.gov and may be reviewed and copied at the SEC's Public Reference Room in Washington, D.C. Information on the operation of the Public Reference Room may be obtained by calling 1-800-SEC-0330.
Transfer Agent
Columbia Management Investment
Services Corp.
P.O. Box 8081
Boston, MA 02266-8081
1-800-345-6611
Distributor
Columbia Management Investment
Distributors, Inc.
225 Franklin Street
Boston, MA 02110
Investment Manager
Columbia Management Investment Advisers, LLC
225 Franklin Street
Boston, MA 02110
45

Columbia Large Cap Core Fund
P. O. Box 8081
Boston, MA 02266-8081
columbiamanagement.com
This information is for use with concurrent or prior delivery of a fund prospectus. Investors should consider the investment objectives, risks, charges and expenses of a mutual fund carefully before investing. For a free prospectus, which contains this and other important information about the funds, visit columbiamanagement.com. Read the prospectus carefully before investing. The Fund is distributed by Columbia Management Investment Distributors, Inc., member FINRA, and managed by Columbia Management Investment Advisers, LLC.
© 2012 Columbia Management Investment Advisers, LLC. All rights reserved.
C-1236 C (4/12)

Columbia Small Cap Value Fund II
Annual Report for the Period Ended February 29, 2012
Not FDIC insured • No bank guarantee • May lose value
Table of Contents
| Fund Profile | | | 1 | | |
|
| Performance Information | | | 2 | | |
|
| Understanding Your Expenses | | | 3 | | |
|
| Portfolio Managers' Report | | | 4 | | |
|
| Portfolio of Investments | | | 6 | | |
|
Statement of Assets and
Liabilities | | | 12 | | |
|
| Statement of Operations | | | 14 | | |
|
Statement of Changes in
Net Assets | | | 15 | | |
|
| Financial Highlights | | | 17 | | |
|
| Notes to Financial Statements | | | 23 | | |
|
Report of Independent Registered
Public Accounting Firm | | | 33 | | |
|
| Federal Income Tax Information | | | 34 | | |
|
| Fund Governance | | | 35 | | |
|
Important Information About
This Report | | | 45 | | |
|
The views expressed in this report reflect the current views of the respective parties. These views are not guarantees of future performance and involve certain risks, uncertainties and assumptions that are difficult to predict, so actual outcomes and results may differ significantly from the views expressed. These views are subject to change at any time based upon economic, market or other conditions and the respective parties disclaim any responsibility to update such views. These views may not be relied on as investment advice and, because investment decisions for a Columbia Fund are based on numerous factors, may not be relied on as an indication of trading intent on behalf of any particular Columbia Fund. References to specific securities should not be construed as a recommendation or investment advice.
President's Message

Dear Shareholders,
Americans were dispirited in the fourth quarter of 2011 by Washington's inability to reach a plan for deficit reduction and Europe's piecemeal attempt to address its own fiscal issues. Yet, there was sufficient good news to encourage risk taking, buoying both stocks and bonds to solid gains.
U.S. economic data surprised on the upside and fears of recession abated. With the bar of expectations set low, investors responded positively to the announcement that the economy had expanded by 1.8% in the third quarter. Consumer confidence improved, even though consumers remain under pressure with no real increase in disposable income and a continued decline in household net worth. Headline inflation—which tracks a broad range of consumer expenditures, including food and energy—declined. Even manufacturing held its ground.
Against this backdrop, the U.S. equity markets logged solid returns. The S&P 500 Index gained 11.82%, moving into positive territory for the year with quarterly advances in all ten sectors. Mid- and small-cap stocks did even better. Value outperformed growth across all market capitalizations. Energy stocks led the market, as the price of oil moved above $100 a barrel in December. Industrials and materials stocks rose, buoyed by improving economic data. The U.S. fixed-income markets logged modest but solid returns. High-yield bonds were the best performers as the economy showed signs of improvement. Emerging market bonds were strong performers, as inflation came under control in key regions. Municipal bonds and Treasuries eked out only modest gains, as investors moved away from quality in favor of riskier assets.
While fourth quarter gains were encouraging, challenges still remain. Columbia Management, however, remains strong and steadfast. Columbia Management is the eighth largest manager of long-term mutual fund assets with $326 billion under management as of December 31, 2011. The past year has been one of considerable change for the organization as we worked diligently to align products, services and resources in the integration of Columbia Management with RiverSource Investments. The strong line-up of talent, resources and capabilities that has resulted is highlighted by the success of our products. As of December 31, 2011, Columbia Management offers 52 funds rated either 4 or 5 stars by Morningstar.*
For more information about these and other funds offered by Columbia Management, including detailed, up-to-date fund performance and portfolio information, please visit us online at columbiamanagement.com. Other information and resources available on our website include:
g timely economic analysis and market commentary
g quarterly fund commentaries
g Columbia Management Investor, a quarterly newsletter for shareholders
Thank you for your continued support of the Columbia Funds. We look forward to serving your investment needs for many years to come.
Best Regards,

J. Kevin Connaughton
President, Columbia Funds
* All ratings are based on Class Z shares as of 12/31/2011. Out of 119 Class Z share Columbia funds rated by Morningstar, 7 funds received a 5-star Overall Rating and 45 funds received a 4-star Overall Rating. The Overall Morningstar Rating for a retail mutual fund is derived from a weighted average of the performance figures associated with its 3-, 5- and 10-year (if applicable) Morningstar Rating metrics. For share classes that do not have a 3-, 5-, or 10-year actual performance history, the fund's independent Morningstar Rating metric is then compared against the retail mutual fund universe breakpoints to determine its hypothetical rating.
For each fund with at least a three-year history, Morningstar calculates a Morningstar RatingTM based on a Morningstar Risk-Adjusted Return measure that accounts for variation in a fund's monthly performance (including the effects of sales charges/loads, and redemption fees), placing more emphasis on downward variations and rewarding consistent performance. The top 10% of funds in each category receive 5 stars, the next 22.5% receive 4 stars, the next 35% receive 3 stars, the next 22.5% receive 2 stars and the bottom 10% receive 1 star. (Each share class is counted as a fraction of one fund within this scale and rated separately, which may cause slight variations in the distribution percentages.)
The Morningstar RatingTM is for Class Z shares only; other classes may have different performance characteristics and may have different ratings. ©2012 Morningstar, Inc. All Rights Reserved. The Morningstar information contained herein: (1) is proprietary to Morningstar and/or its content providers; (2) may not be copied or distributed; and (3) is not warranted to be accurate, complete or timely. Neither Morningstar nor its content providers are responsible for any damages or losses arising from any use of this information.
Investors should consider the investment objectives, risks, charges and expenses of a mutual fund carefully before investing. For a free prospectus, which contains this and other important information about the funds, visit columbiamanagement.com. The prospectus should be read carefully before investing.
Columbia Funds are distributed by Columbia Management Investment Distributors, Inc., member FINRA, and managed by Columbia Management Investment Advisers, LLC.
© 2012 Columbia Management Investment Advisers, LLC. All rights reserved.
Fund Profile – Columbia Small Cap Value Fund II
Summary
g For the 12-month period that ended February 29, 2012, the fund's Class A shares returned –2.08%without sales charge.
g In a difficult environment for small-cap stocks, the fund held up better than its benchmark, the Russell 2000 Value Index, which returned –2.72%.1
g Stock selection, particularly in the consumer discretionary sector, helped shore up results versus the Russell index.
Portfolio Management
Christian K. Stadlinger has co-managed the fund since 2002. From 2002 until joining Columbia Management Investment Advisers, LLC (the Investment Manager) in May 2010, Mr. Stadlinger was associated with the fund's previous investment adviser as an investment professional.
Jarl Ginsberg has co-managed the fund since 2003. From 2003 until joining the Investment Manager in May 2010, Mr. Ginsberg was associated with the fund's previous investment adviser as an investment professional.
1The Russell 2000 Value Index measures the performance of those Russell 2000 Index companies with lower price-to-book ratios and lower forecasted growth values.
Indices are not available for investment, are not professionally managed and do not reflect sales charges, fees, brokerage commissions, taxes or other expenses of investing. Securities in the fund may not match those in an index.
Performance data quoted represents past performance and current performance may be lower or higher. Past performance is no guarantee of future results. The investment return and principal value will fluctuate so that shares, when redeemed, may be worth more or less than the original cost. Please visit www.columbiamanagement.com for daily and most recent month-end performance updates.
Summary
1-year return as of 02/29/12
| | | | –2.08% | |
|
|  | | | Class A shares
(without sales charge) | |
|
| | | | –2.72% | |
|
|  | | | Russell 2000 Value Index | |
|
Morningstar Style BoxTM
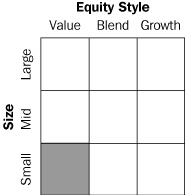
The Morningstar Style BoxTM is based on the fund's portfolio holdings. For equity funds, the vertical axis shows the market capitalization of the stocks owned, and the horizontal axis shows investment style (value, blend, or growth). Information shown is based on the most recent data provided by Morningstar.
© 2012 Morningstar, Inc. All rights reserved. The Morningstar information contained herein: (1) is proprietary to Morningstar and/or its content providers; (2) may not be copied or distributed; and (3) is not warranted to be accurate, complete or timely. Neither Morningstar nor its content providers are responsible for any damages or losses arising from any use of this information.
1
Performance Information – Columbia Small Cap Value Fund II
Performance data quoted represents past performance and current performance may be lower or higher. Past performance is no guarantee of future results. The investment return and principal value will fluctuate so that shares, when redeemed, may be worth more or less than the original cost. Please visit www.columbiamanagement.com for daily and most recent month-end performance updates.
Performance of a $10,000 investment 05/01/02 – 02/29/12
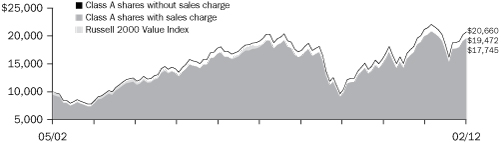
The chart above shows the change in value of a hypothetical $10,000 investment in Class A shares of Columbia Small Cap Value Fund II during the stated time period, and does not reflect the deduction of taxes that a shareholder may pay on fund distributions or on the redemption of fund shares.
Performance of a $10,000 investment 05/01/02 – 02/29/12 ($)
| Sales charge | | without | | with | |
| Class A | | | 20,660 | | | | 19,472 | | |
| Class B | | | 19,178 | | | | 19,178 | | |
| Class C | | | 19,172 | | | | 19,172 | | |
| Class I* | | | 20,807 | | | | n/a | | |
| Class R* | | | 20,126 | | | | n/a | | |
| Class Z | | | 21,170 | | | | n/a | | |
Average annual total return as of 02/29/12 (%)
| Share class | | A | | B | | C | | I* | | R* | | Z | |
| Inception | | 05/01/02 | | 05/01/02 | | 05/01/02 | | 09/27/10 | | 01/23/06 | | 05/01/02 | |
| Sales charge | | without | | with | | without | | with | | without | | with | | without | | without | | without | |
| 1-year | | | –2.08 | | | | –7.71 | | | | –2.84 | | | | –7.70 | | | | –2.84 | | | | –3.81 | | | | –1.64 | | | | –2.38 | | | | –1.84 | | |
| 5-year | | | 1.98 | | | | 0.78 | | | | 1.20 | | | | 0.81 | | | | 1.20 | | | | 1.20 | | | | 2.13 | | | | 1.71 | | | | 2.22 | | |
| Life | | | 7.66 | | | | 7.01 | | | | 6.85 | | | | 6.85 | | | | 6.84 | | | | 6.84 | | | | 7.74 | | | | 7.37 | | | | 7.93 | | |
The "with sales charge" returns include the maximum initial sales charge of 5.75% for Class A shares and the applicable contingent deferred sales charge of 5.00% in the first year, declining to 1.00% in the sixth year and eliminated thereafter for Class B shares and 1.00% for Class C shares for the first year only. The "without sales charge" returns do not include the effect of sales charges. If they had, returns would be lower.
Performance results reflect any fee waivers or reimbursements of fund expenses by Columbia Management Investment Advisers, LLC and/or any of its affiliates. Absent these fee waivers or expense reimbursement arrangements, performance results would have been lower.
All results shown assume reinvestment of distributions. Class I and Class Z shares are sold at net asset value with no distribution and service (Rule 12b-1) fees. Class R shares are sold at net asset value with a distribution (12b-1) fee. Class I shares, Class R shares and Class Z shares have limited eligibility and the investment minimum requirements may vary. Please see the fund's prospectuses for details. Performance for different share classes will vary based on differences in sales charges and fees associated with each class.
The tables do not reflect the deduction of taxes that a shareholder may pay on fund distributions or on the redemption of fund shares.
*The returns shown for periods prior to the share class inception date (including returns since inception, which are since fund inception) include the returns of the fund's oldest share class. These returns are adjusted to reflect any higher class-related operating expenses of the newer share classes, as applicable. Please visit columbiamanagement.com/mutual-funds/appended-performance for more information.
2
Understanding Your Expenses – Columbia Small Cap Value Fund II
As an investor, you incur two types of costs. There are transaction costs, which generally include sales charges on purchases and may include redemption fees. There are also ongoing costs, which generally include management fees, distribution and service (Rule 12b-1) fees, and other fund expenses. The following information is intended to help you understand your ongoing costs (in dollars) of investing in the Fund and to help you compare these costs with the ongoing costs of investing in other mutual funds.
Analyzing your fund's expenses
To illustrate these ongoing costs, we have provided examples and calculated the expenses paid by investors in each share class of the Fund during the period. The actual and hypothetical information in the table is based on an initial investment of $1,000 at the beginning of the period indicated and held for the entire period. Expense information is calculated two ways and each method provides you with different information. The amount listed in the "Actual" column is calculated using the Fund's actual operating expenses and total return for the period. You may use the Actual information, together with the amount invested, to estimate the expenses that you paid over the period. Simply divide your account value by $1,000 (for example, an $8,600 account value divided by $1,000 = 8.6), then multiply the results by the expenses paid during the period under the Actual column. The amount listed in the "Hypothetical" column assumes a 5% annual rate of return before expenses (which is not the Fund's actual return) and then applies the Fund's actual expense ratio for the period to the hypothetical return. You should not use the hypothetical account values and expenses to estimate either your actual account balance at the end of the period or the expenses you paid during the period. See "Compare with other funds" below for details on how to use the hypothetical data.
Compare with other funds
Since all mutual funds are required to include the same hypothetical calculations about expenses in shareholder reports, you can use this information to compare the ongoing cost of investing in the Fund with other funds. To do so, compare the hypothetical example with the 5% hypothetical examples that appear in the shareholder reports of other funds. As you compare hypothetical examples of other funds, it is important to note that hypothetical examples are meant to highlight the ongoing costs of investing in a fund only and do not reflect any transaction costs, such as sales charges, or redemption or exchange fees. Therefore, the hypothetical calculations are useful in comparing ongoing costs only, and will not help you determine the relative total costs of owning different funds. If transaction costs were included in these calculations, your costs would be higher.
September 1, 2011 – February 29, 2012
| | | Account value at the
beginning of the period ($) | | Account value at the
end of the period ($) | | Expenses paid
during the period ($) | | Fund's annualized
expense ratio (%) | |
| | | Actual | | Hypothetical | | Actual | | Hypothetical | | Actual | | Hypothetical | | Actual | |
| Class A | | | 1,000.00 | | | | 1,000.00 | | | | 1,129.90 | | | | 1,018.30 | | | | 6.99 | | | | 6.62 | | | | 1.32 | | |
| Class B | | | 1,000.00 | | | | 1,000.00 | | �� | | 1,125.70 | | | | 1,014.57 | | | | 10.94 | | | | 10.37 | | | | 2.07 | | |
| Class C | | | 1,000.00 | | | | 1,000.00 | | | | 1,125.80 | | | | 1,014.57 | | | | 10.94 | | | | 10.37 | | | | 2.07 | | |
| Class I | | | 1,000.00 | | | | 1,000.00 | | | | 1,132.90 | | | | 1,020.69 | | | | 4.45 | | | | 4.22 | | | | 0.84 | | |
| Class R | | | 1,000.00 | | | | 1,000.00 | | | | 1,128.00 | | | | 1,017.11 | | | | 8.25 | | | | 7.82 | | | | 1.56 | | |
| Class Z | | | 1,000.00 | | | | 1,000.00 | | | | 1,131.50 | | | | 1,019.54 | | | | 5.67 | | | | 5.37 | | | | 1.07 | | |
Expenses paid during the period are equal to the annualized expense ratio for each class as indicated above, multiplied by the average account value over the period and then multiplied by the number of days in the Fund's most recent fiscal half year and divided by 366.
Expenses do not include fees and expenses incurred indirectly by the Fund from the underlying funds in which the Fund may invest (also referred to as "acquired funds"), including affiliated and non-affiliated pooled investments vehicles (including mutual funds and exchange traded funds).
Had Columbia Management Investment Advisers, LLC and/or certain of its affiliates not waived/reimbursed certain fees and expenses, account value at the end of the period would have been reduced.
3
Portfolio Managers' Report – Columbia Small Cap Value Fund II
Performance data quoted represents past performance and current performance may be lower or higher. Past performance is no guarantee of future results. The investment return and principal value will fluctuate so that shares, when redeemed, may be worth more or less than the original cost. Please visit www.columbiamanagement.com for daily and most recent month-end performance updates.
Net asset value per share
as of 02/29/12 ($)
| Class A | | | 14.44 | | |
| Class B | | | 13.70 | | |
| Class C | | | 13.69 | | |
| Class I | | | 14.54 | | |
| Class R | | | 14.36 | | |
| Class Z | | | 14.54 | | |
Distributions declared per share
03/01/11 – 02/29/12 ($)
| Class A | | | 0.02 | | |
| Class I | | | 0.08 | | |
| Class Z | | | 0.05 | | |
For the 12-month period that ended February 29, 2012, the fund's Class A shares returned –2.08% without sales charge. The fund held up better than its benchmark, the Russell 2000 Value Index, which return –2.72% for the same period. Security selection, which targeted small-cap companies with attractively valued stocks and improving earnings prospects, helped shore up performance in a difficult environment for small-cap stocks and more than offset the negative impact of certain sector allocations.
Market volatility rocked small-cap stocks
After a year of extreme volatility, small-cap stocks ended the 12-month reporting period modestly behind where they had started. The market was unsettled early in the period by unrest in the Middle East, a nuclear meltdown and tsunami disaster in Japan and a sovereign debt crisis in Europe. Concerns accelerated over the summer amid slowing global economic growth, Congress's inability to address the federal budget deficit and Standard & Poor's subsequent decision to downgrade U.S. debt. Against this backdrop, equity markets worldwide fell sharply in the third quarter, with small-cap stocks posting especially steep losses. Signs that the U.S. economy was improving and that Europe was taking steps to address its problems spurred a fourth-quarter market turnaround that extended into early 2012. Within the Russell 2000 Value Index, defensive utilities stocks posted the strongest returns, while energy stocks were down sharply.
Strong stock selection in consumer discretionary and consumer staples
The fund picked up the most ground versus the Russell index from stock picks in the consumer discretionary sector, where winners included Domino's Pizza and specialty retailer GNC Holdings (1.0% and 0.9% of net assets, respectively). Domino's stock moved sharply higher, driven by better-than-expected domestic and international same-store sales, robust overseas expansion and higher store traffic after a well-advertised upgrade of its pizza recipe. Shares of nutritional products company GNC also posted steep gains, buoyed by increased sales and improved merchandising. Security selection in the consumer staples sector contributed, with notable gains from investments in the personal products industry. The stock of personal care products company Nu Skin Enterprises (1.0% of net assets) advanced as increased global sales of new products boosted earnings.
Added gains from industrials and health care
Security selection in industrials further aided performance. Top contributors included United Rentals (1.0% of net assets), which rents out construction equipment and tools. Its shares benefited as economic uncertainty led more companies and contractors to rent equipment instead of buying it. Stock picks in the health care sector also aided performance. Standouts included managed health-care companies Wellcare Health Plans (1.1% of net assets) and HealthSpring, whose stocks benefited from growth in insured lives as more states looked for ways to control health-care costs. HealthSpring also benefited from being acquired by a larger competitor during the period.
4
Portfolio Managers' Report (continued) – Columbia Small Cap Value Fund II
Modest disappointments from materials, utilities and tech
The fund lost some ground from security selection within materials, where detractors included plastics manufacturer Georgia Gulf (position eliminated), whose business was pressured by continued weakness in the housing market. An underweight in utilities, where we did not find many stocks that met our valuation criteria, and an overweight in technology, one of the weaker performing sectors in the Russell 2000 Value Index, also hampered results. Elsewhere, detractors included hospital operators Kindred Healthcare and Vanguard Health Systems (0.5% of and 0.4% of net assets, respectively). Kindred suffered from cuts in Medicare reimbursement, while Vanguard was hurt by weaker-than-predicted hospital admissions. The stock of medical equipment company Invacare declined when the government's Food and Drug Administration criticized the company's manufacturing operations. We sold the position. In technology, specialty semiconductor chip manufacturer Silicon Image (0.5% of net assets) detracted, as investors shied away from higher volatility stocks.
Looking ahead
Going forward, the fund will continue to focus on undervalued stocks with strong underlying earnings prospects and improving operating performance. We remain especially interested in "out-of-the-limelight" companies that seem to have been overlooked by Wall Street research, companies that may be out of favor with investors and companies whose operating fundamentals are on a positive trajectory. The fund ended the period with overweights versus its Russell benchmark in technology and industrials and underweights in financials and utilities.
Portfolio characteristics and holdings are subject to change periodically and may not be representative of current characteristics and holdings. The outlook for this fund may differ from those presented for other Columbia Funds.
Equity securities are subject to stock market fluctuations that occur in response to economic and business developments.
Value stocks are stocks of companies that may have experienced adverse business or industry developments or may be subject to special risks that have caused the stocks to be out of favor. If the manager's assessment of a company's prospects is wrong, the price of its stock may not approach the value the manager has placed on it.
Stocks of small-cap companies pose special risks, including possible illiquidity and greater price volatility than stocks of larger, more established companies.
Portfolio Breakdown1
at 02/29/12 (%)
| Consumer Discretionary | | | 12.3 | | |
| Consumer Staples | | | 3.8 | | |
| Energy | | | 4.3 | | |
| Financials | | | 29.6 | | |
| Health Care | | | 5.8 | | |
| Industrials | | | 16.7 | | |
| Information Technology | | | 15.3 | | |
| Materials | | | 4.4 | | |
| Utilities | | | 4.2 | | |
| Exchange-Traded Funds | | | 1.5 | | |
| Other2 | | | 2.1 | | |
1Percentages indicated are based upon total investments (excluding Investments of Cash Collateral Received for Securities on Loan). The Fund's portfolio composition is subject to change.
2Includes investments in affiliated money market fund.
Top Ten Holdings1
at 02/29/12 (%)
| iShares Russell 2000 Index Fund | | | 1.5 | | |
| Cirrus Logic, Inc. | | | 1.2 | | |
| Hornbeck Offshore Services, Inc. | | | 1.2 | | |
| Key Energy Services, Inc. | | | 1.2 | | |
| Wabash National Corp. | | | 1.2 | | |
| CubeSmart | | | 1.2 | | |
| NeuStar, Inc., Class A | | | 1.2 | | |
| South Jersey Industries, Inc. | | | 1.1 | | |
| SVB Financial Group | | | 1.1 | | |
| Helen of Troy Ltd. | | | 1.1 | | |
1Percentages indicated are based upon total investments (excluding Investments of Cash Collateral Received for Securities on Loan and affiliated money market fund).
For further detail about these holdings, please refer to the section entitled "Portfolio of Investments."
Fund holdings are as of the date given, are subject to change at any time, and are not recommendations to buy or sell any security.
5
Portfolio of Investments – Columbia Small Cap Value Fund II
February 29, 2012
(Percentages represent value of investments compared to net assets)
| Issuer | | Shares | | Value | |
| Common Stocks 97.4% | |
| CONSUMER DISCRETIONARY 12.4% | |
| Auto Components 2.9% | |
| Cooper Tire & Rubber Co. | | | 510,000 | | | $ | 8,466,000 | | |
| Dana Holding Corp.(a)(b) | | | 1,075,000 | | | | 17,200,000 | | |
| Tenneco, Inc.(b) | | | 362,400 | | | | 13,952,400 | | |
| Tower International, Inc.(a)(b) | | | 1,000,000 | | | | 12,740,000 | | |
| Total | | | 52,358,400 | | |
| Diversified Consumer Services 1.7% | |
| Bridgepoint Education, Inc.(a)(b) | | | 700,000 | | | | 17,052,000 | | |
| Stewart Enterprises, Inc., Class A(a) | | | 2,250,000 | | | | 13,995,000 | | |
| Total | | | 31,047,000 | | |
| Hotels, Restaurants & Leisure 1.0% | |
| Domino's Pizza, Inc.(b) | | | 490,000 | | | | 18,845,400 | | |
| Household Durables 1.8% | |
| Helen of Troy Ltd.(a)(b) | | | 620,000 | | | | 20,150,000 | | |
| KB Home(a) | | | 1,050,000 | | | | 11,991,000 | | |
| Total | | | 32,141,000 | | |
| Specialty Retail 5.0% | |
| Express, Inc.(a)(b) | | | 575,000 | | | | 13,685,000 | | |
| Finish Line, Inc., Class A (The) | | | 625,000 | | | | 14,368,750 | | |
| Genesco, Inc.(b) | | | 275,000 | | | | 18,738,500 | | |
| GNC Holdings, Inc., Class A(a)(b) | | | 480,000 | | | | 15,537,600 | | |
| Pier 1 Imports, Inc.(a)(b) | | | 750,000 | | | | 12,877,500 | | |
| Sonic Automotive, Inc., Class A(a) | | | 875,000 | | | | 14,988,750 | | |
| Total | | | 90,196,100 | | |
| TOTAL CONSUMER DISCRETIONARY | | | 224,587,900 | | |
| CONSUMER STAPLES 3.9% | |
| Food & Staples Retailing 1.2% | |
| Andersons, Inc. (The) | | | 242,000 | | | | 10,427,780 | | |
| Ruddick Corp. | | | 300,000 | | | | 12,288,000 | | |
| Total | | | 22,715,780 | | |
| Food Products 1.7% | |
| Dean Foods Co.(b) | | | 1,300,000 | | | | 15,938,000 | | |
| Sanderson Farms, Inc.(a) | | | 285,000 | | | | 14,022,000 | | |
| Total | | | 29,960,000 | | |
| Personal Products 1.0% | |
| Nu Skin Enterprises, Inc., Class A(a) | | | 310,000 | | | | 17,905,600 | | |
| TOTAL CONSUMER STAPLES | | | 70,581,380 | | |
| ENERGY 4.3% | |
| Energy Equipment & Services 3.1% | |
| Hornbeck Offshore Services, Inc.(a)(b) | | | 525,000 | | | | 21,393,750 | | |
| Key Energy Services, Inc.(a)(b) | | | 1,250,000 | | | | 21,325,000 | | |
| Oil States International, Inc.(b) | | | 160,000 | | | | 12,995,200 | | |
| Total | | | 55,713,950 | | |
| Oil, Gas & Consumable Fuels 1.2% | |
| Renewable Energy Group, Inc.(b) | | | 659,100 | | | | 6,307,587 | | |
| Swift Energy Co.(b) | | | 545,000 | | | | 16,366,350 | | |
| Total | | | 22,673,937 | | |
| TOTAL ENERGY | | | 78,387,887 | | |
| Issuer | | Shares | | Value | |
| Common Stocks (continued) | |
| FINANCIALS 29.9% | |
| Capital Markets 0.6% | |
| Apollo Investment Corp.(a) | | | 757,289 | | | $ | 5,316,169 | | |
| Medley Capital Corp. | | | 497,337 | | | | 5,495,574 | | |
| Total | | | 10,811,743 | | |
| Commercial Banks 11.1% | |
| Community Bank System, Inc.(a) | | | 730,000 | | | | 19,943,600 | | |
| East West Bancorp, Inc. | | | 790,000 | | | | 17,474,800 | | |
| FNB Corp.(a) | | | 1,600,000 | | | | 18,864,000 | | |
| Iberiabank Corp.(a) | | | 310,000 | | | | 16,442,400 | | |
| Independent Bank Corp.(a) | | | 610,000 | | | | 16,768,900 | | |
| Prosperity Bancshares, Inc.(a) | | | 410,000 | | | | 17,933,400 | | |
| Sandy Spring Bancorp, Inc.(a) | | | 659,161 | | | | 11,904,448 | | |
| Sterling Bancorp(c) | | | 1,725,824 | | | | 15,359,833 | | |
| Susquehanna Bancshares, Inc.(a) | | | 1,008,786 | | | | 9,351,446 | | |
| SVB Financial Group(b) | | | 340,000 | | | | 20,155,200 | | |
| Texas Capital Bancshares, Inc.(a)(b) | | | 545,000 | | | | 18,470,050 | | |
| Umpqua Holdings Corp. | | | 1,450,000 | | | | 17,864,000 | | |
| Total | | | 200,532,077 | | |
| Insurance 6.4% | |
| Alterra Capital Holdings Ltd.(a) | | | 620,000 | | | | 14,235,200 | | |
| American Equity Investment Life Holding Co. | | | 780,000 | | | | 9,438,000 | | |
| AMERISAFE, Inc.(a)(b) | | | 660,000 | | | | 14,889,600 | | |
| Amtrust Financial Services, Inc.(a) | | | 500,900 | | | | 13,529,309 | | |
| Argo Group International Holdings Ltd. | | | 355,365 | | | | 10,607,645 | | |
| Delphi Financial Group, Inc., Class A | | | 325,000 | | | | 14,482,000 | | |
| National Financial Partners Corp.(a)(b) | | | 1,150,000 | | | | 17,549,000 | | |
| Platinum Underwriters Holdings Ltd.(a) | | | 235,000 | | | | 8,356,600 | | |
| Symetra Financial Corp. | | | 1,300,000 | | | | 12,922,000 | | |
| Total | | | 116,009,354 | | |
| Real Estate Investment Trusts (REITs) 9.4% | |
| American Assets Trust, Inc. | | | 800,000 | | | | 17,216,000 | | |
| BioMed Realty Trust, Inc.(a) | | | 875,000 | | | | 16,117,500 | | |
| Brandywine Realty Trust(a) | | | 950,000 | | | | 10,269,500 | | |
| Capstead Mortgage Corp. | | | 660,000 | | | | 8,778,000 | | |
| CBL & Associates Properties, Inc.(a) | | | 600,000 | | | | 10,578,000 | | |
| CubeSmart(a) | | | 1,850,000 | | | | 20,868,000 | | |
| First Industrial Realty Trust, Inc.(a)(b) | | | 1,300,000 | | | | 15,366,000 | | |
| Highwoods Properties, Inc.(a) | | | 300,000 | | | | 9,600,000 | | |
| Kilroy Realty Corp.(a) | | | 410,000 | | | | 17,974,400 | | |
| LaSalle Hotel Properties(a) | | | 670,000 | | | | 17,875,600 | | |
| MFA Financial, Inc. | | | 1,050,000 | | | | 7,665,000 | | |
| Mid-America Apartment Communities, Inc.(a) | | | 145,000 | | | | 9,043,650 | | |
| Omega Healthcare Investors, Inc.(a) | | | 425,000 | | | | 8,657,250 | | |
| Total | | | 170,008,900 | | |
| Thrifts & Mortgage Finance 2.4% | |
| Flushing Financial Corp.(a) | | | 600,000 | | | | 7,770,000 | | |
| Northwest Bancshares, Inc.(a) | | | 1,350,000 | | | | 17,037,000 | | |
| Oritani Financial Corp.(a) | | | 859,933 | | | | 11,204,927 | | |
| Radian Group, Inc.(a) | | | 2,050,000 | | | | 7,769,500 | | |
| Total | | | 43,781,427 | | |
| TOTAL FINANCIALS | | | 541,143,501 | | |
The Accompanying Notes to Financial Statements are an integral part of this statement.
6
Columbia Small Cap Value Fund II
February 29, 2012
(Percentages represent value of investments compared to net assets)
| Issuer | | Shares | | Value | |
| Common Stocks (continued) | |
| HEALTH CARE 5.9% | |
| Health Care Equipment & Supplies 2.3% | |
| CONMED Corp.(a)(b) | | | 565,000 | | | $ | 16,859,600 | | |
| Cooper Companies, Inc. (The) | | | 135,000 | | | | 10,729,800 | | |
| ICU Medical, Inc.(b) | | | 313,000 | | | | 14,360,440 | | |
| Total | | | 41,949,840 | | |
| Health Care Providers & Services 3.6% | |
| Centene Corp.(b) | | | 370,000 | | | | 18,056,000 | | |
| Kindred Healthcare, Inc.(b) | | | 950,000 | | | | 9,775,500 | | |
| Metropolitan Health Networks, Inc.(a)(b) | | | 1,026,116 | | | | 8,578,330 | | |
| Vanguard Health Systems, Inc.(b) | | | 800,000 | | | | 7,968,000 | | |
| WellCare Health Plans, Inc.(b) | | | 290,000 | | | | 19,679,400 | | |
| Total | | | 64,057,230 | | |
| TOTAL HEALTH CARE | | | 106,007,070 | | |
| INDUSTRIALS 16.9% | |
| Air Freight & Logistics 0.3% | |
| Pacer International, Inc.(b) | | | 791,914 | | | | 4,371,365 | | |
| Airlines 1.0% | |
| Alaska Air Group, Inc.(b) | | | 190,000 | | | | 13,028,300 | | |
| U.S. Airways Group, Inc.(a)(b) | | | 650,000 | | | | 4,816,500 | | |
| Total | | | 17,844,800 | | |
| Building Products 0.6% | |
| USG Corp.(a)(b) | | | 750,000 | | | | 10,687,500 | | |
| Commercial Services & Supplies 4.0% | |
| Cenveo, Inc.(a)(b) | | | 2,300,000 | | | | 8,970,000 | | |
| Deluxe Corp.(a) | | | 786,088 | | | | 19,392,791 | | |
| Geo Group, Inc. (The)(a)(b) | | | 565,000 | | | | 9,949,650 | | |
| Progressive Waste Solutions Ltd. | | | 450,000 | | | | 9,216,000 | | |
| TMS International Corp., Class A(b)(c) | | | 936,500 | | | | 11,144,350 | | |
| United Stationers, Inc. | | | 489,952 | | | | 14,228,206 | | |
| Total | | | 72,900,997 | | |
| Construction & Engineering 0.5% | |
| EMCOR Group, Inc. | | | 325,000 | | | | 9,035,000 | | |
| Electrical Equipment 0.6% | |
| Brady Corp., Class A | | | 342,336 | | | | 10,937,635 | | |
| Machinery 2.8% | |
| Robbins & Myers, Inc. | | | 310,000 | | | | 15,131,100 | | |
| Trinity Industries, Inc. | | | 435,000 | | | | 15,120,600 | | |
| Wabash National Corp.(a)(b) | | | 2,000,000 | | | | 21,120,000 | | |
| Total | | | 51,371,700 | | |
| Professional Services 1.1% | |
| CBIZ, Inc.(a)(b) | | | 663,000 | | | | 4,309,500 | | |
| Navigant Consulting, Inc.(a)(b) | | | 1,200,000 | | | | 16,212,000 | | |
| Total | | | 20,521,500 | | |
| Road & Rail 1.6% | |
| Swift Transportation Co.(b) | | | 900,000 | | | | 10,548,000 | | |
| Werner Enterprises, Inc.(a) | | | 740,000 | | | | 17,922,800 | | |
| Total | | | 28,470,800 | | |
| Trading Companies & Distributors 4.4% | |
| Beacon Roofing Supply, Inc.(a)(b) | | | 740,000 | | | | 17,449,200 | | |
| Houston Wire & Cable Co.(c) | | | 935,000 | | | | 13,277,000 | | |
| Textainer Group Holdings Ltd.(a) | | | 525,000 | | | | 17,440,500 | | |
| Issuer | | Shares | | Value | |
| Common Stocks (continued) | |
| INDUSTRIALS (cont.) | |
| Trading Companies & Distributors (cont.) | |
| Titan Machinery, Inc.(a)(b) | | | 463,765 | | | $ | 12,146,006 | | |
| United Rentals, Inc.(a)(b) | | | 450,000 | | | | 18,756,000 | | |
| Total | | | 79,068,706 | | |
| TOTAL INDUSTRIALS | | | 305,210,003 | | |
| INFORMATION TECHNOLOGY 15.5% | |
| Communications Equipment 0.8% | |
| Ciena Corp.(a)(b) | | | 1,000,000 | | | | 14,920,000 | | |
| Electronic Equipment, Instruments & Components 4.1% | |
| Anixter International, Inc.(b) | | | 250,000 | | | | 17,385,000 | | |
| Brightpoint, Inc.(a)(b) | | | 1,050,000 | | | | 9,240,000 | | |
| Elster Group SE, ADR(a)(b) | | | 1,150,000 | | | | 16,571,500 | | |
| Rofin-Sinar Technologies, Inc.(a)(b) | | | 478,119 | | | | 11,216,672 | | |
| Rogers Corp.(a)(b) | | | 310,000 | | | | 11,497,900 | | |
| TTM Technologies, Inc.(a)(b) | | | 725,000 | | | | 8,489,750 | | |
| Total | | | 74,400,822 | | |
| Internet Software & Services 0.9% | |
| Saba Software, Inc.(a)(b)(c) | | | 1,375,000 | | | | 16,115,000 | | |
| IT Services 2.8% | |
| Cardtronics, Inc.(b) | | | 600,000 | | | | 15,954,000 | | |
| Global Cash Access Holdings, Inc.(b) | | | 2,505,000 | | | | 13,927,800 | | |
| NeuStar, Inc., Class A(b) | | | 589,165 | | | | 20,650,233 | | |
| Total | | | 50,532,033 | | |
| Semiconductors & Semiconductor Equipment 5.5% | |
| Cirrus Logic, Inc.(b) | | | 940,000 | | | | 22,165,200 | | |
Fairchild Semiconductor International,
Inc.(a)(b) | | | 700,000 | | | | 10,213,000 | | |
| IXYS Corp.(a)(b) | | | 1,100,000 | | | | 13,123,000 | | |
| Kulicke & Soffa Industries, Inc.(b) | | | 1,200,000 | | | | 13,512,000 | | |
| Micrel, Inc.(a) | | | 1,000,000 | | | | 10,670,000 | | |
| Silicon Image, Inc.(a)(b) | | | 1,900,000 | | | | 9,823,000 | | |
| Standard Microsystems Corp.(a)(b) | | | 535,056 | | | | 13,692,083 | | |
| Ultra Clean Holdings(a)(b) | | | 735,841 | | | | 6,011,821 | | |
| Total | | | 99,210,104 | | |
| Software 1.4% | |
| EPIQ Systems, Inc. | | | 771,700 | | | | 8,866,833 | | |
| Mentor Graphics Corp.(b) | | | 1,075,000 | | | | 16,297,000 | | |
| Total | | | 25,163,833 | | |
| TOTAL INFORMATION TECHNOLOGY | | | 280,341,792 | | |
| MATERIALS 4.4% | |
| Containers & Packaging 0.7% | |
| Boise, Inc. | | | 1,523,093 | | | | 12,535,055 | | |
| Metals & Mining 2.1% | |
| Metals U.S.A. Holdings Corp.(b) | | | 1,000,000 | | | | 13,080,000 | | |
| RTI International Metals, Inc.(a)(b) | | | 444,192 | | | | 10,012,088 | | |
| Schnitzer Steel Industries, Inc., Class A(a) | | | 340,000 | | | | 15,354,400 | | |
| Total | | | 38,446,488 | | |
| Paper & Forest Products 1.6% | |
| Neenah Paper, Inc.(a) | | | 435,000 | | | | 12,132,150 | | |
| Schweitzer-Mauduit International, Inc. | | | 250,000 | | | | 17,512,500 | | |
| Total | | | 29,644,650 | | |
| TOTAL MATERIALS | | | 80,626,193 | | |
The Accompanying Notes to Financial Statements are an integral part of this statement.
7
Columbia Small Cap Value Fund II
February 29, 2012
(Percentages represent value of investments compared to net assets)
| Issuer | | Shares | | Value | |
| Common Stocks (continued) | |
| UTILITIES 4.2% | |
| Electric Utilities 1.1% | |
| UIL Holdings Corp.(a) | | | 550,000 | | | $ | 19,387,500 | | |
| Gas Utilities 2.2% | |
| New Jersey Resources Corp.(a) | | | 430,000 | | | | 20,076,700 | | |
| South Jersey Industries, Inc.(a) | | | 391,696 | | | | 20,368,192 | | |
| Total | | | 40,444,892 | | |
| Multi-Utilities 0.9% | |
| Avista Corp.(a) | | | 655,000 | | | | 16,178,500 | | |
| TOTAL UTILITIES | | | 76,010,892 | | |
Total Common Stocks
(Cost: $1,403,454,513) | | $ | 1,762,896,618 | | |
| Exchange-Traded Funds 1.5% | |
| iShares Russell 2000 Index Fund(a) | | | 340,000 | | | $ | 27,536,600 | | |
Total Exchange-Traded Funds
(Cost: $27,883,400) | | $ | 27,536,600 | | |
| Money Market Funds 2.1% | |
| Columbia Short-Term Cash Fund, 0.166%(d) | | | 38,239,245 | | | $ | 38,239,245 | | |
Total Money Market Funds
(Cost: $38,239,245) | | $ | 38,239,245 | | |
| Issuer | | Effective
Yield | | Par/
Principal/
Shares | | Value | |
| Investments of Cash Collateral Received for Securities on Loan 19.8% | |
| Asset-Backed Commercial Paper 1.9% | |
Atlantis One
04/11/12 | | | 0.511 | % | | $ | 4,993,554 | | | $ | 4,993,554 | | |
| 08/01/12 | | | 0.662 | % | | | 4,983,317 | | | | 4,983,317 | | |
KELLS FUNDING, LLC
04/13/12 | | | 0.581 | % | | | 9,985,016 | | | | 9,985,016 | | |
Regency Markets No. 1 LLC
03/19/12 | | | 0.200 | % | | | 4,999,139 | | | | 4,999,139 | | |
Rheingold Securitization
03/08/12 | | | 0.590 | % | | | 4,998,853 | | | | 4,998,853 | | |
| 03/09/12 | | | 0.570 | % | | | 4,999,129 | | | | 4,999,129 | | |
| Total | | | 34,959,008 | | |
| Certificates of Deposit 7.0% | |
Bank of Nova Scotia
05/03/12 | | | 0.394 | % | | | 10,000,000 | | | | 10,000,000 | | |
| 07/26/12 | | | 0.324 | % | | | 6,000,000 | | | | 6,000,000 | | |
Barclays Bank PLC
04/18/12 | | | 0.600 | % | | | 10,000,000 | | | | 10,000,000 | | |
Canadian Imperial Bank
03/21/12 | | | 0.291 | % | | | 8,000,799 | | | | 8,000,799 | | |
Credit Suisse
03/20/12 | | | 0.590 | % | | | 8,000,000 | | | | 8,000,000 | | |
Mitsubishi UFJ Trust and Banking Corp.
05/31/12 | | | 0.390 | % | | | 10,000,128 | | | | 10,000,128 | | |
| Issuer | | Effective
Yield | | Par/
Principal/
Shares | | Value | |
| Investments of Cash Collateral Received for Securities on Loan (continued) | |
| Certificates of Deposit (cont.) | |
National Australia Bank
04/30/12 | | | 0.394 | % | | $ | 8,000,000 | | | $ | 8,000,000 | | |
National Bank of Canada
05/08/12 | | | 0.410 | % | | | 9,000,000 | | | | 9,000,000 | | |
Nordea Bank AB
03/13/12 | | | 0.520 | % | | | 5,000,000 | | | | 5,000,000 | | |
Norinchukin Bank
05/21/12 | | | 0.470 | % | | | 7,000,000 | | | | 7,000,000 | | |
Rabobank
03/16/12 | | | 0.530 | % | | | 9,986,621 | | | | 9,986,621 | | |
Skandinaviska Enskilda Banken
03/19/12 | | | 0.410 | % | | | 5,000,000 | | | | 5,000,000 | | |
Standard Chartered Bank PLC
03/30/12 | | | 0.625 | % | | | 9,984,226 | | | | 9,984,226 | | |
| 04/03/12 | | | 0.570 | % | | | 5,000,000 | | | | 5,000,000 | | |
Union Bank of Switzerland
03/02/12 | | | 0.530 | % | | | 10,000,000 | | | | 10,000,000 | | |
United Overseas Bank Ltd.
03/16/12 | | | 0.250 | % | | | 5,000,000 | | | | 5,000,000 | | |
| Total | | | 125,971,774 | | |
| Commercial Paper 6.5% | |
Australia and New Zealand Bank Group, Ltd.
04/25/12 | | | 0.461 | % | | | 9,976,617 | | | | 9,976,617 | | |
Caisse d'Amortissement de la Dette Sociale
05/02/12 | | | 0.671 | % | | | 9,983,064 | | | | 9,983,064 | | |
DnB NOR
04/10/12 | | | 0.521 | % | | | 4,993,139 | | | | 4,993,139 | | |
| 08/30/12 | | | — | | | | 5,000,000 | | | | 5,000,000 | | |
Foreningsparbanken (Swedbank)
03/20/12 | | | 0.440 | % | | | 4,996,333 | | | | 4,996,333 | | |
| 03/21/12 | | | 0.425 | % | | | 4,996,813 | | | | 4,996,813 | | |
HSBC Bank PLC
04/13/12 | | | 0.481 | % | | | 9,975,600 | | | | 9,975,600 | | |
Nordea Bank AB
07/24/12 | | | 0.627 | % | | | 6,977,882 | | | | 6,977,882 | | |
Skandinaviska Enskilda Banken AB
05/03/12 | | | 0.350 | % | | | 4,996,840 | | | | 4,996,840 | | |
Societe Generale
03/06/12 | | | 0.320 | % | | | 6,999,565 | | | | 6,999,565 | | |
Suncorp Metway Ltd.
03/19/12 | | | 0.480 | % | | | 4,995,933 | | | | 4,995,933 | | |
| 04/11/12 | | | 0.480 | % | | | 9,991,600 | | | | 9,991,600 | | |
Svenska Handelsbank
03/29/12 | | | 0.506 | % | | | 4,993,617 | | | | 4,993,617 | | |
The Commonwealth Bank of Australia
04/23/12 | | | 0.451 | % | | | 4,988,438 | | | | 4,988,438 | | |
| 08/16/12 | | | 0.308 | % | | | 7,000,000 | | | | 7,000,000 | | |
Toyota Motor Credit Corp.
04/26/12 | | | 0.562 | % | | | 6,979,964 | | | | 6,979,964 | | |
Westpac Securities NZ Ltd.
04/20/12 | | | 0.531 | % | | | 9,973,058 | | | | 9,973,058 | | |
| Total | | | 117,818,463 | | |
| Repurchase Agreements 4.4% | |
Citibank NA
dated 02/29/12, matures 03/01/12,
repurchase price $10,000,053(e)
| | | 0.190 | % | | | 10,000,000 | | | | 10,000,000 | | |
The Accompanying Notes to Financial Statements are an integral part of this statement.
8
Columbia Small Cap Value Fund II
February 29, 2012
(Percentages represent value of investments compared to net assets)
| Issuer | | Effective
Yield | | Par/
Principal/
Shares | | Value | |
| Investments of Cash Collateral Received for Securities on Loan (continued) | |
| Repurchase Agreements (cont.) | |
Citigroup Global Markets, Inc.
dated 02/29/12, matures 03/01/12,
repurchase price $10,000,036(e)
| | | 0.130 | % | | $ | 10,000,000 | | | $ | 10,000,000 | | |
Credit Suisse Securities (USA) LLC
dated 02/29/12, matures 03/01/12,
repurchase price $13,962,464(e)
| | | 0.160 | % | | | 13,962,402 | | | | 13,962,402 | | |
Morgan Stanley
dated 02/29/12, matures 03/01/12,
repurchase price $5,000,025(e)
| | | 0.180 | % | | | 5,000,000 | | | | 5,000,000 | | |
RBS Securities, Inc.
dated 02/29/12, matures 03/01/12,
repurchase price $20,000,083(e)
| | | 0.150 | % | | | 20,000,000 | | | | 20,000,000 | | |
| Issuer | | Effective
Yield | | Par/
Principal/
Shares | | Value | |
| Investments of Cash Collateral Received for Securities on Loan (continued) | |
| Repurchase Agreements (cont.) | |
Societe Generale
dated 02/29/12, matures 03/01/12,
repurchase price $20,000,111(e)
| | | 0.200 | % | | $ | 20,000,000 | | | $ | 20,000,000 | | |
| Total | | | 78,962,402 | | |
Total Investments of Cash Collateral Received for Securities
on Loan
(Cost: $357,711,647) | | $ | 357,711,647 | | |
Total Investments
(Cost: $1,827,288,805) | | | | | | | | | | $ | 2,186,384,110 | | |
| Other Assets & Liabilities, Net | | | | | | | | | | | (376,820,245 | ) | |
| Net Assets | | $ | 1,809,563,865 | | |
| Notes to Portfolio of Investments | |
(a) At February 29, 2012, security was partially or fully on loan.
(b) Non-income producing.
(c) Investments in affiliates during the year ended February 29, 2012:
| Issuer | | Beginning
Cost | | Purchase
Cost | | Sales Cost/
Proceeds
from Sales | | Realized
Gain/Loss | | Ending
Cost | | Dividends
or Interest
Income | | Value | |
| Columbia Short-Term Cash Fund | | $ | — | | | $ | 321,837,273 | | | $ | (283,598,028 | ) | | $ | — | | | $ | 38,239,245 | | | $ | 42,239 | | | $ | 38,239,245 | | |
| Houston Wire & Cable Co.* | | | 13,343,463 | | | | 1,139,133 | | | | — | | | | — | | | | 14,482,596 | | | | 252,450 | | | | 13,277,000 | | |
| Saba Software, Inc.* | | | — | | | | 14,654,989 | | | | (3,201,726 | ) | | | 471,303 | | | | 11,924,566 | | | | — | | | | 16,115,000 | | |
| Sterling Bancorp* | | | 15,818,637 | | | | 1,687,910 | | | | — | | | | — | | | | 17,506,547 | | | | 310,648 | | | | 15,359,834 | | |
| Tower International Inc. | | | 11,802,025 | | | | 1,606,446 | | | | — | | | | — | | | | 13,408,471 | | | | — | | | | 12,740,000 | | |
| Total | | $ | 40,964,125 | | | $ | 340,925,751 | | | $ | (286,799,754 | ) | | $ | 471,303 | | | $ | 95,561,425 | | | $ | 605,337 | | | $ | 95,731,079 | | |
* Issuer was not an affiliate for the entire period ended February 29, 2012.
(d) The rate shown is the seven-day current annualized yield at February 29, 2012.
(e) The table below represents securities received as collateral for repurchase agreements. This collateral is deposited with the Fund's custodian and, pursuant to the terms of the repurchase agreement, must have an aggregate market value greater than or equal to the repurchase price plus accrued interest at all times. The value of securities and/or cash held as collateral for repurchase agreements is monitored on a daily basis to ensure the proper level of collateral.
Citibank NA (0.190%)
| Security Description | | Value | |
| Fannie Mae REMICS | | $ | 4,263,555 | | |
| Freddie Mac REMICS | | | 4,283,165 | | |
| Government National Mortgage Association | | | 1,653,280 | | |
| Total Market Value of Collateral Securities | | $ | 10,200,000 | | |
The Accompanying Notes to Financial Statements are an integral part of this statement.
9
Columbia Small Cap Value Fund II
February 29, 2012
| Notes to Portfolio of Investments (continued) | |
Citigroup Global Markets, Inc. (0.130%)
| Security Description | | Value | |
| Fannie Mae REMICS | | $ | 4,785,468 | | |
| Fannie Mae-Aces | | | 529,857 | | |
| Freddie Mac REMICS | | | 3,838,826 | | |
| Government National Mortgage Association | | | 1,045,849 | | |
| Total Market Value of Collateral Securities | | $ | 10,200,000 | | |
Credit Suisse Securities (USA) LLC (0.160%)
| Security Description | | Value | |
| Ginnie Mae I Pool | | $ | 9,995,723 | | |
| Ginnie Mae II Pool | | | 4,245,960 | | |
| Total Market Value of Collateral Securities | | $ | 14,241,683 | | |
Morgan Stanley (0.180%)
| Security Description | | Value | |
| Freddie Mac Gold Pool | | $ | 2,725,246 | | |
| Freddie Mac Non Gold Pool | | | 2,374,754 | | |
| Total Market Value of Collateral Securities | | $ | 5,100,000 | | |
RBS Securities, Inc. (0.150%)
| Security Description | | Value | |
| United States Treasury Inflation Indexed Bonds | | $ | 4,525,642 | | |
| United States Treasury Strip Coupon | | | 13,777,402 | | |
| United States Treasury Strip Principal | | | 2,096,985 | | |
| Total Market Value of Collateral Securities | | $ | 20,400,029 | | |
Societe Generale (0.200%)
| Security Description | | Value | |
| Fannie Mae REMICS | | $ | 3,122,521 | | |
| Freddie Mac REMICS | | | 5,320,026 | | |
| Freddie Mac Strips | | | 540,250 | | |
| Government National Mortgage Association | | | 11,417,203 | | |
| Total Market Value of Collateral Securities | | $ | 20,400,000 | | |
Abbreviation Legend
ADR American Depositary Receipt
Fair Value Measurements
Generally accepted accounting principles (GAAP) require disclosure regarding the inputs and valuation techniques used to measure fair value and any changes in valuation inputs or techniques. In addition, investments shall be disclosed by major category.
The Fund categorizes its fair value measurements according to a three-level hierarchy that maximizes the use of observable inputs and minimizes the use of unobservable inputs by prioritizing that the most observable input be used when available. Observable inputs are those that market participants would use in pricing an investment based on market data obtained from sources independent of the reporting entity. Unobservable inputs are those that reflect the Fund's assumptions about the information market participants would use in pricing an investment. An investment's level within the fair value hierarchy is based on the lowest level of any input that is deemed significant to the asset or liability's fair value measurement. The input levels are not necessarily an indication of the risk or liquidity associated with investments at that level. For example, certain U.S. government securities are generally high quality and liquid, however, they are reflected as Level 2 because the inputs used to determine fair value may not always be quoted prices in an active market.
The Accompanying Notes to Financial Statements are an integral part of this statement.
10
Columbia Small Cap Value Fund II
February 29, 2012
| Fair Value Measurements (continued) | |
Fair value inputs are summarized in the three broad levels listed below:
• Level 1 — Valuations based on quoted prices for investments in active markets that the Fund has the ability to access at the measurement date (including NAV for open-end mutual funds). Valuation adjustments are not applied to Level 1 investments.
• Level 2 — Valuations based on other significant observable inputs (including quoted prices for similar securities, interest rates, prepayment speeds, credit risks, etc.).
• Level 3 — Valuations based on significant unobservable inputs (including the Fund's own assumptions and judgment in determining the fair value of investments).
Inputs that are used in determining fair value of an investment may include price information, credit data, volatility statistics, and other factors. These inputs can be either observable or unobservable. The availability of observable inputs can vary between investments, and is affected by various factors such as the type of investment, and the volume and level of activity for that investment or similar investments in the marketplace. The inputs will be considered by the Investment Manager, along with any other relevant factors in the calculation of an investment's fair value. The Fund uses prices and inputs that are current as of the measurement date, which may include periods of market dislocations. During these periods, the availability of prices and inputs may be reduced for many investments. This condition could cause an investment to be reclassified between the various levels within the hierarchy.
Investments falling into the Level 3 category are primarily supported by quoted prices from brokers and dealers participating in the market for those investments. However, these may be classified as Level 3 investments due to lack of market transparency and corroboration to support these quoted prices. Additionally, valuation models may be used as the pricing source for any remaining investments classified as Level 3. These models rely on one or more significant unobservable inputs and/or significant assumptions by the Investment Manager. Inputs used in valuations may include, but are not limited to, financial statement analysis, capital account balances, discount rates and estimated cash flows, and comparable company data.
The following table is a summary of the inputs used to value the Fund's investments as of February 29, 2012:
| | | Fair value at February 29, 2012 | |
| Description(a) | | Level 1
Quoted Prices
in Active
Markets for
Identical Assets(b) | | Level 2
Other
Significant
Observable
Inputs | | Level 3
Significant
Unobservable
Inputs | | Total | |
| Equity Securities | |
| Common Stocks | |
| Consumer Discretionary | | $ | 224,587,900 | | | $ | — | | | $ | — | | | $ | 224,587,900 | | |
| Consumer Staples | | | 70,581,380 | | | | — | | | | — | | | | 70,581,380 | | |
| Energy | | | 78,387,887 | | | | — | | | | — | | | | 78,387,887 | | |
| Financials | | | 541,143,501 | | | | — | | | | — | | | | 541,143,501 | | |
| Health Care | | | 106,007,070 | | | | — | | | | — | | | | 106,007,070 | | |
| Industrials | | | 305,210,003 | | | | — | | | | — | | | | 305,210,003 | | |
| Information Technology | | | 280,341,792 | | | | — | | | | — | | | | 280,341,792 | | |
| Materials | | | 80,626,193 | | | | — | | | | — | | | | 80,626,193 | | |
| Utilities | | | 76,010,892 | | | | — | | | | — | | | | 76,010,892 | | |
| Total Equity Securities | | | 1,762,896,618 | | | | — | | | | — | | | | 1,762,896,618 | | |
| Other | |
| Exchange-Traded Funds | | | 27,536,600 | | | | — | | | | — | | | | 27,536,600 | | |
| Money Market Funds | | | 38,239,245 | | | | — | | | | — | | | | 38,239,245 | | |
Investments of Cash Collateral
Received for Securities on Loan | | | — | | | | 357,711,647 | | | | — | | | | 357,711,647 | | |
| Total Other | | | 65,775,845 | | | | 357,711,647 | | | | — | | | | 423,487,492 | | |
| Total | | $ | 1,828,672,463 | | | $ | 357,711,647 | | | $ | — | | | $ | 2,186,384,110 | | |
The Fund's assets assigned to the Level 2 input category are generally valued using the market approach, in which a security's value is determined through reference to prices and information from market transactions for similar or identical assets.
(a) See the Portfolio of Investments for all investment classifications not indicated in the table.
(b) There were no significant transfers between Levels 1 and 2 during the period.
The Accompanying Notes to Financial Statements are an integral part of this statement.
11
Statement of Assets and Liabilities – Columbia Small Cap Value Fund II
February 29, 2012
| Assets | |
| Investments, at value* | |
| Unaffiliated issuers (identified cost $1,374,015,733) | | $ | 1,732,941,384 | | |
| Affiliated issuers (identified cost $95,561,425) | | | 95,731,079 | | |
| Investment of cash collateral received for securities on loan | |
| Short-term securities (identified cost $278,749,245) | | | 278,749,245 | | |
| Repurchase agreements (identified cost $78,962,402) | | | 78,962,402 | | |
| Total investments (identified cost $1,827,288,805) | | | 2,186,384,110 | | |
| Receivable for: | |
| Investments sold | | | 11,490,414 | | |
| Capital shares sold | | | 2,617,821 | | |
| Dividends | | | 1,584,541 | | |
| Interest | | | 171,193 | | |
| Expense reimbursement due from Investment Manager | | | 15,328 | | |
| Prepaid expense | | | 25,071 | | |
| Total assets | | | 2,202,288,478 | | |
| Liabilities | |
| Due upon return of securities on loan | | | 357,711,647 | | |
| Payable for: | |
| Investments purchased | | | 22,267,199 | | |
| Capital shares purchased | | | 12,187,866 | | |
| Investment management fees | | | 37,110 | | |
| Distribution and service fees | | | 4,485 | | |
| Transfer agent fees | | | 332,520 | | |
| Administration fees | | | 3,731 | | |
| Chief compliance officer expenses | | | 333 | | |
| Other expenses | | | 179,722 | | |
| Total liabilities | | | 392,724,613 | | |
| Net assets applicable to outstanding capital stock | | $ | 1,809,563,865 | | |
The Accompanying Notes to Financial Statements are an integral part of this statement.
12
Statement of Assets and Liabilities (continued) – Columbia Small Cap Value Fund II
February 29, 2012
| Represented by | |
| Paid-in capital | | $ | 1,550,335,047 | | |
| Undistributed net investment income | | | 300,087 | | |
| Accumulated net realized loss | | | (100,166,574 | ) | |
| Unrealized appreciation (depreciation) on: | |
| Investments | | | 359,095,305 | | |
| Total — representing net assets applicable to outstanding capital stock | | $ | 1,809,563,865 | | |
| *Value of securities on loan | | $ | 345,596,107 | | |
| Net assets applicable to outstanding shares | |
| Class A | | $ | 525,941,096 | | |
| Class B | | $ | 2,337,320 | | |
| Class C | | $ | 18,190,666 | | |
| Class I | | $ | 12,054,555 | | |
| Class R | | $ | 20,080,675 | | |
| Class Z | | $ | 1,230,959,553 | | |
| Shares outstanding | |
| Class A | | | 36,427,610 | | |
| Class B | | | 170,599 | | |
| Class C | | | 1,328,702 | | |
| Class I | | | 828,928 | | |
| Class R | | | 1,398,229 | | |
| Class Z | | | 84,658,636 | | |
| Net asset value per share | |
| Class A(a) | | $ | 14.44 | | |
| Class B | | $ | 13.70 | | |
| Class C | | $ | 13.69 | | |
| Class I | | $ | 14.54 | | |
| Class R | | $ | 14.36 | | |
| Class Z | | $ | 14.54 | | |
(a) The maximum offering price per share for Class A is $15.32. The offering price is calculated by dividing the net asset value by 1.0 minus the maximum sales charge of 5.75%.
The Accompanying Notes to Financial Statements are an integral part of this statement.
13
Statement of Operations – Columbia Small Cap Value Fund II
Year ended February 29, 2012
| Net investment income | |
| Income: | |
| Dividends | | $ | 24,077,676 | | |
| Interest | | | 5,323 | | |
| Dividends from affiliates | | | 605,337 | | |
| Income from securities lending — net | | | 1,453,520 | | |
| Foreign taxes withheld | | | (49,039 | ) | |
| Total income | | | 26,092,817 | | |
| Expenses: | |
| Investment management fees | | | 12,634,977 | | |
| Distribution fees | |
| Class B | | | 18,783 | | |
| Class C | | | 144,639 | | |
| Class R | | | 112,051 | | |
| Service fees | |
| Class B | | | 6,264 | | |
| Class C | | | 48,215 | | |
| Distribution and service fees — Class A | | | 1,355,476 | | |
| Transfer agent fees | |
| Class A | | | 1,416,933 | | |
| Class B | | | 6,508 | | |
| Class C | | | 50,016 | | |
| Class R | | | 58,072 | | |
| Class Z | | | 3,078,950 | | |
| Administration fees | | | 1,896,297 | | |
| Compensation of board members | | | 40,144 | | |
| Pricing and bookkeeping fees | | | 59,231 | | |
| Custodian fees | | | 37,383 | | |
| Printing and postage fees | | | 303,105 | | |
| Registration fees | | | 87,254 | | |
| Professional fees | | | 71,880 | | |
| Chief compliance officer expenses | | | 591 | | |
| Other | | | 72,977 | | |
| Total expenses | | | 21,499,746 | | |
| Fees waived or expenses reimbursed by Investment Manager and its affiliates | | | (887,545 | ) | |
| Expense reductions | | | (340 | ) | |
| Total net expenses | | | 20,611,861 | | |
| Net investment income | | | 5,480,956 | | |
| Realized and unrealized gain (loss) — net | |
| Net realized gain (loss) on: | |
| Investments — unaffiliated issuers | | | 90,179,616 | | |
| Investments — affiliated issuers | | | 471,303 | | |
| Foreign currency translations | | | 4,209 | | |
| Net realized gain | | | 90,655,128 | | |
| Net change in unrealized appreciation (depreciation) on: | |
| Investments | | | (138,119,208 | ) | |
| Net change in unrealized depreciation | | | (138,119,208 | ) | |
| Net realized and unrealized loss | | | (47,464,080 | ) | |
| Net decrease in net assets from operations | | $ | (41,983,124 | ) | |
The Accompanying Notes to Financial Statements are an integral part of this statement.
14
Statement of Changes in Net Assets – Columbia Small Cap Value Fund II
| | | Year ended
Feb. 29, 2012 | | Year ended
Feb. 28, 2011 | |
| Operations | |
| Net investment income | | $ | 5,480,956 | | | $ | 2,149,035 | | |
| Net realized gain | | | 90,655,128 | | | | 151,426,198 | | |
| Net change in unrealized appreciation (depreciation) | | | (138,119,208 | ) | | | 338,087,442 | | |
| Net increase (decrease) in net assets resulting from operations | | | (41,983,124 | ) | | | 491,662,675 | | |
| Distributions to shareholders from: | |
| Net investment income | |
| Class A | | | (792,164 | ) | | | (891,307 | ) | |
| Class I | | | (69,261 | ) | | | (13,012 | ) | |
| Class Z | | | (4,323,653 | ) | | | (4,044,374 | ) | |
| Total distributions to shareholders | | | (5,185,078 | ) | | | (4,948,693 | ) | |
| Increase (decrease) in net assets from share transactions | | | (68,924,549 | ) | | | 22,716,511 | | |
| Total increase (decrease) in net assets | | | (116,092,751 | ) | | | 509,430,493 | | |
| Net assets at beginning of year | | | 1,925,656,616 | | | | 1,416,226,123 | | |
| Net assets at end of year | | $ | 1,809,563,865 | | | $ | 1,925,656,616 | | |
| Undistributed net investment income | | $ | 300,087 | | | $ | — | | |
The Accompanying Notes to Financial Statements are an integral part of this statement.
15
Statement of Changes in Net Assets (continued) – Columbia Small Cap Value Fund II
| | | Year ended
Feb. 29, 2012 | | Year ended
Feb. 28, 2011 | |
| | | Shares | | Dollars ($) | | Shares | | Dollars ($) | |
| Capital stock activity | |
| Class A shares | |
| Subscriptions(a) | | | 13,451,845 | | | | 182,346,875 | | | | 17,064,975 | | | | 208,171,695 | | |
| Distributions reinvested | | | 57,361 | | | | 741,676 | | | | 59,530 | | | | 804,823 | | |
| Redemptions | | | (15,385,558 | ) | | | (208,855,941 | ) | | | (16,377,823 | ) | | | (206,729,842 | ) | |
| Net increase (decrease) | | | (1,876,352 | ) | | | (25,767,390 | ) | | | 746,682 | | | | 2,246,676 | | |
| Class B shares | |
| Subscriptions | | | 223 | | | | 2,904 | | | | 398 | | | | 5,333 | | |
| Redemptions(a) | | | (49,002 | ) | | | (644,763 | ) | | | (66,707 | ) | | | (769,319 | ) | |
| Net decrease | | | (48,779 | ) | | | (641,859 | ) | | | (66,309 | ) | | | (763,986 | ) | |
| Class C shares | |
| Subscriptions | | | 27,629 | | | | 365,594 | | | | 44,522 | | | | 522,687 | | |
| Redemptions | | | (354,210 | ) | | | (4,652,081 | ) | | | (614,679 | ) | | | (7,073,611 | ) | |
| Net decrease | | | (326,581 | ) | | | (4,286,487 | ) | | | (570,157 | ) | | | (6,550,924 | ) | |
| Class I shares | |
| Subscriptions | | | 849,346 | | | | 12,388,439 | | | | 2,146,515 | | | | 29,206,217 | | |
| Distributions reinvested | | | 5,322 | | | | 69,244 | | | | 956 | | | | 12,997 | | |
| Redemptions | | | (2,002,637 | ) | | | (27,538,968 | ) | | | (170,574 | ) | | | (2,419,814 | ) | |
| Net increase (decrease) | | | (1,147,969 | ) | | | (15,081,285 | ) | | | 1,976,897 | | | | 26,799,400 | | |
| Class R shares | |
| Subscriptions | | | 569,369 | | | | 7,806,518 | | | | 697,476 | | | | 8,498,927 | | |
| Redemptions | | | (1,037,533 | ) | | | (14,127,631 | ) | | | (897,871 | ) | | | (11,067,717 | ) | |
| Net decrease | | | (468,164 | ) | | | (6,321,113 | ) | | | (200,395 | ) | | | (2,568,790 | ) | |
| Class Z shares | |
| Subscriptions | | | 21,007,313 | | | | 290,129,852 | | | | 26,926,886 | | | | 329,536,996 | | |
| Distributions reinvested | | | 237,550 | | | | 3,092,901 | | | | 208,130 | | | | 2,832,654 | | |
| Redemptions | | | (22,438,284 | ) | | | (310,049,168 | ) | | | (26,932,907 | ) | | | (328,815,515 | ) | |
| Net increase (decrease) | | | (1,193,421 | ) | | | (16,826,415 | ) | | | 202,109 | | | | 3,554,135 | | |
| Total net increase (decrease) | | | (5,061,266 | ) | | | (68,924,549 | ) | | | 2,088,827 | | | | 22,716,511 | | |
(a) Includes conversions of Class B shares to Class A shares, if any.
The Accompanying Notes to Financial Statements are an integral part of this statement.
16
Financial Highlights – Columbia Small Cap Value Fund II
The following tables are intended to help you understand the Fund's financial performance. Certain information reflects financial results for a single share of a class held for the periods shown. Per share net investment income (loss) amounts are calculated based on average shares outstanding during the period. Total returns assume reinvestment of all dividends and distributions. Total returns do not reflect payments of sales charges, if any, and are not annualized for periods of less than one year.
| | | Year ended
Feb. 29, | | Year ended
Feb. 28, | | Year ended
Feb. 29, | |
| | | 2012 | | 2011 | | 2010 | | 2009 | | 2008 | |
| Class A | |
| Per share data | |
| Net asset value, beginning of period | | $ | 14.77 | | | $ | 11.05 | | | $ | 6.74 | | | $ | 12.21 | | | $ | 13.86 | | |
| Income from investment operations: | |
| Net investment income | | | 0.02 | | | | 0.00 | (a) | | | 0.04 | | | | 0.11 | | | | 0.06 | | |
| Net realized and unrealized gain (loss) | | | (0.33 | ) | | | 3.74 | | | | 4.32 | | | | (5.47 | ) | | | (1.21 | ) | |
| Total from investment operations | | | (0.31 | ) | | | 3.74 | | | | 4.36 | | | | (5.36 | ) | | | (1.15 | ) | |
| Less distributions to shareholders from: | |
| Net investment income | | | (0.02 | ) | | | (0.02 | ) | | | (0.04 | ) | | | (0.11 | ) | | | (0.05 | ) | |
| Net realized gains | | | — | | | | — | | | | — | | | | — | | | | (0.45 | ) | |
| Tax return of capital | | | — | | | | — | | | | (0.01 | ) | | | — | | | | — | | |
| Total distributions to shareholders | | | (0.02 | ) | | | (0.02 | ) | | | (0.05 | ) | | | (0.11 | ) | | | (0.50 | ) | |
| Net asset value, end of period | | $ | 14.44 | | | $ | 14.77 | | | $ | 11.05 | | | $ | 6.74 | | | $ | 12.21 | | |
| Total return | | | (2.08 | %) | | | 33.89 | % | | | 64.73 | % | | | (44.03 | %) | | | (8.74 | %) | |
| Ratios to average net assets(b) | |
| Expenses prior to fees waived or expenses reimbursed | | | 1.37 | % | | | 1.36 | % | | | 1.32 | % | | | 1.28 | % | | | 1.26 | % | |
| Net expenses after fees waived or expenses reimbursed(c) | | | 1.31 | %(d) | | | 1.35 | %(d) | | | 1.32 | %(d) | | | 1.28 | %(d) | | | 1.26 | %(d) | |
| Net investment income (loss) | | | 0.15 | %(d) | | | (0.01 | %)(d) | | | 0.44 | %(d) | | | 1.05 | %(d) | | | 0.46 | %(d) | |
| Supplemental data | |
| Net assets, end of period (in thousands) | | $ | 525,941 | | | $ | 565,730 | | | $ | 414,901 | | | $ | 235,871 | | | $ | 368,060 | | |
| Portfolio turnover | | | 41 | % | | | 60 | % | | | 70 | % | | | 56 | % | | | 41 | % | |
Notes to Financial Highlights
(a) Rounds to less than $0.01.
(b) In addition to the fees and expenses which the Fund bears directly, the Fund indirectly bears a pro rata share of the fees and expenses of the acquired funds in which it invests. Such indirect expenses are not included in the reported expense ratios.
(c) The Investment Manager and certain of its affiliates agreed to waive/reimburse certain fees and expenses, if applicable.
(d) The benefits derived from expense reductions had an impact of less than 0.01%.
The Accompanying Notes to Financial Statements are an integral part of this statement.
17
Financial Highlights (continued) – Columbia Small Cap Value Fund II
| | | Year ended
Feb. 29, | | Year ended
Feb. 28, | | Year ended
Feb. 29, | |
| | | 2012 | | 2011 | | 2010 | | 2009 | | 2008 | |
| Class B | |
| Per share data | |
| Net asset value, beginning of period | | $ | 14.10 | | | $ | 10.61 | | | $ | 6.49 | | | $ | 11.74 | | | $ | 13.41 | | |
| Income from investment operations: | |
| Net investment income (loss) | | | (0.08 | ) | | | (0.09 | ) | | | (0.03 | ) | | | 0.03 | | | | (0.04 | ) | |
| Net realized and unrealized gain (loss) | | | (0.32 | ) | | | 3.58 | | | | 4.15 | | | | (5.24 | ) | | | (1.18 | ) | |
| Total from investment operations | | | (0.40 | ) | | | 3.49 | | | | 4.12 | | | | (5.21 | ) | | | (1.22 | ) | |
| Less distributions to shareholders from: | |
| Net investment income | | | — | | | | — | | | | — | | | | (0.04 | ) | | | — | | |
| Net realized gains | | | — | | | | — | | | | — | | | | — | | | | (0.45 | ) | |
| Total distributions to shareholders | | | — | | | | — | | | | — | | | | (0.04 | ) | | | (0.45 | ) | |
| Net asset value, end of period | | $ | 13.70 | | | $ | 14.10 | | | $ | 10.61 | | | $ | 6.49 | | | $ | 11.74 | | |
| Total return | | | (2.84 | %) | | | 32.89 | % | | | 63.48 | % | | | (44.46 | %) | | | (9.49 | %) | |
| Ratios to average net assets(a) | |
| Expenses prior to fees waived or expenses reimbursed | | | 2.10 | % | | | 2.11 | % | | | 2.07 | % | | | 2.03 | % | | | 2.01 | % | |
| Net expenses after fees waived or expenses reimbursed(b) | | | 2.05 | %(c) | | | 2.10 | %(c) | | | 2.07 | %(c) | | | 2.03 | %(c) | | | 2.01 | %(c) | |
| Net investment income (loss) | | | (0.62 | %)(c) | | | (0.77 | %)(c) | | | (0.29 | %)(c) | | | 0.29 | %(c) | | | (0.28 | %)(c) | |
| Supplemental data | |
| Net assets, end of period (in thousands) | | $ | 2,337 | | | $ | 3,093 | | | $ | 3,031 | | | $ | 2,373 | | | $ | 5,248 | | |
| Portfolio turnover | | | 41 | % | | | 60 | % | | | 70 | % | | | 56 | % | | | 41 | % | |
Notes to Financial Highlights
(a) In addition to the fees and expenses which the Fund bears directly, the Fund indirectly bears a pro rata share of the fees and expenses of the acquired funds in which it invests. Such indirect expenses are not included in the reported expense ratios.
(b) The Investment Manager and certain of its affiliates agreed to waive/reimburse certain fees and expenses, if applicable.
(c) The benefits derived from expense reductions had an impact of less than 0.01%.
The Accompanying Notes to Financial Statements are an integral part of this statement.
18
Financial Highlights (continued) – Columbia Small Cap Value Fund II
| | | Year ended
Feb. 29, | | Year ended
Feb. 28, | | Year ended
Feb. 29, | |
| | | 2012 | | 2011 | | 2010 | | 2009 | | 2008 | |
| Class C | |
| Per share data | |
| Net asset value, beginning of period | | $ | 14.09 | | | $ | 10.60 | | | $ | 6.49 | | | $ | 11.73 | | | $ | 13.40 | | |
| Income from investment operations: | |
| Net investment income (loss) | | | (0.08 | ) | | | (0.09 | ) | | | (0.02 | ) | | | 0.03 | | | | (0.04 | ) | |
| Net realized and unrealized gain (loss) | | | (0.32 | ) | | | 3.58 | | | | 4.13 | | | | (5.23 | ) | | | (1.18 | ) | |
| Total from investment operations | | | (0.40 | ) | | | 3.49 | | | | 4.11 | | | | (5.20 | ) | | | (1.22 | ) | |
| Less distributions to shareholder from: | |
| Net investment income | | | — | | | | — | | | | — | | | | (0.04 | ) | | | — | | |
| Net realized gains | | | — | | | | — | | | | — | | | | — | | | | (0.45 | ) | |
| Total distributions to shareholders | | | — | | | | — | | | | — | | | | (0.04 | ) | | | (0.45 | ) | |
| Net asset value, end of period | | $ | 13.69 | | | $ | 14.09 | | | $ | 10.60 | | | $ | 6.49 | | | $ | 11.73 | | |
| Total return | | | (2.84 | %) | | | 32.92 | % | | | 63.33 | % | | | (44.41 | %) | | | (9.49 | %) | |
| Ratios to average net assets(a) | |
| Expenses prior to fees waived or expenses reimbursed | | | 2.10 | % | | | 2.11 | % | | | 2.07 | % | | | 2.03 | % | | | 2.01 | % | |
| Net expenses after fees waived or expenses reimbursed(b) | | | 2.06 | %(c) | | | 2.10 | %(c) | | | 2.07 | %(c) | | | 2.03 | %(c) | | | 2.01 | %(c) | |
| Net investment income (loss) | | | (0.62 | %)(c) | | | (0.77 | %)(c) | | | (0.27 | %)(c) | | | 0.29 | %(c) | | | (0.29 | %)(c) | |
| Supplemental data | |
| Net assets, end of period (in thousands) | | $ | 18,191 | | | $ | 23,321 | | | $ | 23,588 | | | $ | 22,159 | | | $ | 46,303 | | |
| Portfolio turnover | | | 41 | % | | | 60 | % | | | 70 | % | | | 56 | % | | | 41 | % | |
Notes to Financial Highlights
(a) In addition to the fees and expenses which the Fund bears directly, the Fund indirectly bears a pro rata share of the fees and expenses of the acquired funds in which it invests. Such indirect expenses are not included in the reported expense ratios.
(b) The Investment Manager and certain of its affiliates agreed to waive/reimburse certain fees and expenses, if applicable.
(c) The benefits derived from expense reductions had an impact of less than 0.01%.
The Accompanying Notes to Financial Statements are an integral part of this statement.
19
Financial Highlights (continued) – Columbia Small Cap Value Fund II
| | | Year ended
Feb. 29,
2012 | | Year ended
Feb. 28,
2011(a) | |
| Class I | |
| Per share data | |
| Net asset value, beginning of period | | $ | 14.87 | | | $ | 11.72 | | |
| Income from investment operations: | |
| Net investment income (loss) | | | 0.07 | | | | (0.01 | ) | |
| Net realized and unrealized gain (loss) | | | (0.32 | ) | | | 3.23 | | |
| Total from investment operations | | | (0.25 | ) | | | 3.22 | | |
| Less distributions to shareholders from: | |
| Net investment income | | | (0.08 | ) | | | (0.07 | ) | |
| Total distributions to shareholders | | | (0.08 | ) | | | (0.07 | ) | |
| Net asset value, end of period | | $ | 14.54 | | | $ | 14.87 | | |
| Total return | | | (1.64 | %) | | | 27.55 | % | |
| Ratios to average net assets(b) | |
| Expenses prior to fees waived or expenses reimbursed | | | 0.87 | % | | | 0.92 | %(c) | |
| Net expenses after fees waived or expenses reimbursed(d) | | | 0.87 | % | | | 0.92 | %(c)(e) | |
| Net investment income (loss) | | | 0.52 | % | | | (0.12 | %)(c)(e) | |
| Supplemental data | |
| Net assets, end of period (in thousands) | | $ | 12,055 | | | $ | 29,390 | | |
| Portfolio turnover | | | 41 | % | | | 60 | % | |
Notes to Financial Highlights
(a) For the period from September 27, 2010 (commencement of operations) to February 28, 2011.
(b) In addition to the fees and expenses which the Fund bears directly, the Fund indirectly bears a pro rata share of the fees and expenses of the acquired funds in which it invests. Such indirect expenses are not included in the reported expense ratios.
(c) Annualized.
(d) The Investment Manager and certain of its affiliates agreed to waive/reimburse certain fees and expenses, if applicable.
(e) The benefits derived from expense reductions had an impact of less than 0.01%.
The Accompanying Notes to Financial Statements are an integral part of this statement.
20
Financial Highlights (continued) – Columbia Small Cap Value Fund II
| | | Year ended
Feb. 29, | | Year ended
Feb. 28, | | Year ended
Feb. 29, | |
| | | 2012 | | 2011 | | 2010 | | 2009 | | 2008 | |
| Class R | |
| Per share data | |
| Net asset value, beginning of period | | $ | 14.71 | | | $ | 11.01 | | | $ | 6.72 | | | $ | 12.17 | | | $ | 13.83 | | |
| Income from investment operations: | |
| Net investment income (loss) | | | (0.02 | ) | | | (0.03 | ) | | | 0.02 | | | | 0.09 | | | | 0.03 | | |
| Net realized and unrealized gain (loss) | | | (0.33 | ) | | | 3.73 | | | | 4.30 | | | | (5.45 | ) | | | (1.22 | ) | |
| Total from investment operations | | | (0.35 | ) | | | 3.70 | | | | 4.32 | | | | (5.36 | ) | | | (1.19 | ) | |
| Less distributions to shareholder from: | |
| Net investment income | | | — | | | | — | | | | (0.03 | ) | | | (0.09 | ) | | | (0.02 | ) | |
| Net realized gains | | | — | | | | — | | | | — | | | | — | | | | (0.45 | ) | |
| Tax return of capital | | | — | | | | — | | | | (0.00 | )(a) | | | — | | | | — | | |
| Total distributions to shareholders | | | — | | | | — | | | | (0.03 | ) | | | (0.09 | ) | | | (0.47 | ) | |
| Net asset value, end of period | | $ | 14.36 | | | $ | 14.71 | | | $ | 11.01 | | | $ | 6.72 | | | $ | 12.17 | | |
| Total return | | | (2.38 | %) | | | 33.61 | % | | | 64.32 | % | | | (44.18 | %) | | | (9.03 | %) | |
| Ratios to average net assets(b) | |
| Expenses prior to fees waived or expenses reimbursed | | | 1.60 | % | | | 1.61 | % | | | 1.57 | % | | | 1.53 | % | | | 1.51 | % | |
| Net expenses after fees waived or expenses reimbursed(c) | | | 1.56 | %(d) | | | 1.60 | %(d) | | | 1.57 | %(d) | | | 1.53 | %(d) | | | 1.51 | %(d) | |
| Net investment income (loss) | | | (0.12 | %)(d) | | | (0.26 | %)(d) | | | 0.20 | %(d) | | | 0.82 | %(d) | | | 0.20 | %(d) | |
| Supplemental data | |
| Net assets, end of period (in thousands) | | $ | 20,081 | | | $ | 27,450 | | | $ | 22,755 | | | $ | 14,765 | | | $ | 13,851 | | |
| Portfolio turnover | | | 41 | % | | | 60 | % | | | 70 | % | | | 56 | % | | | 41 | % | |
Notes to Financial Highlights
(a) Rounds to less than $0.01.
(b) In addition to the fees and expenses which the Fund bears directly, the Fund indirectly bears a pro rata share of the fees and expenses of the acquired funds in which it invests. Such indirect expenses are not included in the reported expense ratios.
(c) The Investment Manager and certain of its affiliates agreed to waive/reimburse certain fees and expenses, if applicable.
(d) The benefits derived from expense reductions had an impact of less than 0.01%.
The Accompanying Notes to Financial Statements are an integral part of this statement.
21
Financial Highlights (continued) – Columbia Small Cap Value Fund II
| | | Year ended
Feb. 29, | | Year ended
Feb. 28, | | Year ended
Feb. 29, | |
| | | 2012 | | 2011 | | 2010 | | 2009 | | 2008 | |
| Class Z | |
| Per share data | |
| Net asset value, beginning of period | | $ | 14.87 | | | $ | 11.11 | | | $ | 6.78 | | | $ | 12.29 | | | $ | 13.95 | | |
| Income from investment operations: | |
| Net investment income | | | 0.05 | | | | 0.03 | | | | 0.07 | | | | 0.14 | | | | 0.10 | | |
| Net realized and unrealized gain (loss) | | | (0.33 | ) | | | 3.78 | | | | 4.33 | | | | (5.51 | ) | | | (1.23 | ) | |
| Total from investment operations | | | (0.28 | ) | | | 3.81 | | | | 4.40 | | | | (5.37 | ) | | | (1.13 | ) | |
| Less distributions to shareholders from: | |
| Net investment income | | | (0.05 | ) | | | (0.05 | ) | | | (0.06 | ) | | | (0.14 | ) | | | (0.08 | ) | |
| Net realized gains | | | — | | | | — | | | | — | | | | — | | | | (0.45 | ) | |
| Tax return of capital | | | — | | | | — | | | | (0.01 | ) | | | — | | | | — | | |
| Total distributions to shareholders | | | (0.05 | ) | | | (0.05 | ) | | | (0.07 | ) | | | (0.14 | ) | | | (0.53 | ) | |
| Net asset value, end of period | | $ | 14.54 | | | $ | 14.87 | | | $ | 11.11 | | | $ | 6.78 | | | $ | 12.29 | | |
| Total return | | | (1.84 | %) | | | 34.31 | % | | | 64.94 | % | | | (43.87 | %) | | | (8.55 | %) | |
| Ratios to average net assets(a) | |
| Expenses prior to fees waived or expenses reimbursed | | | 1.11 | % | | | 1.11 | % | | | 1.07 | % | | | 1.03 | % | | | 1.01 | % | |
| Net expenses after fees waived or expenses reimbursed(b) | | | 1.06 | %(c) | | | 1.10 | %(c) | | | 1.07 | %(c) | | | 1.03 | %(c) | | | 1.01 | %(c) | |
| Net investment income | | | 0.40 | %(c) | | | 0.23 | %(c) | | | 0.68 | %(c) | | | 1.33 | %(c) | | | 0.71 | %(c) | |
| Supplemental data | |
| Net assets, end of period (in thousands) | | $ | 1,230,960 | | | $ | 1,276,673 | | | $ | 951,951 | | | $ | 540,951 | | | $ | 654,658 | | |
| Portfolio turnover | | | 41 | % | | | 60 | % | | | 70 | % | | | 56 | % | | | 41 | % | |
Notes to Financial Highlights
(a) In addition to the fees and expenses which the Fund bears directly, the Fund indirectly bears a pro rata share of the fees and expenses of the acquired funds in which it invests. Such indirect expenses are not included in the reported expense ratios.
(b) The Investment Manager and certain of its affiliates agreed to waive/reimburse certain fees and expenses, if applicable.
(c) The benefits derived from expense reductions had an impact of less than 0.01%.
The Accompanying Notes to Financial Statements are an integral part of this statement.
22
Notes to Financial Statements – Columbia Small Cap Value Fund II
February 29, 2012
Note 1. Organization
Columbia Small Cap Value Fund II (the Fund), a series of Columbia Funds Series Trust (the Trust), is a diversified fund. The Trust is registered under the Investment Company Act of 1940, as amended (the 1940 Act), as an open-end management investment company organized as a Delaware statutory trust.
Fund Shares
The Trust may issue an unlimited number of shares (without par value). The Fund offers Class A, Class B, Class C, Class I, Class R and Class Z shares. All share classes have identical voting, dividend and liquidation rights. Each share class has its own expense structure and sales charges, as applicable.
Class A shares are subject to a maximum front-end sales charge of 5.75% based on the initial investment amount. Class A shares purchased without an initial sales charge in accounts aggregating $1 million to $50 million at the time of purchase are subject to a contingent deferred sales charge (CDSC) if the shares are sold within 18 months of purchase, charged as follows: 1.00% CDSC if redeemed within 12 months of purchase, and 0.50% CDSC if redeemed more than 12, but less than 18, months after purchase.
Class B shares may be subject to a maximum CDSC of 5.00% based upon the holding period after purchase. Class B shares will generally convert to Class A shares eight years after purchase. The Fund no longer accepts investments by new or existing investors in the Fund's Class B shares, except in connection with the reinvestment of any dividend and/or capital gain distributions in Class B shares of the Fund and exchanges by existing Class B shareholders of certain other funds within the Columbia Family of Funds.
Class C shares are subject to a 1.00% CDSC on shares redeemed within one year of purchase.
Class I shares are not subject to sales charges and are only available to the Columbia Family of Funds.
Class R shares are not subject to sales charges and are only available to qualifying institutional investors.
Class Z shares are not subject to sales charges, and are only available to certain investors, as described in the Fund's prospectus.
Note 2. Summary of Significant Accounting Policies
Use of Estimates
The preparation of financial statements in accordance with U.S. generally accepted accounting principles (GAAP) requires management to make certain estimates and assumptions that affect the reported amounts of assets and liabilities, the disclosure of contingent assets and liabilities at the date of the financial statements and the reported amounts of revenue and expenses during the reporting period. Actual results could differ from those estimates.
The following is a summary of significant accounting policies consistently followed by the Fund in the preparation of its financial statements.
Security Valuation
All equity securities are valued at the close of business of the New York Stock Exchange (NYSE). Equity securities are valued at the last quoted sales price on the principal exchange or market on which they trade, except for securities traded on the NASDAQ Stock Market, which are valued at the NASDAQ official close price. Unlisted securities or listed securities for which there were no sales during the day are valued at the mean of the latest quoted bid and asked prices on such exchanges or markets.
Foreign securities are valued based on quotations from the principal market in which such securities are normally traded. If any foreign share prices are not readily available as a result of limited share activity the securities are valued at the mean of the latest quoted bid and asked prices on such exchanges or markets. Foreign currency exchange rates are generally determined at 4:00 p.m. Eastern (U.S.) time. However, many securities markets and exchanges outside the U.S. close prior to the close of the NYSE; therefore, the closing prices for securities in such markets or on such exchanges may not fully reflect events that occur after such close but before the close of the NYSE. In those situations, foreign securities will be fair valued pursuant to the policy adopted by the Board of Trustees (the Board), including utilizing a third party pricing service to determine these fair values. The third party pricing service takes into account multiple factors, including, but not limited to, movements in the U.S. securities markets, certain depositary receipts, futures contracts and foreign exchange
23
Columbia Small Cap Value Fund II, February 29, 2012
rates that have occurred subsequent to the close of the foreign exchange, to determine a good faith estimate that reasonably reflects the current market conditions as of the close of the NYSE. The fair value of a security is likely to be different from the quoted or published price, if available.
Investments in other open-end investment companies, including money market funds, are valued at net asset value.
Short-term securities purchased within 60 days to maturity are valued at amortized cost, which approximates market value. The value of short-term securities originally purchased with maturities greater than 60 days is determined based on an amortized value to par upon reaching 60 days to maturity. Short-term securities maturing in more than 60 days from the valuation date are valued at the market price or approximate market value based on current interest rates.
Investments for which market quotations are not readily available, or that have quotations which management believes are not reliable, are valued at fair value as determined in good faith under consistently applied procedures established by and under the general supervision of the Board. If a security or class of securities (such as foreign securities) is valued at fair value, such value is likely to be different from the last quoted market price for the security. The determination of fair value often requires significant judgment. To determine fair value, management may use assumptions including but not limited to future cash flows and estimated risk premiums. Multiple inputs from various sources may be used to determine value.
Foreign Currency Transactions and Translation
The values of all assets and liabilities denominated in foreign currencies are translated into U.S. dollars at that day's exchange rates. Net realized and unrealized gains (losses) on foreign currency transactions and translations include gains (losses) arising from the fluctuation in exchange rates between trade and settlement dates on securities transactions, gains (losses) arising from the disposition of foreign currency and currency gains (losses) between the accrual and payment dates on dividends, interest income and foreign withholding taxes.
For financial statement purposes, the Fund does not distinguish that portion of gains (losses) on investments which is due to changes in foreign exchange rates from that which is due to changes in market prices of the investments. Such fluctuations are included with the net realized and unrealized gains (losses) on investments in the Statement of Operations.
Repurchase Agreements
The Fund may engage in repurchase agreement transactions with institutions that management has determined are creditworthy. The Fund, through the custodian, receives delivery of the underlying securities collateralizing a repurchase agreement. Management is responsible for determining that the collateral is at least equal, at all times, to the value of the repurchase obligation including interest. A repurchase agreement transaction involves certain risks in the event of default or insolvency of the counterparty. These risks include possible delays in or restrictions on a Fund's ability to dispose of the underlying securities and a possible decline in the value of the underlying securities during the period while the Fund seeks to assert its rights.
Security Transactions
Security transactions are accounted for on the trade date. Cost is determined and gains (losses) are based upon the specific identification method for both financial statement and federal income tax purposes.
Income Recognition
Corporate actions and dividend income are recorded on the ex-dividend date.
Interest income is recorded on the accrual basis.
The Fund receives distributions from holdings in real estate investment trusts (REITs) which report information on the character of their distributions annually. REIT distributions are allocated to dividend income, capital gain and return of capital based on estimates made by the Fund's management if actual information has not yet been reported. Return of capital is recorded as a reduction of the cost basis of securities held. Management's estimates are subsequently adjusted when the actual character of the distributions is disclosed by the REITs which could result in a proportionate increase in return of capital to shareholders.
Expenses
General expenses of the Trust are allocated to the Fund and other funds of the Trust based upon relative net assets or other expense allocation methodologies determined by the nature of
24
Columbia Small Cap Value Fund II, February 29, 2012
the expense. Expenses directly attributable to the Fund are charged to the Fund. Expenses directly attributable to a specific class of shares are charged to that share class.
Determination of Class Net Asset Value
All income, expenses (other than class-specific expenses, which are charged to that share class, as shown in the Statement of Operations) and realized and unrealized gains (losses) are allocated to each class of the Fund on a daily basis, based on the relative net assets of each class, for purposes of determining the net asset value of each class.
Federal Income Tax Status
The Fund intends to qualify each year as a regulated investment company under Subchapter M of the Internal Revenue Code, as amended, and will distribute substantially all of its tax exempt or taxable income (including net short-term capital gains), if any, for its tax year, and as such will not be subject to federal income taxes. In addition, the Fund intends to distribute in each calendar year substantially all of its net investment income, capital gains and certain other amounts, if any, such that the Fund should not be subject to federal excise tax. Therefore, no federal income or excise tax provision is recorded.
Distributions to Shareholders
Distributions from net investment income, if any, are declared and paid semi-annually. Net realized capital gains, if any, are distributed along with the income dividend. Income distributions and capital gain distributions are determined in accordance with federal income tax regulations which may differ from GAAP.
Guarantees and Indemnifications
Under the Trust's organizational documents and, in some cases, by contract, its officers and trustees are indemnified against certain liabilities arising out of the performance of their duties to the Trust or its funds. In addition, certain of the Fund's contracts with its service providers contain general indemnification clauses. The Fund's maximum exposure under these arrangements is unknown since the amount of any future claims that may be made against the Fund cannot be determined, and the Fund has no historical basis for predicting the likelihood of any such claims.
Recent Accounting Pronouncement
Fair Value Measurements and Disclosures
In May 2011, the Financial Accounting and Standards Board (FASB) issued ASU No. 2011-04 modifying Topic 820, Fair Value Measurements and Disclosures. At the same time, the International Accounting Standards Board (IASB) issued International Financial Reporting Standard 13, Fair Value Measurement. The objective of the FASB and IASB is convergence of their guidance on fair value measurements and disclosures.
Specifically, ASU No. 2011-04 requires reporting entities to disclose i) the amounts of any transfers between Level 1 and Level 2, and the reasons for the transfers, ii) for Level 3 fair value measurements, a) quantitative information about significant unobservable inputs used, b) a description of the valuation processes used by the reporting entity and c) a narrative description of the sensitivity of the fair value measurement to changes in unobservable inputs if a change in those inputs might result in a significantly higher or lower fair value measurement. The effective date of ASU No. 2011-04 is for interim and annual periods beginning after December 15, 2011. At this time, management is evaluating the implications of this guidance and the impact it will have on the financial statement amounts and footnote disclosures, if any.
Note 3. Fees and Compensation Paid to Affiliates
Investment Management Fees
Under an Investment Management Services Agreement, Columbia Management Investment Advisers, LLC (the Investment Manager), a wholly-owned subsidiary of Ameriprise Financial, Inc. (Ameriprise Financial), determines which securities will be purchased, held or sold. Effective July 1, 2011, the management fee is an annual fee that is equal to a percentage of the Fund's average daily net assets that declines from 0.79% to 0.70% as the Fund's net assets increase. Prior to July 1, 2011, the management fee was equal to a percentage of the Fund's average daily net assets that declined from 0.70% to 0.60% as the Fund's net assets increased. The effective management fee rate for the year ended February 29, 2012 was 0.71% of the Fund's average daily net assets.
25
Columbia Small Cap Value Fund II, February 29, 2012
Administration Fees
Under an Administrative Services Agreement, the Investment Manager serves as the Fund Administrator. Effective July 1, 2011, the Fund pays the Fund Administrator an annual fee for administration and accounting services equal to a percentage of the Fund's average daily net assets that declines from 0.80% to 0.50% as the Fund's net assets increase. Prior to July 1, 2011, the administration fee was equal to the annual rate of 0.17% of the Fund's average daily net assets, less the fees that were payable by the Fund as described under the Pricing and Bookkeeping Fees note below. The effective administration fee rate for the year ended February 29, 2012 was 0.11% of the Fund's average daily net assets.
Pricing and Bookkeeping Fees
Prior to July 25, 2011, the Fund had entered into a Financial Reporting Services Agreement (the Financial Reporting Services Agreement) with State Street Bank and Trust Company (State Street) and the Investment Manager pursuant to which State Street provided financial reporting services to the Fund. The Fund also entered into an Accounting Services Agreement (collectively with the Financial Reporting Services Agreement, the State Street Agreements) with State Street and the Investment Manager pursuant to which State Street provided accounting services to the Fund. Under the State Street Agreements, the Fund paid State Street an annual fee of $38,000 paid monthly plus an additional monthly fee based on an annualized percentage rate of average daily net assets of the Fund for the month. The aggregate fee did not exceed $140,000 per year (exclusive of out-of-pocket expenses and charges). The Fund also reimbursed State Street for certain out-of-pocket expenses and charges. Effective July 25, 2011, these services are provided under the Administrative Services Agreement discussed above.
Other Fees
Effective June 1, 2011, other expenses are for, among other things, certain expenses of the Fund or the Board, including: Fund boardroom and office expense, employee compensation, employee health and retirement benefits, and certain other expenses. Payment of these Fund and Board expenses is facilitated by a company providing limited administrative services to the Fund and the Board. For the period June 1, 2011 through February 29, 2012, other expenses paid to this company were $6,045.
Compensation of Board Members
Board members are compensated for their services to the Fund as disclosed in the Statement of Operations. Under a Deferred Compensation Plan (the Plan), the Board members who are not "interested persons" of the Fund, as defined under the 1940 Act, may elect to defer payment of up to 100% of their compensation. Deferred amounts are treated as though equivalent dollar amounts had been invested in shares of certain funds managed by the Investment Manager. The Fund's liability for these amounts is adjusted for market value changes and remains in the Fund until distributed in accordance with the Plan.
Compensation of Chief Compliance Officer
The Board has appointed a Chief Compliance Officer to the Fund in accordance with federal securities regulations. Effective April 1, 2011, the Fund's expenses associated with the Chief Compliance Officer are paid directly by the Investment Manager. Prior to April 1, 2011, the Fund, along with other affiliated funds, paid its pro-rata share of the expenses for the Chief Compliance Officer. Such fees did not exceed $15,000 per year.
Transfer Agent Fees
Under a Transfer and Dividend Disbursing Agent Agreement, Columbia Management Investment Services Corp. (the Transfer Agent), an affiliate of the Investment Manager and a wholly-owned subsidiary of Ameriprise Financial, is responsible for providing transfer agency services to the Fund. The Transfer Agent has contracted with Boston Financial Data Services (BFDS) to serve as sub-transfer agent.
The Transfer Agent receives monthly account-based service fees based on the number of open accounts and is reimbursed by the Fund for the fees and expenses the Transfer Agent pays to financial intermediaries that maintain omnibus accounts with the Fund that is a percentage of the average aggregate value of the Fund's shares maintained in each such omnibus account (other than omnibus accounts for which American Enterprise Investment Services Inc. is the broker of record or accounts where the beneficial shareholder is a customer of Ameriprise Financial Services, Inc., which are paid a per account fee). The Transfer Agent pays the fees of BFDS for services as sub-transfer agent and is not entitled to
26
Columbia Small Cap Value Fund II, February 29, 2012
reimbursement for such fees from the Fund (with the exception of out-of-pocket fees).
The Transfer Agent also receives compensation from fees for various shareholder services and reimbursements for certain out-of-pocket expenses. Class I shares do not pay transfer agent fees.
For the year ended February 29, 2012, the Fund's effective transfer agent fee rates as a percentage of average daily net assets of each class were as follows:
| Class A | | | 0.26 | % | |
| Class B | | | 0.26 | | |
| Class C | | | 0.26 | | |
| Class R | | | 0.26 | | |
| Class Z | | | 0.26 | | |
An annual minimum account balance fee of $20 may apply to certain accounts with a value below the Fund's initial minimum investment requirements to reduce the impact of small accounts on transfer agent fees. These minimum account balance fees are recorded as part of expense reductions in the Statement of Operations. For the year ended February 29, 2012, these minimum account balance fees reduced total expenses by $340.
Distribution and Service Fees
The Fund has an agreement with Columbia Management Investment Distributors, Inc. (the Distributor), an affiliate of the Investment Manager and a wholly-owned subsidiary of Ameriprise Financial, for distribution and shareholder services. Pursuant to Rule 12b-1 under the 1940 Act, the Board has approved, and the Fund has adopted, distribution and shareholder service plans (the Plans) which set the distribution and service fees for the Fund. These fees are calculated daily and are intended to compensate the Distributor and/or eligible selling and/or servicing agents for selling shares of the Fund and providing services to investors.
The Plans require the payment of a monthly combined distribution and service fee to the Distributor at the maximum annual rate of 0.25% of the average daily net assets attributable to Class A shares of the Fund. The Plans also required the payment of a monthly service fee at the maximum annual rate of 0.25% of the average daily net assets attributable to Class B and Class C shares of the Fund and the payment of a monthly distribution fee at the maximum annual rates of 0.75% of the average daily net assets attributable to Class B and Class C shares and 0.50% of the average daily net assets attributable to Class R shares of the Fund.
Sales Charges
Sales charges, including front-end charges and CDSCs, received by the Distributor for distributing Fund shares were $3,892 for Class A, $4,270 for Class B and $96 for Class C shares for the year ended February 29, 2012.
Expenses Waived/Reimbursed by the Investment Manager and its Affiliates
Effective July 1, 2011, the Investment Manager and certain of its affiliates have contractually agreed to waive fees and/or reimburse expenses (excluding certain fees and expenses described below), through June 30, 2012, unless sooner terminated at the sole discretion of the Board, so that the Fund's net operating expenses, after giving effect to fees waived/expenses reimbursed and any balance credits and/or overdraft charges from the Fund's custodian, do not exceed the following annual rates as a percentage of the class' average daily net assets:
| Class A | | | 1.31 | % | |
| Class B | | | 2.06 | | |
| Class C | | | 2.06 | | |
| Class I | | | 0.90 | | |
| Class R | | | 1.56 | | |
| Class Z | | | 1.06 | | |
Effective April 23, 2012, the Investment Manager and certain of its affiliates have contractually agreed to waive fees and/or reimburse expenses (excluding certain fees and expenses described below), through June 30, 2014, unless sooner terminated at the sole discretion of the Board, so that the Fund's net operating expenses, after giving effect to fees
27
Columbia Small Cap Value Fund II, February 29, 2012
waived/expenses reimbursed and/or overdraft charges from the Fund's custodian, will not exceed the following annual rates as a percentage of the class' average daily net assets:
| Class A | | | 1.31 | % | |
| Class B | | | 2.06 | | |
| Class C | | | 2.06 | | |
| Class I | | | 0.98 | | |
| Class R | | | 1.56 | | |
| Class Z | | | 1.06 | | |
Under the agreement, the following fees and expenses are excluded from the waiver/reimbursement commitment, and therefore will be paid by the Fund, if applicable: taxes (including foreign transaction taxes), expenses associated with investments in affiliated and non-affiliated pooled investment vehicles (including mutual funds and exchange traded funds), transaction costs and brokerage commissions, costs related to any securities lending program, dividend expenses associated with securities sold short, inverse floater program fees and expenses, transaction charges and interest on borrowed money, interest, extraordinary expenses and any other expenses the exclusion of which is specifically approved by the Board. This agreement may be modified or amended only with approval from all parties.
Prior to July 1, 2011, the Investment Manager voluntarily agreed to reimburse a portion of the Fund's expenses (excluding certain expenses, such as brokerage commissions, interest, taxes and extraordinary expenses, but including custodian charges relating to overdrafts, if any) so that the Fund's ordinary net operating expenses, after giving effect to fees waived/expenses reimbursed and any balance credits and/or overdraft charges from the Fund's custodian, did not exceed the following annual rates as a percentage of the class' average daily net assets:
| Class A | | | 1.35 | % | |
| Class B | | | 2.10 | | |
| Class C | | | 2.10 | | |
| Class I | | | 0.95 | | |
| Class R | | | 1.60 | | |
| Class Z | | | 1.10 | | |
Prior to May 1, 2011, the Investment Manager was entitled to recover from the Fund any fees waived and/or expenses reimbursed for a three year period following the date of such fee waiver and/or reimbursement under these arrangements if such recovery did not cause the Fund's expenses to exceed the expense limitations in effect at the time of recovery. Effective May 1, 2011, the Investment Manager has eliminated such fee recoupment provisions.
Note 4. Federal Tax Information
The timing and character of income and capital gain distributions are determined in accordance with income tax regulations, which may differ from GAAP because of temporary or permanent book to tax differences.
For the year ended February 29, 2012, these differences are primarily due to differing treatment for foreign currency transactions, capital loss carryforwards, post-October capital losses, and deferral/reversal of wash sale losses. To the extent these differences are permanent, reclassifications are made among the components of the Fund's net assets in the Statement of Assets and Liabilities. Temporary differences do not require reclassifications. In the Statement of Assets and Liabilities the following reclassifications were made:
| Undistributed net investment income | | $ | 4,209 | | |
| Accumulated net realized loss | | | (4,210 | ) | |
| Paid-in capital | | | 1 | | |
Net investment income and net realized gains (losses), as disclosed in the Statement of Operations, and net assets were not affected by this reclassification.
The tax character of distributions paid during the years indicated was as follows:
| Year ended | | February 29,
2012 | | February 28,
2011 | |
| Ordinary income | | $ | 5,185,078 | | | $ | 4,948,693 | | |
Short-term capital gain distributions, if any, are considered ordinary income distributions for tax purposes.
28
Columbia Small Cap Value Fund II, February 29, 2012
At February 29, 2012, the components of distributable earnings on a tax basis were as follows:
| Undistributed ordinary income | | $ | 347,932 | | |
| Undistributed long-term capital gains | | | — | | |
| Unrealized appreciation | | | 353,744,539 | | |
At February 29, 2012, the cost of investments for federal income tax purposes was $1,832,639,571 and the aggregate gross unrealized appreciation and depreciation based on that cost was:
| Unrealized appreciation | | $ | 423,877,878 | | |
| Unrealized depreciation | | | (70,133,339 | ) | |
| Net unrealized appreciation | | $ | 353,744,539 | | |
The following capital loss carryforward, determined at February 29, 2012, may be available to reduce taxable income arising from future net realized gains on investments, if any, to the extent permitted by the Internal Revenue Code:
| Year of expiration | | Amount | |
| 2018 | | $ | 91,084,175 | | |
On December 22, 2010, the Regulated Investment Company Modernization Act of 2010 (the Act) was enacted, which changed various technical rules governing the tax treatment of regulated investment companies. The changes are generally effective for taxable years beginning after the date of enactment. Under the Act, the Fund will be permitted to carry forward capital losses incurred in taxable years beginning after the date of enactment for an unlimited period. However, any losses incurred during those future taxable years will be required to be utilized prior to the losses incurred in pre-enactment taxable years, which carry an expiration date. As a result of this ordering rule, pre-enactment capital loss carryforwards may be more likely to expire unused.
For the year ended February 29, 2012, $95,695,223 of capital loss carryforward was utilized.
Under current tax rules, regulated investment companies can elect to treat certain late-year ordinary losses incurred and post-October capital losses (capital losses realized after October 31) as arising on the first day of the following taxable year. As of February 29, 2012, the Fund will elect to treat post-October capital losses of $3,731,632 as arising on March 1, 2012.
Management of the Fund has concluded that there are no significant uncertain tax positions that would require recognition in the financial statements. However, management's conclusion may be subject to review and adjustment at a later date based on factors including, but not limited to, new tax laws, regulations, and administrative interpretations (including relevant court decisions). Generally, the Fund's federal tax returns for the prior three fiscal years remain subject to examination by the Internal Revenue Service.
Note 5. Portfolio Information
The cost of purchases and proceeds from sales of securities, excluding short-term obligations, aggregated to $735,550,466 and $775,665,585, respectively, for the year ended February 29, 2012.
Note 6. Lending of Portfolio Securities
Effective July 25, 2011, the Fund has entered into a Master Securities Lending Agreement (the Agreement) with JPMorgan Chase Bank, N.A. (JPMorgan). The Agreement, which replaces the previous security lending arrangement with State Street, authorizes JPMorgan as lending agent to lend securities to authorized borrowers in order to generate additional income on behalf of the Fund. Pursuant to the Agreement, the securities loaned are secured by cash or U.S. government securities equal to at least 100% of the market value of the loaned securities. Any additional collateral required to maintain those levels due to market fluctuations of the loaned securities is requested to be delivered the following business day. Cash collateral received is invested by the lending agent on behalf of the Fund into authorized investments pursuant to the Agreement. The investments made with the cash collateral are listed in the Portfolio of Investments. The values of such investments and any uninvested cash collateral are disclosed in the Statement of Assets and Liabilities along with the related obligation to return the collateral upon the return of the securities loaned.
29
Columbia Small Cap Value Fund II, February 29, 2012
At February 29, 2012, securities valued at $345,596,107 were on loan, secured by cash collateral of $357,711,647 (which does not reflect calls for collateral made to borrowers by JPMorgan at period end) that is partially or fully invested in short-term securities or other cash equivalents.
Risks of delay in recovery of securities or even loss of rights in the securities may occur should the borrower of the securities fail financially. Risks may also arise to the extent that the value of the securities loaned increases above the value of the collateral received. JPMorgan will indemnify the Fund from losses resulting from a borrower's failure to return a loaned security when due. Such indemnification does not extend to losses associated with declines in the value of cash collateral investments. The Investment Manager is not responsible for any losses incurred by the Fund in connection with the securities lending program. Loans are subject to termination by the Fund or the borrower at any time, and are, therefore, not considered to be illiquid investments.
Pursuant to the Agreement, the Fund receives income for lending its securities either in the form of fees or by earning interest on invested cash collateral, net of negotiated rebates paid to borrowers and fees paid to the lending agent for services provided and any other securities lending expenses. Net income earned from securities lending for the year ended February 29, 2012 is disclosed in the Statement of Operations. The Fund continues to earn and accrue interest and dividends on the securities loaned.
Prior to July 25, 2011, the Fund participated in a securities lending arrangement with State Street. Each security on loan was collateralized in an amount at least equal to the market value of the securities loaned plus accrued income from the investment of collateral. The income generated by the investment of the collateral, net of any fees remitted to State Street as the lending agent and borrower rebates, was paid to the Fund.
Note 7. Custody Credits
Prior to July 25, 2011, the Fund had an agreement with its custodian bank under which custody fees may have been reduced by balance credits. These credits are recorded as part of expense reductions on the Statement of Operations. The Fund could have invested a portion of the assets utilized in connection with the expense offset arrangement in an income-producing asset if they had not entered into such an agreement. Subsequent to this date, the Fund may invest its daily balance in an affiliated money market fund as detailed below. For the period March 1, 2011 through July 24, 2011, there were no custody credits.
Note 8. Affiliated Money Market Fund
Effective July 25, 2011, the Fund may invest its daily cash balances in Columbia Short-Term Cash Fund, an affiliated money market fund established for the exclusive use by the Fund and other affiliated funds. The income earned by the Fund from such investments is included as "Dividends from affiliates" in the Statement of Operations. As an investing fund, the Fund indirectly bears its proportionate share of the expenses of Columbia Short-Term Cash Fund.
Note 9. Shareholder Concentration
At February 29, 2012, one unaffiliated shareholder account owned 17.0% of the outstanding shares of the Fund. The Fund has no knowledge about whether any portion of those shares was owned beneficially by such account. Subscription and redemption activity by concentrated accounts may have a significant effect on the operations of the Fund.
Note 10. Line of Credit
The Fund has entered into a revolving credit facility with a syndicate of banks led by JPMorgan Chase Bank, N.A. (the Administrative Agent), whereby the Fund may borrow for the temporary funding of shareholder redemptions or for other temporary or emergency purposes. The credit facility became effective on July 25, 2011, replacing a prior credit facility. The credit facility agreement, as amended, which is a collective agreement between the Fund and certain other funds managed by the Investment Manager, severally and not jointly, permits collective borrowings up to $500 million. Pursuant to a December 13, 2011 amendment to the credit facility agreement, interest is charged to each participating fund based on its borrowings at a rate equal to the higher of (i) the overnight federal funds rate plus 1.00% or (i) the one-month LIBOR rate plus 1.00%. Each borrowing under the credit facility matures no later than 60 days after the date of borrowing. The Fund also pays a commitment fee equal to its pro rata share of the amount of the credit facility at a rate of 0.08% per annum. For the period July 25, 2011 through December 13, 2011, interest was charged to each
30
Columbia Small Cap Value Fund II, February 29, 2012
participating fund based on its borrowings at a rate equal to the sum of the federal funds rate plus (i) 1.25% per annum plus (ii) if one-month LIBOR exceeds the federal funds rate, the amount of such excess. The Fund also paid a commitment fee equal to its pro rata share of the amount of the credit facility at a rate of 0.10% per annum.
For the period June 27, 2011 through July 24, 2011, the Fund and certain other funds managed by the Investment Manager participated in a $100 million committed, unsecured revolving credit facility provided by State Street. For the period May 16, 2011 through June 26, 2011, the collective borrowing amount of the credit facility was $150 million committed, unsecured revolving credit facility provided by State Street. For the period March 28, 2011 through May 15, 2011, the collective borrowing amount of the credit facility was $225 million. Prior to March 28, 2011, the collective borrowing amount of the credit facility was $280 million. Interest was charged to each fund based on its borrowings at a rate equal to the greater of the (i) federal funds rate plus 1.25% per annum or (ii) the overnight LIBOR rate plus 1.25% per annum. The Fund also paid a commitment fee equal to its pro rata share of the amount of the credit facility at a rate of 0.125% per annum.
The Fund had no borrowings during the year ended February 29, 2012.
Note 11. Subsequent Events
Management has evaluated the events and transactions that have occured through the date the financial statements were issued and noted no items requiring adjustment of the financial statements or additional disclosure.
Note 12. Information Regarding Pending and Settled Legal Proceedings
In June 2004, an action captioned John E. Gallus et al. v. American Express Financial Corp. and American Express Financial Advisors Inc. was filed in the United States District Court for the District of Arizona. The plaintiffs allege that they are investors in several American Express Company mutual funds (currently branded as Columbia) and they purport to bring the action derivatively on behalf of those funds under the Investment Company Act of 1940. The plaintiffs allege that fees allegedly paid to the defendants by the funds for investment advisory and administrative services are excessive. The plaintiffs seek remedies including restitution and rescission of investment advisory and distribution agreements. The plaintiffs voluntarily agreed to transfer this case to the United States District Court for the District of Minnesota (the District Court). In response to defendants' motion to dismiss the complaint, the District Court dismissed one of plaintiffs' four claims and granted plaintiffs limited discovery. Defendants moved for summary judgment in April 2007. Summary judgment was granted in the defendants' favor on July 9, 2007. The plaintiffs filed a notice of appeal with the Eighth Circuit Court of Appeals (the Eighth Circuit) on August 8, 2007. On April 8, 2009, the Eighth Circuit reversed summary judgment and remanded to the District Court for further proceedings. On August 6, 2009, defendants filed a writ of certiorari with the U.S. Supreme Court (the Supreme Court), asking the Supreme Court to stay the District Court proceedings while the Supreme Court considers and rules in a case captioned Jones v. Harris Associates, which involves issues of law similar to those presented in the Gallus case. On March 30, 2010, the Supreme Court issued its ruling in Jones v. Harris Associates, and on April 5, 2010, the Supreme Court vacated the Eighth Circuit's decision in the Gallus case and remanded the case to the Eighth Circuit for further consideration in light of the Supreme Court's decision in Jones v. Harris Associates. On June 4, 2010, the Eighth Circuit remanded the Gallus case to the District Court for further consideration in light of the Supreme Court's decision in Jones v. Harris Associates. On December 9, 2010, the District Court reinstated its July 9, 2007 summary judgment order in favor of the defendants. On January 10, 2011, plaintiffs filed a notice of appeal with the Eighth Circuit. In response to the plaintiffs' opening appellate brief filed on March 18, 2011, the defendants filed a response brief on May 4, 2011 with the Eighth Circuit. The plaintiffs filed a reply brief on May 26, 2011 and oral arguments took place on November 17, 2011. On March 30, 2012, the Eighth Circuit upheld the grant of summary judgment by the District Court in favor of the defendants.
In December 2005, without admitting or denying the allegations, American Express Financial Corporation (AEFC, which is now known as Ameriprise Financial, Inc. (Ameriprise Financial)) entered into settlement agreements with the Securities and Exchange Commission (SEC) and Minnesota Department of Commerce (MDOC) related to market timing activities. As a result, AEFC was censured and ordered to cease
31
Columbia Small Cap Value Fund II, February 29, 2012
and desist from committing or causing any violations of certain provisions of the Investment Advisers Act of 1940, the Investment Company Act of 1940, and various Minnesota laws. AEFC agreed to pay disgorgement of $10 million and civil money penalties of $7 million. AEFC also agreed to retain an independent distribution consultant to assist in developing a plan for distribution of all disgorgement and civil penalties ordered by the SEC in accordance with various undertakings detailed at www.sec.gov/litigation/admin/ia-2451.pdf. Ameriprise Financial and its affiliates have cooperated with the SEC and the MDOC in these legal proceedings, and have made regular reports to the funds' Boards of Trustees.
Ameriprise Financial and certain of its affiliates have historically been involved in a number of legal, arbitration and regulatory proceedings, including routine litigation, class actions, and governmental actions, concerning matters arising in connection with the conduct of their business activities. Ameriprise Financial believes that the Funds are not currently the subject of, and that neither Ameriprise Financial nor any of its affiliates are the subject of, any pending legal, arbitration or regulatory proceedings that are likely to have a material adverse effect on the Funds or the ability of Ameriprise Financial or its affiliates to perform under their contracts with the Funds. Ameriprise Financial is required to make 10-Q, 10-K and, as necessary, 8-K filings with the Securities and Exchange Commission on legal and regulatory matters that relate to Ameriprise Financial and its affiliates. Copies of these filings may be obtained by accessing the SEC website at www.sec.gov.
There can be no assurance that these matters, or the adverse publicity associated with them, will not result in increased fund redemptions, reduced sale of fund shares or other adverse consequences to the Funds. Further, although we believe proceedings are not likely to have a material adverse effect on the Funds or the ability of Ameriprise Financial or its affiliates to perform under their contracts with the Funds, these proceedings are subject to uncertainties and, as such, we are unable to estimate the possible loss or range of loss that may result. An adverse outcome in one or more of these proceedings could result in adverse judgments, settlements, fines, penalties or other relief that could have a material adverse effect on the consolidated financial condition or results of operations of Ameriprise Financial.
32
Report of Independent Registered Public Accounting Firm
To the Trustees of Columbia Funds Series Trust and the Shareholders of Columbia Small Cap Value Fund II
In our opinion, the accompanying statement of assets and liabilities, including the investment portfolio, and the related statements of operations and of changes in net assets and the financial highlights present fairly, in all material respects, the financial position of Columbia Small Cap Value Fund II (the "Fund") (a series of Columbia Funds Series Trust) at February 29, 2012, the results of its operations for the year then ended, the changes in its net assets for each of the two years in the period then ended and the financial highlights for each of the periods indicated, in conformity with accounting principles generally accepted in the United States of America. These financial statements and financial highlights (hereafter referred to as "financial statements") are the responsibility of the Fund's management. Our responsibility is to express an opinion on these financial statements based on our audits. We conducted our audits of these financial statements in accordance with the standards of the Public Company Accounting Oversight Board (United States). Those standards require that we plan and perform the audit to obtain reasonable assurance about whether the financial statements are free of material misstatement. An audit includes examining, on a test basis, evidence supporting the amounts and disclosures in the financial statements, assessing the accounting principles used and significant estimates made by management, and evaluating the overall financial statement presentation. We believe that our audits, which included confirmation of securities at February 29, 2012 by correspondence with the custodian, transfer agent and brokers, provide a reasonable basis for our opinion.
PricewaterhouseCoopers LLP
Minneapolis, Minnesota
April 20, 2012
33
Federal Income Tax Information (Unaudited) – Columbia Small Cap Value Fund II
100.00% of the ordinary income distributed by the Fund for the fiscal year ended February 29, 2012, qualifies for the corporate dividends received deduction.
For non-corporate shareholders, 100.00% or the maximum amount allowable under the Jobs and Growth Tax Relief Reconciliation Act of 2003, of the ordinary income distributed by the Fund for the fiscal year ended February 29, 2012 may represent qualified dividend income.
The Fund will notify shareholders in January 2013 of amounts for use in preparing 2012 income tax returns.
34
Fund Governance
Shareholders elect the Board that oversees the funds' operations. The Board appoints officers who are responsible for day-to-day business decisions based on policies set by the Board. The following table provides basic biographical information about the funds' Board members, including their principal occupations during the past five years, although specific titles for individuals may have varied over the period. Under current Board policy, members may serve until the next Board meeting after he or she reaches the mandatory retirement age established by the Board, or the fifteenth anniversary of the first Board meeting they attended as a member of the Board.
On September 29, 2009, Ameriprise Financial, the parent company of Columbia Management, entered into an agreement with Bank of America, N.A. ("Bank of America") to acquire a portion of the asset management business of Columbia Management Group, LLC and certain of its affiliated companies (the "Transaction"). Following the Transaction, which became effective on May 1, 2010, various alignment activities have occurred with respect to the Fund Family. In connection with the Transaction, Mr. Edward J. Boudreau, Jr., Mr. William P. Carmichael, Mr. William A. Hawkins, Mr. R. Glenn Hilliard, Mr. John J. Nagorniak, Ms. Minor M. Shaw and Dr. Anthony M. Santomero, who were members prior to the Transaction of the Legacy Columbia Nations funds' Board ("Nations Funds"), which includes Columbia Funds Series Trust, Columbia Funds Variable Insurance Trust I and Columbia Funds Master Investment Trust, LLC., began service on the Board for the Legacy RiverSource funds ("RiverSource Funds") effective June 1, 2011, which resulted in an overall increase from twelve Trustees to sixteen for all mutual funds overseen by the Board.
Independent Board Members
| Name, Address, Age | | Position Held
with Funds
and Length
of Service | | Principal Occupation During Past Five Years | | Number of
Funds in the
Fund Family
Overseen by
Board Member | | Other Present or
Past Directorships/
Trusteeships
(Within Past 5 Years) | |
| Kathleen Blatz | | | | | | | | | |
|
901 S. Marquette Ave.
Minneapolis, MN 55402
Age 57 | | Board member since 1/06 for RiverSource Funds and since 6/11 for Nations Funds | | Attorney; Chief Justice, Minnesota Supreme Court, 1998-2006 | | 153 | | None | |
|
| Edward J. Boudreau, Jr. | | | | | | | | | |
|
225 Franklin Street
Mail Drop
BX32 05228
Boston, MA 02110
Age 67 | | Board member since 6/11 for RiverSource Funds and since 1/05 for Nations Funds | | Managing Director, E.J. Boudreau & Associates (consulting) since 2000 | | 146 | | Former Trustee, BofA Funds Series Trust (11 funds) | |
|
| Pamela G. Carlton | | | | | | | | | |
|
901 S. Marquette Ave.
Minneapolis, MN 55402
Age 57 | | Board member since 7/07 for RiverSource Funds and since 6/11 for Nations Funds | | President, Springboard-Partners in Cross Cultural Leadership (consulting company) | | 153 | | None | |
|
35
Fund Governance (continued)
Independent Board Members (continued)
| Name, Address, Age | | Position Held
with Funds
and Length
of Service | | Principal Occupation During Past Five Years | | Number of
Funds in the
Fund Family
Overseen by
Board Member | | Other Present or
Past Directorships/
Trusteeships
(Within Past 5 Years) | |
| William P. Carmichael | | | | | | | | | |
|
225 Franklin Street
Mail Drop
BX32 05228
Boston, MA 02110
Age 68 | | Board member since 6/11 for RiverSource Funds and since 1999 for Nations Funds | | Retired | | 146 | | Director, Cobra Electronics Corporation (electronic equipment manufacturer); The Finish Line (athletic shoes and apparel); McMoRan Exploration Company (oil and gas exploration and development); former Trustee, BofA Funds Series Trust (11 funds); former Director, Spectrum Brands, Inc. (consumer products); former Director, Simmons Company (bedding) | |
|
| Patricia M. Flynn | | | | | | | | | |
|
901 S. Marquette Ave.
Minneapolis, MN 55402
Age 61 | | Board member since 11/04 for RiverSource Funds and since 6/11 for Nations Funds | | Trustee Professor of Economics and Management, Bentley University; former Dean, McCallum Graduate School of Business, Bentley University | | 153 | | None | |
|
| William A. Hawkins | | | | | | | | | |
|
225 Franklin Street
Mail Drop
BX32 05228
Boston, MA 02110
Age 69 | | Board member since 6/11 for RiverSource Funds and since 1/05 for Nations Funds | | Managing Director, Overton Partners (financial consulting), since August 2010; President and Chief Executive Officer, California General Bank, N.A., January 2008-August 2010 | | 146 | | Trustee, BofA Funds Series Trust (11 funds) | |
|
| R. Glenn Hilliard | | | | | | | | | |
|
225 Franklin Street
Mail Drop
BX32 05228
Boston, MA 02110
Age 69 | | Board member since 6/11 for RiverSource Funds and since 1/05 for Nations Funds | | Chairman and Chief Executive Officer, Hilliard Group LLC (investing and consulting), since April 2003; Non-Executive Director & Chairman, CNO Financial Group, Inc. (formerly Conseco, Inc.) (insurance), September 2003-May 2011 | | 146 | | Chairman, BofA Fund Series Trust (11 funds); former Director, CNO Financial Group, Inc. (insurance) | |
|
36
Fund Governance (continued)
Independent Board Members (continued)
| Name, Address, Age | | Position Held
with Funds
and Length
of Service | | Principal Occupation During Past Five Years | | Number of
Funds in the
Fund Family
Overseen by
Board Member | | Other Present or
Past Directorships/
Trusteeships
(Within Past 5 Years) | |
| Stephen R. Lewis, Jr. | | | | | | | | | |
|
901 S. Marquette Ave.
Minneapolis, MN 55402
Age 73 | | Chair of the Board for RiverSource Funds since 1/07, Board member for RiverSource Funds since 1/02 and since 6/11 for Nations Funds | | President Emeritus and Professor of Economics Emeritus, Carleton College | | 153 | | Director, Valmont Industries, Inc. (manufactures irrigation systems) | |
|
| John F. Maher | | | | | | | | | |
|
901 S. Marquette Ave.
Minneapolis, MN 55402
Age 68 | | Board member since 12/06 for Legacy Seligman funds, since 12/08 for RiverSource Funds and since 6/11 for Nations Funds | | Retired President and Chief Executive Officer and former Director, Great Western Financial Corporation (financial services), 1986-1997 | | 153 | | None | |
|
| John J. Nagorniak | | | | | | | | | |
|
225 Franklin Street
Mail Drop
BX32 05228
Boston, MA 02110
Age 67 | | Board member since 6/11 for RiverSource Funds and since 1/08 for Nations Funds | | Retired; President and Director, Foxstone Financial, Inc. (consulting), 2000-2007; Director, Mellon Financial Corporation affiliates (investing), 2000-2007; Chairman, Franklin Portfolio Associates (investing—Mellon affiliate), 1982-2007 | | 146 | | Trustee, Research Foundation of CFA Institute; Director, MIT Investment Company; Trustee, MIT 401k Plan; former Trustee, BofA Funds Series Trust (11 funds) | |
|
| Catherine James Paglia | | | | | | | | | |
|
901 S. Marquette Ave.
Minneapolis, MN 55402
Age 59 | | Board member since 11/04 for RiverSource Funds and since 6/11 for Nations Funds | | Director, Enterprise Asset Management, Inc. (private real estate and asset management company) | | 153 | | None | |
|
37
Fund Governance (continued)
Independent Board Members (continued)
| Name, Address, Age | | Position Held
with Funds
and Length
of Service | | Principal Occupation During Past Five Years | | Number of
Funds in the
Fund Family
Overseen by
Board Member | | Other Present or
Past Directorships/
Trusteeships
(Within Past 5 Years) | |
| Leroy C. Richie | | | | | | | | | |
|
901 S. Marquette Ave.
Minneapolis, MN 55402
Age 70 | | Board member since 2000 for Legacy Seligman funds, since 11/08 for RiverSource Funds and since 6/11 for Nations Funds | | Counsel, Lewis & Munday, P.C. since 2004; former Vice President and General Counsel, Automotive Legal Affairs, Chrysler Corporation | | 153 | | Director, Digital Ally, Inc. (digital imaging); Director, Infinity, Inc. (oil and gas exploration and production); Director, OGE Energy Corp. (energy and energy services) | |
|
| Minor M. Shaw | | | | | | | | | |
|
225 Franklin Street
Mail Drop
BX32 05228
Boston, MA 02110
Age 64 | | Board member since 6/11 for RiverSource Funds and since 2003 for Nations Funds | | President—Micco LLC (private investments) | | 146 | | Former Trustee, BofA Funds Series Trust (11 funds); Board Member, Piedmont Natural Gas; Director, Blue Cross Blue Shield of South Carolina | |
|
| Alison Taunton-Rigby | | | | | | | | | |
|
901 S. Marquette Ave.
Minneapolis, MN 55402
Age 67 | | Board member since 11/02 for RiverSource Funds and since 6/11 for Nations Funds | | Chief Executive Officer and Director, RiboNovix, Inc. 2003-2010 (biotechnology); former President, Aquila Biopharmaceuticals | | 153 | | Director, Healthways, Inc. (health management programs); Director, ICI Mutual Insurance Company, RRG; Director, Abt Associates (government contractor) | |
|
38
Fund Governance (continued)
Interested Board Member Not Affiliated with Investment Manager*
| Name, Address, Age | | Position Held
with Funds
and Length
of Service | | Principal Occupation During Past Five Years | | Number of
Funds in the
Fund Family
Overseen by
Board Member | | Other Present or
Past Directorships/
Trusteeships
(Within Past 5 Years) | |
| Anthony M. Santomero* | | | | | | | | | |
|
225 Franklin Street
Mail Drop
BX32 05228
Boston, MA 02110
Age 65 | | Board member since 6/11 for RiverSource Funds and since 1/08 for Nations Funds | | Richard K. Mellon Professor Emeritus of Finance, The Wharton School, University of Pennsylvania, since 2002; Senior Advisor, McKinsey & Company (consulting), 2006-2008; President and Chief Executive Officer, Federal Reserve Bank of Philadelphia, 2000-2006 | | 146 | | Director, Renaissance Reinsurance Ltd.; Trustee, Penn Mutual Life Insurance Company; Director, Citigroup; Director, Citibank, N.A.; former Trustee, BofA Funds Series Trust (11 funds) | |
|
* Dr. Santomero is not an affiliated person of the Investment Manager or Ameriprise Financial. However, he is currently deemed by the funds to be an "interested person" (as defined in the 1940 Act) of the Funds because he serves as a Director of Citigroup, Inc. and Citibank N.A., companies that may directly or through subsidiaries and affiliates engage from time-to-time in brokerage execution, principal transactions and lending relationships with the funds or accounts advised/managed by the Investment Manager.
Interested Board Member Affiliated with Investment Manager*
| William F. Truscott | | | | | | | | | |
|
53600 Ameriprise Financial Center
Minneapolis, MN 55474
Age 51 | | Board member since 11/01 for RiverSource Funds and since 6/11 for Nations Funds; Senior Vice President since 2002 for RiverSource Funds and 5/10 for Nations Funds | | Chairman of the Board and President, Columbia Management Investment Advisers, LLC since May 2010 and February 2012, respectively (previously President, Chairman of the Board and Chief Investment Officer, 2001-April 2010); Chief Executive Officer, U.S. Asset Management & President, Annuities, Ameriprise Financial, Inc. since May 2010 (previously President—U.S. Asset Management and Chief Investment Officer, 2005-April 2010); Director, President and Chief Executive Officer, Ameriprise Certificate Company since 2006; Director and Chief Executive Officer, Columbia Management Investment Distributors, Inc. since May 2010 and February 2012, respectively (previously Chairman of the Board and Chief Executive Officer, 2006-April 2010); Chairman of the Board and Chief Executive Officer, RiverSource Distributors, Inc. since 2006. | | 153 | | None | |
|
* Interested person (as defined under the 1940 Act) by reason of being an officer, director, security holder and/or employee of the Investment Manager or Ameriprise Financial.
The SAI has additional information about the Fund's Board members and is available, without charge, upon request by calling 800.345.6611; contacting your financial intermediary; or visiting columbiamanagement.com.
39
Fund Governance (continued)
Officers
| Name, Year of Birth and Address | | Principal Occupation(s) During the Past Five Years | |
| J. Kevin Connaughton (Born 1964) | |
|
225 Franklin Street
Boston, MA 02110
President (since 2009) | | Senior Vice President and General Manager—Mutual Fund Products, Columbia Management Investment Advisers, LLC since May 2010; President, Columbia Funds, since 2009, and RiverSource Funds, since May 2010 (previously Senior Vice President and Chief Financial Officer, Columbia Funds, from June 2008 to January 2009, Treasurer, Columbia Funds, from October 2003 to May 2008, and senior officer of various other affiliated funds since 2000); Managing Director, Columbia Management Advisors, LLC from December 2004 to April 2010. | |
|
| Michael G. Clarke (Born 1969) | |
|
225 Franklin Street
Boston, MA 02110
Treasurer (since 2011) and Chief Financial Officer (since 2009) | | Vice President, Columbia Management Investment Advisers, LLC since May 2010; Managing Director of Fund Administration, Columbia Management Advisors, LLC, from September 2004 to April 2010; senior officer of Columbia Funds and affiliated funds since 2002. | |
|
| Scott R. Plummer (Born 1959) | |
|
5228 Ameriprise Financial Center
Minneapolis, MN 55474
Senior Vice President and Chief Legal Officer (since 2010) | | Chief Legal Officer and Assistant Secretary, Columbia Management Investment Advisers, LLC since June 2005; Vice President and Lead Chief Counsel—Asset Management, Ameriprise Financial, Inc. since May 2010 (previously Vice President and Chief Counsel—Asset Management, from 2005 to April 2010, Vice President, Chief Counsel and Assistant Secretary, Columbia Management Investment Distributors, Inc. since 2008; Vice President, General Counsel and Secretary, Ameriprise Certificate Company since 2005; Chief Counsel, RiverSource Distributors, Inc. since 2006; Senior officer of Columbia Funds and affiliated funds, since 2006. | |
|
| Thomas P. McGuire (Born 1972) | |
|
225 Franklin Street
Boston, MA 02110
Chief Compliance Officer (since 2012) | | Vice President—Asset Management Compliance, Columbia Management Investment Advisers, LLC since March 2010; Chief Compliance Officer, Ameriprise Certificate Company, since September 2010; Compliance Executive, Bank of America, from June 2005 to April 2010. | |
|
| William F. Truscott (Born 1960) | |
|
53600 Ameriprise Financial Center
Minneapolis, MN 55474
Senior Vice President (since 2010) | | Chairman of the Board and President, Columbia Management Investment Advisers, LLC since May 2010 and February 2012, respectively (previously President, Chairman of the Board and Chief Investment Officer, from 2001 to April 2010); Chief Executive Officer, U.S. Asset Management & President, Annuities, Ameriprise Financial, Inc. since May 2010 (previously President—U.S. Asset Management and Chief Investment Officer from 2005 to April 2010); Director, President and Chief Executive Officer, Ameriprise Certificate Company since 2006; Director and Chief Executive Officer, Columbia Management Investment Distributors, Inc. since May 2010 and February 2012, respectively (previously Chairman of the Board and Chief Executive Officer from 2008 to April 2010); Chairman of the Board and Chief Executive Officer, RiverSource Distributors, Inc. since 2006. | |
|
| Paul D. Pearson (Born 1956) | |
|
10468 Ameriprise Financial Center
Minneapolis, MN 55474
Vice President and Assistant Treasurer
(since 2011) | | Vice President—Investment Accounting, Columbia Management Investment Advisers, LLC, since May 2010; Vice President—Managed Assets, Investment Accounting, Ameriprise Financial Corporation, 1998-2010 | |
|
40
Fund Governance (continued)
Officers (continued)
| Name, Year of Birth and Address | | Principal Occupation(s) During the Past Five Years | |
| Colin Moore (Born 1958) | |
|
225 Franklin Street
Boston, MA 02110
Senior Vice President (since 2010) | | Director and Chief Investment Officer, Columbia Management Investment Advisers, LLC since May 2010; Manager, Managing Director and Chief Investment Officer of Columbia Management Advisors, LLC from 2007 to April 2010; Head of Equities, Columbia Management Advisors, LLC from 2002 to 2007. | |
|
| Christopher O. Petersen (Born 1970) | |
|
5228 Ameriprise Financial Center
Minneapolis, MN 55474
Vice President and Secretary (since 2011) | | Vice President and Chief Counsel, Ameriprise Financial since January 2010 (formerly Vice President and Group Counsel or Counsel from April 2004 to January 2010); Senior officer of Columbia Funds and affiliated funds, since 2007. | |
|
| Amy K. Johnson (Born 1965) | |
|
5228 Ameriprise Financial Center
Minneapolis, MN 55474
Vice President (since 2010) | | Senior Vice President and Chief Operating Officer, Columbia Management Investment Advisers, LLC since May 2010 (previously Chief Administrative Officer, from 2009 until April 2010, Vice President—Asset Management and Trust Company Services, from 2006 to 2009, and Vice President—Operations and Compliance from 2004 to 2006). | |
|
| Joseph F. DiMaria (Born 1968) | |
|
225 Franklin Street
Boston, MA 02110
Vice President (since 2011) and Chief Accounting Officer (since 2008) | | Vice President, Mutual Fund Administration, Columbia Management Investment Advisers, LLC, since May 2010; Director of Fund Administration, Columbia Management Advisors, LLC from January 2006 to April 2010, past 5 years. | |
|
| Paul B. Goucher (Born 1968) | |
|
100 Park Avenue
New York, NY 10017
Vice President and Assistant Secretary (since 2010) | | Vice President and Chief Counsel of Ameriprise Financial since January 2010 (formerly Vice President and Group Counsel from November 2008 to January 2010); Director, Managing Director and General Counsel of J. & W. Seligman & Co. Incorporated (Seligman) from July 2008 to November 2008 and Managing Director and Associate General Counsel of Seligman from January 2005 to July 2008. | |
|
| Michael E. DeFao (Born 1968) | |
|
225 Franklin Street
Boston, MA 02110
Vice President and Assistant Treasurer (since 2011) | | Vice President and Chief Counsel, Ameriprise Financial since May 2010; Associate General Counsel, Bank of America from June 2005 to April 2010 | |
|
| Stephen T. Welsh (Born 1957) | |
|
225 Franklin Street
Boston, MA 02110
Vice President (since 2006) | | President and Director, Columbia Management Investment Services Corp. since May 2010; President and Director, Columbia Management Services, Inc. from July 2004 to April 2010; Managing Director, Columbia Management Distributors, Inc. from August 2007 to April 2010. | |
|
41
This page intentionally left blank.
42
This page intentionally left blank.
43
This page intentionally left blank.
44
Important Information About This Report
The fund mails one shareholder report to each shareholder address. If you would like more than one report, please call shareholder services at 1-800-345-6611 and additional reports will be sent to you. This report has been prepared for shareholders of Columbia Small Cap Value Fund II.
A description of the policies and procedures that the fund uses to determine how to vote proxies and a copy of the fund's voting records are available (i) at www.columbiamanagement.com, (ii) on the Securities and Exchange Commission's website at www.sec.gov, and (iii) without charge, upon request, by calling 1-800-368-0346. Information regarding how the fund voted proxies relating to portfolio securities during the 12-month period ended June 30 is available from the SEC's website. Information regarding how the fund voted proxies relating to portfolio securities is also available from the fund's website, www.columbiamanagement.com.
The fund files a complete schedule of portfolio holdings with the SEC for the first and third quarters of each fiscal year on Form N-Q. The fund's Form N-Q is available on the SEC's website at www.sec.gov and may be reviewed and copied at the SEC's Public Reference Room in Washington, D.C. Information on the operation of the Public Reference Room may be obtained by calling 1-800-SEC-0330.
Transfer Agent
Columbia Management Investment
Services Corp.
P.O. Box 8081
Boston, MA 02266-8081
1-800-345-6611
Distributor
Columbia Management Investment
Distributors, Inc.
225 Franklin Street
Boston, MA 02110
Investment Manager
Columbia Management Investment Advisers, LLC
225 Franklin Street
Boston, MA 02110
45

Columbia Small Cap Value Fund II
P. O. Box 8081
Boston, MA 02266-8081
columbiamanagement.com
This information is for use with concurrent or prior delivery of a fund prospectus. Investors should consider the investment objectives, risks, charges and expenses of a mutual fund carefully before investing. For a free prospectus, which contains this and other important information about the funds, visit columbiamanagement.com. Read the prospectus carefully before investing. The Fund is distributed by Columbia Management Investment Distributors, Inc., member FINRA, and managed by Columbia Management Investment Advisers, LLC.
© 2012 Columbia Management Investment Advisers, LLC. All rights reserved.
C-1221 C (4/12)

Columbia International Value Fund
Annual Report for the Period Ended February 29, 2012
Not FDIC insured • No bank guarantee • May lose value
Table of Contents
| Fund Profile | | | 1 | | |
|
| Performance Information | | | 2 | | |
|
| Fund Expense Example | | | 3 | | |
|
| Portfolio Managers' Report | | | 4 | | |
|
| Portfolio of Investments | | | 6 | | |
|
| Financial Statements | | | 7 | | |
|
| Financial Highlights | | | 11 | | |
|
| Notes to Financial Statements | | | 17 | | |
|
Report of Independent Registered
Public Accounting Firm | | | 25 | | |
|
| Federal Income Tax Information | | | 26 | | |
|
Columbia International Value
Master Portfolio | | | 27 | | |
|
| Portfolio of Investments | | | 28 | | |
|
| Financial Statements | | | 33 | | |
|
| Financial Highlights | | | 36 | | |
|
| Notes to Financial Statements | | | 37 | | |
|
Report of Independent Registered
Public Accounting Firm | | | 44 | | |
|
| Fund Governance | | | 45 | | |
|
Important Information About
This Report | | | 53 | | |
|
The views expressed in this report reflect the current views of the respective parties. These views are not guarantees of future performance and involve certain risks, uncertainties and assumptions that are difficult to predict, so actual outcomes and results may differ significantly from the views expressed. These views are subject to change at any time based upon economic, market or other conditions and the respective parties disclaim any responsibility to update such views. These views may not be relied on as investment advice and, because investment decisions for a Columbia Fund are based on numerous factors, may not be relied on as an indication of trading intent on behalf of any particular Columbia Fund. References to specific securities should not be construed as a recommendation or investment advice.
President's Message

Dear Shareholders,
Americans were dispirited in the fourth quarter of 2011 by Washington's inability to reach a plan for deficit reduction and Europe's piecemeal attempt to address its own fiscal issues. Yet, there was sufficient good news to encourage risk taking, buoying both stocks and bonds to solid gains.
U.S. economic data surprised on the upside and fears of recession abated. With the bar of expectations set low, investors responded positively to the announcement that the economy had expanded by 1.8% in the third quarter. Consumer confidence improved, even though consumers remain under pressure with no real increase in disposable income and a continued decline in household net worth. Headline inflation—which tracks a broad range of consumer expenditures, including food and energy—declined. Even manufacturing held its ground.
Against this backdrop, the U.S. equity markets logged solid returns. The S&P 500 Index gained 11.82%, moving into positive territory for the year with quarterly advances in all ten sectors. Mid- and small-cap stocks did even better. Value outperformed growth across all market capitalizations. Energy stocks led the market, as the price of oil moved above $100 a barrel in December. Industrials and materials stocks rose, buoyed by improving economic data. The U.S. fixed-income markets logged modest but solid returns. High-yield bonds were the best performers as the economy showed signs of improvement. Emerging market bonds were strong performers, as inflation came under control in key regions. Municipal bonds and Treasuries eked out only modest gains, as investors moved away from quality in favor of riskier assets.
While fourth quarter gains were encouraging, challenges still remain. Columbia Management, however, remains strong and steadfast. Columbia Management is the eighth largest manager of long-term mutual fund assets with $326 billion under management as of December 31, 2011. The past year has been one of considerable change for the organization as we worked diligently to align products, services and resources in the integration of Columbia Management with RiverSource Investments. The strong line-up of talent, resources and capabilities that has resulted is highlighted by the success of our products. As of December 31, 2011, Columbia Management offers 52 funds rated either 4 or 5 stars by Morningstar.*
For more information about these and other funds offered by Columbia Management, including detailed, up-to-date fund performance and portfolio information, please visit us online at columbiamanagement.com. Other information and resources available on our website include:
g timely economic analysis and market commentary
g quarterly fund commentaries
g Columbia Management Investor, a quarterly newsletter for shareholders
Thank you for your continued support of the Columbia Funds. We look forward to serving your investment needs for many years to come.
Best Regards,

J. Kevin Connaughton
President, Columbia Funds
* All ratings are based on Class Z shares as of 12/31/2011. Out of 119 Class Z share Columbia funds rated by Morningstar, 7 funds received a 5-star Overall Rating and 45 funds received a 4-star Overall Rating. The Overall Morningstar Rating for a retail mutual fund is derived from a weighted average of the performance figures associated with its 3-, 5- and 10-year (if applicable) Morningstar Rating metrics. For share classes that do not have a 3-, 5-, or 10-year actual performance history, the fund's independent Morningstar Rating metric is then compared against the retail mutual fund universe breakpoints to determine its hypothetical rating.
For each fund with at least a three-year history, Morningstar calculates a Morningstar RatingTM based on a Morningstar Risk-Adjusted Return measure that accounts for variation in a fund's monthly performance (including the effects of sales charges/loads, and redemption fees), placing more emphasis on downward variations and rewarding consistent performance. The top 10% of funds in each category receive 5 stars, the next 22.5% receive 4 stars, the next 35% receive 3 stars, the next 22.5% receive 2 stars and the bottom 10% receive 1 star. (Each share class is counted as a fraction of one fund within this scale and rated separately, which may cause slight variations in the distribution percentages.)
The Morningstar RatingTM is for Class Z shares only; other classes may have different performance characteristics and may have different ratings. ©2012 Morningstar, Inc. All Rights Reserved. The Morningstar information contained herein: (1) is proprietary to Morningstar and/or its content providers; (2) may not be copied or distributed; and (3) is not warranted to be accurate, complete or timely. Neither Morningstar nor its content providers are responsible for any damages or losses arising from any use of this information.
Investors should consider the investment objectives, risks, charges and expenses of a mutual fund carefully before investing. For a free prospectus, which contains this and other important information about the funds, visit columbiamanagement.com. The prospectus should be read carefully before investing.
Columbia Funds are distributed by Columbia Management Investment Distributors, Inc., member FINRA, and managed by Columbia Management Investment Advisers, LLC.
© 2012 Columbia Management Investment Advisers, LLC. All rights reserved.
Fund Profile – Columbia International Value Fund
Summary
• The fund is a feeder fund that invests all or substantially all of its assets in a master portfolio.
• For the 12-month period that ended February 29, 2012, the fund's Class A shares returned –9.51% without sales charge.
• The fund's benchmark, the MSCI EAFE Value Index (Net), returned –9.85% for the same period.1
• In a challenging period for international stock markets, the fund held up slightly better than the benchmark, aided by security selection and group weights in the pharmaceuticals industry and companies domiciled in Japan.
Portfolio Management
The fund is managed by Columbia Management Investment Advisers, LLC (the Investment Manager). The Investment Manager has retained Brandes Investment Partners, L.P. (Brandes) to serve as investment subadviser to the fund. As an investment subadviser, Brandes makes the investment decisions and manages all or a portion of the Fund. Brandes is an investement adviser registered with the Securities and Exchange Commission. Brandes is not affiliated with the Investment Manager.
The following are the six voting members of Brandes' Large Cap Investment Committee who are jointly responsible for making day-to-day investment decisions for the Fund: Glenn Carlson, Brent Woods, Amelia Morris, Jim Brown, Brent Fredberg, and Jeffrey Germain. Chief Executive Officer (CEO) Glenn Carlson has been with Brandes since 1986, serving as Managing Partner from 1996-2002, co-CEO from 2002-2004, and CEO since 2004. Brent Woods has been with Brandes since 1995, serving as Managing Partner from 1998-2002 and Managing Director of Investments since 2002. Amelia Morris has been with Brandes since 1998, serving as a Senior Research Analyst from 1998-2004, and Director of Investments since 2004. Jim Brown has been with Brandes since 1996, serving as a Senior Research Analyst from 1996-2004, and Director of Investments since 2004. Brent Fredberg has been with Brandes since 1999, serving as an Analyst from 1999-2004, serving as Senior Research Analyst from 2004-2010, and Director of Investments since 2010. Jeffrey Germain has been with Brandes since 2001, serving as a Research Associate from 2001-2004, Senior Research Associate from 2004-2005, Research Analyst from 2005-2010, and Senior Analyst since 2010.
1The MSCI Europe, Australasia and the Far East (EAFE) Value Index (Net) is a subset of the MSCI EAFE Index (Net), and constituents of the index include securities from Europe, Australasia and the Far East. The index generally represents approximately 50% of the free float-adjusted market capitalization of the underlying MSCI EAFE Index (Net), and consists of those securities classified by Morgan Stanley Capital International, Inc. (MSCI) as most representing the value style, such as higher book value-to-price ratios, higher forward earnings-to-price ratios, higher dividend yields and lower forecasted growth rates than securities representing the growth style.
Indices are not available for investment, are not professionally managed and do not reflect sales charges, fees, brokerage commissions, taxes or other expenses of investing. Securities in the fund may not match those in an index.
Performance data quoted represents past performance and current performance may be lower or higher. Past performance is no guarantee of future results. The investment return and principal value will fluctuate so that shares, when redeemed, may be worth more or less than the original cost. Please visit www.columbiamanagement.com for daily and most recent month-end performance updates.
Summary
1-year return as of 02/29/12
| | | | –9.51% | |
|
|  | | | Class A shares
(without sales charge) | |
|
| | | | –9.85% | |
|
|  | | | MSCI EAFE Value Index (Net) | |
|
Morningstar Style BoxTM

The Morningstar Style BoxTM is based on the fund's portfolio holdings. For equity funds, the vertical axis shows the market capitalization of the stocks owned, and the horizontal axis shows investment style (value, blend, or growth). Information shown is based on the most recent data provided by Morningstar.
© 2012 Morningstar, Inc. All rights reserved. The Morningstar information contained herein: (1) is proprietary to Morningstar and/or its content providers; (2) may not be copied or distributed; and (3) is not warranted to be accurate, complete or timely. Neither Morningstar nor its content providers are responsible for any damages or losses arising from any use of this information.
1
Performance Information – Columbia International Value Fund
Performance data quoted represents past performance and current performance may be lower or higher. Past performance is no guarantee of future results. The investment return and principal value will fluctuate so that shares, when redeemed, may be worth more or less than the original cost. Please visit www.columbiamanagement.com for daily and most recent month-end performance updates.
Performance of a $10,000 investment 03/01/02 – 02/29/12
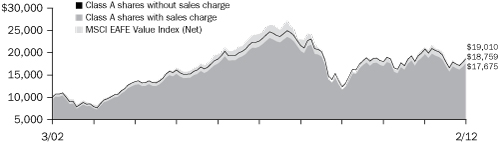
The chart above shows the change in value of a hypothetical $10,000 investment in Class A shares of Columbia International Value Fund during the stated time period, and does not reflect the deduction of taxes that a shareholder may pay on fund distributions or on the redemption of fund shares.
Performance of a $10,000 investment 03/01/02 – 02/29/12 ($)
| Sales charge | | without | | with | |
| Class A | | | 18,759 | | | | 17,675 | | |
| Class B | | | 17,419 | | | | 17,419 | | |
| Class C | | | 17,399 | | | | 17,399 | | |
| Class I* | | | 18,180 | | | | n/a | | |
| Class R* | | | 18,208 | | | | n/a | | |
| Class Z | | | 19,227 | | | | n/a | | |
Average annual total return as of 02/29/12 (%)
| Share class | | A | | B | | C | | I* | | R* | | Z | |
| Inception | | 12/27/95 | | 05/22/98 | | 06/15/98 | | 09/27/10 | | 09/27/10 | | 12/27/95 | |
| Sales charge | | without | | with | | without | | with | | without | | with | | without | | without | | without | |
| 1-year | | | –9.51 | | | | –14.70 | | | | –10.28 | | | | –14.62 | | | | –10.24 | | | | –11.11 | | | | –12.47 | | | | –9.90 | | | | –9.35 | | |
| 5-year | | | –3.60 | | | | –4.73 | | | | –4.30 | | | | –4.55 | | | | –4.33 | | | | –4.33 | | | | –4.20 | | | | –3.90 | | | | –3.36 | | |
| 10-year | | | 6.49 | | | | 5.86 | | | | 5.71 | | | | 5.71 | | | | 5.69 | | | | 5.69 | | | | 6.16 | | | | 6.18 | | | | 6.76 | | |
The "with sales charge" returns include the maximum initial sales charge of 5.75% for Class A shares and the applicable contingent deferred sales charge of 5.00% in the first year, declining to 1.00% in the sixth year and eliminated thereafter for Class B shares and 1.00% for Class C shares for the first year only. The "without sales charge" returns do not include the effect of sales charges. If they had, returns would have been lower.
Class I and Class R were initially offered by the fund on September 27, 2010.
Performance results reflect any fee waivers or reimbursements of fund expenses by the Columbia Management Investment Advisers, LLC and/or any of its affiliates. Absent these fee waivers or expense reimbursement arrangements, performance results would have been lower.
All results shown assume reinvestment of distributions. Class I and Z shares are sold at net asset value with no distribution and service (Rule 12b-1) fees. Class R shares are sold at net asset value with a distribution (Rule 12b-1) fee. Class I, Class R and Class Z shares have limited eligibility and the investment minimum requirements may vary. Please see the fund's prospectuses for details. Performance for different share classes will vary based on differences in sales charges and fees associated with each class.
The tables do not reflect the deduction of taxes that a shareholder may pay on fund distributions or on the redemption of fund shares.
*The returns shown for periods prior to the share class inception date (including returns since inception, which are since fund inception) include the returns of the fund's Class A shares, the fund's oldest share class. These returns are adjusted to reflect any higher class-related operating expenses of the newer share classes, as applicable. Please visit columbiamanagement.com/mutual-fund/appended-performance for more information.
2
Fund Expense Example – Columbia International Value Fund
As an investor, you incur two types of costs. There are transaction costs, which generally include sales charges on purchases and may include redemption fees. There are also ongoing costs, which generally include management fees, distribution and service (Rule 12b-1) fees, and other fund expenses. The following information is intended to help you understand your ongoing costs (in dollars) of investing in the Fund and to help you compare these costs with the ongoing costs of investing in other mutual funds.
Analyzing your fund's expenses
To illustrate these ongoing costs, we have provided examples and calculated the expenses paid by investors in each share class of the Fund during the period. The actual and hypothetical information in the table is based on an initial investment of $1,000 at the beginning of the period indicated and held for the entire period. Expense information is calculated two ways and each method provides you with different information. The amount listed in the "Actual" column is calculated using the Fund's actual operating expenses and total return for the period. You may use the Actual information, together with the amount invested, to estimate the expenses that you paid over the period. Simply divide your account value by $1,000 (for example, an $8,600 account value divided by $1,000 = 8.6), then multiply the results by the expenses paid during the period under the Actual column. The amount listed in the "Hypothetical" column assumes a 5% annual rate of return before expenses (which is not the Fund's actual return) and then applies the Fund's actual expense ratio for the period to the hypothetical return. You should not use the hypothetical account values and expenses to estimate either your actual account balance at the end of the period or the expenses you paid during the period. See "Compare with other funds" below for details on how to use the hypothetical data.
Compare with other funds
Since all mutual funds are required to include the same hypothetical calculations about expenses in shareholder reports, you can use this information to compare the ongoing cost of investing in the Fund with other funds. To do so, compare the hypothetical example with the 5% hypothetical examples that appear in the shareholder reports of other funds. As you compare hypothetical examples of other funds, it is important to note that hypothetical examples are meant to highlight the ongoing costs of investing in a fund only and do not reflect any transaction costs, such as sales charges, or redemption or exchange fees. Therefore, the hypothetical calculations are useful in comparing ongoing costs only, and will not help you determine the relative total costs of owning different funds. If transaction costs were included in these calculations, your costs would be higher.
09/01/11 – 02/29/12
| | | Account value at the
beginning of the period ($) | | Account value at the
end of the period ($) | | Expenses paid
during the period ($) | | Fund's annualized
expense ratio (%) | |
| | | Actual | | Hypothetical | | Actual | | Hypothetical | | Actual | | Hypothetical | | Actual | |
| Class A | | | 1,000.00 | | | | 1,000.00 | | | | 1,046.90 | | | | 1,018.25 | | | | 6.77 | | | | 6.67 | | | | 1.33 | | |
| Class B | | | 1,000.00 | | | | 1,000.00 | | | | 1,042.60 | | | | 1,014.47 | | | | 10.61 | | | | 10.47 | | | | 2.09 | | |
| Class C | | | 1,000.00 | | | | 1,000.00 | | | | 1,042.80 | | | | 1,014.52 | | | | 10.56 | | | | 10.42 | | | | 2.08 | | |
| Class I | | | 1,000.00 | | | | 1,000.00 | | | | 1,010.40 | | | | 1,019.34 | | | | 5.55 | | | | 5.57 | | | | 1.11 | | |
| Class R | | | 1,000.00 | | | | 1,000.00 | | | | 1,044.20 | | | | 1,017.01 | | | | 8.03 | | | | 7.92 | | | | 1.58 | | |
| Class Z | | | 1,000.00 | | | | 1,000.00 | | | | 1,048.10 | | | | 1,019.44 | | | | 5.55 | | | | 5.47 | | | | 1.09 | | |
Expenses paid during the period are equal to the annualized expense ratio for each class as indicated above, multiplied by the average account value over the period and then multiplied by the number of days in the Fund's most recent fiscal half year and divided by 366.
Had Columbia Management Investment Advisers, LLC and/or any of its affiliates not waived/reimbursed a portion of fees and expenses, account value at the end of the period would have been reduced.
3
Portfolio Managers' Report – Columbia International Value Fund
Performance data quoted represents past performance and current performance may be lower or higher. Past performance is no guarantee of future results. The investment return and principal value will fluctuate so that shares, when redeemed, may be worth more or less than the original cost. Please visit www.columbiamanagement.com for daily and most recent month-end performance updates.
Net asset value per share
as of 02/29/12 ($)
| Class A | | | 13.14 | | |
| Class B | | | 12.68 | | |
| Class C | | | 12.64 | | |
| Class I | | | 12.77 | | |
| Class R | | | 13.15 | | |
| Class Z | | | 13.27 | | |
Distributions declared per share
03/01/11- 02/29/12 ($)
| Class A | | | 0.49 | | |
| Class B | | | 0.39 | | |
| Class C | | | 0.39 | | |
| Class I | | | 0.55 | | |
| Class R | | | 0.46 | | |
| Class Z | | | 0.53 | | |
For the 12-month period that ended February 29, 2012, the fund's Class A shares returned –9.51% without sales charge. The fund's benchmark, the MSCI EAFE Value Index (Net), returned –9.85% over the same period. In a difficult period for international stock markets, security selection and group weights in the pharmaceuticals industry and companies domiciled in Japan aided fund performance relative to the index. Please keep in mind that industry and country weights are a residual of our bottom-up, stock-specific investment approach.
Portfolio activity
Advances among the fund's holdings in the pharmaceuticals and tobacco industries had the most substantial impact on returns during the 12-month period. Top-performing positions in these industries included GlaxoSmithKline, a U.K. pharmaceutical company and Japan-based Japan Tobacco (1.7% and 1.1% of net assets, respectively).
Stock selection within the household durables and insurance industries proved unfavorable to performance relative to the index. In addition, the fund had more exposure than the index to securities in Italy, which contributed to weaker results. By contrast, the fund's holdings in the wireless telecommunications services and multiline retail industries performed better than the index, helping both absolute and relative performance.
From a country perspective, gains from companies based in the United Kingdom, New Zealand and Ireland made positive contributions to returns. Kingfisher, a U.K. specialty retail company (1.3% of net assets), Telecom Corp. of New Zealand (position eliminated) and CRH PLC, a construction materials company from Ireland (1.5% of net assets) were among the standout performers from these countries.
Research drives portfolio changes
As a result of our company-by-company analysis, we made adjustments to certain existing positions within the fund during the year. We sold the fund's position in Nokia, a Finland-based communication equipment company, to pursue what we believe to be more attractive opportunities. During the same period, we purchased shares of Akzo Nobel (0.8% of net assets), the Netherlands-based chemical company and America Movil SAB (0.9% of net assets), a wireless telecommunications services company based in Mexico, at prices that we considered to be attractive.
Looking ahead
The last 12 months were challenging for the fund. In this environment, the large-cap investment committee continued to actively monitor and assess the broad global economic developments, especially those coming out of Europe. When and where possible, the committee incorporates changes into company-level valuations, such as in the form of lower normalized earnings multiples, longer time value of money discounts, or lower returns on equity. Amid the macroeconomic and geopolitical
4
Portfolio Managers' Report (continued) – Columbia International Value Fund
challenges facing the global economy, we continue to identify and invest in potentially under-valued companies trading at a discount to their estimated intrinsic values, or what we believe they are worth.
The foregoing reflects the thoughts and opinions of Brandes Investment Partners® exclusively and is subject to change without notice.
Brandes Investment Partners® is a registered trademark of Brandes Investment Partners, L.P. in the United States and Canada.
Source for all statistical data: Columbia Management Investment Advisers, LLC.
Source for all stock-specific commentary: Brandes
Portfolio characteristics and holdings are subject to change periodically and may not be representative of current characteristics and holdings. The outlook for the fund may differ from those presented for other Columbia Funds.
Equity securities are affected by stock market fluctuations that occur in response to economic and business developments.
International investing may involve special risks, including foreign taxation, currency risks, risks associated with possible differences in financial standards and other risks associated with future political and economic developments.
Investing in emerging markets may involve greater risks than investing in more developed countries. In addition, concentration of investments in a single region may result in greater volatility.
Top 10 holdings
as of 02/29/12 (%)
| ENI SpA | | | 3.8 | | |
| Total SA | | | 3.3 | | |
| Nippon Telegraph & Telephone Corp. | | | 2.6 | | |
| Telecom Italia SpA, Savings Shares | | | 2.5 | | |
| Sanofi | | | 2.4 | | |
| Swiss Re AG | | | 2.3 | | |
| Toyota Motor Corp. | | | 2.3 | | |
| France Telecom SA | | | 2.3 | | |
| BP PLC | | | 2.2 | | |
| AstraZeneca PLC | | | 2.1 | | |
The master portfolio is actively managed and the composition of its portfolio will change over time. Percentages indicated are based upon total investments (excluding Investments of Cash Collateral Received for Securities on Loan and affiliated money market fund.)
The fund is a feeder fund that invests all or substantially all of its assets in a master portfolio. Holdings information referenced in this section is that of the master portfolio.
5
Portfolio of Investments – Columbia International Value Fund
February 29, 2012
| | | Value | |
| Investment Company – 100.1% | |
Investment in Columbia Funds
Master Investment Trust, LLC,
Columbia International Value
Master Portfolio(a) | | $ | 1,187,396,745 | | |
| Total Investments | | $ | 1,187,396,745 | | |
| Other Assets & Liabilities, Net | | | (1,145,633 | ) | |
| Net Assets | | $ | 1,186,251,112 | | |
| Notes to Portfolio of Investments | |
(a) The financial statements of Columbia International Value Master Portfolio, including its investment portfolio, are included elsewhere within this report and should be read in conjunction with Columbia International Value Fund's financial statements.
Columbia International Value Fund invests only in Columbia International Value Master Portfolio (the Master Portfolio). At February 29, 2012, Columbia International Value Fund owned 92.0% of the Master Portfolio. Columbia International Value Master Portfolio was invested in the following sectors at February 29, 2012.
| Sector (Unaudited) | | Value | | % of Total
Investments(1) | |
| Consumer Discretionary | | $ | 114,406,027 | | | | 8.9 | | |
| Consumer Staples | | | 139,421,319 | | | | 10.8 | | |
| Energy | | | 153,959,635 | | | | 12.0 | | |
| Financials | | | 231,088,890 | | | | 18.0 | | |
| Health Care | | | 157,873,812 | | | | 12.3 | | |
| Industrials | | | 12,788,196 | | | | 1.0 | | |
| Information Technology | | | 110,036,372 | | | | 8.5 | | |
| Materials | | | 56,294,657 | | | | 4.4 | | |
| Telecommunication Services | | | 232,692,728 | | | | 18.1 | | |
| Utilities | | | 30,036,169 | | | | 2.3 | | |
| Cash Equivalents | | | 47,968,082 | | | | 3.7 | | |
| | | $ | 1,286,565,887 | | | | 100.0 | | |
(1) Percentages indicated are based upon total investments (excluding Investments of Cash Collateral Received for Securities on Loan).
The Accompanying Notes to Financial Statements are an integral part of this statement.
6
Statement of Assets and Liabilities – Columbia International Value Fund
February 29, 2012
| Assets | |
| Investments, at value | |
| Columbia International Value Master Portfolio (identified cost $1,384,177,724) | | $ | 1,187,396,745 | | |
| Cash | | | 1,536,464 | | |
| Receivable for: | |
| Capital shares sold | | | 1,406,676 | | |
| Prepaid expense | | | 15,527 | | |
| Total assets | | | 1,190,355,412 | | |
| Liabilities | |
| Payable to Master Portfolio | | | 1,536,464 | | |
| Payable for: | |
| Capital shares purchased | | | 2,089,997 | | |
| Expense reimbursement due to Investment Manager | | | 202,516 | | |
| Distribution and service fees | | | 2,545 | | |
| Transfer agent fees | | | 160,529 | | |
| Administration fees | | | 5,556 | | |
| Other expenses | | | 106,693 | | |
| Total liabilities | | | 4,104,300 | | |
| Net assets applicable to outstanding capital stock | | $ | 1,186,251,112 | | |
| Represented by | |
| Paid-in capital | | $ | 1,775,123,306 | | |
| Excess of distributions over net investment income | | | (2,445,137 | ) | |
| Accumulated net realized loss | | | (389,646,078 | ) | |
| Unrealized appreciation (depreciation) on: | |
| Investments | | | (196,780,979 | ) | |
| Total — representing net assets applicable to outstanding capital stock | | $ | 1,186,251,112 | | |
| Net assets applicable to outstanding shares | |
| Class A | | $ | 225,747,229 | | |
| Class B | | $ | 807,210 | | |
| Class C | | $ | 34,909,675 | | |
| Class I | | $ | 2,286 | | |
| Class R | | $ | 7,784 | | |
| Class Z | | $ | 924,776,928 | | |
| Shares outstanding | |
| Class A | | | 17,186,275 | | |
| Class B | | | 63,650 | | |
| Class C | | | 2,761,653 | | |
| Class I | | | 179 | | |
| Class R | | | 592 | | |
| Class Z | | | 69,695,246 | | |
| Net asset value per share | |
| Class A(a) | | $ | 13.14 | | |
| Class B | | $ | 12.68 | | |
| Class C | | $ | 12.64 | | |
| Class I | | $ | 12.77 | | |
| Class R | | $ | 13.15 | | |
| Class Z | | $ | 13.27 | | |
(a) The maximum offering price per share for Class A is $13.94. The offering price is calculated by dividing the net asset value by 1.0 minus the maximum sales charge of 5.75%.
The Accompanying Notes to Financial Statements are an integral part of this statement.
7
Statement of Operations – Columbia International Value Fund
Year ended February 29, 2012
| Net investment income | |
| Income allocated from Master Portfolio: | |
| Dividends | | $ | 65,625,429 | | |
| Interest | | | 2,037 | | |
| Dividends from affiliates | | | 11,966 | | |
| Income from securities lending — net | | | 516,668 | | |
| Foreign taxes withheld | | | (9,250,118 | ) | |
| Expenses allocated from Master Portfolio(a) | | | (11,727,761 | ) | |
| Line of credit interest expense allocated from Master Portfolio | | | (30,938 | ) | |
| Total income | | | 45,147,283 | | |
| Expenses: | |
| Distribution fees | |
| Class B | | | 7,973 | | |
| Class C | | | 320,101 | | |
| Class R | | | 17 | | |
| Service fees | |
| Class B | | | 2,658 | | |
| Class C | | | 106,700 | | |
| Distribution and service fees — Class A | | | 678,520 | | |
| Transfer agent fees | |
| Class A | | | 517,800 | | |
| Class B | | | 1,931 | | |
| Class C | | | 81,302 | | |
| Class R | | | 9 | | |
| Class Z | | | 1,914,428 | | |
| Administration fees | | | 2,258,470 | | |
| Compensation of board members | | | 53,694 | | |
| Custodian fees | | | 5,335 | | |
| Pricing and bookkeeping fees | | | 16,344 | | |
| Printing and postage fees | | | 180,020 | | |
| Registration fees | | | 121,366 | | |
| Professional fees | | | 59,136 | | |
| Chief compliance officer expenses | | | 252 | | |
| Other | | | 39,689 | | |
| Total expenses | | | 6,365,745 | | |
| Fees waived or expenses reimbursed by Investment Manager and its affiliates | | | (1,523,364 | ) | |
| Expense reductions | | | (1,440 | ) | |
| Total net expenses | | | 4,840,941 | | |
| Net investment income | | | 40,306,342 | | |
| Realized and unrealized gain (loss) — net | |
| Net realized gain (loss) allocated from Master Portfolio on: | |
| Investments | | | (101,711,641 | ) | |
| Foreign currency translations | | | 289,366 | | |
| Net realized loss | | | (101,422,275 | ) | |
| Net change in unrealized appreciation (depreciation) allocated from Master Portfolio on: | |
| Investments | | | (107,890,152 | ) | |
| Net change in unrealized depreciation | | | (107,890,152 | ) | |
| Net realized and unrealized loss | | | (209,312,427 | ) | |
| Net decrease in net assets from operations | | $ | (169,006,085 | ) | |
(a) Net expenses allocated from Master Portfolio include the Fund's pro-rata portion of the Master Portfiolio's investment management fees, administration fees, compensation of board members, custodian fees and other expenses.
The Accompanying Notes to Financial Statements are an integral part of this statement.
8
Statement of Changes in Net Assets – Columbia International Value Fund
| | | Year ended
February 29,
2012 | | Year ended
February 28,
2011(a) | |
| Operations | |
| Net investment income | | $ | 40,306,342 | | | $ | 29,006,191 | | |
| Net realized loss allocated from Master Portfolio | | | (101,422,275 | ) | | | (79,638,678 | ) | |
| Net change in unrealized appreciation (depreciation) allocated from Master Portfolio | | | (107,890,152 | ) | | | 287,733,276 | | |
| Net increase (decrease) in net assets resulting from operations | | | (169,006,085 | ) | | | 237,100,789 | | |
| Distributions to shareholders from: | |
| Net investment income | |
| Class A | | | (8,774,790 | ) | | | (10,501,221 | ) | |
| Class B | | | (27,711 | ) | | | (31,120 | ) | |
| Class C | | | (1,145,212 | ) | | | (1,255,137 | ) | |
| Class I | | | (33,455 | ) | | | (29,462 | ) | |
| Class R | | | (82 | ) | | | (45 | ) | |
| Class Z | | | (36,299,996 | ) | | | (36,753,860 | ) | |
| Total distributions to shareholders | | | (46,281,246 | ) | | | (48,570,845 | ) | |
| Increase (decrease) in net assets from share transactions | | | (337,926,958 | ) | | | (90,034,060 | ) | |
| Proceeds from regulatory settlements (Note 5) | | | 81,090 | | | | 108,538 | | |
| Total increase (decrease) in net assets | | | (553,133,199 | ) | | | 98,604,422 | | |
| Net assets at beginning of year | | | 1,739,384,311 | | | | 1,640,779,889 | | |
| Net assets at end of year | | $ | 1,186,251,112 | | | $ | 1,739,384,311 | | |
| Excess of distributions over net investment income | | $ | (2,445,137 | ) | | $ | (6,314,587 | ) | |
(a) Class I and Class R shares are for the period from September 27, 2010 (commencement of operations) to February 28, 2011.
The Accompanying Notes to Financial Statements are an integral part of this statement.
9
Statement of Changes in Net Assets (continued) – Columbia International Value Fund
| | | Year ended February 29,
2012 | | Year ended February 28,
2011(a) | |
| | | Shares | | Dollars ($) | | Shares | | Dollars ($) | |
| Capital stock activity | |
| Class A shares | |
| Subscriptions(b) | | | 3,807,023 | | | | 51,147,403 | | | | 7,203,721 | | | | 99,387,352 | | |
| Distributions reinvested | | | 500,111 | | | | 6,030,999 | | | | 618,142 | | | | 8,293,553 | | |
| Redemptions | | | (11,441,576 | ) | | | (156,058,831 | ) | | | (11,725,247 | ) | | | (161,161,045 | ) | |
| Net decrease | | | (7,134,442 | ) | | | (98,880,429 | ) | | | (3,903,384 | ) | | | (53,480,140 | ) | |
| Class B shares | |
| Subscriptions | | | 15,890 | | | | 209,769 | | | | 24,199 | | | | 326,879 | | |
| Distributions reinvested | | | 1,770 | | | | 20,511 | | | | 1,744 | | | | 22,401 | | |
| Redemptions(b) | | | (52,388 | ) | | | (673,782 | ) | | | (578,776 | ) | | | (7,649,102 | ) | |
| Net decrease | | | (34,728 | ) | | | (443,502 | ) | | | (552,833 | ) | | | (7,299,822 | ) | |
| Class C shares | |
| Subscriptions | | | 249,459 | | | | 3,293,863 | | | | 287,489 | | | | 3,834,791 | | |
| Distributions reinvested | | | 65,034 | | | | 752,044 | | | | 66,784 | | | | 861,421 | | |
| Redemptions | | | (1,521,712 | ) | | | (19,861,019 | ) | | | (1,304,444 | ) | | | (17,279,783 | ) | |
| Net decrease | | | (1,207,219 | ) | | | (15,815,112 | ) | | | (950,171 | ) | | | (12,583,571 | ) | |
| Class I shares | |
| Subscriptions | | | 29,397 | | | | 431,921 | | | | 2,946,162 | | | | 41,364,980 | | |
| Distributions reinvested | | | 2,341 | | | | 33,356 | | | | 2,089 | | | | 29,403 | | |
| Redemptions | | | (2,291,500 | ) | | | (33,085,036 | ) | | | (688,310 | ) | | | (9,989,541 | ) | |
| Net increase (decrease) | | | (2,259,762 | ) | | | (32,619,759 | ) | | | 2,259,941 | | | | 31,404,842 | | |
| Class R shares | |
| Subscriptions | | | 411 | | | | 4,831 | | | | 181 | | | | 2,500 | | |
| Net increase | | | 411 | | | | 4,831 | | | | 181 | | | | 2,500 | | |
| Class Z shares | |
| Subscriptions | | | 20,014,598 | | | | 273,478,830 | | | | 25,508,322 | | | | 355,263,216 | | |
| Distributions reinvested | | | 2,074,910 | | | | 25,186,240 | | | | 1,622,754 | | | | 22,067,009 | | |
| Redemptions | | | (36,032,727 | ) | | | (488,838,057 | ) | | | (30,733,729 | ) | | | (425,408,094 | ) | |
| Net decrease | | | (13,943,219 | ) | | | (190,172,987 | ) | | | (3,602,653 | ) | | | (48,077,869 | ) | |
| Total net decrease | | | (24,578,959 | ) | | | (337,926,958 | ) | | | (6,748,919 | ) | | | (90,034,060 | ) | |
(a) Class I and Class R shares are for the period from September 27, 2010 (commencement of operations) to February 28, 2011.
(b) Includes conversions of Class B shares to Class A shares, if any.
The Accompanying Notes to Financial Statements are an integral part of this statement.
10
Financial Highlights – Columbia International Value Fund
The following tables are intended to help you understand the Fund's financial performance. Certain information reflects financial results for a single share of a class held for the periods shown. The per share amounts and percentages reflect income and expenses assuming inclusion of the Fund's proportionate share of the income and expenses of Columbia International Value Master Portfolio. Per share net investment income (loss) amounts are calculated based on average shares outstanding during the period. Total returns assume reinvestment of all dividends and distributions. Total returns do not reflect payment of sales charges, if any, and are not annualized for periods of less than one year.
| | | Year ended
Feb. 29, | | Year ended Feb. 28, | | Year ended
Feb. 29, | | Year ended
March 31, | |
| | | 2012 | | 2011 | | 2010 | | 2009 | | 2008(a) | | 2007 | |
| Class A | |
| Per share data | |
| Net asset value, beginning of period | | $ | 15.12 | | | $ | 13.48 | | | $ | 9.40 | | | $ | 18.95 | | | $ | 26.02 | | | $ | 24.97 | | |
| Income from investment operations: | |
| Net investment income | | | 0.39 | | | | 0.22 | | | | 0.33 | (b) | | | 0.52 | | | | 0.65 | | | | 0.29 | | |
| Net realized and unrealized gain (loss) | | | (1.88 | ) | | | 1.81 | | | | 3.96 | | | | (7.83 | ) | | | (1.95 | ) | | | 4.34 | | |
| Total from investment operations | | | (1.49 | ) | | | 2.03 | | | | 4.29 | | | | (7.31 | ) | | | (1.30 | ) | | | 4.63 | | |
| Less distributions to shareholders from: | |
| Net investment income | | | (0.49 | ) | | | (0.39 | ) | | | (0.21 | ) | | | (0.53 | ) | | | (0.68 | ) | | | (0.34 | ) | |
| Net realized gains | | | — | | | | — | | | | — | | | | (1.70 | ) | | | (5.09 | ) | | | (3.24 | ) | |
| Tax return of capital | | | — | | | | — | | | | — | | | | (0.01 | ) | | | — | | | | — | | |
| Total distributions to shareholders | | | (0.49 | ) | | | (0.39 | ) | | | (0.21 | ) | | | (2.24 | ) | | | (5.77 | ) | | | (3.58 | ) | |
| Proceeds from regulatory settlement | | | 0.00 | (c) | | | 0.00 | (c) | | | 0.00 | (c) | | | — | | | | — | | | | — | | |
| Redemption fees: | |
| Redemption fees added to paid-in-capital | | | — | | | | — | | | | 0.00 | (c) | | | 0.00 | (c) | | | 0.00 | (c) | | | 0.00 | (c) | |
| Net asset value, end of period | | $ | 13.14 | | | $ | 15.12 | | | $ | 13.48 | | | $ | 9.40 | | | $ | 18.95 | | | $ | 26.02 | | |
| Total return | | | (9.51 | %) | | | 15.47 | % | | | 45.57 | % | | | (42.59 | %) | | | (7.28 | %) | | | 20.46 | % | |
| Ratios to average net assets | |
Expenses prior to fees waived or expenses reimbursed
(including interest expense) | | | 1.53 | %(d) | | | 1.48 | %(d) | | | 1.42 | %(d) | | | 1.38 | %(d) | | | 1.32 | %(d)(e) | | | 1.30 | %(d) | |
Net expenses after fees waived or expenses reimbursed
(including interest expense)(f) | | | 1.41 | %(d)(g) | | | 1.48 | %(d)(g) | | | 1.42 | %(d)(g) | | | 1.38 | %(d)(g) | | | 1.32 | %(d)(e)(g) | | | 1.30 | %(d)(g) | |
Expenses prior to fees waived or expenses reimbursed
(excluding interest expense) | | | 1.53 | % | | | 1.48 | % | | | 1.42 | % | | | 1.38 | % | | | 1.32 | %(e) | | | 1.30 | % | |
Net expenses after fees waived or expenses reimbursed
(excluding interest expense)(f) | | | 1.41 | %(g) | | | 1.48 | %(g) | | | 1.42 | %(g) | | | 1.38 | %(g) | | | 1.32 | %(e)(g) | | | 1.30 | %(g) | |
| Net investment income | | | 2.87 | %(g) | | | 1.61 | %(g) | | | 2.56 | %(g) | | | 3.31 | %(g) | | | 2.71 | %(e)(g) | | | 1.15 | %(g) | |
| Supplemental data | |
| Net assets, end of period (in thousands) | | $ | 225,747 | | | $ | 367,847 | | | $ | 380,578 | | | $ | 241,097 | | | $ | 868,942 | | | $ | 1,073,616 | | |
| Notes to Financial Highlights | |
(a) For the period from April 1, 2007 to February 29, 2008. In 2008, the Fund's fiscal year end was changed from March 31 to February 29.
(b) Net investment income per share reflects special dividends. The effect of these dividends amounted to $0.13 per share.
(c) Rounds to less than $0.01.
(d) Includes interest expense which rounds to less than 0.01%.
(e) Annualized.
(f) The Investment Manager and certain of its affiliates agreed to waive/reimburse certain fees and expenses, if applicable.
(g) The benefits derived from expense reductions had an impact of less than 0.01%.
The Accompanying Notes to Financial Statements are an integral part of this statement.
11
Financial Highlights (continued) – Columbia International Value Fund
| | | Year ended
Feb. 29, | | Year ended Feb. 28, | | Year ended
Feb. 29, | | Year ended
March 31, | |
| | | 2012 | | 2011 | | 2010 | | 2009 | | 2008(a) | | 2007 | |
| Class B | |
| Per share data | |
| Net asset value, beginning of period | | $ | 14.61 | | | $ | 13.02 | | | $ | 9.09 | | | $ | 18.39 | | | $ | 25.43 | | | $ | 24.54 | | |
| Income from investment operations: | |
| Net investment income | | | 0.27 | | | | 0.21 | | | | 0.24 | (b) | | | 0.37 | | | | 0.49 | | | | 0.11 | | |
| Net realized and unrealized gain (loss) | | | (1.81 | ) | | | 1.67 | | | | 3.82 | | | | (7.53 | ) | | | (1.91 | ) | | | 4.22 | | |
| Total from investment operations | | | (1.54 | ) | | | 1.88 | | | | 4.06 | | | | (7.16 | ) | | | (1.42 | ) | | | 4.33 | | |
| Less distributions to shareholders from: | |
| Net investment income | | | (0.39 | ) | | | (0.29 | ) | | | (0.13 | ) | | | (0.43 | ) | | | (0.53 | ) | | | (0.20 | ) | |
| Net realized gains | | | — | | | | — | | | | — | | | | (1.70 | ) | | | (5.09 | ) | | | (3.24 | ) | |
| Tax return of capital | | | — | | | | — | | | | — | | | | (0.01 | ) | | | — | | | | — | | |
| Total distributions to shareholders | | | (0.39 | ) | | | (0.29 | ) | | | (0.13 | ) | | | (2.14 | ) | | | (5.62 | ) | | | (3.44 | ) | |
| Proceeds from regulatory settlement | | | 0.00 | (c) | | | 0.00 | (c) | | | 0.00 | (c) | | | — | | | | — | | | | — | | |
| Redemption fees: | |
| Redemption fees added to paid-in-capital | | | — | | | | — | | | | 0.00 | (c) | | | 0.00 | (c) | | | 0.00 | (c) | | | 0.00 | (c) | |
| Net asset value, end of period | | $ | 12.68 | | | $ | 14.61 | | | $ | 13.02 | | | $ | 9.09 | | | $ | 18.39 | | | $ | 25.43 | | |
| Total return | | | (10.28 | %) | | | 14.75 | % | | | 44.61 | % | | | (43.01 | %) | | | (7.90 | %) | | | 19.51 | % | |
| Ratios to average net assets | |
Expenses prior to fees waived or expenses reimbursed
(including interest expense) | | | 2.27 | %(d) | | | 2.23 | %(d) | | | 2.17 | %(d) | | | 2.13 | %(d) | | | 2.07 | %(d)(e) | | | 2.05 | %(d) | |
Net expenses after fees waived or expenses reimbursed
(including interest expense)(f) | | | 2.16 | %(d)(g) | | | 2.23 | %(d)(g) | | | 2.17 | %(d)(g) | | | 2.13 | %(d)(g) | | | 2.07 | %(d)(e)(g) | | | 2.05 | %(d)(g) | |
Expenses prior to fees waived or expenses reimbursed
(excluding interest expense) | | | 2.27 | % | | | 2.23 | % | | | 2.17 | % | | | 2.13 | % | | | 2.07 | %(e) | | | 2.05 | % | |
Net expenses after fees waived or expenses reimbursed
(excluding interest expense)(f) | | | 2.16 | %(g) | | | 2.23 | %(g) | | | 2.17 | %(g) | | | 2.13 | %(g) | | | 2.07 | %(e)(g) | | | 2.05 | %(g) | |
| Net investment income | | | 2.05 | %(g) | | | 1.62 | %(g) | | | 1.95 | %(g) | | | 2.43 | %(g) | | | 2.10 | %(e)(g) | | | 0.45 | %(g) | |
| Supplemental data | |
| Net assets, end of period (in thousands) | | $ | 807 | | | $ | 1,437 | | | $ | 8,476 | | | $ | 18,743 | | | $ | 65,705 | | | $ | 110,726 | | |
| Notes to Financial Highlights | |
(a) For the period from April 1, 2007 to February 29, 2008. In 2008, the Fund's fiscal year end was changed from March 31 to February 29.
(b) Net investment income per share reflects special dividends. The effect of these dividends amounted to $0.13 per share.
(c) Rounds to less than $0.01.
(d) Includes interest expense which rounds to less than 0.01%.
(e) Annualized.
(f) The Investment Manager and certain of its affiliates agreed to waive/reimburse certain fees and expenses, if applicable.
(g) The benefits derived from expense reductions had an impact of less than 0.01%.
The Accompanying Notes to Financial Statements are an integral part of this statement.
12
Financial Highlights (continued) – Columbia International Value Fund
| | | Year ended
Feb. 29, | | Year ended Feb. 28, | | Year ended
Feb. 29, | | Year ended
March 31, | |
| | | 2012 | | 2011 | | 2010 | | 2009 | | 2008(a) | | 2007 | |
| Class C | |
| Per share data | |
| Net asset value, beginning of period | | $ | 14.56 | | | $ | 12.99 | | | $ | 9.08 | | | $ | 18.37 | | | $ | 25.40 | | | $ | 24.52 | | |
| Income from investment operations: | |
| Net investment income | | | 0.27 | | | | 0.12 | | | | 0.22 | (b) | | | 0.34 | | | | 0.46 | | | | 0.10 | | |
| Net realized and unrealized gain (loss) | | | (1.80 | ) | | | 1.74 | | | | 3.82 | | | | (7.49 | ) | | | (1.87 | ) | | | 4.22 | | |
| Total from investment operations | | | (1.53 | ) | | | 1.86 | | | | 4.04 | | | | (7.15 | ) | | | (1.41 | ) | | | 4.32 | | |
| Less distributions to shareholders from: | |
| Net investment income | | | (0.39 | ) | | | (0.29 | ) | | | (0.13 | ) | | | (0.43 | ) | | | (0.53 | ) | | | (0.20 | ) | |
| Net realized gains | | | — | | | | — | | | | — | | | | (1.70 | ) | | | (5.09 | ) | | | (3.24 | ) | |
| Tax return of capital | | | — | | | | — | | | | — | | | | (0.01 | ) | | | — | | | | — | | |
| Total distributions to shareholders | | | (0.39 | ) | | | (0.29 | ) | | | (0.13 | ) | | | (2.14 | ) | | | (5.62 | ) | | | (3.44 | ) | |
| Proceeds from regulatory settlement | | | 0.00 | (c) | | | 0.00 | (c) | | | 0.00 | (c) | | | — | | | | — | | | | — | | |
| Redemption fees: | |
| Redemption fees added to paid-in-capital | | | — | | | | — | | | | 0.00 | (c) | | | 0.00 | (c) | | | 0.00 | (c) | | | 0.00 | (c) | |
| Net asset value, end of period | | $ | 12.64 | | | $ | 14.56 | | | $ | 12.99 | | | $ | 9.08 | | | $ | 18.37 | | | $ | 25.40 | | |
| Total return | | | (10.24 | %) | | | 14.62 | % | | | 44.44 | % | | | (43.00 | %) | | | (7.86 | %) | | | 19.48 | % | |
| Ratios to average net assets | |
Expenses prior to fees waived or expenses reimbursed
(including interest expense) | | | 2.28 | %(d) | | | 2.23 | %(d) | | | 2.17 | %(d) | | | 2.13 | %(d) | | | 2.07 | %(d)(e) | | | 2.05 | %(d) | |
Net expenses after fees waived or expenses reimbursed
(including interest expense)(f) | | | 2.16 | %(d)(g) | | | 2.23 | %(d)(g) | | | 2.17 | %(d)(g) | | | 2.13 | %(d)(g) | | | 2.07 | %(d)(e)(g) | | | 2.05 | %(d)(g) | |
Expenses prior to fees waived or expenses reimbursed
(excluding interest expense) | | | 2.28 | % | | | 2.23 | % | | | 2.17 | % | | | 2.13 | % | | | 2.07 | %(e) | | | 2.05 | % | |
Net expenses after fees waived or expenses reimbursed
(excluding interest expense)(f) | | | 2.16 | %(g) | | | 2.23 | %(g) | | | 2.17 | %(g) | | | 2.13 | %(g) | | | 2.07 | %(e)(g) | | | 2.05 | %(g) | |
| Net investment income | | | 2.10 | %(g) | | | 0.89 | %(g) | | | 1.81 | %(g) | | | 2.28 | %(g) | | | 1.99 | %(e)(g) | | | 0.42 | %(g) | |
| Supplemental data | |
| Net assets, end of period (in thousands) | | $ | 34,910 | | | $ | 57,793 | | | $ | 63,914 | | | $ | 49,750 | | | $ | 127,020 | | | $ | 170,731 | | |
| Notes to Financial Highlights | |
(a) For the period from April 1, 2007 to February 29, 2008. In 2008, the Fund's fiscal year end was changed from March 31 to February 29.
(b) Net investment income per share reflects special dividends. The effect of these dividends amounted to $0.13 per share.
(c) Rounds to less than $0.01.
(d) Includes interest expense which rounds to less than 0.01%.
(e) Annualized.
(f) The Investment Manager and certain of its affiliates agreed to waive/reimburse certain fees and expenses, if applicable.
(g) The benefits derived from expense reductions had an impact of less than 0.01%.
The Accompanying Notes to Financial Statements are an integral part of this statement.
13
Financial Highlights (continued) – Columbia International Value Fund
| | | Year ended
Feb. 29,
2012 | | Year ended
Feb. 28,
2011(a) | |
| Class I | |
| Per share data | |
| Net asset value, beginning of period | | $ | 15.27 | | | $ | 13.93 | | |
| Income from investment operations: | |
| Net investment income (loss) | | | 0.70 | | | | (0.00 | )(b) | |
| Net realized and unrealized gain (loss) | | | (2.65 | ) | | | 1.67 | | |
| Total from investment operations | | | (1.95 | ) | | | 1.67 | | |
| Less distributions to shareholders from: | |
| Net investment income | | | (0.55 | ) | | | (0.33 | ) | |
| Total distributions to shareholders | | | (0.55 | ) | | | (0.33 | ) | |
| Proceeds from regulatory settlement | | | 0.00 | (b) | | | 0.00 | (b) | |
| Net asset value, end of period | | $ | 12.77 | | | $ | 15.27 | | |
| Total return | | | (12.47 | %) | | | 12.22 | % | |
| Ratios to average net assets | |
| Expenses prior to fees waived or expenses reimbursed (including interest expense) | | | 1.06 | %(c) | | | 1.07 | %(c)(d) | |
| Net expenses after fees waived or expenses reimbursed (including interest expense)(e) | | | 1.06 | %(c)(f) | | | 1.07 | %(c)(d)(f) | |
| Expenses prior to fees waived or expenses reimbursed (excluding interest expense) | | | 1.06 | % | | | 1.07 | %(d) | |
| Net expenses after fees waived or expenses reimbursed (excluding interest expense)(e) | | | 1.06 | %(f) | | | 1.07 | %(d)(f) | |
| Net investment income (loss) | | | 4.77 | %(f) | | | (0.05 | %)(d)(f) | |
| Supplemental data | |
| Net assets, end of period (in thousands) | | $ | 2 | | | $ | 34,506 | | |
| Notes to Financial Highlights | |
(a) For the period from September 27, 2010 (commencement of operations) to February 28, 2011.
(b) Rounds to less than $0.01.
(c) Includes interest expense which rounds to less than 0.01%.
(d) Annualized.
(e) The Investment Manager and certain of its affiliates agreed to waive/reimburse certain fees and expenses, if applicable.
(f) The benefits derived from expense reductions had an impact of less than 0.01%.
The Accompanying Notes to Financial Statements are an integral part of this statement.
14
Financial Highlights (continued) – Columbia International Value Fund
| | | Year ended
Feb. 29,
2012 | | Year ended
Feb. 28,
2011(a) | |
| Class R | |
| Per share data | |
| Net asset value, beginning of period | | $ | 15.15 | | | $ | 13.78 | | |
| Income from investment operations: | |
| Net investment income | | | 0.25 | | | | 0.02 | | |
| Net realized and unrealized gain (loss) | | | (1.79 | ) | | | 1.60 | | |
| Total from investment operations | | | (1.54 | ) | | | 1.62 | | |
| Less distributions to shareholders from: | |
| Net investment income | | | (0.46 | ) | | | (0.25 | ) | |
| Total distributions to shareholders | | | (0.46 | ) | | | (0.25 | ) | |
| Proceeds from regulatory settlement | | | 0.00 | (b) | | | 0.00 | (b) | |
| Net asset value, end of period | | $ | 13.15 | | | $ | 15.15 | | |
| Total return | | | (9.90 | %) | | | 11.92 | % | |
| Ratios to average net assets | |
| Expenses prior to fees waived or expenses reimbursed (including interest expense) | | | 1.86 | %(c) | | | 1.77 | %(c)(d) | |
| Net expenses after fees waived or expenses reimbursed (including interest expense)(e) | | | 1.64 | %(c)(f) | | | 1.77 | %(c)(d)(f) | |
| Expenses prior to fees waived or expenses reimbursed (excluding interest expense) | | | 1.86 | % | | | 1.77 | %(d) | |
| Net expenses after fees waived or expenses reimbursed (excluding interest expense)(e) | | | 1.64 | %(f) | | | 1.77 | %(d)(f) | |
| Net investment income | | | 1.94 | %(f) | | | 0.40 | %(d)(f) | |
| Supplemental data | |
| Net assets, end of period (in thousands) | | $ | 8 | | | $ | 3 | | |
| Notes to Financial Highlights | |
(a) For the period from September 27, 2010 (commencement of operations) to February 28, 2011.
(b) Rounds to less than $0.01.
(c) Includes interest expense which rounds to less than 0.01%.
(d) Annualized.
(e) The Investment Manager and certain of its affiliates agreed to waive/reimburse certain fees and expenses, if applicable.
(f) The benefits derived from expense reductions had an impact of less than 0.01%.
The Accompanying Notes to Financial Statements are an integral part of this statement.
15
Financial Highlights (continued) – Columbia International Value Fund
| | | Year ended
Feb. 29, | | Year ended Feb. 28, | | Year ended
Feb. 29, | | Year ended
March 31, | |
| | | 2012 | | 2011 | | 2010 | | 2009 | | 2008(a) | | 2007 | |
| Class Z | |
| Per share data | |
| Net asset value, beginning of period | | $ | 15.28 | | | $ | 13.62 | | | $ | 9.49 | | | $ | 19.10 | | | $ | 26.17 | | | $ | 25.09 | | |
| Income from investment operations: | |
| Net investment income | | | 0.42 | | | | 0.26 | | | | 0.36 | (b) | | | 0.50 | | | | 0.73 | | | | 0.36 | | |
| Net realized and unrealized gain (loss) | | | (1.90 | ) | | | 1.83 | | | | 4.01 | | | | (7.83 | ) | | | (1.98 | ) | | | 4.35 | | |
| Total from investment operations | | | (1.48 | ) | | | 2.09 | | | | 4.37 | | | | (7.33 | ) | | | (1.25 | ) | | | 4.71 | | |
| Less distributions to shareholders from: | |
| Net investment income | | | (0.53 | ) | | | (0.43 | ) | | | (0.24 | ) | | | (0.57 | ) | | | (0.73 | ) | | | (0.39 | ) | |
| Net realized gains | | | — | | | | — | | | | — | | | | (1.70 | ) | | | (5.09 | ) | | | (3.24 | ) | |
| Tax return of capital | | | — | | | | — | | | | — | | | | (0.01 | ) | | | — | | | | — | | |
| Total distributions to shareholders | | | (0.53 | ) | | | (0.43 | ) | | | (0.24 | ) | | | (2.28 | ) | | | (5.82 | ) | | | (3.63 | ) | |
| Proceeds from regulatory settlement | | | 0.00 | (c) | | | 0.00 | (c) | | | 0.00 | (c) | | | — | | | | — | | | | — | | |
| Redemption fees: | |
| Redemption fees added to paid-in-capital | | | — | | | | — | | | | 0.00 | (c) | | | 0.00 | (c) | | | 0.00 | (c) | | | 0.00 | (c) | |
| Net asset value, end of period | | $ | 13.27 | | | $ | 15.28 | | | $ | 13.62 | | | $ | 9.49 | | | $ | 19.10 | | | $ | 26.17 | | |
| Total return | | | (9.35 | %) | | | 15.74 | % | | | 45.94 | % | | | (42.41 | %) | | | (7.05 | %) | | | 20.70 | % | |
| Ratios to average net assets | |
Expenses prior to fees waived or expenses reimbursed
(including interest expense) | | | 1.27 | %(d) | | | 1.23 | %(d) | | | 1.17 | %(d) | | | 1.13 | %(d) | | | 1.07 | %(d)(e) | | | 1.05 | %(d) | |
Net expenses after fees waived or expenses reimbursed
(including interest expense)(f) | | | 1.16 | %(d)(g) | | | 1.23 | %(d)(g) | | | 1.17 | %(d)(g) | | | 1.13 | %(d)(g) | | | 1.07 | %(d)(e)(g) | | | 1.05 | %(d)(g) | |
Expenses prior to fees waived or expenses reimbursed
(excluding interest expense) | | | 1.27 | % | | | 1.23 | % | | | 1.17 | % | | | 1.13 | % | | | 1.07 | %(e) | | | 1.05 | % | |
Net expenses after fees waived or expenses reimbursed
(excluding interest expense)(f) | | | 1.16 | %(g) | | | 1.23 | %(g) | | | 1.17 | %(g) | | | 1.13 | %(g) | | | 1.07 | %(e)(g) | | | 1.05 | %(g) | |
| Net investment income | | | 3.09 | %(g) | | | 1.85 | %(g) | | | 2.76 | %(g) | | | 3.20 | %(g) | | | 3.04 | %(e)(g) | | | 1.43 | %(g) | |
| Supplemental data | |
| Net assets, end of period (in thousands) | | $ | 924,777 | | | $ | 1,277,799 | | | $ | 1,187,812 | | | $ | 844,122 | | | $ | 1,886,808 | | | $ | 2,651,855 | | |
| Notes to Financial Highlights | |
(a) For the period from April 1, 2007 to February 29, 2008. In 2008, the Fund's fiscal year end was changed from March 31 to February 29.
(b) Net investment income per share reflects special dividends. The effect of these dividends amounted to $0.13 per share.
(c) Rounds to less than $0.01.
(d) Includes interest expense which rounds to less than 0.01%.
(e) Annualized.
(f) The Investment Manager and certain of its affiliates agreed to waive/reimburse certain fees and expenses, if applicable.
(g) The benefits derived from expense reductions had an impact of less than 0.01%.
The Accompanying Notes to Financial Statements are an integral part of this statement.
16
Notes to Financial Statements – Columbia International Value Fund
February 29, 2012
Note 1. Organization
Columbia International Value Fund (the Feeder Fund), a series of Columbia Funds Series Trust (the Trust), is a diversified fund. The Trust is registered under the Investment Company Act of 1940, as amended (the 1940 Act), as an open-end management investment company organized as a Delaware statutory trust.
The value of the Feeder Fund's investment in Columbia International Value Master Portfolio (the Master Portfolio) included in the Statement of Assets and Liabilities reflects the Feeder Fund's proportionate amount of beneficial interests in the net assets of the Master Portfolio, which is equal to 92.0% at February 29, 2012. The financial statements of the Master Portfolio, including its investment portfolio, are included elsewhere within this report and should be read in conjunction with the Feeder Fund's financial statements. Another fund that is managed by the Investment Manager, not registered under the 1940 Act, and whose financial statements are not presented here, also invests in the Master Portfolio.
Fund Shares
The Trust may issue an unlimited number of shares (without par value). The Feeder Fund offers Class A, Class B, Class C, Class I, Class R and Class Z shares. All share classes have identical voting, dividend and liquidation rights. Each share class has its own expense structure and sales charges, as applicable.
Class A shares are subject to a maximum front-end sales charge of 5.75% based on the initial investment amount. Class A shares purchased without an initial sales charge in accounts aggregating $1 million to $50 million at the time of purchase are subject to a contingent deferred sales charge (CDSC) if the shares are sold within 18 months of purchase, charged as follows: 1.00% CDSC if redeemed within 12 months of purchase, and 0.50% CDSC if redeemed more than 12, but less than 18, months after purchase.
Class B shares may be subject to a maximum CDSC of 5.00% based upon the holding period after purchase. Class B shares will generally convert to Class A shares eight years after purchase. The Feeder Fund no longer accepts investments by new or existing investors in the Feeder Fund's Class B shares, except in connection with the reinvestment of any dividend and/or capital gain distributions in Class B shares of the Feeder Fund and exchanges by existing Class B shareholders of certain other funds within the Columbia Family of Funds.
Class C shares are subject to a 1.00% CDSC on shares redeemed within one year of purchase.
Class I shares are not subject to sales charges and are only available to the Columbia Family of Funds.
Class R shares are not subject to sales charges and are only available to qualifying institutional investors.
Class Z shares are not subject to sales charges, and are only available to certain investors, as described in the Feeder Fund's prospectus.
Note 2. Summary of Significant Accounting Policies
Use of Estimates
The preparation of financial statements in accordance with U.S. generally accepted accounting principles (GAAP) requires management to make certain estimates and assumptions that affect the reported amounts of assets and liabilities, the disclosure of contingent assets and liabilities at the date of the financial statements and the reported amounts of revenue and expenses during the reporting period. Actual results could differ from those estimates.
The following is a summary of significant accounting policies consistently followed by the Feeder Fund in the preparation of its financial statements.
Security Valuation
The Feeder Fund invests all or substantially all of its assets in the Master Portfolio. See the Notes to Financial Statements for the Master Portfolio included elsewhere in this report for the Master Portfolio's valuation policies.
Foreign Currency Transactions and Translation
The values of all assets and liabilities denominated in foreign currencies are translated into U.S. dollars at that day's exchange rates. Net realized and unrealized gains (losses) on foreign currency transactions and translations include gains (losses) arising from the fluctuation in exchange rates between trade and settlement dates on securities transactions, gains (losses) arising from the disposition of foreign currency and
17
Columbia International Value Fund, February 29, 2012
currency gains (losses) between the accrual and payment dates on dividends, interest income and foreign withholding taxes.
For financial statement purposes, the Feeder Fund does not distinguish that portion of gains (losses) on investments which is due to changes in foreign exchange rates from that which is due to changes in market prices of the investments. Such fluctuations are included with the net realized and unrealized gains (losses) on investments in the Statement of Operations.
Security Transactions
Security transactions are accounted for on the trade date. Cost is determined and gains (losses) are based upon the specific identification method for both financial statement and federal income tax purposes.
Expenses
General expenses of the Trust are allocated to the Feeder Fund and other funds of the Trust based upon relative net assets or other expense allocation methodologies determined by the nature of the expense. Expenses directly attributable to the Feeder Fund are charged to the Feeder Fund. Expenses directly attributable to a specific class of shares are charged to that share class.
Determination of Class Net Asset Value
All income, expenses (other than class-specific expenses, which are charged to that share class, as shown in the Statement of Operations) and realized and unrealized gains (losses) are allocated to each class of the Feeder Fund on a daily basis, based on the relative net assets of each class, for purposes of determining the net asset value of each class.
The Feeder Fund records its proportionate share of investment income, realized and unrealized gains (losses) and expenses reported by the Master Portfolio on a daily basis. The investment income, realized and unrealized gains (losses) and expenses are allocated daily to investors of the Master Portfolio based upon the relative value of their investment in the Master Portfolio.
Federal Income Tax Status
The Feeder Fund intends to qualify each year as a regulated investment company under Subchapter M of the Internal Revenue Code, as amended, and will distribute substantially all of its taxable income, if any, for its tax year, and as such will not be subject to federal income taxes. In addition, the Feeder Fund intends to distribute in each calendar year substantially all of its net investment income, capital gains and certain other amounts, if any, such that the Feeder Fund should not be subject to federal excise tax. Therefore, no federal income or excise tax provision is recorded.
Foreign Taxes
The Feeder Fund may be subject to foreign taxes on income, gains on investments or currency repatriation, a portion of which may be recoverable. The Feeder Fund will accrue such taxes and recoveries, as applicable, based upon its current interpretation of tax rules and regulations that exist in the markets in which it invests.
Realized gains in certain countries may be subject to foreign taxes at the Feeder Fund level, based on statutory rates. The Feeder Fund accrues for such foreign taxes on net realized and unrealized gains at the appropriate rate for each jurisdiction.
Distributions to Shareholders
Distributions from net investment income, if any, are declared and paid semi-annually. Net realized capital gains, if any, are distributed along with the income dividend. Income distributions and capital gain distributions are determined in accordance with federal income tax regulations which may differ from GAAP.
Guarantees and Indemnifications
Under the Trust's organizational documents and, in some cases, by contract, its officers and trustees are indemnified against certain liabilities arising out of the performance of their duties to the Trust or its Feeder Fund. In addition, certain of the Feeder Fund's contracts with its service providers contain general indemnification clauses. The Feeder Fund's maximum exposure under these arrangements is unknown since the amount of any future claims that may be made against the Feeder Fund cannot be determined, and the Feeder Fund has no historical basis for predicting the likelihood of any such claims.
18
Columbia International Value Fund, February 29, 2012
Note 3. Fees and Compensation Paid to Affiliates
Investment Management Fees
Under an Investment Management Services Agreement, Columbia Management Investment Advisers, LLC (the Investment Manager), a wholly-owned subsidiary of Ameriprise Financial, Inc. (Ameriprise Financial), determines which securities will be purchased, held or sold. The Feeder Fund indirectly pays for investment management and subadvisory services and a portion of the administrative services through its investment in the Master Portfolio (see Notes to Financial Statements of the Master Portfolio).
Administration Fees
Under an Administrative Services Agreement, the Investment Manager serves as the Fund Administrator. The Feeder Fund pays the Fund Administrator an annual fee for administration and accounting services equal to 0.17% of the Feeder Fund's average daily net assets, less the fees that were payable by the Feeder Fund as described under the Pricing and Bookkeeping Fees note below.
Pricing and Bookkeeping Fees
Prior to August 8, 2011, the Feeder Fund had entered into a Financial Reporting Services Agreement (the Financial Reporting Services Agreement) with State Street Bank and Trust Company (State Street) and the Investment Manager pursuant to which State Street provided financial reporting services to the Feeder Fund. The Feeder Fund also entered into an Accounting Services Agreement (collectively with the Financial Reporting Services Agreement, the State Street Agreements) with State Street and the Investment Manager pursuant to which State Street provided accounting services to the Feeder Fund. Under the State Street Agreements, the Feeder Fund paid State Street an annual fee of $38,000 paid monthly plus an additional monthly fee based on an annualized percentage rate of average daily net assets of the Feeder Fund for the month. The aggregate fee did not exceed $140,000 per year (exclusive of out-of-pocket expenses and charges). The Feeder Fund also reimbursed State Street for certain out-of-pocket expenses and charges. Effective August 8, 2011, these services are provided under the Administrative Services Agreement discussed above.
Other Fees
Effective June 1, 2011, other expenses are for, among other things, certain expenses of the Feeder Fund or the Board including: Fund boardroom and office expense, employee compensation, employee health and retirement benefits, and certain other expenses. Payment of these Feeder Fund and Board expenses is facilitated by a company providing limited administrative services to the Feeder Fund and the Board. For the period June 1, 2011 through February 29, 2012, other expenses paid to this company were $2,883.
Compensation of Board Members
Board members are compensated for their services to the Feeder Fund as disclosed in the Statement of Operations. Under a Deferred Compensation Plan (the Plan), the Board members who are not "interested persons" of the Feeder Fund, as defined under the 1940 Act, may elect to defer payment of up to 100% of their compensation. Deferred amounts are treated as though equivalent dollar amounts had been invested in shares of certain funds managed by the Investment Manager. The Feeder Fund's liability for these amounts is adjusted for market value changes and remains in the Feeder Fund until distributed in accordance with the Plan.
Compensation of Chief Compliance Officer
The Board has appointed a Chief Compliance Officer to the Feeder Fund in accordance with federal securities regulations. Effective April 1, 2011, the Feeder Fund's expenses associated with the Chief Compliance Officer are paid directly by the Investment Manager. Prior to April 1, 2011, the Feeder Fund, along with other affiliated funds, paid its pro-rata share of the expenses for the Chief Compliance Officer. Such fees did not exceed $15,000 per year.
Transfer Agent Fees
Under a Transfer and Dividend Disbursing Agent Agreement, Columbia Management Investment Services Corp. (the Transfer Agent), an affiliate of the Investment Manager and a wholly-owned subsidiary of Ameriprise Financial, is responsible for providing transfer agency services to the Feeder Fund. The Transfer Agent has contracted with Boston Financial Data Services (BFDS) to serve as sub-transfer agent.
19
Columbia International Value Fund, February 29, 2012
The Transfer Agent receives monthly account-based service fees based on the number of open accounts and is reimbursed by the Feeder Fund for the fees and expenses the Transfer Agent pays to financial intermediaries that maintain omnibus accounts with the Feeder Fund that is a percentage of the average aggregate value of the Feeder Fund's shares maintained in each such omnibus account (other than omnibus accounts for which American Enterprise Investment Services Inc. is the broker of record or accounts where the beneficial shareholder is a customer of Ameriprise Financial Services, Inc., which are paid a per account fee). The Transfer Agent pays the fees of BFDS for services as sub-transfer agent and is not entitled to reimbursement for such fees from the Feeder Fund (with the exception of out-of-pocket fees).
The Transfer Agent also receives compensation from fees for various shareholder services and reimbursements for certain out-of-pocket expenses. Class I shares do not pay transfer agent fees.
For the year ended February 29, 2012, the Feeder Fund's effective transfer agent fee rates as a percentage of average daily net assets of each class were as follows:
| Class A | | | 0.19 | % | |
| Class B | | | 0.18 | | |
| Class C | | | 0.19 | | |
| Class R | | | 0.26 | | |
| Class Z | | | 0.19 | | |
An annual minimum account balance fee of $20 may apply to certain accounts with a value below the Feeder Fund's initial minimum investment requirements to reduce the impact of small accounts on transfer agent fees. These minimum account balance fees are recorded as part of expense reductions in the Statement of Operations. For the year ended February 29, 2012, these minimum account balance fees reduced total expenses by $1,440.
Distribution and Service Fees
The Feeder Fund has an agreement with Columbia Management Investment Distributors, Inc. (the Distributor), an affiliate of the Investment Manager and a wholly-owned subsidiary of Ameriprise Financial, for distribution and shareholder services. Pursuant to Rule 12b-1 under the 1940 Act, the Board has approved, and the Feeder Fund has adopted, distribution and shareholder service plans (the Plans) which set the distribution and service fees for the Feeder Fund. These fees are calculated daily and are intended to compensate the Distributor and/or eligible selling and/or servicing agents for selling shares of the Feeder Fund and providing services to investors.
The Plans require the payment of a monthly service fee to the Distributor at the maximum annual rate of 0.25% of the average daily net assets attributable to Class A, Class B and Class C shares of the Feeder Fund. The Plans also require the payment of a monthly distribution fee to the Distributor at the maximum annual rates of 0.10%, 0.75%, 0.50% and 0.50% of the average daily net assets attributable to Class A, Class B, Class C and Class R shares, respectively.
Sales Charges
Sales charges, including front-end charges and CDSCs, received by the Distributor for distributing Feeder Fund shares were $81,986 for Class A, $1,025 for Class B and $4,325 for Class C shares for the year ended February 29, 2012.
Expenses Waived/Reimbursed by the Investment Manager and its Affiliates
Effective July 1, 2011, the Investment Manager and certain of its affiliates have contractually agreed to waive fees and/or reimburse expenses (excluding certain fees and expenses described below), through June 30, 2012, unless sooner terminated at the sole discretion of the Board, so that the Feeder Fund's net operating expenses, after giving effect to fees waived/expenses reimbursed and any balance credits and/or overdraft charges from the Feeder Fund's custodian, do not exceed the following annual rates as a percentage of the class' average daily net assets:
| Class A | | | 1.37 | % | |
| Class B | | | 2.12 | | |
| Class C | | | 2.12 | | |
| Class I | | | 0.97 | | |
| Class R | | | 1.62 | | |
| Class Z | | | 1.12 | | |
20
Columbia International Value Fund, February 29, 2012
Prior to July 1, 2011, the Investment Manager and its affiliates contractually agreed to waive fees and/or reimburse expenses (excluding certain fees and expenses described below), so that the Feeder Fund's net operating expenses, after giving effect to fees waived/expenses reimbursed and any balance credits and/or overdraft charges from the Feeder Fund's custodian, did not exceed the following annual rates as a percentage of the class' average daily net assets:
| Class A | | | 1.60 | % | |
| Class B | | | 2.35 | | |
| Class C | | | 2.35 | | |
| Class I | | | 1.25 | | |
| Class R | | | 1.85 | | |
| Class Z | | | 1.35 | | |
Under the agreement, the following fees and expenses are excluded from the waiver/reimbursement commitment, and therefore will be paid by the Feeder Fund, if applicable: taxes (including foreign transaction taxes), expenses associated with investments in affiliated and non-affiliated pooled investment vehicles (including mutual funds and exchange traded funds), transaction costs and brokerage commissions, costs related to any securities lending program, dividend expenses associated with securities sold short, inverse floater program fees and expenses, transaction charges and interest on borrowed money, interest, extraordinary expenses and any other expenses the exclusion of which is specifically approved by the Board. This agreement may be modified or amended only with approval from all parties.
Note 4. Federal Tax Information
The timing and character of income and capital gain distributions are determined in accordance with income tax regulations, which may differ from GAAP because of temporary or permanent book to tax differences.
For the year ended February 29, 2012, these differences are primarily due to differing treatment for deferral/reversal of wash sales, capital loss carryforwards, passive foreign investment company (PFIC) holdings, deferred trustees expense, post-October loss deferrals and reversals, proceeds from litigation settlements, foreign currency transactions and allocations from the Master Portfolio. To the extent these differences are permanent, reclassifications are made among the components of the Feeder Fund's net assets in the Statement of Assets and Liabilities. Temporary differences do not require reclassifications. In the Statement of Assets and Liabilities the following reclassifications were made:
Excess of distributions over
net investment income | | | $9,844,354 | | |
| Accumulated net realized loss | | | (9,035,125 | ) | |
| Paid-in capital | | | (809,229 | ) | |
Net investment income and net realized gains (losses), as disclosed in the Statement of Operations, and net assets were not affected by this reclassification.
The tax character of distributions paid during the years indicated was as follows:
| | Year ended
February 29,
2012 | | Year ended
February 28,
2011 | |
| Ordinary income | | $ | 46,281,246 | | | $ | 48,570,845 | | |
Short-term capital gain distributions, if any, are considered ordinary income distributions for tax purposes.
At February 29, 2012, the components of distributable earnings on a tax basis were as follows:
| Undistributed ordinary income | | $ | 2,049,426 | | |
| Undistributed accumulated long-term gain | | | — | | |
| Unrealized depreciation | | | N/A* | | |
* See the Master Portfolio notes to financial statements for tax basis information.
21
Columbia International Value Fund, February 29, 2012
At February 29, 2012, the aggregate gross unrealized appreciation and depreciation based on cost of investments for federal income tax purposes were:
| Unrealized appreciation | | | N/A* | | |
| Unrealized depreciation | | | N/A* | | |
| Net unrealized depreciation | | | N/A* | | |
* See the Master Portfolio notes to financial statements for tax basis information.
The following capital loss carryforward, determined at February 29, 2012, may be available to reduce taxable income arising from future net realized gains on investments, if any, to the extent permitted by the Internal Revenue Code:
| Year of expiration | | Amount | |
| 2018 | | $ | 185,725,377 | | |
| 2019 | | | 68,376,538 | | |
| Unlimited long-term | | | 80,594,079 | | |
| Total | | $ | 334,695,994 | | |
On December 22, 2010, the Regulated Investment Company Modernization Act of 2010 (the Act) was enacted, which changed various technical rules governing the tax treatment of regulated investment companies. The changes are generally effective for taxable years beginning after the date of enactment. Under the Act, the Feeder Fund will be permitted to carry forward capital losses incurred in taxable years beginning after the date of enactment for an unlimited period. However, any losses incurred during those future taxable years will be required to be utilized prior to the losses incurred in pre-enactment taxable years, which carry an expiration date. As a result of this ordering rule, pre-enactment capital loss carryforwards may be more likely to expire unused.
Under current tax rules, regulated investment companies can elect to treat certain late-year ordinary losses incurred and post-October capital losses (capital losses realized after October 31) as arising on the first day of the following taxable year. As of February 29, 2012, the Feeder Fund will elect to treat post-October capital losses of $51,269,575 as arising on March 1, 2012.
Management of the Feeder Fund has concluded that there are no significant uncertain tax positions that would require recognition in the financial statements. However, management's conclusion may be subject to review and adjustment at a later date based on factors including, but not limited to, new tax laws, regulations, and administrative interpretations (including relevant court decisions). Generally, the Feeder Fund's federal tax returns for the prior three fiscal years remain subject to examination by the Internal Revenue Service.
Note 5. Regulatory Settlements
During the year ended February 29, 2012, the Feeder Fund received $81,090 as a result of a settlement of an administrative proceeding brought by the Securities and Exchange Commission against an unaffiliated third party relating to market timing and/or late trading of mutual funds. This amount represented the Feeder Fund's portion of the proceeds from the settlement (the Feeder Fund was not a party to the proceeding).
During the year ended February 28, 2011, the Feeder Fund received payments of $108,538 resulting from certain regulatory settlements with third parties in which the Feeder Fund had participated.
The payments have been included in "Proceeds from regulatory settlements" in the Statement of Changes in Net Assets.
Note 6. Custody Credits
Prior to August 8, 2011, the Feeder Fund had an agreement with its custodian bank under which custody fees may have been reduced by balance credits. These credits are recorded as part of expense reductions on the Statement of Operations. The Feeder Fund could have invested a portion of the assets utilized in connection with the expense offset arrangement in an income-producing asset if they had not entered into such an agreement. Subsequent to this date, the Feeder Fund may invest its daily balance in an affiliated money market fund as detailed below. For the period March 1, 2011 through August 7, 2011, there were no custody credits.
Note 7. Shareholder Concentration
At February 29, 2012, three unaffiliated shareholder accounts owned 62.3% of the outstanding shares of the Feeder Fund.
22
Columbia International Value Fund, February 29, 2012
The Feeder Fund has no knowledge about whether any portion of those shares was owned beneficially by such account. Subscription and redemption activity by concentrated accounts may have a significant effect on the operations of the Feeder Fund.
Note 8. Significant Risks
Foreign Securities Risk
Investing in foreign securities may include certain risks and considerations not typically associated with investing in U.S. securities, such as fluctuating currency values and changing local and regional economic, political and social conditions, which may result in greater market volatility. In addition, certain foreign securities may not be as liquid as U.S. securities. Investing in emerging markets may accentuate these risks.
Investments in emerging market countries are subject to additional risk. The risk of foreign investments is typically increased in less developed countries. These countries are also more likely to experience high levels of inflation, deflation or currency devaluation which could hurt their economies and securities markets.
Note 9. Subsequent Events
Management has evaluated the events and transactions that have occurred through the date the financial statements were issued and noted no items requiring adjustment of the financial statements or additional disclosure.
Note 10. Information Regarding Pending and Settled Legal Proceedings
In June 2004, an action captioned John E. Gallus et al. v. American Express Financial Corp. and American Express Financial Advisors Inc. was filed in the United States District Court for the District of Arizona. The plaintiffs allege that they are investors in several American Express Company mutual funds (currently branded as Columbia) and they purport to bring the action derivatively on behalf of those funds under the Investment Company Act of 1940. The plaintiffs allege that fees allegedly paid to the defendants by the funds for investment advisory and administrative services are excessive. The plaintiffs seek remedies including restitution and rescission of investment advisory and distribution agreements. The plaintiffs voluntarily agreed to transfer this case to the United States District Court for the District of Minnesota (the District Court). In response to defendants' motion to dismiss the complaint, the District Court dismissed one of plaintiffs' four claims and granted plaintiffs limited discovery. Defendants moved for summary judgment in April 2007. Summary judgment was granted in the defendants' favor on July 9, 2007. The plaintiffs filed a notice of appeal with the Eighth Circuit Court of Appeals (the Eighth Circuit) on August 8, 2007. On April 8, 2009, the Eighth Circuit reversed summary judgment and remanded to the District Court for further proceedings. On August 6, 2009, defendants filed a writ of certiorari with the U.S. Supreme Court (the Supreme Court), asking the Supreme Court to stay the District Court proceedings while the Supreme Court considered and ruled in a case captioned Jones v. Harris Associates, which involved issues of law similar to those presented in the Gallus case. On March 30, 2010, the Supreme Court issued its ruling in Jones v. Harris Associates, and on April 5, 2010, the Supreme Court vacated the Eighth Circuit's decision in the Gallus case and remanded the case to the Eighth Circuit for further consideration in light of the Supreme Court's decision in Jones v. Harris Associates. On June 4, 2010, the Eighth Circuit remanded the Gallus case to the District Court for further consideration in light of the Supreme Court's decision in Jones v. Harris Associates. On December 9, 2010, the District Court reinstated its July 9, 2007 summary judgment order in favor of the defendants. On January 10, 2011, plaintiffs filed a notice of appeal with the Eighth Circuit. In response to the plaintiffs' opening appellate brief filed on March 18, 2011, the defendants filed a response brief on May 4, 2011 with the Eighth Circuit. The plaintiffs filed a reply brief on May 26, 2011 and oral arguments took place on November 17, 2011. On March 30, 2012, the Eighth Circuit upheld the grant of summary judgment by the District Court in favor of the defendants.
In December 2005, without admitting or denying the allegations, American Express Financial Corporation (AEFC, which is now known as Ameriprise Financial, Inc. (Ameriprise Financial)) entered into settlement agreements with the Securities and Exchange Commission (SEC) and Minnesota Department of Commerce (MDOC) related to market timing activities. As a result, AEFC was censured and ordered to cease and desist from committing or causing any violations of certain provisions of the Investment Advisers
23
Columbia International Value Fund, February 29, 2012
Act of 1940, the Investment Company Act of 1940, and various Minnesota laws. AEFC agreed to pay disgorgement of $10 million and civil money penalties of $7 million. AEFC also agreed to retain an independent distribution consultant to assist in developing a plan for distribution of all disgorgement and civil penalties ordered by the SEC in accordance with various undertakings detailed at www.sec.gov/litigation/admin/ia-2451.pdf. Ameriprise Financial and its affiliates have cooperated with the SEC and the MDOC in these legal proceedings, and have made regular reports to the funds' Boards of Trustees.
Ameriprise Financial and certain of its affiliates have historically been involved in a number of legal, arbitration and regulatory proceedings, including routine litigation, class actions, and governmental actions, concerning matters arising in connection with the conduct of their business activities. Ameriprise Financial believes that the Funds are not currently the subject of, and that neither Ameriprise Financial nor any of its affiliates are the subject of, any pending legal, arbitration or regulatory proceedings that are likely to have a material adverse effect on the Funds or the ability of Ameriprise Financial or its affiliates to perform under their contracts with the Funds. Ameriprise Financial is required to make 10-Q, 10-K and, as necessary, 8-K filings with the Securities and Exchange Commission on legal and regulatory matters that relate to Ameriprise Financial and its affiliates. Copies of these filings may be obtained by accessing the SEC website at www.sec.gov.
There can be no assurance that these matters, or the adverse publicity associated with them, will not result in increased fund redemptions, reduced sale of fund shares or other adverse consequences to the Funds. Further, although we believe proceedings are not likely to have a material adverse effect on the Funds or the ability of Ameriprise Financial or its affiliates to perform under their contracts with the Funds, these proceedings are subject to uncertainties and, as such, we are unable to estimate the possible loss or range of loss that may result. An adverse outcome in one or more of these proceedings could result in adverse judgments, settlements, fines, penalties or other relief that could have a material adverse effect on the consolidated financial condition or results of operations of Ameriprise Financial.
24
Report of Independent Registered Public Accounting Firm
To the Trustees of Columbia Funds Series Trust and the Shareholders of Columbia International Value Fund
In our opinion, the accompanying statement of assets and liabilities, including the investment portfolio, and the related statements of operations and of changes in net assets and the financial highlights present fairly, in all material respects, the financial position of Columbia International Value Fund (the "Fund") (a series of Columbia Funds Series Trust) at February 29, 2012, the results of its operations for the year then ended, the changes in its net assets for each of the two years in the period then ended and the financial highlights for each of the periods indicated, in conformity with accounting principles generally accepted in the United States of America. These financial statements and financial highlights (hereafter referred to as "financial statements") are the responsibility of the Fund's management. Our responsibility is to express an opinion on these financial statements based on our audits. We conducted our audits of these financial statements in accordance with the standards of the Public Company Accounting Oversight Board (United States). Those standards require that we plan and perform the audit to obtain reasonable assurance about whether the financial statements are free of material misstatement. An audit includes examining, on a test basis, evidence supporting the amounts and disclosures in the financial statements, assessing the accounting principles used and significant estimates made by management, and evaluating the overall financial statement presentation. We believe that our audits, which included confirmation of securities at February 29, 2012 by correspondence with the custodian, transfer agent and brokers, provide a reasonable basis for our opinion.
PricewaterhouseCoopers LLP
Minneapolis, Minnesota
April 20, 2012
25
Federal Income Tax Information (Unaudited) – Columbia International Value Fund
Foreign taxes paid during the fiscal year ended February 29, 2012, of $8,099,871 are being passed through to shareholders. This represents $0.09 per share. Eligible shareholders may claim this amount as a foreign tax credit.
Gross income derived from sources within foreign countries was $64,688,474 ($0.72 per share) for the fiscal year ended February 29, 2012.
For non-corporate shareholders, 96.71% or the maximum amount allowable under the Jobs and Growth Tax Relief Reconciliation Act of 2003, of the ordinary income distributed by the Feeder Fund for the fiscal year ended February 29, 2012 may represent qualified dividend income.
The Feeder Fund will notify shareholders in January 2013 of amounts for use in preparing 2012 income tax returns.
26
Columbia Funds Master Investment Trust, LLC
Columbia International Value Master Portfolio Annual Report (Unaudited)
February 29, 2012
The following pages should be read in conjunction with Columbia International Value Fund's Annual Report.
27
Portfolio of Investments – Columbia International Value Master Portfolio
February 29, 2012
(Percentages represent value of investments compared to net assets)
| Issuer | | Shares | | Value | |
| Common Stocks 96.0% | |
| BRAZIL 5.9% | |
| Centrais Eletricas Brasileiras SA, ADR | | | 1,727,040 | | | $ | 18,669,302 | | |
| Oi SA (Ordinary), ADR | | | 199,977 | | | | 1,425,836 | | |
| Oi SA (Preference), ADR | | | 352,511 | | | | 7,050,220 | | |
| Petroleo Brasileiro SA, ADR(a) | | | 879,743 | | | | 25,063,878 | | |
| Tele Norte Leste Participacoes SA, ADR(a) | | | 691,100 | | | | 7,422,414 | | |
| Telefonica Brasil SA, ADR(a) | | | 353,756 | | | | 10,411,039 | | |
| Tim Participacoes SA, ADR(a) | | | 214,753 | | | | 6,453,328 | | |
| Total | | | 76,496,017 | | |
| FRANCE 11.0% | |
| Alcatel-Lucent(b) | | | 1,688,500 | | | | 4,233,724 | | |
| Carrefour SA | | | 944,160 | | | | 23,673,751 | | |
| France Telecom SA | | | 1,838,170 | | | | 28,053,214 | | |
| Natixis | | | 2,404,246 | | | | 8,690,215 | | |
| Renault SA | | | 125,200 | | | | 6,628,787 | | |
| Sanofi | | | 397,486 | | | | 29,396,452 | | |
| Total SA | | | 739,781 | | | | 41,385,757 | | |
| Total | | | 142,061,900 | | |
| GERMANY 2.6% | |
| Deutsche Bank AG, Registered Shares | | | 160,195 | | | | 7,481,708 | | |
| Deutsche Telekom AG | | | 2,207,800 | | | | 25,767,109 | | |
| Total | | | 33,248,817 | | |
| IRELAND 1.5% | |
| CRH PLC | | | 890,616 | | | | 19,099,556 | | |
| ITALY 7.9% | |
| ENI SpA | | | 2,015,187 | | | | 46,474,452 | | |
| Intesa Sanpaolo SpA | | | 10,191,238 | | | | 19,837,138 | | |
| Italcementi SpA, Savings Shares | | | 890,500 | | | | 2,894,847 | | |
| Telecom Italia SpA | | | 1,120,510 | | | | 1,291,319 | | |
| Telecom Italia SpA, Savings Shares | | | 32,972,210 | | | | 31,211,454 | | |
| Total | | | 101,709,210 | | |
| JAPAN 28.7% | |
| Astellas Pharma, Inc.(a) | | | 475,000 | | | | 19,511,286 | | |
| Canon, Inc. | | | 321,200 | | | | 14,647,761 | | |
| Dai Nippon Printing Co., Ltd. | | | 1,240,000 | | | | 12,788,196 | | |
| Daiichi Sankyo Co., Ltd. | | | 852,600 | | | | 15,675,808 | | |
| FUJIFILM Holdings Corp. | | | 890,505 | | | | 22,711,342 | | |
| Japan Tobacco, Inc. | | | 2,778 | | | | 14,758,061 | | |
| Mitsubishi UFJ Financial Group, Inc.(a) | | | 3,679,431 | | | | 19,015,723 | | |
| Mizuho Financial Group, Inc.(a) | | | 5,695,300 | | | | 9,572,987 | | |
| MS&AD Insurance Group Holdings, Inc. | | | 864,200 | | | | 18,614,488 | | |
| Nippon Telegraph & Telephone Corp. | | | 681,700 | | | | 32,089,243 | | |
| Nissan Motor Co., Ltd. | | | 903,100 | | | | 9,315,905 | | |
| NKSJ Holdings, Inc.(a) | | | 597,250 | | | | 14,062,319 | | |
| Ono Pharmaceutical Co., Ltd.(a) | | | 262,800 | | | | 14,383,713 | | |
| Rohm Co., Ltd. | | | 191,400 | | | | 9,676,271 | | |
| Seven & I Holdings Co., Ltd.(a) | | | 625,600 | | | | 17,281,605 | | |
| Sony Corp. | | | 669,300 | | | | 14,446,061 | | |
| Sumitomo Mitsui Financial Group, Inc.(a) | | | 552,042 | | | | 18,736,672 | | |
| Sumitomo Mitsui Trust Holdings, Inc. | | | 1,436,000 | | | | 4,994,305 | | |
| Taisho Pharmaceutical Holdings Co., Ltd.(a)(b) | | | 100,999 | | | | 8,088,369 | | |
| Takeda Pharmaceutical Co., Ltd.(a) | | | 499,800 | | | | 22,553,595 | | |
| TDK Corp. | | | 185,000 | | | | 9,711,827 | | |
| Tokio Marine Holdings, Inc. | | | 714,900 | | | | 19,743,673 | | |
| Toyota Motor Corp. | | | 678,300 | | | | 28,196,630 | | |
| Total | | | 370,575,840 | | |
| Issuer | | Shares | | Value | |
| Common Stocks (continued) | |
| MEXICO 1.7% | |
| America Movil SAB de CV, Class L, ADR(a) | | | 469,512 | | | $ | 11,240,117 | | |
| Cemex SAB de CV, ADR(a)(b) | | | 1,412,592 | | | | 10,848,707 | | |
| Total | | | 22,088,824 | | |
| NETHERLANDS 7.6% | |
| Aegon NV(b) | | | 3,899,357 | | | | 20,416,787 | | |
| Akzo Nobel NV | | | 189,700 | | | | 10,760,287 | | |
| Koninklijke Ahold NV | | | 1,736,532 | | | | 24,014,967 | | |
| STMicroelectronics NV | | | 2,682,400 | | | | 20,016,630 | | |
| Unilever NV-CVA | | | 678,849 | | | | 22,547,444 | | |
| Total | | | 97,756,115 | | |
| PORTUGAL 0.8% | |
| Portugal Telecom SGPS SA(a) | | | 2,106,976 | | | | 10,894,444 | | |
| RUSSIAN FEDERATION 1.0% | |
| Lukoil OAO, ADR | | | 207,100 | | | | 13,212,980 | | |
| SOUTH KOREA 3.1% | |
| Korea Electric Power Corp., ADR(b) | | | 1,019,450 | | | | 11,366,867 | | |
| POSCO | | | 34,200 | | | | 12,691,260 | | |
| SK Telecom Co., Ltd. | | | 118,977 | | | | 15,455,878 | | |
| Total | | | 39,514,005 | | |
| SPAIN 0.9% | |
| Telefonica SA | | | 697,443 | | | | 11,903,090 | | |
| SWEDEN 0.9% | |
| Telefonaktiebolaget LM Ericsson, Class B | | | 1,137,168 | | | | 11,420,145 | | |
| SWITZERLAND 5.9% | |
| Swiss Re AG | | | 485,400 | | | | 28,811,739 | | |
| Swisscom AG | | | 40,130 | | | | 15,986,351 | | |
| TE Connectivity Ltd. | | | 482,043 | | | | 17,618,671 | | |
| UBS AG, Registered Shares(b) | | | 975,930 | | | | 13,645,976 | | |
| Total | | | 76,062,737 | | |
| UNITED KINGDOM 16.5% | |
| AstraZeneca PLC | | | 579,085 | | | | 25,864,553 | | |
| Barclays PLC | | | 4,818,407 | | | | 18,780,730 | | |
| BP PLC | | | 3,551,700 | | | | 27,822,568 | | |
| GlaxoSmithKline PLC | | | 1,015,148 | | | | 22,400,036 | | |
| HSBC Holdings PLC | | | 983,039 | | | | 8,684,430 | | |
| ITV PLC | | | 10,528,676 | | | | 14,396,686 | | |
| J Sainsbury PLC | | | 4,328,729 | | | | 20,542,654 | | |
| Kingfisher PLC | | | 3,680,700 | | | | 16,641,689 | | |
| Marks & Spencer Group PLC | | | 4,290,980 | | | | 24,780,269 | | |
| Vodafone Group PLC | | | 5,952,690 | | | | 16,037,673 | | |
| Wm Morrison Supermarkets PLC | | | 3,598,665 | | | | 16,602,837 | | |
| Total | | | 212,554,125 | | |
Total Common Stocks
(Cost: $1,456,254,197) | | $ | 1,238,597,805 | | |
| Money Market Funds 3.7% | |
| Columbia Short-Term Cash Fund, 0.166%(c)(d) | | | 47,968,082 | | | | 47,968,082 | | |
Total Money Market Funds
(Cost: $47,968,082) | | $ | 47,968,082 | | |
The Accompanying Notes to Financial Statements are an integral part of this statement.
28
Columbia International Value Master Portfolio
February 29, 2012
(Percentages represent value of investments compared to net assets)
| Issuer | | Effective
Yield | | Par/
Principal/
Shares | | Value | |
Investments of Cash Collateral Received for Securities
on Loan 10.5% | |
| Asset-Backed Commercial Paper 0.6% | |
Barton Capital Corporation
03/07/12 | | | 0.270 | % | | $ | 4,999,738 | | | $ | 4,999,738 | | |
Rheingold Securitization
03/27/12 | | | 0.700 | % | | | 1,998,872 | | | | 1,998,872 | | |
| Total | | | 6,998,610 | | |
| Certificates of Deposit 1.9% | |
ABM AMRO Bank N.V.
03/21/12 | | | 0.310 | % | | | 1,999,501 | | | | 1,999,501 | | |
Branch Banking & Trust Corporation
03/15/12 | | | 0.240 | % | | | 5,000,000 | | | | 5,000,000 | | |
FMS Wertmanagement Anstalt Des Oeffentlichen Rechts
03/09/12 | | | 0.330 | % | | | 1,500,000 | | | | 1,500,000 | | |
Mitsubishi UFJ Trust and Banking Corp.
05/31/12 | | | 0.390 | % | | | 5,000,064 | | | | 5,000,064 | | |
Norinchukin Bank
05/21/12 | | | 0.470 | % | | | 2,000,000 | | | | 2,000,000 | | |
Standard Chartered Bank PLC
04/03/12 | | | 0.570 | % | | | 3,000,000 | | | | 3,000,000 | | |
Sumitomo Trust & Banking Co., Ltd.
05/29/12 | | | 0.370 | % | | | 4,000,000 | | | | 4,000,000 | | |
United Overseas Bank Ltd.
03/16/12 | | | 0.250 | % | | | 2,000,000 | | | | 2,000,000 | | |
| Total | | | 24,499,565 | | |
| Commercial Paper 0.5% | |
Foreningsparbanken (Swedbank)
03/21/12 | | | 0.425 | % | | | 1,998,725 | | | | 1,998,725 | | |
Societe Generale
03/06/12 | | | 0.320 | % | | | 4,999,689 | | | | 4,999,689 | | |
| Total | | | 6,998,414 | | |
| Repurchase Agreements 7.5% | |
Citigroup Global Markets, Inc.
dated 02/29/12, matures 03/01/12,
repurchase price $10,000,036(e) | | | 0.130 | % | | | 10,000,000 | | | | 10,000,000 | | |
Credit Suisse Securities (USA) LLC
dated 02/29/12, matures 03/01/12,
repurchase price $11,184,614(e) | | | 0.160 | % | | | 11,184,564 | | | | 11,184,564 | | |
Morgan Stanley
dated 02/29/12, matures 03/01/12,
repurchase price $10,000,050(e) | | | 0.180 | % | | | 10,000,000 | | | | 10,000,000 | | |
| Issuer | | Effective
Yield | | Par/
Principal/
Shares | | Value | |
Investments of Cash Collateral Received for Securities
on Loan (continued) | |
| Repurchase Agreements (cont.) | |
Natixis Financial Products, Inc.
dated 02/29/12, matures 03/01/12,
repurchase price $14,500,089(e) | | | 0.220 | % | | $ | 14,500,000 | | | $ | 14,500,000 | | |
Nomura Securities
dated 02/29/12, matures 03/01/12,
repurchase price $5,000,028(e) | | | 0.200 | % | | | 5,000,000 | | | | 5,000,000 | | |
Pershing LLC
dated 02/29/12, matures 03/01/12,
repurchase price $6,000,048(e) | | | 0.290 | % | | | 6,000,000 | | | | 6,000,000 | | |
Societe Generale
dated 02/29/12, matures 03/01/12,
repurchase price $40,000,222(e) | | | 0.200 | % | | | 40,000,000 | | | | 40,000,000 | | |
| Total | | | 96,684,564 | | |
Total Investments of Cash Collateral Received for Securities
on Loan
(Cost: $135,181,153) | | $ | 135,181,153 | | |
Total Investments
(Cost: $1,639,403,432) | | | | | | | | | | $ | 1,421,747,040 | | |
| Other Assets & Liabilities, Net | | | | | | | | | | | (131,074,177 | ) | |
| Net Assets | | $ | 1,290,672,863 | | |
At February 29, 2012, the Master Portfolio held investments in the following sectors.
| Sector (Unaudited) | | Value | | % of Total
Investments(1) | |
| Consumer Discretionary | | $ | 114,406,027 | | | | 8.9 | | |
| Consumer Staples | | | 139,421,319 | | | | 10.8 | | |
| Energy | | | 153,959,635 | | | | 12.0 | | |
| Financials | | | 231,088,890 | | | | 18.0 | | |
| Health Care | | | 157,873,812 | | | | 12.3 | | |
| Industrials | | | 12,788,196 | | | | 1.0 | | |
| Information Technology | | | 110,036,372 | | | | 8.5 | | |
| Materials | | | 56,294,657 | | | | 4.4 | | |
| Telecommunication Services | | | 232,692,728 | | | | 18.1 | | |
| Utilities | | | 30,036,169 | | | | 2.3 | | |
| Cash Equivalents | | | 47,968,082 | | | | 3.7 | | |
| | | $ | 1,286,565,887 | | | | 100.0 | | |
(1) Percentages indicated are based upon total investments (excluding Investments of Cash Collateral Received for Securities on Loan).
| Notes to Portfolio of Investments | |
(a) At February 29, 2012, security was partially or fully on loan.
(b) Non-income producing.
(c) The rate shown is the seven-day current annualized yield at February 29, 2012.
(d) Investments in affiliates during the year ended February 29, 2012:
| Issuer | | Beginning Cost | | Purchase Cost | | Sales Cost/
Proceeds
from Sales | | Realized
Gain/Loss | | Ending
Cost | | Dividends
or Interest
Income | | Value | |
Columbia Short-Term
Cash Fund | | $ | — | | | $ | 236,395,400 | | | $ | (188,427,318 | ) | | $ | — | | | $ | 47,968,082 | | | $ | 13,055 | | | $ | 47,968,082 | | |
The Accompanying Notes to Financial Statements are an integral part of this statement.
29
Columbia International Value Master Portfolio
February 29, 2012
| Notes to Portfolio of Investments (continued) | |
(e) The table below represents securities received as collateral for repurchase agreements. This collateral is deposited with the Fund's custodian and, pursuant to the terms of the repurchase agreement, must have an aggregate market value greater than or equal to the repurchase price plus accrued interest at all times. The value of securities and/or cash held as collateral for repurchase agreements is monitored on a daily basis to ensure the proper level of collateral.
Citigroup Global Markets, Inc. (0.130%)
| Security Description | | Value | |
| Fannie Mae REMICS | | $ | 4,785,468 | | |
| Fannie Mae-Aces | | | 529,857 | | |
| Freddie Mac REMICS | | | 3,838,826 | | |
| Government National Mortgage Association | | | 1,045,849 | | |
| Total Market Value of Collateral Securities | | $ | 10,200,000 | | |
Credit Suisse Securities (USA) LLC (0.160%)
| Security Description | | Value | |
| Ginnie Mae I Pool | | $ | 8,007,061 | | |
| Ginnie Mae II Pool | | | 3,401,221 | | |
| Total Market Value of Collateral Securities | | $ | 11,408,282 | | |
Morgan Stanley (0.180%)
| Security Description | | Value | |
| Freddie Mac Gold Pool | | $ | 5,450,492 | | |
| Freddie Mac Non Gold Pool | | | 4,749,508 | | |
| Total Market Value of Collateral Securities | | $ | 10,200,000 | | |
Natixis Financial Products, Inc. (0.220%)
| Security Description | | Value | |
| Fannie Mae Pool | | $ | 729,448 | | |
| Fannie Mae REMICS | | | 5,432,682 | | |
| Freddie Mac Gold Pool | | | 667,873 | | |
| Freddie Mac REMICS | | | 3,203,370 | | |
| Government National Mortgage Association | | | 956,202 | | |
| United States Treasury Note/Bond | | | 3,800,515 | | |
| Total Market Value of Collateral Securities | | $ | 14,790,090 | | |
Nomura Securities (0.200%)
| Security Description | | Value | |
| Ginnie Mae II Pool | | $ | 5,100,000 | | |
| Total Market Value of Collateral Securities | | $ | 5,100,000 | | |
Pershing LLC (0.290%)
| Security Description | | Value | |
| Fannie Mae Pool | | $ | 979,521 | | |
| Fannie Mae REMICS | | | 826,029 | | |
| Fannie Mae-Aces | | | 8,324 | | |
| Federal Farm Credit Bank | | | 74,021 | | |
| Federal Home Loan Banks | | | 79,615 | | |
| Federal Home Loan Mortgage Corp | | | 187,668 | | |
| Federal National Mortgage Association | | | 231,469 | | |
| Freddie Mac Gold Pool | | | 397,471 | | |
| Freddie Mac Non Gold Pool | | | 111,011 | | |
| Freddie Mac Reference REMIC | | | 27 | | |
| Freddie Mac REMICS | | | 769,368 | | |
| Ginnie Mae I Pool | | | 1,004,013 | | |
| Ginnie Mae II Pool | | | 895,143 | | |
| Government National Mortgage Association | | | 321,202 | | |
| United States Treasury Note/Bond | | | 221,511 | | |
| United States Treasury Strip Coupon | | | 13,607 | | |
| Total Market Value of Collateral Securities | | $ | 6,120,000 | | |
The Accompanying Notes to Financial Statements are an integral part of this statement.
30
Columbia International Value Master Portfolio
February 29, 2012
| Notes to Portfolio of Investments (continued) | |
Societe Generale (0.200%)
| Security Description | | Value | |
| Fannie Mae REMICS | | $ | 6,245,042 | | |
| Freddie Mac REMICS | | | 10,640,051 | | |
| Freddie Mac Strips | | | 1,080,501 | | |
| Government National Mortgage Association | | | 22,834,406 | | |
| Total Market Value of Collateral Securities | | $ | 40,800,000 | | |
| Abbreviation Legend | |
ADR American Depositary Receipt
Generally accepted accounting principles (GAAP) require disclosure regarding the inputs and valuation techniques used to measure fair value and any changes in valuation inputs or techniques. In addition, investments shall be disclosed by major category.
The Fund categorizes its fair value measurements according to a three-level hierarchy that maximizes the use of observable inputs and minimizes the use of unobservable inputs by prioritizing that the most observable input be used when available. Observable inputs are those that market participants would use in pricing an investment based on market data obtained from sources independent of the reporting entity. Unobservable inputs are those that reflect the Fund's assumptions about the information market participants would use in pricing an investment. An investment's level within the fair value hierarchy is based on the lowest level of any input that is deemed significant to the asset or liability's fair value measurement. The input levels are not necessarily an indication of the risk or liquidity associated with investments at that level. For example, certain U.S. government securities are generally high quality and liquid, however, they are reflected as Level 2 because the inputs used to determine fair value may not always be quoted prices in an active market.
Fair value inputs are summarized in the three broad levels listed below:
• Level 1 — Valuations based on quoted prices for investments in active markets that the Fund has the ability to access at the measurement date (including NAV for open-end mutual funds). Valuation adjustments are not applied to Level 1 investments.
• Level 2 — Valuations based on other significant observable inputs (including quoted prices for similar securities, interest rates, prepayment speeds, credit risks, etc.).
• Level 3 — Valuations based on significant unobservable inputs (including the Fund's own assumptions and judgment in determining the fair value of investments).
Inputs that are used in determining fair value of an investment may include price information, credit data, volatility statistics, and other factors. These inputs can be either observable or unobservable. The availability of observable inputs can vary between investments, and is affected by various factors such as the type of investment, and the volume and level of activity for that investment or similar investments in the marketplace. The inputs will be considered by the Investment Manager, along with any other relevant factors in the calculation of an investment's fair value. The Fund uses prices and inputs that are current as of the measurement date, which may include periods of market dislocations. During these periods, the availability of prices and inputs may be reduced for many investments. This condition could cause an investment to be reclassified between the various levels within the hierarchy.
Foreign equity securities actively traded in markets where there is a significant delay in the local close relative to the New York Stock Exchange (NYSE) are classified as Level 2. The values of these securities may include an adjustment to reflect the impact of significant market movements following the close of local trading, as described in Note 2 to the financial statements — Security Valuation.
Investments falling into the Level 3 category are primarily supported by quoted prices from brokers and dealers participating in the market for those investments. However, these may be classified as Level 3 investments due to lack of market transparency and corroboration to support these quoted prices. Additionally, valuation models may be used as the pricing source for any remaining investments classified as Level 3. These models rely on one or more significant unobservable inputs and/or significant assumptions by the Investment Manager. Inputs used in valuations may include, but are not limited to, financial statement analysis, capital account balances, discount rates and estimated cash flows, and comparable company data.
The Accompanying Notes to Financial Statements are an integral part of this statement.
31
Columbia International Value Master Portfolio
February 29, 2012
| Fair Value Measurements (continued) | |
The following table is a summary of the inputs used to value the Fund's investments as of February 29, 2012:
| | | Fair value at February 29, 2012 | |
| Description(a) | | Level 1
quoted prices
in active
markets for
identical assets | | Level 2
other
significant
observable
inputs(b) | | Level 3
significant
unobservable
inputs | | Total | |
| Equity Securities | |
| Common Stocks | |
| Consumer Discretionary | | $ | — | | | $ | 114,406,027 | | | $ | — | | | $ | 114,406,027 | | |
| Consumer Staples | | | — | | | | 139,421,319 | | | | — | | | | 139,421,319 | | |
| Energy | | | 38,276,858 | | | | 115,682,777 | | | | — | | | | 153,959,635 | | |
| Financials | | | — | | | | 231,088,890 | | | | — | | | | 231,088,890 | | |
| Health Care | | | — | | | | 157,873,812 | | | | — | | | | 157,873,812 | | |
| Industrials | | | — | | | | 12,788,196 | | | | — | | | | 12,788,196 | | |
| Information Technology | | | 17,618,671 | | | | 92,417,700 | | | | — | | | | 110,036,371 | | |
| Materials | | | 10,848,707 | | | | 45,445,950 | | | | — | | | | 56,294,657 | | |
| Telecommunication Services | | | 44,002,954 | | | | 188,689,775 | | | | — | | | | 232,692,729 | | |
| Utilities | | | 30,036,169 | | | | — | | | | — | | | | 30,036,169 | | |
| Total Equity Securities | | | 140,783,359 | | | | 1,097,814,446 | | | | — | | | | 1,238,597,805 | | |
| Other | |
| Money Market Funds | | | 47,968,082 | | | | — | | | | — | | | | 47,968,082 | | |
Investments of Cash Collateral
Received for Securities on Loan | | | — | | | | 135,181,153 | | | | — | | | | 135,181,153 | | |
| Total Other | | | 47,968,082 | | | | 135,181,153 | | | | — | | | | 183,149,235 | | |
| Total | | $ | 188,751,441 | | | $ | 1,232,995,599 | | | $ | — | | | $ | 1,421,747,040 | | |
The Fund's assets assigned to the Level 2 input category are generally valued using the market approach, in which a security's value is determined through reference to prices and information from market transactions for similar or identical assets. These assets include certain foreign securities for which a third party statistical pricing service may be employed for purposes of fair market valuation. The models utilized by the third party statistical pricing service take into account a security's correlation to available market data including, but not limited to, intraday index, ADR, and ETF movements.
(a) See the Portfolio of Investments for all investment classifications not indicated in the table.
(b) There were no significant transfers between Levels 1 and 2 during the period.
The Accompanying Notes to Financial Statements are an integral part of this statement.
32
Statement of Assets and Liabilities – Columbia International Value Master Portfolio
February 29, 2012
| Assets | |
| Investments, at value* | |
| Unaffiliated issuers (identified cost $1,456,254,197) | | $ | 1,238,597,805 | | |
| Affiliated issuers (identified cost $47,968,082) | | | 47,968,082 | | |
| Investment of cash collateral received for securities on loan | |
| Short-term securities (identified cost $38,496,589) | | | 38,496,589 | | |
| Repurchase agreements (identified cost $96,684,564) | | | 96,684,564 | | |
| Total investments (identified cost $1,639,403,432) | | | 1,421,747,040 | | |
| Foreign currency (identified cost $389,900) | | | 390,816 | | |
| Receivable from feeder funds | | | 1,538,312 | | |
| Receivable for: | |
| Dividends | | | 13,169,369 | | |
| Interest | | | 27,945 | | |
| Reclaims | | | 63,783 | | |
| Prepaid expense | | | 3,882 | | |
| Total assets | | | 1,436,941,147 | | |
| Liabilities | |
| Due upon return of securities on loan | | | 135,181,153 | | |
| Payable for: | |
| Investments purchased | | | 9,939,965 | | |
| Investment management fees | | | 828,543 | | |
| Administration fees | | | 51,137 | | |
| Compensation of board members | | | 15,975 | | |
| Custodian fees | | | 35,270 | | |
| Professional fees | | | 77,575 | | |
| Other expenses | | | 138,666 | | |
| Total liabilities | | | 146,268,284 | | |
| Net assets applicable to outstanding capital stock | | $ | 1,290,672,863 | | |
| *Value of securities on loan | | $ | 128,222,861 | | |
The Accompanying Notes to Financial Statements are an integral part of this statement.
33
Statement of Operations – Columbia International Value Master Portfolio
Year ended February 29, 2012
| Net investment income | |
| Income: | |
| Dividends | | $ | 73,432,884 | | |
| Interest | | | 2,297 | | |
| Dividends from affiliates | | | 13,055 | | |
| Income from securities lending — net | | | 561,625 | | |
| Foreign taxes withheld | | | (10,372,194 | ) | |
| Total income | | | 63,637,667 | | |
| Expenses: | |
| Investment management fees | | | 11,852,353 | | |
| Administration fees | | | 682,306 | | |
| Compensation of board members | | | 40,293 | | |
| Pricing and bookkeeping fees | | | 67,228 | | |
| Custodian fees | | | 270,746 | | |
| Professional fees | | | 61,157 | | |
| Line of credit interest expense | | | 34,698 | | |
| Other | | | 52,357 | | |
| Total expenses | | | 13,061,138 | | |
| Net investment income | | | 50,576,529 | | |
| Realized and unrealized gain (loss) — net | |
| Net realized gain (loss) on: | |
| Investments | | | (114,577,230 | ) | |
| Foreign currency translations | | | 272,626 | | |
| Net realized loss | | | (114,304,604 | ) | |
| Net change in unrealized appreciation (depreciation) on: | |
| Investments | | | (120,804,496 | ) | |
| Foreign currency translations | | | (25,219 | ) | |
| Net change in unrealized depreciation | | | (120,829,715 | ) | |
| Net realized and unrealized loss | | | (235,134,319 | ) | |
| Net decrease in net assets from operations | | $ | (184,557,790 | ) | |
The Accompanying Notes to Financial Statements are an integral part of this statement.
34
Statement of Changes in Net Assets – Columbia International Value Master Portfolio
| | | Year ended
February 29,
2012 | | Year ended
February 28,
2011 | |
| Operations | |
| Net investment income | | $ | 50,576,529 | | | $ | 41,552,435 | | |
| Net realized loss | | | (114,304,604 | ) | | | (91,159,555 | ) | |
| Net change in unrealized appreciation (depreciation) | | | (120,829,715 | ) | | | 326,490,584 | | |
| Net increase (decrease) in net assets resulting from operations | | | (184,557,790 | ) | | | 276,883,464 | | |
| Contributions and withdrawals: | |
| Contributions | | | 278,469,573 | | | | 465,537,680 | | |
| Withdrawals | | | (781,643,335 | ) | | | (660,383,240 | ) | |
| Net contributions (withdrawals) | | | (503,173,762 | ) | | | (194,845,560 | ) | |
| Total increase (decrease) in net assets | | | (687,731,552 | ) | | | 82,037,904 | | |
| Net assets at beginning of year | | | 1,978,404,415 | | | | 1,896,366,511 | | |
| Net assets at end of year | | $ | 1,290,672,863 | | | $ | 1,978,404,415 | | |
The Accompanying Notes to Financial Statements are an integral part of this statement.
35
Financial Highlights – Columbia International Value Master Portfolio
The following table shows certain financial information for evaluating the Portfolio's results. Total returns are not annualized for periods of less than one year.
| | | Year ended
Feb. 29, | | Year ended Feb. 28, | | Year ended
Feb. 29, | | Year ended
March 31, | |
| | | 2012 | | 2011 | | 2010 | | 2009 | | 2008(a) | | 2007 | |
| Total return | | | (9.07 | %) | | | 16.11 | % | | | 46.24 | % | | | (42.12 | %) | | | (6.79 | %) | | | 20.95 | % | |
| Ratios to average net assets(b) | |
Expenses prior to fees waived or expenses reimbursed
(including interest expense) | | | 0.88 | %(c) | | | 0.86 | %(c) | | | 0.87 | %(c) | | | 0.84 | %(c) | | | 0.81 | %(c)(d) | | | 0.80 | %(c) | |
Net expenses after fees waived or expenses reimbursed
(including interest expense) | | | 0.88 | %(c) | | | 0.86 | %(c)(e) | | | 0.87 | %(c)(e) | | | 0.84 | %(c)(e) | | | 0.81 | %(c)(d)(e) | | | 0.80 | %(c)(e) | |
Expenses prior to fees waived or expenses reimbursed
(excluding interest expense) | | | 0.88 | % | | | 0.86 | % | | | 0.87 | % | | | 0.84 | % | | | 0.81 | %(d) | | | 0.80 | % | |
Net expenses after fees waiver or expenses reimbursed
(excluding interest expense) | | | 0.88 | % | | | 0.86 | %(e) | | | 0.87 | %(e) | | | 0.84 | %(e) | | | 0.81 | %(d)(e) | | | 0.80 | %(e) | |
| Net investment income | | | 3.41 | % | | | 2.21 | %(e) | | | 3.08 | %(e) | | | 3.58 | %(e) | | | 3.27 | %(d)(e) | | | 1.66 | %(e) | |
| Supplemental data | |
| Portfolio turnover | | | 16 | % | | | 7 | % | | | 22 | % | | | 5 | % | | | 24 | % | | | 19 | % | |
| Notes to Financial Highlights | |
(a) For the period from April 1, 2007 to February 29, 2008. In 2008, the Fund's fiscal year end was changed from March 31 to February 29.
(b) In addition to the fees and expenses which the Fund bears directly, the Fund indirectly bears a pro rata share of the fees and expenses of the acquired funds in which it invests. Such indirect expenses are not included in the reported expense ratios.
(c) Includes interest expense which rounds to less than 0.01%.
(d) Annualized.
(e) The benefits derived from expense reductions had an impact of less than 0.01%.
The Accompanying Notes to Financial Statements are an integral part of this statement.
36
Notes to Financial Statements – Columbia International Value Master Portfolio
February 29, 2012
Note 1. Organization
Columbia Funds Master Investment Trust, LLC (the Master Trust), is registered under the Investment Company Act of 1940, as amended (the 1940 Act), as an open-end management investment company and is organized as a Delaware limited liability company. Information presented in these financial statements pertains to Columbia International Value Master Portfolio (the Master Portfolio), a series of the Master Trust.
The following investors were invested in the Master Portfolio at February 29, 2012:
Columbia International
Value Fund (the Feeder Fund) | | | 92.0 | % | |
Columbia Management Private
Funds VII, LLC—International Value Fund | | | 8.0 | % | |
The Master Portfolio serves as a master portfolio for the Columbia International Value Fund which operates as a feeder fund in a master/feeder structure.
Each investor in the Master Portfolio is treated as an owner of its proportionate share of the net assets, income, expenses and realized and unrealized gains (losses) of the Master Portfolio.
Note 2. Summary of Significant Accounting Policies
Use of Estimates
The preparation of financial statements in accordance with U.S. generally accepted accounting principles (GAAP) requires management to make certain estimates and assumptions that affect the reported amounts of assets and liabilities, the disclosure of contingent assets and liabilities at the date of the financial statements and the reported amounts of revenue and expenses during the reporting period. Actual results could differ from those estimates.
The following is a summary of significant accounting policies consistently followed by the Master Portfolio in the preparation of its financial statements.
Security Valuation
All equity securities are valued at the close of business of the New York Stock Exchange (NYSE). Equity securities are valued at the last quoted sales price on the principal exchange or market on which they trade, except for securities traded on the NASDAQ Stock Market, which are valued at the NASDAQ official close price. Unlisted securities or listed securities for which there were no sales during the day are valued at the mean of the latest quoted bid and asked prices on such exchanges or markets.
Foreign securities are valued based on quotations from the principal market in which such securities are normally traded. If any foreign share prices are not readily available as a result of limited share activity the securities are valued at the mean of the latest quoted bid and asked prices on such exchanges or markets. Foreign currency exchange rates are generally determined at 4:00 p.m. Eastern (U.S.) time. However, many securities markets and exchanges outside the U.S. close prior to the close of the NYSE; therefore, the closing prices for securities in such markets or on such exchanges may not fully reflect events that occur after such close but before the close of the NYSE. In those situations, foreign securities will be fair valued pursuant to the policy adopted by the Board of Trustees (the Board), including utilizing a third party pricing service to determine these fair values. The third party pricing service takes into account multiple factors, including, but not limited to, movements in the U.S. securities markets, certain depositary receipts, futures contracts and foreign exchange rates that have occurred subsequent to the close of the foreign exchange, to determine a good faith estimate that reasonably reflects the current market conditions as of the close of the NYSE. The fair value of a security is likely to be different from the quoted or published price, if available.
Investments in other open-end investment companies, including money market funds, are valued at net asset value.
Short-term securities purchased within 60 days to maturity are valued at amortized cost, which approximates market value. The value of short-term securities originally purchased with maturities greater than 60 days is determined based on an amortized value to par upon reaching 60 days to maturity. Short-term securities maturing in more than 60 days from the valuation date are valued at the market price or approximate market value based on current interest rates.
Investments for which market quotations are not readily available, or that have quotations which management believes are not reliable, are valued at fair value as determined in good faith under consistently applied procedures established by and under the general supervision of the Board. If a security or class of securities (such as foreign securities) is valued at fair value, such value is likely to be different from the last quoted market price for the security. The determination of fair value often requires significant judgment. To determine fair
37
Columbia International Value Master Portfolio, February 29, 2012
value, management may use assumptions including but not limited to future cash flows and estimated risk premiums. Multiple inputs from various sources may be used to determine value.
Foreign Currency Transactions and Translation
The values of all assets and liabilities denominated in foreign currencies are translated into U.S. dollars at that day's exchange rates. Net realized and unrealized gains (losses) on foreign currency transactions and translations include gains (losses) arising from the fluctuation in exchange rates between trade and settlement dates on securities transactions, gains (losses) arising from the disposition of foreign currency and currency gains (losses) between the accrual and payment dates on dividends, interest income and foreign withholding taxes.
For financial statement purposes, the Master Portfolio does not distinguish that portion of gains (losses) on investments which is due to changes in foreign exchange rates from that which is due to changes in market prices of the investments. Such fluctuations are included with the net realized and unrealized gains (losses) on investments in the Statement of Operations.
Repurchase Agreements
The Master Portfolio may engage in repurchase agreement transactions with institutions that management has determined are creditworthy. The Master Portfolio, through the custodian, receives delivery of the underlying securities collateralizing a repurchase agreement. Management is responsible for determining that the collateral is at least equal, at all times, to the value of the repurchase obligation including interest. A repurchase agreement transaction involves certain risks in the event of default or insolvency of the counterparty. These risks include possible delays in or restrictions on a Master Portfolio's ability to dispose of the underlying securities and a possible decline in the value of the underlying securities during the period while the Master Portfolio seeks to assert its rights.
Security Transactions
Security transactions are accounted for on the trade date. Cost is determined and gains (losses) are based upon the specific identification method for both financial statement and federal income tax purposes.
Income Recognition
Corporate actions and dividend income are recorded net of any non-reclaimable tax withholdings, on the ex-dividend date or upon receipt of ex-dividend notification in the case of certain foreign securities.
Interest income is recorded on the accrual basis.
Awards from class action litigation are recorded as a reduction of cost if the Master Portfolio still owns the applicable securities on the payment date. If the Master Portfolio no longer owns the applicable securities, the proceeds are recorded as realized gains.
Federal Income Tax Status
The Master Portfolio is treated as a partnership for federal income tax purposes and therefore is not subject to federal income tax. Each investor in the Master Portfolio will be subject to taxation on its allocated share of the Master Portfolio's ordinary income and capital gains.
The Master Portfolio's assets, income and distributions will be managed in such a way that the Feeder Fund will be able to continue to qualify as a registered investment company by investing its assets through its Master Portfolio.
Foreign Taxes
The Master Portfolio may be subject to foreign taxes on income, gains on investments or currency repatriation, a portion of which may be recoverable. The Master Portfolio will accrue such taxes and recoveries, as applicable, based upon its current interpretation of tax rules and regulations that exist in the markets in which it invests.
Realized gains in certain countries may be subject to foreign taxes at the Master Portfolio level, based on statutory rates. The Master Portfolio accrues for such foreign taxes on net realized and unrealized gains at the appropriate rate for each jurisdiction, as applicable.
Guarantees and Indemnifications
Under the Master Trust's organizational documents and, in some cases, by contract, its officers and trustees are indemnified against certain liabilities arising out of the performance of their duties to the Master Trust or its Master Portfolio. In addition, certain of the Master Portfolio's contracts with its service providers contain general indemnification clauses. The Master Portfolio's maximum exposure under these arrangements is unknown since the amount of any future claims that may be made against the Master Portfolio cannot be determined, and the Master Portfolio has no historical basis for predicting the likelihood of any such claims.
38
Columbia International Value Master Portfolio, February 29, 2012
Recent Accounting Pronouncement
Fair Value Measurements and Disclosures
In May 2011, the Financial Accounting and Standards Board (FASB) issued ASU No. 2011-04 modifying Topic 820, Fair Value Measurements and Disclosures. At the same time, the International Accounting Standards Board (IASB) issued International Financial Reporting Standard 13, Fair Value Measurement. The objective of the FASB and IASB is convergence of their guidance on fair value measurements and disclosures.
Specifically, ASU No. 2011-04 requires reporting entities to disclose i) the amounts of any transfers between Level 1 and Level 2, and the reasons for the transfers, ii) for Level 3 fair value measurements, a) quantitative information about significant unobservable inputs used, b) a description of the valuation processes used by the reporting entity and c) a narrative description of the sensitivity of the fair value measurement to changes in unobservable inputs if a change in those inputs might result in a significantly higher or lower fair value measurement. The effective date of ASU No. 2011-04 is for interim and annual periods beginning after December 15, 2011. At this time, management is evaluating the implications of this guidance and the impact it will have on the financial statement amounts and footnote disclosures, if any.
Note 3. Fees and Compensation Paid to Affiliates
Investment Management Fees
Under an Investment Management Services Agreement, Columbia Management Investment Advisers, LLC (the Investment Manager), a wholly-owned subsidiary of Ameriprise Financial, Inc. (Ameriprise Financial), determines which securities will be purchased, held or sold. The management fee is an annual fee that is equal to a percentage of the Master Portfolio's average daily net assets that declines from 0.85% to 0.66% as the Master Portfolio's net assets increase. The effective management fee rate for the year ended February 29, 2012 was 0.80% of the Master Portfolio's average daily net assets.
Subadvisory Agreement
The Investment Manager has entered into a Subadvisory Agreement with Brandes Investment Partners, L.P. (Brandes), the subadviser of the Master Portfolio. The Investment Manager compensates Brandes to manage the investments of the Master Portfolio's assets.
Administration Fees
Under an Administrative Services Agreement, the Investment Manager serves as the Master Portfolio Administrator. The Master Portfolio pays the Master Portfolio Administrator an annual fee for administration and accounting services equal to 0.05% of the Master Portfolio's average daily net assets, less the fees that were payable by the Master Portfolio as described under the Pricing and Bookkeeping Fees note below.
Pricing and Bookkeeping Fees
Prior to August 8, 2011, the Master Portfolio had entered into a Financial Reporting Services Agreement (the Financial Reporting Services Agreement) with State Street Bank and Trust Company (State Street) and the Investment Manager pursuant to which State Street provided financial reporting services to the Master Portfolio. The Master Portfolio also entered into an Accounting Services Agreement (collectively with the Financial Reporting Services Agreement, the State Street Agreements) with State Street and the Investment Manager pursuant to which State Street provided accounting services to the Master Portfolio. Under the State Street Agreements, the Master Portfolio paid State Street an annual fee of $38,000 paid monthly plus an additional monthly fee based on an annualized percentage rate of average daily net assets of the Master Portfolio for the month. The aggregate fee did not exceed $140,000 per year (exclusive of out-of-pocket expenses and charges). The Master Portfolio also reimbursed State Street for certain out-of-pocket expenses and charges. Effective August 8, 2011, these services are provided under the Administrative Services Agreement discussed above.
Compensation of Board Members
Board members are compensated for their services to the Master Portfolio as disclosed in the Statement of Operations. Under a Deferred Compensation Plan (the Plan), the Board members who are not "interested persons" of the Master Portfolio, as defined under the 1940 Act, may elect to defer payment of up to 100% of their compensation. Deferred amounts are treated as though equivalent dollar amounts had been invested in shares of certain funds managed by the Investment Manager. The Master Portfolio's liability for these amounts is adjusted for market value changes and remains in the Master Portfolio until distributed in accordance with the Plan.
39
Columbia International Value Master Portfolio, February 29, 2012
Compensation of Chief Compliance Officer
The Board has appointed a Chief Compliance Officer to the Master Portfolio in accordance with federal securities regulations. The Master Portfolio does not bear any of the expenses associated with the Chief Compliance Officer.
Other Fees
Effective June 1, 2011, other expenses are for, among other things, certain expenses of the Master Portfolio or the Board, including: Master Portfolio boardroom and office expense, employee compensation, employee health and retirement benefits, and certain other expenses. Payment of these Master Portfolio and Board expenses is facilitated by a company providing limited administrative services to the Master Portfolio and the Board. For the period June 1, 2011 through February 29, 2012, other expenses paid to this company were $1,899.
Expenses Waived/Reimbursed by the Investment Manager and its Affiliates
The Investment Manager and certain of its affilates have voluntarily agreed to waive fees and/or reimburse certain expenses (excluding certain fees and expenses, such as brokerage commissions, interest, taxes and extraordinary expenses, but including custodian charges relating to overdrafts, if any) so that the Master Portfolio's ordinary net operating expenses, after giving effect to fees waived/expenses reimbursed and any balance credits and/or overdraft charges from the Master Portfolio's custodian, do not exceed the annual rate of 0.90% of the Master Portfolio's average daily net assets. This arrangement may be modified or terminated by the Investment Manager at any time.
Note 4. Federal Tax Information
At February 29, 2012, the cost of investments for federal income tax purposes was $1,648,707,921 and the aggregate gross unrealized appreciation and depreciation based on that cost was:
| Unrealized appreciation | | $ | 112,817,440 | | |
| Unrealized depreciation | | $ | (339,778,321 | ) | |
| Net unrealized depreciation | | $ | (226,960,881 | ) | |
Management of the Master Portfolio has concluded that there are no significant uncertain tax positions that would require recognition in the financial statements. However, management's conclusion may be subject to review and adjustment at a later date based on factors including, but not limited to, new tax laws, regulations, and administrative interpretations (including relevant court decisions). Generally, the Master Portfolio's federal tax returns for the prior three fiscal years remain subject to examination by the Internal Revenue Service.
Note 5. Portfolio Information
The cost of purchases and proceeds from sales of securities, excluding short-term obligations, aggregated to $229,905,363 and $713,617,654, respectively, for the year ended February 29, 2012.
Note 6. Lending of Portfolio Securities
Effective August 8, 2011, the Master Portfolio has entered into a Master Securities Lending Agreement (the Agreement) with JPMorgan Chase Bank, N.A. (JPMorgan). The Agreement, which replaces the previous security lending arrangement with State Street, authorizes JPMorgan as lending agent to lend securities to authorized borrowers in order to generate additional income on behalf of the Master Portfolio. Pursuant to the Agreement, the securities loaned are secured by cash or U.S. government securities equal to at least 100% of the market value of the loaned securities. Any additional collateral required to maintain those levels due to market fluctuations of the loaned securities is requested to be delivered the following business day. Cash collateral received is invested by the lending agent on behalf of the Master Portfolio into authorized investments pursuant to the Agreement. The investments made with the cash collateral are listed in the Portfolio of Investments. The values of such investments and any uninvested cash collateral are disclosed in the Statement of Assets and Liabilities along with the related obligation to return the collateral upon the return of the securities loaned. At February 29, 2012, securities valued at $128,222,861 were on loan, secured by cash collateral of $135,181,153 (which does not reflect calls for collateral made to borrowers by JPMorgan at period end) that is partially or fully invested in short-term securities or other cash equivalents.
Risks of delay in recovery of securities or even loss of rights in the securities may occur should the borrower of the securities fail financially. Risks may also arise to the extent that the value of the securities loaned increases above the value of the collateral received. JPMorgan will indemnify the Master Portfolio from losses resulting from a borrower's failure to return a loaned security when due. Such indemnification does not extend to losses associated with declines in the value of cash collateral investments. The Investment Manager is not responsible for any losses incurred by the Master Portfolio in connection with the securities lending program. Loans are subject to
40
Columbia International Value Master Portfolio, February 29, 2012
termination by the Master Portfolio or the borrower at any time, and are, therefore, not considered to be illiquid investments.
Pursuant to the Agreement, the Master Portfolio receives income for lending its securities either in the form of fees or by earning interest on invested cash collateral, net of negotiated rebates paid to borrowers and fees paid to the lending agent for services provided and any other securities lending expenses. Net income earned from securities lending for the year ended February 29, 2012 is disclosed in the Statement of Operations. The Master Portfolio continues to earn and accrue interest and dividends on the securities loaned.
Prior to August 8, 2011, the Master Portfolio participated in a securities lending arrangement with State Street. Each security on loan was collateralized in an amount at least equal to the market value of the securities loaned plus accrued income from the investment of collateral. The income generated by the investment of the collateral, net of any fees remitted to State Street as the lending agent and borrower rebates, was paid to the Master Portfolio.
Note 7. Custody Credits
Prior to August 8, 2011, the Master Portfolio had an agreement with its custodian bank under which custody fees may have been reduced by balance credits. These credits are recorded as part of expense reductions on the Statement of Operations. The Master Portfolio could have invested a portion of the assets utilized in connection with the expense offset arrangement in an income-producing asset if they had not entered into such an agreement. Subsequent to this date, the Master Portfolio may invest its daily balance in an affiliated money market fund as detailed below. For the period March 1, 2011 through August 7, 2011, there were no custody credits.
Note 8. Affiliated Money Market Fund
Effective August 8, 2011, the Master Portfolio may invest its daily cash balances in Columbia Short-Term Cash Fund, an affiliated money market fund established for the exclusive use by the Master Portfolio and other affiliated funds. The income earned by the Master Portfolio from such investments is included as "Dividends from affiliates" in the Statement of Operations. As an investing fund, the Master Portfolio indirectly bears its proportionate share of the expenses of Columbia Short-Term Cash Fund.
Note 9. Line of Credit
The Master Portfolio has entered into a revolving credit facility with a syndicate of banks led by JPMorgan Chase Bank, N.A. (the Administrative Agent), whereby the Master Portfolio may borrow for the temporary funding of shareholder redemptions or for other temporary or emergency purposes. The credit facility became effective on August 8, 2011, replacing a prior credit facility. The credit facility agreement, as amended, which is a collective agreement between the Master Portfolio and certain other funds managed by the Investment Manager, severally and not jointly, permits collective borrowings up to $500 million. Pursuant to a December 13, 2011 amendment to the credit facility agreement, interest is charged to each participating fund based on its borrowings at a rate equal to the higher of (i) the overnight federal funds rate plus 1.00% or (i) the one-month LIBOR rate plus 1.00%. Each borrowing under the credit facility matures no later than 60 days after the date of borrowing. The Master Portfolio also pays a commitment fee equal to its pro rata share of the amount of the credit facility at a rate of 0.08% per annum.
For the period August 8, 2011 through December 12, 2011, interest was charged to each participating fund based on its borrowings at a rate equal to the sum of the federal funds rate plus (i) 1.25% per annum plus (ii) if one-month LIBOR exceeds the federal funds rate, the amount of such excess. The Master Portfolio also paid a commitment fee equal to its pro rata share of the amount of the credit facility at a rate of 0.10% per annum.
For the period June 27, 2011 through August 7, 2011, the Master Portfolio and certain other funds managed by the Investment Manager participated in a $100 million committed, unsecured revolving credit facility provided by State Street. For the period May 16, 2011 through June 26, 2011, the collective borrowing amount of the credit facility was $150 million committed, unsecured revolving credit facility provided by State Street. For the period March 28, 2011 through May 15, 2011, the collective borrowing amount of the credit facility was $225 million. Prior to March 28, 2011, the collective borrowing amount of the credit facility was $280 million. Iinterest was charged to each fund based on its borrowings at a rate equal to the greater of the (i) federal funds rate plus 1.25% per annum or (ii) the overnight LIBOR rate plus 1.25% per annum. The Master Portfolio also paid a commitment fee equal to its pro rata share of the amount of the credit facility at a rate of 0.125% per annum.
For the year ended February 29, 2012, the average daily loan balance outstanding on days when borrowing existed was $12,502,817 at a weighted average interest rate of 1.41%.
41
Columbia International Value Master Portfolio, February 29, 2012
Note 10. Significant Risks
Foreign Securities Risk
Investing in foreign securities may include certain risks and considerations not typically associated with investing in U.S. securities, such as fluctuating currency values and changing local and regional economic, political and social conditions, which may result in greater market volatility. In addition, certain foreign securities may not be as liquid as U.S. securities. Investing in emerging markets may accentuate these risks.
Investments in emerging market countries are subject to additional risk. The risk of foreign investments is typically increased in less developed countries. These countries are also more likely to experience high levels of inflation, deflation or currency devaluation which could hurt their economies and securities markets.
Note 11. Subsequent Events
Management has evaluated the events and transactions that have occurred through the date the financial statements were issued and noted no items requiring adjustment of the financial statements or additional disclosure.
Note 12. Information Regarding Pending and Settled Legal Proceedings
In June 2004, an action captioned John E. Gallus et al. v. American Express Financial Corp. and American Express Financial Advisors Inc. was filed in the United States District Court for the District of Arizona. The plaintiffs allege that they are investors in several American Express Company mutual funds (currently branded as Columbia) and they purport to bring the action derivatively on behalf of those funds under the Investment Company Act of 1940. The plaintiffs allege that fees allegedly paid to the defendants by the funds for investment advisory and administrative services are excessive. The plaintiffs seek remedies including restitution and rescission of investment advisory and distribution agreements. The plaintiffs voluntarily agreed to transfer this case to the United States District Court for the District of Minnesota (the District Court). In response to defendants' motion to dismiss the complaint, the District Court dismissed one of plaintiffs' four claims and granted plaintiffs limited discovery. Defendants moved for summary judgment in April 2007. Summary judgment was granted in the defendants' favor on July 9, 2007. The plaintiffs filed a notice of appeal with the Eighth Circuit Court of Appeals (the Eighth Circuit) on August 8, 2007. On April 8, 2009, the Eighth Circuit reversed summary judgment and remanded to the District Court for further proceedings. On August 6, 2009, defendants filed a writ of certiorari with the U.S. Supreme Court (the Supreme Court), asking the Supreme Court to stay the District Court proceedings while the Supreme Court considered and ruled in a case captioned Jones v. Harris Associates, which involved issues of law similar to those presented in the Gallus case. On March 30, 2010, the Supreme Court issued its ruling in Jones v. Harris Associates, and on April 5, 2010, the Supreme Court vacated the Eighth Circuit's decision in the Gallus case and remanded the case to the Eighth Circuit for further consideration in light of the Supreme Court's decision in Jones v. Harris Associates. On June 4, 2010, the Eighth Circuit remanded the Gallus case to the District Court for further consideration in light of the Supreme Court's decision in Jones v. Harris Associates. On December 9, 2010, the District Court reinstated its July 9, 2007 summary judgment order in favor of the defendants. On January 10, 2011, plaintiffs filed a notice of appeal with the Eighth Circuit. In response to the plaintiffs' opening appellate brief filed on March 18, 2011, the defendants filed a response brief on May 4, 2011 with the Eighth Circuit. The plaintiffs filed a reply brief on May 26, 2011 and oral arguments took place on November 17, 2011. On March 30, 2012, the Eighth Circuit upheld the grant of summary judgment by the District Court in favor of the defendants.
In December 2005, without admitting or denying the allegations, American Express Financial Corporation (AEFC, which is now known as Ameriprise Financial, Inc. (Ameriprise Financial)) entered into settlement agreements with the Securities and Exchange Commission (SEC) and Minnesota Department of Commerce (MDOC) related to market timing activities. As a result, AEFC was censured and ordered to cease and desist from committing or causing any violations of certain provisions of the Investment Advisers Act of 1940, the Investment Company Act of 1940, and various Minnesota laws. AEFC agreed to pay disgorgement of $10 million and civil money penalties of $7 million. AEFC also agreed to retain an independent distribution consultant to assist in developing a plan for distribution of all disgorgement and civil penalties ordered by the SEC in accordance with various undertakings detailed at www.sec.gov/litigation/admin/ia-2451.pdf. Ameriprise Financial and its affiliates have cooperated with the SEC and the MDOC in these legal proceedings, and have made regular reports to the funds' Boards of Trustees.
Ameriprise Financial and certain of its affiliates have historically been involved in a number of legal, arbitration and regulatory proceedings, including routine litigation, class actions, and
42
Columbia International Value Master Portfolio, February 29, 2012
governmental actions, concerning matters arising in connection with the conduct of their business activities. Ameriprise Financial believes that the Funds are not currently the subject of, and that neither Ameriprise Financial nor any of its affiliates are the subject of, any pending legal, arbitration or regulatory proceedings that are likely to have a material adverse effect on the Funds or the ability of Ameriprise Financial or its affiliates to perform under their contracts with the Funds. Ameriprise Financial is required to make 10-Q, 10-K and, as necessary, 8-K filings with the Securities and Exchange Commission on legal and regulatory matters that relate to Ameriprise Financial and its affiliates. Copies of these filings may be obtained by accessing the SEC website at www.sec.gov.
There can be no assurance that these matters, or the adverse publicity associated with them, will not result in increased fund redemptions, reduced sale of fund shares or other adverse consequences to the Funds. Further, although we believe proceedings are not likely to have a material adverse effect on the Funds or the ability of Ameriprise Financial or its affiliates to perform under their contracts with the Funds, these proceedings are subject to uncertainties and, as such, we are unable to estimate the possible loss or range of loss that may result. An adverse outcome in one or more of these proceedings could result in adverse judgments, settlements, fines, penalties or other relief that could have a material adverse effect on the consolidated financial condition or results of operations of Ameriprise Financial.
43
Report of Independent Registered Public Accounting Firm
To the Holders and Trustees of Columbia Funds Master Investment Trust, LLC
In our opinion, the accompanying statement of assets and liabilities, including the investment portfolio, and the related statements of operations and of changes in net assets and the financial highlights present fairly, in all material respects, the financial position of Columbia International Value Master Portfolio (constituting a series of Columbia Funds Master Investment Trust, LLC, hereafter referred to as the "Master Portfolio") at February 29, 2012, and the results of its operations for the year then ended, the changes in its net assets for each of the two years in the period then ended and the financial highlights for each of the periods indicated, in conformity with accounting principles generally accepted in the United States of America. These financial statements and financial highlights (hereafter referred to as "financial statements") are the responsibility of the Master Portfolio's management. Our responsibility is to express an opinion on these financial statements based on our audits. We conducted our audits of these financial statements in accordance with the standards of the Public Company Accounting Oversight Board (United States). Those standards require that we plan and perform the audit to obtain reasonable assurance about whether the financial statements are free of material misstatement. An audit includes examining, on a test basis, evidence supporting the amounts and disclosures in the financial statements, assessing the accounting principles used and significant estimates made by management, and evaluating the overall financial statement presentation. We believe that our audits, which included confirmation of securities at February 29, 2012 by correspondence with the custodian, transfer agent and brokers, provide a reasonable basis for our opinion.
PricewaterhouseCoopers LLP
Minneapolis, Minnesota
April 20, 2012
44
Fund Governance
Shareholders elect the Board that oversees the funds' operations. The Board appoints officers who are responsible for day-to-day business decisions based on policies set by the Board. The following table provides basic biographical information about the funds' Board members, including their principal occupations during the past five years, although specific titles for individuals may have varied over the period. Under current Board policy, members may serve until the next Board meeting after he or she reaches the mandatory retirement age established by the Board, or the fifteenth anniversary of the first Board meeting they attended as a member of the Board.
On September 29, 2009, Ameriprise Financial, the parent company of Columbia Management, entered into an agreement with Bank of America, N.A. ("Bank of America") to acquire a portion of the asset management business of Columbia Management Group, LLC and certain of its affiliated companies (the "Transaction"). Following the Transaction, which became effective on May 1, 2010, various alignment activities have occurred with respect to the Fund Family. In connection with the Transaction, Mr. Edward J. Boudreau, Jr., Mr. William P. Carmichael, Mr. William A. Hawkins, Mr. R. Glenn Hilliard, Mr. John J. Nagorniak, Ms. Minor M. Shaw and Dr. Anthony M. Santomero, who were members prior to the Transaction of the Legacy Columbia Nations funds' Board ("Nations Funds"), which includes Columbia Funds Series Trust, Columbia Funds Variable Insurance Trust I and Columbia Funds Master Investment Trust, LLC., began service on the Board for the Legacy RiverSource funds ("RiverSource Funds") effective June 1, 2011, which resulted in an overall increase from twelve Trustees to sixteen for all mutual funds overseen by the Board.
Independent Board Members
| Name, Address, Age | | Position Held
with Funds
and Length
of Service | | Principal Occupation During Past Five Years | | Number of
Funds in the
Fund Family
Overseen by
Board Member | | Other Present or
Past Directorships/
Trusteeships
(Within Past 5 Years) | |
| Kathleen Blatz | | | | | | | | | |
|
901 S. Marquette Ave.
Minneapolis, MN 55402
Age 57 | | Board member since 1/06 for RiverSource Funds and since 6/11 for Nations Funds | | Attorney; Chief Justice, Minnesota Supreme Court, 1998-2006 | | | 153 | | | None | |
|
| Edward J. Boudreau, Jr. | | | | | | | | | |
|
225 Franklin Street
Mail Drop
BX32 05228
Boston, MA 02110
Age 67 | | Board member since 6/11 for RiverSource Funds and since 1/05 for Nations Funds | | Managing Director, E.J. Boudreau & Associates (consulting) since 2000 | | | 146 | | | Former Trustee, BofA Funds Series Trust (11 funds) | |
|
| Pamela G. Carlton | | | | | | | | | |
|
901 S. Marquette Ave.
Minneapolis, MN 55402
Age 57 | | Board member since 7/07 for RiverSource Funds and since 6/11 for Nations Funds | | President, Springboard-Partners in Cross Cultural Leadership (consulting company) | | | 153 | | | None | |
|
45
Fund Governance (continued)
Independent Board Members (continued)
| Name, Address, Age | | Position Held
with Funds
and Length
of Service | | Principal Occupation During Past Five Years | | Number of
Funds in the
Fund Family
Overseen by
Board Member | | Other Present or
Past Directorships/
Trusteeships
(Within Past 5 Years) | |
| William P. Carmichael | | | | | | | | | |
|
225 Franklin Street
Mail Drop
BX32 05228
Boston, MA 02110
Age 68 | | Board member since 6/11 for RiverSource Funds and since 1999 for Nations Funds | | Retired | | | 146 | | | Director, Cobra Electronics Corporation (electronic equipment manufacturer); The Finish Line (athletic shoes and apparel); McMoRan Exploration Company (oil and gas exploration and development); former Trustee, BofA Funds Series Trust (11 funds); former Director, Spectrum Brands, Inc. (consumer products); former Director, Simmons Company (bedding) | |
|
| Patricia M. Flynn | | | | | | | | | |
|
901 S. Marquette Ave.
Minneapolis, MN 55402
Age 61 | | Board member since 11/04 for RiverSource Funds and since 6/11 for Nations Funds | | Trustee Professor of Economics and Management, Bentley University; former Dean, McCallum Graduate School of Business, Bentley University | | | 153 | | | None | |
|
| William A. Hawkins | | | | | | | | | |
|
225 Franklin Street
Mail Drop
BX32 05228
Boston, MA 02110
Age 69 | | Board member since 6/11 for RiverSource Funds and since 1/05 for Nations Funds | | Managing Director, Overton Partners (financial consulting), since August 2010; President and Chief Executive Officer, California General Bank, N.A., January 2008-August 2010 | | | 146 | | | Trustee, BofA Funds Series Trust (11 funds) | |
|
| R. Glenn Hilliard | | | | | | | | | |
|
225 Franklin Street
Mail Drop
BX32 05228
Boston, MA 02110
Age 69 | | Board member since 6/11 for RiverSource Funds and since 1/05 for Nations Funds | | Chairman and Chief Executive Officer, Hilliard Group LLC (investing and consulting), since April 2003; Non-Executive Director & Chairman, CNO Financial Group, Inc. (formerly Conseco, Inc.) (insurance), September 2003-May 2011 | | | 146 | | | Chairman, BofA Fund Series Trust (11 funds); former Director, CNO Financial Group, Inc. (insurance) | |
|
46
Fund Governance (continued)
Independent Board Members (continued)
| Name, Address, Age | | Position Held
with Funds
and Length
of Service | | Principal Occupation During Past Five Years | | Number of
Funds in the
Fund Family
Overseen by
Board Member | | Other Present or
Past Directorships/
Trusteeships
(Within Past 5 Years) | |
| Stephen R. Lewis, Jr. | | | | | | | | | |
|
901 S. Marquette Ave.
Minneapolis, MN 55402
Age 73 | | Chair of the Board for RiverSource Funds since 1/07, Board member for RiverSource Funds since 1/02 and since 6/11 for Nations Funds | | President Emeritus and Professor of Economics Emeritus, Carleton College | | | 153 | | | Director, Valmont Industries, Inc. (manufactures irrigation systems) | |
|
| John F. Maher | | | | | | | | | |
|
901 S. Marquette Ave.
Minneapolis, MN 55402
Age 68 | | Board member since 12/06 for Legacy Seligman funds, since 12/08 for RiverSource Funds and since 6/11 for Nations Funds | | Retired President and Chief Executive Officer and former Director, Great Western Financial Corporation (financial services), 1986-1997 | | | 153 | | | None | |
|
| John J. Nagorniak | | | | | | | | | |
|
225 Franklin Street
Mail Drop
BX32 05228
Boston, MA 02110
Age 67 | | Board member since 6/11 for RiverSource Funds and since 1/08 for Nations Funds | | Retired; President and Director, Foxstone Financial, Inc. (consulting), 2000-2007; Director, Mellon Financial Corporation affiliates (investing), 2000-2007; Chairman, Franklin Portfolio Associates (investing—Mellon affiliate), 1982-2007 | | | 146 | | | Trustee, Research Foundation of CFA Institute; Director, MIT Investment Company; Trustee, MIT 401k Plan; former Trustee, BofA Funds Series Trust (11 funds) | |
|
| Catherine James Paglia | | | | | | | | | |
|
901 S. Marquette Ave.
Minneapolis, MN 55402
Age 59 | | Board member since 11/04 for RiverSource Funds and since 6/11 for Nations Funds | | Director, Enterprise Asset Management, Inc. (private real estate and asset management company) | | | 153 | | | None | |
|
47
Fund Governance (continued)
Independent Board Members (continued)
| Name, Address, Age | | Position Held
with Funds
and Length
of Service | | Principal Occupation During Past Five Years | | Number of
Funds in the
Fund Family
Overseen by
Board Member | | Other Present or
Past Directorships/
Trusteeships
(Within Past 5 Years) | |
| Leroy C. Richie | | | | | | | | | |
|
901 S. Marquette Ave.
Minneapolis, MN 55402
Age 70 | | Board member since 2000 for Legacy Seligman funds, since 11/08 for RiverSource Funds and since 6/11 for Nations Funds | | Counsel, Lewis & Munday, P.C. since 2004; former Vice President and General Counsel, Automotive Legal Affairs, Chrysler Corporation | | | 153 | | | Director, Digital Ally, Inc. (digital imaging); Director, Infinity, Inc. (oil and gas exploration and production); Director, OGE Energy Corp. (energy and energy services) | |
|
| Minor M. Shaw | | | | | | | | | |
|
225 Franklin Street
Mail Drop
BX32 05228
Boston, MA 02110
Age 64 | | Board member since 6/11 for RiverSource Funds and since 2003 for Nations Funds | | President—Micco LLC (private investments) | | | 146 | | | Former Trustee, BofA Funds Series Trust (11 funds); Board Member, Piedmont Natural Gas; Director, Blue Cross Blue Shield of South Carolina | |
|
| Alison Taunton-Rigby | | | | | | | | | |
|
901 S. Marquette Ave.
Minneapolis, MN 55402
Age 67 | | Board member since 11/02 for RiverSource Funds and since 6/11 for Nations Funds | | Chief Executive Officer and Director, RiboNovix, Inc. 2003-2010 (biotechnology); former President, Aquila Biopharmaceuticals | | | 153 | | | Director, Healthways, Inc. (health management programs); Director, ICI Mutual Insurance Company, RRG; Director, Abt Associates (government contractor) | |
|
48
Fund Governance (continued)
Interested Board Member Not Affiliated with Investment Manager*
| Name, Address, Age | | Position Held
with Funds
and Length
of Service | | Principal Occupation During Past Five Years | | Number of
Funds in the
Fund Family
Overseen by
Board Member | | Other Present or
Past Directorships/
Trusteeships
(Within Past 5 Years) | |
| Anthony M. Santomero* | | | | | | | | | |
|
225 Franklin Street
Mail Drop
BX32 05228
Boston, MA 02110
Age 65 | | Board member since 6/11 for RiverSource Funds and since 1/08 for Nations Funds | | Richard K. Mellon Professor Emeritus of Finance, The Wharton School, University of Pennsylvania, since 2002; Senior Advisor, McKinsey & Company (consulting), 2006-2008; President and Chief Executive Officer, Federal Reserve Bank of Philadelphia, 2000-2006 | | | 146 | | | Director, Renaissance Reinsurance Ltd.; Trustee, Penn Mutual Life Insurance Company; Director, Citigroup; Director, Citibank, N.A.; former Trustee, BofA Funds Series Trust (11 funds) | |
|
* Dr. Santomero is not an affiliated person of the Investment Manager or Ameriprise Financial. However, he is currently deemed by the funds to be an "interested person" (as defined in the 1940 Act) of the Funds because he serves as a Director of Citigroup, Inc. and Citibank N.A., companies that may directly or through subsidiaries and affiliates engage from time-to-time in brokerage execution, principal transactions and lending relationships with the funds or accounts advised/managed by the Investment Manager.
Interested Board Member Affiliated with Investment Manager*
| William F. Truscott | | | | | | | | | |
|
53600 Ameriprise Financial Center
Minneapolis, MN 55474
Age 51 | | Board member since 11/01 for RiverSource Funds and since 6/11 for Nations Funds; Senior Vice President since 2002 for RiverSource Funds and 5/10 for Nations Funds | | Chairman of the Board and President, Columbia Management Investment Advisers, LLC since May 2010 and February 2012, respectively (previously President, Chairman of the Board and Chief Investment Officer, 2001-April 2010); Chief Executive Officer, U.S. Asset Management & President, Annuities, Ameriprise Financial, Inc. since May 2010 (previously President—U.S. Asset Management and Chief Investment Officer, 2005-April 2010); Director, President and Chief Executive Officer, Ameriprise Certificate Company since 2006; Director and Chief Executive Officer, Columbia Management Investment Distributors, Inc. since May 2010 and February 2012, respectively (previously Chairman of the Board and Chief Executive Officer, 2006-April 2010); Chairman of the Board and Chief Executive Officer, RiverSource Distributors, Inc. since 2006. | | | 153 | | | None | |
|
* Interested person (as defined under the 1940 Act) by reason of being an officer, director, security holder and/or employee of the Investment Manager or Ameriprise Financial.
The SAI has additional information about the Fund's Board members and is available, without charge, upon request by calling 800.345.6611; contacting your financial intermediary; or visiting columbiamanagement.com.
49
Fund Governance (continued)
Officers
| Name, Year of Birth and Address | | Principal Occupation(s) During the Past Five Years | |
| J. Kevin Connaughton (Born 1964) | |
|
225 Franklin Street
Boston, MA 02110
President (since 2009) | | Senior Vice President and General Manager—Mutual Fund Products, Columbia Management Investment Advisers, LLC since May 2010; President, Columbia Funds, since 2009, and RiverSource Funds, since May 2010 (previously Senior Vice President and Chief Financial Officer, Columbia Funds, from June 2008 to January 2009, Treasurer, Columbia Funds, from October 2003 to May 2008, and senior officer of various other affiliated funds since 2000); Managing Director, Columbia Management Advisors, LLC from December 2004 to April 2010. | |
|
| Michael G. Clarke (Born 1969) | |
|
225 Franklin Street
Boston, MA 02110
Treasurer (since 2011) and Chief Financial Officer (since 2009) | | Vice President, Columbia Management Investment Advisers, LLC since May 2010; Managing Director of Fund Administration, Columbia Management Advisors, LLC, from September 2004 to April 2010; senior officer of Columbia Funds and affiliated funds since 2002. | |
|
| Scott R. Plummer (Born 1959) | |
|
5228 Ameriprise Financial Center
Minneapolis, MN 55474
Senior Vice President and Chief Legal Officer (since 2010) | | Chief Legal Officer and Assistant Secretary, Columbia Management Investment Advisers, LLC since June 2005; Vice President and Lead Chief Counsel—Asset Management, Ameriprise Financial, Inc. since May 2010 (previously Vice President and Chief Counsel—Asset Management, from 2005 to April 2010, Vice President, Chief Counsel and Assistant Secretary, Columbia Management Investment Distributors, Inc. since 2008; Vice President, General Counsel and Secretary, Ameriprise Certificate Company since 2005; Chief Counsel, RiverSource Distributors, Inc. since 2006; Senior officer of Columbia Funds and affiliated funds, since 2006. | |
|
| Thomas P. McGuire (Born 1972) | |
|
225 Franklin Street
Boston, MA 02110
Chief Compliance Officer (since 2012) | | Vice President—Asset Management Compliance, Columbia Management Investment Advisers, LLC since March 2010; Chief Compliance Officer, Ameriprise Certificate Company, since September 2010; Compliance Executive, Bank of America, from June 2005 to April 2010. | |
|
| William F. Truscott (Born 1960) | |
|
53600 Ameriprise Financial Center
Minneapolis, MN 55474
Senior Vice President (since 2010) | | Chairman of the Board and President, Columbia Management Investment Advisers, LLC since May 2010 and February 2012, respectively (previously President, Chairman of the Board and Chief Investment Officer, from 2001 to April 2010); Chief Executive Officer, U.S. Asset Management & President, Annuities, Ameriprise Financial, Inc. since May 2010 (previously President—U.S. Asset Management and Chief Investment Officer from 2005 to April 2010; Director, President and Chief Executive Officer, Ameriprise Certificate Company since 2006; Director and Chief Executive Officer, Columbia Management Investment Distributors, Inc. since May 2010 and February 2012, respectively (previously Chairman of the Board and Chief Executive Officer from 2008 to April 2010); Chairman of the Board and Chief Executive Officer, RiverSource Distributors, Inc. since 2006. | |
|
| Paul D. Pearson (Born 1956) | |
|
10468 Ameriprise Financial Center
Minneapolis, MN 55474
Vice President and Assistant Treasurer
(since 2011) | | Vice President—Investment Accounting, Columbia Management Investment Advisers, LLC, since May 2010; Vice President—Managed Assets, Investment Accounting, Ameriprise Financial Corporation, 1998-2010 | |
|
50
Fund Governance (continued)
Officers (continued)
| Name, Year of Birth and Address | | Principal Occupation(s) During the Past Five Years | |
| Colin Moore (Born 1958) | |
|
225 Franklin Street
Boston, MA 02110
Senior Vice President (since 2010) | | Director and Chief Investment Officer, Columbia Management Investment Advisers, LLC since May 2010; Manager, Managing Director and Chief Investment Officer of Columbia Management Advisors, LLC from 2007 to April 2010; Head of Equities, Columbia Management Advisors, LLC from 2002 to 2007. | |
|
| Christopher O. Petersen (Born 1970) | |
|
5228 Ameriprise Financial Center
Minneapolis, MN 55474
Vice President and Secretary (since 2011) | | Vice President and Chief Counsel, Ameriprise Financial since January 2010 (formerly Vice President and Group Counsel or Counsel from April 2004 to January 2010); Senior officer of Columbia Funds and affiliated funds, since 2007. | |
|
| Amy K. Johnson (Born 1965) | |
|
5228 Ameriprise Financial Center
Minneapolis, MN 55474
Vice President (since 2010) | | Senior Vice President and Chief Operating Officer, Columbia Management Investment Advisers, LLC since May 2010 (previously Chief Administrative Officer, from 2009 until April 2010, Vice President—Asset Management and Trust Company Services, from 2006 to 2009, and Vice President—Operations and Compliance from 2004 to 2006). | |
|
| Joseph F. DiMaria (Born 1968) | |
|
225 Franklin Street
Boston, MA 02110
Vice President (since 2011) and Chief Accounting Officer (since 2008) | | Vice President, Mutual Fund Administration, Columbia Management Investment Advisers, LLC, since May 2010; Director of Fund Administration, Columbia Management Advisors, LLC from January 2006 to April 2010. | |
|
| Paul B. Goucher (Born 1968) | |
|
100 Park Avenue
New York, NY 10017
Vice President and Assistant Secretary (since 2010) | | Vice President and Chief Counsel of Ameriprise Financial since January 2010 (formerly Vice President and Group Counsel from November 2008 to January 2010); Director, Managing Director and General Counsel of J. & W. Seligman & Co. Incorporated (Seligman) from July 2008 to November 2008 and Managing Director and Associate General Counsel of Seligman from January 2005 to July 2008. | |
|
| Michael E. DeFao (Born 1968) | |
|
225 Franklin Street
Boston, MA 02110
Vice President and Assistant Treasurer (since 2011) | | Vice President and Chief Counsel, Ameriprise Financial since May 2010; Associate General Counsel, Bank of America from June 2005 to April 2010. | |
|
| Stephen T. Welsh (Born 1957) | |
|
225 Franklin Street
Boston, MA 02110
Vice President (since 2006) | | President and Director, Columbia Management Investment Services Corp. since May 2010; President and Director, Columbia Management Services, Inc. from July 2004 to April 2010; Managing Director, Columbia Management Distributors, Inc. from August 2007 to April 2010. | |
|
51
This page intentionally left blank.
Important Information About This Report
The fund mails one shareholder report to each shareholder address. If you would like more than one report, please call shareholder services at 1-800-345-6611 and additional reports will be sent to you. This report has been prepared for shareholders of Columbia International Value Fund.
A description of the policies and procedures that the fund uses to determine how to vote proxies and a copy of the fund's voting records are available (i) at www.columbiamanagement.com, (ii) on the Securities and Exchange Commission's website at www.sec.gov, and (iii) without charge, upon request, by calling 1-800-368-0346. Information regarding how the fund voted proxies relating to portfolio securities during the 12-month period ended June 30 is available from the SEC's website. Information regarding how the fund voted proxies relating to portfolio securities is also available from the fund's website, www.columbiamanagement.com.
The fund files a complete schedule of portfolio holdings with the SEC for the first and third quarters of each fiscal year on Form N-Q. The fund's Form N-Q is available on the SEC's website at www.sec.gov and may be reviewed and copied at the SEC's Public Reference Room in Washington, D.C. Information on the operation of the Public Reference Room may be obtained by calling 1-800-SEC-0330.
Transfer Agent
Columbia Management Investment
Services Corp.
P.O. Box 8081
Boston, MA 02266-8081
1-800-345-6611
Distributor
Columbia Management Investment
Distributors, Inc.
225 Franklin Street
Boston, MA 02110
Investment Manager
Columbia Management Investment Advisers, LLC
225 Franklin Street
Boston, MA 02110
53

Columbia International Value Fund
P. O. Box 8081
Boston, MA 02266-8081
columbiamanagement.com
This information is for use with concurrent or prior delivery of a fund prospectus. Investors should consider the investment objectives, risks, charges and expenses of a mutual fund carefully before investing. For a free prospectus, which contains this and other important information about the funds, visit columbiamanagement.com. Read the prospectus carefully before investing. The Fund is distributed by Columbia Management Investment Distributors, Inc., member FINRA, and managed by Columbia Management Investment Advisers, LLC.
© 2012 Columbia Management Investment Advisers, LLC. All rights reserved.
C-1681 C (4/12)

Columbia Large Cap Index Fund
Annual Report for the Period Ended February 29, 2012
Table of contents
The views expressed in this report reflect the current views of the respective parties. These views are not guarantees of future performance and involve certain risks, uncertainties and assumptions that are difficult to predict, so actual outcomes and results may differ significantly from the views expressed. These views are subject to change at any time based upon economic, market or other conditions and the respective parties disclaim any responsibility to update such views. These views may not be relied on as investment advice and, because investment decisions for a Columbia Fund are based on numerous factors, may not be relied on as an indication of trading intent on behalf of any particular Columbia Fund. References to specific securities should not be construed as a recommendation or investment advice.
President’s Message

Dear Shareholders,
Americans were dispirited in the fourth quarter of 2011 by Washington’s inability to reach a plan for deficit reduction and Europe’s piecemeal attempt to address its own fiscal issues. Yet, there was sufficient good news to encourage risk taking, buoying both stocks and bonds to solid gains.
U.S. economic data surprised on the upside and fears of recession abated. With the bar of expectations set low, investors responded positively to the announcement that the economy had expanded by 1.8% in the third quarter. Consumer confidence improved, even though consumers remain under pressure with no real increase in disposable income and a continued decline in household net worth. Headline inflation — which tracks a broad range of consumer expenditures, including food and energy — declined. Even manufacturing held its ground.
Against this backdrop, the U.S. equity markets logged solid
returns. The S&P 500 Index gained 11.82%, moving into positive territory for the year with quarterly advances in all ten sectors. Mid- and small-cap stocks did even better. Value outperformed growth across all market capitalizations. Energy stocks led the market, as the price of oil moved above $100 a barrel in December. Industrials and materials stocks rose, buoyed by improving economic data. The U.S. fixed-income markets logged modest but solid returns. High-yield bonds were the best performers as the economy showed signs of improvement. Emerging market bonds were strong performers, as inflation came under control in key regions. Municipal bonds and Treasuries eked out only modest gains, as investors moved away from quality in favor of riskier assets.
While fourth quarter gains were encouraging, challenges still remain. Columbia Management, however, remains strong and steadfast. Columbia Management is the eighth largest manager of long-term mutual fund assets with $326 billion under management as of December 31, 2011. The past year has been one of considerable change for the organization as we worked diligently to align products, services and resources in the integration of Columbia Management with RiverSource Investments. The strong line-up of talent, resources and capabilities that has resulted is highlighted by the success of our products. As of December 31, 2011, Columbia Management offers 52 funds rated either 4 or 5 stars by Morningstar.*
For more information about these and other funds offered by Columbia Management, including detailed, up-to-date fund performance and portfolio information, please visit us online at columbiamanagement.com. Other information and resources available on our website include:
| n | | timely economic analysis and market commentary |
| n | | quarterly fund commentaries |
| n | | Columbia Management Investor, a quarterly newsletter for shareholders |
Thank you for your continued support of the Columbia Funds. We look forward to serving your investment needs for many years to come.
Best Regards,

J. Kevin Connaughton
President, Columbia Funds
* All ratings are based on Class Z shares as of 12/31/2011. Out of 119 Class Z share Columbia funds rated by Morningstar, 7 funds received a 5-star Overall Rating and 45 funds received a 4-star Overall Rating. The Overall Morningstar Rating for a retail mutual fund is derived from a weighted average of the performance figures associated with its 3-, 5- and 10-year (if applicable) Morningstar Rating metrics. For share classes that do not have a 3-, 5-, or 10-year actual performance history, the fund’s independent Morningstar Rating metric is then compared against the retail mutual fund universe breakpoints to determine its hypothetical rating.
For each fund with at least a three-year history, Morningstar calculates a Morningstar RatingTM based on a Morningstar Risk-Adjusted Return measure that accounts for variation in a fund’s monthly performance (including the effects of sales charges/loads, and redemption fees), placing more emphasis on downward variations and rewarding consistent performance. The top 10% of funds in each category receive 5 stars, the next 22.5% receive 4 stars, the next 35% receive 3 stars, the next 22.5% receive 2 stars and the bottom 10% receive 1 star. (Each share class is counted as a fraction of one fund within this scale and rated separately, which may cause slight variations in the distribution percentages.)
The Morningstar RatingTM is for Class Z shares only; other classes may have different performance characteristics and may have different ratings. ©2012 Morningstar, Inc. All Rights Reserved. The Morningstar information contained herein: (1) is proprietary to Morningstar and/or its content providers; (2) may not be copied or distributed; and (3) is not warranted to be accurate, complete or timely. Neither Morningstar nor its content providers are responsible for any damages or losses arising from any use of this information.
Investors should consider the investment objectives, risks, charges and expenses of a mutual fund carefully before investing. For a free prospectus, which contains this and other important information about the funds, visit columbiamanagement.com. The prospectus should be read carefully before investing.
Columbia Funds are distributed by Columbia Management Investment Distributors, Inc., member FINRA, and managed by Columbia Management Investment Advisers, LLC.
© 2012 Columbia Management Investment Advisers, LLC. All rights reserved.
Fund Profile – Columbia Large Cap Index Fund
Summary
| n | | For the 12-month period that ended February 29, 2012, the fund’s Class A shares returned 4.67% without sales charge. |
| n | | The fund’s return was slightly lower than the 5.12% return of its benchmark, the S&P 500 Index.1 |
| n | | For the fund and the U.S stock market, it was a third consecutive 12-month period of gains. |
Portfolio Management
Alfred F. Alley III has managed or co-managed the fund since February 2009. From 2005 until joining Columbia Management Investment Advisers, LLC (the Investment Manager) in May 2010, Mr. Alley was associated with the fund’s previous investment adviser as an investment professional.
Vadim Shteyn has co-managed the fund since August 2011. From August 2006 until joining the Investment Manager in May 2010, Mr. Shteyn was associated with the fund’s previous investment adviser as an investment professional.
| 1 | The Standard & Poor’s (S&P) 500 Index tracks the performance of 500 widely held, large-capitalization U.S. stocks. |
Indices are not available for investment, are not professionally managed and do not reflect sales charges, fees, brokerage commissions, taxes or other expenses of investing. Securities in the fund may not match those in an index.
Performance data quoted represents past performance and current performance may be lower or higher. Past performance is no guarantee of future results. The investment return and principal value will fluctuate so that shares, when redeemed, may be worth more or less than the original cost. Please visit www.columbiamanagement.com for daily and most recent month-end performance updates.
Summary
1-year return as of 02/29/12
| | |
| |
 | | +4.67% Class A shares |
| |
| | +5.12% S&P 500 Index |
|
Morningstar Style Box™ |
|
Equity Style |
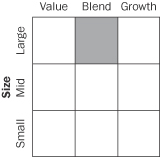
|
The Morningstar Style BoxTM is based on the fund’s portfolio holdings. For equity funds, the vertical axis shows the market capitalization of the stocks owned, and the horizontal axis shows investment style (value, blend, or growth). Information shown is based on the most recent data provided by Morningstar.
© 2012 Morningstar, Inc. All rights reserved. The Morningstar information contained herein: (1) is proprietary to Morningstar and/or its content providers; (2) may not be copied or distributed; and (3) is not warranted to be accurate, complete or timely. Neither Morningstar nor its content providers are responsible for any damages or losses arising from any use of this information.
1
Performance Information – Columbia Large Cap Index Fund
Performance data quoted represents past performance and current performance may be lower or higher. Past performance is no guarantee of future results. The investment return and principal value will fluctuate so that shares, when redeemed, may be worth more or less than the original cost. Please visit www.columbiamanagement.com for daily and most recent month-end performance updates.
|
| Performance of a $10,000 investment 03/01/02 – 02/29/12 |
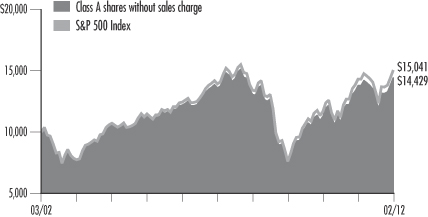
The chart above shows the change in value of a hypothetical $10,000 investment in Class A shares of Columbia Large Cap Index Fund during the stated time period, and does not reflect the deduction of taxes that a shareholder may pay on fund distributions or on the redemption of fund shares.
| | | | | | | | |
| Performance of a $10,000 investment 03/01/02 – 02/29/12 ($) | |
| | |
| Sales charge | | without | | | with | |
Class A* | | | 14,429 | | | | n/a | |
Class B* | | | 13,400 | | | | 13,400 | |
Class I* | | | 14,710 | | | | n/a | |
Class Z | | | 14,796 | | | | n/a | |
| | | | | | | | | | | | | | | | | | | | |
| Average annual total return as of 02/29/12 (%) | |
| | | | |
| Share class | | A* | | | B* | | | I* | | | Z | |
| Inception | | 10/10/95 | | | 09/23/05 | | | 11/16/11 | | | 12/15/93 | |
| Sales charge | | without | | | without | | | with | | | without | | | without | |
1-year | | | 4.67 | | | | 3.90 | | | | –1.10 | | | | 4.87 | | | | 4.91 | |
5-year | | | 1.21 | | | | 0.46 | | | | 0.07 | | | | 1.40 | | | | 1.46 | |
10-year | | | 3.73 | | | | 2.97 | | | | 2.97 | | | | 3.94 | | | | 4.00 | |
The “with sales charge” returns include the applicable contingent deferred sales charge of 5.00% in the first year, declining to 1.00% in the sixth year and eliminated thereafter for Class B shares. The “without sales charge” returns do not include the effect of sales charges. If they had, returns would be lower.
Performance results reflect any fee waivers or reimbursements of fund expenses by Columbia Management Investment Advisers, LLC and/or any of its affiliates. Absent these fee waivers or expense reimbursement arrangements, performance results would have been lower.
All results shown assume reinvestment of distributions. Class A shares are sold at net asset value. Class I and Class Z shares are sold at net asset value with no distribution and service (Rule 12b-1) fees. Class I and Class Z shares have limited eligibility and the investment minimum requirements may vary. Please see the fund’s prospectuses for details. Performance for different share classes will vary based on differences in sales charges and fees associated with each class.
The tables do not reflect the deduction of taxes that a shareholder may pay on fund distributions or on the redemption of fund shares.
| * | The returns shown for periods prior to the share class inception date (including returns since inception, which are since fund inception) include the returns of the fund’s Class Z shares, the fund’s oldest share class. These returns are adjusted to reflect any higher class-related operating expenses of the newer share classes, as applicable. Please visit columbiamanagement.com/mutual-funds/appended-performance for more information. |
2
Understanding Your Expenses – Columbia Large Cap Index Fund
As an investor, you incur two types of costs. There are transaction costs, which generally include sales charges on purchases and may include redemption fees. There are also ongoing costs, which generally include management fees, distribution and service (Rule 12b-1) fees, and other fund expenses. The following information is intended to help you understand your ongoing costs (in dollars) of investing in the Fund and to help you compare these costs with the ongoing costs of investing in other mutual funds.
Analyzing your fund’s expenses
To illustrate these ongoing costs, we have provided examples and calculated the expenses paid by investors in each share class of the Fund during the period. The actual and hypothetical information in the table is based on an initial investment of $1,000 at the beginning of the period indicated and held for the entire period. Expense information is calculated two ways and each method provides you with different information. The amount listed in the “Actual” column is calculated using the Fund’s actual operating expenses and total return for the period. You may use the Actual information, together with the amount invested, to estimate the expenses that you paid over the period. Simply divide your account value by $1,000 (for example, an $8,600 account value divided by $1,000 = 8.6), then multiply the results by the expenses paid during the period under the Actual column. The amount listed in the “Hypothetical” column assumes a 5% annual rate of return before expenses (which is not the Fund’s actual return) and then applies the Fund’s actual expense ratio for the period to the hypothetical return. You should not use the hypothetical account values and expenses to estimate either your actual account balance at the end of the period or the expenses you paid during the period. See “Compare with other funds” below for details on how to use the hypothetical data.
Compare with other funds
Since all mutual funds are required to include the same hypothetical calculations about expenses in shareholder reports, you can use this information to compare the ongoing cost of investing in the Fund with other funds. To do so, compare the hypothetical example with the 5% hypothetical examples that appear in the shareholder reports of other funds. As you compare hypothetical examples of other funds, it is important to note that hypothetical examples are meant to highlight the ongoing costs of investing in a fund only and do not reflect any transaction costs, such as sales charges, or redemption or exchange fees. Therefore, the hypothetical calculations are useful in comparing ongoing costs only, and will not help you determine the relative total costs of owning different funds. If transaction costs were included in these calculations, your costs would be higher.
| | | | | | | | | | | | | | | | | | | | | | | | | | | | |
| 09/01/11 – 02/29/12 | | | | | | | | | | | | | | | | |
| | | | |
| | | Account value at the beginning of the period ($) | | | Account value at the end of the period ($) | | | Expenses paid during the period ($) | | | Fund’s annualized
expense ratio (%) | |
| | | Actual | | | Hypothetical | | | Actual | | | Hypothetical | | | Actual | | | Hypothetical | | | Actual | |
Class A | | | 1,000.00 | | | | 1,000.00 | | | | 1,130.40 | | | | 1,022.77 | | | | 2.22 | | | | 2.11 | | | | 0.42 | % |
Class B | | | 1,000.00 | | | | 1,000.00 | | | | 1,126.60 | | | | 1,019.05 | | | | 6.19 | | | | 5.87 | | | | 1.17 | % |
Class I | | | 1,000.00 | | | | 1,000.00 | | | | 1,131.60 | * | | | 1,024.12 | | | | 0.45 | * | | | 0.75 | | | | 0.15 | % |
Class Z | | | 1,000.00 | | | | 1,000.00 | | | | 1,131.80 | | | | 1,024.02 | | | | 0.90 | | | | 0.86 | | | | 0.17 | % |
*For the period November 16, 2011 through February 29, 2012. Class I shares commenced operations on November 16, 2011.
Expenses paid during the period are equal to the annualized expense ratio for each class as indicated above, multiplied by the average account value over the period and then multiplied by the number of days in the Fund’s most recent fiscal half year and divided by 366.
Expenses do not include fees and expenses incurred indirectly by the Fund from the underlying funds in which the Fund may invest (also referred to as “acquired funds”), including affiliated and non-affiliated pooled investments vehicles (including mutual funds and exchange traded funds).
Had Columbia Management Investment Advisers, LLC and/or certain of its affiliates not waived/reimbursed certain fees and expenses, account value at the end of the period would have been reduced.
3
Portfolio Managers’ Report – Columbia Large Cap Index Fund
Performance data quoted represents past performance and current performance may be lower or higher. Past performance is no guarantee of future results. The investment return and principal value will fluctuate so that shares, when redeemed, may be worth more or less than the original cost. Please visit www.columbiamanagement.com for daily and most recent month-end performance updates.
| | | | |
| Net asset value per share | |
| |
as of 02/29/12 ($) | | | | |
Class A | | | 26.35 | |
Class B | | | 26.44 | |
Class I | | | 26.45 | |
Class Z | | | 26.45 | |
| | | | |
| Distributions declared per share | |
| |
03/01/11 – 02/29/12 ($) | | | | |
Class A | | | 0.43 | |
Class B | | | 0.24 | |
Class I | | | 0.41 | |
Class Z | | | 0.49 | |
For the 12-month period that ended February 29, 2012, the fund’s Class A shares returned 4.67% without sales charge. The S&P 500 Index returned 5.12%. The fund seeks to approximate the benchmark weights of securities represented in the S&P 500 Index. As such, its return was slightly below the return of the index, after fees and expenses, which the index does not incur. Despite a rocky period midway through 2011, stock prices climbed for the third consecutive year, buoyed by sectors that are sensitive to economic growth.
U.S. economy picks up momentum
During the first half of the 12-month period, a series of natural disasters in Japan, Europe’s debt problems and wrangling in Washington over the federal budget and the national debt dominated world headlines. U.S. economic news was lackluster and job growth was disappointing. However, the pace of growth picked up in the second half of the period and, as fears of a lapse back into recession faded, prospects brightened. Consumer confidence improved even though consumers remain under pressure, with no real increase in disposable income and a continued decline in household net worth. The labor markets added more than a million new jobs from September 2011 through February 2012, and the jobless rate fell to 8.3%. Headline inflation — which tracks a broad range of consumer expenditures, including food and energy — remained within its historical range. Even manufacturing held its ground. A modest slowdown in manufacturing activity late in the summer of 2011 raised concern that this lynchpin of the recovery was ready to turn downward. However, manufacturing activity stabilized, and the manufacturing expansion continued into 2012. Housing continues to be the one nagging weak spot in the economy. Yet, home sales edged modestly higher over the year, and there is hope that a bottom in the housing market is in sight.
Defensive sectors drove performance
For the 12-month period, consumer staples, health care and utilities — all traditionally defensive market sectors — drove performance within the fund and the index. Trading companies & distributors, health care technology, tobacco, biotechnology and textiles, apparel & luxury goods were the top-performing industries. Technology stocks dominated the top performers. Apple, International Business Machines, Microsoft and Intel (4.0%, 1.8%, 1.9% and 1.1% of net assets, respectively) were among the top five performers. Philip Morris International (1.2% of net assets) was also a top performer for the period.
By contrast, financials, materials and energy sectors underperformed for the period. Wireless telecommunication services, real estate management & development, electronic equipment, instruments & components, diversified financial services and airlines were the five weakest industries. The worst performing stocks in terms of contribution to benchmark total return were Bank of America, Citigroup, Hewlett-Packard, JPMorgan Chase and Goldman Sachs (0.6%, 0.6%, 0.4%, 1.2% and 0.5% of net assets, respectively).
Changes to index and portfolio holdings
During the period, there were 18 additions and deletions to the index and the fund. Compuware, Tellabs, Monster Worldwide, MEMC Electronic Materials, AK Steel, Nicor, Janus Capital, ITT, Cephalon, National Semiconductor, Marshall & Isley, Radioshack, Prologis, Massey Energy, Novell, Genzyme, Qwest Communications and McAfee were deleted from the index. WPX Energy, TripAdvisor, BorgWarner, Dollar Tree, Perrigo, AGL Resources, Cooper
4
Portfolio Managers’ Report (continued) – Columbia Large Cap Index Fund
Industries, Xylem, TE Connectivity, Mosaic, Accenture, Marathon Petroleum, Alpha Natural Resources, Chipotle Mexican Grill, BlackRock, Edwards Lifesciences and Covidien (0.03%, 0.02%, 0.1%, 0.1%, 0.1%, 0.04%, 0.1%, 0.04%, 0.1%, 0.1%, 0.3%, 0.1%, 0.03%, 0.1%, 0.2%, 0.1% and 0.2% of net assets, respectively) were added to the index.
Looking ahead
As the period ended, economic data suggested that economic growth will continue at a below-trend pace and that, at least in the near term, the U.S. economy has moved away from recessionary conditions. Recession odds have been reduced with the extension of the payroll tax cut and unemployment benefit programs. However, this extension is temporary and only kicks the can down the road into 2013, when severe curtailments are set to bite. And while U.S. economic data is mildly encouraging, there is still a reasonable chance of a mild recession. Europe may already be in a recession, which is likely to worsen further into 2012 as austerity measures begin to bite deeper. The good news is that these measures will initially reduce deficits, but without economic growth it is hard to make significant and persistent progress in debt reduction. So while many of the issues that worried us in 2011 continue to worry us into 2012, we are, nonetheless, cautiously optimistic about the potential for financial returns in 2012.
Equity securities are subject to stock market fluctuations that occur in response to economic and business developments.
| | | | |
| Portfolio breakdown1 | |
| |
(at February 29, 2012) | | | | |
Consumer Discretionary | | | 10.8 | % |
Consumer Staples | | | 10.7 | |
Energy | | | 12.0 | |
Financials | | | 14.1 | |
Health Care | | | 11.2 | |
Industrials | | | 10.6 | |
Information Technology | | | 20.0 | |
Materials | | | 3.5 | |
Telecommunication Services | | | 2.7 | |
Utilities | | | 3.4 | |
Other2 | | | 1.0 | |
| | 1 | Percentages indicated are based upon total investments (excluding Investments of Cash Collateral Received for Securities on Loan). The Fund’s portfolio composition is subject to change. |
| | 2 | Includes investments in affiliated money market fund. |
| | | | |
| Top ten holdings1 | |
| |
(at February 29, 2012) | | | | |
Apple, Inc. | | | 4.1 | % |
Exxon Mobil Corp. | | | 3.4 | |
Microsoft Corp. | | | 1.9 | |
International Business Machines Corp. | | | 1.9 | |
Chevron Corp. | | | 1.8 | |
General Electric Co. | | | 1.6 | |
Procter & Gamble Co. (The) | | | 1.5 | |
AT&T, Inc. | | | 1.5 | |
Johnson & Johnson | | | 1.4 | |
Wells Fargo & Co. | | | 1.3 | |
| | 1 | Percentages indicated are based upon total investments (excluding Investments of Cash Collateral Received for Securities on Loan and affiliated money market fund). |
For further detail about these holdings, please refer to the section entitled “Portfolio of Investments.”
Fund holdings are as of the date given, are subject to change at any time, and are not recommendations to buy or sell any securities.
5
Portfolio of Investments – Columbia Large Cap Index Fund
February 29, 2012
(Percentages represent value of investments compared to net assets)
| | | | | | | | |
| Issuer | | Shares | | | Value | |
Common Stocks 98.5% | |
Consumer Discretionary 10.7% | | | | | | | | |
Auto Components 0.3% | | | | | | | | |
BorgWarner, Inc.(a) | | | 31,675 | | | | $2,623,957 | |
Goodyear Tire & Rubber Co. (The)(a) | | | 70,544 | | | | 907,196 | |
Johnson Controls, Inc. | | | 196,422 | | | | 6,409,250 | |
| | | | | | | | |
Total | | | | | | | 9,940,403 | |
Automobiles 0.4% | | | | | | | | |
Ford Motor Co. | | | 1,097,064 | | | | 13,581,652 | |
Harley-Davidson, Inc. | | | 67,084 | | | | 3,124,773 | |
| | | | | | | | |
Total | | | | | | | 16,706,425 | |
Distributors 0.1% | | | | | | | | |
Genuine Parts Co. | | | 44,936 | | | | 2,816,589 | |
Diversified Consumer Services 0.1% | | | | | | | | |
Apollo Group, Inc., Class A(a) | | | 33,552 | | | | 1,430,657 | |
DeVry, Inc. | | | 17,480 | | | | 621,064 | |
H&R Block, Inc. | | | 84,559 | | | | 1,378,312 | |
| | | | | | | | |
Total | | | | | | | 3,430,033 | |
Hotels, Restaurants & Leisure 1.9% | | | | | | | | |
Carnival Corp. | | | 130,639 | | | | 3,957,055 | |
Chipotle Mexican Grill, Inc.(a) | | | 9,035 | | | | 3,525,638 | |
Darden Restaurants, Inc. | | | 38,057 | | | | 1,940,526 | |
International Game Technology | | | 85,915 | | | | 1,290,443 | |
Marriott International, Inc., Class A | | | 77,399 | | | | 2,730,637 | |
McDonald’s Corp. | | | 295,396 | | | | 29,326,915 | |
Starbucks Corp. | | | 215,192 | | | | 10,449,724 | |
Starwood Hotels & Resorts Worldwide, Inc. | | | 55,477 | | | | 2,990,210 | |
Wyndham Worldwide Corp. | | | 44,060 | | | | 1,938,199 | |
Wynn Resorts Ltd. | | | 22,862 | | | | 2,710,062 | |
Yum! Brands, Inc. | | | 132,942 | | | | 8,806,078 | |
| | | | | | | | |
Total | | | | | | | 69,665,487 | |
Household Durables 0.2% | | | | | | | | |
D.R. Horton, Inc. | | | 80,293 | | | | 1,151,402 | |
Harman International Industries, Inc. | | | 20,239 | | | | 994,342 | |
Leggett & Platt, Inc. | | | 40,167 | | | | 908,979 | |
Lennar Corp., Class A | | | 46,430 | | | | 1,085,533 | |
Newell Rubbermaid, Inc. | | | 83,577 | | | | 1,529,459 | |
PulteGroup, Inc.(a) | | | 97,246 | | | | 857,710 | |
Whirlpool Corp. | | | 22,067 | | | | 1,667,603 | |
| | | | | | | | |
Total | | | | | | | 8,195,028 | |
Internet & Catalog Retail 0.9% | | | | | | | | |
Amazon.com, Inc.(a) | | | 105,028 | | | | 18,872,481 | |
Expedia, Inc. | | | 27,367 | | | | 931,846 | |
Netflix, Inc.(a) | | | 15,982 | | | | 1,769,687 | |
priceline.com, Inc.(a) | | | 14,372 | | | | 9,011,532 | |
TripAdvisor, Inc.(a) | | | 27,367 | | | | 882,039 | |
| | | | | | | | |
Total | | | | | | | 31,467,585 | |
Leisure Equipment & Products 0.1% | | | | | | | | |
Hasbro, Inc. | | | 33,513 | | | | 1,183,679 | |
Mattel, Inc. | | | 97,765 | | | | 3,171,497 | |
| | | | | | | | |
Total | | | | | | | 4,355,176 | |
Media 3.2% | | | | | | | | |
Cablevision Systems Corp., Class A | | | 63,734 | | | | 906,935 | |
CBS Corp., Class B Non Voting | | | 188,924 | | | | 5,648,828 | |
| | | | | | | | |
| Issuer | | Shares | | | Value | |
Common Stocks (continued) | |
Consumer Discretionary (cont.) | | | | | | | | |
Media (cont.) | | | | | | | | |
Comcast Corp., Class A | | | 786,644 | | | | $23,111,601 | |
DIRECTV, Class A(a) | | | 203,697 | | | | 9,435,245 | |
Discovery Communications, Inc., Class A(a) | | | 76,294 | | | | 3,559,115 | |
Gannett Co., Inc. | | | 68,792 | | | | 1,020,873 | |
Interpublic Group of Companies, Inc. (The) | | | 133,138 | | | | 1,560,377 | |
McGraw-Hill Companies, Inc. (The) | | | 80,253 | | | | 3,734,975 | |
News Corp., Class A | | | 633,092 | | | | 12,579,538 | |
Omnicom Group, Inc. | | | 79,643 | | | | 3,937,550 | |
Scripps Networks Interactive, Inc., Class A | | | 28,079 | | | | 1,269,171 | |
Time Warner Cable, Inc. | | | 92,126 | | | | 7,309,277 | |
Time Warner, Inc. | | | 288,949 | | | | 10,751,792 | |
Viacom, Inc., Class B | | | 159,420 | | | | 7,591,580 | |
Walt Disney Co. (The) | | | 518,642 | | | | 21,777,777 | |
Washington Post Co. (The), Class B(b) | | | 1,404 | | | | 553,036 | |
| | | | | | | | |
Total | | | | | | | 114,747,670 | |
Multiline Retail 0.8% | | | | | | | | |
Big Lots, Inc.(a) | | | 18,924 | | | | 829,817 | |
Dollar Tree, Inc.(a) | | | 34,362 | | | | 3,041,381 | |
Family Dollar Stores, Inc. | | | 33,889 | | | | 1,829,667 | |
JCPenney Co., Inc.(b) | | | 41,261 | | | | 1,633,936 | |
Kohl’s Corp. | | | 73,164 | | | | 3,634,788 | |
Macy’s, Inc. | | | 121,200 | | | | 4,601,964 | |
Nordstrom, Inc. | | | 46,704 | | | | 2,504,268 | |
Sears Holdings Corp.(a)(b) | | | 11,108 | | | | 773,783 | |
Target Corp. | | | 193,886 | | | | 10,991,397 | |
| | | | | | | | |
Total | | | | | | | 29,841,001 | |
Specialty Retail 2.0% | | | | | | | | |
Abercrombie & Fitch Co., Class A | | | 24,816 | | | | 1,136,325 | |
AutoNation, Inc.(a) | | | 13,732 | | | | 467,987 | |
AutoZone, Inc.(a) | | | 8,061 | | | | 3,018,683 | |
Bed Bath & Beyond, Inc.(a) | | | 69,306 | | | | 4,140,340 | |
Best Buy Co., Inc. | | | 84,720 | | | | 2,092,584 | |
CarMax, Inc.(a) | | | 65,369 | | | | 2,006,175 | |
GameStop Corp., Class A(b) | | | 39,955 | | | | 910,175 | |
Gap, Inc. (The) | | | 100,160 | | | | 2,339,738 | |
Home Depot, Inc. (The) | | | 445,041 | | | | 21,170,600 | |
Limited Brands, Inc. | | | 71,010 | | | | 3,304,095 | |
Lowe’s Companies, Inc. | | | 361,606 | | | | 10,262,378 | |
O’Reilly Automotive, Inc.(a) | | | 37,047 | | | | 3,204,565 | |
Ross Stores, Inc. | | | 66,745 | | | | 3,559,511 | |
Staples, Inc. | | | 201,919 | | | | 2,960,133 | |
Tiffany & Co. | | | 36,652 | | | | 2,382,747 | |
TJX Companies, Inc. | | | 217,756 | | | | 7,972,047 | |
Urban Outfitters, Inc.(a) | | | 32,055 | | | | 910,041 | |
| | | | | | | | |
Total | | | | | | | 71,838,124 | |
Textiles, Apparel & Luxury Goods 0.7% | | | | | | | | |
Coach, Inc. | | | 84,248 | | | | 6,305,120 | |
Nike, Inc., Class B | | | 107,087 | | | | 11,556,829 | |
Ralph Lauren Corp. | | | 18,618 | | | | 3,234,505 | |
VF Corp. | | | 25,170 | | | | 3,676,079 | |
| | | | | | | | |
Total | | | | | | | 24,772,533 | |
Total Consumer Discretionary | | | | | | | 387,776,054 | |
The Accompanying Notes to Financial Statements are an integral part of this statement.
6
Columbia Large Cap Index Fund
February 29, 2012
| | | | | | | | |
| Issuer | | Shares | | | Value | |
Common Stocks (continued) | |
Consumer Staples 10.6% | | | | | | | | |
Beverages 2.4% | | | | | | | | |
Beam, Inc. | | | 44,880 | | | | $2,471,991 | |
Brown-Forman Corp., Class B | | | 29,119 | | | | 2,377,566 | |
Coca-Cola Co. (The) | | | 655,690 | | | | 45,806,504 | |
Coca-Cola Enterprises, Inc. | | | 90,077 | | | | 2,603,225 | |
Constellation Brands, Inc., Class A(a) | | | 50,261 | | | | 1,097,700 | |
Dr. Pepper Snapple Group, Inc. | | | 61,890 | | | | 2,354,915 | |
Molson Coors Brewing Co., Class B | | | 45,478 | | | | 1,998,303 | |
PepsiCo, Inc. | | | 451,346 | | | | 28,407,717 | |
| | | | | | | | |
Total | | | | | | | 87,117,921 | |
Food & Staples Retailing 2.2% | | | | | | | | |
Costco Wholesale Corp. | | | 125,110 | | | | 10,766,967 | |
CVS Caremark Corp. | | | 375,772 | | | | 16,947,317 | |
Kroger Co. (The) | | | 172,392 | | | | 4,101,206 | |
Safeway, Inc. | | | 98,127 | | | | 2,104,824 | |
SUPERVALU, Inc.(b) | | | 61,269 | | | | 400,087 | |
SYSCO Corp. | | | 170,301 | | | | 5,010,255 | |
Wal-Mart Stores, Inc. | | | 504,231 | | | | 29,789,967 | |
Walgreen Co. | | | 256,733 | | | | 8,513,266 | |
Whole Foods Market, Inc. | | | 46,120 | | | | 3,723,729 | |
| | | | | | | | |
Total | | | | | | | 81,357,618 | |
Food Products 1.8% | | | | | | | | |
Archer-Daniels-Midland Co. | | | 192,842 | | | | 6,016,670 | |
Campbell Soup Co. | | | 51,774 | | | | 1,725,110 | |
ConAgra Foods, Inc. | | | 119,663 | | | | 3,141,154 | |
Dean Foods Co.(a) | | | 53,033 | | | | 650,185 | |
General Mills, Inc. | | | 185,762 | | | | 7,116,542 | |
Hershey Co. (The) | | | 44,194 | | | | 2,682,576 | |
HJ Heinz Co. | | | 92,450 | | | | 4,873,039 | |
Hormel Foods Corp. | | | 39,816 | | | | 1,133,562 | |
JM Smucker Co. (The) | | | 32,865 | | | | 2,475,392 | |
Kellogg Co. | | | 71,542 | | | | 3,745,224 | |
Kraft Foods, Inc., Class A | | | 510,049 | | | | 19,417,565 | |
McCormick & Co., Inc. | | | 38,301 | | | | 1,932,285 | |
Mead Johnson Nutrition Co. | | | 58,768 | | | | 4,569,212 | |
Sara Lee Corp. | | | 170,544 | | | | 3,453,516 | |
Tyson Foods, Inc., Class A | | | 84,337 | | | | 1,594,813 | |
| | | | | | | | |
Total | | | | | | | 64,526,845 | |
Household Products 2.1% | | | | | | | | |
Clorox Co. (The) | | | 38,080 | | | | 2,574,589 | |
Colgate-Palmolive Co. | | | 139,727 | | | | 13,019,762 | |
Kimberly-Clark Corp. | | | 113,773 | | | | 8,291,776 | |
Procter & Gamble Co. (The) | | | 794,288 | | | | 53,630,326 | |
| | | | | | | | |
Total | | | | | | | 77,516,453 | |
Personal Products 0.2% | | | | | | | | |
Avon Products, Inc. | | | 124,362 | | | | 2,324,326 | |
Estee Lauder Companies, Inc. (The), Class A | | | 64,492 | | | | 3,775,361 | |
| | | | | | | | |
Total | | | | | | | 6,099,687 | |
Tobacco 1.9% | | | | | | | | |
Altria Group, Inc. | | | 593,676 | | | | 17,869,648 | |
Lorillard, Inc. | | | 38,977 | | | | 5,109,105 | |
Philip Morris International, Inc. | | | 501,455 | | | | 41,881,521 | |
Reynolds American, Inc. | | | 97,604 | | | | 4,092,536 | |
| | | | | | | | |
Total | | | | | | | 68,952,810 | |
Total Consumer Staples | | | | | | | 385,571,334 | |
| | | | | | | | |
| Issuer | | Shares | | | Value | |
Common Stocks (continued) | |
Energy 11.9% | | | | | | | | |
Energy Equipment & Services 2.0% | | | | | | | | |
Baker Hughes, Inc. | | | 126,005 | | | | $6,335,531 | |
Cameron International Corp.(a) | | | 70,788 | | | | 3,943,600 | |
Diamond Offshore Drilling, Inc. | | | 20,068 | | | | 1,374,056 | |
FMC Technologies, Inc.(a) | | | 68,790 | | | | 3,469,080 | |
Halliburton Co. | | | 265,646 | | | | 9,719,987 | |
Helmerich & Payne, Inc. | | | 30,932 | | | | 1,896,132 | |
Nabors Industries Ltd.(a) | | | 83,015 | | | | 1,808,067 | |
National Oilwell Varco, Inc. | | | 122,361 | | | | 10,098,453 | |
Noble Corp.(a) | | | 72,877 | | | | 2,928,198 | |
Rowan Companies, Inc.(a) | | | 36,081 | | | | 1,330,306 | |
Schlumberger Ltd. | | | 387,463 | | | | 30,071,003 | |
| | | | | | | | |
Total | | | | | | | 72,974,413 | |
Oil, Gas & Consumable Fuels 9.9% | | | | | | | | |
Alpha Natural Resources, Inc.(a) | | | 63,457 | | | | 1,177,762 | |
Anadarko Petroleum Corp. | | | 143,761 | | | | 12,093,175 | |
Apache Corp. | | | 110,875 | | | | 11,966,739 | |
Cabot Oil & Gas Corp. | | | 60,334 | | | | 2,104,450 | |
Chesapeake Energy Corp. | | | 190,326 | | | | 4,758,150 | |
Chevron Corp. | | | 574,929 | | | | 62,736,253 | |
ConocoPhillips | | | 383,310 | | | | 29,342,381 | |
Consol Energy, Inc. | | | 65,482 | | | | 2,345,565 | |
Denbury Resources, Inc.(a) | | | 114,688 | | | | 2,283,438 | |
Devon Energy Corp. | | | 116,603 | | | | 8,548,166 | |
El Paso Corp. | | | 222,639 | | | | 6,191,591 | |
EOG Resources, Inc. | | | 77,616 | | | | 8,837,358 | |
EQT Corp. | | | 43,141 | | | | 2,287,336 | |
Exxon Mobil Corp.(c) | | | 1,383,768 | | | | 119,695,932 | |
Hess Corp. | | | 86,034 | | | | 5,585,327 | |
Kinder Morgan Management LLC(a)(d) | | | 60,281 | | | | 48 | |
Marathon Oil Corp. | | | 203,160 | | | | 6,885,092 | |
Marathon Petroleum Corp. | | | 102,924 | | | | 4,276,492 | |
Murphy Oil Corp. | | | 55,869 | | | | 3,572,264 | |
Newfield Exploration Co.(a) | | | 38,251 | | | | 1,377,036 | |
Noble Energy, Inc. | | | 50,682 | | | | 4,949,097 | |
Occidental Petroleum Corp. | | | 234,358 | | | | 24,459,944 | |
Peabody Energy Corp. | | | 78,200 | | | | 2,727,616 | |
Pioneer Natural Resources Co. | | | 35,331 | | | | 3,873,691 | |
QEP Resources, Inc. | | | 51,085 | | | | 1,744,042 | |
Range Resources Corp. | | | 45,159 | | | | 2,875,725 | |
Southwestern Energy Co.(a) | | | 100,286 | | | | 3,315,455 | |
Spectra Energy Corp. | | | 187,750 | | | | 5,891,595 | |
Sunoco, Inc. | | | 30,820 | | | | 1,190,577 | |
Tesoro Corp.(a) | | | 41,060 | | | | 1,089,322 | |
Valero Energy Corp. | | | 161,590 | | | | 3,957,339 | |
Williams Companies, Inc. (The) | | | 170,159 | | | | 5,084,351 | |
WPX Energy, Inc.(a) | | | 56,719 | | | | 1,030,017 | |
| | | | | | | | |
Total | | | | | | | 358,253,326 | |
Total Energy | | | | 431,227,739 | |
Financials 14.0% | | | | | | | | |
Capital Markets 1.9% | | | | | | | | |
Ameriprise Financial, Inc.(e) | | | 65,318 | | | | 3,642,132 | |
Bank of New York Mellon Corp. (The) | | | 350,079 | | | | 7,740,247 | |
BlackRock, Inc. | | | 28,922 | | | | 5,755,478 | |
Charles Schwab Corp. (The) | | | 311,641 | | | | 4,325,577 | |
E*Trade Financial Corp.(a) | | | 73,297 | | | | 705,850 | |
Federated Investors, Inc., Class B(b) | | | 26,661 | | | | 546,284 | |
The Accompanying Notes to Financial Statements are an integral part of this statement.
7
Columbia Large Cap Index Fund
February 29, 2012
| | | | | | | | |
| Issuer | | Shares | | | Value | |
Common Stocks (continued) | |
Financials (cont.) | | | | | | | | |
Capital Markets (cont.) | | | | | | | | |
Franklin Resources, Inc. | | | 42,021 | | | | $4,953,856 | |
Goldman Sachs Group, Inc. (The) | | | 142,128 | | | | 16,364,618 | |
Invesco Ltd. | | | 130,199 | | | | 3,225,029 | |
Legg Mason, Inc. | | | 35,913 | | | | 983,657 | |
Morgan Stanley | | | 428,450 | | | | 7,943,463 | |
Northern Trust Corp. | | | 69,574 | | | | 3,089,781 | |
State Street Corp. | | | 142,023 | | | | 5,997,631 | |
T Rowe Price Group, Inc. | | | 72,936 | | | | 4,492,128 | |
| | | | | | | | |
Total | | | | | | | 69,765,731 | |
Commercial Banks 2.7% | | | | | | | | |
BB&T Corp. | | | 201,254 | | | | 5,886,679 | |
Comerica, Inc. | | | 57,358 | | | | 1,702,959 | |
Fifth Third Bancorp | | | 265,534 | | | | 3,613,918 | |
First Horizon National Corp. | | | 76,105 | | | | 715,387 | |
Huntington Bancshares, Inc. | | | 249,453 | | | | 1,458,053 | |
KeyCorp | | | 275,093 | | | | 2,228,253 | |
M&T Bank Corp. | | | 36,267 | | | | 2,960,112 | |
PNC Financial Services Group, Inc. | | | 151,885 | | | | 9,040,195 | |
Regions Financial Corp. | | | 363,430 | | | | 2,093,357 | |
SunTrust Banks, Inc. | | | 155,028 | | | | 3,559,443 | |
U.S. Bancorp | | | 550,944 | | | | 16,197,754 | |
Wells Fargo & Co. | | | 1,522,433 | | | | 47,636,929 | |
Zions Bancorporation | | | 53,203 | | | | 1,010,857 | |
| | | | | | | | |
Total | | | | | | | 98,103,896 | |
Consumer Finance 0.8% | | | | | | | | |
American Express Co. | | | 291,722 | | | | 15,429,176 | |
Capital One Financial Corp. | | | 159,806 | | | | 8,086,184 | |
Discover Financial Services | | | 158,677 | | | | 4,761,897 | |
SLM Corp. | | | 146,869 | | | | 2,314,655 | |
| | | | | | | | |
Total | | | | | | | 30,591,912 | |
Diversified Financial Services 3.0% | | | | | | | | |
Bank of America Corp. | | | 2,926,161 | | | | 23,321,503 | |
Citigroup, Inc. | | | 844,056 | | | | 28,123,946 | |
CME Group, Inc. | | | 19,167 | | | | 5,548,655 | |
IntercontinentalExchange, Inc.(a) | | | 20,974 | | | | 2,893,573 | |
JPMorgan Chase & Co. | | | 1,096,968 | | | | 43,045,024 | |
Leucadia National Corp. | | | 57,194 | | | | 1,629,457 | |
Moody’s Corp. | | | 56,399 | | | | 2,177,566 | |
NASDAQ OMX Group, Inc. (The)(a) | | | 36,828 | | | | 970,050 | |
NYSE Euronext | | | 75,638 | | | | 2,251,743 | |
| | | | | | | | |
Total | | | | | | | 109,961,517 | |
Insurance 3.5% | | | | | | | | |
ACE Ltd. | | | 97,239 | | | | 6,973,009 | |
Aflac, Inc. | | | 134,759 | | | | 6,367,363 | |
Allstate Corp. (The) | | | 145,892 | | | | 4,585,385 | |
American International Group, Inc.(a) | | | 126,108 | | | | 3,684,876 | |
AON Corp. | | | 93,331 | | | | 4,368,824 | |
Assurant, Inc. | | | 26,591 | | | | 1,129,320 | |
Berkshire Hathaway, Inc., Class B(a) | | | 507,540 | | | | 39,816,513 | |
Chubb Corp. (The) | | | 80,278 | | | | 5,455,693 | |
Cincinnati Financial Corp. | | | 46,791 | | | | 1,645,639 | |
Genworth Financial, Inc., Class A(a) | | | 141,729 | | | | 1,288,317 | |
Hartford Financial Services Group, Inc. | | | 128,682 | | | | 2,665,004 | |
Lincoln National Corp. | | | 87,089 | | | | 2,163,291 | |
Loews Corp. | | | 88,154 | | | | 3,450,347 | |
| | | | | | | | |
| Issuer | | Shares | | | Value | |
Common Stocks (continued) | |
Financials (cont.) | | | | | | | | |
Insurance (cont.) | | | | | | | | |
Marsh & McLennan Companies, Inc. | | | 155,308 | | | | $4,845,610 | |
MetLife, Inc. | | | 305,332 | | | | 11,770,549 | |
Principal Financial Group, Inc. | | | 88,096 | | | | 2,436,735 | |
Progressive Corp. (The) | | | 178,037 | | | | 3,813,552 | |
Prudential Financial, Inc. | | | 136,263 | | | | 8,333,845 | |
Torchmark Corp. | | | 29,429 | | | | 1,425,541 | |
Travelers Companies, Inc. (The) | | | 119,165 | | | | 6,907,995 | |
Unum Group | | | 84,408 | | | | 1,945,604 | |
XL Group PLC | | | 92,531 | | | | 1,924,645 | |
| | | | | | | | |
Total | | | | | | | 126,997,657 | |
Real Estate Investment Trusts (REITs) 1.9% | | | | | | | | |
American Tower Corp. | | | 113,464 | | | | 7,100,577 | |
Apartment Investment & Management Co., Class A | | | 34,908 | | | | 867,115 | |
AvalonBay Communities, Inc. | | | 27,450 | | | | 3,559,442 | |
Boston Properties, Inc. | | | 42,620 | | | | 4,328,061 | |
Equity Residential | | | 85,635 | | | | 4,871,775 | |
HCP, Inc. | | | 117,726 | | | | 4,650,177 | |
Health Care REIT, Inc. | | | 59,988 | | | | 3,265,747 | |
Host Hotels & Resorts, Inc. | | | 203,885 | | | | 3,217,305 | |
Kimco Realty Corp. | | | 117,482 | | | | 2,159,319 | |
Plum Creek Timber Co., Inc. | | | 46,560 | | | | 1,823,290 | |
ProLogis, Inc. | | | 132,295 | | | | 4,453,050 | |
Public Storage | | | 40,988 | | | | 5,495,261 | |
Simon Property Group, Inc. | | | 84,817 | | | | 11,491,007 | |
Ventas, Inc. | | | 83,121 | | | | 4,648,126 | |
Vornado Realty Trust | | | 53,263 | | | | 4,353,185 | |
Weyerhaeuser Co. | | | 154,860 | | | | 3,235,025 | |
| | | | | | | | |
Total | | | | | | | 69,518,462 | |
Real Estate Management & Development 0.1% | | | | | | | | |
CBRE Group, Inc., Class A(a) | | | 93,626 | | | | 1,716,165 | |
Thrifts & Mortgage Finance 0.1% | | | | | | | | |
Hudson City Bancorp, Inc. | | | 152,279 | | | | 1,043,111 | |
People’s United Financial, Inc. | | | 104,114 | | | | 1,310,795 | |
| | | | | | | | |
Total | | | | | | | 2,353,906 | |
Total Financials | | | | 509,009,246 | |
Health Care 11.2% | | | | | | | | |
Biotechnology 1.2% | | | | | | | | |
Amgen, Inc. | | | 229,004 | | | | 15,560,822 | |
Biogen Idec, Inc.(a) | | | 70,129 | | | | 8,167,925 | |
Celgene Corp.(a) | | | 128,160 | | | | 9,397,332 | |
Gilead Sciences, Inc.(a) | | | 216,849 | | | | 9,866,629 | |
| | | | | | | | |
Total | | | | | | | 42,992,708 | |
Health Care Equipment & Supplies 1.8% | | | | | | | | |
Baxter International, Inc. | | | 162,784 | | | | 9,462,634 | |
Becton Dickinson and Co. | | | 62,038 | | | | 4,728,536 | |
Boston Scientific Corp.(a) | | | 427,701 | | | | 2,660,300 | |
CareFusion Corp.(a) | | | 64,845 | | | | 1,673,650 | |
Covidien PLC | | | 139,274 | | | | 7,277,067 | |
CR Bard, Inc. | | | 24,765 | | | | 2,318,499 | |
DENTSPLY International, Inc. | | | 40,866 | | | | 1,580,697 | |
Edwards Lifesciences Corp.(a) | | | 32,933 | | | | 2,408,390 | |
Intuitive Surgical, Inc.(a) | | | 11,257 | | | | 5,759,306 | |
Medtronic, Inc. | | | 304,670 | | | | 11,614,020 | |
St. Jude Medical, Inc. | | | 92,090 | | | | 3,878,831 | |
The Accompanying Notes to Financial Statements are an integral part of this statement.
8
Columbia Large Cap Index Fund
February 29, 2012
| | | | | | | | |
| Issuer | | Shares | | | Value | |
Common Stocks (continued) | |
Health Care (cont.) | | | | | | | | |
Health Care Equipment & Supplies (cont.) | | | | | | | | |
Stryker Corp. | | | 93,904 | | | | $5,037,011 | |
Varian Medical Systems, Inc.(a) | | | 32,495 | | | | 2,120,299 | |
Zimmer Holdings, Inc.(a) | | | 51,727 | | | | 3,142,415 | |
| | | | | | | | |
Total | | | | | | | 63,661,655 | |
Health Care Providers & Services 2.1% | | | | | | | | |
Aetna, Inc. | | | 104,594 | | | | 4,890,815 | |
AmerisourceBergen Corp. | | | 74,582 | | | | 2,785,638 | |
Cardinal Health, Inc. | | | 99,745 | | | | 4,144,405 | |
CIGNA Corp. | | | 82,412 | | | | 3,635,193 | |
Coventry Health Care, Inc.(a) | | | 41,652 | | | | 1,361,604 | |
DaVita, Inc.(a) | | | 26,993 | | | | 2,336,244 | |
Express Scripts, Inc.(a) | | | 140,452 | | | | 7,490,305 | |
Five Star Quality Care, Inc.(a)(d) | | | 23,000 | | | | 1 | |
Humana, Inc. | | | 47,203 | | | | 4,111,381 | |
Laboratory Corp. of America Holdings(a) | | | 28,610 | | | | 2,571,753 | |
McKesson Corp. | | | 70,892 | | | | 5,920,191 | |
Medco Health Solutions, Inc.(a) | | | 111,769 | | | | 7,554,467 | |
Patterson Companies, Inc. | | | 25,316 | | | | 808,087 | |
Quest Diagnostics, Inc. | | | 45,544 | | | | 2,643,829 | |
Tenet Healthcare Corp.(a) | | | 125,394 | | | | 708,476 | |
UnitedHealth Group, Inc. | | | 307,755 | | | | 17,157,341 | |
WellPoint, Inc. | | | 100,425 | | | | 6,590,893 | |
| | | | | | | | |
Total | | | | | | | 74,710,623 | |
Health Care Technology 0.1% | | | | | | | | |
Cerner Corp.(a) | | | 42,060 | | | | 3,105,290 | |
Life Sciences Tools & Services 0.4% | | | | | | | | |
Agilent Technologies, Inc.(a) | | | 100,238 | | | | 4,372,382 | |
Life Technologies Corp.(a) | | | 51,447 | | | | 2,433,958 | |
PerkinElmer, Inc. | | | 32,647 | | | | 881,469 | |
Thermo Fisher Scientific, Inc.(a) | | | 109,207 | | | | 6,183,300 | |
Waters Corp.(a) | | | 25,869 | | | | 2,317,862 | |
| | | | | | | | |
Total | | | | | | | 16,188,971 | |
Pharmaceuticals 5.6% | | | | | | | | |
Abbott Laboratories | | | 449,726 | | | | 25,458,989 | |
Allergan, Inc. | | | 88,061 | | | | 7,889,385 | |
Bristol-Myers Squibb Co. | | | 489,200 | | | | 15,737,564 | |
Eli Lilly & Co. | | | 294,130 | | | | 11,541,661 | |
Forest Laboratories, Inc.(a) | | | 77,125 | | | | 2,508,105 | |
Hospira, Inc.(a) | | | 47,550 | | | | 1,693,731 | |
Johnson & Johnson | | | 788,378 | | | | 51,307,640 | |
Merck & Co., Inc. | | | 879,915 | | | | 33,586,355 | |
Mylan, Inc.(a) | | | 123,131 | | | | 2,886,191 | |
Perrigo Co. | | | 26,904 | | | | 2,772,726 | |
Pfizer, Inc. | | | 2,219,178 | | | | 46,824,656 | |
Watson Pharmaceuticals, Inc.(a) | | | 36,710 | | | | 2,140,927 | |
| | | | | | | | |
Total | | | | | | | 204,347,930 | |
Total Health Care | | | | | | | 405,007,177 | |
Industrials 10.6% | | | | | | | | |
Aerospace & Defense 2.6% | | | | | | | | |
Boeing Co. (The) | | | 214,567 | | | | 16,081,797 | |
General Dynamics Corp. | | | 102,808 | | | | 7,528,630 | |
Goodrich Corp. | | | 36,151 | | | | 4,553,941 | |
Honeywell International, Inc. | | | 223,304 | | | | 13,302,219 | |
L-3 Communications Holdings, Inc. | | | 28,830 | | | | 2,025,307 | |
Lockheed Martin Corp. | | | 76,598 | | | | 6,772,029 | |
| | | | | | | | |
| Issuer | | Shares | | | Value | |
Common Stocks (continued) | |
Industrials (cont.) | | | | | | | | |
Aerospace & Defense (cont.) | | | | | | | | |
Northrop Grumman Corp. | | | 75,430 | | | | $4,511,468 | |
Precision Castparts Corp. | | | 41,627 | | | | 6,969,609 | |
Raytheon Co. | | | 99,917 | | | | 5,047,807 | |
Rockwell Collins, Inc. | | | 43,688 | | | | 2,590,262 | |
Textron, Inc. | | | 80,305 | | | | 2,209,191 | |
United Technologies Corp. | | | 261,582 | | | | 21,938,882 | |
| | | | | | | | |
Total | | | | | | | 93,531,142 | |
Air Freight & Logistics 1.0% | | | | | | | | |
CH Robinson Worldwide, Inc. | | | 47,397 | | | | 3,136,259 | |
Expeditors International of Washington, Inc. | | | 61,212 | | | | 2,670,680 | |
FedEx Corp. | | | 91,579 | | | | 8,241,194 | |
United Parcel Service, Inc., Class B | | | 278,586 | | | | 21,420,478 | |
| | | | | | | | |
Total | | | | | | | 35,468,611 | |
Airlines 0.1% | | | | | | | | |
Southwest Airlines Co. | | | 224,754 | | | | 2,018,291 | |
Building Products —% | | | | | | | | |
Masco Corp. | | | 103,295 | | | | 1,227,144 | |
Commercial Services & Supplies 0.4% | | | | | | | | |
Avery Dennison Corp. | | | 30,369 | | | | 926,255 | |
Cintas Corp. | | | 31,833 | | | | 1,227,481 | |
Iron Mountain, Inc. | | | 53,587 | | | | 1,663,876 | |
Pitney Bowes, Inc.(b) | | | 57,634 | | | | 1,044,904 | |
Republic Services, Inc. | | | 90,883 | | | | 2,711,040 | |
RR Donnelley & Sons Co.(b) | | | 54,217 | | | | 749,279 | |
Stericycle, Inc.(a) | | | 24,572 | | | | 2,132,112 | |
Waste Management, Inc. | | | 132,894 | | | | 4,648,632 | |
| | | | | | | | |
Total | | | | | | | 15,103,579 | |
Construction & Engineering 0.2% | | | | | | | | |
Fluor Corp. | | | 48,981 | | | | 2,962,371 | |
Jacobs Engineering Group, Inc.(a) | | | 36,992 | | | | 1,709,770 | |
Quanta Services, Inc.(a) | | | 60,664 | | | | 1,267,878 | |
| | | | | | | | |
Total | | | | | | | 5,940,019 | |
Electrical Equipment 0.5% | | | | | | | | |
Cooper Industries PLC | | | 45,643 | | | | 2,794,264 | |
Emerson Electric Co. | | | 212,406 | | | | 10,686,146 | |
Rockwell Automation, Inc. | | | 40,971 | | | | 3,276,861 | |
Roper Industries, Inc. | | | 27,852 | | | | 2,549,015 | |
| | | | | | | | |
Total | | | | | | | 19,306,286 | |
Industrial Conglomerates 2.5% | | | | | | | | |
3M Co. | | | 202,329 | | | | 17,724,020 | |
Danaher Corp. | | | 164,459 | | | | 8,688,369 | |
General Electric Co. | | | 3,047,839 | | | | 58,061,333 | |
Tyco International Ltd. | | | 133,371 | | | | 6,911,285 | |
| | | | | | | | |
Total | | | | | | | 91,385,007 | |
Machinery 2.2% | | | | | | | | |
Caterpillar, Inc. | | | 186,675 | | | | 21,320,152 | |
Cummins, Inc. | | | 55,675 | | | | 6,712,735 | |
Deere & Co. | | | 119,497 | | | | 9,909,886 | |
Dover Corp. | | | 53,517 | | | | 3,426,158 | |
Eaton Corp. | | | 96,481 | | | | 5,035,344 | |
Flowserve Corp. | | | 16,039 | | | | 1,901,744 | |
Illinois Tool Works, Inc. | | | 139,495 | | | | 7,768,477 | |
Ingersoll-Rand PLC | | | 90,123 | | | | 3,594,105 | |
Joy Global, Inc. | | | 30,341 | | | | 2,638,453 | |
The Accompanying Notes to Financial Statements are an integral part of this statement.
9
Columbia Large Cap Index Fund
February 29, 2012
| | | | | | | | |
| Issuer | | Shares | | | Value | |
Common Stocks (continued) | |
Industrials (cont.) | | | | | | | | |
Machinery (cont.) | | | | | | | | |
PACCAR, Inc. | | | 103,415 | | | | $4,758,124 | |
Pall Corp. | | | 33,242 | | | | 2,109,205 | |
Parker Hannifin Corp. | | | 43,616 | | | | 3,917,153 | |
Snap-On, Inc. | | | 16,795 | | | | 1,026,678 | |
Stanley Black & Decker, Inc. | | | 48,761 | | | | 3,744,845 | |
Xylem, Inc. | | | 53,284 | | | | 1,384,318 | |
| | | | | | | | |
Total | | | | | | | 79,247,377 | |
Professional Services 0.1% | | | | | | | | |
Dun & Bradstreet Corp. (The) | | | 14,033 | | | | 1,159,828 | |
Equifax, Inc. | | | 34,955 | | | | 1,469,508 | |
Robert Half International, Inc. | | | 41,272 | | | | 1,173,363 | |
| | | | | | | | |
Total | | | | | | | 3,802,699 | |
Road & Rail 0.8% | | | | | | | | |
CSX Corp. | | | 303,115 | | | | 6,368,446 | |
Norfolk Southern Corp. | | | 97,032 | | | | 6,685,505 | |
Ryder System, Inc. | | | 14,759 | | | | 785,622 | |
Union Pacific Corp. | | | 139,461 | | | | 15,375,575 | |
| | | | | | | | |
Total | | | | | | | 29,215,148 | |
Trading Companies & Distributors 0.2% | | | | | | | | |
Fastenal Co.(b) | | | 85,223 | | | | 4,489,548 | |
WW Grainger, Inc. | | | 17,518 | | | | 3,639,014 | |
| | | | | | | | |
Total | | | | | | | 8,128,562 | |
Total Industrials | | | | | | | 384,373,865 | |
Information Technology 19.9% | | | | | | | | |
Communications Equipment 2.1% | | | | | | | | |
Cisco Systems, Inc. | | | 1,551,977 | | | | 30,853,303 | |
F5 Networks, Inc.(a) | | | 22,947 | | | | 2,867,457 | |
Harris Corp. | | | 33,432 | | | | 1,458,638 | |
JDS Uniphase Corp.(a) | | | 66,149 | | | | 862,583 | |
Juniper Networks, Inc.(a) | | | 151,855 | | | | 3,456,220 | |
Motorola Mobility Holdings, Inc.(a) | | | 76,096 | | | | 3,021,011 | |
Motorola Solutions, Inc. | | | 82,703 | | | | 4,118,609 | |
QUALCOMM, Inc. | | | 485,272 | | | | 30,174,213 | |
| | | | | | | | |
Total | | | | | | | 76,812,034 | |
Computers & Peripherals 5.4% | | | | | | | | |
Apple, Inc.(a) | | | 268,314 | | | | 145,544,246 | |
Dell, Inc.(a) | | | 440,844 | | | | 7,626,601 | |
EMC Corp.(a) | | | 588,922 | | | | 16,307,250 | |
Hewlett-Packard Co. | | | 573,625 | | | | 14,518,449 | |
Lexmark International, Inc., Class A | | | 20,728 | | | | 764,449 | |
NetApp, Inc.(a) | | | 103,527 | | | | 4,451,661 | |
SanDisk Corp.(a) | | | 69,372 | | | | 3,431,139 | |
Western Digital Corp.(a) | | | 67,494 | | | | 2,649,139 | |
| | | | | | | | |
Total | | | | | | | 195,292,934 | |
Electronic Equipment, Instruments & Components 0.5% | | | | | | | | |
Amphenol Corp., Class A | | | 47,848 | | | | 2,677,574 | |
Corning, Inc. | | | 453,705 | | | | 5,916,313 | |
FLIR Systems, Inc. | | | 45,034 | | | | 1,178,540 | |
Jabil Circuit, Inc. | | | 52,891 | | | | 1,366,174 | |
Molex, Inc. | | | 39,586 | | | | 1,072,781 | |
TE Connectivity Ltd. | | | 122,536 | | | | 4,478,691 | |
| | | | | | | | |
Total | | | | | | | 16,690,073 | |
| | | | | | | | |
| Issuer | | Shares | | | Value | |
Common Stocks (continued) | |
Information Technology (cont.) | | | | | | | | |
Internet Software & Services 1.8% | | | | | | | | |
Akamai Technologies, Inc.(a) | | | 51,801 | | | | $1,864,836 | |
eBay, Inc.(a) | | | 331,689 | | | | 11,854,565 | |
Google, Inc., Class A(a) | | | 72,933 | | | | 45,090,827 | |
VeriSign, Inc. | | | 45,922 | | | | 1,696,818 | |
Yahoo!, Inc.(a) | | | 358,066 | | | | 5,310,119 | |
| | | | | | | | |
Total | | | | | | | 65,817,165 | |
IT Services 3.8% | | | | | | | | |
Accenture PLC, Class A | | | 185,027 | | | | 11,016,508 | |
Automatic Data Processing, Inc. | | | 141,084 | | | | 7,663,683 | |
Cognizant Technology Solutions Corp., Class A(a) | | | 87,219 | | | | 6,188,188 | |
Computer Sciences Corp. | | | 44,765 | | | | 1,421,736 | |
Fidelity National Information Services, Inc. | | | 70,029 | | | | 2,222,020 | |
Fiserv, Inc.(a) | | | 40,665 | | | | 2,696,089 | |
International Business Machines Corp. | | | 340,259 | | | | 66,939,153 | |
Mastercard, Inc., Class A | | | 30,778 | | | | 12,926,760 | |
Paychex, Inc. | | | 93,109 | | | | 2,914,312 | |
SAIC, Inc.(a) | | | 79,739 | | | | 974,411 | |
Teradata Corp.(a) | | | 48,327 | | | | 3,216,162 | |
Total System Services, Inc. | | | 46,800 | | | | 1,023,984 | |
Visa, Inc., Class A | | | 146,823 | | | | 17,085,793 | |
Western Union Co. (The) | | | 178,741 | | | | 3,122,605 | |
| | | | | | | | |
Total | | | | | | | 139,411,404 | |
Office Electronics 0.1% | | | | | | | | |
Xerox Corp. | | | 400,433 | | | | 3,295,564 | |
Semiconductors & Semiconductor Equipment 2.4% | | | | | | | | |
Advanced Micro Devices, Inc.(a) | | | 169,006 | | | | 1,242,194 | |
Altera Corp. | | | 92,631 | | | | 3,561,662 | |
Analog Devices, Inc. | | | 86,019 | | | | 3,372,805 | |
Applied Materials, Inc. | | | 376,929 | | | | 4,613,611 | |
Broadcom Corp., Class A(a) | | | 140,045 | | | | 5,202,672 | |
First Solar, Inc.(a)(b) | | | 16,966 | | | | 548,002 | |
Intel Corp. | | | 1,470,027 | | | | 39,514,326 | |
KLA-Tencor Corp. | | | 48,115 | | | | 2,328,766 | |
Linear Technology Corp. | | | 65,755 | | | | 2,201,477 | |
LSI Corp.(a) | | | 162,676 | | | | 1,399,014 | |
Microchip Technology, Inc.(b) | | | 55,178 | | | | 1,990,270 | |
Micron Technology, Inc.(a) | | | 285,106 | | | | 2,437,656 | |
Novellus Systems, Inc.(a) | | | 19,224 | | | | 893,531 | |
NVIDIA Corp.(a) | | | 176,292 | | | | 2,670,824 | |
Teradyne, Inc.(a) | | | 53,136 | | | | 872,493 | |
Texas Instruments, Inc. | | | 329,876 | | | | 11,001,365 | |
Xilinx, Inc. | | | 75,771 | | | | 2,798,223 | |
| | | | | | | | |
Total | | | | | | | 86,648,891 | |
Software 3.8% | | | | | | | | |
Adobe Systems, Inc.(a) | | | 141,718 | | | | 4,661,105 | |
Autodesk, Inc.(a) | | | 65,476 | | | | 2,478,267 | |
BMC Software, Inc.(a) | | | 49,135 | | | | 1,839,614 | |
CA, Inc. | | | 106,829 | | | | 2,887,588 | |
Citrix Systems, Inc.(a) | | | 53,841 | | | | 4,024,076 | |
Electronic Arts, Inc.(a) | | | 95,680 | | | | 1,562,454 | |
Intuit, Inc. | | | 85,814 | | | | 4,963,482 | |
Microsoft Corp. | | | 2,161,403 | | | | 68,602,931 | |
Oracle Corp. | | | 1,135,948 | | | | 33,249,198 | |
Red Hat, Inc.(a) | | | 55,671 | | | | 2,753,488 | |
Salesforce.com, Inc.(a) | | | 39,262 | | | | 5,620,748 | |
The Accompanying Notes to Financial Statements are an integral part of this statement.
10
Columbia Large Cap Index Fund
February 29, 2012
| | | | | | | | |
| Issuer | | Shares | | | Value | |
Common Stocks (continued) | |
Information Technology (cont.) | | | | | | | | |
Software (cont.) | | | | | | | | |
Symantec Corp.(a) | | | 212,814 | | | | $3,796,602 | |
| | | | | | | | |
Total | | | | | | | 136,439,553 | |
Total Information Technology | | | | | | | 720,407,618 | |
Materials 3.5% | | | | | | | | |
Chemicals 2.3% | | | | | | | | |
Air Products & Chemicals, Inc. | | | 60,760 | | | | 5,482,983 | |
Airgas, Inc. | | | 19,725 | | | | 1,623,959 | |
CF Industries Holdings, Inc. | | | 18,877 | | | | 3,511,122 | |
Dow Chemical Co. (The) | | | 341,181 | | | | 11,432,975 | |
Eastman Chemical Co. | | | 39,718 | | | | 2,149,935 | |
Ecolab, Inc. | | | 86,650 | | | | 5,199,000 | |
EI du Pont de Nemours & Co. | | | 266,729 | | | | 13,563,170 | |
FMC Corp. | | | 20,331 | | | | 2,012,159 | |
International Flavors & Fragrances, Inc. | | | 23,355 | | | | 1,331,936 | |
Monsanto Co. | | | 154,569 | | | | 11,960,549 | |
Mosaic Co. (The) | | | 85,956 | | | | 4,963,959 | |
PPG Industries, Inc. | | | 44,581 | | | | 4,068,016 | |
Praxair, Inc. | | | 86,539 | | | | 9,432,751 | |
Sherwin-Williams Co. (The) | | | 24,863 | | | | 2,564,619 | |
Sigma-Aldrich Corp. | | | 34,770 | | | | 2,496,138 | |
| | | | | | | | |
Total | | | | | | | 81,793,271 | |
Construction Materials —% | | | | | | | | |
Vulcan Materials Co. | | | 37,309 | | | | 1,662,489 | |
Containers & Packaging 0.1% | | | | | | | | |
Ball Corp. | | | 46,954 | | | | 1,881,916 | |
Bemis Co., Inc. | | | 29,729 | | | | 932,599 | |
Owens-Illinois, Inc.(a) | | | 47,416 | | | | 1,133,242 | |
Sealed Air Corp. | | | 55,465 | | | | 1,088,778 | |
| | | | | | | | |
Total | | | | | | | 5,036,535 | |
Metals & Mining 0.9% | | | | | | | | |
Alcoa, Inc. | | | 307,258 | | | | 3,124,814 | |
Allegheny Technologies, Inc. | | | 30,705 | | | | 1,347,028 | |
Cliffs Natural Resources, Inc. | | | 41,287 | | | | 2,620,899 | |
Freeport-McMoRan Copper & Gold, Inc. | | | 273,656 | | | | 11,646,799 | |
Newmont Mining Corp. | | | 142,850 | | | | 8,485,290 | |
Nucor Corp. | | | 91,430 | | | | 3,979,948 | |
Titanium Metals Corp. | | | 23,769 | | | | 348,453 | |
United States Steel Corp. | | | 41,571 | | | | 1,131,563 | |
| | | | | | | | |
Total | | | | | | | 32,684,794 | |
Paper & Forest Products 0.2% | | | | | | | | |
International Paper Co. | | | 126,180 | | | | 4,435,227 | |
MeadWestvaco Corp. | | | 49,292 | | | | 1,492,562 | |
| | | | | | | | |
Total | | | | | | | 5,927,789 | |
Total Materials | | | | | | | 127,104,878 | |
Telecommunication Services 2.7% | | | | | | | | |
Diversified Telecommunication Services 2.6% | | | | | | | | |
AT&T, Inc. | | | 1,710,798 | | | | 52,333,311 | |
CenturyLink, Inc. | | | 178,299 | | | | 7,176,535 | |
Frontier Communications Corp.(b) | | | 287,287 | | | | 1,318,647 | |
Verizon Communications, Inc. | | | 817,318 | | | | 31,147,989 | |
Windstream Corp. | | | 168,250 | | | | 2,032,460 | |
| | | | | | | | |
Total | | | | | | | 94,008,942 | |
| | | | | | | | |
| Issuer | | Shares | | | Value | |
Common Stocks (continued) | |
Telecommunication Services (cont.) | | | | | | | | |
Wireless Telecommunication Services 0.1% | | | | | | | | |
MetroPCS Communications, Inc.(a) | | | 84,712 | | | | $872,534 | |
Sprint Nextel Corp.(a) | | | 864,873 | | | | 2,136,236 | |
| | | | | | | | |
Total | | | | | | | 3,008,770 | |
Total Telecommunication Services | | | | | | | 97,017,712 | |
Utilities 3.4% | | | | | | | | |
Electric Utilities 1.8% | | | | | | | | |
American Electric Power Co., Inc. | | | 139,414 | | | | 5,243,361 | |
Duke Energy Corp. | | | 384,751 | | | | 8,048,991 | |
Edison International | | | 94,060 | | | | 3,938,292 | |
Entergy Corp. | | | 50,844 | | | | 3,387,736 | |
Exelon Corp. | | | 191,408 | | | | 7,478,311 | |
FirstEnergy Corp. | | | 120,736 | | | | 5,347,397 | |
NextEra Energy, Inc. | | | 121,983 | | | | 7,259,208 | |
Northeast Utilities | | | 51,108 | | | | 1,834,777 | |
Pepco Holdings, Inc. | | | 65,521 | | | | 1,273,728 | |
Pinnacle West Capital Corp. | | | 31,520 | | | | 1,482,386 | |
PPL Corp. | | | 166,951 | | | | 4,766,451 | |
Progress Energy, Inc. | | | 85,166 | | | | 4,520,611 | |
Southern Co. (The) | | | 248,833 | | | | 10,995,930 | |
| | | | | | | | |
Total | | | | | | | 65,577,179 | |
Gas Utilities 0.1% | | | | | | | | |
AGL Resources, Inc. | | | 33,699 | | | | 1,343,579 | |
Oneok, Inc. | | | 29,732 | | | | 2,457,053 | |
| | | | | | | | |
Total | | | | | | | 3,800,632 | |
Independent Power Producers & Energy Traders 0.2% | | | | | | | | |
AES Corp. (The)(a) | | | 186,132 | | | | 2,523,950 | |
Constellation Energy Group, Inc. | | | 58,190 | | | | 2,109,969 | |
NRG Energy, Inc.(a) | | | 66,390 | | | | 1,135,269 | |
| | | | | | | | |
Total | | | | | | | 5,769,188 | |
Multi-Utilities 1.3% | | | | | | | | |
Ameren Corp. | | | 69,933 | | | | 2,242,751 | |
CenterPoint Energy, Inc. | | | 122,964 | | | | 2,396,568 | |
CMS Energy Corp. | | | 72,749 | | | | 1,557,556 | |
Consolidated Edison, Inc. | | | 84,560 | | | | 4,912,936 | |
Dominion Resources, Inc. | | | 164,443 | | | | 8,299,438 | |
DTE Energy Co. | | | 48,862 | | | | 2,638,060 | |
Integrys Energy Group, Inc. | | | 22,493 | | | | 1,170,311 | |
NiSource, Inc. | | | 81,155 | | | | 1,947,720 | |
PG&E Corp. | | | 117,176 | | | | 4,883,896 | |
Public Service Enterprise Group, Inc. | | | 146,051 | | | | 4,495,450 | |
SCANA Corp. | | | 33,312 | | | | 1,499,040 | |
Sempra Energy | | | 69,188 | | | | 4,098,697 | |
TECO Energy, Inc. | | | 62,291 | | | | 1,118,124 | |
Wisconsin Energy Corp. | | | 66,766 | | | | 2,275,385 | |
Xcel Energy, Inc. | | | 140,004 | | | | 3,708,706 | |
| | | | | | | | |
Total | | | | | | | 47,244,638 | |
Total Utilities | | | | | | | 122,391,637 | |
Total Common Stocks | | | | | | | | |
(Cost: $2,667,822,550) | | | | | | | $3,569,887,260 | |
| |
Money Market Funds 1.0% | | | | | | | | |
Columbia Short-Term Cash Fund, 0.166%(e)(f) | | | 36,309,837 | | | | $36,309,837 | |
Total Money Market Funds | | | | | | | | |
(Cost: $36,309,837) | | | | | | | $36,309,837 | |
The Accompanying Notes to Financial Statements are an integral part of this statement.
11
Columbia Large Cap Index Fund
February 29, 2012
| | | | | | | | | | | | |
| Issuer | | Effective
Yield | | | Par/ Principal | | | Value | |
Investments of Cash Collateral Received for Securities on Loan 0.3% | |
Repurchase Agreements 0.3% | |
Credit Suisse Securities (USA) LLC
dated 02/29/12, matures 03/01/12,
repurchase price $5,830,086(g) | |
| | | 0.160 | % | | | $5,830,060 | | | | $5,830,060 | |
Natixis Financial Products, Inc.
dated 02/29/12, matures 03/01/12,
repurchase price $2,000,012(g) | |
| | | 0.220 | % | | | 2,000,000 | | | | 2,000,000 | |
Pershing LLC
dated 02/29/12, matures 03/01/12,
repurchase price $2,000,016(g) | |
| | | 0.290 | % | | | 2,000,000 | | | | 2,000,000 | |
| | | | | | | | | | | | |
Total | | | | | | | | | | | $9,830,060 | |
| | | | | | | | |
| Issuer | | Effective
Yield | | | | Value | |
Investments of Cash Collateral Received for Securities on Loan 0.3% (continued) | |
Total Investments of Cash Collateral Received for Securities on Loan | |
(Cost: $9,830,060) | | | $9,830,060 | |
Total Investments | | | | |
(Cost: $2,713,962,447) | | | | | $3,616,027,157 | |
Other Assets & Liabilities, Net | | | 5,701,694 | |
Net Assets | | | | | $3,621,728,851 | |
Investment in Derivatives
Futures Contracts Outstanding at February 29, 2012
| | | | | | | | | | | | | | | | | | | | |
| Contract Description | | Number of
Contracts
Long (Short) | | | Notional
Market Value | | | Expiration
Date | | | Unrealized
Appreciation | | | Unrealized
Depreciation | |
S&P 500 Index | | | 147 | | | | 50,141,700 | | | | March 2012 | | | | $1,808,277 | | | | $— | |
|
Notes to Portfolio of Investments |
| (b) | At February 29, 2012, security was partially or fully on loan. |
| (c) | At February 29, 2012, investments in securities included securities valued at $8,667,733 that were partially pledged as collateral to cover initial margin deposits on open stock index futures contracts. |
| (d) | Identifies issues considered to be illiquid as to their marketability. The aggregate value of such securities at February 29, 2012 was $49, representing less than 0.01% of net assets. Information concerning such security holdings at February 29, 2012 was as follows: |
| | | | | | | | |
| Security Description | | Acquisition
Dates | | | Cost | |
Five Star Quality Care, Inc. | | | 01/02/02 | | | | $2 | |
Kinder Morgan Management LLC | | | 09/26/02 - 05/20/08 | | | | 14 | |
| (e) | Investments in affiliates during the year ended February 29, 2012: |
| | | | | | | | | | | | | | | | | | | | | | | | | | | | |
Issuer | | Beginning
Cost | | | Purchase
Cost | | | Sales Cost/
Proceeds
from Sales | | | Realized
Gain/Loss | | | Ending Cost | | | Dividends
or Interest
Income | | | Value | |
Ameriprise Financial, Inc. | | | $1,808,983 | | | | $190,082 | | | | $(446,301 | ) | | | $192,017 | | | | $1,744,781 | | | | $65,176 | | | | $3,642,132 | |
Columbia Short-Term Cash Fund | | | — | | | | 369,766,989 | | | | (333,457,152 | ) | | | — | | | | 36,309,837 | | | | 66,430 | | | | 36,309,837 | |
Total | | | $1,808,983 | | | | $369,957,071 | | | | $(333,903,453 | ) | | | $192,017 | | | | $38,054,618 | | | | $131,606 | | | | $39,951,969 | |
| (f) | The rate shown is the seven-day current annualized yield at February 29, 2012. |
| (g) | The table below represents securities received as collateral for repurchase agreements. This collateral is deposited with the Fund’s custodian and, pursuant to the terms of the repurchase agreement, must have an aggregate market value greater than or equal to the repurchase price plus accrued |
The Accompanying Notes to Financial Statements are an integral part of this statement.
12
Columbia Large Cap Index Fund
February 29, 2012
|
Notes to Portfolio of Investments (continued) |
| | interest at all times. The value of securities and/or cash held as collateral for repurchase agreements is monitored on a daily basis to ensure the proper level of collateral. |
Credit Suisse Securities (USA) LLC (0.160%)
| | | | |
| Security Description | | Value | |
Ginnie Mae I Pool | | | $4,173,757 | |
Ginnie Mae II Pool | | | 1,772,918 | |
Total Market Value of Collateral Securities | | | $5,946,675 | |
| Natixis Financial Products, Inc. (0.220%) | | | | |
| Security Description | | Value | |
Fannie Mae Pool | | | $100,614 | |
Fannie Mae REMICS | | | 749,335 | |
Freddie Mac Gold Pool | | | 92,120 | |
Freddie Mac REMICS | | | 441,844 | |
Government National Mortgage Association | | | 131,890 | |
United States Treasury Note/Bond | | | 524,210 | |
Total Market Value of Collateral Securities | | | $2,040,013 | |
| |
| Pershing LLC (0.290%) | | | | |
| Security Description | | Value | |
Fannie Mae Pool | | | $326,507 | |
Fannie Mae REMICS | | | 275,343 | |
Fannie Mae-Aces | | | 2,775 | |
Federal Farm Credit Bank | | | 24,674 | |
Federal Home Loan Banks | | | 26,538 | |
Federal Home Loan Mortgage Corp | | | 62,556 | |
Federal National Mortgage Association | | | 77,156 | |
Freddie Mac Gold Pool | | | 132,490 | |
Freddie Mac Non Gold Pool | | | 37,004 | |
Freddie Mac Reference REMIC | | | 9 | |
Freddie Mac REMICS | | | 256,456 | |
Ginnie Mae I Pool | | | 334,671 | |
Ginnie Mae II Pool | | | 298,381 | |
Government National Mortgage Association | | | 107,067 | |
United States Treasury Note/Bond | | | 73,837 | |
United States Treasury Strip Coupon | | | 4,536 | |
Total Market Value of Collateral Securities | | | $2,040,000 | |
Generally accepted accounting principles (GAAP) require disclosure regarding the inputs and valuation techniques used to measure fair value and any changes in valuation inputs or techniques. In addition, investments shall be disclosed by major category.
The Fund categorizes its fair value measurements according to a three-level hierarchy that maximizes the use of observable inputs and minimizes the use of unobservable inputs by prioritizing that the most observable input be used when available. Observable inputs are those that market participants would use in pricing an investment based on market data obtained from sources independent of the reporting entity. Unobservable inputs are those that reflect the Fund’s assumptions about the information market participants would use in pricing an investment. An investment’s level within the fair value hierarchy is based on the lowest level of any input that is deemed significant to the asset or liability’s fair value measurement. The input levels are not necessarily an indication of the risk or liquidity associated with investments at that level. For example, certain U.S. government securities are generally high quality and liquid, however, they are reflected as Level 2 because the inputs used to determine fair value may not always be quoted prices in an active market.
Fair value inputs are summarized in the three broad levels listed below:
| | Ÿ | | Level 1 – Valuations based on quoted prices for investments in active markets that the Fund has the ability to access at the measurement date (including NAV for open-end mutual funds). Valuation adjustments are not applied to Level 1 investments. |
| | Ÿ | | Level 2 – Valuations based on other significant observable inputs (including quoted prices for similar securities, interest rates, prepayment speeds, credit risks, etc.). |
The Accompanying Notes to Financial Statements are an integral part of this statement.
13
Columbia Large Cap Index Fund
February 29, 2012
|
Fair Value Measurements (continued) |
| | Ÿ | | Level 3 – Valuations based on significant unobservable inputs (including the Fund’s own assumptions and judgment in determining the fair value of investments). |
Inputs that are used in determining fair value of an investment may include price information, credit data, volatility statistics, and other factors. These inputs can be either observable or unobservable. The availability of observable inputs can vary between investments, and is affected by various factors such as the type of investment, and the volume and level of activity for that investment or similar investments in the marketplace. The inputs will be considered by the Investment Manager, along with any other relevant factors in the calculation of an investment’s fair value. The Fund uses prices and inputs that are current as of the measurement date, which may include periods of market dislocations. During these periods, the availability of prices and inputs may be reduced for many investments. This condition could cause an investment to be reclassified between the various levels within the hierarchy.
Investments falling into the Level 3 category are primarily supported by quoted prices from brokers and dealers participating in the market for those investments. However, these may be classified as Level 3 investments due to lack of market transparency and corroboration to support these quoted prices. Additionally, valuation models may be used as the pricing source for any remaining investments classified as Level 3. These models rely on one or more significant unobservable inputs and/or significant assumptions by the Investment Manager. Inputs used in valuations may include, but are not limited to, financial statement analysis, capital account balances, discount rates and estimated cash flows, and comparable company data.
The following table is a summary of the inputs used to value the Fund’s investments as of February 29, 2012:
| | | | | | | | | | | | | | | | |
| | | Fair value at February 29, 2012 | |
| Description(a) | | Level 1
quoted prices
in active
markets for
identical assets | | | Level 2
other
significant
observable
inputs(b) | | | Level 3
significant
unobservable
inputs | | | Total | |
Equity Securities | | | | | | | | | | | | | | | | |
Common Stocks | | | | | | | | | | | | | | | | |
Consumer Discretionary | | | $387,776,054 | | | | $— | | | | $— | | | | $387,776,054 | |
Consumer Staples | | | 385,571,334 | | | | — | | | | — | | | | 385,571,334 | |
Energy | | | 431,227,691 | | | | 48 | | | | — | | | | 431,227,739 | |
Financials | | | 509,009,246 | | | | — | | | | — | | | | 509,009,246 | |
Health Care | | | 405,007,176 | | | | 1 | | | | — | | | | 405,007,177 | |
Industrials | | | 384,373,865 | | | | — | | | | — | | | | 384,373,865 | |
Information Technology | | | 720,407,618 | | | | — | | | | — | | | | 720,407,618 | |
Materials | | | 127,104,878 | | | | — | | | | — | | | | 127,104,878 | |
Telecommunication Services | | | 97,017,712 | | | | — | | | | — | | | | 97,017,712 | |
Utilities | | | 122,391,637 | | | | — | | | | — | | | | 122,391,637 | |
Total Equity Securities | | | 3,569,887,211 | | | | 49 | | | | — | | | | 3,569,887,260 | |
Other | | | | | | | | | | | | | | | | |
Money Market Funds | | | 36,309,837 | | | | — | | | | — | | | | 36,309,837 | |
Investments of Cash Collateral Received for Securities on Loan | | | — | | | | 9,830,060 | | | | — | | | | 9,830,060 | |
Total Other | | | 36,309,837 | | | | 9,830,060 | | | | — | | | | 46,139,897 | |
Investments in Securities | | | 3,606,197,048 | | | | 9,830,109 | | | | — | | | | 3,616,027,157 | |
Derivatives(c) | | | | | | | | | | | | | | | | |
Assets | | | | | | | | | | | | | | | | |
Futures Contracts | | | 1,808,277 | | | | — | | | | — | | | | 1,808,277 | |
Total | | | $3,608,005,325 | | | | $9,830,109 | | | | $— | | | | $3,617,835,434 | |
The Fund’s assets assigned to the Level 2 input category are generally valued using the market approach, in which a security’s value is determined through reference to prices and information from market transactions for similar or identical assets.
| (a) | See the Portfolio of Investments for all investment classifications not indicated in the table. |
| (b) | There were no significant transfers between Levels 1 and 2 during the period. |
| (c) | Derivative instruments are valued at unrealized appreciation (depreciation). |
The Accompanying Notes to Financial Statements are an integral part of this statement.
14
Statement of Assets and Liabilities – Columbia Large Cap Index Fund
February 29, 2012
| | | | |
| Assets | | | | |
Investments, at value* | | | | |
Unaffiliated issuers (identified cost $2,666,077,769) | | $ | 3,566,245,128 | |
Affiliated issuers (identified cost $38,054,618) | | | 39,951,969 | |
Investment of cash collateral received for securities on loan | | | | |
Repurchase agreements (identified cost $9,830,060) | | | 9,830,060 | |
Total investments (identified cost $2,713,962,447) | | | 3,616,027,157 | |
Receivable for: | | | | |
Investments sold | | | 18,105 | |
Capital shares sold | | | 10,649,855 | |
Dividends | | | 8,599,135 | |
Interest | | | 22,442 | |
Reclaims | | | 6,448 | |
Expense reimbursement due from Investment Manager | | | 4,147 | |
Total assets | | | 3,635,327,289 | |
| |
| Liabilities | | | | |
Disbursements in excess of cash | | | 140,524 | |
Due upon return of securities on loan | | | 9,830,060 | |
Payable for: | | | | |
Investments purchased | | | 1,371,260 | |
Capital shares purchased | | | 2,049,637 | |
Variation margin on futures contracts | | | 92,750 | |
Investment management fees | | | 9,922 | |
Distribution and service fees | | | 3,267 | |
Administration fees | | | 9,922 | |
Other expenses | | | 91,016 | |
Other liabilities | | | 80 | |
Total liabilities | | | 13,598,438 | |
Net assets applicable to outstanding capital stock | | $ | 3,621,728,851 | |
The Accompanying Notes to Financial Statements are an integral part of this statement.
15
Statement of Assets and Liabilities (continued) – Columbia Large Cap Index Fund
February 29, 2012
| | | | |
| Represented by | | | | |
Paid-in capital | | $ | 2,864,621,517 | |
Undistributed net investment income | | | 8,786,359 | |
Accumulated net realized loss | | | (155,552,012 | ) |
Unrealized appreciation (depreciation) on: | | | | |
Investments | | | 902,064,710 | |
Futures contracts | | | 1,808,277 | |
Total — representing net assets applicable to outstanding capital stock | | $ | 3,621,728,851 | |
*Value of securities on loan | | $ | 13,168,748 | |
Net assets applicable to outstanding shares | | | | |
Class A | | $ | 472,380,843 | |
Class B | | $ | 1,304,635 | |
Class I | | $ | 2,724 | |
Class Z | | $ | 3,148,040,649 | |
Shares outstanding | | | | |
Class A | | | 17,923,860 | |
Class B | | | 49,345 | |
Class I | | | 103 | |
Class Z | | | 118,996,488 | |
Net asset value per share | | | | |
Class A | | $ | 26.35 | |
Class B | | $ | 26.44 | |
Class I | | $ | 26.45 | |
Class Z | | $ | 26.45 | |
The Accompanying Notes to Financial Statements are an integral part of this statement.
16
Statement of Operations – Columbia Large Cap Index Fund
Year Ended February 29, 2012
| | | | |
| Net investment income | | | | |
Income: | | | | |
Dividends | | $ | 70,665,024 | |
Interest | | | 1,411 | |
Dividends from affiliates | | | 131,606 | |
Income from securities lending – net | | | 229,988 | |
Foreign taxes withheld | | | (223 | ) |
Total income | | | 71,027,806 | |
Expenses: | | | | |
Investment management fees | | | 3,361,680 | |
Distribution fees | | | | |
Class B | | | 20,222 | |
Service fees | | | | |
Class B | | | 6,741 | |
Distribution and service fees – Class A | | | 1,034,785 | |
Administration fees | | | 3,361,679 | |
Compensation of board members | | | 63,360 | |
Other | | | 26,116 | |
Total expenses | | | 7,874,583 | |
Fees waived or expenses reimbursed by Investment Manager and its affiliates | | | (1,275,467 | ) |
Expense reductions | | | (14,557 | ) |
Total net expenses | | | 6,584,559 | |
Net investment income | | | 64,443,247 | |
| |
| Realized and unrealized gain (loss) — net | | | | |
Net realized gain (loss) on: | | | | |
Investments — unaffiliated issuers | | | 60,982,651 | |
Investments — affiliated issuers | | | 192,017 | |
Futures contracts | | | (796,408 | ) |
Net realized gain | | | 60,378,260 | |
Net change in unrealized appreciation (depreciation) on: | | | | |
Investments | | | 50,440,227 | |
Futures contracts | | | 1,495,179 | |
Net change in unrealized appreciation | | | 51,935,406 | |
Net realized and unrealized gain | | | 112,313,666 | |
Net increase in net assets resulting from operations | | $ | 176,756,913 | |
The Accompanying Notes to Financial Statements are an integral part of this statement.
17
Statement of Changes in Net Assets – Columbia Large Cap Index Fund
| | | | | | | | |
| | | Year ended
February 29, 2012(a) | | | Year ended
February 28, 2011 | |
| | |
| Operations | | | | | | | | |
Net investment income | | $ | 64,443,247 | | | $ | 53,963,334 | |
Net realized gain | | | 60,378,260 | | | | 26,181,614 | |
Net change in unrealized appreciation | | | 51,935,406 | | | | 537,090,418 | |
Net increase in net assets resulting from operations | | | 176,756,913 | | | | 617,235,366 | |
| | |
| Distributions to shareholders from: | | | | | | | | |
Net investment income | | | | | | | | |
Class A | | | (7,494,825 | ) | | | (5,104,698 | ) |
Class B | | | (22,739 | ) | | | (27,404 | ) |
Class I | | | (43 | ) | | | — | |
Class Z | | | (57,569,836 | ) | | | (46,637,026 | ) |
Total distributions to shareholders | | | (65,087,443 | ) | | | (51,769,128 | ) |
Increase in net assets from share transactions | | | 71,992,379 | | | | 187,980,533 | |
Total increase in net assets | | | 183,661,849 | | | | 753,446,771 | |
Net assets at beginning of year | | | 3,438,067,002 | | | | 2,684,620,231 | |
Net assets at end of year | | $ | 3,621,728,851 | | | $ | 3,438,067,002 | |
Undistributed net investment income | | $ | 8,786,359 | | | $ | 9,437,867 | |
| (a) | Class I shares are for the period from November 16, 2011 (commencement of operations) to February 29, 2012. |
The Accompanying Notes to Financial Statements are an integral part of this statement.
18
Statement of Changes in Net Assets (continued) – Columbia Large Cap Index Fund
| | | | | | | | | | | | | | | | |
| | | Year ended
February 29, 2012(a) | | | Year ended
February 28, 2011 | |
| | | Shares | | | Dollars ($) | | | Shares | | | Dollars ($) | |
| | | | |
| Capital stock activity | | | | | | | | | | | | | | | | |
Class A shares | | | | | | | | | | | | | | | | |
Subscriptions(b) | | | 6,905,904 | | | | 171,194,657 | | | | 6,146,842 | | | | 138,848,361 | |
Fund merger | | | 787,315 | | | | 17,981,794 | | | | — | | | | — | |
Distributions reinvested | | | 286,000 | | | | 6,919,883 | | | | 208,778 | | | | 4,905,111 | |
Redemptions | | | (5,024,385 | ) | | | (124,351,906 | ) | | | (3,973,822 | ) | | | (90,572,054 | ) |
Net increase | | | 2,954,834 | | | | 71,744,428 | | | | 2,381,798 | | | | 53,181,418 | |
Class B shares | | | | | | | | | | | | | | | | |
Subscriptions | | | 697 | | | | 16,731 | | | | 430 | | | | 10,306 | |
Distributions reinvested | | | 399 | | | | 9,714 | | | | 659 | | | | 15,333 | |
Redemptions(b) | | | (89,890 | ) | | | (2,230,876 | ) | | | (39,316 | ) | | | (888,886 | ) |
Net decrease | | | (88,794 | ) | | | (2,204,431 | ) | | | (38,227 | ) | | | (863,247 | ) |
Class I shares | | | | | | | | | | | | | | | | |
Subscriptions | | | 103 | | | | 2,500 | | | | — | | | | — | |
Net increase | | | 103 | | | | 2,500 | | | | — | | | | — | |
Class Z shares | | | | | | | | | | | | | | | | |
Subscriptions | | | 16,905,590 | | | | 420,417,150 | | | | 26,840,621 | | | | 617,637,630 | |
Fund merger | | | 4,433,356 | | | | 101,748,793 | | | | — | | | | — | |
Distributions reinvested | | | 1,929,052 | | | | 46,823,918 | | | | 1,574,843 | | | | 37,130,261 | |
Redemptions | | | (22,903,786 | ) | | | (566,539,979 | ) | | | (22,669,871 | ) | | | (519,105,529 | ) |
Net increase | | | 364,212 | | | | 2,449,882 | | | | 5,745,593 | | | | 135,662,362 | |
Total net increase | | | 3,230,355 | | | | 71,992,379 | | | | 8,089,164 | | | | 187,980,533 | |
| (a) | Class I shares are for the period from November 16, 2011 (commencement of operations) to February 29, 2012. |
| (b) | Includes conversions of Class B shares to Class A shares. |
The Accompanying Notes to Financial Statements are an integral part of this statement.
19
Financial Highlights – Columbia Large Cap Index Fund
The following tables are intended to help you understand the Fund’s financial performance. Certain information reflects financial results for a single share of a class held for the periods shown. Per share net investment income (loss) amounts are calculated based on average shares outstanding during the period. Total returns assume reinvestment of all dividends and distributions. Total returns do not reflect payment of sales charges, if any, and are not annualized for periods of less than one year.
| | | | | | | | | | | | | | | | | | | | |
| | | Year ended
Feb. 29, 2012 | | | Year ended Feb. 28, | | | Year ended
Feb. 29, 2008 | |
| | | | 2011 | | | 2010 | | | 2009 | | |
| Class A | | | | | | | | | | | | | | | |
| Per share data | | | | | | | | | | | | | | | | | | | | |
Net asset value, beginning of period | | | $25.62 | | | | $21.30 | | | | $14.14 | | | | $25.64 | | | | $27.08 | |
Income from investment operations: | | | | | | | | | | | | | | | | | | | | |
Net investment income | | | 0.42 | | | | 0.37 | | | | 0.34 | | | | 0.45 | | | | 0.47 | |
Net realized and unrealized gain (loss) | | | 0.74 | | | | 4.30 | | | | 7.15 | | | | (11.54 | ) | | | (1.49 | ) |
Total from investment operations | | | 1.16 | | | | 4.67 | | | | 7.49 | | | | (11.09 | ) | | | (1.02 | ) |
Less distributions to shareholders from: | | | | | | | | | | | | | | | | | | | | |
Net investment income | | | (0.43 | ) | | | (0.35 | ) | | | (0.33 | ) | | | (0.41 | ) | | | (0.42 | ) |
Total distributions to shareholders | | | (0.43 | ) | | | (0.35 | ) | | | (0.33 | ) | | | (0.41 | ) | | | (0.42 | ) |
Proceeds from regulatory settlement | | | — | | | | — | | | | 0.00 | (a) | | | — | | | | — | |
Net asset value, end of period | | | $26.35 | | | | $25.62 | | | | $21.30 | | | | $14.14 | | | | $25.64 | |
| Total return | | | 4.67% | | | | 22.09% | | | | 53.09% | | | | (43.51% | ) | | | (3.92% | ) |
| Ratios to average net assets(b) | | | | | | | | | | | | | | | | | | | | |
Expenses prior to fees waived or expenses reimbursed (including interest expense) | | | 0.45% | | | | 0.45% | | | | 0.45% | (c) | | | 0.45% | | | | 0.45% | |
Net expenses after fees waived or expenses reimbursed (including interest expense)(d) | | | 0.42% | (e) | | | 0.39% | | | | 0.39% | (c) | | | 0.39% | (e) | | | 0.39% | |
Expenses prior to fees waived or expenses reimbursed (excluding interest expense) | | | 0.45% | | | | 0.45% | | | | 0.45% | | | | 0.45% | | | | 0.45% | |
Net expenses after fees waived or expenses reimbursed (excluding interest expense)(d) | | | 0.42% | (e) | | | 0.39% | | | | 0.39% | | | | 0.39% | (e) | | | 0.39% | |
Net investment income | | | 1.72% | (e) | | | 1.64% | | | | 1.75% | | | | 2.09% | (e) | | | 1.67% | |
| Supplemental data | | | | | | | | | | | | | | | | | | | | |
Net assets, end of period (in thousands) | | | $472,381 | | | | $383,538 | | | | $268,091 | | | | $101,119 | | | | $138,795 | |
Portfolio turnover | | | 6% | | | | 2% | | | | 7% | | | | 5% | | | | 6% | |
Notes to Financial Highlights
| (a) | Rounds to less than $0.01. |
| (b) | In addition to the fees and expenses which the Fund bears directly, the Fund indirectly bears a pro rata share of the fees and expenses of the acquired funds in which it invests. Such indirect expenses are not included in the reported expense ratios. |
| (c) | Includes interest expense which rounds to less than 0.01%. |
| (d) | The Investment Manager and certain of its affiliates agreed to waive/reimburse certain fees and expenses, if applicable. |
| (e) | The benefits derived from expense reductions had an impact of less than 0.01%. |
The Accompanying Notes to Financial Statements are an integral part of this statement.
20
Financial Highlights (continued) – Columbia Large Cap Index Fund
| | | | | | | | | | | | | | | | | | | | |
| | | Year ended
Feb. 29, 2012 | | | Year ended Feb. 28, | | | Year ended
Feb. 29, 2008 | |
| | | | 2011 | | | 2010 | | | 2009 | | |
| Class B | | | | | | | | | | | | | | | |
| Per share data | | | | | | | | | | | | | | | | | | | | |
Net asset value, beginning of period | | | $25.70 | | | | $21.37 | | | | $14.20 | | | | $25.70 | | | | $27.14 | |
Income from investment operations: | | | | | | | | | | | | | | | | | | | | |
Net investment income | | | 0.22 | | | | 0.20 | | | | 0.19 | | | | 0.28 | | | | 0.24 | |
Net realized and unrealized gain (loss) | | | 0.76 | | | | 4.32 | | | | 7.18 | | | | (11.53 | ) | | | (1.48 | ) |
Total from investment operations | | | 0.98 | | | | 4.52 | | | | 7.37 | | | | (11.25 | ) | | | (1.24 | ) |
Less distributions to shareholders from: | | | | | | | | | | | | | | | | | | | | |
Net investment income | | | (0.24 | ) | | | (0.19 | ) | | | (0.20 | ) | | | (0.25 | ) | | | (0.20 | ) |
Total distributions to shareholders | | | (0.24 | ) | | | (0.19 | ) | | | (0.20 | ) | | | (0.25 | ) | | | (0.20 | ) |
Proceeds from regulatory settlement | | | — | | | | — | | | | 0.00 | (a) | | | — | | | | — | |
Net asset value, end of period | | | $26.44 | | | | $25.70 | | | | $21.37 | | | | $14.20 | | | | $25.70 | |
| Total return | | | 3.90% | | | | 21.22% | | | | 51.94% | | | | (43.94% | ) | | | (4.63% | ) |
| Ratios to average net assets(b) | | | | | | | | | | | | | | | | | | | | |
Expenses prior to fees waived or expenses reimbursed (including interest expense) | | | 1.20% | | | | 1.20% | | | | 1.20% | (c) | | | 1.20% | | | | 1.20% | |
Net expenses after fees waived or expenses reimbursed (including interest expense)(d) | | | 1.17% | (e) | | | 1.14% | | | | 1.14% | (c) | | | 1.14% | (e) | | | 1.14% | |
Expenses prior to fees waived or expenses reimbursed (excluding interest expense) | | | 1.20% | | | | 1.20% | | | | 1.20% | | | | 1.20% | | | | 1.20% | |
Net expenses after fees waived or expenses reimbursed (excluding interest expense)(d) | | | 1.17% | (e) | | | 1.14% | | | | 1.14% | | | | 1.14% | (e) | | | 1.14% | |
Net investment income | | | 0.90% | (e) | | | 0.87% | | | | 1.01% | | | | 1.28% | (e) | | | 0.86% | |
| Supplemental data | | | | | | | | | | | | | | | | | | | | |
Net assets, end of period (in thousands) | | | $1,305 | | | | $3,550 | | | | $3,769 | | | | $3,248 | | | | $7,836 | |
Portfolio turnover | | | 6% | | | | 2% | | | | 7% | | | | 5% | | | | 6% | |
Notes to Financial Highlights
| (a) | Rounds to less than $0.01. |
| (b) | In addition to the fees and expenses which the Fund bears directly, the Fund indirectly bears a pro rata share of the fees and expenses of the acquired funds in which it invests. Such indirect expenses are not included in the reported expense ratios. |
| (c) | Includes interest expense which rounds to less than 0.01%. |
| (d) | The Investment Manager and certain of its affiliates agreed to waive/reimburse certain fees and expenses, if applicable. |
| (e) | The benefits derived from expense reductions had an impact of less than 0.01%. |
The Accompanying Notes to Financial Statements are an integral part of this statement.
21
Financial Highlights (continued) – Columbia Large Cap Index Fund
| | | | |
| | | Year ended
Feb. 29, 2012(a) | |
| Class I | | | |
| Per share data | | | | |
Net asset value, beginning of period | | | $24.22 | |
Income from investment operations: | | | | |
Net investment income | | | 0.15 | |
Net realized and unrealized gain | | | 2.49 | |
Total from investment operations | | | 2.64 | |
Less distributions to shareholders from: | | | | |
Net investment income | | | (0.41 | ) |
Total distributions to shareholders | | | (0.41 | ) |
Net asset value, end of period | | | $26.45 | |
| Total return | | | 11.08% | |
| Ratios to average net assets(b) | | | | |
Expenses prior to fees waived or expenses reimbursed | | | 0.15% | (c) |
Net expenses after fees waived or expenses reimbursed(d) | | | 0.15% | (c) |
Net investment income | | | 2.06% | (c) |
| Supplemental data | | | | |
Net assets, end of period (in thousands) | | | $3 | |
Portfolio turnover | | | 6% | |
Notes to Financial Highlights
| (a) | For the period from November 16, 2011 (commencement of operations) to February 29, 2012. |
| (b) | In addition to the fees and expenses which the Fund bears directly, the Fund indirectly bears a pro rata share of the fees and expenses of the acquired funds in which it invests. Such indirect expenses are not included in the reported expense ratios. |
| (d) | The Investment Manager and certain of its affiliates agreed to waive/reimburse certain fees and expenses, if applicable. |
The Accompanying Notes to Financial Statements are an integral part of this statement.
22
Financial Highlights (continued) – Columbia Large Cap Index Fund
| | | | | | | | | | | | | | | | | | | | |
| | | Year ended
Feb. 29, 2012 | | | Year ended Feb. 28, | | | Year ended
Feb. 29, 2008 | |
| | | | 2011 | | | 2010 | | | 2009 | | |
| Class Z | | | | | | | | | | | | | | | |
| Per share data | | | | | | | | | | | | | | | | | | | | |
Net asset value, beginning of period | | | $25.72 | | | | $21.37 | | | | $14.18 | | | | $25.79 | | | | $27.29 | |
Income from investment operations: | | | | | | | | | | | | | | | | | | | | |
Net investment income | | | 0.48 | | | | 0.43 | | | | 0.38 | | | | 0.51 | | | | 0.53 | |
Net realized and unrealized gain (loss) | | | 0.74 | | | | 4.33 | | | | 7.19 | | | | (11.59 | ) | | | (1.49 | ) |
Total from investment operations | | | 1.22 | | | | 4.76 | | | | 7.57 | | | | (11.08 | ) | | | (0.96 | ) |
Less distributions to shareholders from: | | | | | | | | | | | | | | | | | | | | |
Net investment income | | | (0.49 | ) | | | (0.41 | ) | | | (0.38 | ) | | | (0.53 | ) | | | (0.54 | ) |
Total distributions to shareholders | | | (0.49 | ) | | | (0.41 | ) | | | (0.38 | ) | | | (0.53 | ) | | | (0.54 | ) |
Proceeds from regulatory settlement | | | — | | | | — | | | | 0.00 | (a) | | | — | | | | — | |
Net asset value, end of period | | | $26.45 | | | | $25.72 | | | | $21.37 | | | | $14.18 | | | | $25.79 | |
| Total return | | | 4.91% | | | | 22.44% | | | | 53.49% | | | | (43.37% | ) | | | (3.72% | ) |
| Ratios to average net assets(b) | | | | | | | | | | | | | | | | | | | | |
Expenses prior to fees waived or expenses reimbursed (including interest expense) | | | 0.20% | | | | 0.20% | | | | 0.20% | (c) | | | 0.20% | | | | 0.20% | |
Net expenses after fees waived or expenses reimbursed (including interest expense)(d) | | | 0.16% | (e) | | | 0.14% | | | | 0.14% | (c) | | | 0.14% | (e) | | | 0.14% | |
Expenses prior to fees waived or expenses reimbursed (excluding interest expense) | | | 0.20% | | | | 0.20% | | | | 0.20% | | | | 0.20% | | | | 0.20% | |
Net expenses after fees waived or expenses reimbursed (excluding interest expense)(d) | | | 0.16% | (e) | | | 0.14% | | | | 0.14% | | | | 0.14% | (e) | | | 0.14% | |
Net investment income | | | 1.95% | (e) | | | 1.88% | | | | 2.00% | | | | 2.31% | (e) | | | 1.87% | |
| Supplemental data | | | | | | | | | | | | | | | | | | | | |
Net assets, end of period (in thousands) | | | $3,148,041 | | | | $3,050,979 | | | | $2,412,760 | | | | $1,359,555 | | | | $2,358,122 | |
Portfolio turnover | | | 6% | | | | 2% | | | | 7% | | | | 5% | | | | 6% | |
Notes to Financial Highlights
| (a) | Rounds to less than $0.01. |
| (b) | In addition to the fees and expenses which the Fund bears directly, the Fund indirectly bears a pro rata share of the fees and expenses of the acquired funds in which it invests. Such indirect expenses are not included in the reported expense ratios. |
| (c) | Includes interest expense which rounds to less than 0.01%. |
| (d) | The Investment Manager and certain of its affiliates agreed to waive/reimburse certain fees and expenses, if applicable. |
| (e) | The benefits derived from expense reductions had an impact of less than 0.01%. |
The Accompanying Notes to Financial Statements are an integral part of this statement.
23
Notes to Financial Statements – Columbia Large Cap Index Fund
February 29, 2012
Note 1. Organization
Columbia Large Cap Index Fund (the Fund), a series of Columbia Funds Series Trust (the Trust), is a diversified fund. The Trust is registered under the Investment Company Act of 1940, as amended (the 1940 Act), as an open-end management investment company organized as a Delaware statutory trust.
Fund Shares
The Trust may issue an unlimited number of shares (without par value). The Fund offers Class A, Class B, Class I and Class Z shares. All share classes have identical voting, dividend and liquidation rights. Each share class has its own expense structure and sales charges, as applicable.
Class A shares have no sales charge.
Class B shares may be subject to a maximum Contingent Deferred Sales Charge (CDSC) of 5.00% based upon the holding period after purchase. Class B shares will generally convert to Class A shares eight years after purchase. The Fund no longer accepts investments by new or existing investors in the Fund’s Class B shares, except in connection with the reinvestment of any dividend and/or capital gain distributions in Class B shares of the Fund and exchanges by existing Class B shareholders of certain other funds within the Columbia Family of Funds.
Class I shares are not subject to sales charges and are only available to the Columbia Family of Funds. Class I shares commenced operations on November 16, 2011.
Class Z shares are not subject to sales charges, and are only available to certain investors, as described in the Fund’s prospectus.
Note 2. Summary of Significant Accounting Policies
Use of Estimates
The preparation of financial statements in accordance with U.S. generally accepted accounting principles (GAAP) requires management to make certain estimates and assumptions that affect the reported amounts of assets and liabilities, the disclosure of contingent assets and liabilities at the date of the financial statements and the reported amounts of revenue and expenses during the reporting period. Actual results could differ from those estimates.
The following is a summary of significant accounting policies consistently followed by the Fund in the preparation of its financial statements.
Security Valuation
All equity securities are valued at the close of business of the New York Stock Exchange (NYSE). Equity securities are valued at the last quoted sales price on the principal exchange or market on which they trade, except for securities traded on the NASDAQ Stock Market, which are valued at the NASDAQ official close price. Unlisted securities or listed securities for which there were no sales during the day are valued at the mean of the latest quoted bid and asked prices on such exchanges or markets.
Foreign securities are valued based on quotations from the principal market in which such securities are normally traded. If any foreign share prices are not readily available as a result of limited share activity the securities are valued at the mean of the latest quoted bid and asked prices on such exchanges or markets. Foreign currency exchange rates are generally determined at 4:00 p.m. Eastern (U.S.) time. However, many securities markets and exchanges outside the U.S. close prior to the close of the NYSE; therefore, the closing prices for securities in such markets or on such exchanges may not fully reflect events that occur after such close but before the close of the NYSE. In those situations, foreign securities will be fair valued pursuant to the policy adopted by the Board of Trustees (the Board), including utilizing a third party pricing service to determine these fair values. The third party pricing service takes into account multiple factors, including, but not limited to, movements in the U.S. securities markets, certain depositary receipts, futures contracts and foreign exchange rates that have occurred subsequent to the close of the foreign exchange, to determine a good faith estimate that reasonably reflects the current market conditions as of the close of the NYSE. The fair value of a security is likely to be different from the quoted or published price, if available.
Investments in other open-end investment companies, including money market funds, are valued at net asset value.
Short-term securities purchased within 60 days to maturity are valued at amortized cost, which approximates market value. The value of short-term securities originally purchased with maturities greater than 60 days is determined based on an amortized value to par upon reaching 60 days to maturity. Short-term securities maturing in more than 60 days from the valuation date are valued at the market price or approximate market value based on current interest rates.
Futures and options on futures contracts are valued based upon the settlement price established each day by the board of trade or exchange on which they are traded.
24
Columbia Large Cap Index Fund
February 29, 2012
Investments for which market quotations are not readily available, or that have quotations which management believes are not reliable, are valued at fair value as determined in good faith under consistently applied procedures established by and under the general supervision of the Board. If a security or class of securities (such as foreign securities) is valued at fair value, such value is likely to be different from the last quoted market price for the security. The determination of fair value often requires significant judgment. To determine fair value, management may use assumptions including but not limited to future cash flows and estimated risk premiums. Multiple inputs from various sources may be used to determine value.
Derivative Instruments
The Fund invests in certain derivative instruments as detailed below to meet its investment objectives. Derivatives are instruments whose values depend on, or are derived from, in whole or in part, the value of one or more other assets, such as securities, currencies, commodities or indices. Derivative instruments may be used to maintain cash reserves while maintaining exposure to certain other assets, to offset anticipated declines in values of investments, to facilitate trading, to reduce transaction costs and to pursue higher investment returns. The Fund may also use derivative instruments to mitigate certain investment risks, such as foreign currency exchange rate risk, interest rate risk and credit risk. Derivatives may involve various risks, including the potential inability of the counterparty to fulfill its obligation under the terms of the contract, the potential for an illiquid secondary market and the potential for market movements which may expose the Fund to gains or losses in excess of the amount shown in the Statement of Assets and Liabilities.
The Fund and any counterparty are required to maintain an agreement that requires the Fund and that counterparty to monitor (on a daily basis) the net fair value of all derivatives entered into pursuant to the agreement between the Fund and such counterparty. If the net fair value of such derivatives between the Fund and that counterparty exceeds a certain threshold (as defined in the agreement), the Fund or the counterparty (as the case may be) is required to post cash and/or securities as collateral. Fair values of derivatives presented in the financial statements are not netted with the fair value of other derivatives or with any collateral amounts posted by the Fund or any counterparty.
Futures Contracts
Futures contracts represent commitments for the future purchase or sale of an asset at a specified price on a specified date. The Fund bought equity index futures contracts to equitize cash in order to
maintain appropriate equity market exposure while keeping sufficient cash to accommodate daily redemptions. Upon entering into futures contracts, the Fund bears risks which may include interest rates, exchange rates or securities prices moving unexpectedly, in which case, the Fund may not achieve the anticipated benefits of the futures contracts and may realize a loss. Additional risks include counterparty credit risk, the possibility of an illiquid market, and that a change in the value of the contract or option may not correlate with changes in the value of the underlying asset.
Upon entering into a futures contract, the Fund pledges cash or securities with the broker in an amount sufficient to meet the initial margin requirement. Subsequent payments (variation margin) are made or received by the Fund each day. The variation margin payments are equal to the daily change in the contract value and are recorded as variation margin receivable or payable and are offset in unrealized gains or losses. The Fund recognizes a realized gain or loss when the contract is closed or expires. Futures contracts involve, to varying degrees, risk of loss in excess of the variation margin disclosed in the Statement of Assets and Liabilities.
Effects of Derivative Transactions in the Financial Statements
The following tables are intended to provide additional information about the effect of derivatives on the financial statements of the Fund, including: the fair value of derivatives by risk category and the location of those fair values in the Statement of Assets and Liabilities; the impact of derivative transactions on the Fund’s operations over the period including realized gains or losses and unrealized gains or losses. The derivative schedules following the Portfolio of Investments present additional information regarding derivative instruments outstanding at the end of the period, if any.
| | | | | | | | |
Fair Values of Derivative Instruments at February 29, 2012 |
| | | Asset derivatives | | Liability derivatives |
| | |
Risk Exposure Category | | Statement of
Assets and
Liabilities
Location | | Fair Value | | Statement of
Assets and
Liabilities
Location | | Fair
Value |
| Equity contracts | | Net
assets —
unrealized
appreciation
on futures
contracts | | $1,808,277* | | Net
assets —
unrealized
depreciation
on futures
contracts | | $—* |
| * | Includes cumulative appreciation (depreciation) of futures contracts as reported in the Futures Contracts Outstanding table following the Portfolio of Investments. Only the current day’s variation margin is reported in receivables or payables in the Statement of Assets and Liabilities. |
25
Columbia Large Cap Index Fund
February 29, 2012
| | |
Effect of Derivative Instruments in the Statement of
Operations for the Year Ended February 29, 2012 |
Amount of Realized Gain (Loss) on Derivatives |
| Risk Exposure Category | | Futures Contracts |
| |
| Equity contracts | | $(796,408) |
| | |
| | | |
Change in Unrealized Appreciation (Depreciation) on
Derivatives Recognized in Income |
| Risk Exposure Category | | Futures Contracts |
| |
| Equity contracts | | $1,495,179 |
| | |
Volume of Derivative Instruments for the Year Ended February 29, 2012 |
| | | Contracts
Opened |
| Futures Contracts | | 1,882 |
Repurchase Agreements
The Fund may engage in repurchase agreement transactions with institutions that management has determined are creditworthy. The Fund, through the custodian, receives delivery of the underlying securities collateralizing a repurchase agreement. Management is responsible for determining that the collateral is at least equal, at all times, to the value of the repurchase obligation including interest. A repurchase agreement transaction involves certain risks in the event of default or insolvency of the counterparty. These risks include possible delays in or restrictions on a Fund’s ability to dispose of the underlying securities and a possible decline in the value of the underlying securities during the period while the Fund seeks to assert its rights.
Security Transactions
Security transactions are accounted for on the trade date. Cost is determined and gains (losses) are based upon the specific identification method for both financial statement and federal income tax purposes.
Income Recognition
Corporate actions and dividend income are recorded net of any non-reclaimable tax withholdings, on the ex-dividend date or upon receipt of ex-dividend notification in the case of certain foreign securities.
Interest income is recorded on the accrual basis.
The Fund receives distributions from holdings in real estate investment trusts (REITs) which report information on the character of their distributions annually. REIT distributions are allocated to dividend income, capital gain and return of capital based on estimates made by the Fund’s management if actual information has not yet been reported. Return of capital is recorded as a reduction of the cost basis of securities held. Management’s estimates are subsequently adjusted when the actual character of the distributions is disclosed by the REITs which could result in a proportionate increase in return of capital to shareholders.
Awards from class action litigation are recorded as a reduction of cost basis if the Fund still owns the applicable securities on the payment date. If the Fund no longer owns the applicable securities, the proceeds are recorded as realized gains.
Expenses
General expenses of the Trust are allocated to the Fund and other funds of the Trust based upon relative net assets or other expense allocation methodologies determined by the nature of the expense. Expenses directly attributable to the Fund are charged to the Fund. Expenses directly attributable to a specific class of shares are charged to that share class.
Determination of Class Net Asset Value
All income, expenses (other than class-specific expenses, which are charged to that share class, as shown in the Statement of Operations) and realized and unrealized gains (losses) are allocated to each class of the Fund on a daily basis, based on the relative net assets of each class, for purposes of determining the net asset value of each class.
Federal Income Tax Status
The Fund intends to qualify each year as a regulated investment company under Subchapter M of the Internal Revenue Code, as amended, and will distribute substantially all of its taxable income (including net short-term capital gains), if any, for its tax year, and as such will not be subject to federal income taxes. In addition, the Fund intends to distribute in each calendar year substantially all of its net investment income, capital gains and certain other amounts, if any, such that the Fund should not be subject to federal excise tax. Therefore, no federal income or excise tax provision is recorded.
26
Columbia Large Cap Index Fund
February 29, 2012
Distributions to Shareholders
Distributions from net investment income, if any, are declared and paid semi-annually. Net realized capital gains, if any, are distributed along with the income dividend. Income distributions and capital gain distributions are determined in accordance with federal income tax regulations which may differ from GAAP.
Guarantees and Indemnifications
Under the Trust’s organizational documents and, in some cases, by contract, its officers and trustees are indemnified against certain liabilities arising out of the performance of their duties to the Trust or its funds. In addition, certain of the Fund’s contracts with its service providers contain general indemnification clauses. The Fund’s maximum exposure under these arrangements is unknown since the amount of any future claims that may be made against the Fund cannot be determined, and the Fund has no historical basis for predicting the likelihood of any such claims.
Recent Accounting Pronouncement
Fair Value Measurements and Disclosures
In May 2011, the Financial Accounting and Standards Board (FASB) issued ASU No. 2011-04 modifying Topic 820, Fair Value Measurements and Disclosures. At the same time, the International Accounting Standards Board (IASB) issued International Financial Reporting Standard 13, Fair Value Measurement. The objective of the FASB and IASB is convergence of their guidance on fair value measurements and disclosures.
Specifically, ASU No. 2011-04 requires reporting entities to disclose i) the amounts of any transfers between Level 1 and Level 2, and the reasons for the transfers, ii) for Level 3 fair value measurements, a) quantitative information about significant unobservable inputs used, b) a description of the valuation processes used by the reporting entity and c) a narrative description of the sensitivity of the fair value measurement to changes in unobservable inputs if a change in those inputs might result in a significantly higher or lower fair value measurement. The effective date of ASU No. 2011-04 is for interim and annual periods beginning after December 15, 2011. At this time, management is evaluating the implications of this guidance and the impact it will have on the financial statement amounts and footnote disclosures, if any.
Note 3. Fees and Compensation Paid to Affiliates
Investment Management Fees
Under an Investment Management Services Agreement, Columbia Management Investment Advisers, LLC (the Investment Manager), a wholly-owned subsidiary of Ameriprise Financial, Inc. (Ameriprise Financial), determines which securities will be purchased, held or sold. The management fee is an annual fee that is equal to 0.10% of the Fund’s average daily net assets.
Administration Fees
Under an Administrative Services Agreement, the Investment Manager serves as the Fund Administrator. The Fund pays the Fund Administrator an annual fee for administration and accounting services equal to 0.10% of the Fund’s average daily net assets.
The Investment Manager, from the administration fee it receives from the Fund, pays all operating expenses of the Fund, with the exception of brokerage fees and commissions, interest, fees and expenses of Trustees who are not officers, directors or employees of the Investment Manager or its affiliates, distribution (Rule 12b-1) and/or shareholder servicing fees and any extraordinary non-recurring expenses that may arise, including litigation.
Pricing and Bookkeeping Fees
Prior to March 28, 2011, the Fund had entered into a Financial Reporting Services Agreement (the Financial Reporting Services Agreement) with State Street Bank and Trust Company (State Street) and the Investment Manager pursuant to which State Street provided financial reporting services to the Fund. The Fund also entered into an Accounting Services Agreement (collectively with the Financial Reporting Services Agreement, the State Street Agreements) with State Street and the Investment Manager pursuant to which State Street provided accounting services to the Fund. The pricing and bookkeeping fees for the Fund were paid by the Investment Manager. Effective March 28, 2011, these services are now provided under the Administrative Services Agreement discussed above.
Other Fees
Effective June 1, 2011, other expenses are for, among other things, certain expenses of the Fund or the Board, including: Fund boardroom and office expense, employee compensation, employee health and retirement benefits, and certain other expenses. Payment of these Fund and Board expenses is facilitated by a company
27
Columbia Large Cap Index Fund
February 29, 2012
providing limited administrative services to the Fund and the Board. For the period June 1, 2011 through February 29, 2012, other expenses paid to this company were $10,351.
Compensation of Board Members
Board members are compensated for their services to the Fund as disclosed in the Statement of Operations. Under a Deferred Compensation Plan (the Plan), the Board members who are not “interested persons” of the Fund, as defined under the 1940 Act, may elect to defer payment of up to 100% of their compensation. Deferred amounts are treated as though equivalent dollar amounts had been invested in shares of certain funds managed by the Investment Manager. The Fund’s liability for these amounts is adjusted for market value changes and remains in the Fund until distributed in accordance with the Plan.
Compensation of Chief Compliance Officer
The Board has appointed a Chief Compliance Officer to the Fund in accordance with federal securities regulations. Effective April 1, 2011, the Fund’s expenses associated with the Chief Compliance Officer are paid directly by Columbia. Prior to April 1, 2011, the Fund, along with other affiliated funds, paid its pro-rata share of the expenses for the Chief Compliance Officer. Such fees did not exceed $15,000 per year.
Transfer Agent Fees
Under a Transfer Agency Agreement, Columbia Management Investment Services Corp. (the Transfer Agent), an affiliate of the Investment Manager and a wholly-owned subsidiary of Ameriprise Financial, is responsible for providing transfer agency services to the Fund. The Transfer Agent has contracted with Boston Financial Data Services (BFDS) to serve as sub-transfer agent.
The transfer agent fees are payable by the Investment Manager. The Transfer Agent pays the fees of BFDS for services as sub-transfer agent and is not entitled to reimbursement for such fees from the Fund. The Transfer Agent also receives compensation from fees for various shareholder services and reimbursements for certain out-of -pocket expenses.
An annual minimum account balance fee of $20 may apply to certain accounts with a value below the Fund’s initial minimum investment requirements to reduce the impact of small accounts on transfer agent fees. These minimum account balance fees are recorded as part of expense reductions in the Statement of Operations. For the year ended February 29, 2012, these minimum account balance fees reduced total expenses by $14,557.
Distribution and Service Fees
The Fund has an agreement with Columbia Management Investment Distributors, Inc. (the Distributor), an affiliate of the Investment Manager and a wholly-owned subsidiary of Ameriprise Financial, for distribution and shareholder services. Pursuant to Rule 12b-1 under the 1940 Act, the Board has approved, and the Fund has adopted, distribution and shareholder service plans (the Plans) which set the distribution and service fees for the Fund. These fees are calculated daily and are intended to compensate the Distributor and/or eligible selling and/or servicing agents for selling shares of the Fund and providing services to investors.
The Plans require the payment of a monthly combined distribution and service fee to the Distributor at the maximum annual rate of 0.25% of the average daily net assets attributable to Class A shares of the Fund. The Plans also required the payment of a monthly service fee at the maximum annual rate of 0.25% and a monthly distribution fee at the maximum annual rate of 0.75% of the average daily net assets attributable to Class B shares of the Fund.
Sales Charges
Sales charges, including front-end charges and CDSCs, received by the Distributor for distributing Fund shares were $212 for Class B shares for the year ended February 29, 2012.
Expenses Waived/Reimbursed by the Investment Manager and its Affiliates
Effective April 30, 2011, the Investment Manager and certain of its affiliates have contractually agreed to waive fees and/or reimburse expenses (excluding certain fees and expenses described below), through June 30, 2012, unless sooner terminated at the sole discretion of the Board, so that the Fund’s net operating expenses, after giving effect to fees waived/expenses reimbursed and any balance credits and/or overdraft charges from the Fund’s custodian, do not exceed the following annual rates as a percentage of the class’ average daily net assets:
| | | | |
| | | | |
| Class A | | | 0.42 | % |
| Class B | | | 1.17 | |
| Class I | | | 0.17 | |
| Class Z | | | 0.17 | |
Under the agreement, the following fees and expenses are excluded from the waiver/reimbursement commitment, and therefore will be paid by the Fund, if applicable: taxes (including foreign transaction
28
Columbia Large Cap Index Fund
February 29, 2012
taxes), expenses associated with investments in affiliated and non-affiliated pooled investment vehicles (including mutual funds and exchange traded funds), transaction costs and brokerage commissions, costs related to any securities lending program, dividend expenses associated with securities sold short, inverse floater program fees and expenses, transaction charges and interest on borrowed money, interest, extraordinary expenses and any other expenses the exclusion of which is specifically approved by the Board. This agreement may be modified or amended only with approval from all parties.
Prior to April 30, 2011, the Investment Manager voluntarily agreed to reimburse a portion of the Fund’s expenses (excluding certain expenses, such as distribution and services fees, brokerage commissions, interest, taxes and extraordinary expenses, but including custodian charges relating to overdrafts, if any) so that the Fund’s ordinary net operating expenses, after giving effect to fees waived/expenses reimbursed and any balance credits and/or overdraft charges from the Fund’s custodian, did not exceed 0.14% of the Fund’s average daily net assets on an annualized basis.
Prior to May 1, 2011, the Investment Manager was entitled to recover from the Fund any fees waived and/or expenses reimbursed for a three year period following the date of such fee waiver and/or reimbursement under these arrangements if such recovery did not cause the Fund’s expenses to exceed the expense limitations in effect at the time of recovery. Effective May 1, 2011, the Investment Manager has eliminated such fee recoupment provisions.
Note 4. Federal Tax Information
The timing and character of income and capital gain distributions are determined in accordance with income tax regulations, which may differ from GAAP because of temporary or permanent book to tax differences.
For the year ended February 29, 2012, these differences are primarily due to differing treatment for attributes from acquired funds, capital loss carryforwards, deferral/reversal of wash sales, recognition of unrealized appreciation (depreciation) for certain derivative investments, return of capital sales basis adjustment and Trustee’s deferred compensation. To the extent these differences are permanent, reclassifications are made among the components of the Fund’s net assets in the Statement of Assets and Liabilities. Temporary differences do not require reclassifications. In the
Statement of Assets and Liabilities the following reclassifications were made:
| | | | |
| | | | |
| Undistributed net investment income | | | $190,443 | |
| Accumulated net realized loss | | | 993,973 | |
| Paid-in capital | | | (1,184,416 | ) |
Net investment income and net realized gains (losses), as disclosed in the Statement of Operations, and net assets were not affected by this reclassification.
The tax character of distributions paid during the years indicated was as follows:
| | | | | | | | |
| | | Year ended
February 29,
2012 | | | Year ended
February 28,
2011 | |
| Ordinary income | | | $65,087,443 | | | | $51,769,128 | |
Short-term capital gain distributions, if any, are considered ordinary income distributions for tax purposes.
At February 29, 2012, the components of distributable earnings on a tax basis were as follows:
| | | | |
| | | | |
| Undistributed ordinary income | | $ | 8,809,934 | |
| Unrealized appreciation | | | 853,432,067 | |
At February 29, 2012, the cost of investments for federal income tax purposes was $2,762,595,090 and the aggregate gross unrealized appreciation and depreciation based on that cost was:
| | | | |
| | | | |
| Unrealized appreciation | | $ | 1,153,179,009 | |
| Unrealized depreciation | | $ | (299,746,942 | ) |
| | | | |
| Net unrealized appreciation | | $ | 853,432,067 | |
The following capital loss carryforward, determined at February 29, 2012, may be available to reduce taxable income arising from future
29
Columbia Large Cap Index Fund
February 29, 2012
net realized gains on investments, if any, to the extent permitted by the Internal Revenue Code:
| | | | |
| | | | |
| Year of expiration | | Amount | |
| 2013 | | $ | 235,890 | |
| 2014 | | | 66,065 | |
| 2015 | | | 84,935,905 | |
| 2017 | | | 19,873,230 | |
| | | | |
| Total | | $ | 105,111,090 | |
On December 22, 2010, the Regulated Investment Company Modernization Act of 2010 (the Act) was enacted, which changed various technical rules governing the tax treatment of regulated investment companies. The changes are generally effective for taxable years beginning after the date of enactment. Under the Act, the Fund will be permitted to carry forward capital losses incurred in taxable years beginning after the date of enactment for an unlimited period. However, any losses incurred during those future taxable years will be required to be utilized prior to the losses incurred in pre-enactment taxable years, which carry an expiration date. As a result of this ordering rule, pre-enactment capital loss carryforwards may be more likely to expire unused.
For the year ended February 29, 2012, $58,603,881 of capital loss carryforward was utilized and $303,006 expired unused.
Columbia Large Cap Index Fund acquired capital loss carryforwards in connection with the merger with RiverSource S&P 500 Index Fund of $3,639,022 (Note 10). The yearly utilization of the acquired capital loss carryforwards may be limited by the Internal Revenue Code. Any capital loss carryforwards acquired as part of a merger that is permanently lost due to the provisions under the Internal Revenue Code is included as being expired.
Management of the Fund has concluded that there are no significant uncertain tax positions that would require recognition in the financial statements. However, management’s conclusion may be subject to review and adjustment at a later date based on factors including, but not limited to, new tax laws, regulations, and administrative interpretations (including relevant court decisions). Generally, the Fund’s federal tax returns for the prior three fiscal years remain subject to examination by the Internal Revenue Service.
Note 5. Portfolio Information
The cost of purchases and proceeds from sales of securities, excluding short-term obligations, aggregated to $209,472,348 and $275,612,211, respectively, for the year ended February 29, 2012.
Note 6. Lending of Portfolio Securities
Effective March 28, 2011, the Fund has entered into a Master Securities Lending Agreement (the Agreement) with JPMorgan Chase Bank, N.A. (JPMorgan). The Agreement, which replaces the previous security lending arrangement with State Street, authorizes JPMorgan as lending agent to lend securities to authorized borrowers in order to generate additional income on behalf of the Fund. Pursuant to the Agreement, the securities loaned are secured by cash or U.S. government securities equal to at least 100% of the market value of the loaned securities. Any additional collateral required to maintain those levels due to market fluctuations of the loaned securities is requested to be delivered the following business day. Cash collateral received is invested by the lending agent on behalf of the Fund into authorized investments pursuant to the Agreement. The investments made with the cash collateral are listed in the Portfolio of Investments. The values of such investments and any uninvested cash collateral are disclosed in the Statement of Assets and Liabilities along with the related obligation to return the collateral upon the return of the securities loaned.
At February 29, 2012, securities valued at $13,168,748 were on loan, secured by U.S. government securities valued at $3,813,876 and by cash collateral of $9,830,060 (which does not reflect calls for collateral made to borrowers by JPMorgan at period end) that is partially or fully invested in short-term securities or other cash equivalents.
Risks of delay in recovery of securities or even loss of rights in the securities may occur should the borrower of the securities fail financially. Risks may also arise to the extent that the value of the securities loaned increases above the value of the collateral received. JPMorgan will indemnify the Fund from losses resulting from a borrower’s failure to return a loaned security when due. Such indemnification does not extend to losses associated with declines in the value of cash collateral investments. The Investment Manager is not responsible for any losses incurred by the Fund in connection with the securities lending program. Loans are subject to termination by the Fund or the borrower at any time, and are, therefore, not considered to be illiquid investments.
30
Columbia Large Cap Index Fund
February 29, 2012
Pursuant to the Agreement, the Fund receives income for lending its securities either in the form of fees or by earning interest on invested cash collateral, net of negotiated rebates paid to borrowers and fees paid to the lending agent for services provided and any other securities lending expenses. Net income earned from securities lending for the year ended February 29, 2012 is disclosed in the Statement of Operations. The Fund continues to earn and accrue interest and dividends on the securities loaned.
Prior to March 28, 2011, the Fund participated in a securities lending arrangement with State Street. Each security on loan was collateralized in an amount at least equal to the market value of the securities loaned plus accrued income from the investment of collateral. The income generated by the investment of the collateral, net of any fees remitted to State Street as the lending agent and borrower rebates, was paid to the Fund.
Note 7. Affiliated Money Market Fund
Effective March 28, 2011, the Fund may invest its daily cash balances in Columbia Short-Term Cash Fund, an affiliated money market fund established for the exclusive use by the Fund and other affiliated funds. The income earned by the Fund from such investments is included as “Dividends from affiliates” in the Statement of Operations. As an investing fund, the Fund indirectly bears its proportionate share of the expenses of Columbia Short-Term Cash Fund.
Note 8. Shareholder Concentration
At February 29, 2012, two unaffiliated shareholder accounts owned 44.6% of the outstanding shares of the Fund. The Fund has no knowledge about whether any portion of those shares was owned beneficially. Subscription and redemption activity of these accounts may have a significant effect on the operations of the Fund.
Note 9. Line of Credit
The Fund has entered into a revolving credit facility with a syndicate of banks led by JPMorgan Chase Bank, N.A. (the Administrative Agent), whereby the Fund may borrow for the temporary funding of shareholder redemptions or for other temporary or emergency purposes. The credit facility became effective on March 28, 2011, replacing a prior credit facility. The credit facility agreement, as amended, which is a collective agreement between the Fund and certain other funds managed by the Investment Manager, severally and not jointly, permits collective borrowings up to $500 million. Pursuant to a December 13, 2011 amendment to the credit facility
agreement, interest is charged to each participating fund based on its borrowings at a rate equal to the higher of (i) the overnight federal funds rate plus 1.00% or (i) the one-month LIBOR rate plus 1.00%. Each borrowing under the credit facility matures no later than 60 days after the date of borrowing. The Fund also pays a commitment fee equal to its pro rata share of the amount of the credit facility at a rate of 0.08% per annum. For the period March 28, 2011 through December 13, 2011, interest was charged to each participating fund based on its borrowings at a rate equal to the sum of the federal funds rate plus (i) 1.25% per annum plus (ii) if one-month LIBOR exceeds the federal funds rate, the amount of such excess. The Fund also paid a commitment fee equal to its pro rata share of the amount of the credit facility at a rate of 0.10% per annum.
Prior to March 28, 2011, the Fund and certain other funds managed by the Investment Manager participated in a $280 million committed, unsecured revolving credit facility provided by State Street. Interest was charged to each fund based on its borrowings at a rate equal to the greater of the (i) federal funds rate plus 1.25% per annum or (ii) the overnight LIBOR rate plus 1.25% per annum. The Fund also paid a commitment fee equal to its pro rata share of the amount of the credit facility at a rate of 0.125% per annum.
The Fund had no borrowings during the year ended February 29, 2012.
Note 10. Fund Merger
At the close of business on August 12, 2011, the Fund acquired the assets and assumed the identified liabilities of RiverSource S&P 500 Index Fund a series of RiverSource Market Advantage Series, Inc. The reorganization was completed after shareholders of RiverSource S&P 500 Index Fund approved the plan on April 27, 2011. The purpose of the transaction was to combine two funds managed by the Investment Manager with comparable investment objectives and strategies.
The aggregate net assets of the Fund immediately before the acquisition were $3,045,750,893 and the combined net assets immediately after the acquisition were $3,165,481,480.
The merger was accomplished by a tax-free exchange of 30,883,112 shares of RiverSource S&P 500 Index Fund valued at $119,730,587 (including $7,017,237 of unrealized appreciation).
31
Columbia Large Cap Index Fund
February 29, 2012
In exchange for RiverSource S&P 500 Index Fund shares, the Fund issued the following number of shares:
| | | | |
| | | | |
| | | Shares | |
| Class A | | | 787,315 | |
| Class Z | | | 4,433,356 | |
For financial reporting purposes, net assets received and shares issued by the Fund were recorded at fair value; however, RiverSource S&P 500 Index Fund’s cost of investments was carried forward.
The financial statements reflect the operations of the Fund for the period prior to the merger and the combined fund for the period subsequent to the merger. Because the combined investment portfolios have been managed as a single integrated portfolio since the merger was completed, it is not practicable to separate the amounts of revenue and earnings of RiverSource S&P 500 Index Fund that have been included in the combined Fund’s Statement of Operations since the merger was completed.
Assuming the merger had been completed on March 1, 2011, the Fund’s pro-forma net investment income, net gain on investments, net change in unrealized appreciation and net increase in net assets from operations for the year ended February 29, 2012 would have been approximately $66.0 million, $64.3 million, $32.0 million and $162.3 million, respectively.
Note 11. Subsequent Events
Management has evaluated the events and transactions that have occurred through the date the financial statements were issued. Other than as noted below, there were no items requiring adjustment of the financial statements or additional disclosure.
On March 23, 2012, a group of unaffiliated shareholders of the Fund redeemed $1,271,206,650, substantially all through an in-kind transaction. This amount represented approximately 35% of the Fund’s net assets as of that date.
Note 12. Information Regarding Pending and Settled Legal Proceedings
In June 2004, an action captioned John E. Gallus et al. v. American Express Financial Corp. and American Express Financial Advisors Inc. was filed in the United States District Court for the District of Arizona. The plaintiffs allege that they are investors in several American Express Company mutual funds (currently branded as Columbia) and they purport to bring the action derivatively on
behalf of those funds under the Investment Company Act of 1940. The plaintiffs allege that fees allegedly paid to the defendants by the funds for investment advisory and administrative services are excessive. The plaintiffs seek remedies including restitution and rescission of investment advisory and distribution agreements. The plaintiffs voluntarily agreed to transfer this case to the United States District Court for the District of Minnesota (the District Court). In response to defendants’ motion to dismiss the complaint, the District Court dismissed one of plaintiffs’ four claims and granted plaintiffs limited discovery. Defendants moved for summary judgment in April 2007. Summary judgment was granted in the defendants’ favor on July 9, 2007. The plaintiffs filed a notice of appeal with the Eighth Circuit Court of Appeals (the Eighth Circuit) on August 8, 2007. On April 8, 2009, the Eighth Circuit reversed summary judgment and remanded to the District Court for further proceedings. On August 6, 2009, defendants filed a writ of certiorari with the U.S. Supreme Court (the Supreme Court), asking the Supreme Court to stay the District Court proceedings while the Supreme Court considered and ruled in a case captioned Jones v. Harris Associates, which involved issues of law similar to those presented in the Gallus case. On March 30, 2010, the Supreme Court issued its ruling in Jones v. Harris Associates, and on April 5, 2010, the Supreme Court vacated the Eighth Circuit’s decision in the Gallus case and remanded the case to the Eighth Circuit for further consideration in light of the Supreme Court’s decision in Jones v. Harris Associates. On June 4, 2010, the Eighth Circuit remanded the Gallus case to the District Court for further consideration in light of the Supreme Court’s decision in Jones v. Harris Associates. On December 9, 2010, the District Court reinstated its July 9, 2007 summary judgment order in favor of the defendants. On January 10, 2011, plaintiffs filed a notice of appeal with the Eighth Circuit. In response to the plaintiffs’ opening appellate brief filed on March 18, 2011, the defendants filed a response brief on May 4, 2011 with the Eighth Circuit. The plaintiffs filed a reply brief on May 26, 2011 and oral arguments took place on November 17, 2011. On March 30, 2012, the Eighth Circuit upheld the grant of summary judgment by the District Court in favor of the defendants.
In December 2005, without admitting or denying the allegations, American Express Financial Corporation (AEFC, which is now known as Ameriprise Financial, Inc. (Ameriprise Financial)) entered into settlement agreements with the Securities and Exchange Commission (SEC) and Minnesota Department of Commerce (MDOC) related to market timing activities. As a result, AEFC was censured and ordered to cease and desist from committing or causing any violations of certain provisions of the Investment Advisers Act
32
Columbia Large Cap Index Fund
February 29, 2012
of 1940, the Investment Company Act of 1940, and various Minnesota laws. AEFC agreed to pay disgorgement of $10 million and civil money penalties of $7 million. AEFC also agreed to retain an independent distribution consultant to assist in developing a plan for distribution of all disgorgement and civil penalties ordered by the SEC in accordance with various undertakings detailed at www.sec.gov/litigation/admin/ia-2451.pdf. Ameriprise Financial and its affiliates have cooperated with the SEC and the MDOC in these legal proceedings, and have made regular reports to the funds’ Boards of Trustees.
Ameriprise Financial and certain of its affiliates have historically been involved in a number of legal, arbitration and regulatory proceedings, including routine litigation, class actions, and governmental actions, concerning matters arising in connection with the conduct of their business activities. Ameriprise Financial believes that the Funds are not currently the subject of, and that neither Ameriprise Financial nor any of its affiliates are the subject of, any pending legal, arbitration or regulatory proceedings that are likely to have a material adverse effect on the Funds or the ability of
Ameriprise Financial or its affiliates to perform under their contracts with the Funds. Ameriprise Financial is required to make 10-Q, 10-K and, as necessary, 8-K filings with the Securities and Exchange Commission on legal and regulatory matters that relate to Ameriprise Financial and its affiliates. Copies of these filings may be obtained by accessing the SEC website at www.sec.gov.
There can be no assurance that these matters, or the adverse publicity associated with them, will not result in increased fund redemptions, reduced sale of fund shares or other adverse consequences to the Funds. Further, although we believe proceedings are not likely to have a material adverse effect on the Funds or the ability of Ameriprise Financial or its affiliates to perform under their contracts with the Funds, these proceedings are subject to uncertainties and, as such, we are unable to estimate the possible loss or range of loss that may result. An adverse outcome in one or more of these proceedings could result in adverse judgments, settlements, fines, penalties or other relief that could have a material adverse effect on the consolidated financial condition or results of operations of Ameriprise Financial.
33
Report of Independent Registered Public Accounting Firm
To the Trustees of Columbia Funds Series Trust and the Shareholders of Columbia Large Cap Index Fund
In our opinion, the accompanying statement of assets and liabilities, including the investment portfolio, and the related statements of operations and of changes in net assets and the financial highlights present fairly, in all material respects, the financial position of Columbia Large Cap Index Fund (the “Fund”) (a series of Columbia Funds Series Trust) at February 29, 2012, the results of its operations for the year then ended, the changes in its net assets for each of the two years in the period then ended and the financial highlights for each of the periods indicated, in conformity with accounting principles generally accepted in the United States of America. These financial statements and financial highlights (hereafter referred to as “financial statements”) are the responsibility of the Fund’s management. Our responsibility is to express an opinion on these financial statements based on our audits. We conducted our audits of these financial statements in accordance with the standards of the Public Company Accounting Oversight Board (United States). Those standards require that we plan and perform the audit to obtain reasonable assurance about whether the financial statements are free of material misstatement. An audit includes examining, on a test basis, evidence supporting the amounts and disclosures in the financial statements, assessing the accounting principles used and significant estimates made by management, and evaluating the overall financial statement presentation. We believe that our audits, which included confirmation of securities at February 29, 2012 by correspondence with the custodian, brokers and transfer agent provide a reasonable basis for our opinion.
PricewaterhouseCoopers LLP
Minneapolis, Minnesota
April 20, 2012
34
Federal Income Tax Information (Unaudited) – Columbia Large Cap Index Fund
100.00% of the ordinary income distributed by the Fund for the fiscal year ended February 29, 2012, qualifies for the corporate dividends received deduction.
For non-corporate shareholders 100.00%, or the maximum amount allowable under the Jobs and Growth Tax Relief Reconciliation Act of 2003, of ordinary income distributed by the Fund for the fiscal year ended February 29, 2012 may represent qualified dividend income.
The Fund will notify shareholders in January 2013 of amounts for use in preparing 2012 income tax returns.
35
Fund Governance
Shareholders elect the Board that oversees the funds’ operations. The Board appoints officers who are responsible for day-to-day business decisions based on policies set by the Board. The following table provides basic biographical information about the funds’ Board members, including their principal occupations during the past five years, although specific titles for individuals may have varied over the period. Under current Board policy, members may serve until the next Board meeting after he or she reaches the mandatory retirement age established by the Board, or the fifteenth anniversary of the first Board meeting they attended as a member of the Board.
On September 29, 2009, Ameriprise Financial, the parent company of Columbia Management, entered into an agreement with Bank of America, N.A. (“Bank of America”) to acquire a portion of the asset management business of Columbia Management Group, LLC and certain of its affiliated companies (the “Transaction”). Following the Transaction, which became effective on May 1, 2010, various alignment activities have occurred with respect to the Fund Family. In connection with the Transaction, Mr. Edward J. Boudreau, Jr., Mr. William P. Carmichael, Mr. William A. Hawkins, Mr. R. Glenn Hilliard, Mr. John J. Nagorniak, Ms. Minor M. Shaw and Dr. Anthony M. Santomero, who were members prior to the Transaction of the Legacy Columbia Nations funds’ Board (“Nations Funds”), which includes Columbia Funds Series Trust, Columbia Funds Variable Insurance Trust I and Columbia Funds Master Investment Trust, LLC., began service on the Board for the Legacy RiverSource funds (“RiverSource Funds”) effective June 1, 2011, which resulted in an overall increase from twelve Trustees to sixteen for all mutual funds overseen by the Board.
| | | | | | | | |
| Independent Board Members | | |
| Name, address, age | | Position
held with
funds and
length of
service | | Principal occupation
during past five years | | Number of
funds in
the Fund
Family
overseen
by Board
member | | Other present or past
directorships/trusteeships
(within past 5 years) |
Kathleen Blatz 901 S. Marquette Ave. Minneapolis, MN 55402 Age 57 | | Board member since 1/06 for RiverSource Funds and since 6/11 for Nations Funds | | Attorney; Chief Justice, Minnesota Supreme Court, 1998-2006 | | 153 | | None |
Edward J. Boudreau, Jr. 225 Franklin Street Mail Drop BX32 05228 Boston, MA 02110 Age 67 | | Board member since 6/11 for RiverSource Funds and since 1/05 for Nations Funds | | Managing Director, E.J. Boudreau & Associates (consulting) since 2000 | | 146 | | Former Trustee, BofA Funds Series Trust (11 funds) |
Pamela G. Carlton 901 S. Marquette Ave. Minneapolis, MN 55402 Age 57 | | Board member since 7/07 for RiverSource Funds and since 6/11 for Nations Funds | | President, Springboard-Partners in Cross Cultural Leadership (consulting company) | | 153 | | None |
36
Fund Governance (continued)
| | | | | | | | |
| Independent Board Members (continued) | | |
| Name, address, age | | Position
held with
funds and
length of
service | | Principal occupation
during past five years | | Number of
funds in
the Fund
Family
overseen
by Board
member | | Other present or past
directorships/trusteeships
(within past 5 years) |
William P. Carmichael 225 Franklin Street Mail Drop BX32 05228 Boston, MA 02110 Age 68 | | Board member since 6/11 for RiverSource Funds and since 1999 for Nations Funds | | Retired | | 146 | | Director, Cobra Electronics Corporation (electronic equipment manufacturer); The Finish Line (athletic shoes and apparel); McMoRan Exploration Company (oil and gas exploration and development); former Trustee, BofA Funds Series Trust (11 funds); former Director, Spectrum Brands, Inc. (consumer products); former Director, Simmons Company (bedding) |
Patricia M. Flynn 901 S. Marquette Ave. Minneapolis, MN 55402 Age 61 | | Board member since 11/04 for RiverSource Funds and since 6/11 for Nations Funds | | Trustee Professor of Economics and Management, Bentley University; former Dean, McCallum Graduate School of Business, Bentley University | | 153 | | None |
William A. Hawkins 225 Franklin Street Mail Drop BX32 05228 Boston, MA 02110 Age 69 | | Board member since 6/11 for RiverSource Funds and since 1/05 for Nations Funds | | Managing Director, Overton Partners (financial consulting), since August 2010; President and Chief Executive Officer, California General Bank, N.A., January 2008-August 2010 | | 146 | | Trustee, BofA Funds Series Trust (11 funds) |
R. Glenn Hilliard 225 Franklin Street Mail Drop BX32 05228 Boston, MA 02110 Age 69 | | Board member since 6/11 for RiverSource Funds and since 1/05 for Nations Funds | | Chairman and Chief Executive Officer, Hilliard Group LLC (investing and consulting), since April 2003; Non-Executive Director & Chairman, CNO Financial Group, Inc. (formerly Conseco, Inc.) (insurance), September 2003-May 2011 | | 146 | | Chairman, BofA Fund Series Trust (11 funds); former Director, CNO Financial Group, Inc. (insurance) |
Stephen R. Lewis, Jr. 901 S. Marquette Ave. Minneapolis, MN 55402 Age 73 | | Chair of the Board for RiverSource Funds since 1/07, Board member for RiverSource Funds since 1/02 and since 6/11 for Nations Funds | | President Emeritus and Professor of Economics Emeritus, Carleton College | | 153 | | Director, Valmont Industries, Inc. (manufactures irrigation systems) |
37
Fund Governance (continued)
| | | | | | | | |
| Independent Board Members (continued) | | |
| Name, address, age | | Position
held with
funds and
length of
service | | Principal occupation
during past five years | | Number of
funds in
the Fund
Family
overseen
by Board
member | | Other present or past
directorships/trusteeships
(within past 5 years) |
John F. Maher 901 S. Marquette Ave. Minneapolis, MN 55402 Age 68 | | Board member since 12/06 for Legacy Seligman funds, since 12/08 for RiverSource Funds and since 6/11 for Nations Funds | | Retired President and Chief Executive Officer and former Director, Great Western Financial Corporation (financial services), 1986-1997 | | 153 | | None |
John J. Nagorniak 225 Franklin Street Mail Drop BX32 05228 Boston, MA 02110 Age 67 | | Board member since 6/11 for RiverSource Funds and since 1/08 for Nations Funds | | Retired; President and Director, Foxstone Financial, Inc. (consulting), 2000-2007; Director, Mellon Financial Corporation affiliates (investing), 2000-2007; Chairman, Franklin Portfolio Associates (investing–Mellon affiliate), 1982-2007 | | 146 | | Trustee, Research Foundation of CFA Institute; Director, MIT Investment Company; Trustee, MIT 401k Plan; former Trustee, BofA Funds Series Trust (11 funds) |
Catherine James Paglia 901 S. Marquette Ave. Minneapolis, MN 55402 Age 59 | | Board member since 11/04 for RiverSource Funds and since 6/11 for Nations Funds | | Director, Enterprise Asset Management, Inc. (private real estate and asset management company) | | 153 | | None |
Leroy C. Richie 901 S. Marquette Ave. Minneapolis, MN 55402 Age 70 | | Board member since 2000 for Legacy Seligman funds, since 11/08 for RiverSource Funds and since 6/11 for Nations Funds | | Counsel, Lewis & Munday, P.C. since 2004; former Vice President and General Counsel, Automotive Legal Affairs, Chrysler Corporation | | 153 | | Director, Digital Ally, Inc. (digital imaging); Director, Infinity, Inc. (oil and gas exploration and production); Director, OGE Energy Corp. (energy and energy services) |
Minor M. Shaw 225 Franklin Street Mail Drop BX32 05228 Boston, MA 02110 Age 64 | | Board member since 6/11 for RiverSource Funds and since 2003 for Nations Funds | | President–Micco LLC (private investments) | | 146 | | Former Trustee, BofA Funds Series Trust (11 funds); Board Member, Piedmont Natural Gas; Director, Blue Cross Blue Shield of South Carolina |
Alison Taunton-Rigby 901 S. Marquette Ave. Minneapolis, MN 55402 Age 67 | | Board member since 11/02 for RiverSource Funds and since 6/11 for Nations Funds | | Chief Executive Officer and Director, RiboNovix, Inc. 2003-2010 (biotechnology); former President, Aquila Biopharmaceuticals | | 153 | | Director, Healthways, Inc. (health management programs); Director, ICI Mutual Insurance Company, RRG; Director, Abt Associates (government contractor) |
38
Fund Governance (continued)
| | | | | | | | |
| Interested Board Member Not Affiliated with Investment Manager* | | |
| Name, address, age | | Position
held with
funds and
length of
service | | Principal occupation
during past five years | | Number of
funds in
the Fund
Family
overseen
by Board
member | | Other present or past
directorships/trusteeships
(within past 5 years) |
Anthony M. Santomero* 225 Franklin Street Mail Drop BX32 05228 Boston, MA 02110 Age 65 | | Board member since 6/11 for RiverSource Funds and since 1/08 for Nations Funds | | Richard K. Mellon Professor Emeritus of Finance, The Wharton School, University of Pennsylvania, since 2002; Senior Advisor, McKinsey & Company (consulting), 2006-2008; President and Chief Executive Officer, Federal Reserve Bank of Philadelphia, 2000-2006 | | 146 | | Director, Renaissance Reinsurance Ltd.; Trustee, Penn Mutual Life Insurance Company; Director, Citigroup; Director, Citibank, N.A.; former Trustee, BofA Funds Series Trust (11 funds) |
| * | Dr. Santomero is not an affiliated person of the Investment Manager or Ameriprise Financial. However, he is currently deemed by the funds to be an “interested person” (as defined in the 1940 Act) of the Funds because he serves as a Director of Citigroup, Inc. and Citibank N.A., companies that may directly or through subsidiaries and affiliates engage from time-to-time in brokerage execution, principal transactions and lending relationships with the funds or accounts advised/managed by the Investment Manager. |
| | | | | | | | |
| Interested Board Member Affiliated with Investment Manager* | | |
William F. Truscott 53600 Ameriprise Financial Center Minneapolis, MN 55474 Age 51 | | Board member since 11/01 for RiverSource Funds and since 6/11 for Nations Funds; Senior Vice President since 2002 for RiverSource Funds and 5/10 for Nations Funds | | Chairman of the Board and President, Columbia Management Investment Advisers, LLC since May 2010 and February 2012, respectively (previously President, Chairman of the Board and Chief Investment Officer, 2001-April 2010); Chief Executive Officer, U.S. Asset Management & President, Annuities, Ameriprise Financial, Inc. since May 2010 (previously President–U.S. Asset Management and Chief Investment Officer, 2005-April 2010); Director, President and Chief Executive Officer, Ameriprise Certificate Company since 2006; Director and Chief Executive Officer, Columbia Management Investment Distributors, Inc. since May 2010 and February 2012, respectively (previously Chairman of the Board and Chief Executive Officer, 2006-April 2010); Chairman of the Board and Chief Executive Officer, RiverSource Distributors, Inc. since 2006. | | 153 | | None |
| * | Interested person (as defined under the 1940 Act) by reason of being an officer, director, security holder and/or employee of the Investment Manager or Ameriprise Financial. |
| | The SAI has additional information about the Fund’s Board members and is available, without charge, upon request by calling 800.345.6611 or contacting your financial intermediary. |
39
Fund Governance (continued)
Officers
| | |
| Name, Year of Birth and Address | | Principal Occupation(s) During Past Five Years |
| |
| J. Kevin Connaughton (Born 1964) | | |
225 Franklin Street Boston, MA 02110 President (since 2009) | | Senior Vice President and General Manager–Mutual Fund Products, Columbia Management Investment Advisers, LLC since May 2010; President, Columbia Funds, since 2009, and RiverSource Funds, since May 2010 (previously Senior Vice President and Chief Financial Officer, Columbia Funds, from June 2008 to January 2009, Treasurer, Columbia Funds, from October 2003 to May 2008, and senior officer of various other affiliated funds since 2000); Managing Director, Columbia Management Advisors, LLC from December 2004 to April 2010. |
| |
| Michael G. Clarke (Born 1969) | | |
225 Franklin Street Boston, MA 02110 Treasurer (since 2011) and Chief Financial Officer
(since 2009) | | Vice President, Columbia Management Investment Advisers, LLC since May 2010; Managing Director of Fund Administration, Columbia Management Advisors, LLC, from September 2004 to April 2010; senior officer of Columbia Funds and affiliated funds since 2002. |
| |
| Scott R. Plummer (Born 1959) | | |
5228 Ameriprise Financial Center Minneapolis, MN 55474 Senior Vice President, Secretary and Chief Legal Officer (since 2010) | | Chief Legal Officer and Assistant Secretary, Columbia Management Investment Advisers, LLC since June 2005; Vice President and Lead Chief Counsel–Asset Management, Ameriprise Financial, Inc. since May 2010 (previously Vice President and Chief Counsel–Asset Management, from 2005 to April 2010, Vice President, Chief Counsel and Assistant Secretary, Columbia Management Investment Distributors, Inc. since 2008; Vice President, General Counsel and Secretary, Ameriprise Certificate Company since 2005; Chief Counsel, RiverSource Distributors, Inc. since 2006; Senior officer of Columbia Funds and affiliated funds, since 2006. |
| |
| Thomas P. McGuire (Born 1972) | | |
225 Franklin Street Boston, MA 02110 Chief Compliance Officer (since 2012) | | Vice President–Asset Management Compliance, Columbia Management Investment Advisers, LLC since March 2010; Chief Compliance Officer, Ameriprise Certificate Company, since September 2010; Compliance Executive, Bank of America, from June 2005 to April 2010. |
| |
| William F. Truscott (Born 1960) | | |
53600 Ameriprise Financial Center Minneapolis, MN 55474 Senior Vice President (since 2010) | | Chairman of the Board and President, Columbia Management Investment Advisers, LLC since May 2010 and February 2012, respectively (previously President, Chairman of the Board and Chief Investment Officer, from 2001 to April 2010); Chief Executive Officer, U.S. Asset Management & President, Annuities, Ameriprise Financial, Inc. since May 2010 (previously President–U.S. Asset Management and Chief Investment Officer from 2005 to April 2010; Director, President and Chief Executive Officer, Ameriprise Certificate Company since 2006; Director and Chief Executive Officer, Columbia Management Investment Distributors, Inc. since May 2010 and February 2012, respectively (previously Chairman of the Board and Chief Executive Officer from 2008 to April 2010); Chairman of the Board and Chief Executive Officer, RiverSource Distributors, Inc. since 2006. |
| |
| Paul D. Pearson (Born 1956) | | |
10468 Ameriprise Financial Center Minneapolis, MN 55474 Vice President and Assistant Treasurer (since 2011) | | Vice President–Investment Accounting, Columbia Management Investment Advisers, LLC, since May 2010; Vice President–Managed Assets, Investment Accounting, Ameriprise Financial Corporation, 1998-2010. |
40
Fund Governance (continued)
Officers (continued)
| | |
| Name, Year of Birth and Address | | Principal Occupation(s) During Past Five Years |
| |
| Colin Moore (Born 1958) | | |
225 Franklin Street Boston, MA 02110 Senior Vice President (since 2010) | | Director and Chief Investment Officer, Columbia Management Investment Advisers, LLC since May 2010; Manager, Managing Director and Chief Investment Officer of Columbia Management Advisors, LLC from 2007 to April 2010; Head of Equities, Columbia Management Advisors, LLC from 2002 to 2007. |
| |
| Christopher O. Petersen (Born 1970) | | |
5228 Ameriprise Financial Center Minneapolis, MN 55474 Vice President and Secretary (since 2011) | | Vice President and Chief Counsel, Ameriprise Financial since January 2010 (formerly Vice President and Group Counsel or Counsel from April 2004 to January 2010); Senior officer of Columbia Funds and affiliated funds, since 2007. |
| |
| Amy K. Johnson (Born 1965) | | |
5228 Ameriprise Financial Center Minneapolis, MN 55474 Senior Vice President (since 2010) | | Senior Vice President and Chief Operating Officer, Columbia Management Investment Advisers, LLC since May 2010 (previously Chief Administrative Officer, from 2009 until April 2010, Vice President–Asset Management and Trust Company Services, from 2006 to 2009, and Vice President–Operations and Compliance from 2004 to 2006). |
| |
| Joseph F. DiMaria (Born 1968) | | |
225 Franklin Street Boston, MA 02110 Vice President (since 2011) and Chief Accounting Officer (since 2008) | | Vice President, Mutual Fund Administration, Columbia Management Investment Advisers, LLC, since May 2010; Director of Fund Administration, Columbia Management Advisors, LLC from January 2006 to April 2010. |
| |
| Paul B. Goucher (Born 1968) | | |
100 Park Avenue New York, NY 10017 Vice President and Assistant Secretary (since 2010) | | Vice President and Chief Counsel of Ameriprise Financial since January 2010 (formerly Vice President and Group Counsel from November 2008 to January 2010); Director, Managing Director and General Counsel of J. & W. Seligman & Co. Incorporated (Seligman) from July 2008 to November 2008 and Managing Director and Associate General Counsel of Seligman from January 2005 to July 2008. |
| |
| Michael E. DeFao (Born 1968) | | |
225 Franklin Street Boston, MA 02110 Vice President and Assistant Treasurer (since 2011) | | Vice President and Chief Counsel, Ameriprise Financial since May 2010; Associate General Counsel, Bank of America from June 2005 to April 2010 |
| |
| Stephen T. Welsh (Born 1957) | | |
225 Franklin Street Boston, MA 02110 Vice President (since 2006) | | President, Columbia Management Investment Services, Corp. since May 2010; President and Director, Columbia Management Services, Inc. from July 2004 to April 2010; Managing Director, Columbia Management Distributors, Inc. from August 2007 to April 2010. |
41
[THIS PAGE INTENTIONALLY LEFT BLANK]
42
[THIS PAGE INTENTIONALLY LEFT BLANK]
43
[THIS PAGE INTENTIONALLY LEFT BLANK]
44
Important Information About This Report
The fund mails one shareholder report to each shareholder address. If you would like more than one report, please call shareholder services at 1-800-345-6611 and additional reports will be sent to you. This report has been prepared for shareholders of Columbia Large Cap Index Fund.
A description of the policies and procedures that the fund uses to determine how to vote proxies and a copy of the fund’s voting records are available (i) at www.columbiamanagement.com, (ii) on the Securities and Exchange Commission’s website at www.sec.gov, and (iii) without charge, upon request, by calling 1-800-368-0346. Information regarding how the fund voted proxies relating to portfolio securities during the 12-month period ended June 30 is available from the SEC’s website. Information regarding how the fund voted proxies relating to portfolio securities is also available from the fund’s website, www.columbiamanagement.com.
The fund files a complete schedule of portfolio holdings with the SEC for the first and third quarters of each fiscal year on Form N-Q. The fund’s Form N-Q is available on the SEC’s website at www.sec.gov and may be reviewed and copied at the SEC’s Public Reference Room in Washington, D.C. Information on the operation of the Public Reference Room may be obtained by calling
1-800-SEC-0330.
Transfer Agent
Columbia Management Investment Services Corp.
P.O. Box 8081
Boston, MA 02266-8081
1-800-345-6611
Distributor
Columbia Management Investment
Distributors, Inc.
225 Franklin Street Boston, MA 02110
Investment Manager
Columbia Management Investment Advisers, LLC
225 Franklin Street Boston, MA 02110
45

Columbia Large Cap Index Fund
P.O. Box 8081
Boston, MA 02266-8081
columbiamanagement.com
This information is for use with concurrent or prior delivery of a fund prospectus. Investors should consider the investment objectives, risks, charges and expenses of a mutual fund carefully before investing. For a free prospectus, which contains this and other important information about the funds, visit columbiamanagement.com. Read the prospectus carefully before investing. The Fund is distributed by Columbia Management Investment Distributors, Inc., member FINRA, and managed by Columbia Management Investment Advisers, LLC.
©2012 Columbia Management Investment Advisers, LLC. All rights reserved.
C-1266 C (4/12)

Columbia Large Cap Enhanced Core Fund
Annual Report for the Period Ended February 29, 2012
Table of contents
The views expressed in this report reflect the current views of the respective parties. These views are not guarantees of future performance and involve certain risks, uncertainties and assumptions that are difficult to predict, so actual outcomes and results may differ significantly from the views expressed. These views are subject to change at any time based upon economic, market or other conditions and the respective parties disclaim any responsibility to update such views. These views may not be relied on as investment advice and, because investment decisions for a Columbia Fund are based on numerous factors, may not be relied on as an indication of trading intent on behalf of any particular Columbia Fund. References to specific securities should not be construed as a recommendation or investment advice.
President’s Message

Dear Shareholders,
Americans were dispirited in the fourth quarter of 2011 by Washington’s inability to reach a plan for deficit reduction and Europe’s piecemeal attempt to address its own fiscal issues. Yet, there was sufficient good news to encourage risk taking, buoying both stocks and bonds to solid gains.
U.S. economic data surprised on the upside and fears of recession abated. With the bar of expectations set low, investors responded positively to the announcement that the economy had expanded by 1.8% in the third quarter. Consumer confidence improved, even though consumers remain under pressure with no real increase in disposable income and a continued decline in household net worth. Headline inflation — which tracks a broad range of consumer expenditures, including food and energy — declined. Even manufacturing held its ground.
Against this backdrop, the U.S. equity markets logged solid returns.
The S&P 500 Index gained 11.82%, moving into positive territory for the year with quarterly advances in all ten sectors. Mid- and small-cap stocks did even better. Value outperformed growth across all market capitalizations. Energy stocks led the market, as the price of oil moved above $100 a barrel in December. Industrials and materials stocks rose, buoyed by improving economic data. The U.S. fixed-income markets logged modest but solid returns. High-yield bonds were the best performers as the economy showed signs of improvement. Emerging market bonds were strong performers, as inflation came under control in key regions. Municipal bonds and Treasuries eked out only modest gains, as investors moved away from quality in favor of riskier assets.
While fourth quarter gains were encouraging, challenges still remain. Columbia Management, however, remains strong and steadfast. Columbia Management is the eighth largest manager of long-term mutual fund assets with $326 billion under management as of December 31, 2011. The past year has been one of considerable change for the organization as we worked diligently to align products, services and resources in the integration of Columbia Management with RiverSource Investments. The strong line-up of talent, resources and capabilities that has resulted is highlighted by the success of our products. As of December 31, 2011, Columbia Management offers 52 funds rated either 4 or 5 stars by Morningstar.*
For more information about these and other funds offered by Columbia Management, including detailed, up-to-date fund performance and portfolio information, please visit us online at columbiamanagement.com. Other information and resources available on our website include:
| n | | timely economic analysis and market commentary |
| n | | quarterly fund commentaries |
| n | | Columbia Management Investor, a quarterly newsletter for shareholders |
Thank you for your continued support of the Columbia Funds. We look forward to serving your investment needs for many years to come.
Best Regards,

J. Kevin Connaughton
President, Columbia Funds
| * | All ratings are based on Class Z shares as of 12/31/2011. Out of 119 Class Z share Columbia funds rated by Morningstar, 7 funds received a 5-star Overall Rating and 45 funds received a 4-star Overall Rating. The Overall Morningstar Rating for a retail mutual fund is derived from a weighted average of the performance figures associated with its 3-, 5- and 10-year (if applicable) Morningstar Rating metrics. For share classes that do not have a 3-, 5-, or 10-year actual performance history, the fund’s independent Morningstar Rating metric is then compared against the retail mutual fund universe breakpoints to determine its hypothetical rating. |
For each fund with at least a three-year history, Morningstar calculates a Morningstar RatingTM based on a Morningstar Risk-Adjusted Return measure that accounts for variation in a fund’s monthly performance (including the effects of sales charges/loads, and redemption fees), placing more emphasis on downward variations and rewarding consistent performance. The top 10% of funds in each category receive 5 stars, the next 22.5% receive 4 stars, the next 35% receive 3 stars, the next 22.5% receive 2 stars and the bottom 10% receive 1 star. (Each share class is counted as a fraction of one fund within this scale and rated separately, which may cause slight variations in the distribution percentages.)
The Morningstar RatingTM is for Class Z shares only; other classes may have different performance characteristics and may have different ratings. ©2012 Morningstar, Inc. All Rights Reserved. The Morningstar information contained herein: (1) is proprietary to Morningstar and/or its content providers; (2) may not be copied or distributed; and (3) is not warranted to be accurate, complete or timely. Neither Morningstar nor its content providers are responsible for any damages or losses arising from any use of this information.
Investors should consider the investment objectives, risks, charges and expenses of a mutual fund carefully before investing. For a free prospectus, which contains this and other important information about the funds, visit columbiamanagement.com. The prospectus should be read carefully before investing.
Columbia Funds are distributed by Columbia Management Investment Distributors, Inc., member FINRA, and managed by Columbia Management Investment Advisers, LLC.
© 2012 Columbia Management Investment Advisers, LLC. All rights reserved.
Fund Profile – Columbia Large Cap Enhanced Core Fund
Summary
| n | | For the 12-month period that ended February 29, 2012, the fund’s Class A shares returned 8.41% without sales charge. |
| n | | The fund outperformed its benchmark, the S&P 500 Index, which returned 5.12%.1 |
| n | | The fund’s quality and valuation components generally accounted for its performance advantage over its benchmark, with each component adding value during different periods of the year. The catalyst component added value consistently throughout the year. |
Portfolio Management
Brian M. Condon has managed or co-managed the fund since February 2009. From 1999 until joining Columbia Management Investment Advisers, LLC (the Investment Manager) in May 2010, Mr. Condon was associated with the fund’s previous investment adviser or its predecessors as an investment professional.
Oliver E. Buckley has co-managed the fund since August 2011 and has been associated with the Investment Manager since July 2011.
| 1 | The Standard & Poor’s (S&P) 500 Index tracks the performance of 500 widely held, large-capitalization U.S. stocks. |
Indices are not available for investment, are not professionally managed and do not reflect sales charges, fees, brokerage commissions, taxes or other expenses of investing. Securities in the fund may not match those in an index.
Performance data quoted represents past performance and current performance may be lower or higher. Past performance is no guarantee of future results. The investment return and principal value will fluctuate so that shares, when redeemed, may be worth more or less than the original cost. Please visit www.columbiamanagement.com for daily and most recent month-end performance updates.
Summary
1-year return as of 02/29/12
| | |
| |
 | | +8.41% Class A shares |
| |
| | +5.12% S&P 500 Index |
|
Morningstar Style Box™ |
|
Equity Style |

|
The Morningstar Style Box™ is based on the fund’s portfolio holdings. For equity funds, the vertical axis shows the market capitalization of the stocks owned, and the horizontal axis shows investment style (value, blend, or growth). Information shown is based on the most recent data provided by Morningstar.
© 2012 Morningstar, Inc. All rights reserved. The Morningstar information contained herein: (1) is proprietary to Morningstar and/or its content providers; (2) may not be copied or distributed; and (3) is not warranted to be accurate, complete or timely. Neither Morningstar nor its content providers are responsible for any damages or losses arising from any use of this information.
1
Performance Information – Columbia Large Cap Enhanced Core Fund
Performance data quoted represents past performance and current performance may be lower or higher. Past performance is no guarantee of future results. The investment return and principal value will fluctuate so that shares, when redeemed, may be worth more or less than the original cost. Please visit www.columbiamanagement.com for daily and most recent month-end performance updates.
|
| Performance of a $10,000 investment 03/01/02 – 02/29/12 |
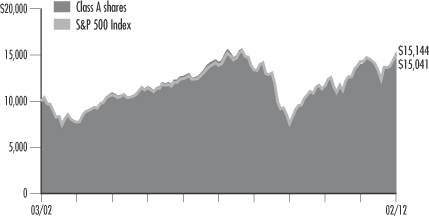
The chart above shows the change in value of a hypothetical $10,000 investment in Class A shares of Columbia Large Cap Enhanced Core Fund during the stated time period, and does not reflect the deduction of taxes that a shareholder may pay on fund distributions or on the redemption of fund shares.
| | | | |
| Performance of a $10,000 investment 03/01/02 – 02/29/12 ($) | |
Class A | | | 15,144 | |
Class I* | | | 15,213 | |
Class R* | | | 14,753 | |
Class Y* | | | 15,289 | |
Class Z | | | 15,527 | |
| | | | | | | | | | | | | | | | | | | | |
| Average annual total return as of 02/29/12 (%) | |
| | | | | |
| Share class | | A | | | I* | | | R* | | | Y* | | | Z | |
| Inception | | 07/31/96 | | | 09/27/10 | | | 01/23/06 | | | 07/15/09 | | | 07/31/96 | |
1-year | | | 8.41 | | | | 8.73 | | | | 8.08 | | | | 8.74 | | | | 8.54 | |
5-year | | | 1.29 | | | | 1.38 | | | | 1.02 | | | | 1.48 | | | | 1.53 | |
10-year | | | 4.24 | | | | 4.28 | | | | 3.97 | | | | 4.34 | | | | 4.50 | |
Performance results reflect any fee waivers or reimbursements of fund expenses by Columbia Management Investment Advisers, LLC and/or any of its affiliates. Absent these fee waivers or expense reimbursement arrangements, performance results would have been lower.
All results shown assume reinvestment of distributions. Class I, Class Y and Class Z shares are sold at net asset value with no distribution and service (Rule 12b-1) fees. Class R shares are sold at net asset value with a distribution (Rule 12b-1) fee. Class I, Class R, Class Y and Class Z shares have limited eligibility and the investment minimum requirements may vary. Please see the fund’s prospectuses for details. Performance for different share classes will vary based on differences in fees associated with each class.
The tables do not reflect the deduction of taxes that a shareholder may pay on fund distributions or on the redemption of fund shares.
| * | The returns shown for periods prior to the share class inception date (including returns since inception, which are since fund inception) include the returns of the fund’s Class A shares, the fund’s oldest share class. These returns are adjusted to reflect any higher class-related operating expenses of the newer share classes, as applicable. Please visit columbiamanagement.com/mutual-funds/appended-performance for more information. |
2
Understanding Your Expenses – Columbia Large Cap Enhanced Core Fund
As an investor, you incur two types of costs. There are transaction costs, which generally include sales charges on purchases and may include redemption fees. There are also ongoing costs, which generally include management fees, distribution and service (Rule 12b-1) fees, and other fund expenses. The following information is intended to help you understand your ongoing costs (in dollars) of investing in the Fund and to help you compare these costs with the ongoing costs of investing in other mutual funds.
Analyzing your fund’s expenses
To illustrate these ongoing costs, we provided examples and calculated the expenses paid by investors in each share class of the Fund during the period. The information in the table is based on an initial investment of $1,000 at the beginning of the period indicated and held for the entire period. Expense information is calculated two ways and each method provides you with different information. The amount listed in the “Actual” column is calculated using the Fund’s actual operating expenses and total return for the period. You may use the Actual information, together with the amount invested, to estimate the expenses that you paid over the period. Simply divide your account value by $1,000 (for example, an $8,600 account value divided by $1,000 = 8.6), then multiply the results by the expenses paid during the period under the Actual column. The amount listed in the “Hypothetical” column assumes a 5% annual rate of return before expenses (which is not the Fund’s actual return) and then applies the Fund’s actual expense ratio for the period to the hypothetical return. You should not use the hypothetical account values and expenses to estimate either your actual account balance at the end of the period or the expenses you paid during the period. See the “Compare with other funds” below for details on how to use the hypothetical data.
In addition to the ongoing expenses which the Fund bears directly, the Fund’s shareholders indirectly bear the Fund’s allocable share of the costs and expenses of each underlying fund in which the Fund invests. You can also estimate the effective expenses paid during the period, which includes the indirect fees associated with investing in the underlying funds, by using the amounts listed in the effective expenses paid during the period column.
Compare with other funds
Since all mutual funds are required to include the same hypothetical calculations about expenses in shareholder reports, you can use this information to compare the ongoing cost of investing in the Fund with other funds. To do so, compare the hypothetical example with the 5% hypothetical examples that appear in the shareholder reports of other funds. As you compare hypothetical examples of other funds, it is important to note that hypothetical examples are meant to highlight the ongoing costs of investing in a fund only and do not reflect any transaction costs, such as sales charges, or redemption or exchange fees. Therefore, the hypothetical calculations are useful in comparing ongoing costs only, and will not help you determine the relative total costs of owning different funds. If transaction costs were included in these calculations, your costs would be higher.
| | | | | | | | | | | | | | | | | | | | | | | | | | | | |
| 09/01/2011 – 02/29/2012 | | | | | | | | | | | | | | | | |
| | | | |
| | | Account value at the
beginning of the period ($) | | | Account value at the
end of the period ($) | | | Expenses paid
during the period ($) | | | Fund’s annualized
expense ratio (%) | |
| | | Actual | | | Hypothetical | | | Actual | | | Hypothetical | | | Actual | | | Hypothetical | | | Actual | |
Class A | | | 1,000.00 | | | | 1,000.00 | | | | 1,149.60 | | | | 1,020.19 | | | | 5.02 | | | | 4.72 | | | | 0.94 | |
Class I | | | 1,000.00 | | | | 1,000.00 | | | | 1,151.50 | | | | 1,021.78 | | | | 3.32 | | | | 3.12 | | | | 0.62 | |
Class R | | | 1,000.00 | | | | 1,000.00 | | | | 1,147.60 | | | | 1,018.95 | | | | 6.35 | | | | 5.97 | | | | 1.19 | |
Class Y | | | 1,000.00 | | | | 1,000.00 | | | | 1,151.60 | | | | 1,021.73 | | | | 3.37 | | | | 3.17 | | | | 0.63 | |
Class Z | | | 1,000.00 | | | | 1,000.00 | | | | 1,150.70 | | | | 1,021.38 | | | | 3.74 | | | | 3.52 | | | | 0.70 | |
Expenses paid during the period are equal to the annualized expense ratio for each class as indicated above, multiplied by the average account value over the period and then multiplied by the number of days in the Fund’s most recent fiscal half year and divided by 366.
Expenses do not include fees and expenses incurred indirectly by the Fund from the underlying funds in which the Fund may invest (also referred to as “acquired funds”), including affiliated and non-affiliated pooled investments vehicles (including mutual funds and exchange traded funds).
Had Columbia Management Investment Advisers, LLC and/or certain of its affiliates not waived/reimbursed certain fees and expenses, account value at the end of the period would have been reduced.
3
Portfolio Managers’ Report – Columbia Large Cap Enhanced Core Fund
Performance data quoted represents past performance and current performance may be lower or higher. Past performance is no guarantee of future results. The investment return and principal value will fluctuate so that shares, when redeemed, may be worth more or less than the original cost. Please visit www.columbiamanagement.com for daily and most recent month-end performance updates.
| | | | |
| Net asset value per share | |
| |
as of 02/29/12 ($) | | | | |
Class A | | | 13.67 | |
Class I | | | 13.63 | |
Class R | | | 13.65 | |
Class Y | | | 13.63 | |
Class Z | | | 13.62 | |
| | | | |
| Distributions declared per share | |
| |
03/01/11 – 02/29/12 ($) | | | | |
Class A | | | 0.20 | |
Class I | | | 0.24 | |
Class R | | | 0.17 | |
Class Y | | | 0.24 | |
Class Z | | | 0.23 | |
For the 12-month period that ended February 29, 2012, the fund’s Class A shares returned 8.41% without sales charge. The fund outperformed its benchmark, the S&P 500 Index, which returned 5.12%. The fund’s quality and valuation components generally accounted for its performance advantage over its benchmark, with each component adding value during different periods of the year. The catalyst component as described below, added value more consistently throughout the year, though with less impact.
A shifting market
Over the 12-month period covered by this report, the U.S. equity market went through several distinct phases, as sentiment shifted with economic and political news. In March and April of 2011, optimism about a continued economic recovery pushed the S&P 500 Index upward. Then, the index treaded water through July, when deep concerns about political paralysis in Washington, a downgrade of U.S. debt by Standard & Poor’s and Europe’s lingering debt crisis pushed the market lower. Yet, despite the continued overhang of European debt, the market recovered strongly in the fourth quarter of 2011 and through the first two months of 2012, driven by upbeat economic results and forecasts. Although the index was up and down in double digits at different points in the year, its 5.12% return for the full period cheered investors.
The drivers of index returns also shifted over the year. As the market declined sharply from May 2011 through September, stocks with defensive qualities strongly outperformed riskier, higher beta stocks by almost 32%. (Beta is a measure of volatility relative to the index.) Large-company stocks outperformed the smallest-capitalization stocks in the index and the top dividend payers outperformed stocks that don’t pay a dividend. By contrast, as stock prices picked up from October 2011 through February 2012, the quintile of stocks with the highest beta outperformed the quintile of stocks with the lowest beta by almost 25%. Small-cap stocks outperformed large-cap stocks and the stocks of non-dividend paying stocks outperformed stocks with the highest yield.
Stock model components drove performance advantage
The components of the fund’s stock selection model, exhibited similar, but generally more muted, behavior than the index. We divide the metrics for our stock selection model into three broad categories: valuation, which is based on fundamental measures such as earnings and cash flow relative to market values; catalyst, which measures price and business momentum; and quality, which measures such things as the quality of a company’s earnings and its overall financial strength. During the period, the most pronounced shifts in performance occurred within the fund’s quality and valuation components. For the May through September down period in the market, the fund’s high quality stocks outperformed its lower quality stocks by more than 13% and were the biggest positive driver of returns relative to the S&P 500 Index. However, as stock prices rose from October through the end of the fund’s fiscal year, the fund’s quality measures failed to distinguish between winners and losers.
The story was reversed for the fund’s valuation metrics. From May to September, the top quintile of stocks ranked by the fund’s valuation measures underperformed the bottom quintile by about 5%. After September, the fund’s valuation measures were the most positive driver of returns, with the top quintile outperforming the bottom quintile by more than 11%. The fund’s catalyst factors added value more consistently throughout the period, with the top quintile outperforming the bottom quintile by about 2% from May through September and by about 3% from October through February.
4
Portfolio Managers’ Report (continued) – Columbia Large Cap Enhanced Core Fund
During the period, health care, and consumer discretionary stocks were the top contributors to performance. Biogen Idec (position eliminated), a global biotech company received positive news regarding trials of a new multiple sclerosis drug and announced several strategic acquisitions and joint ventures. In financials, the fund benefited by being significantly underweight in Bank of America (0.2% of net assets), which was a poor performer, and by being overweight in the strong performing Simon Property Group (1.3% of net assets), a real estate investment trust that owns and operates regional malls and premium outlets, among other real estate properties. Other top contributors included top holding Apple (5.1% of net assets). Anticipation of the next generation iPhone was more than enough to bolster the stock against news of increased competition for smartphones and tablets, as well as the loss of its iconic chief executive Steve Jobs. Industrials and financials made the weakest showing during the period. R.R. Donnelley (0.8% of net assets), a global commercial printing company, absorbed several acquisitions and struggled with expansion plans, which took a bite out of profit margins.
The fund holds S&P futures contracts to equitize cash positions and to minimize tracking error relative to the index, which would result from holding cash in the portfolio.
Looking ahead
In the current economic environment, we plan to maintain our investment discipline and continue to seek to identify stocks that we believe have the potential to outperform within each sector. We also seek to minimize sector weight differences between the fund and its investment benchmark. We continue to favor stocks with attributes considered most important in the fund’s stock selection model: companies with attractive valuations relative to their peers, companies with strong business and market momentum and companies with good quality of earnings and financial strength. Over the long run, we have found that stocks with these characteristics have tended to outperform their peers in different macroeconomic environments.
Equity securities are subject to stock market fluctuations that occur in response to economic and business developments.
| | | | |
| Portfolio Breakdown1 | |
| |
as of 02/29/12 | | | | |
Consumer Discretionary | | | 10.2 | % |
Consumer Staples | | | 10.4 | |
Energy | | | 12.0 | |
Financials | | | 13.9 | |
Health Care | | | 10.9 | |
Industrials | | | 10.9 | |
Information Technology | | | 20.4 | |
Materials | | | 3.7 | |
Telecommunication Services | | | 2.7 | |
Utilities | | | 3.3 | |
Other(2) | | | 1.6 | |
| | 1 | Percentages indicated are based upon total investments (excluding Investments of Cash Collateral Received for Securities on Loan). The Fund’s portfolio composition is subject to change. |
| | 2 | Includes investments in affiliated money market fund. |
| | | | |
| Top Ten Holdings1 | |
| |
as of 02/29/12 | | | | |
Apple, Inc. | | | 5.1 | % |
Microsoft Corp. | | | 2.9 | |
Chevron Corp. | | | 2.7 | |
Exxon Mobil Corp. | | | 2.6 | |
Pfizer, Inc. | | | 2.2 | |
JPMorgan Chase & Co. | | | 2.2 | |
Philip Morris International, Inc. | | | 2.2 | |
Wells Fargo & Co. | | | 2.0 | |
International Business Machines Corp. | | | 1.9 | |
Wal-Mart Stores, Inc. | | | 1.7 | |
| | 1 | Percentages indicated are based upon total investments (excluding Investments of Cash Collateral Received for Securities on Loan and affiliated money market fund). |
| | | For further detail about these holdings, please refer to the section entitled “Portfolio of Investments.” |
5
Portfolio of Investments – Columbia Large Cap Enhanced Core Fund
February 29, 2012
(Percentages represent value of investments compared to net assets)
| | | | | | | | |
| Issuer | |
Shares | | | Value | |
Common Stocks 99.7% | |
CONSUMER DISCRETIONARY 10.3% | | | | | | | | |
Diversified Consumer Services 0.8% | | | | | | | | |
Apollo Group, Inc., Class A(a) | | | 52,250 | | | | $2,227,940 | |
Hotels, Restaurants & Leisure 0.5% | | | | | | | | |
McDonald’s Corp. | | | 900 | | | | 89,352 | |
Yum! Brands, Inc. | | | 21,200 | | | | 1,404,288 | |
| | | | | | | | |
Total | | | | | | | 1,493,640 | |
Internet & Catalog Retail 0.6% | | | | | | | | |
Expedia, Inc.(b) | | | 29,350 | | | | 999,368 | |
Netflix, Inc.(a)(b) | | | 5,100 | | | | 564,723 | |
| | | | | | | | |
Total | | | | | | | 1,564,091 | |
Media 3.4% | | | | | | | | |
Comcast Corp., Class A | | | 102,400 | | | | 3,008,512 | |
DIRECTV, Class A(a) | | | 72,850 | | | | 3,374,412 | |
McGraw-Hill Companies, Inc.(The) | | | 52,200 | | | | 2,429,388 | |
Viacom, Inc., Class B | | | 16,300 | | | | 776,206 | |
| | | | | | | | |
Total | | | | | | | 9,588,518 | |
Multiline Retail 1.3% | | | | | | | | |
Dollar Tree, Inc.(a) | | | 21,700 | | | | 1,920,667 | |
Macy’s, Inc. | | | 46,200 | | | | 1,754,214 | |
| | | | | | | | |
Total | | | | | | | 3,674,881 | |
Specialty Retail 2.8% | | | | | | | | |
Bed Bath & Beyond, Inc.(a) | | | 13,600 | | | | 812,464 | |
Best Buy Co., Inc.(b) | | | 13,800 | | | | 340,860 | |
GameStop Corp., Class A(b) | | | 94,800 | | | | 2,159,544 | |
Ross Stores, Inc. | | | 32,200 | | | | 1,717,226 | |
TJX Companies, Inc. | | | 82,400 | | | | 3,016,664 | |
| | | | | | | | |
Total | | | | | | | 8,046,758 | |
Textiles, Apparel & Luxury Goods 0.9% | | | | | | | | |
Coach, Inc. | | | 17,700 | | | | 1,324,668 | |
Ralph Lauren Corp. | | | 7,800 | | | | 1,355,094 | |
| | | | | | | | |
Total | | | | | | | 2,679,762 | |
TOTAL CONSUMER DISCRETIONARY | | | | | | | 29,275,590 | |
CONSUMER STAPLES 10.5% | | | | | | | | |
Beverages 1.2% | | | | | | | | |
Coca-Cola Co.(The) | | | 14,900 | | | | 1,040,914 | |
Coca-Cola Enterprises, Inc. | | | 79,600 | | | | 2,300,440 | |
| | | | | | | | |
Total | | | | | | | 3,341,354 | |
Food & Staples Retailing 3.4% | | | | | | | | |
CVS Caremark Corp. | | | 39,200 | | | | 1,767,920 | |
Kroger Co.(The) | | | 118,700 | | | | 2,823,873 | |
Wal-Mart Stores, Inc. | | | 83,650 | | | | 4,942,042 | |
Walgreen Co. | | | 5,350 | | | | 177,406 | |
| | | | | | | | |
Total | | | | | | | 9,711,241 | |
Food Products 1.5% | | | | | | | | |
Campbell Soup Co.(b) | | | 75,500 | | | | 2,515,660 | |
Tyson Foods, Inc., Class A(b) | | | 99,500 | | | | 1,881,545 | |
| | | | | | | | |
Total | | | | | | | 4,397,205 | |
| | | | | | | | |
| Issuer | |
Shares | | | Value | |
Common Stocks (continued) | |
CONSUMER STAPLES (cont.) | | | | | | | | |
Household Products 0.8% | | | | | | | | |
Kimberly-Clark Corp.(b) | | | 9,650 | | | | $703,292 | |
Procter & Gamble Co.(The) | | | 23,850 | | | | 1,610,352 | |
| | | | | | | | |
Total | | | | | | | 2,313,644 | |
Tobacco 3.6% | | | | | | | | |
Altria Group, Inc. | | | 23,250 | | | | 699,825 | |
Lorillard, Inc. | | | 24,800 | | | | 3,250,784 | |
Philip Morris International, Inc. | | | 73,370 | | | | 6,127,862 | |
| | | | | | | | |
Total | | | | | | | 10,078,471 | |
TOTAL CONSUMER STAPLES | | | | | | | 29,841,915 | |
ENERGY 12.1% | | | | | | | | |
Energy Equipment & Services 1.5% | | | | | | | | |
National Oilwell Varco, Inc. | | | 39,350 | | | | 3,247,555 | |
Schlumberger Ltd. | | | 14,500 | | | | 1,125,345 | |
| | | | | | | | |
Total | | | | | | | 4,372,900 | |
Oil, Gas & Consumable Fuels 10.6% | | | | | | | | |
Apache Corp. | | | 34,200 | | | | 3,691,206 | |
Chevron Corp. | | | 69,700 | | | | 7,605,664 | |
ConocoPhillips | | | 37,620 | | | | 2,879,811 | |
Exxon Mobil Corp. | | | 83,494 | | | | 7,222,231 | |
Marathon Oil Corp. | | | 97,900 | | | | 3,317,831 | |
Tesoro Corp.(a) | | | 95,100 | | | | 2,523,003 | |
Valero Energy Corp. | | | 112,900 | | | | 2,764,921 | |
| | | | | | | | |
Total | | | | | | | 30,004,667 | |
TOTAL ENERGY | | | | | | | 34,377,567 | |
FINANCIALS 14.1% | | | | | | | | |
Capital Markets 1.8% | | | | | | | | |
BlackRock, Inc. | | | 13,400 | | | | 2,666,600 | |
Franklin Resources, Inc.(b) | | | 21,350 | | | | 2,516,952 | |
| | | | | | | | |
Total | | | | | | | 5,183,552 | |
Commercial Banks 2.1% | | | | | | | | |
Regions Financial Corp. | | | 64,800 | | | | 373,248 | |
Wells Fargo & Co. | | | 176,500 | | | | 5,522,685 | |
| | | | | | | | |
Total | | | | | | | 5,895,933 | |
Consumer Finance 1.0% | | | | | | | | |
Discover Financial Services | | | 96,110 | | | | 2,884,261 | |
Diversified Financial Services 4.4% | | | | | | | | |
Bank of America Corp. | | | 73,200 | | | | 583,404 | |
Citigroup, Inc. | | | 66,425 | | | | 2,213,281 | |
IntercontinentalExchange, Inc.(a) | | | 14,400 | | | | 1,986,624 | |
JPMorgan Chase & Co. | | | 158,400 | | | | 6,215,616 | |
Moody’s Corp.(b) | | | 37,000 | | | | 1,428,570 | |
| | | | | | | | |
Total | | | | | | | 12,427,495 | |
Insurance 3.3% | | | | | | | | |
Aflac, Inc. | | | 47,510 | | | | 2,244,847 | |
Berkshire Hathaway, Inc., Class B(a) | | | 8,000 | | | | 627,600 | |
Lincoln National Corp.(b) | | | 85,600 | | | | 2,126,304 | |
MetLife, Inc. | | | 40,200 | | | | 1,549,710 | |
Prudential Financial, Inc. | | | 45,200 | | | | 2,764,432 | |
| | | | | | | | |
Total | | | | | | | 9,312,893 | |
The Accompanying Notes to Financial Statements are an integral part of this statement
6
Columbia Large Cap Enhanced Core Fund
February 29, 2012
| | | | | | | | |
| Issuer | |
Shares | | | Value | |
Common Stocks (continued) | |
FINANCIALS (cont.) | | | | | | | | |
Real Estate Investment Trusts (REITs) 1.5% | | | | | | | | |
Public Storage | | | 4,500 | | | | $603,315 | |
Simon Property Group, Inc. | | | 26,550 | | | | 3,596,994 | |
| | | | | | | | |
Total | | | | | | | 4,200,309 | |
TOTAL FINANCIALS | | | | | | | 39,904,443 | |
HEALTH CARE 11.1% | | | | | | | | |
Biotechnology 1.4% | | | | | | | | |
Amgen, Inc. | | | 57,600 | | | | 3,913,920 | |
Health Care Equipment & Supplies 0.5% | | | | | | | | |
Zimmer Holdings, Inc.(a)(b) | | | 22,500 | | | | 1,366,875 | |
Health Care Providers & Services 1.7% | | | | | | | | |
Aetna, Inc. | | | 19,800 | | | | 925,848 | |
AmerisourceBergen Corp. | | | 62,600 | | | | 2,338,110 | |
Humana, Inc. | | | 12,300 | | | | 1,071,330 | |
McKesson Corp. | | | 4,700 | | | | 392,497 | |
| | | | | | | | |
Total | | | | | | | 4,727,785 | |
Pharmaceuticals 7.5% | | | | | | | | |
Abbott Laboratories(b) | | | 78,600 | | | | 4,449,546 | |
Bristol-Myers Squibb Co. | | | 28,000 | | | | 900,760 | |
Eli Lilly & Co. | | | 86,700 | | | | 3,402,108 | |
Johnson & Johnson | | | 23,100 | | | | 1,503,348 | |
Merck & Co., Inc. | | | 124,900 | | | | 4,767,433 | |
Pfizer, Inc. | | | 297,560 | | | | 6,278,516 | |
| | | | | | | | |
Total | | | | | | | 21,301,711 | |
TOTAL HEALTH CARE | | | | | | | 31,310,291 | |
INDUSTRIALS 11.0% | | | | | | | | |
Aerospace & Defense 4.1% | | | | | | | | |
General Dynamics Corp. | | | 42,180 | | | | 3,088,841 | |
Lockheed Martin Corp.(b) | | | 36,500 | | | | 3,226,965 | |
Northrop Grumman Corp. | | | 15,000 | | | | 897,150 | |
Raytheon Co.(b) | | | 2,350 | | | | 118,722 | |
United Technologies Corp. | | | 51,850 | | | | 4,348,660 | |
| | | | | | | | |
Total | | | | | | | 11,680,338 | |
Air Freight & Logistics 1.4% | | | | | | | | |
United Parcel Service, Inc., Class B | | | 51,350 | | | | 3,948,301 | |
Commercial Services & Supplies 1.3% | | | | | | | | |
Pitney Bowes, Inc.(b) | | | 71,400 | | | | 1,294,482 | |
RR Donnelley & Sons Co.(b) | | | 162,375 | | | | 2,244,023 | |
| | | | | | | | |
Total | | | | | | | 3,538,505 | |
Electrical Equipment 0.2% | | | | | | | | |
Emerson Electric Co. | | | 13,500 | | | | 679,185 | |
Industrial Conglomerates 2.8% | | | | | | | | |
3M Co. | | | 24,900 | | | | 2,181,240 | |
General Electric Co.(c) | | | 129,400 | | | | 2,465,070 | |
Tyco International Ltd. | | | 63,450 | | | | 3,287,979 | |
| | | | | | | | |
Total | | | | | | | 7,934,289 | |
Machinery 1.2% | | | | | | | | |
Cummins, Inc. | | | 7,000 | | | | 843,990 | |
Parker Hannifin Corp. | | | 28,800 | | | | 2,586,528 | |
| | | | | | | | |
Total | | | | | | | 3,430,518 | |
TOTAL INDUSTRIALS | | | | | | | 31,211,136 | |
| | | | | | | | |
| Issuer | |
Shares | | | Value | |
Common Stocks (continued) | |
INFORMATION TECHNOLOGY 20.7% | | | | | | | | |
Communications Equipment 3.1% | | | | | | | | |
Cisco Systems, Inc. | | | 228,550 | | | | $4,543,574 | |
QUALCOMM, Inc. | | | 67,300 | | | | 4,184,714 | |
| | | | | | | | |
Total | | | | | | | 8,728,288 | |
Computers & Peripherals 5.8% | | | | | | | | |
Apple, Inc.(a) | | | 26,600 | | | | 14,428,904 | |
Dell, Inc.(a) | | | 114,300 | | | | 1,977,390 | |
| | | | | | | | |
Total | | | | | | | 16,406,294 | |
Internet Software & Services 0.4% | | | | | | | | |
Google, Inc., Class A(a) | | | 1,950 | �� | | | 1,205,588 | |
IT Services 4.1% | | | | | | | | |
International Business Machines Corp.(b) | | | 26,700 | | | | 5,252,691 | |
Mastercard, Inc., Class A | | | 8,200 | | | | 3,444,000 | |
Visa, Inc., Class A | | | 24,800 | | | | 2,885,976 | |
| | | | | | | | |
Total | | | | | | | 11,582,667 | |
Semiconductors & Semiconductor Equipment 1.9% | | | | | | | | |
Altera Corp. | | | 3,900 | | | | 149,955 | |
Broadcom Corp., Class A(a) | | | 68,200 | | | | 2,533,630 | |
Intel Corp. | | | 22,430 | | | | 602,918 | |
NVIDIA Corp.(a) | | | 141,000 | | | | 2,136,150 | |
| | | | | | | | |
Total | | | | | | | 5,422,653 | |
Software 5.4% | | | | | | | | |
BMC Software, Inc.(a) | | | 60,200 | | | | 2,253,888 | |
Microsoft Corp. | | | 260,500 | | | | 8,268,270 | |
Oracle Corp. | | | 160,350 | | | | 4,693,444 | |
| | | | | | | | |
Total | | | | | | | 15,215,602 | |
TOTAL INFORMATION TECHNOLOGY | | | | | | | 58,561,092 | |
MATERIALS 3.8% | | | | | | | | |
Chemicals 2.2% | | | | | | | | |
CF Industries Holdings, Inc.(b) | | | 16,300 | | | | 3,031,800 | |
Eastman Chemical Co. | | | 44,200 | | | | 2,392,546 | |
PPG Industries, Inc.(b) | | | 7,300 | | | | 666,125 | |
| | | | | | | | |
Total | | | | | | | 6,090,471 | |
Metals & Mining 1.5% | | | | | | | | |
Cliffs Natural Resources, Inc. | | | 11,600 | | | | 736,368 | |
Freeport-McMoRan Copper & Gold, Inc. | | | 61,900 | | | | 2,634,464 | |
Newmont Mining Corp. | | | 15,200 | | | | 902,880 | |
| | | | | | | | |
Total | | | | | | | 4,273,712 | |
Paper & Forest Products 0.1% | | | | | | | | |
International Paper Co. | | | 11,900 | | | | 418,285 | |
TOTAL MATERIALS | | | | | | | 10,782,468 | |
TELECOMMUNICATION SERVICES 2.8% | | | | | | | | |
Diversified Telecommunication Services 2.8% | | | | | | | | |
AT&T, Inc.(b) | | | 99,100 | | | | 3,031,469 | |
Verizon Communications, Inc. | | | 123,900 | | | | 4,721,829 | |
| | | | | | | | |
Total | | | | | | | 7,753,298 | |
TOTAL TELECOMMUNICATION SERVICES | | | | | | | 7,753,298 | |
The Accompanying Notes to Financial Statements are an integral part of this statement
7
Columbia Large Cap Enhanced Core Fund
February 29, 2012
| | | | | | | | |
| Issuer | |
Shares | | | Value | |
Common Stocks (continued) | |
UTILITIES 3.3% | | | | | | | | |
Electric Utilities 1.4% | | | | | | | | |
Entergy Corp. | | | 19,400 | | | | $1,292,622 | |
Exelon Corp.(b) | | | 66,200 | | | | 2,586,434 | |
| | | | | | | | |
Total | | | | | | | 3,879,056 | |
Independent Power Producers & Energy Traders 1.0% | |
AES Corp.(The)(a) | | | 223,200 | | | | 3,026,592 | |
Multi-Utilities 0.9% | | | | | | | | |
Public Service Enterprise Group, Inc. | | | 82,100 | | | | 2,527,038 | |
TOTAL UTILITIES | | | | | | | 9,432,686 | |
Total Common Stocks | | | | | | | | |
(Cost: $193,346,383) | | | | | | | $282,450,486 | |
| |
Money Market Funds 1.6% | |
Columbia Short-Term Cash Fund, 0.166%(d)(e) | | | 4,604,916 | | | | 4,604,916 | |
Total Money Market Funds | | | | | | | | |
(Cost: $4,604,916) | | | | | | | $4,604,916 | |
| | | | | | | | | | | | |
| Issuer | | Effective
Yield | | | Par/Principal/
Shares | | | Value | |
Investments of Cash Collateral Received for Securities on Loan 9.7% | |
Certificates of Deposit 0.3% | |
Skandinaviska Enskilda Banken | |
04/16/12 | | | 0.360 | % | | | 1,000,000 | | | | $1,000,000 | |
| | | | | | | | | | | | |
Total | | | | | | | | | | | 1,000,000 | |
Repurchase Agreements 9.4% | |
Citibank NA dated 02/29/12, matures 03/01/12, repurchase
price $2,000,011(f) | |
| | | 0.190 | % | | | $2,000,000 | | | | 2,000,000 | |
Citigroup Global Markets, Inc. dated 02/29/12, matures 03/01/12, repurchase price $5,000,018(f) | |
| | | 0.130 | % | | | 5,000,000 | | | | 5,000,000 | |
Credit Suisse Securities (USA) LLC dated 02/29/12, matures 03/01/12, repurchase price $590,217(f) | |
| | | 0.160 | % | | | 590,215 | | | | 590,215 | |
Natixis Financial Products, Inc. dated 02/29/12, matures 03/01/12, repurchase price $3,000,018(f) | |
| | | 0.220 | % | | | 3,000,000 | | | | 3,000,000 | |
Nomura Securities dated 02/29/12, matures 03/01/12, repurchase price $13,000,072(f) | |
| | | 0.200 | % | | | 13,000,000 | | | | 13,000,000 | |
Pershing LLC dated 02/29/12, matures 03/01/12, repurchase price $3.000,024(f) | |
| | | 0.290 | % | | | 3,000,000 | | | | 3,000,000 | |
| | | | | | | | | | | | |
Total | | | | | | | | | | | 26,590,215 | |
Total Investments of Cash Collateral Received for Securities on Loan | | | | | |
(Cost: $27,590,215) | | | | $27,590,215 | |
Total Investments | | | | | |
(Cost: $225,541,514) | | | | $314,645,617 | |
Other Assets & Liabilities, Net | | | | (31,217,029 | ) |
Net Assets | | | | $283,428,588 | |
Investment in Derivatives
Futures Contracts Outstanding at February 29, 2012
| | | | | | | | | | | | | | | | | | | | |
| Contract Description | | Number of
Contracts
Long (Short) | | | Notional
Market Value | | | Expiration
Date | | | Unrealized
Appreciation | | | Unrealized
Depreciation | |
S&P 500 Index | | | 4 | | | | $1,364,400 | | | | March 2012 | | | | $155,758 | | | | $— | |
|
Notes to Portfolio of Investments |
| (b) | At February 29, 2012, security was partially or fully on loan. |
| (c) | At February 29, 2012, investments in securities included securities valued at $1,004,325 that were partially pledged as collateral to cover initial margin deposits on open stock index futures contracts. |
| (d) | The rate shown is the seven-day current annualized yield at February 29, 2012. |
| (e) | Investments in affiliates during the year ended February 29, 2012: |
| | | | | | | | | | | | | | | | | | | | | | | | | | | | |
| Issuer | | Beginning
Cost | | | Purchase
Cost | | | Sales Cost/
Proceeds
from Sales | | | Realized
Gain/Loss | | | Ending
Cost | | | Dividends
or Interest
Income | | | Value | |
Columbia Short-Term Cash Fund | | | $— | | | | $52,300,783 | | | | $(47,695,867 | ) | | | $— | | | | $4,604,916 | | | | $5,059 | | | | $4,604,916 | |
The Accompanying Notes to Financial Statements are an integral part of this statement
8
Columbia Large Cap Enhanced Core Fund
February 29, 2012
|
Notes to Portfolio of Investments (continued) |
| (f) | The table below represents securities received as collateral for repurchase agreements. This collateral is deposited with the Fund’s custodian and, pursuant to the terms of the repurchase agreement, must have an aggregate market value greater than or equal to the repurchase price plus accrued interest at all times. The value of securities and/or cash held as collateral for repurchase agreements is monitored on a daily basis to ensure the existence of the proper level of collateral. |
Citibank NA (0.190%)
| | | | |
| Security Description | | Value | |
Fannie Mae REMICS | | | $852,711 | |
Freddie Mac REMICS | | | 856,633 | |
Government National Mortgage Association | | | 330,656 | |
Total Market Value of Collateral Securities | | | $2,040,000 | |
| |
| Citigroup Global Markets, Inc. (0.130%) | | | | |
| Security Description | | Value | |
Fannie Mae REMICS | | | $2,392,734 | |
Fannie Mae-Aces | | | 264,929 | |
Freddie Mac REMICS | | | 1,919,413 | |
Government National Mortgage Association | | | 522,924 | |
Total Market Value of Collateral Securities | | | $5,100,000 | |
| |
| Credit Suisse Securities (USA) LLC (0.160%) | | | | |
| Security Description | | Value | |
Ginnie Mae I Pool | | | $422,536 | |
Ginnie Mae II Pool | | | 179,484 | |
Total Market Value of Collateral Securities | | | $602,020 | |
| |
| Natixis Financial Products, Inc. (0.220%) | | | | |
| Security Description | | Value | |
Fannie Mae Pool | | | $150,920 | |
Fannie Mae REMICS | | | 1,124,003 | |
Freddie Mac Gold Pool | | | 138,181 | |
Freddie Mac REMICS | | | 662,766 | |
Government National Mortgage Association | | | 197,835 | |
United States Treasury Note/Bond | | | 786,314 | |
Total Market Value of Collateral Securities | | | $3,060,019 | |
| |
| Nomura Securities (0.200%) | | | | |
| Security Description | | Value | |
Ginnie Mae II Pool | | | $13,260,000 | |
Total Market Value of Collateral Securities | | | $13,260,000 | |
The Accompanying Notes to Financial Statements are an integral part of this statement
9
Columbia Large Cap Enhanced Core Fund
February 29, 2012
|
Notes to Portfolio of Investments (continued) |
| | | | |
| Pershing LLC (0.290%) | | | | |
| Security Description | | Value | |
Fannie Mae Pool | | | $489,761 | |
Fannie Mae REMICS | | | 413,015 | |
Fannie Mae-Aces | | | 4,162 | |
Federal Farm Credit Bank | | | 37,011 | |
Federal Home Loan Banks | | | 39,808 | |
Federal Home Loan Mortgage Corp | | | 93,834 | |
Federal National Mortgage Association | | | 115,734 | |
Freddie Mac Gold Pool | | | 198,735 | |
Freddie Mac Non Gold Pool | | | 55,505 | |
Freddie Mac Reference REMIC | | | 13 | |
Freddie Mac REMICS | | | 384,684 | |
Ginnie Mae I Pool | | | 502,006 | |
Ginnie Mae II Pool | | | 447,572 | |
Government National Mortgage Association | | | 160,601 | |
United States Treasury Note/Bond | | | 110,756 | |
United States Treasury Strip Coupon | | | 6,803 | |
Total Market Value of Collateral Securities | | | $3,060,000 | |
Generally accepted accounting principles (GAAP) require disclosure regarding the inputs and valuation techniques used to measure fair value and any changes in valuation inputs or techniques. In addition, investments shall be disclosed by major category.
The Fund categorizes its fair value measurements according to a three-level hierarchy that maximizes the use of observable inputs and minimizes the use of unobservable inputs by prioritizing that the most observable input be used when available. Observable inputs are those that market participants would use in pricing an investment based on market data obtained from sources independent of the reporting entity. Unobservable inputs are those that reflect the Fund’s assumptions about the information market participants would use in pricing an investment. An investment’s level within the fair value hierarchy is based on the lowest level of any input that is deemed significant to the asset or liability’s fair value measurement. The input levels are not necessarily an indication of the risk or liquidity associated with investments at that level. For example, certain U.S. government securities are generally high quality and liquid, however, they are reflected as Level 2 because the inputs used to determine fair value may not always be quoted prices in an active market.
Fair value inputs are summarized in the three broad levels listed below:
| | Ÿ | | Level 1 — Valuations based on quoted prices for investments in active markets that the Fund has the ability to access at the measurement date (including NAV for open-end mutual funds). Valuation adjustments are not applied to Level 1 investments. |
| | Ÿ | | Level 2 — Valuations based on other significant observable inputs (including quoted prices for similar securities, interest rates, prepayment speeds, credit risks, etc.). |
| | Ÿ | | Level 3 — Valuations based on significant unobservable inputs (including the Fund’s own assumptions and judgment in determining the fair value of investments). |
Inputs that are used in determining fair value of an investment may include price information, credit data, volatility statistics, and other factors. These inputs can be either observable or unobservable. The availability of observable inputs can vary between investments, and is affected by various factors such as the type of investment, and the volume and level of activity for that investment or similar investments in the marketplace. The inputs will be considered by the Investment Manager, along with any other relevant factors in the calculation of an investment’s fair value. The Fund uses prices and inputs that are current as of the measurement date, which may include periods of market dislocations. During these periods, the availability of prices and inputs may be reduced for many investments. This condition could cause an investment to be reclassified between the various levels within the hierarchy.
Investments falling into the Level 3 category are primarily supported by quoted prices from brokers and dealers participating in the market for those investments. However, these may be classified as Level 3 investments due to lack of market transparency and corroboration to support these quoted prices. Additionally, valuation models may be used as the pricing source for any remaining investments classified as Level 3. These models rely on one or more significant unobservable inputs and/or significant assumptions by the Investment Manager. Inputs used in valuations may include, but are not limited to, financial statement analysis, capital account balances, discount rates and estimated cash flows, and comparable company data.
The Accompanying Notes to Financial Statements are an integral part of this statement
10
Columbia Large Cap Enhanced Core Fund
February 29, 2012
|
Fair Value Measurements (continued) |
The following table is a summary of the inputs used to value the Fund’s investments as of February 29, 2012:
| | | | | | | | | | | | | | | | |
| | | Fair value at February 29, 2012 | |
| Description(a) | | Level 1
quoted prices
in active
markets for
identical assets(b) | | | Level 2
other
significant
observable
inputs | | | Level 3
significant
unobservable
inputs | | | Total | |
Equity Securities | | | | | | | | | | | | | | | | |
Common Stocks | | | | | | | | | | | | | | | | |
Consumer Discretionary | | | $29,275,590 | | | | $— | | | | $— | | | | $29,275,590 | |
Consumer Staples | | | 29,841,915 | | | | — | | | | — | | | | 29,841,915 | |
Energy | | | 34,377,567 | | | | — | | | | — | | | | 34,377,567 | |
Financials | | | 39,904,443 | | | | — | | | | — | | | | 39,904,443 | |
Health Care | | | 31,310,291 | | | | — | | | | — | | | | 31,310,291 | |
Industrials | | | 31,211,136 | | | | — | | | | — | | | | 31,211,136 | |
Information Technology | | | 58,561,092 | | | | — | | | | — | | | | 58,561,092 | |
Materials | | | 10,782,468 | | | | — | | | | — | | | | 10,782,468 | |
Telecommunication Services | | | 7,753,298 | | | | — | | | | — | | | | 7,753,298 | |
Utilities | | | 9,432,686 | | | | — | | | | — | | | | 9,432,686 | |
Total Equity Securities | | | 282,450,486 | | | | — | | | | — | | | | 282,450,486 | |
Other | | | | | | | | | | | | | | | | |
Money Market Funds | | | 4,604,916 | | | | — | | | | — | | | | 4,604,916 | |
Investments of Cash Collateral Received for Securities on Loan | | | — | | | | 27,590,215 | | | | — | | | | 27,590,215 | |
Total Other | | | 4,604,916 | | | | 27,590,215 | | | | — | | | | 32,195,131 | |
Investments in Securities | | | 287,055,402 | | | | 27,590,215 | | | | — | | | | 314,645,617 | |
Derivatives(c) | | | | | | | | | | | | | | | | |
Assets | | | | | | | | | | | | | | | | |
Futures Contracts | | | 155,758 | | | | — | | | | — | | | | 155,758 | |
Total | | | $287,211,160 | | | | $27,590,215 | | | | $— | | | | $314,801,375 | |
The Fund’s assets assigned to the level 2 input category are generally valued using the market approach, in which a security’s value is determined through reference to prices and information from market transactions for similar or identical assets.
| (a) | See the Portfolio of Investments for all investment classifications not indicated in the table. |
| (b) | There were no significant transfers between Levels 1 and 2 during the period. |
| (c) | Derivative instruments are valued at unrealized appreciation (depreciation). |
The Accompanying Notes to Financial Statements are an integral part of this statement
11
Statement of Assets and Liabilities – Columbia Large Cap Enhanced Core Fund
February 29, 2012
| | | | |
| Assets | | | | |
Investments, at value* | | | | |
Unaffiliated issuers (identified cost $193,346,383) | | $ | 282,450,486 | |
Affiliated issuers (identified cost $4,604,916) | | | 4,604,916 | |
Investment of cash collateral received for securities on loan | | | | |
Short-term securities (identified cost $1,000,000) | | | 1,000,000 | |
Repurchase agreements (identified cost $26,590,215) | | | 26,590,215 | |
Total investments (identified cost $225,541,514) | | | 314,645,617 | |
Receivable for: | | | | |
Investments sold | | | 17,432,490 | |
Capital shares sold | | | 439,825 | |
Dividends | | | 830,214 | |
Interest | | | 6,350 | |
Prepaid expense | | | 4,199 | |
Total assets | | | 333,358,695 | |
| |
| Liabilities | | | | |
Due upon return of securities on loan | | | 27,590,215 | |
Payable for: | | | | |
Investments purchased | | | 16,594,811 | |
Capital shares purchased | | | 5,545,860 | |
Variation margin on futures contracts | | | 28,000 | |
Investment management fees | | | 3,879 | |
Distribution and service fees | | | 88 | |
Transfer agent fees | | | 36,727 | |
Administration fees | | | 475 | |
Other expenses | | | 130,052 | |
Total liabilities | | | 49,930,107 | |
Net assets applicable to outstanding capital stock | | $ | 283,428,588 | |
The Accompanying Notes to Financial Statements are an integral part of this statement
12
Statement of Assets and Liabilities (continued) – Columbia Large Cap Enhanced Core Fund
February 29, 2012
| | | | |
| Represented by | | | | |
Paid-in capital | | $ | 336,207,517 | |
Undistributed net investment income | | | 649,765 | |
Accumulated net realized loss | | | (142,688,555 | ) |
Unrealized appreciation (depreciation) on: | | | | |
Investments | | | 89,104,103 | |
Futures contracts | | | 155,758 | |
Total — representing net assets applicable to outstanding capital stock | | $ | 283,428,588 | |
*Value of securities on loan | | $ | 26,747,345 | |
Net assets applicable to outstanding shares | | | | |
Class A | | $ | 12,403,965 | |
Class I | | $ | 13,296,575 | |
Class R | | $ | 203,724 | |
Class Y | | $ | 3,024,039 | |
Class Z | | $ | 254,500,285 | |
Shares outstanding | | | | |
Class A | | | 907,705 | |
Class I | | | 975,596 | |
Class R | | | 14,922 | |
Class Y | | | 221,939 | |
Class Z | | | 18,682,810 | |
Net asset value per share | | | | |
Class A | | $ | 13.67 | |
Class I | | $ | 13.63 | |
Class R | | $ | 13.65 | |
Class Y | | $ | 13.63 | |
Class Z | | $ | 13.62 | |
The Accompanying Notes to Financial Statements are an integral part of this statement
13
Statement of Operations – Columbia Large Cap Enhanced Core Fund
Year Ended February 29, 2012
| | | | |
| Net investment income | | | | |
Income: | | | | |
Dividends | | $ | 7,124,765 | |
Interest | | | 1,272 | |
Dividends from affiliates | | | 5,059 | |
Income from securities lending — net | | | 16,515 | |
Total income | | | 7,147,611 | |
Expenses: | | | | |
Investment management fees | | | 1,790,035 | |
Distribution fees | | | | |
Class R | | | 992 | |
Distribution and service fees — Class A | | | 28,967 | |
Transfer agent fees | | | | |
Class A | | | 23,148 | |
Class R | | | 395 | |
Class Y | | | 58 | |
Class Z | | | 598,960 | |
Administration fees | | | 298,190 | |
Compensation of board members | | | 14,438 | |
Pricing and bookkeeping fees | | | 30,316 | |
Custodian fees | | | 11,372 | |
Printing and postage fees | | | 89,518 | |
Registration fees | | | 62,399 | |
Professional fees | | | 45,208 | |
Line of credit interest expense | | | 662 | |
Chief compliance officer expenses | | | 85 | |
Other | | | 22,353 | |
Total expenses | | | 3,017,096 | |
Fees waived or expenses reimbursed by Investment Manager and its affiliates | | | (768,210 | ) |
Expense reductions | | | (300 | ) |
Total net expenses | | | 2,248,586 | |
Net investment income | | | 4,899,025 | |
| |
| Realized and unrealized gain (loss) — net | | | | |
Net realized gain (loss) on: | | | | |
Investments | | | 53,424,978 | |
Futures contracts | | | 1,794,799 | |
Net realized gain | | | 55,219,777 | |
Net change in unrealized appreciation (depreciation) on: | | | | |
Investments | | | (39,847,366 | ) |
Futures contracts | | | 166,894 | |
Net change in unrealized depreciation | | | (39,680,472 | ) |
Net realized and unrealized gain | | | 15,539,305 | |
Net increase in net assets resulting from operations | | $ | 20,438,330 | |
The Accompanying Notes to Financial Statements are an integral part of this statement
14
Statement of Changes in Net Assets – Columbia Large Cap Enhanced Core Fund
| | | | | | | | |
| | | Year ended
February 29, 2012 | | | Year ended
February 28, 2011(a) | |
| | |
| Operations | | | | | | | | |
Net investment income | | $ | 4,899,025 | | | $ | 6,681,777 | |
Net realized gain | | | 55,219,777 | | | | 67,285,135 | |
Net change in unrealized appreciation (depreciation) | | | (39,680,472 | ) | | | 11,901,803 | |
Net increase in net assets resulting from operations | | | 20,438,330 | | | | 85,868,715 | |
| | |
| Distributions to shareholders from: | | | | | | | | |
Net investment income | | | | | | | | |
Class A | | | (177,778 | ) | | | (142,166 | ) |
Class I | | | (218,209 | ) | | | (38 | ) |
Class R | | | (2,930 | ) | | | (1,179 | ) |
Class Y | | | (56,015 | ) | | | (458,353 | ) |
Class Z | | | (4,721,975 | ) | | | (5,796,706 | ) |
Total distributions to shareholders | | | (5,176,907 | ) | | | (6,398,442 | ) |
Increase (decrease) in net assets from share transactions | | | (148,478,815 | ) | | | (187,436,361 | ) |
Total decrease in net assets | | | (133,217,392 | ) | | | (107,966,088 | ) |
Net assets at beginning of year | | | 416,645,980 | | | | 524,612,068 | |
Net assets at end of year | | $ | 283,428,588 | | | $ | 416,645,980 | |
Undistributed net investment income | | $ | 649,765 | | | $ | 927,647 | |
| (a) | Class I shares are for the period from September 27, 2011 (commencement of operations) to February 28, 2011. |
The Accompanying Notes to Financial Statements are an integral part of this statement
15
Statement of Changes in Net Assets (continued) – Columbia Large Cap Enhanced Core Fund
| | | | | | | | | | | | | | | | |
| | | Year ended
February 29, 2012 | | | Year ended
February 28, 2011(a) | |
| | | Shares | | | Dollars ($) | | | Shares | | | Dollars ($) | |
| | | | |
| Capital stock activity | | | | | | | | | | | | | | | | |
Class A shares | | | | | | | | | | | | | | | | |
Subscriptions | | | 102,738 | | | | 1,292,075 | | | | 96,908 | | | | 1,096,367 | |
Distributions reinvested | | | 6,941 | | | | 85,718 | | | | 5,732 | | | | 67,413 | |
Redemptions | | | (155,456 | ) | | | (1,913,399 | ) | | | (300,096 | ) | | | (3,370,740 | ) |
Net decrease | | | (45,777 | ) | | | (535,606 | ) | | | (197,456 | ) | | | (2,206,960 | ) |
Class I shares | | | | | | | | | | | | | | | | |
Subscriptions | | | 1,115,305 | | | | 13,431,106 | | | | 713,340 | | | | 8,467,866 | |
Distributions reinvested | | | 17,728 | | | | 218,155 | | | | — | | | | — | |
Redemptions | | | (741,741 | ) | | | (9,394,174 | ) | | | (129,036 | ) | | | (1,587,814 | ) |
Net increase | | | 391,292 | | | | 4,255,087 | | �� | | 584,304 | | | | 6,880,052 | |
Class R shares | | | | | | | | | | | | | | | | |
Subscriptions | | | 6,183 | | | | 74,577 | | | | 5,935 | | | | 72,269 | |
Distributions reinvested | | | 237 | | | | 2,930 | | | | 99 | | | | 1,179 | |
Redemptions | | | (5,162 | ) | | | (66,574 | ) | | | (2,786 | ) | | | (31,414 | ) |
Net increase | | | 1,258 | | | | 10,933 | | | | 3,248 | | | | 42,034 | |
Class Y shares | | | | | | | | | | | | | | | | |
Subscriptions | | | 4,531 | | | | 55,742 | | | | 21,371 | | | | 229,000 | |
Distributions reinvested | | | 23 | | | | 273 | | | | 24,439 | | | | 287,432 | |
Redemptions | | | (2,253,345 | ) | | | (28,066,198 | ) | | | (3,213,455 | ) | | | (35,542,959 | ) |
Net decrease | | | (2,248,791 | ) | | | (28,010,183 | ) | | | (3,167,645 | ) | | | (35,026,527 | ) |
Class Z shares | | | | | | | | | | | | | | | | |
Subscriptions | | | 1,005,023 | | | | 12,568,288 | | | | 1,788,867 | | | | 19,995,993 | |
Distributions reinvested | | | 12,154 | | | | 149,441 | | | | 30,932 | | | | 363,005 | |
Redemptions | | | (10,921,456 | ) | | | (136,916,775 | ) | | | (15,463,550 | ) | | | (177,483,958 | ) |
Net decrease | | | (9,904,279 | ) | | | (124,199,046 | ) | | | (13,643,751 | ) | | | (157,124,960 | ) |
Total net decrease | | | (11,806,297 | ) | | | (148,478,815 | ) | | | (16,421,300 | ) | | | (187,436,361 | ) |
| (a) | Class I shares are for the period from September 27, 2011 (commencement of operations) to February 28, 2011. |
The Accompanying Notes to Financial Statements are an integral part of this statement
16
Financial Highlights – Columbia Large Cap Enhanced Core Fund
The following tables are intended to help you understand the Fund’s financial performance. Certain information reflects financial results for a single share of a class held for the periods shown. Per share net investment income (loss) amounts are calculated based on average shares outstanding during the period. Total returns assume reinvestment of all dividends and distributions. Total returns do not reflect payment of sales charges, if any, and are not annualized for periods of less than one year.
| | | | | | | | | | | | | | | | | | | | |
| | | Year ended
Feb. 29, 2012 | | | Year ended Feb. 28, | | | Year ended
Feb. 29, 2008 | |
| | | | 2011 | | | 2010 | | | 2009 | | |
| Class A | | | | | | | | | | | | | | | |
| Per share data | | | | | | | | | | | | | | | | | | | | |
Net asset value, beginning of period | | | $12.81 | | | | $10.73 | | | | $7.24 | | | | $12.91 | | | | $14.58 | |
Income from investment operations: | | | | | | | | | | | | | | | | | | | | |
Net investment income | | | 0.17 | | | | 0.14 | | | | 0.13 | | | | 0.18 | | | | 0.19 | |
Net realized and unrealized gain (loss) | | | 0.89 | | | | 2.08 | | | | 3.52 | | | | (5.69 | ) | | | (0.85 | ) |
Total from investment operations | | | 1.06 | | | | 2.22 | | | | 3.65 | | | | (5.51 | ) | | | (0.66 | ) |
Less distributions to shareholders from: | | | | | | | | | | | | | | | | | | | | |
Net investment income | | | (0.20 | ) | | | (0.14 | ) | | | (0.16 | ) | | | (0.16 | ) | | | (0.15 | ) |
Net realized gains | | | — | | | | — | | | | — | | | | — | | | | (0.86 | ) |
Total distributions to shareholders | | | (0.20 | ) | | | (0.14 | ) | | | (0.16 | ) | | | (0.16 | ) | | | (1.01 | ) |
Proceeds from regulatory settlement | | | — | | | | — | | | | 0.00 | (a) | | | — | | | | — | |
Net asset value, end of period | | | $13.67 | | | | $12.81 | | | | $10.73 | | | | $7.24 | | | | $12.91 | |
| Total return | | | 8.41% | | | | 20.84% | | | | 50.49% | | | | (42.89% | ) | | | (5.29% | ) |
| Ratios to average net assets(b) | | | | | | | | | | | | | | | | | | | | |
Expenses prior to fees waived or expenses reimbursed (including interest expense) | | | 1.19% | (c) | | | 0.96% | (c) | | | 0.92% | (c) | | | 0.82% | (c) | | | 0.79% | |
Net expenses after fees waived or expenses reimbursed (including interest expense)(d) | | | 0.94% | (c)(e) | | | 0.95% | (c)(e) | | | 0.89% | (c)(e) | | | 0.75% | (c)(e) | | | 0.75% | (e) |
Expenses prior to fees waived or expenses reimbursed (excluding interest expense) | | | 1.19% | | | | 0.96% | | | | 0.92% | | | | 0.82% | | | | 0.79% | |
Net expenses after fees waived or expenses reimbursed (excluding interest expense)(d) | | | 0.94% | (e) | | | 0.95% | (e) | | | 0.89% | (e) | | | 0.75% | (e) | | | 0.75% | (e) |
Net investment income | | | 1.33% | (e) | | | 1.22% | (e) | | | 1.39% | (e) | | | 1.63% | (e) | | | 1.28% | (e) |
| Supplemental data | | | | | | | | | | | | | | | | | | | | |
Net assets, end of period (in thousands) | | | $12,404 | | | | $12,213 | | | | $12,348 | | | | $9,291 | | | | $17,281 | |
Portfolio turnover | | | 67% | | | | 63% | | | | 122% | | | | 246% | | | | 207% | |
Notes to Financial Highlights
| (a) | Rounds to less than $0.01. |
| (b) | In addition to the fees and expenses which the Fund bears directly, the Fund indirectly bears a pro rata share of the fees and expenses of the acquired funds in which it invests. Such indirect expenses are not included in the reported expense ratios. |
| (c) | Includes interest expense which rounds to less than 0.01%. |
| (d) | The Investment Manager and certain of its affiliates agreed to waive/reimburse certain fees and expenses, if applicable. |
| (e) | The benefits derived from expense reductions had an impact of less than 0.01%. |
The Accompanying Notes to Financial Statements are an integral part of this statement
17
Financial Highlights (continued) – Columbia Large Cap Enhanced Core Fund
| | | | | | | | |
| | | Year ended
Feb. 29, | | | Year ended
Feb. 28, | |
| | | 2012 | | | 2011(a) | |
| Class I | | | | | | |
| Per share data | | | | | | | | |
Net asset value, beginning of period | | | $12.78 | | | | $11.11 | |
Income from investment operations: | | | | | | | | |
Net investment income | | | 0.21 | | | | 0.09 | |
Net realized and unrealized gain | | | 0.88 | | | | 1.75 | |
Total from investment operations | | | 1.09 | | | | 1.84 | |
Less distributions to shareholders from: | | | | | | | | |
Net investment income | | | (0.24 | ) | | | (0.17 | ) |
Total distributions to shareholders | | | (0.24 | ) | | | (0.17 | ) |
Net asset value, end of period | | | $13.63 | | | | $12.78 | |
| Total return | | | 8.73% | | | | 16.65% | |
| Ratios to average net assets(b) | | | | | | | | |
Expenses prior to fees waived or expenses reimbursed (including interest expense) | | | 0.74% | (c) | | | 0.59% | (c)(d) |
Net expenses after fees waived or expenses reimbursed (including interest expense)(e) | | | 0.61% | (c) | | | 0.57% | (c)(d)(f) |
Expenses prior to fees waived or expenses reimbursed (excluding interest expense) | | | 0.74% | | | | 0.59% | (d) |
Net expenses after fees waived or expenses reimbursed (excluding interest expense)(e) | | | 0.61% | | | | 0.57% | (d)(f) |
Net investment income | | | 1.72% | | | | 1.68% | (d)(f) |
| Supplemental data | | | | | | | | |
Net assets, end of period (in thousands) | | | $13,297 | | | | $7,466 | |
Portfolio turnover | | | 67% | | | | 63% | |
Notes to Financial Highlights
| (a) | For the period from September 27, 2010 (commencement of operation) to February 28, 2011. |
| (b) | In addition to the fees and expenses which the Fund bears directly, the Fund indirectly bears a pro rata share of the fees and expenses of the acquired funds in which it invests. Such indirect expenses are not included in the reported expense ratios. |
| (c) | Includes interest expense which rounds to less than 0.01%. |
| (e) | The Investment Manager and certain of its affiliates agreed to waive/reimburse certain fees and expenses, if applicable. |
| (f) | The benefits derived from expense reductions had an impact of less than 0.01%. |
The Accompanying Notes to Financial Statements are an integral part of this statement
18
Financial Highlights (continued) – Columbia Large Cap Enhanced Core Fund
| | | | | | | | | | | | | | | | | | | | |
| | | Year ended
Feb. 29, 2012 | | | Year ended Feb. 28, | | | Year ended
Feb. 29, 2008 | |
| | | | 2011 | | | 2010 | | | 2009 | | |
| Class R | | | | | | | | | | | | | | | |
| Per share data | | | | | | | | | | | | | | | | | | | | |
Net asset value, beginning of period | | | $12.80 | | | | $10.72 | | | | $7.24 | | | | $12.90 | | | | $14.58 | |
Income from investment operations: | | | | | | | | | | | | | | | | | | | | |
Net investment income | | | 0.14 | | | | 0.12 | | | | 0.11 | | | | 0.16 | | | | 0.16 | |
Net realized and unrealized gain (loss) | | | 0.88 | | | | 2.08 | | | | 3.51 | | | | (5.69 | ) | | | (0.86 | ) |
Total from investment operations | | | 1.02 | | | | 2.20 | | | | 3.62 | | | | (5.53 | ) | | | (0.70 | ) |
Less distributions to shareholders from: | | | | | | | | | | | | | | | | | | | | |
Net investment income | | | (0.17 | ) | | | (0.12 | ) | | | (0.14 | ) | | | (0.13 | ) | | | (0.12 | ) |
Net realized gains | | | — | | | | — | | | | — | | | | — | | | | (0.86 | ) |
Total distributions to shareholders | | | (0.17 | ) | | | (0.12 | ) | | | (0.14 | ) | | | (0.13 | ) | | | (0.98 | ) |
Proceeds from regulatory settlement | | | — | | | | — | | | | 0.00 | (a) | | | — | | | | — | |
Net asset value, end of period | | | $13.65 | | | | $12.80 | | | | $10.72 | | | | $7.24 | | | | $12.90 | |
| Total return | | | 8.08% | | | | 20.58% | | | | 50.02% | | | | (43.01% | ) | | | (5.57% | ) |
| Ratios to average net assets(b) | | | | | | | | | | | | | | | | | | | | |
Expenses prior to fees waived or expenses reimbursed (including interest expense) | | | 1.44% | (c) | | | 1.21% | (c) | | | 1.17% | (c) | | | 1.07% | (c) | | | 1.04% | |
Net expenses after fees waived or expenses reimbursed (including interest expense)(d) | | | 1.19% | (c)(e) | | | 1.20% | (c)(e) | | | 1.14% | (c)(e) | | | 1.00% | (c)(e) | | | 1.00% | (e) |
Expenses prior to fees waived or expenses reimbursed (excluding interest expense) | | | 1.44% | | | | 1.21% | | | | 1.17% | | | | 1.07% | | | | 1.04% | |
Net expenses after fees waived or expenses reimbursed (excluding interest expense)(d) | | | 1.19% | (e) | | | 1.20% | (e) | | | 1.14% | (e) | | | 1.00% | (e) | | | 1.00% | (e) |
Net investment income(d) | | | 1.11% | (e) | | | 1.02% | (e) | | | 1.08% | (e) | | | 1.46% | (e) | | | 1.09% | (e) |
| Supplemental data | | | | | | | | | | | | | | | | | | | | |
Net assets, end of period (in thousands) | | | $204 | | | | $175 | | | | $112 | | | | $39 | | | | $46 | |
Portfolio turnover | | | 67% | | | | 63% | | | | 122% | | | | 246% | | | | 207% | |
Notes to Financial Highlights
| (a) | Rounds to less than $0.01. |
| (b) | In addition to the fees and expenses which the Fund bears directly, the Fund indirectly bears a pro rata share of the fees and expenses of the acquired funds in which it invests. Such indirect expenses are not included in the reported expense ratios. |
| (c) | Includes interest expense which rounds to less than 0.01%. |
| (d) | The Investment Manager and certain of its affiliates agreed to waive/reimburse certain fees and expenses, if applicable. |
| (e) | The benefits derived from expense reductions had an impact of less than 0.01%. |
The Accompanying Notes to Financial Statements are an integral part of this statement
19
Financial Highlights (continued) – Columbia Large Cap Enhanced Core Fund
| | | | | | | | | | | | |
| | | Year ended
Feb. 29, 2012 | | | Year ended Feb. 28, | |
| | | | 2011 | | | 2010(a) | |
| Class Y | | | | | | | | | |
| Per share data | | | | | | | | | | | | |
Net asset value, beginning of period | | | $12.78 | | | | $10.70 | | | | $9.10 | |
Income from investment operations | | | | | | | | | | | | |
Net investment income | | | 0.18 | | | | 0.17 | | | | 0.11 | |
Net realized and unrealized gain | | | 0.91 | | | | 2.09 | | | | 1.64 | |
Total from investment operations | | | 1.09 | | | | 2.26 | | | | 1.75 | |
Less distributions to shareholders from: | | | | | | | | | | | | |
Net investment income | | | (0.24 | ) | | | (0.18 | ) | | | (0.15 | ) |
Total distributions to shareholders | | | (0.24 | ) | | | (0.18 | ) | | | (0.15 | ) |
Net asset value, end of period | | | $13.63 | | | | $12.78 | | | | $10.70 | |
| Total return | | | 8.74% | | | | 21.30% | | | | 19.23% | |
| Ratios to average net assets(b) | | | | | | | | | | | | |
Expenses prior to fees waived or expenses reimbursed (including interest expense) | | | 0.74% | (c) | | | 0.59% | (c) | | | 0.57% | (c)(d) |
Net Expenses after fees waived or expenses reimbursed (including interest expense)(e) | | | 0.60% | (c) | | | 0.58% | (c)(f) | | | 0.57% | (c)(d)(f) |
Expenses prior to fees waived or expenses reimbursed (excluding interest expense) | | | 0.74% | | | | 0.59% | | | | 0.57% | (d) |
Net Expenses after fees waived or expenses reimbursed (excluding interest expense)(e) | | | 0.60% | | | | 0.58% | (f) | | | 0.57% | (d)(f) |
Net investment income | | | 1.46% | | | | 1.53% | (f) | | | 1.62% | (d)(f) |
| Supplemental data | | | | | | | | | | | | |
Net assets, end of period (in thousands) | | | $3,024 | | | | $31,588 | | | | $60,329 | |
Portfolio turnover | | | 67% | | | | 63% | | | | 122% | |
Notes to Financial Highlights
| (a) | For the period from July 15, 2009 (commencement of operations) to February 28, 2010. |
| (b) | In addition to the fees and expenses which the Fund bears directly, the Fund indirectly bears a pro rata share of the fees and expenses of the acquired funds in which it invests. Such indirect expenses are not included in the reported expense ratios. |
| (c) | Includes interest expense which rounds to less than 0.01%. |
| (e) | The Investment Manager and certain of its affiliates agreed to waive/reimburse certain fees and expenses, if applicable. |
| (f) | The benefits derived from expense reductions had an impact of less than 0.01%. |
The Accompanying Notes to Financial Statements are an integral part of this statement
20
Financial Highlights (continued) – Columbia Large Cap Enhanced Core Fund
| | | | | | | | | | | | | | | | | | | | |
| | | Year ended
Feb. 29, 2012 | | | Year ended Feb. 28, | | | Year ended
Feb. 29, 2008 | |
| | | | 2011 | | | 2010 | | | 2009 | | |
| Class Z | | | | | | | | | | | | | | | |
| Per share data | | | | | | | | | | | | | | | | | | | | |
Net asset value, beginning of period | | | $12.78 | | | | $10.70 | | | | $7.22 | | | | $12.90 | | | | $14.60 | |
Income from investment operations: | | | | | | | | | | | | | | | | | | | | |
Net investment income | | | 0.19 | | | | 0.16 | | | | 0.16 | | | | 0.21 | | | | 0.23 | |
Net realized and unrealized gain (loss) | | | 0.88 | | | | 2.09 | | | | 3.50 | | | | (5.68 | ) | | | (0.85 | ) |
Total from investment operations | | | 1.07 | | | | 2.25 | | | | 3.66 | | | | (5.47 | ) | | | (0.62 | ) |
Less distributions to shareholders from: | | | | | | | | | | | | | | | | | | | | |
Net investment income | | | (0.23 | ) | | | (0.17 | ) | | | (0.18 | ) | | | (0.21 | ) | | | (0.22 | ) |
Net realized gains | | | — | | | | — | | | | — | | | | — | | | | (0.86 | ) |
Total distributions to shareholders | | | (0.23 | ) | | | (0.17 | ) | | | (0.18 | ) | | | (0.21 | ) | | | (1.08 | ) |
Proceeds from regulatory settlement | | | — | | | | — | | | | 0.00 | (a) | | | — | | | | — | |
Net asset value, end of period | | | $13.62 | | | | $12.78 | | | | $10.70 | | | | $7.22 | | | | $12.90 | |
| Total return | | | 8.54% | | | | 21.18% | | | | 50.82% | | | | (42.69% | ) | | | (5.10% | ) |
| Ratios to average net assets(b) | | | | | | | | | | | | | | | | | | | | |
Expenses prior to fees waived or expenses reimbursed (including interest expense) | | | 0.94% | (c) | | | 0.71% | (c) | | | 0.67% | (c) | | | 0.57% | (c) | | | 0.54% | |
Net expenses after fees waived or expenses reimbursed (including interest expense)(d) | | | 0.70% | (c)(e) | | | 0.70% | (c)(e) | | | 0.64% | (c)(e) | | | 0.50% | (c)(e) | | | 0.50% | (e) |
Expenses prior to fees waived or expenses reimbursed (excluding interest expense) | | | 0.94% | | | | 0.71% | | | | 0.67% | | | | 0.57% | | | | 0.54% | |
Net expenses after fees waived or expenses reimbursed (excluding interest expense)(d) | | | 0.70% | (e) | | | 0.70% | (e) | | | 0.64% | (e) | | | 0.50% | (e) | | | 0.50% | (e) |
Net investment income | | | 1.54% | (e) | | | 1.46% | (e) | | | 1.65% | (e) | | | 1.86% | (e) | | | 1.54% | (e) |
| Supplemental data | | | | | | | | | | | | | | | | | | | | |
Net assets, end of period (in thousands) | | | $254,500 | | | | $365,205 | | | | $451,824 | | | | $382,637 | | | | $796,550 | |
Portfolio turnover | | | 67% | | | | 63% | | | | 122% | | | | 246% | | | | 207% | |
Notes to Financial Highlights
| (a) | Rounds to less than $0.01. |
| (b) | In addition to the fees and expenses which the Fund bears directly, the Fund indirectly bears a pro rata share of the fees and expenses of the acquired funds in which it invests. Such indirect expenses are not included in the reported expense ratios. |
| (c) | Includes interest expense which rounds to less than 0.01%. |
| (d) | The Investment Manager and certain of its affiliates agreed to waive/reimburse certain fees and expenses, if applicable. |
| (e) | The benefits derived from expense reductions had an impact of less than 0.01%. |
The Accompanying Notes to Financial Statements are an integral part of this statement
21
Notes to Financial Statements – Columbia Large Cap Enhanced Core Fund
February 29, 2012
Note 1. Organization
Columbia Large Cap Enhanced Core Fund (the Fund), a series of Columbia Funds Series Trust (the Trust), is a diversified fund. The Trust is registered under the Investment Company Act of 1940, as amended (the 1940 Act), as an open-end management investment company organized as a Delaware statutory trust.
Fund Shares
The Trust may issue an unlimited number of shares (without par value). The Fund offers Class A, Class I, Class R, Class Y and Class Z shares. All share classes have identical voting, dividend and liquidation rights. Each share class has its own expense structure and sales charges, as applicable.
Class A shares have no sales charge.
Class I shares are not subject to sales charges and are only available to the Columbia Family of Funds.
Class R shares are not subject to sales charges and are only available to qualifying institutional investors.
Class Y shares are not subject to sales charges and are only available to certain categories of investors which are subject to minimum initial investment requirements.
Class Z shares are not subject to sales charges, and are only available to certain investors, as described in the Fund’s prospectus.
Note 2. Summary of Significant Accounting Policies
Use of Estimates
The preparation of financial statements in accordance with U.S. generally accepted accounting principles (GAAP) requires management to make certain estimates and assumptions that affect the reported amounts of assets and liabilities, the disclosure of contingent assets and liabilities at the date of the financial statements and the reported amounts of revenue and expenses during the reporting period. Actual results could differ from those estimates.
The following is a summary of significant accounting policies consistently followed by the Fund in the preparation of its financial statements.
Security Valuation
All equity securities are valued at the close of business of the New York Stock Exchange (NYSE). Equity securities are valued at the last quoted sales price on the principal exchange or market on which
they trade, except for securities traded on the NASDAQ Stock Market, which are valued at the NASDAQ official close price. Unlisted securities or listed securities for which there were no sales during the day are valued at the mean of the latest quoted bid and asked prices on such exchanges or markets.
Investments in other open-end investment companies, including money market funds, are valued at net asset value.
Short-term securities purchased within 60 days to maturity are valued at amortized cost, which approximates market value. The value of short-term securities originally purchased with maturities greater than 60 days is determined based on an amortized value to par upon reaching 60 days to maturity. Short-term securities maturing in more than 60 days from the valuation date are valued at the market price or approximate market value based on current interest rates.
Futures and options on futures contracts are valued based upon the settlement price established each day by the board of trade or exchange on which they are traded.
Investments for which market quotations are not readily available, or that have quotations which management believes are not reliable, are valued at fair value as determined in good faith under consistently applied procedures established by and under the general supervision of the Board of Trustees (the Board). If a security or class of securities (such as foreign securities) is valued at fair value, such value is likely to be different from the last quoted market price for the security. The determination of fair value often requires significant judgment. To determine fair value, management may use assumptions including but not limited to future cash flows and estimated risk premiums. Multiple inputs from various sources may be used to determine value.
Derivative Instruments
The Fund invests in certain derivative instruments as detailed below to meet its investment objectives. Derivatives are instruments whose values depend on, or are derived from, in whole or in part, the value of one or more other assets, such as securities, currencies, commodities or indices. Derivative instruments may be used to maintain cash reserves while maintaining exposure to certain other assets, to offset anticipated declines in values of investments, to facilitate trading, to reduce transaction costs and to pursue higher investment returns. The Fund may also use derivative instruments to mitigate certain investment risks, such as foreign currency exchange rate risk, interest rate risk and credit risk. Derivatives may involve various risks, including the potential inability of the counterparty to
22
Columbia Large Cap Enhanced Core Fund
February 29, 2012
fulfill its obligation under the terms of the contract, the potential for an illiquid secondary market and the potential for market movements which may expose the Fund to gains or losses in excess of the amount shown in the Statement of Assets and Liabilities.
The Fund and any counterparty are required to maintain an agreement that requires the Fund and that counterparty to monitor (on a daily basis) the net fair value of all derivatives entered into pursuant to the agreement between the Fund and such counterparty. If the net fair value of such derivatives between the Fund and that counterparty exceeds a certain threshold (as defined in the agreement), the Fund or the counterparty (as the case may be) is required to post cash and/or securities as collateral. Fair values of derivatives presented in the financial statements are not netted with the fair value of other derivatives or with any collateral amounts posted by the Fund or any counterparty.
Futures Contracts
Futures contracts represent commitments for the future purchase or sale of an asset at a specified price on a specified date. The Fund bought and sold futures contracts to maintain appropriate equity market exposure while keeping sufficient cash to accommodate daily redemptions. Upon entering into futures contracts, the Fund bears risks which may include interest rates, exchange rates or securities prices moving unexpectedly, in which case, the Fund may not achieve the anticipated benefits of the futures contracts and may realize a loss. Additional risks include counterparty credit risk, the possibility of an illiquid market, and that a change in the value of the contract or option may not correlate with changes in the value of the underlying asset.
Upon entering into a futures contract, the Fund pledges cash or securities with the broker in an amount sufficient to meet the initial margin requirement. Subsequent payments (variation margin) are made or received by the Fund each day. The variation margin payments are equal to the daily change in the contract value and are recorded as variation margin receivable or payable and are offset in unrealized gains or losses. The Fund recognizes a realized gain or loss when the contract is closed or expires. Futures contracts involve, to varying degrees, risk of loss in excess of the variation margin disclosed in the Statement of Assets and Liabilities.
Effects of Derivative Transactions in the Financial Statements
The following tables are intended to provide additional information about the effect of derivatives on the financial statements of the Fund, including: the fair value of derivatives by risk category and the location of those fair values in the Statement of Assets and Liabilities; the impact of derivative transactions on the Fund’s operations over the period including realized gains or losses and unrealized gains or losses. The derivative schedules following the Portfolio of Investments present additional information regarding derivative instruments outstanding at the end of the period, if any.
| | | | |
Fair Values of Derivative Instruments at
February 29, 2012 |
| Asset derivatives |
Risk Exposure
Category | | Statement of Assets and
Liabilities Location | | Fair Value |
| Equity contracts | | Net assets — unrealized
appreciation on futures
contracts | | $155,758* |
| * | Includes cumulative appreciation (depreciation) of futures contracts as reported in the Futures Contracts Outstanding table following the Portfolio of Investments. Only the current day’s variation margin is reported in receivables or payables in the Statement of Assets and Liabilities. |
| | | | |
Effect of Derivative Instruments in the Statement of
Operations for the Year Ended February 29, 2012 | |
| | | Amount of Realized Gain (Loss) on
Derivatives Recognized in Income | |
Risk Exposure
Category | | Futures Contracts | |
| Equity contracts | | $ | 1,794,799 | |
| | | | |
| | | | |
| | | Change in Unrealized Appreciation
(Depreciation) on Derivatives
Recognized in Income | |
Risk Exposure
Category | | Futures Contracts | |
| Equity contracts | | $ | 166,894 | |
| | | | |
Volume of Derivative Instruments for the
Year Ended February 29, 2012 | |
| | | Contracts
Opened | |
| Futures Contracts | | | 590 | |
Repurchase Agreements
The Fund may engage in repurchase agreement transactions with institutions that management has determined are creditworthy. The
23
Columbia Large Cap Enhanced Core Fund
February 29, 2012
Fund, through the custodian, receives delivery of the underlying securities collateralizing a repurchase agreement. Management is responsible for determining that the collateral is at least equal, at all times, to the value of the repurchase obligation including interest. A repurchase agreement transaction involves certain risks in the event of default or insolvency of the counterparty. These risks include possible delays in or restrictions on a Fund’s ability to dispose of the underlying securities and a possible decline in the value of the underlying securities during the period while the Fund seeks to assert its rights.
Security Transactions
Security transactions are accounted for on the trade date. Cost is determined and gains (losses) are based upon the specific identification method for both financial statement and federal income tax purposes.
Income Recognition
Corporate actions and dividend income are recorded net of any non-reclaimable tax withholdings, on the ex-dividend date or upon receipt of ex-dividend notification in the case of certain foreign securities.
Interest income is recorded on the accrual basis.
The Fund receives distributions from holdings in real estate investment trusts (REITs) which report information on the character of their distributions annually. REIT distributions are allocated to dividend income, capital gain and return of capital based on estimates made by the Fund’s management if actual information has not yet been reported. Return of capital is recorded as a reduction of the cost basis of securities held. Management’s estimates are subsequently adjusted when the actual character of the distributions is disclosed by the REITs which could result in a proportionate increase in return of capital to shareholders.
Awards from class action litigation are recorded as a reduction of cost basis if the Fund still owns the applicable securities on the payment date. If the Fund no longer owns the applicable securities, the proceeds are recorded as realized gains.
Expenses
General expenses of the Trust are allocated to the Fund and other funds of the Trust based upon relative net assets or other expense allocation methodologies determined by the nature of the expense. Expenses directly attributable to the Fund are charged to the Fund. Expenses directly attributable to a specific class of shares are charged to that share class.
Determination of Class Net Asset Value
All income, expenses (other than class-specific expenses, which are charged to that share class, as shown in the Statement of Operations) and realized and unrealized gains (losses) are allocated to each class of the Fund on a daily basis, based on the relative net assets of each class, for purposes of determining the net asset value of each class.
Federal Income Tax Status
The Fund intends to qualify each year as a regulated investment company under Subchapter M of the Internal Revenue Code, as amended, and will distribute substantially all of its tax exempt or taxable income (including net short-term capital gains), if any, for its tax year, and as such will not be subject to federal income taxes. In addition, the Fund intends to distribute in each calendar year substantially all of its net investment income, capital gains and certain other amounts, if any, such that the Fund should not be subject to federal excise tax. Therefore, no federal income or excise tax provision is recorded.
Distributions to Shareholders
Distributions from net investment income, if any, are declared and paid semi-annually. Net realized capital gains, if any, are distributed along with the income dividend. Income distributions and capital gain distributions are determined in accordance with federal income tax regulations which may differ from GAAP.
Guarantees and Indemnifications
Under the Trust’s organizational documents and, in some cases, by contract, its officers and trustees are indemnified against certain liabilities arising out of the performance of their duties to the Trust or its funds. In addition, certain of the Fund’s contracts with its service providers contain general indemnification clauses. The Fund’s maximum exposure under these arrangements is unknown since the amount of any future claims that may be made against the Fund cannot be determined, and the Fund has no historical basis for predicting the likelihood of any such claims.
Recent Accounting Pronouncement
Fair Value Measurements and Disclosures
In May 2011, the Financial Accounting and Standards Board (FASB) issued ASU No. 2011-04 modifying Topic 820, Fair Value Measurements and Disclosures. At the same time, the International Accounting Standards Board (IASB) issued International Financial Reporting Standard 13, Fair Value Measurement. The objective of the FASB and IASB is convergence of their guidance on fair value measurements and disclosures.
24
Columbia Large Cap Enhanced Core Fund
February 29, 2012
Specifically, ASU No. 2011-04 requires reporting entities to disclose i) the amounts of any transfers between Level 1 and Level 2, and the reasons for the transfers, ii) for Level 3 fair value measurements, a) quantitative information about significant unobservable inputs used, b) a description of the valuation processes used by the reporting entity and c) a narrative description of the sensitivity of the fair value measurement to changes in unobservable inputs if a change in those inputs might result in a significantly higher or lower fair value measurement. The effective date of ASU No. 2011-04 is for interim and annual periods beginning after December 15, 2011. At this time, management is evaluating the implications of this guidance and the impact it will have on the financial statement amounts and footnote disclosures, if any.
Note 3. Fees and Compensation Paid to Affiliates
Investment Management Fees
Under an Investment Management Services Agreement (IMSA), Columbia Management Investment Advisers, LLC (the Investment Manager), a wholly-owned subsidiary of Ameriprise Financial, Inc. (Ameriprise Financial), determines which securities will be purchased, held or sold. Effective July 1, 2011, the management fee is an annual fee that is equal to a percentage of the Fund’s average daily net assets that declines from 0.69% to 0.52% as the Fund’s net assets increase. Prior to July 1, 2011, the management fee was equal to a percentage of the Fund’s average daily net assets that declined from 0.35% to 0.16% as the Fund’s net assets increased. The effective management fee rate for the year ended February 29, 2012 was 0.56% of the Fund’s average daily net assets.
Effective July 1, 2011, the Investment Manager has contractually agreed to waive a portion of the management fee so that the net management fee will be 0.49% for the fiscal period ending June 30, 2012.
Administration Fees
Under an Administrative Services Agreement, the Investment Manager serves as the Fund Administrator. Effective July 1, 2011, the Fund pays the Fund Administrator an annual fee for administration and accounting services equal to a percentage of the Fund’s average daily net assets that declines from 0.06% to 0.03% as the Fund’s net assets increase. Prior to July 1, 2011, the administration fee was equal to the annual rate of 0.17% of the Fund’s average daily net assets, less the fees that were payable by
the Fund as described under the Pricing and Bookkeeping Fees note below. The effective administration fee rate for the year ended February 29, 2012 was 0.10% of the Fund’s average daily net assets.
Pricing and Bookkeeping Fees
Prior to June 27, 2011, the Fund had entered into a Financial Reporting Services Agreement (the Financial Reporting Services Agreement) with State Street Bank and Trust Company (State Street) and the Investment Manager pursuant to which State Street provided financial reporting services to the Fund. The Fund also entered into an Accounting Services Agreement (collectively with the Financial Reporting Services Agreement, the State Street Agreements) with State Street and the Investment Manager pursuant to which State Street provided accounting services to the Fund. Under the State Street Agreements, the Fund paid State Street an annual fee of $38,000 paid monthly plus an additional monthly fee based on an annualized percentage rate of average daily net assets of the Fund for the month. The aggregate fee did not exceed $140,000 per year (exclusive of out-of-pocket expenses and charges). The Fund also reimbursed State Street for certain out-of-pocket expenses and charges. Effective June 27, 2011, these services are provided under the Administrative Services Agreement discussed above.
Other Fees
Effective June 1, 2011, other expenses are for, among other things, certain expenses of the Fund or the Board, including: Fund boardroom and office expense, employee compensation, employee health and retirement benefits, and certain other expenses. Payment of these Fund and Board expenses is facilitated by a company providing limited administrative services to the Fund and the Board. For the period June 1, 2011 through February 29, 2012, other expenses paid to this company were $2,069.
Compensation of Board Members
Board members are compensated for their services to the Fund as disclosed in the Statement of Operations. Under a Deferred Compensation Plan (the Plan), the Board members who are not “interested persons” of the Fund, as defined under the 1940 Act, may elect to defer payment of up to 100% of their compensation. Deferred amounts are treated as though equivalent dollar amounts had been invested in shares of certain funds managed by the Investment Manager. The Fund’s liability for these amounts is adjusted for market value changes and remains in the Fund until distributed in accordance with the Plan.
25
Columbia Large Cap Enhanced Core Fund
February 29, 2012
Compensation of Chief Compliance Officer
The Board has appointed a Chief Compliance Officer to the Fund in accordance with federal securities regulations. Effective April 1, 2011, the Fund’s expenses associated with the Chief Compliance Officer are paid directly by Columbia. Prior to April 1, 2011, the Fund, along with other affiliated funds, paid its pro-rata share of the expenses for the Chief Compliance Officer. Such fees did not exceed $15,000 per year.
Transfer Agent Fees
Under a Transfer and Dividend Disbursing Agent Agreement, Columbia Management Investment Services Corp. (the Transfer Agent), an affiliate of the Investment Manager and a wholly-owned subsidiary of Ameriprise Financial, is responsible for providing transfer agency services to the Fund. The Transfer Agent has contracted with Boston Financial Data Services (BFDS) to serve as sub-transfer agent.
The Transfer Agent receives monthly account-based service fees based on the number of open accounts and is reimbursed by the Fund for the fees and expenses the Transfer Agent pays to financial intermediaries that maintain omnibus accounts with the Fund that is a percentage of the average aggregate value of the Fund’s shares maintained in each such omnibus account (other than omnibus accounts for which American Enterprise Investment Services Inc. is the broker of record or accounts where the beneficial shareholder is a customer of Ameriprise Financial Services, Inc., which are paid a per account fee). The Transfer Agent pays the fees of BFDS for services as sub-transfer agent and is not entitled to reimbursement for such fees from the Fund (with the exception of out-of-pocket fees).
The Transfer Agent also receives compensation from fees for various shareholder services and reimbursements for certain out-of-pocket expenses. Class I shares do not pay transfer agent fees.
For the year ended February 29, 2012, the Fund’s effective transfer agent fee rates as a percentage of average daily net assets of each class were as follows:
| | | | |
| | | | |
| Class A | | | 0.20 | % |
| Class R | | | 0.20 | |
| Class Y | | | 0.00 | * |
| Class Z | | | 0.20 | |
| * | Rounds to less than 0.01%. |
An annual minimum account balance fee of $20 may apply to certain accounts with a value below the Fund’s initial minimum investment requirements to reduce the impact of small accounts on transfer agent fees. These minimum account balance fees are recorded as part of expense reductions in the Statement of Operations. For the year ended February 29, 2012, these minimum account balance fees reduced total expenses by $300.
Distribution and Service Fees
The Fund has an agreement with Columbia Management Investment Distributors, Inc. (the Distributor), an affiliate of the Investment Manager and a wholly-owned subsidiary of Ameriprise Financial, for distribution and shareholder services. Pursuant to Rule 12b-1 under the 1940 Act, the Board has approved, and the Fund has adopted, distribution and shareholder service plans (the Plans) which set the distribution and service fees for the Fund. These fees are calculated daily and are intended to compensate the Distributor and/or eligible selling and/or servicing agents for selling shares of the Fund and providing services to investors.
The Plans require the payment of a monthly combined distribution and service fee to the Distributor at the maximum annual rate of 0.25% of the average daily net assets attributable to Class A shares of the Fund. The Plans also required the payment of a monthly distribution fee at the maximum annual rate of 0.50% of the average daily net assets attributable to Class R shares of the Fund.
Expenses Waived/Reimbursed by the Investment Manager and its Affiliates
Effective July 1, 2011, the Investment Manager and certain of its affiliates have contractually agreed to waive fees and/or reimburse expenses (excluding certain fees and expenses described below), through June 30, 2012, unless sooner terminated at the sole discretion of the Board, so that the Fund’s net operating expenses, after giving effect to fees waived/expenses reimbursed and/or overdraft charges from the Fund’s custodian, do not exceed the following annual rates as a percentage of the class’ average daily net assets:
| | | | |
| | | | |
| Class A | | | 0.95 | % |
| Class I | | | 0.63 | |
| Class R | | | 1.20 | |
| Class Y | | | 0.70 | |
Class Z | | | 0.70 | |
26
Columbia Large Cap Enhanced Core Fund
February 29, 2012
Under the agreement, the following fees and expenses are excluded from the waiver/reimbursement commitment, and therefore will be paid by the Fund, if applicable: taxes (including foreign transaction taxes), expenses associated with investments in affiliated and non-affiliated pooled investment vehicles (including mutual funds and exchange traded funds), transaction costs and brokerage commissions, costs related to any securities lending program, dividend expenses associated with securities sold short, inverse floater program fees and expenses, transaction charges and interest on borrowed money, interest, extraordinary expenses and any other expenses the exclusion of which is specifically approved by the Board. This agreement may be modified or amended only with approval from all parties.
Prior to July 1, 2011, the Investment Manager voluntarily agreed to reimburse a portion of the Fund’s expenses (excluding certain expenses, such as brokerage commissions, interest, taxes and extraordinary expenses, but including custodian charges relating to overdrafts, if any) so that the Fund’s ordinary net operating expenses, after giving effect to fees waived/expenses reimbursed and any balance credits and/or overdraft charges from the Fund’s custodian, did not exceed the following annual rates as a percentage of the class’ average daily net assets:
| | | | |
| | | | |
| Class A | | | 0.95 | % |
| Class I | | | 0.57 | |
| Class R | | | 1.20 | |
| Class Y | | | 0.70 | |
| Class Z | | | 0.70 | |
Prior to May 1, 2011, the Investment Manager was entitled to recover from the Fund any fees waived and/or expenses reimbursed for a three year period following the date of such fee waiver and/or reimbursement under these arrangements if such recovery did not cause the Fund’s expenses to exceed the expense limitations in effect at the time of recovery. Effective May 1, 2011, the Investment Manager has eliminated such fee recoupment provisions.
Note 4. Federal Tax Information
The timing and character of income and capital gain distributions are determined in accordance with income tax regulations, which may differ from GAAP because of temporary or permanent book to tax differences.
For the Year Ended February 29, 2012, these differences are primarily due to differing treatment for deferral/reversal of wash
sales, deferred trustees expense, capital loss carryforwards, and recognition of unrealized appreciation (depreciation) for certain derivative investments. To the extent these differences are permanent, reclassifications are made among the components of the Fund’s net assets in the Statement of Assets and Liabilities. Temporary differences do not require reclassifications. Net investment income and net realized gains (losses), as disclosed in the Statement of Operations, and net assets were not affected by this reclassification.
The tax character of distributions paid during the years indicated was as follows:
| | | | |
| Year ended | | February 29, 2012 | | February 28, 2011 |
| Ordinary income | | $5,176,907 | | $6,398,442 |
Short-term capital gain distributions, if any, are considered ordinary income distributions for tax purposes.
At February 29, 2012, the components of distributable earnings on a tax basis were as follows:
| | | | |
| | | | |
| Undistributed ordinary income | | $ | 714,707 | |
| Unrealized appreciation | | | 87,524,544 | |
At February 29, 2012, the cost of investments for federal income tax purposes was $227,121,073 and the aggregate gross unrealized appreciation and depreciation based on that cost was:
| | | | |
| | | | |
| Unrealized appreciation | | $ | 88,838,548 | |
| Unrealized depreciation | | | (1,314,004 | ) |
| | | | |
| Net unrealized appreciation/depreciation | | $ | 87,524,544 | |
The following capital loss carryforward, determined at February 29, 2012, may be available to reduce taxable income arising from future net realized gains on investments, if any, to the extent permitted by the Internal Revenue Code:
| | | | |
| | | | |
| Year of Expiration | | Amount | |
| 2017 | | $ | 8,601,528 | |
| 2018 | | | 132,297,711 | |
| | | | |
| Total | | $ | 140,899,239 | |
For the year ended February 29, 2012, $55,172,188 was utilized.
On December 22, 2010, the Regulated Investment Company Modernization Act of 2010 (the Act) was enacted, which changed
27
Columbia Large Cap Enhanced Core Fund
February 29, 2012
various technical rules governing the tax treatment of regulated investment companies. The changes are generally effective for taxable years beginning after the date of enactment. Under the Act, the Fund will be permitted to carry forward capital losses incurred in taxable years beginning after the date of enactment for an unlimited period. However, any losses incurred during those future taxable years will be required to be utilized prior to the losses incurred in pre-enactment taxable years, which carry an expiration date. As a result of this ordering rule, pre-enactment capital loss carryforwards may be more likely to expire unused.
Management of the Fund has concluded that there are no significant uncertain tax positions that would require recognition in the financial statements. However, management’s conclusion may be subject to review and adjustment at a later date based on factors including, but not limited to, new tax laws, regulations, and administrative interpretations (including relevant court decisions). Generally, the Fund’s federal tax returns for the prior three fiscal years remain subject to examination by the Internal Revenue Service.
Note 5. Portfolio Information
The cost of purchases and proceeds from sales of securities, excluding short-term obligations, aggregated to $216,344,045 and $358,707,510, respectively, for the year ended February 29, 2012.
Note 6. Lending of Portfolio Securities
Effective June 27, 2011, the Fund has entered into a Master Securities Lending Agreement (the Agreement) with JPMorgan Chase Bank, N.A. (JPMorgan). The Agreement, which replaces the previous security lending arrangement with State Street, authorizes JPMorgan as lending agent to lend securities to authorized borrowers in order to generate additional income on behalf of the Fund. Pursuant to the Agreement, the securities loaned are secured by cash or U.S. government securities equal to at least 100% of the market value of the loaned securities. Any additional collateral required to maintain those levels due to market fluctuations of the loaned securities is requested to be delivered the following business day. Cash collateral received is invested by the lending agent on behalf of the Fund into authorized investments pursuant to the Agreement. The investments made with the cash collateral are listed in the Portfolio of Investments. The values of such investments and any uninvested cash collateral are disclosed in the Statement of Assets and Liabilities along with the related obligation to return the collateral upon the return of the securities loaned.
At February 29, 2012, securities valued at $26,747,345 were on loan, secured by U.S. government securities valued at $27,590,215 (which does not reflect calls for collateral made to borrowers by JPMorgan at period end) that is partially or fully invested in short-term securities or other cash equivalents.
Risks of delay in recovery of securities or even loss of rights in the securities may occur should the borrower of the securities fail financially. Risks may also arise to the extent that the value of the securities loaned increases above the value of the collateral received. JPMorgan will indemnify the Fund from losses resulting from a borrower’s failure to return a loaned security when due. Such indemnification does not extend to losses associated with declines in the value of cash collateral investments. The Investment Manager is not responsible for any losses incurred by the Fund in connection with the securities lending program. Loans are subject to termination by the Fund or the borrower at any time, and are, therefore, not considered to be illiquid investments.
Pursuant to the Agreement, the Fund receives income for lending its securities either in the form of fees or by earning interest on invested cash collateral, net of negotiated rebates paid to borrowers and fees paid to the lending agent for services provided and any other securities lending expenses. Net income earned from securities lending for the year ended February 29, 2012 is disclosed in the Statement of Operations. The Fund continues to earn and accrue interest and dividends on the securities loaned.
Prior to June 27, 2011, the Fund participated in a securities lending arrangement with State Street. Each security on loan was collateralized in an amount at least equal to the market value of the securities loaned plus accrued income from the investment of collateral. The income generated by the investment of the collateral, net of any fees remitted to State Street as the lending agent and borrower rebates, was paid to the Fund.
Note 7. Custody Credits
Prior to June 27, 2011, the Fund had an agreement with its custodian bank under which custody fees may have been reduced by balance credits. These credits are recorded as part of expense reductions on the Statement of Operations. The Fund could have invested a portion of the assets utilized in connection with the expense offset arrangement in an income-producing asset if they had not entered into such an agreement. Subsequent to this date, the Fund may invest its daily balance in an affiliated money market fund as detailed below. For the period March 1, 2011 through June 27, 2011, there were no credits.
28
Columbia Large Cap Enhanced Core Fund
February 29, 2012
Note 8. Affiliated Money Market Fund
Effective June 27, 2011, the Fund may invest its daily cash balances in Columbia Short-Term Cash Fund, an affiliated money market fund established for the exclusive use by the Fund and other affiliated funds. The income earned by the Fund from such investments is included as “Dividends from affiliates” in the Statement of Operations. As an investing fund, the Fund indirectly bears its proportionate share of the expenses of Columbia Short-Term Cash Fund.
Note 9. Shareholder Concentration
At February 29, 2012, one unaffiliated shareholder account owned 89.3% of the outstanding shares of the Fund. The Fund has no knowledge about whether any portion of those shares was owned beneficially by such accounts. Subscription and redemption activity by concentrated accounts may have a significant effect on the operations of the Fund.
Note 10 . Line of Credit
The Fund has entered into a revolving credit facility with a syndicate of banks led by JPMorgan Chase Bank, N.A. (the Administrative Agent), whereby the Fund may borrow for the temporary funding of shareholder redemptions or for other temporary or emergency purposes. The credit facility became effective on June 27, 2011, replacing a prior credit facility. The credit facility agreement, as amended, which is a collective agreement between the Fund and certain other funds managed by the Investment Manager, severally and not jointly, permits collective borrowings up to $500 million. Pursuant to a December 13, 2011 amendment to the credit facility agreement, interest is charged to each participating fund based on its borrowings at a rate equal to the higher of (i) the overnight federal funds rate plus 1.00% or (i) the one-month LIBOR rate plus 1.00%. Each borrowing under the credit facility matures no later than 60 days after the date of borrowing. The Fund also pays a commitment fee equal to its pro rata share of the amount of the credit facility at a rate of 0.08% per annum. For the period June 27, 2011 through December 12, 2011, interest was charged to each participating fund based on its borrowings at a rate equal to the sum of the federal funds rate plus (i) 1.25% per annum plus (ii) if one-month LIBOR exceeds the federal funds rate, the amount of such excess. The Fund also paid a commitment fee equal to its pro rata share of the amount of the credit facility at a rate of 0.10% per annum.
For the period May 16, 2011 through June 26, 2011, the Fund and certain other funds managed by the Investment Manager participated
in a $150 million committed, unsecured revolving credit facility provided by State Street. For the period March 28, 2011 through May 15, 2011, the collective borrowing amount of the credit facility was $225 million. Prior to March 28, 2011, the collective borrowing amount of the credit facility was $280 million. Interest was charged to each fund based on its borrowings at a rate equal to the greater of the (i) federal funds rate plus 1.25% per annum or (ii) the overnight LIBOR rate plus 1.25% per annum. The Fund also paid a commitment fee equal to its pro rata share of the amount of the credit facility at a rate of 0.125% per annum.
For the year ended February 29, 2012, the average daily loan balance outstanding on days when borrowing existed was $3,240,000 at a weighted average interest rate of 1.47%.
Note 11. Subsequent Events
Management has evaluated the events and transactions that have occurred through the date the financial statements were issued and noted no items requiring adjustment of the financial statements or additional disclosure.
Note 12. Information Regarding Pending and Settled Legal Proceedings
In June 2004, an action captioned John E. Gallus et al. v. American Express Financial Corp. and American Express Financial Advisors Inc. was filed in the United States District Court for the District of Arizona. The plaintiffs allege that they are investors in several American Express Company mutual funds (currently branded as Columbia) and they purport to bring the action derivatively on behalf of those funds under the Investment Company Act of 1940. The plaintiffs allege that fees allegedly paid to the defendants by the funds for investment advisory and administrative services are excessive. The plaintiffs seek remedies including restitution and rescission of investment advisory and distribution agreements. The plaintiffs voluntarily agreed to transfer this case to the United States District Court for the District of Minnesota (the District Court). In response to defendants’ motion to dismiss the complaint, the District Court dismissed one of plaintiffs’ four claims and granted plaintiffs limited discovery. Defendants moved for summary judgment in April 2007. Summary judgment was granted in the defendants’ favor on July 9, 2007. The plaintiffs filed a notice of appeal with the Eighth Circuit Court of Appeals (the Eighth Circuit) on August 8, 2007. On April 8, 2009, the Eighth Circuit reversed summary judgment and remanded to the District Court for further proceedings. On August 6, 2009, defendants filed a writ of certiorari with the U.S. Supreme Court (the Supreme Court), asking the Supreme Court to
29
Columbia Large Cap Enhanced Core Fund
February 29, 2012
stay the District Court proceedings while the Supreme Court considered and ruled in a case captioned Jones v. Harris Associates, which involved issues of law similar to those presented in the Gallus case. On March 30, 2010, the Supreme Court issued its ruling in Jones v. Harris Associates, and on April 5, 2010, the Supreme Court vacated the Eighth Circuit’s decision in the Gallus case and remanded the case to the Eighth Circuit for further consideration in light of the Supreme Court’s decision in Jones v. Harris Associates. On June 4, 2010, the Eighth Circuit remanded the Gallus case to the District Court for further consideration in light of the Supreme Court’s decision in Jones v. Harris Associates. On December 9, 2010, the District Court reinstated its July 9, 2007 summary judgment order in favor of the defendants. On January 10, 2011, plaintiffs filed a notice of appeal with the Eighth Circuit. In response to the plaintiffs’ opening appellate brief filed on March 18, 2011, the defendants filed a response brief on May 4, 2011 with the Eighth Circuit. The plaintiffs filed a reply brief on May 26, 2011 and oral arguments took place on November 17, 2011. On March 30, 2012, the Eighth Circuit upheld the grant of summary judgment by the District Court in favor of the defendants.
In December 2005, without admitting or denying the allegations, American Express Financial Corporation (AEFC, which is now known as Ameriprise Financial, Inc. (Ameriprise Financial)) entered into settlement agreements with the Securities and Exchange Commission (SEC) and Minnesota Department of Commerce (MDOC) related to market timing activities. As a result, AEFC was censured and ordered to cease and desist from committing or causing any violations of certain provisions of the Investment Advisers Act of 1940, the Investment Company Act of 1940, and various Minnesota laws. AEFC agreed to pay disgorgement of $10 million and civil money penalties of $7 million. AEFC also agreed to retain an independent distribution consultant to assist in developing a plan for distribution of all disgorgement and civil penalties ordered by
the SEC in accordance with various undertakings detailed at www.sec.gov/litigation/admin/ia-2451.pdf. Ameriprise Financial and its affiliates have cooperated with the SEC and the MDOC in these legal proceedings, and have made regular reports to the funds’ Boards of Trustees.
Ameriprise Financial and certain of its affiliates have historically been involved in a number of legal, arbitration and regulatory proceedings, including routine litigation, class actions, and governmental actions, concerning matters arising in connection with the conduct of their business activities. Ameriprise Financial believes that the Funds are not currently the subject of, and that neither Ameriprise Financial nor any of its affiliates are the subject of, any pending legal, arbitration or regulatory proceedings that are likely to have a material adverse effect on the Funds or the ability of Ameriprise Financial or its affiliates to perform under their contracts with the Funds. Ameriprise Financial is required to make 10-Q, 10-K and, as necessary, 8-K filings with the Securities and Exchange Commission on legal and regulatory matters that relate to Ameriprise Financial and its affiliates. Copies of these filings may be obtained by accessing the SEC website at www.sec.gov.
There can be no assurance that these matters, or the adverse publicity associated with them, will not result in increased fund redemptions, reduced sale of fund shares or other adverse consequences to the Funds. Further, although we believe proceedings are not likely to have a material adverse effect on the Funds or the ability of Ameriprise Financial or its affiliates to perform under their contracts with the Funds, these proceedings are subject to uncertainties and, as such, we are unable to estimate the possible loss or range of loss that may result. An adverse outcome in one or more of these proceedings could result in adverse judgments, settlements, fines, penalties or other relief that could have a material adverse effect on the consolidated financial condition or results of operations of Ameriprise Financial.
30
Report of Independent Registered Public Accounting Firm
To the Trustees of Columbia Funds Series Trust and the Shareholders of Columbia Large Cap Enhanced Core Fund
In our opinion, the accompanying statement of assets and liabilities, including the investment portfolio, and the related statements of operations and of changes in net assets and the financial highlights present fairly, in all material respects, the financial position of Columbia Large Cap Enhanced Core Fund (the “Fund”) (a series of Columbia Funds Series Trust), at February 29, 2012, the results of its operations for the year then ended, the changes in its net assets for the two years in the period then ended and the financial highlights for each of the periods indicated, in conformity with accounting principles generally accepted in the United States of America. These financial statements and financial highlights (hereafter referred to as “financial statements”) are the responsibility of the Fund’s management. Our responsibility is to express an opinion on these financial statements based on our audits. We conducted our audits of these financial statements in accordance with the standards of the Public Company Accounting Oversight Board (United States). Those standards require that we plan and perform the audit to obtain reasonable assurance about whether the financial statements are free of material misstatement. An audit includes examining, on a test basis, evidence supporting the amounts and disclosures in the financial statements, assessing the accounting principles used and significant estimates made by management, and evaluating the overall financial statement presentation. We believe that our audits, which included confirmation of securities at February 29, 2012 by correspondence with the custodian, brokers and transfer agent provide a reasonable basis for our opinion.
PricewaterhouseCoopers LLP
Minneapolis, Minnesota
April 20, 2012
31
Federal Income Tax Information (Unaudited) – Columbia Large Cap Enhanced Core Fund
100.00% of the ordinary income distributed by the Fund for the fiscal year ended February 29, 2012, qualifies for the corporate dividends received deduction.
For non-corporate shareholders 100.00%, or the maximum amount allowable under the Jobs and Growth Tax Relief Reconciliation Act of 2003, of ordinary income distributed by the Fund for the fiscal year ended February 29, 2012 may represent qualified dividend income.
The Fund will notify shareholders in January 2013 of amounts for use in preparing 2012 income tax returns.
32
Fund Governance
Shareholders elect the Board that oversees the funds’ operations. The Board appoints officers who are responsible for day-to-day business decisions based on policies set by the Board. The following table provides basic biographical information about the funds’ Board members, including their principal occupations during the past five years, although specific titles for individuals may have varied over the period. Under current Board policy, members may serve until the next Board meeting after he or she reaches the mandatory retirement age established by the Board, or the fifteenth anniversary of the first Board meeting they attended as a member of the Board.
On September 29, 2009, Ameriprise Financial, the parent company of Columbia Management, entered into an agreement with Bank of America, N.A. (“Bank of America”) to acquire a portion of the asset management business of Columbia Management Group, LLC and certain of its affiliated companies (the “Transaction”). Following the Transaction, which became effective on May 1, 2010, various alignment activities have occurred with respect to the Fund Family. In connection with the Transaction, Mr. Edward J. Boudreau, Jr., Mr. William P. Carmichael, Mr. William A. Hawkins, Mr. R. Glenn Hilliard, Mr. John J. Nagorniak, Ms. Minor M. Shaw and Dr. Anthony M. Santomero, who were members prior to the Transaction of the Legacy Columbia Nations funds’ Board (“Nations Funds”), which includes Columbia Funds Series Trust, Columbia Funds Variable Insurance Trust I and Columbia Funds Master Investment Trust, LLC., began service on the Board for the Legacy RiverSource funds (“RiverSource Funds”) effective June 1, 2011, which resulted in an overall increase from twelve Trustees to sixteen for all mutual funds overseen by the Board.
| | | | | | | | |
| Independent Board Members | | |
| Name, address, age | | Position
held with
funds and
length of
service | | Principal occupation
during past five years | | Number of
funds in
the Fund
Family
overseen
by Board
member | | Other present or past
directorships/trusteeships
(within past 5 years) |
Kathleen Blatz 901 S. Marquette Ave. Minneapolis, MN 55402 Age 57 | | Board member since 1/06 for RiverSource Funds and since 6/11 for Nations Funds | | Attorney; Chief Justice, Minnesota Supreme Court, 1998-2006 | | 153 | | None |
Edward J. Boudreau, Jr. 225 Franklin Street Mail Drop BX32 05228 Boston, MA 02110
Age 67 | | Board member since 6/11 for RiverSource Funds and since 1/05 for Nations Funds | | Managing Director, E.J. Boudreau & Associates (consulting) since 2000 | | 146 | | Former Trustee, BofA Funds Series Trust (11 funds) |
Pamela G. Carlton
901 S. Marquette Ave. Minneapolis, MN 55402 Age 57 | | Board member since 7/07 for RiverSource Funds and since 6/11 for Nations Funds | | President, Springboard-Partners in Cross Cultural Leadership (consulting company) | | 153 | | None |
33
Fund Governance (continued)
| | | | | | | | |
| Independent Board Members (continued) | | |
| Name, address, age | | Position
held with
funds and
length of
service | | Principal occupation
during past five years | | Number of
funds in
the Fund
Family
overseen
by Board
member | | Other present or past
directorships/trusteeships
(within past 5 years) |
William P. Carmichael 225 Franklin Street
Mail Drop BX32 05228 Boston, MA 02110 Age 68 | | Board member since 6/11 for RiverSource Funds and since 1999 for Nations Funds | | Retired | | 146 | | Director, Cobra Electronics Corporation (electronic equipment manufacturer); The Finish Line (athletic shoes and apparel); McMoRan Exploration Company (oil and gas exploration and development); former Trustee, BofA Funds Series Trust (11 funds); former Director, Spectrum Brands, Inc. (consumer products); former Director, Simmons Company (bedding) |
Patricia M. Flynn 901 S. Marquette Ave. Minneapolis, MN 55402 Age 61 | | Board member since 11/04 for RiverSource Funds and since 6/11 for Nations Funds | | Trustee Professor of Economics and Management, Bentley University; former Dean, McCallum Graduate School of Business, Bentley University | | 153 | | None |
William A. Hawkins 225 Franklin Street
Mail Drop BX32 05228 Boston, MA 02110 Age 69 | | Board member since 6/11 for RiverSource Funds and since 1/05 for Nations Funds | | Managing Director, Overton Partners (financial consulting), since August 2010; President and Chief Executive Officer, California General Bank, N.A., January 2008-August 2010 | | 146 | | Trustee, BofA Funds Series Trust (11 funds) |
R. Glenn Hilliard 225 Franklin Street
Mail Drop BX32 05228 Boston, MA 02110 Age 69 | | Board member since 6/11 for RiverSource Funds and since 1/05 for Nations Funds | | Chairman and Chief Executive Officer, Hilliard Group LLC (investing and consulting), since April 2003; Non-Executive Director & Chairman, CNO Financial Group, Inc. (formerly Conseco, Inc.) (insurance), September 2003–May 2011 | | 146 | | Chairman, BofA Fund Series Trust (11 funds); former Director, CNO Financial Group, Inc. (insurance) |
Stephen R. Lewis, Jr. 901 S. Marquette Ave. Minneapolis, MN 55402 Age 73 | | Chair of the Board for RiverSource Funds since 1/07, Board member for RiverSource Funds since 1/02 and since 6/11 for Nations Funds | | President Emeritus and Professor of Economics Emeritus, Carleton College | | 153 | | Director, Valmont Industries, Inc. (manufactures irrigation systems) |
34
Fund Governance (continued)
| | | | | | | | |
| Independent Board Members (continued) | | |
| Name, address, age | | Position
held with
funds and
length of
service | | Principal occupation
during past five years | | Number of
funds in
the Fund
Family
overseen
by Board
member | | Other present or past
directorships/trusteeships
(within past 5 years) |
John F. Maher 901 S. Marquette Ave. Minneapolis, MN 55402 Age 68 | | Board member since 12/06 for Legacy Seligman funds, since 12/08 for RiverSource Funds and since 6/11 for Nations Funds | | Retired President and Chief Executive Officer and former Director, Great Western Financial Corporation (financial services), 1986-1997 | | 153 | | None |
John J. Nagorniak
225 Franklin Street
Mail Drop BX32 05228 Boston, MA 02110 Age 67 | | Board member since 6/11 for RiverSource Funds and since 1/08 for Nations Funds | | Retired; President and Director, Foxstone Financial, Inc. (consulting), 2000-2007; Director, Mellon Financial Corporation affiliates (investing), 2000-2007; Chairman, Franklin Portfolio Associates (investing–Mellon affiliate), 1982-2007 | | 146 | | Trustee, Research Foundation of CFA Institute; Director, MIT Investment Company; Trustee, MIT 401k Plan; former Trustee, BofA Funds Series Trust (11 funds) |
Catherine James Paglia 901 S. Marquette Ave. Minneapolis, MN 55402 Age 59 | | Board member since 11/04 for RiverSource Funds and since 6/11 for Nations Funds | | Director, Enterprise Asset Management, Inc. (private real estate and asset management company) | | 153 | | None |
Leroy C. Richie
901 S. Marquette Ave. Minneapolis, MN 55402 Age 70 | | Board member since 2000 for Legacy Seligman funds, since 11/08 for RiverSource Funds and since 6/11 for Nations Funds | | Counsel, Lewis & Munday, P.C. since 2004; former Vice President and General Counsel, Automotive Legal Affairs, Chrysler Corporation | | 153 | | Director, Digital Ally, Inc. (digital imaging); Director, Infinity, Inc. (oil and gas exploration and production); Director, OGE Energy Corp. (energy and energy services) |
Minor M. Shaw 225 Franklin Street Mail Drop BX32 05228 Boston, MA 02110
Age 64 | | Board member since 6/11 for RiverSource Funds and since 2003 for Nations Funds | | President–Micco LLC (private investments) | | 146 | | Former Trustee, BofA Funds Series Trust (11 funds); Board Member, Piedmont Natural Gas; Director, Blue Cross Blue Shield of South Carolina |
Alison Taunton-Rigby 901 S. Marquette Ave. Minneapolis, MN 55402
Age 67 | | Board member since 11/02 for RiverSource Funds and since 6/11 for Nations Funds | | Chief Executive Officer and Director, RiboNovix, Inc. 2003-2010 (biotechnology); former President, Aquila Biopharmaceuticals | | 153 | | Director, Healthways, Inc. (health management programs); Director, ICI Mutual Insurance Company, RRG; Director, Abt Associates (government contractor) |
35
Fund Governance (continued)
| | | | | | | | |
| Interested Board Member Not Affiliated with Investment Manager* | | |
| Name, address, age | | Position
held with
funds and
length of
service | | Principal occupation
during past five years | | Number of
funds in
the Fund
Family
overseen
by Board
member | | Other present or past
directorships/trusteeships
(within past 5 years) |
Anthony M. Santomero** 225 Franklin Street Mail Drop BX32 05228 Boston, MA 02110 Age 65 | | Board member since 6/11 for RiverSource Funds and since 1/08 for Nations Funds | | Richard K. Mellon Professor Emeritus of Finance, The Wharton School, University of Pennsylvania, since 2002; Senior Advisor, McKinsey & Company (consulting), 2006-2008; President and Chief Executive Officer, Federal Reserve Bank of Philadelphia, 2000-2006 | | 146 | | Director, Renaissance Reinsurance Ltd.; Trustee, Penn Mutual Life Insurance Company; Director, Citigroup; Director, Citibank, N.A.; former Trustee, BofA Funds Series Trust (11 funds) |
| ** | Dr. Santomero is not an affiliated person of the Investment Manager or Ameriprise Financial. However, he is currently deemed by the funds to be an “interested person” (as defined in the 1940 Act) of the Funds because he serves as a Director of Citigroup, Inc. and Citibank N.A., companies that may directly or through subsidiaries and affiliates engage from time-to-time in brokerage execution, principal transactions and lending relationships with the funds or accounts advised/managed by the Investment Manager. |
| | | | | | | | |
| Interested Board Member Affiliated with Investment Manager* | | |
William F. Truscott 53600 Ameriprise Financial Center Minneapolis, MN 55474 Age 51 | | Board member since 11/01 for RiverSource Funds and since 6/11 for Nations Funds; Senior Vice President since 2002 for RiverSource Funds and 5/10 for Nations Funds | | Chairman of the Board and President, Columbia Management Investment Advisers, LLC since May 2010 and February 2012, respectively (previously President, Chairman of the Board and Chief Investment Officer, 2001-April 2010); Chief Executive Officer, U.S. Asset Management & President, Annuities, Ameriprise Financial, Inc. since May 2010 (previously President–U.S. Asset Management and Chief Investment Officer, 2005-April 2010); Director, President and Chief Executive Officer, Ameriprise Certificate Company since 2006; Director and Chief Executive Officer, Columbia Management Investment Distributors, Inc. since May 2010 (previously Chairman of the Board and Chief Executive Officer, 2006-April 2010); Chairman of the Board and Chief Executive Officer, RiverSource Distributors, Inc. since 2006. | | 153 | | None |
| * | Interested person (as defined under the 1940 Act) by reason of being an officer, director, security holder and/or employee of the Investment Manager or Ameriprise Financial. |
| | The SAI has additional information about the Fund’s Board members and is available, without charge, upon request by calling 800.345.6611 or contacting your financial intermediary. |
36
Fund Governance (continued)
Officers
| | |
| Name, Year of birth and address | | Principal occupation(s) during past five years |
| |
| J. Kevin Connaughton (Born 1964) | | |
225 Franklin Street Boston, MA 02110 President (since 2009) | | Senior Vice President and General Manager–Mutual Fund Products, Columbia Management Investment Advisers, LLC since May 2010; President, Columbia Funds, since 2009, and RiverSource Funds, since May 2010 (previously Senior Vice President and Chief Financial Officer, Columbia Funds, from June 2008 to January 2009, Treasurer, Columbia Funds, from October 2003 to May 2008, and senior officer of various other affiliated funds since 2000); Managing Director, Columbia Management Advisors, LLC from December 2004 to April 2010. |
| |
| Michael G. Clarke (Born 1969) | | |
225 Franklin Street Boston, MA 02110 Treasurer (since 2011) and Chief Financial Officer
(since 2009) | | Vice President, Columbia Management Investment Advisers, LLC since May 2010; Managing Director of Fund Administration, Columbia Management Advisors, LLC, from September 2004 to April 2010; senior officer of Columbia Funds and affiliated funds since 2002. |
| |
| Scott R. Plummer (Born 1959) | | |
5228 Ameriprise Financial Center Minneapolis, MN 55474 Senior Vice President, Secretary and Chief Legal Officer (since 2010) | | Chief Legal Officer and Assistant Secretary, Columbia Management Investment Advisers, LLC since June 2005; Vice President and Lead Chief Counsel–Asset Management, Ameriprise Financial, Inc. since May 2010 (previously Vice President and Chief Counsel–Asset Management, from 2005 to April 2010; Vice President and Chief Counsel–Asset Management, from 2005 to April 2010; Vice President, Chief Counsel and Assistant Secretary, Columbia Management Investment Distributors, Inc. since 2008; Vice President, General Counsel and Secretary, Ameriprise Certificate Company since 2005; Chief Counsel, RiverSource Distributors, Inc. since 2006; Senior officer of Columbia Funds and affiliated funds, since 2006. |
| |
| Thomas P. McGuire (Born 1972) | | |
225 Franklin Street Boston, MA 02110 Chief Compliance Officer (since 2012) | | Vice President–Asset Management Compliance Columbia Management Investment Advisers, LLC since March 2010; Chief Compliance Officer, Ameriprise Certificate Company, since September 2010; Compliance Executive, Bank of America, from June 2005 to April 2010. |
| |
| William F. Truscott (Born 1960) | | |
53600 Ameriprise Financial Center Minneapolis, MN 55474 Senior Vice President (since 2010) | | Chairman of the Board and President, Columbia Management Investment Advisers, LLC since May 2010 and February 2012, respectively (previously President, Chairman of the Board and Chief Investment Officer, from 2001 to April 2010); Chief Executive Officer, U.S. Asset Management & President, Annuities, Ameriprise Financial, Inc. since May 2010 (previously President–U.S. Asset Management and Chief Investment Officer from 2005 to April 2010); Director, President and Chief Executive Officer, Ameriprise Certificate Company since 2006; Director and Chief Executive Officer, Columbia Management Investment Distributors, Inc. since May 2010 and February 2012, respectively (previously Chairman of the Board and Chief Executive Officer from 2008 to April 2010); Chairman of the Board and Chief Executive Officer, RiverSource Distributors, Inc. since 2006. |
| |
| Paul D. Pearson (Born 1956) | | |
10468 Ameriprise Financial Center Minneapolis, MN 55474 Vice President and Assistant Treasurer (since 2011) | | Vice President–Investment Accounting, Columbia Management Investment Advisers, LLC, since May 2010; Vice President–Managed Assets, Investment Accounting, Ameriprise Financial Corporation, 1998–2010 |
37
Fund Governance (continued)
Officers (continued)
| | |
| Name, Year of birth and address | | Principal occupation(s) during past five years |
| |
| Colin Moore (Born 1958) | | |
225 Franklin Street Boston, MA 02110 Senior Vice President (since 2010) | | Director and Chief Investment Officer, Columbia Management Investment Advisers, LLC since May 2010; Manager, Managing Director and Chief Investment Officer of Columbia Management Advisors, LLC from 2007 to April 2010; Head of Equities, Columbia Management Advisors, LLC from 2002 to 2007. |
| |
| Christopher O. Petersen (Born 1970) | | |
5228 Ameriprise Financial Center Minneapolis, MN 55474 Vice President and Secretary (since 2011) | | Vice President and Chief Counsel, Ameriprise Financial since January 2010 (formerly Vice President and Group Counsel or Counsel from April 2004 to January 2010); Senior officer of Columbia Funds and affiliated funds, since 2007. |
| |
| Amy K. Johnson (Born 1965) | | |
5228 Ameriprise Financial Center Minneapolis, MN 55474 Senior Vice President (since 2010) | | Senior Vice President and Chief Operating Officer, Columbia Management Investment Advisers, LLC since May 2010 (previously Chief Administrative Officer, from 2009 until April 2010, Vice President–Asset Management and Trust Company Services, from 2006 to 2009, and Vice President–Operations and Compliance from 2004 to 2006). |
| |
| Joseph F. DiMaria (Born 1968) | | |
225 Franklin Street Boston, MA 02110 Vice President (since 2011) and Chief Accounting Officer (since 2008) | | Vice President, Mutual Fund Administration, Columbia Management Investment Advisers, LLC, since May 2010; Director of Fund Administration, Columbia Management Advisors, LLC from January 2006 to April 2010. |
| |
| Paul B. Goucher (Born 1968) | | |
100 Park Avenue New York, NY 10017 Vice President and Assistant Secretary (since 2010) | | Vice President and Chief Counsel of Ameriprise Financial since January 2010 (formerly Vice President and Group Counsel from November 2008 to January 2010); Director, Managing Director and General Counsel of J. & W. Seligman & Co. Incorporated (Seligman) from July 2008 to November 2008 and Managing Director and Associate General Counsel of Seligman from January 2005 to July 2008. |
| |
| Michael E. DeFao (Born 1968) | | |
225 Franklin Street Boston, MA 02110 Vice President and Assistant Treasurer (since 2011) | | Vice President and Chief Counsel, Ameriprise Financial since May 2010; Associate General Counsel, Bank of America from June 2005 to April 2010 |
| |
| Stephen T. Welsh (Born 1957) | | |
225 Franklin Street Boston, MA 02110 Vice President (since 2006) | | President, Columbia Management Investment Services, Corp. since May 2010; President and Director, Columbia Management Services, Inc. from July 2004 to April 2010; Managing Director, Columbia Management Distributors, Inc. from August 2007 to April 2010. |
38
[THIS PAGE INTENTIONALLY LEFT BLANK]
39
[THIS PAGE INTENTIONALLY LEFT BLANK]
40
Important Information About This Report
The fund mails one shareholder report to each shareholder address. If you would like more than one report, please call shareholder services at 1-800-345-6611 and additional reports will be sent to you. This report has been prepared for shareholders of Columbia Large Cap Enhanced Core Fund.
A description of the policies and procedures that the fund uses to determine how to vote proxies and a copy of the fund’s voting records are available (i) at www.columbiamanagement.com, (ii) on the Securities and Exchange Commission’s website at www.sec.gov, and (iii) without charge, upon request, by calling 1-800-368-0346. Information regarding how the fund voted proxies relating to portfolio securities during the 12-month period ended June 30 is available from the SEC’s website. Information regarding how the fund voted proxies relating to portfolio securities is also available from the fund’s website, www.columbiamanagement.com.
The fund files a complete schedule of portfolio holdings with the SEC for the first and third quarters of each fiscal year on Form N-Q. The fund’s Form N-Q is available on the SEC’s website at www.sec.gov and may be reviewed and copied at the SEC’s Public Reference Room in Washington, D.C. Information on the operation of the Public Reference Room may be obtained by calling
1-800-SEC-0330.
Transfer Agent
Columbia Management Investment Services Corp.
P.O. Box 8081
Boston, MA 02266-8081
1-800-345-6611
Distributor
Columbia Management Investment
Distributors, Inc.
225 Franklin Street Boston, MA 02110
Investment Manager
Columbia Management Investment Advisers, LLC
225 Franklin Street Boston, MA 02110
41

Columbia Large Cap Enhanced Core Fund
P.O. Box 8081
Boston, MA 02266-8081
columbiamanagement.com
This information is for use with concurrent or prior delivery of a fund prospectus. Investors should consider the investment objectives, risks, charges and expenses of a mutual fund carefully before investing. For a free prospectus, which contains this and other important information about the funds, visit columbiamanagement.com. Read the prospectus carefully before investing. The Fund is distributed by Columbia Management Investment Distributors, Inc., member FINRA, and managed by Columbia Management Investment Advisers, LLC.
©2012 Columbia Management Investment Advisers, LLC. All rights reserved.
C-1701 C (4/12)

Columbia Small Cap Index Fund
Annual Report for the Period Ended February 29, 2012
Table of contents
The views expressed in this report reflect the current views of the respective parties. These views are not guarantees of future performance and involve certain risks, uncertainties and assumptions that are difficult to predict, so actual outcomes and results may differ significantly from the views expressed. These views are subject to change at any time based upon economic, market or other conditions and the respective parties disclaim any responsibility to update such views. These views may not be relied on as investment advice and, because investment decisions for a Columbia Fund are based on numerous factors, may not be relied on as an indication of trading intent on behalf of any particular Columbia Fund. References to specific securities should not be construed as a recommendation or investment advice.
President’s Message

Dear Shareholders,
Americans were dispirited in the fourth quarter of 2011 by Washington’s inability to reach a plan for deficit reduction and Europe’s piecemeal attempt to address its own fiscal issues. Yet, there was sufficient good news to encourage risk taking, buoying both stocks and bonds to solid gains.
U.S. economic data surprised on the upside and fears of recession abated. With the bar of expectations set low, investors responded positively to the announcement that the economy had expanded by 1.8% in the third quarter. Consumer confidence improved, even though consumers remain under pressure with no real increase in disposable income and a continued decline in household net worth. Headline inflation — which tracks a broad range of consumer expenditures, including food and energy — declined. Even manufacturing held its ground.
Against this backdrop, the U.S. equity markets logged solid returns. The S&P 500 Index gained 11.82%, moving into positive territory
for the year with quarterly advances in all ten sectors. Mid- and small-cap stocks did even better. Value outperformed growth across all market capitalizations. Energy stocks led the market, as the price of oil moved above $100 a barrel in December. Industrials and materials stocks rose, buoyed by improving economic data. The U.S. fixed-income markets logged modest but solid returns. High-yield bonds were the best performers as the economy showed signs of improvement. Emerging market bonds were strong performers, as inflation came under control in key regions. Municipal bonds and Treasuries eked out only modest gains, as investors moved away from quality in favor of riskier assets.
While fourth quarter gains were encouraging, challenges still remain. Columbia Management, however, remains strong and steadfast. Columbia Management is the eighth largest manager of long-term mutual fund assets with $326 billion under management as of December 31, 2011. The past year has been one of considerable change for the organization as we worked diligently to align products, services and resources in the integration of Columbia Management with RiverSource Investments. The strong line-up of talent, resources and capabilities that has resulted is highlighted by the success of our products. As of December 31, 2011, Columbia Management offers 52 funds rated either 4 or 5 stars by Morningstar.*
For more information about these and other funds offered by Columbia Management, including detailed, up-to-date fund performance and portfolio information, please visit us online at columbiamanagement.com. Other information and resources available on our website include:
| n | | timely economic analysis and market commentary |
| n | | quarterly fund commentaries |
| n | | Columbia Management Investor, a quarterly newsletter for shareholders |
Thank you for your continued support of the Columbia Funds. We look forward to serving your investment needs for many years to come.
Best Regards,

J. Kevin Connaughton
President, Columbia Funds
| * | All ratings are based on Class Z shares as of 12/31/2011. Out of 119 Class Z share Columbia funds rated by Morningstar, 7 funds received a 5-star Overall Rating and 45 funds received a 4-star Overall Rating. The Overall Morningstar Rating for a retail mutual fund is derived from a weighted average of the performance figures associated with its 3-, 5- and 10-year (if applicable) Morningstar Rating metrics. For share classes that do not have a 3-, 5-, or 10-year actual performance history, the fund’s independent Morningstar Rating metric is then compared against the retail mutual fund universe breakpoints to determine its hypothetical rating. |
For each fund with at least a three-year history, Morningstar calculates a Morningstar RatingTM based on a Morningstar Risk-Adjusted Return measure that accounts for variation in a fund’s monthly performance (including the effects of sales charges/loads, and redemption fees), placing more emphasis on downward variations and rewarding consistent performance. The top 10% of funds in each category receive 5 stars, the next 22.5% receive 4 stars, the next 35% receive 3 stars, the next 22.5% receive 2 stars and the bottom 10% receive 1 star. (Each share class is counted as a fraction of one fund within this scale and rated separately, which may cause slight variations in the distribution percentages.)
The Morningstar RatingTM is for Class Z shares only; other classes may have different performance characteristics and may have different ratings. ©2012 Morningstar, Inc. All Rights Reserved. The Morningstar information contained herein: (1) is proprietary to Morningstar and/or its content providers; (2) may not be copied or distributed; and (3) is not warranted to be accurate, complete or timely. Neither Morningstar nor its content providers are responsible for any damages or losses arising from any use of this information.
Investors should consider the investment objectives, risks, charges and expenses of a mutual fund carefully before investing. For a free prospectus, which contains this and other important information about the funds, visit columbiamanagement.com. The prospectus should be read carefully before investing.
Columbia Funds are distributed by Columbia Management Investment Distributors, Inc., member FINRA, and managed by Columbia Management Investment Advisers, LLC.
© 2012 Columbia Management Investment Advisers, LLC. All rights reserved.
Fund Profile – Columbia Small Cap Index Fund
Summary
| n | | For the 12-month period that ended February 29, 2012, the fund’s Class A shares returned 4.65% without sales charge. |
| n | | The fund’s benchmark, the S&P SmallCap 600® Index,1 returned 5.14%. |
| n | | The fund’s portfolio is constructed to closely approximate the benchmark. |
Portfolio Management
Alfred F. Alley III has managed or co-managed the fund since February 2009. From 2005 until joining Columbia Management Investment Advisers, LLC (the Investment Manager) in May 2010, Mr. Alley was associated with the fund’s previous investment adviser as an investment professional.
Vadim Shteyn has co-managed the fund since August 2011. From August 2006 until joining the Investment Manager in May 2010, Mr. Shteyn was associated with the fund’s previous investment adviser as an investment professional.
| 1 | The Standard & Poor’s (S&P) SmallCap 600 Index tracks the performance of 600 domestic companies traded on the New York Stock Exchange, the NYSE Amex and NASDAQ. The S&P Small Cap 600 is heavily weighted with the stocks of companies with small market capitalizations. |
Indices are not available for investment, are not professionally managed and do not reflect sales charges, fees, brokerage commissions, taxes or other expenses of investing. Securities in the fund may not match those in an index.
Performance data quoted represents past performance and current performance may be lower or higher. Past performance is no guarantee of future results. The investment return and principal value will fluctuate so that shares, when redeemed, may be worth more or less than the original cost. Please visit www.columbiamanagement.com for daily and most recent month-end performance updates.
Summary
1-year return as of 02/29/12
| | |
| |
 | | +4.65% Class A shares |
| |
| | +5.14% S&P SmallCap 600® Index |
|
Morningstar Style Box™ |
|
Equity Style |
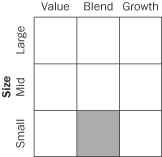
|
The Morningstar Style Box™ is based on the fund’s portfolio holdings. For equity funds, the vertical axis shows the market capitalization of the stocks owned, and the horizontal axis shows investment style (value, blend, or growth). Information shown is based on the most recent data provided by Morningstar.
© 2012 Morningstar, Inc. All rights reserved. The Morningstar information contained herein: (1) is proprietary to Morningstar and/or its content providers; (2) may not be copied or distributed; and (3) is not warranted to be accurate, complete or timely. Neither Morningstar nor its content providers are responsible for any damages or losses arising from any use of this information.
1
Performance Information – Columbia Small Cap Index Fund
Performance data quoted represents past performance and current performance may be lower or higher. Past performance is no guarantee of future results. The investment return and principal value will fluctuate so that shares, when redeemed, may be worth more or less than the original cost. Please visit www.columbiamanagement.com for daily and most recent month-end performance updates.
|
| Performance of a $10,000 investment 03/01/02 – 02/29/12 |
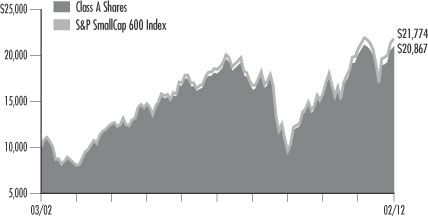
The chart above shows the change in value of a hypothetical $10,000 investment in Class A shares of Columbia Small Cap Index Fund during the stated time period, and does not reflect the deduction of taxes that a shareholder may pay on fund distributions or on the redemption of fund shares.
| | | | | | | | |
| Performance of a $10,000 investment 03/01/02 – 02/29/12 ($) | |
| | |
| Sales charge | | without | | | with | |
Class A | | | 20,867 | | | | n/a | |
Class B* | | | 19,360 | | | | 19,360 | |
Class I* | | | 20,880 | | | | n/a | |
Class R4* | | | 20,864 | | | | n/a | |
Class Z | | | 21,403 | | | | n/a | |
| | | | | | | | | | | | | | | | | | | | | | | | |
| Average annual total return as of 02/29/12 (%) | |
| Share class | | A | | | B* | | | I* | | | R4* | | | Z | |
| Inception | | 10/15/96 | | | 03/07/11 | | | 11/16/11 | | | 03/07/11 | | | 10/15/96 | |
| Sales charge | | without | | | without | | | with | | | without | | | without | | | without | |
1-year | | | 4.65 | | | | 3.85 | | | | –1.07 | | | | 4.72 | | | | 4.64 | | | | 4.92 | |
5-year | | | 3.08 | | | | 2.30 | | | | 2.01 | | | | 3.09 | | | | 3.07 | | | | 3.33 | |
10-year | | | 7.63 | | | | 6.83 | | | | 6.83 | | | | 7.64 | | | | 7.63 | | | | 7.91 | |
The “with sales charge” returns include the applicable contingent deferred sales charge of 5.00% in the first year, declining to 1.00% in the sixth year, and eliminated thereafter for Class B shares. The “without sales charge” returns do not include the effect of sales charges. If they had, returns would be lower.
Performance results reflect any fee waivers or reimbursements of fund expenses by Columbia Management Investment Advisers, LLC and/or any of its affiliates. Absent these fee waivers or expense reimbursement arrangements, performance results would have been lower.
All results shown assume reinvestment of distributions. Class I, Class R4 and Class Z shares are sold at net asset value with no distribution and service (Rule 12b-1) fees. Class I, Class R4 and Class Z shares have limited eligibility and the investment minimum requirements may vary. Please see the fund’s prospectuses for details. Performance for different share classes will vary based on differences in sales charges and fees associated with each class.
The tables do not reflect the deduction of taxes that a shareholder may pay on fund distributions or on the redemption of fund shares.
Class B and Class R4 shares were initially offered by the Fund on March 7, 2011.
Class I shares were initially offered by the Fund on November 16, 2011.
| * | The returns shown for periods prior to the share class inception date (including returns since inception, which are since fund inception) include the returns of the fund’s oldest share class. These returns are adjusted to reflect any higher class-related operating expenses of the newer share classes, as applicable. Please visit columbiamanagement.com/mutual-funds/appended-performance for more information. |
2
Understanding Your Expenses – Columbia Small Cap Index Fund
As an investor, you incur two types of costs. There are transaction costs, which generally include sales charges on purchases and may include redemption fees. There are also ongoing costs, which generally include management fees, distribution and service (Rule 12b-1) fees, and other fund expenses. The following information is intended to help you understand your ongoing costs (in dollars) of investing in the Fund and to help you compare these costs with the ongoing costs of investing in other mutual funds.
Analyzing your fund’s expenses
To illustrate these ongoing costs, we have provided examples and calculated the expenses paid by investors in each share class of the Fund during the period. The actual and hypothetical information in the table is based on an initial investment of $1,000 at the beginning of the period indicated and held for the entire period. Expense information is calculated two ways and each method provides you with different information. The amount listed in the “Actual” column is calculated using the Fund’s actual operating expenses and total return for the period. You may use the Actual information, together with the amount invested, to estimate the expenses that you paid over the period. Simply divide your account value by $1,000 (for example, an $8,600 account value divided by $1,000 = 8.6), then multiply the results by the expenses paid during the period under the Actual column. The amount listed in the “Hypothetical” column assumes a 5% annual rate of return before expenses (which is not the Fund’s actual return) and then applies the Fund’s actual expense ratio for the period to the hypothetical return. You should not use the hypothetical account values and expenses to estimate either your actual account balance at the end of the period or the expenses you paid during the period. See “Compare with other funds” below for details on how to use the hypothetical data.
Compare with other funds
Since all mutual funds are required to include the same hypothetical calculations about expenses in shareholder reports, you can use this information to compare the ongoing cost of investing in the Fund with other funds. To do so, compare the hypothetical example with the 5% hypothetical examples that appear in the shareholder reports of other funds. As you compare hypothetical examples of other funds, it is important to note that hypothetical examples are meant to highlight the ongoing costs of investing in a fund only and do not reflect any transaction costs, such as sales charges, or redemption or exchange fees. Therefore, the hypothetical calculations are useful in comparing ongoing costs only, and will not help you determine the relative total costs of owning different funds. If transaction costs were included in these calculations, your costs would be higher.
| | | | | | | | | | | | | | | | | | | | | | | | | | | | |
09/01/2011 – 02/29/2012 | | | | | | | |
| | | | |
| | | Account value at the
beginning of the period ($) | | | Account value at the
end of the period ($) | | | Expenses paid
during the period ($) | | | Fund’s annualized
expense ratio (%) | |
| | | Actual | | | Hypothetical | | | Actual | | | Hypothetical | | | Actual | | | Hypothetical | | | Actual | |
Class A | | | 1,000.00 | | | | 1,000.00 | | | | 1,141.20 | | | | 1,022.63 | | | | 2.40 | | | | 2.26 | | | | 0.45 | |
Class B | | | 1,000.00 | | | | 1,000.00 | | | | 1,137.50 | | | | 1,018.90 | | | | 6.38 | | | | 6.02 | | | | 1.20 | |
Class I | | | 1,000.00 | | | | 1,000.00 | | | | 1,120.30 | * | | | 1,024.02 | | | | 0.51 | * | | | 0.86 | | | | 0.17 | |
Class R4 | | | 1,000.00 | | | | 1,000.00 | | | | 1,141.50 | | | | 1,022.63 | | | | 2.40 | | | | 2.26 | | | | 0.45 | |
Class Z | | | 1,000.00 | | | | 1,000.00 | | | | 1,143.10 | | | | 1,023.87 | | | | 1.07 | | | | 1.01 | | | | 0.20 | |
| * | For the period November 16, 2011 through February 29, 2012. Class I shares commenced operations on November 16, 2011. |
Expenses paid during the period are equal to the annualized expense ratio for each class as indicated above, multiplied by the average account value over the period and then multiplied by the number of days in the Fund’s most recent fiscal half year and divided by 366.
Expenses do not include fees and expenses incurred indirectly by the Fund from the underlying funds in which the Fund may invest (also referred to as “acquired funds”), including affiliated and non-affiliated pooled investments vehicles (including mutual funds and exchange traded funds).
Had Columbia Management Investment Advisers, LLC and/or certain of its affiliates not waived/reimbursed certain fees and expenses, account value at the end of the period would have been reduced.
3
Portfolio Managers’ Report – Columbia Small Cap Index Fund
Performance data quoted represents past performance and current performance may be lower or higher. Past performance is no guarantee of future results. The investment return and principal value will fluctuate so that shares, when redeemed, may be worth more or less than the original cost. Please visit www.columbiamanagement.com for daily and most recent month-end performance updates.
| | | | |
| Net asset value per share | |
| |
as of 02/29/12 ($) | | | | |
Class A | | | 17.75 | |
Class B | | | 17.73 | |
Class I | | | 17.76 | |
Class R4 | | | 17.80 | |
Class Z | | | 17.81 | |
| | | | |
| Distribution declared per share | |
| |
03/01/11 – 02/29/12 ($) | | | | |
Class A | | | 1.04 | |
Class B | | | 0.93 | |
Class I | | | 0.63 | |
Class R4 | | | 1.04 | |
Class Z | | | 1.07 | |
For the 12-month period that ended February 29, 2012, the fund’s Class A shares returned 4.65% without sales charge. The S&P SmallCap 600 Index returned 5.14%. The fund seeks to allocate fund assets among common stocks in approximately the same weightings of the S&P SmallCap 600 Index. As such, its return was in line with the return of the index, after fees and expenses, which the index does not incur.
U.S. economy picks up momentum
During the first half of the 12-month period, a series of natural disasters in Japan, Europe’s debt problems and wrangling in Washington over the federal budget and the national debt dominated world headlines. U.S. economic news was lackluster and job growth was disappointing. However, the pace of growth picked up in the second half of the period and, as fears of a lapse back into recession faded, prospects brightened. Consumer confidence improved even though consumers remain under pressure, with no real increase in disposable income and a continued decline in household net worth. The labor markets added more than a million new jobs from September 2011 through February 2012, and the jobless rate fell to 8.3%. Headline inflation — which tracks a broad range of consumer expenditures, including food and energy — remained within its historical range. Even manufacturing held its ground. A modest slowdown in manufacturing activity late in the summer of 2011 raised concern that this lynchpin of the recovery was ready to turn downward. However, manufacturing activity stabilized, and the manufacturing expansion continued into 2012. Housing continues to be the one nagging weak spot in the economy. Yet, home sales edged modestly higher over the year, and there is hope that a bottom in the housing market is in sight.
Defensive sectors drove returns
For the 12-month period, the health care, utilities and consumer staples sectors generated the highest returns. However, health care, consumer discretionary and financials were the top three contributors to returns, based on sector weights, in both the fund and the index. Pharmaceuticals, distributors, biotechnology, containers & packaging and Internet software & services were the leading industry gainers. The top three individual securities within the index and the fund were in the health care sector: Questcor Pharmaceuticals (0.5% of net assets), HealthSpring and Regeneron Pharmaceuticals (positions eliminated).
Telecommunication services, energy and information technology were the weakest sector performers for the period. Automobiles, media, real estate management & development, capital markets and metals & mining logged the most disappointing results within industry groups. TriQuint Semicondutor, Veeco Instruments and ION Geophysical (0.2%, 0.2% and 0.2% of net assets, respectively) were the worst-performing individual securities in the index and the fund for the period.
There were 59 additions and deletions to the index during the 12-month period. Since the fund is mandated to track the underlying benchmark, all changes that were made to the index were also made to the fund.
The fund owned equity index futures contracts in the notional amount of its cash balances during the period. It does so in order to keep its investment exposure on par with the index, which is always fully invested.
4
Portfolio Managers’ Report (continued) – Columbia Small Cap Index Fund
Looking ahead
As the period ended, economic data suggested that economic growth will continue at a below-trend pace and that, at least in the near term, the U.S. economy has moved away from recessionary conditions. Recession odds have been reduced with the extension of the payroll tax cut and unemployment benefit programs. However, this extension is temporary and only kicks the can down the road into 2013, when severe curtailments are set to bite. And while U.S. economic data is mildly encouraging, there is still a reasonable chance of a mild recession. Europe may already be in a recession, which is likely to worsen further into 2012 as austerity measures begin to bite deeper. The good news is that these measures will initially reduce deficits, but without economic growth it is hard to make significant and persistent progress in debt reduction. So while many of the issues that worried us in 2011 continue to worry us into 2012, we are, nonetheless, cautiously optimistic about the potential for financial returns in 2012.
Equity securities are subject to stock market fluctuations that occur in response to economic and business developments.
Stocks of small-cap companies pose special risks, including possible illiquidity and greater price volatility than stocks of larger, more established companies.
| | | | |
| Portfolio breakdown1 | |
| |
(as of February 29, 2012) | | | | |
Consumer Discretionary | | | 15.2 | % |
Consumer Staples | | | 4.1 | |
Energy | | | 4.6 | |
Financials | | | 19.3 | |
Health Care | | | 10.6 | |
Industrials | | | 15.5 | |
Information Technology | | | 19.2 | |
Materials | | | 5.2 | |
Telecommunication Services | | | 0.6 | |
Utilities | | | 4.1 | |
Other2 | | | 1.6 | |
| | 1 | Percentages indicated are based upon total investments (excluding Investments of Cash Collateral Received for Securities on Loan). The Fund’s portfolio composition is subject to change. |
| | 2 | Includes investments in an affiliated money market fund. |
| | | | |
| Top ten holdings1 | |
| |
(as of February 29, 2012) | | | | |
Kilroy Realty Corp. | | | 0.6 | % |
Salix Pharmaceuticals Ltd. | | | 0.6 | |
BioMed Realty Trust, Inc. | | | 0.6 | |
ProAssurance Corp. | | | 0.5 | |
Cubist Pharmaceuticals, Inc. | | | 0.5 | |
Tanger Factory Outlet Centers | | | 0.5 | |
Extra Space Storage, Inc. | | | 0.5 | |
Centene Corp. | | | 0.5 | |
Questcor Pharmaceuticals, Inc. | | | 0.5 | |
Delphi Financial Group, Inc., Class A | | | 0.5 | |
| | 1 | Percentages indicated are based upon total investments (excluding Investments of Cash Collateral Received for Securities on Loan and an affiliated money market fund). |
For further detail about these holdings, please refer to the section entitled “Portfolio of Investments.”
Fund holdings are as of the date given, are subject to change at any time, and are not recommendations to buy or sell any security.
5
Portfolio of Investments – Columbia Small Cap Index Fund
February 29, 2012
(Percentages represent value of investments compared to net assets)
| | | | | | | | |
| Issuer | | Shares | | | Value | |
Common Stocks 98.8% | |
CONSUMER DISCRETIONARY 15.3% | |
Auto Components 0.3% | | | | | | | | |
Drew Industries, Inc.(a) | | | 87,118 | | | | $2,387,033 | |
Spartan Motors, Inc. | | | 154,218 | | | | 880,585 | |
Standard Motor Products, Inc.(b) | | | 89,405 | | | | 2,031,282 | |
Superior Industries International, Inc. | | | 108,519 | | | | 1,962,023 | |
| | | | | | | | |
Total | | | | | | | 7,260,923 | |
Automobiles 0.1% | | | | | | | | |
Winnebago Industries, Inc.(a)(b) | | | 133,785 | | | | 1,193,362 | |
Distributors 0.4% | | | | | | | | |
Pool Corp. | | | 218,678 | | | | 7,959,879 | |
VOXX International Corp.(a) | | | 85,848 | | | | 1,097,996 | |
| | | | | | | | |
Total | | | | | | | 9,057,875 | |
Diversified Consumer Services 1.2% | | | | | | | | |
American Public Education, Inc.(a) | | | 81,920 | | | | 3,207,987 | |
Capella Education Co.(a) | | | 66,374 | | | | 2,575,311 | |
Career Education Corp.(a) | | | 275,190 | | | | 2,372,138 | |
Coinstar, Inc.(a)(b) | | | 141,305 | | | | 8,228,190 | |
Corinthian Colleges, Inc.(a) | | | 389,610 | | | | 1,749,349 | |
Hillenbrand, Inc. | | | 287,016 | | | | 6,592,758 | |
Lincoln Educational Services Corp. | | | 103,905 | | | | 879,036 | |
Universal Technical Institute, Inc.(a) | | | 98,658 | | | | 1,281,567 | |
| | | | | | | | |
Total | | | | | | | 26,886,336 | |
Hotels, Restaurants & Leisure 3.2% | | | | | | | | |
Biglari Holdings, Inc.(a)(b) | | | 6,573 | | | | 2,698,282 | |
BJ’s Restaurants, Inc.(a)(b) | | | 110,699 | | | | 5,496,205 | |
Boyd Gaming Corp.(a)(b) | | | 249,750 | | | | 2,000,498 | |
Buffalo Wild Wings, Inc.(a) | | | 84,309 | | | | 7,291,885 | |
CEC Entertainment, Inc. | | | 86,615 | | | | 3,305,228 | |
Cracker Barrel Old Country Store, Inc. | | | 105,390 | | | | 5,867,061 | |
DineEquity, Inc.(a)(b) | | | 71,228 | | | | 3,802,151 | |
Interval Leisure Group, Inc.(a) | | | 182,619 | | | | 2,463,530 | |
Jack in the Box, Inc.(a) | | | 201,940 | | | | 4,816,269 | |
Marcus Corp. | | | 91,313 | | | | 1,100,322 | |
Marriott Vacations Worldwide Corp.(a) | | | 123,790 | | | | 3,086,085 | |
Monarch Casino & Resort, Inc.(a) | | | 52,615 | | | | 551,405 | |
Multimedia Games Holdings Co., Inc.(a) | | | 123,192 | | | | 1,260,254 | |
O’Charleys, Inc.(a)(b) | | | 85,767 | | | | 849,951 | |
Papa John’s International, Inc.(a) | | | 85,051 | | | | 3,160,495 | |
Peet’s Coffee & Tea, Inc.(a) | | | 59,366 | | | | 3,822,577 | |
PF Chang’s China Bistro, Inc. | | | 97,410 | | | | 3,732,751 | |
Pinnacle Entertainment, Inc.(a) | | | 285,320 | | | | 3,141,373 | |
Red Robin Gourmet Burgers, Inc.(a) | | | 51,170 | | | | 1,760,760 | |
Ruby Tuesday, Inc.(a) | | | 287,209 | | | | 2,234,486 | |
Ruth’s Hospitality Group, Inc.(a) | | | 161,879 | | | | 1,008,506 | |
Shuffle Master, Inc.(a) | | | 246,281 | | | | 3,595,703 | |
Sonic Corp.(a) | | | 284,703 | | | | 2,351,647 | |
Texas Roadhouse, Inc. | | | 272,765 | | | | 4,563,359 | |
| | | | | | | | |
Total | | | | | | | 73,960,783 | |
Household Durables 1.2% | | | | | | | | |
Blyth, Inc. | | | 23,852 | | | | 1,521,758 | |
Ethan Allen Interiors, Inc. | | | 119,217 | | | | 3,010,229 | |
Helen of Troy Ltd.(a) | | | 145,055 | | | | 4,714,288 | |
iRobot Corp.(a) | | | 124,145 | | | | 3,168,180 | |
La-Z-Boy, Inc.(a) | | | 238,114 | | | | 3,402,649 | |
M/I Homes, Inc.(a) | | | 86,062 | | | | 1,042,211 | |
| | | | | | | | |
| Issuer | | Shares | | | Value | |
Common Stocks (continued) | |
CONSUMER DISCRETIONARY (cont.) | |
Household Durables (cont.) | | | | | | | | |
Meritage Homes Corp.(a) | | | 128,078 | | | | $3,315,939 | |
Ryland Group, Inc. (The) | | | 203,970 | | | | 3,697,976 | |
Standard Pacific Corp.(a) | | | 463,990 | | | | 2,032,276 | |
Universal Electronics, Inc.(a) | | | 67,787 | | | | 1,325,914 | |
| | | | | | | | |
Total | | | | | | | 27,231,420 | |
Internet & Catalog Retail 0.2% | | | | | | | | |
Blue Nile, Inc.(a)(b) | | | 62,246 | | | | 2,219,070 | |
Nutrisystem, Inc.(b) | | | 129,000 | | | | 1,453,830 | |
PetMed Express, Inc. | | | 93,415 | | | | 1,137,795 | |
| | | | | | | | |
Total | | | | | | | 4,810,695 | |
Leisure Equipment & Products 0.8% | | | | | | | | |
Arctic Cat, Inc.(a) | | | 55,980 | | | | 2,058,944 | |
Brunswick Corp. | | | 409,129 | | | | 9,782,274 | |
Callaway Golf Co.(b) | | | 297,954 | | | | 1,951,599 | |
JAKKS Pacific, Inc. | | | 119,305 | | | | 1,852,807 | |
Sturm Ruger & Co., Inc. | | | 87,447 | | | | 3,653,536 | |
| | | | | | | | |
Total | | | | | | | 19,299,160 | |
Media 0.7% | | | | | | | | |
Arbitron, Inc. | | | 125,137 | | | | 4,184,581 | |
Digital Generation, Inc.(a) | | | 126,350 | | | | 1,263,500 | |
EW Scripps Co., Class A(a) | | | 143,246 | | | | 1,363,702 | |
Harte-Hanks, Inc. | | | 201,935 | | | | 1,764,912 | |
Live Nation Entertainment, Inc.(a) | | | 678,673 | | | | 6,325,232 | |
| | | | | | | | |
Total | | | | | | | 14,901,927 | |
Multiline Retail 0.1% | | | | | | | | |
Fred’s, Inc., Class A(b) | | | 176,988 | | | | 2,451,284 | |
Tuesday Morning Corp.(a) | | | 195,044 | | | | 669,001 | |
| | | | | | | | |
Total | | | | | | | 3,120,285 | |
Specialty Retail 4.9% | | | | | | | | |
Big 5 Sporting Goods Corp. | | | 99,613 | | | | 775,985 | |
Brown Shoe Co., Inc. | | | 192,716 | | | | 2,077,479 | |
Buckle, Inc. (The)(b) | | | 124,068 | | | | 5,573,135 | |
Cabela’s, Inc.(a)(b) | | | 198,141 | | | | 7,030,043 | |
Cato Corp. (The), Class A | | | 135,270 | | | | 3,667,170 | |
Children’s Place Retail Stores, Inc. (The)(a) | | | 114,214 | | | | 5,796,361 | |
Christopher & Banks Corp. | | | 164,960 | | | | 353,014 | |
Coldwater Creek, Inc.(a) | | | 407,665 | | | | 383,205 | |
Finish Line, Inc., Class A (The) | | | 238,004 | | | | 5,471,712 | |
Genesco, Inc.(a) | | | 111,038 | | | | 7,566,129 | |
Group 1 Automotive, Inc.(b) | | | 104,404 | | | | 5,384,114 | |
Haverty Furniture Companies, Inc. | | | 87,715 | | | | 964,865 | |
Hibbett Sports, Inc.(a) | | | 121,498 | | | | 5,947,327 | |
HOT Topic, Inc. | | | 194,030 | | | | 1,730,748 | |
JOS A Bank Clothiers, Inc.(a) | | | 127,778 | | | | 6,579,289 | |
Kirkland’s, Inc.(a) | | | 74,495 | | | | 1,188,195 | |
Lithia Motors, Inc., Class A | | | 98,790 | | | | 2,332,432 | |
Lumber Liquidators Holdings, Inc.(a)(b) | | | 127,464 | | | | 2,790,187 | |
MarineMax, Inc.(a) | | | 106,878 | | | | 863,574 | |
Men’s Wearhouse, Inc. (The) | | | 235,059 | | | | 9,103,835 | |
Midas, Inc.(a) | | | 66,154 | | | | 603,986 | |
Monro Muffler Brake, Inc. | | | 141,502 | | | | 6,490,697 | |
OfficeMax, Inc.(a) | | | 395,481 | | | | 2,214,694 | |
PEP Boys-Manny Moe & Jack (The) | | | 242,086 | | | | 3,640,973 | |
The Accompanying Notes to Financial Statements are an integral part of this statement.
6
Columbia Small Cap Index Fund
February 29, 2012
| | | | | | | | |
| Issuer | | Shares | | | Value | |
Common Stocks (continued) | |
CONSUMER DISCRETIONARY (cont.) | |
Specialty Retail (cont.) | | | | | | | | |
Rue21, Inc.(a) | | | 71,885 | | | | $1,917,892 | |
Select Comfort Corp.(a) | | | 257,975 | | | | 7,633,480 | |
Sonic Automotive, Inc., Class A | | | 159,701 | | | | 2,735,678 | |
Stage Stores, Inc. | | | 139,696 | | | | 2,088,455 | |
Stein Mart, Inc.(a) | | | 124,284 | | | | 891,116 | |
Vitamin Shoppe, Inc.(a) | | | 134,050 | | | | 5,687,742 | |
Zale Corp.(a) | | | 119,626 | | | | 383,999 | |
Zumiez, Inc.(a) | | | 100,075 | | | | 3,144,357 | |
| | | | | | | | |
Total | | | | | | | 113,011,868 | |
Textiles, Apparel & Luxury Goods 2.2% | | | | | | | | |
CROCS, Inc.(a) | | | 414,508 | | | | 8,145,082 | |
Iconix Brand Group, Inc.(a) | | | 338,185 | | | | 6,141,440 | |
K-Swiss, Inc., Class A(a) | | | 125,861 | | | | 419,117 | |
Liz Claiborne, Inc.(a)(b) | | | 434,398 | | | | 4,248,412 | |
Maidenform Brands, Inc.(a) | | | 107,911 | | | | 2,266,131 | |
Movado Group, Inc. | | | 80,019 | | | | 1,712,407 | |
Oxford Industries, Inc.(b) | | | 63,594 | | | | 3,205,138 | |
Perry Ellis International, Inc.(a) | | | 55,699 | | | | 970,833 | |
Quiksilver, Inc.(a) | | | 561,523 | | | | 2,627,928 | |
Skechers U.S.A., Inc., Class A(a) | | | 169,535 | | | | 2,164,962 | |
Steven Madden Ltd.(a) | | | 175,182 | | | | 7,564,359 | |
True Religion Apparel, Inc.(a) | | | 117,358 | | | | 3,094,730 | |
Wolverine World Wide, Inc. | | | 221,773 | | | | 8,458,422 | |
| | | | | | | | |
Total | | | | | | | 51,018,961 | |
TOTAL CONSUMER DISCRETIONARY | | | | | | | 351,753,595 | |
CONSUMER STAPLES 4.1% | | | | | | | | |
Beverages 0.2% | | | | | | | | |
Boston Beer Co., Inc. (The), Class A(a) | | | 38,619 | | | | 3,650,268 | |
Food & Staples Retailing 1.1% | | | | | | | | |
Andersons, Inc. (The) | | | 84,973 | | | | 3,661,487 | |
Casey’s General Stores, Inc. | | | 174,737 | | | | 8,951,776 | |
Nash Finch Co. | | | 55,734 | | | | 1,494,229 | |
Spartan Stores, Inc. | | | 104,998 | | | | 1,873,164 | |
United Natural Foods, Inc.(a) | | | 223,877 | | | | 10,190,881 | |
| | | | | | | | |
Total | | | | | | | 26,171,537 | |
Food Products 2.2% | | | | | | | | |
B&G Foods, Inc. | | | 219,050 | | | | 5,099,484 | |
Cal-Maine Foods, Inc. | | | 65,761 | | | | 2,531,799 | |
Calavo Growers, Inc.(b) | | | 57,643 | | | | 1,585,183 | |
Darling International, Inc.(a) | | | 537,558 | | | | 8,595,552 | |
Diamond Foods, Inc.(b) | | | 101,303 | | | | 2,423,168 | |
Hain Celestial Group, Inc. (The)(a) | | | 202,354 | | | | 8,264,137 | |
J&J Snack Foods Corp. | | | 66,228 | | | | 3,322,659 | |
Sanderson Farms, Inc. | | | 86,462 | | | | 4,253,930 | |
Seneca Foods Corp., Class A(a) | | | 42,065 | | | | 1,077,705 | |
Snyders-Lance, Inc. | | | 214,794 | | | | 4,822,125 | |
TreeHouse Foods, Inc.(a) | | | 164,908 | | | | 9,498,701 | |
| | | | | | | | |
Total | | | | | | | 51,474,443 | |
Household Products 0.2% | | | | | | | | |
Central Garden and Pet Co., Class A(a) | | | 196,113 | | | | 1,876,801 | |
WD-40 Co. | | | 73,288 | | | | 3,157,247 | |
| | | | | | | | |
Total | | | | | | | 5,034,048 | |
Personal Products 0.3% | | | | | | | | |
Inter Parfums, Inc. | | | 74,305 | | | | 1,253,526 | |
| | | | | | | | |
| Issuer | | Shares | | | Value | |
Common Stocks (continued) | |
CONSUMER STAPLES (cont.) | | | | | | | | |
Personal Products (cont.) | | | | | | | | |
Medifast, Inc.(a)(b) | | | 63,140 | | | | $1,024,762 | |
Prestige Brands Holdings, Inc.(a) | | | 231,590 | | | | 3,821,235 | |
| | | | | | | | |
Total | | | | | | | 6,099,523 | |
Tobacco 0.1% | | | | | | | | |
Alliance One International, Inc.(a) | | | 401,209 | | | | 1,480,461 | |
TOTAL CONSUMER STAPLES | | | | | | | 93,910,280 | |
ENERGY 4.6% | |
Energy Equipment & Services 2.6% | | | | | | | | |
Basic Energy Services, Inc.(a) | | | 134,677 | | | | 2,674,685 | |
Bristow Group, Inc.(b) | | | 166,062 | | | | 7,839,787 | |
Exterran Holdings, Inc.(a) | | | 286,390 | | | | 4,124,016 | |
Gulf Island Fabrication, Inc. | | | 65,900 | | | | 1,931,529 | |
Hornbeck Offshore Services, Inc.(a)(b) | | | 155,811 | | | | 6,349,298 | |
ION Geophysical Corp.(a) | | | 584,448 | | | | 4,184,648 | |
Lufkin Industries, Inc. | | | 139,929 | | | | 11,143,946 | |
Matrix Service Co.(a) | | | 118,825 | | | | 1,573,243 | |
OYO Geospace Corp.(a) | | | 29,130 | | | | 3,205,756 | |
Pioneer Drilling Co.(a) | | | 283,033 | | | | 2,819,009 | |
SEACOR Holdings, Inc.(a) | | | 99,726 | | | | 9,860,907 | |
Tetra Technologies, Inc.(a) | | | 354,833 | | | | 3,225,432 | |
| | | | | | | | |
Total | | | | 58,932,256 | |
Oil, Gas & Consumable Fuels 2.0% | | | | | | | | |
Approach Resources, Inc.(a) | | | 122,140 | | | | 4,221,158 | |
Cloud Peak Energy, Inc.(a) | | | 279,800 | | | | 4,958,056 | |
Comstock Resources, Inc.(a) | | | 218,800 | | | | 3,507,364 | |
Contango Oil & Gas Co.(a) | | | 58,545 | | | | 3,722,291 | |
Georesources, Inc.(a) | | | 91,640 | | | | 2,936,146 | |
Gulfport Energy Corp.(a) | | | 204,615 | | | | 6,879,156 | |
Overseas Shipholding Group, Inc.(b) | | | 120,320 | | | | 1,064,832 | |
Penn Virginia Corp. | | | 209,914 | | | | 1,026,480 | |
Petroleum Development Corp.(a) | | | 108,423 | | | | 3,528,084 | |
Petroquest Energy, Inc.(a)(b) | | | 262,235 | | | | 1,599,634 | |
Stone Energy Corp.(a) | | | 224,933 | | | | 7,186,609 | |
Swift Energy Co.(a) | | | 195,085 | | | | 5,858,403 | |
| | | | | | | | |
Total | | | | 46,488,213 | |
TOTAL ENERGY | | | | 105,420,469 | |
FINANCIALS 19.4% | | | | | | | | |
Capital Markets 1.2% | | | | | | | | |
Calamos Asset Management, Inc., Class A | | | 92,445 | | | | 1,133,376 | |
Financial Engines, Inc.(a) | | | 179,690 | | | | 4,141,854 | |
Investment Technology Group, Inc.(a) | | | 183,696 | | | | 2,112,504 | |
Piper Jaffray Companies(a) | | | 71,433 | | | | 1,755,823 | |
Prospect Capital Corp.(b) | | | 557,795 | | | | 6,029,764 | |
Stifel Financial Corp.(a) | | | 246,669 | | | | 9,257,488 | |
SWS Group, Inc. | | | 134,785 | | | | 753,448 | |
Virtus Investment Partners, Inc.(a) | | | 28,350 | | | | 2,254,959 | |
| | | | | | | | |
Total | | | | 27,439,216 | |
Commercial Banks 5.6% | | | | | | | | |
Bank of the Ozarks, Inc.(b) | | | 130,626 | | | | 3,833,873 | |
BBCN Bancorp, Inc.(a) | | | 358,095 | | | | 3,670,474 | |
Boston Private Financial Holdings, Inc. | | | 358,248 | | | | 3,414,104 | |
City Holding Co.(b) | | | 68,000 | | | | 2,330,360 | |
Columbia Banking System, Inc. | | | 181,386 | | | | 3,836,314 | |
Community Bank System, Inc.(b) | | | 177,700 | | | | 4,854,764 | |
The Accompanying Notes to Financial Statements are an integral part of this statement.
7
Columbia Small Cap Index Fund
February 29, 2012
| | | | | | | | |
| Issuer | | Shares | | | Value | |
Common Stocks (continued) | |
FINANCIALS (cont.) | | | | | | | | |
Commercial Banks (cont.) | | | | | | | | |
First BanCorp(a)(b) | | | 94,244 | | | | $364,724 | |
First Commonwealth Financial Corp. | | | 481,762 | | | | 2,885,754 | |
First Financial Bancorp | | | 267,566 | | | | 4,380,055 | |
First Financial Bankshares, Inc.(b) | | | 144,456 | | | | 4,949,045 | |
First Midwest Bancorp, Inc. | | | 342,064 | | | | 3,954,260 | |
FNB Corp. | | | 639,685 | | | | 7,541,886 | |
Glacier Bancorp, Inc.(b) | | | 330,243 | | | | 4,557,353 | |
Hanmi Financial Corp.(a) | | | 144,617 | | | | 1,253,829 | |
Home Bancshares, Inc. | | | 102,555 | | | | 2,584,386 | |
Independent Bank Corp.(b) | | | 98,665 | | | | 2,712,301 | |
National Penn Bancshares, Inc. | | | 564,414 | | | | 4,938,623 | |
NBT Bancorp, Inc. | | | 152,024 | | | | 3,315,644 | |
Old National Bancorp | | | 435,117 | | | | 5,256,213 | |
PacWest Bancorp | | | 154,000 | | | | 3,352,580 | |
Pinnacle Financial Partners, Inc.(a)(b) | | | 157,569 | | | | 2,609,343 | |
PrivateBancorp, Inc. | | | 273,667 | | | | 3,968,172 | |
S&T Bancorp, Inc.(b) | | | 129,059 | | | | 2,737,341 | |
Simmons First National Corp., Class A(b) | | | 79,302 | | | | 2,084,850 | |
Sterling Bancorp(b) | | | 142,036 | | | | 1,264,120 | |
Susquehanna Bancshares, Inc. | | | 856,784 | | | | 7,942,388 | |
Texas Capital Bancshares, Inc.(a) | | | 172,030 | | | | 5,830,097 | |
Tompkins Financial Corp. | | | 37,811 | | | | 1,554,032 | |
UMB Financial Corp. | | | 148,401 | | | | 6,180,902 | |
Umpqua Holdings Corp. | | | 526,001 | | | | 6,480,332 | |
United Bankshares, Inc.(b) | | | 207,515 | | | | 6,076,039 | |
United Community Banks, Inc.(a) | | | 87,201 | | | | 782,193 | |
Wilshire Bancorp, Inc.(a) | | | 275,006 | | | | 1,193,526 | |
Wintrust Financial Corp. | | | 165,021 | | | | 5,562,858 | |
| | | | | | | | |
Total | | | | 128,252,735 | |
Consumer Finance 1.0% | | | | | | | | |
Cash America International, Inc. | | | 134,459 | | | | 6,236,209 | |
Ezcorp, Inc., Class A(a) | | | 201,208 | | | | 6,338,052 | |
First Cash Financial Services, Inc.(a) | | | 138,135 | | | | 5,837,585 | |
World Acceptance Corp.(a) | | | 66,933 | | | | 4,251,584 | |
| | | | | | | | |
Total | | | | | | | 22,663,430 | |
Diversified Financial Services 0.1% | | | | | | | | |
Interactive Brokers Group, Inc., Class A | | | 177,855 | | | | 2,820,780 | |
Insurance 2.8% | | | | | | | | |
AMERISAFE, Inc.(a) | | | 82,945 | | | | 1,871,239 | |
Delphi Financial Group, Inc., Class A | | | 250,753 | | | | 11,173,554 | |
eHealth, Inc.(a) | | | 92,065 | | | | 1,383,737 | |
Employers Holdings, Inc. | | | 160,171 | | | | 2,769,357 | |
Horace Mann Educators Corp. | | | 183,345 | | | | 3,177,369 | |
Infinity Property & Casualty Corp. | | | 54,352 | | | | 2,980,120 | |
Meadowbrook Insurance Group, Inc. | | | 234,415 | | | | 2,231,631 | |
National Financial Partners Corp.(a)(b) | | | 189,976 | | | | 2,899,034 | |
Navigators Group, Inc. (The)(a) | | | 50,538 | | | | 2,375,791 | |
Presidential Life Corp. | | | 97,798 | | | | 1,058,174 | |
ProAssurance Corp. | | | 140,252 | | | | 12,308,515 | |
RLI Corp.(b) | | | 76,462 | | | | 5,356,928 | |
Safety Insurance Group, Inc. | | | 69,728 | | | | 2,975,991 | |
Selective Insurance Group, Inc. | | | 248,970 | | | | 4,277,305 | |
Stewart Information Services Corp.(b) | | | 88,636 | | | | 1,164,677 | |
Tower Group, Inc. | | | 183,110 | | | | 4,220,685 | |
United Fire Group, Inc. | | | 94,879 | | | | 1,906,119 | |
| | | | | | | | |
Total | | | | 64,130,226 | |
| | | | | | | | |
| Issuer | | Shares | | | Value | |
Common Stocks (continued) | |
FINANCIALS (cont.) | | | | | | | | |
Real Estate Investment Trusts (REITs) 7.7% | | | | | | | | |
Acadia Realty Trust | | | 195,566 | | | | $4,144,044 | |
BioMed Realty Trust, Inc. | | | 706,413 | | | | 13,012,127 | |
Cedar Realty Trust, Inc. | | | 256,114 | | | | 1,219,103 | |
Colonial Properties Trust | | | 401,277 | | | | 8,234,204 | |
Cousins Properties, Inc. | | | 472,740 | | | | 3,493,549 | |
DiamondRock Hospitality Co. | | | 769,195 | | | | 7,661,182 | |
EastGroup Properties, Inc.(b) | | | 123,261 | | | | 5,939,948 | |
Entertainment Properties Trust | | | 214,581 | | | | 9,763,435 | |
Extra Space Storage, Inc. | | | 433,382 | | | | 11,428,283 | |
Franklin Street Properties Corp. | | | 331,349 | | | | 3,416,208 | |
Getty Realty Corp.(b) | | | 124,205 | | | | 2,111,485 | |
Healthcare Realty Trust, Inc. | | | 357,466 | | | | 7,388,822 | |
Inland Real Estate Corp. | | | 355,365 | | | | 3,081,015 | |
Kilroy Realty Corp. | | | 306,387 | | | | 13,432,006 | |
Kite Realty Group Trust | | | 289,963 | | | | 1,423,718 | |
LaSalle Hotel Properties | | | 384,762 | | | | 10,265,450 | |
Lexington Realty Trust(b) | | | 616,547 | | | | 5,333,132 | |
LTC Properties, Inc. | | | 139,309 | | | | 4,299,076 | |
Medical Properties Trust, Inc. | | | 602,256 | | | | 5,853,928 | |
Mid-America Apartment Communities, Inc. | | | 173,686 | | | | 10,832,796 | |
Parkway Properties, Inc. | | | 101,018 | | | | 1,009,170 | |
Pennsylvania Real Estate Investment Trust | | | 255,656 | | | | 3,430,904 | |
Post Properties, Inc. | | | 238,217 | | | | 10,402,936 | |
PS Business Parks, Inc. | | | 85,293 | | | | 5,323,989 | |
Saul Centers, Inc. | | | 54,020 | | | | 2,045,197 | |
Sovran Self Storage, Inc. | | | 127,899 | | | | 6,076,482 | |
Tanger Factory Outlet Centers | | | 398,097 | | | | 11,656,280 | |
Universal Health Realty Income Trust | | | 58,160 | | | | 2,197,866 | |
Urstadt Biddle Properties, Inc., Class A | | | 105,993 | | | | 2,015,987 | |
| | | | | | | | |
Total | | | | | | | 176,492,322 | |
Real Estate Management & Development 0.1% | | | | | | | | |
Forestar Group, Inc.(a) | | | 162,262 | | | | 2,545,891 | |
Thrifts & Mortgage Finance 0.9% | | | | | | | | |
Bank Mutual Corp. | | | 212,297 | | | | 834,327 | |
Brookline Bancorp, Inc. | | | 321,962 | | | | 2,955,611 | |
Dime Community Bancshares, Inc. | | | 128,652 | | | | 1,790,836 | |
Northwest Bancshares, Inc. | | | 447,735 | | | | 5,650,416 | |
Oritani Financial Corp. | | | 210,370 | | | | 2,741,121 | |
Provident Financial Services, Inc. | | | 247,115 | | | | 3,395,360 | |
TrustCo Bank Corp. | | | 428,525 | | | | 2,296,894 | |
ViewPoint Financial Group | | | 155,700 | | | | 2,333,943 | |
| | | | | | | | |
Total | | | | 21,998,508 | |
TOTAL FINANCIALS | | | | 446,343,108 | |
HEALTH CARE 10.6% | | | | | |
Biotechnology 0.8% | | | | | |
Arqule, Inc.(a) | | | 246,912 | | | | 1,753,075 | |
Cubist Pharmaceuticals, Inc.(a) | | | 282,736 | | | | 12,118,065 | |
Emergent Biosolutions, Inc.(a) | | | 113,916 | | | | 1,739,497 | |
Momenta Pharmaceuticals, Inc.(a) | | | 202,350 | | | | 2,966,451 | |
Savient Pharmaceuticals, Inc.(a)(b) | | | 322,364 | | | | 647,952 | |
| | | | | | | | |
Total | | | | 19,225,040 | |
Health Care Equipment & Supplies 3.2% | | | | | | | | |
Abaxis, Inc.(a) | | | 99,555 | | | | 2,644,181 | |
Align Technology, Inc.(a) | | | 313,817 | | | | 8,036,853 | |
Analogic Corp. | | | 56,157 | | | | 3,198,141 | |
The Accompanying Notes to Financial Statements are an integral part of this statement.
8
Columbia Small Cap Index Fund
February 29, 2012
| | | | | | | | |
| Issuer | | Shares | | | Value | |
Common Stocks (continued) | |
HEALTH CARE (cont.) | | | | | |
Health Care Equipment & Supplies (cont.) | | | | | | | | |
Cantel Medical Corp. | | | 90,344 | | | | $1,824,045 | |
CONMED Corp.(a) | | | 128,190 | | | | 3,825,190 | |
CryoLife, Inc.(a) | | | 129,206 | | | | 704,173 | |
Cyberonics, Inc.(a) | | | 114,148 | | | | 4,249,730 | |
Greatbatch, Inc.(a) | | | 107,580 | | | | 2,662,605 | |
Haemonetics Corp.(a) | | | 114,713 | | | | 7,689,212 | |
ICU Medical, Inc.(a)(b) | | | 55,887 | | | | 2,564,096 | |
Integra LifeSciences Holdings Corp.(a) | | | 91,156 | | | | 2,880,530 | |
Invacare Corp. | | | 146,274 | | | | 2,414,984 | |
Kensey Nash Corp. | | | 35,747 | | | | 807,167 | |
Meridian Bioscience, Inc.(b) | | | 189,347 | | | | 3,412,033 | |
Merit Medical Systems, Inc.(a) | | | 192,518 | | | | 2,410,325 | |
Natus Medical, Inc.(a) | | | 134,994 | | | | 1,413,387 | |
Neogen Corp.(a) | | | 107,340 | | | | 3,724,698 | |
NuVasive, Inc.(a) | | | 194,015 | | | | 3,044,095 | |
Palomar Medical Technologies, Inc.(a) | | | 89,607 | | | | 989,261 | |
SurModics, Inc.(a) | | | 66,781 | | | | 948,290 | |
Symmetry Medical, Inc.(a) | | | 166,763 | | | | 1,207,364 | |
West Pharmaceutical Services, Inc. | | | 154,841 | | | | 6,441,386 | |
Zoll Medical Corp.(a) | | | 101,711 | | | | 7,440,160 | |
| | | | | | | | |
Total | | | | | | | 74,531,906 | |
Health Care Providers & Services 3.2% | | | | | | | | |
Air Methods Corp.(a) | | | 51,945 | | | | 4,686,997 | |
Almost Family, Inc.(a) | | | 37,869 | | | | 866,443 | |
Amedisys, Inc.(a) | | | 135,152 | | | | 1,736,703 | |
AMN Healthcare Services, Inc.(a)(b) | | | 185,744 | | | | 991,873 | |
Amsurg Corp.(a) | | | 143,936 | | | | 3,761,048 | |
Bio-Reference Labs, Inc.(a) | | | 114,225 | | | | 2,300,491 | |
Centene Corp.(a) | | | 231,338 | | | | 11,289,294 | |
Chemed Corp. | | | 91,312 | | | | 5,644,908 | |
Corvel Corp.(a) | | | 29,424 | | | | 1,334,084 | |
Cross Country Healthcare, Inc.(a) | | | 143,474 | | | | 812,063 | |
Ensign Group, Inc. (The) | | | 75,510 | | | | 2,069,729 | |
Gentiva Health Services, Inc.(a) | | | 141,433 | | | | 1,110,249 | |
Hanger Orthopedic Group, Inc.(a) | | | 152,783 | | | | 3,161,080 | |
Healthways, Inc.(a) | | | 152,870 | | | | 1,215,316 | |
IPC The Hospitalist Co., Inc.(a) | | | 75,496 | | | | 2,745,790 | |
Kindred Healthcare, Inc.(a) | | | 239,340 | | | | 2,462,809 | |
Landauer, Inc. | | | 43,281 | | | | 2,321,593 | |
LHC Group, Inc.(a) | | | 72,539 | | | | 1,234,614 | |
Magellan Health Services, Inc.(a)(b) | | | 128,339 | | | | 6,065,301 | |
Molina Healthcare, Inc.(a) | | | 130,082 | | | | 4,417,585 | |
MWI Veterinary Supply, Inc.(a) | | | 58,400 | | | | 5,055,688 | |
PharMerica Corp.(a) | | | 134,927 | | | | 1,654,205 | |
PSS World Medical, Inc.(a) | | | 242,064 | | | | 5,865,211 | |
| | | | | | | | |
Total | | | | | | | 72,803,074 | |
Health Care Technology 0.6% | | | | | | | | |
Computer Programs & Systems, Inc. | | | 50,802 | | | | 3,090,794 | |
Medidata Solutions, Inc.(a) | | | 101,300 | | | | 2,019,922 | |
Omnicell, Inc.(a) | | | 152,551 | | | | 2,276,061 | |
Quality Systems, Inc. | | | 181,050 | | | | 7,761,613 | |
| | | | | | | | |
Total | | | | | | | 15,148,390 | |
Life Sciences Tools & Services 0.5% | | | | | | | | |
Affymetrix, Inc.(a) | | | 323,625 | | | | 1,349,516 | |
Cambrex Corp.(a) | | | 135,391 | | | | 901,704 | |
Enzo Biochem, Inc.(a) | | | 154,838 | | | | 399,482 | |
| | | | | | | | |
| Issuer | | Shares | | | Value | |
Common Stocks (continued) | |
HEALTH CARE (cont.) | | | | | |
Life Sciences Tools & Services (cont.) | | | | | | | | |
eResearchTechnology, Inc.(a) | | | 201,264 | | | | $1,284,064 | |
Parexel International Corp.(a) | | | 271,701 | | | | 6,651,241 | |
| | | | | | | | |
Total | | | | | | | 10,586,007 | |
Pharmaceuticals 2.3% | | | | | | | | |
Akorn, Inc.(a) | | | 308,730 | | | | 3,868,387 | |
Hi-Tech Pharmacal Co., Inc.(a)(b) | | | 46,900 | | | | 1,872,248 | |
Medicines Co. (The)(a) | | | 243,760 | | | | 5,223,777 | |
Par Pharmaceutical Companies, Inc.(a) | | | 164,948 | | | | 6,121,220 | |
Questcor Pharmaceuticals, Inc.(a) | | | 288,035 | | | | 11,204,562 | |
Salix Pharmaceuticals Ltd.(a) | | | 271,557 | | | | 13,393,191 | |
Viropharma, Inc.(a) | | | 323,950 | | | | 10,385,837 | |
| | | | | | | | |
Total | | | | | | | 52,069,222 | |
TOTAL HEALTH CARE | | | | | | | 244,363,639 | |
INDUSTRIALS 15.5% | | | | | | | | |
Aerospace & Defense 2.2% | | | | | | | | |
AAR Corp. | | | 178,450 | | | | 3,934,823 | |
Aerovironment, Inc.(a) | | | 81,393 | | | | 2,318,073 | |
American Science & Engineering, Inc. | | | 41,022 | | | | 2,982,299 | |
Ceradyne, Inc. | | | 111,121 | | | | 3,434,750 | |
Cubic Corp. | | | 72,423 | | | | 3,461,819 | |
Curtiss-Wright Corp. | | | 214,385 | | | | 7,964,403 | |
GenCorp, Inc.(a) | | | 274,058 | | | | 1,644,348 | |
Moog, Inc., Class A(a) | | | 207,725 | | | | 9,121,205 | |
National Presto Industries, Inc.(b) | | | 22,073 | | | | 1,911,301 | |
Orbital Sciences Corp.(a) | | | 269,789 | | | | 3,790,535 | |
Teledyne Technologies, Inc.(a) | | | 169,742 | | | | 10,116,623 | |
| | | | | | | | |
Total | | | | | | | 50,680,179 | |
Air Freight & Logistics 0.4% | | | | | | | | |
Forward Air Corp. | | | 131,076 | | | | 4,413,329 | |
HUB Group, Inc., Class A(a) | | | 172,299 | | | | 6,139,013 | |
| | | | | | | | |
Total | | | | | | | 10,552,342 | |
Airlines 0.3% | | | | | | | | |
Allegiant Travel Co.(a) | | | 69,165 | | | | 3,456,867 | |
Skywest, Inc. | | | 232,914 | | | | 2,659,878 | |
| | | | | | | | |
Total | | | | | | | 6,116,745 | |
Building Products 1.2% | | | | | | | | |
AAON, Inc.(b) | | | 86,021 | | | | 1,595,690 | |
AO Smith Corp. | | | 178,514 | | | | 8,061,692 | |
Apogee Enterprises, Inc. | | | 130,046 | | | | 1,725,710 | |
Gibraltar Industries, Inc.(a)(b) | | | 139,714 | | | | 1,930,848 | |
Griffon Corp. | | | 211,807 | | | | 2,264,217 | |
NCI Building Systems, Inc.(a) | | | 91,398 | | | | 1,105,916 | |
Quanex Building Products Corp. | | | 170,023 | | | | 2,892,091 | |
Simpson Manufacturing Co., Inc. | | | 185,759 | | | | 5,539,333 | |
Universal Forest Products, Inc. | | | 89,819 | | | | 2,886,783 | |
| | | | | | | | |
Total | | | | | | | 28,002,280 | |
Commercial Services & Supplies 2.5% | | | | | | | | |
ABM Industries, Inc. | | | 220,071 | | | | 4,995,612 | |
Consolidated Graphics, Inc.(a) | | | 41,005 | | | | 1,914,523 | |
Encore Capital Group, Inc.(a) | | | 100,145 | | | | 2,231,231 | |
G&K Services, Inc., Class A | | | 86,429 | | | | 2,880,679 | |
Geo Group, Inc. (The)(a) | | | 287,522 | | | | 5,063,262 | |
Healthcare Services Group, Inc. | | | 306,583 | | | | 5,972,237 | |
The Accompanying Notes to Financial Statements are an integral part of this statement.
9
Columbia Small Cap Index Fund
February 29, 2012
| | | | | | | | |
| Issuer | | Shares | | | Value | |
Common Stocks (continued) | |
INDUSTRIALS (cont.) | | | | | | | | |
Commercial Services & Supplies (cont.) | | | | | | | | |
Interface, Inc., Class A | | | 264,617 | | | | $3,241,558 | |
Mobile Mini, Inc.(a) | | | 161,115 | | | | 3,480,084 | |
Portfolio Recovery Associates, Inc.(a) | | | 78,589 | | | | 5,480,011 | |
Standard Register Co. (The)(b) | | | 56,108 | | | | 88,090 | |
SYKES Enterprises, Inc.(a) | | | 182,172 | | | | 2,510,330 | |
Tetra Tech, Inc.(a) | | | 287,174 | | | | 7,052,993 | |
Unifirst Corp. | | | 70,260 | | | | 4,221,221 | |
United Stationers, Inc. | | | 195,964 | | | | 5,690,794 | |
Viad Corp. | | | 92,430 | | | | 1,798,688 | |
| | | | | | | | |
Total | | | | | | | 56,621,313 | |
Construction & Engineering 0.8% | | | | | | | | |
Aegion Corp.(a) | | | 179,069 | | | | 3,153,405 | |
Comfort Systems U.S.A., Inc.(b) | | | 171,995 | | | | 1,967,623 | |
Dycom Industries, Inc.(a) | | | 154,531 | | | | 3,288,420 | |
EMCOR Group, Inc. | | | 306,367 | | | | 8,517,003 | |
Orion Marine Group, Inc.(a) | | | 124,525 | | | | 909,032 | |
| | | | | | | | |
Total | | | | | | | 17,835,483 | |
Electrical Equipment 1.8% | | | | | | | | |
AZZ, Inc. | | | 57,715 | | | | 2,897,293 | |
Belden, Inc. | | | 213,946 | | | | 8,444,449 | |
Brady Corp., Class A | | | 240,661 | | | | 7,689,119 | |
Encore Wire Corp. | | | 88,210 | | | | 2,569,557 | |
EnerSys(a) | | | 219,050 | | | | 7,355,699 | |
Franklin Electric Co., Inc. | | | 86,350 | | | | 4,318,363 | |
II-VI, Inc.(a) | | | 250,580 | | | | 5,861,066 | |
Powell Industries, Inc.(a) | | | 41,006 | | | | 1,344,587 | |
Vicor Corp. | | | 90,260 | | | | 732,911 | |
| | | | | | | | |
Total | | | | | | | 41,213,044 | |
Industrial Conglomerates 0.1% | | | | | | | | |
Standex International Corp. | | | 58,074 | | | | 2,219,008 | |
Machinery 3.8% | | | | | | | | |
Actuant Corp., Class A | | | 316,512 | | | | 8,916,143 | |
Albany International Corp., Class A(b) | | | 129,237 | | | | 3,091,349 | |
Astec Industries, Inc.(a) | | | 91,706 | | | | 3,480,243 | |
Barnes Group, Inc. | | | 216,176 | | | | 5,988,075 | |
Briggs & Stratton Corp.(b) | | | 229,890 | | | | 3,894,336 | |
Cascade Corp. | | | 39,695 | | | | 2,113,362 | |
CIRCOR International, Inc. | | | 79,260 | | | | 2,624,299 | |
EnPro Industries, Inc.(a)(b) | | | 95,435 | | | | 3,608,397 | |
ESCO Technologies, Inc. | | | 122,491 | | | | 4,383,953 | |
Federal Signal Corp.(a) | | | 285,605 | | | | 1,342,343 | |
John Bean Technologies Corp. | | | 131,597 | | | | 2,272,680 | |
Kaydon Corp. | | | 147,521 | | | | 5,549,740 | |
Lindsay Corp. | | | 58,199 | | | | 3,817,272 | |
Lydall, Inc.(a) | | | 78,752 | | | | 717,431 | |
Mueller Industries, Inc. | | | 175,526 | | | | 8,074,196 | |
Robbins & Myers, Inc. | | | 210,790 | | | | 10,288,660 | |
Tennant Co. | | | 86,395 | | | | 3,545,651 | |
Toro Co. (The) | | | 140,827 | | | | 9,539,621 | |
Watts Water Technologies, Inc., Class A | | | 133,418 | | | | 5,275,348 | |
| | | | | | | | |
Total | | | | | | | 88,523,099 | |
Professional Services 1.0% | | | | | | | | |
CDI Corp. | | | 58,999 | | | | 885,575 | |
Dolan Co. (The)(a) | | | 138,566 | | | | 1,244,323 | |
Exponent, Inc.(a) | | | 60,806 | | | | 2,932,066 | |
| | | | | | | | |
| Issuer | | Shares | | | Value | |
Common Stocks (continued) | |
INDUSTRIALS (cont.) | | | | | | | | |
Professional Services (cont.) | | | | | | | | |
Heidrick & Struggles International, Inc.(b) | | | 81,935 | | | | $1,664,919 | |
Insperity, Inc. | | | 103,125 | | | | 3,107,156 | |
Kelly Services, Inc., Class A | | | 130,185 | | | | 1,952,775 | |
Navigant Consulting, Inc.(a) | | | 240,075 | | | | 3,243,413 | |
On Assignment, Inc.(a) | | | 169,292 | | | | 2,349,773 | |
Resources Connection, Inc. | | | 202,790 | | | | 2,650,465 | |
TrueBlue, Inc.(a) | | | 184,098 | | | | 3,048,663 | |
| | | | | | | | |
Total | | | | | | | 23,079,128 | |
Road & Rail 0.9% | | | | | | | | |
Arkansas Best Corp. | | | 116,740 | | | | 2,077,972 | |
Heartland Express, Inc. | | | 264,469 | | | | 3,826,866 | |
Knight Transportation, Inc. | | | 269,700 | | | | 4,619,961 | |
Old Dominion Freight Line, Inc.(a) | | | 216,313 | | | | 9,411,779 | |
| | | | | | | | |
Total | | | | | | | 19,936,578 | |
Trading Companies & Distributors 0.5% | |
Applied Industrial Technologies, Inc. | | | 192,793 | | | | 7,744,495 | |
Kaman Corp. | | | 120,343 | | | | 4,150,630 | |
Lawson Products, Inc. | | | 17,294 | | | | 282,065 | |
| | | | | | | | |
Total | | | | | | | 12,177,190 | |
TOTAL INDUSTRIALS | | | | | | | 356,956,389 | |
INFORMATION TECHNOLOGY 19.3% | | | | | |
Communications Equipment 1.5% | | | | | | | | |
Arris Group, Inc.(a) | | | 541,368 | | | | 6,166,181 | |
Bel Fuse, Inc., Class B | | | 46,666 | | | | 815,722 | |
Black Box Corp. | | | 81,214 | | | | 2,186,281 | |
Comtech Telecommunications Corp. | | | 93,500 | | | | 3,017,245 | |
Digi International, Inc.(a) | | | 117,744 | | | | 1,323,443 | |
Harmonic, Inc.(a) | | | 532,785 | | | | 3,138,104 | |
Netgear, Inc.(a) | | | 172,481 | | | | 6,480,111 | |
Oplink Communications, Inc.(a) | | | 87,940 | | | | 1,443,095 | |
PC-Tel, Inc. | | | 83,715 | | | | 615,305 | |
Symmetricom, Inc.(a) | | | 195,390 | | | | 1,146,939 | |
Viasat, Inc.(a) | | | 193,958 | | | | 8,947,283 | |
| | | | | | | | |
Total | | | | | | | 35,279,709 | |
Computers & Peripherals 0.7% | | | | | | | | |
Avid Technology, Inc.(a) | | | 134,759 | | | | 1,435,183 | |
Intermec, Inc.(a) | | | 235,339 | | | | 1,760,336 | |
Intevac, Inc.(a) | | | 105,991 | | | | 837,329 | |
Novatel Wireless, Inc.(a) | | | 147,237 | | | | 505,023 | |
Stratasys, Inc.(a) | | | 97,366 | | | | 3,586,963 | |
Super Micro Computer, Inc.(a) | | | 126,390 | | | | 2,090,491 | |
Synaptics, Inc.(a) | | | 147,870 | | | | 5,434,222 | |
| | | | | | | | |
Total | | | | | | | 15,649,547 | |
Electronic Equipment, Instruments & Components 4.5% | | | | | |
Agilysys, Inc.(a) | | | 69,616 | | | | 560,409 | |
Anixter International, Inc.(a) | | | 127,109 | | | | 8,839,160 | |
Badger Meter, Inc.(b) | | | 69,411 | | | | 2,232,952 | |
Benchmark Electronics, Inc.(a) | | | 265,271 | | | | 4,355,750 | |
Brightpoint, Inc.(a) | | | 313,191 | | | | 2,756,081 | |
Checkpoint Systems, Inc.(a) | | | 184,402 | | | | 2,046,862 | |
Cognex Corp. | | | 193,238 | | | | 8,239,668 | |
CTS Corp. | | | 157,624 | | | | 1,568,359 | |
Daktronics, Inc. | | | 169,134 | | | | 1,522,206 | |
DTS, Inc.(a) | | | 76,681 | | | | 2,153,202 | |
The Accompanying Notes to Financial Statements are an integral part of this statement.
10
Columbia Small Cap Index Fund
February 29, 2012
| | | | | | | | |
| Issuer | | Shares | | | Value | |
Common Stocks (continued) | |
INFORMATION TECHNOLOGY (cont.) | | | | | | | | |
Electronic Equipment, Instruments & Components (cont.) | | | | | |
Electro Scientific Industries, Inc. | | | 111,136 | | | | $1,538,122 | |
FARO Technologies, Inc.(a) | | | 76,330 | | | | 4,233,262 | |
FEI Co.(a) | | | 172,526 | | | | 7,680,857 | |
Insight Enterprises, Inc.(a) | | | 201,504 | | | | 4,211,434 | |
Littelfuse, Inc. | | | 98,995 | | | | 5,239,805 | |
Measurement Specialties, Inc.(a) | | | 68,980 | | | | 2,243,230 | |
Mercury Computer Systems, Inc.(a) | | | 140,548 | | | | 2,019,675 | |
Methode Electronics, Inc.(b) | | | 170,006 | | | | 1,555,555 | |
MTS Systems Corp. | | | 72,023 | | | | 3,537,049 | |
Newport Corp.(a) | | | 172,611 | | | | 2,886,056 | |
OSI Systems, Inc.(a) | | | 90,235 | | | | 5,323,865 | |
Park Electrochemical Corp. | | | 95,316 | | | | 2,716,506 | |
Plexus Corp.(a) | | | 158,984 | | | | 5,516,745 | |
Pulse Electronics Corp. | | | 189,535 | | | | 583,768 | |
Radisys Corp.(a) | | | 104,445 | | | | 782,293 | |
Rofin-Sinar Technologies, Inc.(a) | | | 130,870 | | | | 3,070,210 | |
Rogers Corp.(a) | | | 74,335 | | | | 2,757,085 | |
Scansource, Inc.(a) | | | 124,843 | | | | 4,619,191 | |
SYNNEX Corp.(a) | | | 118,088 | | | | 4,868,768 | |
TTM Technologies, Inc.(a) | | | 235,294 | | | | 2,755,293 | |
| | | | | | | | |
Total | | | | | | | 102,413,418 | |
Internet Software & Services 1.7% | | | | | | | | |
comScore, Inc.(a) | | | 151,694 | | | | 3,335,751 | |
DealerTrack Holdings, Inc.(a) | | | 190,536 | | | | 5,306,428 | |
Digital River, Inc.(a) | | | 171,450 | | | | 3,026,093 | |
InfoSpace, Inc.(a) | | | 181,053 | | | | 2,102,025 | |
j2 Global, Inc.(b) | | | 217,850 | | | | 6,441,824 | |
Liquidity Services, Inc.(a) | | | 106,630 | | | | 4,611,747 | |
LivePerson, Inc.(a) | | | 217,675 | | | | 3,282,539 | |
LogMeIn, Inc.(a) | | | 97,140 | | | | 3,580,580 | |
Perficient, Inc.(a) | | | 140,557 | | | | 1,697,929 | |
Stamps.com, Inc.(a) | | | 57,890 | | | | 1,496,457 | |
United Online, Inc. | | | 409,452 | | | | 2,071,827 | |
XO Group, Inc.(a) | | | 131,560 | | | | 1,189,302 | |
| | | | | | | | |
Total | | | | | | | 38,142,502 | |
IT Services 2.1% | | | | | | | | |
CACI International, Inc., Class A(a) | | | 121,334 | | | | 7,175,693 | |
Cardtronics, Inc.(a) | | | 201,420 | | | | 5,355,758 | |
Ciber, Inc.(a) | | | 331,880 | | | | 1,453,634 | |
CSG Systems International, Inc.(a) | | | 155,662 | | | | 2,492,149 | |
Forrester Research, Inc.(a) | | | 67,661 | | | | 2,180,714 | |
Heartland Payment Systems, Inc. | | | 181,210 | | | | 5,131,867 | |
Higher One Holdings, Inc.(a)(b) | | | 142,700 | | | | 2,097,690 | |
iGate Corp.(a) | | | 137,800 | | | | 2,401,854 | |
MAXIMUS, Inc. | | | 154,241 | | | | 6,433,392 | |
NCI, Inc., Class A(a) | | | 36,197 | | | | 260,618 | |
TeleTech Holdings, Inc.(a) | | | 116,072 | | | | 1,772,420 | |
Virtusa Corp.(a) | | | 86,190 | | | | 1,347,150 | |
Wright Express Corp.(a) | | | 177,540 | | | | 10,986,175 | |
| | | | | | | | |
Total | | | | | | | 49,089,114 | |
Semiconductors & Semiconductor Equipment 4.9% | | | | | | | | |
Advanced Energy Industries, Inc.(a) | | | 203,775 | | | | 2,445,300 | |
ATMI, Inc.(a) | | | 145,503 | | | | 3,205,431 | |
Brooks Automation, Inc. | | | 297,021 | | | | 3,549,401 | |
Cabot Microelectronics Corp. | | | 103,633 | | | | 5,207,558 | |
Ceva, Inc.(a) | | | 108,055 | | | | 2,663,556 | |
| | | | | | | | |
| Issuer | | Shares | | | Value | |
Common Stocks (continued) | |
INFORMATION TECHNOLOGY (cont.) | | | | | | | | |
Semiconductors & Semiconductor Equipment (cont.) | | | | | |
Cirrus Logic, Inc.(a) | | | 293,560 | | | | $6,922,145 | |
Cohu, Inc. | | | 110,947 | | | | 1,244,825 | |
Cymer, Inc.(a) | | | 140,401 | | | | 6,455,638 | |
Diodes, Inc.(a) | | | 169,678 | | | | 4,214,802 | |
DSP Group, Inc.(a) | | | 105,734 | | | | 675,640 | |
Entropic Communications, Inc.(a)(b) | | | 398,560 | | | | 2,457,122 | |
Exar Corp.(a) | | | 205,798 | | | | 1,440,586 | |
GT Advanced Technologies, Inc.(a) | | | 549,930 | | | | 4,707,401 | |
Hittite Microwave Corp.(a) | | | 128,079 | | | | 7,323,557 | |
Kopin Corp.(a) | | | 311,578 | | | | 1,121,681 | |
Kulicke & Soffa Industries, Inc.(a) | | | 333,844 | | | | 3,759,083 | |
Micrel, Inc. | | | 228,679 | | | | 2,440,005 | |
Microsemi Corp.(a) | | | 395,872 | | | | 8,281,642 | |
MKS Instruments, Inc. | | | 240,808 | | | | 7,212,200 | |
Monolithic Power Systems, Inc.(a) | | | 136,185 | | | | 2,531,679 | |
Nanometrics, Inc.(a) | | | 78,360 | | | | 1,375,218 | |
Pericom Semiconductor Corp.(a) | | | 111,668 | | | | 858,727 | |
Power Integrations, Inc. | | | 128,800 | | | | 4,804,240 | |
Rubicon Technology, Inc.(a)(b) | | | 79,805 | | | | 715,851 | |
Rudolph Technologies, Inc.(a) | | | 146,328 | | | | 1,444,257 | |
Sigma Designs, Inc.(a) | | | 147,619 | | | | 848,809 | |
Standard Microsystems Corp.(a) | | | 104,747 | | | | 2,680,476 | |
STR Holdings, Inc.(a)(b) | | | 190,665 | | | | 1,353,721 | |
Supertex, Inc.(a) | | | 55,359 | | | | 1,021,927 | |
Tessera Technologies, Inc.(a) | | | 236,627 | | | | 3,975,334 | |
TriQuint Semiconductor, Inc.(a) | | | 763,347 | | | | 4,915,955 | |
Ultratech, Inc.(a) | | | 118,043 | | | | 3,211,950 | |
Veeco Instruments, Inc.(a)(b) | | | 177,788 | | | | 4,807,388 | |
Volterra Semiconductor Corp.(a) | | | 112,890 | | | | 3,469,110 | |
| | | | | | | | |
Total | | | | | | | 113,342,215 | |
Software 3.9% | | | | | | | | |
Blackbaud, Inc. | | | 198,958 | | | | 6,277,125 | |
Bottomline Technologies, Inc.(a) | | | 165,425 | | | | 4,648,443 | |
CommVault Systems, Inc.(a) | | | 199,874 | | | | 10,307,502 | |
Ebix, Inc.(b) | | | 143,523 | | | | 3,344,086 | |
EPIQ Systems, Inc. | | | 145,978 | | | | 1,677,287 | |
Interactive Intelligence Group, Inc.(a) | | | 65,687 | | | | 1,839,236 | |
JDA Software Group, Inc.(a) | | | 195,426 | | | | 4,897,376 | |
Manhattan Associates, Inc.(a) | | | 95,028 | | | | 4,405,498 | |
MicroStrategy, Inc., Class A(a) | | | 37,083 | | | | 5,028,084 | |
Monotype Imaging Holdings, Inc.(a) | | | 165,420 | | | | 2,320,843 | |
Netscout Systems, Inc.(a) | | | 158,232 | | | | 3,359,265 | |
Opnet Technologies, Inc. | | | 68,210 | | | | 1,947,396 | |
Progress Software Corp.(a) | | | 293,996 | | | | 6,817,767 | |
Sourcefire, Inc.(a) | | | 131,800 | | | | 5,933,636 | |
Synchronoss Technologies, Inc.(a) | | | 122,635 | | | | 4,103,367 | |
Take-Two Interactive Software, Inc.(a)(b) | | | 397,950 | | | | 6,148,327 | |
Taleo Corp., Class A(a) | | | 190,538 | | | | 8,730,451 | |
Tyler Technologies, Inc.(a) | | | 111,886 | | | | 4,225,934 | |
Websense, Inc.(a) | | | 178,260 | | | | 3,210,463 | |
| | | | | | | | |
Total | | | | | | | 89,222,086 | |
TOTAL INFORMATION TECHNOLOGY | | | | | | | 443,138,591 | |
MATERIALS 5.3% | | | | | | | | |
Chemicals 2.3% | | | | | | | | |
A. Schulman, Inc. | | | 134,944 | | | | 3,486,953 | |
American Vanguard Corp. | | | 106,779 | | | | 1,763,989 | |
The Accompanying Notes to Financial Statements are an integral part of this statement.
11
Columbia Small Cap Index Fund
February 29, 2012
| | | | | | | | |
| Issuer | | Shares | | | Value | |
Common Stocks (continued) | |
MATERIALS (cont.) | | | | | | | | |
Chemicals (cont.) | | | | | | | | |
Balchem Corp. | | | 133,065 | | | | $3,626,021 | |
Calgon Carbon Corp.(a) | | | 260,270 | | | | 3,932,680 | |
H.B. Fuller Co. | | | 224,816 | | | | 6,773,706 | |
Hawkins, Inc. | | | 41,015 | | | | 1,589,331 | |
Koppers Holdings, Inc. | | | 94,625 | | | | 3,560,739 | |
Kraton Performance Polymers, Inc.(a) | | | 147,385 | | | | 4,095,829 | |
LSB Industries, Inc.(a) | | | 84,935 | | | | 3,416,086 | |
OM Group, Inc.(a) | | | 148,447 | | | | 4,079,324 | |
PolyOne Corp. | | | 416,834 | | | | 5,598,081 | |
Quaker Chemical Corp. | | | 59,120 | | | | 2,436,335 | |
Stepan Co. | | | 38,061 | | | | 3,327,673 | |
Tredegar Corp. | | | 107,339 | | | | 2,494,558 | |
Zep, Inc. | | | 100,953 | | | | 1,531,457 | |
| | | | | | | | |
Total | | | | | | | 51,712,762 | |
Construction Materials 0.5% | | | | | | | | |
Eagle Materials, Inc. | | | 206,200 | | | | 6,470,556 | |
Headwaters, Inc.(a) | | | 279,850 | | | | 850,744 | |
Texas Industries, Inc.(b) | | | 128,058 | | | | 4,332,202 | |
| | | | | | | | |
Total | | | | | | | 11,653,502 | |
Containers & Packaging 0.1% | | | | | | | | |
Myers Industries, Inc. | | | 153,251 | | | | 2,041,303 | |
Metals & Mining 1.3% | | | | | | | | |
AK Steel Holding Corp.(b) | | | 506,390 | | | | 4,010,609 | |
AM Castle & Co.(a) | | | 76,173 | | | | 872,181 | |
AMCOL International Corp. | | | 114,889 | | | | 3,369,694 | |
Century Aluminum Co.(a) | | | 251,015 | | | | 2,462,457 | |
Haynes International, Inc. | | | 55,465 | | | | 3,510,380 | |
Kaiser Aluminum Corp. | | | 72,640 | | | | 3,511,417 | |
Materion Corp.(a) | | | 93,265 | | | | 2,737,328 | |
Olympic Steel, Inc. | | | 42,073 | | | | 986,191 | |
RTI International Metals, Inc.(a) | | | 138,615 | | | | 3,124,382 | |
Suncoke Energy, Inc.(a) | | | 321,460 | | | | 4,606,522 | |
| | | | | | | | |
Total | | | | 29,191,161 | |
Paper & Forest Products 1.1% | | | | | | | | |
Buckeye Technologies, Inc. | | | 180,663 | | | | 6,171,448 | |
Clearwater Paper Corp.(a) | | | 104,461 | | | | 3,584,057 | |
Deltic Timber Corp. | | | 49,711 | | | | 3,241,654 | |
KapStone Paper and Packaging Corp.(a) | | | 178,990 | | | | 3,597,699 | |
Neenah Paper, Inc. | | | 69,012 | | | | 1,924,745 | |
Schweitzer-Mauduit International, Inc. | | | 74,231 | | | | 5,199,882 | |
Wausau Paper Corp. | | | 225,812 | | | | 2,109,084 | |
| | | | | | | | |
Total | | | | 25,828,569 | |
TOTAL MATERIALS | | | | 120,427,297 | |
TELECOMMUNICATION SERVICES 0.6% | |
Diversified Telecommunication Services 0.5% | |
Atlantic Tele-Network, Inc. | | | 42,460 | | | | 1,627,067 | |
Cbeyond, Inc.(a) | | | 139,420 | | | | 1,070,746 | |
Cincinnati Bell, Inc.(a) | | | 899,070 | | | | 3,371,512 | |
General Communication, Inc., Class A(a) | | | 160,127 | | | | 1,695,745 | |
Lumos Networks Corp. | | | 67,840 | | | | 868,352 | |
Neutral Tandem, Inc.(a) | | | 144,418 | | | | 1,611,705 | |
| | | | | | | | |
Total | | | | 10,245,127 | |
| | | | | | | | |
| Issuer | | Shares | | | Value | |
Common Stocks (continued) | |
TELECOMMUNICATION SERVICES (cont.) | |
Wireless Telecommunication Services 0.1% | | | | | | | | |
NTELOS Holdings Corp. | | | 68,690 | | | | $1,597,043 | |
U.S.A. Mobility, Inc. | | | 101,528 | | | | 1,392,964 | |
| | | | | | | | |
Total | | | | 2,990,007 | |
TOTAL TELECOMMUNICATION SERVICES | | | | 13,235,134 | |
UTILITIES 4.1% | |
Electric Utilities 1.3% | |
Allete, Inc. | | | 148,765 | | | | 6,185,649 | |
Central Vermont Public Service Corp. | | | 61,669 | | | | 2,173,216 | |
El Paso Electric Co. | | | 184,821 | | | | 6,049,191 | |
UIL Holdings Corp. | | | 231,634 | | | | 8,165,098 | |
Unisource Energy Corp. | | | 169,556 | | | | 6,237,965 | |
| | | | | | | | |
Total | | | | 28,811,119 | |
Gas Utilities 2.0% | | | | | | | | |
Laclede Group, Inc. (The) | | | 102,953 | | | | 4,230,339 | |
New Jersey Resources Corp. | | | 190,356 | | | | 8,887,722 | |
Northwest Natural Gas Co.(b) | | | 122,613 | | | | 5,611,997 | |
Piedmont Natural Gas Co., Inc. | | | 331,421 | | | | 10,738,040 | |
South Jersey Industries, Inc. | | | 138,435 | | | | 7,198,620 | |
Southwest Gas Corp.(b) | | | 210,844 | | | | 8,992,497 | |
| | | | | | | | |
Total | | | | 45,659,215 | |
Multi-Utilities 0.7% | | | | | | | | |
Avista Corp. | | | 267,347 | | | | 6,603,471 | |
CH Energy Group, Inc. | | | 68,361 | | | | 4,557,628 | |
NorthWestern Corp. | | | 166,530 | | | | 5,783,587 | |
| | | | | | | | |
Total | | | | 16,944,686 | |
Water Utilities 0.1% | | | | | | | | |
American States Water Co. | | | 86,055 | | | | 3,171,987 | |
TOTAL UTILITIES | | | | 94,587,007 | |
Total Common Stocks | | | | | |
(Cost: $1,805,350,603) | | | | $2,270,135,509 | |
| |
Rights —% | |
INFORMATION TECHNOLOGY —% | |
Electronic Equipment, Instruments & Components —% | |
Gerber Scientific, Inc.(a)(c)(d)(e) | | | 112,391 | | | | $— | |
TOTAL INFORMATION TECHNOLOGY | | | | — | |
Total Rights | | | | | |
(Cost: $—) | | | | $— | |
| |
Money Market Funds 1.6% | |
Columbia Short-Term Cash Fund, 0.166%(f)(g) | | | 37,258,392 | | | | $37,258,392 | |
Total Money Market Funds | | | | | |
(Cost: $37,258,392) | | | | $37,258,392 | |
The Accompanying Notes to Financial Statements are an integral part of this statement.
12
Columbia Small Cap Index Fund
February 29, 2012
| | | | | | | | | | | | |
| Issuer | | Effective
Yield | | | Par/
Principal/
Shares | | | Value | |
Investments of Cash Collateral Received for Securities on Loan 3.1% | |
Asset-Backed Commercial Paper 0.1% | |
Rhein-Main Securitisation Ltd. | |
03/21/12 | | | 0.700 | % | | | $1,998,950 | | | | $1,998,950 | |
| | | | | | | | | | | | |
Total | | | | | | | | | | | 1,998,950 | |
Certificates of Deposit 0.2% | |
Australia and New Zealand Bank Group, Ltd. | |
03/09/12 | | | 0.500 | % | | | 2,000,000 | | | | 2,000,000 | |
Standard Chartered Bank PLC | |
03/05/12 | | | 0.630 | % | | | 1,000,000 | | | | 1,000,000 | |
04/03/12 | | | 0.570 | % | | | 2,000,000 | | | | 2,000,000 | |
| | | | | | | | | | | | |
Total | | | | | | | | | | | 5,000,000 | |
Commercial Paper 0.3% | |
Caisse d’Amortissement de la Dette Sociale | |
05/02/12 | | | 0.671 | % | | | 1,996,613 | | | | 1,996,613 | |
Foreningsparbanken (Swedbank) | |
03/21/12 | | | 0.425 | % | | | 2,998,087 | | | | 2,998,087 | |
State Development Bank of NorthRhine-Westphalia | |
03/13/12 | | | 0.240 | % | | | 1,999,613 | | | | 1,999,613 | |
| | | | | | | | | | | | |
Total | | | | | | | | | | | 6,994,313 | |
Other Short-Term Obligations 0.1% | |
Natixis Financial Products LLC | |
03/01/12 | | | 0.470 | % | | | 3,000,000 | | | | 3,000,000 | |
| | | | | | | | | | | | |
| Issuer | | Effective
Yield | | | Par/
Principal/
Shares | | | Value | |
Investments of Cash Collateral Received for Securities on Loan (continued) | |
Repurchase Agreements 2.4% | |
Citigroup Global Markets, Inc. dated 02/29/12, matures 03/01/12, repurchase price $5,000,018(h) | |
| | | 0.130 | % | | | $5,000,000 | | | | $5,000,000 | |
| | | 0.130 | % | | | 5,000,000 | | | | 5,000,000 | |
Credit Suisse Securities (USA) LLC dated 02/29/12, matures 03/01/12,
repurchase price $19,069,088(h) | |
| | | 0.160 | % | | | 19,069,004 | | | | 19,069,004 | |
Mizuho Securities USA, Inc. dated 02/29/12, matures 03/01/12,
repurchase price $15,000,092(h) | |
| | | 0.220 | % | | | 15,000,000 | | | | 15,000,000 | |
Natixis Financial Products, Inc. dated 02/29/12, matures 03/01/12,
repurchase price $5,000,031(h) | |
| | | 0.220 | % | | | 5,000,000 | | | | 5,000,000 | |
Pershing LLC dated 02/29/12, matures 03/01/12,
repurchase price $5,000,040(h) | |
| | | 0.290 | % | | | 5,000,000 | | | | 5,000,000 | |
| | | | | | | | | | | | |
Total | | | | | | | | | | | 54,069,004 | |
Total Investments of Cash Collateral Received for Securities on Loan | |
(Cost: $71,062,267) | | | | $71,062,267 | |
Total Investments | |
(Cost: $1,913,671,262) | | | | $2,378,456,168 | |
Other Assets & Liabilities, Net | | | | (80,174,125 | ) |
Net Assets | | | | $2,298,282,043 | |
Investment in Derivatives
Futures Contracts Outstanding at February 29, 2012
At February 29, 2012, $6,160,000 was held in a margin deposit account as collateral to cover initial margin requirements on open futures contracts.
| | | | | | | | | | | | | | | | | | | | |
| Contract Description | | Number of
Contracts
Long (Short) | | | Notional
Market Value | | | Expiration
Date | | | Unrealized
Appreciation | | | Unrealized
Depreciation | |
Russell 2000 Mini Index | | | 347 | | | | $28,034,130 | | | | March 2012 | | | | $2,298,727 | | | | $— | |
|
Notes to Portfolio of Investments |
| (b) | At February 29, 2012, security was partially or fully on loan. |
| (c) | Negligible market value. |
| (d) | Identifies issues considered to be illiquid as to their marketability. The aggregate value of such securities at February 29, 2012 was $0. Information concerning such security holdings at February 29, 2012 was as follows: |
| | | | | | | | |
| Security Description | | Acquisition
Dates | | | Cost | |
Gerber Scientific, Inc. | | | 08/22/11 | | | | $— | |
| (e) | Represents fair value as determined in good faith under procedures approved by the Board of Trustees. At February 29, 2012, the value of these securities amounted to $0, which represents 0.00% of the net assets. |
| (f) | The rate shown is the seven-day current annualized yield at February 29, 2012. |
The Accompanying Notes to Financial Statements are an integral part of this statement.
13
Columbia Small Cap Index Fund
February 29, 2012
|
Notes to Portfolio of Investments (continued) |
| (g) | Investments in affiliates during the year ended February 29, 2012: |
| | | | | | | | | | | | | | | | | | | | | | | | | | | | |
| Issuer | | Beginning
Cost | | | Purchase
Cost | | | Sales Cost/
Proceeds
from Sales | | | Realized
Gain/Loss | | | Ending
Cost | | | Dividends
or Interest
Income | | | Value | |
Columbia Short-Term Cash Fund | | | $— | | | | $330,726,286 | | | | $(293,467,894 | ) | | | $— | | | | $37,258,392 | | | | $41,752 | | | | $37,258,392 | |
| (h) | The table below represents securities received as collateral for repurchase agreements. This collateral is deposited with the Fund’s custodian and, pursuant to the terms of the repurchase agreement, must have an aggregate market value greater than or equal to the repurchase price plus accrued interest at all times. The value of securities and/or cash held as collateral for repurchase agreements is monitored on a daily basis to ensure the proper level of collateral. |
Citigroup Global Markets, Inc. (0.130%)
| | | | |
| Security Description | | Value | |
Fannie Mae REMICS | | | $2,392,734 | |
Fannie Mae-Aces | | | 264,929 | |
Freddie Mac REMICS | | | 1,919,413 | |
Government National Mortgage Association | | | 522,924 | |
Total Market Value of Collateral Securities | | | $5,100,000 | |
| |
| Citigroup Global Markets, Inc. (0.130%) | | | | |
| Security Description | | Value | |
Fannie Mae REMICS | | | $2,392,734 | |
Fannie Mae-Aces | | | 264,929 | |
Freddie Mac REMICS | | | 1,919,413 | |
Government National Mortgage Association | | | 522,924 | |
Total Market Value of Collateral Securities | | | $5,100,000 | |
| |
| Credit Suisse Securities (USA) LLC (0.160%) | | | | |
| Security Description | | Value | |
Ginnie Mae I Pool | | | $13,651,554 | |
Ginnie Mae II Pool | | | 5,798,874 | |
Total Market Value of Collateral Securities | | | $19,450,428 | |
| |
| Mizuho Securities USA, Inc. (0.220%) | | | | |
| Security Description | | Value | |
Fannie Mae Pool | | | $4,846,025 | |
Freddie Mac Gold Pool | | | 79,288 | |
Freddie Mac REMICS | | | 896,570 | |
Ginnie Mae I Pool | | | 6,003,995 | |
Ginnie Mae II Pool | | | 2,863,894 | |
Government National Mortgage Association | | | 610,228 | |
Total Market Value of Collateral Securities | | | $15,300,000 | |
| |
| Natixis Financial Products, Inc. (0.220%) | | | | |
| Security Description | | Value | |
Fannie Mae Pool | | | $251,534 | |
Fannie Mae REMICS | | | 1,873,339 | |
Freddie Mac Gold Pool | | | 230,300 | |
Freddie Mac REMICS | | | 1,104,611 | |
Government National Mortgage Association | | | 329,725 | |
United States Treasury Note/Bond | | | 1,310,522 | |
Total Market Value of Collateral Securities | | | $5,100,031 | |
The Accompanying Notes to Financial Statements are an integral part of this statement.
14
Columbia Small Cap Index Fund
February 29, 2012
|
Notes to Portfolio of Investments (continued) |
| | | | |
| Pershing LLC (0.290%) | | | | |
| Security Description | | Value | |
Fannie Mae Pool | | | $816,268 | |
Fannie Mae REMICS | | | 688,358 | |
Fannie Mae-Aces | | | 6,936 | |
Federal Farm Credit Bank | | | 61,684 | |
Federal Home Loan Banks | | | 66,346 | |
Federal Home Loan Mortgage Corp | | | 156,390 | |
Federal National Mortgage Association | | | 192,890 | |
Freddie Mac Gold Pool | | | 331,226 | |
Freddie Mac Non Gold Pool | | | 92,509 | |
Freddie Mac Reference REMIC | | | 22 | |
Freddie Mac REMICS | | | 641,140 | |
Ginnie Mae I Pool | | | 836,677 | |
Ginnie Mae II Pool | | | 745,953 | |
Government National Mortgage Association | | | 267,669 | |
United States Treasury Note/Bond | | | 184,593 | |
United States Treasury Strip Coupon | | | 11,339 | |
Total Market Value of Collateral Securities | | | $5,100,000 | |
Generally accepted accounting principles (GAAP) require disclosure regarding the inputs and valuation techniques used to measure fair value and any changes in valuation inputs or techniques. In addition, investments shall be disclosed by major category.
The Fund categorizes its fair value measurements according to a three-level hierarchy that maximizes the use of observable inputs and minimizes the use of unobservable inputs by prioritizing that the most observable input be used when available. Observable inputs are those that market participants would use in pricing an investment based on market data obtained from sources independent of the reporting entity. Unobservable inputs are those that reflect the Fund’s assumptions about the information market participants would use in pricing an investment. An investment’s level within the fair value hierarchy is based on the lowest level of any input that is deemed significant to the asset or liability’s fair value measurement. The input levels are not necessarily an indication of the risk or liquidity associated with investments at that level. For example, certain U.S. government securities are generally high quality and liquid, however, they are reflected as Level 2 because the inputs used to determine fair value may not always be quoted prices in an active market.
Fair value inputs are summarized in the three broad levels listed below:
| | Ÿ | | Level 1 – Valuations based on quoted prices for investments in active markets that the Fund has the ability to access at the measurement date (including NAV for open-end mutual funds). Valuation adjustments are not applied to Level 1 investments. |
| | Ÿ | | Level 2 – Valuations based on other significant observable inputs (including quoted prices for similar securities, interest rates, prepayment speeds, credit risks, etc.). |
| | Ÿ | | Level 3 – Valuations based on significant unobservable inputs (including the Fund’s own assumptions and judgment in determining the fair value of investments). |
Inputs that are used in determining fair value of an investment may include price information, credit data, volatility statistics, and other factors. These inputs can be either observable or unobservable. The availability of observable inputs can vary between investments, and is affected by various factors such as the type of investment, and the volume and level of activity for that investment or similar investments in the marketplace. The inputs will be considered by the Investment Manager, along with any other relevant factors in the calculation of an investment’s fair value. The Fund uses prices and inputs that are current as of the measurement date, which may include periods of market dislocations. During these periods, the availability of prices and inputs may be reduced for many investments. This condition could cause an investment to be reclassified between the various levels within the hierarchy.
Investments falling into the Level 3 category are primarily supported by quoted prices from brokers and dealers participating in the market for those investments. However, these may be classified as Level 3 investments due to lack of market transparency and corroboration to support these quoted prices. Additionally, valuation models may be used as the pricing source for any remaining investments classified as Level 3. These models rely on one or more significant unobservable inputs and/or significant assumptions by the Investment Manager. Inputs used in valuations may include, but are not limited to, financial statement analysis, capital account balances, discount rates and estimated cash flows, and comparable company data.
The Accompanying Notes to Financial Statements are an integral part of this statement.
15
Columbia Small Cap Index Fund
February 29, 2012
|
Fair Value Measurements (continued) |
The following table is a summary of the inputs used to value the Fund’s investments as of February 29, 2012:
| | | | | | | | | | | | | | | | |
| | | Fair value at February 29, 2012 | |
| Description(a) | | Level 1
quoted prices
in active
markets for
identical assets | | | Level 2
other
significant
observable
inputs(b) | | | Level 3
significant
unobservable
inputs | | | Total | |
Equity Securities | | | | | | | | | | | | | | | | |
Common Stocks | | | | | | | | | | | | | | | | |
Consumer Discretionary | | | $351,753,595 | | | | $— | | | | $— | | | | $351,753,595 | |
Consumer Staples | | | 93,910,280 | | | | — | | | | — | | | | 93,910,280 | |
Energy | | | 105,420,469 | | | | — | | | | — | | | | 105,420,469 | |
Financials | | | 446,343,108 | | | | — | | | | — | | | | 446,343,108 | |
Health Care | | | 244,363,639 | | | | — | | | | — | | | | 244,363,639 | |
Industrials | | | 356,956,389 | | | | — | | | | — | | | | 356,956,389 | |
Information Technology | | | 443,138,591 | | | | — | | | | — | | | | 443,138,591 | |
Materials | | | 120,427,297 | | | | — | | | | — | | | | 120,427,297 | |
Telecommunication Services | | | 13,235,134 | | | | — | | | | — | | | | 13,235,134 | |
Utilities | | | 94,587,007 | | | | — | | | | — | | | | 94,587,007 | |
Total Equity Securities | | | 2,270,135,509 | | | | — | | | | — | | | | 2,270,135,509 | |
Other | | | | | | | | | | | | | | | | |
Money Market Funds | | | 37,258,392 | | | | — | | | | — | | | | 37,258,392 | |
Investments of Cash Collateral Received for Securities on Loan | | | — | | | | 71,062,267 | | | | — | | | | 71,062,267 | |
Total Other | | | 37,258,392 | | | | 71,062,267 | | | | — | | | | 108,320,659 | |
Investments in Securities | | | 2,307,393,901 | | | | 71,062,267 | | | | — | | | | 2,378,456,168 | |
Derivatives(c) | | | | | | | | | | | | | | | | |
Assets | | | | | | | | | | | | | | | | |
Futures Contracts | | | 2,298,727 | | | | — | | | | — | | | | 2,298,727 | |
Total | | | $2,309,692,628 | | | | $71,062,267 | | | | $— | | | | $2,380,754,895 | |
The Fund’s assets assigned to the Level 2 input category are generally valued using the market approach, in which a security’s value is determined through reference to prices and information from market transactions for similar or identical assets.
| (a) | See the Portfolio of Investments for all investment classifications not indicated in the table. |
| (b) | There were no significant transfers between Levels 1 and 2 during the period. |
| (c) | Derivative instruments are valued at unrealized appreciation (depreciation). |
The Accompanying Notes to Financial Statements are an integral part of this statement.
16
Statement of Assets and Liabilities – Columbia Small Cap Index Fund
February 29, 2012
| | | | |
| Assets | | | | |
Investments, at value* | | | | |
Unaffiliated issuers (identified cost $1,805,350,603) | | $ | 2,270,135,509 | |
Affiliated issuers (identified cost $37,258,392) | | | 37,258,392 | |
Investment of cash collateral received for securities on loan | | | | |
Short-term securities (identified cost $16,993,263) | | | 16,993,263 | |
Repurchase agreements (identified cost $54,069,004) | | | 54,069,004 | |
Total investments (identified cost $1,913,671,262) | | | 2,378,456,168 | |
Margin deposits on futures contracts | | | 6,160,000 | |
Receivable for: | | | | |
Investments sold | | | 415,423 | |
Capital shares sold | | | 3,525,147 | |
Dividends | | | 1,669,603 | |
Interest | | | 93,556 | |
Expense reimbursement due from Investment Manager | | | 728 | |
Total assets | | | 2,390,320,625 | |
| |
| Liabilities | | | | |
Due upon return of securities on loan | | | 71,062,267 | |
Payable for: | | | | |
Capital shares purchased | | | 19,970,972 | |
Variation margin on futures contracts | | | 901,600 | |
Investment management fees | | | 6,420 | |
Distribution fees | | | 4,442 | |
Administration fees | | | 6,420 | |
Plan administration fees | | | 2,059 | |
Other expenses | | | 84,402 | |
Total liabilities | | | 92,038,582 | |
Net assets applicable to outstanding capital stock | | $ | 2,298,282,043 | |
The Accompanying Notes to Financial Statements are an integral part of this statement.
17
Statement of Assets and Liabilities (continued) – Columbia Small Cap Index Fund
February 29, 2012
| | | | |
| Represented by | | | | |
Paid-in capital | | $ | 1,843,220,594 | |
Undistributed net investment income | | | 221,253 | |
Accumulated net realized loss | | | (12,243,437 | ) |
Unrealized appreciation (depreciation) on: | | | | |
Investments | | | 464,784,906 | |
Futures contracts | | | 2,298,727 | |
Total — representing net assets applicable to outstanding capital stock | | $ | 2,298,282,043 | |
*Value of securities on loan | | $ | 67,724,348 | |
Net assets applicable to outstanding shares | | | | |
Class A | | $ | 570,805,852 | |
Class B | | $ | 17,410,256 | |
Class I | | $ | 2,699 | |
Class R4 | | $ | 9,858,116 | |
Class Z | | $ | 1,700,205,120 | |
Shares outstanding | | | | |
Class A | | | 32,154,839 | |
Class B | | | 981,843 | |
Class I | | | 152 | |
Class R4 | | | 553,826 | |
Class Z | | | 95,477,768 | |
Net asset value per share | | | | |
Class A | | $ | 17.75 | |
Class B | | $ | 17.73 | |
Class I | | $ | 17.76 | |
Class R4 | | $ | 17.80 | |
Class Z | | $ | 17.81 | |
The Accompanying Notes to Financial Statements are an integral part of this statement.
18
Statement of Operations – Columbia Small Cap Index Fund
Year ended February 29, 2012
| | | | |
| Net investment income | | | | |
Income: | | | | |
Dividends | | $ | 23,175,800 | |
Interest | | | 1,303 | |
Dividends from affiliates | | | 41,752 | |
Income from securities lending – net | | | 886,548 | |
Total income | | | 24,105,403 | |
Expenses: | | | | |
Investment management fees | | | 2,072,518 | |
Distribution fees | | | | |
Class B | | | 104,604 | |
Service fees | | | | |
Class B | | | 34,868 | |
Distribution and service fees – Class A | | | 1,098,118 | |
Administration fees | | | 2,072,518 | |
Plan administration fees | | | | |
Class R4 | | | 16,539 | |
Compensation of board members | | | 36,773 | |
Other | | | 16,937 | |
Total expenses | | | 5,452,875 | |
Fees waived or expenses reimbursed by Investment Manager and its affiliates | | | (61,413 | ) |
Expense reductions | | | (6,267 | ) |
Total net expenses | | | 5,385,195 | |
Net investment income | | | 18,720,208 | |
| |
| Realized and unrealized gain (loss) – net | | | | |
Net realized gain (loss) on: | | | | |
Investments | | | 122,879,489 | |
Futures contracts | | | 1,134,941 | |
Net realized gain | | | 124,014,430 | |
Net change in unrealized appreciation (depreciation) on: | | | | |
Investments | | | (39,470,187 | ) |
Futures contracts | | | 1,587,699 | |
Net change in unrealized depreciation | | | (37,882,488 | ) |
Net realized and unrealized gain | | | 86,131,942 | |
Net increase in net assets resulting from operations | | $ | 104,852,150 | |
The Accompanying Notes to Financial Statements are an integral part of this statement.
19
Statement of Changes in Net Assets – Columbia Small Cap Index Fund
| | | | | | | | |
| | | Year ended
February 29, 2012(a)(b) | | | Year ended
February 28, 2011 | |
| | |
| Operations | | | | | | | | |
Net investment income | | $ | 18,720,208 | | | $ | 14,971,558 | |
Net realized gain | | | 124,014,430 | | | | 95,162,414 | |
Net change in unrealized appreciation (depreciation) | | | (37,882,488 | ) | | | 321,416,882 | |
Net increase in net assets resulting from operations | | | 104,852,150 | | | | 431,550,854 | |
| | |
| Distributions to shareholders from: | | | | | | | | |
Net investment income | | | | | | | | |
Class A | | | (3,701,970 | ) | | | (1,129,698 | ) |
Class B | | | (12,461 | ) | | | — | |
Class I | | | (24 | ) | | | — | |
Class R4 | | | (64,558 | ) | | | — | |
Class Z | | | (14,626,391 | ) | | | (14,228,716 | ) |
Net realized gains | | | | | | | | |
Class A | | | (19,220,754 | ) | | | (896,978 | ) |
Class B | | | (462,560 | ) | | | — | |
Class I | | | (70 | ) | | | — | |
Class R4 | | | (250,641 | ) | | | — | |
Class Z | | | (85,869,199 | ) | | | (8,701,851 | ) |
Total distributions to shareholders | | | (124,208,628 | ) | | | (24,957,243 | ) |
Increase (decrease) in net assets from share transactions | | | 452,887,679 | | | | 51,910,164 | |
Proceeds from regulatory settlements (Note 6) | | | 20,242 | | | | — | |
Total increase in net assets | | | 433,551,443 | | | | 458,503,775 | |
Net assets at beginning of year | | | 1,864,730,600 | | | | 1,406,226,825 | |
Net assets at end of year | | $ | 2,298,282,043 | | | $ | 1,864,730,600 | |
Undistributed (excess of distributions over) net investment income | | $ | 221,253 | | | $ | (6,315 | ) |
| (a) | Class B and Class R4 shares are for the period from March 7, 2011 (commencement of operations) to February 29, 2012. |
| (b) | Class I shares are for the period from November 16, 2011 (commencement of operations) to February 29, 2012. |
The Accompanying Notes to Financial Statements are an integral part of this statement.
20
Statement of Changes in Net Assets (continued) – Columbia Small Cap Index Fund
| | | | | | | | | | | | | | | | |
| | | Year ended
February 29, 2012(a)(b) | | | Year ended
February 28, 2011 | |
| | | Shares | | | Dollars ($) | | | Shares | | | Dollars ($) | |
| | | | |
| Capital stock activity | | | | | | | | | | | | | | | | |
Class A shares | | | | | | | | | | | | | | | | |
Subscriptions(c) | | | 7,323,046 | | | | 125,611,197 | | | | 6,068,664 | | | | 95,108,606 | |
Fund merger | | | 20,611,091 | | | | 361,216,966 | | | | — | | | | — | |
Distributions reinvested | | | 1,345,701 | | | | 22,192,742 | | | | 113,006 | | | | 1,927,875 | |
Redemptions | | | (7,319,115 | ) | | | (123,339,421 | ) | | | (2,874,865 | ) | | | (45,040,444 | ) |
Net increase | | | 21,960,723 | | | | 385,681,484 | | | | 3,306,805 | | | | 51,996,037 | |
Class B shares | | | | | | | | | | | | | | | | |
Subscriptions | | | 13,734 | | | | 228,153 | | | | — | | | | — | |
Fund merger | | | 1,666,330 | | | | 29,135,680 | | | | — | | | | — | |
Distributions reinvested | | | 29,110 | | | | 467,212 | | | | — | | | | — | |
Redemptions(c) | | | (727,331 | ) | | | (12,870,503 | ) | | | — | | | | — | |
Net increase | | | 981,843 | | | | 16,960,542 | | | | — | | | | — | |
Class I shares | | | | | | | | | | | | | | | | |
Subscriptions | | | 152 | | | | 2,500 | | | | — | | | | — | |
Net increase | | | 152 | | | | 2,500 | | | | — | | | | — | |
Class R4 shares | | | | | | | | | | | | | | | | |
Subscriptions | | | 109,033 | | | | 1,879,937 | | | | — | | | | — | |
Fund merger | | | 558,110 | | | | 9,804,641 | | | | — | | | | — | |
Distributions reinvested | | | 19,581 | | | | 315,054 | | | | — | | | | — | |
Redemptions | | | (132,898 | ) | | | (2,292,545 | ) | | | — | | | | — | |
Net increase | | | 553,826 | | | | 9,707,087 | | | | — | | | | — | |
Class Z shares | | | | | | | | | | | | | | | | |
Subscriptions | | | 16,655,344 | | | | 282,842,375 | | | | 14,971,394 | | | | 238,197,658 | |
Distributions reinvested | | | 4,048,483 | | | | 68,860,680 | | | | 873,176 | | | | 14,893,636 | |
Redemptions | | | (18,313,870 | ) | | | (311,166,989 | ) | | | (16,277,274 | ) | | | (253,177,167 | ) |
Net increase (decrease) | | | 2,389,957 | | | | 40,536,066 | | | | (432,704 | ) | | | (85,873 | ) |
Total net increase | | | 25,886,501 | | | | 452,887,679 | | | | 2,874,101 | | | | 51,910,164 | |
| (a) | Class B and Class R4 shares are for the period from March 7, 2011 (commencement of operations) to February 29, 2012. |
| (b) | Class I shares are for the period from November 16, 2011 (commencement of operations) to February 29, 2012. |
| (c) | Includes conversions of Class B shares to Class A shares, if any. |
The Accompanying Notes to Financial Statements are an integral part of this statement.
21
Financial Highlights – Columbia Small Cap Index Fund
The following tables are intended to help you understand the Fund’s financial performance. Certain information reflects financial results for a single share of a class held for the periods shown. Per share net investment income (loss) amounts are calculated based on average shares outstanding during the period. Total returns assume reinvestment of all dividends and distributions. Total returns do not reflect payment of sales charges, if any, and are not annualized for periods of less than one year.
| | | | | | | | | | | | | | | | | | | | |
| | | Year ended
Feb. 29,
2012 | | | Year ended Feb. 28, | | | Year ended
Feb. 29,
2008 | |
| | | | 2011 | | | 2010 | | | 2009 | | |
| Class A | | | | | | | | | | | | | | | |
| Per share data | | | | | | | | | | | | | | | | | | | | |
Net asset value, beginning of period | | | $18.01 | | | | $13.97 | | | | $8.58 | | | | $17.70 | | | | $22.19 | |
Income from investment operations: | | | | | | | | | | | | | | | | | | | | |
Net investment income | | | 0.12 | | | | 0.12 | | | | 0.08 | | | | 0.17 | | | | 0.18 | |
Net realized and unrealized gain (loss) | | | 0.66 | | | | 4.14 | | | | 5.40 | | | | (7.25 | ) | | | (2.05 | ) |
Total from investment operations | | | 0.78 | | | | 4.26 | | | | 5.48 | | | | (7.08 | ) | | | (1.87 | ) |
Less distributions to shareholders from: | | | | | | | | | | | | | | | | | | | | |
Net investment income | | | (0.12 | ) | | | (0.12 | ) | | | (0.09 | ) | | | (0.17 | ) | | | (0.17 | ) |
Net realized gains | | | (0.92 | ) | | | (0.10 | ) | | | — | | | | (1.87 | ) | | | (2.45 | ) |
Total distributions to shareholders | | | (1.04 | ) | | | (0.22 | ) | | | (0.09 | ) | | | (2.04 | ) | | | (2.62 | ) |
Proceeds from regulatory settlement | | | 0.00 | (a) | | | — | | | | 0.00 | (a) | | | — | | | | — | |
Net asset value, end of period | | | $17.75 | | | | $18.01 | | | | $13.97 | | | | $8.58 | | | | $17.70 | |
| Total return | | | 4.65% | | | | 30.55% | | | | 63.90% | | | | (42.43% | ) | | | (9.74% | ) |
| Ratios to average net assets(b) | | | | | | | | | | | | | | | | | | | | |
Expenses prior to fees waived or expenses reimbursed (including interest expense) | | | 0.45% | | | | 0.45% | | | | 0.45% | | | | 0.45% | (c) | | | 0.45% | (c) |
Net expenses after fees waived or expenses reimbursed (including interest expense)(d) | | | 0.45% | (e) | | | 0.45% | | | | 0.45% | | | | 0.45% | (c)(e) | | | 0.45% | (c)(e) |
Expenses prior to fees waived or expenses reimbursed (excluding interest expense) | | | 0.45% | | | | 0.45% | | | | 0.45% | | | | 0.45% | | | | 0.45% | |
Net expenses after fees waived or expenses reimbursed (excluding interest expense)(d) | | | 0.45% | (e) | | | 0.45% | | | | 0.45% | | | | 0.45% | (e) | | | 0.45% | (e) |
Net investment income | | | 0.74% | (e) | | | 0.73% | | | | 0.68% | | | | 1.15% | (e) | | | 0.81% | (e) |
| Supplemental data | | | | | | | | | | | | | | | | | | | | |
Net assets, end of period (in thousands) | | | $570,806 | | | | $183,578 | | | | $96,238 | | | | $33,273 | | | | $46,078 | |
Portfolio turnover | | | 20% | | | | 14% | | | | 14% | | | | 35% | | | | 24% | |
Notes to Financial Highlights
| (a) | Rounds to less than $0.01. |
| (b) | In addition to the fees and expenses which the Fund bears directly, the Fund indirectly bears a pro rata share of the fees and expenses of the acquired funds in which it invests. Such indirect expenses are not included in the reported expense ratios. |
| (c) | Includes interest expense which rounds to less than 0.01%. |
| (d) | The Investment Manager and certain of its affiliates agreed to waive/reimburse certain fees and expenses, if applicable. |
| (e) | The benefits derived from expense reductions had an impact of less than 0.01%. |
The Accompanying Notes to Financial Statements are an integral part of this statement.
22
Financial Highlights (continued) – Columbia Small Cap Index Fund
| | | | |
| | | Year ended
Feb. 29, 2012(a) | |
| Class B | | | |
| Per share data | | | | |
Net asset value, beginning of period | | | $17.82 | |
Income from investment operations: | | | | |
Net investment income | | | (0.00 | )(b) |
Net realized and unrealized gain | | | 0.84 | |
Total from investment operations | | | 0.84 | |
Less distributions to shareholders from: | | | | |
Net investment income | | | (0.01 | ) |
Net realized gains | | | (0.92 | ) |
Total distributions to shareholders | | | (0.93 | ) |
Proceeds from regulatory settlement | | | 0.00 | (b) |
Net asset value, end of period | | | $17.73 | |
| Total return | | | 4.97% | |
| Ratios to average net assets(c) | | | | |
Expenses prior to fees waived or expenses reimbursed | | | 1.20% | (d) |
Net expenses after fees waived or expenses reimbursed(e) | | | 1.20% | (d)(f) |
Net investment income | | | 0.01% | (d) |
| Supplemental data | | | | |
Net assets, end of period (in thousands) | | | $17,410 | |
Portfolio turnover | | | 20% | |
Notes to Financial Highlights
| (a) | For the period from March 7, 2011 (commencement of operations) to February 29, 2012. |
| (b) | Rounds to less than $0.01. |
| (c) | In addition to the fees and expenses which the Fund bears directly, the Fund indirectly bears a pro rata share of the fees and expenses of the acquired funds in which it invests. Such indirect expenses are not included in the reported expense ratios. |
| (e) | The Investment Manager and certain of its affiliates agreed to waive/reimburse certain fees and expenses, if applicable. |
| (f) | The benefits derived from expense reductions had an impact of less than 0.01%. |
The Accompanying Notes to Financial Statements are an integral part of this statement.
23
Financial Highlights (continued) – Columbia Small Cap Index Fund
| | | | |
| | | Year ended
Feb. 29, 2012(a) | |
| Class I | | | |
| Per share data | | | | |
Net asset value, beginning of period | | | $16.47 | |
Income from investment operations: | | | | |
Net investment income | | | 0.05 | |
Net realized and unrealized gain | | | 1.87 | |
Total from investment operations | | | 1.92 | |
Less distributions to shareholders from: | | | | |
Net investment income | | | (0.17 | ) |
Net realized gains | | | (0.46 | ) |
Total distributions to shareholders | | | (0.63 | ) |
Proceeds from regulatory settlement | | | 0.00 | (b) |
Net asset value, end of period | | | $17.76 | |
| Total return | | | 12.03% | |
| Ratios to average net assets(c) | | | | |
Expenses prior to fees waived or expenses reimbursed | | | 0.17% | (d) |
Net expenses after fees waived or expenses reimbursed(e) | | | 0.17% | (d) |
Net investment income | | | 1.09% | (d) |
| Supplemental data | | | | |
Net assets, end of period (in thousands) | | | $3 | |
Portfolio turnover | | | 20% | |
Notes to Financial Highlights
| (a) | For the period from November 16, 2011 (commencement of operations) to February 29, 2012. |
| (b) | Rounds to less than $0.01. |
| (c) | In addition to the fees and expenses which the Fund bears directly, the Fund indirectly bears a pro rata share of the fees and expenses of the acquired funds in which it invests. Such indirect expenses are not included in the reported expense ratios. |
| (e) | The Investment Manager and certain of its affiliates agreed to waive/reimburse certain fees and expenses, if applicable. |
The Accompanying Notes to Financial Statements are an integral part of this statement.
24
Financial Highlights (continued) – Columbia Small Cap Index Fund
| | | | |
| | | Year ended
Feb. 29, 2012(a) | |
| Class R4 | | | |
| Per share data | | | | |
Net asset value, beginning of period | | | $17.87 | |
Income from investment operations: | | | | |
Net investment income | | | 0.13 | |
Net realized and unrealized gain | | | 0.84 | |
Total from investment operations | | | 0.97 | |
Less distributions to shareholders from: | | | | |
Net investment income | | | (0.12 | ) |
Net realized gains | | | (0.92 | ) |
Total distributions to shareholders | | | (1.04 | ) |
Proceeds from regulatory settlement | | | 0.00 | (b) |
Net asset value, end of period | | | $17.80 | |
| Total return | | | 5.76% | |
| Ratios to average net assets(c) | | | | |
Expenses prior to fees waived or expenses reimbursed | | | 0.45% | (d) |
Net expenses after fees waived or expenses reimbursed(e) | | | 0.45% | (d) |
Net investment income | | | 0.76% | (d) |
| Supplemental data | | | | |
Net assets, end of period (in thousands) | | | $9,858 | |
Portfolio turnover | | | 20% | |
Notes to Financial Highlights
| (a) | For the period from March 7, 2011 (commencement of operations) to February 29, 2012. |
| (b) | Rounds to less than $0.01. |
| (c) | In addition to the fees and expenses which the Fund bears directly, the Fund indirectly bears a pro rata share of the fees and expenses of the acquired funds in which it invests. Such indirect expenses are not included in the reported expense ratios. |
| (e) | The Investment Manager and certain of its affiliates agreed to waive/reimburse certain fees and expenses, if applicable. |
The Accompanying Notes to Financial Statements are an integral part of this statement.
25
Financial Highlights (continued) – Columbia Small Cap Index Fund
| | | | | | | | | | | | | | | | | | | | |
| | | Year ended
Feb. 29,
2012 | | | Year ended Feb. 28, | | | Year ended
Feb. 29,
2008 | |
| | | | 2011 | | | 2010 | | | 2009 | | |
| Class Z | | | | | | | | | | | | | | | |
| Per share data | | | | | | | | | | | | | | | | | | | | |
Net asset value, beginning of period | | | $18.06 | | | | $14.01 | | | | $8.60 | | | | $17.76 | | | | $22.27 | |
Income from investment operations: | | | | | | | | | | | | | | | | | | | | |
Net investment income | | | 0.16 | | | | 0.15 | | | | 0.12 | | | | 0.21 | | | | 0.23 | |
Net realized and unrealized gain (loss) | | | 0.66 | | | | 4.15 | | | | 5.40 | | | | (7.27 | ) | | | (2.05 | ) |
Total from investment operations | | | 0.82 | | | | 4.30 | | | | 5.52 | | | | (7.06 | ) | | | (1.82 | ) |
Less distributions to shareholders from: | | | | | | | | | | | | | | | | | | | | |
Net investment income | | | (0.15 | ) | | | (0.15 | ) | | | (0.11 | ) | | | (0.23 | ) | | | (0.24 | ) |
Net realized gains | | | (0.92 | ) | | | (0.10 | ) | | | — | | | | (1.87 | ) | | | (2.45 | ) |
Total distributions to shareholders | | | (1.07 | ) | | | (0.25 | ) | | | (0.11 | ) | | | (2.10 | ) | | | (2.69 | ) |
Proceeds from regulatory settlement | | | 0.00 | (a) | | | — | | | | 0.00 | (a) | | | — | | | | — | |
Net asset value, end of period | | | $17.81 | | | | $18.06 | | | | $14.01 | | | | $8.60 | | | | $17.76 | |
| Total return | | | 4.92% | | | | 30.81% | | | | 64.34% | | | | (42.28% | ) | | | (9.52% | ) |
| Ratios to average net assets(b) | | | | | | | | | | | | | | | | | | | | |
Expenses prior to fees waived or expenses reimbursed (including interest expense) | | | 0.20% | | | | 0.20% | | | | 0.20% | | | | 0.20% | (c) | | | 0.20% | (c) |
Net expenses after fees waived or expenses reimbursed (including interest expense)(d) | | | 0.20% | (e) | | | 0.20% | | | | 0.20% | | | | 0.20% | (c)(e) | | | 0.20% | (c)(e) |
Expenses prior to fees waived or expenses reimbursed (excluding interest expense) | | | 0.20% | | | | 0.20% | | | | 0.20% | | | | 0.20% | | | | 0.20% | |
Net expenses after fees waived or expenses reimbursed (excluding interest expense)(d) | | | 0.20% | (e) | | | 0.20% | | | | 0.20% | | | | 0.20% | (e) | | | 0.20% | (e) |
Net investment income | | | 0.96% | (e) | | | 0.97% | | | | 0.95% | | | | 1.39% | (e) | | | 1.06% | (e) |
| Supplemental data | | | | | | | | | | | | | | | | | | | | |
Net assets, end of period (in thousands) | | | $1,700,205 | | | | $1,681,152 | | | | $1,309,989 | | | | $660,059 | | | | $1,244,382 | |
Portfolio turnover | | | 20% | | | | 14% | | | | 14% | | | | 35% | | | | 24% | |
Notes to Financial Highlights
| (a) | Rounds to less than $0.01. |
| (b) | In addition to the fees and expenses which the Fund bears directly, the Fund indirectly bears a pro rata share of the fees and expenses of the acquired funds in which it invests. Such indirect expenses are not included in the reported expense ratios. |
| (c) | Includes interest expense which rounds to less than 0.01%. |
| (d) | The Investment Manager and certain of its affiliates agreed to waive/reimburse certain fees and expenses, if applicable. |
| (e) | The benefits derived from expense reductions had an impact of less than 0.01%. |
The Accompanying Notes to Financial Statements are an integral part of this statement.
26
Notes to Financial Statements – Columbia Small Cap Index Fund
February 29, 2012
Note 1. Organization
Columbia Small Cap Index Fund (the Fund), a series of Columbia Funds Series Trust (the Trust), is a diversified fund. The Trust is registered under the Investment Company Act of 1940, as amended (the 1940 Act), as an open-end management investment company organized as a Delaware statutory trust.
Fund Shares
The Trust may issue an unlimited number of shares (without par value). The Fund offers Class A, Class B, Class I, Class R4 and Class Z shares. All share classes have identical voting, dividend and liquidation rights. Each share class has its own expense structure and sales charges, as applicable.
Class A shares have no sales charge.
Class B shares may be subject to a maximum Contingent Deferred Sales Charge (CDSC) of 5.00% based upon the holding period after purchase. Class B shares will generally convert to Class A shares eight years after purchase. The Fund no longer accepts investments by new or existing investors in the Fund’s Class B shares, except in connection with the reinvestment of any dividend and/or capital gain distributions in Class B shares of the Fund and exchanges by existing Class B shareholders of certain other funds within the Columbia Family of Funds. Class B shares commenced operations on March 7, 2011.
Class I shares are not subject to sales charges and are only available to the Columbia Family of Funds. Class I shares commenced operations on November 16, 2011.
The Fund is authorized to issue Class R4 shares, which are not subject to sales charges; however, this share class is closed to new investors. Class R4 shares commenced operations on March 7, 2011.
Class Z shares are not subject to sales charges, and are only available to certain investors, as described in the Fund’s prospectus.
Note 2. Summary of Significant Accounting Policies
Use of Estimates
The preparation of financial statements in accordance with U.S. generally accepted accounting principles (GAAP) requires management to make certain estimates and assumptions that affect the reported amounts of assets and liabilities, the disclosure of contingent assets and liabilities at the date of the financial statements and the reported amounts of revenue and expenses during the reporting period. Actual results could differ from those estimates.
The following is a summary of significant accounting policies consistently followed by the Fund in the preparation of its financial statements.
Security Valuation
All equity securities are valued at the close of business of the New York Stock Exchange (NYSE). Equity securities are valued at the last quoted sales price on the principal exchange or market on which they trade, except for securities traded on the NASDAQ Stock Market, which are valued at the NASDAQ official close price. Unlisted securities or listed securities for which there were no sales during the day are valued at the mean of the latest quoted bid and asked prices on such exchanges or markets.
Foreign securities are valued based on quotations from the principal market in which such securities are normally traded. If any foreign share prices are not readily available as a result of limited share activity the securities are valued at the mean of the latest quoted bid and asked prices on such exchanges or markets. Foreign currency exchange rates are generally determined at 4:00 p.m. Eastern (U.S.) time. However, many securities markets and exchanges outside the U.S. close prior to the close of the NYSE; therefore, the closing prices for securities in such markets or on such exchanges may not fully reflect events that occur after such close but before the close of the NYSE. In those situations, foreign securities will be fair valued pursuant to the policy adopted by the Board of Trustees (the Board), including utilizing a third party pricing service to determine these fair values. The third party pricing service takes into account multiple factors, including, but not limited to, movements in the U.S. securities markets, certain depositary receipts, futures contracts and foreign exchange rates that have occurred subsequent to the close of the foreign exchange, to determine a good faith estimate that reasonably reflects the current market conditions as of the close of the NYSE. The fair value of a security is likely to be different from the quoted or published price, if available.
Investments in other open-end investment companies, including money market funds, are valued at net asset value.
Short-term securities purchased within 60 days to maturity are valued at amortized cost, which approximates market value. The value of short-term securities originally purchased with maturities greater than 60 days is determined based on an amortized value to par upon reaching 60 days to maturity. Short-term securities maturing in more than 60 days from the valuation date are valued at the market price or approximate market value based on current interest rates.
27
Columbia Small Cap Index Fund
February 29, 2012
Futures and options on futures contracts are valued based upon the settlement price established each day by the board of trade or exchange on which they are traded.
Investments for which market quotations are not readily available, or that have quotations which management believes are not reliable, are valued at fair value as determined in good faith under consistently applied procedures established by and under the general supervision of the Board. If a security or class of securities (such as foreign securities) is valued at fair value, such value is likely to be different from the last quoted market price for the security. The determination of fair value often requires significant judgment. To determine fair value, management may use assumptions including but not limited to future cash flows and estimated risk premiums. Multiple inputs from various sources may be used to determine value.
Derivative Instruments
The Fund invests in certain derivative instruments as detailed below to meet its investment objectives. Derivatives are instruments whose values depend on, or are derived from, in whole or in part, the value of one or more other assets, such as securities, currencies, commodities or indices. Derivative instruments may be used to maintain cash reserves while maintaining exposure to certain other assets, to offset anticipated declines in values of investments, to facilitate trading, to reduce transaction costs and to pursue higher investment returns. The Fund may also use derivative instruments to mitigate certain investment risks, such as foreign currency exchange rate risk, interest rate risk and credit risk. Derivatives may involve various risks, including the potential inability of the counterparty to fulfill its obligation under the terms of the contract, the potential for an illiquid secondary market and the potential for market movements which may expose the Fund to gains or losses in excess of the amount shown in the Statement of Assets and Liabilities.
The Fund and any counterparty are required to maintain an agreement that requires the Fund and that counterparty to monitor (on a daily basis) the net fair value of all derivatives entered into pursuant to the agreement between the Fund and such counterparty. If the net fair value of such derivatives between the Fund and that counterparty exceeds a certain threshold (as defined in the agreement), the Fund or the counterparty (as the case may be) is required to post cash and/or securities as collateral. Fair values of derivatives presented in the financial statements are not netted with the fair value of other derivatives or with any collateral amounts posted by the Fund or any counterparty.
Futures Contracts
Futures contracts represent commitments for the future purchase or sale of an asset at a specified price on a specified date. The Fund
bought and sold futures contracts to maintain appropriate equity market exposure while keeping sufficient cash to accommodate daily redemptions. Upon entering into futures contracts, the Fund bears risks which may include interest rates, exchange rates or securities prices moving unexpectedly, in which case, the Fund may not achieve the anticipated benefits of the futures contracts and may realize a loss. Additional risks include counterparty credit risk, the possibility of an illiquid market, and that a change in the value of the contract or option may not correlate with changes in the value of the underlying asset.
Upon entering into a futures contract, the Fund pledges cash or securities with the broker in an amount sufficient to meet the initial margin requirement. Subsequent payments (variation margin) are made or received by the Fund each day. The variation margin payments are equal to the daily change in the contract value and are recorded as variation margin receivable or payable and are offset in unrealized gains or losses. The Fund recognizes a realized gain or loss when the contract is closed or expires. Futures contracts involve, to varying degrees, risk of loss in excess of the variation margin disclosed in the Statement of Assets and Liabilities.
Effects of Derivative Transactions in the Financial Statements
The following tables are intended to provide additional information about the effect of derivatives on the financial statements of the Fund, including: the fair value of derivatives by risk category and the location of those fair values in the Statement of Assets and Liabilities; the impact of derivative transactions on the Fund’s operations over the period including realized gains or losses and unrealized gains or losses. The derivative schedules following the Portfolio of Investments present additional information regarding derivative instruments outstanding at the end of the period, if any.
| | | | | | | | |
Fair Values of Derivative Instruments at
February 29, 2012 |
| | | Asset derivatives | | Liability derivatives |
Risk
Exposure
Category | | Statement of
Assets and
Liabilities
Location | | Fair
Value | | Statement of
Assets and
Liabilities
Location | | Fair
Value |
Equity
contracts | | Net assets —
unrealized
appreciation
on futures
contracts | | $2,298,727* | | Net assets —
unrealized
depreciation
on futures
contracts | | $—* |
| * | Includes cumulative appreciation (depreciation) of futures contracts as reported in the Futures Contracts Outstanding table following the Portfolio of Investments. Only the current day’s variation margin is reported in receivables or payables in the Statement of Assets and Liabilities. |
28
Columbia Small Cap Index Fund
February 29, 2012
| | | | |
Effect of Derivative Instruments in the Statement of
Operations for the Year Ended February 29, 2012 | |
| | | Amount of Realized Gain (Loss) on
Derivatives Recognized in Income | |
Risk Exposure
Category | | Futures Contracts | |
| Equity contracts | | $ | 1,134,941 | |
| | | | |
| | | | |
| | | Change in Unrealized Appreciation
(Depreciation) on Derivatives
Recognized in Income | |
Risk Exposure
Category | | Futures Contracts | |
| Equity contracts | | $ | 1,587,699 | |
| | | | |
Volume of Derivative Instruments for the
Year Ended February 29, 2012 | |
| | | Contracts
Opened | |
| Futures Contracts | | | 5,733 | |
Repurchase Agreements
The Fund may engage in repurchase agreement transactions with institutions that management has determined are creditworthy. The Fund, through the custodian, receives delivery of the underlying securities collateralizing a repurchase agreement. Management is responsible for determining that the collateral is at least equal, at all times, to the value of the repurchase obligation including interest. A repurchase agreement transaction involves certain risks in the event of default or insolvency of the counterparty. These risks include possible delays in or restrictions on a Fund’s ability to dispose of the underlying securities and a possible decline in the value of the underlying securities during the period while the Fund seeks to assert its rights.
Security Transactions
Security transactions are accounted for on the trade date. Cost is determined and gains (losses) are based upon the specific identification method for both financial statement and federal income tax purposes.
Income Recognition
Corporate actions and dividend income are recorded net of any non-reclaimable tax withholdings, on the ex-dividend date or upon receipt of ex-dividend notification in the case of certain foreign securities.
Interest income is recorded on the accrual basis.
The Fund receives distributions from holdings in real estate investment trusts (REITs) which report information on the character of their distributions annually. REIT distributions are allocated to dividend income, capital gain and return of capital based on estimates made by the Fund’s management if actual information has not yet been reported. Return of capital is recorded as a reduction of the cost basis of securities held. Management’s estimates are subsequently adjusted when the actual character of the distributions is disclosed by the REITs which could result in a proportionate increase in return of capital to shareholders.
Awards from class action litigation are recorded as a reduction of cost basis if the Fund still owns the applicable securities on the payment date. If the Fund no longer owns the applicable securities the proceeds are recorded as realized gains.
Expenses
General expenses of the Trust are allocated to the Fund and other funds of the Trust based upon relative net assets or other expense allocation methodologies determined by the nature of the expense. Expenses directly attributable to the Fund are charged to the Fund. Expenses directly attributable to a specific class of shares are charged to that share class.
Determination of Class Net Asset Value
All income, expenses (other than class-specific expenses, which are charged to that share class, as shown in the Statement of Operations) and realized and unrealized gains (losses) are allocated to each class of the Fund on a daily basis, based on the relative net assets of each class, for purposes of determining the net asset value of each class.
Federal Income Tax Status
The Fund intends to qualify each year as a regulated investment company under Subchapter M of the Internal Revenue Code, as amended, and will distribute substantially all of its taxable income (including net short-term capital gains), if any, for its tax year, and as such will not be subject to federal income taxes. In addition, the Fund intends to distribute in each calendar year substantially all of its net investment income, capital gains and certain other amounts, if any, such that the Fund should not be subject to federal excise tax. Therefore, no federal income or excise tax provision is recorded.
Distributions to Shareholders
Distributions from net investment income, if any, are declared and paid semi-annually. Net realized capital gains, if any, are distributed
29
Columbia Small Cap Index Fund
February 29, 2012
along with the income dividend. Income distributions and capital gain distributions are determined in accordance with federal income tax regulations which may differ from GAAP.
Guarantees and Indemnifications
Under the Trust’s organizational documents and, in some cases, by contract, its officers and trustees are indemnified against certain liabilities arising out of the performance of their duties to the Trust or its funds. In addition, certain of the Fund’s contracts with its service providers contain general indemnification clauses. The Fund’s maximum exposure under these arrangements is unknown since the amount of any future claims that may be made against the Fund cannot be determined, and the Fund has no historical basis for predicting the likelihood of any such claims.
Recent Accounting Pronouncement
Fair Value Measurements and Disclosures
In May 2011, the Financial Accounting and Standards Board (FASB) issued ASU No. 2011-04 modifying Topic 820, Fair Value Measurements and Disclosures. At the same time, the International Accounting Standards Board (IASB) issued International Financial Reporting Standard 13, Fair Value Measurement. The objective of the FASB and IASB is convergence of their guidance on fair value measurements and disclosures.
Specifically, ASU No. 2011-04 requires reporting entities to disclose i) the amounts of any transfers between Level 1 and Level 2, and the reasons for the transfers, ii) for Level 3 fair value measurements, a) quantitative information about significant unobservable inputs used, b) a description of the valuation processes used by the reporting entity and c) a narrative description of the sensitivity of the fair value measurement to changes in unobservable inputs if a change in those inputs might result in a significantly higher or lower fair value measurement. The effective date of ASU No. 2011-04 is for interim and annual periods beginning after December 15, 2011. At this time, management is evaluating the implications of this guidance and the impact it will have on the financial statement amounts and footnote disclosures, if any.
Note 3. Fees and Compensation Paid to Affiliates
Investment Management Fees
Under an Investment Management Services Agreement, Columbia Management Investment Advisers, LLC (the Investment Manager), a wholly-owned subsidiary of Ameriprise Financial, Inc.
(Ameriprise Financial), determines which securities will be purchased, held or sold. The management fee is an annual fee that is equal to 0.10% of the Fund’s average daily net assets.
Administration Fees
Under an Administrative Services Agreement, the Investment Manager serves as the Fund Administrator. The Fund pays the Fund Administrator an annual fee for administration and accounting services equal to 0.10% of the Fund’s average daily net assets.
The Investment Manager, from the administration fee it receives from the Fund, pays all operating expenses of the Fund, with the exception of brokerage fees and commissions, interest, fees and expenses of Trustees who are not officers, directors or employees of the Investment Manager or its affiliates, distribution (Rule 12b-1) and/or shareholder servicing fees and any extraordinary non-recurring expenses that may arise, including litigation.
Pricing and Bookkeeping Fees
Prior to March 28, 2011, the Fund had entered into a Financial Reporting Services Agreement (the Financial Reporting Services Agreement) with State Street Bank and Trust Company (State Street) and the Investment Manager pursuant to which State Street provided financial reporting services to the Fund. The Fund also entered into an Accounting Services Agreement (collectively with the Financial Reporting Services Agreement, the State Street Agreements) with State Street and the Investment Manager pursuant to which State Street provided accounting services to the Fund. The pricing and bookkeeping fees for the Fund were paid by the Investment Manager. Effective March 28, 2011, these services are provided under the Administrative Services Agreement discussed above.
Other Fees
Effective June 1, 2011, other expenses are for, among other things, certain expenses of the Fund or the Board, including: Fund boardroom and office expense, employee compensation, employee health and retirement benefits, and certain other expenses. Payment of these Fund and Board expenses is facilitated by a company providing limited administrative services to the Fund and the Board. For the period June 1, 2011 through February 29, 2012, other expenses paid to this company were $6,950.
Compensation of Board Members
Board members are compensated for their services to the Fund as disclosed in the Statement of Operations. Under a Deferred
30
Columbia Small Cap Index Fund
February 29, 2012
Compensation Plan (the Plan), the Board members who are not “interested persons” of the Fund, as defined under the 1940 Act, may elect to defer payment of up to 100% of their compensation. Deferred amounts are treated as though equivalent dollar amounts had been invested in shares of certain funds managed by the Investment Manager. The Fund’s liability for these amounts is adjusted for market value changes and remains in the Fund until distributed in accordance with the Plan.
Compensation of Chief Compliance Officer
The Board has appointed a Chief Compliance Officer to the Fund in accordance with federal securities regulations. Effective April 1, 2011, the Fund’s expenses associated with the Chief Compliance Officer are paid directly by the Investment Manager. Prior to April 1, 2011, the Fund, along with other affiliated funds, paid its pro-rata share of the expenses for the Chief Compliance Officer. Such fees did not exceed $15,000 per year.
Transfer Agent Fees
Under a Transfer and Dividend Disbursing Agent Agreement, Columbia Management Investment Services Corp. (the Transfer Agent), an affiliate of the Investment Manager and a wholly-owned subsidiary of Ameriprise Financial, is responsible for providing transfer agency services to the Fund. The Transfer Agent has contracted with Boston Financial Data Services (BFDS) to serve as sub-transfer agent.
The Transfer Agent pays the fees of BFDS for services as sub-transfer agent and is not entitled to reimbursement for such fees from the Fund. The transfer agent fees for the Fund are payable by the Investment Manager. The Transfer Agent also receives compensation from fees for various shareholder services and reimbursements for certain out-of-pocket expenses.
An annual minimum account balance fee of $20 may apply to certain accounts with a value below the Fund’s initial minimum investment requirements to reduce the impact of small accounts on transfer agent fees. These minimum account balance fees are recorded as part of expense reductions in the Statement of Operations. For the year ended February 29, 2012, these minimum account balance fees reduced total expenses by $6,267.
Plan Administration Fees
Under a Plan Administration Services Agreement with the Transfer Agent, the Fund pays an annual fee at a rate of 0.25% of the Fund’s average daily net assets attributable to Class R4 shares for the provision of various administrative, recordkeeping, communication and educational services.
Distribution and Service Fees
The Fund has an agreement with Columbia Management Investment Distributors, Inc. (the Distributor), an affiliate of the Investment Manager and a wholly-owned subsidiary of Ameriprise Financial, for distribution and shareholder services. Pursuant to Rule 12b-1 under the 1940 Act, the Board has approved, and the Fund has adopted, distribution and shareholder service plans (the Plans) which set the distribution and service fees for the Fund. These fees are calculated daily and are intended to compensate the Distributor and/or eligible selling and/or servicing agents for selling shares of the Fund and providing services to investors.
The Plans require the payment of a monthly combined distribution and service fee to the Distributor at the maximum annual rate of 0.25% of the average daily net assets attributable to Class A shares of the Fund. The Plans also required the payment of a monthly service fee at the maximum annual rate of 0.25% of the average daily net assets attributable to Class B shares of the Fund and the payment of a monthly distribution fee at the maximum annual rate of 0.75% of the average daily net assets attributable to Class B shares of the Fund.
Sales Charges
Sales charges, including front-end charges and CDSCs, received by the Distributor for distributing Fund shares were $6,291 for Class B shares for the year ended February 29, 2012.
Expenses Waived/Reimbursed by the Investment Manager and its Affiliates
Effective April 30, 2011, the Investment Manager and certain of its affiliates have contractually agreed to waive fees and/or reimburse expenses (excluding certain fees and expenses described below), through June 30, 2012, unless sooner terminated at the sole discretion of the Board, so that the Fund’s net operating expenses, after giving effect to fees waived/expenses reimbursed and any balance credits and/or overdraft charges from the Fund’s custodian, do not exceed the following annual rates as a percentage of the class’ average daily net assets:
| | | | |
| | | | |
| Class A | | | 0.45 | % |
| Class B | | | 1.20 | |
| Class I | | | 0.20 | |
| Class R4 | | | 0.45 | |
| Class Z | | | 0.20 | |
Under the agreement, the following fees and expenses are excluded from the waiver/reimbursement commitment, and therefore will be
31
Columbia Small Cap Index Fund
February 29, 2012
paid by the Fund, if applicable: taxes (including foreign transaction taxes), expenses associated with investments in affiliated and non-affiliated pooled investment vehicles (including mutual funds and exchange traded funds), transaction costs and brokerage commissions, costs related to any securities lending program, dividend expenses associated with securities sold short, inverse floater program fees and expenses, transaction charges and interest on borrowed money, interest, extraordinary expenses and any other expenses the exclusion of which is specifically approved by the Board. This agreement may be modified or amended only with approval from all parties.
Prior to April 30, 2011, the Investment Manager voluntarily agreed to reimburse a portion of the Fund’s expenses (excluding certain expenses, such as distribution and services fees, brokerage commissions, interest, taxes and extraordinary expenses, but including custodian charges relating to overdrafts, if any) so that the Fund’s ordinary net operating expenses, after giving effect to fees waived/expenses reimbursed and any balance credits and/or overdraft charges from the Fund’s custodian, did not exceed 0.20% of the Fund’s average daily net assets on an annualized basis.
Prior to May 1, 2011, the Investment Manager was entitled to recover from the Fund any fees waived and/or expenses reimbursed for a three year period following the date of such fee waiver and/or reimbursement under these arrangements if such recovery did not cause the Fund’s expenses to exceed the expense limitations in effect at the time of recovery. Effective May 1, 2011, the Investment Manager has eliminated such fee recoupment provisions.
Note 4. Federal Tax Information
The timing and character of income and capital gain distributions are determined in accordance with income tax regulations, which may differ from GAAP because of temporary or permanent book to tax differences.
For the year ended February 29, 2012, these differences are primarily due to differing treatment for deferred trustees expense, deferral/reversal of wash sales, recognition of unrealized appreciation (depreciation) of certain derivative instruments, capital loss carryforwards and distributions. To the extent these differences are permanent, reclassifications are made among the components of the Fund’s net assets in the Statement of Assets and Liabilities. Temporary differences do not require reclassifications. In the Statement of Assets and Liabilities the following reclassifications were made:
| | | | |
| | | | |
| Undistributed Net Investment Income | | $ | 79,959 | |
| Accumulated Net realized Loss | | | 48,263 | |
| Paid-In Capital | | | (128,222 | ) |
Net investment income and net realized gains (losses), as disclosed in the Statement of Operations, and net assets were not affected by this reclassification.
The tax character of distributions paid during the years indicated was as follows:
| | | | | | | | |
| | | Year ended
February 29,
2012 | | | Year ended
February 28,
2011 | |
| Ordinary income | | | $22,262,162 | | | | $15,358,414 | |
| Long-term capital gains | | | 101,946,466 | | | | 9,598,829 | |
Short-term capital gain distributions, if any, are considered ordinary income distributions for tax purposes.
At February 29, 2012, the components of distributable earnings on a tax basis were as follows:
| | | | |
| | | | |
| Undistributed ordinary income | | $ | 301,418 | |
| Undistributed long-term capital gains | | | 53,802,014 | |
| Unrealized appreciation | | | 401,048,627 | |
At February 29, 2012, the cost of investments for federal income tax purposes was $1,977,407,541 and the aggregate gross unrealized appreciation and depreciation based on that cost was:
| | | | |
| | | | |
| Unrealized appreciation | | $ | 575,012,470 | |
| Unrealized depreciation | | $ | (173,963,843 | ) |
| | | | |
| Net unrealized appreciation | | $ | 401,048,627 | |
On December 22, 2010, the Regulated Investment Company Modernization Act of 2010 (the Act) was enacted, which changed various technical rules governing the tax treatment of regulated investment companies. The changes are generally effective for taxable years beginning after the date of enactment. Under the Act, the Fund will be permitted to carry forward capital losses incurred in taxable years beginning after the date of enactment for an unlimited period. However, any losses incurred during those future taxable years will be required to be utilized prior to the losses incurred in pre-enactment taxable years, which carry an expiration date. As a result of this ordering rule, pre-enactment capital loss carryforwards may be more likely to expire unused.
32
Columbia Small Cap Index Fund
February 29, 2012
Columbia Small Cap Index Fund acquired capital loss carryforwards in connection with the merger with RiverSource Small Company Index Fund of 10,841,431 (Note 12). In addition to the acquired capital loss carryforwards, the Fund also acquired unrealized capital gains as a result of the merger. These acquired capital loss carryforwards were utilized in full during the current fiscal year.
Management of the Fund has concluded that there are no significant uncertain tax positions that would require recognition in the financial statements. However, management’s conclusion may be subject to review and adjustment at a later date based on factors including, but not limited to, new tax laws, regulations, and administrative interpretations (including relevant court decisions). Generally, the Fund’s federal tax returns for the prior three fiscal years remain subject to examination by the Internal Revenue Service.
Note 5. Portfolio Information
The cost of purchases and proceeds from sales of securities, excluding short-term obligations, aggregated to $407,592,877 and $433,679,970, respectively, for the year ended February 29, 2012.
Note 6. Regulatory Settlements
During the February 29, 2012, the Fund received $20,242 as a result of a settlement of an administrative proceeding brought by the Securities and Exchange Commission against an unaffiliated third party relating to market timing and/or late trading of mutual funds which represented the Fund’s portion of the proceeds from the settlement (the Fund was not a party to the proceeding). The proceeds received by the Fund were recorded as an increase to additional paid-in capital.
Note 7. Lending of Portfolio Securities
Effective March 28, 2011, the Fund has entered into a Master Securities Lending Agreement (the Agreement) with JPMorgan Chase Bank, N.A. (JPMorgan). The Agreement, which replaces the previous security lending arrangement with State Street, authorizes JPMorgan as lending agent to lend securities to authorized borrowers in order to generate additional income on behalf of the Fund. Pursuant to the Agreement, the securities loaned are secured by cash or U.S. government securities equal to at least 100% of the market value of the loaned securities. Any additional collateral required to maintain those levels due to market fluctuations of the loaned securities is requested to be delivered the following business day. Cash collateral received is invested by the lending agent on behalf of the Fund into authorized investments pursuant to the
Agreement. The investments made with the cash collateral are listed in the Portfolio of Investments. The values of such investments and any uninvested cash collateral are disclosed in the Statement of Assets and Liabilities along with the related obligation to return the collateral upon the return of the securities loaned.
At February 29, 2012, securities valued at $67,724,348 were on loan, secured by cash collateral of $71,062,267 (which does not reflect calls for collateral made to borrowers by JPMorgan at period end) that is partially or fully invested in short-term securities or other cash equivalents.
Risks of delay in recovery of securities or even loss of rights in the securities may occur should the borrower of the securities fail financially. Risks may also arise to the extent that the value of the securities loaned increases above the value of the collateral received. JPMorgan will indemnify the Fund from losses resulting from a borrower’s failure to return a loaned security when due. Such indemnification does not extend to losses associated with declines in the value of cash collateral investments. The Investment Manager is not responsible for any losses incurred by the Fund in connection with the securities lending program. Loans are subject to termination by the Fund or the borrower at any time, and are, therefore, not considered to be illiquid investments.
Pursuant to the Agreement, the Fund receives income for lending its securities either in the form of fees or by earning interest on invested cash collateral, net of negotiated rebates paid to borrowers and fees paid to the lending agent for services provided and any other securities lending expenses. Net income earned from securities lending for the year ended February 29, 2012 is disclosed in the Statement of Operations. The Fund continues to earn and accrue interest and dividends on the securities loaned.
Prior to March 28, 2011, the Fund participated in a securities lending arrangement with State Street. Each security on loan was collateralized in an amount at least equal to the market value of the securities loaned plus accrued income from the investment of collateral. The income generated by the investment of the collateral, net of any fees remitted to State Street as the lending agent and borrower rebates, was paid to the Fund.
Note 8. Custody Credits
Prior to March 28, 2011, the Fund had an agreement with its custodian bank under which custody fees may have been reduced by balance credits. These credits are recorded as part of expense reductions on the Statement of Operations. The Fund could have
33
Columbia Small Cap Index Fund
February 29, 2012
invested a portion of the assets utilized in connection with the expense offset arrangement in an income-producing asset if they had not entered into such an agreement. Subsequent to this date, the Fund may invest its daily balance in an affiliated money market fund as detailed below. For the period March 1, 2011 through March 27, 2011, there were no custody credits.
Note 9. Affiliated Money Market Fund
Effective March 28, 2011, the Fund may invest its daily cash balances in Columbia Short-Term Cash Fund, an affiliated money market fund established for the exclusive use by the Fund and other affiliated funds. The income earned by the Fund from such investments is included as “Dividends from affiliates” in the Statement of Operations. As an investing fund, the Fund indirectly bears its proportionate share of the expenses of Columbia Short-Term Cash Fund.
Note 10. Shareholder Concentration
At February 29, 2012, two unaffiliated shareholder accounts owned an aggregate of 44.4% of the outstanding shares of the Fund. The Fund has no knowledge about whether any portion of those shares was owned beneficially by such accounts. Subscription and redemption activity by concentrated accounts may have a significant effect on the operations of the Fund.
Note 11. Line of Credit
The Fund has entered into a revolving credit facility with a syndicate of banks led by JPMorgan Chase Bank, N.A. (the Administrative Agent), whereby the Fund may borrow for the temporary funding of shareholder redemptions or for other temporary or emergency purposes. The credit facility became effective on March 28, 2011, replacing a prior credit facility. The credit facility agreement, as amended, which is a collective agreement between the Fund and certain other funds managed by the Investment Manager, severally and not jointly, permits collective borrowings up to $500 million. Pursuant to a December 13, 2011 amendment to the credit facility agreement, interest is charged to each participating fund based on its borrowings at a rate equal to the higher of (i) the overnight federal funds rate plus 1.00% or (i) the one-month LIBOR rate plus 1.00%. Each borrowing under the credit facility matures no later than 60 days after the date of borrowing. The Fund also pays a commitment fee equal to its pro rata share of the amount of the credit facility at a rate of 0.08% per annum. For the period March 28, 2011 through December 13, 2011, interest was charged to each participating fund based on its borrowings at a rate equal to the sum of the federal
funds rate plus (i) 1.25% per annum plus (ii) if one-month LIBOR exceeds the federal funds rate, the amount of such excess. The Fund also paid a commitment fee equal to its pro rata share of the amount of the credit facility at a rate of 0.10% per annum.
Prior to March 28, 2011, the Fund and certain other funds managed by the Investment Manager participated in a $280 million committed, unsecured revolving credit facility provided by State Street. Interest was charged to each fund based on its borrowings at a rate equal to the greater of the (i) federal funds rate plus 1.25% per annum or (ii) the overnight LIBOR rate plus 1.25% per annum. The Fund also paid a commitment fee equal to its pro rata share of the amount of the credit facility at a rate of 0.125% per annum.
The Fund had no borrowings during the year ended February 29, 2012.
Note 12. Fund Merger
At the close of business on June 3, 2011, the Fund acquired the assets and assumed the identified liabilities of RiverSource Small Company Index Fund. The reorganization was completed after shareholders approved the plan on February 15, 2011. The purpose of the transaction was to combine two funds managed by the Investment Manager with comparable investment objectives and strategies.
The aggregate net assets of the Fund immediately before the acquisition were $1,858,175,305 and the combined net assets immediately after the acquisition were $2,258,332,592.
The merger was accomplished by a tax-free exchange of 77,975,673 shares of RiverSource Small Company Index Fund valued at $400,157,287 (including $76,110,521 of unrealized appreciation).
In exchange for the RiverSource Small Company Index Fund shares, the Fund issued the following number of shares:
| | | | |
| | | | |
| | | Shares | |
| Class A | | | 20,611,091 | |
| Class B | | | 1,666,330 | |
| Class R4 | | | 558,110 | |
For financial reporting purposes, net assets received and shares issued by the Fund were recorded at fair value; however, RiverSource Small Company Index Fund’s cost of investments was carried forward.
34
Columbia Small Cap Index Fund
February 29, 2012
The financial statements reflect the operations of the Fund for the period prior to the merger and the combined Fund for the period subsequent to the merger. Because the combined investment portfolios have been managed as a single integrated portfolio since the merger was completed, it is not practicable to separate the amounts of revenue and earnings of RiverSource Small Company Index Fund that have been included in the combined Fund’s Statement of Operations since the merger was completed.
Assuming the merger had been completed on March 1, 2011 the Fund’s pro-forma net investment income, net realized gain, net change in unrealized depreciation and net increase in net assets resulting from operations for the year ended February 29, 2012 would have been approximately $19.4 million, $134.7 million, $(48.4) million and $105.7 million, respectively.
Note 13. Subsequent Events
Management has evaluated the events and transactions that have occurred through the date the financial statements were issued and noted no items requiring adjustment of the financial statements or additional disclosure.
Note 14. Information Regarding Pending and Settled Legal Proceedings
In June 2004, an action captioned John E. Gallus et al. v. American Express Financial Corp. and American Express Financial Advisors Inc. was filed in the United States District Court for the District of Arizona. The plaintiffs allege that they are investors in several American Express Company mutual funds (currently branded as Columbia) and they purport to bring the action derivatively on behalf of those funds under the Investment Company Act of 1940. The plaintiffs allege that fees allegedly paid to the defendants by the funds for investment advisory and administrative services are excessive. The plaintiffs seek remedies including restitution and rescission of investment advisory and distribution agreements. The plaintiffs voluntarily agreed to transfer this case to the United States District Court for the District of Minnesota (the District Court). In response to defendants’ motion to dismiss the complaint, the District Court dismissed one of plaintiffs’ four claims and granted plaintiffs limited discovery. Defendants moved for summary judgment in April 2007. Summary judgment was granted in the defendants’ favor on July 9, 2007. The plaintiffs filed a notice of appeal with the Eighth Circuit Court of Appeals (the Eighth Circuit) on August 8, 2007. On April 8, 2009, the Eighth Circuit reversed summary judgment and remanded to the District Court for further proceedings. On August 6, 2009, defendants filed a writ of certiorari with the U.S.
Supreme Court (the Supreme Court), asking the Supreme Court to stay the District Court proceedings while the Supreme Court considered and rules in a case captioned Jones v. Harris Associates, which involved issues of law similar to those presented in the Gallus case. On March 30, 2010, the Supreme Court issued its ruling in Jones v. Harris Associates, and on April 5, 2010, the Supreme Court vacated the Eighth Circuit’s decision in the Gallus case and remanded the case to the Eighth Circuit for further consideration in light of the Supreme Court’s decision in Jones v. Harris Associates. On June 4, 2010, the Eighth Circuit remanded the Gallus case to the District Court for further consideration in light of the Supreme Court’s decision in Jones v. Harris Associates. On December 9, 2010, the District Court reinstated its July 9, 2007 summary judgment order in favor of the defendants. On January 10, 2011, plaintiffs filed a notice of appeal with the Eighth Circuit. In response to the plaintiffs’ opening appellate brief filed on March 18, 2011, the defendants filed a response brief on May 4, 2011 with the Eighth Circuit. The plaintiffs filed a reply brief on May 26, 2011 and oral arguments took place on November 17, 2011. On March 30, 2012, the Eighth Circuit upheld the grant of summary judgment by the District Court in favor of the defendants.
In December 2005, without admitting or denying the allegations, American Express Financial Corporation (AEFC, which is now known as Ameriprise Financial, Inc. (Ameriprise Financial)) entered into settlement agreements with the Securities and Exchange Commission (SEC) and Minnesota Department of Commerce (MDOC) related to market timing activities. As a result, AEFC was censured and ordered to cease and desist from committing or causing any violations of certain provisions of the Investment Advisers Act of 1940, the Investment Company Act of 1940, and various Minnesota laws. AEFC agreed to pay disgorgement of $10 million and civil money penalties of $7 million. AEFC also agreed to retain an independent distribution consultant to assist in developing a plan for distribution of all disgorgement and civil penalties ordered by the SEC in accordance with various undertakings detailed at www.sec.gov/litigation/admin/ia-2451.pdf. Ameriprise Financial and its affiliates have cooperated with the SEC and the MDOC in these legal proceedings, and have made regular reports to the funds’ Boards of Trustees.
Ameriprise Financial and certain of its affiliates have historically been involved in a number of legal, arbitration and regulatory proceedings, including routine litigation, class actions, and governmental actions, concerning matters arising in connection with the conduct of their business activities. Ameriprise Financial believes that the Funds are not currently the subject of, and that
35
Columbia Small Cap Index Fund
February 29, 2012
neither Ameriprise Financial nor any of its affiliates are the subject of, any pending legal, arbitration or regulatory proceedings that are likely to have a material adverse effect on the Funds or the ability of Ameriprise Financial or its affiliates to perform under their contracts with the Funds. Ameriprise Financial is required to make 10-Q, 10-K and, as necessary, 8-K filings with the Securities and Exchange Commission on legal and regulatory matters that relate to Ameriprise Financial and its affiliates. Copies of these filings may be obtained by accessing the SEC website at www.sec.gov.
There can be no assurance that these matters, or the adverse publicity associated with them, will not result in increased fund
redemptions, reduced sale of fund shares or other adverse consequences to the Funds. Further, although we believe proceedings are not likely to have a material adverse effect on the Funds or the ability of Ameriprise Financial or its affiliates to perform under their contracts with the Funds, these proceedings are subject to uncertainties and, as such, we are unable to estimate the possible loss or range of loss that may result. An adverse outcome in one or more of these proceedings could result in adverse judgments, settlements, fines, penalties or other relief that could have a material adverse effect on the consolidated financial condition or results of operations of Ameriprise Financial.
36
Report of Independent Registered Public Accounting Firm
To the Trustees of Columbia Funds Series Trust and the Shareholders of Columbia Small Cap Index Fund
In our opinion, the accompanying statement of assets and liabilities, including the investment portfolio, and the related statements of operations and of changes in net assets and the financial highlights present fairly, in all material respects, the financial position of Columbia Small Cap Index Fund (the “Fund”) (a series of Columbia Funds Series Trust ) at February 29, 2012, the results of its operations for the year then ended, the changes in its net assets for each of the two years in the period then ended and the financial highlights for the periods indicated, in conformity with accounting principles generally accepted in the United States of America. These financial statements and financial highlights (hereafter referred to as “financial statements”) are the responsibility of the Fund’s management. Our responsibility is to express an opinion on these financial statements based on our audits. We conducted our audits of these financial statements in accordance with the standards of the Public Company Accounting Oversight Board (United States). Those standards require that we plan and perform the audit to obtain reasonable assurance about whether the financial statements are free of material misstatement. An audit includes examining, on a test basis, evidence supporting the amounts and disclosures in the financial statements, assessing the accounting principles used and significant estimates made by management, and evaluating the overall financial statement presentation. We believe that our audits, which included confirmation of securities at February 29, 2012 by correspondence with the custodian, transfer agent and brokers, provide a reasonable basis for our opinion.
PricewaterhouseCoopers LLP
Minneapolis, Minnesota
April 20, 2012
37
Federal Income Tax Information (Unaudited) – Columbia Small Cap Index Fund
The Fund hereby designates as a capital gain dividend with respect to the fiscal year ended February 29, 2012, $118,677,989, or, if subsequently determined to be different, the net capital gain of such year.
80.87% of the ordinary income distributed by the Fund for the fiscal year ended February 29, 2012, qualifies for the corporate dividends received deduction.
For non-corporate shareholders 80.99%, or the maximum amount allowable under the Jobs and Growth Tax Relief Reconciliation Act of 2003, of ordinary income distributed by the Fund for the fiscal year ended February 29, 2012 may represent qualified dividend income.
The Fund will notify shareholders in January 2013 of amounts for use in preparing 2012 income tax returns.
38
Fund Governance
Shareholders elect the Board that oversees the funds’ operations. The Board appoints officers who are responsible for day-to-day business decisions based on policies set by the Board. The following table provides basic biographical information about the funds’ Board members, including their principal occupations during the past five years, although specific titles for individuals may have varied over the period. Under current Board policy, members may serve until the next Board meeting after he or she reaches the mandatory retirement age established by the Board, or the fifteenth anniversary of the first Board meeting they attended as a member of the Board.
On September 29, 2009, Ameriprise Financial, the parent company of Columbia Management, entered into an agreement with Bank of America, N.A. (“Bank of America”) to acquire a portion of the asset management business of Columbia Management Group, LLC and certain of its affiliated companies (the “Transaction”). Following the Transaction, which became effective on May 1, 2010, various alignment activities have occurred with respect to the Fund Family. In connection with the Transaction, Mr. Edward J. Boudreau, Jr., Mr. William P. Carmichael, Mr. William A. Hawkins, Mr. R. Glenn Hilliard, Mr. John J. Nagorniak, Ms. Minor M. Shaw and Dr. Anthony M. Santomero, who were members prior to the Transaction of the Legacy Columbia Nations funds’ Board (“Nations Funds”), which includes Columbia Funds Series Trust, Columbia Funds Variable Insurance Trust I and Columbia Funds Master Investment Trust, LLC., began service on the Board for the Legacy RiverSource funds (“RiverSource Funds”) effective June 1, 2011, which resulted in an overall increase from twelve Trustees to sixteen for all mutual funds overseen by the Board.
| | | | | | | | |
| Independent Board Members | | |
| Name, address, age | | Position
held with
funds and
length of
service | | Principal occupation
during past five years | | Number of
funds in
the Fund
Family
overseen
by Board
member | | Other present or past
directorships/trusteeships
(within past 5 years) |
Kathleen Blatz 901 S. Marquette Ave. Minneapolis, MN 55402 Age 57 | | Board member since 1/06 for RiverSource Funds and since 6/11 for Nations Funds | | Attorney; Chief Justice, Minnesota Supreme Court, 1998-2006 | | 153 | | None |
Edward J. Boudreau, Jr. 225 Franklin Street Mail Drop BX32 05228 Boston, MA 02110 Age 67 | | Board member since 6/11 for RiverSource Funds and since 1/05 for Nations Funds | | Managing Director, E.J. Boudreau & Associates (consulting) since 2000 | | 146 | | Former Trustee, BofA Funds Series Trust (11 funds) |
Pamela G. Carlton 901 S. Marquette Ave. Minneapolis, MN 55402 Age 57 | | Board member since 7/07 for RiverSource Funds and since 6/11 for Nations Funds | | President, Springboard-Partners in Cross Cultural Leadership (consulting company) | | 153 | | None |
39
Fund Governance (continued)
| | | | | | | | |
| Independent Board Members (continued) | | |
| Name, address, age | | Position
held with
funds and
length of
service | | Principal occupation
during past five years | | Number of
funds in
the Fund
Family
overseen
by Board
member | | Other present or past
directorships/trusteeships
(within past 5 years) |
William P. Carmichael 225 Franklin Street Mail Drop BX32 05228 Boston, MA 02110 Age 68 | | Board member since 6/11 for RiverSource Funds and since 1999 for Nations Funds | | Retired | | 146 | | Director, Cobra Electronics Corporation (electronic equipment manufacturer); The Finish Line (athletic shoes and apparel); McMoRan Exploration Company (oil and gas exploration and development); former Trustee, BofA Funds Series Trust (11 funds); former Director, Spectrum Brands, Inc. (consumer products); former Director, Simmons Company (bedding) |
Patricia M. Flynn 901 S. Marquette Ave. Minneapolis, MN 55402 Age 61 | | Board member since 11/04 for RiverSource Funds and since 6/11 for Nations Funds | | Trustee Professor of Economics and Management, Bentley University; former Dean, McCallum Graduate School of Business, Bentley University | | 153 | | None |
William A. Hawkins 225 Franklin Street Mail Drop BX32 05228 Boston, MA 02110 Age 69 | | Board member since 6/11 for RiverSource Funds and since 1/05 for Nations Funds | | Managing Director, Overton Partners (financial consulting), since August 2010; President and Chief Executive Officer, California General Bank, N.A., January 2008-August 2010 | | 146 | | Trustee, BofA Funds Series Trust (11 funds) |
R. Glenn Hilliard 225 Franklin Street Mail Drop BX32 05228 Boston, MA 02110 Age 69 | | Board member since 6/11 for RiverSource Funds and since 1/05 for Nations Funds | | Chairman and Chief Executive Officer, Hilliard Group LLC (investing and consulting), since April 2003; Non-Executive Director & Chairman, CNO Financial Group, Inc. (formerly Conseco, Inc.) (insurance), September 2003-May 2011 | | 146 | | Chairman, BofA Fund Series Trust (11 funds); former Director, CNO Financial Group, Inc. (insurance) |
Stephen R. Lewis, Jr. 901 S. Marquette Ave. Minneapolis, MN 55402 Age 73 | | Chair of the Board for RiverSource Funds since 1/07, Board member for RiverSource Funds since 1/02 and since 6/11 for Nations Funds | | President Emeritus and Professor of Economics Emeritus, Carleton College | | 153 | | Director, Valmont Industries, Inc. (manufactures irrigation systems) |
40
Fund Governance (continued)
| | | | | | | | |
| Independent Board Members (continued) | | |
| Name, address, age | | Position
held with
funds and
length of
service | | Principal occupation
during past five years | | Number of
funds in
the Fund
Family
overseen
by Board
member | | Other present or past
directorships/trusteeships
(within past 5 years) |
John F. Maher 901 S. Marquette Ave. Minneapolis, MN 55402 Age 68 | | Board member since 12/06 for Legacy Seligman funds, since 12/08 for RiverSource Funds and since 6/11 for Nations Funds | | Retired President and Chief Executive Officer and former Director, Great Western Financial Corporation (financial services), 1986-1997 | | 153 | | None |
John J. Nagorniak 225 Franklin Street Mail Drop BX32 05228 Boston, MA 02110 Age 67 | | Board member since 6/11 for RiverSource Funds and since 1/08 for Nations Funds | | Retired; President and Director, Foxstone Financial, Inc. (consulting), 2000-2007; Director, Mellon Financial Corporation affiliates (investing), 2000-2007; Chairman, Franklin Portfolio Associates (investing–Mellon affiliate), 1982-2007 | | 146 | | Trustee, Research Foundation of CFA Institute; Director, MIT Investment Company; Trustee, MIT 401k Plan; former Trustee, BofA Funds Series Trust (11 funds) |
Catherine James Paglia 901 S. Marquette Ave. Minneapolis, MN 55402 Age 59 | | Board member since 11/04 for RiverSource Funds and since 6/11 for Nations Funds | | Director, Enterprise Asset Management, Inc. (private real estate and asset management company) | | 153 | | None |
Leroy C. Richie 901 S. Marquette Ave. Minneapolis, MN 55402 Age 70 | | Board member since 2000 for Legacy Seligman funds, since 11/08 for RiverSource Funds and since 6/11 for Nations Funds | | Counsel, Lewis & Munday, P.C. since 2004; former Vice President and General Counsel, Automotive Legal Affairs, Chrysler Corporation | | 153 | | Director, Digital Ally, Inc. (digital imaging); Director, Infinity, Inc. (oil and gas exploration and production); Director, OGE Energy Corp. (energy and energy services) |
Minor M. Shaw 225 Franklin Street Mail Drop BX32 05228 Boston, MA 02110 Age 64 | | Board member since 6/11 for RiverSource Funds and since 2003 for Nations Funds | | President–Micco LLC (private investments) | | 146 | | Former Trustee, BofA Funds Series Trust (11 funds); Board Member, Piedmont Natural Gas; Director, Blue Cross Blue Shield of South Carolina |
Alison Taunton-Rigby 901 S. Marquette Ave. Minneapolis, MN 55402 Age 67 | | Board member since 11/02 for RiverSource Funds and since 6/11 for Nations Funds | | Chief Executive Officer and Director, RiboNovix, Inc. 2003-2010 (biotechnology); former President, Aquila Biopharmaceuticals | | 153 | | Director, Healthways, Inc. (health management programs); Director, ICI Mutual Insurance Company, RRG; Director, Abt Associates (government contractor) |
41
Fund Governance (continued)
| | | | | | | | |
| Interested Board Member Not Affiliated with Investment Manager* | | |
| Name, address, age | | Position
held with
funds and
length of
service | | Principal occupation
during past five years | | Number of
funds in
the Fund
Family
overseen
by Board
member | | Other present or past
directorships/trusteeships
(within past 5 years) |
Anthony M. Santomero** 225 Franklin Street Mail Drop BX32 05228 Boston, MA 02110 Age 65 | | Board member since 6/11 for RiverSource Funds and since 1/08 for Nations Funds | | Richard K. Mellon Professor Emeritus of Finance, The Wharton School, University of Pennsylvania, since 2002; Senior Advisor, McKinsey & Company (consulting), 2006-2008; President and Chief Executive Officer, Federal Reserve Bank of Philadelphia, 2000-2006 | | 146 | | Director, Renaissance Reinsurance Ltd.; Trustee, Penn Mutual Life Insurance Company; Director, Citigroup; Director, Citibank, N.A.; former Trustee, BofA Funds Series Trust (11 funds) |
| ** | Dr. Santomero is not an affiliated person of the Investment Manager or Ameriprise Financial. However, he is currently deemed by the funds to be an “interested person” (as defined in the 1940 Act) of the Funds because he serves as a Director of Citigroup, Inc. and Citibank N.A., companies that may directly or through subsidiaries and affiliates engage from time-to-time in brokerage execution, principal transactions and lending relationships with the funds or accounts advised/managed by the Investment Manager. |
| | | | | | | | |
| Interested Board Member Affiliated with Investment Manager* | | |
William F. Truscott 53600 Ameriprise Financial Center Minneapolis, MN 55474 Age 51 | | Board member since 11/01 for RiverSource Funds and since 6/11 for Nations Funds; Senior Vice President since 2002 for RiverSource Funds and 5/10 for Nations Funds | | Chairman of the Board and President, Columbia Management Investment Advisers, LLC since May 2010 and February 2012, respectively (previously President, Chairman of the Board and Chief Investment Officer, 2001-April 2010); Chief Executive Officer, U.S. Asset Management & President, Annuities, Ameriprise Financial, Inc. since May 2010 (previously President–U.S. Asset Management and Chief Investment Officer, 2005-April 2010); Director, President and Chief Executive Officer, Ameriprise Certificate Company since 2006; Director and Chief Executive Officer, Columbia Management Investment Distributors, Inc. since May 2010 (previously Chairman of the Board and Chief Executive Officer, 2006-April 2010); Chairman of the Board and Chief Executive Officer, RiverSource Distributors, Inc. since 2006. | | 153 | | None |
| * | Interested person (as defined under the 1940 Act) by reason of being an officer, director, security holder and/or employee of the Investment Manager or Ameriprise Financial. |
| | The SAI has additional information about the Fund’s Board members and is available, without charge, upon request by calling 800.345.6611 or contacting your financial intermediary. |
42
Fund Governance continued
Officers
| | |
| Name, Year of Birth and Address | | Principal Occupation(s) During Past Five Years |
| |
| J. Kevin Connaughton (Born 1964) | | |
225 Franklin Street Boston, MA 02110 President (since 2009) | | Senior Vice President and General Manager–Mutual Fund Products, Columbia Management Investment Advisers, LLC since May 2010; President, Columbia Funds, since 2009, and RiverSource Funds, since May 2010 (previously Senior Vice President and Chief Financial Officer, Columbia Funds, from June 2008 to January 2009, Treasurer, Columbia Funds, from October 2003 to May 2008, and senior officer of various other affiliated funds since 2000); Managing Director, Columbia Management Advisors, LLC from December 2004 to April 2010. |
| |
| Michael G. Clarke (Born 1969) | | |
225 Franklin Street Boston, MA 02110 Treasurer (since 2011) and Chief Financial Officer
(since 2009) | | Vice President, Columbia Management Investment Advisers, LLC since May 2010; Managing Director of Fund Administration, Columbia Management Advisors, LLC, from September 2004 to April 2010; senior officer of Columbia Funds and affiliated funds since 2002. |
| |
| Scott R. Plummer (Born 1959) | | |
5228 Ameriprise Financial Center Minneapolis, MN 55474 Senior Vice President, Secretary and Chief Legal Officer (since 2010) | | Chief Legal Officer and Assistant Secretary, Columbia Management Investment Advisers, LLC since June 2005; Vice President and Lead Chief Counsel–Asset Management, Ameriprise Financial, Inc. since May 2010 (previously Vice President and Chief Counsel–Asset Management, from 2005 to April 2010, Vice President and Chief Counsel–Asset Management, from 2005 to April 2010; Vice President, Chief Counsel and Assistant Secretary, Columbia Management Investment Distributors, Inc. since 2008; Vice President, General Counsel and Secretary, Ameriprise Certificate Company since 2005; Chief Counsel, RiverSource Distributors, Inc. since 2006; Senior officer of Columbia Funds and affiliated funds, since 2006. |
| |
| Thomas P. McGuire (Born 1972) | | |
225 Franklin Street Boston, MA 02110 Chief Compliance Officer (since 2012) | | Vice President–Asset Management Compliance, Columbia Management Investment Advisers, LLC since March 2010; Chief Compliance Officer, Ameriprise Certificate Company, since September 2010; Compliance Executive, Bank of America, from June 2005 to April 2010. |
| |
| William F. Truscott (Born 1960) | | |
53600 Ameriprise Financial Center Minneapolis, MN 55474 Senior Vice President (since 2010) | | Chairman of the Board and President, Columbia Management Investment Advisers, LLC since May 2010 and February 2012, respectively (previously President, Chairman of the Board and Chief Investment Officer, from 2001 to April 2010); Chief Executive Officer, U.S. Asset Management & President, Annuities, Ameriprise Financial, Inc. since May 2010 (previously President–U.S. Asset Management and Chief Investment Officer from 2005 to April 2010); Director, President and Chief Executive Officer, Ameriprise Certificate Company since 2006; Director and Chief Executive Officer, Columbia Management Investment Distributors, Inc. since May 2010 and February 2012, respectively (previously Chairman of the Board and Chief Executive Officer from 2008 to April 2010); Chairman of the Board and Chief Executive Officer, RiverSource Distributors, Inc. since 2006. |
| |
| Paul D. Pearson (Born 1956) | | |
10468 Ameriprise Financial Center Minneapolis, MN 55474 Vice President and Assistant Treasurer (since 2011) | | Vice President–Investment Accounting, Columbia Management Investment Advisers, LLC, since May 2010; Vice President–Managed Assets, Investment Accounting, Ameriprise Financial Corporation, 1998-2010. |
43
Fund Governance (continued)
Officers (continued)
| | |
| Name, Year of Birth and Address | | Principal Occupation(s) During Past Five Years |
| |
| Colin Moore (Born 1958) | | |
225 Franklin Street Boston, MA 02110 Senior Vice President (since 2010) | | Director and Chief Investment Officer, Columbia Management Investment Advisers, LLC since May 2010; Manager, Managing Director and Chief Investment Officer of Columbia Management Advisors, LLC from 2007 to April 2010; Head of Equities, Columbia Management Advisors, LLC from 2002 to 2007. |
| |
| Christopher O. Petersen (Born 1970) | | |
5228 Ameriprise Financial Center Minneapolis, MN 55474 Vice President and Secretary (since 2011) | | Vice President and Chief Counsel, Ameriprise Financial since January 2010 (formerly Vice President and Group Counsel or Counsel from April 2004 to January 2010); Senior officer of Columbia Funds and affiliated funds, since 2007. |
| |
| Amy K. Johnson (Born 1965) | | |
5228 Ameriprise Financial Center Minneapolis, MN 55474 Senior Vice President (since 2010) | | Senior Vice President and Chief Operating Officer, Columbia Management Investment Advisers, LLC since May 2010 (previously Chief Administrative Officer, from 2009 until April 2010, Vice President–Asset Management and Trust Company Services, from 2006 to 2009, and Vice President–Operations and Compliance from 2004 to 2006). |
| |
| Joseph F. DiMaria (Born 1968) | | |
225 Franklin Street Boston, MA 02110 Vice President (since 2011) and Chief Accounting Officer (since 2008) | | Vice President, Mutual Fund Administration, Columbia Management Investment Advisers, LLC, since May 2010; Director of Fund Administration, Columbia Management Advisors, LLC from January 2006 to April 2010. |
| |
| Paul B. Goucher (Born 1968) | | |
100 Park Avenue New York, NY 10017 Vice President and Assistant Secretary (since 2010) | | Vice President and Chief Counsel of Ameriprise Financial since January 2010 (formerly Vice President and Group Counsel from November 2008 to January 2010); Director, Managing Director and General Counsel of J. & W. Seligman & Co. Incorporated (Seligman) from July 2008 to November 2008 and Managing Director and Associate General Counsel of Seligman from January 2005 to July 2008. |
| |
| Michael E. DeFao (Born 1968) | | |
225 Franklin Street Boston, MA 02110 Vice President and Assistant Treasurer (since 2011) | | Vice President and Chief Counsel, Ameriprise Financial since May 2010; Associate General Counsel, Bank of America from June 2005 to April 2010 |
| |
| Stephen T. Welsh (Born 1957) | | |
225 Franklin Street Boston, MA 02110 Vice President (since 2006) | | President, Columbia Management Investment Services, Corp. since May 2010; President and Director, Columbia Management Services, Inc. from July 2004 to April 2010; Managing Director, Columbia Management Distributors, Inc. from August 2007 to April 2010. |
44
Important Information About This Report
The fund mails one shareholder report to each shareholder address. If you would like more than one report, please call shareholder services at 1-800-345-6611 and additional reports will be sent to you. This report has been prepared for shareholders of Columbia Small Cap Index Fund.
A description of the policies and procedures that the fund uses to determine how to vote proxies and a copy of the fund’s voting records are available (i) at www.columbiamanagement.com, (ii) on the Securities and Exchange Commission’s website at www.sec.gov, and (iii) without charge, upon request, by calling 1-800-368-0346. Information regarding how the fund voted proxies relating to portfolio securities during the 12-month period ended June 30 is available from the SEC’s website. Information regarding how the fund voted proxies relating to portfolio securities is also available from the fund’s website, www.columbiamanagement.com.
The fund files a complete schedule of portfolio holdings with the SEC for the first and third quarters of each fiscal year on Form N-Q. The fund’s Form N-Q is available on the SEC’s website at www.sec.gov and may be reviewed and copied at the SEC’s Public Reference Room in Washington, D.C. Information on the operation of the Public Reference Room may be obtained by calling
1-800-SEC-0330.
Transfer Agent
Columbia Management Investment Services Corp.
P.O. Box 8081
Boston, MA 02266-8081
1-800-345-6611
Distributor
Columbia Management Investment
Distributors, Inc.
225 Franklin Street Boston, MA 02110
Investment Manager
Columbia Management Investment Advisers, LLC
225 Franklin Street Boston, MA 02110
45

Columbia Small Cap Index Fund
P.O. Box 8081
Boston, MA 02266-8081
columbiamanagement.com
This information is for use with concurrent or prior delivery of a fund prospectus. Investors should consider the investment objectives, risks, charges and expenses of a mutual fund carefully before investing. For a free prospectus, which contains this and other important information about the funds, visit columbiamanagement.com. Read the prospectus carefully before investing. The Fund is distributed by Columbia Management Investment Distributors, Inc., member FINRA, and managed by Columbia Management Investment Advisers, LLC.
©2012 Columbia Management Investment Advisers, LLC. All rights reserved.
C-1696 C (4/12)

Columbia Mid Cap Index Fund
Annual Report for the Period Ended February 29, 2012
Table of contents
The views expressed in this report reflect the current views of the respective parties. These views are not guarantees of future performance and involve certain risks, uncertainties and assumptions that are difficult to predict, so actual outcomes and results may differ significantly from the views expressed. These views are subject to change at any time based upon economic, market or other conditions and the respective parties disclaim any responsibility to update such views. These views may not be relied on as investment advice and, because investment decisions for a Columbia Fund are based on numerous factors, may not be relied on as an indication of trading intent on behalf of any particular Columbia Fund. References to specific securities should not be construed as a recommendation or investment advice.
President’s Message

Dear Shareholders,
Americans were dispirited in the fourth quarter of 2011 by Washington’s inability to reach a plan for deficit reduction and Europe’s piecemeal attempt to address its own fiscal issues. Yet, there was sufficient good news to encourage risk taking, buoying both stocks and bonds to solid gains.
U.S. economic data surprised on the upside and fears of recession abated. With the bar of expectations set low, investors responded positively to the announcement that the economy had expanded by 1.8% in the third quarter. Consumer confidence improved, even though consumers remain under pressure with no real increase in disposable income and a continued decline in household net worth. Headline inflation — which tracks a broad range of consumer expenditures, including food and energy — declined. Even manufacturing held its ground.
Against this backdrop, the U.S. equity markets logged solid returns. The S&P 500 Index gained 11.82%, moving into positive territory
for the year with quarterly advances in all ten sectors. Mid- and small-cap stocks did even better. Value outperformed growth across all market capitalizations. Energy stocks led the market, as the price of oil moved above $100 a barrel in December. Industrials and materials stocks rose, buoyed by improving economic data. The U.S. fixed-income markets logged modest but solid returns. High-yield bonds were the best performers as the economy showed signs of improvement. Emerging market bonds were strong performers, as inflation came under control in key regions. Municipal bonds and Treasuries eked out only modest gains, as investors moved away from quality in favor of riskier assets.
While fourth quarter gains were encouraging, challenges still remain. Columbia Management, however, remains strong and steadfast. Columbia Management is the eighth largest manager of long-term mutual fund assets with $326 billion under management as of December 31, 2011. The past year has been one of considerable change for the organization as we worked diligently to align products, services and resources in the integration of Columbia Management with RiverSource Investments. The strong line-up of talent, resources and capabilities that has resulted is highlighted by the success of our products. As of December 31, 2011, Columbia Management offers 52 funds rated either 4 or 5 stars by Morningstar.*
For more information about these and other funds offered by Columbia Management, including detailed, up-to-date fund performance and portfolio information, please visit us online at columbiamanagement.com. Other information and resources available on our website include:
| n | | timely economic analysis and market commentary |
| n | | quarterly fund commentaries |
| n | | Columbia Management Investor, a quarterly newsletter for shareholders |
Thank you for your continued support of the Columbia Funds. We look forward to serving your investment needs for many years to come.
Best Regards,

J. Kevin Connaughton
President, Columbia Funds
| * | All ratings are based on Class Z shares as of 12/31/2011. Out of 119 Class Z share Columbia funds rated by Morningstar, 7 funds received a 5-star Overall Rating and 45 funds received a 4-star Overall Rating. The Overall Morningstar Rating for a retail mutual fund is derived from a weighted average of the performance figures associated with its 3-, 5- and 10-year (if applicable) Morningstar Rating metrics. For share classes that do not have a 3-, 5-, or 10-year actual performance history, the fund’s independent Morningstar Rating metric is then compared against the retail mutual fund universe breakpoints to determine its hypothetical rating. |
For each fund with at least a three-year history, Morningstar calculates a Morningstar RatingTM based on a Morningstar Risk-Adjusted Return measure that accounts for variation in a fund’s monthly performance (including the effects of sales charges/loads, and redemption fees), placing more emphasis on downward variations and rewarding consistent performance. The top 10% of funds in each category receive 5 stars, the next 22.5% receive 4 stars, the next 35% receive 3 stars, the next 22.5% receive 2 stars and the bottom 10% receive 1 star. (Each share class is counted as a fraction of one fund within this scale and rated separately, which may cause slight variations in the distribution percentages.)
The Morningstar RatingTM is for Class Z shares only; other classes may have different performance characteristics and may have different ratings. ©2012 Morningstar, Inc. All Rights Reserved. The Morningstar information contained herein: (1) is proprietary to Morningstar and/or its content providers; (2) may not be copied or distributed; and (3) is not warranted to be accurate, complete or timely. Neither Morningstar nor its content providers are responsible for any damages or losses arising from any use of this information.
Investors should consider the investment objectives, risks, charges and expenses of a mutual fund carefully before investing. For a free prospectus, which contains this and other important information about the funds, visit columbiamanagement.com. The prospectus should be read carefully before investing.
Columbia Funds are distributed by Columbia Management Investment Distributors, Inc., member FINRA, and managed by Columbia Management Investment Advisers, LLC.
© 2012 Columbia Management Investment Advisers, LLC. All rights reserved.
Fund Profile – Columbia Mid Cap Index Fund
Summary
| n | | For the 12-month period that ended February 29, 2012, the fund’s Class A shares returned 2.12% without sales charge. |
| n | | The fund’s benchmark, the S&P MidCap 400 Index1, returned 2.55%. |
| n | | The portfolio is constructed to closely approximate the performance of the benchmark. |
Portfolio Management
Alfred F. Alley III has managed or co-managed the fund since February 2009. From 2005 until joining Columbia Management Investment Advisers, LLC (the Investment Manager) in May 2010, Mr. Alley was associated with the fund’s previous investment adviser as an investment professional.
Vadim Shteyn has co-managed the fund since August 2011. From August 2006 until joining the Investment Manager in May 2010, Mr. Shteyn was associated with the fund’s previous investment adviser as an investment professional.
| 1 | The Standard & Poor’s (S&P) MidCap 400 Index is a market value-weighted index that tracks the performance of 400 mid-cap U.S. companies. |
Indices are not available for investment, are not professionally managed and do not reflect sales charges, fees, brokerage commissions, taxes or other expenses of investing. Securities in the fund may not match those in an index.
Performance data quoted represents past performance and current performance may be lower or higher. Past performance is no guarantee of future results. The investment return and principal value will fluctuate so that shares, when redeemed, may be worth more or less than the original cost. Please visit www.columbiamanagement.com for daily and most recent month-end performance updates.
Summary
1-year return as of 02/29/12
| | |
| |
 | | +2.12% Class A shares |
| |
| | +2.55% S&P MidCap 400 Index |
|
Morningstar Style Box™ |
|
Equity Style |
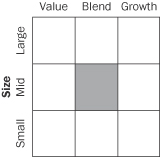
|
The Morningstar Style BoxTM is based on the fund’s portfolio holdings. For equity funds, the vertical axis shows the market capitalization of the stocks owned, and the horizontal axis shows investment style (value, blend, or growth). Information shown is based on the most recent data provided by Morningstar.
© 2012 Morningstar, Inc. All rights reserved. The Morningstar information contained herein: (1) is proprietary to Morningstar and/or its content providers; (2) may not be copied or distributed; and (3) is not warranted to be accurate, complete or timely. Neither Morningstar nor its content providers are responsible for any damages or losses arising from any use of this information.
1
Performance Information – Columbia Mid Cap Index Fund
Performance data quoted represents past performance and current performance may be lower or higher. Past performance is no guarantee of future results. The investment return and principal value will fluctuate so that shares, when redeemed, may be worth more or less than the original cost. Please visit www.columbiamanagement.com for daily and most recent month-end performance updates.
|
| Performance of a $10,000 investment 03/01/02 – 02/29/12 |
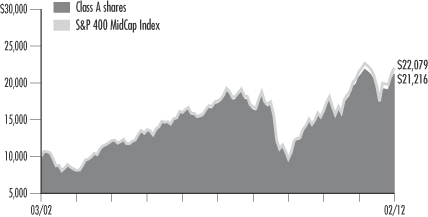
The chart above shows the change in value of a hypothetical $10,000 investment in Class A shares of Columbia Mid Cap Index Fund during the stated time period, and does not reflect the deduction of taxes that a shareholder may pay on fund distributions or on the redemption of fund shares.
| | | | |
| Performance of a $10,000 investment 03/1/02 – 02/29/12 ($) | |
Class A | | | 21,216 | |
Class I* | | | 21,764 | |
Class Z | | | 21,764 | |
| | | | | | | | | | | | |
| Average annual total return as of 2/29/12 (%) | |
| | | |
| Share class | | A | | | I* | | | Z | |
| Inception | | 05/31/00 | | | 9/27/10 | | | 3/31/00 | |
1-year | | | 2.12 | | | | 2.40 | | | | 2.39 | |
5-year | | | 4.32 | | | | 4.58 | | | | 4.58 | |
10-year | | | 7.81 | | | | 8.09 | | | | 8.09 | |
Performance results reflect any fee waivers or reimbursements of fund expenses by Columbia Management Investment Advisers, LLC and/or any of its affiliates. Absent these fee waivers or expense reimbursement arrangements, performance results would have been lower.
Class I shares commenced operations on September 27, 2010.
All results shown assume reinvestment of distributions. Class A shares are sold at net asset value. Class I shares and Z shares are sold at net asset value with no distribution and service (Rule 12b-1) fees. Class I shares and Z shares have limited eligibility and the investment minimum requirements may vary. Please see the fund’s prospectuses for details. Performance for different share classes will vary based on differences in sales charges and fees associated with each class.
The tables do not reflect the deduction of taxes that a shareholder may pay on fund distributions or on the redemption of fund shares.
| * | The returns shown for periods prior to the share class inception date (including returns since inception, which are since Fund inception) include the returns of the Fund’s Class Z shares, the fund’s oldest share class. These returns are adjusted to reflect any higher class-related operating expenses of the newer share classes, as applicable. Please visit columbiamanagement.com/mutual-fund/appended-performance for more information. |
2
Understanding Your Expenses – Columbia Mid Cap Index Fund
As an investor, you incur two types of costs. There are transaction costs, which generally include sales charges on purchases and may include redemption fees. There are also ongoing costs, which generally include management fees, distribution and service (Rule 12b-1) fees, and other fund expenses. The following information is intended to help you understand your ongoing costs (in dollars) of investing in the Fund and to help you compare these costs with the ongoing costs of investing in other mutual funds.
Analyzing your fund’s expenses
To illustrate these ongoing costs, we have provided examples and calculated the expenses paid by investors in each share class of the Fund during the period. The actual and hypothetical information in the table is based on an initial investment of $1,000 at the beginning of the period indicated and held for the entire period. Expense information is calculated two ways and each method provides you with different information. The amount listed in the “Actual” column is calculated using the Fund’s actual operating expenses and total return for the period. You may use the Actual information, together with the amount invested, to estimate the expenses that you paid over the period. Simply divide your account value by $1,000 (for example, an $8,600 account value divided by $1,000 = 8.6), then multiply the results by the expenses paid during the period under the Actual column. The amount listed in the “Hypothetical” column assumes a 5% annual rate of return before expenses (which is not the Fund’s actual return) and then applies the Fund’s actual expense ratio for the period to the hypothetical return. You should not use the hypothetical account values and expenses to estimate either your actual account balance at the end of the period or the expenses you paid during the period. See “Compare with other funds” below for details on how to use the hypothetical data.
Compare with other funds
Since all mutual funds are required to include the same hypothetical calculations about expenses in shareholder reports, you can use this information to compare the ongoing cost of investing in the Fund with other funds. To do so, compare the hypothetical example with the 5% hypothetical examples that appear in the shareholder reports of other funds. As you compare hypothetical examples of other funds, it is important to note that hypothetical examples are meant to highlight the ongoing costs of investing in a fund only and do not reflect any transaction costs, such as sales charges, or redemption or exchange fees. Therefore, the hypothetical calculations are useful in comparing ongoing costs only, and will not help you determine the relative total costs of owning different funds. If transaction costs were included in these calculations, your costs would be higher.
| | | | | | | | | | | | | | | | | | | | | | | | | | | | |
| September 1, 2011 – February 29, 2012 | |
| | | | |
| | | Account value at the
beginning of the period ($) | | | Account value at the
end of the period ($) | | | Expenses paid
during the period ($) | | | Fund’s annualized
expense ratio (%) | |
| | | Actual | | | Hypothetical | | | Actual | | | Hypothetical | | | Actual | | | Hypothetical | | | Actual | |
Class A | | | 1,000.00 | | | | 1,000.00 | | | | 1,123.00 | | | | 1,022.63 | | | | 2.38 | | | | 2.26 | | | | 0.45 | |
Class I | | | 1,000.00 | | | | 1,000.00 | | | | 1,125.10 | | | | 1,023.92 | | | | 1.00 | | | | 0.96 | | | | 0.19 | |
Class Z | | | 1,000.00 | | | | 1,000.00 | | | | 1,125.00 | | | | 1,023.87 | | | | 1.06 | | | | 1.01 | | | | 0.20 | |
Expenses paid during the period are equal to the annualized expense ratio for each class as indicated above, multiplied by the average account value over the period and then multiplied by the number of days in the Fund’s most recent fiscal half year and divided by 366.
Expenses do not include fees and expenses incurred indirectly by the Fund from the underlying funds in which the Fund may invest (also referred to as “acquired funds”), including affiliated and non-affiliated pooled investments vehicles (including mutual funds and exchange traded funds).
Had Columbia Management Investment Advisers, LLC and/or certain of its affiliates not waived/reimbursed certain fees and expenses, account value at the end of the period would have been reduced.
3
Portfolio Manager’s Report – Columbia Mid Cap Index Fund
Performance data quoted represents past performance and current performance may be lower or higher. Past performance is no guarantee of future results. The investment return and principal value will fluctuate so that shares, when redeemed, may be worth more or less than the original cost. Please visit www.columbiamanagement.com for daily and most recent month-end performance updates.
| | | | |
| Net asset value per share | |
| |
as of 02/29/12 ($) | | | | |
Class A | | | 11.92 | |
Class I | | | 11.88 | |
Class Z | | | 11.88 | |
| | | | |
| Distribution declared per share | |
| |
03/01/11 – 02/29/12 ($) | | | | |
Class A | | | 0.61 | |
Class I | | | 0.64 | |
Class Z | | | 0.64 | |
For the 12-month period that ended February 29, 2012, the fund’s Class A shares returned 2.12% without sales charge. The fund’s benchmark, the S&P MidCap 400 Index, returned 2.55%. The fund seeks to allocate its assets among common stocks in approximately the same weightings as the S&P MidCap 400 Index. As such, its return was in line with the return of the index, after fees and expenses, which the index does not incur.
U.S. economy picks up momentum
During the first half of the 12-month period, a series of natural disasters in Japan, Europe’s debt problems and wrangling in Washington over the federal budget and the national debt dominated world headlines. U.S. economic news was lackluster and job growth was disappointing. However, the pace of growth picked up in the second half of the period and, as fears of a lapse back into recession faded, prospects brightened. Consumer confidence improved even though consumers remain under pressure, with no real increase in disposable income and a continued decline in household net worth. The labor markets added more than a million new jobs from September 2011 through February 2012, and the jobless rate fell to 8.3%. Headline inflation — which tracks a broad range of consumer expenditures, including food and energy — remained within its historical range. Even manufacturing held its ground. A modest slowdown in manufacturing activity late in the summer of 2011 raised concern that this lynchpin of the recovery was ready to turn downward. However, manufacturing activity stabilized, and the manufacturing expansion continued into 2012. Housing continues to be the one nagging weak spot in the economy. Yet, home sales edged modestly higher over the year, and there is hope that a bottom in the housing market is in sight.
Economic growth benefited key sectors
As economic growth picked up, consumer staples, consumer discretionary and materials sectors generated the highest gains within the benchmark and the fund. Consumer discretionary, industrials and consumer staples made the largest contributions to return, based on the weight of these sectors in the benchmark and the fund. Beverages, multiline retail, leisure equipment & products, distributors and trading companies were the leading industry groups. The top performing mid-cap securities for the period included Dollar Tree, Monster Beverage, Regeneron Pharmaceuticals, Tractor Supply and Equinix (a provider of carrier-neutral data centers and Internet exchanges) (position eliminated, 0.7%, 0.7%, 0.5% and 0.6% of net assets, respectively).
Energy, information technology and financials were the three biggest laggards for the period. Air freight & logistics, auto components, communications equipment, thrift & mortgage finance and paper & forest products were the bottom five industries, as measured by total return. Arch Coal, Cimarex Energy, Cree (a maker of indoor and light-emitting diode (LED) indoor and outdoor lighting and other applications), Rovi (digital entertainment technology solutions) and Forest Oil (0.2%, 0.6% 0.3%, 0.3% and 0.1% of net assets, respectively) were the weakest performing securities for the period.
There were 40 additions and deletions to the index during the 12-month period. All changes that were made to the index were also made to the fund.
4
Portfolio Manager’s Report (continued) – Columbia Mid Cap Index Fund
The fund owned equity index futures contracts in the notional (face value) amount of its cash balances during the period. It does so in order to keep its investment exposure on par with the index, which is always fully invested.
Looking ahead
As the period ended, economic data suggested that economic growth will continue at a below-trend pace and that, at least in the near term, the U.S. economy has moved away from recessionary conditions. Recession odds have been reduced with the extension of the payroll tax cut and unemployment benefit programs. However, this extension is temporary and only kicks the can down the road into 2013, when severe curtailments are set to bite. And while U.S. economic data is mildly encouraging, there is still a reasonable chance of a mild recession. Europe may already be in a recession, which is likely to worsen further into 2012 as austerity measures begin to bite deeper. The good news is that these measures will initially reduce deficits, but without economic growth it is hard to make significant and persistent progress in debt reduction. So while many of the issues that worried us in 2011 continue to worry us into 2012, we are, nonetheless, cautiously optimistic about the potential for financial returns in 2012.
Equity securities are subject to stock market fluctuations that occur in response to economic and business developments.
Stocks of mid-cap companies pose special risks, including possible illiquidity and greater price volatility than stocks of larger, more established companies.
| | | | |
| Portfolio Breakdown1 | |
| |
(as of February 29, 2012) | | | | |
Consumer Discretionary | | | 12.9 | % |
Consumer Staples | | | 4.1 | |
Energy | | | 6.8 | |
Financials | | | 19.8 | |
Health Care | | | 10.1 | |
Industrials | | | 16.5 | |
Information Technology | | | 15.8 | |
Materials | | | 6.3 | |
Telecommunication Services | | | 0.5 | |
Utilities | | | 4.9 | |
Other2 | | | 2.3 | |
| | 1 | Percentages indicated are based upon total investments (excluding Investments of Cash Collateral Received for Securities on Loan). The Fund’s portfolio composition is subject to change. |
| | 2 | Includes investments in affiliated money market fund. |
| | | | |
| Top Ten Holdings1 | |
| |
(as of February 29, 2012) | | | | |
Monster Beverage Corp. | | | 0.7 | % |
Green Mountain Coffee Roasters, Inc. | | | 0.7 | |
Vertex Pharmaceuticals, Inc. | | | 0.7 | |
Regeneron Pharmaceuticals, Inc. | | | 0.7 | |
Kansas City Southern | | | 0.7 | |
AMETEK, Inc. | | | 0.7 | |
Macerich Co. (The) | | | 0.6 | |
Cimarex Energy Co. | | | 0.6 | |
Church & Dwight Co., Inc. | | | 0.6 | |
HollyFrontier Corp. | | | 0.6 | |
| | 1 | Percentages indicated are based upon total investments (excluding Investments of Cash Collateral Received for Securities on Loan and affiliated money market fund). |
| | | For further detail about these holdings, please refer to the section entitled “Portfolio of Investments.” |
| | | Fund holdings are as of the date given, are subject to change at any time, and are not recommendations to buy or sell any securities. |
5
Portfolio of Investments – Columbia Mid Cap Index Fund
February 29, 2012
(Percentages represent value of investments compared to net assets)
| | | | | | | | |
| Issuer | | Shares | | | Value | |
Common Stocks 97.7% | |
CONSUMER DISCRETIONARY 12.9% | | | | | | | | |
Auto Components 0.3% | | | | | | | | |
Gentex Corp. | | | 357,625 | | | | $8,457,831 | |
Automobiles 0.1% | | | | | | | | |
Thor Industries, Inc. | | | 109,355 | | | | 3,561,692 | |
Distributors 0.4% | | | | | | | | |
LKQ Corp.(a) | | | 365,365 | | | | 11,640,529 | |
Diversified Consumer Services 0.8% | | | | | | | | |
ITT Educational Services, Inc.(a)(b) | | | 49,850 | | | | 3,421,704 | |
Matthews International Corp., Class A | | | 70,895 | | | | 2,199,163 | |
Regis Corp. | | | 143,865 | | | | 2,490,303 | |
Service Corp. International | | | 568,325 | | | | 6,444,806 | |
Sotheby’s | | | 168,395 | | | | 6,624,659 | |
Strayer Education, Inc.(b) | | | 28,970 | | | | 2,980,868 | |
| | | | | | | | |
Total | | | | | | | 24,161,503 | |
Hotels, Restaurants & Leisure 1.5% | | | | | | | | |
Bally Technologies, Inc.(a) | | | 108,042 | | | | 4,639,323 | |
Bob Evans Farms, Inc. | | | 73,310 | | | | 2,697,808 | |
Brinker International, Inc. | | | 200,647 | | | | 5,535,851 | |
Cheesecake Factory, Inc. (The)(a) | | | 136,080 | | | | 4,033,411 | |
International Speedway Corp., Class A | | | 70,580 | | | | 1,775,793 | |
Life Time Fitness, Inc.(a) | | | 105,540 | | | | 5,221,064 | |
Panera Bread Co., Class A(a) | | | 73,895 | | | | 11,422,689 | |
Scientific Games Corp., Class A(a) | | | 144,690 | | | | 1,520,692 | |
Wendy’s Co. (The) | | | 737,195 | | | | 3,737,579 | |
WMS Industries, Inc.(a) | | | 138,905 | | | | 3,060,077 | |
| | | | | | | | |
Total | | | | | | | 43,644,287 | |
Household Durables 1.4% | | | | | | | | |
American Greetings Corp., Class A | | | 99,450 | | | | 1,491,750 | |
KB Home(b) | | | 179,980 | | | | 2,055,372 | |
MDC Holdings, Inc. | | | 93,485 | | | | 2,297,861 | |
Mohawk Industries, Inc.(a) | | | 142,270 | | | | 9,035,568 | |
NVR, Inc.(a) | | | 12,402 | | | | 8,582,184 | |
Toll Brothers, Inc.(a) | | | 366,625 | | | | 8,601,022 | |
Tupperware Brands Corp. | | | 142,990 | | | | 8,964,043 | |
| | | | | | | | |
Total | | | | | | | 41,027,800 | |
Internet & Catalog Retail 0.1% | | | | | | | | |
HSN, Inc. | | | 100,100 | | | | 3,719,716 | |
Leisure Equipment & Products 0.4% | | | | | | | | |
Polaris Industries, Inc. | | | 172,080 | | | | 11,367,605 | |
Media 1.0% | | | | | | | | |
AMC Networks, Inc., Class A(a) | | | 143,295 | | | | 6,504,160 | |
DreamWorks Animation SKG, Inc., Class A(a) | | | 177,010 | | | | 3,055,193 | |
John Wiley & Sons, Inc., Class A | | | 118,410 | | | | 5,375,814 | |
Lamar Advertising Co., Class A(a) | | | 145,975 | | | | 4,773,383 | |
Meredith Corp.(b) | | | 93,030 | | | | 3,060,687 | |
New York Times Co. (The), Class A(a) | | | 301,375 | | | | 1,986,061 | |
Scholastic Corp. | | | 63,020 | | | | 1,926,521 | |
Valassis Communications, Inc.(a) | | | 111,560 | | | | 2,786,769 | |
| | | | | | | | |
Total | | | | | | | 29,468,588 | |
Multiline Retail 0.1% | | | | | | | | |
Saks, Inc.(a)(b) | | | 398,530 | | | | 4,642,874 | |
Specialty Retail 4.6% | | | | | | | | |
Aaron’s, Inc. | | | 188,250 | | | | 5,259,705 | |
| | | | | | | | |
| | |
| Issuer | | Shares | | | Value | |
Common Stocks (continued) | |
CONSUMER DISCRETIONARY (cont.) | | | | | | | | |
Specialty Retail (cont.) | | | | | | | | |
Advance Auto Parts, Inc. | | | 180,585 | | | | $15,416,541 | |
Aeropostale, Inc.(a) | | | 201,287 | | | | 3,617,127 | |
American Eagle Outfitters, Inc. | | | 482,944 | | | | 7,022,006 | |
ANN, Inc.(a) | | | 130,535 | | | | 3,118,481 | |
Ascena Retail Group, Inc.(a) | | | 167,665 | | | | 6,471,869 | |
Barnes & Noble, Inc.(a)(b) | | | 102,010 | | | | 1,357,753 | |
Chico’s FAS, Inc. | | | 417,975 | | | | 6,273,805 | |
Collective Brands, Inc.(a) | | | 150,995 | | | | 2,720,930 | |
Dick’s Sporting Goods, Inc. | | | 240,735 | | | | 10,775,299 | |
Foot Locker, Inc. | | | 381,275 | | | | 11,121,792 | |
Guess?, Inc. | | | 166,515 | | | | 5,769,745 | |
Office Depot, Inc.(a) | | | 699,115 | | | | 2,307,080 | |
PetSmart, Inc. | | | 278,245 | | | | 15,509,376 | |
RadioShack Corp.(b) | | | 248,860 | | | | 1,764,417 | |
Rent-A-Center, Inc. | | | 146,455 | | | | 5,187,436 | |
Signet Jewelers Ltd. | | | 216,630 | | | | 10,159,947 | |
Tractor Supply Co. | | | 177,040 | | | | 15,131,609 | |
Williams-Sonoma, Inc. | | | 258,440 | | | | 9,975,784 | |
| | | | | | | | |
Total | | | | | | | 138,960,702 | |
Textiles, Apparel & Luxury Goods 2.2% | | | | | | | | |
Carter’s, Inc.(a) | | | 126,900 | | | | 6,163,533 | |
Deckers Outdoor Corp.(a) | | | 96,235 | | | | 7,194,529 | |
Fossil, Inc.(a) | | | 131,070 | | | | 15,987,918 | |
Hanesbrands, Inc.(a) | | | 242,220 | | | | 6,958,981 | |
PVH Corp. | | | 168,395 | | | | 14,315,259 | |
Under Armour, Inc., Class A(a) | | | 91,520 | | | | 8,167,245 | |
Warnaco Group, Inc. (The)(a) | | | 100,910 | | | | 5,924,426 | |
| | | | | | | | |
Total | | | | | | | 64,711,891 | |
TOTAL CONSUMER DISCRETIONARY | | | | | | | 385,365,018 | |
CONSUMER STAPLES 4.1% | | | | | | | | |
Beverages 0.7% | | | | | | | | |
Monster Beverage Corp.(a) | | | 377,690 | | | | 21,600,091 | |
Food & Staples Retailing 0.2% | | | | | | | | |
Ruddick Corp. | | | 122,845 | | | | 5,031,731 | |
Food Products 2.1% | | | | | | | | |
Corn Products International, Inc. | | | 188,920 | | | | 10,834,562 | |
Flowers Foods, Inc. | | | 281,307 | | | | 5,384,216 | |
Green Mountain Coffee Roasters, Inc.(a) | | | 323,755 | | | | 21,034,363 | |
Lancaster Colony Corp. | | | 49,595 | | | | 3,232,106 | |
Post Holdings, Inc.(a) | | | 68,715 | | | | 2,139,785 | |
Ralcorp Holdings, Inc.(a) | | | 137,430 | | | | 10,252,278 | |
Smithfield Foods, Inc.(a) | | | 407,140 | | | | 9,539,290 | |
Tootsie Roll Industries, Inc.(b) | | | 61,917 | | | | 1,439,570 | |
| | | | | | | | |
Total | | | | | | | 63,856,170 | |
Household Products 1.0% | | | | | | | | |
Church & Dwight Co., Inc. | | | 356,580 | | | | 17,023,129 | |
Energizer Holdings, Inc.(a) | | | 166,765 | | | | 12,749,185 | |
| | | | | | | | |
Total | | | | | | | 29,772,314 | |
Tobacco 0.1% | | | | | | | | |
Universal Corp. | | | 57,900 | | | | 2,659,926 | |
TOTAL CONSUMER STAPLES | | | | | | | 122,920,232 | |
The Accompanying Notes to Financial Statements are an integral part of this statement.
6
Columbia Mid Cap Index Fund
February 29, 2012
| | | | | | | | |
| Issuer | | Shares | | | Value | |
Common Stocks (continued) | |
ENERGY 6.8% | | | | | | | | |
Energy Equipment & Services 3.0% | | | | | | | | |
Atwood Oceanics, Inc.(a) | | | 140,870 | | | | $6,699,777 | |
CARBO Ceramics, Inc.(b) | | | 49,535 | | | | 4,539,883 | |
Dresser-Rand Group, Inc.(a) | | | 187,555 | | | | 9,850,389 | |
Dril-Quip, Inc.(a) | | | 85,910 | | | | 6,012,841 | |
Helix Energy Solutions Group, Inc.(a) | | | 262,905 | | | | 5,058,292 | |
Oceaneering International, Inc. | | | 269,300 | | | | 14,614,911 | |
Oil States International, Inc.(a) | | | 127,700 | | | | 10,371,794 | |
Patterson-UTI Energy, Inc. | | | 384,685 | | | | 7,470,583 | |
Superior Energy Services, Inc.(a) | | | 385,060 | | | | 11,297,660 | |
Tidewater, Inc. | | | 129,370 | | | | 7,697,515 | |
Unit Corp.(a) | | | 103,225 | | | | 4,910,413 | |
| | | | | | | | |
Total | | | | | | | 88,524,058 | |
Oil, Gas & Consumable Fuels 3.8% | | | | | | | | |
Arch Coal, Inc. | | | 527,495 | | | | 7,158,107 | |
Bill Barrett Corp.(a) | | | 116,730 | | | | 3,412,018 | |
Cimarex Energy Co. | | | 213,730 | | | | 17,241,599 | |
Energen Corp. | | | 179,710 | | | | 9,565,963 | |
Forest Oil Corp.(a) | | | 278,795 | | | | 3,604,819 | |
HollyFrontier Corp. | | | 518,588 | | | | 16,921,527 | |
Northern Oil and Gas, Inc.(a)(b) | | | 157,455 | | | | 3,733,258 | |
Patriot Coal Corp.(a) | | | 227,775 | | | | 1,646,813 | |
Plains Exploration & Production Co.(a) | | | 351,465 | | | | 15,489,063 | |
Quicksilver Resources, Inc.(a)(b) | | | 298,985 | | | | 1,656,377 | |
SM Energy Co. | | | 159,530 | | | | 12,558,202 | |
Southern Union Co. | | | 310,955 | | | | 13,663,363 | |
World Fuel Services Corp. | | | 177,340 | | | | 7,387,984 | |
| | | | | | | | |
Total | | | | | | | 114,039,093 | |
TOTAL ENERGY | | | | | | | 202,563,151 | |
FINANCIALS 19.8% | | | | | | | | |
Capital Markets 2.1% | | | | | | | | |
Affiliated Managers Group, Inc.(a) | | | 132,750 | | | | 14,123,273 | |
Apollo Investment Corp. | | | 491,160 | | | | 3,447,943 | |
Eaton Vance Corp. | | | 286,210 | | | | 8,245,710 | |
Greenhill & Co., Inc. | | | 72,055 | | | | 3,167,538 | |
Janus Capital Group, Inc. | | | 465,120 | | | | 4,102,358 | |
Jefferies Group, Inc. | | | 363,420 | | | | 6,076,382 | |
Raymond James Financial, Inc. | | | 273,545 | | | | 9,675,287 | |
SEI Investments Co. | | | 365,435 | | | | 7,217,341 | |
Waddell & Reed Financial, Inc., Class A | | | 212,650 | | | | 6,711,234 | |
| | | | | | | | |
Total | | | | | | | 62,767,066 | |
Commercial Banks 3.9% | | | | | | | | |
Associated Banc-Corp. | | | 432,502 | | | | 5,726,327 | |
BancorpSouth, Inc. | | | 201,690 | | | | 2,388,010 | |
Bank of Hawaii Corp. | | | 115,795 | | | | 5,326,570 | |
Cathay General Bancorp | | | 196,045 | | | | 3,203,375 | |
City National Corp. | | | 116,680 | | | | 5,483,960 | |
Commerce Bancshares, Inc. | | | 197,282 | | | | 7,617,058 | |
Cullen/Frost Bankers, Inc. | | | 152,665 | | | | 8,622,519 | |
East West Bancorp, Inc. | | | 371,535 | | | | 8,218,354 | |
First Niagara Financial Group, Inc. | | | 867,038 | | | | 8,288,883 | |
FirstMerit Corp. | | | 272,319 | | | | 4,370,720 | |
Fulton Financial Corp. | | | 498,565 | | | | 4,885,937 | |
Hancock Holding Co. | | | 211,140 | | | | 7,168,203 | |
International Bancshares Corp. | | | 132,485 | | | | 2,514,565 | |
Prosperity Bancshares, Inc. | | | 116,885 | | | | 5,112,550 | |
| | | | | | | | |
| Issuer | | Shares | | | Value | |
Common Stocks (continued) | |
FINANCIALS (cont.) | | | | | | | | |
Commercial Banks (cont.) | | | | | | | | |
Signature Bank(a) | | | 115,090 | | | | $6,831,743 | |
SVB Financial Group(a) | | | 108,040 | | | | 6,404,611 | |
Synovus Financial Corp. | | | 1,957,450 | | | | 4,149,794 | |
TCF Financial Corp. | | | 393,005 | | | | 4,236,594 | |
Trustmark Corp. | | | 159,830 | | | | 3,768,791 | |
Valley National Bancorp | | | 465,898 | | | | 5,828,384 | |
Webster Financial Corp. | | | 183,215 | | | | 4,008,744 | |
Westamerica Bancorporation | | | 70,985 | | | | 3,361,850 | |
| | | | | | | | |
Total | | | | | | | 117,517,542 | |
Diversified Financial Services 0.6% | | | | | | | | |
CBOE Holdings, Inc. | | | 224,320 | | | | 6,184,503 | |
MSCI, Inc., Class A(a) | | | 300,535 | | | | 10,632,928 | |
| | | | | | | | |
Total | | | | | | | 16,817,431 | |
Insurance 4.0% | | | | | | | | |
American Financial Group, Inc. | | | 191,960 | | | | 7,188,902 | |
Arthur J Gallagher & Co. | | | 282,245 | | | | 9,630,199 | |
Aspen Insurance Holdings Ltd. | | | 175,990 | | | | 4,669,015 | |
Brown & Brown, Inc. | | | 289,485 | | | | 6,840,531 | |
Everest Re Group Ltd. | | | 133,875 | | | | 11,760,919 | |
Fidelity National Financial, Inc., Class A | | | 546,330 | | | | 9,429,656 | |
First American Financial Corp. | | | 262,845 | | | | 4,047,813 | |
Hanover Insurance Group, Inc. (The) | | | 111,850 | | | | 4,565,717 | |
HCC Insurance Holdings, Inc. | | | 283,365 | | | | 8,653,967 | |
Kemper Corp. | | | 125,090 | | | | 3,580,076 | |
Mercury General Corp. | | | 90,220 | | | | 3,868,634 | |
Old Republic International Corp. | | | 636,943 | | | | 6,917,201 | |
Protective Life Corp. | | | 206,420 | | | | 5,732,283 | |
Reinsurance Group of America, Inc. | | | 182,635 | | | | 10,532,560 | |
StanCorp Financial Group, Inc. | | | 110,140 | | | | 4,379,166 | |
Transatlantic Holdings, Inc. | | | 143,190 | | | | 8,677,314 | |
WR Berkley Corp. | | | 276,820 | | | | 9,896,315 | |
| | | | | | | | |
Total | | | | | | | 120,370,268 | |
Real Estate Investment Trusts (REITs) 8.2% | |
Alexandria Real Estate Equities, Inc. | | | 154,435 | | | | 11,071,445 | |
American Campus Communities, Inc. | | | 176,625 | | | | 7,268,119 | |
BRE Properties, Inc. | | | 187,715 | | | | 9,091,038 | |
Camden Property Trust | | | 192,140 | | | | 11,912,680 | |
Corporate Office Properties Trust | | | 179,440 | | | | 4,399,869 | |
Duke Realty Corp. | | | 630,455 | | | | 8,750,715 | |
Equity One, Inc. | | | 148,620 | | | | 2,826,752 | |
Essex Property Trust, Inc. | | | 85,065 | | | | 11,908,249 | |
Federal Realty Investment Trust | | | 158,265 | | | | 15,090,568 | |
Highwoods Properties, Inc. | | | 180,915 | | | | 5,789,280 | |
Home Properties, Inc. | | | 120,310 | | | | 6,933,465 | |
Hospitality Properties Trust | | | 307,905 | | | | 7,614,491 | |
Liberty Property Trust | | | 289,255 | | | | 9,811,530 | |
Macerich Co. (The) | | | 328,885 | | | | 17,756,501 | |
Mack-Cali Realty Corp. | | | 217,220 | | | | 6,212,492 | |
National Retail Properties, Inc. | | | 257,740 | | | | 6,868,771 | |
Omega Healthcare Investors, Inc. | | | 257,160 | | | | 5,238,349 | |
Potlatch Corp. | | | 100,171 | | | | 3,087,270 | |
Rayonier, Inc. | | | 301,322 | | | | 13,414,855 | |
Realty Income Corp. | | | 332,040 | | | | 12,248,956 | |
Regency Centers Corp. | | | 224,125 | | | | 9,590,309 | |
Senior Housing Properties Trust | | | 405,425 | | | | 8,676,095 | |
SL Green Realty Corp. | | | 214,740 | | | | 16,330,977 | |
The Accompanying Notes to Financial Statements are an integral part of this statement.
7
Columbia Mid Cap Index Fund
February 29, 2012
| | | | | | | | |
| Issuer | | Shares | | | Value | |
Common Stocks (continued) | |
FINANCIALS (cont.) | | | | | | | | |
Real Estate Investment Trusts (REITs) (cont.) | | | | | | | | |
Taubman Centers, Inc. | | | 144,370 | | | | $9,971,636 | |
UDR, Inc. | | | 546,000 | | | | 13,660,920 | |
Weingarten Realty Investors | | | 301,210 | | | | 7,500,129 | |
| | | | | | | | |
Total | | | | | | | 243,025,461 | |
Real Estate Management & Development 0.3% | | | | | | | | |
Jones Lang LaSalle, Inc. | | | 108,360 | | | | 8,821,587 | |
Thrifts & Mortgage Finance 0.7% | | | | | | | | |
Astoria Financial Corp. | | | 208,775 | | | | 1,833,045 | |
New York Community Bancorp, Inc. | | | 1,090,308 | | | | 14,184,907 | |
Washington Federal, Inc. | | | 268,262 | | | | 4,345,844 | |
| | | | | | | | |
Total | | | | | | | 20,363,796 | |
TOTAL FINANCIALS | | | | | | | 589,683,151 | |
HEALTH CARE 10.1% | | | | | | | | |
Biotechnology 1.6% | | | | | | | | |
Regeneron Pharmaceuticals, Inc.(a) | | | 189,220 | | | | 19,828,364 | |
United Therapeutics Corp.(a) | | | 129,415 | | | | 6,176,978 | |
Vertex Pharmaceuticals, Inc.(a) | | | 519,885 | | | | 20,233,924 | |
| | | | | | | | |
Total | | | | | | | 46,239,266 | |
Health Care Equipment & Supplies 2.6% | | | | | | | | |
Cooper Companies, Inc. (The) | | | 118,990 | | | | 9,457,325 | |
Gen-Probe, Inc.(a) | | | 115,945 | | | | 7,916,725 | |
Hill-Rom Holdings, Inc. | | | 153,830 | | | | 5,225,605 | |
Hologic, Inc.(a) | | | 655,860 | | | | 13,595,978 | |
IDEXX Laboratories, Inc.(a) | | | 139,960 | | | | 12,001,570 | |
Masimo Corp.(a) | | | 149,570 | | | | 3,260,626 | |
ResMed, Inc.(a) | | | 366,655 | | | | 10,742,991 | |
STERIS Corp. | | | 144,490 | | | | 4,534,096 | |
Teleflex, Inc. | | | 101,495 | | | | 6,015,609 | |
Thoratec Corp.(a) | | | 149,385 | | | | 5,153,782 | |
| | | | | | | | |
Total | | | | | | | 77,904,307 | |
Health Care Providers & Services 3.8% | | | | | | | | |
AMERIGROUP Corp.(a) | | | 119,235 | | | | 8,099,634 | |
Catalyst Health Solutions, Inc.(a) | | | 124,695 | | | | 7,733,584 | |
Community Health Systems, Inc.(a) | | | 225,780 | | | | 5,698,687 | |
Health Management Associates, Inc., Class A(a) | | | 633,395 | | | | 4,674,455 | |
Health Net, Inc.(a) | | | 206,810 | | | | 7,805,009 | |
Henry Schein, Inc.(a) | | | 225,245 | | | | 16,672,635 | |
HMS Holdings Corp.(a) | | | 212,010 | | | | 6,830,962 | |
LifePoint Hospitals, Inc.(a) | | | 120,030 | | | | 4,677,569 | |
Lincare Holdings, Inc. | | | 220,715 | | | | 5,928,405 | |
Mednax, Inc.(a) | | | 121,925 | | | | 9,070,001 | |
Omnicare, Inc. | | | 285,015 | | | | 10,026,828 | |
Owens & Minor, Inc. | | | 158,110 | | | | 4,736,976 | |
Universal Health Services, Inc., Class B | | | 240,630 | | | | 10,734,504 | |
VCA Antech, Inc.(a) | | | 216,120 | | | | 4,752,479 | |
WellCare Health Plans, Inc.(a) | | | 106,670 | | | | 7,238,626 | |
| | | | | | | | |
Total | | �� | | | | | 114,680,354 | |
Health Care Technology 0.3% | | | | | | | | |
Allscripts-Misys Healthcare Solutions, Inc.(a) | | | 472,545 | | | | 9,129,569 | |
Life Sciences Tools & Services 1.3% | | | | | | | | |
Bio-Rad Laboratories, Inc., Class A(a) | | | 49,065 | | | | 5,000,705 | |
Charles River Laboratories International, Inc.(a) | | | 123,245 | | | | 4,329,597 | |
Covance, Inc.(a) | | | 151,455 | | | | 7,228,947 | |
Mettler-Toledo International, Inc.(a) | | | 78,730 | | | | 14,193,444 | |
| | | | | | | | |
| Issuer | | Shares | | | Value | |
Common Stocks (continued) | |
HEALTH CARE (cont.) | | | | | | | | |
Life Sciences Tools & Services (cont.) | | | | | | | | |
Techne Corp. | | | 92,230 | | | | $6,602,746 | |
| | | | | | | | |
Total | | | | | | | 37,355,439 | |
Pharmaceuticals 0.5% | | | | | | | | |
Endo Pharmaceuticals Holdings, Inc.(a) | | | 291,230 | | | | 10,795,896 | |
Medicis Pharmaceutical Corp., Class A | | | 157,270 | | | | 5,495,014 | |
| | | | | | | | |
Total | | | | | | | 16,290,910 | |
TOTAL HEALTH CARE | | | | | | | 301,599,845 | |
INDUSTRIALS 16.5% | | | | | | | | |
Aerospace & Defense 1.3% | | | | | | | | |
Alliant Techsystems, Inc. | | | 82,130 | | | | 4,927,800 | |
BE Aerospace, Inc.(a) | | | 257,100 | | | | 11,785,464 | |
Esterline Technologies Corp.(a) | | | 76,308 | | | | 4,956,204 | |
Exelis, Inc. | | | 460,090 | | | | 4,835,546 | |
Huntington Ingalls Industries, Inc.(a) | | | 121,660 | | | | 4,365,161 | |
Triumph Group, Inc. | | | 107,645 | | | | 6,867,751 | |
| | | | | | | | |
Total | | | | | | | 37,737,926 | |
Air Freight & Logistics 0.1% | | | | | | | | |
UTi Worldwide, Inc. | | | 256,240 | | | | 4,135,714 | |
Airlines 0.3% | | | | | | | | |
Alaska Air Group, Inc.(a) | | | 88,525 | | | | 6,070,159 | |
JetBlue Airways Corp.(a) | | | 509,335 | | | | 2,597,609 | |
| | | | | | | | |
Total | | | | | | | 8,667,768 | |
Building Products 0.4% | | | | | | | | |
Fortune Brands Home & Security, Inc.(a) | | | 387,850 | | | | 7,501,019 | |
Lennox International, Inc. | | | 128,530 | | | | 5,029,379 | |
| | | | | | | | |
Total | | | | | | | 12,530,398 | |
Commercial Services & Supplies 1.6% | | | | | | | | |
Brink’s Co.(The) | | | 116,735 | | | | 2,947,559 | |
Clean Harbors, Inc.(a) | | | 117,715 | | | | 7,905,739 | |
Copart, Inc.(a) | | | 132,975 | | | | 6,619,496 | |
Corrections Corp. of America(a) | | | 248,040 | | | | 6,215,882 | |
Deluxe Corp. | | | 126,670 | | | | 3,124,949 | |
Herman Miller, Inc. | | | 145,145 | | | | 3,048,045 | |
HNI Corp. | | | 111,735 | | | | 2,824,661 | |
Mine Safety Appliances Co. | | | 76,715 | | | | 2,827,715 | |
Rollins, Inc. | | | 160,450 | | | | 3,250,717 | |
Waste Connections, Inc. | | | 308,647 | | | | 10,037,200 | |
| | | | | | | | |
Total | | | | | | | 48,801,963 | |
Construction & Engineering 1.2% | | | | | | | | |
AECOM Technology Corp.(a) | | | 287,545 | | | | 6,714,176 | |
Granite Construction, Inc. | | | 86,740 | | | | 2,480,764 | |
KBR, Inc. | | | 371,050 | | | | 13,476,536 | |
Shaw Group, Inc.(The)(a) | | | 162,400 | | | | 4,699,856 | |
URS Corp.(a) | | | 198,455 | | | | 8,662,560 | |
| | | | | | | | |
Total | | | | | | | 36,033,892 | |
Electrical Equipment 1.9% | | | | | | | | |
Acuity Brands, Inc. | | | 104,855 | | | | 6,520,933 | |
AMETEK, Inc. | | | 399,085 | | | | 18,996,446 | |
General Cable Corp.(a) | | | 130,090 | | | | 4,028,887 | |
Hubbell, Inc., Class B | | | 146,915 | | | | 11,050,946 | |
Regal-Beloit Corp. | | | 103,500 | | | | 6,986,250 | |
Thomas & Betts Corp.(a) | | | 129,740 | | | | 9,371,120 | |
| | | | | | | | |
Total | | | | | | | 56,954,582 | |
The Accompanying Notes to Financial Statements are an integral part of this statement.
8
Columbia Mid Cap Index Fund
February 29, 2012
| | | | | | | | |
| Issuer | | Shares | | | Value | |
Common Stocks (continued) | |
INDUSTRIALS (cont.) | | | | | | | | |
Industrial Conglomerates 0.2% | | | | | | | | |
Carlisle Companies, Inc. | | | 152,130 | | | | $7,423,944 | |
Machinery 5.7% | | | | | | | | |
AGCO Corp.(a) | | | 242,260 | | | | 12,507,884 | |
Clarcor, Inc. | | | 125,210 | | | | 6,319,349 | |
Crane Co. | | | 121,775 | | | | 5,914,612 | |
Donaldson Co., Inc. | | | 185,750 | | | | 13,639,622 | |
Gardner Denver, Inc. | | | 126,090 | | | | 8,659,861 | |
Graco, Inc. | | | 148,777 | | | | 7,614,407 | |
Harsco Corp. | | | 201,195 | | | | 4,472,565 | |
IDEX Corp. | | | 207,990 | | | | 8,693,982 | |
ITT Corp. | | | 231,200 | | | | 5,768,440 | |
Kennametal, Inc. | | | 198,065 | | | | 9,124,855 | |
Lincoln Electric Holdings, Inc. | | | 208,885 | | | | 9,648,398 | |
Nordson Corp. | | | 148,630 | | | | 8,170,191 | |
Oshkosh Corp.(a) | | | 227,885 | | | | 5,311,999 | |
Pentair, Inc. | | | 245,695 | | | | 9,459,257 | |
SPX Corp. | | | 127,175 | | | | 9,301,579 | |
Terex Corp.(a) | | | 273,445 | | | | 6,942,769 | |
Timken Co. | | | 209,330 | | | | 10,968,892 | |
Trinity Industries, Inc. | | | 199,755 | | | | 6,943,484 | |
Valmont Industries, Inc. | | | 56,025 | | | | 6,222,697 | |
Wabtec Corp. | | | 119,575 | | | | 8,935,840 | |
Woodward, Inc. | | | 149,425 | | | | 6,540,332 | |
| | | | | | | | |
Total | | | | | | | 171,161,015 | |
Marine 0.5% | | | | | | | | |
Alexander & Baldwin, Inc. | | | 103,935 | | | | 4,823,624 | |
Kirby Corp.(a) | | | 138,765 | | | | 9,522,054 | |
| | | | | | | | |
Total | | | | | | | 14,345,678 | |
Professional Services 0.9% | | | | | | | | |
Corporate Executive Board Co. (The) | | | 82,990 | | | | 3,439,106 | |
FTI Consulting, Inc.(a) | | | 102,130 | | | | 4,092,349 | |
Korn/Ferry International(a) | | | 118,955 | | | | 1,899,711 | |
Manpower, Inc. | | | 203,370 | | | | 8,759,146 | |
Towers Watson & Co. | | | 128,435 | | | | 8,212,134 | |
| | | | | | | | |
Total | | | | | | | 26,402,446 | |
Road & Rail 1.5% | | | | | | | | |
Con-way, Inc. | | | 138,570 | | | | 4,094,744 | |
JB Hunt Transport Services, Inc. | | | 224,045 | | | | 11,473,344 | |
Kansas City Southern(a) | | | 273,805 | | | | 19,051,352 | |
Landstar System, Inc. | | | 116,920 | | | | 6,320,695 | |
Werner Enterprises, Inc. | | | 110,743 | | | | 2,682,195 | |
| | | | | | | | |
Total | | | | | | | 43,622,330 | |
Trading Companies & Distributors 0.9% | | | | | | | | |
GATX Corp. | | | 116,155 | | | | 5,051,581 | |
MSC Industrial Direct Co., Inc., Class A | | | 114,200 | | | | 9,068,622 | |
United Rentals, Inc.(a) | | | 156,165 | | | | 6,508,957 | |
Watsco, Inc. | | | 70,750 | | | | 5,050,843 | |
| | | | | | | | |
Total | | | | | | | 25,680,003 | |
TOTAL INDUSTRIALS | | | | | | | 493,497,659 | |
INFORMATION TECHNOLOGY 15.8% | | | | | | | | |
Communications Equipment 1.2% | | | | | | | | |
ADTRAN, Inc. | | | 158,675 | | | | 5,593,294 | |
Ciena Corp.(a) | | | 241,505 | | | | 3,603,255 | |
Plantronics, Inc. | | | 108,445 | | | | 4,044,998 | |
| | | | | | | | |
| Issuer | | Shares | | | Value | |
Common Stocks (continued) | |
INFORMATION TECHNOLOGY (cont.) | | | | | | | | |
Communications Equipment (cont.) | | | | | | | | |
Polycom, Inc.(a) | | | 441,545 | | | | $9,117,904 | |
Riverbed Technology, Inc.(a) | | | 386,410 | | | | 11,001,093 | |
Tellabs, Inc. | | | 908,900 | | | | 3,599,244 | |
| | | | | | | | |
Total | | | | | | | 36,959,788 | |
Computers & Peripherals 0.6% | | | | | | | | |
Diebold, Inc. | | | 156,135 | | | | 6,109,563 | |
NCR Corp.(a) | | | 392,345 | | | | 8,521,733 | |
QLogic Corp.(a) | | | 250,815 | | | | 4,311,510 | |
| | | | | | | | |
Total | | | | | | | 18,942,806 | |
Electronic Equipment, Instruments & Components 2.3% | |
Arrow Electronics, Inc.(a) | | | 278,510 | | | | 11,182,176 | |
Avnet, Inc.(a) | | | 369,835 | | | | 13,217,903 | |
Ingram Micro, Inc., Class A(a) | | | 382,375 | | | | 7,314,834 | |
Itron, Inc.(a) | | | 101,530 | | | | 4,509,963 | |
National Instruments Corp. | | | 231,083 | | | | 6,146,808 | |
Tech Data Corp.(a) | | | 102,875 | | | | 5,501,755 | |
Trimble Navigation Ltd.(a) | | | 307,370 | | | | 15,457,637 | |
Vishay Intertechnology, Inc.(a) | | | 391,800 | | | | 4,803,468 | |
| | | | | | | | |
Total | | | | | | | 68,134,544 | |
Internet Software & Services 1.4% | | | | | | | | |
AOL, Inc.(a) | | | 242,645 | | | | 4,357,904 | |
Equinix, Inc.(a) | | | 118,175 | | | | 16,565,772 | |
Monster Worldwide, Inc.(a) | | | 321,130 | | | | 2,228,642 | |
Rackspace Hosting, Inc.(a) | | | 258,110 | | | | 13,483,666 | |
ValueClick, Inc.(a) | | | 205,855 | | | | 4,281,784 | |
| | | | | | | | |
Total | | | | | | | 40,917,768 | |
IT Services 3.0% | | | | | | | | |
Acxiom Corp.(a) | | | 195,115 | | | | 2,739,415 | |
Alliance Data Systems Corp.(a) | | | 124,555 | | | | 15,115,995 | |
Broadridge Financial Solutions, Inc. | | | 309,380 | | | | 7,530,309 | |
Convergys Corp.(a) | | | 299,525 | | | | 3,857,882 | |
CoreLogic, Inc.(a) | | | 265,465 | | | | 4,082,852 | |
DST Systems, Inc. | | | 83,490 | | | | 4,424,970 | |
Gartner, Inc.(a) | | | 236,535 | | | | 9,522,899 | |
Global Payments, Inc. | | | 195,215 | | | | 10,076,998 | |
Jack Henry & Associates, Inc. | | | 215,815 | | | | 7,281,598 | |
Lender Processing Services, Inc. | | | 210,335 | | | | 4,635,783 | |
Mantech International Corp., Class A | | | 57,800 | | | | 1,938,612 | |
NeuStar, Inc., Class A(a) | | | 162,960 | | | | 5,711,748 | |
VeriFone Systems, Inc.(a) | | | 262,380 | | | | 12,565,378 | |
| | | | | | | | |
Total | | | | | | | 89,484,439 | |
Office Electronics 0.2% | | | | | | | | |
Zebra Technologies Corp., Class A(a) | | | 129,530 | | | | 4,979,133 | |
Semiconductors & Semiconductor Equipment 2.7% | |
Atmel Corp.(a) | | | 1,153,115 | | | | 11,657,993 | |
Cree, Inc.(a)(b) | | | 287,620 | | | | 8,712,010 | |
Cypress Semiconductor Corp.(a) | | | 386,030 | | | | 6,659,017 | |
Fairchild Semiconductor International, Inc.(a) | | | 315,130 | | | | 4,597,747 | |
Integrated Device Technology, Inc.(a) | | | 354,082 | | | | 2,446,707 | |
International Rectifier Corp.(a) | | | 172,105 | | | | 3,863,757 | |
Intersil Corp., Class A | | | 315,125 | | | | 3,567,215 | |
Lam Research Corp.(a) | | | 297,995 | | | | 12,426,391 | |
MEMC Electronic Materials, Inc.(a) | | | 574,480 | | | | 2,257,706 | |
RF Micro Devices, Inc.(a) | | | 692,870 | | | | 3,304,990 | |
Semtech Corp.(a) | | | 165,220 | | | | 4,743,466 | |
The Accompanying Notes to Financial Statements are an integral part of this statement.
9
Columbia Mid Cap Index Fund
February 29, 2012
| | | | | | | | |
| Issuer | | Shares | | | Value | |
Common Stocks (continued) | |
INFORMATION TECHNOLOGY (cont.) | | | | | | | | |
Semiconductors & Semiconductor Equipment (cont.) | |
Silicon Laboratories, Inc.(a) | | | 104,325 | | | | $4,673,760 | |
Skyworks Solutions, Inc.(a) | | | 468,345 | | | | 12,631,265 | |
| | | | | | | | |
Total | | | | | | | 81,542,024 | |
Software 4.4% | | | | | | | | |
ACI Worldwide, Inc.(a) | | | 97,810 | | | | 3,695,262 | |
Advent Software, Inc.(a) | | | 79,775 | | | | 2,052,611 | |
ANSYS, Inc.(a) | | | 230,270 | | | | 14,548,458 | |
Cadence Design Systems, Inc.(a) | | | 678,845 | | | | 7,990,006 | |
Compuware Corp.(a) | | | 543,640 | | | | 4,898,196 | |
Concur Technologies, Inc.(a) | | | 115,955 | | | | 6,835,547 | |
Factset Research Systems, Inc. | | | 112,580 | | | | 9,839,492 | |
Fair Isaac Corp. | | | 88,995 | | | | 3,602,518 | |
Informatica Corp.(a) | | | 265,085 | | | | 13,031,578 | |
Mentor Graphics Corp.(a) | | | 232,610 | | | | 3,526,368 | |
MICROS Systems, Inc.(a) | | | 199,745 | | | | 10,372,758 | |
Parametric Technology Corp.(a) | | | 291,265 | | | | 7,776,775 | |
Quest Software, Inc.(a) | | | 140,830 | | | | 2,819,417 | |
Rovi Corp.(a) | | | 274,180 | | | | 9,727,906 | |
Solera Holdings, Inc. | | | 176,745 | | | | 8,483,760 | |
Synopsys, Inc.(a) | | | 357,225 | | | | 10,884,646 | |
TIBCO Software, Inc.(a) | | | 401,875 | | | | 11,642,319 | |
| | | | | | | | |
Total | | | | | | | 131,727,617 | |
TOTAL INFORMATION TECHNOLOGY | | | | | | | 472,688,119 | |
MATERIALS 6.3% | | | | | | | | |
Chemicals 2.8% | | | | | | | | |
Albemarle Corp. | | | 221,255 | | | | 14,717,883 | |
Ashland, Inc. | | | 194,695 | | | | 12,374,814 | |
Cabot Corp. | | | 159,290 | | | | 6,452,838 | |
Cytec Industries, Inc. | | | 123,605 | | | | 7,349,553 | |
Intrepid Potash, Inc.(a) | | | 131,220 | | | | 3,318,554 | |
Minerals Technologies, Inc. | | | 44,025 | | | | 2,842,694 | |
NewMarket Corp. | | | 26,400 | | | | 4,816,152 | |
Olin Corp. | | | 199,820 | | | | 4,202,215 | |
RPM International, Inc. | | | 326,635 | | | | 7,796,777 | |
Scotts Miracle-Gro Co., Class A | | | 107,880 | | | | 5,053,099 | |
Sensient Technologies Corp. | | | 124,845 | | | | 4,618,017 | |
Valspar Corp. | | | 232,965 | | | | 10,797,928 | |
| | | | | | | | |
Total | | | | | | | 84,340,524 | |
Construction Materials 0.3% | | | | | | | | |
Martin Marietta Materials, Inc.(b) | | | 113,905 | | | | 9,781,022 | |
Containers & Packaging 1.6% | | | | | | | | |
AptarGroup, Inc. | | | 164,695 | | | | 8,692,602 | |
Greif, Inc., Class A | | | 76,685 | | | | 3,927,039 | |
Packaging Corp. of America | | | 243,675 | | | | 7,222,527 | |
Rock-Tenn Co., Class A | | | 175,765 | | | | 12,389,675 | |
Silgan Holdings, Inc. | | | 123,535 | | | | 5,252,708 | |
Sonoco Products Co. | | | 249,220 | | | | 8,184,385 | |
| | | | | | | | |
Total | | | | | | | 45,668,936 | |
Metals & Mining 1.2% | | | | | | | | |
Carpenter Technology Corp. | | | 110,130 | | | | 5,649,669 | |
Commercial Metals Co. | | | 288,005 | | | | 3,827,586 | |
Compass Minerals International, Inc. | | | 82,050 | | | | 5,911,703 | |
Reliance Steel & Aluminum Co. | | | 186,885 | | | | 10,039,462 | |
Steel Dynamics, Inc. | | | 545,135 | | | | 8,073,449 | |
| | | | | | | | |
| Issuer | | Shares | | | Value | |
Common Stocks (continued) | |
MATERIALS (cont.) | | | | | | | | |
Metals & Mining (cont.) | | | | | | | | |
Worthington Industries, Inc. | | | 133,740 | | | | $2,256,194 | |
| | | | | | | | |
Total | | | | | | | 35,758,063 | |
Paper & Forest Products 0.4% | | | | | | | | |
Domtar Corp. | | | 90,845 | | | | 8,709,310 | |
Louisiana-Pacific Corp.(a) | | | 339,685 | | | | 2,775,227 | |
| | | | | | | | |
Total | | | | | | | 11,484,537 | |
TOTAL MATERIALS | | | | | | | 187,033,082 | |
TELECOMMUNICATION SERVICES 0.5% | | | | | | | | |
Diversified Telecommunication Services 0.3% | | | | | |
tw telecom, inc.(a) | | | 372,310 | | | | 8,041,896 | |
Wireless Telecommunication Services 0.2% | | | | | | | | |
Telephone & Data Systems, Inc. | | | 240,293 | | | | 6,072,204 | |
TOTAL TELECOMMUNICATION SERVICES | | | | | | | 14,114,100 | |
UTILITIES 4.9% | | | | | | | | |
Electric Utilities 1.5% | | | | | | | | |
Cleco Corp. | | | 151,220 | | | | 5,818,946 | |
Great Plains Energy, Inc. | | | 338,224 | | | | 6,690,071 | |
Hawaiian Electric Industries, Inc. | | | 239,235 | | | | 5,992,837 | |
IDACORP, Inc. | | | 124,055 | | | | 5,021,746 | |
NV Energy, Inc. | | | 588,275 | | | | 9,224,152 | |
PNM Resources, Inc. | | | 198,550 | | | | 3,569,929 | |
Westar Energy, Inc. | | | 292,095 | | | | 8,038,454 | |
| | | | | | | | |
Total | | | | | | | 44,356,135 | |
Gas Utilities 1.3% | | | | | | | | |
Atmos Energy Corp. | | | 225,245 | | | | 6,921,779 | |
National Fuel Gas Co. | | | 206,510 | | | | 10,393,648 | |
Questar Corp. | | | 442,670 | | | | 8,508,117 | |
UGI Corp. | | | 287,800 | | | | 8,130,350 | |
WGL Holdings, Inc. | | | 128,195 | | | | 5,234,202 | |
| | | | | | | | |
Total | | | | | | | 39,188,096 | |
Multi-Utilities 1.9% | | | | | | | | |
Alliant Energy Corp. | | | 276,645 | | | | 11,796,143 | |
Black Hills Corp. | | | 98,380 | | | | 3,230,799 | |
MDU Resources Group, Inc. | | | 470,605 | | | | 10,212,129 | |
NSTAR | | | 258,205 | | | | 12,109,814 | |
OGE Energy Corp. | | | 244,425 | | | | 12,827,424 | |
Vectren Corp. | | | 204,035 | | | | 5,961,903 | |
| | | | | | | | |
Total | | | | | | | 56,138,212 | |
Water Utilities 0.2% | | | | | | | | |
Aqua America, Inc. | | | 345,409 | | | | 7,671,534 | |
TOTAL UTILITIES | | | | | | | 147,353,977 | |
Total Common Stocks | | | | | | | | |
(Cost: $2,303,435,662) | | | | | | | $2,916,818,334 | |
| |
| | |
| | | Shares | | | Value | |
Money Market Funds 2.3% | |
Columbia Short-Term Cash Fund, 0.166%(c)(d) | | | 69,812,648 | | | | $69,812,648 | |
Total Money Market Funds | | | | | | | | |
(Cost: $69,812,648) | | | | | | | $69,812,648 | |
The Accompanying Notes to Financial Statements are an integral part of this statement.
10
Columbia Mid Cap Index Fund
February 29, 2012
| | | | | | | | | | | | |
| Issuer | | Effective
Yield | | | Par/
Principal/
Shares | | | Value | |
Investments of Cash Collateral Received for Securities on Loan 1.4% | |
Certificates of Deposit —% | |
FMS Wertmanagement Anstalt Des Oeffentlichen Rechts | |
03/09/12 | | | 0.330 | % | | | $1,000,000 | | | | $1,000,000 | |
| | | | | | | | | | | | |
Total | | | | | | | | | | | 1,000,000 | |
Repurchase Agreements 1.4% | |
Citibank NA
dated 02/29/12, matures 03/01/12,
repurchase price $10,000,053(e) | |
| | | 0.190 | % | | | 10,000,000 | | | | 10,000,000 | |
Citigroup Global Markets, Inc.(e)
dated 02/29/12, matures 03/01/12,
repurchase price $10,000,036 | |
| | | 0.130 | % | | | 10,000,000 | | | | 10,000,000 | |
repurchase price $7,998,829 | |
| | | 0.130 | % | | | 7,998,800 | | | | 7,998,800 | |
Credit Suisse Securities (USA) LLC
dated 02/29/12, matures 03/01/12,
repurchase price $11,747,716(e) | |
| | | 0.160 | % | | | 11,747,664 | | | | 11,747,664 | |
| | | | | | | | | | | | |
| Issuer | | Effective
Yield | | | Par/
Principal | | | Value | |
Investments of Cash Collateral Received for Securities on Loan 1.4% (continued) | |
Repurchase Agreements (cont.) | |
Pershing LLC
dated 02/29/12, matures 03/01/12,
repurchase price $1,000,008(e) | |
| | | 0.290 | % | | | $1,000,000 | | | | $1,000,000 | |
| | | | | | | | | | | | |
Total | | | | | | | | | | | 40,746,464 | |
Total Investments of Cash Collateral Received for Securities on Loan | | | | | |
(Cost: $41,746,464) | | | | $41,746,464 | |
Total Investments | | | | | |
(Cost: $2,414,994,774) | | | | $3,028,377,446 | |
Other Assets & Liabilities, Net | | | | (40,620,947 | ) |
Net Assets | | | | $2,987,756,499 | |
Investment in Derivatives
At February 29, 2012, $7,415,000 was held in a margin deposit account as collateral to cover initial margin requirements on open stock index futures contracts.
Futures Contracts Outstanding at February 29, 2012
| | | | | | | | | | | | | | | | | | | | |
| Contract Description | | Number of Contracts Long (Short) | | | Notional Market Value | | | Expiration Date | | | Unrealized Appreciation | | | Unrealized Depreciation | |
S&P Mid Cap 400 Index | | | 694 | | | | $67,776,040 | | | | March 2012 | | | | $6,122,069 | | | | $— | |
|
Notes to Portfolio of Investments |
| (a) | Non-income producing. |
| (b) | At February 29, 2012, security was partially or fully on loan. |
| (c) | The rate shown is the seven-day current annualized yield at February 29, 2012. |
| (d) | Investments in affiliates during the year ended February 29, 2012: |
| | | | | | | | | | | | | | | | | | | | | | | | | | | | |
| Issuer | | Beginning
Cost | | | Purchase
Cost | | | Sales Cost/
Proceeds
from Sales | | | Realized
Gain/Loss | | | Ending
Cost | | | Dividends
or Interest
Income | | | Value | |
Columbia Short-Term Cash Fund | | | $— | | | | $350,976,199 | | | | $(281,163,551 | ) | | | $— | | | | $69,812,648 | | | | $42,878 | | | | $69,812,648 | |
| (e) | The table below represents securities received as collateral for repurchase agreements. This collateral is deposited with the Fund’s custodian and, pursuant to the terms of the repurchase agreement, must have an aggregate market value greater than or equal to the repurchase price plus accrued interest at all times. The value of securities and/or cash held as collateral for repurchase agreements is monitored on a daily basis to ensure the proper level of collateral. |
Citibank NA (0.190%)
| | | | |
| Security Description | | Value | |
Fannie Mae REMICS | | | $4,263,555 | |
Freddie Mac REMICS | | | 4,283,165 | |
Government National Mortgage Association | | | 1,653,280 | |
Total Market Value of Collateral Securities | | | $10,200,000 | |
The Accompanying Notes to Financial Statements are an integral part of this statement.
11
Columbia Mid Cap Index Fund
February 29, 2012
|
Notes to Portfolio of Investments (continued) |
| | | | |
| Citigroup Global Markets, Inc. (0.130%) | | | | |
| Security Description | | Value | |
Fannie Mae REMICS | | | $3,827,800 | |
Fannie Mae-Aces | | | 423,823 | |
Freddie Mac REMICS | | | 3,070,600 | |
Government National Mortgage Association | | | 836,553 | |
Total Market Value of Collateral Securities | | | $8,158,776 | |
| |
| Citigroup Global Markets, Inc. (0.130%) | | | | |
| Security Description | | Value | |
Fannie Mae REMICS | | | $4,785,468 | |
Fannie Mae-Aces | | | 529,857 | |
Freddie Mac REMICS | | | 3,838,826 | |
Government National Mortgage Association | | | 1,045,849 | |
Total Market Value of Collateral Securities | | | $10,200,000 | |
| |
| Credit Suisse Securities (USA) LLC (0.160%) | | | | |
| Security Description | | Value | |
Ginnie Mae I Pool | | | $8,410,186 | |
Ginnie Mae II Pool | | | 3,572,459 | |
Total Market Value of Collateral Securities | | | $11,982,645 | |
| |
| Pershing LLC (0.290%) | | | | |
| Security Description | | Value | |
Fannie Mae Pool | | | $163,254 | |
Fannie Mae REMICS | | | 137,672 | |
Fannie Mae-Aces | | | 1,387 | |
Federal Farm Credit Bank | | | 12,336 | |
Federal Home Loan Banks | | | 13,269 | |
Federal Home Loan Mortgage Corp | | | 31,278 | |
Federal National Mortgage Association | | | 38,578 | |
Freddie Mac Gold Pool | | | 66,245 | |
Freddie Mac Non Gold Pool | | | 18,502 | |
Freddie Mac Reference REMIC | | | 4 | |
Freddie Mac REMICS | | | 128,228 | |
Ginnie Mae I Pool | | | 167,335 | |
Ginnie Mae II Pool | | | 149,191 | |
Government National Mortgage Association | | | 53,534 | |
United States Treasury Note/Bond | | | 36,919 | |
United States Treasury Strip Coupon | | | 2,268 | |
Total Market Value of Collateral Securities | | | $1,020,000 | |
Generally accepted accounting principles (GAAP) require disclosure regarding the inputs and valuation techniques used to measure fair value and any changes in valuation inputs or techniques. In addition, investments shall be disclosed by major category.
The Fund categorizes its fair value measurements according to a three-level hierarchy that maximizes the use of observable inputs and minimizes the use of unobservable inputs by prioritizing that the most observable input be used when available. Observable inputs are those that market participants would use in pricing an investment based on market data obtained from sources independent of the reporting entity. Unobservable inputs are those that reflect the Fund’s assumptions about the information market participants would use in pricing an investment. An investment’s level within the fair value hierarchy is based on the lowest level of any input that is deemed significant to the asset or liability’s fair value measurement. The input levels are not necessarily an indication of the risk or liquidity associated with investments at that level. For example, certain U.S. government securities are generally high quality and liquid, however, they are reflected as Level 2 because the inputs used to determine fair value may not always be quoted prices in an active market.
The Accompanying Notes to Financial Statements are an integral part of this statement.
12
Columbia Mid Cap Index Fund
February 29, 2012
|
Fair Value Measurements (continued) |
Fair value inputs are summarized in the three broad levels listed below:
| | Ÿ | | Level 1 – Valuations based on quoted prices for investments in active markets that the Fund has the ability to access at the measurement date (including NAV for open-end mutual funds). Valuation adjustments are not applied to Level 1 investments. |
| | Ÿ | | Level 2 – Valuations based on other significant observable inputs (including quoted prices for similar securities, interest rates, prepayment speeds, credit risks, etc.). |
| | Ÿ | | Level 3 – Valuations based on significant unobservable inputs (including the Fund’s own assumptions and judgment in determining the fair value of investments). |
Inputs that are used in determining fair value of an investment may include price information, credit data, volatility statistics, and other factors. These inputs can be either observable or unobservable. The availability of observable inputs can vary between investments, and is affected by various factors such as the type of investment, and the volume and level of activity for that investment or similar investments in the marketplace. The inputs will be considered by the Investment Manager, along with any other relevant factors in the calculation of an investment’s fair value. The Fund uses prices and inputs that are current as of the measurement date, which may include periods of market dislocations. During these periods, the availability of prices and inputs may be reduced for many investments. This condition could cause an investment to be reclassified between the various levels within the hierarchy.
Investments falling into the Level 3 category are primarily supported by quoted prices from brokers and dealers participating in the market for those investments. However, these may be classified as Level 3 investments due to lack of market transparency and corroboration to support these quoted prices. Additionally, valuation models may be used as the pricing source for any remaining investments classified as Level 3. These models rely on one or more significant unobservable inputs and/or significant assumptions by the Investment Manager. Inputs used in valuations may include, but are not limited to, financial statement analysis, capital account balances, discount rates and estimated cash flows, and comparable company data.
The following table is a summary of the inputs used to value the Fund’s investments as of February 29, 2012:
| | | | | | | | | | | | | | | | |
| | | Fair value at February 29, 2012 | |
| Description(a) | | Level 1
quoted prices in active markets for identical assets(b) | | | Level 2
other significant observable inputs | | | Level 3
significant unobservable inputs | | | Total | |
Equity Securities | | | | | | | | | | | | | | | | |
Common Stocks | | | | | | | | | | | | | | | | |
Consumer Discretionary | | | $385,365,018 | | | | $— | | | | $— | | | | $385,365,018 | |
Consumer Staples | | | 122,920,232 | | | | — | | | | — | | | | 122,920,232 | |
Energy | | | 202,563,151 | | | | — | | | | — | | | | 202,563,151 | |
Financials | | | 589,683,151 | | | | — | | | | — | | | | 589,683,151 | |
Health Care | | | 301,599,845 | | | | — | | | | — | | | | 301,599,845 | |
Industrials | | | 493,497,659 | | | | — | | | | — | | | | 493,497,659 | |
Information Technology | | | 472,688,119 | | | | — | | | | — | | | | 472,688,119 | |
Materials | | | 187,033,082 | | | | — | | | | — | | | | 187,033,082 | |
Telecommunication Services | | | 14,114,100 | | | | — | | | | — | | | | 14,114,100 | |
Utilities | | | 147,353,977 | | | | — | | | | — | | | | 147,353,977 | |
Total Equity Securities | | | 2,916,818,334 | | | | — | | | | — | | | | 2,916,818,334 | |
Other | | | | | | | | | | | | | | | | |
Money Market Funds | | | 69,812,648 | | | | — | | | | — | | | | 69,812,648 | |
Investments of Cash Collateral Received for Securities on Loan | | | — | | | | 41,746,464 | | | | — | | | | 41,746,464 | |
Total Other | | | 69,812,648 | | | | 41,746,464 | | | | — | | | | 111,559,112 | |
Investments in Securities | | | 2,986,630,982 | | | | 41,746,464 | | | | — | | | | 3,028,377,446 | |
Derivatives(c) | | | | | | | | | | | | | | | | |
Assets | | | | | | | | | | | | | | | | |
Futures Contracts | | | 6,122,069 | | | | — | | | | — | | | | 6,122,069 | |
Total | | | $2,992,753,051 | | | | $41,746,464 | | | | $— | | | | $3,034,499,515 | |
The Fund’s assets assigned to the Level 2 input category are generally valued using the market approach, in which a security’s value is determined through reference to prices and information from market transactions for similar or identical assets.
| (a) | See the Portfolio of Investments for all investment classifications not indicated in the table. |
| (b) | There were no significant transfers between Levels 1 and 2 during the period. |
| (c) | Derivative instruments are valued at unrealized appreciation (depreciation). |
The Accompanying Notes to Financial Statements are an integral part of this statement.
13
Statement of Assets and Liabilities – Columbia Mid Cap Index Fund
February 29, 2012
| | | | |
| Assets | | | | |
Investments, at value* | | | | |
Unaffiliated issuers (identified cost $2,303,435,662) | | $ | 2,916,818,334 | |
Affiliated issuers (identified cost $69,812,648) | | | 69,812,648 | |
Investment of cash collateral received for securities on loan | | | | |
Short-term securities (identified cost $1,000,000) | | | 1,000,000 | |
Repurchase agreements (identified cost $40,746,464) | | | 40,746,464 | |
Total investments (identified cost $2,414,994,774) | | | 3,028,377,446 | |
Margin deposits on futures contracts | | | 7,415,000 | |
Receivable for: | | | | |
Capital shares sold | | | 7,642,105 | |
Dividends | | | 2,676,995 | |
Interest | | | 42,902 | |
Expense reimbursement due from Investment Manager | | | 30,997 | |
Prepaid expense | | | 16,698 | |
Total assets | | | 3,046,202,143 | |
| |
| Liabilities | | | | |
Due upon return of securities on loan | | | 41,746,464 | |
Payable for: | | | | |
Investments purchased | | | 970,117 | |
Capital shares purchased | | | 14,528,814 | |
Variation margin on futures contracts | | | 508,400 | |
Investment management fees | | | 8,235 | |
Distribution and service fees | | | 3,224 | |
Transfer agent fees | | | 528,309 | |
Administration fees | | | 8,235 | |
Other expenses | | | 143,846 | |
Total liabilities | | | 58,445,644 | |
Net assets applicable to outstanding capital stock | | $ | 2,987,756,499 | |
The Accompanying Notes to Financial Statements are an integral part of this statement.
14
Statement of Assets and Liabilities (continued) – Columbia Mid Cap Index Fund
February 29, 2012
| | | | |
| Represented by | | | | |
Paid-in capital | | $ | 2,353,416,227 | |
Undistributed net investment income | | | 1,290,321 | |
Accumulated net realized gain | | | 13,545,210 | |
Unrealized appreciation (depreciation) on: | | | | |
Investments | | | 613,382,672 | |
Futures contracts | | | 6,122,069 | |
Total — representing net assets applicable to outstanding capital stock | | $ | 2,987,756,499 | |
*Value of securities on loan | | $ | 40,051,650 | |
Net assets applicable to outstanding shares | | | | |
Class A | | $ | 470,550,466 | |
Class I | | $ | 2,911 | |
Class Z | | $ | 2,517,203,122 | |
Shares outstanding | | | | |
Class A | | | 39,485,964 | |
Class I | | | 245 | |
Class Z | | | 211,930,721 | |
Net asset value per share | | | | |
Class A | | $ | 11.92 | |
Class I | | $ | 11.88 | |
Class Z | | $ | 11.88 | |
The Accompanying Notes to Financial Statements are an integral part of this statement.
15
Statement of Operations – Columbia Mid Cap Index Fund
Year ended February 29, 2012
| | | | |
| Net investment income | | | | |
Income: | | | | |
Dividends | | $ | 34,695,591 | |
Interest | | | 5,291 | |
Dividends from affiliates | | | 42,878 | |
Income from securities lending — net | | | 204,192 | |
Total income | | | 34,947,952 | |
Expenses: | | | | |
Investment management fees | | | 2,746,586 | |
Distribution and service fees — Class A | | | 935,798 | |
Transfer agent fees | | | | |
Class A | | | 700,821 | |
Class Z | | | 4,437,963 | |
Administration fees | | | 2,688,253 | |
Compensation of board members | | | 54,491 | |
Pricing and bookkeeping fees | | | 60,484 | |
Custodian fees | | | 73,202 | |
Printing and postage fees | | | 253,784 | |
Registration fees | | | 67,197 | |
Licensing fees | | | 25,390 | |
Professional fees | | | 69,043 | |
Chief compliance officer expenses | | | 348 | |
Other | | | 120,066 | |
Total expenses | | | 12,233,426 | |
Fees waived or expenses reimbursed by Investment Manager and its affiliates | | | (5,810,057 | ) |
Expense reductions | | | (617 | ) |
Total net expenses | | | 6,422,752 | |
Net investment income | | | 28,525,200 | |
| |
| Realized and unrealized gain (loss) — net | | | | |
Net realized gain (loss) on: | | | | |
Investments | | | 101,704,535 | |
Futures contracts | | | (3,343,763 | ) |
Net realized gain | | | 98,360,772 | |
Net change in unrealized appreciation (depreciation) on: | | | | |
Investments | | | (61,326,122 | ) |
Futures contracts | | | 4,042,096 | |
Net change in unrealized depreciation | | | (57,284,026 | ) |
Net realized and unrealized gain | | | 41,076,746 | |
Net increase in net assets resulting from operations | | $ | 69,601,946 | |
The Accompanying Notes to Financial Statements are an integral part of this statement.
16
Statement of Changes in Net Assets – Columbia Mid Cap Index Fund
| | | | | | | | |
| | | Year ended
February 29, 2012 | | | Year ended
February 28, 2011(a) | |
| | |
| Operations | | | | | | | | |
Net investment income | | $ | 28,525,200 | | | $ | 24,037,045 | |
Net realized gain | | | 98,360,772 | | | | 110,030,452 | |
Net change in unrealized appreciation (depreciation) | | | (57,284,026 | ) | | | 530,989,694 | |
Net increase in net assets resulting from operations | | | 69,601,946 | | | | 665,057,191 | |
| | |
| Distributions to shareholders from: | | | | | | | | |
Net investment income | | | | | | | | |
Class A | | | (3,099,815 | ) | | | (2,107,030 | ) |
Class I | | | (29 | ) | | | (26 | ) |
Class Z | | | (24,665,554 | ) | | | (21,678,975 | ) |
Net realized gains | | | | | | | | |
Class A | | | (16,881,805 | ) | | | (1,223,725 | ) |
Class I | | | (129 | ) | | | (12 | ) |
Class Z | | | (108,010,412 | ) | | | (9,765,119 | ) |
Total distributions to shareholders | | | (152,657,744 | ) | | | (34,774,887 | ) |
Increase in net assets from share transactions | | | 251,630,333 | | | | 229,495,259 | |
Total increase in net assets | | | 168,574,535 | | | | 859,777,563 | |
Net assets at beginning of year | | | 2,819,181,964 | | | | 1,959,404,401 | |
Net assets at end of year | | $ | 2,987,756,499 | | | $ | 2,819,181,964 | |
Undistributed net investment income | | $ | 1,290,321 | | | $ | 901,715 | |
| (a) | Class I shares are for the period from September 27, 2010 (commencement of operations) to February 28, 2011. |
The Accompanying Notes to Financial Statements are an integral part of this statement.
17
Statement of Changes in Net Assets (continued) – Columbia Mid Cap Index Fund
| | | | | | | | | | | | | | | | |
| | | Year ended
February 29, 2012 | | | Year ended
February 28, 2011(a) | |
| | | Shares | | | Dollars ($) | | | Shares | | | Dollars ($) | |
| Capital stock activity | | | | | | | | | | | | | | | | |
Class A shares | | | | | | | | | | | | | | | | |
Subscriptions | | | 21,883,341 | | | | 252,664,365 | | | | 17,066,820 | | | | 180,579,120 | |
Distributions reinvested | | | 1,777,674 | | | | 19,595,990 | | | | 284,194 | | | | 3,250,276 | |
Redemptions | | | (11,735,101 | ) | | | (134,597,142 | ) | | | (7,622,051 | ) | | | (80,137,504 | ) |
Net increase | | | 11,925,914 | | | | 137,663,213 | | | | 9,728,963 | | | | 103,691,892 | |
Class I shares | | | | | | | | | | | | | | | | |
Subscriptions | | | — | | | | — | | | | 245 | | | | 2,500 | |
Net increase | | | — | | | | — | | | | 245 | | | | 2,500 | |
Class Z shares | | | | | | | | | | | | | | | | |
Subscriptions | | | 48,336,594 | | | | 546,829,833 | | | | 47,413,396 | | | | 499,135,492 | |
Distributions reinvested | | | 8,311,846 | | | | 91,427,308 | | | | 1,768,997 | | | | 20,094,343 | |
Redemptions | | | (46,467,848 | ) | | | (524,290,021 | ) | | | (37,856,190 | ) | | | (393,428,968 | ) |
Net increase | | | 10,180,592 | | | | 113,967,120 | | | | 11,326,203 | | | | 125,800,867 | |
Total net increase | | | 22,106,506 | | | | 251,630,333 | | | | 21,055,411 | | | | 229,495,259 | |
| (a) | Class I Shares are for the period from September 27, 2010 (commencement of operations) to February 28, 2011. |
The Accompanying Notes to Financial Statements are an integral part of this statement.
18
Financial Highlights – Columbia Mid Cap Index Fund
The following tables are intended to help you understand the Fund’s financial performance. Certain information reflects financial results for a single share of a class held for the periods shown. Per share net investment income (loss) amounts are calculated based on average shares outstanding during the period. Total returns assume reinvestment of all dividends and distributions. Total returns do not reflect payment of sales charges, if any, and are not annualized for periods of less than one year.
| | | | | | | | | | | | | | | | | | | | |
| | | Year ended
Feb. 29, 2012 | | | Year ended Feb. 28, | | | Year ended
Feb. 29, 2008 | |
| | | | 2011 | | | 2010 | | | 2009 | | |
| Class A | | | | | | | | | | | | | | | |
| Per share data | | | | | | | | | | | | | | | | | | | | |
Net asset value, beginning of period | | | $12.33 | | | | $9.44 | | | | $5.73 | | | | $10.86 | | | | $12.61 | |
Income from investment operations: | | | | | | | | | | | | | | | | | | | | |
Net investment income | | | 0.10 | | | | 0.09 | | | | 0.09 | | | | 0.12 | | | | 0.14 | |
Net realized and unrealized gain (loss) | | | 0.10 | | | | 2.94 | | | | 3.71 | | | | (4.55 | ) | | | (0.64 | ) |
Total from investment operations | | | 0.20 | | | | 3.03 | | | | 3.80 | | | | (4.43 | ) | | | (0.50 | ) |
Less distributions to shareholders from: | | | | | | | | | | | | | | | | | | | | |
Net investment income | | | (0.09 | ) | | | (0.09 | ) | | | (0.09 | ) | | | (0.14 | ) | | | (0.12 | ) |
Net realized gains | | | (0.52 | ) | | | (0.05 | ) | | | — | | | | (0.56 | ) | | | (1.13 | ) |
Total distributions to shareholders | | | (0.61 | ) | | | (0.14 | ) | | | (0.09 | ) | | | (0.70 | ) | | | (1.25 | ) |
Net asset value, end of period | | | $11.92 | | | | $12.33 | | | | $9.44 | | | | $5.73 | | | | $10.86 | |
| Total return | | | 2.12% | | | | 32.16% | | | | 66.35% | | | | (42.11% | ) | | | (4.94% | ) |
| Ratios to average net assets(a) | | | | | | | | | | | | | | | | | | | | |
Expenses prior to fees waived or expenses reimbursed (including interest expense) | | | 0.66% | | | | 0.50% | | | | 0.49% | | | | 0.49% | (b) | | | 0.47% | |
Net expenses after fees waived or expenses reimbursed (including interest expense)(c) | | | 0.45% | (d) | | | 0.45% | (d) | | | 0.43% | (d) | | | 0.39% | (b)(d) | | | 0.39% | (d) |
Expenses prior to fees waived or expenses reimbursed (excluding interest expense) | | | 0.66% | | | | 0.50% | | | | 0.49% | | | | 0.49% | | | | 0.47% | |
Net expenses after fees waived or expenses reimbursed (excluding interest expense)(c) | | | 0.45% | (d) | | | 0.45% | (d) | | | 0.43% | (d) | | | 0.39% | (d) | | | 0.39% | (d) |
Net investment income | | | 0.83% | (d) | | | 0.83% | (d) | | | 1.10% | (d) | | | 1.36% | (d) | | | 1.13% | (d) |
| Supplemental data | | | | | | | | | | | | | | | | | | | | |
Net assets, end of period (in thousands) | | | $470,550 | | | | $339,724 | | | | $168,264 | | | | $59,374 | | | | $72,095 | |
Portfolio turnover | | | 15% | | | | 10% | | | | 15% | | | | 28% | | | | 26% | |
Notes to Financial Highlights
| (a) | In addition to the fees and expenses which the Fund bears directly, the Fund indirectly bears a pro rata share of the fees and expenses of the acquired funds in which it invests. Such indirect expenses are not included in the reported expense ratios. |
| (b) | Includes interest expense which rounds to less than 0.01%. |
| (c) | The Investment Manager and certain of its affiliates agreed to waive/reimburse certain fees and expenses, if applicable. |
| (d) | The benefits derived from expense reductions had an impact of less than 0.01%. |
The Accompanying Notes to Financial Statements are an integral part of this statement.
19
Financial Highlights (continued) – Columbia Mid Cap Index Fund
| | | | | | | | |
| | | Year ended
Feb. 29, 2012 | | | Year ended
Feb. 28, 2011(a) | |
| Class I | | | | | | |
| Per share data | | | | | | | | |
Net asset value, beginning of period | | | $12.29 | | | | $10.19 | |
Income from investment operations: | | | | | | | | |
Net investment income | | | 0.12 | | | | 0.04 | |
Net realized and unrealized gain | | | 0.11 | | | | 2.22 | |
Total from investment operations | | | 0.23 | | | | 2.26 | |
Less distributions to shareholders from: | | | | | | | | |
Net investment income | | | (0.12 | ) | | | (0.11 | ) |
Net realized gains | | | (0.52 | ) | | | (0.05 | ) |
Total distributions to shareholders | | | (0.64 | ) | | | (0.16 | ) |
Net asset value, end of period | | | $11.88 | | | | $12.29 | |
| Total return | | | 2.40% | | | | 22.27% | |
| Ratios to average net assets(b) | | | | | | | | |
Expenses prior to fees waived or expenses reimbursed (including interest expense) | | | 0.20% | | | | 0.23% | (c) |
Net expenses after fees waived or expenses reimbursed (including interest expense)(d) | | | 0.19% | | | | 0.19% | (c)(e) |
Expenses prior to fees waived or expenses reimbursed (excluding interest expense) | | | 0.20% | | | | 0.23% | (c) |
Net expenses after fees waived or expenses reimbursed (excluding interest expense)(d) | | | 0.19% | | | | 0.19% | (c)(e) |
Net investment income | | | 1.08% | | | | 0.92% | (c)(e) |
| Supplemental data | | | | | | | | |
Net assets, end of period (in thousands) | | | $3 | | | | $3 | |
Portfolio turnover | | | 15% | | | | 10% | |
Notes to Financial Highlights
| (a) | For the period from September 27, 2010 (commencement of operations) to February 28, 2011. |
| (b) | In addition to the fees and expenses which the Fund bears directly, the Fund indirectly bears a pro rata share of the fees and expenses of the acquired funds in which it invests. Such indirect expenses are not included in the reported expense ratios. |
| (d) | The Investment Manager and certain of its affiliates agreed to waive/reimburse certain fees and expenses, if applicable. |
| (e) | The benefits derived from expense reductions had an impact of less than 0.01%. |
The Accompanying Notes to Financial Statements are an integral part of this statement.
20
Financial Highlights (continued) – Columbia Mid Cap Index Fund
| | | | | | | | | | | | | | | | | | | | |
| | | Year ended
Feb. 29, 2012 | | | Year ended Feb. 28, | | | Year ended
Feb. 29, 2008 | |
| Class Z | | | 2011 | | | 2010 | | | 2009 | | |
| Per share data | | | | | | | | | | | | | | | | | | | | |
Net asset value, beginning of period | | | $12.29 | | | | $9.41 | | | | $5.71 | | | | $10.84 | | | | $12.61 | |
Income from investment operations: | | | | | | | | | | | | | | | | | | | | |
Net investment income | | | 0.12 | | | | 0.11 | | | | 0.11 | | | | 0.15 | | | | 0.17 | |
Net realized and unrealized gain (loss) | | | 0.11 | | | | 2.93 | | | | 3.69 | | | | (4.55 | ) | | | (0.64 | ) |
Total from investment operations | | | 0.23 | | | | 3.04 | | | | 3.80 | | | | (4.40 | ) | | | (0.47 | ) |
Less distributions to shareholders from: | | | | | | | | | | | | | | | | | | | | |
Net investment income | | | (0.12 | ) | | | (0.11 | ) | | | (0.10 | ) | | | (0.17 | ) | | | (0.17 | ) |
Net realized gains | | | (0.52 | ) | | | (0.05 | ) | | | — | | | | (0.56 | ) | | | (1.13 | ) |
Total distributions to shareholders | | | (0.64 | ) | | | (0.16 | ) | | | (0.10 | ) | | | (0.73 | ) | | | (1.30 | ) |
Net asset value, end of period | | | $11.88 | | | | $12.29 | | | | $9.41 | | | | $5.71 | | | | $10.84 | |
| Total return | | | 2.39% | | | | 32.45% | | | | 66.71% | | | | (41.92% | ) | | | (4.75% | ) |
| Ratios to average net assets(a) | | | | | | | | | | | | | | | | | | | | |
Expenses prior to fees waived or expenses reimbursed (including interest expense) | | | 0.41% | | | | 0.25% | | | | 0.24% | | | | 0.24% | (b) | | | 0.22% | |
Net expenses after fees waived or expenses reimbursed (including interest expense)(c) | | | 0.20% | (d) | | | 0.20% | (d) | | | 0.18% | (d) | | | 0.14% | (b)(d) | | | 0.14% | (d) |
Expenses prior to fees waived or expenses reimbursed (excluding interest expense) | | | 0.41% | | | | 0.25% | | | | 0.24% | | | | 0.24% | | | | 0.22% | |
Net expenses after fees waived or expenses reimbursed (excluding interest expense)(c) | | | 0.20% | (d) | | | 0.20% | (d) | | | 0.18% | (d) | | | 0.14% | (d) | | | 0.14% | (d) |
Net investment income | | | 1.07% | (d) | | | 1.08% | (d) | | | 1.36% | (d) | | | 1.59% | (d) | | | 1.38% | (d) |
| Supplemental data | | | | | | | | | | | | | | | | | | | | |
Net assets, end of period (in thousands) | | | $2,517,203 | | | | $2,479,455 | | | | $1,791,140 | | | | $971,538 | | | | $1,875,184 | |
Portfolio turnover | | | 15% | | | | 10% | | | | 15% | | | | 28% | | | | 26% | |
Notes to Financial Highlights
| (a) | In addition to the fees and expenses which the Fund bears directly, the Fund indirectly bears a pro rata share of the fees and expenses of the acquired funds in which it invests. Such indirect expenses are not included in the reported expense ratios. |
| (b) | Includes interest expense which rounds to less than 0.01%. |
| (c) | The Investment Manager and certain of its affiliates agreed to waive/reimburse certain fees and expenses, if applicable. |
| (d) | The benefits derived from expense reductions had an impact of less than 0.01%. |
The Accompanying Notes to Financial Statements are an integral part of this statement.
21
Notes to Financial Statements – Columbia Mid Cap Index Fund
February 29, 2012
Note 1. Organization
Columbia Mid Cap Index Fund (the Fund), a series of Columbia Funds Series Trust (the Trust), is a diversified fund. The Trust is registered under the Investment Company Act of 1940, as amended (the 1940 Act), as an open-end management investment company organized as a Delaware statutory trust.
Fund Shares
The Trust may issue an unlimited number of shares (without par value). The Fund offers Class A, Class I and Class Z shares. All share classes have identical voting, dividend and liquidation rights. Each share class has its own expense structure and sales charges, as applicable.
Class A shares have no sales charge.
Class I shares are not subject to sales charges and are only available to the Columbia Family of Funds.
Class Z shares are not subject to sales charges, and are only available to certain investors, as described in the Fund’s prospectus.
Note 2. Summary of Significant Accounting Policies
Use of Estimates
The preparation of financial statements in accordance with U.S. generally accepted accounting principles (GAAP) requires management to make certain estimates and assumptions that affect the reported amounts of assets and liabilities, the disclosure of contingent assets and liabilities at the date of the financial statements and the reported amounts of revenue and expenses during the reporting period. Actual results could differ from those estimates.
The following is a summary of significant accounting policies consistently followed by the Fund in the preparation of its financial statements.
Security Valuation
All equity securities are valued at the close of business of the New York Stock Exchange (NYSE). Equity securities are valued at the last quoted sales price on the principal exchange or market on which they trade, except for securities traded on the NASDAQ Stock Market, which are valued at the NASDAQ official close price. Unlisted securities or listed securities for which there were no sales during the day are valued at the mean of the latest quoted bid and asked prices on such exchanges or markets.
Foreign securities are valued based on quotations from the principal market in which such securities are normally traded. If any foreign share prices are not readily available as a result of limited share activity the securities are valued at the mean of the latest quoted bid and asked prices on such exchanges or markets. Foreign currency exchange rates are generally determined at 4:00 p.m. Eastern (U.S.) time. However, many securities markets and exchanges outside the U.S. close prior to the close of the NYSE; therefore, the closing prices for securities in such markets or on such exchanges may not fully reflect events that occur after such close but before the close of the NYSE. In those situations, foreign securities will be fair valued pursuant to the policy adopted by the Board of Trustees (the Board), including utilizing a third party pricing service to determine these fair values. The third party pricing service takes into account multiple factors, including, but not limited to, movements in the U.S. securities markets, certain depositary receipts, futures contracts and foreign exchange rates that have occurred subsequent to the close of the foreign exchange, to determine a good faith estimate that reasonably reflects the current market conditions as of the close of the NYSE. The fair value of a security is likely to be different from the quoted or published price, if available.
Investments in other open-end investment companies, including money market funds, are valued at net asset value.
Short-term securities purchased within 60 days to maturity are valued at amortized cost, which approximates market value. The value of short-term securities originally purchased with maturities greater than 60 days is determined based on an amortized value to par upon reaching 60 days to maturity. Short-term securities maturing in more than 60 days from the valuation date are valued at the market price or approximate market value based on current interest rates.
Futures and options on futures contracts are valued based upon the settlement price established each day by the board of trade or exchange on which they are traded.
Investments for which market quotations are not readily available, or that have quotations which management believes are not reliable, are valued at fair value as determined in good faith under consistently applied procedures established by and under the general supervision of the Board. If a security or class of securities (such as foreign securities) is valued at fair value, such value is likely to be different from the last quoted market price for the security. The determination of fair value often requires significant judgment. To determine fair value, management may use assumptions including but not limited to future cash flows and estimated risk premiums. Multiple inputs from various sources may be used to determine value.
22
Columbia Mid Cap Index Fund
February 29, 2012
Derivative Instruments
The Fund invests in certain derivative instruments as detailed below to meet its investment objectives. Derivatives are instruments whose values depend on, or are derived from, in whole or in part, the value of one or more other assets, such as securities, currencies, commodities or indices. Derivative instruments may be used to maintain cash reserves while maintaining exposure to certain other assets, to offset anticipated declines in values of investments, to facilitate trading, to reduce transaction costs and to pursue higher investment returns. The Fund may also use derivative instruments to mitigate certain investment risks, such as foreign currency exchange rate risk, interest rate risk and credit risk. Derivatives may involve various risks, including the potential inability of the counterparty to fulfill its obligation under the terms of the contract, the potential for an illiquid secondary market and the potential for market movements which may expose the Fund to gains or losses in excess of the amount shown in the Statement of Assets and Liabilities.
The Fund and any counterparty are required to maintain an agreement that requires the Fund and that counterparty to monitor (on a daily basis) the net fair value of all derivatives entered into pursuant to the agreement between the Fund and such counterparty. If the net fair value of such derivatives between the Fund and that counterparty exceeds a certain threshold (as defined in the agreement), the Fund or the counterparty (as the case may be) is required to post cash and/or securities as collateral. Fair values of derivatives presented in the financial statements are not netted with the fair value of other derivatives or with any collateral amounts posted by the Fund or any counterparty.
Futures Contracts
Futures contracts represent commitments for the future purchase or sale of an asset at a specified price on a specified date. The Fund bought and sold futures contracts to maintain appropriate equity market exposure while keeping sufficient cash to accommodate daily redemptions. Upon entering into futures contracts, the Fund bears risks which may include interest rates, exchange rates or securities prices moving unexpectedly, in which case, the Fund may not achieve the anticipated benefits of the futures contracts and may realize a loss. Additional risks include counterparty credit risk, the possibility of an illiquid market, and that a change in the value of the contract or option may not correlate with changes in the value of the underlying asset.
Upon entering into a futures contract, the Fund pledges cash or securities with the broker in an amount sufficient to meet the initial margin requirement. Subsequent payments (variation margin) are made or received by the Fund each day. The variation margin
payments are equal to the daily change in the contract value and are recorded as variation margin receivable or payable and are offset in unrealized gains or losses. The Fund recognizes a realized gain or loss when the contract is closed or expires. Futures contracts involve, to varying degrees, risk of loss in excess of the variation margin disclosed in the Statement of Assets and Liabilities.
Effects of Derivative Transactions in the Financial Statements
The following tables are intended to provide additional information about the effect of derivatives on the financial statements of the Fund, including: the fair value of derivatives by risk category and the location of those fair values in the Statement of Assets and Liabilities; the impact of derivative transactions on the Fund’s operations over the period including realized gains or losses and unrealized gains or losses. The derivative schedules following the Portfolio of Investments present additional information regarding derivative instruments outstanding at the end of the period, if any.
| | | | | | | | |
Fair Values of Derivative Instruments at
February 29, 2012 |
| | | Asset derivatives | | Liability derivatives |
Risk
Exposure
Category | | Statement of
Assets and
Liabilities
Location | | Fair
Value | | Statement of
Assets and
Liabilities
Location | | Fair
Value |
Equity
contracts | | Net assets —
unrealized
appreciation
on futures
contracts | | $6,122,069* | | Net assets —
unrealized
depreciation
on futures
contracts | | $—* |
| * | Includes cumulative appreciation (depreciation) of futures contracts as reported in the Futures Contracts Outstanding table following the Portfolio of Investments. Only the current day’s variation margin is reported in receivables or payables in the Statement of Assets and Liabilities. |
| | | | |
Effect of Derivative Instruments in the Statement of
Operations for the Year Ended February 29, 2012 | |
| | | Amount of Realized Gain (Loss)
on Derivatives Recognized in
Income | |
| Risk Exposure Category | | Futures Contracts | |
| Equity contracts | | $ | (3,343,763 | ) |
| | | | |
| | |
| | | Change in Unrealized Appreciation
(Depreciation) on Derivatives
Recognized in Income | |
| Risk Exposure Category | | Futures Contracts | |
| Equity contracts | | $ | 4,042,096 | |
23
Columbia Mid Cap Index Fund
February 29, 2012
| | |
Volume of Derivative Instruments
for the Year Ended February 29, 2012 |
| | | Contracts
Opened |
| Futures Contracts | | 7,691 |
Repurchase Agreements
The Fund may engage in repurchase agreement transactions with institutions that management has determined are creditworthy. The Fund, through the custodian, receives delivery of the underlying securities collateralizing a repurchase agreement. Management is responsible for determining that the collateral is at least equal, at all times, to the value of the repurchase obligation including interest. A repurchase agreement transaction involves certain risks in the event of default or insolvency of the counterparty. These risks include possible delays in or restrictions on a Fund’s ability to dispose of the underlying securities and a possible decline in the value of the underlying securities during the period while the Fund seeks to assert its rights.
Security Transactions
Security transactions are accounted for on the trade date. Cost is determined and gains (losses) are based upon the specific identification method for both financial statement and federal income tax purposes.
Income Recognition
Corporate actions and dividend income are recorded net of any non-reclaimable tax withholdings, on the ex-dividend date or upon receipt of ex-dividend notification in the case of certain foreign securities.
Interest income is recorded on the accrual basis.
The Fund receives distributions from holdings in real estate investment trusts (REITs) which report information on the character of their distributions annually. REIT distributions are allocated to dividend income, capital gain and return of capital based on estimates made by the Fund’s management if actual information has not yet been reported. Return of capital is recorded as a reduction of the cost basis of securities held. Management’s estimates are subsequently adjusted when the actual character of the distributions is disclosed by the REITs which could result in a proportionate increase in return of capital to shareholders.
Awards from class action litigation are recorded as a reduction of cost basis if the Fund still owns the applicable securities on the
payment date. If the Fund no longer owns the applicable securities, the proceeds are recorded as realized gains.
Expenses
General expenses of the Trust are allocated to the Fund and other funds of the Trust based upon relative net assets or other expense allocation methodologies determined by the nature of the expense. Expenses directly attributable to the Fund are charged to the Fund. Expenses directly attributable to a specific class of shares are charged to that share class.
Determination of Class Net Asset Value
All income, expenses (other than class-specific expenses, which are charged to that share class, as shown in the Statement of Operations) and realized and unrealized gains (losses) are allocated to each class of the Fund on a daily basis, based on the relative net assets of each class, for purposes of determining the net asset value of each class.
Federal Income Tax Status
The Fund intends to qualify each year as a regulated investment company under Subchapter M of the Internal Revenue Code, as amended, and will distribute substantially all of its taxable income (including net short-term capital gains), if any, for its tax year, and as such will not be subject to federal income taxes. In addition, the Fund intends to distribute in each calendar year substantially all of its net investment income, capital gains and certain other amounts, if any, such that the Fund should not be subject to federal excise tax. Therefore, no federal income or excise tax provision is recorded.
Distributions to Shareholders
Distributions from net investment income, if any, are declared and paid semi-annually. Net realized capital gains, if any, are distributed along with the income dividend. Income distributions and capital gain distributions are determined in accordance with federal income tax regulations which may differ from GAAP.
Guarantees and Indemnifications
Under the Trust’s organizational documents and, in some cases, by contract, its officers and trustees are indemnified against certain liabilities arising out of the performance of their duties to the Trust or its funds. In addition, certain of the Fund’s contracts with its service providers contain general indemnification clauses. The Fund’s maximum exposure under these arrangements is unknown since the amount of any future claims that may be made against the Fund cannot be determined, and the Fund has no historical basis for predicting the likelihood of any such claims.
24
Columbia Mid Cap Index Fund
February 29, 2012
Recent Accounting Pronouncement
Fair Value Measurements and Disclosures
In May 2011, the Financial Accounting and Standards Board (FASB) issued ASU No. 2011-04 modifying Topic 820, Fair Value Measurements and Disclosures. At the same time, the International Accounting Standards Board (IASB) issued International Financial Reporting Standard 13, Fair Value Measurement. The objective of the FASB and IASB is convergence of their guidance on fair value measurements and disclosures.
Specifically, ASU No. 2011-04 requires reporting entities to disclose i) the amounts of any transfers between Level 1 and Level 2, and the reasons for the transfers, ii) for Level 3 fair value measurements, a) quantitative information about significant unobservable inputs used, b) a description of the valuation processes used by the reporting entity and c) a narrative description of the sensitivity of the fair value measurement to changes in unobservable inputs if a change in those inputs might result in a significantly higher or lower fair value measurement. The effective date of ASU No. 2011-04 is for interim and annual periods beginning after December 15, 2011. At this time, management is evaluating the implications of this guidance and the impact it will have on the financial statement amounts and footnote disclosures, if any.
Note 3. Fees and Compensation Paid to Affiliates
Investment Management Fees
Under an Investment Management Services Agreement, Columbia Management Investment Advisers, LLC (the Investment Manager), a wholly-owned subsidiary of Ameriprise Financial, Inc. (Ameriprise Financial), determines which securities will be purchased, held or sold. The management fee is an annual fee that is equal to 0.10% of the Fund’s average daily net assets.
Administration Fees
Under an Administrative Services Agreement, the Investment Manager serves as the Fund Administrator. The Fund pays the Fund Administrator an annual fee for administration and accounting services equal to 0.10% of the Fund’s average daily net assets, less the fees that were payable by the Fund as described under the Pricing and Bookkeeping Fees note below.
Pricing and Bookkeeping Fees
Prior to July 25, 2011, the Fund had entered into a Financial Reporting Services Agreement (the Financial Reporting Services
Agreement) with State Street Bank and Trust Company (State Street) and the Investment Manager pursuant to which State Street provided financial reporting services to the Fund. The Fund also entered into an Accounting Services Agreement (collectively with the Financial Reporting Services Agreement, the State Street Agreements) with State Street and the Investment Manager pursuant to which State Street provided accounting services to the Fund. Under the State Street Agreements, the Fund paid State Street an annual fee of $38,000 paid monthly plus an additional monthly fee based on an annualized percentage rate of average daily net assets of the Fund for the month. The aggregate fee did not exceed $140,000 per year (exclusive of out-of-pocket expenses and charges). The Fund also reimbursed State Street for certain out-of-pocket expenses and charges. Effective July 25, 2011, these services are provided under the Administrative Services Agreement discussed above.
Other Fees
Effective June 1, 2011, other expenses are for, among other things, certain expenses of the Fund or the Board, including: Fund boardroom and office expense, employee compensation, employee health and retirement benefits, and certain other expenses. Payment of these Fund and Board expenses is facilitated by a company providing limited administrative services to the Fund and the Board. For the period June 1, 2011 through February 29, 2012, other expenses paid to this company were $8,604.
Compensation of Board Members
Board members are compensated for their services to the Fund as disclosed in the Statement of Operations. Under a Deferred Compensation Plan (the Plan), the Board members who are not “interested persons” of the Fund, as defined under the 1940 Act, may elect to defer payment of up to 100% of their compensation. Deferred amounts are treated as though equivalent dollar amounts had been invested in shares of certain funds managed by the Investment Manager. The Fund’s liability for these amounts is adjusted for market value changes and remains in the Fund until distributed in accordance with the Plan.
Compensation of Chief Compliance Officer
The Board has appointed a Chief Compliance Officer to the Fund in accordance with federal securities regulations. Effective April 1, 2011, the Fund’s expenses associated with the Chief Compliance Officer are paid directly by the Investment Manager. Prior to April 1, 2011, the Fund, along with other affiliated funds, paid its pro-rata share of the expenses for the Chief Compliance Officer. Such fees did not exceed $15,000 per year.
25
Columbia Mid Cap Index Fund
February 29, 2012
Transfer Agent Fees
Under a Transfer and Dividend Disbursing Agent Agreement, Columbia Management Investment Services Corp. (the Transfer Agent), an affiliate of the Investment Manager and a wholly-owned subsidiary of Ameriprise Financial, is responsible for providing transfer agency services to the Fund. The Transfer Agent has contracted with Boston Financial Data Services (BFDS) to serve as sub-transfer agent.
The Transfer Agent receives monthly account-based service fees based on the number of open accounts and is reimbursed by the Fund for the fees and expenses the Transfer Agent pays to financial intermediaries that maintain omnibus accounts with the Fund that is a percentage of the average aggregate value of the Fund’s shares maintained in each such omnibus account (other than omnibus accounts for which American Enterprise Investment Services Inc. is the broker of record or accounts where the beneficial shareholder is a customer of Ameriprise Financial Services, Inc., which are paid a per account fee). The Transfer Agent pays the fees of BFDS for services as sub-transfer agent and is not entitled to reimbursement for such fees from the Fund (with the exception of out-of-pocket fees).
The Transfer Agent also receives compensation from fees for various shareholder services and reimbursements for certain out-of-pocket expenses. Class I shares do not pay transfer agent fees.
For the year ended February 29, 2012, the Fund’s effective transfer agent fee rates as a percentage of average daily net assets of each class were as follows:
| | | | |
| | | | |
| Class A | | | 0.19 | % |
| Class Z | | | 0.19 | |
An annual minimum account balance fee of $20 may apply to certain accounts with a value below the Fund’s initial minimum investment requirements to reduce the impact of small accounts on transfer agent fees. These minimum account balance fees are recorded as part of expense reductions in the Statement of Operations. For the year ended February 29, 2012, these minimum account balance fees reduced total expenses by $540.
Distribution and Service Fees
The Fund has an agreement with Columbia Management Investment Distributors, Inc. (the Distributor), an affiliate of the Investment Manager and a wholly-owned subsidiary of Ameriprise Financial, for distribution and shareholder services. Pursuant to Rule 12b-1
under the 1940 Act, the Board has approved, and the Fund has adopted, distribution and shareholder service plans (the Plans) which set the distribution and service fees for the Fund. These fees are calculated daily and are intended to compensate the Distributor and/or eligible selling and/or servicing agents for selling shares of the Fund and providing services to investors.
The Plans require the payment of a monthly combined distribution and service fee to the Distributor at the maximum annual rate of 0.25% of the average daily net assets attributable to Class A shares of the Fund.
Expenses Waived/Reimbursed by the Investment Manager and its Affiliates
Effective July 1, 2011, the Investment Manager and certain of its affiliates have contractually agreed to waive fees and/or reimburse expenses (excluding certain fees and expenses described below), through June 30, 2012, unless sooner terminated at the sole discretion of the Board, so that the Fund’s net operating expenses, after giving effect to fees waived/expenses reimbursed and any balance credits and/or overdraft charges from the Fund’s custodian, do not exceed the following annual rates as a percentage of the class’ average daily net assets:
| | | | |
| | | | |
| Class A | | | 0.45 | % |
| Class I | | | 0.19 | |
| Class Z | | | 0.20 | |
Under the agreement, the following fees and expenses are excluded from the waiver/reimbursement commitment, and therefore will be paid by the Fund, if applicable: taxes (including foreign transaction taxes), expenses associated with investments in affiliated and non-affiliated pooled investment vehicles (including mutual funds and exchange traded funds), transaction costs and brokerage commissions, costs related to any securities lending program, dividend expenses associated with securities sold short, inverse floater program fees and expenses, transaction charges and interest on borrowed money, interest, extraordinary expenses and any other expenses the exclusion of which is specifically approved by the Board. This agreement may be modified or amended only with approval from all parties.
Prior to July 1, 2011, the Investment Manager voluntarily agreed to reimburse a portion of the Fund’s expenses (excluding certain expenses, such as brokerage commissions, interest, taxes and extraordinary expenses, but including custodian charges relating to
26
Columbia Mid Cap Index Fund
February 29, 2012
overdrafts, if any) so that the Fund’s ordinary net operating expenses, after giving effect to fees waived/expenses reimbursed and any balance credits and/or overdraft charges from the Fund’s custodian, did not exceed the following annual rates as a percentage of the class’ average daily net assets:
| | | | |
| | | | |
| Class A | | | 0.45 | % |
| Class I | | | 0.19 | |
| Class Z | | | 0.20 | |
Note 4. Federal Tax Information
The timing and character of income and capital gain distributions are determined in accordance with income tax regulations, which may differ from GAAP because of temporary or permanent book to tax differences.
For the year ended February 29, 2012, these differences are primarily due to differing treatment for distribution reclassifications, redemption-based payments treated as eligible for the dividends paid deduction, futures contracts, and deferral/reversal of wash sale losses. To the extent these differences are permanent; reclassifications are made among the components of the Fund’s net assets in the Statement of Assets and Liabilities. Temporary differences do not require reclassifications. In the Statement of Assets and Liabilities the following reclassifications were made:
| | | | |
| | | | |
| Undistributed net investment income | | $ | (371,196 | ) |
| Accumulated net realized gain | | | (7,040,063 | ) |
| Paid-in capital | | | 7,411,259 | |
Net investment income and net realized gains (losses), as disclosed in the Statement of Operations, and net assets were not affected by this reclassification.
The tax character of distributions paid during the years indicated was as follows:
| | | | | | | | |
| | | Year ended
February 29,
2012 | | | Year ended
February 28,
2011 | |
| Ordinary income | | $ | 36,747,997 | | | $ | 23,786,031 | |
| Long-term capital gains | | | 115,909,747 | | | | 10,988,856 | |
Short-term capital gain distributions, if any, are considered ordinary income distributions for tax purposes.
At February 29, 2012, the components of distributable earnings on a tax basis were as follows:
| | | | |
| | | | |
| Undistributed ordinary income | | $ | 1,346,378 | |
| Undistributed long-term capital gains | | | 36,952,014 | |
| Unrealized appreciation | | | 596,097,937 | |
At February 29, 2012, the cost of investments for federal income tax purposes was $2,432,279,509 and the aggregate gross unrealized appreciation and depreciation based on that cost was:
| | | | |
| | | | |
| Unrealized appreciation | | $ | 799,931,009 | |
| Unrealized depreciation | | $ | (203,833,072 | ) |
| | | | |
| Net unrealized appreciation | | $ | 596,097,937 | |
On December 22, 2010, the Regulated Investment Company Modernization Act of 2010 (the Act) was enacted, which changed various technical rules governing the tax treatment of regulated investment companies. The changes are generally effective for taxable years beginning after the date of enactment. Under the Act, the Fund will be permitted to carry forward capital losses incurred in taxable years beginning after the date of enactment for an unlimited period. However, any losses incurred during those future taxable years will be required to be utilized prior to the losses incurred in pre-enactment taxable years, which carry an expiration date. As a result of this ordering rule, pre-enactment capital loss carryforwards may be more likely to expire unused.
Management of the Fund has concluded that there are no significant uncertain tax positions that would require recognition in the financial statements. However, management’s conclusion may be subject to review and adjustment at a later date based on factors including, but not limited to, new tax laws, regulations, and administrative interpretations (including relevant court decisions). Generally, the Fund’s federal tax returns for the prior three fiscal years remain subject to examination by the Internal Revenue Service.
Note 5. Portfolio Information
The cost of purchases and proceeds from sales of securities, excluding short-term obligations, aggregated to $551,133,354 and $396,911,835, respectively, for the year ended February 29, 2012.
Note 6. Lending of Portfolio Securities
Effective July 25, 2011, the Fund has entered into a Master Securities Lending Agreement (the Agreement) with JPMorgan
27
Columbia Mid Cap Index Fund
February 29, 2012
Chase Bank, N.A. (JPMorgan). The Agreement, which replaces the previous security lending arrangement with State Street, authorizes JPMorgan as lending agent to lend securities to authorized borrowers in order to generate additional income on behalf of the Fund. Pursuant to the Agreement, the securities loaned are secured by cash or U.S. government securities equal to at least 100% of the market value of the loaned securities. Any additional collateral required to maintain those levels due to market fluctuations of the loaned securities is requested to be delivered the following business day. Cash collateral received is invested by the lending agent on behalf of the Fund into authorized investments pursuant to the Agreement. The investments made with the cash collateral are listed in the Portfolio of Investments. The values of such investments and any uninvested cash collateral are disclosed in the Statement of Assets and Liabilities along with the related obligation to return the collateral upon the return of the securities loaned. At February 29, 2012, securities valued at $40,051,650 were on loan, secured by cash collateral of $41,746,464 (which does not reflect calls for collateral made to borrowers by JPMorgan at period end) that is partially or fully invested in short-term securities or other cash equivalents.
Risks of delay in recovery of securities or even loss of rights in the securities may occur should the borrower of the securities fail financially. Risks may also arise to the extent that the value of the securities loaned increases above the value of the collateral received. JPMorgan will indemnify the Fund from losses resulting from a borrower’s failure to return a loaned security when due. Such indemnification does not extend to losses associated with declines in the value of cash collateral investments. The Investment Manager is not responsible for any losses incurred by the Fund in connection with the securities lending program. Loans are subject to termination by the Fund or the borrower at any time, and are, therefore, not considered to be illiquid investments.
Pursuant to the Agreement, the Fund receives income for lending its securities either in the form of fees or by earning interest on invested cash collateral, net of negotiated rebates paid to borrowers and fees paid to the lending agent for services provided and any other securities lending expenses. Net income earned from securities lending for the year ended February 29, 2012 is disclosed in the Statement of Operations. The Fund continues to earn and accrue interest and dividends on the securities loaned.
Prior to July 25, 2011, the Fund participated in a securities lending arrangement with State Street. Each security on loan was collateralized in an amount at least equal to the market value of the securities loaned plus accrued income from the investment of
collateral. The income generated by the investment of the collateral, net of any fees remitted to State Street as the lending agent and borrower rebates, was paid to the Fund.
Note 7. Custody Credits
Prior to July 25, 2011, the Fund had an agreement with its custodian bank under which custody fees may have been reduced by balance credits. These credits are recorded as part of expense reductions on the Statement of Operations. The Fund could have invested a portion of the assets utilized in connection with the expense offset arrangement in an income-producing asset if they had not entered into such an agreement. Subsequent to this date, the Fund may invest its daily balance in an affiliated money market fund as detailed below. For the period March 1, 2011 through July 24, 2011, these credits reduced total expenses by $77.
Note 8. Affiliated Money Market Fund
Effective July 25, 2011, the Fund may invest its daily cash balances in Columbia Short-Term Cash Fund, an affiliated money market fund established for the exclusive use by the Fund and other affiliated funds. The income earned by the Fund from such investments is included as “Dividends from affiliates” in the Statement of Operations. As an investing fund, the Fund indirectly bears its proportionate share of the expenses of Columbia Short-Term Cash Fund.
Note 9. Shareholder Concentration
At February 29, 2012, two unaffiliated shareholder accounts owned an aggregate of 51.9% of the outstanding shares of the Fund. The Fund has no knowledge about whether any portion of those shares was owned beneficially by such accounts. Subscription and redemption activity by concentrated accounts of these accounts may have a significant effect on the operations of the Fund.
Note 10. Line of Credit
The Fund has entered into a revolving credit facility with a syndicate of banks led by JPMorgan Chase Bank, N.A. (the Administrative Agent), whereby the Fund may borrow for the temporary funding of shareholder redemptions or for other temporary or emergency purposes. The credit facility became effective on July 25, 2011, replacing a prior credit facility. The credit facility agreement, as amended, which is a collective agreement between the Fund and certain other funds managed by the Investment Manager, severally and not jointly, permits collective borrowings up to $500 million. Pursuant to a December 13, 2011 amendment to the credit facility agreement, interest is charged to each participating fund based on its
28
Columbia Mid Cap Index Fund
February 29, 2012
borrowings at a rate equal to the higher of (i) the overnight federal funds rate plus 1.00% or (i) the one-month LIBOR rate plus 1.00%. Each borrowing under the credit facility matures no later than 60 days after the date of borrowing. The Fund also pays a commitment fee equal to its pro rata share of the amount of the credit facility at a rate of 0.08% per annum. For the period July 25, 2011 through December 13, 2011, interest was charged to each participating fund based on its borrowings at a rate equal to the sum of the federal funds rate plus (i) 1.25% per annum plus (ii) if one-month LIBOR exceeds the federal funds rate, the amount of such excess. The Fund also paid a commitment fee equal to its pro rata share of the amount of the credit facility at a rate of 0.10% per annum.
For the period June 27, 2011 through July 24, 2011, the Fund and certain other funds managed by the Investment Manager participated in a $100 million committed, unsecured revolving credit facility provided by State Street. For the period May 16, 2011 through June 26, 2011, the collective borrowing amount of the credit facility was $150 million committed, unsecured revolving credit facility provided by State Street. For the period March 28, 2011 through May 15, 2011, the collective borrowing amount of the credit facility was $225 million. Prior to March 28, 2011, the collective borrowing amount of the credit facility was $280 million. Interest was charged to each fund based on its borrowings at a rate equal to the greater of the (i) federal funds rate plus 1.25% per annum or (ii) the overnight LIBOR rate plus 1.25% per annum. The Fund also paid a commitment fee equal to its pro rata share of the amount of the credit facility at a rate of 0.125% per annum.
The Fund had no borrowings during the year ended February 29, 2012.
Note 11. Subsequent Events
Management has evaluated the events and transactions that have occurred through the date the financial statements were issued and noted no items requiring adjustment of the financial statements or additional disclosure.
Note 12. Information Regarding Pending and Settled Legal Proceedings
In June 2004, an action captioned John E. Gallus et al. v. American Express Financial Corp. and American Express Financial Advisors Inc. was filed in the United States District Court for the District of Arizona. The plaintiffs allege that they are investors in several American Express Company mutual funds (currently branded as Columbia) and they purport to bring the action derivatively on
behalf of those funds under the Investment Company Act of 1940. The plaintiffs allege that fees allegedly paid to the defendants by the funds for investment advisory and administrative services are excessive. The plaintiffs seek remedies including restitution and rescission of investment advisory and distribution agreements. The plaintiffs voluntarily agreed to transfer this case to the United States District Court for the District of Minnesota (the District Court). In response to defendants’ motion to dismiss the complaint, the District Court dismissed one of plaintiffs’ four claims and granted plaintiffs limited discovery. Defendants moved for summary judgment in April 2007. Summary judgment was granted in the defendants’ favor on July 9, 2007. The plaintiffs filed a notice of appeal with the Eighth Circuit Court of Appeals (the Eighth Circuit) on August 8, 2007. On April 8, 2009, the Eighth Circuit reversed summary judgment and remanded to the District Court for further proceedings. On August 6, 2009, defendants filed a writ of certiorari with the U.S. Supreme Court (the Supreme Court), asking the Supreme Court to stay the District Court proceedings while the Supreme Court considered and ruled in a case captioned Jones v. Harris Associates, which involved issues of law similar to those presented in the Gallus case. On March 30, 2010, the Supreme Court issued its ruling in Jones v. Harris Associates, and on April 5, 2010, the Supreme Court vacated the Eighth Circuit’s decision in the Gallus case and remanded the case to the Eighth Circuit for further consideration in light of the Supreme Court’s decision in Jones v. Harris Associates. On June 4, 2010, the Eighth Circuit remanded the Gallus case to the District Court for further consideration in light of the Supreme Court’s decision in Jones v. Harris Associates. On December 9, 2010, the District Court reinstated its July 9, 2007 summary judgment order in favor of the defendants. On January 10, 2011, plaintiffs filed a notice of appeal with the Eighth Circuit. In response to the plaintiffs’ opening appellate brief filed on March 18, 2011, the defendants filed a response brief on May 4, 2011 with the Eighth Circuit. The plaintiffs filed a reply brief on May 26, 2011 and oral arguments took place on November 17, 2011. On March 30, 2012, the Eighth Circuit upheld the grant of summary judgment by the District Court in favor of the defendants.
In December 2005, without admitting or denying the allegations, American Express Financial Corporation (AEFC, which is now known as Ameriprise Financial, Inc. (Ameriprise Financial)) entered into settlement agreements with the Securities and Exchange Commission (SEC) and Minnesota Department of Commerce (MDOC) related to market timing activities. As a result, AEFC was censured and ordered to cease and desist from committing or causing any violations of certain provisions of the Investment Advisers Act
29
Columbia Mid Cap Index Fund
February 29, 2012
of 1940, the Investment Company Act of 1940, and various Minnesota laws. AEFC agreed to pay disgorgement of $10 million and civil money penalties of $7 million. AEFC also agreed to retain an independent distribution consultant to assist in developing a plan for distribution of all disgorgement and civil penalties ordered by the SEC in accordance with various undertakings detailed at www.sec.gov/litigation/admin/ia-2451.pdf. Ameriprise Financial and its affiliates have cooperated with the SEC and the MDOC in these legal proceedings, and have made regular reports to the funds’ Boards of Trustees.
Ameriprise Financial and certain of its affiliates have historically been involved in a number of legal, arbitration and regulatory proceedings, including routine litigation, class actions, and governmental actions, concerning matters arising in connection with the conduct of their business activities. Ameriprise Financial believes that the Funds are not currently the subject of, and that neither Ameriprise Financial nor any of its affiliates are the subject of, any pending legal, arbitration or regulatory proceedings that are likely to have a material adverse effect on the Funds or the ability of
Ameriprise Financial or its affiliates to perform under their contracts with the Funds. Ameriprise Financial is required to make 10-Q, 10-K and, as necessary, 8-K filings with the Securities and Exchange Commission on legal and regulatory matters that relate to Ameriprise Financial and its affiliates. Copies of these filings may be obtained by accessing the SEC website at www.sec.gov.
There can be no assurance that these matters, or the adverse publicity associated with them, will not result in increased fund redemptions, reduced sale of fund shares or other adverse consequences to the Funds. Further, although we believe proceedings are not likely to have a material adverse effect on the Funds or the ability of Ameriprise Financial or its affiliates to perform under their contracts with the Funds, these proceedings are subject to uncertainties and, as such, we are unable to estimate the possible loss or range of loss that may result. An adverse outcome in one or more of these proceedings could result in adverse judgments, settlements, fines, penalties or other relief that could have a material adverse effect on the consolidated financial condition or results of operations of Ameriprise Financial.
30
Report of Independent Registered Public Accounting Firm
To the Trustees of Columbia Funds Series Trust and the Shareholders of Columbia Mid Cap Index Fund
In our opinion, the accompanying statement of assets and liabilities, including the investment portfolio, and the related statements of operations and of changes in net assets and the financial highlights present fairly, in all material respects, the financial position of Columbia Mid Cap Index Fund (the “Fund”) (a series of Columbia Funds Series Trust) at February 29, 2012, the results of its operations for the year then ended, the changes in its net assets for each of the two years in the period then ended and the financial highlights for each of the periods indicated, in conformity with accounting principles generally accepted in the United States of America. These financial statements and financial highlights (hereafter referred to as “financial statements”) are the responsibility of the Fund’s management. Our responsibility is to express an opinion on these financial statements based on our audits. We conducted our audits of these financial statements in accordance with the standards of the Public Company Accounting Oversight Board (United States). Those standards require that we plan and perform the audit to obtain reasonable assurance about whether the financial statements are free of material misstatement. An audit includes examining, on a test basis, evidence supporting the amounts and disclosures in the financial statements, assessing the accounting principles used and significant estimates made by management, and evaluating the overall financial statement presentation. We believe that our audits, which included confirmation of securities at February 29, 2012 by correspondence with the custodian, transfer agent and brokers, provide a reasonable basis for our opinion.
PricewaterhouseCoopers LLP
Minneapolis, Minnesota
April 20, 2012
31
Federal Income Tax Information (Unaudited) – Columbia Mid Cap Index Fund
The Fund hereby designates as a capital gain dividend with respect to the fiscal year ended February 29, 2012, $107,406,168 or, if subsequently determined to be different, the net capital gain of such year.
92.92% of the ordinary income distributed by the Fund for the fiscal year ended February 29, 2012, qualifies for the corporate dividends received deduction.
For non-corporate shareholders, 92.93%, or the maximum amount allowable under the Jobs and Growth Tax Relief Reconciliation Act of 2003, of the ordinary income distributed by the Fund for the fiscal year ended February 29, 2012 may represent qualified dividend income.
The Fund will notify shareholders in January 2013 of amounts for use in preparing 2012 income tax returns.
32
Fund Governance
Shareholders elect the Board that oversees the funds’ operations. The Board appoints officers who are responsible for day-to-day business decisions based on policies set by the Board. The following table provides basic biographical information about the funds’ Board members, including their principal occupations during the past five years, although specific titles for individuals may have varied over the period. Under current Board policy, members may serve until the next Board meeting after he or she reaches the mandatory retirement age established by the Board, or the fifteenth anniversary of the first Board meeting they attended as a member of the Board.
On September 29, 2009, Ameriprise Financial, the parent company of Columbia Management, entered into an agreement with Bank of America, N.A. (“Bank of America”) to acquire a portion of the asset management business of Columbia Management Group, LLC and certain of its affiliated companies (the “Transaction”). Following the Transaction, which became effective on May 1, 2010, various alignment activities have occurred with respect to the Fund Family. In connection with the Transaction, Mr. Edward J. Boudreau, Jr., Mr. William P. Carmichael, Mr. William A. Hawkins, Mr. R. Glenn Hilliard, Mr. John J. Nagorniak, Ms. Minor M. Shaw and Dr. Anthony M. Santomero, who were members prior to the Transaction of the Legacy Columbia Nations funds’ Board (“Nations Funds”), which includes Columbia Funds Series Trust, Columbia Funds Variable Insurance Trust I and Columbia Funds Master Investment Trust, LLC., began service on the Board for the Legacy RiverSource funds (“RiverSource Funds”) effective June 1, 2011, which resulted in an overall increase from twelve Trustees to sixteen for all mutual funds overseen by the Board.
| | | | | | | | |
| Independent Board Members | | |
| Name, address, age | | Position
held with
funds and
length
of service | | Principal occupation
during past five years | | Number of
funds in
the Fund
Family
overseen
by Board
member | | Other present or past
directorships/trusteeships
(within past 5 years) |
Kathleen Blatz 901 S. Marquette Ave. Minneapolis, MN 55402 Age 57 | | Board member since 1/06 for RiverSource Funds and since 6/11 for Nations Funds | | Attorney; Chief Justice, Minnesota Supreme Court, 1998-2006 | | 153 | | None |
Edward J. Boudreau, Jr. 225 Franklin Street Mail Drop BX32 05228 Boston, MA 02110 Age 67 | | Board member since 6/11 for RiverSource Funds and since 1/05 for Nations Funds | | Managing Director, E.J. Boudreau & Associates (consulting) since 2000 | | 146 | | Former Trustee, BofA Funds Series Trust (11 funds) |
Pamela G. Carlton 901 S. Marquette Ave. Minneapolis, MN 55402 Age 57 | | Board member since 7/07 for RiverSource Funds and since 6/11 for Nations Funds | | President, Springboard-Partners in Cross Cultural Leadership (consulting company) | | 153 | | None |
33
Fund Governance (continued)
| | | | | | | | |
| Independent Board Members (continued) | | |
| Name, address, age | | Position
held with
funds and
length
of service | | Principal occupation
during past five years | | Number of
funds in
the Fund
Family
overseen
by Board
member | | Other present or past
directorships/trusteeships
(within past 5 years) |
William P. Carmichael 225 Franklin Street Mail Drop BX32 05228 Boston, MA 02110 Age 68 | | Board member since 6/11 for RiverSource Funds and since 1999 for Nations Funds | | Retired | | 146 | | Director, Cobra Electronics Corporation (electronic equipment manufacturer); The Finish Line (athletic shoes and apparel); McMoRan Exploration Company (oil and gas exploration and development); former Trustee, BofA Funds Series Trust (11 funds); former Director, Spectrum Brands, Inc. (consumer products); former Director, Simmons Company (bedding) |
Patricia M. Flynn 901 S. Marquette Ave. Minneapolis, MN 55402 Age 61 | | Board member since 11/04 for RiverSource Funds and since 6/11 for Nations Funds | | Trustee Professor of Economics and Management, Bentley University; former Dean, McCallum Graduate School of Business, Bentley University | | 153 | | None |
William A. Hawkins 225 Franklin Street Mail Drop BX32 05228 Boston, MA 02110 Age 69 | | Board member since 6/11 for RiverSource Funds and since 1/05 for Nations Funds | | Managing Director, Overton Partners (financial consulting), since August 2010; President and Chief Executive Officer, California General Bank, N.A., January 2008–August 2010 | | 146 | | Trustee, BofA Funds Series Trust (11 funds) |
R. Glenn Hilliard 225 Franklin Street Mail Drop BX32 05228 Boston, MA 02110 Age 69 | | Board member since 6/11 for RiverSource Funds and since 1/05 for Nations Funds | | Chairman and Chief Executive Officer, Hilliard Group LLC (investing and consulting), since April 2003; Non-Executive Director & Chairman, CNO Financial Group, Inc. (formerly Conseco, Inc.) (insurance), September 2003–May 2011 | | 146 | | Chairman, BofA Fund Series Trust (11 funds); former Director, CNO Financial Group, Inc. (insurance) |
Stephen R. Lewis, Jr. 901 S. Marquette Ave. Minneapolis, MN 55402 Age 73 | | Chair of the Board for RiverSource Funds since 1/07, Board member for RiverSource Funds since 1/02 and since 6/11 for Nations Funds | | President Emeritus and Professor of Economics Emeritus, Carleton College | | 153 | | Director, Valmont Industries, Inc. (manufactures irrigation systems) |
34
Fund Governance (continued)
| | | | | | | | |
| Independent Board Members (continued) | | |
| Name, address, age | | Position
held with
funds and
length
of service | | Principal occupation
during past five years | | Number of
funds in
the Fund
Family
overseen
by Board
member | | Other present or past
directorships/trusteeships
(within past 5 years) |
John F. Maher 901 S. Marquette Ave. Minneapolis, MN 55402 Age 68 | | Board member since 12/06 for Legacy Seligman funds, since 12/08 for RiverSource Funds and since 6/11 for Nations Funds | | Retired President and Chief Executive Officer and former Director, Great Western Financial Corporation (financial services), 1986-1997 | | 153 | | None |
John J. Nagorniak 225 Franklin Street Mail Drop BX32 05228 Boston, MA 02110 Age 67 | | Board member since 6/11 for RiverSource Funds and since 1/08 for Nations Funds | | Retired; President and Director, Foxstone Financial, Inc. (consulting), 2000-2007; Director, Mellon Financial Corporation affiliates (investing), 2000-2007; Chairman, Franklin Portfolio Associates (investing–Mellon affiliate), 1982-2007 | | 146 | | Trustee, Research Foundation of CFA Institute; Director, MIT Investment Company; Trustee, MIT 401k Plan; former Trustee, BofA Funds Series Trust (11 funds) |
Catherine James Paglia 901 S. Marquette Ave. Minneapolis, MN 55402 Age 59 | | Board member since 11/04 for RiverSource Funds and since 6/11 for Nations Funds | | Director, Enterprise Asset Management, Inc. (private real estate and asset management company) | | 153 | | None |
Leroy C. Richie 901 S. Marquette Ave. Minneapolis, MN 55402 Age 70 | | Board member since 2000 for Legacy Seligman funds, since 11/08 for RiverSource Funds and since 6/11 for Nations Funds | | Counsel, Lewis & Munday, P.C. since 2004; former Vice President and General Counsel, Automotive Legal Affairs, Chrysler Corporation | | 153 | | Director, Digital Ally, Inc. (digital imaging); Director, Infinity, Inc. (oil and gas exploration and production); Director, OGE Energy Corp. (energy and energy services) |
Minor M. Shaw 225 Franklin Street Mail Drop BX32 05228 Boston, MA 02110 Age 64 | | Board member since 6/11 for RiverSource Funds and since 2003 for Nations Funds | | President–Micco LLC (private investments) | | 146 | | Former Trustee, BofA Funds Series Trust (11 funds); Board Member, Piedmont Natural Gas; Director, Blue Cross Blue Shield of South Carolina |
Alison Taunton-Rigby 901 S. Marquette Ave. Minneapolis, MN 55402 Age 67 | | Board member since 11/02 for RiverSource Funds and since 6/11 for Nations Funds | | Chief Executive Officer and Director, RiboNovix, Inc. 2003-2010 (biotechnology); former President, Aquila Biopharmaceuticals | | 153 | | Director, Healthways, Inc. (health management programs); Director, ICI Mutual Insurance Company, RRG; Director, Abt Associates (government contractor) |
35
Fund Governance (continued)
| | | | | | | | |
| Interested Board Member Not Affiliated with Investment Manager* | | |
| Name, address, age | | Position
held with
funds and
length of
service | | Principal occupation
during past five years | | Number of
funds in
the Fund
Family
overseen
by Board
member | | Other present or past
directorships/trusteeships
(within past 5 years) |
Anthony M. Santomero* 225 Franklin Street Mail Drop BX32 05228 Boston, MA 02110 Age 65 | | Board member since 6/11 for RiverSource Funds and since 1/08 for Nations Funds | | Richard K. Mellon Professor Emeritus of Finance, The Wharton School, University of Pennsylvania, since 2002; Senior Advisor, McKinsey & Company (consulting), 2006-2008; President and Chief Executive Officer, Federal Reserve Bank of Philadelphia, 2000-2006 | | 146 | | Director, Renaissance Reinsurance Ltd.; Trustee, Penn Mutual Life Insurance Company; Director, Citigroup; Director, Citibank, N.A.; former Trustee, BofA Funds Series Trust (11 funds) |
| * | Dr. Santomero is not an affiliated person of the Investment Manager or Ameriprise Financial. However, he is currently deemed by the funds to be an “interested person” (as defined in the 1940 Act) of the Funds because he serves as a Director of Citigroup, Inc. and Citibank N.A., companies that may directly or through subsidiaries and affiliates engage from time-to-time in brokerage execution, principal transactions and lending relationships with the funds or accounts advised/managed by the Investment Manager. |
| | | | | | | | |
| Interested Board Member Affiliated with Investment Manager* | | |
William F. Truscott 53600 Ameriprise Financial Center Minneapolis, MN 55474 Age 51 | | Board member since 11/01 for RiverSource Funds and since 6/11 for Nations Funds; Senior Vice President since 2002 for RiverSource Funds and 5/10 for Nations Funds | | Chairman of the Board and President, Columbia Management Investment Advisers, LLC since May 2010 and February 2012, respectively (previously President, Chairman of the Board and Chief Investment Officer, 2001-April 2010); Chief Executive Officer, U.S. Asset Management & President, Annuities, Ameriprise Financial, Inc. since May 2010 (previously President–U.S. Asset Management and Chief Investment Officer, 2005-April 2010); Director, President and Chief Executive Officer, Ameriprise Certificate Company since 2006; Director and Chief Executive Officer, Columbia Management Investment Distributors, Inc. since May 2010 (previously Chairman of the Board and Chief Executive Officer, 2006-April 2010); Chairman of the Board and Chief Executive Officer, RiverSource Distributors, Inc. since 2006. | | 153 | | None |
| * | Interested person (as defined under the 1940 Act) by reason of being an officer, director, security holder and/or employee of the Investment Manager or Ameriprise Financial. |
The SAI has additional information about the Fund’s Board members and is available, without charge, upon request by calling 800.345.6611 or contacting your financial intermediary.
36
Fund Governance (continued)
Officers
| | |
| Name, Year of birth and address | | Principal occupation(s) during past five years |
| |
| J. Kevin Connaughton (Born 1964) | | |
225 Franklin Street Boston, MA 02110 President (since 2009) | | Senior Vice President and General Manager–Mutual Fund Products, Columbia Management Investment Advisers, LLC since May 2010; President, Columbia Funds, since 2009, and RiverSource Funds, since May 2010 (previously Senior Vice President and Chief Financial Officer, Columbia Funds, from June 2008 to January 2009, Treasurer, Columbia Funds, from October 2003 to May 2008, and senior officer of various other affiliated funds since 2000); Managing Director, Columbia Management Advisors, LLC from December 2004 to April 2010. |
| |
| Michael G. Clarke (Born 1969) | | |
225 Franklin Street Boston, MA 02110 Treasurer (since 2011) and Chief Financial Officer
(since 2009) | | Vice President, Columbia Management Investment Advisers, LLC since May 2010; Managing Director of Fund Administration, Columbia Management Advisors, LLC, from September 2004 to April 2010; senior officer of Columbia Funds and affiliated funds since 2002. |
| |
| Scott R. Plummer (Born 1959) | | |
5228 Ameriprise Financial Center Minneapolis, MN 55474 Senior Vice President, Secretary and Chief Legal Officer (since 2010) | | Chief Legal Officer and Assistant Secretary, Columbia Management Investment Advisers, LLC since June 2005; Vice President and Lead Chief Counsel–Asset Management, Ameriprise Financial, Inc. since May 2010 (previously Vice President and Chief Counsel–Asset Management, from 2005 to April 2010); Vice President and Chief Counsel–Asset Management, from 2005 to April 2010; Vice President, Chief Counsel and Assistant Secretary, Columbia Management Investment Distributors, Inc. since 2008; Vice President, General Counsel and Secretary, Ameriprise Certificate Company since 2005; Chief Counsel, RiverSource Distributors, Inc. since 2006; Senior Officer of Columbia Funds and affiliated funds, since 2006. |
| |
| Thomas P. McGuire (Born 1972) | | |
225 Franklin Street Boston, MA 02110 Chief Compliance Officer (since 2012) | | Vice President–Asset Management Compliance, Columbia Management Investment Advisers, LLC since March 2010; Chief Compliance Officer, Ameriprise Certificate Company, since September 2010; Compliance Executive, Bank of America, from June 2005 to April 2010. |
| |
| William F. Truscott (Born 1960) | | |
53600 Ameriprise Financial Center Minneapolis, MN 55474 Senior Vice President (since 2010) | | Chairman of the Board and President, Columbia Management Investment Advisers, LLC since May 2010 and February 2012, respectively (previously President, Chairman of the Board and Chief Investment Officer, from 2001 to April 2010); Chief Executive Officer, U.S. Asset Management & President, Annuities, Ameriprise Financial, Inc. since May 2010 (previously President–U.S. Asset Management and Chief Investment Officer from 2005 to April 2010); Director, President and Chief Executive Officer, Ameriprise Certificate Company since 2006; Director and Chief Executive Officer, Columbia Management Investment Distributors, Inc. since May 2010 and February 2012, respectively (previously Chairman of the Board and Chief Executive Officer from 2008 to April 2010); Chairman of the Board and Chief Executive Officer, RiverSource Distributors, Inc. since 2006. |
| |
Paul D. Pearson (Born 1956) | | |
10468 Ameriprise Financial Center Minneapolis, MN 55474 Vice President and Assistant Treasurer (since 2011) | | Vice President–Investment Accounting, Columbia Management Investment Advisers, LLC, since May 2010; Vice President–Managed Assets, Investment Accounting, Ameriprise Financial Corporation, 1998-2010 |
37
Fund Governance (continued)
Officers (continued)
| | |
| Name, Year of birth and address | | Principal occupation(s) during past five years |
| |
| Colin Moore (Born 1958) | | |
225 Franklin Street Boston, MA 02110 Senior Vice President (since 2010) | | Director and Chief Investment Officer, Columbia Management Investment Advisers, LLC since May 2010; Manager, Managing Director and Chief Investment Officer of Columbia Management Advisors, LLC from 2007 to April 2010; Head of Equities, Columbia Management Advisors, LLC from 2002 to 2007. |
| |
| Christopher O. Petersen (Born 1970) | | |
5228 Ameriprise Financial Center Minneapolis, MN 55474 Vice President and Secretary (since 2011) | | Vice President and Chief Counsel, Ameriprise Financial since January 2010 (formerly Vice President and Group Counsel or Counsel from April 2004 to January 2010); Senior officer of Columbia Funds and affiliated funds, since 2007. |
| |
| Amy K. Johnson (Born 1965) | | |
5228 Ameriprise Financial Center Minneapolis, MN 55474 Senior Vice President (since 2010) | | Senior Vice President and Chief Operating Officer, Columbia Management Investment Advisers, LLC since May 2010 (previously Chief Administrative Officer, from 2009 until April 2010, Vice President–Asset Management and Trust Company Services, from 2006 to 2009, and Vice President–Operations and Compliance from 2004 to 2006). |
| |
| Joseph F. DiMaria (Born 1968) | | |
225 Franklin Street Boston, MA 02110 Vice President (since 2011) and Chief Accounting Officer (since 2008) | | Vice President, Mutual Fund Administration, Columbia Management Investment Advisers, LLC, since May 2010; Director of Fund Administration, Columbia Management Advisors, LLC from January 2006 to April 2010. |
| |
| Paul B. Goucher (Born 1968) | | |
100 Park Avenue New York, NY 10017 Vice President and Assistant Secretary (since 2010) | | Vice President and Chief Counsel of Ameriprise Financial since January 2010 (formerly Vice President and Group Counsel from November 2008 to January 2010); Director, Managing Director and General Counsel of J. & W. Seligman & Co. Incorporated (Seligman) from July 2008 to November 2008 and Managing Director and Associate General Counsel of Seligman from January 2005 to July 2008. |
| |
| Michael E. DeFao (Born 1968) | | |
225 Franklin Street Boston, MA 02110 Vice President and Assistant Treasurer (since 2011) | | Vice President and Chief Counsel, Ameriprise Financial since May 2010; Associate General Counsel, Bank of America from June 2005 to April 2010 |
| |
| Stephen T. Welsh (Born 1957) | | |
225 Franklin Street Boston, MA 02110 Vice President (since 2006) | | President, Columbia Management Investment Services, Corp. since May 2010; President and Director, Columbia Management Services, Inc. from July 2004 to April 2010; Managing Director, Columbia Management Distributors, Inc. from August 2007 to April 2010. |
38
[THIS PAGE INTENTIONALLY LEFT BLANK]
39
[THIS PAGE INTENTIONALLY LEFT BLANK]
40
Important Information About This Report
The fund mails one shareholder report to each shareholder address. If you would like more than one report, please call shareholder services at 1-800-345-6611 and additional reports will be sent to you. This report has been prepared for shareholders of Columbia Mid Cap Index Fund.
A description of the policies and procedures that the fund uses to determine how to vote proxies and a copy of the fund’s voting records are available (i) at www.columbiamanagement.com, (ii) on the Securities and Exchange Commission’s website at www.sec.gov, and (iii) without charge, upon request, by calling 1-800-368-0346. Information regarding how the fund voted proxies relating to portfolio securities during the 12-month period ended June 30 is available from the SEC’s website. Information regarding how the fund voted proxies relating to portfolio securities is also available from the fund’s website, www.columbiamanagement.com.
The fund files a complete schedule of portfolio holdings with the SEC for the first and third quarters of each fiscal year on Form N-Q. The fund’s Form N-Q is available on the SEC’s website at www.sec.gov and may be reviewed and copied at the SEC’s Public Reference Room in Washington, D.C. Information on the operation of the Public Reference Room may be obtained by calling
1-800-SEC-0330.
Transfer Agent
Columbia Management Investment Services Corp.
P.O. Box 8081
Boston, MA 02266-8081
1-800-345-6611
Distributor
Columbia Management Investment
Distributors, Inc.
225 Franklin Street Boston, MA 02110
Investment Manager
Columbia Management Investment Advisers, LLC
225 Franklin Street Boston, MA 02110
41

Columbia Mid Cap Index Fund
P.O. Box 8081
Boston, MA 02266-8081
columbiamanagement.com
This information is for use with concurrent or prior delivery of a fund prospectus. Investors should consider the investment objectives, risks, charges and expenses of a mutual fund carefully before investing. For a free prospectus, which contains this and other important information about the funds, visit columbiamanagement.com. Read the prospectus carefully before investing. The Fund is distributed by Columbia Management Investment Distributors, Inc., member FINRA, and managed by Columbia Management Investment Advisers, LLC.
©2012 Columbia Management Investment Advisers, LLC. All rights reserved.
C-1691 C (4/12)
Item 2. Code of Ethics.
(a) The registrant has adopted a code of ethics that applies to the registrant’s principal executive officer, principal financial officer, principal accounting officer or controller, or persons performing similar functions, regardless of whether these individuals are employed by the registrant or a third party.
(b) During the period covered by this report, there were not any amendments to a provision of the code of ethics adopted in 2(a) above.
(c) During the period covered by this report, there were no waivers, including any implicit waivers, from a provision of the code of ethics described in 2(a) above that relates to one or more of the items set forth in paragraph (b) of this item’s instructions.
Item 3. Audit Committee Financial Expert.
The registrant’s Board of Trustees has determined that Edward J. Boudreau Jr., Pamela G. Carlton, William P. Carmichael, William A. Hawkins and John F. Maher, each of whom are members of the registrant’s Board of Trustees and Audit Committee, each qualify as an audit committee financial expert. Mr. Boudreau, Ms. Carlton, Mr. Carmichael, Mr. Hawkins and Mr. Maher each are independent trustees, as defined in paragraph (a)(2) of this item’s instructions.
Item 4. Principal Accountant Fees and Services.
Fee information below is disclosed for the eighteen series of the registrant whose report to stockholders are included in this annual filing. Fee information for fiscal year ended February 29, 2012 also includes fees for one series that merged during the period.
(a) Audit Fees. Aggregate Audit Fees billed by the principal accountant for professional services rendered during the fiscal years ended February 29, 2012 and February 28, 2011 are approximately as follows:
2012 | | 2011 | |
$ | 579,500 | | $ | 588,600 | |
| | | | | |
Audit Fees include amounts related to the audit of the registrant’s annual financial statements or services that are normally provided by the accountant in connection with statutory and regulatory filings or engagements for those fiscal years. Fiscal year 2011 also includes audit fees for the review and provision of consent in connection with filing Form N-1A for new share classes.
(b) Audit-Related Fees. Aggregate Audit-Related Fees billed to the registrant by the principal accountant for professional services rendered during the fiscal years ended February 29, 2012 and February 28, 2011 are approximately as follows:
2012 | | 2011 | |
$ | 132,500 | | $ | 121,700 | |
| | | | | |
Audit-Related Fees include amounts for assurance and related services by the principal accountant that are reasonably related to the performance of the audit of the registrant’s financial statements and are not reported in Audit Fees above. In both fiscal years 2012 and 2011, Audit-Related Fees consist of agreed-upon procedures performed for semi-annual shareholder reports and agreed- upon procedures related to fund mergers. Fiscal year 2012 also includes Audit-Related Fees for agreed-upon procedures for fund accounting and custody conversions.
During the fiscal years ended February 29, 2012 and February 28, 2011, there were no Audit-Related Fees billed by the registrant’s principal accountant to the registrant’s investment adviser (not including any sub-adviser whose role is primarily portfolio management and is subcontracted with or overseen by another investment adviser) and any entity controlling, controlled by, or under common control with the adviser that provides ongoing services to the registrant for an engagement that related directly to the operations and financial reporting of the registrant.
(c) Tax Fees. Aggregate Tax Fees billed by the principal accountant to the registrant for professional services rendered during the fiscal years ended February 29, 2012 and February 28, 2011 are approximately as follows:
2012 | | 2011 | |
$ | 103,800 | | $ | 85,200 | |
| | | | | |
Tax Fees include amounts for the review of annual tax returns, the review of required shareholder distribution calculations and typically include amounts for professional services by the principal accountant for tax compliance, tax advice and tax planning. In fiscal year 2012, Tax Fees also include agreed-upon procedures related to fund mergers and the review of final tax returns and foreign tax filings.
During the fiscal years ended February 29, 2012 and February 28, 2011, there were no Tax Fees billed by the registrant’s principal accountant to the registrant’s investment adviser (not including any sub-adviser whose role is primarily portfolio management and
is subcontracted with or overseen by another investment adviser) and any entity controlling, controlled by, or under common control with the adviser that provides ongoing services to the registrant for an engagement that related directly to the operations and financial reporting of the registrant.
(d) All Other Fees. Aggregate All Other Fees billed by the principal accountant to the registrant for professional services rendered during the fiscal years ended February 29, 2012 and February 28, 2011 are approximately as follows:
All Other Fees include amounts for products and services provided by the principal accountant, other than the services reported in paragraphs (a) through (c) above.
Aggregate All Other Fees billed by the registrant’s principal accountant to the registrant’s investment adviser (not including any sub-adviser whose role is primarily portfolio management and is subcontracted with or overseen by another investment adviser) and any entity controlling, controlled by, or under common control with the adviser that provides ongoing services to the registrant for an engagement that related directly to the operations and financial reporting of the registrant during the fiscal years ended February 29, 2012 and February 28, 2011 are approximately as follows:
2012 | | 2011 | |
$ | 395,800 | | $ | 495,300 | |
| | | | | |
In both fiscal years 2012 and 2011, All Other Fees consist of fees billed for internal control examinations of the registrant’s transfer agent and investment advisor.
(e)(1) Audit Committee Pre-Approval Policies and Procedures
The registrant’s Audit Committee is required to pre-approve the engagement of the registrant’s independent accountants to provide audit and non-audit services to the registrant and non-audit services to its investment adviser (not including any sub-adviser whose role is primarily portfolio management and is subcontracted with or overseen by another investment adviser) or any entity controlling, controlled by or under common control with such investment adviser that provides ongoing services to the registrant (“Adviser Affiliates”), if the engagement relates directly to the operations and financial reporting of the registrant.
The Audit Committee has adopted a Policy for Engagement of Independent Accountants for Audit and Non-Audit Services (“Policy”). The Policy sets forth the understanding of the Audit Committee regarding the engagement of the registrant’s independent accountants to provide (i) audit and permissible audit-related, tax and other services to the registrant (collectively “Fund Services”); (ii) non-audit services to the registrant’s investment adviser (not including any sub-adviser whose role is primarily portfolio
management and is subcontracted with or overseen by another investment adviser) and Adviser Affiliates, if the engagement relates directly to the operations or financial reporting of a Fund (collectively “Fund-related Adviser Services”); and (iii) certain other audit and non-audit services to the registrant’s investment adviser (not including any sub-adviser whose role is primarily portfolio management and is subcontracted with or overseen by another investment adviser) and Adviser Affiliates. As set forth in this Fund Policy, a service will require specific pre-approval by the Audit Committee if it is to be provided by the Fund’s independent auditor; provided, however, that pre-approval of non-audit services to the Fund, the Adviser or Control Affiliates may be waived if certain de minimis requirements set forth in the SEC’s rules are met.
Under the Policy, the Audit Committee may delegate pre-approval authority to any pre-designated member or members who are Independent Trustees/Directors. The member(s) to whom such authority is delegated must report, for informational purposes only, any pre-approval decisions to the Audit Committee at its next regular meeting. The Audit Committee’s responsibilities with respect to the pre-approval of services performed by the independent accountants may not be delegated to management.
On an annual basis, at a regularly scheduled Audit Committee meeting, the Fund’s Treasurer or other Fund Officer shall submit to the Audit Committee a schedule of the types of Fund Services and Fund-related Adviser Services that are subject to specific pre-approval.
This schedule will provide a description of each type of service that is subject to specific pre-approval, along with total projected fees for each service. The pre-approval will generally cover a one-year period. The Audit Committee will review and approve the types of services and the projected fees for the next one-year period and may add to, or subtract from, the list of pre-approved services from time to time, based on subsequent determinations. This specific approval acknowledges that the Audit Committee is in agreement with the types of services that the independent accountants will be permitted to perform.
The Fund’s Treasurer or other Fund Officer shall report to the Audit Committee at each of its regular meetings regarding all Fund Services or Fund-related Adviser Services initiated since the last such report was rendered, including a general description of the services with forecasted fees for the annual period, proposed changes requiring specific pre-approval and a description of services provided by the independent auditor with actual fees during the current reporting period.
*****
(e)(2) The percentage of services described in paragraphs (b) through (d) of this Item approved pursuant to the “de minimis” exception under paragraph (c)(7)(i)(C) of Rule 2-01 of Regulation S-X during both fiscal years ended February 29, 2012 and February 28, 2011 was zero.
(f) Not applicable.
(g) The aggregate non-audit fees billed by the registrant’s accountant for services rendered to the registrant, and rendered to the registrant’s investment adviser (not including any sub-adviser whose role is primarily portfolio management and is subcontracted with or overseen by another investment adviser), and any entity controlling, controlled by, or under common control with the adviser that provides ongoing services to the registrant for the fiscal years ended February 29, 2012 and February 28, 2011 are approximately as follows:
2012 | | 2011 | |
$ | 632,100 | | $ | 702,200 | |
| | | | | |
(h) The registrant’s Audit Committee of the Board of Directors has considered whether the provision of non-audit services that were rendered to the registrant’s adviser (not including any sub-adviser whose role is primarily portfolio management and is subcontracted with or overseen by another investment adviser), and any entity controlling, controlled by, or under common control with the investment adviser that provides ongoing services to the registrant that were not pre-approved pursuant to paragraph (c)(7)(ii) of Rule 2-01 of Regulation S-X, is compatible with maintaining the principal accountant’s independence.
Item 5. Audit Committee of Listed Registrants.
Not applicable.
Item 6. Investments
(a) The registrant’s “Schedule I — Investments in securities of unaffiliated issuers” (as set forth in 17 CFR 210.12-12) is included in Item 1 of this Form N-CSR.
(b) Not applicable.
Item 7. Disclosure of Proxy Voting Policies and Procedures for Closed-End Management Investment Companies.
Not applicable.
Item 8. Portfolio Managers of Closed-End Management Investment Companies.
Not applicable.
Item 9. Purchases of Equity Securities by Closed-End Management Investment Company and Affiliated Purchasers.
Not applicable.
Item 10. Submission of Matters to a Vote of Security Holders.
There were no material changes to the procedures by which shareholders may recommend nominees to the registrant’s board of directors.
Item 11. Controls and Procedures.
(a) The registrant’s principal executive officer and principal financial officers, based on their evaluation of the registrant’s disclosure controls and procedures as of a date within 90 days of the filing of this report, have concluded that such controls and procedures are adequately designed to ensure that material information required to be disclosed by the registrant in Form N-CSR is accumulated and communicated to the registrant’s management, including the principal executive officer and principal financial officer, or persons performing similar functions, as appropriate to allow timely decisions regarding required disclosure.
(b) There was no change in the registrant’s internal control over financial reporting that occurred during the registrant’s second fiscal quarter of the period covered by this report that has materially affected, or is reasonably likely to materially affect, the registrant’s internal control over financial reporting.
Item 12. Exhibits.
(a)(1) Code of ethics required to be disclosed under Item 2 of Form N-CSR attached hereto as Exhibit 99.CODE ETH.
(a)(2) Certifications pursuant to Rule 30a-2(a) under the Investment Company Act of 1940 (17 CFR 270.30a-2(a)) attached hereto as Exhibit 99.CERT.
(a)(3) Not applicable.
(b) Certification pursuant to Rule 30a-2(b) under the Investment Company Act of 1940 (17 CFR 270.30a-2(b)) attached hereto as Exhibit 99.906CERT.
SIGNATURES
Pursuant to the requirements of the Securities Exchange Act of 1934 and the Investment Company Act of 1940, the registrant has duly caused this report to be signed on its behalf by the undersigned, thereunto duly authorized.
(registrant) | | Columbia Funds Series Trust | |
| | | |
| | |
By (Signature and Title) | | /s/ J. Kevin Connaughton | |
| J. Kevin Connaughton, President and Principal Executive Officer | |
| | |
| | | |
Date | | April 24, 2012 | |
| | | | | |
Pursuant to the requirements of the Securities Exchange Act of 1934 and the Investment Company Act of 1940, this report has been signed below by the following persons on behalf of the registrant and in the capacities and on the dates indicated.
By (Signature and Title) | | /s/ J. Kevin Connaughton | |
| J. Kevin Connaughton, President and Principal Executive Officer | |
| | |
| | | |
Date | | April 24, 2012 | |
| | | | |
By (Signature and Title) | | /s/ Michael G. Clarke | |
| Michael G. Clarke, Treasurer and Chief Financial Officer | |
| | |
| | | |
Date | | April 24, 2012 | |
| | | | |


