UNITED STATES
SECURITIES AND EXCHANGE COMMISSION
Washington, D.C. 20549
FORM N-CSR
CERTIFIED SHAREHOLDER REPORT OF REGISTERED
MANAGEMENT INVESTMENT COMPANIES
Investment Company Act file number | 811-09645 |
|
Columbia Funds Series Trust |
(Exact name of registrant as specified in charter) |
|
225 Franklin Street, Boston, Massachusetts | | 02110 |
(Address of principal executive offices) | | (Zip code) |
|
Scott R. Plummer 5228 Ameriprise Financial Center Minneapolis, MN 55474 |
(Name and address of agent for service) |
|
Registrant’s telephone number, including area code: | 1-612-671-1947 | |
|
Date of fiscal year end: | March 31 | |
|
Date of reporting period: | March 31, 2012 | |
| | | | | | | | |
Form N-CSR is to be used by management investment companies to file reports with the Commission not later than 10 days after the transmission to stockholders of any report that is required to be transmitted to stockholders under Rule 30e-1 under the Investment Company Act of 1940 (17 CFR 270.30e-1). The Commission may use the information provided on Form N-CSR in its regulatory, disclosure review, inspection, and policymaking roles.
A registrant is required to disclose the information specified by Form N-CSR, and the Commission will make this information public. A registrant is not required to respond to the collection of information contained in Form N-CSR unless the Form displays a currently valid Office of Management and Budget (“OMB”) control number. Please direct comments concerning the accuracy of the information collection burden estimate and any suggestions for reducing the burden to Secretary, Securities and Exchange Commission, 450 Fifth Street, NW, Washington, DC 20549-0609. The OMB has reviewed this collection of information under the clearance requirements of 44 U.S.C. § 3507.
Item 1. Reports to Stockholders.

Columbia Short Term Bond Fund
Annual Report for the Period Ended March 31, 2012
Not FDIC insured • No bank guarantee • May lose value
Table of Contents
| Fund Profile | | | 1 | | |
|
| Performance Information | | | 2 | | |
|
| Fund Expense Example | | | 3 | | |
|
| Portfolio Managers' Report | | | 4 | | |
|
| Portfolio of Investments | | | 7 | | |
|
Statement of Assets and
Liabilities | | | 19 | | |
|
| Statement of Operations | | | 21 | | |
|
Statement of Changes in
Net Assets | | | 22 | | |
|
| Financial Highlights | | | 24 | | |
|
| Notes to Financial Statements | | | 33 | | |
|
Report of Independent Registered
Public Accounting Firm | | | 46 | | |
|
| Fund Governance | | | 47 | | |
|
Important Information About
This Report | | | 57 | | |
|
The views expressed in this report reflect the current views of the respective parties. These views are not guarantees of future performance and involve certain risks, uncertainties and assumptions that are difficult to predict, so actual outcomes and results may differ significantly from the views expressed. These views are subject to change at any time based upon economic, market or other conditions and the respective parties disclaim any responsibility to update such views. These views may not be relied on as investment advice and, because investment decisions for a Columbia Fund are based on numerous factors, may not be relied on as an indication of trading intent on behalf of any particular Columbia Fund. References to specific securities should not be construed as a recommendation or investment advice.
President's Message

Dear Shareholders,
A stock market rally that commenced in the fourth quarter of 2011 continued into 2012 in the United States and around the world, as all major market regions generated double-digit returns for the three-month period ended March 31, 2012. Volatility declined sharply as European debt fears quieted somewhat and sentiment improved. Returns in developed countries were buoyed by strong results in Germany, Belgium, Austria and the Nordic markets of Denmark, Finland, Norway and Sweden. Under the cloud of its own mounting debt problem, Spain was the only eurozone country to deliver a negative return during the three-month period. Solid economic growth and accommodative monetary policy helped boost gains in emerging markets. The rally in U.S. equities was largely driven by an expansion in "multiples"—an increase in stock prices relative to their earnings. By the end of the first quarter of 2012, stocks no longer appeared as cheap as they were late in 2011. Bonds lagged stocks during the first quarter as investors responded to signs of an improved environment with a greater appetite for risk.
Concerns around the health of the global economy were centered in news headlines focusing on Washington D.C., Europe, China and the Middle East. In the United States, economic indicators remained mixed but generally indicated support for slow, sustainable economic growth. European policymakers have made progress in containing the eurozone debt crisis, though they still have not solved the issue of long-term solvency. The European Central Bank has lowered interest rates and flooded the financial system with liquidity that may provide breathing space for companies to restructure their balance sheets. These massive infusions of liquidity may whet the appetite for risk from investors around the world. However, it has delayed a true reckoning with the European financial situation, as concerns about Spain and Portugal continue to cloud the outlook. These structural challenges that persist in the developed world, and slowing growth in emerging market economies, leave the global economy in a fragile state. Domestic demand, combined with slowing inflationary trends, has also helped to shore up emerging market economies. Joblessness remains low and monetary conditions remain easy.
Despite the challenges and surprises of 2011, we see pockets of strength—and as a result, attractive opportunities—both here and abroad for 2012. We hope to help you capitalize on these opportunities with various articles in our 2012 Perspectives, which is available via the Market Insights tab at columbiamanagement.com. This publication showcases the strong research capabilities and experienced investment teams of Columbia Management and offers a diverse array of investment ideas based on our five key themes for 2012.
Other information and resources available at columbiamanagement.com include:
g detailed up-to-date fund performance and portfolio information
g economic analysis and market commentary
g quarterly fund commentaries
g Columbia Management Investor, our award-winning quarterly newsletter for shareholders
Thank you for your continued support of the Columbia Funds. We look forward to serving your investment needs for many years to come.
Best Regards,

J. Kevin Connaughton
President, Columbia Funds
Investors should consider the investment objectives, risks, charges and expenses of a mutual fund carefully before investing. For a free prospectus, which contains this and other important information about the funds, visit columbiamanagement.com. The prospectus should be read carefully before investing.
Columbia Funds are distributed by Columbia Management Investment Distributors, Inc., member FINRA, and managed by Columbia Management Investment Advisers, LLC.
© 2012 Columbia Management Investment Advisers, LLC. All rights reserved.
Fund Profile – Columbia Short Term Bond Fund
Summary
g For the 12-month period that ended March 31, 2012, the fund's Class A shares returned 1.78% without sales charge.
g The fund performed in line with its benchmark, the Barclays 1-3 Year Government/Credit Index.1
g The fund's sector positioning benefited performance, as did its yield curve strategy. Duration positioning detracted from relative performance.
Portfolio Management
Leonard A. Aplet has co-managed the fund since 2004. From 1987 until joining Columbia Management Investment Advisers, LLC (the Investment Manager) in May 2010, Mr. Aplet was associated with the fund's previous investment adviser as an investment professional.
Gregory S. Liechty has co-managed the fund since 2010. From 2005 until joining the Investment Manager in May 2010, Mr. Liechty was associated with the fund's previous investment adviser as an investment professional.
Ronald B. Stahl has co-managed the fund since 2006. From 1998 until joining the Investment Manager in May 2010, Mr. Stahl was associated with the fund's previous investment adviser as an investment professional.
1The Barclays 1-3 Year Government/Credit Index consists of Treasury or government agency securities and investment grade corporate debt securities with maturities of one to three years.
Indices are not available for investment, are not professionally managed and do not reflect sales charges, fees, brokerage commissions, taxes or other expenses of investing. Securities in the fund may not match those in an index.
Performance data quoted represents past performance and current performance may be lower or higher. Past performance is no guarantee of future results. The investment return and principal value will fluctuate so that shares, when redeemed, may be worth more or less than the original cost. Please visit www.columbiamanagement.com for daily and most recent month-end performance updates.
Summary
1-year return as of 03/31/12
| | | | +1.78% | |
|
|  | | | Class A shares
(without sales charge) | |
|
| | | | +1.78% | |
|
|  | | | Barclays 1-3 Year Government/Credit Index | |
|
1
Performance Information – Columbia Short Term Bond Fund
Performance data quoted represents past performance and current performance may be lower or higher. Past performance is no guarantee of future results. The investment return and principal value will fluctuate so that shares, when redeemed, may be worth more or less than the original cost. Please visit www.columbiamanagement.com for daily and most recent month-end performance updates.
Performance of a $10,000 investment 04/01/02 – 03/31/12
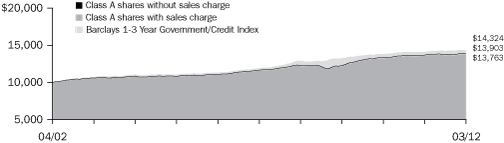
The chart above shows the change in value of a hypothetical $10,000 investment in Class A shares of Columbia Short Term Bond Fund during the stated time period, and does not reflect the deduction of taxes that a shareholder may pay on fund distributions or on the redemption of fund shares.
Performance of a $10,000 investment 04/01/02 – 03/31/12 ($)
| Sales charge | | without | | with | |
| Class A | | | 13,903 | | | | 13,763 | | |
| Class B | | | 12,903 | | | | 12,903 | | |
| Class C | | | 13,263 | | | | 13,263 | | |
| Class I* | | | 14,252 | | | | n/a | | |
| Class R* | | | 13,492 | | | | n/a | | |
| Class R4* | | | 13,988 | | | | n/a | | |
| Class W* | | | 13,857 | | | | n/a | | |
| Class Y* | | | 14,256 | | | | n/a | | |
| Class Z | | | 14,256 | | | | n/a | | |
Average annual total return as of 03/31/12 (%)
| Share class | | A | | B | | C | | I* | | R* | | R4* | | W* | | Y* | | Z | |
| Inception | | 10/02/92 | | 06/07/93 | | 10/02/92 | | 09/27/10 | | 09/27/10 | | 03/07/11 | | 09/27/10 | | 07/15/09 | | 09/30/92 | |
| Sales charge | | without | | with | | without | | with | | without | | with | | without | | without | | without | | without | | without | | without | |
| 1-year | | | 1.78 | | | | 0.77 | | | | 1.12 | | | | –1.88 | | | | 1.48 | | | | 0.48 | | | | 1.99 | | | | 1.60 | | | | 1.83 | | | | 1.89 | | | | 2.11 | | | | 2.14 | | |
| 5-year | | | 3.59 | | | | 3.39 | | | | 2.82 | | | | 2.82 | | | | 3.27 | | | | 3.27 | | | | 3.87 | | | | 3.31 | | | | 3.67 | | | | 3.59 | | | | 3.87 | | | | 3.88 | | |
| 10-year | | | 3.35 | | | | 3.25 | | | | 2.58 | | | | 2.58 | | | | 2.86 | | | | 2.86 | | | | 3.61 | | | | 3.04 | | | | 3.41 | | | | 3.32 | | | | 3.61 | | | | 3.61 | | |
The "with sales charge" returns include the maximum initial sales charge of 1.00% for Class A shares and the applicable contingent deferred sales charge of 3.00% in the first year, declining to 1.00% in the fourth year and eliminated thereafter for Class B shares and 1.00% for Class C shares for the first year only. The "without sales charge" returns do not include the effect of sales charges. If they had, returns would be lower.
Performance results reflect any fee waivers or reimbursements of fund expenses by Columbia Management Investment Advisers, LLC and/or any of its affiliates. Absent these fee waivers or expense reimbursement arrangements, performance results would have been lower.
All results shown assume reinvestment of distributions. Class I, Class Y, Class R4 and Class Z shares are sold at net asset value with no distribution and service (Rule 12b-1) fees. Class R shares are sold at net asset value with a distribution (Rule 12b-1) fee and Class W shares are sold at net asset value with a distribution and service (Rule 12b-1) fee. Class I, Class R, Class R4, Class W, Class Y and Class Z shares have limited eligibility and the investment minimum requirements may vary. Please see the fund's prospectuses for details. Performance for different share classes will vary based on differences in sales charges and fees associated with each class.
The tables do not reflect the deduction of taxes that a shareholder may pay on fund distributions or on the redemption of fund shares.
* The returns shown for periods prior to the share class inception date (including returns since inception, which are since fund inception) include the returns of the fund's oldest share class. These returns are adjusted to reflect any higher class-related operating expenses of the newer share classes, as applicable. Please visit columbiamanagement.com/mutual-funds/appended-performance for more information.
2
Fund Expense Example – Columbia Short Term Bond Fund
As an investor, you incur two types of costs. There are transaction costs, which generally include sales charges on purchases and may include redemption fees. There are also ongoing costs, which generally include management fees, distribution and service (Rule 12b-1) fees, and other fund expenses. The following information is intended to help you understand your ongoing costs (in dollars) of investing in the Fund and to help you compare these costs with the ongoing costs of investing in other mutual funds.
Analyzing your fund's expenses
To illustrate these ongoing costs, we have provided examples and calculated the expenses paid by investors in each share class of the Fund during the period. The actual and hypothetical information in the table is based on an initial investment of $1,000 at the beginning of the period indicated and held for the entire period. Expense information is calculated two ways and each method provides you with different information. The amount listed in the "Actual" column is calculated using the Fund's actual operating expenses and total return for the period. You may use the Actual information, together with the amount invested, to estimate the expenses that you paid over the period. Simply divide your account value by $1,000 (for example, an $8,600 account value divided by $1,000 = 8.6), then multiply the results by the expenses paid during the period under the Actual column. The amount listed in the "Hypothetical" column assumes a 5% annual rate of return before expenses (which is not the Fund's actual return) and then applies the Fund's actual expense ratio for the period to the hypothetical return. You should not use the hypothetical account values and expenses to estimate either your actual account balance at the end of the period or the expenses you paid during the period. See "Compare with other funds" below for details on how to use the hypothetical data.
Compare with other funds
Since all mutual funds are required to include the same hypothetical calculations about expenses in shareholder reports, you can use this information to compare the ongoing cost of investing in the Fund with other funds. To do so, compare the hypothetical example with the 5% hypothetical examples that appear in the shareholder reports of other funds. As you compare hypothetical examples of other funds, it is important to note that hypothetical examples are meant to highlight the ongoing costs of investing in a fund only and do not reflect any transaction costs, such as sales charges, or redemption or exchange fees. Therefore, the hypothetical calculations are useful in comparing ongoing costs only, and will not help you determine the relative total costs of owning different funds. If transaction costs were included in these calculations, your costs would be higher.
10/01/11 – 03/31/12
| | | Account value at the
beginning of the period ($) | | Account value at the
end of the period ($) | | Expenses paid
during the period ($) | | Fund's annualized
expense ratio (%) | |
| | | Actual | | Hypothetical | | Actual | | Hypothetical | | Actual | | Hypothetical | | Actual | |
| Class A | | | 1,000.00 | | | | 1,000.00 | | | | 1,013.30 | | | | 1,020.89 | | | | 4.00 | | | | 4.02 | | | | 0.80 | | |
| Class B | | | 1,000.00 | | | | 1,000.00 | | | | 1,009.40 | | | | 1,016.96 | | | | 7.94 | | | | 7.97 | | | | 1.59 | | |
| Class C | | | 1,000.00 | | | | 1,000.00 | | | | 1,011.60 | | | | 1,019.19 | | | | 5.70 | | | | 5.72 | | | | 1.14 | | |
| Class I | | | 1,000.00 | | | | 1,000.00 | | | | 1,014.20 | | | | 1,022.82 | | | | 2.05 | | | | 2.06 | | | | 0.41 | | |
| Class R | | | 1,000.00 | | | | 1,000.00 | | | | 1,012.00 | | | | 1,019.54 | | | | 5.35 | | | | 5.37 | | | | 1.07 | | |
| Class R4 | | | 1,000.00 | | | | 1,000.00 | | | | 1,013.40 | | | | 1,020.98 | | | | 3.90 | | | | 3.92 | | | | 0.78 | | |
| Class W | | | 1,000.00 | | | | 1,000.00 | | | | 1,013.20 | | | | 1,020.84 | | | | 4.05 | | | | 4.07 | | | | 0.81 | | |
| Class Y | | | 1,000.00 | | | | 1,000.00 | | | | 1,015.10 | | | | 1,022.68 | | | | 2.20 | | | | 2.21 | | | | 0.44 | | |
| Class Z | | | 1,000.00 | | | | 1,000.00 | | | | 1,014.90 | | | | 1,022.43 | | | | 2.45 | | | | 2.46 | | | | 0.49 | | |
Expenses paid during the period are equal to the annualized expense ratio for each class as indicated above, multiplied by the average account value over the period and then multiplied by the number of days in the Fund's most recent fiscal half year and divided by 366.
Expenses do not include fees and expenses incurred indirectly by the Fund from the underlying funds in which the Fund may invest (also referred to as "acquired funds"), including affiliated and non-affiliated pooled investments vehicles (including mutual funds and exchange traded funds).
Had Columbia Management Investment Advisers, LLC and/or certain of its affiliates not waived/reimbursed certain fees and expenses, account value at the end of the period would have been reduced.
3
Portfolio Managers' Report – Columbia Short Term Bond Fund
Performance data quoted represents past performance and current performance may be lower or higher. Past performance is no guarantee of future results. The investment return and principal value will fluctuate so that shares, when redeemed, may be worth more or less than the original cost. Please visit www.columbiamanagement.com for daily and most recent month-end performance updates.
Net asset value per share
as of 03/31/12 ($)
| Class A | | | 9.95 | | |
| Class B | | | 9.95 | | |
| Class C | | | 9.94 | | |
| Class I | | | 9.93 | | |
| Class R | | | 9.96 | | |
| Class R4 | | | 9.93 | | |
| Class W | | | 9.96 | | |
| Class Y | | | 9.93 | | |
| Class Z | | | 9.94 | | |
Distributions declared per share
04/01/11 – 03/31/12 ($)
| Class A | | | 0.17 | | |
| Class B | | | 0.09 | | |
| Class C | | | 0.14 | | |
| Class I | | | 0.20 | | |
| Class R | | | 0.14 | | |
| Class R4 | | | 0.17 | | |
| Class W | | | 0.17 | | |
| Class Y | | | 0.20 | | |
| Class Z | | | 0.19 | | |
30-day SEC yields
as of 03/31/12 (%)
| Class A | | | 1.40 | | |
| Class B | | | 0.68 | | |
| Class C | | | 1.03 | | |
| Class I | | | 1.68 | | |
| Class R | | | 1.18 | | |
| Class R4 | | | 1.32 | | |
| Class W | | | 1.44 | | |
| Class Y | | | 1.68 | | |
| Class Z | | | 1.67 | | |
The 30-day SEC yields reflect the fund's earning power, net of expenses, expressed as an annualized percentage of the public offering price per share at the end of the period. Had Columbia Management Investment Advisers, LLC and/or any of its affiliates not waived fees or reimbursed a portion of expenses, the 30-day SEC yields would have been lower.
For the 12-month period that ended March 31, 2012, the fund's Class A shares returned 1.78% without sales charge. The fund performed in line with its benchmark, the Barclays 1-3 Year Government/Credit Index, which returned 1.78%. In general, the fund's sector positioning benefited performance, as did its yield curve strategy. The fund's overweight in commercial mortgage-backed securities (CMBS), its position in auto asset-backed securities (ABS) and an overweight in corporate bonds were all favorable factors. The fund's duration was shorter than the benchmark index, which dampened results. Duration is a measure of interest rate sensitivity.
Positive sector and yield-curve stance
Against a backdrop of solid performance for structured securities, the fund's overweight in CMBS aided performance. The fund is about equally weighted between agency and non-agency CMBS, and both areas contributed significantly. During the period, we reduced the fund's exposure to agency collateralized mortgage obligations (CMO) and reallocated the proceeds primarily to CMBS and government securities, which also aided performance. CMBS was the best performing short-term investment-grade sector for the period. It benefited from improving fundamentals, limited supply and relative cheapness compared to other short-duration assets. Auto ABS was also a strong performing sector relative to Treasuries, and results benefited from the fund's holdings there, as well as in certain AAA-rated1 floating rate ABS.
The fund's overweight in corporate bonds also aided returns. Within the corporate market, the fund's exposure to finance, wireline communications, real estate investment trusts (REITs), insurance and natural gas was notably positive for performance, as these subsectors outperformed the corporate bond market overall. The remaining corporate subsectors also outperformed Treasuries, albeit to a lesser degree. The fund also benefited from an overweight in the BBB-rated segment of the market, which outperformed AA- and A-rated securities. During the period, we employed a barbell strategy to take advantage of the steep yield curve. (The yield curve charts bond yields from short to long.) This strategy aided returns as the curve flattened during the period, with five-year yields declining more than two-year yields.
Duration, quality orientation detracted from results
The fund's duration was shorter than the benchmark index, which detracted from performance as interest rates declined. The fund's higher quality orientation also dampened returns as lower quality securities outperformed across all sectors of the bond market during the period. All subsectors of the corporate market outperformed Treasuries; however, several sectors, including capital goods, sovereign and technology outperformed to a lesser degree.
1The credit quality ratings represent those of Moody's Investors Service, Inc. ("Moody's"), Standard & Poor's Corporation ("S&P") or Fitch Ratings ("Fitch") credit ratings. The ratings represent their opinions as to the quality of the securities they rate. Ratings are relative and subjective and are not absolute standards of quality. The security's credit quality does not eliminate risk.
4
Portfolio Managers' Report (continued) – Columbia Short Term Bond Fund
Looking ahead
We expect Treasury rates to rise modestly in 2012, as Federal Reserve Board policy is expected to remain highly accommodative. The odds of another monetary stimulus program in the near term have faded given supportive financial markets and better economic data. There has been some improvement in the labor market as evidenced by recent non-farm payroll reports, although the unemployment rate remains much too high. Positive data have been offset somewhat by rising energy prices, which could hamper consumer spending. We are closely watching the upcoming U.S. election as well as events in Europe and the Middle East.
Against this backdrop, the fund remains underweight in U.S. Government securities relative to the benchmark. We continue to favor U.S. agency-backed residential mortgages, including both pass-through and collateralized mortgage obligations, and CMBS, including Government National Mortgage Association (GNMA), government-backed project loans and non-agency AAA-rated CMBS. We have been adding to the fund's position in GNMA Projects, as they are expected to continue to benefit from a yield advantage over Treasuries, while having the full faith and credit guarantee from the U.S. Government.
We believe the corporate sector should continue to offer good relative returns compared to Treasuries. However, valuations are less compelling than they were at the beginning of the year. Technical market factors remain supportive, and corporate fundamentals appear positive as balance sheets and income statements are in good shape. However, we are expecting further rating downgrades of financial institutions in the second quarter of 2012. Within the corporate market, we find particular value in the wireline communication, banking, natural gas pipeline, independent energy, insurance and REIT sectors.
Portfolio characteristics and holdings are subject to change periodically and may not be representative of current characteristics and holdings. The outlook for the fund may differ from that presented for other Columbia Funds.
Investing in fixed-income securities may involve certain risks, including the credit quality of individual issuers, possible prepayments, market or economic developments and yields and share price fluctuations due to changes in interest rates. When interest rates go up, bond prices typically drop, and vice versa.
Investments in real estate securities can be subject to fluctuations in the value of the underlying properties, the effect of economic conditions on real estate values, changes in interest rates and risks related to renting properties, such as rental defaults.
Any guarantee by the U.S. Government, its agencies or instrumentalities applies only to the payment of principal and interest on the guaranteed security and does not guarantee the yield or value of that security.
Portfolio breakdown1
as of 03/31/12 (%)
Asset-Backed Securities—
Agency | | | 0.0 | * | |
Asset-Backed Securities—
Non-Agency | | | 16.7 | | |
Commercial Mortgage-Backed
Securities—Agency | | | 7.6 | | |
Commercial Mortgage-Backed
Securities—Non-Agency | | | 6.7 | | |
| Corporate Bonds & Notes | | | 30.9 | | |
Foreign Government
Obligations | | | 1.0 | | |
| Inflation-Indexed Bonds | | | 1.0 | | |
| Municipal Bonds | | | 0.5 | | |
Residential Mortgage-Backed
Securities—Agency | | | 18.5 | | |
Residential Mortgage-Backed
Securities—Non-Agency | | | 1.9 | | |
U.S. Government & Agency
Obligations | | | 2.9 | | |
| U.S. Treasury Obligations | | | 8.3 | | |
| Other2 | | | 4.0 | | |
*Rounds to less than 0.1%
1Percentages indicated are based upon total investments. The Fund's portfolio composition is subject to change.
2Includes investments in money market funds.
5
Portfolio Managers' Report (continued) – Columbia Short Term Bond Fund
Top 10 holdings3
as of 03/31/12 (%)
U.S. Treasury
2.000% 01/31/16 | | | 4.6 | | |
U.S. Treasury Note
0.375% 03/15/15 | | | 2.6 | | |
Federal Home Loan
Mortgage Corp.
3.500% 04/01/27 | | | 2.1 | | |
Federal National Mortgage
Association
0.286% 03/04/14 | | | 2.0 | | |
General Electric Capital Corp
0.734% 09/15/14 | | | 1.3 | | |
Credit Suisse First Boston
Mortgage Securities Corp.
Series 2002-CP5 Class A2
4.940% 12/15/35 | | | 0.9 | | |
U.S. Treasury
0.250% 12/15/14 | | | 0.9 | | |
Federal Home Loan Mortgage
Corp. CMO Series 3774
Class AB
3.500% 12/15/20 | | | 0.9 | | |
U.S. Treasury Inflation-Indexed
Bond
3.000% 07/15/12 | | | 0.8 | | |
Government National
Mortgage Association
CMO Series 2011-49 Class A
2.450% 07/16/38 | | | 0.8 | | |
3Percentages indicated are based upon total investments (excluding investments in money market funds).
For further detail about these holdings, please refer to the section entitled "Portfolio of Investments."
Fund holdings are as of the date given, are subject to change at any time, and are not recommendations to buy or sell any security.
Quality Breakdown4
as of 03/31/12 (%)
| AAA rating | | | 60.1 | | |
| AA rating | | | 8.9 | | |
| A rating | | | 14.8 | | |
| BBB rating | | | 16.2 | | |
4Percentages indicated are based upon total fixed income securities (excluding money market funds).
Bond ratings apply to the underlying holdings of the Fund and not the Fund itself and are divided into categories ranging from AAA (highest) to D (lowest), and are subject to change. The ratings shown are determined by using the middle rating of Moody's, S&P, and Fitch after dropping the highest and lowest available ratings. When a rating from only two agencies is available, the lower rating is used. When a rating from only one agency is available, that rating is used. When a bond is not rated by one of these agencies, it is designated as Not Rated. Credit ratings are subjective opinions and not statements of fact.
6
Portfolio of Investments – Columbia Short Term Bond Fund
March 31, 2012
(Percentages represent value of investments compared to net assets)
| Issuer | | Coupon
Rate | | Principal
Amount | | Value | |
| Corporate Bonds & Notes 31.5% | |
| Aerospace & Defense 0.3% | |
| L-3 Communications Corp. | |
| 11/15/16 | | | 3.950 | % | | $ | 7,465,000 | | | $ | 7,859,801 | | |
| Banking 9.3% | |
Abbey National Treasury Services PLC
Bank Guaranteed(a) | |
| 04/25/14 | | | 2.137 | % | | | 12,000,000 | | | | 11,659,057 | | |
BB&T Corp.
Senior Unsecured(a) | |
| 04/28/14 | | | 1.253 | % | | | 10,237,000 | | | | 10,283,804 | | |
BNP Paribas SA
Bank Guaranteed(a) | |
| 01/10/14 | | | 1.482 | % | | | 11,830,000 | | | | 11,582,018 | | |
Bank of Montreal
Senior Unsecured(a) | |
| 04/29/14 | | | 1.023 | % | | | 8,195,000 | | | | 8,209,005 | | |
Bank of New York Mellon Corp. (The)
Senior Unsecured(a) | |
| 07/28/14 | | | 0.823 | % | | | 11,000,000 | | | | 10,995,502 | | |
Barclays Bank PLC
Senior Unsecured | |
| 04/07/15 | | | 3.900 | % | | | 7,325,000 | | | | 7,610,470 | | |
Capital One Financial Corp.
Senior Unsecured(a) | |
| 07/15/14 | | | 1.717 | % | | | 11,085,000 | | | | 10,975,591 | | |
Citigroup, Inc.
Senior Unsecured | |
| 06/15/16 | | | 3.953 | % | | | 19,100,000 | | | | 19,628,191 | | |
Commonwealth Bank of Australia
Senior Unsecured(b) | |
| 10/15/14 | | | 3.750 | % | | | 11,000,000 | | | | 11,527,725 | | |
| Cooperatieve Centrale Raiffeisen-Boerenleenbank BA | |
| 01/10/14 | | | 1.850 | % | | | 11,000,000 | | | | 11,097,922 | | |
Goldman Sachs Group Inc. (The)
Senior Unsecured(a) | |
| 03/22/16 | | | 0.924 | % | | | 14,175,000 | | | | 12,938,685 | | |
HSBC USA, Inc.
Senior Unsecured | |
| 02/13/15 | | | 2.375 | % | | | 13,500,000 | | | | 13,592,569 | | |
ING Bank NV
Senior Unsecured(b) | |
| 06/09/14 | | | 1.875 | % | | | 12,000,000 | | | | 11,873,184 | | |
JPMorgan Chase & Co.
Senior Unsecured | |
| 07/05/16 | | | 3.150 | % | | | 20,685,000 | | | | 21,323,422 | | |
KeyCorp
Senior Unsecured | |
| 08/13/15 | | | 3.750 | % | | | 10,000,000 | | | | 10,572,664 | | |
Lloyds TSB Bank PLC
Bank Guaranteed | |
| 01/21/16 | | | 4.875 | % | | | 11,500,000 | | | | 11,923,626 | | |
Merrill Lynch & Co., Inc.
Senior Unsecured | |
| 01/15/15 | | | 5.000 | % | | | 17,200,000 | | | | 17,943,848 | | |
Morgan Stanley
Senior Unsecured(a) | |
| 01/09/14 | | | 0.769 | % | | | 17,000,000 | | | | 16,166,830 | | |
| Issuer | | Coupon
Rate | | Principal
Amount | | Value | |
| Corporate Bonds & Notes (continued) | |
| Banking (cont.) | |
Toronto-Dominion Bank (The)
Senior Unsecured(a) | |
| 07/14/14 | | | 0.867 | % | | $ | 9,765,000 | | | $ | 9,801,941 | | |
U.S. Bank
Subordinated Notes(a) | |
| 04/29/20 | | | 3.778 | % | | | 14,000,000 | | | | 14,616,924 | | |
Wells Fargo & Co.
Senior Unsecured(a) | |
| 10/28/15 | | | 0.753 | % | | | 17,832,000 | | | | 17,445,242 | | |
| Total | | | 271,768,220 | | |
| Chemicals 0.3% | |
Dow Chemical Co. (The)
Senior Unsecured | |
| 02/15/15 | | | 5.900 | % | | | 6,835,000 | | | | 7,694,112 | | |
| Construction Machinery 0.4% | |
John Deere Capital Corp.
Senior Unsecured | |
| 04/03/13 | | | 4.500 | % | | | 5,151,000 | | | | 5,358,977 | | |
John Deere Capital Corp.(a)
Senior Unsecured | |
| 03/03/14 | | | 0.700 | % | | | 7,483,000 | | | | 7,502,411 | | |
| Total | | | 12,861,388 | | |
| Diversified Manufacturing 0.6% | |
| Ingersoll-Rand Global Holding Co., Ltd. | |
| 04/15/14 | | | 9.500 | % | | | 6,002,000 | | | | 6,915,709 | | |
| Tyco International Finance SA | |
| 10/15/14 | | | 4.125 | % | | | 11,220,000 | | | | 11,998,365 | | |
| Total | | | 18,914,074 | | |
| Electric 1.5% | |
| CenterPoint Energy Houston Electric LLC(b) | |
| 01/15/14 | | | 5.750 | % | | | 1,000,000 | | | | 1,080,305 | | |
Consolidated Edison Co. of New York, Inc.
Senior Unsecured | |
| 02/01/13 | | | 4.875 | % | | | 5,693,000 | | | | 5,893,616 | | |
| 04/01/14 | | | 5.550 | % | | | 265,000 | | | | 289,115 | | |
DTE Energy Co.
Senior Unsecured(a) | |
| 06/03/13 | | | 1.180 | % | | | 7,095,000 | | | | 7,121,778 | | |
Jersey Central Power & Light Co.
Senior Unsecured | |
| 05/01/16 | | | 5.625 | % | | | 2,000,000 | | | | 2,247,112 | | |
| National Rural Utilities Cooperative Finance Corp. | |
| 07/01/13 | | | 5.500 | % | | | 9,525,000 | | | | 10,097,967 | | |
| 02/02/15 | | | 1.000 | % | | | 3,815,000 | | | | 3,819,662 | | |
| Nevada Power Co. | |
| 03/15/16 | | | 5.950 | % | | | 1,000,000 | | | | 1,144,198 | | |
Ohio Power Co.
Senior Unsecured | |
| 09/01/13 | | | 5.750 | % | | | 5,870,000 | | | | 6,260,783 | | |
Progress Energy, Inc.
Senior Unsecured | |
| 03/15/14 | | | 6.050 | % | | | 2,715,000 | | | | 2,977,171 | | |
| Sierra Pacific Power Co. | |
| 09/01/13 | | | 5.450 | % | | | 1,710,000 | | | | 1,814,195 | | |
| Total | | | 42,745,902 | | |
The Accompanying Notes to Financial Statements are an integral part of this statement.
7
Columbia Short Term Bond Fund
March 31, 2012
(Percentages represent value of investments compared to net assets)
| Issuer | | Coupon
Rate | | Principal
Amount | | Value | |
| Corporate Bonds & Notes (continued) | |
| Food and Beverage 1.7% | |
| Anheuser-Busch InBev Worldwide, Inc.(a) | |
| 07/14/14 | | | 0.927 | % | | $ | 11,375,000 | | | $ | 11,392,279 | | |
| Bacardi Ltd.(b) | |
| 04/01/14 | | | 7.450 | % | | | 6,200,000 | | | | 6,924,048 | | |
General Mills, Inc.
Senior Unsecured(a) | |
| 05/16/14 | | | 0.848 | % | | | 13,445,000 | | | | 13,469,013 | | |
Kraft Foods, Inc.
Senior Unsecured(a) | |
| 07/10/13 | | | 1.457 | % | | | 8,800,000 | | | | 8,856,100 | | |
SABMiller PLC(b)
Senior Unsecured | |
| 08/15/13 | | | 5.500 | % | | | 4,685,000 | | | | 4,948,232 | | |
| 01/15/14 | | | 5.700 | % | | | 4,360,000 | | | | 4,710,330 | | |
| Total | | | 50,300,002 | | |
| Gas Distributors 0.4% | |
Atmos Energy Corp.
Senior Unsecured | |
| 01/15/13 | | | 5.125 | % | | | 1,960,000 | | | | 2,026,808 | | |
| 06/15/17 | | | 6.350 | % | | | 1,525,000 | | | | 1,784,116 | | |
Sempra Energy
Senior Unsecured | |
| 02/01/13 | | | 6.000 | % | | | 2,272,000 | | | | 2,371,127 | | |
| 11/15/13 | | | 8.900 | % | | | 5,230,000 | | | | 5,851,136 | | |
| Total | | | 12,033,187 | | |
| Gas Pipelines 1.6% | |
Energy Transfer Partners LP
Senior Unsecured | |
| 04/15/14 | | | 8.500 | % | | | 5,215,000 | | | | 5,893,101 | | |
| Nisource Finance Corp. | |
| 03/01/13 | | | 6.150 | % | | | 4,288,000 | | | | 4,479,374 | | |
| Plains All American Pipeline LP/Finance Corp. | |
| 09/01/12 | | | 4.250 | % | | | 8,220,000 | | | | 8,319,807 | | |
Southern Natural Gas Co.
Senior Unsecured(b) | |
| 04/01/17 | | | 5.900 | % | | | 8,530,000 | | | | 9,659,551 | | |
TransCanada PipeLines Ltd.
Senior Unsecured | |
| 06/01/15 | | | 3.400 | % | | | 7,350,000 | | | | 7,859,401 | | |
Williams Partners LP/Finance Corp.
Senior Unsecured | |
| 02/01/17 | | | 7.250 | % | | | 7,790,000 | | | | 9,374,400 | | |
| Total | | | 45,585,634 | | |
| Health Care 1.0% | |
Cardinal Health, Inc.
Senior Unsecured | |
| 06/15/15 | | | 4.000 | % | | | 8,770,000 | | | | 9,435,836 | | |
| Express Scripts Holding Co. | |
| 06/15/14 | | | 6.250 | % | | | 9,080,000 | | | | 9,963,193 | | |
Hospira, Inc.
Senior Unsecured | |
| 06/15/14 | | | 5.900 | % | | | 2,000,000 | | | | 2,158,790 | | |
| 03/30/17 | | | 6.050 | % | | | 6,287,000 | | | | 6,999,204 | | |
| Total | | | 28,557,023 | | |
| Issuer | | Coupon
Rate | | Principal
Amount | | Value | |
| Corporate Bonds & Notes (continued) | |
| Healthcare Insurance 0.3% | |
Cigna Corp.
Senior Unsecured | |
| 11/15/16 | | | 2.750 | % | | $ | 8,615,000 | | | $ | 8,722,455 | | |
| Independent Energy 1.4% | |
Anadarko Petroleum Corp.
Senior Unsecured | |
| 03/15/14 | | | 7.625 | % | | | 8,084,000 | | | | 9,014,355 | | |
Canadian Natural Resources Ltd.
Senior Unsecured | |
| 10/01/12 | | | 5.450 | % | | | 5,090,000 | | | | 5,208,704 | | |
Encana Corp.
Senior Unsecured | |
| 12/01/17 | | | 5.900 | % | | | 7,430,000 | | | | 8,660,222 | | |
| Southwestern Energy Co. | |
| 02/01/18 | | | 7.500 | % | | | 6,100,000 | | | | 7,349,610 | | |
| Woodside Finance Ltd.(b) | |
| 03/01/14 | | | 8.125 | % | | | 2,070,000 | | | | 2,294,620 | | |
| 11/10/14 | | | 4.500 | % | | | 7,225,000 | | | | 7,669,995 | | |
| Total | | | 40,197,506 | | |
| Integrated Energy 0.3% | |
| Phillips 66(b) | |
| 03/05/15 | | | 1.950 | % | | | 2,135,000 | | | | 2,149,768 | | |
| 05/01/17 | | | 2.950 | % | | | 6,460,000 | | | | 6,565,957 | | |
| Total | | | 8,715,725 | | |
| Life Insurance 1.1% | |
Lincoln National Corp.
Senior Unsecured | |
| 08/27/12 | | | 5.650 | % | | | 5,300,000 | | | | 5,397,435 | | |
| 02/15/14 | | | 4.750 | % | | | 3,855,000 | | | | 4,024,239 | | |
Metlife Institutional Funding II
Secured(a)(b) | |
| 04/04/14 | | | 1.368 | % | | | 11,015,000 | | | | 11,054,147 | | |
Prudential Financial, Inc.
Senior Unsecured | |
| 06/15/17 | | | 6.100 | % | | | 9,030,000 | | | | 10,427,537 | | |
| Total | | | 30,903,358 | | |
| Media Cable 0.8% | |
| Comcast Corp. | |
| 03/15/16 | | | 5.900 | % | | | 10,391,000 | | | | 11,997,708 | | |
| DIRECTV Holdings LLC/Financing Co., Inc. | |
| 02/15/16 | | | 3.125 | % | | | 10,005,000 | | | | 10,378,997 | | |
| Total | | | 22,376,705 | | |
| Media Non-Cable 0.7% | |
| News America, Inc. | |
| 12/15/14 | | | 5.300 | % | | | 10,210,000 | | | | 11,295,119 | | |
| TCM Sub LLC(b) | |
| 01/15/15 | | | 3.550 | % | | | 9,605,000 | | | | 10,163,799 | | |
| Total | | | 21,458,918 | | |
| Metals 0.4% | |
ArcelorMittal
Senior Unsecured | |
| 02/25/17 | | | 4.500 | % | | | 9,000,000 | | | | 9,022,755 | | |
| Vale Overseas Ltd | |
| 01/11/16 | | | 6.250 | % | | | 3,100,000 | | | | 3,516,519 | | |
| Total | | | 12,539,274 | | |
The Accompanying Notes to Financial Statements are an integral part of this statement.
8
Columbia Short Term Bond Fund
March 31, 2012
(Percentages represent value of investments compared to net assets)
| Issuer | | Coupon
Rate | | Principal
Amount | | Value | |
| Corporate Bonds & Notes (continued) | |
| Non-Captive Diversified 1.3% | |
General Electric Capital Corp.
Senior Unsecured(a) | |
| 09/15/14 | | | 0.734 | % | | $ | 37,325,000 | | | $ | 36,827,383 | | |
| Oil Field Services 0.3% | |
| Weatherford International Ltd. | |
| 03/15/13 | | | 5.150 | % | | | 139,000 | | | | 143,411 | | |
| Weatherford International, Inc. | |
| 06/15/17 | | | 6.350 | % | | | 7,530,000 | | | | 8,695,185 | | |
| Total | | | 8,838,596 | | |
| Pharmaceuticals 0.5% | |
Pfizer, Inc.
Senior Unsecured | |
| 02/15/14 | | | 4.500 | % | | | 8,830,000 | | | | 9,483,888 | | |
| Roche Holdings, Inc.(b) | |
| 03/01/14 | | | 5.000 | % | | | 3,945,000 | | | | 4,252,035 | | |
Sanofi
Senior Unsecured(a) | |
| 03/28/14 | | | 0.783 | % | | | 1,000,000 | | | | 1,005,184 | | |
| Total | | | 14,741,107 | | |
| Property & Casualty 1.3% | |
Berkshire Hathaway, Inc.
Senior Unsecured | |
| 08/15/14 | | | 1.203 | % | | | 13,390,000 | | | | 13,568,837 | | |
CNA Financial Corp.
Senior Unsecured | |
| 12/15/14 | | | 5.850 | % | | | 9,433,000 | | | | 10,167,840 | | |
Liberty Mutual Group, Inc.
Senior Unsecured(b) | |
| 03/15/14 | | | 5.750 | % | | | 6,613,000 | | | | 6,970,036 | | |
Transatlantic Holdings, Inc.
Senior Unsecured | |
| 12/14/15 | | | 5.750 | % | | | 7,240,000 | | | | 7,810,997 | | |
| Total | | | 38,517,710 | | |
| REITs 1.2% | |
Camden Property Trust
Senior Unsecured | |
| 11/30/12 | | | 5.875 | % | | | 7,660,000 | | | | 7,851,102 | | |
| 12/15/13 | | | 5.375 | % | | | 1,460,000 | | | | 1,542,332 | | |
Duke Realty LP
Senior Unsecured | |
| 02/15/15 | | | 7.375 | % | | | 7,340,000 | | | | 8,245,550 | | |
Kimco Realty Corp.
Senior Unsecured | |
| 02/01/18 | | | 4.300 | % | | | 7,300,000 | | | | 7,419,275 | | |
Simon Property Group LP
Senior Unsecured | |
| 03/01/17 | | | 5.875 | % | | | 10,000,000 | | | | 11,543,600 | | |
| Total | | | 36,601,859 | | |
| Retailers 0.3% | |
CVS Caremark Corp.
Senior Unsecured | |
| 05/18/15 | | | 3.250 | % | | | 7,500,000 | | | | 7,949,303 | | |
| Issuer | | Coupon
Rate | | Principal
Amount | | Value | |
| Corporate Bonds & Notes (continued) | |
| Technology 1.1% | |
Cisco Systems, Inc.
Senior Unsecured(a) | |
| 03/14/14 | | | 0.724 | % | | $ | 6,600,000 | | | $ | 6,633,680 | | |
Hewlett-Packard Co.
Senior Unsecured(a) | |
| 05/30/14 | | | 0.891 | % | | | 14,775,000 | | | | 14,604,009 | | |
International Business Machines Corp.
Senior Unsecured | |
| 02/06/15 | | | 0.550 | % | | | 10,000,000 | | | | 9,947,830 | | |
| Total | | | 31,185,519 | | |
| Transportation Services 0.3% | |
| ERAC U.S.A. Finance LLC(b) | |
| 01/10/14 | | | 2.250 | % | | | 1,500,000 | | | | 1,509,631 | | |
| 05/01/15 | | | 5.600 | % | | | 7,000,000 | | | | 7,691,495 | | |
| Total | | | 9,201,126 | | |
| Wireless 0.3% | |
| America Movil SAB de CV | |
| 03/01/14 | | | 5.500 | % | | | 9,170,000 | | | | 9,897,474 | | |
| Wirelines 2.8% | |
AT&T, Inc.
Senior Unsecured | |
| 11/15/13 | | | 6.700 | % | | | 13,000,000 | | | | 14,221,116 | | |
CenturyLink, Inc.
Senior Unsecured | |
| 06/15/17 | | | 5.150 | % | | | 9,000,000 | | | | 9,279,594 | | |
| Deutsche Telekom International Finance BV | |
| 08/20/13 | | | 5.875 | % | | | 9,580,000 | | | | 10,199,836 | | |
France Telecom SA
Senior Unsecured | |
| 09/16/15 | | | 2.125 | % | | | 7,805,000 | | | | 7,953,584 | | |
| 09/14/16 | | | 2.750 | % | | | 3,335,000 | | | | 3,430,511 | | |
| Telecom Italia Capital SA | |
| 10/01/15 | | | 5.250 | % | | | 9,785,000 | | | | 10,103,012 | | |
| Telefonica Emisiones SAU | |
| 01/15/15 | | | 4.949 | % | | | 12,000,000 | | | | 12,373,980 | | |
Verizon Virginia, Inc.
Senior Unsecured | |
| 03/15/13 | | | 4.625 | % | | | 13,967,000 | | | | 14,401,009 | | |
| Total | | | 81,962,642 | | |
Total Corporate Bonds & Notes
(Cost: $903,770,945) | | $ | 918,956,003 | | |
| Residential Mortgage-Backed Securities—Agency 18.9% | |
FDIC Structured Sale Guaranteed Notes
CMO Series 2010-S1 Class 1A(a)(b)(c) | |
| 02/25/48 | | | 0.550 | % | | $ | 12,954,475 | | | $ | 12,957,545 | | |
| Federal Home Loan Mortgage Corp.(a)(c) | |
| 04/01/35 | | | 2.358 | % | | | 404,196 | | | | 425,500 | | |
| 03/01/34 | | | 2.387 | % | | | 587,659 | | | | 620,103 | | |
| 08/01/36 | | | 2.485 | % | | | 245,387 | | | | 262,443 | | |
| 01/01/37 | | | 2.489 | % | | | 719,965 | | | | 767,010 | | |
| 01/01/36 | | | 2.783 | % | | | 1,264,138 | | | | 1,353,530 | | |
| 09/01/37 | | | 5.560 | % | | | 858,292 | | | | 892,109 | | |
| 07/01/36 | | | 5.881 | % | | | 23,152 | | | | 24,908 | | |
| 12/01/36 | | | 6.044 | % | | | 463,760 | | | | 503,209 | | |
The Accompanying Notes to Financial Statements are an integral part of this statement.
9
Columbia Short Term Bond Fund
March 31, 2012
(Percentages represent value of investments compared to net assets)
| Issuer | | Coupon
Rate | | Principal
Amount | | Value | |
| Residential Mortgage-Backed Securities—Agency (continued) | |
| CMO IO Series 3630 Class AI | | | | | | | | | | | | | |
| 03/15/17 | | | 1.931 | % | | $ | 5,698,993 | | | $ | 225,309 | | |
| Federal Home Loan Mortgage Corp.(c) | |
| 05/01/24-07/01/25 | | | 4.000 | % | | | 17,648,512 | | | | 18,646,423 | | |
| 02/01/13-05/01/25 | | | 4.500 | % | | | 13,002,863 | | | | 13,870,272 | | |
| 11/01/17-07/01/25 | | | 5.000 | % | | | 29,721,809 | | | | 32,001,732 | | |
| 05/01/17-02/01/24 | | | 5.500 | % | | | 14,965,079 | | | | 16,214,925 | | |
| 03/01/17-10/01/21 | | | 6.000 | % | | | 2,184,955 | | | | 2,372,344 | | |
| 04/01/17 | | | 6.500 | % | | | 4,209,961 | | | | 4,614,495 | | |
| 09/01/15 | | | 7.500 | % | | | 14,809 | | | | 15,620 | | |
| CMO Series 2467 Class NB | | | | | | | | | | | | | |
| 07/15/17 | | | 5.000 | % | | | 4,240,867 | | | | 4,534,433 | | |
| CMO Series 2535 Class TE | | | | | | | | | | | | | |
| 12/15/31 | | | 5.500 | % | | | 1,506,286 | | | | 1,540,835 | | |
| CMO Series 2624 Class LP | | | | | | | | | | | | | |
| 01/15/17 | | | 3.500 | % | | | 187,743 | | | | 188,247 | | |
| CMO Series 2899 Class KC | | | | | | | | | | | | | |
| 03/15/19 | | | 4.500 | % | | | 4,023,336 | | | | 4,123,540 | | |
| CMO Series 3197 Class AB | | | | | | | | | | | | | |
| 08/15/13 | | | 5.500 | % | | | 4,791 | | | | 4,798 | | |
| CMO Series 3414 Class A | | | | | | | | | | | | | |
| 07/15/22 | | | 4.500 | % | | | 7,271,056 | | | | 7,609,321 | | |
| CMO Series 3455 Class KA | | | | | | | | | | | | | |
| 10/15/34 | | | 5.000 | % | | | 1,086,560 | | | | 1,112,959 | | |
| CMO Series 3531 Class CE | | | | | | | | | | | | | |
| 01/15/39 | | | 3.000 | % | | | 1,697,587 | | | | 1,746,050 | | |
| CMO Series 3536 Class PC | | | | | | | | | | | | | |
| 05/15/39 | | | 4.500 | % | | | 5,163,310 | | | | 5,477,395 | | |
| CMO Series 3552 Class AB | | | | | | | | | | | | | |
| 10/15/36 | | | 5.000 | % | | | 8,477,384 | | | | 8,819,140 | | |
| CMO Series 3553 Class GA | | | | | | | | | | | | | |
| 07/15/19 | | | 3.200 | % | | | 6,809,734 | | | | 6,943,786 | | |
| CMO Series 3556 Class MA | | | | | | | | | | | | | |
| 07/15/37 | | | 5.000 | % | | | 5,896,080 | | | | 6,250,966 | | |
| CMO Series 3558 Class AD | | | | | | | | | | | | | |
| 08/15/19 | | | 4.750 | % | | | 9,123,252 | | | | 9,530,610 | | |
| CMO Series 3561 Class AJ | | | | | | | | | | | | | |
| 08/15/19 | | | 3.100 | % | | | 2,742,623 | | | | 2,795,851 | | |
| CMO Series 3565 Class KA | | | | | | | | | | | | | |
| 12/15/35 | | | 5.000 | % | | | 4,334,642 | | | | 4,462,574 | | |
| CMO Series 3567 Class ND | | | | | | | | | | | | | |
| 12/15/17 | | | 4.000 | % | | | 9,357,276 | | | | 9,831,682 | | |
| CMO Series 3774 Class AB | | | | | | | | | | | | | |
| 12/15/20 | | | 3.500 | % | | | 23,294,067 | | | | 24,677,725 | | |
| CMO Series 3812 Class BE | | | | | | | | | | | | | |
| 09/15/18 | | | 2.750 | % | | | 8,257,133 | | | | 8,585,114 | | |
| CMO Series 3831 Class CG | | | | | | | | | | | | | |
| 10/15/18 | | | 3.000 | % | | | 16,758,172 | | | | 17,489,887 | | |
| CMO Series 3832 Class AC | | | | | | | | | | | | | |
| 10/15/18 | | | 3.000 | % | | | 12,004,372 | | | | 12,528,521 | | |
| CMO Series 3840 Class AU | | | | | | | | | | | | | |
| 05/15/37 | | | 3.500 | % | | | 6,056,691 | | | | 6,239,655 | | |
| CMO Series 3856 Class EA | | | | | | | | | | | | | |
| 10/15/18 | | | 3.000 | % | | | 12,159,233 | | | | 12,706,725 | | |
| CMO Series 3862 Class LA | | | | | | | | | | | | | |
| 11/15/18 | | | 2.500 | % | | | 3,705,226 | | | | 3,830,925 | | |
| CMO Series R010 Class AB | | | | | | | | | | | | | |
| 12/15/19 | | | 5.500 | % | | | 3,155,712 | | | | 3,244,957 | | |
| Issuer | | Coupon
Rate | | Principal
Amount | | Value | |
| Residential Mortgage-Backed Securities—Agency (continued) | |
| Federal Home Loan Mortgage Corp.(c)(d) | |
| 04/01/27 | | | 3.500 | % | | $ | 58,515,000 | | | $ | 61,184,747 | | |
Federal Home Loan Mortgage Corp.(c)(e)
CMO IO Series 11 Class B | | | | | | | | | | | | | |
| 01/01/20 | | | 10.000 | % | | | 3,611 | | | | 935 | | |
| Federal National Mortgage Association(a)(c) | |
| 06/01/33 | | | 1.921 | % | | | 1,229,604 | | | | 1,268,292 | | |
| 04/01/36 | | | 2.146 | % | | | 332,047 | | | | 352,900 | | |
| 11/01/34 | | | 2.173 | % | | | 379,305 | | | | 400,093 | | |
| 07/01/34 | | | 2.284 | % | | | 1,069,710 | | | | 1,137,474 | | |
| 04/01/36 | | | 2.287 | % | | | 1,406,352 | | | | 1,459,728 | | |
| 01/01/35 | | | 2.302 | % | | | 807,592 | | | | 853,458 | | |
| 04/01/34 | | | 2.313 | % | | | 967,490 | | | | 1,016,217 | | |
| 08/01/35 | | | 2.349 | % | | | 694,217 | | | | 728,989 | | |
| 06/01/34 | | | 2.500 | % | | | 771,883 | | | | 822,725 | | |
| 03/01/34 | | | 2.588 | % | | | 931,278 | | | | 993,804 | | |
| 08/01/36 | | | 4.126 | % | | | 217,672 | | | | 227,403 | | |
| 06/01/35 | | | 4.527 | % | | | 1,210,451 | | | | 1,283,235 | | |
| 07/01/33 | | | 4.952 | % | | | 1,773,003 | | | | 1,897,257 | | |
| 07/01/35 | | | 4.966 | % | | | 1,034,122 | | | | 1,100,632 | | |
| 04/01/36 | | | 5.430 | % | | | 275,864 | | | | 296,286 | | |
| 09/01/37 | | | 5.730 | % | | | 307,482 | | | | 329,060 | | |
| 07/01/36 | | | 5.757 | % | | | 26,735 | | | | 28,773 | | |
| 06/01/37 | | | 5.831 | % | | | 1,779,104 | | | | 1,887,362 | | |
| 10/01/35 | | | 6.045 | % | | | 475,685 | | | | 511,099 | | |
| 09/01/37 | | | 6.301 | % | | | 432,544 | | | | 468,673 | | |
| CMO Series 2003-W11 Class A1 | | | | | | | | | | | | | |
| 06/25/33 | | | 3.128 | % | | | 61,859 | | | | 61,839 | | |
| Federal National Mortgage Association(c) | |
| 10/01/20 | | | 3.500 | % | | | 1,296,769 | | | | 1,370,472 | | |
| 03/01/20 | | | 4.000 | % | | | 2,421,130 | | | | 2,565,974 | | |
| 10/01/13-07/01/25 | | | 4.500 | % | | | 10,910,209 | | | | 11,675,198 | | |
| 08/01/13-03/01/25 | | | 5.000 | % | | | 17,089,909 | | | | 18,474,272 | | |
| 08/01/17-01/01/25 | | | 5.500 | % | | | 54,478,131 | | | | 59,450,506 | | |
| 06/01/17-11/01/17 | | | 6.000 | % | | | 9,067,424 | | | | 9,724,183 | | |
| 08/01/14 | | | 6.500 | % | | | 92,256 | | | | 97,436 | | |
| 06/01/17-08/01/17 | | | 7.000 | % | | | 356,919 | | | | 389,153 | | |
| 08/01/15 | | | 7.500 | % | | | 13,197 | | | | 14,125 | | |
| CMO Series 2002-95 Class EB | | | | | | | | | | | | | |
| 04/25/31 | | | 5.000 | % | | | 363,988 | | | | 368,001 | | |
| CMO Series 2003-129 Class AP | | | | | | | | | | | | | |
| 01/25/19 | | | 4.000 | % | | | 2,370,559 | | | | 2,490,580 | | |
| CMO Series 2003-49 Class YC | | | | | | | | | | | | | |
| 06/25/23 | | | 4.000 | % | | | 1,831,648 | | | | 1,955,928 | | |
| CMO Series 2004-60 Class PA | | | | | | | | | | | | | |
| 04/25/34 | | | 5.500 | % | | | 1,611,847 | | | | 1,751,563 | | |
| CMO Series 2004-78 Class AC | | | | | | | | | | | | | |
| 05/25/32 | | | 5.000 | % | | | 1,538,210 | | | | 1,616,971 | | |
| CMO Series 2005-22 Class KJ | | | | | | | | | | | | | |
| 07/25/33 | | | 5.000 | % | | | 6,964,179 | | | | 7,204,265 | | |
| CMO Series 2006-106 Class PA | | | | | | | | | | | | | |
| 06/25/30 | | | 5.500 | % | | | 74,113 | | | | 74,169 | | |
| CMO Series 2006-22 Class CB | | | | | | | | | | | | | |
| 11/25/21 | | | 4.500 | % | | | 1,370,821 | | | | 1,401,742 | | |
| CMO Series 2007-35 Class DH | | | | | | | | | | | | | |
| 09/25/33 | | | 5.000 | % | | | 1,710,834 | | | | 1,769,905 | | |
| CMO Series 2008-18 Class HD | | | | | | | | | | | | | |
| 12/25/18 | | | 4.000 | % | | | 4,077,399 | | | | 4,310,000 | | |
The Accompanying Notes to Financial Statements are an integral part of this statement.
10
Columbia Short Term Bond Fund
March 31, 2012
(Percentages represent value of investments compared to net assets)
| Issuer | | Coupon
Rate | | Principal
Amount | | Value | |
| Residential Mortgage-Backed Securities—Agency (continued) | |
| CMO Series 2008-45 Class DA | | | | | | | | | | | | | |
| 03/25/23 | | | 4.500 | % | | $ | 6,966,291 | | | $ | 7,565,253 | | |
| CMO Series 2009-70 Class NL | | | | | | | | | | | | | |
| 08/25/19 | | | 3.000 | % | | | 741,636 | | | | 774,454 | | |
| CMO Series 2009-88 Class HA | | | | | | | | | | | | | |
| 11/25/24 | | | 3.000 | % | | | 11,091,633 | | | | 11,574,364 | | |
| CMO Series 2010-9 Class PA | | | | | | | | | | | | | |
| 10/25/39 | | | 4.500 | % | | | 6,992,383 | | | | 7,075,262 | | |
| CMO Series 2011-25 Class AH | | | | | | | | | | | | | |
| 06/25/21 | | | 2.750 | % | | | 14,517,123 | | | | 15,089,040 | | |
| CMO Series 2011-3 Class EK | | | | | | | | | | | | | |
| 05/25/20 | | | 2.750 | % | | | 1,197,142 | | | | 1,243,196 | | |
| Federal National Mortgage Association(c)(d) | |
| 04/01/27 | | | 3.000 | % | | | 14,170,000 | | | | 14,668,163 | | |
Federal National Mortgage Association(c)(e)
CMO IO STRIPS Series 163 Class 2 | | | | | | | | | | | | | |
| 07/25/22 | | | 8.500 | % | | | 215,328 | | | | 31,499 | | |
| CMO IO STRIPS Series 36 Class 2 | | | | | | | | | | | | | |
| 08/01/18 | | | 9.500 | % | | | 2,198 | | | | 437 | | |
Federal National Mortgage Association(c)(f)(g)
CMO PO Series G-15 Class A | | | | | | | | | | | | | |
| 06/25/21 | | | 0.000 | % | | | 13,035 | | | | 12,482 | | |
| CMO PO Series 1993-92 Class C | | | | | | | | | | | | | |
| 05/25/23 | | | 0.000 | % | | | 570,999 | | | | 511,261 | | |
| Government National Mortgage Association(a)(c) | |
| 03/20/30 | | | 2.250 | % | | | 45,553 | | | | 47,068 | | |
| 04/20/22-06/20/29 | | | 2.375 | % | | | 1,186,327 | | | | 1,228,649 | | |
| 07/20/18 | | | 3.000 | % | | | 152,796 | | | | 159,393 | | |
| Government National Mortgage Association(c) | |
| 08/15/13-09/20/21 | | | 6.000 | % | | | 883,418 | | | | 938,216 | | |
| 09/15/13-11/15/33 | | | 6.500 | % | | | 212,627 | | | | 246,022 | | |
| 11/15/13-08/15/29 | | | 7.000 | % | | | 41,185 | | | | 47,738 | | |
| CMO Series 2008-30 Class AC | | | | | | | | | | | | | |
| 06/20/37 | | | 4.000 | % | | | 4,299,191 | | | | 4,499,560 | | |
| CMO Series 2009-33 Class NK | | | | | | | | | | | | | |
| 05/20/39 | | | 4.500 | % | | | 3,322,510 | | | | 3,569,696 | | |
| CMO Series 2010-61 Class PA | | | | | | | | | | | | | |
| 03/20/33 | | | 4.500 | % | | | 5,576,523 | | | | 5,896,213 | | |
Total Residential Mortgage-Backed Securities—Agency
(Cost: $539,237,336) | | $ | 550,236,563 | | |
| Residential Mortgage-Backed Securities—Non-Agency 1.9% | |
BCAP LLC Trust(b)(c)
CMO Series 2010-RR2 Class 5A1 | |
| 12/26/36 | | | 5.000 | % | | $ | 9,633,362 | | | $ | 9,668,117 | | |
| CMO Series 2010-RR4 Class 32A1 | | | | | | | | | | | | | |
| 01/26/37 | | | 4.000 | % | | | 9,405,079 | | | | 9,487,427 | | |
| CMO Series 2010-RR6 Class 6A1 | | | | | | | | | | | | | |
| 07/26/37 | | | 4.000 | % | | | 1,133,939 | | | | 1,135,526 | | |
Banc of America Funding Corp.
CMO Series 2010-R4 Class 4A1(a)(b)(c) | |
| 06/26/37 | | | 0.451 | % | | | 497,648 | | | | 486,429 | | |
Countrywide Alternative Loan Trust
CMO Series 2004-2CB Class 1A4(a)(c) | |
| 03/25/34 | | | 0.642 | % | | | 98,826 | | | | 94,535 | | |
| Issuer | | Coupon
Rate | | Principal
Amount | | Value | |
| Residential Mortgage-Backed Securities—Non-Agency (continued) | |
Credit Suisse Mortgage Capital Certificates(a)(b)(c)
CMO Series 2009-12R Class 27A1 | |
| 04/27/36 | | | 2.885 | % | | $ | 915,174 | | | $ | 912,959 | | |
Credit Suisse Mortgage Capital Certificates(b)(c)
CMO Series 2009-12R Class 14A1 | |
| 11/27/35 | | | 5.500 | % | | | 2,752,591 | | | | 2,839,350 | | |
| CMO Series 2009-12R Class 19A1 | | | | | | | | | | | | | |
| 12/27/36 | | | 6.250 | % | | | 4,325,083 | | | | 4,563,655 | | |
| CMO Series 2009-12R Class 25A1 | | | | | | | | | | | | | |
| 10/27/37 | | | 4.894 | % | | | 4,490,559 | | | | 4,501,656 | | |
| CMO Series 2009-12R Class 30A1 | | | | | | | | | | | | | |
| 12/27/36 | | | 8.020 | % | | | 215,827 | | | | 217,142 | | |
| CMO Series 2009-12R Class 42A1 | | | | | | | | | | | | | |
| 06/27/37 | | | 5.000 | % | | | 1,063,908 | | | | 1,066,720 | | |
| CMO Series 2010-12R Class 12A1 | | | | | | | | | | | | | |
| 05/26/37 | | | 4.000 | % | | | 1,846,508 | | | | 1,881,019 | | |
GSR Mortgage Loan Trust
CMO Series 2005-5F Class 2A3(c) | |
| 06/25/35 | | | 5.500 | % | | | 3,861 | | | | 3,854 | | |
JPMorgan Reremic
CMO Series 2010-2 Class 2A1(a)(b)(c) | | | | | | | | | | | | | |
| 03/21/37 | | | 2.641 | % | | | 2,983,509 | | | | 2,916,917 | | |
LVII Resecuritization Trust
CMO Series 2009-3 Class A1(a)(b)(c) | |
| 11/27/37 | | | 5.600 | % | | | 154,878 | | | | 154,765 | | |
Residential Asset Mortgage Products, Inc.
Series 2005-RS2 Class M1(a)(c) | |
| 02/25/35 | | | 0.692 | % | | | 9,322,916 | | | | 8,887,256 | | |
Residential Asset Securitization Trust
CMO Series 2004-A7 Class A1(c) | |
| 10/25/34 | | | 5.500 | % | | | 617 | | | | 616 | | |
Structured Asset Securities Corp.(c)
CMO Series 2003-14 Class 1A3 | |
| 05/25/33 | | | 5.500 | % | | | 89,420 | | | | 92,566 | | |
| CMO Series 2003-21 Class 1A3 | | | | | | | | | | | | | |
| 07/25/33 | | | 5.500 | % | | | 2,906 | | | | 2,901 | | |
| CMO Series 2003-8 Class 2A7 | | | | | | | | | | | | | |
| 04/25/33 | | | 5.750 | % | | | 577,327 | | | | 595,904 | | |
Wells Fargo Mortgage Loan Trust
CMO Series 2010-RR4 Class 1A1(a)(b)(c) | |
| 12/27/46 | | | 5.262 | % | | | 6,000,507 | | | | 6,003,648 | | |
Total Residential Mortgage-Backed Securities—Non-Agency
(Cost: $55,180,247) | | $ | 55,512,962 | | |
| Commercial Mortgage-Backed Securities—Agency 7.7% | |
Federal Home Loan Mortgage Corp.(c)
Multifamily Structured Pass-Through Certificates
CMO Series K001 Class A2 | |
| 04/25/16 | | | 5.651 | % | | $ | 3,241,109 | | | $ | 3,623,680 | | |
| CMO Series K003 Class A1 | | | | | | | | | | | | | |
| 07/25/13 | | | 2.225 | % | | | 2,407,148 | | | | 2,426,203 | | |
Federal National Mortgage Association
CMO Series 2010-M4 Class A1(c) | | | | | | | | | | | | | |
| 06/25/20 | | | 2.520 | % | | | 2,442,969 | | | | 2,529,103 | | |
Government National Mortgage Association(c)
CMO Series 2007-13 Class C | |
| 06/16/40 | | | 5.020 | % | | | 6,890,461 | | | | 7,346,502 | | |
The Accompanying Notes to Financial Statements are an integral part of this statement.
11
Columbia Short Term Bond Fund
March 31, 2012
(Percentages represent value of investments compared to net assets)
| Issuer | | Coupon
Rate | | Principal
Amount | | Value | |
| Commercial Mortgage-Backed Securities—Agency (continued) | |
| CMO Series 2009-105 Class A | | | | | | | | | | | | | |
| 12/16/50 | | | 3.456 | % | | $ | 6,903,008 | | | $ | 7,153,477 | | |
| CMO Series 2009-114 Class A | | | | | | | | | | | | | |
| 12/16/38 | | | 3.103 | % | | | 5,266,093 | | | | 5,426,849 | | |
| CMO Series 2009-63 Class A | | | | | | | | | | | | | |
| 01/16/38 | | | 3.400 | % | | | 4,019,439 | | | | 4,190,462 | | |
| CMO Series 2009-71 Class A | | | | | | | | | | | | | |
| 04/16/38 | | | 3.304 | % | | | 5,949,290 | | | | 6,169,177 | | |
| CMO Series 2009-90 Class AC | | | | | | | | | | | | | |
| 01/16/33 | | | 3.137 | % | | | 5,400,000 | | | | 5,549,515 | | |
| CMO Series 2010-102 Class AE | | | | | | | | | | | | | |
| 11/16/39 | | | 3.500 | % | | | 10,150,724 | | | | 10,661,508 | | |
| CMO Series 2010-13 Class A | | | | | | | | | | | | | |
| 08/16/22 | | | 2.461 | % | | | 3,850,940 | | | | 3,873,086 | | |
| CMO Series 2010-141 Class A | | | | | | | | | | | | | |
| 08/16/31 | | | 1.864 | % | | | 4,585,746 | | | | 4,625,633 | | |
| CMO Series 2010-159 Class A | | | | | | | | | | | | | |
| 01/16/33 | | | 2.159 | % | | | 6,889,539 | | | | 6,997,375 | | |
| CMO Series 2010-161 Class AB | | | | | | | | | | | | | |
| 05/16/35 | | | 2.110 | % | | | 15,754,784 | | | | 16,023,766 | | |
| CMO Series 2010-18 Class A | | | | | | | | | | | | | |
| 12/16/50 | | | 3.100 | % | | | 4,814,428 | | | | 5,001,324 | | |
| CMO Series 2010-22 Class AC | | | | | | | | | | | | | |
| 12/16/30 | | | 2.229 | % | | | 3,142,823 | | | | 3,179,880 | | |
| CMO Series 2010-49 Class A | | | | | | | | | | | | | |
| 03/16/51 | | | 2.870 | % | | | 1,248,698 | | | | 1,277,249 | | |
| CMO Series 2010-65 Class A | | | | | | | | | | | | | |
| 11/16/28 | | | 2.017 | % | | | 3,464,204 | | | | 3,487,649 | | |
| CMO Series 2010-83 Class A | | | | | | | | | | | | | |
| 10/16/50 | | | 2.021 | % | | | 4,203,493 | | | | 4,234,657 | | |
| CMO Series 2011-1 Class A | | | | | | | | | | | | | |
| 12/16/31 | | | 2.239 | % | | | 5,641,811 | | | | 5,738,949 | | |
| CMO Series 2011-120 Class AB | | | | | | | | | | | | | |
| 08/16/33 | | | 2.400 | % | | | 12,961,156 | | | | 13,240,378 | | |
| CMO Series 2011-143 Class AB | | | | | | | | | | | | | |
| 03/16/33 | | | 3.973 | % | | | 18,762,931 | | | | 19,786,768 | | |
| CMO Series 2011-144 Class AB | | | | | | | | | | | | | |
| 07/16/35 | | | 2.012 | % | | | 5,155,809 | | | | 5,244,747 | | |
| CMO Series 2011-149 Class A | | | | | | | | | | | | | |
| 10/16/46 | | | 3.000 | % | | | 4,603,797 | | | | 4,808,261 | | |
| CMO Series 2011-16 Class A | | | | | | | | | | | | | |
| 11/16/34 | | | 2.210 | % | | | 8,287,856 | | | | 8,426,058 | | |
| CMO Series 2011-20 Class A | | | | | | | | | | | | | |
| 04/16/32 | | | 1.883 | % | | | 7,115,053 | | | | 7,189,818 | | |
| CMO Series 2011-31 Class A | | | | | | | | | | | | | |
| 12/16/35 | | | 2.210 | % | | | 5,804,048 | | | | 5,912,398 | | |
| CMO Series 2011-49 Class A | | | | | | | | | | | | | |
| 07/16/38 | | | 2.450 | % | | | 21,240,093 | | | | 21,764,150 | | |
| CMO Series 2011-78 Class A | | | | | | | | | | | | | |
| 08/16/34 | | | 2.250 | % | | | 11,394,050 | | | | 11,589,596 | | |
| CMO Series 2012-1 Class AB | | | | | | | | | | | | | |
| 09/16/33 | | | 1.999 | % | | | 9,821,165 | | | | 9,978,438 | | |
| CMO Series 2012-22 Class AB | | | | | | | | | | | | | |
| 03/16/33 | | | 1.661 | % | | | 5,800,436 | | | | 5,843,471 | | |
| CMO Series 2012-9 Class A | | | | | | | | | | | | | |
| 05/16/39 | | | 3.220 | % | | | 2,491,467 | | | | 2,608,569 | | |
Total Commercial Mortgage-Backed Securities—Agency
(Cost: $223,473,514) | | $ | 225,908,696 | | |
| Issuer | | Coupon
Rate | | Principal
Amount | | Value | |
| Commercial Mortgage-Backed Securities—Non-Agency 6.7% | |
Bear Stearns Commercial Mortgage Securities(c)
Series 2005-PW10 Class AAB | |
| 12/11/40 | | | 5.382 | % | | $ | 8,338,793 | | | $ | 8,656,776 | | |
| Series 2005-T20 Class AAB | | | | | | | | | | | | | |
| 10/12/42 | | | 5.129 | % | | | 11,737,689 | | | | 12,319,339 | | |
| Series 2006-PW12 Class AAB | | | | | | | | | | | | | |
| 09/11/38 | | | 5.694 | % | | | 2,961,712 | | | | 3,146,040 | | |
Citigroup Commercial Mortgage Trust(c)
Series 2004-C1 Class A3 | |
| 04/15/40 | | | 5.251 | % | | | 2,914,191 | | | | 2,985,411 | | |
| Series 2004-C2 Class A3 | | | | | | | | | | | | | |
| 10/15/41 | | | 4.380 | % | | | 517,322 | | | | 517,141 | | |
| Series 2005-C3 Class ASB | | | | | | | | | | | | | |
| 05/15/43 | | | 4.755 | % | | | 7,396,113 | | | | 7,694,990 | | |
Commercial Mortgage Pass-Through Certificates
Series 2011-STRT Class A(b)(c) | |
| 12/10/24 | | | 2.555 | % | | | 4,000,000 | | | | 4,020,752 | | |
Credit Suisse First Boston Mortgage Securities Corp.(c)
Series 2002-CP3 Class A3 | |
| 07/15/35 | | | 5.603 | % | | | 1,787,003 | | | | 1,788,358 | | |
| Series 2002-CP5 Class A2 | | | | | | | | | | | | | |
| 12/15/35 | | | 4.940 | % | | | 26,163,207 | | | | 26,518,687 | | |
| Series 2005-C2 Class AAB | | | | | | | | | | | | | |
| 04/15/37 | | | 4.681 | % | | | 8,007,162 | | | | 8,219,736 | | |
| Series 2005-C5 Class AAB | | | | | | | | | | | | | |
| 08/15/38 | | | 5.100 | % | | | 4,227,258 | | | | 4,412,944 | | |
GE Capital Commercial Mortgage Corp.
Series 2005-C1 Class AAB(c) | |
| 06/10/48 | | | 4.599 | % | | | 1,932,304 | | | | 1,992,802 | | |
GMAC Commercial Mortgage Securities, Inc.(c)
Series 2002-C3 Class A2 | |
| 07/10/39 | | | 4.930 | % | | | 8,284,142 | | | | 8,395,231 | | |
| Series 2003-C1 Class A2 | | | | | | | | | | | | | |
| 05/10/36 | | | 4.079 | % | | | 5,000,000 | | | | 5,099,260 | | |
| Series 2004-C1 Class A4 | | | | | | | | | | | | | |
| 03/10/38 | | | 4.908 | % | | | 8,095,000 | | | | 8,584,278 | | |
GS Mortgage Securities Corp. II
Series 2011-GC3 Class A1(b)(c) | |
| 03/10/44 | | | 2.331 | % | | | 13,563,992 | | | | 13,796,329 | | |
Greenwich Capital Commercial Funding Corp.(c)
Series 2003-C2 Class A3 | |
| 01/05/36 | | | 4.533 | % | | | 1,184,622 | | | | 1,189,156 | | |
| Series 2005-GG3 Class AAB | | | | | | | | | | | | | |
| 08/10/42 | | | 4.619 | % | | | 12,062,959 | | | | 12,395,932 | | |
JPMorgan Chase Commercial Mortgage Securities Corp.(c)
Series 2002-C2 Class A2 | |
| 12/12/34 | | | 5.050 | % | | | 8,274,768 | | | | 8,399,427 | | |
| Series 2005-CB11 Class ASB | | | | | | | | | | | | | |
| 08/12/37 | | | 5.201 | % | | | 8,649,310 | | | | 9,001,899 | | |
| Series 2005-LDP2 Class ASB | | | | | | | | | | | | | |
| 07/15/42 | | | 4.659 | % | | | 7,591,102 | | | | 7,931,092 | | |
| Series 2006-CB14 Class ASB | | | | | | | | | | | | | |
| 12/12/44 | | | 5.506 | % | | | 6,757,579 | | | | 7,173,501 | | |
| Series 2006-LDP7 Class ASB | | | | | | | | | | | | | |
| 04/15/45 | | | 5.871 | % | | | 2,273,774 | | | | 2,390,750 | | |
LB-UBS Commercial Mortgage Trust(c)
Series 2003-C1 Class A3 | |
| 03/15/27 | | | 4.095 | % | | | 1,563,987 | | | | 1,582,525 | | |
The Accompanying Notes to Financial Statements are an integral part of this statement.
12
Columbia Short Term Bond Fund
March 31, 2012
(Percentages represent value of investments compared to net assets)
| Issuer | | Coupon
Rate | | Principal
Amount | | Value | |
| Commercial Mortgage-Backed Securities—Non-Agency (continued) | |
| Series 2005-C2 Class AAB | | | | | | | | | | | | | |
| 04/15/30 | | | 5.007 | % | | $ | 1,282,074 | | | $ | 1,332,536 | | |
| Series 2007-C1 Class AAB | | | | | | | | | | | | | |
| 02/15/40 | | | 5.403 | % | | | 5,306,028 | | | | 5,626,740 | | |
| Series 2008-C1 Class A1 | | | | | | | | | | | | | |
| 04/15/41 | | | 5.611 | % | | | 765,217 | | | | 776,334 | | |
Nationslink Funding Corp.
Series 1999-LTL1 Class A3(c) | |
| 01/22/26 | | | 7.104 | % | | | 6,357,513 | | | | 6,782,914 | | |
Wachovia Bank Commercial Mortgage Trust(c)
Series 2004-C12 Class A4 | |
| 07/15/41 | | | 5.317 | % | | | 10,595,000 | | | | 11,372,885 | | |
| Series 2005-C17 Class APB | | | | | | | | | | | | | |
| 03/15/42 | | | 5.037 | % | | | 1,064,583 | | | | 1,102,267 | | |
Total Commercial Mortgage-Backed Securities—Non-Agency
(Cost: $195,349,560) | | $ | 195,206,032 | | |
| Asset-Backed Securities—Agency —% | |
| Small Business Administration Pools(a) | |
| 06/25/22 | | | 0.875 | % | | $ | 134,459 | | | $ | 135,385 | | |
United States Small Business Administration
Series 2002-P10B Class 1 | |
| 08/10/12 | | | 5.199 | % | | | 176,706 | | | | 179,361 | | |
Total Asset-Backed Securities—Agency
(Cost: $311,091) | | $ | 314,746 | | |
| Asset-Backed Securities—Non-Agency 17.1% | |
Aames Mortgage Investment Trust
Series 2005-3 Class A2(a)(b) | |
| 08/25/35 | | | 0.502 | % | | $ | 16,326,667 | | | $ | 15,703,837 | | |
Access Group, Inc.(a)
Series 2004A Class A2 | |
| 04/25/29 | | | 0.820 | % | | | 8,209,246 | | | | 7,760,438 | | |
| Series 2005-1 Class A1 | | | | | | | | | | | | | |
| 06/22/18 | | | 0.554 | % | | | 17,248 | | | | 17,248 | | |
| Series 2007A Class A2 | | | | | | | | | | | | | |
| 08/25/26 | | | 0.621 | % | | | 8,515,145 | | | | 8,004,919 | | |
Ally Master Owner Trust(a)
CMO Series 2011-3 Class A1 | |
| 05/15/16 | | | 0.872 | % | | | 15,925,000 | | | | 15,867,683 | | |
| Series 2011-1 Class A1 | | | | | | | | | | | | | |
| 01/15/16 | | | 1.112 | % | | | 10,905,000 | | | | 10,921,794 | | |
| Series 2011-4 Class A1 | | | | | | | | | | | | | |
| 09/15/16 | | | 1.042 | % | | | 19,690,000 | | | | 19,689,996 | | |
| Series 2012-1 Class A1 | | | | | | | | | | | | | |
| 02/15/17 | | | 1.042 | % | | | 10,000,000 | | | | 9,999,998 | | |
Ally Master Owner Trust(b)
Series 2010-3 Class A | |
| 04/15/15 | | | 2.880 | % | | | 1,464,000 | | | | 1,490,329 | | |
AmeriCredit Automobile Receivables Trust
Series 2008-2 Class A3(a) | |
| 04/06/15 | | | 5.243 | % | | | 980,664 | | | | 1,019,255 | | |
American Credit Acceptance Receivables Trust
Series 2012-1 Class A2(b) | |
| 10/15/15 | | | 3.040 | % | | | 6,000,000 | | | | 5,998,380 | | |
| Issuer | | Coupon
Rate | | Principal
Amount | | Value | |
| Asset-Backed Securities—Non-Agency (continued) | |
Amresco Residential Securities Mortgage Loan Trust
Series 1998-3 Class A7(a)(h) | |
| 07/25/28 | | | 0.722 | % | | $ | 14,774 | | | $ | 10,532 | | |
Arizona Educational Loan Marketing Corp.
Series 2004A Class A2(a) | |
| 12/01/23 | | | 0.708 | % | | | 7,452,632 | | | | 7,286,512 | | |
Avis Budget Rental Car Funding AESOP LLC
Series 2012-1A Class A(b) | |
| 08/20/16 | | | 2.054 | % | | | 14,200,000 | | | | 14,241,849 | | |
Bear Stearns Asset-Backed Securities Trust
Series 2006-HE9 Class 1A1(a) | |
| 11/25/36 | | | 0.292 | % | | | 153,499 | | | | 152,010 | | |
Brazos Higher Education Authority
Series 2011-1 Class A1(a) | |
| 02/25/20 | | | 0.941 | % | | | 874,767 | | | | 873,478 | | |
CIT Education Loan Trust
Series 2005-1 Class A2(a) | |
| 03/15/22 | | | 0.564 | % | | | 1,185,174 | | | | 1,179,292 | | |
CNH Wholesale Master Note Trust
Series 2011-1A Class A(a)(b) | |
| 12/15/15 | | | 1.042 | % | | | 7,000,000 | | | | 7,005,708 | | |
Capital Auto Receivables Asset Trust
Series 2007-4A Class A4 | |
| 05/15/14 | | | 5.300 | % | | | 123,048 | | | | 123,493 | | |
Capital Auto Receivables Asset Trust(b)
Series 2007-2 Class B | |
| 02/18/14 | | | 5.760 | % | | | 2,549,975 | | | | 2,557,917 | | |
Carrington Mortgage Loan Trust
Series 2006-RFC1 Class A2(a) | |
| 05/25/36 | | | 0.342 | % | | | 784,054 | | | | 766,188 | | |
Chesapeake Funding LLC(a)(b)
Series 2009-1 Class A | |
| 12/15/20 | | | 2.242 | % | | | 4,759,628 | | | | 4,768,754 | | |
| Series 2011-2A Class A | | | | | | | | | | | | | |
| 04/07/24 | | | 1.493 | % | | | 11,360,000 | | | | 11,415,717 | | |
Citigroup Mortgage Loan Trust, Inc.(a)
Series 2006-WFH4 Class A2 | |
| 11/25/36 | | | 0.342 | % | | | 262,981 | | | | 261,896 | | |
Citigroup Mortgage Loan Trust, Inc.(a)(b)
Series 2003-HE4 Class A | |
| 12/25/33 | | | 0.652 | % | | | 5,860,292 | | | | 5,703,506 | | |
Cityscape Home Equity Loan Trust(h)
Series 1997-B Class A7 | |
| 05/25/28 | | | 7.410 | % | | | 6,833 | | | | 3,433 | | |
| Series 1997-C Class A3 | | | | | | | | | | | | | |
| 07/25/28 | | | 7.380 | % | | | 607,537 | | | | 587,062 | | |
Countrywide Asset-Backed Certificates
Series 2005-11 Class 3AV3(a) | |
| 02/25/36 | | | 0.662 | % | | | 8,134,573 | | | | 8,067,512 | | |
DT Auto Owner Trust(b)
Series 2011-1A Class B | |
| 12/16/13 | | | 1.940 | % | | | 3,000,000 | | | | 3,006,283 | | |
| Series 2011-2A Class B | | | | | | | | | | | | | |
| 02/16/16 | | | 2.120 | % | | | 4,104,000 | | | | 4,107,465 | | |
| Series 2011-3A Class B | | | | | | | | | | | | | |
| 02/15/17 | | | 3.020 | % | | | 4,300,000 | | | | 4,301,054 | | |
EFS Volunteer LLC
Series 2010-1 Class A1(a)(b) | |
| 10/26/26 | | | 1.410 | % | | | 12,055,605 | | | | 12,020,713 | | |
The Accompanying Notes to Financial Statements are an integral part of this statement.
13
Columbia Short Term Bond Fund
March 31, 2012
(Percentages represent value of investments compared to net assets)
| Issuer | | Coupon
Rate | | Principal
Amount | | Value | |
| Asset-Backed Securities—Non-Agency (continued) | |
Educational Funding of the South, Inc.
Series 2011-1 Class A1(a) | |
| 10/25/21 | | | 1.110 | % | | $ | 3,570,040 | | | $ | 3,546,250 | | |
Encore Credit Receivables Trust
Series 2005-4 Class 2A4(a) | |
| 01/25/36 | | | 0.582 | % | | | 23,000,000 | | | | 21,688,172 | | |
First Alliance Mortgage Loan Trust
Series 1994-2 Class A2 (NPFGC) | |
| 06/25/25 | | | 6.680 | % | | | 33,594 | | | | 32,514 | | |
First Franklin Mortgage Loan Asset-Backed Certificates
Series 2005-FF9 Class A3(a) | |
| 10/25/35 | | | 0.522 | % | | | 11,052,905 | | | | 10,850,317 | | |
First Investors Auto Owner Trust(b)
Series 2011-1 Class A2 | |
| 03/16/15 | | | 1.470 | % | | | 3,864,899 | | | | 3,877,182 | | |
| Series 2011-2A Class A2 | | | | | | | | | | | | | |
| 08/15/17 | | | 2.600 | % | | | 8,226,790 | | | | 8,230,081 | | |
| Series 2012-1A Class A2 | | | | | | | | | | | | | |
| 11/15/17 | | | 1.960 | % | | | 5,750,000 | | | | 5,851,814 | | |
Ford Credit Floorplan Master Owner Trust
Series 2010-5 Class A1 | |
| 09/15/15 | | | 1.500 | % | | | 700,000 | | | | 704,270 | | |
| Series 2011-1 Class A1 | | | | | | | | | | | | | |
| 02/15/16 | | | 2.120 | % | | | 1,215,000 | | | | 1,242,901 | | |
Ford Credit Floorplan Master Owner Trust(a)(b)
Series 2010-1 Class A | | | | | | | | | | | | | |
| 12/15/14 | | | 1.892 | % | | | 10,000,000 | | | | 10,100,120 | | |
GE Dealer Floorplan Master Note Trust
Series 2011-1 Class A(a) | | | | | | | | | | | | | |
| 07/20/16 | | | 0.842 | % | | | 10,900,000 | | | | 10,899,999 | | |
HSBC Home Equity Loan Trust
Series 2006-2 Class A1(a) | | | | | | | | | | | | | |
| 03/20/36 | | | 0.392 | % | | | 15,034,025 | | | | 13,892,040 | | |
IMC Home Equity Loan Trust
Series 1995-3 Class A5 (AGM) | |
| 04/25/26 | | | 7.500 | % | | | 15,910 | | | | 15,916 | | |
| Series 1997-3 Class A7 | | | | | | | | | | | | | |
| 08/20/28 | | | 7.080 | % | | | 955 | | | | 955 | | |
Keycorp Student Loan Trust(a)
Series 1999-A Class A2 | |
| 12/27/29 | | | 0.803 | % | | | 12,010,973 | | | | 11,767,138 | | |
| Series 1999-B Class A2 | | | | | | | | | | | | | |
| 08/25/27 | | | 0.921 | % | | | 6,001,258 | | | | 5,926,153 | | |
| Series 2006-A Class 2A2 | | | | | | | | | | | | | |
| 06/27/25 | | | 0.553 | % | | | 5,811,557 | | | | 5,734,272 | | |
Marriott Vacation Club Owner Trust(b)
Series 2007-1A Class A | |
| 05/20/29 | | | 5.518 | % | | | 2,189,713 | | | | 2,228,783 | | |
| Series 2009-2A Class A | | | | | | | | | | | | | |
| 07/20/31 | | | 4.809 | % | | | 4,816,970 | | | | 5,041,367 | | |
Miramax LLC
Series 2011-1A Class A(b) | |
| 10/20/21 | | | 6.250 | % | | | 6,680,357 | | | | 6,822,759 | | |
Morgan Stanley ABS Capital I(a)
Series 2005-WMC5 Class M2 | |
| 06/25/35 | | | 0.722 | % | | | 554,099 | | | | 553,945 | | |
| Series 2006-WMC1 Class A2B | | | | | | | | | | | | | |
| 12/25/35 | | | 0.442 | % | | | 633,866 | | | | 613,249 | | |
| Issuer | | Coupon
Rate | | Principal
Amount | | Value | |
| Asset-Backed Securities—Non-Agency (continued) | |
National Collegiate Student Loan Trust
Series 2006-2 Class A2(a) | |
| 07/25/26 | | | 0.392 | % | | $ | 10,241,538 | | | $ | 9,194,544 | | |
Panhandle-Plains Higher Education Authority, Inc.
Series 2011-2 Class A1(a) | |
| 07/01/21 | | | 0.968 | % | | | 2,825,000 | | | | 2,809,119 | | |
Prestige Auto Receivables Trust
Series 2012-1A Class A2(b) | |
| 12/15/15 | | | 1.230 | % | | | 5,455,000 | | | | 5,454,953 | | |
Residential Asset Mortgage Products, Inc.
Series 2004-RS8 Class AI4 | |
| 06/25/32 | | | 5.060 | % | | | 747,010 | | | | 731,998 | | |
Residential Funding Mortgage Securities II, Inc.
Series 2003-HS3 Class A2B (NPFGC)(a) | |
| 08/25/33 | | | 0.532 | % | | | 7,967 | | | | 5,948 | | |
SLM Student Loan Trust(a)
Series 2003-A Class A2 | |
| 09/15/20 | | | 0.914 | % | | | 9,307,064 | | | | 8,970,795 | | |
| Series 2004B Class A2 | | | | | | | | | | | | | |
| 06/15/21 | | | 0.674 | % | | | 3,117,793 | | | | 2,985,782 | | |
| Series 2005-A Class A2 | | | | | | | | | | | | | |
| 12/15/20 | | | 0.614 | % | | | 8,663,476 | | | | 8,450,199 | | |
SLM Student Loan Trust(a)(b)
Series 2011-A Class A1 | |
| 10/15/24 | | | 1.242 | % | | | 2,334,459 | | | | 2,317,534 | | |
| Series 2012-A Class A1 | | | | | | | | | | | | | |
| 08/15/25 | | | 1.642 | % | | | 4,714,860 | | | | 4,725,563 | | |
SMART Trust(a)(b)
Series 2011-1USA Class A3B | |
| 10/14/14 | | | 1.092 | % | | | 12,800,000 | | | | 12,818,455 | | |
| Series 2011-2USA Class A3B | | | | | | | | | | | | | |
| 03/14/15 | | | 1.092 | % | | | 11,000,000 | | | | 11,049,131 | | |
| Series 2012-1USA Class A3B | | | | | | | | | | | | | |
| 05/14/16 | | | 1.142 | % | | | 1,000,000 | | | | 1,000,000 | | |
SMART Trust(b)
Series 2011-4USA Class A2A | |
| 04/14/14 | | | 1.540 | % | | | 9,155,000 | | | | 9,196,388 | | |
| Series 2012-1USA Class A2A | | | | | | | | | | | | | |
| 09/14/14 | | | 1.040 | % | | | 5,075,000 | | | | 5,073,489 | | |
Santander Consumer Acquired Receivables Trust
Series 2011-WO Class A4(b) | |
| 01/15/15 | | | 1.740 | % | | | 8,720,000 | | | | 8,762,659 | | |
Santander Drive Auto Receivables Trust
Series 2010-2 Class A2 | |
| 08/15/13 | | | 0.950 | % | | | 1,999,176 | | | | 2,000,775 | | |
| Series 2011-1 Class A2 | | | | | | | | | | | | | |
| 02/18/14 | | | 0.940 | % | | | 1,581,086 | | | | 1,582,354 | | |
| Series 2011-4 Class B | | | | | | | | | | | | | |
| 05/16/16 | | | 2.900 | % | | | 10,000,000 | | | | 10,198,074 | | |
| Series 2012-1 Class B | | | | | | | | | | | | | |
| 05/16/16 | | | 2.720 | % | | | 5,500,000 | | | | 5,593,297 | | |
Sierra Receivables Funding Co. LLC(b)
Series 2010-2A Class A | |
| 11/20/25 | | | 3.840 | % | | | 1,111,002 | | | | 1,133,490 | | |
| Series 2011-1A Class A | | | | | | | | | | | | | |
| 04/20/26 | | | 3.350 | % | | | 5,834,103 | | | | 5,898,636 | | |
| Series 2011-2A Class A | | | | | | | | | | | | | |
| 05/20/28 | | | 3.260 | % | | | 5,039,049 | | | | 5,049,605 | | |
| Series 2011-3A Class A | | | | | | | | | | | | | |
| 07/20/28 | | | 3.370 | % | | | 6,898,221 | | | | 6,892,515 | | |
The Accompanying Notes to Financial Statements are an integral part of this statement.
14
Columbia Short Term Bond Fund
March 31, 2012
(Percentages represent value of investments compared to net assets)
| Issuer | | Coupon
Rate | | Principal
Amount | | Value | |
| Asset-Backed Securities—Non-Agency (continued) | |
| Series 2012-1A Class A | |
| 11/20/28 | | | 2.840 | % | | $ | 14,000,000 | | | $ | 14,023,444 | | |
South Texas Higher Education Authority, Inc.
Series 2012-1 Class A1(a) | |
| 10/01/20 | | | 0.968 | % | | | 8,400,000 | | | | 8,322,804 | | |
Specialty Underwriting & Residential Finance
Series 2005-BC3 Class M1(a) | |
| 06/25/36 | | | 0.692 | % | | | 3,700,192 | | | | 3,574,219 | | |
Terwin Mortgage Trust
Series 2007-4HE Class A1(a)(b) | |
| 05/25/38 | | | 0.362 | % | | | 3,636,738 | | | | 3,384,628 | | |
Utah State Board of Regents
Series 2011-1 Class A1(a) | |
| 05/01/23 | | | 1.047 | % | | | 2,670,102 | | | | 2,658,114 | | |
Wachovia Student Loan Trust(a)
Series 2005-1 Class A4 | |
| 07/27/20 | | | 0.670 | % | | | 1,545,338 | | | | 1,537,125 | | |
Wachovia Student Loan Trust(a)(b)
Series 2006-1 Class A4 | |
| 04/25/23 | | | 0.640 | % | | | 10,550,000 | | | | 10,411,259 | | |
Westlake Automobile Receivables Trust(b)
Series 2011-1A Class A2 | |
| 07/15/13 | | | 1.080 | % | | | 2,708,411 | | | | 2,707,874 | | |
| Series 2011-1A Class A3 | | | | | | | | | | | | | |
| 06/16/14 | | | 1.490 | % | | | 4,385,000 | | | | 4,386,775 | | |
Total Asset-Backed Securities—Non-Agency
(Cost: $495,880,280) | | $ | 497,435,993 | | |
| Inflation-Indexed Bonds 1.0% | |
| U.S. Treasury Inflation-Indexed Bond | |
| 07/15/12 | | | 3.000 | % | | $ | 22,360,738 | | | $ | 22,863,854 | | |
| 04/15/14 | | | 1.250 | % | | | 5,354,400 | | | | 5,679,011 | | |
Total Inflation-Indexed Bonds
(Cost: $28,236,144) | | $ | 28,542,865 | | |
| U.S. Treasury Obligations 8.5% | |
| U.S. Treasury | |
| 08/31/13 | | | 0.125 | % | | $ | 17,500,000 | | | $ | 17,458,985 | | |
| 12/15/14 | | | 0.250 | % | | | 25,000,000 | | | | 24,849,600 | | |
| 03/15/15 | | | 0.375 | % | | | 75,000,000 | | | | 74,712,900 | | |
| U.S. Treasury(i) | |
| 01/31/16 | | | 2.000 | % | | | 125,000,000 | | | | 130,908,250 | | |
Total U.S. Treasury Obligations
(Cost: $241,273,750) | | $ | 247,929,735 | | |
| U.S. Government & Agency Obligations 3.0% | |
| Federal Farm Credit Bank(a) | |
| 08/22/13 | | | 0.262 | % | | $ | 6,000,000 | | | $ | 6,004,896 | | |
| 04/21/14 | | | 0.246 | % | | | 6,000,000 | | | | 5,997,834 | | |
| 06/13/14 | | | 0.410 | % | | | 4,100,000 | | | | 4,101,759 | | |
| Issuer | | Coupon
Rate | | Principal
Amount | | Value | |
| U.S. Government & Agency Obligations (continued) | |
| Federal Home Loan Mortgage Corp. | |
| 01/10/13 | | | 0.340 | % | | $ | 12,000,000 | | | $ | 12,010,365 | | |
| Federal National Mortgage Association(a) | |
| 03/04/14 | | | 0.286 | % | | | 58,329,000 | | | | 58,384,528 | | |
Total U.S. Government & Agency Obligations
(Cost: $86,461,461) | | $ | 86,499,382 | | |
| Foreign Government Obligations 1.1% | |
| CANADA 0.8% | |
Province of Ontario
Senior Unsecured | |
| 06/16/14 | | | 4.100 | % | | $ | 20,000,000 | | | $ | 21,528,320 | | |
| MEXICO 0.3% | |
| Petroleos Mexicanos | |
| 03/15/15 | | | 4.875 | % | | | 8,500,000 | | | | 9,201,250 | | |
| MOROCCO —% | |
Morocco Government AID Bond
U.S. Government Guaranty(a)(j) | |
| 05/01/23 | | | 0.500 | % | | | 977,500 | | | | 928,625 | | |
Total Foreign Government Obligations
(Cost: $30,261,337) | | $ | 31,658,195 | | |
| Municipal Bonds 0.5% | |
State of Illinois
Unlimited General Obligation Bonds
Taxable
Series 2011 | |
| 03/01/15 | | | 4.511 | % | | $ | 14,175,000 | | | $ | 14,898,917 | | |
Total Municipal Bonds
(Cost: $14,254,366) | | $ | 14,898,917 | | |
| | | | | Shares | | Value | |
| Money Market Funds 4.1% | |
| Columbia Short-Term Cash Fund, | |
| 0.161%(k)(l) | | | | | | | 120,157,982 | | | $ | 120,157,982 | | |
Total Money Market Funds
(Cost: $120,157,982) | | $ | 120,157,982 | | |
Total Investments
(Cost: $2,933,848,013) | | | | | | $ | 2,973,258,071 | | |
| Other Assets & Liabilities, Net | | | | | | | (58,097,006 | ) | |
| Net Assets | | $ | 2,915,161,065 | | |
The Accompanying Notes to Financial Statements are an integral part of this statement.
15
Columbia Short Term Bond Fund
March 31, 2012
| Investment in Derivatives | |
Futures Contracts Outstanding at March 31, 2012
| Contract Description | | Number of
Contracts
Long (Short) | | Notional
Market Value | | Expiration
Date | | Unrealized
Appreciation | | Unrealized
Depreciation | |
| U.S. Treasury Note, 2-year | | | (485 | ) | | $ | (106,768,206 | ) | | July 2012 | | $ | 701,550 | | | $ | — | | |
| U.S. Treasury Note, 5-year | | | (900 | ) | | | (110,285,154 | ) | | July 2012 | | | 47,586 | | | | — | | |
| Total | | | | | | | | $ | 749,136 | | | $ | — | | |
| Notes to Portfolio of Investments | |
(a) Variable rate security. The interest rate shown reflects the rate as of March 31, 2012.
(b) Security exempt from registration pursuant to Rule 144A under the Securities Act of 1933. This security may be resold in transactions exempt from registration, normally to qualified institutional buyers. At March 31, 2012, the value of these securities amounted to $436,414,830 or 14.97% of net assets.
(c) The maturity dates shown represent the original maturity of the underlying obligation. Actual maturity may vary based upon prepayment activity on these obligations. Unless otherwise noted, the coupon rates presented are fixed rates.
(d) Represents a security purchased on a when-issued or delayed delivery basis.
(e) Interest Only (IO) security. The actual effective yield of this security is different than the stated coupon rate.
(f) Zero coupon bond.
(g) Principal Only (PO) security issued with a zero coupon. Income is recognized through the accretion of discount.
(h) Identifies issues considered to be illiquid as to their marketability. The aggregate value of such securities at March 31, 2012 was $601,027, representing 0.02% of net assets. Information concerning such security holdings at March 31, 2012 was as follows:
| Security Description | | Acquisition
Dates | | Cost | |
Amresco Residential Securities Mortgage Loan Trust
Series 1998-3 Class A7
07/25/28 0.722% | | 12/19/03 | | $ | 14,671 | | |
Cityscape Home Equity Loan Trust
Series 1997-B Class A7
05/25/28 7.410% | | 06/18/04-05/26/11 | | | 6,632 | | |
Cityscape Home Equity Loan Trust
Series 1997-C Class A3
07/25/28 7.380% | | 11/25/03-06/29/09 | | | 572,183 | | |
(i) At March 31, 2012, investments in securities included securities valued at $3,220,343 that were partially pledged as collateral to cover initial margin deposits on open interest rate futures contracts.
(j) Represents fair value as determined in good faith under procedures approved by the Board of Trustees. At March 31, 2012, the value of these securities amounted to $928,625, which represents 0.03% of net assets.
(k) The rate shown is the seven-day current annualized yield at March 31, 2012.
(l) Investments in affiliates during the year ended March 31, 2012:
| Issuer | | Beginning
Cost | | Purchase
Cost | | Sales Cost/
Proceeds
from Sales | | Realized
Gain/Loss | | Ending
Cost | | Dividends
or Interest
Income | | Value | |
Columbia Short-Term
Cash Fund | | $ | — | | | $ | 1,285,150,256 | | | $ | (1,164,992,274 | ) | | $ | — | | | $ | 120,157,982 | | | $ | 149,770 | | | $ | 120,157,982 | | |
The Accompanying Notes to Financial Statements are an integral part of this statement.
16
Columbia Short Term Bond Fund
March 31, 2012
AGM Assured Guaranty Municipal Corporation
CMO Collateralized Mortgage Obligation
FDIC Federal Deposit Insurance Corporation
NPFGC National Public Finance Guarantee Corporation
STRIPS Separate Trading of Registered Interest and Principal Securities
Generally accepted accounting principles (GAAP) require disclosure regarding the inputs and valuation techniques used to measure fair value and any changes in valuation inputs or techniques. In addition, investments shall be disclosed by major category.
The Fund categorizes its fair value measurements according to a three-level hierarchy that maximizes the use of observable inputs and minimizes the use of unobservable inputs by prioritizing that the most observable input be used when available. Observable inputs are those that market participants would use in pricing an investment based on market data obtained from sources independent of the reporting entity. Unobservable inputs are those that reflect the Fund's assumptions about the information market participants would use in pricing an investment. An investment's level within the fair value hierarchy is based on the lowest level of any input that is deemed significant to the asset or liability's fair value measurement. The input levels are not necessarily an indication of the risk or liquidity associated with investments at that level. For example, certain U.S. government securities are generally high quality and liquid, however, they are reflected as Level 2 because the inputs used to determine fair value may not always be quoted prices in an active market.
Fair value inputs are summarized in the three broad levels listed below:
• Level 1 — Valuations based on quoted prices for investments in active markets that the Fund has the ability to access at the measurement date (including NAV for open-end mutual funds). Valuation adjustments are not applied to Level 1 investments.
• Level 2 — Valuations based on other significant observable inputs (including quoted prices for similar securities, interest rates, prepayment speeds, credit risks, etc.).
• Level 3 — Valuations based on significant unobservable inputs (including the Fund's own assumptions and judgment in determining the fair value of investments).
Inputs that are used in determining fair value of an investment may include price information, credit data, volatility statistics, and other factors. These inputs can be either observable or unobservable. The availability of observable inputs can vary between investments, and is affected by various factors such as the type of investment, and the volume and level of activity for that investment or similar investments in the marketplace. The inputs will be considered by the Investment Manager, along with any other relevant factors in the calculation of an investment's fair value. The Fund uses prices and inputs that are current as of the measurement date, which may include periods of market dislocations. During these periods, the availability of prices and inputs may be reduced for many investments. This condition could cause an investment to be reclassified between the various levels within the hierarchy.
Investments falling into the Level 3 category are primarily supported by quoted prices from brokers and dealers participating in the market for those investments. However, these may be classified as Level 3 investments due to lack of market transparency and corroboration to support these quoted prices. Additionally, valuation models may be used as the pricing source for any remaining investments classified as Level 3. These models rely on one or more significant unobservable inputs and/or significant assumptions by the Investment Manager. Inputs used in valuations may include, but are not limited to, financial statement analysis, capital account balances, discount rates and estimated cash flows, and comparable company data.
The Accompanying Notes to Financial Statements are an integral part of this statement.
17
Columbia Short Term Bond Fund
March 31, 2012
| Fair Value Measurements (continued) | |
The following table is a summary of the inputs used to value the Fund's investments as of March 31, 2012:
| | | Fair Value at March 31, 2012 | |
| Description | | Level 1
Quoted Prices
in Active
Markets for
Identical Assets | | Level 2
Other
Significant
Observable
Inputs | | Level 3
Significant
Unobservable
Inputs | | Total | |
| Bonds | |
| Corporate Bonds & Notes | | $ | — | | | $ | 918,956,003 | | | $ | — | | | $ | 918,956,003 | | |
| Residential Mortgage-Backed Securities—Agency | | | — | | | | 550,236,563 | | | | — | | | | 550,236,563 | | |
| Residential Mortgage-Backed Securities—Non-Agency | | | — | | | | 55,512,962 | | | | — | | | | 55,512,962 | | |
| Commercial Mortgage-Backed Securities—Agency | | | — | | | | 225,908,696 | | | | — | | | | 225,908,696 | | |
| Commercial Mortgage-Backed Securities—Non-Agency | | | — | | | | 195,206,032 | | | | — | | | | 195,206,032 | | |
| Asset-Backed Securities—Agency | | | — | | | | 314,746 | | | | — | | | | 314,746 | | |
| Asset-Backed Securities—Non-Agency | | | — | | | | 491,437,613 | | | | 5,998,380 | | | | 497,435,993 | | |
| Inflation-Indexed Bonds | | | — | | | | 28,542,865 | | | | — | | | | 28,542,865 | | |
| U.S. Treasury Obligations | | | 247,929,735 | | | | — | | | | — | | | | 247,929,735 | | |
| U.S. Government & Agency Obligations | | | — | | | | 86,499,382 | | | | — | | | | 86,499,382 | | |
| Foreign Government Obligations | | | — | | | | 30,729,570 | | | | 928,625 | | | | 31,658,195 | | |
| Municipal Bonds | | | — | | | | 14,898,917 | | | | — | | | | 14,898,917 | | |
| Total Bonds | | | 247,929,735 | | | | 2,598,243,349 | | | | 6,927,005 | | | | 2,853,100,089 | | |
| Other | |
| Money Market Funds | | | 120,157,982 | | | | — | | | | — | | | | 120,157,982 | | |
| Total Other | | | 120,157,982 | | | | — | | | | — | | | | 120,157,982 | | |
| Investments in Securities | | | 368,087,717 | | | | 2,598,243,349 | | | | 6,927,005 | | | | 2,973,258,071 | | |
| Derivatives | |
Assets
Futures Contracts | | | 749,136 | | | | — | | | | — | | | | 749,136 | | |
| Total | | $ | 368,836,853 | | | $ | 2,598,243,349 | | | $ | 6,927,005 | | | $ | 2,974,007,207 | | |
See the Portfolio of Investments for all investment classifications not indicated in the table.
The Fund's assets assigned to the Level 2 input category are generally valued using the market approach, in which a security's value is determined through reference to prices and information from market transactions for similar or identical assets.
There were no significant transfers between Levels 1 and 2 during the period.
The Fund's assets assigned to the Level 3 category are valued utilizing the valuation technique deemed the most appropriate in the circumstances. Certain Foreign Government Obligations and Asset-Backed Securities classified as Level 3 are valued using the market approach. To determine fair value for these securities, management considered various factors which may have included, but were not limited to, estimated cash flows of the securities, observed yields on comparable securities, and the utilization of single market quotations from broker dealers.
Derivative instruments are valued at unrealized appreciation (depreciation).
The following table is a reconciliation of Level 3 assets for which significant unobservable inputs were used to determine fair value.
| | | Asset-Backed
Securities—
Non-Agency | | Foreign
Government
Obligations | | Total | |
| Balance as of March 31, 2011 | | $ | — | | | $ | 1,009,375 | | | $ | 1,009,375 | | |
| Accrued discounts/premiums | | | — | | | | 1,270 | | | | 1,270 | | |
| Realized gain (loss) | | | 42,078 | | | | 1,357 | | | | 43,435 | | |
| Change in unrealized appreciation (depreciation)* | | | (1,554 | ) | | | 1,623 | | | | 69 | | |
| Sales | | | (14,950,000 | ) | | | (85,000 | ) | | | (15,035,000 | ) | |
| Purchases | | | 20,907,856 | | | | — | | | | 20,907,856 | | |
| Issuances | | | — | | | | — | | | | — | | |
| Settlements | | | — | | | | — | | | | — | | |
| Transfers into Level 3 | | | — | | | | — | | | | — | | |
| Transfers out of Level 3 | | | — | | | | — | | | | — | | |
| Balance as of March 31, 2012 | | $ | 5,998,380 | | | $ | 928,625 | | | $ | 6,927,005 | | |
* Change in unrealized appreciation (depreciation) relating to securities held at March 31, 2012 was $69, which is comprised of Asset-Backed Securities–Non Agency of ($1,554) and Foreign Government Obligations of $1,623.
The Accompanying Notes to Financial Statements are an integral part of this statement.
18
Statement of Assets and Liabilities – Columbia Short Term Bond Fund
March 31, 2012
| Assets | |
| Investments, at value | |
| Unaffiliated issuers (identified cost $2,813,690,031) | | $ | 2,853,100,089 | | |
| Affiliated issuers (identified cost $120,157,982) | | | 120,157,982 | | |
| Total investments (identified cost $2,933,848,013) | | | 2,973,258,071 | | |
| Receivable for: | |
| Investments sold | | | 12,658,997 | | |
| Capital shares sold | | | 4,347,798 | | |
| Dividends | | | 15,174 | | |
| Interest | | | 12,188,357 | | |
| Variation margin on futures contracts | | | 127,656 | | |
| Expense reimbursement due from Investment Manager | | | 12,616 | | |
| Prepaid expense | | | 21,063 | | |
| Trustees' deferred compensation plan | | | 4,407 | | |
| Total assets | | | 3,002,634,139 | | |
| Liabilities | |
| Disbursements in excess of cash | | | 433,867 | | |
| Payable for: | |
| Investments purchased | | | 1,864,973 | | |
| Investments purchased on a delayed delivery basis | | | 75,968,610 | | |
| Capital shares purchased | | | 4,216,977 | | |
| Dividend distributions to shareholders | | | 4,250,613 | | |
| Investment management fees | | | 28,316 | | |
| Distribution and service fees | | | 6,956 | | |
| Transfer agent fees | | | 406,705 | | |
| Administration fees | | | 4,989 | | |
| Plan administration fees | | | 1,772 | | |
| Compensation of board members | | | 143,208 | | |
| Other expenses | | | 141,681 | | |
| Trustees' deferred compensation plan | | | 4,407 | | |
| Total liabilities | | | 87,473,074 | | |
| Net assets applicable to outstanding capital stock | | $ | 2,915,161,065 | | |
The Accompanying Notes to Financial Statements are an integral part of this statement.
19
Statement of Assets and Liabilities (continued) – Columbia Short Term Bond Fund
March 31, 2012
| Represented by | |
| Paid-in capital | | $ | 2,966,211,815 | | |
| Excess of distributions over net investment income | | | (4,391,044 | ) | |
| Accumulated net realized loss | | | (86,818,900 | ) | |
| Unrealized appreciation (depreciation) on: | |
| Investments | | | 39,410,058 | | |
| Futures contracts | | | 749,136 | | |
| Total — representing net assets applicable to outstanding capital stock | | $ | 2,915,161,065 | | |
| Net assets applicable to outstanding shares | |
| Class A | | $ | 641,834,643 | | |
| Class B | | $ | 19,697,463 | | |
| Class C | | $ | 129,511,144 | | |
| Class I | | $ | 2,706,219 | | |
| Class R | | $ | 3,593,911 | | |
| Class R4 | | $ | 4,205,049 | | |
| Class W | | $ | 7,507 | | |
| Class Y | | $ | 13,707,215 | | |
| Class Z | | $ | 2,099,897,914 | | |
| Shares outstanding | |
| Class A | | | 64,479,578 | | |
| Class B | | | 1,980,299 | | |
| Class C | | | 13,024,067 | | |
| Class I | | | 272,409 | | |
| Class R | | | 360,970 | | |
| Class R4 | | | 423,348 | | |
| Class W | | | 754 | | |
| Class Y | | | 1,380,034 | | |
| Class Z | | | 211,340,123 | | |
| Net asset value per share | |
| Class A(a) | | $ | 9.95 | | |
| Class B | | $ | 9.95 | | |
| Class C | | $ | 9.94 | | |
| Class I | | $ | 9.93 | | |
| Class R | | $ | 9.96 | | |
| Class R4 | | $ | 9.93 | | |
| Class W | | $ | 9.96 | | |
| Class Y | | $ | 9.93 | | |
| Class Z | | $ | 9.94 | | |
(a) The maximum offering price per share for Class A is $10.05. The offering price is calculated by dividing the net asset value by 1.0 minus the maximum sales charge of 1.00%.
The Accompanying Notes to Financial Statements are an integral part of this statement.
20
Statement of Operations – Columbia Short Term Bond Fund
Year ended March 31, 2012
| Net investment income | |
| Income: | |
| Interest | | $ | 65,425,754 | | |
| Dividends from affiliates | | | 149,770 | | |
| Total income | | | 65,575,524 | | |
| Expenses: | |
| Investment management fees | | | 10,005,702 | | |
| Distribution fees | |
| Class B | | | 156,604 | | |
| Class C | | | 979,067 | | |
| Class R | | | 14,406 | | |
| Service fees | |
| Class B | | | 52,201 | | |
| Class C | | | 326,714 | | |
| Class W | | | 16 | | |
| Distribution and service fees — Class A | | | 1,488,885 | | |
| Transfer agent fees | |
| Class A | | | 1,140,348 | | |
| Class B | | | 43,559 | | |
| Class C | | | 231,806 | | |
| Class R | | | 5,959 | | |
| Class R4 | | | 1,925 | | |
| Class W | | | 14 | | |
| Class Y | | | — | | |
| Class Z | | | 3,604,312 | | |
| Administration fees | | | 1,741,167 | | |
| Plan administration fees | |
| Class R4 | | | 8,948 | | |
| Compensation of board members | | | 68,961 | | |
| Pricing and bookkeeping fees | | | 27,398 | | |
| Custodian fees | | | 69,871 | | |
| Printing and postage fees | | | 177,336 | | |
| Registration fees | | | 186,396 | | |
| Professional fees | | | 96,795 | | |
| Other | | | 106,872 | | |
| Total expenses | | | 20,535,262 | | |
| Fees waived or expenses reimbursed by Investment Manager and its affiliates | | | (3,769,340 | ) | |
| Fees waived by distributor — Class C | | | (573,941 | ) | |
| Expense reductions | | | (4,060 | ) | |
| Total net expenses | | | 16,187,921 | | |
| Net investment income | | | 49,387,603 | | |
| Realized and unrealized gain (loss) — net | |
| Net realized gain (loss) on: | |
| Investments | | | 15,056,845 | | |
| Futures contracts | | | (16,761,458 | ) | |
| Net realized loss | | | (1,704,613 | ) | |
| Net change in unrealized appreciation (depreciation) on: | |
| Investments | | | 2,938,101 | | |
| Futures contracts | | | 1,169,293 | | |
| Net change in unrealized appreciation | | | 4,107,394 | | |
| Net realized and unrealized gain | | | 2,402,781 | | |
| Net increase in net assets resulting from operations | | $ | 51,790,384 | | |
The Accompanying Notes to Financial Statements are an integral part of this statement.
21
Statement of Changes in Net Assets – Columbia Short Term Bond Fund
| | | Year ended
March 31,
2012 | | Year ended
March 31,
2011(a) | |
| Operations | |
| Net investment income | | $ | 49,387,603 | | | $ | 58,633,359 | | |
| Net realized gain (loss) | | | (1,704,613 | ) | | | 11,337,840 | | |
| Net change in unrealized appreciation (depreciation) | | | 4,107,394 | | | | (2,795,256 | ) | |
| Net increase in net assets resulting from operations | | | 51,790,384 | | | | 67,175,943 | | |
| Distributions to shareholders from: | |
| Net investment income | |
| Class A | | | (9,458,385 | ) | | | (7,364,546 | ) | |
| Class B | | | (171,118 | ) | | | (155,774 | ) | |
| Class C | | | (1,757,024 | ) | | | (2,880,627 | ) | |
| Class I | | | (533,904 | ) | | | (125,306 | ) | |
| Class R | | | (36,687 | ) | | | (29 | ) | |
| Class R4 | | | (54,283 | ) | | | (4 | ) | |
| Class W | | | (104 | ) | | | (32 | ) | |
| Class Y | | | (287,252 | ) | | | (600,807 | ) | |
| Class Z | | | (38,652,158 | ) | | | (58,054,450 | ) | |
| Total distributions to shareholders | | | (50,950,915 | ) | | | (69,181,575 | ) | |
| Increase (decrease) in net assets from share transactions | | | 568,202,417 | | | | (71,423,953 | ) | |
| Proceeds from regulatory settlements (Note 6) | | | 4,573 | | | | — | | |
| Total increase (decrease) in net assets | | | 569,046,459 | | | | (73,429,585 | ) | |
| Net assets at beginning of year | | | 2,346,114,606 | | | | 2,419,544,191 | | |
| Net assets at end of year | | $ | 2,915,161,065 | | | $ | 2,346,114,606 | | |
| Excess of distributions over net investment income | | $ | (4,391,044 | ) | | $ | (3,501,686 | ) | |
(a) Class I, Class R and Class W shares are for the period from September 27, 2010 (commencement of operations) through March 31, 2011. Class R4 shares are for the period from March 7, 2011 (commencement of operations) through March 31, 2011.
The Accompanying Notes to Financial Statements are an integral part of this statement.
22
Statement of Changes in Net Assets (continued) – Columbia Short Term Bond Fund
| | | Year ended March 31,
2012 | | Year ended March 31,
2011(a) | |
| | | Shares | | Dollars ($) | | Shares | | Dollars ($) | |
| Capital stock activity | |
| Class A shares | |
| Subscriptions(b) | | | 18,052,535 | | | | 179,459,403 | | | | 15,294,072 | | | | 152,573,055 | | |
| Fund merger | | | 42,517,537 | | | | 425,136,210 | | | | — | | | | — | | |
| Distributions reinvested | | | 730,704 | | | | 7,259,959 | | | | 474,538 | | | | 4,734,919 | | |
| Redemptions | | | (23,303,845 | ) | | | (231,586,353 | ) | | | (14,001,098 | ) | | | (139,605,799 | ) | |
| Net increase | | | 37,996,931 | | | | 380,269,219 | | | | 1,767,512 | | | | 17,702,175 | | |
| Class B shares | |
| Subscriptions | | | 258,162 | | | | 2,563,981 | | | | 208,622 | | | | 2,079,277 | | |
| Fund merger | | | 3,306,318 | | | | 33,004,024 | | | | — | | | | — | | |
| Distributions reinvested | | | 13,464 | | | | 133,744 | | | | 10,191 | | | | 101,641 | | |
| Redemptions(b) | | | (2,211,705 | ) | | | (22,032,456 | ) | | | (542,696 | ) | | | (5,407,084 | ) | |
| Net increase (decrease) | | | 1,366,239 | | | | 13,669,293 | | | | (323,883 | ) | | | (3,226,166 | ) | |
| Class C shares | |
| Subscriptions | | | 3,579,781 | | | | 35,546,860 | | | | 4,345,566 | | | | 43,300,685 | | |
| Fund merger | | | 2,595,555 | | | | 25,923,990 | | | | — | | | | — | | |
| Distributions reinvested | | | 89,879 | | | | 892,483 | | | | 145,799 | | | | 1,453,196 | | |
| Redemptions | | | (4,709,140 | ) | | | (46,740,562 | ) | | | (4,398,309 | ) | | | (43,776,269 | ) | |
| Net increase | | | 1,556,075 | | | | 15,622,771 | | | | 93,056 | | | | 977,612 | | |
| Class I shares | |
| Subscriptions | | | 518,518 | | | | 5,151,052 | | | | 1,551,583 | | | | 15,407,172 | | |
| Fund merger | | | 7,022,434 | | | | 70,058,256 | | | | — | | | | — | | |
| Distributions reinvested | | | 50,434 | | | | 501,160 | | | | 12,614 | | | | 125,289 | | |
| Redemptions | | | (8,394,882 | ) | | | (82,997,949 | ) | | | (488,292 | ) | | | (4,846,321 | ) | |
| Net increase (decrease) | | | (803,496 | ) | | | (7,287,481 | ) | | | 1,075,905 | | | | 10,686,140 | | |
| Class R shares | |
| Subscriptions | | | 71,665 | | | | 712,255 | | | | 250 | | | | 2,500 | | |
| Fund merger | | | 351,665 | | | | 3,520,266 | | | | — | | | | — | | |
| Distributions reinvested | | | 997 | | | | 9,908 | | | | 1 | | | | 15 | | |
| Redemptions | | | (63,608 | ) | | | (631,938 | ) | | | — | | | | — | | |
| Net increase | | | 360,719 | | | | 3,610,491 | | | | 251 | | | | 2,515 | | |
| Class R4 shares | |
| Subscriptions | | | 74,732 | | | | 740,284 | | | | 252 | | | | 2,500 | | |
| Fund merger | | | 449,742 | | | | 4,480,153 | | | | — | | | | — | | |
| Distributions reinvested | | | 5,469 | | | | 54,182 | | | | — | * | | | 4 | | |
| Redemptions | | | (106,847 | ) | | | (1,058,297 | ) | | | — | | | | — | | |
| Net increase | | | 423,096 | | | | 4,216,322 | | | | 252 | | | | 2,504 | | |
| Class W shares | |
| Subscriptions | | | — | | | | — | | | | 264 | | | | 2,650 | | |
| Fund merger | | | 503 | | | | 5,034 | | | | — | | | | — | | |
| Distributions reinvested | | | — | | | | — | | | | 2 | | | | 16 | | |
| Redemptions | | | — | | | | — | | | | (15 | ) | | | (150 | ) | |
| Net increase | | | 503 | | | | 5,034 | | | | 251 | | | | 2,516 | | |
| Class Y shares | |
| Subscriptions | | | 17,509 | | | | 173,033 | | | | 15,742 | | | | 157,008 | | |
| Distributions reinvested | | | 5,168 | | | | 51,304 | | | | 16,093 | | | | 160,329 | | |
| Redemptions | | | (272,804 | ) | | | (2,710,817 | ) | | | (1,031,479 | ) | | | (10,291,770 | ) | |
| Net decrease | | | (250,127 | ) | | | (2,486,480 | ) | | | (999,644 | ) | | | (9,974,433 | ) | |
| Class Z shares | |
| Subscriptions | | | 96,741,746 | | | | 959,401,499 | | | | 80,659,730 | | | | 802,780,170 | | |
| Distributions reinvested | | | 1,051,519 | | | | 10,435,282 | | | | 1,491,180 | | | | 14,849,498 | | |
| Redemptions | | | (81,596,974 | ) | | | (809,253,533 | ) | | | (90,950,158 | ) | | | (905,226,484 | ) | |
| Net increase (decrease) | | | 16,196,291 | | | | 160,583,248 | | | | (8,799,248 | ) | | | (87,596,816 | ) | |
| Total net increase (decrease) | | | 56,846,231 | | | | 568,202,417 | | | | (7,185,548 | ) | | | (71,423,953 | ) | |
* Rounds to less than one share.
(a) Class I, Class R and Class W shares are for the period from September 27, 2010 (commencement of operations) through March 31, 2011. Class R4 shares are for the period from March 7, 2011 (commencement of operations) through March 31, 2011.
(b) Includes conversions of Class B shares to Class A shares, if any.
The Accompanying Notes to Financial Statements are an integral part of this statement.
23
Financial Highlights – Columbia Short Term Bond Fund
The following tables are intended to help you understand the Fund's financial performance. Certain information reflects financial results for a single share of a class held for the periods shown. Per share net investment income (loss) amounts are calculated based on average shares outstanding during the period. Total returns assume reinvestment of all dividends and distributions. Total returns do not reflect payments of sales charges, if any, and are not annualized for periods of less than one year.
| | | Year ended March 31, | |
| | | 2012 | | 2011 | | 2010 | | 2009 | | 2008 | |
| Class A | |
| Per share data | |
| Net asset value, beginning of period | | $ | 9.94 | | | $ | 9.95 | | | $ | 9.47 | | | $ | 9.89 | | | $ | 9.84 | | |
| Income from investment operations: | |
| Net investment income | | | 0.15 | | | | 0.22 | | | | 0.32 | | | | 0.42 | | | | 0.44 | | |
| Net realized and unrealized gain (loss) | | | 0.03 | | | | 0.03 | | | | 0.49 | | | | (0.42 | ) | | | 0.05 | | |
| Total from investment operations | | | 0.18 | | | | 0.25 | | | | 0.81 | | | | — | | | | 0.49 | | |
| Less distributions to shareholders from: | |
| Net investment income | | | (0.17 | ) | | | (0.26 | ) | | | (0.33 | ) | | | (0.42 | ) | | | (0.44 | ) | |
| Total distributions to shareholders | | | (0.17 | ) | | | (0.26 | ) | | | (0.33 | ) | | | (0.42 | ) | | | (0.44 | ) | |
| Proceeds from regulatory settlement | | | 0.00 | (a) | | | — | | | | 0.00 | (a) | | | 0.00 | (a) | | | — | | |
| Net asset value, end of period | | $ | 9.95 | | | $ | 9.94 | | | $ | 9.95 | | | $ | 9.47 | | | $ | 9.89 | | |
| Total return | | | 1.78 | % | | | 2.57 | % | | | 8.68 | % | | | 0.03 | % | | | 5.13 | % | |
| Ratios to average net assets(b) | |
| Expenses prior to fees waived or expenses reimbursed | | | 0.89 | % | | | 0.82 | % | | | 0.76 | % | | | 0.77 | % | | | 0.75 | % | |
| Net expenses after fees waived or expenses reimbursed(c) | | | 0.74 | %(d) | | | 0.73 | %(d) | | | 0.73 | %(d) | | | 0.73 | %(d) | | | 0.73 | %(d) | |
| Net investment income | | | 1.53 | %(d) | | | 2.21 | %(d) | | | 3.27 | %(d) | | | 4.43 | %(d) | | | 4.43 | %(d) | |
| Supplemental data | |
| Net assets, end of period (in thousands) | | $ | 641,835 | | | $ | 263,223 | | | $ | 245,872 | | | $ | 121,914 | | | $ | 76,196 | | |
| Portfolio turnover | | | 76 | %(e) | | | 83 | % | | | 91 | % | | | 58 | % | | | 58 | % | |
| Notes to Financial Highlights | |
(a) Rounds to less than $0.01.
(b) In addition to the fees and expenses which the Fund bears directly, the Fund indirectly bears a pro rata share of the fees and expenses of the acquired funds in which it invests. Such indirect expenses are not included in the reported expense ratios.
(c) The Investment Manager and certain of its affiliates agreed to waive/reimburse certain fees and expenses, if applicable.
(d) The benefits derived from expense reductions had an impact of less than 0.01%.
(e) Includes mortgage dollar rolls. If mortgage dollar roll transactions were excluded, the portfolio turnover would have been 63% for the year ended March 31, 2012.
The Accompanying Notes to Financial Statements are an integral part of this statement.
24
Financial Highlights (continued) – Columbia Short Term Bond Fund
| | | Year ended March 31, | |
| | | 2012 | | 2011 | | 2010 | | 2009 | | 2008 | |
| Class B | |
| Per share data | |
| Net asset value, beginning of period | | $ | 9.93 | | | $ | 9.94 | | | $ | 9.47 | | | $ | 9.89 | | | $ | 9.84 | | |
| Income from investment operations: | |
| Net investment income | | | 0.07 | | | | 0.15 | | | | 0.26 | | | | 0.35 | | | | 0.36 | | |
| Net realized and unrealized gain (loss) | | | 0.04 | | | | 0.03 | | | | 0.47 | | | | (0.42 | ) | | | 0.06 | | |
| Total from investment operations | | | 0.11 | | | | 0.18 | | | | 0.73 | | | | (0.07 | ) | | | 0.42 | | |
| Less distributions to shareholders from: | |
| Net investment income | | | (0.09 | ) | | | (0.19 | ) | | | (0.26 | ) | | | (0.35 | ) | | | (0.37 | ) | |
| Total distributions to shareholders | | | (0.09 | ) | | | (0.19 | ) | | | (0.26 | ) | | | (0.35 | ) | | | (0.37 | ) | |
| Proceeds from regulatory settlement | | | 0.00 | (a) | | | — | | | | 0.00 | (a) | | | 0.00 | (a) | | | — | | |
| Net asset value, end of period | | $ | 9.95 | | | $ | 9.93 | | | $ | 9.94 | | | $ | 9.47 | | | $ | 9.89 | | |
| Total return | | | 1.12 | % | | | 1.80 | % | | | 7.77 | % | | | (0.72 | %) | | | 4.35 | % | |
| Ratios to average net assets(b) | |
| Expenses prior to fees waived or expenses reimbursed | | | 1.65 | % | | | 1.57 | % | | | 1.51 | % | | | 1.52 | % | | | 1.50 | % | |
| Net expenses after fees waived or expenses reimbursed(c) | | | 1.49 | %(d) | | | 1.48 | %(d) | | | 1.48 | %(d) | | | 1.48 | %(d) | | | 1.48 | %(d) | |
| Net investment income | | | 0.75 | %(d) | | | 1.47 | %(d) | | | 2.62 | %(d) | | | 3.69 | %(d) | | | 3.69 | %(d) | |
| Supplemental data | |
| Net assets, end of period (in thousands) | | $ | 19,697 | | | $ | 6,100 | | | $ | 9,326 | | | $ | 10,502 | | | $ | 14,035 | | |
| Portfolio turnover | | | 76 | %(e) | | | 83 | % | | | 91 | % | | | 58 | % | | | 58 | % | |
| Notes to Financial Highlights | |
(a) Rounds to less than $0.01.
(b) In addition to the fees and expenses which the Fund bears directly, the Fund indirectly bears a pro rata share of the fees and expenses of the acquired funds in which it invests. Such indirect expenses are not included in the reported expense ratios.
(c) The Investment Manager and certain of its affiliates agreed to waive/reimburse certain fees and expenses, if applicable.
(d) The benefits derived from expense reductions had an impact of less than 0.01%.
(e) Includes mortgage dollar rolls. If mortgage dollar roll transactions were excluded, the portfolio turnover would have been 63% for the year ended March 31, 2012.
The Accompanying Notes to Financial Statements are an integral part of this statement.
25
Financial Highlights (continued) – Columbia Short Term Bond Fund
| | | Year ended March 31, | |
| | | 2012 | | 2011 | | 2010 | | 2009 | | 2008 | |
| Class C | |
| Per share data | |
| Net asset value, beginning of period | | $ | 9.93 | | | $ | 9.94 | | | $ | 9.46 | | | $ | 9.88 | | | $ | 9.83 | | |
| Income from investment operations: | |
| Net investment income | | | 0.13 | | | | 0.19 | | | | 0.29 | | | | 0.39 | | | | 0.41 | | |
| Net realized and unrealized gain (loss) | | | 0.02 | | | | 0.03 | | | | 0.49 | | | | (0.42 | ) | | | 0.05 | | |
| Total from investment operations | | | 0.15 | | | | 0.22 | | | | 0.78 | | | | (0.03 | ) | | | 0.46 | | |
| Less distributions to shareholders from: | |
| Net investment income | | | (0.14 | ) | | | (0.23 | ) | | | (0.30 | ) | | | (0.39 | ) | | | (0.41 | ) | |
| Total distributions to shareholders | | | (0.14 | ) | | | (0.23 | ) | | | (0.30 | ) | | | (0.39 | ) | | | (0.41 | ) | |
| Proceeds from regulatory settlement | | | 0.00 | (a) | | | — | | | | 0.00 | (a) | | | 0.00 | (a) | | | — | | |
| Net asset value, end of period | | $ | 9.94 | | | $ | 9.93 | | | $ | 9.94 | | | $ | 9.46 | | | $ | 9.88 | | |
| Total return | | | 1.48 | % | | | 2.25 | % | | | 8.35 | % | | | (0.29 | %) | | | 4.80 | % | |
| Ratios to average net assets(b) | |
| Expenses prior to fees waived or expenses reimbursed | | | 1.62 | % | | | 1.57 | % | | | 1.51 | % | | | 1.52 | % | | | 1.50 | % | |
| Net expenses after fees waived or expenses reimbursed(c) | | | 1.04 | %(d) | | | 1.04 | %(d) | | | 1.04 | %(d) | | | 1.04 | %(d) | | | 1.04 | %(d) | |
| Net investment income | | | 1.30 | %(d) | | | 1.90 | %(d) | | | 2.90 | %(d) | | | 4.12 | %(d) | | | 4.12 | %(d) | |
| Supplemental data | |
| Net assets, end of period (in thousands) | | $ | 129,511 | | | $ | 113,863 | | | $ | 113,038 | | | $ | 35,926 | | | $ | 18,644 | | |
| Portfolio turnover | | | 76 | %(e) | | | 83 | % | | | 91 | % | | | 58 | % | | | 58 | % | |
| Notes to Financial Highlights | |
(a) Rounds to less than $0.01.
(b) In addition to the fees and expenses which the Fund bears directly, the Fund indirectly bears a pro rata share of the fees and expenses of the acquired funds in which it invests. Such indirect expenses are not included in the reported expense ratios.
(c) The Investment Manager and certain of its affiliates agreed to waive/reimburse certain fees and expenses, if applicable.
(d) The benefits derived from expense reductions had an impact of less than 0.01%.
(e) Includes mortgage dollar rolls. If mortgage dollar roll transactions were excluded, the portfolio turnover would have been 63% for the year ended March 31, 2012.
The Accompanying Notes to Financial Statements are an integral part of this statement.
26
Financial Highlights (continued) – Columbia Short Term Bond Fund
| | | Year ended March 31, | |
| | | 2012 | | 2011(a) | |
| Class I | |
| Per share data | |
| Net asset value, beginning of period | | $ | 9.93 | | | $ | 10.00 | | |
| Income from investment operations: | |
| Net investment income | | | 0.18 | | | | 0.10 | | |
| Net realized and unrealized gain (loss) | | | 0.02 | | | | (0.03 | ) | |
| Total from investment operations | | | 0.20 | | | | 0.07 | | |
| Less distributions to shareholders from: | |
| Net investment income | | | (0.20 | ) | | | (0.14 | ) | |
| Total distributions to shareholders | | | (0.20 | ) | | | (0.14 | ) | |
| Proceeds from regulatory settlement | | | 0.00 | (b) | | | — | | |
| Net asset value, end of period | | $ | 9.93 | | | $ | 9.93 | | |
| Total return | | | 1.99 | % | | | 0.73 | % | |
| Ratios to average net assets(c) | |
| Expenses prior to fees waived or expenses reimbursed | | | 0.44 | % | | | 0.48 | %(d) | |
| Net expenses after fees waived or expenses reimbursed(e) | | | 0.44 | %(f) | | | 0.46 | %(d)(f) | |
| Net investment income | | | 1.80 | %(f) | | | 1.99 | %(d)(f) | |
| Supplemental data | |
| Net assets, end of period (in thousands) | | $ | 2,706 | | | $ | 10,679 | | |
| Portfolio turnover | | | 76 | %(g) | | | 83 | % | |
| Notes to Financial Highlights | |
(a) For the period from September 27, 2010 (commencement of operations) to March 31, 2011.
(b) Rounds to less than $0.01.
(c) In addition to the fees and expenses which the Fund bears directly, the Fund indirectly bears a pro rata share of the fees and expenses of the acquired funds in which it invests. Such indirect expenses are not included in the reported expense ratios.
(d) Annualized.
(e) The Investment Manager and certain of its affiliates agreed to waive/reimburse certain fees and expenses, if applicable.
(f) The benefits derived from expense reductions had an impact of less than 0.01%.
(g) Includes mortgage dollar rolls. If mortgage dollar roll transactions were excluded, the portfolio turnover would have been 63% for the year ended March 31, 2012.
The Accompanying Notes to Financial Statements are an integral part of this statement.
27
Financial Highlights (continued) – Columbia Short Term Bond Fund
| | | Year ended March 31, | |
| | | 2012 | | 2011(a) | |
| Class R | |
| Per share data | |
| Net asset value, beginning of period | | $ | 9.94 | | | $ | 10.02 | | |
| Income from investment operations: | |
| Net investment income | | | 0.12 | | | | 0.07 | | |
| Net realized and unrealized gain (loss) | | | 0.04 | | | | (0.03 | ) | |
| Total from investment operations | | | 0.16 | | | | 0.04 | | |
| Less distributions to shareholders from: | |
| Net investment income | | | (0.14 | ) | | | (0.12 | ) | |
| Total distributions to shareholders | | | (0.14 | ) | | | (0.12 | ) | |
| Proceeds from regulatory settlement | | | 0.00 | (b) | | | — | | |
| Net asset value, end of period | | $ | 9.96 | | | $ | 9.94 | | |
| Total return | | | 1.60 | % | | | 0.37 | % | |
| Ratios to average net assets(c) | |
| Expenses prior to fees waived or expenses reimbursed | | | 1.15 | % | | | 1.19 | %(d) | |
| Net expenses after fees waived or expenses reimbursed(e) | | | 0.99 | %(f) | | | 1.04 | %(d)(f) | |
| Net investment income | | | 1.22 | %(f) | | | 1.35 | %(d)(f) | |
| Supplemental data | |
| Net assets, end of period (in thousands) | | $ | 3,594 | | | $ | 2 | | |
| Portfolio turnover | | | 76 | %(g) | | | 83 | % | |
| Notes to Financial Highlights | |
(a) For the period from September 27, 2010 (commencement of operations) to March 31, 2011.
(b) Rounds to less than $0.01.
(c) In addition to the fees and expenses which the Fund bears directly, the Fund indirectly bears a pro rata share of the fees and expenses of the acquired funds in which it invests. Such indirect expenses are not included in the reported expense ratios.
(d) Annualized.
(e) The Investment Manager and certain of its affiliates agreed to waive/reimburse certain fees and expenses, if applicable.
(f) The benefits derived from expense reductions had an impact of less than 0.01%.
(g) Includes mortgage dollar rolls. If mortgage dollar roll transactions were excluded, the portfolio turnover would have been 63% for the year ended March 31, 2012.
The Accompanying Notes to Financial Statements are an integral part of this statement.
28
Financial Highlights (continued) – Columbia Short Term Bond Fund
| | | Year ended March 31, | |
| | | 2012 | | 2011(a) | |
| Class R4 | |
| Per share data | |
| Net asset value, beginning of period | | $ | 9.92 | | | $ | 9.93 | | |
| Income from investment operations: | |
| Net investment income (loss) | | | 0.14 | | | | (0.03 | ) | |
| Net realized and unrealized gain | | | 0.04 | | | | 0.04 | | |
| Total from investment operations | | | 0.18 | | | | 0.01 | | |
| Less distributions to shareholders from: | |
| Net investment income | | | (0.17 | ) | | | (0.02 | ) | |
| Total distributions to shareholders | | | (0.17 | ) | | | (0.02 | ) | |
| Proceeds from regulatory settlement | | | 0.00 | (b) | | | — | | |
| Net asset value, end of period | | $ | 9.93 | | | $ | 9.92 | | |
| Total return | | | 1.83 | % | | | 0.07 | % | |
| Ratios to average net assets(c) | |
| Expenses prior to fees waived or expenses reimbursed | | | 0.75 | % | | | 0.68 | %(d) | |
| Net expenses after fees waived or expenses reimbursed(e) | | | 0.75 | %(f) | | | 0.66 | %(d)(f) | |
| Net investment income (loss) | | | 1.46 | %(f) | | | (4.05 | %)(d)(f) | |
| Supplemental data | |
| Net assets, end of period (in thousands) | | $ | 4,205 | | | $ | 3 | | |
| Portfolio turnover | | | 76 | %(g) | | | 83 | % | |
| Notes to Financial Highlights | |
(a) For the period from March 07, 2011 (commencement of operations) to March 31, 2011.
(b) Rounds to less than $0.01.
(c) In addition to the fees and expenses which the Fund bears directly, the Fund indirectly bears a pro rata share of the fees and expenses of the acquired funds in which it invests. Such indirect expenses are not included in the reported expense ratios.
(d) Annualized.
(e) The Investment Manager and certain of its affiliates agreed to waive/reimburse certain fees and expenses, if applicable.
(f) The benefits derived from expense reductions had an impact of less than 0.01%.
(g) Includes mortgage dollar rolls. If mortgage dollar roll transactions were excluded, the portfolio turnover would have been 63% for the year ended March 31, 2012.
The Accompanying Notes to Financial Statements are an integral part of this statement.
29
Financial Highlights (continued) – Columbia Short Term Bond Fund
| | | Year ended March 31, | |
| | | 2012 | | 2011(a) | |
| Class W | |
| Per share data | |
| Net asset value, beginning of period | | $ | 9.94 | | | $ | 10.02 | | |
| Income from investment operations: | |
| Net investment income | | | 0.15 | | | | 0.08 | | |
| Net realized and unrealized gain (loss) | | | 0.04 | | | | (0.03 | ) | |
| Total from investment operations | | | 0.19 | | | | 0.05 | | |
| Less distributions to shareholders from: | |
| Net investment income | | | (0.17 | ) | | | (0.13 | ) | |
| Total distributions to shareholders | | | (0.17 | ) | | | (0.13 | ) | |
| Proceeds from regulatory settlement | | | 0.00 | (b) | | | — | | |
| Net asset value, end of period | | $ | 9.96 | | | $ | 9.94 | | |
| Total return | | | 1.89 | % | | | 0.48 | % | |
| Ratios to average net assets(c) | |
| Expenses prior to fees waived or expenses reimbursed | | | 0.90 | % | | | 0.90 | %(d) | |
| Net expenses after fees waived or expenses reimbursed(e) | | | 0.74 | %(f) | | | 0.77 | %(d)(f) | |
| Net investment income | | | 1.53 | %(f) | | | 1.67 | %(d)(f) | |
| Supplemental data | |
| Net assets, end of period (in thousands) | | $ | 8 | | | $ | 2 | | |
| Portfolio turnover | | | 76 | %(g) | | | 83 | % | |
| Notes to Financial Highlights | |
(a) For the period from September 27, 2010 (commencement of operations) to March 31, 2011
(b) Rounds to less than $0.01.
(c) In addition to the fees and expenses which the Fund bears directly, the Fund indirectly bears a pro rata share of the fees and expenses of the acquired funds in which it invests. Such indirect expenses are not included in the reported expense ratios.
(d) Annualized.
(e) The Investment Manager and certain of its affiliates agreed to waive/reimburse certain fees and expenses, if applicable.
(f) The benefits derived from expense reductions had an impact of less than 0.01%.
(g) Includes mortgage dollar rolls. If mortgage dollar roll transactions were excluded, the portfolio turnover would have been 63% for the year ended March 31, 2012.
The Accompanying Notes to Financial Statements are an integral part of this statement.
30
Financial Highlights (continued) – Columbia Short Term Bond Fund
| | | Year ended March 31, | |
| | | 2012 | | 2011 | | 2010(a) | |
| Class Y | |
| Per share data | |
| Net asset value, beginning of period | | $ | 9.92 | | | $ | 9.93 | | | $ | 9.70 | | |
| Income from investment operations: | |
| Net investment income | | | 0.19 | | | | 0.25 | | | | 0.24 | | |
| Net realized and unrealized gain | | | 0.02 | | | | 0.03 | | | | 0.23 | | |
| Total from investment operations | | | 0.21 | | | | 0.28 | | | | 0.47 | | |
| Less distributions to shareholders from: | |
| Net investment income | | | (0.20 | ) | | | (0.29 | ) | | | (0.24 | ) | |
| Total distributions to shareholders | | | (0.20 | ) | | | (0.29 | ) | | | (0.24 | ) | |
| Proceeds from regulatory settlement | | | 0.00 | (b) | | | — | | | | 0.00 | (b) | |
| Net asset value, end of period | | $ | 9.93 | | | $ | 9.92 | | | $ | 9.93 | | |
| Total return | | | 2.11 | % | | | 2.84 | % | | | 4.91 | % | |
| Ratios to average net assets(c) | |
| Expenses prior to fees waived or expenses reimbursed | | | 0.44 | % | | | 0.47 | % | | | 0.47 | %(d) | |
| Net expenses after fees waived or expenses reimbursed(e) | | | 0.44 | %(f) | | | 0.45 | %(f) | | | 0.47 | %(d)(f) | |
| Net investment income | | | 1.93 | %(f) | | | 2.51 | %(f) | | | 3.39 | %(d)(f) | |
| Supplemental data | |
| Net assets, end of period (in thousands) | | $ | 13,707 | | | $ | 16,173 | | | $ | 26,110 | | |
| Portfolio turnover | | | 76 | %(g) | | | 83 | % | | | 91 | % | |
| Notes to Financial Highlights | |
(a) For the period from July 15, 2009 (commencement of operations) to March 31, 2010.
(b) Rounds to less than $0.01.
(c) In addition to the fees and expenses which the Fund bears directly, the Fund indirectly bears a pro rata share of the fees and expenses of the acquired funds in which it invests. Such indirect expenses are not included in the reported expense ratios.
(d) Annualized.
(e) The Investment Manager and certain of its affiliates agreed to waive/reimburse certain fees and expenses, if applicable.
(f) The benefits derived from expense reductions had an impact of less than 0.01%.
(g) Includes mortgage dollar rolls. If mortgage dollar roll transactions were excluded, the portfolio turnover would have been 63% for the year ended March 31, 2012.
The Accompanying Notes to Financial Statements are an integral part of this statement.
31
Financial Highlights (continued) – Columbia Short Term Bond Fund
| | | Year ended March 31, | |
| | | 2012 | | 2011 | | 2010 | | 2009 | | 2008 | |
| Class Z | |
| Per share data | |
| Net asset value, beginning of period | | $ | 9.92 | | | $ | 9.93 | | | $ | 9.45 | | | $ | 9.87 | | | $ | 9.82 | | |
| Income from investment operations: | |
| Net investment income | | | 0.18 | | | | 0.24 | | | | 0.35 | | | | 0.45 | | | | 0.46 | | |
| Net realized and unrealized gain (loss) | | | 0.03 | | | | 0.04 | | | | 0.49 | | | | (0.43 | ) | | | 0.06 | | |
| Total from investment operations | | | 0.21 | | | | 0.28 | | | | 0.84 | | | | 0.02 | | | | 0.52 | | |
| Less distributions to shareholders from: | |
| Net investment income | | | (0.19 | ) | | | (0.29 | ) | | | (0.36 | ) | | | (0.44 | ) | | | (0.47 | ) | |
| Total distributions to shareholders | | | (0.19 | ) | | | (0.29 | ) | | | (0.36 | ) | | | (0.44 | ) | | | (0.47 | ) | |
| Proceeds from regulatory settlement | | | 0.00 | (a) | | | — | | | | 0.00 | (a) | | | 0.00 | (a) | | | — | | |
| Net asset value, end of period | | $ | 9.94 | | | $ | 9.92 | | | $ | 9.93 | | | $ | 9.45 | | | $ | 9.87 | | |
| Total return | | | 2.14 | % | | | 2.82 | % | | | 8.97 | % | | | 0.27 | % | | | 5.39 | % | |
| Ratios to average net assets(b) | |
| Expenses prior to fees waived or expenses reimbursed | | | 0.62 | % | | | 0.57 | % | | | 0.51 | % | | | 0.52 | % | | | 0.50 | % | |
| Net expenses after fees waived or expenses reimbursed(c) | | | 0.49 | %(d) | | | 0.48 | %(d) | | | 0.48 | %(d) | | | 0.48 | %(d) | | | 0.48 | %(d) | |
| Net investment income | | | 1.86 | %(d) | | | 2.46 | %(d) | | | 3.54 | %(d) | | | 4.68 | %(d) | | | 4.67 | %(d) | |
| Supplemental data | |
| Net assets, end of period (in thousands) | | $ | 2,099,898 | | | $ | 1,936,070 | | | $ | 2,025,199 | | | $ | 1,133,563 | | | $ | 1,092,555 | | |
| Portfolio turnover | | | 76 | %(e) | | | 83 | % | | | 91 | % | | | 58 | % | | | 58 | % | |
| Notes to Financial Highlights | |
(a) Rounds to less than $0.01.
(b) In addition to the fees and expenses which the Fund bears directly, the Fund indirectly bears a pro rata share of the fees and expenses of the acquired funds in which it invests. Such indirect expenses are not included in the reported expense ratios.
(c) The Investment Manager and certain of its affiliates agreed to waive/reimburse certain fees and expenses, if applicable.
(d) The benefits derived from expense reductions had an impact of less than 0.01%.
(e) Includes mortgage dollar rolls. If mortgage dollar roll transactions were excluded, the portfolio turnover would have been 63% for the year ended March 31, 2012.
The Accompanying Notes to Financial Statements are an integral part of this statement.
32
Notes to Financial Statements – Columbia Short Term Bond Fund
March 31, 2012
Note 1. Organization
Columbia Short Term Bond Fund (the Fund), a series of Columbia Funds Series Trust (the Trust), is a diversified fund. The Trust is registered under the Investment Company Act of 1940, as amended (the 1940 Act), as an open-end management investment company organized as a Delaware statutory trust.
Fund Shares
The Trust may issue an unlimited number of shares (without par value). The Fund offers Class A, Class B, Class C, Class I, Class R, Class R4, Class W, Class Y and Class Z shares. All share classes have identical voting, dividend and liquidation rights. Each share class has its own expense structure and sales charges, as applicable.
Class A shares are subject to a maximum front-end sales charge of 1.00% based on the initial investment amount. Class A shares purchased without an initial sales charge in accounts aggregating $1 million to $50 million at the time of purchase are subject to a contingent deferred sales charge (CDSC) if the shares are sold within 18 months of purchase, charged as follows: 1.00% CDSC if redeemed within 12 months of purchase, and 0.50% CDSC if redeemed more than 12, but less than 18, months after purchase.
Class B shares may be subject to a maximum CDSC of 5.00% based upon the holding period after purchase. Class B shares will generally convert to Class A shares eight years after purchase. The Fund no longer accepts investments by new or existing investors in the Fund's Class B shares, except in connection with the reinvestment of any dividend and/or capital gain distributions in Class B shares of the Fund and exchanges by existing Class B shareholders of certain other funds within the Columbia Family of Funds.
Class C shares are subject to a 1.00% CDSC on shares redeemed within one year of purchase.
Class I shares are not subject to sales charges and are only available to the Columbia Family of Funds.
Class R shares are not subject to sales charges and are only available to qualifying institutional investors.
Class R4 shares are not subject to sales charges; however, this share class is closed to new investors.
Class W shares are not subject to sales charges and are only available to investors purchasing through authorized investment programs managed by investment professionals, including discretionary managed account programs.
Class Y shares are not subject to sales charges and are only available to certain categories of investors which are subject to minimum initial investment requirements.
Class Z shares are not subject to sales charges, and are only available to certain investors, as described in the Fund's prospectus.
Note 2. Summary of Significant Accounting Policies
Use of Estimates
The preparation of financial statements in accordance with U.S. generally accepted accounting principles (GAAP) requires management to make certain estimates and assumptions that affect the reported amounts of assets and liabilities, the disclosure of contingent assets and liabilities at the date of the financial statements and the reported amounts of revenue and expenses during the reporting period. Actual results could differ from those estimates.
The following is a summary of significant accounting policies consistently followed by the Fund in the preparation of its financial statements.
Security Valuation
Debt securities generally are valued by pricing services approved by the Board of Trustees (the Board) based upon market transactions for normal, institutional-size trading units of similar securities. The services may use various pricing techniques which take into account appropriate factors such as yield, quality, coupon rate, maturity, type of issue, trading characteristics and other data, as well as broker quotes. Debt securities for which quotations are readily available may also be valued based upon an over-the-counter or exchange bid quotation.
Asset and mortgage-backed securities are generally valued by pricing services, which utilize pricing models that incorporate the securities' cash flow and loan performance data. These models also take into account available market data, including trades, market quotations, and benchmark yield curves for identical or similar securities. Factors used to identify similar securities may include, but are not limited to, issuer, collateral type, vintage, prepayment speeds, collateral performance, credit ratings, credit enhancement and expected life. Asset-backed
33
Columbia Short Term Bond Fund, March 31, 2012
securities for which quotations are readily available may also be valued based upon an over-the-counter or exchange bid quotation.
Investments in other open-end investment companies, including money market funds, are valued at net asset value.
Short-term securities purchased within 60 days to maturity are valued at amortized cost, which approximates market value. The value of short-term securities originally purchased with maturities greater than 60 days is determined based on an amortized value to par upon reaching 60 days to maturity. Short-term securities maturing in more than 60 days from the valuation date are valued at the market price or approximate market value based on current interest rates.
Futures and options on futures contracts are valued based upon the settlement price established each day by the board of trade or exchange on which they are traded.
Foreign securities are valued based on quotations from the principal market in which such securities are normally traded. If any foreign share prices are not readily available as a result of limited share activity the securities are valued at the mean of the latest quoted bid and asked prices on such exchanges or markets. Foreign currency exchange rates are generally determined at 4:00 p.m. Eastern (U.S.) time. However, many securities markets and exchanges outside the U.S. close prior to the close of the NYSE; therefore, the closing prices for securities in such markets or on such exchanges may not fully reflect events that occur after such close but before the close of the NYSE. In those situations, foreign securities will be fair valued pursuant to the policy adopted by the Board, including utilizing a third party pricing service to determine these fair values. The third party pricing service takes into account multiple factors, including, but not limited to, movements in the U.S. securities markets, certain depositary receipts, futures contracts and foreign exchange rates that have occurred subsequent to the close of the foreign exchange, to determine a good faith estimate that reasonably reflects the current market conditions as of the close of the NYSE. The fair value of a security is likely to be different from the quoted or published price, if available.
Investments for which market quotations are not readily available, or that have quotations which management believes are not reliable, are valued at fair value as determined in good faith under consistently applied procedures established by and under the general supervision of the Board. If a security or class of securities (such as foreign securities) is valued at fair value, such value is likely to be different from the last quoted market price for the security. The determination of fair value often requires significant judgment. To determine fair value, management may use assumptions including but not limited to future cash flows and estimated risk premiums. Multiple inputs from various sources may be used to determine value.
Derivative Instruments
The Fund invests in certain derivative instruments as detailed below to meet its investment objectives. Derivatives are instruments whose values depend on, or are derived from, in whole or in part, the value of one or more other assets, such as securities, currencies, commodities or indices. Derivative instruments may be used to maintain cash reserves while maintaining exposure to certain other assets, to offset anticipated declines in values of investments, to facilitate trading, to reduce transaction costs and to pursue higher investment returns. The Fund may also use derivative instruments to mitigate certain investment risks, such as foreign currency exchange rate risk, interest rate risk and credit risk. Derivatives may involve various risks, including the potential inability of the counterparty to fulfill its obligation under the terms of the contract, the potential for an illiquid secondary market and the potential for market movements which may expose the Fund to gains or losses in excess of the amount shown in the Statement of Assets and Liabilities.
The Fund and any counterparty are required to maintain an agreement that requires the Fund and that counterparty to monitor (on a daily basis) the net fair value of all derivatives entered into pursuant to the agreement between the Fund and such counterparty. If the net fair value of such derivatives between the Fund and that counterparty exceeds a certain threshold (as defined in the agreement), the Fund or the counterparty (as the case may be) is required to post cash and/or securities as collateral. Fair values of derivatives presented in the financial statements are not netted with the fair value of other derivatives or with any collateral amounts posted by the Fund or any counterparty.
Futures Contracts
Futures contracts represent commitments for the future purchase or sale of an asset at a specified price on a specified date. The Fund bought and sold futures contracts to manage the duration and yield curve exposure of the Fund versus the benchmark and manage exposure to movements in interest
34
Columbia Short Term Bond Fund, March 31, 2012
rates. Upon entering into futures contracts, the Fund bears risks which may include interest rates, exchange rates or securities prices moving unexpectedly, in which case, the Fund may not achieve the anticipated benefits of the futures contracts and may realize a loss. Additional risks include counterparty credit risk, the possibility of an illiquid market, and that a change in the value of the contract or option may not correlate with changes in the value of the underlying asset.
Upon entering into a futures contract, the Fund pledges cash or securities with the broker in an amount sufficient to meet the initial margin requirement. Subsequent payments (variation margin) are made or received by the Fund each day. The variation margin payments are equal to the daily change in the contract value and are recorded as variation margin receivable or payable and are offset in unrealized gains or losses. The Fund recognizes a realized gain or loss when the contract is closed or expires. Futures contracts involve, to varying degrees, risk of loss in excess of the variation margin disclosed in the Statement of Assets and Liabilities.
Effects of Derivative Transactions in the Financial Statements
The following tables are intended to provide additional information about the effect of derivatives on the financial statements of the Fund, including: the fair value of derivatives by risk category and the location of those fair values in the Statement of Assets and Liabilities; the impact of derivative transactions on the Fund's operations over the period including realized gains or losses and unrealized gains or losses. The derivative schedules following the Portfolio of Investments present additional information regarding derivative instruments outstanding at the end of the period, if any.
| Fair Values of Derivative Instruments at March 31, 2012 | |
| | | Asset derivatives | |
Risk Exposure
Category | | Statement of Assets and
Liabilities Location | | Fair Value | |
Interest rate
contracts | | Net assets—unrealized
appreciation on futures
contracts | | $ | 749,136 | * | |
* Includes cumulative appreciation (depreciation) of futures contracts as reported in the Futures Contracts Outstanding table following the Portfolio of Investments. Only the current day's variation margin is reported in receivables or payables in the Statement of Assets and Liabilities.
Effect of Derivative Instruments in the Statement of Operations for the Year Ended March 31, 2012
Amount of Realized Gain (Loss) on Derivatives Recognized in Income
| Risk Exposure Category | | Futures Contracts | |
| Interest rate contracts | | $ | (16,761,458 | ) | |
Change in Unrealized Appreciation (Depreciation) on Derivatives Recognized in Income
| Risk Exposure Category | | Futures Contracts | |
| Interest rate contracts | | $ | 1,169,293 | | |
Volume of Derivative Instruments for the Year Ended March 31, 2012
| | | Contracts
Opened | |
| Futures Contracts | | | 12,712 | | |
Repurchase Agreements
The Fund may engage in repurchase agreement transactions with institutions that management has determined are creditworthy. The Fund, through the custodian, receives delivery of the underlying securities collateralizing a repurchase agreement. Management is responsible for determining that the collateral is at least equal, at all times, to the value of the repurchase obligation including interest. A repurchase agreement transaction involves certain risks in the event of default or insolvency of the counterparty. These risks include possible delays in or restrictions on a Fund's ability to dispose of the underlying securities and a possible decline in the value of the underlying securities during the period while the Fund seeks to assert its rights.
Delayed Delivery Securities
The Fund may trade securities on other than normal settlement terms, including securities purchased or sold on a "when-issued" basis. This may increase the risk if the other party to the transaction fails to deliver and causes the Fund to subsequently invest at less advantageous prices. The Fund designates cash or liquid securities in an amount equal to the delayed delivery commitment.
35
Columbia Short Term Bond Fund, March 31, 2012
Mortgage Dollar Roll Transactions
The Fund may enter into mortgage "dollar rolls" in which the Fund sells securities for delivery in the current month and simultaneously contracts with the same counterparty to repurchase similar (same type, coupon and maturity) but not identical securities on a specified future date not exceeding 120 days. During the roll period, the Fund loses the right to receive principal and interest paid on the securities sold. However, the Fund will benefit because it receives negotiated amounts in the form of reductions of the purchase price for the future purchase plus the interest earned on the cash proceeds of the securities sold until the settlement date of the forward purchase. The Fund records the incremental difference between the forward purchase and sale of each forward roll as a realized gain or loss. Unless any realized gains exceed the income, capital appreciation, and gain or loss due to mortgage prepayments that would have been realized on the securities sold as part of the mortgage dollar roll, the use of this technique will diminish the investment performance of the Fund compared to what the performance would have been without the use of mortgage dollar rolls. All cash proceeds will be invested in instruments that are permissible investments for the Fund. The Fund identifies within its Portfolio of Investments cash or liquid securities in an amount equal to the forward purchase price.
For financial reporting and tax purposes, the Fund treats "to be announced" mortgage dollar rolls as two separate transactions, one involving the purchase of a security and a separate transaction involving a sale. This treatment may exaggerate the Fund's portfolio turnover rate. The Fund does not currently enter into mortgage dollar rolls that are accounted for as financing transactions.
Mortgage dollar rolls involve certain risks. If the broker-dealer to whom the Fund sells the securities becomes insolvent, the Fund's right to purchase or repurchase the mortgage-related securities may be restricted and the instruments which the Fund is required to repurchase may be worth less than instruments which the Fund originally held. Successful use of mortgage dollar rolls may depend upon the Investment Manager's ability to predict interest rates and mortgage prepayments. For these reasons, there is no assurance that mortgage dollar rolls can be successfully employed.
Restricted Securities
Restricted securities are securities that may only be resold upon registration under federal securities laws or in transactions exempt from registration. In some cases, the issuer of restricted securities has agreed to register such securities for resale at the issuer's expense either upon demand by the Fund or in connection with another registered offering of the securities. Many restricted securities may be resold in the secondary market in transactions exempt from registration. Such restricted securities may be determined to be liquid under criteria established by the Board. The Fund will not incur any registration costs upon such resale.
Treasury Inflation Protected Securities
The Fund may invest in treasury inflation protected securities (TIPS). The principal amount of TIPS is adjusted periodically and is increased for inflation or decreased for deflation based on a monthly published index. Interest payments are based on the adjusted principal at the time the interest is paid. These adjustments are recorded as interest income in the Statement of Operations.
Stripped Securities
The Fund may invest in Interest Only (IO) and Principal Only (PO) stripped mortgage-backed securities. These securities are derivative multi-class mortgage securities structured so that one class receives most, if not all, of the principal from the underlying mortgage assets, while the other class receives most, if not all, of the interest and the remainder of the principal. If the underlying mortgage assets experience greater than anticipated prepayments of principal, the Fund may fail to fully recoup its initial investment in an IO security, therefore the daily interest accrual factor is adjusted each month to reflect the paydown of principal. The market value of these securities can be extremely volatile in response to changes in interest rates. Credit risk reflects the risk that the Fund may not receive all or part of its principal because the issuer or credit enhancer has defaulted on its obligation.
Security Transactions
Security transactions are accounted for on the trade date. Cost is determined and gains (losses) are based upon the specific identification method for both financial statement and federal income tax purposes.
36
Columbia Short Term Bond Fund, March 31, 2012
Income Recognition
Interest income is recorded on the accrual basis. Market premium and discount are amortized and accreted, respectively, on all debt securities, unless otherwise noted. Original issue discount is accreted to interest income over the life of the security with a corresponding increase in the cost basis, if any. For convertible securities, premiums attributable to the conversion feature are not amortized.
Dividend income is recorded on the ex-dividend date.
Awards from class action litigation are recorded as a reduction of cost basis if the Fund still owns the applicable securities on the payment date. If the Fund no longer owns the applicable securities, the proceeds are recorded as realized gains.
Expenses
General expenses of the Trust are allocated to the Fund and other funds of the Trust based upon relative net assets or other expense allocation methodologies determined by the nature of the expense. Expenses directly attributable to the Fund are charged to the Fund. Expenses directly attributable to a specific class of shares are charged to that share class.
Determination of Class Net Asset Value
All income, expenses (other than class-specific expenses, which are charged to that share class, as shown in the Statement of Operations) and realized and unrealized gains (losses) are allocated to each class of the Fund on a daily basis for purposes of determining the net asset value of each class. Income and expenses are allocated to each class based on the settled shares method, while realized and unrealized gains (losses) are allocated based on the relative net assets of each class.
Federal Income Tax Status
The Fund intends to qualify each year as a regulated investment company under Subchapter M of the Internal Revenue Code, as amended, and will distribute substantially all of its tax exempt or taxable income (including net short-term capital gains), if any, for its tax year, and as such will not be subject to federal income taxes. In addition, the Fund intends to distribute in each calendar year substantially all of its net investment income, capital gains and certain other amounts, if any, such that the Fund should not be subject to federal excise tax. Therefore, no federal income or excise tax provision is recorded.
Distributions to Shareholders
Distributions from net investment income are declared daily and paid monthly. Net realized capital gains, if any, are distributed at least annually. Income distributions and capital gain distributions are determined in accordance with federal income tax regulations which may differ from GAAP.
Guarantees and Indemnifications
Under the Trust's organizational documents and, in some cases, by contract, its officers and trustees are indemnified against certain liabilities arising out of the performance of their duties to the Trust or its funds. In addition, certain of the Fund's contracts with its service providers contain general indemnification clauses. The Fund's maximum exposure under these arrangements is unknown since the amount of any future claims that may be made against the Fund cannot be determined, and the Fund has no historical basis for predicting the likelihood of any such claims.
Recent Accounting Pronouncement
Fair Value Measurements and Disclosures
In May 2011, the Financial Accounting Standards Board (FASB) issued ASU No. 2011-04 modifying Topic 820, Fair Value Measurements and Disclosures. At the same time, the International Accounting Standards Board (IASB) issued International Financial Reporting Standard 13, Fair Value Measurement. The objective of the FASB and IASB is convergence of their guidance on fair value measurements and disclosures.
Specifically, ASU No. 2011-04 requires reporting entities to disclose i) the amounts of any transfers between Level 1 and Level 2, and the reasons for the transfers, ii) for Level 3 fair value measurements, a) quantitative information about significant unobservable inputs used, b) a description of the valuation processes used by the reporting entity and c) a narrative description of the sensitivity of the fair value measurement to changes in unobservable inputs if a change in those inputs might result in a significantly higher or lower fair value measurement. The effective date of ASU No. 2011-04 is for interim and annual periods beginning after December 15,
37
Columbia Short Term Bond Fund, March 31, 2012
2011. At this time, management is evaluating the implications of this guidance and the impact it will have on the financial statement amounts and footnote disclosures, if any.
Note 3. Fees and Compensation Paid to Affiliates
Investment Management Fees
Under an Investment Management Services Agreement, Columbia Management Investment Advisers, LLC (the Investment Manager), a wholly-owned subsidiary of Ameriprise Financial, Inc. (Ameriprise Financial), determines which securities will be purchased, held or sold. The management fee is an annual fee that is equal to a percentage of the Fund's average daily net assets that declines from 0.36% to 0.24% as the Fund's net assets increase. The effective management fee rate for the year ended March 31, 2012 was 0.36% of the Fund's average daily net assets.
Administration Fees
Under an Administrative Services Agreement, the Investment Manager serves as the Fund Administrator. The Fund pays the Fund Administrator an annual fee for administration and accounting services equal to a percentage of the Fund's average daily net assets that declines from 0.07% to 0.04% as the Fund's net assets increase. The effective administration fee rate for the year ended March 31, 2012 was 0.06% of the Fund's average daily net assets.
Pricing and Bookkeeping Fees
Prior to May 16, 2011, the Fund had entered into a Financial Reporting Services Agreement (the Financial Reporting Services Agreement) with State Street Bank and Trust Company (State Street) and the Investment Manager pursuant to which State Street provided financial reporting services to the Fund. The Fund also entered into an Accounting Services Agreement (collectively with the Financial Reporting Services Agreement, the State Street Agreements) with State Street and the Investment Manager pursuant to which State Street provided accounting services to the Fund. Under the State Street Agreements, the Fund paid State Street an annual fee of $38,000 paid monthly plus an additional monthly fee based on an annualized percentage rate of average daily net assets of the Fund for the month. The aggregate fee did not exceed $140,000 per year (exclusive of out-of-pocket expenses and charges). The Fund also reimbursed State Street for certain out-of-pocket expenses and charges. Effective May 16, 2011, these services are provided under the Administrative Services Agreement discussed above.
Other expenses
Effective June 1, 2011, other expenses are for, among other things, certain expenses of the Fund or the Board, including: Fund boardroom and office expense, employee compensation, employee health and retirement benefits, and certain other expenses. Payment of these Fund and Board expenses is facilitated by a company providing limited administrative services to the Fund and the Board. For the period June 1, 2011 through March 31, 2012, other expenses paid to this company were $9,779.
Compensation of Board Members
Board members are compensated for their services to the Fund as disclosed in the Statement of Operations. Under a Deferred Compensation Plan (the Plan), the Board members who are not "interested persons" of the Fund, as defined under the 1940 Act, may elect to defer payment of up to 100% of their compensation. Deferred amounts are treated as though equivalent dollar amounts had been invested in shares of certain funds managed by the Investment Manager. The Fund's liability for these amounts is adjusted for market value changes and remains in the Fund until distributed in accordance with the Plan.
Compensation of Chief Compliance Officer
The Board has appointed a Chief Compliance Officer to the Fund in accordance with federal securities regulations. The Fund's expenses associated with the Chief Compliance Officer are paid directly by the Investment Manager.
Transfer Agent Fees
Under a Transfer and Dividend Disbursing Agent Agreement, Columbia Management Investment Services Corp. (the Transfer Agent), an affiliate of the Investment Manager and a wholly-owned subsidiary of Ameriprise Financial, is responsible for providing transfer agency services to the Fund. The Transfer Agent has contracted with Boston Financial Data Services (BFDS) to serve as sub-transfer agent.
The Transfer Agent receives monthly account-based service fees based on the number of open accounts and is reimbursed
38
Columbia Short Term Bond Fund, March 31, 2012
by the Fund for the fees and expenses the Transfer Agent pays to financial intermediaries that maintain omnibus accounts with the Fund that is a percentage of the average aggregate value of the Fund's shares maintained in each such omnibus account (other than omnibus accounts for which American Enterprise Investment Services Inc. is the broker of record or accounts where the beneficial shareholder is a customer of Ameriprise Financial Services, Inc., which are paid a per account fee). The Transfer Agent pays the fees of BFDS for services as sub-transfer agent and is not entitled to reimbursement for such fees from the Fund (with the exception of out-of-pocket fees).
The Transfer Agent also receives compensation from fees for various shareholder services and reimbursements for certain out-of-pocket expenses. Class I shares do not pay transfer agent fees. Total transfer agent fees for Class R4 shares are subject to an annual limitation of not more than 0.05% of the average daily net assets attributable to each share class.
For the year ended March 31, 2012, the Fund's effective transfer agent fee rates as a percentage of average daily net assets of each class were as follows:
| Class A | | | 0.19 | % | |
| Class B | | | 0.21 | | |
| Class C | | | 0.18 | | |
| Class R | | | 0.21 | | |
| Class R4 | | | 0.05 | | |
| Class W | | | 0.21 | | |
| Class Y | | | 0.00 | | |
| Class Z | | | 0.18 | | |
In connection with the acquisition of RiverSource Short Term Duration U.S. Government Fund (see Note 12), the fund assumed the assets and obligations of RiverSource Short Term Duration U.S. Government Fund, which together with certain other associated investment companies (together, the Guarantors), have severally, but not jointly, guaranteed the performance and observance of all the terms and conditions of a lease entered into by Seligman Data Corp. (SDC), the former transfer agent, including the payment of rent by SDC (the Guaranty). The lease and the Guaranty expire in January 2019. At March 31, 2012, the Fund's total potential future obligation over the life of the Guaranty is $73,346. The liability remaining at March 31, 2012 for non-recurring charges associated with the lease amounted to $48,175 and is included within other accrued expenses in the Statement of Assets and Liabilities.
An annual minimum account balance fee of $20 may apply to certain accounts with a value below the Fund's initial minimum investment requirements to reduce the impact of small accounts on transfer agent fees. These minimum account balance fees are recorded as part of expense reductions in the Statement of Operations. For the year ended March 31, 2012, these minimum account balance fees reduced total expenses by $3,985.
Plan Administration Fees
Under a Plan Administration Services Agreement with the Transfer Agent, the Fund pays an annual fee at a rate of 0.25% of the Fund's average daily net assets attributable to Class R4 shares for the provision of various administrative, recordkeeping, communication and educational services.
Distribution and Service Fees
The Fund has an agreement with Columbia Management Investment Distributors, Inc. (the Distributor), an affiliate of the Investment Manager and a wholly-owned subsidiary of Ameriprise Financial, for distribution and shareholder services. Pursuant to Rule 12b-1 under the 1940 Act, the Board has approved, and the Fund has adopted, distribution and shareholder service plans (the Plans) which set the distribution and service fees for the Fund. These fees are calculated daily and are intended to compensate the Distributor and/or eligible selling and/or servicing agents for selling shares of the Fund and providing services to investors.
The Plans require the payment of a monthly combined distribution and service fee to the Distributor at the maximum annual rate of 0.25% of the average daily net assets attributable to Class A shares of the Fund. The Plans also required the payment of a monthly service fee at the maximum annual rate of 0.25% of the average daily net assets attributable to Class B, Class C and Class W shares of the Fund and the payment of a monthly distribution fee at the maximum annual rates of 0.75%, 0.75%, 0.50% and 0.25% of the average daily net assets attributable to Class B, Class C, Class R and Class W shares, respectively.
39
Columbia Short Term Bond Fund, March 31, 2012
The Distributor has voluntarily agreed to waive a portion of the distribution fee for Class C shares so it does not exceed 0.31% annually of the average daily net assets attributable to Class C shares. This arrangement may be modified or terminated by the Distributor at any time.
The Fund may pay a distribution fee of up to 0.25% of the Fund's average daily net assets attributable to Class W shares and a service fee of up to 0.25% of the Fund's average daily net assets attributable to Class W shares, provided, however, that the aggregate fee shall not exceed 0.25% of the Fund's average daily net assets attributable to Class W shares.
Sales Charges
Sales charges, including front-end charges and CDSCs, received by the Distributor for distributing Fund shares were $123,557 for Class A, $7,611 for Class B and $19,214 for Class C shares for the year ended March 31, 2012.
Expenses Waived/Reimbursed by the Investment Manager and its Affiliates
The Investment Manager and certain of its affiliates have contractually agreed to waive fees and/or reimburse expenses (excluding certain fees and expenses described below), through July 31, 2012, unless sooner terminated at the sole discretion of the Board, so that the Fund's net operating expenses, after giving effect to fees waived/expenses reimbursed and any balance credits and/or overdraft charges from the Fund's custodian, do not exceed the following annual rates as a percentage of the class' average daily net assets:
| Class A | | | 0.74 | % | |
| Class B | | | 1.49 | | |
| Class C | | | 1.49 | | |
| Class I | | | 0.45 | | |
| Class R | | | 0.99 | | |
| Class R4 | | | 0.75 | | |
| Class W | | | 0.74 | | |
| Class Y | | | 0.49 | | |
| Class Z | | | 0.49 | | |
Under the agreement, the following fees and expenses are excluded from the waiver/reimbursement commitment, and therefore will be paid by the Fund, if applicable: taxes (including foreign transaction taxes), expenses associated with investments in affiliated and non-affiliated pooled investment vehicles (including mutual funds and exchange traded funds), transaction costs and brokerage commissions, costs related to any securities lending program, dividend expenses associated with securities sold short, inverse floater program fees and expenses, transaction charges and interest on borrowed money, interest, extraordinary expenses and any other expenses the exclusion of which is specifically approved by the Board. This agreement may be modified or amended only with approval from all parties. Class C distribution fees waived by the Distributor, as discussed above, are in addition to the waiver/reimbursement commitment under the agreement.
Note 4. Federal Tax Information
The timing and character of income and capital gain distributions are determined in accordance with income tax regulations, which may differ from GAAP because of temporary or permanent book to tax differences.
For the year ended March 31, 2012, these differences are primarily due to differing treatment for distributions, proceeds from litigation settlements, deferral/reversal of wash sale losses, Trustees' deferred compensation, expiring capital loss carryforwards, paydown reclassifications, recognition of unrealized appreciation (depreciation) for certain derivative investments, and tax straddles. To the extent these differences are permanent, reclassifications are made among the components of the Fund's net assets in the Statement of Assets and Liabilities. Temporary differences do not require reclassifications. In the Statement of Assets and Liabilities the following reclassifications were made:
Excess of distributions over
net investment income | | | $760,294 | | |
| Accumulated net realized loss | | | 34,440,629 | | |
| Paid-in capital | | | (35,200,923 | ) | |
Net investment income and net realized gains (losses), as disclosed in the Statement of Operations, and net assets were not affected by this reclassification.
40
Columbia Short Term Bond Fund, March 31, 2012
The tax character of distributions paid during the years indicated was as follows:
| Year ended March 31, | | 2012 | | 2011 | |
| Ordinary income | | $ | 50,950,915 | | | $ | 69,181,575 | | |
Short-term capital gain distributions, if any, are considered ordinary income distributions for tax purposes.
At March 31, 2012, the components of distributable earnings on a tax basis were as follows:
| Unrealized appreciation | | $ | 39,410,058 | | |
At March 31, 2012, the cost of investments for federal income tax purposes was $2,933,848,013 and the aggregate gross unrealized appreciation and depreciation based on that cost was:
| Unrealized appreciation | | $ | 44,312,498 | | |
| Unrealized depreciation | | $ | (4,902,440 | ) | |
| Net unrealized appreciation | | $ | 39,410,058 | | |
The following capital loss carryforward, determined at March 31, 2012, may be available to reduce taxable income arising from future net realized gains on investments, if any, to the extent permitted by the Internal Revenue Code:
| Year of Expiration | | Amount | |
| 2013 | | $ | 22,442,089 | | |
| 2014 | | | 21,362,256 | | |
| 2015 | | | 12,691,619 | | |
| 2016 | | | 4,489,585 | | |
| 2017 | | | 18,644,660 | | |
| Total | | $ | 79,630,209 | | |
On December 22, 2010, the Regulated Investment Company Modernization Act of 2010 (the Act) was enacted, which changed various technical rules governing the tax treatment of regulated investment companies. The changes are generally effective for taxable years beginning after the date of enactment. Under the Act, the Fund will be permitted to carry forward capital losses incurred in taxable years beginning after the date of enactment for an unlimited period. However, any losses incurred during those future taxable years will be required to be utilized prior to the losses incurred in pre-enactment taxable years, which carry an expiration date. As a result of this ordering rule, pre-enactment capital loss carryforwards may be more likely to expire unused.
Columbia Short Term Bond Fund acquired $92,174,380 of capital loss carryforward in connection with the RiverSource Short Duration U.S. Government Fund merger (Note 12). In addition to the acquired capital loss carryforward, the Fund also acquired unrealized capital gains as a result of the merger. The yearly utilization of the acquired capital loss carryforward may be limited by the Internal Revenue Code.
For the year ended March 31, 2012, $3,783,139 of capital loss carryforward was utilized and $34,869,515 expired unused.
Management of the Fund has concluded that there are no significant uncertain tax positions that would require recognition in the financial statements. However, management's conclusion may be subject to review and adjustment at a later date based on factors including, but not limited to, new tax laws, regulations, and administrative interpretations (including relevant court decisions). Generally, the Fund's federal tax returns for the prior three fiscal years remain subject to examination by the Internal Revenue Service.
Note 5. Portfolio Information
The cost of purchases and proceeds from sales of securities, excluding short-term obligations but including mortgage dollar rolls, aggregated to $2,077,207,349 and $2,164,236,509, respectively, for the year ended March 31, 2012, of which $1,075,641,791 and $836,633,378, respectively, were U.S. government securities.
Transactions to realign the Fund's portfolio following the merger as described in Note 12 are excluded for purposes of calculating the Fund's portfolio turnover rate. These realignment transactions amounted to cost of purchases and
41
Columbia Short Term Bond Fund, March 31, 2012
proceeds from sales of $113,307,046 and $45,575,719, respectively.
Note 6. Regulatory Settlements
During the year ended March 31, 2012, the Fund received payments of $4,573 resulting from certain regulatory settlements with third parties in which the Fund had participated. The payments have been included in "Proceeds from regulatory settlements" in the Statement of Changes in Net Assets.
Note 7. Lending of Portfolio Securities
Effective May 16, 2011, the Fund has entered into a Master Securities Lending Agreement (the Agreement) with JPMorgan Chase Bank, N.A. (JPMorgan). The Agreement, which replaces the previous securities lending arrangement with State Street, authorizes JPMorgan as lending agent to lend securities to authorized borrowers in order to generate additional income on behalf of the Fund. Pursuant to the Agreement, the securities loaned are secured by cash or U.S. government securities equal to at least 100% of the market value of the loaned securities. Any additional collateral required to maintain those levels due to market fluctuations of the loaned securities is requested to be delivered the following business day. Cash collateral received is invested by the lending agent on behalf of the Fund into authorized investments pursuant to the Agreement. The investments made with the cash collateral are listed in the Portfolio of Investments. The values of such investments and any uninvested cash collateral are disclosed in the Statement of Assets and Liabilities along with the related obligation to return the collateral upon the return of the securities loaned.
Risks of delay in recovery of securities or even loss of rights in the securities may occur should the borrower of the securities fail financially. Risks may also arise to the extent that the value of the securities loaned increases above the value of the collateral received. JPMorgan will indemnify the Fund from losses resulting from a borrower's failure to return a loaned security when due. Such indemnification does not extend to losses associated with declines in the value of cash collateral investments. The Investment Manager is not responsible for any losses incurred by the Fund in connection with the securities lending program. Loans are subject to termination by the Fund or the borrower at any time, and are, therefore, not considered to be illiquid investments.
Pursuant to the Agreement, the Fund receives income for lending its securities either in the form of fees or by earning interest on invested cash collateral, net of negotiated rebates paid to borrowers and fees paid to the lending agent for services provided and any other securities lending expenses. The Fund continues to earn and accrue interest and dividends on the securities loaned.
Prior to May 16, 2011, the Fund participated in a securities lending arrangement with State Street. Each security on loan was collateralized in an amount at least equal to the market value of the securities loaned plus accrued income from the investment of collateral. The income generated by the investment of the collateral, net of any fees remitted to State Street as the lending agent and borrower rebates, was paid to the Fund.
For the year ended March 31, 2012, the Fund did not participate in securities lending activity.
Note 8. Custody Credits
Prior to May 16, 2011, the Fund had an agreement with its custodian bank under which custody fees may have been reduced by balance credits. These credits are recorded as part of expense reductions on the Statement of Operations. The Fund could have invested a portion of the assets utilized in connection with the expense offset arrangement in an income-producing asset if they had not entered into such an agreement. Subsequent to this date, the Fund may invest its daily balance in an affiliated money market fund as detailed below. For the period April 1, 2011 through May 15, 2011, these credits reduced total expenses by $75.
Note 9. Affiliated Money Market Fund
Effective May 16, 2011, the Fund may invest its daily cash balances in Columbia Short-Term Cash Fund, an affiliated money market fund established for the exclusive use by the Fund and other affiliated funds. The income earned by the Fund from such investments is included as "Dividends from affiliates" in the Statement of Operations. As an investing fund, the Fund indirectly bears its proportionate share of the expenses of Columbia Short-Term Cash Fund.
42
Columbia Short Term Bond Fund, March 31, 2012
Note 10. Shareholder Concentration
At March 31, 2012, one unaffiliated shareholder account owned 55.9% of the outstanding shares of the Fund. The Fund has no knowledge about whether any portion of those shares was owned beneficially by such accounts. Subscription and redemption activity by concentrated accounts may have a significant effect on the operations of the Fund.
Note 11. Line of Credit
The Fund has entered into a revolving credit facility with a syndicate of banks led by JPMorgan Chase Bank, N.A. (the Administrative Agent), whereby the Fund may borrow for the temporary funding of shareholder redemptions or for other temporary or emergency purposes. The credit facility became effective on May 16, 2011, replacing a prior credit facility. The credit facility agreement, as amended, which is a collective agreement between the Fund and certain other funds managed by the Investment Manager, severally and not jointly, permits collective borrowings up to $500 million. Pursuant to a December 13, 2011 amendment to the credit facility agreement, interest is charged to each participating fund based on its borrowings at a rate equal to the higher of (i) the overnight federal funds rate plus 1.00% or (i) the one-month LIBOR rate plus 1.00%. Each borrowing under the credit facility matures no later than 60 days after the date of borrowing. The Fund also pays a commitment fee equal to its pro rata share of the amount of the credit facility at a rate of 0.08% per annum. For the period May 16, 2011 through December 13, 2011, interest was charged to each participating fund based on its borrowings at a rate equal to the sum of the federal funds rate plus (i) 1.25% per annum plus (ii) if one-month LIBOR exceeds the federal funds rate, the amount of such excess. The Fund also paid a commitment fee equal to its pro rata share of the amount of the credit facility at a rate of 0.10% per annum.
Prior to May 16, 2011, the Fund and certain other funds managed by the Investment Manager participated in a $225 million committed, unsecured revolving credit facility provided by State Street. Interest was charged to each fund based on its borrowings at a rate equal to the greater of the (i) federal funds rate plus 1.25% per annum or (ii) the overnight LIBOR rate plus 1.25% per annum. The Fund also paid a commitment fee equal to its pro rata share of the amount of the credit facility at a rate of 0.125% per annum.
The Fund had no borrowings during the year ended March 31, 2012.
Note 12. Fund Merger
At the close of business on June 3, 2011, the Fund acquired the assets and assumed the identified liabilities of RiverSource Short Duration U.S. Government Fund, a series of RiverSource Government Income Series, Inc. The reorganization was completed after shareholders approved the plan on February 15, 2011. The purpose of the transaction was to combine two funds managed by the Investment Manager with comparable investment objectives and strategies.
The aggregate net assets of the Fund immediately before the acquisition were $2,387,447,405 and the combined net assets immediately after the acquisition were $2,949,575,338.
The merger was accomplished by a tax-free exchange of 117,478,834 shares of RiverSource Short Duration U.S. Government Fund valued at $562,127,933 (including $8,317,724 of unrealized appreciation).
In exchange for RiverSource Short Duration U.S. Government Fund shares, the Fund issued the following number of shares:
| | | Shares | |
| Class A | | | 42,517,537 | | |
| Class B | | | 3,306,318 | | |
| Class C | | | 2,595,555 | | |
| Class I | | | 7,022,434 | | |
| Class R | | | 351,665 | | |
| Class R4 | | | 449,742 | | |
| Class W | | | 503 | | |
For financial reporting purposes, net assets received and shares issued by the Fund were recorded at fair value; however, RiverSource Short Duration U.S. Government Fund's cost of investments was carried forward.
The financial statements reflect the operations of the Fund for the period prior to the merger and the combined fund for the period subsequent to the merger. Because the combined investment portfolios have been managed as a single integrated portfolio since the merger was completed, it is not practicable to separate the amounts of revenue and earnings
43
Columbia Short Term Bond Fund, March 31, 2012
of RiverSource Short Duration U.S. Government Fund that have been included in the combined Fund's Statement of Operations since the merger was completed.
Assuming the merger had been completed on April 1, 2011 the Fund's pro-forma net investment income, net gain on investments, net change in unrealized appreciation and net increase in net assets from operations for the year ended March 31, 2012 would have been approximately $50.2 million, $1.1 million, $4.8 million and $56.1 million, respectively.
Note 13. Significant Risks
Foreign Securities Risk
Investing in foreign securities may include certain risks and considerations not typically associated with investing in U.S. securities, such as fluctuating currency values and changing local and regional economic, political and social conditions, which may result in greater market volatility. In addition, certain foreign securities may not be as liquid as U.S. securities.
Asset-Backed Securities Risk
The value of asset-backed securities may be affected by, among other factors, changes in interest rates, the market's assessment of the quality of underlying assets, the creditworthiness of the servicer for the underlying assets, factors concerning the interests in and structure of the issuer or the originator of the underlying assets, or the creditworthiness or rating of the entities that provide any supporting letters of credit, surety bonds, derivative instruments, or other credit enhancement. The value of asset-backed securities also will be affected by the exhaustion, termination or expiration of any credit enhancement. Most asset-backed securities are subject to prepayment risk, which is the possibility that the underlying debt may be refinanced or prepaid prior to maturity during periods of declining or low interest rates, causing the Fund to have to reinvest the money received in securities that have lower yields. In addition, the impact of prepayments on the value of asset-backed securities may be difficult to predict and may result in greater volatility.
Mortgage-Backed Securities Risk
The value of mortgage-backed securities may be affected by, among other things, changes in interest rates, factors concerning the interests in and structure of the issuer or the originator of the mortgages, the creditworthiness of the entities that provide any supporting letters of credit, surety bonds or other credit enhancements or the quality of underlying assets or the market's assessment thereof. Mortgage-backed securities are subject to prepayment risk, which is the possibility that the underlying mortgage may be refinanced or prepaid prior to maturity during periods of declining or low interest rates, causing the Fund to have to reinvest the money received in securities that have lower yields. In addition, the impact of prepayments on the value of mortgage-backed securities may be difficult to predict and may result in greater volatility.
Note 14. Subsequent Events
Management has evaluated the events and transactions that have occurred through the date the financial statements were issued and noted no items requiring adjustment of the financial statements or additional disclosure.
Note 15. Information Regarding Pending and Settled Legal Proceedings
In December 2005, without admitting or denying the allegations, American Express Financial Corporation (AEFC, which is now known as Ameriprise Financial, Inc. (Ameriprise Financial)) entered into settlement agreements with the Securities and Exchange Commission (SEC) and Minnesota Department of Commerce (MDOC) related to market timing activities. As a result, AEFC was censured and ordered to cease and desist from committing or causing any violations of certain provisions of the Investment Advisers Act of 1940, the Investment Company Act of 1940, and various Minnesota laws. AEFC agreed to pay disgorgement of $10 million and civil money penalties of $7 million. AEFC also agreed to retain an independent distribution consultant to assist in developing a plan for distribution of all disgorgement and civil penalties ordered by the SEC in accordance with various undertakings detailed at www.sec.gov/litigation/admin/ia-2451.pdf. Ameriprise Financial and its affiliates have cooperated with the SEC and the MDOC in these legal proceedings, and have made regular reports to the funds' Boards of Trustees.
Ameriprise Financial and certain of its affiliates have historically been involved in a number of legal, arbitration and regulatory proceedings, including routine litigation, class
44
Columbia Short Term Bond Fund, March 31, 2012
actions, and governmental actions, concerning matters arising in connection with the conduct of their business activities. Ameriprise Financial believes that the Funds are not currently the subject of, and that neither Ameriprise Financial nor any of its affiliates are the subject of, any pending legal, arbitration or regulatory proceedings that are likely to have a material adverse effect on the Funds or the ability of Ameriprise Financial or its affiliates to perform under their contracts with the Funds. Ameriprise Financial is required to make 10-Q, 10-K and, as necessary, 8-K filings with the Securities and Exchange Commission on legal and regulatory matters that relate to Ameriprise Financial and its affiliates. Copies of these filings may be obtained by accessing the SEC website at www.sec.gov.
There can be no assurance that these matters, or the adverse publicity associated with them, will not result in increased fund redemptions, reduced sale of fund shares or other adverse consequences to the Funds. Further, although we believe proceedings are not likely to have a material adverse effect on the Funds or the ability of Ameriprise Financial or its affiliates to perform under their contracts with the Funds, these proceedings are subject to uncertainties and, as such, we are unable to estimate the possible loss or range of loss that may result. An adverse outcome in one or more of these proceedings could result in adverse judgments, settlements, fines, penalties or other relief that could have a material adverse effect on the consolidated financial condition or results of operations of Ameriprise Financial.
45
Report of Independent Registered Public Accounting Firm
To the Trustees of Columbia Funds Series Trust and the Shareholders of Columbia Short Term Bond Fund
In our opinion, the accompanying statement of assets and liabilities, including the investment portfolio, and the related statements of operations and of changes in net assets and the financial highlights present fairly, in all material respects, the financial position of Columbia Short Term Bond Fund (the "Fund") (a series of Columbia Funds Series Trust) at March 31, 2012, the results of its operations for the year then ended, the changes in its net assets for each of the two years in the period then ended and the financial highlights for each of the periods indicated, in conformity with accounting principles generally accepted in the United States of America. These financial statements and financial highlights (hereafter referred to as "financial statements") are the responsibility of the Fund's management. Our responsibility is to express an opinion on these financial statements based on our audits. We conducted our audits of these financial statements in accordance with the standards of the Public Company Accounting Oversight Board (United States). Those standards require that we plan and perform the audit to obtain reasonable assurance about whether the financial statements are free of material misstatement. An audit includes examining, on a test basis, evidence supporting the amounts and disclosures in the financial statements, assessing the accounting principles used and significant estimates made by management, and evaluating the overall financial statement presentation. We believe that our audits, which included confirmation of securities at March 31, 2012 by correspondence with the custodian, brokers and transfer agent, provide a reasonable basis for our opinion.
PricewaterhouseCoopers LLP
Minneapolis, Minnesota
May 22, 2012
46
Fund Governance
Shareholders elect the Board that oversees the funds' operations. The Board appoints officers who are responsible for day-to-day business decisions based on policies set by the Board. The following table provides basic biographical information about the funds' Board members, including their principal occupations during the past five years, although specific titles for individuals may have varied over the period. Under current Board policy, members may serve until the next Board meeting after he or she reaches the mandatory retirement age established by the Board, or the fifteenth anniversary of the first Board meeting they attended as a member of the Board.
On September 29, 2009, Ameriprise Financial, the parent company of Columbia Management, entered into an agreement with Bank of America, N.A. ("Bank of America") to acquire a portion of the asset management business of Columbia Management Group, LLC and certain of its affiliated companies (the "Transaction"). Following the Transaction, which became effective on May 1, 2010, various alignment activities have occurred with respect to the Fund Family. In connection with the Transaction, Mr. Edward J. Boudreau, Jr., Mr. William P. Carmichael, Mr. William A. Hawkins, Mr. R. Glenn Hilliard, Mr. John J. Nagorniak, Ms. Minor M. Shaw and Dr. Anthony M. Santomero, who were members prior to the Transaction of the Legacy Columbia Nations funds' Board ("Nations Funds"), which includes Columbia Funds Series Trust, Columbia Funds Variable Insurance Trust I and Columbia Funds Master Investment Trust, LLC., began service on the Board for the Legacy RiverSource funds ("RiverSource Funds") effective June 1, 2011, which resulted in an overall increase from twelve Trustees to sixteen for all mutual funds overseen by the Board.
Independent Board Members
| Name, Address, Age | | Position Held
with Funds
and Length
of Service | | Principal Occupation During Past Five Years | | Number of
Funds in the
Fund Family
Overseen by
Board Member | | Other Present or
Past Directorships/
Trusteeships
(Within Past 5 Years) | |
| Kathleen Blatz | | | | | | | | | |
|
901 S. Marquette Ave.
Minneapolis, MN 55402
Age 57 | | Board member since 1/06 for RiverSource Funds and since 6/11 for Nations Funds | | Attorney; Chief Justice, Minnesota Supreme Court, 1998-2006 | | | 156 | | | None | |
|
| Edward J. Boudreau, Jr. | | | | | | | | | |
|
225 Franklin Street
Mail Drop
BX32 05228
Boston, MA 02110
Age 67 | | Board member since 6/11 for RiverSource Funds and since 1/05 for Nations Funds | | Managing Director, E.J. Boudreau & Associates (consulting) since 2000 | | | 149 | | | Former Trustee, BofA Funds Series Trust (11 funds) | |
|
| Pamela G. Carlton | | | | | | | | | |
|
901 S. Marquette Ave.
Minneapolis, MN 55402
Age 57 | | Board member since 7/07 for RiverSource Funds and since 6/11 for Nations Funds | | President, Springboard-Partners in Cross Cultural Leadership (consulting company) | | | 156 | | | None | |
|
47
Fund Governance (continued)
Independent Board Members (continued)
| Name, Address, Age | | Position Held
with Funds
and Length
of Service | | Principal Occupation During Past Five Years | | Number of
Funds in the
Fund Family
Overseen by
Board Member | | Other Present or
Past Directorships/
Trusteeships
(Within Past 5 Years) | |
| William P. Carmichael | | | | | | | | | |
|
225 Franklin Street
Mail Drop
BX32 05228
Boston, MA 02110
Age 68 | | Board member since 6/11 for RiverSource Funds and since 1999 for Nations Funds | | Retired | | | 149 | | | Director, Cobra Electronics Corporation (electronic equipment manufacturer); The Finish Line (athletic shoes and apparel); McMoRan Exploration Company (oil and gas exploration and development); former Trustee, BofA Funds Series Trust (11 funds); former Director, Spectrum Brands, Inc. (consumer products); former Director, Simmons Company (bedding) | |
|
| Patricia M. Flynn | | | | | | | | | |
|
901 S. Marquette Ave.
Minneapolis, MN 55402
Age 61 | | Board member since 11/04 for RiverSource Funds and since 6/11 for Nations Funds | | Trustee Professor of Economics and Management, Bentley University; former Dean, McCallum Graduate School of Business, Bentley University | | | 156 | | | None | |
|
| William A. Hawkins | | | | | | | | | |
|
225 Franklin Street
Mail Drop
BX32 05228
Boston, MA 02110
Age 69 | | Board member since 6/11 for RiverSource Funds and since 1/05 for Nations Funds | | Managing Director, Overton Partners (financial consulting), since August 2010; President and Chief Executive Officer, California General Bank, N.A., January 2008-August 2010 | | | 149 | | | Trustee, BofA Funds Series Trust (11 funds) | |
|
| R. Glenn Hilliard | | | | | | | | | |
|
225 Franklin Street
Mail Drop
BX32 05228
Boston, MA 02110
Age 69 | | Board member since 6/11 for RiverSource Funds and since 1/05 for Nations Funds | | Chairman and Chief Executive Officer, Hilliard Group LLC (investing and consulting), since April 2003; Non-Executive Director & Chairman, CNO Financial Group, Inc. (formerly Conseco, Inc.) (insurance), September 2003-May 2011 | | | 149 | | | Chairman, BofA Fund Series Trust (11 funds); former Director, CNO Financial Group, Inc. (insurance) | |
|
48
Fund Governance (continued)
Independent Board Members (continued)
| Name, Address, Age | | Position Held
with Funds
and Length
of Service | | Principal Occupation During Past Five Years | | Number of
Funds in the
Fund Family
Overseen by
Board Member | | Other Present or
Past Directorships/
Trusteeships
(Within Past 5 Years) | |
| Stephen R. Lewis, Jr. | | | | | | | | | |
|
901 S. Marquette Ave.
Minneapolis, MN 55402
Age 73 | | Chair of the Board for RiverSource Funds since 1/07, Board member for RiverSource Funds since 1/02 and since 6/11 for Nations Funds | | President Emeritus and Professor of Economics Emeritus, Carleton College | | | 156 | | | Director, Valmont Industries, Inc. (manufactures irrigation systems) | |
|
| John F. Maher | | | | | | | | | |
|
901 S. Marquette Ave.
Minneapolis, MN 55402
Age 69 | | Board member since 12/06 for Legacy Seligman funds, since 12/08 for RiverSource Funds and since 6/11 for Nations Funds | | Retired President and Chief Executive Officer and former Director, Great Western Financial Corporation (financial services), 1986-1997 | | | 156 | | | None | |
|
| John J. Nagorniak | | | | | | | | | |
|
225 Franklin Street
Mail Drop
BX32 05228
Boston, MA 02110
Age 67 | | Board member since 6/11 for RiverSource Funds and since 1/08 for Nations Funds | | Retired; President and Director, Foxstone Financial, Inc. (consulting), 2000-2007; Director, Mellon Financial Corporation affiliates (investing), 2000-2007; Chairman, Franklin Portfolio Associates (investing—Mellon affiliate), 1982-2007 | | | 149 | | | Trustee, Research Foundation of CFA Institute; Director, MIT Investment Company; Trustee, MIT 401k Plan; former Trustee, BofA Funds Series Trust (11 funds) | |
|
| Catherine James Paglia | | | | | | | | | |
|
901 S. Marquette Ave.
Minneapolis, MN 55402
Age 59 | | Board member since 11/04 for RiverSource Funds and since 6/11 for Nations Funds | | Director, Enterprise Asset Management, Inc. (private real estate and asset management company) | | | 156 | | | None | |
|
49
Fund Governance (continued)
Independent Board Members (continued)
| Name, Address, Age | | Position Held
with Funds
and Length
of Service | | Principal Occupation During Past Five Years | | Number of
Funds in the
Fund Family
Overseen by
Board Member | | Other Present or
Past Directorships/
Trusteeships
(Within Past 5 Years) | |
| Leroy C. Richie | | | | | | | | | |
|
901 S. Marquette Ave.
Minneapolis, MN 55402
Age 70 | | Board member since 2000 for Legacy Seligman funds, since 11/08 for RiverSource Funds and since 6/11 for Nations Funds | | Counsel, Lewis & Munday, P.C. since 2004; former Vice President and General Counsel, Automotive Legal Affairs, Chrysler Corporation | | | 156 | | | Director, Digital Ally, Inc. (digital imaging); Director, Infinity, Inc. (oil and gas exploration and production); Director, OGE Energy Corp. (energy and energy services) | |
|
| Minor M. Shaw | | | | | | | | | |
|
225 Franklin Street
Mail Drop
BX32 05228
Boston, MA 02110
Age 64 | | Board member since 6/11 for RiverSource Funds and since 2003 for Nations Funds | | President—Micco LLC (private investments) | | | 149 | | | Former Trustee, BofA Funds Series Trust (11 funds); Board Member, Piedmont Natural Gas; Director, Blue Cross Blue Shield of South Carolina | |
|
| Alison Taunton-Rigby | | | | | | | | | |
|
901 S. Marquette Ave.
Minneapolis, MN 55402
Age 68 | | Board member since 11/02 for RiverSource Funds and since 6/11 for Nations Funds | | Chief Executive Officer and Director, RiboNovix, Inc. 2003-2010 (biotechnology); former President, Aquila Biopharmaceuticals | | | 156 | | | Director, Healthways, Inc. (health management programs); Director, ICI Mutual Insurance Company, RRG; Director, Abt Associates (government contractor) | |
|
50
Fund Governance (continued)
Interested Board Member Not Affiliated with Investment Manager*
| Name, Address, Age | | Position Held
with Funds
and Length
of Service | | Principal Occupation During Past Five Years | | Number of
Funds in the
Fund Family
Overseen by
Board Member | | Other Present or
Past Directorships/
Trusteeships
(Within Past 5 Years) | |
| Anthony M. Santomero* | | | | | | | | | |
|
225 Franklin Street
Mail Drop
BX32 05228
Boston, MA 02110
Age 65 | | Board member since 6/11 for RiverSource Funds and since 1/08 for Nations Funds | | Richard K. Mellon Professor Emeritus of Finance, The Wharton School, University of Pennsylvania, since 2002; Senior Advisor, McKinsey & Company (consulting), 2006-2008; President and Chief Executive Officer, Federal Reserve Bank of Philadelphia, 2000-2006 | | | 149 | | | Director, Renaissance Reinsurance Ltd.; Trustee, Penn Mutual Life Insurance Company; Director, Citigroup; Director, Citibank, N.A.; former Trustee, BofA Funds Series Trust (11 funds) | |
|
* Dr. Santomero is not an affiliated person of the Investment Manager or Ameriprise Financial. However, he is currently deemed by the funds to be an "interested person" (as defined in the 1940 Act) of the Funds because he serves as a Director of Citigroup, Inc. and Citibank N.A., companies that may directly or through subsidiaries and affiliates engage from time-to-time in brokerage execution, principal transactions and lending relationships with the funds or accounts advised/managed by the Investment Manager.
Interested Board Member Affiliated with Investment Manager*
| William F. Truscott | | | | | | | | | |
|
53600 Ameriprise Financial Center
Minneapolis, MN 55474
Age 51 | | Board member since 11/01 for RiverSource Funds and since 6/11 for Nations Funds; Senior Vice President since 2002 for RiverSource Funds and 5/10 for Nations Funds | | Chairman of the Board and President, Columbia Management Investment Advisers, LLC since May 2010 and February 2012, respectively (previously President, Chairman of the Board and Chief Investment Officer, 2001-April 2010); Chief Executive Officer, U.S. Asset Management & President, Annuities, Ameriprise Financial, Inc. since May 2010 (previously President—U.S. Asset Management and Chief Investment Officer, 2005-April 2010); Director, President and Chief Executive Officer, Ameriprise Certificate Company since 2006; Director and Chief Executive Officer, Columbia Management Investment Distributors, Inc. since May 2010 and February 2012, respectively (previously Chairman of the Board and Chief Executive Officer, 2006-April 2010); Chairman of the Board and Chief Executive Officer, RiverSource Distributors, Inc. since 2006. | | | 156 | | | Trustee, Columbia Funds Series Trust I and Columbia Funds Variable Insurance Trust | |
|
* Interested person (as defined under the 1940 Act) by reason of being an officer, director, security holder and/or employee of the Investment Manager or Ameriprise Financial.
The SAI has additional information about the Fund's Board members and is available, without charge, upon request by calling 800.345.6611; contacting your financial intermediary; or visiting columbiamanagement.com.
51
Fund Governance (continued)
Officers
| Name, Year of Birth and Address | | Principal Occupation(s) During the Past Five Years | |
| J. Kevin Connaughton (Born 1964) | |
|
225 Franklin Street
Boston, MA 02110
President (since 2009) | | Senior Vice President and General Manager—Mutual Fund Products, Columbia Management Investment Advisers, LLC since May 2010; President, Columbia Funds, since 2009, and RiverSource Funds, since May 2010 (previously Senior Vice President and Chief Financial Officer, Columbia Funds, from June 2008 to January 2009, Treasurer, Columbia Funds, from October 2003 to May 2008, and senior officer of various other affiliated funds since 2000); Managing Director, Columbia Management Advisors, LLC from December 2004 to April 2010. | |
|
| Michael G. Clarke (Born 1969) | |
|
225 Franklin Street
Boston, MA 02110
Treasurer (since 2011) and Chief Financial Officer (since 2009) | | Vice President, Columbia Management Investment Advisers, LLC since May 2010; Managing Director of Fund Administration, Columbia Management Advisors, LLC, from September 2004 to April 2010; senior officer of Columbia Funds and affiliated funds since 2002. | |
|
| Scott R. Plummer (Born 1959) | |
|
5228 Ameriprise Financial Center
Minneapolis, MN 55474
Senior Vice President and Chief Legal Officer (since 2010) | | Chief Legal Officer and Assistant Secretary, Columbia Management Investment Advisers, LLC since June 2005; Vice President and Lead Chief Counsel—Asset Management, Ameriprise Financial, Inc. since May 2010 (previously Vice President and Chief Counsel—Asset Management, from 2005 to April 2010, Vice President, Chief Counsel and Assistant Secretary, Columbia Management Investment Distributors, Inc. since 2008; Vice President, General Counsel and Secretary, Ameriprise Certificate Company since 2005; Chief Counsel, RiverSource Distributors, Inc. since 2006; Senior officer of Columbia Funds and affiliated funds, since 2006. | |
|
| Thomas P. McGuire (Born 1972) | |
|
225 Franklin Street
Boston, MA 02110
Chief Compliance Officer (since 2012) | | Vice President—Asset Management Compliance, Columbia Management Investment Advisers, LLC since March 2010; Chief Compliance Officer, Ameriprise Certificate Company, since September 2010; Compliance Executive, Bank of America, from June 2005 to April 2010. | |
|
| William F. Truscott (Born 1960) | |
|
53600 Ameriprise Financial Center
Minneapolis, MN 55474
Senior Vice President (since 2010) | | Chairman of the Board and President, Columbia Management Investment Advisers, LLC since May 2010 and February 2012, respectively (previously President, Chairman of the Board and Chief Investment Officer, from 2001 to April 2010); Chief Executive Officer, U.S. Asset Management & President, Annuities, Ameriprise Financial, Inc. since May 2010 (previously President—U.S. Asset Management and Chief Investment Officer from 2005 to April 2010); Director, President and Chief Executive Officer, Ameriprise Certificate Company since 2006; Director and Chief Executive Officer, Columbia Management Investment Distributors, Inc. since May 2010 and February 2012, respectively (previously Chairman of the Board and Chief Executive Officer from 2008 to April 2010); Chairman of the Board and Chief Executive Officer, RiverSource Distributors, Inc. since 2006. | |
|
| Paul D. Pearson (Born 1956) | |
|
10468 Ameriprise Financial Center
Minneapolis, MN 55474
Vice President and Assistant Treasurer
(since 2011) | | Vice President—Investment Accounting, Columbia Management Investment Advisers, LLC, since May 2010; Vice President—Managed Assets, Investment Accounting, Ameriprise Financial Corporation, 1998-2010 | |
|
52
Fund Governance (continued)
Officers (continued)
| Name, Year of Birth and Address | | Principal Occupation(s) During the Past Five Years | |
| Colin Moore (Born 1958) | |
|
225 Franklin Street
Boston, MA 02110
Senior Vice President (since 2010) | | Director and Chief Investment Officer, Columbia Management Investment Advisers, LLC since May 2010; Manager, Managing Director and Chief Investment Officer of Columbia Management Advisors, LLC from 2007 to April 2010; Head of Equities, Columbia Management Advisors, LLC from 2002 to 2007. | |
|
| Christopher O. Petersen (Born 1970) | |
|
5228 Ameriprise Financial Center
Minneapolis, MN 55474
Vice President and Secretary (since 2011) | | Vice President and Chief Counsel, Ameriprise Financial since January 2010 (formerly Vice President and Group Counsel or Counsel from April 2004 to January 2010); Senior officer of Columbia Funds and affiliated funds, since 2007. | |
|
| Amy K. Johnson (Born 1965) | |
|
5228 Ameriprise Financial Center
Minneapolis, MN 55474
Vice President (since 2010) | | Senior Vice President and Chief Operating Officer, Columbia Management Investment Advisers, LLC since May 2010 (previously Chief Administrative Officer, from 2009 until April 2010, Vice President—Asset Management and Trust Company Services, from 2006 to 2009, and Vice President—Operations and Compliance from 2004 to 2006). | |
|
| Joseph F. DiMaria (Born 1968) | |
|
225 Franklin Street
Boston, MA 02110
Vice President (since 2011) and Chief Accounting Officer (since 2008) | | Vice President, Mutual Fund Administration, Columbia Management Investment Advisers, LLC, since May 2010; Director of Fund Administration, Columbia Management Advisors, LLC from January 2006 to April 2010. | |
|
| Paul B. Goucher (Born 1968) | |
|
100 Park Avenue
New York, NY 10017
Vice President and Assistant Secretary (since 2010) | | Vice President and Chief Counsel of Ameriprise Financial since January 2010 (formerly Vice President and Group Counsel from November 2008 to January 2010); Director, Managing Director and General Counsel of J. & W. Seligman & Co. Incorporated (Seligman) from July 2008 to November 2008 and Managing Director and Associate General Counsel of Seligman from January 2005 to July 2008. | |
|
| Michael E. DeFao (Born 1968) | |
|
225 Franklin Street
Boston, MA 02110
Vice President and Assistant Treasurer (since 2011) | | Vice President and Chief Counsel, Ameriprise Financial since May 2010; Associate General Counsel, Bank of America from June 2005 to April 2010. | |
|
| Stephen T. Welsh (Born 1957) | |
|
225 Franklin Street
Boston, MA 02110
Vice President (since 2006) | | President and Director, Columbia Management Investment Services Corp. since May 2010; President and Director, Columbia Management Services, Inc. from July 2004 to April 2010; Managing Director, Columbia Management Distributors, Inc. from August 2007 to April 2010. | |
|
53
This page intentionally left blank.
54
This page intentionally left blank.
55
This page intentionally left blank.
56
Important Information About This Report
The fund mails one shareholder report to each shareholder address. If you would like more than one report, please call shareholder services at 1-800-345-6611 and additional reports will be sent to you. This report has been prepared for shareholders of Columbia Short Term Bond Fund.
A description of the policies and procedures that the fund uses to determine how to vote proxies and a copy of the fund's voting records are available (i) at www.columbiamanagement.com, (ii) on the Securities and Exchange Commission's website at www.sec.gov, and (iii) without charge, upon request, by calling 1-800-368-0346. Information regarding how the fund voted proxies relating to portfolio securities during the 12-month period ended June 30 is available from the SEC's website. Information regarding how the fund voted proxies relating to portfolio securities is also available from the fund's website, www.columbiamanagement.com.
The fund files a complete schedule of portfolio holdings with the SEC for the first and third quarters of each fiscal year on Form N-Q. The fund's Form N-Q is available on the SEC's website at www.sec.gov and may be reviewed and copied at the SEC's Public Reference Room in Washington, D.C. Information on the operation of the Public Reference Room may be obtained by calling 1-800-SEC-0330.
Transfer Agent
Columbia Management Investment
Services Corp.
P.O. Box 8081
Boston, MA 02266-8081
1-800-345-6611
Distributor
Columbia Management Investment
Distributors, Inc.
225 Franklin Street
Boston, MA 02110
Investment Manager
Columbia Management Investment Advisers, LLC
225 Franklin Street
Boston, MA 02110
57

Columbia Short Term Bond Fund
P. O. Box 8081
Boston, MA 02266-8081
columbiamanagement.com
This information is for use with concurrent or prior delivery of a fund prospectus. Investors should consider the investment objectives, risks, charges and expenses of a mutual fund carefully before investing. For a free prospectus, which contains this and other important information about the funds, visit columbiamanagement.com. Read the prospectus carefully before investing. The Fund is distributed by Columbia Management Investment Distributors, Inc., member FINRA, and managed by Columbia Management Investment Advisers, LLC.
© 2012 Columbia Management Investment Advisers, LLC. All rights reserved.
C-1071 C (5/12)
Item 2. Code of Ethics.
(a) The registrant has adopted a code of ethics that applies to the registrant’s principal executive officer, principal financial officer, principal accounting officer or controller, or persons performing similar functions, regardless of whether these individuals are employed by the registrant or a third party.
(b) During the period covered by this report, there were not any amendments to a provision of the code of ethics adopted in 2(a) above.
(c) During the period covered by this report, there were no waivers, including any implicit waivers, from a provision of the code of ethics described in 2(a) above that relates to one or more of the items set forth in paragraph (b) of this item’s instructions.
Item 3. Audit Committee Financial Expert.
The registrant’s Board of Trustees has determined that Edward J. Boudreau Jr., Pamela G. Carlton, William P. Carmichael, William A. Hawkins and John F. Maher, each of whom are members of the registrant’s Board of Trustees and Audit Committee, each qualify as an audit committee financial expert. Mr. Boudreau, Ms. Carlton, Mr. Carmichael, Mr. Hawkins and Mr. Maher each are independent trustees, as defined in paragraph (a)(2) of this item’s instructions.
Item 4. Principal Accountant Fees and Services.
Fee information below is disclosed for the one series of the registrant whose report to stockholders is included in this annual filing. Fee information for fiscal year ended March 31, 2011 also includes fees for three series that merged during the period, five series that changed their fiscal year end from March 31 to January 31 and nine series that changed their fiscal year end from March 31 to April 30 in 2012.
(a) Audit Fees. Aggregate Audit Fees billed by the principal accountant for professional services rendered during the fiscal years ended March 31, 2012 and March 31, 2011 are approximately as follows:
2012 | | 2011 | |
$ | 36,300 | | $ | 379,000 | |
| | | | | |
Audit Fees include amounts related to the audit of the registrant’s annual financial statements or services that are normally provided by the accountant in connection with statutory and regulatory filings or engagements for those fiscal years. Fiscal year 2011 also includes audit fees for the review and provision of consent in connection with filing Form N-1A for new share classes.
(b) Audit-Related Fees. Aggregate Audit-Related Fees billed to the registrant by the principal accountant for professional services rendered during the fiscal years ended March 31, 2012 and March 31, 2011 are approximately as follows:
Audit-Related Fees include amounts for assurance and related services by the principal accountant that are reasonably related to the performance of the audit of the registrant’s financial statements and are not reported in Audit Fees above. In both fiscal years 2012 and 2011, Audit-Related Fees consist of agreed-upon procedures performed for semi-annual shareholder reports and agreed- upon procedures related to fund mergers. Fiscal year 2012 also includes Audit-Related Fees for agreed-upon procedures for fund accounting and custody conversions.
During the fiscal years ended March 31, 2012 and March 31, 2011, there were no Audit-Related Fees billed by the registrant’s principal accountant to the registrant’s investment adviser (not including any sub-adviser whose role is primarily portfolio management and is subcontracted with or overseen by another investment adviser) and any entity controlling, controlled by, or under common control with the adviser that provides ongoing services to the registrant for an engagement that related directly to the operations and financial reporting of the registrant.
(c) Tax Fees. Aggregate Tax Fees billed by the principal accountant to the registrant for professional services rendered during the fiscal years ended March 31, 2012 and March 31, 2011 are approximately as follows:
Tax Fees include amounts for the review of annual tax returns, the review of required shareholder distribution calculations and typically include amounts for professional services by the principal accountant for tax compliance, tax advice and tax planning.
During the fiscal years ended March 31, 2012 and March 31, 2011, there were no Tax Fees billed by the registrant’s principal accountant to the registrant’s investment adviser (not including any sub-adviser whose role is primarily portfolio management and is subcontracted with or overseen by another investment adviser) and any entity controlling, controlled by, or under common control with the adviser that provides ongoing services
to the registrant for an engagement that related directly to the operations and financial reporting of the registrant.
(d) All Other Fees. Aggregate All Other Fees billed by the principal accountant to the registrant for professional services rendered during the fiscal years ended March 31, 2012 and March 31, 2011 are approximately as follows:
All Other Fees include amounts for products and services provided by the principal accountant, other than the services reported in paragraphs (a) through (c) above.
Aggregate All Other Fees billed by the registrant’s principal accountant to the registrant’s investment adviser (not including any sub-adviser whose role is primarily portfolio management and is subcontracted with or overseen by another investment adviser) and any entity controlling, controlled by, or under common control with the adviser that provides ongoing services to the registrant for an engagement that related directly to the operations and financial reporting of the registrant during the fiscal years ended March 31, 2012 and March 31, 2011 are approximately as follows:
2012 | | 2011 |
$ | 395,800 | | $ | 495,300 |
| | | | |
In both fiscal years 2012 and 2011, All Other Fees consist of fees billed for internal control examinations of the registrant’s transfer agent and investment advisor.
(e)(1) Audit Committee Pre-Approval Policies and Procedures
The registrant’s Audit Committee is required to pre-approve the engagement of the registrant’s independent accountants to provide audit and non-audit services to the registrant and non-audit services to its investment adviser (not including any sub-adviser whose role is primarily portfolio management and is subcontracted with or overseen by another investment adviser) or any entity controlling, controlled by or under common control with such investment adviser that provides ongoing services to the registrant (“Adviser Affiliates”), if the engagement relates directly to the operations and financial reporting of the registrant.
The Audit Committee has adopted a Policy for Engagement of Independent Accountants for Audit and Non-Audit Services (“Policy”). The Policy sets forth the understanding of the Audit Committee regarding the engagement of the registrant’s independent accountants to provide (i) audit and permissible audit-related, tax and other services to the registrant (collectively “Fund Services”); (ii) non-audit services to the registrant’s investment adviser (not including any sub-adviser whose role is primarily portfolio management and is subcontracted with or overseen by another investment adviser) and Adviser Affiliates, if the engagement relates directly to the operations or financial
reporting of a Fund (collectively “Fund-related Adviser Services”); and (iii) certain other audit and non-audit services to the registrant’s investment adviser (not including any sub-adviser whose role is primarily portfolio management and is subcontracted with or overseen by another investment adviser) and Adviser Affiliates. As set forth in this Fund Policy, a service will require specific pre-approval by the Audit Committee if it is to be provided by the Fund’s independent auditor; provided, however, that pre-approval of non-audit services to the Fund, the Adviser or Control Affiliates may be waived if certain de minimis requirements set forth in the SEC’s rules are met.
Under the Policy, the Audit Committee may delegate pre-approval authority to any pre-designated member or members who are Independent Trustees/Directors. The member(s) to whom such authority is delegated must report, for informational purposes only, any pre-approval decisions to the Audit Committee at its next regular meeting. The Audit Committee’s responsibilities with respect to the pre-approval of services performed by the independent accountants may not be delegated to management.
On an annual basis, at a regularly scheduled Audit Committee meeting, the Fund’s Treasurer or other Fund Officer shall submit to the Audit Committee a schedule of the types of Fund Services and Fund-related Adviser Services that are subject to specific pre-approval.
This schedule will provide a description of each type of service that is subject to specific pre-approval, along with total projected fees for each service. The pre-approval will generally cover a one-year period. The Audit Committee will review and approve the types of services and the projected fees for the next one-year period and may add to, or subtract from, the list of pre-approved services from time to time, based on subsequent determinations. This specific approval acknowledges that the Audit Committee is in agreement with the types of services that the independent accountants will be permitted to perform.
The Fund’s Treasurer or other Fund Officer shall report to the Audit Committee at each of its regular meetings regarding all Fund Services or Fund-related Adviser Services initiated since the last such report was rendered, including a general description of the services with forecasted fees for the annual period, proposed changes requiring specific pre-approval and a description of services provided by the independent auditor with actual fees during the current reporting period.
*****
(e)(2) The percentage of services described in paragraphs (b) through (d) of this Item approved pursuant to the “de minimis” exception under paragraph (c)(7)(i)(C) of Rule 2-01 of Regulation S-X during both fiscal years ended March 31, 2012 and March 31, 2011 was zero.
(f) Not applicable.
(g) The aggregate non-audit fees billed by the registrant’s accountant for services rendered to the registrant, and rendered to the registrant’s investment adviser (not
including any sub-adviser whose role is primarily portfolio management and is subcontracted with or overseen by another investment adviser), and any entity controlling, controlled by, or under common control with the adviser that provides ongoing services to the registrant for the fiscal years ended March 31, 2012 and March 31, 2011 are approximately as follows:
2012 | | 2011 |
$ | 409,700 | | $ | 658,900 |
| | | | |
(h) The registrant’s Audit Committee of the Board of Directors has considered whether the provision of non-audit services that were rendered to the registrant’s adviser (not including any sub-adviser whose role is primarily portfolio management and is subcontracted with or overseen by another investment adviser), and any entity controlling, controlled by, or under common control with the investment adviser that provides ongoing services to the registrant that were not pre-approved pursuant to paragraph (c)(7)(ii) of Rule 2-01 of Regulation S-X, is compatible with maintaining the principal accountant’s independence.
Item 5. Audit Committee of Listed Registrants.
Not applicable.
Item 6. Investments
(a) The registrant’s “Schedule I — Investments in securities of unaffiliated issuers” (as set forth in 17 CFR 210.12-12) is included in Item 1 of this Form N-CSR.
(b) Not applicable.
Item 7. Disclosure of Proxy Voting Policies and Procedures for Closed-End Management Investment Companies.
Not applicable.
Item 8. Portfolio Managers of Closed-End Management Investment Companies.
Not applicable.
Item 9. Purchases of Equity Securities by Closed-End Management Investment Company and Affiliated Purchasers.
Not applicable.
Item 10. Submission of Matters to a Vote of Security Holders.
There were no material changes to the procedures by which shareholders may recommend nominees to the registrant’s board of directors.
Item 11. Controls and Procedures.
(a) The registrant’s principal executive officer and principal financial officers, based on their evaluation of the registrant’s disclosure controls and procedures as of a date within 90 days of the filing of this report, have concluded that such controls and procedures are adequately designed to ensure that material information required to be disclosed by the registrant in Form N-CSR is accumulated and communicated to the registrant’s management, including the principal executive officer and principal financial officer, or persons performing similar functions, as appropriate to allow timely decisions regarding required disclosure.
(b) There was no change in the registrant’s internal control over financial reporting that occurred during the registrant’s second fiscal quarter of the period covered by this report that has materially affected, or is reasonably likely to materially affect, the registrant’s internal control over financial reporting.
Item 12. Exhibits.
(a)(1) Code of ethics required to be disclosed under Item 2 of Form N-CSR attached hereto as Exhibit 99.CODE ETH.
(a)(2) Certifications pursuant to Rule 30a-2(a) under the Investment Company Act of 1940 (17 CFR 270.30a-2(a)) attached hereto as Exhibit 99.CERT.
(a)(3) Not applicable.
(b) Certification pursuant to Rule 30a-2(b) under the Investment Company Act of 1940 (17 CFR 270.30a-2(b)) attached hereto as Exhibit 99.906CERT.
SIGNATURES
Pursuant to the requirements of the Securities Exchange Act of 1934 and the Investment Company Act of 1940, the registrant has duly caused this report to be signed on its behalf by the undersigned, thereunto duly authorized.
(registrant) | | Columbia Funds Series Trust | |
| | |
| | |
By (Signature and Title) | | /s/ J. Kevin Connaughton | |
| J. Kevin Connaughton, President and Principal Executive Officer | |
| | |
| | |
Date | | May 23, 2012 | |
| | | | | |
Pursuant to the requirements of the Securities Exchange Act of 1934 and the Investment Company Act of 1940, this report has been signed below by the following persons on behalf of the registrant and in the capacities and on the dates indicated.
By (Signature and Title) | | /s/ J. Kevin Connaughton | |
| J. Kevin Connaughton, President and Principal Executive Officer | |
| | |
| | |
Date | | May 23, 2012 | |
| | |
| | |
By (Signature and Title) | | /s/ Michael G. Clarke | |
| Michael G. Clarke, Treasurer and Chief Financial Officer | |
| | |
| | |
Date | | May 23, 2012 | |
| | | | | |