UNITED STATES
SECURITIES AND EXCHANGE COMMISSION
Washington, D.C. 20549
FORM N-CSR
CERTIFIED SHAREHOLDER REPORT OF REGISTERED
MANAGEMENT INVESTMENT COMPANIES
Investment Company Act file number | 811-09645 |
|
Columbia Funds Series Trust |
(Exact name of registrant as specified in charter) |
|
225 Franklin Street, Boston, Massachusetts | | 02110 |
(Address of principal executive offices) | | (Zip code) |
|
Scott R. Plummer 5228 Ameriprise Financial Center Minneapolis, MN 55474 |
(Name and address of agent for service) |
|
Registrant’s telephone number, including area code: | 1-612-671-1947 | |
|
Date of fiscal year end: | February 28 | |
|
Date of reporting period: | February 28, 2013 | |
| | | | | | | | |
Form N-CSR is to be used by management investment companies to file reports with the Commission not later than 10 days after the transmission to stockholders of any report that is required to be transmitted to stockholders under Rule 30e-1 under the Investment Company Act of 1940 (17 CFR 270.30e-1). The Commission may use the information provided on Form N-CSR in its regulatory, disclosure review, inspection, and policymaking roles.
A registrant is required to disclose the information specified by Form N-CSR, and the Commission will make this information public. A registrant is not required to respond to the collection of information contained in Form N-CSR unless the Form displays a currently valid Office of Management and Budget (“OMB”) control number. Please direct comments concerning the accuracy of the information collection burden estimate and any suggestions for reducing the burden to Secretary, Securities and Exchange Commission, 450 Fifth Street, NW, Washington, DC 20549-0609. The OMB has reviewed this collection of information under the clearance requirements of 44 U.S.C. § 3507.
Item 1. Reports to Stockholders.
Annual Report
February 28, 2013

Columbia Convertible Securities Fund
Not FDIC insured • No bank guarantee • May lose value
Columbia Convertible Securities Fund
 Dear Shareholders,
U.S. stocks flat, foreign markets strong in 2012 finale
After a strong third quarter, U.S. stock market averages treaded water as the year 2012 came to a close. However, they ended the year up strongly, as first- and third-quarter gains more than offset second- and fourth-quarter weakness. Typically a strong quarter for domestic small- and mid-cap issues, the fourth quarter of 2012 indeed proved to be another year-end positive for small-cap stocks. For the full calendar year 2012, the S&P 500 Index rose 16.00%.
Stock markets outside the United States generated some of the best returns for the fourth quarter, as optimism rebounded, thanks to the September actions of the European Central Bank in support of the euro and an improving outlook from China. Both developed and emerging foreign markets topped U.S. stocks by a solid margin.
Corporate and emerging markets led fixed income
Fixed-income investors took their cue from the equity markets and continued to favor the highest risk sectors through the end of 2012. Global fixed-income returns posted mixed results in the final quarter of the year. Gains were the highest for corporate high-yield and emerging market bonds. Although investors remained cautious ahead of the year-end budget negotiations, better economic data and a further improvement in the European sovereign debt crisis supported riskier assets and depressed government bond prices. In December, the Federal Reserve announced its intention to continue to purchase both Treasury and mortgage-backed securities and said that it would seek to keep short-term interest rates unchanged until the unemployment rate reaches 6.5%, or inflation turned noticeably higher.
Stay on track with Columbia Management
Backed by more than 100 years of experience, Columbia Management is one of the nation's largest asset managers. At the heart of our success — and, most importantly, that of our investors — are highly talented industry professionals, brought together by a unique way of working. We are dedicated to helping you take advantage of today's opportunities and anticipate tomorrow's. We stay abreast of the latest investment trends and ideas, using our collective insight to evaluate events and transform them into solutions you can use.
Visit columbiamanagement.com for:
> The Columbia Management Perspectives blog, featuring timely posts by our investment teams
> Detailed up-to-date fund performance and portfolio information
> Economic analysis and market commentary
> Quarterly fund commentaries
> Columbia Management Investor, our award-winning quarterly newsletter for shareholders
Thank you for your continued support of the Columbia Funds. We look forward to serving your investment needs for many years to come.
Best Regards,

J. Kevin Connaughton
President, Columbia Funds
The S&P 500 Index, an unmanaged index, measures the performance of 500 widely held, large-capitalization U.S. stocks and is frequently used as a general measure of market performance. Indices are not available for investment, are not professionally managed and do not reflect sales charges, fees, brokerage commissions, taxes or other expenses of investing.
Investors should consider the investment objectives, risks, charges and expenses of a mutual fund carefully before investing. For a free prospectus, which contains this and other important information about a fund, visit columbiamanagement.com. The prospectus should be read carefully before investing.
Columbia Funds are distributed by Columbia Management Investment Distributors, Inc., member FINRA, and managed by Columbia Management Investment Advisers, LLC.
© 2013 Columbia Management Investment Advisers, LLC. All rights reserved.
Columbia Convertible Securities Fund
Performance Overview | | | 2 | | |
Manager Discussion of Fund Performance | | | 4 | | |
Understanding Your Fund's Expenses | | | 6 | | |
Portfolio of Investments | | | 7 | | |
Statement of Assets and Liabilities | | | 16 | | |
Statement of Operations | | | 18 | | |
Statement of Changes in Net Assets | | | 19 | | |
Financial Highlights | | | 21 | | |
Notes to Financial Statements | | | 30 | | |
Report of Independent Registered
Public Accounting Firm | | | 37 | | |
Federal Income Tax Information | | | 38 | | |
Trustees and Officers | | | 39 | | |
Important Information About This Report | | | 45 | | |
Fund Investment Manager
Columbia Management Investment
Advisers, LLC
225 Franklin Street
Boston, MA 02110
Fund Distributor
Columbia Management Investment
Distributors, Inc.
225 Franklin Street
Boston, MA 02110
Fund Transfer Agent
Columbia Management Investment
Services Corp.
P.O. Box 8081
Boston, MA 02266-8081
For more information about any of the funds, please visit columbiamanagement.com or call 800.345.6611. Customer Service Representatives are available to answer your questions Monday through Friday from 8 a.m. to 8 p.m. Eastern time.
The views expressed in this report reflect the current views of the respective parties. These views are not guarantees of future performance and involve certain risks, uncertainties and assumptions that are difficult to predict, so actual outcomes and results may differ significantly from the views expressed. These views are subject to change at any time based upon economic, market or other conditions and the respective parties disclaim any responsibility to update such views. These views may not be relied on as investment advice and, because investment decisions for a Columbia Fund are based on numerous factors, may not be relied on as an indication of trading intent on behalf of any particular Columbia Fund. References to specific securities should not be construed as a recommendation or investment advice.
Columbia Convertible Securities Fund
Performance Summary
> Columbia Convertible Securities Fund (the Fund) Class A shares returned 7.84% excluding sales charges for the 12-month period ended February 28, 2013.
> The Fund underperformed its benchmark, the BofA Merrill Lynch All Convertibles All Qualities Index, which returned 10.06% for the same 12-month period.
> During a period of strong equity market performance, the Fund's maturity and premium composition was somewhat more defensive than the benchmark, which generally accounted for the modest relative shortfall in performance.
Average Annual Total Returns (%) (for period ended February 28, 2013)
| | Inception | | 1 Year | | 5 Years | | 10 Years | |
Class A | | 09/25/87 | | | | | | | |
Excluding sales charges | | | | | 7.84 | | | | 4.40 | | | | 7.18 | | |
Including sales charges | | | | | 1.67 | | | | 3.17 | | | | 6.54 | | |
Class B | | 07/15/98 | | | | | | | |
Excluding sales charges | | | | | 7.10 | | | | 3.62 | | | | 6.37 | | |
Including sales charges | | | | | 2.10 | | | | 3.27 | | | | 6.37 | | |
Class C | | 10/21/96 | | | | | | | |
Excluding sales charges | | | | | 6.99 | | | | 3.61 | | | | 6.36 | | |
Including sales charges | | | | | 5.99 | | | | 3.61 | | | | 6.36 | | |
Class I* | | 09/27/10 | | | 8.29 | | | | 4.59 | | | | 7.28 | | |
Class R* | | 11/16/11 | | | 7.55 | | | | 4.01 | | | | 6.76 | | |
Class R4* | | 11/08/12 | | | 7.98 | | | | 4.42 | | | | 7.19 | | |
Class R5* | | 11/08/12 | | | 8.01 | | | | 4.43 | | | | 7.19 | | |
Class W* | | 11/16/11 | | | 7.87 | | | | 4.27 | | | | 7.02 | | |
Class Z | | 05/21/99 | | | 8.10 | | | | 4.67 | | | | 7.44 | | |
BofA Merrill Lynch All Convertibles All Qualities Index | | | | | 10.06 | | | | 5.50 | | | | 7.64 | | |
Returns for Class A are shown with and without the maximum initial sales charge of 5.75%. Returns for Class B are shown with and without the applicable contingent deferred sales charge (CDSC) of 5.00% in the first year, declining to 1.00% in the sixth year and eliminated thereafter. Returns for Class C are shown with and without the 1.00% CDSC for the first year only. The Fund's other classes are not subject to sales charges and have limited eligibility. Please see the Fund's prospectuses for details. Performance for different share classes will vary based on differences in sales charges and fees associated with each class. All results shown assume reinvestment of distributions during the period. Returns do not reflect the deduction of taxes that a shareholder may pay on Fund distributions or on the redemption of Fund shares. Performance results reflect the effect of any fee waivers or reimbursements of Fund expenses by Columbia Management Investment Advisers, LLC and/or any of its affiliates. Absent these fee waivers or expense reimbursement arrangements, performance results would have been lower.
The performance information shown represents past performance and is not a guarantee of future results. The investment return and principal value of your investment will fluctuate so that your shares, when redeemed, may be worth more or less than their original cost. Current performance may be lower or higher than the performance information shown. You may obtain performance information current to the most recent month-end by contacting your financial intermediary, visiting columbiamanagement.com or calling 800.345.6611.
*The returns shown for periods prior to the share class inception date (including returns for the Life of the Fund, if shown, which are since Fund inception) include the returns of the Fund's oldest share class. These returns are adjusted to reflect any higher class-related operating expenses of the newer share classes, as applicable. Please visit columbiamanagement.com/mutual-funds/appended-performance for more information.
The BofA Merrill Lynch All Convertibles All Qualities Index measures the performance of U.S. dollar-denominated convertible securities not currently in bankruptcy with a total market value greater than $50 million at issuance.
Indices are not available for investment, are not professionally managed and do not reflect sales charges, fees, brokerage commissions, taxes or other expenses of investing. Securities in the Fund may not match those in an index.
Annual Report 2013
2
Columbia Convertible Securities Fund
Performance Overview (continued)
Performance of a Hypothetical $10,000 Investment (March 1, 2003 – February 28, 2013)
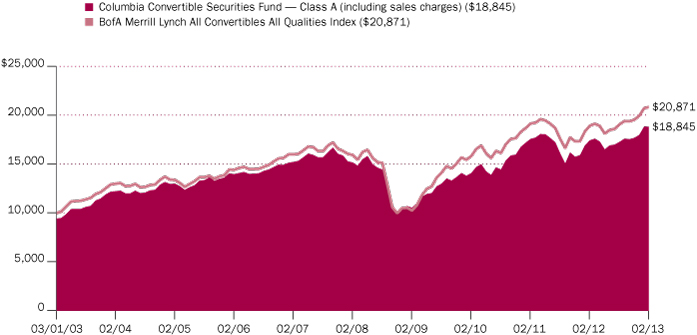
The chart above shows the change in value of a hypothetical $10,000 investment in Class A shares of Columbia Convertible Securities Fund during the stated time period, and does not reflect the deduction of taxes that a shareholder may pay on Fund distributions or on the redemption of Fund shares.
Annual Report 2013
3
Columbia Convertible Securities Fund
Manager Discussion of Fund Performance
For the 12-month period ended February 28, 2013, the Fund's Class A shares returned 7.84% excluding sales charges. The Fund underperformed its benchmark, the BofA Merrill Lynch All Convertibles All Qualities Index, which returned 10.06% for the same 12-month period. The Fund's positioning was more defensive than the benchmark during a period of rising share prices, which generally accounted for the modest relative shortfall in performance.
Investors Shrug Off Weak Economic Growth
The federal government's struggles to avoid a fiscal cliff of tax increases and spending cuts weighed on the U.S. economy during the 12-month period ended February 28, 2013. Yet, investors chose to look beyond the numbers and came in from the sidelines to bid stock prices significantly higher. Favorable central bank action and improving economic prospects in some sectors gave investors confidence to favor stocks and other riskier assets. The U.S. economy expanded at a pace of just 1.6% in 2012. However, a pickup in job growth early in 2013 and steady manufacturing activity were encouraging signs. The U.S. housing market staged a solid comeback, with higher home sales, rising prices and lower inventories.
Against this backdrop, the convertible securities market performed well, aided by an extended equity rally toward the end of the period. As stocks rallied, several large-capitalization, equity-sensitive convertibles close to maturity did especially well, boosting the overall performance of the benchmark. Actively-managed convertible securities funds tend to underweight this class of convertibles and were therefore at a slight structural disadvantage during the period.
Security Selection Aided Performance
Several specific Fund holdings kept overall performance competitive. Biotechnology company Gilead Sciences performed well and was the Fund's single biggest holding at the end of the period. Auto parts manufacturer TRW Automotive, whose shares rallied strongly beginning in the summer of 2012, was another meaningful contributor. We eventually trimmed the Fund's position in TRW Automotive when the price advance of the convertible had reduced its defensive characteristics.
Although the Fund generally benefited from its technology holdings, it was hurt by its overweight in EMC, which had been a solid investment but declined during the period amid a deteriorating growth outlook for its investment in VMWare. The Fund also took a loss on Knight Capital, which was sold from the portfolio because of concern about a potential bankruptcy, which was averted at the last minute. The weak performance of the mining sector, to which the Fund was exposed via investments in Jaguar Mining, Molycorp, and James River Coal, was also a drag overall results.
Fund Took Advantage as Pace of Convertible Issuance Picked Up
For much of the period, convertible issuance was slow, as prevailing low interest rates enabled companies to issue regular debt cheaply without the need to grant investors a long-term call option on their common stock. Issuance picked up as the stock market advanced, however, and the Fund took advantage of this new issuance to refresh the portfolio. The early returns from this activity have been
Portfolio Management
David King, CFA
Yan Jin
Top Ten Holdings (%)
(at February 28, 2013) | |
Gilead Sciences, Inc.
1.625% 05/01/16 | | | 3.5
| | |
General Motors Co., 4.750% | | | 2.4 | | |
Dendreon Corp.
2.875% 01/15/16 | | | 2.3
| | |
Bank of America Corp., 7.250% | | | 2.0 | | |
Intel Corp.
3.250% 08/01/39 | | | 1.8
| | |
EMC Corp.
1.750% 12/01/13 | | | 1.7
| | |
Health Care REIT, Inc., 6.500% | | | 1.5 | | |
MGM Resorts International
4.250% 04/15/15 | | | 1.5
| | |
Jarden Corp.
1.875% 09/15/18 | | | 1.3
| | |
Micron Technology, Inc.
2.125% 02/15/33 | | | 1.3
| | |
Percentages indicated are based upon total investments (excluding Money Market Funds).
For further detail about these holdings, please refer to the section entitled "Portfolio of Investments."
Fund holdings are as of the date given, are subject to change at any time, and are not recommendations to buy or sell any security.
Annual Report 2013
4
Columbia Convertible Securities Fund
Manager Discussion of Fund Performance (continued)
favorable, as most of these new purchases have moved up from their offering prices. We also purchased a so-called "synthetic" convertible of Vertex Pharmaceuticals. This privately issued security will enable the Fund to preserve its long-term exposure to the potential upside of this equity, given that its existing publicly-traded becomes callable later this year.
Looking Ahead
We currently anticipate that the pace of new issuance in the period ahead will exceed that of the past 12 months. This trend would be welcome to active managers, who tend to prefer convertibles with more downside protection than the equity-sensitive issues that led the market over the past 12 months. We expect to continue to focus on issue selection and to avoid large sector bets unless an unusual opportunity arises.
Portfolio Breakdown (%)
(at February 28, 2013) | |
Common Stocks | | | 1.6 | | |
Financials | | | 0.5 | | |
Information Technology | | | 0.5 | | |
Utilities | | | 0.6 | | |
Convertible Bonds | | | 73.8 | | |
Consumer Discretionary | | | 10.0 | | |
Consumer Staples | | | 2.6 | | |
Energy | | | 3.4 | | |
Financials | | | 8.5 | | |
Health Care | | | 19.3 | | |
Industrials | | | 6.4 | | |
Materials | | | 4.0 | | |
Telecommunication | | | 18.9 | | |
Utilities | | | 0.7 | | |
Convertible Preferred Stocks | | | 22.4 | | |
Consumer Discretionary | | | 3.1 | | |
Consumer Staples | | | 2.0 | | |
Energy | | | 4.3 | | |
Financials | | | 7.2 | | |
Industrials | | | 2.3 | | |
Information Technology | | | 0.5 | | |
Utilities | | | 3.0 | | |
Equity-Linked Notes | | | 0.8 | | |
Money Market Funds | | | 1.4 | | |
Total | | | 100.0 | | |
Percentages indicated are based upon total investments. The Fund's portfolio composition is subject to change.
Annual Report 2013
5
Columbia Convertible Securities Fund
Understanding Your Fund's Expenses
(Unaudited)
As an investor, you incur two types of costs. There are transaction costs, which generally include sales charges on purchases and may include redemption fees. There are also ongoing costs, which generally include management fees, distribution and service (Rule 12b-1) fees, and other fund expenses. The following information is intended to help you understand your ongoing costs (in dollars) of investing in the Fund and to help you compare these costs with the ongoing costs of investing in other mutual funds.
Analyzing Your Fund's Expenses
To illustrate these ongoing costs, we have provided examples and calculated the expenses paid by investors in each share class of the Fund during the period. The actual and hypothetical information in the table is based on an initial investment of $1,000 at the beginning of the period indicated and held for the entire period. Expense information is calculated two ways and each method provides you with different information. The amount listed in the "Actual" column is calculated using the Fund's actual operating expenses and total return for the period. You may use the Actual information, together with the amount invested, to estimate the expenses that you paid over the period. Simply divide your account value by $1,000 (for example, an $8,600 account value divided by $1,000 = 8.6), then multiply the results by the expenses paid during the period under the Actual column. The amount listed in the "Hypothetical" column assumes a 5% annual rate of return before expenses (which is not the Fund's actual return) and then applies the Fund's actual expense ratio for the period to the hypothetical return. You should not use the hypothetical account values and expenses to estimate either your actual account balance at the end of the period or the expenses you paid during the period. See "Compare With Other Funds" below for details on how to use the hypothetical data.
Compare With Other Funds
Since all mutual funds are required to include the same hypothetical calculations about expenses in shareholder reports, you can use this information to compare the ongoing cost of investing in the Fund with other funds. To do so, compare the hypothetical example with the 5% hypothetical examples that appear in the shareholder reports of other funds. As you compare hypothetical examples of other funds, it is important to note that hypothetical examples are meant to highlight the ongoing costs of investing in a fund only and do not reflect any transaction costs, such as sales charges, or redemption or exchange fees. Therefore, the hypothetical calculations are useful in comparing ongoing costs only, and will not help you determine the relative total costs of owning different funds. If transaction costs were included in these calculations, your costs would be higher.
September 1, 2012 – February 28, 2013
| | Account Value at the Beginning
of the Period ($) | | Account Value at the End of the
Period ($) | | Expenses Paid During the
Period ($) | | Fund's Annualized
Expense Ratio (%) | |
| | Actual | | Hypothetical | | Actual | | Hypothetical | | Actual | | Hypothetical | | Actual | |
Class A | | | 1,000.00 | | | | 1,000.00 | | | | 1,090.10 | | | | 1,018.99 | | | | 6.06 | | | | 5.86 | | | | 1.17 | | |
Class B | | | 1,000.00 | | | | 1,000.00 | | | | 1,086.20 | | | | 1,015.27 | | | | 9.93 | | | | 9.59 | | | | 1.92 | | |
Class C | | | 1,000.00 | | | | 1,000.00 | | | | 1,085.60 | | | | 1,015.27 | | | | 9.93 | | | | 9.59 | | | | 1.92 | | |
Class I | | | 1,000.00 | | | | 1,000.00 | | | | 1,092.70 | | | | 1,021.12 | | | | 3.84 | | | | 3.71 | | | | 0.74 | | |
Class R | | | 1,000.00 | | | | 1,000.00 | | | | 1,088.80 | | | | 1,017.75 | | | | 7.35 | | | | 7.10 | | | | 1.42 | | |
Class R4 | | | 1,000.00 | | | | 1,000.00 | | | | 1,080.50 | * | | | 1,020.23 | | | | 2.91 | * | | | 4.61 | | | | 0.92 | * | |
Class R5 | | | 1,000.00 | | | | 1,000.00 | | | | 1,080.80 | * | | | 1,020.88 | | | | 2.50 | * | | | 3.96 | | | | 0.79 | * | |
Class W | | | 1,000.00 | | | | 1,000.00 | | | | 1,090.20 | | | | 1,018.99 | | | | 6.06 | | | | 5.86 | | | | 1.17 | | |
Class Z | | | 1,000.00 | | | | 1,000.00 | | | | 1,091.30 | | | | 1,020.23 | | | | 4.77 | | | | 4.61 | | | | 0.92 | | |
*For the period November 8, 2012 through February 28, 2013. Class R4 and Class R5 shares commenced operations on November 8, 2012.
Expenses paid during the period are equal to the annualized expense ratio for each class as indicated above, multiplied by the average account value over the period and then multiplied by the number of days in the Fund's most recent fiscal half year and divided by 365.
Expenses do not include fees and expenses incurred indirectly by the Fund from the underlying funds in which the Fund may invest (also referred to as "acquired funds"), including affiliated and non-affiliated pooled investment vehicles (including mutual funds and exchange-traded funds).
Had Columbia Management Investment Advisers, LLC and/or certain of its affiliates not waived/reimbursed certain fees and expenses, account value at the end of the period would have been reduced.
Annual Report 2013
6
Columbia Convertible Securities Fund
Portfolio of Investments
February 28, 2013
(Percentages represent value of investments compared to net assets)
Common Stocks 1.6%
Issuer | | Shares | | Value ($) | |
Financials 0.5% | |
Real Estate Investment Trusts (REITs) 0.5% | |
Digital Realty Trust, Inc. | | | 40,000 | | | | 2,679,200 | | |
Total Financials | | | | | 2,679,200 | | |
Information Technology 0.5% | |
Semiconductors & Semiconductor Equipment 0.5% | |
Microchip Technology, Inc. | | | 80,000 | | | | 2,917,600 | | |
Total Information Technology | | | | | 2,917,600 | | |
Utilities 0.6% | |
Multi-Utilities 0.6% | |
CMS Energy Corp. | | | 120,000 | | | | 3,193,200 | | |
Total Utilities | | | | | 3,193,200 | | |
Total Common Stocks
(Cost: $8,642,689) | | | | | 8,790,000 | | |
Convertible Preferred Stocks 22.4% | |
Consumer Discretionary 3.1% | |
Automobiles 2.4% | |
General Motors Co., 4.750% | | | 315,000 | | | | 13,157,550 | | |
Media 0.7% | |
Interpublic Group of Companies,
Inc. (The), 5.250% | | | 3,460 | | | | 4,033,063 | | |
Total Consumer Discretionary | | | | | 17,190,613 | | |
Consumer Staples 2.0% | |
Food Products 2.0% | |
Bunge Ltd., 4.875% | | | 50,000 | | | | 5,277,500 | | |
Post Holdings, Inc., 3.750%(a)(b) | | | 57,100 | | | | 5,734,153 | | |
Total | | | | | 11,011,653 | | |
Total Consumer Staples | | | | | 11,011,653 | | |
Energy 4.3% | |
Oil, Gas & Consumable Fuels 4.3% | |
Apache Corp., 6.000% | | | 111,500 | | | | 4,814,570 | | |
Chesapeake Energy Corp., 5.000% | | | 73,100 | | | | 6,327,719 | | |
Chesapeake Energy Corp., 5.750%(a) | | | 5,500 | | | | 5,702,812 | | |
Energy XXI Bermuda Ltd., 5.625% | | | 7,600 | | | | 2,476,080 | | |
Convertible Preferred Stocks (continued)
Issuer | | Shares | | Value ($) | |
Penn Virginia Corp., 6.000% | | | 27,065 | | | | 2,367,890 | | |
Whiting Petroleum Corp., 6.250% | | | 10,500 | | | | 2,377,358 | | |
Total | | | | | 24,066,429 | | |
Total Energy | | | | | 24,066,429 | | |
Financials 7.2% | |
Commercial Banks 1.0% | |
Fifth Third Bancorp, 8.500% | | | 40,350 | | | | 5,772,067 | | |
Diversified Financial Services 2.9% | |
AMG Capital Trust II, 5.150% | | | 110,000 | | | | 5,692,500 | | |
Bank of America Corp., 7.250% | | | 9,000 | | | | 10,800,000 | | |
Total | | | | | 16,492,500 | | |
Insurance 0.9% | |
MetLife, Inc., 5.000% | | | 105,000 | | | | 4,956,000 | | |
Real Estate Investment Trusts (REITs) 2.4% | |
Alexandria Real Estate Equities,
Inc., 7.000% | | | 190,000 | | | | 5,153,750 | | |
Health Care REIT, Inc., 6.500% | | | 135,000 | | | | 8,127,000 | | |
Total | | | | | 13,280,750 | | |
Total Financials | | | | | 40,501,317 | | |
Industrials 2.3% | |
Aerospace & Defense 1.0% | |
United Technologies Corp., 7.500% | | | 91,000 | | | | 5,300,750 | | |
Road & Rail 1.3% | |
2010 Swift Mandatory Common
Exchange Security Trust, 6.000%(a) | | | 345,000 | | | | 4,138,275 | | |
Genesee & Wyoming, Inc., 5.000% | | | 26,650 | | | | 3,384,550 | | |
Total | | | | | 7,522,825 | | |
Total Industrials | | | | | 12,823,575 | | |
Information Technology 0.5% | |
IT Services 0.5% | |
Unisys Corp., 6.250% | | | 46,000 | | | | 2,996,440 | | |
Total Information Technology | | | | | 2,996,440 | | |
Utilities 3.0% | |
Electric Utilities 2.0% | |
NextEra Energy, Inc., 5.599% | | | 110,000 | | | | 5,761,800 | | |
PPL Corp., 8.750% | | | 100,000 | | | | 5,486,000 | | |
Total | | | | | 11,247,800 | | |
The accompanying Notes to Financial Statements are an integral part of this statement.
Annual Report 2013
7
Columbia Convertible Securities Fund
Portfolio of Investments (continued)
February 28, 2013
Convertible Preferred Stocks (continued)
Issuer | |
Shares | |
Value ($) | |
Multi-Utilities 1.0% | |
CenterPoint Energy, Inc., 0.283%(b)(c) | | | 132,000 | | | | 5,700,750 | | |
Total Utilities | | | | | 16,948,550 | | |
Total Convertible Preferred Stocks
(Cost: $120,520,800) | | | | | 125,538,577 | | |
Convertible Bonds 73.5%
Issuer | | Coupon
Rate | | Principal
Amount ($) | | Value ($) | |
Airlines 1.5% | |
AirTran Holdings, Inc.
Senior Unsecured
11/01/16 | | | 5.250 | % | | | 2,950,000 | | | | 4,028,594 | | |
Continental Airlines, Inc.
Senior Unsecured
01/15/15 | | | 4.500 | % | | | 1,835,000 | | | | 2,880,950 | | |
U.S. Airways Group, Inc.
Senior Unsecured
05/15/14 | | | 7.250 | % | | | 455,000 | | | | 1,352,772 | | |
Total | | | | | | | 8,262,316 | | |
Automotive 1.5% | |
Navistar International Corp.
Senior Subordinated Notes
10/15/14 | | | 3.000 | % | | | 5,700,000 | | | | 5,372,250 | | |
TRW Automotive, Inc.
12/01/15 | | | 3.500 | % | | | 1,400,000 | | | | 2,876,930 | | |
Total | | | | | | | 8,249,180 | | |
Banking 1.0% | |
Walter Investment Management Corp.
Senior Subordinated Notes
11/01/19 | | | 4.500 | % | | | 4,950,000 | | | | 5,540,906 | | |
Building Materials 1.0% | |
Cemex SAB de CV
Subordinated Notes
03/15/15 | | | 4.875 | % | | | 4,800,000 | | | | 5,592,000 | | |
Chemicals —% | |
ShengdaTech, Inc.
Senior Notes(a)(d)(e)(f)
12/15/15 | | | 6.500 | % | | | 2,430,000 | | | | 24,300 | | |
Convertible Bonds (continued)
Issuer | | Coupon
Rate | | Principal
Amount ($) | | Value ($) | |
Consumer Cyclical Services 0.8% | |
Coinstar, Inc.
Senior Unsecured
09/01/14 | | | 4.000 | % | | | 2,020,000 | | | | 2,643,675 | | |
MasTec, Inc.
06/15/14 | | | 4.000 | % | | | 956,000 | | | | 1,852,250 | | |
Total | | | | | | | 4,495,925 | | |
Consumer Products 1.3% | |
Jarden Corp.(a)
09/15/18 | | | 1.875 | % | | | 6,650,000 | | | | 7,431,508 | | |
Diversified Manufacturing 0.5% | |
GT Advanced Technologies, Inc.
Senior Unsecured
10/01/17 | | | 3.000 | % | | | 3,650,000 | | | | 2,739,781 | | |
Electric 0.7% | |
Covanta Holding Corp.
Senior Unsecured
06/01/14 | | | 3.250 | % | | | 3,050,000 | | | | 3,839,187 | | |
Entertainment 0.9% | |
Take-Two Interactive Software, Inc.
Senior Unsecured
12/01/16 | | | 1.750 | % | | | 4,500,000 | | | | 4,891,860 | | |
Food and Beverage 0.5% | |
Chiquita Brands International, Inc.
Senior Unsecured
08/15/16 | | | 4.250 | % | | | 2,989,000 | | | | 2,596,694 | | |
Gaming 1.4% | |
MGM Resorts International
04/15/15 | | | 4.250 | % | | | 7,450,000 | | | | 8,018,062 | | |
Health Care 6.0% | |
HeartWare International, Inc.
Senior Unsecured
12/15/17 | | | 3.500 | % | | | 2,650,000 | | | | 3,088,906 | | |
Hologic, Inc.
Senior Unsecured(c)
03/01/42 | | | 2.000 | % | | | 5,520,000 | | | | 5,743,450 | | |
Insulet Corp.
Senior Unsecured
06/15/16 | | | 3.750 | % | | | 4,220,000 | | | | 4,706,988 | | |
Molina Healthcare, Inc.
Senior Notes(a)
01/15/20 | | | 1.125 | % | | | 3,804,000 | | | | 3,896,247 | | |
The accompanying Notes to Financial Statements are an integral part of this statement.
Annual Report 2013
8
Columbia Convertible Securities Fund
Portfolio of Investments (continued)
February 28, 2013
Convertible Bonds (continued)
Issuer | | Coupon
Rate | | Principal
Amount ($) | | Value ($) | |
Omnicare, Inc.
04/01/42 | | | 3.750 | % | | | 5,100,000 | | | | 5,298,543 | | |
Opko Health, Inc.
Senior Unsecured(a)
02/01/33 | | | 3.000 | % | | | 2,850,000 | | | | 3,129,157 | | |
WebMD Health Corp.
Senior Unsecured
01/31/18 | | | 2.500 | % | | | 5,790,000 | | | | 5,207,381 | | |
Wright Medical Group, Inc.
Senior Unsecured(a)
08/15/17 | | | 2.000 | % | | | 2,510,000 | | | | 2,846,466 | | |
Total | | | | | | | 33,917,138 | | |
Healthcare Insurance 1.1% | |
WellPoint, Inc.
Senior Unsecured(a)
10/15/42 | | | 2.750 | % | | | 6,030,000 | | | | 6,457,648 | | |
Home Construction 2.9% | |
KB Homes
02/01/19 | | | 1.375 | % | | | 5,500,000 | | | | 5,530,937 | | |
Lennar Corp.(a)
11/15/21 | | | 3.250 | % | | | 2,800,000 | | | | 4,998,000 | | |
Meritage Homes Corp.
09/15/32 | | | 1.875 | % | | | 5,300,000 | | | | 5,611,375 | | |
Total | | | | | | | 16,140,312 | | |
Independent Energy 1.6% | |
Endeavour International Corp.
07/15/16 | | | 5.500 | % | | | 3,450,000 | | | | 1,664,625 | | |
Newpark Resources, Inc.
Senior Unsecured
10/01/17 | | | 4.000 | % | | | 2,950,000 | | | | 3,342,350 | | |
Stone Energy Corp.(a)
03/01/17 | | | 1.750 | % | | | 4,200,000 | | | | 3,790,500 | | |
Total | | | | | | | 8,797,475 | | |
Lodging 0.5% | |
Home Inns & Hotels Management, Inc.
Senior Unsecured
12/15/15 | | | 2.000 | % | | | 400,000 | | | | 356,750 | | |
Home Inns & Hotels Management, Inc.(a)
Senior Unsecured
12/15/15 | | | 2.000 | % | | | 3,020,000 | | | | 2,693,463 | | |
Total | | | | | | | 3,050,213 | | |
Convertible Bonds (continued)
Issuer | | Coupon
Rate | | Principal
Amount ($) | | Value ($) | |
Metals 2.9% | |
Horsehead Holding Corp.
Senior Unsecured
07/01/17 | | | 3.800 | % | | | 2,670,000 | | | | 2,647,244 | | |
Jaguar Mining, Inc.
Senior Unsecured
03/31/16 | | | 5.500 | % | | | 3,500,000 | | | | 1,327,812 | | |
James River Coal Co.
Senior Unsecured
12/01/15 | | | 4.500 | % | | | 5,890,000 | | | | 2,157,778 | | |
Molycorp, Inc.
Senior Unsecured
09/01/17 | | | 6.000 | % | | | 3,330,000 | | | | 2,544,187 | | |
Royal Gold, Inc.
Senior Unsecured
06/15/19 | | | 2.875 | % | | | 3,800,000 | | | | 3,952,950 | | |
United States Steel Corp.
Senior Unsecured
05/15/14 | | | 4.000 | % | | | 3,750,000 | | | | 3,937,500 | | |
Total | | | | | | | 16,567,471 | | |
Non-Captive Consumer 1.0% | |
DFC Global Corp.
Senior Unsecured(a)
04/15/17 | | | 3.250 | % | | | 5,100,000 | | | | 5,636,979 | | |
Non-Captive Diversified 0.8% | |
Air Lease Corp.
Senior Unsecured(a)
12/01/18 | | | 3.875 | % | | | 3,500,000 | | | | 4,305,210 | | |
Oil Field Services 1.9% | |
Cobalt International Energy, Inc.
Senior Unsecured
12/01/19 | | | 2.625 | % | | | 4,100,000 | | | | 4,264,000 | | |
Hornbeck Offshore Services, Inc.(a)
09/01/19 | | | 1.500 | % | | | 3,800,000 | | | | 4,196,625 | | |
SEACOR Holdings, Inc.
Senior Unsecured(a)
12/15/27 | | | 2.500 | % | | | 1,894,000 | | | | 2,009,667 | | |
Total | | | | | | | 10,470,292 | | |
Other Financial Institutions 1.9% | |
Ares Capital Corp.
Senior Unsecured(a)
03/15/17 | | | 4.875 | % | | | 5,000,000 | | | | 5,270,000 | | |
Forest City Enterprises, Inc.
Senior Unsecured
08/15/18 | | | 4.250 | % | | | 5,190,000 | | | | 5,529,945 | | |
Total | | | | | | | 10,799,945 | | |
The accompanying Notes to Financial Statements are an integral part of this statement.
Annual Report 2013
9
Columbia Convertible Securities Fund
Portfolio of Investments (continued)
February 28, 2013
Convertible Bonds (continued)
Issuer | | Coupon
Rate | | Principal
Amount ($) | | Value ($) | |
Other Industry 1.5% | |
Altra Holdings, Inc.
03/01/31 | | | 2.750 | % | | | 2,500,000 | | | | 2,854,687 | | |
General Cable Corp.
Subordinated Notes(c)
11/15/29 | | | 4.500 | % | | | 2,500,000 | | | | 2,925,000 | | |
WESCO International, Inc.
09/15/29 | | | 6.000 | % | | | 1,000,000 | | | | 2,677,500 | | |
Total | | | | | | | 8,457,187 | | |
Pharmaceuticals 12.0% | |
Akorn, Inc.
06/01/16 | | | 3.500 | % | | | 1,620,000 | | | | 2,786,400 | | |
Corsicanto Ltd.
01/15/32 | | | 3.500 | % | | | 1,900,000 | | | | 2,407,680 | | |
Dendreon Corp.
Senior Unsecured
01/15/16 | | | 2.875 | % | | | 15,520,000 | | | | 12,837,415 | | |
Endo Health Solutions, Inc.
Senior Subordinated Notes
04/15/15 | | | 1.750 | % | | | 2,300,000 | | | | 2,774,375 | | |
Gilead Sciences, Inc.
Senior Unsecured
05/01/16 | | | 1.625 | % | | | 9,880,000 | | | | 19,037,179 | | |
InterMune, Inc.
Senior Unsecured
12/15/17 | | | 2.500 | % | | | 1,710,000 | | | | 1,758,094 | | |
09/15/18 | | | 2.500 | % | | | 4,967,000 | | | | 4,116,401 | | |
Isis Pharmaceuticals, Inc.
Senior Unsecured(a)
10/01/19 | | | 2.750 | % | | | 2,180,000 | | | | 2,505,637 | | |
Medivation, Inc.
Senior Unsecured
04/01/17 | | | 2.625 | % | | | 2,200,000 | | | | 2,780,250 | | |
Mylan, Inc.
09/15/15 | | | 3.750 | % | | | 1,750,000 | | | | 3,972,500 | | |
Onyx Pharmaceuticals, Inc.
Senior Unsecured
08/15/16 | | | 4.000 | % | | | 1,140,000 | | | | 2,302,800 | | |
Pacira Pharmaceuticals, Inc.
Senior Unsecured(a)
02/01/19 | | | 3.250 | % | | | 1,900,000 | | | | 2,220,036 | | |
Regeneron Pharmaceuticals, Inc.
Senior Unsecured
10/01/16 | | | 1.875 | % | | | 1,120,000 | | | | 2,288,944 | | |
Salix Pharmaceuticals Ltd.
Senior Notes(a)
03/15/19 | | | 1.500 | % | | | 5,300,000 | | | | 5,555,937 | | |
Total | | | | | | | 67,343,648 | | |
Convertible Bonds (continued)
Issuer | | Coupon
Rate | | Principal
Amount ($) | | Value ($) | |
Property & Casualty 0.6% | |
Radian Group, Inc.
Senior Unsecured(g)
03/01/19 | | | 2.250 | % | | | 3,100,000 | | | | 3,320,875 | | |
Railroads 0.8% | |
Greenbrier Companies, Inc.
Senior Unsecured
04/01/18 | | | 3.500 | % | | | 4,500,000 | | | | 4,370,625 | | |
REITs 3.3% | |
Boston Properties LP
Senior Unsecured
05/15/36 | | | 3.750 | % | | | 4,500,000 | | | | 4,730,625 | | |
Forestar Group, Inc.
Senior Unsecured
03/01/20 | | | 3.750 | % | | | 2,850,000 | | | | 2,934,075 | | |
SL Green Operating Partnership LP(a)
10/15/17 | | | 3.000 | % | | | 4,800,000 | | | | 5,526,000 | | |
Starwood Property Trust, Inc.
Senior Unsecured
03/01/18 | | | 4.550 | % | | | 4,758,000 | | | | 5,109,331 | | |
Total | | | | | | | 18,300,031 | | |
Retailers 1.0% | |
priceline.com, Inc.
Senior Unsecured(a)
03/15/18 | | | 1.000 | % | | | 5,000,000 | | | | 5,530,550 | | |
Technology 17.1% | |
Bottomline Technologies de, Inc.
Senior Unsecured
12/01/17 | | | 1.500 | % | | | 2,840,000 | | | | 3,272,305 | | |
Ciena Corp.
Senior Unsecured(a)
10/15/18 | | | 3.750 | % | | | 4,800,000 | | | | 5,365,968 | | |
Dealertrack Technologies, Inc.(a)
03/15/17 | | | 1.500 | % | | | 4,750,000 | | | | 5,100,312 | | |
EMC Corp.
Senior Unsecured
12/01/13 | | | 1.750 | % | | | 6,500,000 | | | | 9,400,625 | | |
Equinix, Inc.
Subordinated Notes
10/15/14 | | | 3.000 | % | | | 1,550,000 | | | | 3,055,438 | | |
Intel Corp.
08/01/39 | | | 3.250 | % | | | 8,500,000 | | | | 10,056,562 | | |
Ixia
Senior Notes
12/15/15 | | | 3.000 | % | | | 2,700,000 | | | | 3,402,000 | | |
The accompanying Notes to Financial Statements are an integral part of this statement.
Annual Report 2013
10
Columbia Convertible Securities Fund
Portfolio of Investments (continued)
February 28, 2013
Convertible Bonds (continued)
Issuer | | Coupon
Rate | | Principal
Amount ($) | | Value ($) | |
Mentor Graphics Corp.
04/01/31 | | | 4.000 | % | | | 4,740,000 | | | | 5,498,400 | | |
Micron Technology, Inc.(a)
Senior Unsecured
02/15/33 | | | 1.625 | % | | | 1,900,000 | | | | 1,978,090 | | |
02/15/33 | | | 2.125 | % | | | 6,850,000 | | | | 7,018,989 | | |
Novellus Systems, Inc.
05/15/41 | | | 2.625 | % | | | 3,000,000 | | | | 4,220,100 | | |
Nuance Communications, Inc.
Senior Unsecured
11/01/31 | | | 2.750 | % | | | 4,840,000 | | | | 4,976,125 | | |
ON Semiconductor Corp.
12/15/26 | | | 2.625 | % | | | 5,250,000 | | | | 5,932,500 | | |
Powerwave Technologies, Inc.(e)
Subordinated Notes
10/01/27 | | | 3.875 | % | | | 1,900,000 | | | | 72,438 | | |
Salesforce.com, Inc.
Senior Unsecured
01/15/15 | | | 0.750 | % | | | 2,000,000 | | | | 4,021,250 | | |
SanDisk Corp.
Senior Unsecured
08/15/17 | | | 1.500 | % | | | 3,380,000 | | | | 4,161,625 | | |
Symantec Corp.
Senior Unsecured
06/15/13 | | | 1.000 | % | | | 3,400,000 | | | | 4,182,000 | | |
TIBCO Software, Inc.
Senior Unsecured(a)
05/01/32 | | | 2.250 | % | | | 5,300,000 | | | | 5,155,374 | | |
TTM Technologies, Inc.
Senior Unsecured
05/15/15 | | | 3.250 | % | | | 4,000,000 | | | | 3,995,000 | | |
TiVo, Inc.
Senior Unsecured(a)
03/15/16 | | | 4.000 | % | | | 3,900,000 | | | | 5,265,000 | | |
Total | | | | | | | 96,130,101 | | |
Textile 1.0% | |
Iconix Brand Group, Inc.
Senior Subordinated Notes(a)
06/01/16 | | | 2.500 | % | | | 5,050,000 | | | | 5,465,817 | | |
Tobacco 0.8% | |
Vector Group Ltd.
Senior Unsecured(c)
01/15/19 | | | 2.500 | % | | | 3,900,000 | | | | 4,382,118 | | |
Transportation Services 2.1% | |
DryShips, Inc.
Senior Unsecured
12/01/14 | | | 5.000 | % | | | 7,000,000 | | | | 5,998,125 | | |
Convertible Bonds (continued)
Issuer | | Coupon
Rate | | Principal
Amount ($) | | Value ($) | |
Wabash National Corp.
Senior Unsecured
05/01/18 | | | 3.375 | % | | | 2,400,000 | | | | 2,832,768 | | |
XPO Logistics, Inc.
Senior Unsecured
10/01/17 | | | 4.500 | % | | | 2,500,000 | | | | 3,039,025 | | |
Total | | | | | | | 11,869,918 | | |
Wireless 1.6% | |
InterDigital, Inc.
03/15/16 | | | 2.500 | % | | | 4,800,000 | | | | 5,263,680 | | |
SBA Communications Corp.
Senior Unsecured
10/01/14 | | | 4.000 | % | | | 1,695,000 | | | | 4,013,972 | | |
Total | | | | | | | 9,277,652 | | |
Total Convertible Bonds
(Cost: $389,176,317) | | | | | | | 412,272,924 | | |
Equity-Linked Notes 0.7%
Issuer | | Coupon
Rate | | Shares | | Value ($) | |
Goldman Sachs Group, Inc. (The)
Mandatory Exchangeable Notes
(linked to convertible preferred
stock of Vertex Pharmaceuticals)(a)
08/27/14 | | | 0.500 | % | | | 93,305 | | | | 4,250,418 | | |
Total Equity-Linked Notes
(Cost: $4,275,049) | | | | | | | 4,250,418 | | |
Money Market Funds 1.4%
Columbia Short-Term Cash Fund,
0.128%(h)(i) | | | 7,891,361 | | | | 7,891,361 | | |
Total Money Market Funds
(Cost: $7,891,361) | | | | | 7,891,361 | | |
Total Investments
(Cost: $530,506,216) | | | | | 558,743,280 | | |
Other Assets & Liabilities, Net | | | | | 2,279,232 | | |
Net Assets | | | | | 561,022,512 | | |
The accompanying Notes to Financial Statements are an integral part of this statement.
Annual Report 2013
11
Columbia Convertible Securities Fund
Portfolio of Investments (continued)
February 28, 2013
Notes to Portfolio of Investments
(a) Security exempt from registration pursuant to Rule 144A under the Securities Act of 1933. This security may be resold in transactions exempt from registration, normally to qualified institutional buyers. At February 28, 2013, the value of these securities amounted to $133,199,138 or 23.74% of net assets.
(b) Non-income producing.
(c) Variable rate security.
(d) Identifies issues considered to be illiquid as to their marketability. The aggregate value of such securities at February 28, 2013 was $24,300, representing less than 0.01% of net assets. Information concerning such security holdings at February 28, 2013 is as follows:
Security Description | | Acquisition Dates | | Cost ($) | |
ShengdaTech, Inc.
Senior Notes
12/15/15 6.500% | | 12/10/10 - 12/21/10 | | | 2,434,408 | | |
(e) Represents securities that have defaulted on payment of interest. The Fund has stopped accruing interest on these securities. At February 28, 2013, the value of these securities amounted to $96,738, which represents 0.02% of net assets.
(f) Represents fair value as determined in good faith under procedures approved by the Board of Trustees. At February 28, 2013, the value of these securities amounted to $24,300, which represents less than 0.01% of net assets.
(g) Represents a security purchased on a when-issued or delayed delivery basis.
(h) The rate shown is the seven-day current annualized yield at February 28, 2013.
(i) As defined in the Investment Company Act of 1940, an affiliated company is one in which the Fund owns 5% or more of its outstanding voting securities, or a company which is under common ownership or control with the Fund. Holdings and transactions in these affiliated companies during the year ended February 28, 2013, are as follows:
Issuer | | Beginning
Cost ($) | | Purchase
Cost ($) | | Proceeds
From Sales ($) | | Ending
Cost ($) | | Dividends —
Affiliated
Issuers ($) | | Value ($) | |
Columbia Short-Term Cash Fund | | | 368,531 | | | | 189,234,409 | | | | (181,711,579 | ) | | | 7,891,361 | | | | 15,237 | | | | 7,891,361 | | |
Fair Value Measurements
Generally accepted accounting principles (GAAP) require disclosure regarding the inputs and valuation techniques used to measure fair value and any changes in valuation inputs or techniques. In addition, investments shall be disclosed by major category.
The Fund categorizes its fair value measurements according to a three-level hierarchy that maximizes the use of observable inputs and minimizes the use of unobservable inputs by prioritizing that the most observable input be used when available. Observable inputs are those that market participants would use in pricing an investment based on market data obtained from sources independent of the reporting entity. Unobservable inputs are those that reflect the Fund's assumptions about the information market participants would use in pricing an investment. An investment's level within the fair value hierarchy is based on the lowest level of any input that is deemed significant to the asset or liability's fair value measurement. The input levels are not necessarily an indication of the risk or liquidity associated with investments at that level. For example, certain U.S. government securities are generally high quality and liquid, however, they are reflected as Level 2 because the inputs used to determine fair value may not always be quoted prices in an active market.
Fair value inputs are summarized in the three broad levels listed below:
> Level 1 — Valuations based on quoted prices for investments in active markets that the Fund has the ability to access at the measurement date (including NAV for open-end mutual funds). Valuation adjustments are not applied to Level 1 investments.
> Level 2 — Valuations based on other significant observable inputs (including quoted prices for similar securities, interest rates, prepayment speeds, credit risks, etc.).
> Level 3 — Valuations based on significant unobservable inputs (including the Fund's own assumptions and judgment in determining the fair value of investments).
The accompanying Notes to Financial Statements are an integral part of this statement.
Annual Report 2013
12
Columbia Convertible Securities Fund
Portfolio of Investments (continued)
February 28, 2013
Fair Value Measurements (continued)
Inputs that are used in determining fair value of an investment may include price information, credit data, volatility statistics, and other factors. These inputs can be either observable or unobservable. The availability of observable inputs can vary between investments, and is affected by various factors such as the type of investment, and the volume and level of activity for that investment or similar investments in the marketplace. The inputs will be considered by the Investment Manager, along with any other relevant factors in the calculation of an investment's fair value. The Fund uses prices and inputs that are current as of the measurement date, which may include periods of market dislocations. During these periods, the availability of prices and inputs may be reduced for many investments. This condition could cause an investment to be reclassified between the various levels within the hierarchy.
Investments falling into the Level 3 category are primarily supported by quoted prices from brokers and dealers participating in the market for those investments. However, these may be classified as Level 3 investments due to lack of market transparency and corroboration to support these quoted prices. Additionally, valuation models may be used as the pricing source for any remaining investments classified as Level 3. These models rely on one or more significant unobservable inputs and/or significant assumptions by the Investment Manager. Inputs used in valuations may include, but are not limited to, financial statement analysis, capital account balances, discount rates and estimated cash flows, and comparable company data.
Under the direction of the Fund's Board of Trustees (the Board), the Investment Manager's Valuation Committee (the Committee) is responsible for carrying out the valuation procedures approved by the Board. The Committee consists of voting and non-voting members from various groups within the Investment Manager's organization, including operations and accounting, trading and investments, compliance, risk management and legal.
The Committee meets at least monthly to review and approve valuation matters, which may include a description of specific valuation determinations, data regarding pricing information received from approved pricing vendors and brokers and the results of Board-approved valuation control policies and procedures (the Policies). The Policies address, among other things, instances when market quotations are readily available, including recommendations of third party pricing vendors and a determination of appropriate pricing methodologies; events that require specific valuation determinations and assessment of fair value techniques; securities with a potential for stale pricing, including those that are illiquid, restricted, or in default; and the effectiveness of third-party pricing vendors, including periodic reviews of vendors. The Committee meets more frequently, as needed, to discuss additional valuation matters, which may include the need to review back-testing results, review time-sensitive information or approve related valuation actions. The Committee reports to the Board, with members of the Committee meeting with the Board at each of its regularly scheduled meetings to discuss valuation matters and actions during the period, similar to those described earlier.
For investments categorized as Level 3, the Committee monitors information similar to that described above, which may include: (i) data specific to the issuer or comparable issuers, (ii) general market or specific sector news and (iii) quoted prices and specific or similar security transactions. The Committee considers this data and any changes from prior periods in order to assess the reasonableness of observable and unobservable inputs, any assumptions or internal models used to value those securities and changes in fair value. This data is also used to corroborate, when available, information received from approved pricing vendors and brokers. Various factors impact the frequency of monitoring this information (which may occur as often as daily). However, the Committee may determine that changes to inputs, assumptions and models are not required as a result of the monitoring procedures performed.
The accompanying Notes to Financial Statements are an integral part of this statement.
Annual Report 2013
13
Columbia Convertible Securities Fund
Portfolio of Investments (continued)
February 28, 2013
Fair Value Measurements (continued)
The following table is a summary of the inputs used to value the Fund's investments at February 28, 2013:
Description | | Level 1
Quoted Prices in Active
Markets for Identical
Assets ($) | | Level 2
Other Significant
Observable Inputs ($) | | Level 3
Significant
Unobservable Inputs ($) | | Total ($) | |
Equity Securities | |
Common Stocks | |
Financials | | | 2,679,200 | | | | — | | | | — | | | | 2,679,200 | | |
Information Technology | | | 2,917,600 | | | | — | | | | — | | | | 2,917,600 | | |
Utilities | | | 3,193,200 | | | | — | | | | — | | | | 3,193,200 | | |
Convertible Preferred Stocks | |
Consumer Discretionary | | | 13,157,550 | | | | 4,033,063 | | | | — | | | | 17,190,613 | | |
Consumer Staples | | | — | | | | 11,011,653 | | | | — | | | | 11,011,653 | | |
Energy | | | 7,191,928 | | | | 16,874,501 | | | | — | | | | 24,066,429 | | |
Financials | | | 29,655,067 | | | | 10,846,250 | | | | — | | | | 40,501,317 | | |
Industrials | | | 8,685,300 | | | | 4,138,275 | | | | — | | | | 12,823,575 | | |
Information Technology | | | 2,996,440 | | | | — | | | | — | | | | 2,996,440 | | |
Utilities | | | 5,486,000 | | | | 11,462,550 | | | | — | | | | 16,948,550 | | |
Total Equity Securities | | | 75,962,285 | | | | 58,366,292 | | | | — | | | | 134,328,577 | | |
Bonds | |
Convertible Bonds | |
Chemicals | | | — | | | | — | | | | 24,300 | | | | 24,300 | | |
All other industries | | | — | | | | 412,248,624 | | | | — | | | | 412,248,624 | | |
Total Bonds | | | — | | | | 412,248,624 | | | | 24,300 | | | | 412,272,924 | | |
Other | |
Equity-Linked Notes | | | — | | | | 4,250,418 | | | | — | | | | 4,250,418 | | |
Money Market Funds | | | 7,891,361 | | | | — | | | | — | | | | 7,891,361 | | |
Total Other | | | 7,891,361 | | | | 4,250,418 | | | | — | | | | 12,141,779 | | |
Total | | | 83,853,646 | | | | 474,865,334 | | | | 24,300 | | | | 558,743,280 | | |
See the Portfolio of Investments for all investment classifications not indicated in the table.
The Fund's assets assigned to the Level 2 input category are generally valued using the market approach, in which a security's value is determined through reference to prices and information from market transactions for similar or identical assets.
Financial assets were transferred from Level 2 to Level 1 as the market for these assets was deemed to be active during the period and fair value were consequently obtained using quoted prices for identical assets rather than being based upon other observable market inputs as of period ended, February 28, 2013.
Financial assets were transferred from Level 1 to Level 2 as the market for these assets was deemed not to be active and fair value were consequently obtained using the observable market inputs rather than quoted prices for identical assets as of period end, February 28, 2013.
The accompanying Notes to Financial Statements are an integral part of this statement.
Annual Report 2013
14
Columbia Convertible Securities Fund
Portfolio of Investments (continued)
February 28, 2013
Fair Value Measurements (continued)
The following table shows transfers between Level 1 and Level 2 of the fair value hierarchy:
Transfers In | | Transfers Out | |
| Level 1 | | Level 2 | | Level 1 | | Level 2 | |
| $ | 52,502,138 | | | $ | 5,975,400 | | | $ | 5,975,400 | | | $ | 52,502,138 | | |
Transfers between Level 1 and Level 2 are determined based on the fair value at the beginning of the period for security positions held throughout the period.
The following table is a reconciliation of Level 3 assets for which significant observable and/or unobservable inputs were used to determine fair value.
| | Convertible Bonds ($) | |
Balance as of February 29, 2012 | | | 362,131 | | |
Accrued discounts/premiums | | | — | | |
Realized gain (loss) | | | — | | |
Change in unrealized appreciation (depreciation)(a) | | | (337,831 | ) | |
Sales | | | — | | |
Purchases | | | — | | |
Transfers into Level 3 | | | — | | |
Transfers out of Level 3 | | | — | | |
Balance as of February 28, 2013 | | | 24,300 | | |
(a) Change in unrealized appreciation (depreciation) relating to securities held at February 28, 2013 was $(337,831).
The Fund's assets assigned to Level 3 category are valued utilizing the valuation technique deemed the most appropriate in the circumstances. Certain Convertible Bonds classified as Level 3 are valued using a market approach. To determine fair value for these securities, management considered various factors which may have included, but were limited to, the halt price of the security, the movement in observed market prices for the other securities from the issuer, the movement in certain foreign or domestic market indices, and the estimated earnings of the respective company and market multiples derived from a set comparable companies. Significant increases (decreases) to any of these inputs would result in a significantly lower (higher) fair value measurement. Generally, a change in estimated earnings of the respective company may result in a change to the comparable companies and market multiples utilized.
Transfers in and/or out of Level 3 are determined based on the fair value at the beginning of the period for security positions held throughout the period.
The accompanying Notes to Financial Statements are an integral part of this statement.
Annual Report 2013
15
Columbia Convertible Securities Fund
Statement of Assets and Liabilities
February 28, 2013
Assets | |
Investments, at value | |
Unaffiliated issuers (identified cost $522,614,855) | | $ | 550,851,919 | | |
Affiliated issuers (identified cost $7,891,361) | | | 7,891,361 | | |
Total investments (identified cost $530,506,216) | | | 558,743,280 | | |
Cash | | | 32,802 | | |
Receivable for: | |
Investments sold | | | 1,115,183 | | |
Capital shares sold | | | 1,156,630 | | |
Dividends | | | 486,333 | | |
Interest | | | 3,333,880 | | |
Reclaims | | | 1,784 | | |
Expense reimbursement due from Investment Manager | | | 3,318 | | |
Prepaid expenses | | | 2,402 | | |
Total assets | | | 564,875,612 | | |
Liabilities | |
Payable for: | |
Investments purchased on a delayed delivery basis | | | 3,100,000 | | |
Capital shares purchased | | | 474,614 | | |
Investment management fees | | | 11,584 | | |
Distribution and/or service fees | | | 2,177 | | |
Transfer agent fees | | | 81,993 | | |
Administration fees | | | 912 | | |
Compensation of board members | | | 82,787 | | |
Other expenses | | | 99,033 | | |
Total liabilities | | | 3,853,100 | | |
Net assets applicable to outstanding capital stock | | $ | 561,022,512 | | |
Represented by | |
Paid-in capital | | $ | 576,918,698 | | |
Undistributed net investment income | | | 2,089,221 | | |
Accumulated net realized loss | | | (46,222,471 | ) | |
Unrealized appreciation (depreciation) on: | |
Investments | | | 28,237,064 | | |
Total — representing net assets applicable to outstanding capital stock | | $ | 561,022,512 | | |
The accompanying Notes to Financial Statements are an integral part of this statement.
Annual Report 2013
16
Columbia Convertible Securities Fund
Statement of Assets and Liabilities (continued)
February 28, 2013
Class A | |
Net assets | | $ | 212,251,779 | | |
Shares outstanding | | | 13,535,351 | | |
Net asset value per share | | $ | 15.68 | | |
Maximum offering price per share(a) | | $ | 16.64 | | |
Class B | |
Net assets | | $ | 1,334,996 | | |
Shares outstanding | | | 86,716 | | |
Net asset value per share | | $ | 15.40 | | |
Class C | |
Net assets | | $ | 17,617,488 | | |
Shares outstanding | | | 1,126,922 | | |
Net asset value per share | | $ | 15.63 | | |
Class I | |
Net assets | | $ | 180,373,632 | | |
Shares outstanding | | | 11,474,017 | | |
Net asset value per share | | $ | 15.72 | | |
Class R | |
Net assets | | $ | 1,893,836 | | |
Shares outstanding | | | 120,869 | | |
Net asset value per share | | $ | 15.67 | | |
Class R4 | |
Net assets | | $ | 2,677 | | |
Shares outstanding | | | 169 | | |
Net asset value per share(b) | | $ | 15.80 | | |
Class R5 | |
Net assets | | $ | 2,677 | | |
Shares outstanding | | | 169 | | |
Net asset value per share(b) | | $ | 15.80 | | |
Class W | |
Net assets | | $ | 26,639,850 | | |
Shares outstanding | | | 1,701,148 | | |
Net asset value per share | | $ | 15.66 | | |
Class Z | |
Net assets | | $ | 120,905,577 | | |
Shares outstanding | | | 7,699,200 | | |
Net asset value per share | | $ | 15.70 | | |
(a) The maximum offering price per share is calculated by dividing the net asset value by 1.0 minus the maximum sales charge of 5.75%.
(b) Net asset value per share rounds to this amount due to fractional shares outstanding.
The accompanying Notes to Financial Statements are an integral part of this statement.
Annual Report 2013
17
Columbia Convertible Securities Fund
Statement of Operations
Year Ended February 28, 2013
Net investment income | |
Income: | |
Dividends — unaffiliated issuers | | $ | 7,311,838 | | |
Dividends — affiliated issuers | | | 15,237 | | |
Interest | | | 13,627,987 | | |
Income from securities lending — net | | | 151,004 | | |
Total income | | | 21,106,066 | | |
Expenses: | |
Investment management fees | | | 4,029,231 | | |
Distribution and/or service fees | |
Class A | | | 480,547 | | |
Class B | | | 20,102 | | |
Class C | | | 184,657 | | |
Class R | | | 9,789 | | |
Class W | | | 58,330 | | |
Transfer agent fees | |
Class A | | | 496,224 | | |
Class B | | | 5,086 | | |
Class C | | | 47,540 | | |
Class R | | | 5,048 | | |
Class R4(a) | | | 2 | | |
Class W | | | 59,849 | | |
Class Z | | | 313,273 | | |
Administration fees | | | 317,615 | | |
Compensation of board members | | | 28,846 | | |
Custodian fees | | | 10,344 | | |
Printing and postage fees | | | 131,850 | | |
Registration fees | | | 142,025 | | |
Professional fees | | | 42,206 | | |
Other | | | 27,529 | | |
Total expenses | | | 6,410,093 | | |
Fees waived or expenses reimbursed by Investment Manager and its affiliates | | | (1,123,957 | ) | |
Expense reductions | | | (1,854 | ) | |
Total net expenses | | | 5,284,282 | | |
Net investment income | | | 15,821,784 | | |
Realized and unrealized gain (loss) — net | |
Net realized gain (loss) on: | |
Investments | | | 13,379,079 | | |
Foreign currency translations | | | 115 | | |
Net realized gain | | | 13,379,194 | | |
Net change in unrealized appreciation (depreciation) on: | |
Investments | | | 10,548,141 | | |
Net change in unrealized appreciation (depreciation) | | | 10,548,141 | | |
Net realized and unrealized gain | | | 23,927,335 | | |
Net increase in net assets resulting from operations | | $ | 39,749,119 | | |
(a) For the period from November 8, 2012 (commencement of operations) to February 28, 2013.
The accompanying Notes to Financial Statements are an integral part of this statement.
Annual Report 2013
18
Columbia Convertible Securities Fund
Statement of Changes in Net Assets
| | | Year Ended
February 28,
2013(a) | | Year Ended
February 29,
2012(b) | |
Operations | |
Net investment income | | $ | 15,821,784 | | | $ | 15,647,501 | | |
Net realized gain | | | 13,379,194 | | | | 16,675,985 | | |
Net change in unrealized appreciation (depreciation) | | | 10,548,141 | | | | (40,544,999 | ) | |
Net increase (decrease) in net assets resulting from operations | | | 39,749,119 | | | | (8,221,513 | ) | |
Distributions to shareholders | |
Net investment income | |
Class A | | | (5,824,316 | ) | | | (5,825,865 | ) | |
Class B | | | (48,373 | ) | | | (130,520 | ) | |
Class C | | | (426,422 | ) | | | (409,894 | ) | |
Class I | | | (5,875,875 | ) | | | (4,448,990 | ) | |
Class R | | | (55,704 | ) | | | (22 | ) | |
Class R4 | | | (22 | ) | | | — | | |
Class R5 | | | (23 | ) | | | — | | |
Class W | | | (748,268 | ) | | | (23 | ) | |
Class Z | | | (4,072,063 | ) | | | (4,429,884 | ) | |
Total distributions to shareholders | | | (17,051,066 | ) | | | (15,245,198 | ) | |
Increase (decrease) in net assets from capital stock activity | | | (31,063,283 | ) | | | 84,968,676 | | |
Total increase (decrease) in net assets | | | (8,365,230 | ) | | | 61,501,965 | | |
Net assets at beginning of year | | | 569,387,742 | | | | 507,885,777 | | |
Net assets at end of year | | $ | 561,022,512 | | | $ | 569,387,742 | | |
Undistributed net investment income | | $ | 2,089,221 | | | $ | 2,642,988 | | |
(a) Class R4 and Class R5 shares are for the period November 8, 2012 (commencement of operations) to February 28, 2013.
(b) Class R and Class W shares are for the period November 16, 2011 (commencement of operations) to February 29, 2012.
The accompanying Notes to Financial Statements are an integral part of this statement.
Annual Report 2013
19
Columbia Convertible Securities Fund
Statement of Changes in Net Assets (continued)
| | | Year Ended February 28, 2013(a) | | Year Ended February 29, 2012(b) | |
| | | Shares | | Dollars ($) | | Shares | | Dollars ($) | |
Capital stock activity | |
Class A shares | |
Subscriptions(c) | | | 2,978,867 | | | | 45,049,079 | | | | 2,272,231 | | | | 33,487,733 | | |
Distributions reinvested | | | 182,375 | | | | 2,677,479 | | | | 158,265 | | | | 2,252,369 | | |
Redemptions | | | (2,882,841 | ) | | | (42,782,310 | ) | | | (3,615,035 | ) | | | (52,730,837 | ) | |
Net increase (decrease) | | | 278,401 | | | | 4,944,248 | | | | (1,184,539 | ) | | | (16,990,735 | ) | |
Class B shares | |
Subscriptions | | | 9,141 | | | | 138,620 | | | | 21,036 | | | | 302,932 | | |
Distributions reinvested | | | 1,563 | | | | 22,517 | | | | 2,689 | | | | 38,136 | | |
Redemptions(c) | | | (134,684 | ) | | | (1,961,789 | ) | | | (604,151 | ) | | | (8,791,016 | ) | |
Net decrease | | | (123,980 | ) | | | (1,800,652 | ) | | | (580,426 | ) | | | (8,449,948 | ) | |
Class C shares | |
Subscriptions | | | 124,220 | | | | 1,848,364 | | | | 338,701 | | | | 5,009,845 | | |
Distributions reinvested | | | 13,916 | | | | 203,668 | | | | 13,798 | | | | 195,556 | | |
Redemptions | | | (357,837 | ) | | | (5,295,639 | ) | | | (406,435 | ) | | | (5,811,801 | ) | |
Net decrease | | | (219,701 | ) | | | (3,243,607 | ) | | | (53,936 | ) | | | (606,400 | ) | |
Class I shares | |
Subscriptions | | | 638,685 | | | | 9,415,136 | | | | 10,082,655 | | | | 149,501,517 | | |
Distributions reinvested | | | 399,546 | | | | 5,875,783 | | | | 317,539 | | | | 4,448,906 | | |
Redemptions | | | (1,957,488 | ) | | | (28,708,271 | ) | | | (3,325,698 | ) | | | (46,905,955 | ) | |
Net increase (decrease) | | | (919,257 | ) | | | (13,417,352 | ) | | | 7,074,496 | | | | 107,044,468 | | |
Class R shares | |
Subscriptions | | | 34,136 | | | | 502,970 | | | | 143,409 | | | | 2,071,722 | | |
Distributions reinvested | | | 828 | | | | 12,150 | | | | — | | | | — | | |
Redemptions | | | (52,085 | ) | | | (772,004 | ) | | | (5,419 | ) | | | (81,051 | ) | |
Net increase (decrease) | | | (17,121 | ) | | | (256,884 | ) | | | 137,990 | | | | 1,990,671 | | |
Class R4 shares | |
Subscriptions | | | 169 | | | | 2,500 | | | | — | | | | — | | |
Net increase | | | 169 | | | | 2,500 | | | | — | | | | — | | |
Class R5 shares | |
Subscriptions | | | 169 | | | | 2,500 | | | | — | | | | — | | |
Net increase | | | 169 | | | | 2,500 | | | | — | | | | — | | |
Class W shares | |
Subscriptions | | | 704,883 | | | | 10,370,297 | | | | 1,944,273 | | | | 29,221,765 | | |
Distributions reinvested | | | 50,873 | | | | 748,185 | | | | — | | | | — | | |
Redemptions | | | (978,875 | ) | | | (14,393,032 | ) | | | (20,006 | ) | | | (300,253 | ) | |
Net increase (decrease) | | | (223,119 | ) | | | (3,274,550 | ) | | | 1,924,267 | | | | 28,921,512 | | |
Class Z shares | |
Subscriptions | | | 3,470,807 | | | | 51,631,561 | | | | 4,751,824 | | | | 70,147,549 | | |
Distributions reinvested | | | 86,361 | | | | 1,266,808 | | | | 90,235 | | | | 1,304,380 | | |
Redemptions | | | (4,543,771 | ) | | | (66,917,855 | ) | | | (6,852,715 | ) | | | (98,392,821 | ) | |
Net decrease | | | (986,603 | ) | | | (14,019,486 | ) | | | (2,010,656 | ) | | | (26,940,892 | ) | |
Total net increase (decrease) | | | (2,211,042 | ) | | | (31,063,283 | ) | | | 5,307,196 | | | | 84,968,676 | | |
(a) Class R4 and Class 5 are for the period from November 8, 2012 (commencement of operations) to February 28, 2013.
(b) Class R and Class W shares are for the period from November 16, 2011 (commencement of operation) to February 29, 2012.
(c) Includes conversions of Class B shares to Class A shares, if any.
The accompanying Notes to Financial Statements are an integral part of this statement.
Annual Report 2013
20
Columbia Convertible Securities Fund
The following tables are intended to help you understand the Fund's financial performance. Certain information reflects financial results for a single share of a class held for the periods shown. Per share net investment income (loss) amounts are calculated based on average shares outstanding during the period. Total return assumes reinvestment of all dividends and distributions, if any. Total return does not reflect payment of sales charges, if any, and is not annualized for periods of less than one year.
| | | Year Ended
February 28, | | Year Ended
February 29, | | Year Ended February 28, | |
Class A | | 2013 | | 2012 | | 2011 | | 2010 | | 2009 | |
Per share data | |
Net asset value, beginning of period | | $ | 14.99 | | | $ | 15.55 | | | $ | 12.92 | | | $ | 9.93 | | | $ | 14.90 | | |
Income from investment operations: | |
Net investment income | | | 0.41 | | | | 0.42 | | | | 0.45 | | | | 0.34 | | | | 0.29 | | |
Net realized and unrealized gain (loss) | | | 0.73 | | | | (0.56 | ) | | | 2.67 | | | | 2.99 | | | | (4.73 | ) | |
Total from investment operations | | | 1.14 | | | | (0.14 | ) | | | 3.12 | | | | 3.33 | | | | (4.44 | ) | |
Less distributions to shareholders: | |
Net investment income | | | (0.45 | ) | | | (0.42 | ) | | | (0.49 | ) | | | (0.34 | ) | | | (0.30 | ) | |
Net realized gains | | | — | | | | — | | | | — | | | | — | | | | (0.23 | ) | |
Total distributions to shareholders | | | (0.45 | ) | | | (0.42 | ) | | | (0.49 | ) | | | (0.34 | ) | | | (0.53 | ) | |
Proceeds from regulatory settlements | | | — | | | | — | | | | — | | | | 0.00 | (a) | | | — | | |
Net asset value, end of period | | $ | 15.68 | | | $ | 14.99 | | | $ | 15.55 | | | $ | 12.92 | | | $ | 9.93 | | |
Total return | | | 7.84 | % | | | (0.75 | %) | | | 24.72 | % | | | 33.91 | % | | | (30.64 | %) | |
Ratios to average net assets(b)(c) | |
Total gross expenses | | | 1.39 | % | | | 1.27 | % | | | 1.31 | %(d) | | | 1.24 | % | | | 1.24 | %(d) | |
Total net expenses(e) | | | 1.15 | %(f) | | | 1.12 | %(f) | | | 1.15 | %(d)(f) | | | 1.20 | %(f) | | | 1.21 | %(d)(f) | |
Net investment income | | | 2.80 | % | | | 2.86 | % | | | 3.27 | % | | | 2.88 | % | | | 2.33 | % | |
Supplemental data | |
Net assets, end of period (in thousands) | | $ | 212,252 | | | $ | 198,721 | | | $ | 224,608 | | | $ | 191,414 | | | $ | 154,987 | | |
Portfolio turnover | | | 71 | % | | | 66 | % | | | 118 | % | | | 117 | % | | | 92 | % | |
Notes to Financial Highlights
(a) Rounds to zero.
(b) In addition to the fees and expenses which the Fund bears directly, the Fund indirectly bears a pro rata share of the fees and expenses of the acquired funds in which it invests. Such indirect expenses are not included in the reported expense ratios.
(c) Certain line items from prior years have been reclassified to conform to the current presentation.
(d) Ratios include line of credit interest expense which rounds to less than 0.01%.
(e) Total net expenses include the impact of certain waivers/reimbursements made by the Investment Manager and certain of its affiliates, if applicable.
(f) The benefits derived from expense reductions had an impact of less than 0.01%.
The accompanying Notes to Financial Statements are an integral part of this statement.
Annual Report 2013
21
Columbia Convertible Securities Fund
Financial Highlights (continued)
| | | Year Ended
February 28, | | Year Ended
February 29, | | Year Ended February 28, | |
Class B | | 2013 | | 2012 | | 2011 | | 2010 | | 2009 | |
Per share data | |
Net asset value, beginning of period | | $ | 14.72 | | | $ | 15.28 | | | $ | 12.70 | | | $ | 9.77 | | | $ | 14.66 | | |
Income from investment operations: | |
Net investment income | | | 0.30 | | | | 0.30 | | | | 0.35 | | | | 0.24 | | | | 0.19 | | |
Net realized and unrealized gain (loss) | | | 0.72 | | | | (0.55 | ) | | | 2.62 | | | | 2.94 | | | | (4.65 | ) | |
Total from investment operations | | | 1.02 | | | | (0.25 | ) | | | 2.97 | | | | 3.18 | | | | (4.46 | ) | |
Less distributions to shareholders: | |
Net investment income | | | (0.34 | ) | | | (0.31 | ) | | | (0.39 | ) | | | (0.25 | ) | | | (0.20 | ) | |
Net realized gains | | | — | | | | — | | | | — | | | | — | | | | (0.23 | ) | |
Total distributions to shareholders | | | (0.34 | ) | | | (0.31 | ) | | | (0.39 | ) | | | (0.25 | ) | | | (0.43 | ) | |
Proceeds from regulatory settlements | | | — | | | | — | | | | — | | | | 0.00 | (a) | | | — | | |
Net asset value, end of period | | $ | 15.40 | | | $ | 14.72 | | | $ | 15.28 | | | $ | 12.70 | | | $ | 9.77 | | |
Total return | | | 7.10 | % | | | (1.53 | %) | | | 23.83 | % | | | 32.86 | % | | | (31.14 | %) | |
Ratios to average net assets(b)(c) | |
Total gross expenses | | | 2.13 | % | | | 2.04 | % | | | 2.06 | %(d) | | | 1.99 | % | | | 1.99 | %(d) | |
Total net expenses(e) | | | 1.89 | %(f) | | | 1.88 | %(f) | | | 1.90 | %(d)(f) | | | 1.95 | %(f) | | | 1.96 | %(d)(f) | |
Net investment income | | | 2.07 | % | | | 2.04 | % | | | 2.61 | % | | | 2.10 | % | | | 1.53 | % | |
Supplemental data | |
Net assets, end of period (in thousands) | | $ | 1,335 | | | $ | 3,102 | | | $ | 12,089 | | | $ | 24,126 | | | $ | 31,792 | | |
Portfolio turnover | | | 71 | % | | | 66 | % | | | 118 | % | | | 117 | % | | | 92 | % | |
Notes to Financial Highlights
(a) Rounds to zero.
(b) In addition to the fees and expenses which the Fund bears directly, the Fund indirectly bears a pro rata share of the fees and expenses of the acquired funds in which it invests. Such indirect expenses are not included in the reported expense ratios.
(c) Certain line items from prior years have been reclassified to conform to the current presentation.
(d) Ratios include line of credit interest expense which rounds to less than 0.01%.
(e) Total net expenses include the impact of certain waivers/reimbursements made by the Investment Manager and certain of its affiliates, if applicable.
(f) The benefits derived from expense reductions had an impact of less than 0.01%.
The accompanying Notes to Financial Statements are an integral part of this statement.
Annual Report 2013
22
Columbia Convertible Securities Fund
Financial Highlights (continued)
| | | Year Ended
February 28, | | Year Ended
February 29, | | Year Ended February 28, | |
Class C | | 2013 | | 2012 | | 2011 | | 2010 | | 2009 | |
Per share data | |
Net asset value, beginning of period | | $ | 14.95 | | | $ | 15.51 | | | $ | 12.88 | | | $ | 9.91 | | | $ | 14.86 | | |
Income from investment operations: | |
Net investment income | | | 0.30 | | | | 0.31 | | | | 0.35 | | | | 0.25 | | | | 0.20 | | |
Net realized and unrealized gain (loss) | | | 0.72 | | | | (0.56 | ) | | | 2.67 | | | | 2.97 | | | | (4.72 | ) | |
Total from investment operations | | | 1.02 | | | | (0.25 | ) | | | 3.02 | | | | 3.22 | | | | (4.52 | ) | |
Less distributions to shareholders: | |
Net investment income | | | (0.34 | ) | | | (0.31 | ) | | | (0.39 | ) | | | (0.25 | ) | | | (0.20 | ) | |
Net realized gains | | | — | | | | — | | | | — | | | | — | | | | (0.23 | ) | |
Total distributions to shareholders | | | (0.34 | ) | | | (0.31 | ) | | | (0.39 | ) | | | (0.25 | ) | | | (0.43 | ) | |
Proceeds from regulatory settlements | | | — | | | | — | | | | — | | | | 0.00 | (a) | | | — | | |
Net asset value, end of period | | $ | 15.63 | | | $ | 14.95 | | | $ | 15.51 | | | $ | 12.88 | | | $ | 9.91 | | |
Total return | | | 6.99 | % | | | (1.51 | %) | | | 23.88 | % | | | 32.80 | % | | | (31.13 | %) | |
Ratios to average net assets(b)(c) | |
Total gross expenses | | | 2.14 | % | | | 2.02 | % | | | 2.06 | %(d) | | | 1.99 | % | | | 1.99 | %(d) | |
Total net expenses(e) | | | 1.90 | %(f) | | | 1.87 | %(f) | | | 1.90 | %(d)(f) | | | 1.95 | %(f) | | | 1.96 | %(d)(f) | |
Net investment income | | | 2.05 | % | | | 2.10 | % | | | 2.53 | % | | | 2.12 | % | | | 1.54 | % | |
Supplemental data | |
Net assets, end of period (in thousands) | | $ | 17,617 | | | $ | 20,127 | | | $ | 21,717 | | | $ | 20,103 | | | $ | 18,239 | | |
Portfolio turnover | | | 71 | % | | | 66 | % | | | 118 | % | | | 117 | % | | | 92 | % | |
Notes to Financial Highlights
(a) Rounds to zero.
(b) In addition to the fees and expenses which the Fund bears directly, the Fund indirectly bears a pro rata share of the fees and expenses of the acquired funds in which it invests. Such indirect expenses are not included in the reported expense ratios.
(c) Certain line items from prior years have been reclassified to conform to the current presentation.
(d) Ratios include line of credit interest expense which rounds to less than 0.01%.
(e) Total net expenses include the impact of certain waivers/reimbursements made by the Investment Manager and certain of its affiliates, if applicable.
(f) The benefits derived from expense reductions had an impact of less than 0.01%.
The accompanying Notes to Financial Statements are an integral part of this statement.
Annual Report 2013
23
Columbia Convertible Securities Fund
Financial Highlights (continued)
Class I | | Year Ended
February 28,
2013 | | Year Ended
February 29,
2012 | | Year Ended
February 28,
2011(a) | |
Per share data | |
Net asset value, beginning of period | | $ | 15.02 | | | $ | 15.58 | | | $ | 13.69 | | |
Income from investment operations: | |
Net investment income | | | 0.48 | | | | 0.47 | | | | 0.17 | | |
Net realized and unrealized gain (loss) | | | 0.72 | | | | (0.57 | ) | | | 1.86 | | |
Total from investment operations | | | 1.20 | | | | (0.10 | ) | | | 2.03 | | |
Less distributions to shareholders: | |
Net investment income | | | (0.50 | ) | | | (0.46 | ) | | | (0.14 | ) | |
Total distributions to shareholders | | | (0.50 | ) | | | (0.46 | ) | | | (0.14 | ) | |
Net asset value, end of period | | $ | 15.72 | | | $ | 15.02 | | | $ | 15.58 | | |
Total return | | | 8.29 | % | | | (0.43 | %) | | | 14.92 | % | |
Ratios to average net assets(b) | |
Total gross expenses | | | 0.89 | % | | | 0.84 | % | | | 0.90 | %(c) | |
Total net expenses(d) | | | 0.74 | % | | | 0.77 | % | | | 0.86 | %(c)(e) | |
Net investment income | | | 3.21 | % | | | 3.28 | % | | | 2.63 | %(c) | |
Supplemental data | |
Net assets, end of period (in thousands) | | $ | 180,374 | | | $ | 186,160 | | | $ | 82,875 | | |
Portfolio turnover | | | 71 | % | | | 66 | % | | | 118 | % | |
Notes to Financial Highlights
(a) For the period from September 27, 2010 (commencement of operations) to February 28, 2011.
(b) In addition to the fees and expenses which the Fund bears directly, the Fund indirectly bears a pro rata share of the fees and expenses of the acquired funds in which it invests. Such indirect expenses are not included in the reported expense ratios.
(c) Annualized.
(d) Total net expenses include the impact of certain waivers/reimbursements made by the Investment Manager and certain of its affiliates, if applicable.
(e) The benefits derived from expense reductions had an impact of less than 0.01%.
The accompanying Notes to Financial Statements are an integral part of this statement.
Annual Report 2013
24
Columbia Convertible Securities Fund
Financial Highlights (continued)
Class R | | Year Ended
February 28,
2013 | | Year Ended
February 29,
2012(a) | |
Per share data | |
Net asset value, beginning of period | | $ | 14.99 | | | $ | 13.80 | | |
Income from investment operations: | |
Net investment income | | | 0.38 | | | | 0.11 | | |
Net realized and unrealized gain | | | 0.72 | | | | 1.20 | (b) | |
Total from investment operations | | | 1.10 | | | | 1.31 | | |
Less distributions to shareholders: | |
Net investment income | | | (0.42 | ) | | | (0.12 | ) | |
Total distributions to shareholders | | | (0.42 | ) | | | (0.12 | ) | |
Net asset value, end of period | | $ | 15.67 | | | $ | 14.99 | | |
Total return | | | 7.55 | % | | | 9.57 | % | |
Ratios to average net assets(c) | |
Total gross expenses | | | 1.64 | % | | | 1.28 | %(d) | |
Total net expenses(e) | | | 1.40 | %(f) | | | 1.20 | %(d) | |
Net investment income | | | 2.56 | % | | | 2.64 | %(d) | |
Supplemental data | |
Net assets, end of period (in thousands) | | $ | 1,894 | | | $ | 2,068 | | |
Portfolio turnover | | | 71 | % | | | 66 | % | |
Notes to Financial Highlights
(a) For the period from November 16, 2011 (commencement of operations) to February 29, 2012.
(b) Calculation of the net gain (loss) per share (both realized and unrealized) does not correlate to the aggregate realized and unrealized gain (loss) presented in the Statement of Operations due to the timing of sales and repurchases of Fund shares in relation to fluctuations in the market value of the portfolio.
(c) In addition to the fees and expenses which the Fund bears directly, the Fund indirectly bears a pro rata share of the fees and expenses of the acquired funds in which it invests. Such indirect expenses are not included in the reported expense ratios.
(d) Annualized.
(e) Total net expenses include the impact of certain waivers/reimbursements made by the Investment Manager and certain of its affiliates, if applicable.
(f) The benefits derived from expense reductions had an impact of less than 0.01%.
The accompanying Notes to Financial Statements are an integral part of this statement.
Annual Report 2013
25
Columbia Convertible Securities Fund
Financial Highlights (continued)
Class R4 | | Year Ended
February 28,
2013(a) | |
Per share data | |
Net asset value, beginning of period | | $ | 14.75 | | |
Income from investment operations: | |
Net investment income | | | 0.14 | | |
Net realized and unrealized gain | | | 1.04 | | |
Total from investment operations | | | 1.18 | | |
Less distributions to shareholders: | |
Net investment income | | | (0.13 | ) | |
Total distributions to shareholders | | | (0.13 | ) | |
Net asset value, end of period | | $ | 15.80 | | |
Total return | | | 8.05 | % | |
Ratios to average net assets(b) | |
Total gross expenses | | | 1.24 | %(c) | |
Total net expenses(d) | | | 0.92 | %(c) | |
Net investment income | | | 2.96 | %(c) | |
Supplemental data | |
Net assets, end of period (in thousands) | | $ | 3 | | |
Portfolio turnover | | | 71 | % | |
Notes to Financial Highlights
(a) For the period from November 8, 2012 (commencement of operations) to February 28, 2013.
(b) In addition to the fees and expenses which the Fund bears directly, the Fund indirectly bears a pro rata share of the fees and expenses of the acquired funds in which it invests. Such indirect expenses are not included in the reported expense ratios.
(c) Annualized.
(d) Total net expenses include the impact of certain waivers/reimbursements made by the Investment Manager and certain of its affiliates, if applicable.
The accompanying Notes to Financial Statements are an integral part of this statement.
Annual Report 2013
26
Columbia Convertible Securities Fund
Financial Highlights (continued)
Class R5 | | Year Ended
February 28,
2013(a) | |
Per share data | |
Net asset value, beginning of period | | $ | 14.75 | | |
Income from investment operations: | |
Net investment income | | | 0.14 | | |
Net realized and unrealized gain | | | 1.04 | | |
Total from investment operations | | | 1.18 | | |
Less distributions to shareholders: | |
Net investment income | | | (0.13 | ) | |
Total distributions to shareholders | | | (0.13 | ) | |
Net asset value, end of period | | $ | 15.80 | | |
Total return | | | 8.08 | % | |
Ratios to average net assets(b) | |
Total gross expenses | | | 1.01 | %(c) | |
Total net expenses(d) | | | 0.79 | %(c) | |
Net investment income | | | 3.09 | %(c) | |
Supplemental data | |
Net assets, end of period (in thousands) | | $ | 3 | | |
Portfolio turnover | | | 71 | % | |
Notes to Financial Highlights
(a) For the period from November 8, 2012 (commencement of operations) to February 28, 2013.
(b) In addition to the fees and expenses which the Fund bears directly, the Fund indirectly bears a pro rata share of the fees and expenses of the acquired funds in which it invests. Such indirect expenses are not included in the reported expense ratios.
(c) Annualized.
(d) Total net expenses include the impact of certain waivers/reimbursements made by the Investment Manager and certain of its affiliates, if applicable.
The accompanying Notes to Financial Statements are an integral part of this statement.
Annual Report 2013
27
Columbia Convertible Securities Fund
Financial Highlights (continued)
Class W | | Year Ended
February 28,
2013 | | Year Ended
February 29,
2012(a) | |
Per share data | |
Net asset value, beginning of period | | $ | 14.98 | | | $ | 13.80 | | |
Income from investment operations: | |
Net investment income | | | 0.42 | | | | 0.14 | | |
Net realized and unrealized gain | | | 0.72 | | | | 1.17 | (b) | |
Total from investment operations | | | 1.14 | | | | 1.31 | | |
Less distributions to shareholders: | |
Net investment income | | | (0.46 | ) | | | (0.13 | ) | |
Total distributions to shareholders | | | (0.46 | ) | | | (0.13 | ) | |
Net asset value, end of period | | $ | 15.66 | | | $ | 14.98 | | |
Total return | | | 7.87 | % | | | 9.56 | % | |
Ratios to average net assets(c) | |
Total gross expenses | | | 1.39 | % | | | 0.85 | %(d) | |
Total net expenses(e) | | | 1.15 | %(f) | | | 0.77 | %(d) | |
Net investment income | | | 2.83 | % | | | 3.44 | %(d) | |
Supplemental data | |
Net assets, end of period (in thousands) | | $ | 26,640 | | | $ | 28,830 | | |
Portfolio turnover | | | 71 | % | | | 66 | % | |
Notes to Financial Highlights
(a) For the period from November 16, 2011 (commencement of operations) to February 29, 2012.
(b) Calculation of the net gain (loss) per share (both realized and unrealized) does not correlate to the aggregate realized and unrealized gain (loss) presented in the Statement of Operations due to the timing of sales and repurchases of Fund shares in relation to fluctuations in the market value of the portfolio.
(c) In addition to the fees and expenses which the Fund bears directly, the Fund indirectly bears a pro rata share of the fees and expenses of the acquired funds in which it invests. Such indirect expenses are not included in the reported expense ratios.
(d) Annualized.
(e) Total net expenses include the impact of certain waivers/reimbursements made by the Investment Manager and certain of its affiliates, if applicable.
(f) The benefits derived from expense reductions had an impact of less than 0.01%.
The accompanying Notes to Financial Statements are an integral part of this statement.
Annual Report 2013
28
Columbia Convertible Securities Fund
Financial Highlights (continued)
| | | Year Ended
February 28, | | Year Ended
February 29, | | Year Ended February 28, | |
Class Z | | 2013 | | 2012 | | 2011 | | 2010 | | 2009 | |
Per share data | |
Net asset value, beginning of period | | $ | 15.01 | | | $ | 15.58 | | | $ | 12.93 | | | $ | 9.94 | | | $ | 14.91 | | |
Income from investment operations: | |
Net investment income | | | 0.45 | | | | 0.45 | | | | 0.49 | | | | 0.37 | | | | 0.33 | | |
Net realized and unrealized gain (loss) | | | 0.73 | | | | (0.57 | ) | | | 2.68 | | | | 2.99 | | | | (4.73 | ) | |
Total from investment operations | | | 1.18 | | | | (0.12 | ) | | | 3.17 | | | | 3.36 | | | | (4.40 | ) | |
Less distributions to shareholders: | |
Net investment income | | | (0.49 | ) | | | (0.45 | ) | | | (0.52 | ) | | | (0.37 | ) | | | (0.34 | ) | |
Net realized gains | | | — | | | | — | | | | — | | | | — | | | | (0.23 | ) | |
Total distributions to shareholders | | | (0.49 | ) | | | (0.45 | ) | | | (0.52 | ) | | | (0.37 | ) | | | (0.57 | ) | |
Proceeds from regulatory settlements | | | — | | | | — | | | | — | | | | 0.00 | (a) | | | — | | |
Net asset value, end of period | | $ | 15.70 | | | $ | 15.01 | | | $ | 15.58 | | | $ | 12.93 | | | $ | 9.94 | | |
Total return | | | 8.10 | % | | | (0.56 | %) | | | 25.17 | % | | | 34.20 | % | | | (30.43 | %) | |
Ratios to average net assets(b)(c) | |
Total gross expenses | | | 1.14 | % | | | 1.02 | % | | | 1.06 | %(d) | | | 0.99 | % | | | 0.99 | %(d) | |
Total net expenses(e) | | | 0.90 | %(f) | | | 0.87 | %(f) | | | 0.90 | %(d)(f) | | | 0.95 | %(f) | | | 0.96 | %(d)(f) | |
Net investment income | | | 3.06 | % | | | 3.08 | % | | | 3.52 | % | | | 3.12 | % | | | 2.56 | % | |
Supplemental data | |
Net assets, end of period (in thousands) | | $ | 120,906 | | | $ | 130,380 | | | $ | 166,597 | | | $ | 198,457 | | | $ | 190,168 | | |
Portfolio turnover | | | 71 | % | | | 66 | % | | | 118 | % | | | 117 | % | | | 92 | % | |
Notes to Financial Highlights
(a) Rounds to zero.
(b) In addition to the fees and expenses which the Fund bears directly, the Fund indirectly bears a pro rata share of the fees and expenses of the acquired funds in which it invests. Such indirect expenses are not included in the reported expense ratios.
(c) Certain line items from prior years have been reclassified to conform to the current presentation.
(d) Ratios include line of credit interest expense which rounds to less than 0.01%.
(e) Total net expenses include the impact of certain waivers/reimbursements made by the Investment Manager and certain of its affiliates, if applicable.
(f) The benefits derived from expense reductions had an impact of less than 0.01%.
The accompanying Notes to Financial Statements are an integral part of this statement.
Annual Report 2013
29
Columbia Convertible Securities Fund
Notes to Financial Statements
February 28, 2013
Note 1. Organization
Columbia Convertible Securities Fund (the Fund), a series of Columbia Funds Series Trust (the Trust), is a diversified fund. The Trust is registered under the Investment Company Act of 1940, as amended (the 1940 Act), as an open-end management investment company organized as a Delaware statutory trust.
Fund Shares
The Trust may issue an unlimited number of shares (without par value). The Fund offers Class A, Class B, Class C, Class I, Class R, Class R4, Class R5, Class W and Class Z shares. All share classes have identical voting, dividend and liquidation rights. Each share class has its own expense structure and sales charges, as applicable.
Class A shares are subject to a maximum front-end sales charge of 5.75% based on the initial investment amount. Class A shares purchased without an initial sales charge in accounts aggregating $1 million to $50 million at the time of purchase are subject to a contingent deferred sales charge (CDSC) if the shares are sold within 18 months of purchase, charged as follows: 1.00% CDSC if redeemed within 12 months of purchase, and 0.50% CDSC if redeemed more than 12, but less than 18, months after purchase.
Class B shares may be subject to a maximum CDSC of 5.00% based upon the holding period after purchase. Class B shares will generally convert to Class A shares eight years after purchase. The Fund no longer accepts investments by new or existing investors in the Fund's Class B shares, except in connection with the reinvestment of any dividend and/or capital gain distributions in Class B shares of the Fund and exchanges by existing Class B shareholders of certain other funds within the Columbia Family of Funds.
Class C shares are subject to a 1.00% CDSC on shares redeemed within one year of purchase.
Class I shares are not subject to sales charges and are only available to the Columbia Family of Funds.
Class R shares are not subject to sales charges and are only available to qualifying institutional investors.
Class R4 shares are not subject to sales charges and are only available to investors purchasing through authorized investment professionals. Class R4 shares commenced operations on November 8, 2012.
Class R5 shares are not subject to sales charges and are only available to investors purchasing through authorized investment professionals. Class R5 shares commenced operations on November 8, 2012.
Class W shares are not subject to sales charges and are only available to investors purchasing through authorized
investment programs managed by investment professionals, including discretionary managed account programs.
Class Z shares are not subject to sales charges, and are only available to certain investors.
Note 2. Summary of Significant Accounting Policies
Use of Estimates
The preparation of financial statements in accordance with U.S. generally accepted accounting principles (GAAP) requires management to make certain estimates and assumptions that affect the reported amounts of assets and liabilities, the disclosure of contingent assets and liabilities at the date of the financial statements and the reported amounts of revenue and expenses during the reporting period. Actual results could differ from those estimates.
The following is a summary of significant accounting policies consistently followed by the Fund in the preparation of its financial statements.
Security Valuation
Debt securities generally are valued by pricing services approved by the Board of Trustees (the Board) based upon market transactions for normal, institutional-size trading units of similar securities. The services may use various pricing techniques which take into account appropriate factors such as yield, quality, coupon rate, maturity, type of issue, trading characteristics and other data, as well as broker quotes. Debt securities for which quotations are readily available may also be valued based upon an over-the-counter or exchange bid quotation.
All equity securities are valued at the close of business of the New York Stock Exchange (NYSE). Equity securities are valued at the last quoted sales price on the principal exchange or market on which they trade, except for securities traded on the NASDAQ Stock Market, which are valued at the NASDAQ official close price. Unlisted securities or listed securities for which there were no sales during the day are valued at the mean of the latest quoted bid and ask prices on such exchanges or markets.
Foreign securities are valued based on quotations from the principal market in which such securities are normally traded. If any foreign share prices are not readily available as a result of limited share activity the securities are valued at the mean of the latest quoted bid and ask prices on such exchanges or markets. Foreign currency exchange rates are generally determined at 4:00 p.m. Eastern (U.S.) time. However, many securities markets and exchanges outside the U.S. close prior to the close of the NYSE; therefore, the closing prices for securities in such markets or on such exchanges may not fully reflect events that occur after such close but before the close
Annual Report 2013
30
Columbia Convertible Securities Fund
Notes to Financial Statements (continued)
February 28, 2013
of the NYSE. In those situations, foreign securities will be fair valued pursuant to the policy adopted by the Board, including utilizing a third party pricing service to determine these fair values. The third party pricing service takes into account multiple factors, including, but not limited to, movements in the U.S. securities markets, certain depositary receipts, futures contracts and foreign exchange rates that have occurred subsequent to the close of the foreign exchange or market, to determine a good faith estimate that reasonably reflects the current market conditions as of the close of the NYSE. The fair value of a security is likely to be different from the quoted or published price, if available.
Investments in other open-end investment companies, including money market funds, are valued at net asset value.
Investments for which market quotations are not readily available, or that have quotations which management believes are not reliable, are valued at fair value as determined in good faith under consistently applied procedures established by and under the general supervision of the Board. If a security or class of securities (such as foreign securities) is valued at fair value, such value is likely to be different from the last quoted market price for the security.
The determination of fair value often requires significant judgment. To determine fair value, management may use assumptions including but not limited to future cash flows and estimated risk premiums. Multiple inputs from various sources may be used to determine fair value.
Foreign Currency Transactions and Translations
The values of all assets and liabilities denominated in foreign currencies are translated into U.S. dollars at that day's exchange rates. Net realized and unrealized gains (losses) on foreign currency transactions and translations include gains (losses) arising from the fluctuation in exchange rates between trade and settlement dates on securities transactions, gains (losses) arising from the disposition of foreign currency and currency gains (losses) between the accrual and payment dates on dividends, interest income and foreign withholding taxes.
For financial statement purposes, the Fund does not distinguish that portion of gains (losses) on investments which is due to changes in foreign exchange rates from that which is due to changes in market prices of the investments. Such fluctuations are included with the net realized and unrealized gains (losses) on investments in the Statement of Operations.
Delayed Delivery Securities
The Fund may trade securities on other than normal settlement terms, including securities purchased or sold on a "when-issued" basis. This may increase the risk if the other party to the transaction fails to deliver and causes the Fund to
subsequently invest at less advantageous prices. The Fund designates cash or liquid securities in an amount equal to the delayed delivery commitment.
Equity-Linked Notes
The Fund may invest in equity-linked notes (ELNs). An ELN is a debt instrument whose value is based on the value of a single equity security, basket of equity securities or an index of equity securities (each, an Underlying Equity). An ELN typically provides interest income, thereby offering a yield advantage over investing directly in an Underlying Equity. However, the holder of an ELN may have limited or no benefit from any appreciation in the Underlying Equity, but is exposed to various risks, including, without limitation, volatility, issuer and market risk. The Fund may purchase ELNs that trade on a securities exchange or those that trade on the over-the-counter markets, including securities offered and sold under Rule 144A of the Securities Act of 1933, as amended. The Fund may also purchase an ELN in a privately negotiated transaction with the issuer of the ELN (or its broker-dealer affiliate).
Security Transactions
Security transactions are accounted for on the trade date. Cost is determined and gains (losses) are based upon the specific identification method for both financial statement and federal income tax purposes.
Income Recognition
Interest income is recorded on an accrual basis. Market premiums and discounts, including original issue discounts, are amortized and accreted, respectively, over the expected life of the security on all debt securities, unless otherwise noted. For convertible securities, premiums attributable to the conversion feature are not amortized.
Corporate actions and dividend income are recorded net of any non-reclaimable tax withholdings, on the ex-dividend date or upon receipt of ex-dividend notification in the case of certain foreign securities.
The Fund may receive distributions from holdings in business development companies (BDCs), exchange traded funds (ETFs) and real estate investment trusts (REITs), which report information on the character of their distributions annually. These distributions are allocated to dividend income, capital gain and return of capital based on estimates made by the Fund's management if actual information has not yet been reported. Return of capital is recorded as a reduction of the cost basis of securities held. If the Fund no longer owns the applicable securities, return of capital is recorded as a realized gain. Management's estimates are subsequently adjusted when the actual character of the distributions is disclosed by the
Annual Report 2013
31
Columbia Convertible Securities Fund
Notes to Financial Statements (continued)
February 28, 2013
BDCs, ETFs and REITs, which could result in a proportionate change in return of capital to shareholders.
Awards from class action litigation are recorded as a reduction of cost basis if the Fund still owns the applicable securities on the payment date. If the Fund no longer owns the applicable securities, the proceeds are recorded as realized gains.
Expenses
General expenses of the Trust are allocated to the Fund and other funds of the Trust based upon relative net assets or other expense allocation methodologies determined by the nature of the expense. Expenses directly attributable to the Fund are charged to the Fund. Expenses directly attributable to a specific class of shares are charged to that share class.
Determination of Class Net Asset Value
All income, expenses (other than class-specific expenses, which are charged to that share class, as shown in the Statement of Operations) and realized and unrealized gains (losses) are allocated to each class of the Fund on a daily basis, based on the relative net assets of each class, for purposes of determining the net asset value of each class.
Federal Income Tax Status
The Fund intends to qualify each year as a regulated investment company under Subchapter M of the Internal Revenue Code, as amended, and will distribute substantially all of its taxable income (including net short-term capital gains), if any, for its tax year, and as such will not be subject to federal income taxes. In addition, the Fund intends to distribute in each calendar year substantially all of its net investment income, capital gains and certain other amounts, if any, such that the Fund should not be subject to federal excise tax. Therefore, no federal income or excise tax provision is recorded.
Foreign Taxes
The Fund may be subject to foreign taxes on income, gains on investments or currency repatriation, a portion of which may be recoverable. The Fund will accrue such taxes and recoveries, as applicable, based upon its current interpretation of tax rules and regulations that exist in the markets in which it invests.
Realized gains in certain countries may be subject to foreign taxes at the Fund level, based on statutory rates. The Fund accrues for such foreign taxes on net realized and unrealized gains at the appropriate rate for each jurisdiction, as applicable. The amount, if any, is disclosed as a liability on the Statement of Assets and Liabilities.
Distributions to Shareholders
Distributions from net investment income, if any, are declared and paid each calendar quarter. Net realized capital gains, if any, are distributed at least annually. Income distributions and capital gain distributions are determined in accordance with federal income tax regulations, which may differ from GAAP.
Guarantees and Indemnifications
Under the Trust's organizational documents and, in some cases, by contract, its officers and trustees are indemnified against certain liabilities arising out of the performance of their duties to the Trust or its funds. In addition, certain of the Fund's contracts with its service providers contain general indemnification clauses. The Fund's maximum exposure under these arrangements is unknown since the amount of any future claims that may be made against the Fund cannot be determined, and the Fund has no historical basis for predicting the likelihood of any such claims.
Recent Accounting Pronouncement
Disclosures about Offsetting Assets and Liabilities
In December 2011, the Financial Accounting Standards Board (FASB) issued Accounting Standards Update (ASU) No. 2011-11, Disclosures about Offsetting Assets and Liabilities. The objective of the FASB is to enhance current disclosure requirements on offsetting of certain assets and liabilities and to enable financial statement users to compare financial statements prepared under GAAP and International Financial Reporting Standards.
Specifically, ASU No. 2011-11 requires an entity to disclose both gross and net information for derivatives and other financial instruments that are subject to a master netting arrangement or similar agreement. The standard requires disclosure of collateral received in connection with the master netting agreements or similar agreements. The effective date of ASU No. 2011-11 is for interim and annual periods beginning on or after January 1, 2013. At this time, management is evaluating the implications of this guidance and the impact it will have on the financial statement amounts and footnote disclosures, if any.
Note 3. Fees and Compensation Paid to Affiliates
Investment Management Fees
Under an Investment Management Services Agreement, Columbia Management Investment Advisers, LLC (the Investment Manager), a wholly-owned subsidiary of Ameriprise Financial, Inc. (Ameriprise Financial), determines which securities will be purchased, held or sold. The investment management fee is an annual fee that is equal to a
Annual Report 2013
32
Columbia Convertible Securities Fund
Notes to Financial Statements (continued)
February 28, 2013
percentage of the Fund's average daily net assets that declines from 0.76% to 0.62% as the Fund's net assets increase. The effective investment management fee rate for the year ended February 28, 2013 was 0.76% of the Fund's average daily net assets.
Administration Fees
Under an Administrative Services Agreement, the Investment Manager also serves as the Fund Administrator. The Fund pays the Fund Administrator an annual fee for administration and accounting services equal to a percentage of the Fund's average daily net assets that declines from 0.06% to 0.05% as the Fund's net assets increase. The effective administration fee rate for the year ended February 28, 2013 was 0.06% of the Fund's average daily net assets.
Other Expenses
Other expenses are for, among other things, certain expenses of the Fund or the Board, including: Fund boardroom and office expense, employee compensation, employee health and retirement benefits, and certain other expenses. Payment of these Fund and Board expenses is facilitated by a company providing limited administrative services to the Fund and the Board. For the year ended February 28, 2013, other expenses paid to this company were $2,524.
Compensation of Board Members
Board members are compensated for their services to the Fund as disclosed in the Statement of Operations. Under a Deferred Compensation Plan (the Plan), the Board members who are not "interested persons" of the Fund, as defined under the 1940 Act, may elect to defer payment of up to 100% of their compensation. Deferred amounts are treated as though equivalent dollar amounts had been invested in shares of certain funds managed by the Investment Manager. The Fund's liability for these amounts is adjusted for market value changes and remains in the Fund until distributed in accordance with the Plan.
Transfer Agent Fees
Under a Transfer and Dividend Disbursing Agent Agreement, Columbia Management Investment Services Corp. (the Transfer Agent), an affiliate of the Investment Manager and a wholly-owned subsidiary of Ameriprise Financial, is responsible for providing transfer agency services to the Fund. The Transfer Agent has contracted with Boston Financial Data Services (BFDS) to serve as sub-transfer agent.
The Transfer Agent receives monthly account-based service fees based on the number of open accounts and is reimbursed by the Fund for the fees and expenses the Transfer Agent pays to financial intermediaries that maintain omnibus accounts with the Fund that is a percentage of the average aggregate
value of the Fund's shares maintained in each such omnibus account (other than omnibus accounts for which American Enterprise Investment Services Inc. is the broker of record or accounts where the beneficial shareholder is a customer of Ameriprise Financial Services, Inc., which are paid a per account fee). The Transfer Agent pays the fees of BFDS for services as sub-transfer agent and is not entitled to reimbursement for such fees from the Fund (with the exception of out-of-pocket fees).
The Transfer Agent also receives compensation from fees for various shareholder services and reimbursements for certain out-of-pocket fees. Class I shares do not pay transfer agent fees. Total transfer agent fees for Class R5 shares are subject to an annual limitation of not more than 0.05% of the average daily net assets attributable to Class R5 shares.
For the year ended February 28, 2013, the Fund's effective transfer agent fee rates as a percentage of average daily net assets of each class were as follows:
Class A | | | 0.26 | % | |
Class B | | | 0.25 | | |
Class C | | | 0.26 | | |
Class R | | | 0.26 | | |
Class R4* | | | 0.28 | | |
Class R5* | | | 0.05 | | |
Class W | | | 0.26 | | |
Class Z | | | 0.26 | | |
*Annualized.
An annual minimum account balance fee of $20 may apply to certain accounts with a value below the Fund's initial minimum investment requirements to reduce the impact of small accounts on transfer agent fees. These minimum account balance fees are recorded as part of expense reductions in the Statement of Operations. For the year ended February 28, 2013, these minimum account balance fees reduced total expenses by $1,854.
Distribution and Service Fees
The Fund has an agreement with Columbia Management Investment Distributors, Inc. (the Distributor), an affiliate of the Investment Manager and a wholly-owned subsidiary of Ameriprise Financial, for distribution and shareholder services. Pursuant to Rule 12b-1 under the 1940 Act, the Board has approved, and the Fund has adopted, distribution and shareholder service plans (the Plans) which set the distribution and service fees for the Fund. These fees are calculated daily and are intended to compensate the Distributor and/or eligible selling and/or servicing agents for selling shares of the Fund and providing services to investors.
Annual Report 2013
33
Columbia Convertible Securities Fund
Notes to Financial Statements (continued)
February 28, 2013
The Plans require the payment of a monthly combined distribution and service fee to the Distributor at the maximum annual rate of 0.25% of the average daily net assets attributable to Class A shares of the Fund. The Plans also require the payment of a monthly service fee at the maximum annual rate of 0.25% of the average daily net assets attributable to Class B, Class C and Class W shares of the Fund and the payment of a monthly distribution fee at the maximum annual rate of 0.75%, 0.75%, 0.50% and 0.25% of the average daily net assets attributable to Class B, Class C, Class R and Class W shares, respectively.
The Fund may pay a distribution fee up to 0.25% of the Fund's average daily net assets attributable to Class W shares and a service fee of up to 0.25% of the Fund's average daily net assets attributable to Class W shares, provided, however, that the aggregate fee shall not exceed 0.25% of the Fund's average daily net assets attributable to Class W shares.
Sales Charges
Sales charges, including front-end charges and CDSCs, received by the Distributor for distributing Fund shares were $54,569 for Class A, $1,269 for Class B and $4,011 for Class C shares for the year ended February 28, 2013.
Expenses Waived/Reimbursed by the Investment Manager and its Affiliates
Effective July 1, 2012, the Investment Manager and certain of its affiliates have contractually agreed to waive fees and/or reimburse expenses (excluding certain fees and expenses described below), through June 30, 2013, unless sooner terminated at the sole discretion of the Board, so that the Fund's net operating expenses, after giving effect to fees waived/expenses reimbursed and any balance credits and/or overdraft charges from the Fund's custodian, do not exceed the following annual rates as a percentage of the class' average daily net assets:
Class A | | | 1.17 | % | |
Class B | | | 1.92 | | |
Class C | | | 1.92 | | |
Class I | | | 0.74 | | |
Class R | | | 1.42 | | |
Class R4* | | | 0.92 | | |
Class R5* | | | 0.79 | | |
Class W | | | 1.17 | | |
Class Z | | | 0.92 | | |
*Annual rate is contractual from November 8, 2012 (the commencement of operations of each share class) through November 8, 2013.
Prior to July 1, 2012, the Investment Manager and certain of its affiliates contractually agreed to waive fees and/or reimburse expenses (excluding certain fees and expenses described below), so that the Fund's net operating expenses, after giving effect to fees waived/expenses reimbursed and any balance credits and/or overdraft charges from the Fund's custodian, did not exceed the following annual rates as a percentage of the class' average daily net assets:
Class A | | | 1.11 | % | |
Class B | | | 1.86 | | |
Class C | | | 1.86 | | |
Class I | | | 0.75 | | |
Class R | | | 1.36 | | |
Class W | | | 1.11 | | |
Class Z | | | 0.86 | | |
Under the agreement governing these fee waivers and/or expense reimbursement arrangements, the following fees and expenses are excluded from the waiver/reimbursement commitment, and therefore will be paid by the Fund, if applicable: taxes (including foreign transaction taxes), expenses associated with investments in affiliated and non-affiliated pooled investment vehicles (including mutual funds and exchange traded funds), transaction costs and brokerage commissions, costs related to any securities lending program, dividend expenses associated with securities sold short, inverse floater program fees and expenses, transaction charges and interest on borrowed money, interest, extraordinary expenses and any other expenses the exclusion of which is specifically approved by the Board. This agreement may be modified or amended only with approval from all parties.
Note 4. Federal Tax Information
The timing and character of income and capital gain distributions are determined in accordance with income tax regulations, which may differ from GAAP because of temporary or permanent book to tax differences.
At February 28, 2013, these differences are primarily due to differing treatment for capital loss carryforwards, principal and/or interest of fixed income securities, deferral/reversal of wash sales losses, Trustees' deferred compensation, foreign currency transactions, post-October capital losses and adjustments on certain convertible preferred securities. To the extent these differences are permanent, reclassifications are made among the components of the Fund's net assets in the Statement of Assets and Liabilities. Temporary differences do
Annual Report 2013
34
Columbia Convertible Securities Fund
Notes to Financial Statements (continued)
February 28, 2013
not require reclassifications. In the Statement of Assets and Liabilities the following reclassifications were made:
Undistributed net investment income | | $ | 675,515 | | |
Accumulated net realized gain | | | (675,515 | ) | |
Net investment income and net realized gains (losses), as disclosed in the Statement of Operations, and net assets were not affected by this reclassification.
The tax character of distributions paid during the years indicated was as follows:
Year Ended | | February 28,
2013 | | February 29,
2012 | |
Ordinary income | | $ | 17,051,066 | | | $ | 15,245,198 | | |
Short-term capital gain distributions, if any, are considered ordinary income distributions for tax purposes.
At February 28, 2013, the components of distributable earnings on a tax basis were as follows:
Undistributed ordinary income | | $ | 2,910,320 | | |
Accumulated realized loss | | | (46,078,769 | ) | |
Unrealized appreciation | | | 27,765,672 | | |
At February 28, 2013, the cost of investments for federal income tax purposes was $530,977,608 and the aggregate gross unrealized appreciation and depreciation based on that cost was:
Unrealized appreciation | | $ | 50,572,261 | | |
Unrealized depreciation | | | (22,806,589 | ) | |
Net unrealized appreciation | | | 27,765,672 | | |
The following capital loss carryforward, determined at February 28, 2013, may be available to reduce taxable income arising from future net realized gains on investments, if any, to the extent permitted by the Internal Revenue Code:
Year of Expiration | | Amount | |
2017 | | $ | 6,555,090 | | |
2018 | | | 39,523,679 | | |
Total | | $ | 46,078,769 | | |
For the year ended February 28, 2013, $9,232,349 of capital loss carryforward was utilized.
Management of the Fund has concluded that there are no significant uncertain tax positions that would require recognition in the financial statements. However, management's conclusion may be subject to review and adjustment at a later date based on factors including, but not limited to, new tax laws, regulations, and administrative interpretations (including relevant court decisions). Generally, the Fund's federal tax returns for the prior three fiscal years
remain subject to examination by the Internal Revenue Service.
Note 5. Portfolio Information
The cost of purchases and proceeds from sales of securities, excluding short-term obligations, aggregated to $370,368,360 and $402,754,663, respectively, for the year ended February 28, 2013.
Note 6. Lending of Portfolio Securities
Effective December 19 , 2012, the Fund no longer participates in securities lending activity. Prior to that date, the Fund participated, or was eligible to participate, in securities lending activity pursuant to a Master Securities Lending Agreement (the Agreement) with JPMorgan Chase Bank, N.A. (JPMorgan). The Agreement authorized JPMorgan as lending agent to lend securities to authorized borrowers in order to generate additional income on behalf of the Fund. Pursuant to the Agreement, the securities loaned were secured by cash or securities that either were issued or guaranteed as to principal and interest by the U.S. government, its agencies, authorities or instrumentalities with value equal to at least 100% of the market value of the loaned securities. Any additional collateral required to maintain those levels due to market fluctuations of the loaned securities was requested to be delivered the following business day. Cash collateral received was invested by the lending agent on behalf of the Fund into authorized investments pursuant to the Agreement.
Pursuant to the Agreement, the Fund received income for lending its securities either in the form of fees or by earning interest on invested cash collateral, net of negotiated rebates paid to borrowers and fees paid to the lending agent for services provided and any other securities lending expenses. Net income earned from securities lending for the year ended February 28, 2013 is disclosed in the Statement of Operations. The Fund continued to earn and accrue interest and dividends on the securities loaned.
Note 7. Affiliated Money Market Fund
The Fund invests its daily cash balances in Columbia Short-Term Cash Fund, an affiliated money market fund established for the exclusive use by the Fund and other affiliated funds. The income earned by the Fund from such investments is included as "Dividends — affiliated issuers" in the Statement of Operations. As an investing fund, the Fund indirectly bears its proportionate share of the expenses of Columbia Short-Term Cash Fund.
Annual Report 2013
35
Columbia Convertible Securities Fund
Notes to Financial Statements (continued)
February 28, 2013
Note 8. Shareholder Concentration
At February 28, 2013, one unaffiliated shareholder account owned 34.1% of the outstanding shares of the Fund. The Fund has no knowledge about whether any portion of those shares was owned beneficially by such account. Affiliated shareholder accounts owned 34.8% of the outstanding shares of the Fund. Subscription and redemption activity by concentrated accounts may have a significant effect on the operations of the Fund.
Note 9. Line of Credit
The Fund has entered into a revolving credit facility with a syndicate of banks led by JPMorgan whereby the Fund may borrow for the temporary funding of shareholder redemptions or for other temporary or emergency purposes. The credit facility agreement, as amended, which is a collective agreement between the Fund and certain other funds managed by the Investment Manager, severally and not jointly, permits collective borrowings up to $500 million. Interest is charged to each participating fund based on its borrowings at a rate equal to the higher of (i) the overnight federal funds rate plus 1.00% or (ii) the one-month LIBOR rate plus 1.00%. Each borrowing under the credit facility matures no later than 60 days after the date of borrowing. The Fund also pays a commitment fee equal to its pro rata share of the amount of the credit facility at a rate of 0.08% per annum.
The Fund had no borrowings during the year ended February 28, 2013.
Note 10. Subsequent Events
Management has evaluated the events and transactions that have occurred through the date the financial statements were issued and noted no items requiring adjustment of the financial statements or additional disclosure.
Note 11. Information Regarding Pending and Settled Legal Proceedings
In December 2005, without admitting or denying the allegations, American Express Financial Corporation (AEFC, which is now known as Ameriprise Financial, Inc. (Ameriprise Financial)) entered into settlement agreements with the Securities and Exchange Commission (SEC) and Minnesota Department of Commerce (MDOC) related to market timing activities. As a result, AEFC was censured and ordered to cease and desist from committing or causing any violations of certain provisions of the Investment Advisers Act of 1940, the Investment Company Act of 1940, and various Minnesota laws. AEFC agreed to pay disgorgement of $10 million and civil money penalties of $7 million. AEFC also agreed to retain an independent distribution consultant to assist in developing a plan for distribution of all disgorgement and civil penalties
ordered by the SEC in accordance with various undertakings detailed at www.sec.gov/litigation/admin/ia-2451.pdf. Ameriprise Financial and its affiliates have cooperated with the SEC and the MDOC in these legal proceedings, and have made regular reports to the funds' Boards of Trustees.
Ameriprise Financial and certain of its affiliates have historically been involved in a number of legal, arbitration and regulatory proceedings, including routine litigation, class actions, and governmental actions, concerning matters arising in connection with the conduct of their business activities. Ameriprise Financial believes that the Funds are not currently the subject of, and that neither Ameriprise Financial nor any of its affiliates are the subject of, any pending legal, arbitration or regulatory proceedings that are likely to have a material adverse effect on the Funds or the ability of Ameriprise Financial or its affiliates to perform under their contracts with the Funds. Ameriprise Financial is required to make 10-Q, 10-K and, as necessary, 8-K filings with the Securities and Exchange Commission on legal and regulatory matters that relate to Ameriprise Financial and its affiliates. Copies of these filings may be obtained by accessing the SEC website at www.sec.gov.
There can be no assurance that these matters, or the adverse publicity associated with them, will not result in increased fund redemptions, reduced sale of fund shares or other adverse consequences to the Funds. Further, although we believe proceedings are not likely to have a material adverse effect on the Funds or the ability of Ameriprise Financial or its affiliates to perform under their contracts with the Funds, these proceedings are subject to uncertainties and, as such, we are unable to estimate the possible loss or range of loss that may result. An adverse outcome in one or more of these proceedings could result in adverse judgments, settlements, fines, penalties or other relief that could have a material adverse effect on the consolidated financial condition or results of operations of Ameriprise Financial.
Annual Report 2013
36
Columbia Convertible Securities Fund
Report of Independent Registered Public Accounting Firm
To the Trustees of Columbia Funds Series Trust and
the Shareholders of Columbia Convertible Securities Fund
In our opinion, the accompanying statement of assets and liabilities, including the portfolio of investments, and the related statements of operations and of changes in net assets and the financial highlights present fairly, in all material respects, the financial position of Columbia Convertible Securities Fund (the "Fund") (a series of Columbia Funds Series Trust) at February 28, 2013, the results of its operations for the year then ended, the changes in its net assets for each of the two years in the period then ended and the financial highlights for each of the periods indicated, in conformity with accounting principles generally accepted in the United States of America. These financial statements and financial highlights (hereafter referred to as "financial statements") are the responsibility of the Fund's management. Our responsibility is to express an opinion on these financial statements based on our audits. We conducted our audits of these financial statements in accordance with the standards of the Public Company Accounting Oversight Board (United States). Those standards require that we plan and perform the audit to obtain reasonable assurance about whether the financial statements are free of material misstatement. An audit includes examining, on a test basis, evidence supporting the amounts and disclosures in the financial statements, assessing the accounting principles used and significant estimates made by management, and evaluating the overall financial statement presentation. We believe that our audits, which included confirmation of securities at February 28, 2013 by correspondence with the custodian, transfer agent and brokers, provide a reasonable basis for our opinion.
PricewaterhouseCoopers LLP
Minneapolis, Minnesota
April 19, 2013
Annual Report 2013
37
Columbia Convertible Securities Fund
Federal Income Tax Information
(Unaudited)
The Fund hereby designates the following tax attributes for the fiscal year ended February 28, 2013. Shareholders will be notified in early 2014 of the amounts for use in preparing 2013 income tax returns.
Tax Designations:
| Qualified Dividend Income | | | 22.18 | % | |
| Dividends Received Deduction | | | 19.90 | % | |
Qualified Dividend Income. For taxable, non-corporate shareholders, the percentage of ordinary income dividends paid during the fiscal year that represents qualified dividend income subject to reduced tax rates under the Jobs and Growth Tax Relief Reconciliation Act of 2003.
Dividends Received Deduction. The percentage of ordinary income dividends paid during the fiscal year that qualifies for the corporate dividends received deduction.
Annual Report 2013
38
Columbia Convertible Securities Fund
Shareholders elect the Board that oversees the funds' operations. The Board appoints officers who are responsible for day-to-day business decisions based on policies set by the Board. The following table provides basic biographical information about the funds' Board members, including their principal occupations during the past five years, although specific titles for individuals may have varied over the period. Under current Board policy, members may serve until the next Board meeting after he or she reaches the mandatory retirement age established by the Board, or the fifteenth anniversary of the first Board meeting they attended as a member of the Board.
Mr. Edward J. Boudreau, Jr., Mr. William P. Carmichael, Mr. William A. Hawkins, Mr. R. Glenn Hilliard, Ms. Minor M. Shaw and Dr. Anthony M. Santomero, were members of the Legacy Columbia Nations funds' Board ("Nations Funds"), which includes Columbia Funds Series Trust, Columbia Funds Variable Insurance Trust I and Columbia Funds Master Investment Trust, LLC and began service on the Board for the Legacy RiverSource funds ("RiverSource Funds") effective June 1, 2011.
Independent Trustees
Name,
Address,
Year of Birth | | Position Held With
Funds and Length of
Service | | Principal Occupation
During Past Five Years | | Number of
Funds in the
Fund Family
Overseen by
Board Member | | Other Present or Past
Directorships/Trusteeships
(Within Past 5 Years) | |
Kathleen Blatz
901 S. Marquette Ave.
Minneapolis, MN 55402
1954 | | Board member since 1/06 for RiverSource Funds and since 6/11 for Nations Funds | | Attorney; Chief Justice, Minnesota Supreme Court, 1998-2006 | | | 153 | | | Director, BlueCross BlueShield of Minnesota since 2009 | |
Edward J. Boudreau, Jr.
901 S. Marquette Ave.
Minneapolis, MN 55402
1944 | | Board member since 6/11 for RiverSource Funds and since 1/05 for Nations Funds | | Managing Director, E.J. Boudreau & Associates (consulting) since 2000 | | | 151 | | | Former Trustee, BofA Funds Series Trust (11 funds) | |
Pamela G. Carlton
901 S. Marquette Ave.
Minneapolis, MN 55402
1954 | | Board member since 7/07 for RiverSource Funds and since 6/11 for Nations Funds | | President, Springboard — Partners in Cross Cultural Leadership (consulting company) since 2003 | | | 153 | | | None | |
William P. Carmichael
901 S. Marquette Ave.
Minneapolis, MN 55402
1943 | | Board member since 6/11 for RiverSource Funds and since 1999 for Nations Funds | | Retired | | | 151 | | | Director, Cobra Electronics Corporation (electronic equipment manufacturer); The Finish Line (athletic shoes and apparel) since July 2003; McMoRan Exploration Company (oil and gas exploration and development) since 2010; former Trustee, BofA Funds Series Trust (11 funds); former Director, Spectrum Brands, Inc. (consumer products); former Director, Simmons Company (bedding) | |
Patricia M. Flynn
901 S. Marquette Ave.
Minneapolis, MN 55402
1950 | | Board member since 11/04 for RiverSource Funds and since 6/11 for Nations Funds | | Trustee Professor of Economics and Management, Bentley University since 1976 | | | 153 | | | None | |
William A. Hawkins
901 S. Marquette Ave.
Minneapolis, MN 55402
1942 | | Board member since 6/11 for RiverSource Funds and since 1/05 for Nations Funds | | Managing Director, Overton Partners (financial consulting), since August 2010; President and Chief Executive Officer, California General Bank, N.A., January 2008-August 2010 | | | 151 | | | Trustee, BofA Funds Series Trust (11 funds) | |
Annual Report 2013
39
Columbia Convertible Securities Fund
Trustees and Officers (continued)
Independent Trustees (continued)
Name,
Address,
Year of Birth | | Position Held With
Funds and Length of
Service | | Principal Occupation
During Past Five Years | | Number of
Funds in the
Fund Family
Overseen by
Board Member | | Other Present or Past
Directorships/Trusteeships
(Within Past 5 Years) | |
R. Glenn Hilliard
901 S. Marquette Ave.
Minneapolis, MN 55402
1943 | | Board member since 6/11 for RiverSource Funds and since 1/05 for Nations Funds | | Chairman and Chief Executive Officer, Hilliard Group LLC (investing and consulting), since April 2003; Non-Executive Director & Chairman, CNO Financial Group, Inc. (insurance), September 2003-May 2011 | | | 151 | | | Chairman, BofA Fund Series Trust (11 funds); former Director, CNO Financial Group, Inc. (insurance) | |
Stephen R. Lewis, Jr.
901 S. Marquette Ave.
Minneapolis, MN 55402
1939 | | Chair of the Board for RiverSource Funds since 1/07, Board member for RiverSource Funds since 1/02 and since 6/11 for Nations Funds | | President Emeritus and Professor of Economics Emeritus, Carleton College since 2002 | | | 153 | | | Director, Valmont Industries, Inc. (manufacturer of irrigation systems) since 2002 | |
Catherine James Paglia
901 S. Marquette Ave.
Minneapolis, MN 55402
1952 | | Board member since 11/04 for RiverSource Funds and since 6/11 for Nations Funds | | Director, Enterprise Asset Management, Inc. (private real estate and asset management company) | | | 153 | | | Director, Valmont Industries, Inc. (manufacturer of irrigation systems) since 2012 | |
Leroy C. Richie
901 S. Marquette Ave.
Minneapolis, MN 55402
1941 | | Board member since 2000 for Legacy Seligman Funds, since 11/08 for RiverSource Funds and since 6/11 for Nations Funds | | Counsel, Lewis & Munday, P.C. (law firm) since 2004; former Vice President and General Counsel, Automotive Legal Affairs, Chrysler Corporation from 1983-1987 | | | 153 | | | Lead Outside Director, Digital Ally, Inc. (digital imaging) since September 2005; Director, Infinity, Inc. (oil and gas exploration and production) since 1994; Director, OGE Energy Corp. (energy and energy services) since November 2007 | |
Minor M. Shaw
901 S. Marquette Ave.
Minneapolis, MN 55402
1947 | | Board member since 6/11 for RiverSource Funds and since 2003 for Nations Funds | | President, Micco LLC (private investments) since 2011; President Micco Corp. since 1998 | | | 151 | | | Director, Piedmont Natural Gas; Director, BlueCross BlueShield of South Carolina since April 2008; Former Trustee, BofA Funds Series Trust (11 funds) | |
Alison Taunton-Rigby
901 S. Marquette Ave.
Minneapolis, MN 55402
1944 | | Board member since 11/02 for RiverSource Funds and since 6/11 for Nations Funds | | Chief Executive Officer and Director, RiboNovix, Inc. (biotechnology), 2003-2010 | | | 153 | | | Director, Healthways, Inc. (health and well-being improvement) since 2005; Director, ICI Mutual Insurance Company, RRG since 2011; Director, Abt Associates (government contractor) since 2001; Director, Boston Children's Hospital since 2002 | |
Annual Report 2013
40
Columbia Convertible Securities Fund
Trustees and Officers (continued)
Interested Trustee Not Affiliated With Investment Manager*
Name,
Address,
Year of Birth | | Position Held With
Funds and Length of
Service | | Principal Occupation
During Past Five Years | | Number of
Funds in the
Fund Family
Overseen by
Board Member | | Other Present or Past
Directorships/Trusteeships
(Within Past 5 Years) | |
Anthony M. Santomero
901 S. Marquette Ave.
Minneapolis, MN 55402
1946 | | Board member since 6/11 for RiverSource Funds and since 1/08 for Nations Funds | | Richard K. Mellon Professor Emeritus of Finance, The Wharton School, University of Pennsylvania, since 2002; Senior Advisor, McKinsey & Company (consulting), 2006-2008 | | | 151 | | | Director, Renaissance Reinsurance Ltd. since May 2008; Trustee, Penn Mutual Life Insurance Company since March 2008; Director, Citigroup since 2009; Director, Citibank, N.A. since 2009; former Trustee, BofA Funds Series Trust (11 funds) | |
*Dr. Santomero is not an affiliated person of the investment manager or Ameriprise Financial. However, he is currently deemed by the funds to be an "interested person" (as defined in the 1940 Act) of the funds because he serves as a Director of Citigroup, Inc. and Citibank N.A., companies that may directly or through subsidiaries and affiliates engage from time-to-time in brokerage execution, principal transactions and lending relationships with the funds or accounts advised/managed by the investment manager.
Interested Trustee Affiliated With Investment Manager*
Name,
Address,
Year of Birth | | Position Held With
Funds and Length of
Service | | Principal Occupation
During Past Five Years | | Number of
Funds in the
Fund Family
Overseen by
Board Member | | Other Present or Past
Directorships/Trusteeships
(Within Past 5 Years) | |
William F. Truscott
53600 Ameriprise
Financial Center
Minneapolis, MN 55474
1960 | | Board member since 11/01 for RiverSource Funds and since 6/11 for Nations Funds; Senior Vice President since 2002 for RiverSource Funds and 5/10 for Nations Funds | | President, Columbia Management Investment Advisers, LLC since February 2012, (previously President, Chairman of the Board and Chief Investment Officer, 2001-April 2010); Chief Executive Officer, Global Asset Management, Ameriprise Financial, Inc. since September 2012 (previously Chief Executive Officer, U.S. Asset Management & President, Annuities, May 2010-September 2012 and President — U.S. Asset Management and Chief Investment Officer, 2005-April 2010); Chief Executive Officer, Columbia Management Investment Distributors, Inc. since February 2012, (previously Chairman of the Board and Chief Executive Officer, 2006-April 2010); Chairman of the Board and Chief Executive Officer, RiverSource Distributors, Inc. since 2006; President and Chief Executive Officer, Ameriprise Certificate Company 2006-August 2012 | | | 210 | | | Chairman of the Board, Columbia Management Investment Advisers, LLC since May 2010; Director, Columbia Management Investment Distributors, Inc. since May 2010; Director, Ameriprise Certificate Company, 2006-January 2013 | |
*Interested person (as defined under the 1940 Act) by reason of being an officer, director, security holder and/or employee of the investment manager or Ameriprise Financial.
The SAI has additional information about the Fund's Board members and is available, without charge, upon request by calling 800.345.6611; contacting your financial intermediary; or visiting columbiamanagement.com.
Annual Report 2013
41
Columbia Convertible Securities Fund
Trustees and Officers (continued)
The Board has appointed officers who are responsible for day-to-day business decisions based on policies it has established. The officers serve at the pleasure of the Board. In addition to Mr. Truscott, who is Senior Vice President, the funds' other officers are:
Officers
Name,
Address,
Year of Birth | | Position Held With
Funds and Length of
Service | | Principal Occupation During Past Five Years | |
J. Kevin Connaughton
225 Franklin Street
Boston, MA 02110
1964 | | President and Principal Executive Officer since 5/10 for RiverSource Funds and 2009 for Nations Funds | | Senior Vice President and General Manager — Mutual Fund Products, Columbia Management Investment Advisers, LLC since May 2010; Managing Director of Columbia Management Advisors, LLC, December 2004-April 2010; Senior Vice President and Chief Financial Officer, Columbia Funds, June 2008-January 2009; Treasurer, Columbia Funds, October 2003-May 2008 | |
Amy K. Johnson
5228 Ameriprise Financial Center Minneapolis, MN 55474
1965 | | Vice President since 12/06 for RiverSource Funds and 5/10 for Nations Funds | | Senior Vice President and Chief Operating Officer, Columbia Management Investment Advisers, LLC since May 2010 (previously Chief Administrative Officer, 2009-April 2010 and Vice President — Asset Management and Trust Company Services, 2006-2009) | |
Michael G. Clarke
225 Franklin Street
Boston, MA 02110
1969 | | Treasurer since 1/11 and Chief Financial Officer since 4/11 for RiverSource Funds and Treasurer since 3/11 and Chief Financial Officer since 2009 for Nations Funds | | Vice President, Columbia Management Investment Advisers, LLC since May 2010; Managing Director of Fund Administration, Columbia Management Advisors, LLC, September 2004-April 2010; senior officer of Columbia Funds and affiliated funds since 2002 | |
Scott R. Plummer
5228 Ameriprise Financial Center Minneapolis, MN 55474
1959 | | Senior Vice President and Chief Legal Officer since 12/06 and Assistant Secretary since 6/11 for RiverSource Funds and Senior Vice President and Chief Legal Officer since 5/10 and Assistant Secretary since 6/11 for Nations Funds | | Senior Vice President, Chief Legal Officer and Assistant Secretary, Columbia Management Investment Advisers, LLC since June 2005; Vice President and Lead Chief Counsel — Asset Management, Ameriprise Financial, Inc. since May 2010 (previously Vice President and Chief Counsel — Asset Management, 2005-April 2010); Vice President, Chief Counsel and Assistant Secretary, Columbia Management Investment Distributors, Inc. since 2008; Vice President, General Counsel and Secretary, Ameriprise Certificate Company since 2005; Chief Counsel, RiverSource Distributors, Inc. since 2006 | |
Colin Moore
225 Franklin Street
Boston, MA 02110
1958 | | Senior Vice President since 5/10 for RiverSource Funds and Nations Funds | | Director and Chief Investment Officer, Columbia Management Investment Advisers, LLC since May 2010; Manager, Managing Director and Chief Investment Officer, Columbia Management Advisors, LLC, 2007-April 2010 | |
Thomas P. McGuire
225 Franklin Street
Boston, MA 02110
1972 | | Chief Compliance Officer since 3/12 | | Vice President — Asset Management Compliance, Columbia Management Investment Advisers, LLC since 2010; Chief Compliance Officer, Ameriprise Certificate Company since September 2010; Compliance Executive, Bank of America, 2005-2010 | |
Stephen T. Welsh
225 Franklin Street
Boston, MA 02110
1957 | | Vice President since 4/11 for RiverSource Funds and 2006 for Nations Funds | | President and Director, Columbia Management Investment Services Corp. since May 2010; President and Director, Columbia Management Services, Inc., July 2004- April 2010; Managing Director, Columbia Management Distributors, Inc., August 2007-April 2010 | |
Christopher O. Petersen
5228 Ameriprise Financial Center Minneapolis, MN 55474
1970 | | Vice President and Secretary since 4/11 for RiverSource Funds and 3/11 for Nations Funds | | Vice President and Chief Counsel, Ameriprise Financial, Inc. since January 2010 (formerly Vice President and Group Counsel or Counsel, April 2004-January 2010); Assistant Secretary of Legacy RiverSource Funds, January 2007-April 2011 and of the Nations Funds, May 2010-March 2011 | |
Annual Report 2013
42
Columbia Convertible Securities Fund
Trustees and Officers (continued)
Officers (continued)
Name,
Address,
Year of Birth | | Position Held With
Funds and Length of
Service | | Principal Occupation During Past Five Years | |
Paul D. Pearson
10468 Ameriprise Financial Center Minneapolis, MN 55474
1956 | | Vice President since 4/11 and Assistant Treasurer since 1999 for RiverSource Funds and Vice President and Assistant Treasurer since 6/11 for Nations Funds | | Vice President — Investment Accounting, Columbia Management Investment Advisers, LLC, since May 2010; Vice President — Managed Assets, Investment Accounting, Ameriprise Financial Corporation, February 1998-May 2010 | |
Joseph F. DiMaria
225 Franklin Street
Boston, MA 02110
1968 | | Vice President and Chief Accounting Officer since 4/11 and Vice President since 3/11 and Chief Accounting Officer since 2008 for Nations Funds | | Vice President, Mutual Fund Administration, Columbia Management Investment Advisers, LLC, since May 2010; Director of Fund Administration, Columbia Management Advisors, LLC, January 2006-April 2010 | |
Paul B. Goucher
100 Park Avenue
New York, NY 10017
1968 | | Vice President since 4/11 and Assistant Secretary since 11/08 for RiverSource Funds and 5/10 for Nations Funds | | Vice President and Lead Chief Counsel, Ameriprise Financial, Inc. since November 2008 and January 2013, respectively (formerly, Chief Counsel, January 2010-January 2013 and Group Counsel from November 2008- January 2010); Director, Managing Director and General Counsel, J. & W. Seligman & Co. Incorporated, July 2008-November 2008 (previously, Managing Director and Associate General Counsel, January 2005-July 2008) | |
Michael E. DeFao
225 Franklin Street
Boston, MA 02110
1968 | | Vice President since 4/11 and Assistant Secretary since 5/10 for RiverSource Funds and 2011 for Nations Funds | | Vice President and Chief Counsel, Ameriprise Financial, Inc. since May 2010; Associate General Counsel, Bank of America, June 2005-April 2010 | |
Annual Report 2013
43
This page intentionally left blank.
Annual Report 2013
44
Columbia Convertible Securities Fund
Important Information About This Report
Each fund mails one shareholder report to each shareholder address. If you would like more than one report, please call shareholder services at 800.345.6611 and additional reports will be sent to you.
The policy of the Board is to vote the proxies of the companies in which each fund holds investments consistent with the procedures as stated in the Statement of Additional Information (SAI). You may obtain a copy of the SAI without charge by calling 800.345.6611; contacting your financial intermediary; visiting columbiamanagement.com; or searching the website of the Securities and Exchange Commission (SEC) at sec.gov. Information regarding how each fund voted proxies relating to portfolio securities is filed with the SEC by August 31 for the most recent 12-month period ending June 30 of that year, and is available without charge by visiting columbiamanagement.com; or searching the website of the SEC at sec.gov.
Each fund files a complete schedule of portfolio holdings with the SEC for the first and third quarters of each fiscal year on Form N-Q. Each fund's Form N-Q is available on the SEC's website at sec.gov and may be reviewed and copied at the SEC's Public Reference Room in Washington, D.C. Information on the operation of the Public Reference Room may be obtained by calling 800.SEC.0330. Each fund's complete schedule of portfolio holdings, as filed on Form N-Q, can also be obtained without charge, upon request, by calling 800.345.6611.
Annual Report 2013
45

Columbia Convertible Securities Fund
P.O. Box 8081
Boston, MA 02266-8081
columbiamanagement.com
This information is for use with concurrent or prior delivery of a fund prospectus. Please read and consider the investment objectives, risks, charges and expenses for any fund carefully before investing. For a prospectus which contains this and other important information about the Fund go to columbiamanagement.com. The Fund is distributed by Columbia Management Investment Distributors, Inc., member FINRA, and managed by Columbia Management Investment Advisers, LLC.
© 2013 Columbia Management Investment Advisers, LLC. All rights reserved.
ANN134_02_C01_(04/13)
Annual Report
February 28, 2013

Columbia Large Cap Core Fund
Not FDIC insured • No bank guarantee • May lose value
Columbia Large Cap Core Fund
 Dear Shareholders,
U.S. stocks flat, foreign markets strong in 2012 finale
After a strong third quarter, U.S. stock market averages treaded water as the year 2012 came to a close. However, they ended the year up strongly, as first- and third-quarter gains more than offset second- and fourth-quarter weakness. Typically a strong quarter for domestic small- and mid-cap issues, the fourth quarter of 2012 indeed proved to be another year-end positive for small-cap stocks. For the full calendar year 2012, the S&P 500 Index rose 16.00%.
Stock markets outside the United States generated some of the best returns for the fourth quarter, as optimism rebounded, thanks to the September actions of the European Central Bank in support of the euro and an improving outlook from China. Both developed and emerging foreign markets topped U.S. stocks by a solid margin.
Corporate and emerging markets led fixed income
Fixed-income investors took their cue from the equity markets and continued to favor the highest risk sectors through the end of 2012. Global fixed-income returns posted mixed results in the final quarter of the year. Gains were the highest for corporate high-yield and emerging market bonds. Although investors remained cautious ahead of the year-end budget negotiations, better economic data and a further improvement in the European sovereign debt crisis supported riskier assets and depressed government bond prices. In December, the Federal Reserve announced its intention to continue to purchase both Treasury and mortgage-backed securities and said that it would seek to keep short-term interest rates unchanged until the unemployment rate reaches 6.5%, or inflation turned noticeably higher.
Stay on track with Columbia Management
Backed by more than 100 years of experience, Columbia Management is one of the nation's largest asset managers. At the heart of our success — and, most importantly, that of our investors — are highly talented industry professionals, brought together by a unique way of working. We are dedicated to helping you take advantage of today's opportunities and anticipate tomorrow's. We stay abreast of the latest investment trends and ideas, using our collective insight to evaluate events and transform them into solutions you can use.
Visit columbiamanagement.com for:
> The Columbia Management Perspectives blog, featuring timely posts by our investment teams
> Detailed up-to-date fund performance and portfolio information
> Economic analysis and market commentary
> Quarterly fund commentaries
> Columbia Management Investor, our award-winning quarterly newsletter for shareholders
Thank you for your continued support of the Columbia Funds. We look forward to serving your investment needs for many years to come.
Best Regards,

J. Kevin Connaughton
President, Columbia Funds
The S&P 500 Index, an unmanaged index, measures the performance of 500 widely held, large-capitalization U.S. stocks and is frequently used as a general measure of market performance. Indices are not available for investment, are not professionally managed and do not reflect sales charges, fees, brokerage commissions, taxes or other expenses of investing.
Investors should consider the investment objectives, risks, charges and expenses of a mutual fund carefully before investing. For a free prospectus, which contains this and other important information about a fund, visit columbiamanagement.com. The prospectus should be read carefully before investing.
Columbia Funds are distributed by Columbia Management Investment Distributors, Inc., member FINRA, and managed by Columbia Management Investment Advisers, LLC.
© 2013 Columbia Management Investment Advisers, LLC. All rights reserved.
Columbia Large Cap Core Fund
Performance Overview | | | 2 | | |
Manager Discussion of Fund Performance | | | 4 | | |
Understanding Your Fund's Expenses | | | 6 | | |
Portfolio of Investments | | | 7 | | |
Statement of Assets and Liabilities | | | 12 | | |
Statement of Operations | | | 14 | | |
Statement of Changes in Net Assets | | | 15 | | |
Financial Highlights | | | 17 | | |
Notes to Financial Statements | | | 24 | | |
Report of Independent Registered
Public Accounting Firm | | | 32 | | |
Federal Income Tax Information | | | 33 | | |
Trustees and Officers | | | 34 | | |
Important Information About This Report | | | 41 | | |
Fund Investment Manager
Columbia Management Investment
Advisers, LLC
225 Franklin Street
Boston, MA 02110
Fund Distributor
Columbia Management Investment
Distributors, Inc.
225 Franklin Street
Boston, MA 02110
Fund Transfer Agent
Columbia Management Investment
Services Corp.
P.O. Box 8081
Boston, MA 02266-8081
For more information about any of the funds, please visit columbiamanagement.com or call 800.345.6611. Customer Service Representatives are available to answer your questions Monday through Friday from 8 a.m. to 8 p.m. Eastern time.
The views expressed in this report reflect the current views of the respective parties. These views are not guarantees of future performance and involve certain risks, uncertainties and assumptions that are difficult to predict, so actual outcomes and results may differ significantly from the views expressed. These views are subject to change at any time based upon economic, market or other conditions and the respective parties disclaim any responsibility to update such views. These views may not be relied on as investment advice and, because investment decisions for a Columbia Fund are based on numerous factors, may not be relied on as an indication of trading intent on behalf of any particular Columbia Fund. References to specific securities should not be construed as a recommendation or investment advice.
Columbia Large Cap Core Fund
Performance Summary
> Columbia Large Cap Core Fund (the Fund) Class A shares returned 12.83% excluding sales charges for the 12-month period that ended February 28, 2013,
> The Fund underperformed its benchmark, the S&P 500 Index, which returned 13.46% for the same 12-month period.
> Good overall stock selection, particularly in the consumer discretionary and information technology areas, aided performance. Disappointing results from a handful of stocks accounted for the modest shortfall relative to the index.
Average Annual Total Returns (%) (for period ended February 28, 2013)
| | Inception | | 1 Year | | 5 Years | | 10 Years | |
Class A | | 08/02/99 | | | | | | | | | | | | | |
Excluding sales charges | | | | | | | 12.83 | | | | 4.16 | | | | 7.77 | | |
Including sales charges | | | | | | | 6.34 | | | | 2.94 | | | | 7.14 | | |
Class B | | 08/02/99 | | | | | | | | | | | | | |
Excluding sales charges | | | | | | | 11.93 | | | | 3.38 | | | | 6.95 | | |
Including sales charges | | | | | | | 6.93 | | | | 3.03 | | | | 6.95 | | |
Class C | | 08/02/99 | | | | | | | | | | | | | |
Excluding sales charges | | | | | | | 11.94 | | | | 3.37 | | | | 6.94 | | |
Including sales charges | | | | | | | 10.94 | | | | 3.37 | | | | 6.94 | | |
Class I* | | 09/27/10 | | | 13.24 | | | | 4.48 | | | | 8.07 | | |
Class R5* | | 11/08/12 | | | 13.11 | | | | 4.40 | | | | 8.03 | | |
Class W* | | 09/27/10 | | | 12.78 | | | | 4.18 | | | | 7.80 | | |
Class Z | | 10/02/98 | | | 13.08 | | | | 4.39 | | | | 8.02 | | |
S&P 500 Index | | | | | | | 13.46 | | | | 4.94 | | | | 8.24 | | |
Returns for Class A are shown with and without the maximum initial sales charge of 5.75%. Returns for Class B are shown with and without the applicable contingent deferred sales charge (CDSC) of 5.00% in the first year, declining to 1.00% in the sixth year and eliminated thereafter. Returns for Class C are shown with and without the 1.00% CDSC for the first year only. The Fund's other classes are not subject to sales charges and have limited eligibility. Please see the Fund's prospectuses for details. Performance for different share classes will vary based on differences in sales charges and fees associated with each class. All results shown assume reinvestment of distributions during the period. Returns do not reflect the deduction of taxes that a shareholder may pay on Fund distributions or on the redemption of Fund shares. Performance results reflect the effect of any fee waivers or reimbursements of Fund expenses by Columbia Management Investment Advisers, LLC and/or any of its affiliates. Absent these fee waivers or expense reimbursement arrangements, performance results would have been lower.
The performance information shown represents past performance and is not a guarantee of future results. The investment return and principal value of your investment will fluctuate so that your shares, when redeemed, may be worth more or less than their original cost. Current performance may be lower or higher than the performance information shown. You may obtain performance information current to the most recent month-end by contacting your financial intermediary, visiting columbiamanagement.com or calling 800.345.6611.
*The returns shown for periods prior to the share class inception date (including returns for the Life of the Fund, if shown, which are since Fund inception) include the returns of the Fund's oldest share class. These returns are adjusted to reflect any higher class-related operating expenses of the newer share classes, as applicable. Please visit columbiamanagement.com/mutual-funds/appended-performance for more information.
The S&P 500 Index, an unmanaged index, measures the performance of 500 widely held, large-capitalization U.S. stocks and is frequently used as a general measure of market performance.
Indices are not available for investment, are not professionally managed and do not reflect sales charges, fees, brokerage commissions, taxes or other expenses of investing. Securities in the Fund may not match those in an index.
Annual Report 2013
2
Columbia Large Cap Core Fund
Performance Overview (continued)
Performance of a Hypothetical $10,000 Investment (March 1, 2003 – February 28, 2013)
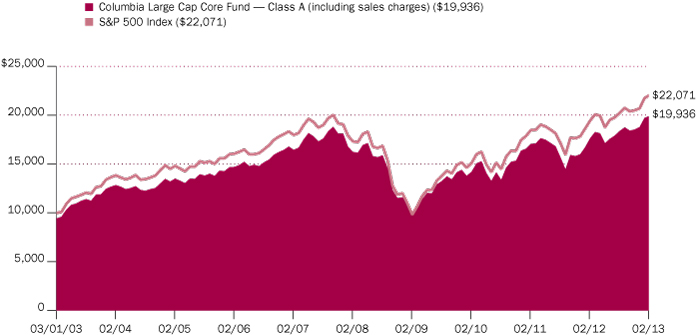
The chart above shows the change in value of a hypothetical $10,000 investment in Class A shares of Columbia Large Cap Core Fund during the stated time period, and does not reflect the deduction of taxes that a shareholder may pay on Fund distributions or on the redemption of Fund shares.
Annual Report 2013
3
Columbia Large Cap Core Fund
Manager Discussion of Fund Performance
For the 12-month period that ended February 28, 2013, the Fund's Class A shares returned 12.83% excluding sales charges. The Fund underperformed its benchmark, the S&P 500 Index, which returned 13.46% for the same 12-month period. Good overall stock selection, particularly in the consumer discretionary and information technology areas, aided returns. Disappointing results from a few individual investments accounted for the modest shortfall relative to the index.
Investors Shrug Off Weak Global Growth
Europe's economic woes and U.S. struggles to avoid a fiscal cliff of tax increases and spending cuts weighed on the global economy during the 12-month period ended February 28, 2013. Yet, investors chose to look beyond the numbers and came in from the sidelines to bid stock prices significantly higher. Favorable central bank action in key markets and improving prospects for the U.S. economy gave investors confidence to favor stocks and other riskier assets. The U.S. economy expanded at a pace of just 1.6% in 2012. However, a pickup in job growth early in 2013 and steady manufacturing activity were encouraging signs. The U.S. housing market staged a solid comeback, with higher home sales, rising prices and lower inventories. Meanwhile, much of Europe headed toward recession. So far, the United Kingdom has avoided recession — but only barely so — and Japan's economy slipped into negative territory for the fifth time in 15 years. Major emerging market economies forged ahead, although mostly at a slower pace, including China.
Consumer, Tech Selections Aided Performance
Consistent with the Fund's fundamental discipline and history, stock selection, rather than sector or industry weights, drove performance. Selections in the consumer discretionary and information technology sectors helped results. In the consumer area, home improvement and hardware retailer Lowe's was a top contributor, as investments in residential housing increased noticeably after a prolonged slump. Media-related investments also did well, most notably Time Warner, which generated healthy earnings gains from its entertainment production and distribution operations, while preparing to shed underperforming assets, including publisher Time-Life. The Fund's innovation theme played out in the strong results from three information technology holdings: eBay, Google and Visa International. They benefited either from the growth of Internet commerce or the increased use of financial transactions. Elsewhere, utility and energy company Sempra posted a big gain as it boosted its stock dividend and improved its future prospects with plans for construction of a major liquefied natural gas (LNG) export terminal. Meanwhile, oil refiner HollyFrontier appreciated as it improved earnings and raised its stock dividend.
Company-specific problems dragged down a handful of holdings, which weighed on performance. Among financials, credit-card issuer Capital One struggled in integrating recent acquisitions and failed to control its costs. In addition, the company experienced weak loan growth at the same time that the credit quality of its customer base appeared to deteriorate. We sold the investment in Capital One, as we did with another underperforming holding, KBR, an energy equipment and services corporation. KBR's earnings were hit by delays in several expected contracts, including for a large liquefied natural gas project. We decided to retain a position in EMC, another poor performer during the period.
Portfolio Management
Peter Santoro, CFA
Craig Leopold, CFA
Morningstar Style BoxTM

The Morningstar Style BoxTM is based on a fund's portfolio holdings. For equity funds, the vertical axis shows the market capitalization of the stocks owned, and the horizontal axis shows investment style (value, blend, or growth). Information shown is based on the most recent data provided by Morningstar.
©2013 Morningstar, Inc. All rights reserved. The Morningstar information contained herein: (1) is proprietary to Morningstar and/or its content providers; (2) may not be copied or distributed; and (3) is not warranted to be accurate, complete or timely. Neither Morningstar nor its content providers are responsible for any damages or losses arising from any use of this information.
Top Ten Holdings (%)
(at February 28, 2013) | |
Chevron Corp. | | | 3.7 | | |
Procter & Gamble Co. (The) | | | 3.3 | | |
Johnson & Johnson | | | 3.2 | | |
Google, Inc., Class A | | | 3.0 | | |
Verizon Communications, Inc. | | | 2.7 | | |
Philip Morris International, Inc. | | | 2.7 | | |
Cisco Systems, Inc. | | | 2.6 | | |
McDonald's Corp. | | | 2.6 | | |
Wells Fargo & Co. | | | 2.5 | | |
Honeywell International, Inc. | | | 2.5 | | |
Percentages indicated are based upon total investments (excluding Money Market Funds).
For further detail about these holdings, please refer to the section entitled "Portfolio of Investments."
Fund holdings are as of the date given, are subject to change at any time, and are not recommendations to buy or sell any security.
Annual Report 2013
4
Columbia Large Cap Core Fund
Manager Discussion of Fund Performance (continued)
A global leader in storage technology, EMC fell victim both to economic weakness in Europe and uncertainty over government spending in the United States. However, we believe institutional spending on data storage has the potential to improve, despite the recent slowdown, and EMC retains a very strong competitive position.
Looking Ahead
At present, we believe that stock valuations remain reasonable, and we remain cautiously optimistic about the equity market in 2013. However, it may be difficult to identify significant growth opportunities because of the many political and economic uncertainties that hover over the market. We intend to remain focused on individual stock selection, searching for under-appreciated stocks. Our bias is to look for higher quality companies with superior growth trends and the ability to generate high levels of cash flow. We expect to favor companies that can grow independently of economic conditions, often by innovation. We look for companies whose managements have demonstrated their concerns for shareholders through steps such as re-structuring and streamlining operations and increasing dividend payouts.
Current holdings place greater emphasis on basic manufacturing corporations, where we see favorable demand trends. By contrast, we have reduced the Fund's exposure to the information technology and consumer discretionary sectors, the latter of which may face difficulties in the face of continued high unemployment and the effects of the recent increase in payroll taxes.
Portfolio Breakdown (%)
(at February 28, 2013) | |
Convertible Preferred Stocks | | | 0.9 | | |
Energy | | | 0.9 | | |
Common Stocks | | | 97.2 | | |
Consumer Discretionary | | | 11.8 | | |
Consumer Staples | | | 8.6 | | |
Energy | | | 10.4 | | |
Financials | | | 14.0 | | |
Health Care | | | 13.6 | | |
Industrials | | | 12.2 | | |
Information Technology | | | 18.7 | | |
Materials | | | 2.2 | | |
Telecommunication Services | | | 3.6 | | |
Utilities | | | 2.1 | | |
Money Market Funds | | | 1.9 | | |
Total | | | 100.0 | | |
Percentages indicated are based upon total investments. The Fund's portfolio composition is subject to change.
Annual Report 2013
5
Columbia Large Cap Core Fund
Understanding Your Fund's Expenses
(Unaudited)
As an investor, you incur two types of costs. There are transaction costs, which generally include sales charges on purchases and may include redemption fees. There are also ongoing costs, which generally include management fees, distribution and service (Rule 12b-1) fees, and other fund expenses. The following information is intended to help you understand your ongoing costs (in dollars) of investing in the Fund and to help you compare these costs with the ongoing costs of investing in other mutual funds.
Analyzing Your Fund's Expenses
To illustrate these ongoing costs, we have provided examples and calculated the expenses paid by investors in each share class of the Fund during the period. The actual and hypothetical information in the table is based on an initial investment of $1,000 at the beginning of the period indicated and held for the entire period. Expense information is calculated two ways and each method provides you with different information. The amount listed in the "Actual" column is calculated using the Fund's actual operating expenses and total return for the period. You may use the Actual information, together with the amount invested, to estimate the expenses that you paid over the period. Simply divide your account value by $1,000 (for example, an $8,600 account value divided by $1,000 = 8.6), then multiply the results by the expenses paid during the period under the Actual column. The amount listed in the "Hypothetical" column assumes a 5% annual rate of return before expenses (which is not the Fund's actual return) and then applies the Fund's actual expense ratio for the period to the hypothetical return. You should not use the hypothetical account values and expenses to estimate either your actual account balance at the end of the period or the expenses you paid during the period. See "Compare With Other Funds" below for details on how to use the hypothetical data.
Compare With Other Funds
Since all mutual funds are required to include the same hypothetical calculations about expenses in shareholder reports, you can use this information to compare the ongoing cost of investing in the Fund with other funds. To do so, compare the hypothetical example with the 5% hypothetical examples that appear in the shareholder reports of other funds. As you compare hypothetical examples of other funds, it is important to note that hypothetical examples are meant to highlight the ongoing costs of investing in a fund only and do not reflect any transaction costs, such as sales charges, or redemption or exchange fees. Therefore, the hypothetical calculations are useful in comparing ongoing costs only, and will not help you determine the relative total costs of owning different funds. If transaction costs were included in these calculations, your costs would be higher.
September 1, 2012 – February 28, 2013
| | Account Value at the Beginning
of the Period ($) | | Account Value at the End of the
Period ($) | | Expenses Paid During the
Period ($) | | Fund's Annualized
Expense Ratio (%) | |
| | Actual | | Hypothetical | | Actual | | Hypothetical | | Actual | | Hypothetical | | Actual | |
Class A | | | 1,000.00 | | | | 1,000.00 | | | | 1,082.70 | | | | 1,018.84 | | | | 6.20 | | | | 6.01 | | | | 1.20 | | |
Class B | | | 1,000.00 | | | | 1,000.00 | | | | 1,078.40 | | | | 1,015.12 | | | | 10.05 | | | | 9.74 | | | | 1.95 | | |
Class C | | | 1,000.00 | | | | 1,000.00 | | | | 1,078.50 | | | | 1,015.12 | | | | 10.05 | | | | 9.74 | | | | 1.95 | | |
Class I | | | 1,000.00 | | | | 1,000.00 | | | | 1,084.30 | | | | 1,020.88 | | | | 4.08 | | | | 3.96 | | | | 0.79 | | |
Class R5 | | | 1,000.00 | | | | 1,000.00 | | | | 1,111.50 | * | | | 1,020.88 | | | | 2.54 | * | | | 3.96 | | | | 0.79 | * | |
Class W | | | 1,000.00 | | | | 1,000.00 | | | | 1,082.20 | | | | 1,018.84 | | | | 6.20 | | | | 6.01 | | | | 1.20 | | |
Class Z | | | 1,000.00 | | | | 1,000.00 | | | | 1,083.80 | | | | 1,020.08 | | | | 4.91 | | | | 4.76 | | | | 0.95 | | |
*For the period November 8, 2012 through February 28, 2013. Class R5 shares commenced operations on November 8, 2012.
Expenses paid during the period are equal to the annualized expense ratio for each class as indicated above, multiplied by the average account value over the period and then multiplied by the number of days in the Fund's most recent fiscal half year and divided by 365.
Expenses do not include fees and expenses incurred indirectly by the Fund from the underlying funds in which the Fund may invest (also referred to as "acquired funds"), including affiliated and non-affiliated pooled investment vehicles (including mutual funds and exchange-traded funds).
Had Columbia Management Investment Advisers, LLC and/or certain of its affiliates not waived/reimbursed certain fees and expenses, account value at the end of the period would have been reduced.
Annual Report 2013
6
Columbia Large Cap Core Fund
Portfolio of Investments
February 28, 2013
(Percentages represent value of investments compared to net assets)
Common Stocks 98.7%
Issuer | | Shares | | Value ($) | |
Consumer Discretionary 12.0% | |
Hotels, Restaurants & Leisure 2.5% | |
McDonald's Corp. | | | 166,570 | | | | 15,974,063 | | |
Internet & Catalog Retail 1.2% | |
Amazon.com, Inc.(a) | | | 28,990 | | | | 7,661,187 | | |
Media 4.7% | |
DISH Network Corp., Class A | | | 139,293 | | | | 4,847,396 | | |
Time Warner, Inc. | | | 247,310 | | | | 13,149,473 | | |
Viacom, Inc., Class B | | | 190,360 | | | | 11,128,446 | | |
Total | | | | | 29,125,315 | | |
Specialty Retail 3.6% | |
Gap, Inc. (The) | | | 234,712 | | | | 7,726,719 | | |
Lowe's Companies, Inc. | | | 386,410 | | | | 14,741,542 | | |
Total | | | | | 22,468,261 | | |
Total Consumer Discretionary | | | | | 75,228,826 | | |
Consumer Staples 8.7% | |
Beverages 1.1% | |
PepsiCo, Inc. | | | 92,200 | | | | 6,985,994 | | |
Food Products 1.6% | |
Kraft Foods Group, Inc. | | | 209,200 | | | | 10,139,924 | | |
Household Products 3.3% | |
Procter & Gamble Co. (The) | | | 271,230 | | | | 20,662,301 | | |
Tobacco 2.7% | |
Philip Morris International, Inc. | | | 181,877 | | | | 16,687,215 | | |
Total Consumer Staples | | | | | 54,475,434 | | |
Energy 10.6% | |
Energy Equipment & Services 2.1% | |
Halliburton Co. | | | 313,990 | | | | 13,033,725 | | |
Oil, Gas & Consumable Fuels 8.5% | |
Anadarko Petroleum Corp. | | | 121,170 | | | | 9,642,708 | | |
Chevron Corp. | | | 198,745 | | | | 23,282,977 | | |
EOG Resources, Inc. | | | 77,690 | | | | 9,766,410 | | |
HollyFrontier Corp. | | | 112,880 | | | | 6,343,856 | | |
Range Resources Corp. | | | 55,620 | | | | 4,271,616 | | |
Total | | | | | 53,307,567 | | |
Total Energy | | | | | 66,341,292 | | |
Common Stocks (continued)
Issuer | | Shares | | Value ($) | |
Financials 14.1% | |
Capital Markets 3.1% | |
BlackRock, Inc. | | | 37,830 | | | | 9,069,743 | | |
Goldman Sachs Group, Inc. (The) | | | 68,690 | | | | 10,287,014 | | |
Total | | | | | 19,356,757 | | |
Commercial Banks 4.5% | |
PNC Financial Services Group, Inc. | | | 196,150 | | | | 12,237,798 | | |
Wells Fargo & Co. | | | 451,938 | | | | 15,853,985 | | |
Total | | | | | 28,091,783 | | |
Diversified Financial Services 4.6% | |
Bank of America Corp. | | | 1,237,170 | | | | 13,893,419 | | |
Citigroup, Inc. | | | 361,299 | | | | 15,163,719 | | |
Total | | | | | 29,057,138 | | |
Insurance 1.9% | |
ACE Ltd. | | | 141,440 | | | | 12,077,562 | | |
Total Financials | | | | | 88,583,240 | | |
Health Care 13.8% | |
Biotechnology 1.0% | |
Onyx Pharmaceuticals, Inc.(a) | | | 27,946 | | | | 2,104,613 | | |
Vertex Pharmaceuticals, Inc.(a) | | | 97,167 | | | | 4,549,359 | | |
Total | | | | | 6,653,972 | | |
Health Care Equipment & Supplies 3.2% | |
Abbott Laboratories | | | 315,450 | | | | 10,659,056 | | |
Edwards Lifesciences Corp.(a) | | | 48,760 | | | | 4,189,947 | | |
Hologic, Inc.(a) | | | 235,910 | | | | 5,149,915 | | |
Total | | | | | 19,998,918 | | |
Health Care Providers & Services 3.7% | |
Aetna, Inc. | | | 233,580 | | | | 11,022,640 | | |
Express Scripts Holding Co.(a) | | | 210,300 | | | | 11,968,173 | | |
Total | | | | | 22,990,813 | | |
Life Sciences Tools & Services 1.3% | |
Thermo Fisher Scientific, Inc. | | | 111,090 | | | | 8,198,442 | | |
Pharmaceuticals 4.6% | |
Johnson & Johnson | | | 263,667 | | | | 20,067,695 | | |
Merck & Co., Inc. | | | 204,170 | | | | 8,724,184 | | |
Total | | | | | 28,791,879 | | |
Total Health Care | | | | | 86,634,024 | | |
The accompanying Notes to Financial Statements are an integral part of this statement.
Annual Report 2013
7
Columbia Large Cap Core Fund
Portfolio of Investments (continued)
February 28, 2013
Common Stocks (continued)
Issuer | | Shares | | Value ($) | |
Industrials 12.4% | |
Aerospace & Defense 2.5% | |
Honeywell International, Inc. | | | 221,930 | | | | 15,557,293 | | |
Air Freight & Logistics 1.8% | |
FedEx Corp. | | | 106,680 | | | | 11,247,272 | | |
Commercial Services & Supplies 1.2% | |
Tyco International Ltd. | | | 239,121 | | | | 7,654,263 | | |
Electrical Equipment 1.9% | |
Eaton Corp. PLC | | | 188,781 | | | | 11,698,759 | | |
Industrial Conglomerates 2.1% | |
General Electric Co. | | | 550,310 | | | | 12,778,198 | | |
Machinery 1.1% | |
Pall Corp. | | | 103,350 | | | | 7,046,403 | | |
Road & Rail 1.8% | |
Hertz Global Holdings, Inc.(a) | | | 269,550 | | | | 5,377,523 | | |
JB Hunt Transport Services, Inc. | | | 88,370 | | | | 6,143,482 | | |
Total | | | | | 11,521,005 | | |
Total Industrials | | | | | 77,503,193 | | |
Information Technology 19.0% | |
Communications Equipment 5.9% | |
Cisco Systems, Inc. | | | 780,580 | | | | 16,275,093 | | |
F5 Networks, Inc.(a) | | | 82,900 | | | | 7,828,247 | | |
QUALCOMM, Inc. | | | 195,540 | | | | 12,833,290 | | |
Total | | | | | 36,936,630 | | |
Computers & Peripherals 4.0% | |
Apple, Inc. | | | 30,440 | | | | 13,436,216 | | |
EMC Corp.(a) | | | 491,804 | | | | 11,316,410 | | |
Total | | | | | 24,752,626 | | |
Internet Software & Services 4.0% | |
eBay, Inc.(a) | | | 115,333 | | | | 6,306,409 | | |
Google, Inc., Class A(a) | | | 23,424 | | | | 18,767,309 | | |
Total | | | | | 25,073,718 | | |
IT Services 1.3% | |
Cognizant Technology Solutions Corp.,
Class A(a) | | | 107,630 | | | | 8,262,755 | | |
Semiconductors & Semiconductor Equipment 2.4% | |
Avago Technologies Ltd. | | | 259,319 | | | | 8,873,896 | | |
Microchip Technology, Inc. | | | 163,840 | | | | 5,975,245 | | |
Total | | | | | 14,849,141 | | |
Common Stocks (continued)
Issuer | | Shares | | Value ($) | |
Software 1.4% | |
Activision Blizzard, Inc. | | | 120,300 | | | | 1,720,290 | | |
Citrix Systems, Inc.(a) | | | 101,970 | | | | 7,229,673 | | |
Total | | | | | 8,949,963 | | |
Total Information Technology | | | | | 118,824,833 | | |
Materials 2.3% | |
Chemicals 1.5% | |
Celanese Corp., Class A | | | 82,980 | | | | 3,887,613 | | |
Cytec Industries, Inc. | | | 75,710 | | | | 5,480,647 | | |
Total | | | | | 9,368,260 | | |
Metals & Mining 0.8% | |
Rio Tinto PLC, ADR | | | 87,720 | | | | 4,705,301 | | |
Total Materials | | | | | 14,073,561 | | |
Telecommunication Services 3.7% | |
Diversified Telecommunication Services 2.7% | |
Verizon Communications, Inc. | | | 359,291 | | | | 16,717,810 | | |
Wireless Telecommunication Services 1.0% | |
Vodafone Group PLC, ADR | | | 253,590 | | | | 6,375,253 | | |
Total Telecommunication Services | | | | | 23,093,063 | | |
Utilities 2.1% | |
Gas Utilities 1.0% | |
Questar Corp. | | | 265,970 | | | | 6,252,955 | | |
Multi-Utilities 1.1% | |
Sempra Energy | | | 89,302 | | | | 6,944,123 | | |
Total Utilities | | | | | 13,197,078 | | |
Total Common Stocks
(Cost: $506,681,862) | | | | | 617,954,544 | | |
Convertible Preferred Stocks 0.9%
Energy 0.9% | |
Oil, Gas & Consumable Fuels 0.9% | |
Chesapeake Energy Corp., 5.750%(b) | | | 5,290 | | | | 5,485,068 | | |
Total Energy | | | | | 5,485,068 | | |
Total Convertible Preferred Stocks
(Cost: $5,415,784) | | | | | 5,485,068 | | |
The accompanying Notes to Financial Statements are an integral part of this statement.
Annual Report 2013
8
Columbia Large Cap Core Fund
Portfolio of Investments (continued)
February 28, 2013
Money Market Funds 1.9%
| | | Shares | | Value ($) | |
Columbia Short-Term Cash Fund,
0.128%(c)(d) | | | 11,840,690 | | | | 11,840,690 | | |
Total Money Market Funds
(Cost: $11,840,690) | | | | | 11,840,690 | | |
Total Investments
(Cost: $523,938,336) | | | | | 635,280,302 | | |
Other Assets & Liabilities, Net | | | | | (9,133,604 | ) | |
Net Assets | | | | | 626,146,698 | | |
Notes to Portfolio of Investments
(a) Non-income producing.
(b) Security exempt from registration pursuant to Rule 144A under the Securities Act of 1933. This security may be resold in transactions exempt from registration, normally to qualified institutional buyers. At February 28, 2013, the value of these securities amounted to $5,485,068 or 0.88% of net assets.
(c) The rate shown is the seven-day current annualized yield at February 28, 2013.
(d) As defined in the Investment Company Act of 1940, an affiliated company is one in which the Fund owns 5% or more of its outstanding voting securities, or a company which is under common ownership or control with the Fund. Holdings and transactions in these affiliated companies during the year ended February 28, 2013, are as follows:
Issuer | | Beginning
Cost ($) | | Purchase
Cost ($) | | Proceeds
From Sales ($) | | Ending
Cost ($) | | Dividends —
Affiliated
Issuers ($) | | Value ($) | |
Columbia Short-Term Cash Fund | | | 15,535,546 | | | | 236,893,659 | | | | (240,588,515 | ) | | | 11,840,690 | | | | 28,063 | | | | 11,840,690 | | |
Abbreviation Legend
ADR American Depositary Receipt
Fair Value Measurements
Generally accepted accounting principles (GAAP) require disclosure regarding the inputs and valuation techniques used to measure fair value and any changes in valuation inputs or techniques. In addition, investments shall be disclosed by major category.
The Fund categorizes its fair value measurements according to a three-level hierarchy that maximizes the use of observable inputs and minimizes the use of unobservable inputs by prioritizing that the most observable input be used when available. Observable inputs are those that market participants would use in pricing an investment based on market data obtained from sources independent of the reporting entity. Unobservable inputs are those that reflect the Fund's assumptions about the information market participants would use in pricing an investment. An investment's level within the fair value hierarchy is based on the lowest level of any input that is deemed significant to the asset or liability's fair value measurement. The input levels are not necessarily an indication of the risk or liquidity associated with investments at that level. For example, certain U.S. government securities are generally high quality and liquid, however, they are reflected as Level 2 because the inputs used to determine fair value may not always be quoted prices in an active market.
Fair value inputs are summarized in the three broad levels listed below:
> Level 1 — Valuations based on quoted prices for investments in active markets that the Fund has the ability to access at the measurement date (including NAV for open-end mutual funds). Valuation adjustments are not applied to Level 1 investments.
> Level 2 — Valuations based on other significant observable inputs (including quoted prices for similar securities, interest rates, prepayment speeds, credit risks, etc.).
> Level 3 — Valuations based on significant unobservable inputs (including the Fund's own assumptions and judgment in determining the fair value of investments).
The accompanying Notes to Financial Statements are an integral part of this statement.
Annual Report 2013
9
Columbia Large Cap Core Fund
Portfolio of Investments (continued)
February 28, 2013
Fair Value Measurements (continued)
Inputs that are used in determining fair value of an investment may include price information, credit data, volatility statistics, and other factors. These inputs can be either observable or unobservable. The availability of observable inputs can vary between investments, and is affected by various factors such as the type of investment, and the volume and level of activity for that investment or similar investments in the marketplace. The inputs will be considered by the Investment Manager, along with any other relevant factors in the calculation of an investment's fair value. The Fund uses prices and inputs that are current as of the measurement date, which may include periods of market dislocations. During these periods, the availability of prices and inputs may be reduced for many investments. This condition could cause an investment to be reclassified between the various levels within the hierarchy.
Investments falling into the Level 3 category are primarily supported by quoted prices from brokers and dealers participating in the market for those investments. However, these may be classified as Level 3 investments due to lack of market transparency and corroboration to support these quoted prices. Additionally, valuation models may be used as the pricing source for any remaining investments classified as Level 3. These models rely on one or more significant unobservable inputs and/or significant assumptions by the Investment Manager. Inputs used in valuations may include, but are not limited to, financial statement analysis, capital account balances, discount rates and estimated cash flows, and comparable company data.
Under the direction of the Fund's Board of Trustees (the Board), the Investment Manager's Valuation Committee (the Committee) is responsible for carrying out the valuation procedures approved by the Board. The Committee consists of voting and non-voting members from various groups within the Investment Manager's organization, including operations and accounting, trading and investments, compliance, risk management and legal.
The Committee meets at least monthly to review and approve valuation matters, which may include a description of specific valuation determinations, data regarding pricing information received from approved pricing vendors and brokers and the results of Board-approved valuation control policies and procedures (the Policies). The Policies address, among other things, instances when market quotations are readily available, including recommendations of third party pricing vendors and a determination of appropriate pricing methodologies; events that require specific valuation determinations and assessment of fair value techniques; securities with a potential for stale pricing, including those that are illiquid, restricted, or in default; and the effectiveness of third-party pricing vendors, including periodic reviews of vendors. The Committee meets more frequently, as needed, to discuss additional valuation matters, which may include the need to review back-testing results, review time-sensitive information or approve related valuation actions. The Committee reports to the Board, with members of the Committee meeting with the Board at each of its regularly scheduled meetings to discuss valuation matters and actions during the period, similar to those described earlier.
For investments categorized as Level 3, the Committee monitors information similar to that described above, which may include: (i) data specific to the issuer or comparable issuers, (ii) general market or specific sector news and (iii) quoted prices and specific or similar security transactions. The Committee considers this data and any changes from prior periods in order to assess the reasonableness of observable and unobservable inputs, any assumptions or internal models used to value those securities and changes in fair value. This data is also used to corroborate, when available, information received from approved pricing vendors and brokers. Various factors impact the frequency of monitoring this information (which may occur as often as daily). However, the Committee may determine that changes to inputs, assumptions and models are not required as a result of the monitoring procedures performed.
The accompanying Notes to Financial Statements are an integral part of this statement.
Annual Report 2013
10
Columbia Large Cap Core Fund
Portfolio of Investments (continued)
February 28, 2013
Fair Value Measurements (continued)
The following table is a summary of the inputs used to value the Fund's investments at February 28, 2013:
Description | | Level 1
Quoted Prices in Active
Markets for Identical
Assets ($) | |
Level 2
Other Significant
Observable Inputs ($) | |
Level 3
Significant
Unobservable Inputs ($) | |
Total ($) | |
Equity Securities | |
Common Stocks | |
Consumer Discretionary | | | 75,228,826 | | | | — | | | | — | | | | 75,228,826 | | |
Consumer Staples | | | 54,475,434 | | | | — | | | | — | | | | 54,475,434 | | |
Energy | | | 66,341,292 | | | | — | | | | — | | | | 66,341,292 | | |
Financials | | | 88,583,240 | | | | — | | | | — | | | | 88,583,240 | | |
Health Care | | | 86,634,024 | | | | — | | | | — | | | | 86,634,024 | | |
Industrials | | | 77,503,193 | | | | — | | | | — | | | | 77,503,193 | | |
Information Technology | | | 118,824,833 | | | | — | | | | — | | | | 118,824,833 | | |
Materials | | | 14,073,561 | | | | — | | | | — | | | | 14,073,561 | | |
Telecommunication Services | | | 23,093,063 | | | | — | | | | — | | | | 23,093,063 | | |
Utilities | | | 13,197,078 | | | | — | | | | — | | | | 13,197,078 | | |
Convertible Preferred Stocks | |
Energy | | | — | | | | 5,485,068 | | | | — | | | | 5,485,068 | | |
Total Equity Securities | | | 617,954,544 | | | | 5,485,068 | | | | — | | | | 623,439,612 | | |
Other | |
Money Market Funds | | | 11,840,690 | | | | — | | | | — | | | | 11,840,690 | | |
Total Other | | | 11,840,690 | | | | — | | | | — | | | | 11,840,690 | | |
Total | | | 629,795,234 | | | | 5,485,068 | | | | — | | | | 635,280,302 | | |
See the Portfolio of Investments for all investment classifications not indicated in the table.
The Fund's assets assigned to the Level 2 input category are generally valued using the market approach, in which a security's value is determined through reference to prices and information from market transactions for similar or identical assets.
There were no transfers of financial assets between Levels 1 and 2 during the period.
The accompanying Notes to Financial Statements are an integral part of this statement.
Annual Report 2013
11
Columbia Large Cap Core Fund
Statement of Assets and Liabilities
February 28, 2013
Assets | |
Investments, at value | |
Unaffiliated issuers (identified cost $512,097,646) | | $ | 623,439,612 | | |
Affiliated issuers (identified cost $11,840,690) | | | 11,840,690 | | |
Total investments (identified cost $523,938,336) | | | 635,280,302 | | |
Receivable for: | |
Investments sold | | | 59,258,984 | | |
Capital shares sold | | | 233,731 | | |
Dividends | | | 1,180,600 | | |
Reclaims | | | 3,786 | | |
Prepaid expenses | | | 4,650 | | |
Trustees' deferred compensation plan | | | 11,609 | | |
Total assets | | | 695,973,662 | | |
Liabilities | |
Payable for: | |
Investments purchased | | | 1,696,385 | | |
Capital shares purchased | | | 67,836,121 | | |
Investment management fees | | | 13,267 | | |
Distribution and/or service fees | | | 937 | | |
Transfer agent fees | | | 85,918 | | |
Administration fees | | | 1,115 | | |
Compensation of board members | | | 101,025 | | |
Expense reimbursement due to Investment Manager | | | 219 | | |
Other expenses | | | 80,368 | | |
Trustees' deferred compensation plan | | | 11,609 | | |
Total liabilities | | | 69,826,964 | | |
Net assets applicable to outstanding capital stock | | $ | 626,146,698 | | |
Represented by | |
Paid-in capital | | $ | 431,753,519 | | |
Undistributed net investment income | | | 734,125 | | |
Accumulated net realized gain | | | 82,317,816 | | |
Unrealized appreciation (depreciation) on: | |
Investments | | | 111,341,966 | | |
Foreign currency translations | | | (728 | ) | |
Total — representing net assets applicable to outstanding capital stock | | $ | 626,146,698 | | |
The accompanying Notes to Financial Statements are an integral part of this statement.
Annual Report 2013
12
Columbia Large Cap Core Fund
Statement of Assets and Liabilities (continued)
February 28, 2013
Class A | |
Net assets | | $ | 120,365,455 | | |
Shares outstanding | | | 7,916,045 | | |
Net asset value per share | | $ | 15.21 | | |
Maximum offering price per share(a) | | $ | 16.14 | | |
Class B | |
Net assets | | $ | 700,206 | | |
Shares outstanding | | | 47,838 | | |
Net asset value per share | | $ | 14.64 | | |
Class C | |
Net assets | | $ | 3,436,337 | | |
Shares outstanding | | | 234,870 | | |
Net asset value per share | | $ | 14.63 | | |
Class I | |
Net assets | | $ | 128,241,358 | | |
Shares outstanding | | | 8,462,269 | | |
Net asset value per share | | $ | 15.15 | | |
Class R5 | |
Net assets | | $ | 2,656 | | |
Shares outstanding | | | 173 | | |
Net asset value per share | | $ | 15.35 | | |
Class W | |
Net assets | | $ | 3,221 | | |
Shares outstanding | | | 212 | | |
Net asset value per share(b) | | $ | 15.20 | | |
Class Z | |
Net assets | | $ | 373,397,465 | | |
Shares outstanding | | | 24,646,645 | | |
Net asset value per share | | $ | 15.15 | | |
(a) The maximum offering price per share is calculated by dividing the net asset value by 1.0 minus the maximum sales charge of 5.75%.
(b) Net asset value per share rounds to this amount due to fractional shares outstanding.
The accompanying Notes to Financial Statements are an integral part of this statement.
Annual Report 2013
13
Columbia Large Cap Core Fund
Statement of Operations
Year Ended February 28, 2013
Net investment income | |
Income: | |
Dividends — unaffiliated issuers | | $ | 15,013,933 | | |
Dividends — affiliated issuers | | | 28,063 | | |
Interest | | | 2,931 | | |
Income from securities lending — net | | | 51,567 | | |
Foreign taxes withheld | | | (12,834 | ) | |
Total income | | | 15,083,660 | | |
Expenses: | |
Investment management fees | | | 5,618,096 | | |
Distribution and/or service fees | |
Class A | | | 294,571 | | |
Class B | | | 6,995 | | |
Class C | | | 27,957 | | |
Class W | | | 8 | | |
Transfer agent fees | |
Class A | | | 227,739 | | |
Class B | | | 1,351 | | |
Class C | | | 5,380 | | |
Class W | | | 6 | | |
Class Z | | | 1,094,665 | | |
Administration fees | | | 470,848 | | |
Compensation of board members | | | 38,019 | | |
Custodian fees | | | 10,274 | | |
Printing and postage fees | | | 82,484 | | |
Registration fees | | | 109,971 | | |
Professional fees | | | 22,057 | | |
Other | | | 33,266 | | |
Total expenses | | | 8,043,687 | | |
Fees waived or expenses reimbursed by Investment Manager and its affiliates | | | (284,624 | ) | |
Expense reductions | | | (5,443 | ) | |
Total net expenses | | | 7,753,620 | | |
Net investment income | | | 7,330,040 | | |
Realized and unrealized gain (loss) — net | |
Net realized gain (loss) on: | |
Investments | | | 163,873,038 | | |
Options contracts written | | | 3,922 | | |
Net realized gain | | | 163,876,960 | | |
Net change in unrealized appreciation (depreciation) on: | |
Investments | | | (78,364,566 | ) | |
Foreign currency translations | | | (77 | ) | |
Net change in unrealized appreciation (depreciation) | | | (78,364,643 | ) | |
Net realized and unrealized gain | | | 85,512,317 | | |
Net increase in net assets resulting from operations | | $ | 92,842,357 | | |
The accompanying Notes to Financial Statements are an integral part of this statement.
Annual Report 2013
14
Columbia Large Cap Core Fund
Statement of Changes in Net Assets
| | | Year Ended
February 28,
2013(a) | | Year Ended
February 29,
2012 | |
Operations | |
Net investment income | | $ | 7,330,040 | | | $ | 11,895,732 | | |
Net realized gain | | | 163,876,960 | | | | 61,028,187 | | |
Net change in unrealized appreciation (depreciation) | | | (78,364,643 | ) | | | (49,265,246 | ) | |
Net increase in net assets resulting from operations | | | 92,842,357 | | | | 23,658,673 | | |
Distributions to shareholders | |
Net investment income | |
Class A | | | (1,076,421 | ) | | | (905,722 | ) | |
Class B | | | (1,354 | ) | | | (1,257 | ) | |
Class C | | | (5,754 | ) | | | (3,321 | ) | |
Class I | | | (1,584,826 | ) | | | (1,919,215 | ) | |
Class R5 | | | (27 | ) | | | — | | |
Class W | | | (29 | ) | | | (23 | ) | |
Class Z | | | (5,353,527 | ) | | | (8,396,793 | ) | |
Net realized gains | |
Class A | | | (4,007,588 | ) | | | — | | |
Class B | | | (23,331 | ) | | | — | | |
Class C | | | (101,913 | ) | | | — | | |
Class I | | | (4,219,734 | ) | | | — | | |
Class R5 | | | (88 | ) | | | — | | |
Class W | | | (108 | ) | | | — | | |
Class Z | | | (15,036,075 | ) | | | — | | |
Total distributions to shareholders | | | (31,410,775 | ) | | | (11,226,331 | ) | |
Increase (decrease) in net assets from capital stock activity | | | (506,304,449 | ) | | | (185,782,787 | ) | |
Proceeds from regulatory settlements (Note 6) | | | — | | | | 64,591 | | |
Total decrease in net assets | | | (444,872,867 | ) | | | (173,285,854 | ) | |
Net assets at beginning of year | | | 1,071,019,565 | | | | 1,244,305,419 | | |
Net assets at end of year | | $ | 626,146,698 | | | $ | 1,071,019,565 | | |
Undistributed net investment income | | $ | 734,125 | | | $ | 1,382,613 | | |
(a) Class R5 shares are for the period from November 8, 2012 (commencement of operations) to February 28, 2013.
The accompanying Notes to Financial Statements are an integral part of this statement.
Annual Report 2013
15
Columbia Large Cap Core Fund
Statement of Changes in Net Assets (continued)
| | | Year Ended February 28, 2013(a) | | Year Ended February 29, 2012 | |
| | | Shares | | Dollars ($) | | Shares | | Dollars ($) | |
Capital stock activity | |
Class A shares | |
Subscriptions(b) | | | 476,836 | | | | 6,902,383 | | | | 520,353 | | | | 6,582,973 | | |
Fund merger | | | — | | | | — | | | | 34,275 | | | | 460,907 | | |
Distributions reinvested | | | 88,054 | | | | 1,257,399 | | | | 15,512 | | | | 197,131 | | |
Redemptions | | | (1,125,296 | ) | | | (16,403,955 | ) | | | (1,563,986 | ) | | | (20,552,117 | ) | |
Net decrease | | | (560,406 | ) | | | (8,244,173 | ) | | | (993,846 | ) | | | (13,311,106 | ) | |
Class B shares | |
Subscriptions | | | 3,698 | | | | 52,520 | | | | 3,792 | | | | 49,240 | | |
Distributions reinvested | | | 1,002 | | | | 13,798 | | | | 52 | | | | 637 | | |
Redemptions(b) | | | (16,725 | ) | | | (232,219 | ) | | | (68,737 | ) | | | (872,316 | ) | |
Net decrease | | | (12,025 | ) | | | (165,901 | ) | | | (64,893 | ) | | | (822,439 | ) | |
Class C shares | |
Subscriptions | | | 61,098 | | | | 857,831 | | | | 33,247 | | | | 403,474 | | |
Fund merger | | | — | | | | — | | | | 14,642 | | | | 190,045 | | |
Distributions reinvested | | | 5,707 | | | | 78,565 | | | | 171 | | | | 2,096 | | |
Redemptions | | | (27,016 | ) | | | (370,894 | ) | | | (50,144 | ) | | | (616,794 | ) | |
Net increase (decrease) | | | 39,789 | | | | 565,502 | | | | (2,084 | ) | | | (21,179 | ) | |
Class I shares | |
Subscriptions | | | 603,974 | | | | 8,378,312 | | | | 6,461,139 | | | | 87,125,127 | | |
Distributions reinvested | | | 408,241 | | | | 5,804,411 | | | | 151,420 | | | | 1,919,181 | | |
Redemptions | | | (1,296,672 | ) | | | (18,797,963 | ) | | | (7,777,573 | ) | | | (102,134,050 | ) | |
Net decrease | | | (284,457 | ) | | | (4,615,240 | ) | | | (1,165,014 | ) | | | (13,089,742 | ) | |
Class R5 shares | |
Subscriptions | | | 173 | | | | 2,500 | | | | — | | | | — | | |
Net increase | | | 173 | | | | 2,500 | | | | — | | | | — | | |
Class Z shares | |
Subscriptions | | | 2,410,751 | | | | 34,663,296 | | | | 4,649,967 | | | | 61,005,623 | | |
Fund merger | | | — | | | | — | | | | 7,530,591 | | | | 100,981,718 | | |
Distributions reinvested | | | 292,445 | | | | 4,153,989 | | | | 330,829 | | | | 4,191,690 | | |
Redemptions | | | (36,835,629 | ) | | | (532,664,422 | ) | | | (24,897,373 | ) | | | (324,717,352 | ) | |
Net decrease | | | (34,132,433 | ) | | | (493,847,137 | ) | | | (12,385,986 | ) | | | (158,538,321 | ) | |
Total net decrease | | | (34,949,359 | ) | | | (506,304,449 | ) | | | (14,611,823 | ) | | | (185,782,787 | ) | |
(a) Class R5 shares are for the period from November 8, 2012 (commencement of operations) to February 28, 2013.
(b) Includes conversions of Class B shares to Class A shares, if any.
The accompanying Notes to Financial Statements are an integral part of this statement.
Annual Report 2013
16
Columbia Large Cap Core Fund
The following table is intended to help you understand the Fund's financial performance. Certain information reflects financial results for a single share of a class held for the periods shown. Per share net investment income (loss) amounts are calculated based on average shares outstanding during the period. Total return assumes reinvestment of all dividends and distributions, if any. Total return does not reflect payment of sales charges, if any, and is not annualized for periods of less than one year.
| | | Year Ended
February 28, | | Year Ended
February 29, | | Year Ended February 28, | |
Class A | | 2013 | | 2012 | | 2011 | | 2010 | | 2009 | |
Per share data | |
Net asset value, beginning of period | | $ | 14.09 | | | $ | 13.73 | | | $ | 11.48 | | | $ | 7.95 | | | $ | 13.66 | | |
Income from investment operations: | |
Net investment income | | | 0.10 | | | | 0.10 | | | | 0.05 | | | | 0.08 | | | | 0.13 | | |
Net realized and unrealized gain (loss) | | | 1.66 | | | | 0.36 | | | | 2.26 | | | | 3.57 | | | | (5.49 | ) | |
Total from investment operations | | | 1.76 | | | | 0.46 | | | | 2.31 | | | | 3.65 | | | | (5.36 | ) | |
Less distributions to shareholders: | |
Net investment income | | | (0.13 | ) | | | (0.10 | ) | | | (0.06 | ) | | | (0.12 | ) | | | (0.10 | ) | |
Net realized gains | | | (0.51 | ) | | | — | | | | — | | | | — | | | | (0.25 | ) | |
Total distributions to shareholders | | | (0.64 | ) | | | (0.10 | ) | | | (0.06 | ) | | | (0.12 | ) | | | (0.35 | ) | |
Proceeds from regulatory settlements | | | — | | | | 0.00 | (a) | | | — | | | | 0.00 | (a) | | | — | | |
Net asset value, end of period | | $ | 15.21 | | | $ | 14.09 | | | $ | 13.73 | | | $ | 11.48 | | | $ | 7.95 | | |
Total return | | | 12.83 | % | | | 3.45 | % | | | 20.16 | % | | | 45.99 | % | | | (40.12 | %) | |
Ratios to average net assets(b)(c) | |
Total gross expenses | | | 1.23 | % | | | 1.21 | %(d) | | | 1.20 | %(d) | | | 1.18 | %(d) | | | 1.15 | %(d) | |
Total net expenses(e) | | | 1.19 | %(f) | | | 1.16 | %(d)(f) | | | 1.20 | %(d)(f) | | | 1.18 | %(d)(f) | | | 1.15 | %(d)(f) | |
Net investment income | | | 0.70 | % | | | 0.77 | % | | | 0.38 | % | | | 0.78 | % | | | 1.10 | % | |
Supplemental data | |
Net assets, end of period (in thousands) | | $ | 120,365 | | | $ | 119,434 | | | $ | 130,039 | | | $ | 131,652 | | | $ | 95,714 | | |
Portfolio turnover | | | 147 | % | | | 197 | % | | | 171 | % | | | 165 | % | | | 156 | % | |
Notes to Financial Highlights
(a) Rounds to zero.
(b) In addition to the fees and expenses which the Fund bears directly, the Fund indirectly bears a pro rata share of the fees and expenses of the acquired funds in which it invests. Such indirect expenses are not included in the reported expense ratios.
(c) Certain line items from prior years have been reclassified to conform to the current presentation.
(d) Ratios include line of credit interest expense which rounds to less than 0.01%.
(e) Total net expenses include the impact of certain waivers/reimbursements made by the Investment Manager and certain of its affiliates, if applicable.
(f) The benefits derived from expense reductions had an impact of less than 0.01%.
The accompanying Notes to Financial Statements are an integral part of this statement.
Annual Report 2013
17
Columbia Large Cap Core Fund
Financial Highlights (continued)
| | | Year Ended
February 28, | | Year Ended
February 29, | | Year Ended February 28, | |
Class B | | 2013 | | 2012 | | 2011 | | 2010 | | 2009 | |
Per share data | |
Net asset value, beginning of period | | $ | 13.59 | | | $ | 13.25 | | | $ | 11.11 | | | $ | 7.71 | | | $ | 13.23 | | |
Income from investment operations: | |
Net investment income (loss) | | | (0.01 | ) | | | (0.00 | )(a) | | | (0.04 | ) | | | 0.00 | (a) | | | 0.03 | | |
Net realized and unrealized gain (loss) | | | 1.60 | | | | 0.36 | | | | 2.18 | | | | 3.44 | | | | (5.28 | ) | |
Total from investment operations | | | 1.59 | | | | 0.36 | | | | 2.14 | | | | 3.44 | | | | (5.25 | ) | |
Less distributions to shareholders: | |
Net investment income | | | (0.03 | ) | | | (0.02 | ) | | | — | | | | (0.04 | ) | | | (0.02 | ) | |
Net realized gains | | | (0.51 | ) | | | — | | | | — | | | | — | | | | (0.25 | ) | |
Total distributions to shareholders | | | (0.54 | ) | | | (0.02 | ) | | | — | | | | (0.04 | ) | | | (0.27 | ) | |
Proceeds from regulatory settlements | | | — | | | | 0.00 | (a) | | | — | | | | 0.00 | (a) | | | — | | |
Net asset value, end of period | | $ | 14.64 | | | $ | 13.59 | | | $ | 13.25 | | | $ | 11.11 | | | $ | 7.71 | | |
Total return | | | 11.93 | % | | | 2.72 | % | | | 19.26 | % | | | 44.74 | % | | | (40.51 | %) | |
Ratios to average net assets(b)(c) | |
Total gross expenses | | | 1.98 | % | | | 1.96 | %(d) | | | 1.95 | %(d) | | | 1.93 | %(d) | | | 1.90 | %(d) | |
Total net expenses(e) | | | 1.94 | %(f) | | | 1.91 | %(d)(f) | | | 1.95 | %(d)(f) | | | 1.93 | %(d)(f) | | | 1.90 | %(d)(f) | |
Net investment income (loss) | | | (0.05 | %) | | | (0.04 | %) | | | (0.36 | %) | | | 0.04 | % | | | 0.28 | % | |
Supplemental data | |
Net assets, end of period (in thousands) | | $ | 700 | | | $ | 813 | | | $ | 1,653 | | | $ | 2,696 | | | $ | 3,300 | | |
Portfolio turnover | | | 147 | % | | | 197 | % | | | 171 | % | | | 165 | % | | | 156 | % | |
Notes to Financial Highlights
(a) Rounds to zero.
(b) In addition to the fees and expenses which the Fund bears directly, the Fund indirectly bears a pro rata share of the fees and expenses of the acquired funds in which it invests. Such indirect expenses are not included in the reported expense ratios.
(c) Certain line items from prior years have been reclassified to conform to the current presentation.
(d) Ratios include line of credit interest expense which rounds to less than 0.01%.
(e) Total net expenses include the impact of certain waivers/reimbursements made by the Investment Manager and certain of its affiliates, if applicable.
(f) The benefits derived from expense reductions had an impact of less than 0.01%.
The accompanying Notes to Financial Statements are an integral part of this statement.
Annual Report 2013
18
Columbia Large Cap Core Fund
Financial Highlights (continued)
| | | Year Ended
February 28, | | Year Ended
February 29, | | Year Ended February 28, | |
Class C | | 2013 | | 2012 | | 2011 | | 2010 | �� | 2009 | |
Per share data | |
Net asset value, beginning of period | | $ | 13.58 | | | $ | 13.25 | | | $ | 11.11 | | | $ | 7.70 | | | $ | 13.23 | | |
Income from investment operations: | |
Net investment income (loss) | | | (0.01 | ) | | | 0.00 | (a) | | | (0.04 | ) | | | 0.00 | (a) | | | 0.04 | | |
Net realized and unrealized gain (loss) | | | 1.60 | | | | 0.35 | | | | 2.18 | | | | 3.45 | | | | (5.30 | ) | |
Total from investment operations | | | 1.59 | | | | 0.35 | | | | 2.14 | | | | 3.45 | | | | (5.26 | ) | |
Less distributions to shareholders: | |
Net investment income | | | (0.03 | ) | | | (0.02 | ) | | | — | | | | (0.04 | ) | | | (0.02 | ) | |
Net realized gains | | | (0.51 | ) | | | — | | | | — | | | | — | | | | (0.25 | ) | |
Total distributions to shareholders | | | (0.54 | ) | | | (0.02 | ) | | | — | | | | (0.04 | ) | | | (0.27 | ) | |
Proceeds from regulatory settlements | | | — | | | | 0.00 | (a) | | | — | | | | 0.00 | (a) | | | — | | |
Net asset value, end of period | | $ | 14.63 | | | $ | 13.58 | | | $ | 13.25 | | | $ | 11.11 | | | $ | 7.70 | | |
Total return | | | 11.94 | % | | | 2.64 | % | | | 19.26 | % | | | 44.93 | % | | | (40.58 | %) | |
Ratios to average net assets(b)(c) | |
Total gross expenses | | | 1.98 | % | | | 1.96 | %(d) | | | 1.95 | %(d) | | | 1.93 | %(d) | | | 1.90 | %(d) | |
Total net expenses(e) | | | 1.94 | %(f) | | | 1.91 | %(d)(f) | | | 1.95 | %(d)(f) | | | 1.93 | %(d)(f) | | | 1.90 | %(d)(f) | |
Net investment income (loss) | | | (0.04 | %) | | | 0.02 | % | | | (0.36 | %) | | | 0.03 | % | | | 0.39 | % | |
Supplemental data | |
Net assets, end of period (in thousands) | | $ | 3,436 | | | $ | 2,649 | | | $ | 2,612 | | | $ | 2,449 | | | $ | 1,559 | | |
Portfolio turnover | | | 147 | % | | | 197 | % | | | 171 | % | | | 165 | % | | | 156 | % | |
Notes to Financial Highlights
(a) Rounds to zero.
(b) In addition to the fees and expenses which the Fund bears directly, the Fund indirectly bears a pro rata share of the fees and expenses of the acquired funds in which it invests. Such indirect expenses are not included in the reported expense ratios.
(c) Certain line items from prior years have been reclassified to conform to the current presentation.
(d) Ratios include line of credit interest expense which rounds to less than 0.01%.
(e) Total net expenses include the impact of certain waivers/reimbursements made by the Investment Manager and certain of its affiliates, if applicable.
(f) The benefits derived from expense reductions had an impact of less than 0.01%.
The accompanying Notes to Financial Statements are an integral part of this statement.
Annual Report 2013
19
Columbia Large Cap Core Fund
Financial Highlights (continued)
Class I | | Year Ended
February 28,
2013 | | Year Ended
February 29,
2012 | | Year Ended
February 28,
2011(a) | |
Per share data | |
Net asset value, beginning of period | | $ | 14.04 | | | $ | 13.69 | | | $ | 11.78 | | |
Income from investment operations: | |
Net investment income | | | 0.16 | | | | 0.15 | | | | 0.04 | | |
Net realized and unrealized gain | | | 1.65 | | | | 0.36 | | | | 1.96 | | |
Total from investment operations | | | 1.81 | | | | 0.51 | | | | 2.00 | | |
Less distributions to shareholders: | |
Net investment income | | | (0.19 | ) | | | (0.16 | ) | | | (0.09 | ) | |
Net realized gains | | | (0.51 | ) | | | — | | | | — | | |
Total distributions to shareholders | | | (0.70 | ) | | | (0.16 | ) | | | (0.09 | ) | |
Proceeds from regulatory settlements | | | — | | | | 0.00 | (b) | | | — | | |
Net asset value, end of period | | $ | 15.15 | | | $ | 14.04 | | | $ | 13.69 | | |
Total return | | | 13.24 | % | | | 3.82 | % | | | 16.99 | % | |
Ratios to average net assets(c)(d) | |
Total gross expenses | | | 0.79 | % | | | 0.76 | %(e) | | | 0.79 | %(e)(f) | |
Total net expenses(g) | | | 0.79 | % | | | 0.76 | %(e)(h) | | | 0.79 | %(e)(f)(h) | |
Net investment income | | | 1.11 | % | | | 1.18 | % | | | 0.64 | %(f) | |
Supplemental data | |
Net assets, end of period (in thousands) | | $ | 128,241 | | | $ | 122,828 | | | $ | 135,677 | | |
Portfolio turnover | | | 147 | % | | | 197 | % | | | 171 | % | |
Notes to Financial Highlights
(a) For the period from September 27, 2010 (commencement of operations) to February 28, 2011.
(b) Rounds to zero.
(c) In addition to the fees and expenses which the Fund bears directly, the Fund indirectly bears a pro rata share of the fees and expenses of the acquired funds in which it invests. Such indirect expenses are not included in the reported expense ratios.
(d) Certain line items from prior years have been reclassified to conform to the current presentation.
(e) Ratios include line of credit interest expense which rounds to less than 0.01%.
(f) Annualized.
(g) Total net expenses include the impact of certain waivers/reimbursements made by the Investment Manager and certain of its affiliates, if applicable.
(h) The benefits derived from expense reductions had an impact of less than 0.01%.
The accompanying Notes to Financial Statements are an integral part of this statement.
Annual Report 2013
20
Columbia Large Cap Core Fund
Financial Highlights (continued)
Class R5 | | Year Ended
February 28,
2013(a) | |
Per share data | |
Net asset value, beginning of period | | $ | 14.45 | | |
Income from investment operations: | |
Net investment income | | | 0.06 | | |
Net realized and unrealized gain | | | 1.51 | | |
Total from investment operations | | | 1.57 | | |
Less distributions to shareholders: | |
Net investment income | | | (0.16 | ) | |
Net realized gains | | | (0.51 | ) | |
Total distributions to shareholders | | | (0.67 | ) | |
Net asset value, end of period | | $ | 15.35 | | |
Total return | | | 11.15 | % | |
Ratios to average net assets(b) | |
Total gross expenses | | | 0.79 | %(c) | |
Total net expenses(d) | | | 0.79 | %(c) | |
Net investment income | | | 1.37 | %(c) | |
Supplemental data | |
Net assets, end of period (in thousands) | | $ | 3 | | |
Portfolio turnover | | | 147 | % | |
Notes to Financial Highlights
(a) For the period from November 8, 2012 (commencement of operations) to February 28, 2013.
(b) In addition to the fees and expenses which the Fund bears directly, the Fund indirectly bears a pro rata share of the fees and expenses of the acquired funds in which it invests. Such indirect expenses are not included in the reported expense ratios.
(c) Annualized.
(d) Total net expenses include the impact of certain waivers/reimbursements made by the Investment Manager and certain of its affiliates, if applicable.
The accompanying Notes to Financial Statements are an integral part of this statement.
Annual Report 2013
21
Columbia Large Cap Core Fund
Financial Highlights (continued)
Class W | | Year Ended
February 28,
2013 | | Year Ended
February 29,
2012 | | Year Ended
February 28,
2011(a) | |
Per share data | |
Net asset value, beginning of period | | $ | 14.09 | | | $ | 13.73 | | | $ | 11.80 | | |
Income from investment operations: | |
Net investment income | | | 0.10 | | | | 0.11 | | | | 0.03 | | |
Net realized and unrealized gain | | | 1.66 | | | | 0.36 | | | | 1.95 | | |
Total from investment operations | | | 1.76 | | | | 0.47 | | | | 1.98 | | |
Less distributions to shareholders: | |
Net investment income | | | (0.14 | ) | | | (0.11 | ) | | | (0.05 | ) | |
Net realized gains | | | (0.51 | ) | | | — | | | | — | | |
Total distributions to shareholders | | | (0.65 | ) | | | (0.11 | ) | | | (0.05 | ) | |
Proceeds from regulatory settlements | | | — | | | | 0.00 | (b) | | | — | | |
Net asset value, end of period | | $ | 15.20 | | | $ | 14.09 | | | $ | 13.73 | | |
Total return | | | 12.78 | % | | | 3.48 | % | | | 16.77 | % | |
Ratios to average net assets(c)(d) | |
Total gross expenses | | | 1.20 | % | | | 1.18 | %(e) | | | 1.16 | %(e)(f) | |
Total net expenses(g) | | | 1.17 | %(h) | | | 1.14 | %(e)(h) | | | 1.16 | %(e)(f)(h) | |
Net investment income | | | 0.72 | % | | | 0.81 | % | | | 0.50 | %(f) | |
Supplemental data | |
Net assets, end of period (in thousands) | | $ | 3 | | | $ | 3 | | | $ | 3 | | |
Portfolio turnover | | | 147 | % | | | 197 | % | | | 171 | % | |
Notes to Financial Highlights
(a) For the period from September 27, 2010 (commencement of operations) to February 28, 2011.
(b) Rounds to zero.
(c) In addition to the fees and expenses which the Fund bears directly, the Fund indirectly bears a pro rata share of the fees and expenses of the acquired funds in which it invests. Such indirect expenses are not included in the reported expense ratios.
(d) Certain line items from prior years have been reclassified to conform to the current presentation.
(e) Ratios include line of credit interest expense which rounds to less than 0.01%.
(f) Annualized.
(g) Total net expenses include the impact of certain waivers/reimbursements made by the Investment Manager and certain of its affiliates, if applicable.
(h) The benefits derived from expense reductions had an impact of less than 0.01%.
The accompanying Notes to Financial Statements are an integral part of this statement.
Annual Report 2013
22
Columbia Large Cap Core Fund
Financial Highlights (continued)
| | | Year Ended
February 28, | | Year Ended
February 29, | | Year Ended February 28, | |
Class Z | | 2013 | | 2012 | | 2011 | | 2010 | | 2009 | |
Per share data | |
Net asset value, beginning of period | | $ | 14.04 | | | $ | 13.69 | | | $ | 11.45 | | | $ | 7.93 | | | $ | 13.66 | | |
Income from investment operations: | |
Net investment income | | | 0.13 | | | | 0.13 | | | | 0.08 | | | | 0.11 | | | | 0.16 | | |
Net realized and unrealized gain (loss) | | | 1.66 | | | | 0.36 | | | | 2.25 | | | | 3.55 | | | | (5.48 | ) | |
Total from investment operations | | | 1.79 | | | | 0.49 | | | | 2.33 | | | | 3.66 | | | | (5.32 | ) | |
Less distributions to shareholders: | |
Net investment income | | | (0.17 | ) | | | (0.14 | ) | | | (0.09 | ) | | | (0.14 | ) | | | (0.16 | ) | |
Net realized gains | | | (0.51 | ) | | | — | | | | — | | | | — | | | | (0.25 | ) | |
Total distributions to shareholders | | | (0.68 | ) | | | (0.14 | ) | | | (0.09 | ) | | | (0.14 | ) | | | (0.41 | ) | |
Proceeds from regulatory settlements | | | — | | | | 0.00 | (a) | | | — | | | | 0.00 | (a) | | | — | | |
Net asset value, end of period | | $ | 15.15 | | | $ | 14.04 | | | $ | 13.69 | | | $ | 11.45 | | | $ | 7.93 | | |
Total return | | | 13.08 | % | | | 3.65 | % | | | 20.40 | % | | | 46.30 | % | | | (39.95 | %) | |
Ratios to average net assets(b)(c) | |
Total gross expenses | | | 0.98 | % | | | 0.95 | %(d) | | | 0.95 | %(d) | | | 0.93 | %(d) | | | 0.90 | %(d) | |
Total net expenses(e) | | | 0.93 | %(f) | | | 0.91 | %(d)(f) | | | 0.95 | %(d)(f) | | | 0.93 | %(d)(f) | | | 0.90 | %(d)(f) | |
Net investment income | | | 0.90 | % | | | 0.99 | % | | | 0.64 | % | | | 1.03 | % | | | 1.35 | % | |
Supplemental data | |
Net assets, end of period (in thousands) | | $ | 373,397 | | | $ | 825,292 | | | $ | 974,320 | | | $ | 988,640 | | | $ | 712,304 | | |
Portfolio turnover | | | 147 | % | | | 197 | % | | | 171 | % | | | 165 | % | | | 156 | % | |
Notes to Financial Highlights
(a) Rounds to zero.
(b) In addition to the fees and expenses which the Fund bears directly, the Fund indirectly bears a pro rata share of the fees and expenses of the acquired funds in which it invests. Such indirect expenses are not included in the reported expense ratios.
(c) Certain line items from prior years have been reclassified to conform to the current presentation.
(d) Ratios include line of credit interest expense which rounds to less than 0.01%.
(e) Total net expenses include the impact of certain waivers/reimbursements made by the Investment Manager and certain of its affiliates, if applicable.
(f) The benefits derived from expense reductions had an impact of less than 0.01%.
The accompanying Notes to Financial Statements are an integral part of this statement.
Annual Report 2013
23
Columbia Large Cap Core Fund
Notes to Financial Statements
February 28, 2013
Note 1. Organization
Columbia Large Cap Core Fund (the Fund), a series of Columbia Funds Series Trust (the Trust), is a diversified fund. The Trust is registered under the Investment Company Act of 1940, as amended (the 1940 Act), as an open-end management investment company organized as a Delaware statutory trust.
Fund Shares
The Trust may issue an unlimited number of shares (without par value). The Fund offers Class A, Class B, Class C, Class I, Class R5, Class W and Class Z shares. All share classes have identical voting, dividend and liquidation rights. Each share class has its own expense structure and sales charges, as applicable.
Class A shares are subject to a maximum front-end sales charge of 5.75% based on the initial investment amount. Class A shares purchased without an initial sales charge in accounts aggregating $1 million to $50 million at the time of purchase are subject to a contingent deferred sales charge (CDSC) if the shares are sold within 18 months of purchase, charged as follows: 1.00% CDSC if redeemed within 12 months of purchase, and 0.50% CDSC if redeemed more than 12, but less than 18, months after purchase.
Class B shares may be subject to a maximum CDSC of 5.00% based upon the holding period after purchase. Class B shares will generally convert to Class A shares eight years after purchase. The Fund no longer accepts investments by new or existing investors in the Fund's Class B shares, except in connection with the reinvestment of any dividend and/or capital gain distributions in Class B shares of the Fund and exchanges by existing Class B shareholders of certain other funds within the Columbia Family of Funds.
Class C shares are subject to a 1.00% CDSC on shares redeemed within one year of purchase.
Class I shares are not subject to sales charges and are only available to the Columbia Family of Funds.
Class R5 shares are not subject to sales charges and are only available to investors purchasing through authorized investment professionals. Class R5 shares commenced operations on November 8, 2012.
Class W shares are not subject to sales charges and are only available to investors purchasing through authorized investment programs managed by investment professionals, including discretionary managed account programs.
Class Z shares are not subject to sales charges, and are only available to certain investors.
Note 2. Summary of Significant Accounting Policies
Use of Estimates
The preparation of financial statements in accordance with U.S. generally accepted accounting principles (GAAP) requires management to make certain estimates and assumptions that affect the reported amounts of assets and liabilities, the disclosure of contingent assets and liabilities at the date of the financial statements and the reported amounts of revenue and expenses during the reporting period. Actual results could differ from those estimates.
The following is a summary of significant accounting policies consistently followed by the Fund in the preparation of its financial statements.
Security Valuation
All equity securities are valued at the close of business of the New York Stock Exchange (NYSE). Equity securities are valued at the last quoted sales price on the principal exchange or market on which they trade, except for securities traded on the NASDAQ Stock Market, which are valued at the NASDAQ official close price. Unlisted securities or listed securities for which there were no sales during the day are valued at the mean of the latest quoted bid and ask prices on such exchanges or markets.
Foreign securities are valued based on quotations from the principal market in which such securities are normally traded. If any foreign share prices are not readily available as a result of limited share activity the securities are valued at the mean of the latest quoted bid and ask prices on such exchanges or markets. Foreign currency exchange rates are generally determined at 4:00 p.m. Eastern (U.S.) time. However, many securities markets and exchanges outside the U.S. close prior to the close of the NYSE; therefore, the closing prices for securities in such markets or on such exchanges may not fully reflect events that occur after such close but before the close of the NYSE. In those situations, foreign securities will be fair valued pursuant to the policy adopted by the Board of Trustees (the Board), including utilizing a third party pricing service to determine these fair values. The third party pricing service takes into account multiple factors, including, but not limited to, movements in the U.S. securities markets, certain depositary receipts, futures contracts and foreign exchange rates that have occurred subsequent to the close of the foreign exchange or market, to determine a good faith estimate that reasonably reflects the current market conditions as of the close of the NYSE. The fair value of a security is likely to be different from the quoted or published price, if available.
Annual Report 2013
24
Columbia Large Cap Core Fund
Notes to Financial Statements (continued)
February 28, 2013
Investments in other open-end investment companies, including money market funds, are valued at net asset value.
Option contracts are valued at the mean of the latest quoted bid and asked prices on their primary exchanges. Option contracts, including over-the-counter (OTC) option contracts, with no readily available market value are valued using quotations obtained from independent brokers as of the close of the NYSE.
Investments for which market quotations are not readily available, or that have quotations which management believes are not reliable, are valued at fair value as determined in good faith under consistently applied procedures established by and under the general supervision of the Board. If a security or class of securities (such as foreign securities) is valued at fair value, such value is likely to be different from the last quoted market price for the security.
The determination of fair value often requires significant judgment. To determine fair value, management may use assumptions including but not limited to future cash flows and estimated risk premiums. Multiple inputs from various sources may be used to determine fair value.
Foreign Currency Transactions and Translations
The values of all assets and liabilities denominated in foreign currencies are translated into U.S. dollars at that day's exchange rates. Net realized and unrealized gains (losses) on foreign currency transactions and translations include gains (losses) arising from the fluctuation in exchange rates between trade and settlement dates on securities transactions, gains (losses) arising from the disposition of foreign currency and currency gains (losses) between the accrual and payment dates on dividends, interest income and foreign withholding taxes.
For financial statement purposes, the Fund does not distinguish that portion of gains (losses) on investments which is due to changes in foreign exchange rates from that which is due to changes in market prices of the investments. Such fluctuations are included with the net realized and unrealized gains (losses) on investments in the Statement of Operations.
Derivative Instruments
The Fund invests in certain derivative instruments, as detailed below, to meet its investment objectives. Derivatives are instruments whose values depend on, or are derived from, in whole or in part, the value of one or more other assets, such as securities, currencies, commodities or indices. Derivative instruments may be used to maintain cash reserves while maintaining exposure to certain other assets, to offset anticipated declines in values of investments, to facilitate trading, to reduce transaction costs and to pursue higher investment returns. The Fund may also use derivative
instruments to mitigate certain investment risks, such as foreign currency exchange rate risk, interest rate risk and credit risk. Derivatives may involve various risks, including the potential inability of the counterparty to fulfill its obligation under the terms of the contract, the potential for an illiquid secondary market and the potential for market movements which may expose the Fund to gains or losses in excess of the amount shown in the Statement of Assets and Liabilities.
The Fund and any counterparty are required to maintain an agreement that requires the Fund and that counterparty to monitor (on a daily basis) the net fair value of all derivatives entered into pursuant to the agreement between the Fund and such counterparty. If the net fair value of such derivatives between the Fund and that counterparty exceeds a certain threshold (as defined in the agreement), the Fund or the counterparty (as the case may be) is required to post cash and/or securities as collateral. Fair values of derivatives presented in the financial statements are not netted with the fair value of other derivatives or with any collateral amounts posted by the Fund or any counterparty.
Options Contracts
Options are contracts which entitle the holder to purchase or sell securities or other identified assets at a specified price, or in the case of index option contracts, to receive or pay the difference between the index value and the strike price of the index option contract. The Fund purchased and wrote option contracts to enhance total return. Completion of transactions for option contracts traded in the OTC market depends upon the performance of the other party. Cash collateral may be collected or posted by the Fund to secure certain OTC option contract trades. Cash collateral held or posted by the Fund for such option contract trades must be returned to the counterparty or the Fund upon closure, exercise or expiration of the contract.
Option contracts purchased are recorded as investments and options contracts written are recorded as liabilities of the Fund. The Fund will realize a gain or loss when the option contract expires. When option contracts are exercised, the proceeds on sales for a written call or purchased put option contract, or the purchase cost for a written put or purchased call option contract, is adjusted by the amount of premium received or paid.
The risk in buying an option contract is that the Fund pays a premium whether or not the option contract is exercised. The Fund also has the additional risk of being unable to enter into a closing transaction if a liquid secondary market does not exist. The risk in writing a call option contract is that the Fund gives up the opportunity for profit if the market price of the
Annual Report 2013
25
Columbia Large Cap Core Fund
Notes to Financial Statements (continued)
February 28, 2013
security increases. The risk in writing a put option contract is that the Fund may incur a loss if the market price of the security decreases and the option contract is exercised. The Fund's maximum payout in the case of written put option contracts represents the maximum potential amount of future payments (undiscounted) that the Fund could be required to make under the contract. For OTC options contracts, the transaction is also subject to counterparty credit risk. The maximum payout amount may be offset by the subsequent sale, if any, of assets obtained upon the exercise of the put option contracts by holders of the option contracts or proceeds received upon entering into the contracts.
Contracts and premiums associated with options contracts written for the year ended February 28, 2013 are as follows:
| | | Calls | |
| | | Contracts | | Premiums | |
Balance at February 29, 2012 | | | — | | | $ | — | | |
Opened | | | 700 | | | | 13,282 | | |
Closed | | | (700 | ) | | | (13,282 | ) | |
Balance at February 28, 2013 | | | — | | | $ | — | | |
Effects of Derivative Transactions in the Financial Statements
The following tables are intended to provide additional information about the effect of derivatives on the financial statements of the Fund, including: the fair value of derivatives by risk category and the location of those fair values in the Statement of Assets and Liabilities; the impact of derivative transactions on the Fund's operations over the period including realized gains or losses and unrealized gains or losses. The derivative schedules following the Portfolio of Investments present additional information regarding derivative instruments outstanding at the end of the period, if any.
The following table is a summary of the fair value of derivative instruments at February 28, 2013:
At February 28, 2013, the Fund had no outstanding derivatives.
The effect of derivative instruments in the Statement of Operations for the year ended February 28, 2013:
Amount of Realized Gain (Loss) on Derivatives Recognized in Income | |
Risk Exposure
Category | | Options Contracts
Written and Purchased ($) | |
Equity contracts | | | 3,922 | | |
The following table is a summary of the volume of derivative instruments for the year ended February 28, 2013:
Derivative Instrument | | Contracts Opened | |
Options contracts | | | 700 | | |
Security Transactions
Security transactions are accounted for on the trade date. Cost is determined and gains (losses) are based upon the specific identification method for both financial statement and federal income tax purposes.
Income Recognition
Corporate actions and dividend income are recorded net of any non-reclaimable tax withholdings, on the ex-dividend date or upon receipt of ex-dividend notification in the case of certain foreign securities.
The Fund may receive distributions from holdings in business development companies (BDCs), exchange traded funds (ETFs) and real estate investment trusts (REITs), which report information on the character of their distributions annually. These distributions are allocated to dividend income, capital gain and return of capital based on estimates made by the Fund's management if actual information has not yet been reported. Return of capital is recorded as a reduction of the cost basis of securities held. If the Fund no longer owns the applicable securities, return of capital is recorded as a realized gain. Management's estimates are subsequently adjusted when the actual character of the distributions is disclosed by the BDCs, ETFs and REITs, which could result in a proportionate change in return of capital to shareholders.
Awards from class action litigation are recorded as a reduction of cost basis if the Fund still owns the applicable securities on the payment date. If the Fund no longer owns the applicable securities, the proceeds are recorded as realized gains.
Expenses
General expenses of the Trust are allocated to the Fund and other funds of the Trust based upon relative net assets or other expense allocation methodologies determined by the nature of the expense. Expenses directly attributable to the Fund are charged to the Fund. Expenses directly attributable to a specific class of shares are charged to that share class.
Determination of Class Net Asset Value
All income, expenses (other than class-specific expenses, which are charged to that share class, as shown in the Statement of Operations) and realized and unrealized gains (losses) are allocated to each class of the Fund on a daily basis, based on the relative net assets of each class, for purposes of determining the net asset value of each class.
Federal Income Tax Status
The Fund intends to qualify each year as a regulated investment company under Subchapter M of the Internal Revenue Code, as amended, and will distribute substantially
Annual Report 2013
26
Columbia Large Cap Core Fund
Notes to Financial Statements (continued)
February 28, 2013
all of its taxable income (including net short-term capital gains), if any, for its tax year, and as such will not be subject to federal income taxes. In addition, the Fund intends to distribute in each calendar year substantially all of its net investment income, capital gains and certain other amounts, if any, such that the Fund should not be subject to federal excise tax. Therefore, no federal income or excise tax provision is recorded.
Distributions to Shareholders
Distributions from net investment income, if any, are declared and paid semi-annually. Net realized capital gains, if any, are distributed at least annually. Income distributions and capital gain distributions are determined in accordance with federal income tax regulations, which may differ from GAAP.
Guarantees and Indemnifications
Under the Trust's organizational documents and, in some cases, by contract, its officers and trustees are indemnified against certain liabilities arising out of the performance of their duties to the Trust or its funds. In addition, certain of the Fund's contracts with its service providers contain general indemnification clauses. The Fund's maximum exposure under these arrangements is unknown since the amount of any future claims that may be made against the Fund cannot be determined, and the Fund has no historical basis for predicting the likelihood of any such claims.
Recent Accounting Pronouncement
Disclosures about Offsetting Assets and Liabilities
In December 2011, the Financial Accounting Standards Board (FASB) issued Accounting Standards Update (ASU) No. 2011-11, Disclosures about Offsetting Assets and Liabilities. The objective of the FASB is to enhance current disclosure requirements on offsetting of certain assets and liabilities and to enable financial statement users to compare financial statements prepared under GAAP and International Financial Reporting Standards.
Specifically, ASU No. 2011-11 requires an entity to disclose both gross and net information for derivatives and other financial instruments that are subject to a master netting arrangement or similar agreement. The standard requires disclosure of collateral received in connection with the master netting agreements or similar agreements. The effective date of ASU No. 2011-11 is for interim and annual periods beginning on or after January 1, 2013. At this time, management is evaluating the implications of this guidance and the impact it will have on the financial statement amounts and footnote disclosures, if any.
Note 3. Fees and Compensation Paid to Affiliates
Investment Management Fees
Under an Investment Management Services Agreement, Columbia Management Investment Advisers, LLC (the Investment Manager), a wholly-owned subsidiary of Ameriprise Financial, Inc. (Ameriprise Financial), determines which securities will be purchased, held or sold. The investment management fee is an annual fee that is equal to a percentage of the Fund's average daily net assets that declines from 0.71% to 0.54% as the Fund's net assets increase. The effective investment management fee rate for the year ended February 28, 2013 was 0.69% of the Fund's average daily net assets.
Administration Fees
Under an Administrative Services Agreement, the Investment Manager also serves as the Fund Administrator. The Fund pays the Fund Administrator an annual fee for administration and accounting services equal to a percentage of the Fund's average daily net assets that declines from 0.06% to 0.03% as the Fund's net assets increase. The effective administration fee rate for the year ended February 28, 2013 was 0.06% of the Fund's average daily net assets.
Other Expenses
Other expenses are for, among other things, certain expenses of the Fund or the Board, including: Fund boardroom and office expense, employee compensation, employee health and retirement benefits, and certain other expenses. Payment of these Fund and Board expenses is facilitated by a company providing limited administrative services to the Fund and the Board. For the year ended February 28, 2013, other expenses paid to this company were $3,360.
Compensation of Board Members
Board members are compensated for their services to the Fund as disclosed in the Statement of Operations. Under a Deferred Compensation Plan (the Plan), the Board members who are not "interested persons" of the Fund, as defined under the 1940 Act, may elect to defer payment of up to 100% of their compensation. Deferred amounts are treated as though equivalent dollar amounts had been invested in shares of certain funds managed by the Investment Manager. The Fund's liability for these amounts is adjusted for market value changes and remains in the Fund until distributed in accordance with the Plan.
Annual Report 2013
27
Columbia Large Cap Core Fund
Notes to Financial Statements (continued)
February 28, 2013
Transfer Agent Fees
Under a Transfer and Dividend Disbursing Agent Agreement, Columbia Management Investment Services Corp. (the Transfer Agent), an affiliate of the Investment Manager and a wholly-owned subsidiary of Ameriprise Financial, is responsible for providing transfer agency services to the Fund. The Transfer Agent has contracted with Boston Financial Data Services (BFDS) to serve as sub-transfer agent.
The Transfer Agent receives monthly account-based service fees based on the number of open accounts and is reimbursed by the Fund for the fees and expenses the Transfer Agent pays to financial intermediaries that maintain omnibus accounts with the Fund that is a percentage of the average aggregate value of the Fund's shares maintained in each such omnibus account (other than omnibus accounts for which American Enterprise Investment Services Inc. is the broker of record or accounts where the beneficial shareholder is a customer of Ameriprise Financial Services, Inc., which are paid a per account fee). The Transfer Agent pays the fees of BFDS for services as sub-transfer agent and is not entitled to reimbursement for such fees from the Fund (with the exception of out-of-pocket fees).
The Transfer Agent also receives compensation from fees for various shareholder services and reimbursements for certain out-of-pocket fees. Class I shares do not pay transfer agent fees. Total transfer agent fees for Class R5 shares are subject to an annual limitation of not more than 0.05% of the average daily net assets attributable to Class R5 shares.
For the year ended February 28, 2013, the Fund's effective transfer agent fee rates as a percentage of average daily net assets of each class were as follows:
Class A | | | 0.19 | % | |
Class B | | | 0.19 | | |
Class C | | | 0.19 | | |
Class R5* | | | 0.05 | | |
Class W | | | 0.20 | | |
Class Z | | | 0.19 | | |
*Annualized.
An annual minimum account balance fee of $20 may apply to certain accounts with a value below the Fund's initial minimum investment requirements to reduce the impact of small accounts on transfer agent fees. These minimum account balance fees are recorded as part of expense reductions in the Statement of Operations. For the year ended February 28, 2013, these minimum account balance fees reduced total expenses by $5,443.
Distribution and Service Fees
The Fund has an agreement with Columbia Management Investment Distributors, Inc. (the Distributor), an affiliate of the Investment Manager and a wholly-owned subsidiary of Ameriprise Financial, for distribution and shareholder services. Pursuant to Rule 12b-1 under the 1940 Act, the Board has approved, and the Fund has adopted, distribution and shareholder service plans (the Plans) which set the distribution and service fees for the Fund. These fees are calculated daily and are intended to compensate the Distributor and/or eligible selling and/or servicing agents for selling shares of the Fund and providing services to investors.
The Plans require the payment of a monthly combined distribution and service fee to the Distributor at the maximum annual rate of 0.25% of the average daily net assets attributable to Class A shares of the Fund. The Plans also require the payment of a monthly service fee at the maximum annual rate of 0.25% of the average daily net assets attributable to Class B, Class C and Class W shares of the Fund and the payment of a monthly distribution fee at the maximum annual rate of 0.75%, 0.75% and 0.25% of the average daily net assets attributable to Class B, Class C and Class W shares of the Fund.
The Fund may pay a distribution fee up to 0.25% of the Fund's average daily net assets attributable to Class W shares and a service fee of up to 0.25% of the Fund's average daily net assets attributable to Class W shares, provided, however, that the aggregate fee shall not exceed 0.25% of the Fund's average daily net assets attributable to Class W shares.
Sales Charges
Sales charges, including front-end charges and CDSCs, received by the Distributor for distributing Fund shares were $42,670 for Class A, $782 for Class B and $91 for Class C shares for the year ended February 28, 2013.
Expenses Waived/Reimbursed by the Investment Manager and its Affiliates
Effective July 1, 2012, the Investment Manager and certain of its affiliates have contractually agreed to waive fees and/or reimburse expenses (excluding certain fees and expenses described below), through June 30, 2013, unless sooner terminated at the sole discretion of the Board, so that the Fund's net operating expenses, after giving effect to fees waived/expenses reimbursed and any balance credits and/or overdraft charges from the Fund's custodian, do not exceed
Annual Report 2013
28
Columbia Large Cap Core Fund
Notes to Financial Statements (continued)
February 28, 2013
the following annual rates as a percentage of the class' average daily net assets:
Class A | | | 1.20 | % | |
Class B | | | 1.95 | | |
Class C | | | 1.95 | | |
Class I | | | 0.82 | | |
Class R5* | | | 0.87 | | |
Class W | | | 1.20 | | |
Class Z | | | 0.95 | | |
*Annual rate is contractual from November 8, 2012 (the commencement of operations of Class R5 shares) through November 8, 2013.
Prior to July 1, 2012, the Investment Manager and certain of its affiliates contractually agreed to waive fees and/or reimburse expenses (excluding certain fees and expenses described below), so that the Fund's net operating expenses, after giving effect to fees waived/expenses reimbursed and any balance credits and/or overdraft charges from the Fund's custodian, did not exceed the following annual rates as a percentage of the class' average daily net assets:
Class A | | | 1.16 | % | |
Class B | | | 1.91 | | |
Class C | | | 1.91 | | |
Class I | | | 0.81 | | |
Class W | | | 1.16 | | |
Class Z | | | 0.91 | | |
Under the agreement governing these fee waivers and/or expense reimbursement arrangements, the following fees and expenses are excluded from the waiver/reimbursement commitment, and therefore will be paid by the Fund, if applicable: taxes (including foreign transaction taxes), expenses associated with investments in affiliated and non-affiliated pooled investment vehicles (including mutual funds and exchange traded funds), transaction costs and brokerage commissions, costs related to any securities lending program, dividend expenses associated with securities sold short, inverse floater program fees and expenses, transaction charges and interest on borrowed money, interest, extraordinary expenses and any other expenses the exclusion of which is specifically approved by the Board. This agreement may be modified or amended only with approval from all parties.
Note 4. Federal Tax Information
The timing and character of income and capital gain distributions are determined in accordance with income tax regulations, which may differ from GAAP because of temporary or permanent book to tax differences.
At February 28, 2013, these differences are primarily due to differing treatment for deferral/reversal of wash sale losses, Trustees' deferred compensation and passive foreign investment company (PFIC) holdings. To the extent these differences are permanent, reclassifications are made among the components of the Fund's net assets in the Statement of Assets and Liabilities. Temporary differences do not require reclassifications. In the Statement of Assets and Liabilities the following reclassifications were made:
Undistributed net investment income | | $ | 43,410 | | |
Accumulated net realized gain | | | (43,410 | ) | |
Paid-in capital | | | — | | |
Net investment income and net realized gains (losses), as disclosed in the Statement of Operations, and net assets were not affected by this reclassification.
The tax character of distributions paid during the years indicated was as follows:
Year Ended | | February 28,
2013 | | February 29,
2012 | |
Ordinary income | | $ | 8,021,938 | | | $ | 11,226,331 | | |
Long-term capital gains | | | 23,388,837 | | | | — | | |
Total | | $ | 31,410,775 | | | $ | 11,226,331 | | |
Short-term capital gain distributions, if any, are considered ordinary income distributions for tax purposes.
At February 28, 2013, the components of distributable earnings on a tax basis were as follows:
Undistributed ordinary income | | $ | 1,329,402 | | |
Undistributed accumulated long-term capital gains | | | 82,584,977 | | |
Unrealized appreciation | | | 110,591,514 | | |
At February 28, 2013, the cost of investments for federal income tax purposes was $524,688,788 and the aggregate gross unrealized appreciation and depreciation based on that cost was:
Unrealized appreciation | | $ | 111,881,765 | | |
Unrealized depreciation | | | (1,290,251 | ) | |
Net unrealized appreciation | | $ | 110,591,514 | | �� |
For the year ended February 28, 2013, $52,694,574 of capital loss carryforward was utilized.
Management of the Fund has concluded that there are no significant uncertain tax positions that would require recognition in the financial statements. However, management's conclusion may be subject to review and adjustment at a later date based on factors including, but not limited to, new tax laws, regulations, and administrative interpretations (including relevant court decisions). Generally,
Annual Report 2013
29
Columbia Large Cap Core Fund
Notes to Financial Statements (continued)
February 28, 2013
the Fund's federal tax returns for the prior three fiscal years remain subject to examination by the Internal Revenue Service.
Note 5. Portfolio Information
The cost of purchases and proceeds from sales of securities, excluding short-term obligations, aggregated to $1,191,192,443 and $1,715,564,325, respectively, for the year ended February 28, 2013.
Note 6. Regulatory Settlements
During the year ended February 29, 2012, the Fund received $64,591 as a result of a regulatory settlement proceeding brought by the Securities and Exchange Commission against an unaffiliated third party relating to market timing and/or late trading of mutual funds. This amount represented the Fund's portion of the proceeds from the settlement (the Fund was not a party to the proceeding). The payments have been included in "Proceeds from regulatory settlements" in the Statement of Changes in Net Assets.
Note 7. Lending of Portfolio Securities
Effective December 19, 2012, the Fund no longer participates in securities lending activity. Prior to that date, the Fund participated, or was eligible to participate, in securities lending activity pursuant to a Master Securities Lending Agreement (the Agreement) with JPMorgan Chase Bank, N.A. (JPMorgan). The Agreement authorized JPMorgan as lending agent to lend securities to authorized borrowers in order to generate additional income on behalf of the Fund. Pursuant to the Agreement, the securities loaned were secured by cash or securities that either were issued or guaranteed as to principal and interest by the U.S. government, its agencies, authorities or instrumentalities with value equal to at least 100% of the market value of the loaned securities. Any additional collateral required to maintain those levels due to market fluctuations of the loaned securities was requested to be delivered the following business day. Cash collateral received was invested by the lending agent on behalf of the Fund into authorized investments pursuant to the Agreement.
Pursuant to the Agreement, the Fund received income for lending its securities either in the form of fees or by earning interest on invested cash collateral, net of negotiated rebates paid to borrowers and fees paid to the lending agent for services provided and any other securities lending expenses. Net income earned from securities lending for the year ended February 28, 2013 is disclosed in the Statement of Operations. The Fund continued to earn and accrue interest and dividends on the securities loaned.
Note 8. Affiliated Money Market Fund
The Fund invests its daily cash balances in Columbia Short-Term Cash Fund, an affiliated money market fund established for the exclusive use by the Fund and other affiliated funds. The income earned by the Fund from such investments is included as "Dividends — affiliated issuers" in the Statement of Operations. As an investing fund, the Fund indirectly bears its proportionate share of the expenses of Columbia Short-Term Cash Fund.
Note 9. Shareholder Concentration
At February 28, 2013, one unaffiliated shareholder account owned 59.6% of the outstanding shares of the Fund. The Fund has no knowledge about whether any portion of those shares was owned beneficially by such account. Affiliated shareholder accounts owned 18.5% of the outstanding shares of the Fund. Subscription and redemption activity by concentrated accounts may have a significant effect on the operations of the Fund.
Note 10. Line of Credit
The Fund has entered into a revolving credit facility with a syndicate of banks led by JPMorgan whereby the Fund may borrow for the temporary funding of shareholder redemptions or for other temporary or emergency purposes. The credit facility agreement, as amended, which is a collective agreement between the Fund and certain other funds managed by the Investment Manager, severally and not jointly, permits collective borrowings up to $500 million. Interest is charged to each participating fund based on its borrowings at a rate equal to the higher of (i) the overnight federal funds rate plus 1.00% or (ii) the one-month LIBOR rate plus 1.00%. Each borrowing under the credit facility matures no later than 60 days after the date of borrowing. The Fund also pays a commitment fee equal to its pro rata share of the amount of the credit facility at a rate of 0.08% per annum.
The Fund had no borrowings during the year ended February 28, 2013.
Note 11. Fund Merger
At the close of business on March 11, 2011, the Fund acquired the assets and assumed the identified liabilities of Columbia Blended Equity Fund, a series of Columbia Funds Series Trust I (the acquired fund). The reorganization was completed after shareholders of the acquired fund approved the plan of reorganization on February 15, 2011. The purpose of the transaction was to combine two funds managed by the Investment Manager with comparable investment objectives and strategies.
Annual Report 2013
30
Columbia Large Cap Core Fund
Notes to Financial Statements (continued)
February 28, 2013
The aggregate net assets of the Fund immediately before the acquisition were $1,218,171,435 and the combined net assets immediately after the acquisition were $1,391,804,105.
The merger was accomplished by a tax-free exchange of 6,625,629 shares of the acquired fund valued at $101,632,670 (including $34,347,901 of unrealized appreciation).
In exchange for the acquired fund's shares, the Fund issued the following number of shares:
| | | Shares | |
Class A | | | 34,275 | | |
Class C | | | 14,642 | | |
Class Z | | | 7,530,591 | | |
For financial reporting purposes, net assets received and shares issued by the Fund were recorded at fair value; however, the acquired fund's cost of investments was carried forward.
The financial statements reflect the operations of the Fund for the period prior to the merger and the combined fund for the period subsequent to the merger. Because the combined investment portfolios have been managed as a single integrated portfolio since the merger was completed, it is not practicable to separate the amounts of revenue and earnings of the acquired fund that have been included in the combined Fund's Statement of Operations since the merger was completed.
Assuming the merger had been completed on March 1, 2011 the Fund's pro-forma net investment income, net gain on investments, net change in unrealized depreciation and net increase in net assets from operations for the year ended February 29, 2012, would have been approximately $11.9 million, $66.6 million, $(56.5) million and $22.0 million, respectively.
Note 12. Subsequent Events
Management has evaluated the events and transactions that have occurred through the date the financial statements were issued and noted no items requiring adjustment of the financial statements or additional disclosure.
Note 13. Information Regarding Pending and Settled Legal Proceedings
In December 2005, without admitting or denying the allegations, American Express Financial Corporation (AEFC, which is now known as Ameriprise Financial, Inc. (Ameriprise Financial)) entered into settlement agreements with the Securities and Exchange Commission (SEC) and Minnesota Department of Commerce (MDOC) related to market timing activities. As a result, AEFC was censured and
ordered to cease and desist from committing or causing any violations of certain provisions of the Investment Advisers Act of 1940, the Investment Company Act of 1940, and various Minnesota laws. AEFC agreed to pay disgorgement of $10 million and civil money penalties of $7 million. AEFC also agreed to retain an independent distribution consultant to assist in developing a plan for distribution of all disgorgement and civil penalties ordered by the SEC in accordance with various undertakings detailed at www.sec.gov/litigation/admin/ia-2451.pdf. Ameriprise Financial and its affiliates have cooperated with the SEC and the MDOC in these legal proceedings, and have made regular reports to the funds' Boards of Trustees.
Ameriprise Financial and certain of its affiliates have historically been involved in a number of legal, arbitration and regulatory proceedings, including routine litigation, class actions, and governmental actions, concerning matters arising in connection with the conduct of their business activities. Ameriprise Financial believes that the Funds are not currently the subject of, and that neither Ameriprise Financial nor any of its affiliates are the subject of, any pending legal, arbitration or regulatory proceedings that are likely to have a material adverse effect on the Funds or the ability of Ameriprise Financial or its affiliates to perform under their contracts with the Funds. Ameriprise Financial is required to make 10-Q, 10-K and, as necessary, 8-K filings with the Securities and Exchange Commission on legal and regulatory matters that relate to Ameriprise Financial and its affiliates. Copies of these filings may be obtained by accessing the SEC website at www.sec.gov.
There can be no assurance that these matters, or the adverse publicity associated with them, will not result in increased fund redemptions, reduced sale of fund shares or other adverse consequences to the Funds. Further, although we believe proceedings are not likely to have a material adverse effect on the Funds or the ability of Ameriprise Financial or its affiliates to perform under their contracts with the Funds, these proceedings are subject to uncertainties and, as such, we are unable to estimate the possible loss or range of loss that may result. An adverse outcome in one or more of these proceedings could result in adverse judgments, settlements, fines, penalties or other relief that could have a material adverse effect on the consolidated financial condition or results of operations of Ameriprise Financial.
Annual Report 2013
31
Columbia Large Cap Core Fund
Report of Independent Registered Public Accounting Firm
To the Trustees of Columbia Funds Series Trust and
the Shareholders of Columbia Large Cap Core Fund
In our opinion, the accompanying statement of assets and liabilities, including the portfolio of investments, and the related statements of operations and of changes in net assets and the financial highlights present fairly, in all material respects, the financial position of Columbia Large Cap Core Fund (the "Fund") (a series of Columbia Funds Series Trust) at February 28, 2013, the results of its operations for the year then ended, the changes in its net assets for each of the two years in the period then ended and the financial highlights for each of the periods indicated, in conformity with accounting principles generally accepted in the United States of America. These financial statements and financial highlights (hereafter referred to as "financial statements") are the responsibility of the Fund's management. Our responsibility is to express an opinion on these financial statements based on our audits. We conducted our audits of these financial statements in accordance with the standards of the Public Company Accounting Oversight Board (United States). Those standards require that we plan and perform the audit to obtain reasonable assurance about whether the financial statements are free of material misstatement. An audit includes examining, on a test basis, evidence supporting the amounts and disclosures in the financial statements, assessing the accounting principles used and significant estimates made by management, and evaluating the overall financial statement presentation. We believe that our audits, which included confirmation of securities at February 28, 2013 by correspondence with the custodian, transfer agent and brokers, provide a reasonable basis for our opinion.
PricewaterhouseCoopers LLP
Minneapolis, Minnesota
April 19, 2013
Annual Report 2013
32
Columbia Large Cap Core Fund
Federal Income Tax Information
(Unaudited)
The Fund hereby designates the following tax attributes for the fiscal year ended February 28, 2013. Shareholders will be notified in early 2014 of the amounts for use in preparing 2013 income tax returns.
Tax Designations:
| Qualified Dividend Income | | | 100 | % | |
| Dividends Received Deduction | | | 100 | % | |
Capital Gain Dividend | | $ | 111,272,505 | | |
Qualified Dividend Income. For taxable, non-corporate shareholders, the percentage of ordinary income dividends paid during the fiscal year that represents qualified dividend income subject to reduced tax rates under the Jobs and Growth Tax Relief Reconciliation Act of 2003.
Dividends Received Deduction. The percentage of ordinary income dividends paid during the fiscal year that qualifies for the corporate dividends received deduction.
Capital Gain Dividend. The Fund designates as a capital gain dividend the amount reflected above, or if subsequently determined to be different, the net capital gain of such fiscal period. The Fund also designates as capital gain dividends, to the extent necessary to fully distribute such capital gains, earnings and profits distributed to shareholders on the redemption of shares.
Annual Report 2013
33
Columbia Large Cap Core Fund
Shareholders elect the Board that oversees the funds' operations. The Board appoints officers who are responsible for day-to-day business decisions based on policies set by the Board. The following table provides basic biographical information about the funds' Board members, including their principal occupations during the past five years, although specific titles for individuals may have varied over the period. Under current Board policy, members may serve until the next Board meeting after he or she reaches the mandatory retirement age established by the Board, or the fifteenth anniversary of the first Board meeting they attended as a member of the Board.
Mr. Edward J. Boudreau, Jr., Mr. William P. Carmichael, Mr. William A. Hawkins, Mr. R. Glenn Hilliard, Ms. Minor M. Shaw and Dr. Anthony M. Santomero, were members of the Legacy Columbia Nations funds' Board ("Nations Funds"), which includes Columbia Funds Series Trust, Columbia Funds Variable Insurance Trust I and Columbia Funds Master Investment Trust, LLC and began service on the Board for the Legacy RiverSource funds ("RiverSource Funds") effective June 1, 2011.
Independent Trustees
Name,
Address,
Year of Birth | | Position Held With
Funds and Length of
Service | | Principal Occupation
During Past Five Years | | Number of
Funds in the
Fund Family
Overseen by
Board Member | | Other Present or Past
Directorships/Trusteeships
(Within Past 5 Years) | |
Kathleen Blatz
901 S. Marquette Ave.
Minneapolis, MN 55402
1954 | | Board member since 1/06 for RiverSource Funds and since 6/11 for Nations Funds | | Attorney; Chief Justice, Minnesota Supreme Court, 1998-2006 | | | 153 | | | Director, BlueCross BlueShield of Minnesota since 2009 | |
Edward J. Boudreau, Jr.
901 S. Marquette Ave.
Minneapolis, MN 55402
1944 | | Board member since 6/11 for RiverSource Funds and since 1/05 for Nations Funds | | Managing Director, E.J. Boudreau & Associates (consulting) since 2000 | | | 151 | | | Former Trustee, BofA Funds Series Trust (11 funds) | |
Pamela G. Carlton
901 S. Marquette Ave.
Minneapolis, MN 55402
1954 | | Board member since 7/07 for RiverSource Funds and since 6/11 for Nations Funds | | President, Springboard — Partners in Cross Cultural Leadership (consulting company) since 2003 | | | 153 | | | None | |
William P. Carmichael
901 S. Marquette Ave.
Minneapolis, MN 55402
1943 | | Board member since 6/11 for RiverSource Funds and since 1999 for Nations Funds | | Retired | | | 151 | | | Director, Cobra Electronics Corporation (electronic equipment manufacturer); The Finish Line (athletic shoes and apparel) since July 2003; McMoRan Exploration Company (oil and gas exploration and development) since 2010; former Trustee, BofA Funds Series Trust (11 funds); former Director, Spectrum Brands, Inc. (consumer products); former Director, Simmons Company (bedding) | |
Patricia M. Flynn
901 S. Marquette Ave.
Minneapolis, MN 55402
1950 | | Board member since 11/04 for RiverSource Funds and since 6/11 for Nations Funds | | Trustee Professor of Economics and Management, Bentley University since 1976 | | | 153 | | | None | |
William A. Hawkins
901 S. Marquette Ave.
Minneapolis, MN 55402
1942 | | Board member since 6/11 for RiverSource Funds and since 1/05 for Nations Funds | | Managing Director, Overton Partners (financial consulting), since August 2010; President and Chief Executive Officer, California General Bank, N.A., January 2008-August 2010 | | | 151 | | | Trustee, BofA Funds Series Trust (11 funds) | |
Annual Report 2013
34
Columbia Large Cap Core Fund
Trustees and Officers (continued)
Independent Trustees (continued)
Name,
Address,
Year of Birth | | Position Held With
Funds and Length of
Service | | Principal Occupation
During Past Five Years | | Number of
Funds in the
Fund Family
Overseen by
Board Member | | Other Present or Past
Directorships/Trusteeships
(Within Past 5 Years) | |
R. Glenn Hilliard
901 S. Marquette Ave.
Minneapolis, MN 55402
1943 | | Board member since 6/11 for RiverSource Funds and since 1/05 for Nations Funds | | Chairman and Chief Executive Officer, Hilliard Group LLC (investing and consulting), since April 2003; Non-Executive Director & Chairman, CNO Financial Group, Inc. (insurance), September 2003-May 2011 | | | 151 | | | Chairman, BofA Fund Series Trust (11 funds); former Director, CNO Financial Group, Inc. (insurance) | |
Stephen R. Lewis, Jr.
901 S. Marquette Ave.
Minneapolis, MN 55402
1939 | | Chair of the Board for RiverSource Funds since 1/07, Board member for RiverSource Funds since 1/02 and since 6/11 for Nations Funds | | President Emeritus and Professor of Economics Emeritus, Carleton College since 2002 | | | 153 | | | Director, Valmont Industries, Inc. (manufacturer of irrigation systems) since 2002 | |
Catherine James Paglia
901 S. Marquette Ave.
Minneapolis, MN 55402
1952 | | Board member since 11/04 for RiverSource Funds and since 6/11 for Nations Funds | | Director, Enterprise Asset Management, Inc. (private real estate and asset management company) | | | 153 | | | Director, Valmont Industries, Inc. (manufacturer of irrigation systems) since 2012 | |
Leroy C. Richie
901 S. Marquette Ave.
Minneapolis, MN 55402
1941 | | Board member since 2000 for Legacy Seligman Funds, since 11/08 for RiverSource Funds and since 6/11 for Nations Funds | | Counsel, Lewis & Munday, P.C. (law firm) since 2004; former Vice President and General Counsel, Automotive Legal Affairs, Chrysler Corporation from 1983-1987 | | | 153 | | | Lead Outside Director, Digital Ally, Inc. (digital imaging) since September 2005; Director, Infinity, Inc. (oil and gas exploration and production) since 1994; Director, OGE Energy Corp. (energy and energy services) since November 2007 | |
Minor M. Shaw
901 S. Marquette Ave.
Minneapolis, MN 55402
1947 | | Board member since 6/11 for RiverSource Funds and since 2003 for Nations Funds | | President, Micco LLC (private investments) since 2011; President Micco Corp. since 1998 | | | 151 | | | Director, Piedmont Natural Gas; Director, BlueCross BlueShield of South Carolina since April 2008; Former Trustee, BofA Funds Series Trust (11 funds) | |
Alison Taunton-Rigby
901 S. Marquette Ave.
Minneapolis, MN 55402
1944 | | Board member since 11/02 for RiverSource Funds and since 6/11 for Nations Funds | | Chief Executive Officer and Director, RiboNovix, Inc. (biotechnology), 2003-2010 | | | 153 | | | Director, Healthways, Inc. (health and well-being improvement) since 2005; Director, ICI Mutual Insurance Company, RRG since 2011; Director, Abt Associates (government contractor) since 2001; Director, Boston Children's Hospital since 2002 | |
Annual Report 2013
35
Columbia Large Cap Core Fund
Trustees and Officers (continued)
Interested Trustee Not Affiliated With Investment Manager*
Name,
Address,
Year of Birth | | Position Held With
Funds and Length of
Service | | Principal Occupation
During Past Five Years | | Number of
Funds in the
Fund Family
Overseen by
Board Member | | Other Present or Past
Directorships/Trusteeships
(Within Past 5 Years) | |
Anthony M. Santomero
901 S. Marquette Ave.
Minneapolis, MN 55402
1946 | | Board member since 6/11 for RiverSource Funds and since 1/08 for Nations Funds | | Richard K. Mellon Professor Emeritus of Finance, The Wharton School, University of Pennsylvania, since 2002; Senior Advisor, McKinsey & Company (consulting), 2006-2008 | | | 151 | | | Director, Renaissance Reinsurance Ltd. since May 2008; Trustee, Penn Mutual Life Insurance Company since March 2008; Director, Citigroup since 2009; Director, Citibank, N.A. since 2009; former Trustee, BofA Funds Series Trust (11 funds) | |
*Dr. Santomero is not an affiliated person of the investment manager or Ameriprise Financial. However, he is currently deemed by the funds to be an "interested person" (as defined in the 1940 Act) of the funds because he serves as a Director of Citigroup, Inc. and Citibank N.A., companies that may directly or through subsidiaries and affiliates engage from time-to-time in brokerage execution, principal transactions and lending relationships with the funds or accounts advised/managed by the investment manager.
Interested Trustee Affiliated With Investment Manager*
Name,
Address,
Year of Birth | | Position Held With
Funds and Length of
Service | | Principal Occupation
During Past Five Years | | Number of
Funds in the
Fund Family
Overseen by
Board Member | | Other Present or Past
Directorships/Trusteeships
(Within Past 5 Years) | |
William F. Truscott
53600 Ameriprise
Financial Center
Minneapolis, MN 55474
1960 | | Board member since 11/01 for RiverSource Funds and since 6/11 for Nations Funds; Senior Vice President since 2002 for RiverSource Funds and 5/10 for Nations Funds | | President, Columbia Management Investment Advisers, LLC since February 2012, (previously President, Chairman of the Board and Chief Investment Officer, 2001-April 2010); Chief Executive Officer, Global Asset Management, Ameriprise Financial, Inc. since September 2012 (previously Chief Executive Officer, U.S. Asset Management & President, Annuities, May 2010-September 2012 and President — U.S. Asset Management and Chief Investment Officer, 2005-April 2010); Chief Executive Officer, Columbia Management Investment Distributors, Inc. since February 2012, (previously Chairman of the Board and Chief Executive Officer, 2006-April 2010); Chairman of the Board and Chief Executive Officer, RiverSource Distributors, Inc. since 2006; President and Chief Executive Officer, Ameriprise Certificate Company 2006-August 2012 | | | 210 | | | Chairman of the Board, Columbia Management Investment Advisers, LLC since May 2010; Director, Columbia Management Investment Distributors, Inc. since May 2010; Director, Ameriprise Certificate Company, 2006-January 2013 | |
*Interested person (as defined under the 1940 Act) by reason of being an officer, director, security holder and/or employee of the investment manager or Ameriprise Financial.
The SAI has additional information about the Fund's Board members and is available, without charge, upon request by calling 800.345.6611; contacting your financial intermediary; or visiting columbiamanagement.com.
Annual Report 2013
36
Columbia Large Cap Core Fund
Trustees and Officers (continued)
The Board has appointed officers who are responsible for day-to-day business decisions based on policies it has established. The officers serve at the pleasure of the Board. In addition to Mr. Truscott, who is Senior Vice President, the funds' other officers are:
Officers
Name,
Address,
Year of Birth | | Position Held With
Funds and Length of
Service | | Principal Occupation During Past Five Years | |
J. Kevin Connaughton
225 Franklin Street
Boston, MA 02110
1964 | | President and Principal Executive Officer since 5/10 for RiverSource Funds and 2009 for Nations Funds | | Senior Vice President and General Manager — Mutual Fund Products, Columbia Management Investment Advisers, LLC since May 2010; Managing Director of Columbia Management Advisors, LLC, December 2004-April 2010; Senior Vice President and Chief Financial Officer, Columbia Funds, June 2008-January 2009; Treasurer, Columbia Funds, October 2003-May 2008 | |
Amy K. Johnson
5228 Ameriprise Financial Center Minneapolis, MN 55474
1965 | | Vice President since 12/06 for RiverSource Funds and 5/10 for Nations Funds | | Senior Vice President and Chief Operating Officer, Columbia Management Investment Advisers, LLC since May 2010 (previously Chief Administrative Officer, 2009-April 2010 and Vice President — Asset Management and Trust Company Services, 2006-2009) | |
Michael G. Clarke
225 Franklin Street
Boston, MA 02110
1969 | | Treasurer since 1/11 and Chief Financial Officer since 4/11 for RiverSource Funds and Treasurer since 3/11 and Chief Financial Officer since 2009 for Nations Funds | | Vice President, Columbia Management Investment Advisers, LLC since May 2010; Managing Director of Fund Administration, Columbia Management Advisors, LLC, September 2004-April 2010; senior officer of Columbia Funds and affiliated funds since 2002 | |
Scott R. Plummer
5228 Ameriprise Financial Center Minneapolis, MN 55474
1959 | | Senior Vice President and Chief Legal Officer since 12/06 and Assistant Secretary since 6/11 for RiverSource Funds and Senior Vice President and Chief Legal Officer since 5/10 and Assistant Secretary since 6/11 for Nations Funds | | Senior Vice President, Chief Legal Officer and Assistant Secretary, Columbia Management Investment Advisers, LLC since June 2005; Vice President and Lead Chief Counsel — Asset Management, Ameriprise Financial, Inc. since May 2010 (previously Vice President and Chief Counsel — Asset Management, 2005-April 2010); Vice President, Chief Counsel and Assistant Secretary, Columbia Management Investment Distributors, Inc. since 2008; Vice President, General Counsel and Secretary, Ameriprise Certificate Company since 2005; Chief Counsel, RiverSource Distributors, Inc. since 2006 | |
Colin Moore
225 Franklin Street
Boston, MA 02110
1958 | | Senior Vice President since 5/10 for RiverSource Funds and Nations Funds | | Director and Chief Investment Officer, Columbia Management Investment Advisers, LLC since May 2010; Manager, Managing Director and Chief Investment Officer, Columbia Management Advisors, LLC, 2007-April 2010 | |
Thomas P. McGuire
225 Franklin Street
Boston, MA 02110
1972 | | Chief Compliance Officer since 3/12 | | Vice President — Asset Management Compliance, Columbia Management Investment Advisers, LLC since 2010; Chief Compliance Officer, Ameriprise Certificate Company since September 2010; Compliance Executive, Bank of America, 2005-2010 | |
Stephen T. Welsh
225 Franklin Street
Boston, MA 02110
1957 | | Vice President since 4/11 for RiverSource Funds and 2006 for Nations Funds | | President and Director, Columbia Management Investment Services Corp. since May 2010; President and Director, Columbia Management Services, Inc., July 2004- April 2010; Managing Director, Columbia Management Distributors, Inc., August 2007-April 2010 | |
Christopher O. Petersen
5228 Ameriprise Financial Center Minneapolis, MN 55474
1970 | | Vice President and Secretary since 4/11 for RiverSource Funds and 3/11 for Nations Funds | | Vice President and Chief Counsel, Ameriprise Financial, Inc. since January 2010 (formerly Vice President and Group Counsel or Counsel, April 2004-January 2010); Assistant Secretary of Legacy RiverSource Funds, January 2007-April 2011 and of the Nations Funds, May 2010-March 2011 | |
Annual Report 2013
37
Columbia Large Cap Core Fund
Trustees and Officers (continued)
Officers (continued)
Name,
Address,
Year of Birth | | Position Held With
Funds and Length of
Service | | Principal Occupation During Past Five Years | |
Paul D. Pearson
10468 Ameriprise Financial Center Minneapolis, MN 55474
1956 | | Vice President since 4/11 and Assistant Treasurer since 1999 for RiverSource Funds and Vice President and Assistant Treasurer since 6/11 for Nations Funds | | Vice President — Investment Accounting, Columbia Management Investment Advisers, LLC, since May 2010; Vice President — Managed Assets, Investment Accounting, Ameriprise Financial Corporation, February 1998-May 2010 | |
Joseph F. DiMaria
225 Franklin Street
Boston, MA 02110
1968 | | Vice President and Chief Accounting Officer since 4/11 and Vice President since 3/11 and Chief Accounting Officer since 2008 for Nations Funds | | Vice President, Mutual Fund Administration, Columbia Management Investment Advisers, LLC, since May 2010; Director of Fund Administration, Columbia Management Advisors, LLC, January 2006-April 2010 | |
Paul B. Goucher
100 Park Avenue
New York, NY 10017
1968 | | Vice President since 4/11 and Assistant Secretary since 11/08 for RiverSource Funds and 5/10 for Nations Funds | | Vice President and Lead Chief Counsel, Ameriprise Financial, Inc. since November 2008 and January 2013, respectively (formerly, Chief Counsel, January 2010-January 2013 and Group Counsel from November 2008- January 2010); Director, Managing Director and General Counsel, J. & W. Seligman & Co. Incorporated, July 2008-November 2008 (previously, Managing Director and Associate General Counsel, January 2005-July 2008) | |
Michael E. DeFao
225 Franklin Street
Boston, MA 02110
1968 | | Vice President since 4/11 and Assistant Secretary since 5/10 for RiverSource Funds and 2011 for Nations Funds | | Vice President and Chief Counsel, Ameriprise Financial, Inc. since May 2010; Associate General Counsel, Bank of America, June 2005-April 2010 | |
Annual Report 2013
38
This page intentionally left blank.
Annual Report 2013
39
This page intentionally left blank.
Annual Report 2013
40
Columbia Large Cap Core Fund
Important Information About This Report
Each fund mails one shareholder report to each shareholder address. If you would like more than one report, please call shareholder services at 800.345.6611 and additional reports will be sent to you.
The policy of the Board is to vote the proxies of the companies in which each fund holds investments consistent with the procedures as stated in the Statement of Additional Information (SAI). You may obtain a copy of the SAI without charge by calling 800.345.6611; contacting your financial intermediary; visiting columbiamanagement.com; or searching the website of the Securities and Exchange Commission (SEC) at sec.gov. Information regarding how each fund voted proxies relating to portfolio securities is filed with the SEC by August 31 for the most recent 12-month period ending June 30 of that year, and is available without charge by visiting columbiamanagement.com; or searching the website of the SEC at sec.gov.
Each fund files a complete schedule of portfolio holdings with the SEC for the first and third quarters of each fiscal year on Form N-Q. Each fund's Form N-Q is available on the SEC's website at sec.gov and may be reviewed and copied at the SEC's Public Reference Room in Washington, D.C. Information on the operation of the Public Reference Room may be obtained by calling 800.SEC.0330. Each fund's complete schedule of portfolio holdings, as filed on Form N-Q, can also be obtained without charge, upon request, by calling 800.345.6611.
Annual Report 2013
41

Columbia Large Cap Core Fund
P.O. Box 8081
Boston, MA 02266-8081
columbiamanagement.com
This information is for use with concurrent or prior delivery of a fund prospectus. Please read and consider the investment objectives, risks, charges and expenses for any fund carefully before investing. For a prospectus which contains this and other important information about the Fund go to columbiamanagement.com. The Fund is distributed by Columbia Management Investment Distributors, Inc., member FINRA, and managed by Columbia Management Investment Advisers, LLC.
© 2013 Columbia Management Investment Advisers, LLC. All rights reserved.
ANN172_02_C01_(04/13)
Annual Report
February 28, 2013

Columbia Large Cap Enhanced Core Fund
Not FDIC insured • No bank guarantee • May lose value
Columbia Large Cap Enhanced Core Fund
 Dear Shareholders,
U.S. stocks flat, foreign markets strong in 2012 finale
After a strong third quarter, U.S. stock market averages treaded water as the year 2012 came to a close. However, they ended the year up strongly, as first- and third-quarter gains more than offset second- and fourth-quarter weakness. Typically a strong quarter for domestic small- and mid-cap issues, the fourth quarter of 2012 indeed proved to be another year-end positive for small-cap stocks. For the full calendar year 2012, the S&P 500 Index rose 16.00%.
Stock markets outside the United States generated some of the best returns for the fourth quarter, as optimism rebounded, thanks to the September actions of the European Central Bank in support of the euro and an improving outlook from China. Both developed and emerging foreign markets topped U.S. stocks by a solid margin.
Corporate and emerging markets led fixed income
Fixed-income investors took their cue from the equity markets and continued to favor the highest risk sectors through the end of 2012. Global fixed-income returns posted mixed results in the final quarter of the year. Gains were the highest for corporate high-yield and emerging market bonds. Although investors remained cautious ahead of the year-end budget negotiations, better economic data and a further improvement in the European sovereign debt crisis supported riskier assets and depressed government bond prices. In December, the Federal Reserve announced its intention to continue to purchase both Treasury and mortgage-backed securities and said that it would seek to keep short-term interest rates unchanged until the unemployment rate reaches 6.5%, or inflation turned noticeably higher.
Stay on track with Columbia Management
Backed by more than 100 years of experience, Columbia Management is one of the nation's largest asset managers. At the heart of our success — and, most importantly, that of our investors — are highly talented industry professionals, brought together by a unique way of working. We are dedicated to helping you take advantage of today's opportunities and anticipate tomorrow's. We stay abreast of the latest investment trends and ideas, using our collective insight to evaluate events and transform them into solutions you can use.
Visit columbiamanagement.com for:
> The Columbia Management Perspectives blog, featuring timely posts by our investment teams
> Detailed up-to-date fund performance and portfolio information
> Economic analysis and market commentary
> Quarterly fund commentaries
> Columbia Management Investor, our award-winning quarterly newsletter for shareholders
Thank you for your continued support of the Columbia Funds. We look forward to serving your investment needs for many years to come.
Best Regards,

J. Kevin Connaughton
President, Columbia Funds
The S&P 500 Index, an unmanaged index, measures the performance of 500 widely held, large-capitalization U.S. stocks and is frequently used as a general measure of market performance. Indices are not available for investment, are not professionally managed and do not reflect sales charges, fees, brokerage commissions, taxes or other expenses of investing.
Investors should consider the investment objectives, risks, charges and expenses of a mutual fund carefully before investing. For a free prospectus, which contains this and other important information about a fund, visit columbiamanagement.com. The prospectus should be read carefully before investing.
Columbia Funds are distributed by Columbia Management Investment Distributors, Inc., member FINRA, and managed by Columbia Management Investment Advisers, LLC.
© 2013 Columbia Management Investment Advisers, LLC. All rights reserved.
Columbia Large Cap Enhanced Core Fund
Performance Overview | | | 2 | | |
Manager Discussion of Fund Performance | | | 4 | | |
Understanding Your Fund's Expenses | | | 6 | | |
Portfolio of Investments | | | 7 | | |
Statement of Assets and Liabilities | | | 12 | | |
Statement of Operations | | | 14 | | |
Statement of Changes in Net Assets | | | 15 | | |
Financial Highlights | | | 17 | | |
Notes to Financial Statements | | | 22 | | |
Report of Independent Registered
Public Accounting Firm | | | 29 | | |
Federal Income Tax Information | | | 30 | | |
Trustees and Officers | | | 31 | | |
Important Information About This Report | | | 37 | | |
Fund Investment Manager
Columbia Management Investment
Advisers, LLC
225 Franklin Street
Boston, MA 02110
Fund Distributor
Columbia Management Investment
Distributors, Inc.
225 Franklin Street
Boston, MA 02110
Fund Transfer Agent
Columbia Management Investment
Services Corp.
P.O. Box 8081
Boston, MA 02266-8081
For more information about any of the funds, please visit columbiamanagement.com or call 800.345.6611. Customer Service Representatives are available to answer your questions Monday through Friday from 8 a.m. to 8 p.m. Eastern time.
The views expressed in this report reflect the current views of the respective parties. These views are not guarantees of future performance and involve certain risks, uncertainties and assumptions that are difficult to predict, so actual outcomes and results may differ significantly from the views expressed. These views are subject to change at any time based upon economic, market or other conditions and the respective parties disclaim any responsibility to update such views. These views may not be relied on as investment advice and, because investment decisions for a Columbia Fund are based on numerous factors, may not be relied on as an indication of trading intent on behalf of any particular Columbia Fund. References to specific securities should not be construed as a recommendation or investment advice.
Columbia Large Cap Enhanced Core Fund
Performance Summary
> Columbia Large Cap Enhanced Core Fund (the Fund) Class A shares returned 11.71% for the 12-month period that ended February 28, 2013.
> The Fund underperformed its benchmark, the S&P 500 Index, which returned 13.46% for the same 12-month period.
> Stock selection in consumer discretionary, information technology, industrials and financials generally accounted for the Fund's shortfall relative to the benchmark during the period.
Average Annual Total Returns (%) (for period ended February 28, 2013)
| | Inception | | 1 Year | | 5 Years | | 10 Years | |
Class A | | 07/31/96 | | | 11.71 | | | | 4.69 | | | | 8.08 | | |
Class I* | | 09/27/10 | | | 12.15 | | | | 4.87 | | | | 8.17 | | |
Class R* | | 01/23/06 | | | 11.54 | | | | 4.44 | | | | 7.81 | | |
Class Y* | | 07/15/09 | | | 12.13 | | | | 4.97 | | | | 8.22 | | |
Class Z | | 07/31/96 | | | 12.02 | | | | 4.96 | | | | 8.35 | | |
S&P 500 Index | | | | | | | 13.46 | | | | 4.94 | | | | 8.24 | | |
All results shown assume reinvestment of distributions during the period. Returns do not reflect the deduction of taxes that a shareholder may pay on Fund distributions or on the redemption of Fund shares. Performance results reflect the effect of any fee waivers or reimbursements of Fund expenses by Columbia Management Investment Advisers, LLC and/or any of its affiliates. Absent these fee waivers or expense reimbursement arrangements, performance results would have been lower.
The performance information shown represents past performance and is not a guarantee of future results. The investment return and principal value of your investment will fluctuate so that your shares, when redeemed, may be worth more or less than their original cost. Current performance may be lower or higher than the performance information shown. You may obtain performance information current to the most recent month-end by contacting your financial intermediary, visiting columbiamanagement.com or calling 800.345.6611.
*The returns shown for periods prior to the share class inception date (including returns for the Life of the Fund, if shown, which are since Fund inception) include the returns of the Fund's oldest share class. Since the Fund launched more than one share class at its inception, Class A shares were used. These returns are adjusted to reflect any higher class-related operating expenses of the newer share classes, as applicable. Please visit columbiamanagement.com/mutual-funds/appended-performance for more information.
The S&P 500 Index, an unmanaged index, measures the performance of 500 widely held, large-capitalization U.S. stocks and is frequently used as a general measure of market performance.
Indices are not available for investment, are not professionally managed and do not reflect sales charges, fees, brokerage commissions, taxes or other expenses of investing. Securities in the Fund may not match those in an index.
Annual Report 2013
2
Columbia Large Cap Enhanced Core Fund
Performance Overview (continued)
Performance of a Hypothetical $10,000 Investment (March 1, 2003 – February 28, 2013)
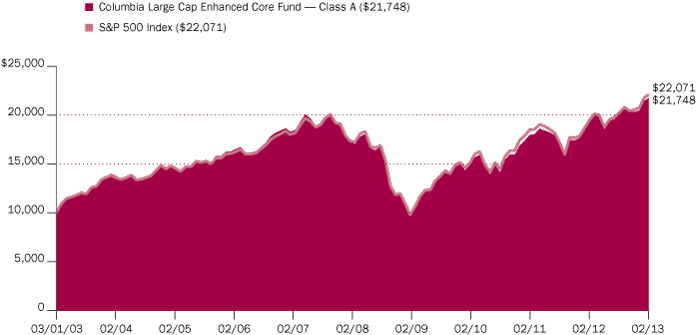
The chart above shows the change in value of a hypothetical $10,000 investment in Class A shares of Columbia Large Cap Enhanced Core Fund during the stated time period, and does not reflect the deduction of taxes that a shareholder may pay on Fund distributions or on the redemption of Fund shares.
Annual Report 2013
3
Columbia Large Cap Enhanced Core Fund
Manager Discussion of Fund Performance
For the 12-month period that ended February 28, 2013, the Fund's Class A shares returned 11.71%. The Fund lagged its benchmark, the S&P 500 Index, which returned 13.46% for the same 12-month period. Stock selection in consumer discretionary, information technology, industrials and financials generally accounted for the Fund's shortfall relative to the benchmark. Stock selection in health care, energy and materials was generally favorable. The Fund's sector allocations were generally in line with the benchmark and did not have a material impact on results for the period.
Investors Shrug Off Weak Global Growth
Europe's economic woes and U.S. struggles to avoid a fiscal cliff of tax increases and spending cuts weighed on the global economy during the 12-month period ended February 28, 2013. Yet, investors chose to look beyond the numbers and came in from the sidelines to bid stock prices significantly higher. Favorable central bank action in key markets and improving prospects for the U.S. economy gave investors confidence to favor stocks and other riskier assets. The U.S. economy expanded at a pace of just 1.6% in 2012. However, a pickup in job growth early in 2013 and steady manufacturing activity were encouraging signs. The U.S. housing market staged a solid comeback, with higher home sales, rising prices and lower inventories. Meanwhile, much of Europe headed toward recession. So far, the United Kingdom has avoided recession — but only barely so — and Japan's economy slipped into negative territory for the fifth time in 15 years. Major emerging market economies forged ahead, although mostly at a slower pace, including China.
Investors Were "Risk On" for the Period
Generally speaking, the riskiest stocks generated the best performance during the period. Within the benchmark S&P 500 Index, the stocks with the highest leverage outperformed stocks with the lowest leverage by about four percentage points. The quintile (20%) of stocks that appeared least expensive based on earnings underperformed the quintile that looked most expensive, also by about four percentage points, and the largest stocks within the benchmark, by weight, underperformed by more than eight percentage points. However, the highest beta stocks — the most volatile quintile in the benchmark — underperformed the lowest beta stocks by almost 12 percentage points. Non-dividend paying stocks outperformed, but they only outperformed the dividend-paying stocks with the highest yields — and only by a slim margin.
The components of the Fund's stock selection model were consistent with the "risk-on" trend. We divide the metrics for our stock selection model into three broad categories: valuation (fundamental measures such as earnings and cash flow relative to market values), catalyst (price momentum and business momentum), and quality (quality of earnings and financial strength). The stocks that we consider to be the highest quality (top 20% of stocks in the S&P 500 Index, ranked using our aggregate quality score) underperformed the lowest quality stocks (bottom 20%). However, the highest quintile of stocks ranked on our catalyst measures outperformed the lowest catalyst quintile and were the biggest positive driver of Fund returns relative to the benchmark.
The Fund's valuation metrics were more neutral, with the top quintile of stocks ranked on valuation outperforming the bottom quintile of stocks by slightly less than two percentage points. However, the positive contribution from our
Portfolio Management
Brian Condon, CFA
Oliver Buckley
Morningstar Style BoxTM
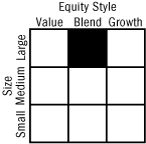
The Morningstar Style BoxTM is based on a fund's portfolio holdings. For equity funds, the vertical axis shows the market capitalization of the stocks owned, and the horizontal axis shows investment style (value, blend, or growth). Information shown is based on the most recent data provided by Morningstar.
© 2013 Morningstar, Inc. All rights reserved. The Morningstar information contained herein: (1) is proprietary to Morningstar and/or its content providers; (2) may not be copied or distributed; and (3) is not warranted to be accurate, complete or timely. Neither Morningstar nor its content providers are responsible for any damages or losses arising from any use of this information.
Top Ten Holdings (%)
(at February 28, 2013) | |
Apple, Inc. | | | 3.7 | | |
Exxon Mobil Corp. | | | 2.5 | | |
Chevron Corp. | | | 2.4 | | |
Microsoft Corp. | | | 2.3 | | |
JPMorgan Chase & Co. | | | 2.2 | | |
Pfizer, Inc. | | | 2.2 | | |
Google, Inc., Class A | | | 2.1 | | |
Philip Morris International, Inc. | | | 1.8 | | |
Oracle Corp. | | | 1.8 | | |
Verizon Communications, Inc. | | | 1.7 | | |
Percentages indicated are based upon total investments (excluding Money Market Funds).
For further detail about these holdings, please refer to the section entitled "Portfolio of Investments."
Fund holdings are as of the date given, are subject to change at any time, and are not recommendations to buy or sell any security.
Annual Report 2013
4
Columbia Large Cap Enhanced Core Fund
Manager Discussion of Fund Performance (continued)
valuation and quality measures wasn't enough to overcome the headwind from the quality measures, and our top-ranked quintile of stocks for the aggregate stock selection model slightly underperformed the benchmark slightly.
Health Care, Energy and Materials Investments Bolstered Performance
The three top sectors contributing to Fund performance were health care, energy and materials. In the health care sector, the Fund had more exposure than the benchmark to Merck, which was a standout performer during the period. Within the energy sector, overweights relative to the benchmark to Valero Energy and Tesoro aided results, as both were very strong performers during the period. An overweight in Discover Financial bolstered relative returns in the financials sector due to the stock's solid results. Intel did poorly for the period; as a result, the Fund's underweight in the stock aided relative returns.
Stock Selection Detracted from Returns in Several Sectors
The Fund gave up ground in the consumer discretionary, technology, industrials, financials, consumer staples and utilities sector. Stock selection generally accounted for the shortfall in these sectors. In the consumer discretionary sector, Apollo Group, a for-profit higher education company, lost significant ground. In the energy sector, Apache sustained a significant loss during the period. In the industrials sector, both Pitney Bowes and R.R. Donnelley & Sons were weak performers. In technology, Advanced Micro Devices was a disappointment. In all five instances, losses were amplified by overweights in the stocks relative to the benchmark.
Looking Forward
The market has had to absorb a mixed bag of economic data, including news that U.S. economic growth was just barely positive in the fourth quarter of 2012, impaired by the biggest cut in defense spending in 40 years, declining exports and sluggish growth in corporate inventories. Personal consumption advanced moderately but appears to be decelerating as consumers react to a 2% payroll tax increase. On a more positive note, home sales in 2012 reached their highest level since 2007, and the economy added more than a million new jobs in the last five months of the period.
Fourth quarter earnings reported early in 2013 modestly beat expectations, and even with a cautious outlook for 2013, investors seemed to give companies the benefit of the doubt that they can manage through a tough demand environment. This may be based on a general belief that the risk of extreme events is dropping. Nonetheless, the many economic and investment challenges we face in the year ahead will likely result in continued market volatility. Yet, equity valuations still currently appear reasonable relative to fixed-income alternatives, and corporate balance sheets are in good condition, with low debt and high cash levels. As a result, even a slower rate of economic growth may be sufficient to sustain a healthy equities market.
Portfolio Breakdown (%)
(at February 28, 2013) | |
Common Stocks | | | 97.3 | | |
Consumer Discretionary | | | 10.9 | | |
Consumer Staples | | | 10.9 | | |
Energy | | | 10.6 | | |
Financials | | | 15.1 | | |
Health Care | | | 12.3 | | |
Industrials | | | 9.7 | | |
Information Technology | | | 17.8 | | |
Materials | | | 3.2 | | |
Telecommunication Services | | | 3.3 | | |
Utilities | | | 3.5 | | |
Money Market Funds | | | 2.7 | | |
Total | | | 100.0 | | |
Percentages indicated are based upon total investments. The Fund's portfolio composition is subject to change.
Annual Report 2013
5
Columbia Large Cap Enhanced Core Fund
Understanding Your Fund's Expenses
(Unaudited)
As an investor, you incur two types of costs. There are transaction costs, which generally include sales charges on purchases and may include redemption fees. There are also ongoing costs, which generally include management fees, distribution and service (Rule 12b-1) fees, and other fund expenses. The following information is intended to help you understand your ongoing costs (in dollars) of investing in the Fund and to help you compare these costs with the ongoing costs of investing in other mutual funds.
Analyzing Your Fund's Expenses
To illustrate these ongoing costs, we have provided examples and calculated the expenses paid by investors in each share class of the Fund during the period. The actual and hypothetical information in the table is based on an initial investment of $1,000 at the beginning of the period indicated and held for the entire period. Expense information is calculated two ways and each method provides you with different information. The amount listed in the "Actual" column is calculated using the Fund's actual operating expenses and total return for the period. You may use the Actual information, together with the amount invested, to estimate the expenses that you paid over the period. Simply divide your account value by $1,000 (for example, an $8,600 account value divided by $1,000 = 8.6), then multiply the results by the expenses paid during the period under the Actual column. The amount listed in the "Hypothetical" column assumes a 5% annual rate of return before expenses (which is not the Fund's actual return) and then applies the Fund's actual expense ratio for the period to the hypothetical return. You should not use the hypothetical account values and expenses to estimate either your actual account balance at the end of the period or the expenses you paid during the period. See "Compare With Other Funds" below for details on how to use the hypothetical data.
Compare With Other Funds
Since all mutual funds are required to include the same hypothetical calculations about expenses in shareholder reports, you can use this information to compare the ongoing cost of investing in the Fund with other funds. To do so, compare the hypothetical example with the 5% hypothetical examples that appear in the shareholder reports of other funds. As you compare hypothetical examples of other funds, it is important to note that hypothetical examples are meant to highlight the ongoing costs of investing in a fund only and do not reflect any transaction costs, such as sales charges, or redemption or exchange fees. Therefore, the hypothetical calculations are useful in comparing ongoing costs only, and will not help you determine the relative total costs of owning different funds. If transaction costs were included in these calculations, your costs would be higher.
September 1, 2012 – February 28, 2013
| | Account Value at the Beginning
of the Period ($) | | Account Value at the End of the
Period ($) | | Expenses Paid During the
Period ($) | | Fund's Annualized
Expense Ratio (%) | |
| | Actual | | Hypothetical | | Actual | | Hypothetical | | Actual | | Hypothetical | | Actual | |
Class A | | | 1,000.00 | | | | 1,000.00 | | | | 1,074.90 | | | | 1,020.53 | | | | 4.42 | | | | 4.31 | | | | 0.86 | | |
Class I | | | 1,000.00 | | | | 1,000.00 | | | | 1,076.90 | | | | 1,022.51 | | | | 2.37 | | | | 2.31 | | | | 0.46 | | |
Class R | | | 1,000.00 | | | | 1,000.00 | | | | 1,074.40 | | | | 1,019.29 | | | | 5.71 | | | | 5.56 | | | | 1.11 | | |
Class Y | | | 1,000.00 | | | | 1,000.00 | | | | 1,076.80 | | | | 1,022.51 | | | | 2.37 | | | | 2.31 | | | | 0.46 | | |
Class Z | | | 1,000.00 | | | | 1,000.00 | | | | 1,075.90 | | | | 1,021.77 | | | | 3.14 | | | | 3.06 | | | | 0.61 | | |
Expenses paid during the period are equal to the annualized expense ratio for each class as indicated above, multiplied by the average account value over the period and then multiplied by the number of days in the Fund's most recent fiscal half year and divided by 365.
Expenses do not include fees and expenses incurred indirectly by the Fund from the underlying funds in which the Fund may invest (also referred to as "acquired funds"), including affiliated and non-affiliated pooled investment vehicles (including mutual funds and exchange-traded funds).
Had Columbia Management Investment Advisers, LLC and/or certain of its affiliates not waived/reimbursed certain fees and expenses, account value at the end of the period would have been reduced.
Annual Report 2013
6
Columbia Large Cap Enhanced Core Fund
Portfolio of Investments
February 28, 2013
(Percentages represent value of investments compared to net assets)
Common Stocks 97.2%
Issuer | | Shares | | Value ($) | |
Consumer Discretionary 10.9% | |
Auto Components 0.4% | |
Delphi Automotive PLC(a) | | | 24,600 | | | | 1,029,510 | | |
Hotels, Restaurants & Leisure 0.3% | |
Yum! Brands, Inc. | | | 11,600 | | | | 759,568 | | |
Media 5.0% | |
Comcast Corp., Class A | | | 105,100 | | | | 4,181,929 | | |
DIRECTV(a) | | | 52,000 | | | | 2,504,840 | | |
Discovery Communications, Inc., Class A(a) | | | 36,800 | | | | 2,698,544 | | |
Gannett Co., Inc. | | | 46,100 | | | | 925,227 | | |
Scripps Networks Interactive, Inc., Class A | | | 34,700 | | | | 2,187,835 | | |
Time Warner Cable, Inc. | | | 10,200 | | | | 881,178 | | |
Total | | | | | 13,379,553 | | |
Multiline Retail 0.9% | |
Macy's, Inc. | | | 56,700 | | | | 2,330,370 | | |
Specialty Retail 4.3% | |
Gap, Inc. (The) | | | 66,100 | | | | 2,176,012 | | |
Home Depot, Inc. (The) | | | 61,300 | | | | 4,199,050 | | |
PetSmart, Inc. | | | 3,600 | | | | 234,396 | | |
Ross Stores, Inc. | | | 39,900 | | | | 2,312,604 | | |
TJX Companies, Inc. | | | 61,100 | | | | 2,747,667 | | |
Total | | | | | 11,669,729 | | |
Total Consumer Discretionary | | | | | 29,168,730 | | |
Consumer Staples 10.9% | |
Beverages 0.8% | |
Coca-Cola Co. (The) | | | 26,200 | | | | 1,014,464 | | |
Coca-Cola Enterprises, Inc. | | | 10,800 | | | | 386,424 | | |
PepsiCo, Inc. | | | 10,100 | | | | 765,277 | | |
Total | | | | | 2,166,165 | | |
Food & Staples Retailing 4.1% | |
CVS Caremark Corp. | | | 65,300 | | | | 3,338,136 | | |
Kroger Co. (The) | | | 33,600 | | | | 981,456 | | |
Safeway, Inc. | | | 100,600 | | | | 2,400,316 | | |
Wal-Mart Stores, Inc. | | | 59,600 | | | | 4,218,488 | | |
Total | | | | | 10,938,396 | | |
Food Products 1.8% | |
Campbell Soup Co. | | | 55,100 | | | | 2,267,916 | | |
General Mills, Inc. | | | 9,900 | | | | 457,875 | | |
Tyson Foods, Inc., Class A | | | 95,800 | | | | 2,171,786 | | |
Total | | | | | 4,897,577 | | |
Common Stocks (continued)
Issuer | | Shares | | Value ($) | |
Household Products 1.0% | |
Kimberly-Clark Corp. | | | 8,700 | | | | 820,236 | | |
Procter & Gamble Co. (The) | | | 23,200 | | | | 1,767,376 | | |
Total | | | | | 2,587,612 | | |
Tobacco 3.2% | |
Altria Group, Inc. | | | 51,900 | | | | 1,741,245 | | |
Lorillard, Inc. | | | 55,400 | | | | 2,135,116 | | |
Philip Morris International, Inc. | | | 51,400 | | | | 4,715,950 | | |
Total | | | | | 8,592,311 | | |
Total Consumer Staples | | | | | 29,182,061 | | |
Energy 10.6% | |
Energy Equipment & Services 1.2% | |
Diamond Offshore Drilling, Inc. | | | 29,300 | | | | 2,041,624 | | |
Ensco PLC, Class A | | | 9,000 | | | | 541,260 | | |
Nabors Industries Ltd.(a) | | | 27,900 | | | | 467,604 | | |
Total | | | | | 3,050,488 | | |
Oil, Gas & Consumable Fuels 9.4% | |
Apache Corp. | | | 32,400 | | | | 2,406,348 | | |
Chevron Corp. | | | 52,700 | | | | 6,173,805 | | |
ConocoPhillips | | | 56,700 | | | | 3,285,765 | | |
Exxon Mobil Corp. | | | 72,900 | | | | 6,528,195 | | |
Marathon Oil Corp. | | | 40,800 | | | | 1,366,800 | | |
Marathon Petroleum Corp. | | | 6,700 | | | | 555,296 | | |
Tesoro Corp. | | | 39,100 | | | | 2,198,984 | | |
Valero Energy Corp. | | | 61,800 | | | | 2,817,462 | | |
Total | | | | | 25,332,655 | | |
Total Energy | | | | | 28,383,143 | | |
Financials 15.1% | |
Capital Markets 2.2% | |
Franklin Resources, Inc. | | | 16,700 | | | | 2,358,875 | | |
Goldman Sachs Group, Inc. (The) | | | 23,400 | | | | 3,504,384 | | |
Total | | | | | 5,863,259 | | |
Commercial Banks 1.5% | |
Fifth Third Bancorp | | | 136,800 | | | | 2,166,912 | | |
Wells Fargo & Co. | | | 53,300 | | | | 1,869,764 | | |
Total | | | | | 4,036,676 | | |
Consumer Finance 0.9% | |
SLM Corp. | | | 125,400 | | | | 2,378,838 | | |
The accompanying Notes to Financial Statements are an integral part of this statement.
Annual Report 2013
7
Columbia Large Cap Enhanced Core Fund
Portfolio of Investments (continued)
February 28, 2013
Common Stocks (continued)
Issuer | | Shares | | Value ($) | |
Diversified Financial Services 4.2% | |
Citigroup, Inc. | | | 106,700 | | | | 4,478,199 | | |
JPMorgan Chase & Co. | | | 119,500 | | | | 5,845,940 | | |
Moody's Corp. | | | 20,500 | | | | 985,230 | | |
Total | | | | | 11,309,369 | | |
Insurance 4.5% | |
Allstate Corp. (The) | | | 54,200 | | | | 2,494,284 | | |
Aon PLC | | | 32,900 | | | | 2,009,861 | | |
Berkshire Hathaway, Inc., Class B(a) | | | 12,200 | | | | 1,246,352 | | |
Lincoln National Corp. | | | 66,100 | | | | 1,952,594 | | |
MetLife, Inc. | | | 53,300 | | | | 1,888,952 | | |
Prudential Financial, Inc. | | | 43,800 | | | | 2,433,966 | | |
Total | | | | | 12,026,009 | | |
Real Estate Investment Trusts (REITs) 1.8% | |
Public Storage | | | 11,400 | | | | 1,723,794 | | |
Simon Property Group, Inc. | | | 19,100 | | | | 3,034,226 | | |
Ventas, Inc. | | | 3,900 | | | | 276,042 | | |
Total | | | | | 5,034,062 | | |
Total Financials | | | | | 40,648,213 | | |
Health Care 12.3% | |
Biotechnology 1.7% | |
Amgen, Inc. | | | 9,500 | | | | 868,395 | | |
Celgene Corp.(a) | | | 15,800 | | | | 1,630,244 | | |
Gilead Sciences, Inc.(a) | | | 50,500 | | | | 2,156,855 | | |
Total | | | | | 4,655,494 | | |
Health Care Equipment & Supplies 2.8% | |
Abbott Laboratories | | | 31,200 | | | | 1,054,248 | | |
Becton Dickinson and Co. | | | 25,900 | | | | 2,280,754 | | |
Boston Scientific Corp.(a) | | | 56,600 | | | | 418,274 | | |
CareFusion Corp.(a) | | | 25,500 | | | | 834,870 | | |
St. Jude Medical, Inc. | | | 49,100 | | | | 2,013,100 | | |
Zimmer Holdings, Inc. | | | 10,100 | | | | 757,096 | | |
Total | | | | | 7,358,342 | | |
Health Care Providers & Services 1.4% | |
AmerisourceBergen Corp. | | | 32,900 | | | | 1,552,880 | | |
Cardinal Health, Inc. | | | 50,100 | | | | 2,315,121 | | |
Total | | | | | 3,868,001 | | |
Common Stocks (continued)
Issuer | | Shares | | Value ($) | |
Pharmaceuticals 6.4% | |
AbbVie, Inc. | | | 31,200 | | | | 1,151,904 | | |
Bristol-Myers Squibb Co. | | | 84,600 | | | | 3,127,662 | | |
Eli Lilly & Co. | | | 57,300 | | | | 3,132,018 | | |
Johnson & Johnson | | | 27,100 | | | | 2,062,581 | | |
Merck & Co., Inc. | | | 43,800 | | | | 1,871,574 | | |
Pfizer, Inc. | | | 209,500 | | | | 5,734,015 | | |
Total | | | | | 17,079,754 | | |
Total Health Care | | | | | 32,961,591 | | |
Industrials 9.7% | |
Aerospace & Defense 2.5% | |
Boeing Co. (The) | | | 19,600 | | | | 1,507,240 | | |
General Dynamics Corp. | | | 12,500 | | | | 849,625 | | |
Northrop Grumman Corp. | | | 35,000 | | | | 2,298,800 | | |
Raytheon Co. | | | 39,800 | | | | 2,171,886 | | |
Total | | | | | 6,827,551 | | |
Air Freight & Logistics 1.2% | |
United Parcel Service, Inc., Class B | | | 37,900 | | | | 3,132,435 | | |
Airlines 0.8% | |
Southwest Airlines Co. | | | 197,300 | | | | 2,308,410 | | |
Electrical Equipment 1.8% | |
Emerson Electric Co. | | | 45,800 | | | | 2,596,860 | | |
Rockwell Automation, Inc. | | | 24,100 | | | | 2,177,194 | | |
Total | | | | | 4,774,054 | | |
Industrial Conglomerates 2.0% | |
Danaher Corp. | | | 45,500 | | | | 2,802,800 | | |
General Electric Co.(b) | | | 109,300 | | | | 2,537,946 | | |
Total | | | | | 5,340,746 | | |
Machinery 1.0% | |
Illinois Tool Works, Inc. | | | 43,000 | | | | 2,644,500 | | |
Professional Services 0.4% | |
Dun & Bradstreet Corp. (The) | | | 10,500 | | | | 846,300 | | |
Equifax, Inc. | | | 3,900 | | | | 214,968 | | |
Total | | | | | 1,061,268 | | |
Total Industrials | | | | | 26,088,964 | | |
The accompanying Notes to Financial Statements are an integral part of this statement.
Annual Report 2013
8
Columbia Large Cap Enhanced Core Fund
Portfolio of Investments (continued)
February 28, 2013
Common Stocks (continued)
Issuer | | Shares | | Value ($) | |
Information Technology 17.7% | |
Communications Equipment 1.6% | |
Cisco Systems, Inc. | | | 205,800 | | | | 4,290,930 | | |
QUALCOMM, Inc. | | | 1,700 | | | | 111,571 | | |
Total | | | | | 4,402,501 | | |
Computers & Peripherals 5.2% | |
Apple, Inc. | | | 22,100 | | | | 9,754,940 | | |
EMC Corp.(a) | | | 118,400 | | | | 2,724,384 | | |
Seagate Technology PLC | | | 8,200 | | | | 263,712 | | |
Western Digital Corp. | | | 26,900 | | | | 1,268,604 | | |
Total | | | | | 14,011,640 | | |
Internet Software & Services 2.7% | |
Google, Inc., Class A(a) | | | 6,800 | | | | 5,448,160 | | |
VeriSign, Inc.(a) | | | 41,700 | | | | 1,909,860 | | |
Total | | | | | 7,358,020 | | |
IT Services 2.2% | |
Accenture PLC, Class A | | | 8,600 | | | | 639,496 | | |
International Business Machines Corp. | | | 11,100 | | | | 2,229,213 | | |
Mastercard, Inc., Class A | | | 6,000 | | | | 3,106,920 | | |
Total | | | | | 5,975,629 | | |
Semiconductors & Semiconductor Equipment 1.2% | |
Broadcom Corp., Class A | | | 25,900 | | | | 883,449 | | |
Intel Corp. | | | 5,900 | | | | 123,015 | | |
Linear Technology Corp. | | | 500 | | | | 19,120 | | |
NVIDIA Corp. | | | 167,300 | | | | 2,118,018 | | |
Total | | | | | 3,143,602 | | |
Software 4.8% | |
CA, Inc. | | | 84,700 | | | | 2,074,303 | | |
Microsoft Corp.(b) | | | 217,800 | | | | 6,054,840 | | |
Oracle Corp. | | | 134,500 | | | | 4,607,970 | | |
Total | | | | | 12,737,113 | | |
Total Information Technology | | | | | 47,628,505 | | |
Materials 3.2% | |
Chemicals 3.0% | |
CF Industries Holdings, Inc. | | | 11,100 | | | | 2,229,213 | | |
Eastman Chemical Co. | | | 34,000 | | | | 2,370,820 | | |
LyondellBasell Industries NV, Class A | | | 42,600 | | | | 2,497,212 | | |
Mosaic Co. (The) | | | 13,800 | | | | 807,852 | | |
Total | | | | | 7,905,097 | | |
Common Stocks (continued)
Issuer | | Shares | | Value ($) | |
Metals & Mining 0.2% | |
Freeport-McMoRan Copper & Gold, Inc. | | | 17,300 | | | | 552,216 | | |
Total Materials | | | | | 8,457,313 | | |
Telecommunication Services 3.3% | |
Diversified Telecommunication Services 3.3% | |
AT&T, Inc. | | | 119,900 | | | | 4,305,609 | | |
Verizon Communications, Inc. | | | 97,600 | | | | 4,541,328 | | |
Total | | | | | 8,846,937 | | |
Total Telecommunication Services | | | | | 8,846,937 | | |
Utilities 3.5% | |
Electric Utilities 1.6% | |
American Electric Power Co., Inc. | | | 51,600 | | | | 2,414,364 | | |
Pinnacle West Capital Corp. | | | 32,800 | | | | 1,834,832 | | |
Total | | | | | 4,249,196 | | |
Independent Power Producers & Energy Traders 0.8% | |
AES Corp. (The) | | | 189,100 | | | | 2,197,342 | | |
Multi-Utilities 1.1% | |
Ameren Corp. | | | 10,600 | | | | 358,174 | | |
CenterPoint Energy, Inc. | | | 12,500 | | | | 267,875 | | |
Public Service Enterprise Group, Inc. | | | 73,500 | | | | 2,395,365 | | |
Total | | | | | 3,021,414 | | |
Total Utilities | | | | | 9,467,952 | | |
Total Common Stocks
(Cost: $178,497,450) | | | | | 260,833,409 | | |
Money Market Funds 2.7% | |
Columbia Short-Term Cash Fund,
0.128%(c)(d) | | | 7,247,525 | | | | 7,247,525 | | |
Total Money Market Funds
(Cost: $7,247,525) | | | 7,247,525 | | |
Total Investments
(Cost: $185,744,975) | | | 268,080,934 | | |
Other Assets & Liabilities, Net | | | 388,291 | | |
Net Assets | | | 268,469,225 | | |
The accompanying Notes to Financial Statements are an integral part of this statement.
Annual Report 2013
9
Columbia Large Cap Enhanced Core Fund
Portfolio of Investments (continued)
February 28, 2013
Investments in Derivatives
Futures Contracts Outstanding at February 28, 2013
Contract Description | | Number of
Contracts
Long (Short) | | Notional
Market
Value ($) | | Expiration
Date | | Unrealized
Appreciation ($) | | Unrealized
Depreciation ($) | |
S&P 500 Index | | | 21 | | | | 7,944,825 | | | March 2013 | | | 388,929 | | | | — | | |
Notes to Portfolio of Investments
(a) Non-income producing.
(b) At February 28, 2013, investments in securities included securities valued at $3,383,400 that were partially pledged as collateral to cover initial margin deposits on open stock index futures contracts.
(c) As defined in the Investment Company Act of 1940, an affiliated company is one in which the Fund owns 5% or more of its outstanding voting securities, or a company which is under common ownership or control with the Fund. Holdings and transactions in these affiliated companies during the year ended February 28, 2013, are as follows:
Issuer | |
Beginning
Cost ($) | |
Purchase
Cost ($) | | Proceeds
From Sales ($) | |
Ending
Cost ($) | | Dividends —
Affiliated
Issuers ($) | |
Value ($) | |
Columbia Short-Term Cash Fund | | | 4,604,916 | | | | 93,452,380 | | | | (90,809,771 | ) | | | 7,247,525 | | | | 9,245 | | | | 7,247,525 | | |
(d) The rate shown is the seven-day current annualized yield at February 28, 2013.
Fair Value Measurements
Generally accepted accounting principles (GAAP) require disclosure regarding the inputs and valuation techniques used to measure fair value and any changes in valuation inputs or techniques. In addition, investments shall be disclosed by major category.
The Fund categorizes its fair value measurements according to a three-level hierarchy that maximizes the use of observable inputs and minimizes the use of unobservable inputs by prioritizing that the most observable input be used when available. Observable inputs are those that market participants would use in pricing an investment based on market data obtained from sources independent of the reporting entity. Unobservable inputs are those that reflect the Fund's assumptions about the information market participants would use in pricing an investment. An investment's level within the fair value hierarchy is based on the lowest level of any input that is deemed significant to the asset or liability's fair value measurement. The input levels are not necessarily an indication of the risk or liquidity associated with investments at that level. For example, certain U.S. government securities are generally high quality and liquid, however, they are reflected as Level 2 because the inputs used to determine fair value may not always be quoted prices in an active market.
Fair value inputs are summarized in the three broad levels listed below:
> Level 1 — Valuations based on quoted prices for investments in active markets that the Fund has the ability to access at the measurement date (including NAV for open-end mutual funds). Valuation adjustments are not applied to Level 1 investments.
> Level 2 — Valuations based on other significant observable inputs (including quoted prices for similar securities, interest rates, prepayment speeds, credit risks, etc.).
> Level 3 — Valuations based on significant unobservable inputs (including the Fund's own assumptions and judgment in determining the fair value of investments).
Inputs that are used in determining fair value of an investment may include price information, credit data, volatility statistics, and other factors. These inputs can be either observable or unobservable. The availability of observable inputs can vary between investments, and is affected by various factors such as the type of investment, and the volume and level of activity for that investment or similar investments in the marketplace. The inputs will be considered by the Investment Manager, along with any other relevant factors in the calculation of an investment's fair value. The Fund uses prices and inputs that are current as of the measurement date, which may include periods of market dislocations. During these periods, the availability of prices and inputs may be reduced for many investments. This condition could cause an investment to be reclassified between the various levels within the hierarchy.
Investments falling into the Level 3 category are primarily supported by quoted prices from brokers and dealers participating in the market for those investments. However, these may be classified as Level 3 investments due to lack of market transparency and corroboration to support these quoted prices. Additionally, valuation models may be used as the pricing source for any remaining investments classified as Level 3. These models rely on one or more significant unobservable inputs and/or significant assumptions by the Investment Manager. Inputs used in valuations may include, but are not limited to, financial statement analysis, capital account balances, discount rates and estimated cash flows, and comparable company data.
The accompanying Notes to Financial Statements are an integral part of this statement.
Annual Report 2013
10
Columbia Large Cap Enhanced Core Fund
Portfolio of Investments (continued)
February 28, 2013
Fair Value Measurements (continued)
Under the direction of the Fund's Board of Trustees (the Board), the Investment Manager's Valuation Committee (the Committee) is responsible for carrying out the valuation procedures approved by the Board. The Committee consists of voting and non-voting members from various groups within the Investment Manager's organization, including operations and accounting, trading and investments, compliance, risk management and legal.
The Committee meets at least monthly to review and approve valuation matters, which may include a description of specific valuation determinations, data regarding pricing information received from approved pricing vendors and brokers and the results of Board-approved valuation control policies and procedures (the Policies). The Policies address, among other things, instances when market quotations are readily available, including recommendations of third party pricing vendors and a determination of appropriate pricing methodologies; events that require specific valuation determinations and assessment of fair value techniques; securities with a potential for stale pricing, including those that are illiquid, restricted, or in default; and the effectiveness of third-party pricing vendors, including periodic reviews of vendors. The Committee meets more frequently, as needed, to discuss additional valuation matters, which may include the need to review back-testing results, review time-sensitive information or approve related valuation actions. The Committee reports to the Board, with members of the Committee meeting with the Board at each of its regularly scheduled meetings to discuss valuation matters and actions during the period, similar to those described earlier.
For investments categorized as Level 3, the Committee monitors information similar to that described above, which may include: (i) data specific to the issuer or comparable issuers, (ii) general market or specific sector news and (iii) quoted prices and specific or similar security transactions. The Committee considers this data and any changes from prior periods in order to assess the reasonableness of observable and unobservable inputs, any assumptions or internal models used to value those securities and changes in fair value. This data is also used to corroborate, when available, information received from approved pricing vendors and brokers. Various factors impact the frequency of monitoring this information (which may occur as often as daily). However, the Committee may determine that changes to inputs, assumptions and models are not required as a result of the monitoring procedures performed.
The following table is a summary of the inputs used to value the Fund's investments at February 28, 2013:
Description | | Level 1
Quoted Prices in Active
Markets for Identical
Assets ($) | |
Level 2
Other Significant
Observable Inputs ($) | |
Level 3
Significant
Unobservable Inputs ($) | |
Total ($) | |
Equity Securities | |
Common Stocks | |
Consumer Discretionary | | | 29,168,730 | | | | — | | | | — | | | | 29,168,730 | | |
Consumer Staples | | | 29,182,061 | | | | — | | | | — | | | | 29,182,061 | | |
Energy | | | 28,383,143 | | | | — | | | | — | | | | 28,383,143 | | |
Financials | | | 40,648,213 | | | | — | | | | — | | | | 40,648,213 | | |
Health Care | | | 32,961,591 | | | | — | | | | — | | | | 32,961,591 | | |
Industrials | | | 26,088,964 | | | | — | | | | — | | | | 26,088,964 | | |
Information Technology | | | 47,628,505 | | | | — | | | | — | | | | 47,628,505 | | |
Materials | | | 8,457,313 | | | | — | | | | — | | | | 8,457,313 | | |
Telecommunication Services | | | 8,846,937 | | | | — | | | | — | | | | 8,846,937 | | |
Utilities | | | 9,467,952 | | | | — | | | | — | | | | 9,467,952 | | |
Total Equity Securities | | | 260,833,409 | | | | — | | | | — | | | | 260,833,409 | | |
Other | |
Money Market Funds | | | 7,247,525 | | | | — | | | | — | | | | 7,247,525 | | |
Total Other | | | 7,247,525 | | | | — | | | | — | | | | 7,247,525 | | |
Investments in Securities | | | 268,080,934 | | | | — | | | | — | | | | 268,080,934 | | |
Derivatives | |
Assets | |
Futures Contracts | | | 388,929 | | | | — | | | | — | | | | 388,929 | | |
Total | | | 268,469,863 | | | | — | | | | — | | | | 268,469,863 | | |
See the Portfolio of Investments for all investment classifications not indicated in the table.
There were no transfers of financial assets between Levels 1 and 2 during the period.
Derivative instruments are valued at unrealized appreciation (depreciation).
The accompanying Notes to Financial Statements are an integral part of this statement.
Annual Report 2013
11
Columbia Large Cap Enhanced Core Fund
Statement of Assets and Liabilities
February 28, 2013
Assets | |
Investments, at value | |
Unaffiliated issuers (identified cost $178,497,450) | | $ | 260,833,409 | | |
Affiliated issuers (identified cost $7,247,525) | | | 7,247,525 | | |
Total investments (identified cost $185,744,975) | | | 268,080,934 | | |
Receivable for: | |
Investments sold | | | 40,755,295 | | |
Capital shares sold | | | 203,251 | | |
Dividends | | | 767,158 | | |
Expense reimbursement due from Investment Manager | | | 1,734 | | |
Prepaid expenses | | | 1,791 | | |
Total assets | | | 309,810,163 | | |
Liabilities | |
Payable for: | |
Investments purchased | | | 11,520,243 | | |
Capital shares purchased | | | 29,333,053 | | |
Variation margin on futures contracts | | | 125,041 | | |
Investment management fees | | | 4,408 | | |
Distribution and/or service fees | | | 107 | | |
Transfer agent fees | | | 40,635 | | |
Administration fees | | | 490 | | |
Compensation of board members | | | 76,679 | | |
Other expenses | | | 240,282 | | |
Total liabilities | | | 41,340,938 | | |
Net assets applicable to outstanding capital stock | | $ | 268,469,225 | | |
Represented by | |
Paid-in capital | | $ | 293,027,781 | | |
Undistributed net investment income | | | 605,646 | | |
Accumulated net realized loss | | | (107,889,090 | ) | |
Unrealized appreciation (depreciation) on: | |
Investments | | | 82,335,959 | | |
Futures contracts | | | 388,929 | | |
Total — representing net assets applicable to outstanding capital stock | | $ | 268,469,225 | | |
The accompanying Notes to Financial Statements are an integral part of this statement.
Annual Report 2013
12
Columbia Large Cap Enhanced Core Fund
Statement of Assets and Liabilities (continued)
February 28, 2013
Class A | |
Net assets | | $ | 13,209,120 | | |
Shares outstanding | | | 878,215 | | |
Net asset value per share | | $ | 15.04 | | |
Class I | |
Net assets | | $ | 36,224,009 | | |
Shares outstanding | | | 2,414,783 | | |
Net asset value per share | | $ | 15.00 | | |
Class R | |
Net assets | | $ | 1,284,166 | | |
Shares outstanding | | | 85,464 | | |
Net asset value per share | | $ | 15.03 | | |
Class Y | |
Net assets | | $ | 3,177,252 | | |
Shares outstanding | | | 211,811 | | |
Net asset value per share | | $ | 15.00 | | |
Class Z | |
Net assets | | $ | 214,574,678 | | |
Shares outstanding | | | 14,311,637 | | |
Net asset value per share | | $ | 14.99 | | |
The accompanying Notes to Financial Statements are an integral part of this statement.
Annual Report 2013
13
Columbia Large Cap Enhanced Core Fund
Statement of Operations
Year Ended February 28, 2013
Net investment income | |
Income: | |
Dividends — unaffiliated issuers | | $ | 6,744,945 | | |
Dividends — affiliated issuers | | | 9,245 | | |
Interest | | | 246 | | |
Income from securities lending — net | | | 73,212 | | |
Foreign taxes withheld | | | (25,347 | ) | |
Total income | | | 6,802,301 | | |
Expenses: | |
Investment management fees | | | 1,932,008 | | |
Distribution and/or service fees | |
Class A | | | 30,732 | | |
Class R | | | 2,487 | | |
Transfer agent fees | |
Class A | | | 24,591 | | |
Class R | | | 993 | | |
Class Y | | | 21 | | |
Class Z | | | 474,768 | | |
Administration fees | | | 168,003 | | |
Compensation of board members | | | 27,700 | | |
Custodian fees | | | 9,653 | | |
Printing and postage fees | | | 71,437 | | |
Registration fees | | | 85,308 | | |
Professional fees | | | 31,026 | | |
Other | | | 14,313 | | |
Total expenses | | | 2,873,040 | | |
Fees waived or expenses reimbursed by Investment Manager and its affiliates | | | (1,086,399 | ) | |
Expense reductions | | | (140 | ) | |
Total net expenses | | | 1,786,501 | | |
Net investment income | | | 5,015,800 | | |
Realized and unrealized gain (loss) — net | |
Net realized gain (loss) on: | |
Investments | | | 33,758,933 | | |
Futures contracts | | | 1,040,532 | | |
Net realized gain | | | 34,799,465 | | |
Net change in unrealized appreciation (depreciation) on: | |
Investments | | | (6,768,144 | ) | |
Futures contracts | | | 233,171 | | |
Net change in unrealized appreciation (depreciation) | | | (6,534,973 | ) | |
Net realized and unrealized gain | | | 28,264,492 | | |
Net increase in net assets resulting from operations | | $ | 33,280,292 | | |
The accompanying Notes to Financial Statements are an integral part of this statement.
Annual Report 2013
14
Columbia Large Cap Enhanced Core Fund
Statement of Changes in Net Assets
| | | Year Ended
February 28,
2013 | | Year Ended
February 29,
2012 | |
Operations | |
Net investment income | | $ | 5,015,800 | | | $ | 4,899,025 | | |
Net realized gain | | | 34,799,465 | | | | 55,219,777 | | |
Net change in unrealized appreciation (depreciation) | | | (6,534,973 | ) | | | (39,680,472 | ) | |
Net increase in net assets resulting from operations | | | 33,280,292 | | | | 20,438,330 | | |
Distributions to shareholders | |
Net investment income | |
Class A | | | (188,669 | ) | | | (177,778 | ) | |
Class I | | | (650,071 | ) | | | (218,209 | ) | |
Class R | | | (9,708 | ) | | | (2,930 | ) | |
Class Y | | | (55,773 | ) | | | (56,015 | ) | |
Class Z | | | (4,155,698 | ) | | | (4,721,975 | ) | |
Total distributions to shareholders | | | (5,059,919 | ) | | | (5,176,907 | ) | |
Increase (decrease) in net assets from capital stock activity | | | (43,179,736 | ) | | | (148,478,815 | ) | |
Total decrease in net assets | | | (14,959,363 | ) | | | (133,217,392 | ) | |
Net assets at beginning of year | | | 283,428,588 | | | | 416,645,980 | | |
Net assets at end of year | | $ | 268,469,225 | | | $ | 283,428,588 | | |
Undistributed net investment income | | $ | 605,646 | | | $ | 649,765 | | |
The accompanying Notes to Financial Statements are an integral part of this statement.
Annual Report 2013
15
Columbia Large Cap Enhanced Core Fund
Statement of Changes in Net Assets (continued)
| | | Year Ended February 28, 2013 | | Year Ended February 29, 2012 | |
| | | Shares | | Dollars ($) | | Shares | | Dollars ($) | |
Capital stock activity | |
Class A shares | |
Subscriptions | | | 145,052 | | | | 2,069,335 | | | | 102,738 | | | | 1,292,075 | | |
Distributions reinvested | | | 7,146 | | | | 100,390 | | | | 6,941 | | | | 85,718 | | |
Redemptions | | | (181,688 | ) | | | (2,565,249 | ) | | | (155,456 | ) | | | (1,913,399 | ) | |
Net decrease | | | (29,490 | ) | | | (395,524 | ) | | | (45,777 | ) | | | (535,606 | ) | |
Class I shares | |
Subscriptions | | | 3,406,324 | | | | 47,272,503 | | | | 1,115,305 | | | | 13,431,106 | | |
Distributions reinvested | | | 46,353 | | | | 650,012 | | | | 17,728 | | | | 218,155 | | |
Redemptions | | | (2,013,490 | ) | | | (28,588,536 | ) | | | (741,741 | ) | | | (9,394,174 | ) | |
Net increase | | | 1,439,187 | | | | 19,333,979 | | | | 391,292 | | | | 4,255,087 | | |
Class R shares | |
Subscriptions | | | 79,167 | | | | 1,128,386 | | | | 6,183 | | | | 74,577 | | |
Distributions reinvested | | | 562 | | | | 7,914 | | | | 237 | | | | 2,930 | | |
Redemptions | | | (9,187 | ) | | | (133,056 | ) | | | (5,162 | ) | | | (66,574 | ) | |
Net increase | | | 70,542 | | | | 1,003,244 | | | | 1,258 | | | | 10,933 | | |
Class Y shares | |
Subscriptions | | | 18,945 | | | | 258,233 | | | | 4,531 | | | | 55,742 | | |
Distributions reinvested | | | — | | | | — | | | | 23 | | | | 273 | | |
Redemptions | | | (29,073 | ) | | | (415,740 | ) | | | (2,253,345 | ) | | | (28,066,198 | ) | |
Net decrease | | | (10,128 | ) | | | (157,507 | ) | | | (2,248,791 | ) | | | (28,010,183 | ) | |
Class Z shares | |
Subscriptions | | | 2,714,857 | | | | 38,196,210 | | | | 1,005,023 | | | | 12,568,288 | | |
Distributions reinvested | | | 21,699 | | | | 304,171 | | | | 12,154 | | | | 149,441 | | |
Redemptions | | | (7,107,729 | ) | | | (101,464,309 | ) | | | (10,921,456 | ) | | | (136,916,775 | ) | |
Net decrease | | | (4,371,173 | ) | | | (62,963,928 | ) | | | (9,904,279 | ) | | | (124,199,046 | ) | |
Total net decrease | | | (2,901,062 | ) | | | (43,179,736 | ) | | | (11,806,297 | ) | | | (148,478,815 | ) | |
The accompanying Notes to Financial Statements are an integral part of this statement.
Annual Report 2013
16
Columbia Large Cap Enhanced Core Fund
The following tables are intended to help you understand the Fund's financial performance. Certain information reflects financial results for a single share of a class held for the periods shown. Per share net investment income (loss) amounts are calculated based on average shares outstanding during the period. Total return assumes reinvestment of all dividends and distributions, if any. Total return does not reflect payment of sales charges, if any, and is not annualized for periods of less than one year.
| | | Year Ended
February 28, | | Year Ended
February 29, | | Year Ended February 28, | |
Class A | | 2013 | | 2012 | | 2011 | | 2010 | | 2009 | |
Per share data | |
Net asset value, beginning of period | | $ | 13.67 | | | $ | 12.81 | | | $ | 10.73 | | | $ | 7.24 | | | $ | 12.91 | | |
Income from investment operations: | |
Net investment income | | | 0.22 | | | | 0.17 | | | | 0.14 | | | | 0.13 | | | | 0.18 | | |
Net realized and unrealized gain (loss) | | | 1.36 | | | | 0.89 | | | | 2.08 | | | | 3.52 | | | | (5.69 | ) | |
Total from investment operations | | | 1.58 | | | | 1.06 | | | | 2.22 | | | | 3.65 | | | | (5.51 | ) | |
Less distributions to shareholders: | |
Net investment income | | | (0.21 | ) | | | (0.20 | ) | | | (0.14 | ) | | | (0.16 | ) | | | (0.16 | ) | |
Total distributions to shareholders | | | (0.21 | ) | | | (0.20 | ) | | | (0.14 | ) | | | (0.16 | ) | | | (0.16 | ) | |
Proceeds from regulatory settlements | | | — | | | | — | | | | — | | | | 0.00 | (a) | | | — | | |
Net asset value, end of period | | $ | 15.04 | | | $ | 13.67 | | | $ | 12.81 | | | $ | 10.73 | | | $ | 7.24 | | |
Total return | | | 11.71 | % | | | 8.41 | % | | | 20.84 | % | | | 50.49 | % | | | (42.89 | %) | |
Ratios to average net assets(b)(c) | |
Total gross expenses | | | 1.28 | % | | | 1.19 | %(d) | | | 0.96 | %(d) | | | 0.92 | %(d) | | | 0.82 | %(d) | |
Total net expenses(e) | | | 0.89 | %(f) | | | 0.94 | %(d)(f) | | | 0.95 | %(d)(f) | | | 0.89 | %(d)(f) | | | 0.75 | %(d)(f) | |
Net investment income | | | 1.53 | % | | | 1.33 | % | | | 1.22 | % | | | 1.39 | % | | | 1.63 | % | |
Supplemental data | |
Net assets, end of period (in thousands) | | $ | 13,209 | | | $ | 12,404 | | | $ | 12,213 | | | $ | 12,348 | | | $ | 9,291 | | |
Portfolio turnover | | | 92 | % | | | 67 | % | | | 63 | % | | | 122 | % | | | 246 | % | |
Notes to Financial Highlights
(a) Rounds to zero.
(b) In addition to the fees and expenses which the Fund bears directly, the Fund indirectly bears a pro rata share of the fees and expenses of the acquired funds in which it invests. Such indirect expenses are not included in the reported expense ratios.
(c) Certain line items from prior years have been reclassified to conform to the current presentation.
(d) Includes interest expense which rounds to less than 0.01%.
(e) Total net expenses include the impact of certain waivers/reimbursements made by the Investment Manager and certain of its affiliates, if applicable.
(f) The benefits derived from expense reductions had an impact of less than 0.01%.
The accompanying Notes to Financial Statements are an integral part of this statement.
Annual Report 2013
17
Columbia Large Cap Enhanced Core Fund
Financial Highlights (continued)
Class I | | Year Ended
February 28,
2013 | | Year Ended
February 29,
2012 | | Year Ended
February 28,
2011(a) | |
Per share data | |
Net asset value, beginning of period | | $ | 13.63 | | | $ | 12.78 | | | $ | 11.11 | | |
Income from investment operations: | |
Net investment income | | | 0.28 | | | | 0.21 | | | | 0.09 | | |
Net realized and unrealized gain | | | 1.36 | | | | 0.88 | | | | 1.75 | | |
Total from investment operations | | | 1.64 | | | | 1.09 | | | | 1.84 | | |
Less distributions to shareholders: | |
Net investment income | | | (0.27 | ) | | | (0.24 | ) | | | (0.17 | ) | |
Total distributions to shareholders | | | (0.27 | ) | | | (0.24 | ) | | | (0.17 | ) | |
Net asset value, end of period | | $ | 15.00 | | | $ | 13.63 | | | $ | 12.78 | | |
Total return | | | 12.15 | % | | | 8.73 | % | | | 16.65 | % | |
Ratios to average net assets(b)(c) | |
Total gross expenses | | | 0.84 | % | | | 0.74 | %(d) | | | 0.59 | %(d)(e) | |
Total net expenses(f) | | | 0.50 | % | | | 0.61 | %(d) | | | 0.57 | %(d)(e)(g) | |
Net investment income | | | 2.01 | % | | | 1.72 | % | | | 1.68 | %(e) | |
Supplemental data | |
Net assets, end of period (in thousands) | | $ | 36,224 | | | $ | 13,297 | | | $ | 7,466 | | |
Portfolio turnover | | | 92 | % | | | 67 | % | | | 63 | % | |
Notes to Financial Highlights
(a) For the period from September 27, 2010 (commencement of operations) to February 28, 2011.
(b) In addition to the fees and expenses which the Fund bears directly, the Fund indirectly bears a pro rata share of the fees and expenses of the acquired funds in which it invests. Such indirect expenses are not included in the reported expense ratios.
(c) Certain line items from prior years have been reclassified to conform to the current presentation.
(d) Includes interest expense which rounds to less than 0.01%.
(e) Annualized.
(f) Total net expenses include the impact of certain waivers/reimbursements made by the Investment Manager and certain of its affiliates, if applicable.
(g) The benefits derived from expense reductions had an impact of less than 0.01%.
The accompanying Notes to Financial Statements are an integral part of this statement.
Annual Report 2013
18
Columbia Large Cap Enhanced Core Fund
Financial Highlights (continued)
| | | Year Ended
February 28, | | Year Ended
February 29, | | Year Ended February 28, | |
Class R | | 2013 | | 2012 | | 2011 | | 2010 | | 2009 | |
Per share data | |
Net asset value, beginning of period | | $ | 13.65 | | | $ | 12.80 | | | $ | 10.72 | | | $ | 7.24 | | | $ | 12.90 | | |
Income from investment operations: | |
Net investment income | | | 0.20 | | | | 0.14 | | | | 0.12 | | | | 0.11 | | | | 0.16 | | |
Net realized and unrealized gain (loss) | | | 1.36 | | | | 0.88 | | | | 2.08 | | | | 3.51 | | | | (5.69 | ) | |
Total from investment operations | | | 1.56 | | | | 1.02 | | | | 2.20 | | | | 3.62 | | | | (5.53 | ) | |
Less distributions to shareholders: | |
Net investment income | | | (0.18 | ) | | | (0.17 | ) | | | (0.12 | ) | | | (0.14 | ) | | | (0.13 | ) | |
Total distributions to shareholders | | | (0.18 | ) | | | (0.17 | ) | | | (0.12 | ) | | | (0.14 | ) | | | (0.13 | ) | |
Proceeds from regulatory settlements | | | — | | | | — | | | | — | | | | 0.00 | (a) | | | — | | |
Net asset value, end of period | | $ | 15.03 | | | $ | 13.65 | | | $ | 12.80 | | | $ | 10.72 | | | $ | 7.24 | | |
Total return | | | 11.54 | % | | | 8.08 | % | | | 20.58 | % | | | 50.02 | % | | | (43.01 | %) | |
Ratios to average net assets(b)(c) | |
Total gross expenses | | | 1.53 | % | | | 1.44 | %(d) | | | 1.21 | %(d) | | | 1.17 | %(d) | | | 1.07 | %(d) | |
Total net expenses(e) | | | 1.12 | %(f) | | | 1.19 | %(d)(f) | | | 1.20 | %(d)(f) | | | 1.14 | %(d)(f) | | | 1.00 | %(d)(f) | |
Net investment income | | | 1.45 | % | | | 1.11 | % | | | 1.02 | % | | | 1.08 | % | | | 1.46 | % | |
Supplemental data | |
Net assets, end of period (in thousands) | | $ | 1,284 | | | $ | 204 | | | $ | 175 | | | $ | 112 | | | $ | 39 | | |
Portfolio turnover | | | 92 | % | | | 67 | % | | | 63 | % | | | 122 | % | | | 246 | % | |
Notes to Financial Highlights
(a) Rounds to zero.
(b) In addition to the fees and expenses which the Fund bears directly, the Fund indirectly bears a pro rata share of the fees and expenses of the acquired funds in which it invests. Such indirect expenses are not included in the reported expense ratios.
(c) Certain line items from prior years have been reclassified to conform to the current presentation.
(d) Includes interest expense which rounds to less than 0.01%.
(e) Total net expenses include the impact of certain waivers/reimbursements made by the Investment Manager and certain of its affiliates, if applicable.
(f) The benefits derived from expense reductions had an impact of less than 0.01%.
The accompanying Notes to Financial Statements are an integral part of this statement.
Annual Report 2013
19
Columbia Large Cap Enhanced Core Fund
Financial Highlights (continued)
| | | Year Ended
February 28, | | Year Ended
February 29, | | Year Ended February 28, | |
Class Y | | 2013 | | 2012 | | 2011 | | 2010(a) | |
Per share data | |
Net asset value, beginning of period | | $ | 13.63 | | | $ | 12.78 | | | $ | 10.70 | | | $ | 9.10 | | |
Income from investment operations: | |
Net investment income | | | 0.27 | | | | 0.18 | | | | 0.17 | | | | 0.11 | | |
Net realized and unrealized gain | | | 1.36 | | | | 0.91 | | | | 2.09 | | | | 1.64 | | |
Total from investment operations | | | 1.63 | | | | 1.09 | | | | 2.26 | | | | 1.75 | | |
Less distributions to shareholders: | |
Net investment income | | | (0.26 | ) | | | (0.24 | ) | | | (0.18 | ) | | | (0.15 | ) | |
Total distributions to shareholders | | | (0.26 | ) | | | (0.24 | ) | | | (0.18 | ) | | | (0.15 | ) | |
Net asset value, end of period | | $ | 15.00 | | | $ | 13.63 | | | $ | 12.78 | | | $ | 10.70 | | |
Total return | | | 12.13 | % | | | 8.74 | % | | | 21.30 | % | | | 19.23 | % | |
Ratios to average net assets(b)(c) | |
Total gross expenses | | | 0.83 | % | | | 0.74 | %(d) | | | 0.59 | %(d) | | | 0.57 | %(d)(e) | |
Total net expenses(f) | | | 0.52 | % | | | 0.60 | %(d) | | | 0.58 | %(d)(g) | | | 0.57 | %(d)(e)(g) | |
Net investment income | | | 1.90 | % | | | 1.46 | % | | | 1.53 | % | | | 1.62 | %(e) | |
Supplemental data | |
Net assets, end of period (in thousands) | | $ | 3,177 | | | $ | 3,024 | | | $ | 31,588 | | | $ | 60,329 | | |
Portfolio turnover | | | 92 | % | | | 67 | % | | | 63 | % | | | 122 | % | |
Notes to Financial Highlights
(a) For the period from July 15, 2009 (commencement of operations) to February 28, 2010.
(b) In addition to the fees and expenses which the Fund bears directly, the Fund indirectly bears a pro rata share of the fees and expenses of the acquired funds in which it invests. Such indirect expenses are not included in the reported expense ratios.
(c) Certain line items from prior years have been reclassified to conform to the current presentation.
(d) Includes interest expense which rounds to less than 0.01%.
(e) Annualized.
(f) Total net expenses include the impact of certain waivers/reimbursements made by the Investment Manager and certain of its affiliates, if applicable.
(g) The benefits derived from expense reductions had an impact of less than 0.01%.
The accompanying Notes to Financial Statements are an integral part of this statement.
Annual Report 2013
20
Columbia Large Cap Enhanced Core Fund
Financial Highlights (continued)
| | | Year Ended
February 28, | | Year Ended
February 29, | | Year Ended February 28, | |
Class Z | | 2013 | | 2012 | | 2011 | | 2010 | | 2009 | |
Per share data | |
Net asset value, beginning of period | | $ | 13.62 | | | $ | 12.78 | | | $ | 10.70 | | | $ | 7.22 | | | $ | 12.90 | | |
Income from investment operations: | |
Net investment income | | | 0.25 | | | | 0.19 | | | | 0.16 | | | | 0.16 | | | | 0.21 | | |
Net realized and unrealized gain (loss) | | | 1.37 | | | | 0.88 | | | | 2.09 | | | | 3.50 | | | | (5.68 | ) | |
Total from investment operations | | | 1.62 | | | | 1.07 | | | | 2.25 | | | | 3.66 | | | | (5.47 | ) | |
Less distributions to shareholders: | |
Net investment income | | | (0.25 | ) | | | (0.23 | ) | | | (0.17 | ) | | | (0.18 | ) | | | (0.21 | ) | |
Total distributions to shareholders | | | (0.25 | ) | | | (0.23 | ) | | | (0.17 | ) | | | (0.18 | ) | | | (0.21 | ) | |
Proceeds from regulatory settlements | | | — | | | | — | | | | — | | | | 0.00 | (a) | | | — | | |
Net asset value, end of period | | $ | 14.99 | | | $ | 13.62 | | | $ | 12.78 | | | $ | 10.70 | | | $ | 7.22 | | |
Total return | | | 12.02 | % | | | 8.54 | % | | | 21.18 | % | | | 50.82 | % | | | (42.69 | %) | |
Ratios to average net assets(b)(c) | |
Total gross expenses | | | 1.03 | % | | | 0.94 | %(d) | | | 0.71 | %(d) | | | 0.67 | %(d) | | | 0.57 | %(d) | |
Total net expenses(e) | | | 0.64 | %(f) | | | 0.70 | %(d)(f) | | | 0.70 | %(d)(f) | | | 0.64 | %(d)(f) | | | 0.50 | %(d)(f) | |
Net investment income | | | 1.77 | % | | | 1.54 | % | | | 1.46 | % | | | 1.65 | % | | | 1.86 | % | |
Supplemental data | |
Net assets, end of period (in thousands) | | $ | 214,575 | | | $ | 254,500 | | | $ | 365,205 | | | $ | 451,824 | | | $ | 382,637 | | |
Portfolio turnover | | | 92 | % | | | 67 | % | | | 63 | % | | | 122 | % | | | 246 | % | |
Notes to Financial Highlights
(a) Rounds to zero.
(b) In addition to the fees and expenses which the Fund bears directly, the Fund indirectly bears a pro rata share of the fees and expenses of the acquired funds in which it invests. Such indirect expenses are not included in the reported expense ratios.
(c) Certain line items from prior years have been reclassified to conform to the current presentation.
(d) Includes interest expense which rounds to less than 0.01%.
(e) Total net expenses include the impact of certain waivers/reimbursements made by the Investment Manager and certain of its affiliates, if applicable.
(f) The benefits derived from expense reductions had an impact of less than 0.01%.
The accompanying Notes to Financial Statements are an integral part of this statement.
Annual Report 2013
21
Columbia Large Cap Enhanced Core Fund
Notes to Financial Statements
February 28, 2013
Note 1. Organization
Columbia Large Cap Enhanced Core Fund (the Fund), a series of Columbia Funds Series Trust (the Trust), is a diversified fund. The Trust is registered under the Investment Company Act of 1940, as amended (the 1940 Act), as an open-end management investment company organized as a Delaware statutory trust.
Fund Shares
The Trust may issue an unlimited number of shares (without par value). The Fund offers Class A, Class I, Class R, Class Y and Class Z shares. All share classes have identical voting, dividend and liquidation rights. Each share class has its own expense structure and sales charges, as applicable.
Class A shares have no sales charge.
Class I shares are not subject to sales charges and are only available to the Columbia Family of Funds.
Class R shares are not subject to sales charges and are only available to qualifying institutional investors.
Class Y shares are not subject to sales charges and are only available to certain categories of investors which are subject to minimum initial investment requirements.
Class Z shares are not subject to sales charges, and are only available to certain investors.
Note 2. Summary of Significant Accounting Policies
Use of Estimates
The preparation of financial statements in accordance with U.S. generally accepted accounting principles (GAAP) requires management to make certain estimates and assumptions that affect the reported amounts of assets and liabilities, the disclosure of contingent assets and liabilities at the date of the financial statements and the reported amounts of revenue and expenses during the reporting period. Actual results could differ from those estimates.
The following is a summary of significant accounting policies consistently followed by the Fund in the preparation of its financial statements.
Security Valuation
All equity securities are valued at the close of business of the New York Stock Exchange (NYSE). Equity securities are valued at the last quoted sales price on the principal exchange or market on which they trade, except for securities traded on the NASDAQ Stock Market, which are valued at the NASDAQ official close price. Unlisted securities or listed securities for which there were no sales during the day are valued at the mean of the latest quoted bid and ask prices on such exchanges or markets.
Foreign equity securities are valued based on quotations from the principal market in which such securities are normally traded. If any foreign share prices are not readily available as a result of limited share activity the securities are valued at the mean of the latest quoted bid and ask prices on such exchanges or markets. Foreign currency exchange rates are generally determined at 4:00 p.m. Eastern (U.S.) time. However, many securities markets and exchanges outside the U.S. close prior to the close of the NYSE; therefore, the closing prices for securities in such markets or on such exchanges may not fully reflect events that occur after such close but before the close of the NYSE. In those situations, foreign securities will be fair valued pursuant to the policy adopted by the Board of Trustees (the Board), including utilizing a third party pricing service to determine these fair values. The third party pricing service takes into account multiple factors, including, but not limited to, movements in the U.S. securities markets, certain depositary receipts, futures contracts and foreign exchange rates that have occurred subsequent to the close of the foreign exchange or market, to determine a good faith estimate that reasonably reflects the current market conditions as of the close of the NYSE. The fair value of a security is likely to be different from the quoted or published price, if available.
Investments in other open-end investment companies, including money market funds, are valued at net asset value.
Futures and options on futures contracts are valued based upon the settlement price established each day by the board of trade or exchange on which they are traded.
Investments for which market quotations are not readily available, or that have quotations which management believes are not reliable, are valued at fair value as determined in good faith under consistently applied procedures established by and under the general supervision of the Board. If a security or class of securities (such as foreign securities) is valued at fair value, such value is likely to be different from the last quoted market price for the security.
The determination of fair value often requires significant judgment. To determine fair value, management may use assumptions including but not limited to future cash flows and estimated risk premiums. Multiple inputs from various sources may be used to determine fair value.
Derivative Instruments
The Fund invests in certain derivative instruments, as detailed below, to meet its investment objectives. Derivatives are instruments whose values depend on, or are derived from, in whole or in part, the value of one or more other assets, such as securities, currencies, commodities or indices. Derivative instruments may be used to maintain cash reserves while maintaining exposure to certain other assets, to offset
Annual Report 2013
22
Columbia Large Cap Enhanced Core Fund
Notes to Financial Statements (continued)
February 28, 2013
anticipated declines in values of investments, to facilitate trading, to reduce transaction costs and to pursue higher investment returns. The Fund may also use derivative instruments to mitigate certain investment risks, such as foreign currency exchange rate risk, interest rate risk and credit risk. Derivatives may involve various risks, including the potential inability of the counterparty to fulfill its obligation under the terms of the contract, the potential for an illiquid secondary market and the potential for market movements which may expose the Fund to gains or losses in excess of the amount shown in the Statement of Assets and Liabilities.
The Fund and any counterparty are required to maintain an agreement that requires the Fund and that counterparty to monitor (on a daily basis) the net fair value of all derivatives entered into pursuant to the agreement between the Fund and such counterparty. If the net fair value of such derivatives between the Fund and that counterparty exceeds a certain threshold (as defined in the agreement), the Fund or the counterparty (as the case may be) is required to post cash and/or securities as collateral. Fair values of derivatives presented in the financial statements are not netted with the fair value of other derivatives or with any collateral amounts posted by the Fund or any counterparty.
Futures Contracts
Futures contracts represent commitments for the future purchase or sale of an asset at a specified price on a specified date. The Fund bought and sold futures contracts to maintain appropriate equity market exposure while keeping sufficient cash to accommodate daily redemptions. Upon entering into futures contracts, the Fund bears risks which may include interest rates, exchange rates or securities prices moving unexpectedly, in which case, the Fund may not achieve the anticipated benefits of the futures contracts and may realize a loss. Additional risks include counterparty credit risk, the possibility of an illiquid market, and that a change in the value of the contract or option may not correlate with changes in the value of the underlying asset.
Upon entering into a futures contract, the Fund pledges cash or securities with the broker in an amount sufficient to meet the initial margin requirement. Subsequent payments (variation margin) are made or received by the Fund each day. The variation margin payments are equal to the daily change in the contract value and are recorded as variation margin receivable or payable and are offset in unrealized gains or losses. The Fund recognizes a realized gain or loss when the contract is closed or expires. Futures contracts involve, to varying degrees, risk of loss in excess of the variation margin disclosed in the Statement of Assets and Liabilities.
Effects of Derivative Transactions in the Financial Statements
The following tables are intended to provide additional information about the effect of derivatives on the financial statements of the Fund, including: the fair value of derivatives by risk category and the location of those fair values in the Statement of Assets and Liabilities; the impact of derivative transactions on the Fund's operations over the period including realized gains or losses and unrealized gains or losses. The derivative schedules following the Portfolio of Investments present additional information regarding derivative instruments outstanding at the end of the period, if any.
The following table is a summary of the fair value of derivative instruments at February 28, 2013:
| | Asset Derivatives | |
| Risk Exposure Category | | Statement of
Assets and
Liabilities Location | | Fair Value ($) | |
Equity contracts
| | Net assets —
unrealized appreciation
on futures contracts | | | 388,929* | | |
*Includes cumulative appreciation (depreciation) of futures contracts as reported in the Futures Contracts Outstanding table following the Portfolio of Investments. Only the current day's variation margin is reported in receivables or payables in the Statement of Assets and Liabilities.
The effect of derivative instruments in the Statement of Operations for the year ended February 28, 2013:
Amount of Realized Gain (Loss) on Derivatives Recognized in Income | |
Risk Exposure Category | | Futures Contracts ($) | |
Equity contracts | | | 1,040,532 | | |
Change in Unrealized Appreciation (Depreciation) on Derivatives Recognized in Income | |
Risk Exposure Category | | Futures Contracts ($) | |
Equity contracts | | | 233,171 | | |
The following table is a summary of the volume of derivative instruments for the year ended February 28, 2013:
Derivative Instrument | | Contracts Opened | |
Futures contracts | | | 389 | | |
Security Transactions
Security transactions are accounted for on the trade date. Cost is determined and gains (losses) are based upon the specific identification method for both financial statement and federal income tax purposes.
Income Recognition
Corporate actions and dividend income are recorded net of any non-reclaimable tax withholdings, on the ex-dividend date
Annual Report 2013
23
Columbia Large Cap Enhanced Core Fund
Notes to Financial Statements (continued)
February 28, 2013
or upon receipt of ex-dividend notification in the case of certain foreign securities.
The Fund may receive distributions from holdings in business development companies (BDCs), exchange traded funds (ETFs) and real estate investment trusts (REITs), which report information on the character of their distributions annually. These distributions are allocated to dividend income, capital gain and return of capital based on estimates made by the Fund's management if actual information has not yet been reported. Return of capital is recorded as a reduction of the cost basis of securities held. If the Fund no longer owns the applicable securities, return of capital is recorded as a realized gain. Management's estimates are subsequently adjusted when the actual character of the distributions is disclosed by the BDCs, ETFs and REITs, which could result in a proportionate change in return of capital to shareholders.
Awards from class action litigation are recorded as a reduction of cost basis if the Fund still owns the applicable securities on the payment date. If the Fund no longer owns the applicable securities, the proceeds are recorded as realized gains.
Expenses
General expenses of the Trust are allocated to the Fund and other funds of the Trust based upon relative net assets or other expense allocation methodologies determined by the nature of the expense. Expenses directly attributable to the Fund are charged to the Fund. Expenses directly attributable to a specific class of shares are charged to that share class.
Determination of Class Net Asset Value
All income, expenses (other than class-specific expenses, which are charged to that share class, as shown in the Statement of Operations) and realized and unrealized gains (losses) are allocated to each class of the Fund on a daily basis, based on the relative net assets of each class, for purposes of determining the net asset value of each class.
Federal Income Tax Status
The Fund intends to qualify each year as a regulated investment company under Subchapter M of the Internal Revenue Code, as amended, and will distribute substantially all of its tax exempt and taxable income (including net short-term capital gains), if any, for its tax year, and as such will not be subject to federal income taxes. In addition, the Fund intends to distribute in each calendar year substantially all of its net investment income, capital gains and certain other amounts, if any, such that the Fund should not be subject to federal excise tax. Therefore, no federal income or excise tax provision is recorded.
Distributions to Shareholders
Distributions from net investment income, if any, are declared and paid semi-annually. Net realized capital gains, if any, are distributed at least annually. Income distributions and capital gain distributions are determined in accordance with federal income tax regulations, which may differ from GAAP.
Guarantees and Indemnifications
Under the Trust's organizational documents and, in some cases, by contract, its officers and trustees are indemnified against certain liabilities arising out of the performance of their duties to the Trust or its funds. In addition, certain of the Fund's contracts with its service providers contain general indemnification clauses. The Fund's maximum exposure under these arrangements is unknown since the amount of any future claims that may be made against the Fund cannot be determined, and the Fund has no historical basis for predicting the likelihood of any such claims.
Recent Accounting Pronouncement
Disclosures about Offsetting Assets and Liabilities
In December 2011, the Financial Accounting Standards Board (FASB) issued Accounting Standards Update (ASU) No. 2011-11, Disclosures about Offsetting Assets and Liabilities. The objective of the FASB is to enhance current disclosure requirements on offsetting of certain assets and liabilities and to enable financial statement users to compare financial statements prepared under GAAP and International Financial Reporting Standards.
Specifically, ASU No. 2011-11 requires an entity to disclose both gross and net information for derivatives and other financial instruments that are subject to a master netting arrangement or similar agreement. The standard requires disclosure of collateral received in connection with the master netting agreements or similar agreements. The effective date of ASU No. 2011-11 is for interim and annual periods beginning on or after January 1, 2013. At this time, management is evaluating the implications of this guidance and the impact it will have on the financial statement amounts and footnote disclosures, if any.
Note 3. Fees and Compensation Paid to Affiliates
Investment Management Fees
Under an Investment Management Services Agreement, Columbia Management Investment Advisers, LLC (the Investment Manager), a wholly-owned subsidiary of Ameriprise Financial, Inc. (Ameriprise Financial), determines which securities will be purchased, held or sold. The investment management fee is an annual fee that is equal to a
Annual Report 2013
24
Columbia Large Cap Enhanced Core Fund
Notes to Financial Statements (continued)
February 28, 2013
percentage of the Fund's average daily net assets that declines from 0.69% to 0.52% as the Fund's net assets increase.
Effective July 1, 2012, the Investment Manager has contractually agreed to waive 0.15% of the Fund's investment management fee through June 30, 2013. Prior to July 1, 2012, the Investment Manager contractually agreed to waive 0.20% of the Fund's investment management fee. The effective investment management fee waiver for the year ended February 28, 2013 was 0.17% of the Fund's average daily net assets.
The effective investment management fee rate, net of fee waivers, for the year ended February 28, 2013 was 0.52% of the Fund's average daily net assets.
Administration Fees
Under an Administrative Services Agreement, the Investment Manager also serves as the Fund Administrator. The Fund pays the Fund Administrator an annual fee for administration and accounting services equal to a percentage of the Fund's average daily net assets that declines from 0.06% to 0.03% as the Fund's net assets increase. The effective administration fee rate for the year ended February 28, 2013 was 0.06% of the Fund's average daily net assets.
Other Expenses
Other expenses are for, among other things, certain expenses of the Fund or the Board, including: Fund boardroom and office expense, employee compensation, employee health and retirement benefits, and certain other expenses. Payment of these Fund and Board expenses is facilitated by a company providing limited administrative services to the Fund and the Board. For the year ended February 28, 2013, other expenses paid to this company were $1,867.
Compensation of Board Members
Board members are compensated for their services to the Fund as disclosed in the Statement of Operations. Under a Deferred Compensation Plan (the Plan), the Board members who are not "interested persons" of the Fund, as defined under the 1940 Act, may elect to defer payment of up to 100% of their compensation. Deferred amounts are treated as though equivalent dollar amounts had been invested in shares of certain funds managed by the Investment Manager. The Fund's liability for these amounts is adjusted for market value changes and remains in the Fund until distributed in accordance with the Plan.
Transfer Agent Fees
Under a Transfer and Dividend Disbursing Agent Agreement, Columbia Management Investment Services Corp. (the Transfer Agent), an affiliate of the Investment Manager and a
wholly-owned subsidiary of Ameriprise Financial, is responsible for providing transfer agency services to the Fund. The Transfer Agent has contracted with Boston Financial Data Services (BFDS) to serve as sub-transfer agent.
The Transfer Agent receives monthly account-based service fees based on the number of open accounts and is reimbursed by the Fund for the fees and expenses the Transfer Agent pays to financial intermediaries that maintain omnibus accounts with the Fund that is a percentage of the average aggregate value of the Fund's shares maintained in each such omnibus account (other than omnibus accounts for which American Enterprise Investment Services Inc. is the broker of record or accounts where the beneficial shareholder is a customer of Ameriprise Financial Services, Inc., which are paid a per account fee). The Transfer Agent pays the fees of BFDS for services as sub-transfer agent and is not entitled to reimbursement for such fees from the Fund (with the exception of out-of-pocket fees).
The Transfer Agent also receives compensation from fees for various shareholder services and reimbursements for certain out-of-pocket fees. Class I shares do not pay transfer agent fees. Effective November 1, 2012, Class Y shares will not pay transfer agent fees for at least twelve months.
For the year ended February 28, 2013, the Fund's effective transfer agent fee rates as a percentage of average daily net assets of each class were as follows:
Class A | | | 0.20 | % | |
Class R | | | 0.20 | | |
Class Y | | | 0.00 | * | |
Class Z | | | 0.20 | | |
*Rounds to zero.
An annual minimum account balance fee of $20 may apply to certain accounts with a value below the Fund's initial minimum investment requirements to reduce the impact of small accounts on transfer agent fees. These minimum account balance fees are recorded as part of expense reductions in the Statement of Operations. For the year ended February 28, 2013, these minimum account balance fees reduced total expenses by $140.
Distribution and Service Fees
The Fund has an agreement with Columbia Management Investment Distributors, Inc. (the Distributor), an affiliate of the Investment Manager and a wholly-owned subsidiary of Ameriprise Financial, for distribution and shareholder services. Pursuant to Rule 12b-1 under the 1940 Act, the Board has approved, and the Fund has adopted, distribution and shareholder service plans (the Plans) which set the distribution and service fees for the Fund. These fees are
Annual Report 2013
25
Columbia Large Cap Enhanced Core Fund
Notes to Financial Statements (continued)
February 28, 2013
calculated daily and are intended to compensate the Distributor and/or eligible selling and/or servicing agents for selling shares of the Fund and providing services to investors.
The Plans require the payment of a monthly combined distribution and service fee to the Distributor at the maximum annual rate of 0.25% of the average daily net assets attributable to Class A shares of the Fund. The Plans also require the payment of a monthly distribution fee at the maximum annual rate of 0.50% of the average daily net assets attributable to Class R shares of the Fund.
Expenses Waived/Reimbursed by the Investment Manager and its Affiliates
Effective July 1, 2012, the Investment Manager and certain of its affiliates have contractually agreed to waive fees and/or reimburse expenses (excluding certain fees and expenses described below), through June 30, 2013, unless sooner terminated at the sole discretion of the Board, so that the Fund's net operating expenses, after giving effect to fees waived/expenses reimbursed and any balance credits and/or overdraft charges from the Fund's custodian, do not exceed the following annual rates as a percentage of the class' average daily net assets:
Class A | | | 0.86 | % | |
Class I | | | 0.46 | | |
Class R | | | 1.11 | | |
Class Y | | | 0.46 | | |
Class Z | | | 0.61 | | |
Prior to July 1, 2012, the Investment Manager and certain of its affiliates contractually agreed to waive fees and/or reimburse expenses (excluding certain fees and expenses described below), so that the Fund's net operating expenses, after giving effect to fees waived/expenses reimbursed and any balance credits and/or overdraft charges from the Fund's custodian, did not exceed the following annual rates as a percentage of the class' average daily net assets:
Class A | | | 0.95 | % | |
Class I | | | 0.63 | | |
Class R | | | 1.20 | | |
Class Y | | | 0.70 | | |
Class Z | | | 0.70 | | |
Under the agreement, the following fees and expenses are excluded from the waiver/reimbursement commitment, and therefore will be paid by the Fund, if applicable: taxes (including foreign transaction taxes), expenses associated with investments in affiliated and non-affiliated pooled investment vehicles (including mutual funds and exchange traded funds), transaction costs and brokerage commissions, costs related to
any securities lending program, dividend expenses associated with securities sold short, inverse floater program fees and expenses, transaction charges and interest on borrowed money, interest, extraordinary expenses and any other expenses the exclusion of which is specifically approved by the Board. This agreement may be modified or amended only with approval from all parties.
Note 4. Federal Tax Information
The timing and character of income and capital gain distributions are determined in accordance with income tax regulations, which may differ from GAAP because of temporary or permanent book to tax differences.
At February 28, 2013, these differences are primarily due to differing treatment for capital loss carryforwards, deferral/reversal of wash sales losses, Trustees' deferred compensation and derivative investments. To the extent these differences are permanent, reclassifications are made among the components of the Fund's net assets in the Statement of Assets and Liabilities. Temporary differences do not require reclassifications.
The Fund did not have any permanent differences; therefore, no reclassifications were made to the Statement of Assets and Liabilities.
The tax character of distributions paid during the years indicated was as follows:
Year Ended | | February 28,
2013 | | February 29,
2012 | |
Ordinary income | | $ | 5,059,919 | | | $ | 5,176,907 | | |
Short-term capital gain distributions, if any, are considered ordinary income distributions for tax purposes.
At February 28, 2013, the components of distributable earnings on a tax basis were as follows:
Undistributed ordinary income | | $ | 682,147 | | |
Accumulated realized loss | | | 106,916,233 | | |
Unrealized appreciation | | | 81,806,031 | | |
At February 28, 2013, the cost of investments for federal income tax purposes was $186,274,903 and the aggregate gross unrealized appreciation and depreciation based on that cost was:
Unrealized appreciation | | $ | 82,513,589 | | |
Unrealized depreciation | | | (707,558 | ) | |
Net unrealized appreciation | | $ | 81,806,031 | | |
The following capital loss carryforward, determined at February 28, 2013, may be available to reduce taxable income
Annual Report 2013
26
Columbia Large Cap Enhanced Core Fund
Notes to Financial Statements (continued)
February 28, 2013
arising from future net realized gains on investments, if any, to the extent permitted by the Internal Revenue Code:
Year of Expiration | | Amount | |
2018 | | $ | 106,916,233 | | |
For the year ended February 28, 2013, $33,983,006 of capital loss carryforward was utilized.
Management of the Fund has concluded that there are no significant uncertain tax positions that would require recognition in the financial statements. However, management's conclusion may be subject to review and adjustment at a later date based on factors including, but not limited to, new tax laws, regulations, and administrative interpretations (including relevant court decisions). Generally, the Fund's federal tax returns for the prior three fiscal years remain subject to examination by the Internal Revenue Service.
Note 5. Portfolio Information
The cost of purchases and proceeds from sales of securities, excluding short-term obligations, aggregated to $252,041,198 and $300,609,165, respectively, for the year ended February 28, 2013.
Note 6. Lending of Portfolio Securities
Effective December 19, 2012, the Fund no longer participates in securities lending activity. Prior to that date, the Fund participated, or was eligible to participate, in securities lending activity pursuant to a Master Securities Lending Agreement (the Agreement) with JPMorgan Chase Bank, N.A. (JPMorgan). The Agreement authorized JPMorgan as lending agent to lend securities to authorized borrowers in order to generate additional income on behalf of the Fund. Pursuant to the Agreement, the securities loaned were secured by cash or securities that either were issued or guaranteed as to principal and interest by the U.S. government, its agencies, authorities or instrumentalities with value equal to at least 100% of the market value of the loaned securities. Any additional collateral required to maintain those levels due to market fluctuations of the loaned securities was requested to be delivered the following business day. Cash collateral received was invested by the lending agent on behalf of the Fund into authorized investments pursuant to the Agreement.
Pursuant to the Agreement, the Fund received income for lending its securities either in the form of fees or by earning interest on invested cash collateral, net of negotiated rebates paid to borrowers and fees paid to the lending agent for services provided and any other securities lending expenses. Net income earned from securities lending for the year ended
February 28, 2013 is disclosed in the Statement of Operations. The Fund continued to earn and accrue interest and dividends on the securities loaned.
Note 7. Affiliated Money Market Fund
The Fund invests its daily cash balances in Columbia Short-Term Cash Fund, an affiliated money market fund established for the exclusive use by the Fund and other affiliated funds. The income earned by the Fund from such investments is included as "Dividends — affiliated issuers" in the Statement of Operations. As an investing fund, the Fund indirectly bears its proportionate share of the expenses of Columbia Short-Term Cash Fund.
Note 8. Shareholder Concentration
At February 28, 2013, one unaffiliated shareholder accounts owned an aggregate of 75.2% of the outstanding shares of the Fund. The Fund has no knowledge about whether any portion of those shares was owned beneficially by such accounts. Affiliated shareholder accounts owned 15.1% of the outstanding shares of the Fund. Subscription and redemption activity by concentrated accounts may have a significant effect on the operations of the Fund.
Note 9. Line of Credit
The Fund has entered into a revolving credit facility with a syndicate of banks led by JPMorgan whereby the Fund may borrow for the temporary funding of shareholder redemptions or for other temporary or emergency purposes. The credit facility agreement, as amended, which is a collective agreement between the Fund and certain other funds managed by the Investment Manager, severally and not jointly, permits collective borrowings up to $500 million. Interest is charged to each participating fund based on its borrowings at a rate equal to the higher of (i) the overnight federal funds rate plus 1.00% or (ii) the one-month LIBOR rate plus 1.00%. Each borrowing under the credit facility matures no later than 60 days after the date of borrowing. The Fund also pays a commitment fee equal to its pro rata share of the amount of the credit facility at a rate of 0.08% per annum.
The Fund had no borrowings during the year ended February 28, 2013.
Note 10. Subsequent Events
Management has evaluated the events and transactions that have occurred through the date the financial statements were issued and noted no items requiring adjustment of the financial statements or additional disclosure.
Annual Report 2013
27
Columbia Large Cap Enhanced Core Fund
Notes to Financial Statements (continued)
February 28, 2013
Note 11. Information Regarding Pending and Settled Legal Proceedings
In December 2005, without admitting or denying the allegations, American Express Financial Corporation (AEFC, which is now known as Ameriprise Financial, Inc. (Ameriprise Financial)) entered into settlement agreements with the Securities and Exchange Commission (SEC) and Minnesota Department of Commerce (MDOC) related to market timing activities. As a result, AEFC was censured and ordered to cease and desist from committing or causing any violations of certain provisions of the Investment Advisers Act of 1940, the Investment Company Act of 1940, and various Minnesota laws. AEFC agreed to pay disgorgement of $10 million and civil money penalties of $7 million. AEFC also agreed to retain an independent distribution consultant to assist in developing a plan for distribution of all disgorgement and civil penalties ordered by the SEC in accordance with various undertakings detailed at www.sec.gov/litigation/admin/ia-2451.pdf. Ameriprise Financial and its affiliates have cooperated with the SEC and the MDOC in these legal proceedings, and have made regular reports to the funds' Boards of Trustees.
Ameriprise Financial and certain of its affiliates have historically been involved in a number of legal, arbitration and regulatory proceedings, including routine litigation, class actions, and governmental actions, concerning matters arising in connection with the conduct of their business activities. Ameriprise Financial believes that the Funds are not currently the subject of, and that neither Ameriprise Financial nor any of its affiliates are the subject of, any pending legal, arbitration or regulatory proceedings that are likely to have a material adverse effect on the Funds or the ability of Ameriprise Financial or its affiliates to perform under their contracts with the Funds. Ameriprise Financial is required to make 10-Q, 10-K and, as necessary, 8-K filings with the Securities and Exchange Commission on legal and regulatory matters that relate to Ameriprise Financial and its affiliates. Copies of these filings may be obtained by accessing the SEC website at www.sec.gov.
There can be no assurance that these matters, or the adverse publicity associated with them, will not result in increased fund redemptions, reduced sale of fund shares or other adverse consequences to the Funds. Further, although we believe proceedings are not likely to have a material adverse effect on the Funds or the ability of Ameriprise Financial or its affiliates to perform under their contracts with the Funds, these proceedings are subject to uncertainties and, as such, we are unable to estimate the possible loss or range of loss that may result. An adverse outcome in one or more of these proceedings could result in adverse judgments, settlements, fines, penalties or other relief that could have a material adverse effect on the consolidated financial condition or results of operations of Ameriprise Financial.
Annual Report 2013
28
Columbia Large Cap Enhanced Core Fund
Report of Independent Registered Public Accounting Firm
To the Trustees of Columbia Funds Series Trust and
the Shareholders of Columbia Large Cap Enhanced Core Fund
In our opinion, the accompanying statement of assets and liabilities, including the portfolio of investments, and the related statements of operations and of changes in net assets and the financial highlights present fairly, in all material respects, the financial position of Columbia Large Cap Enhanced Core Fund (the "Fund") (a series of Columbia Funds Series Trust) at February 28, 2013, the results of its operations for the year then ended, the changes in its net assets for each of the two years in the period then ended and the financial highlights for each of the periods indicated, in conformity with accounting principles generally accepted in the United States of America. These financial statements and financial highlights (hereafter referred to as "financial statements") are the responsibility of the Fund's management. Our responsibility is to express an opinion on these financial statements based on our audits. We conducted our audits of these financial statements in accordance with the standards of the Public Company Accounting Oversight Board (United States). Those standards require that we plan and perform the audit to obtain reasonable assurance about whether the financial statements are free of material misstatement. An audit includes examining, on a test basis, evidence supporting the amounts and disclosures in the financial statements, assessing the accounting principles used and significant estimates made by management, and evaluating the overall financial statement presentation. We believe that our audits, which included confirmation of securities at February 28, 2013 by correspondence with the custodian, transfer agent and brokers, provide a reasonable basis for our opinion.
PricewaterhouseCoopers LLP
Minneapolis, Minnesota
April 19, 2013
Annual Report 2013
29
Columbia Large Cap Enhanced Core Fund
Federal Income Tax Information
(Unaudited)
The Fund hereby designates the following tax attributes for the fiscal year ended February 28, 2013. Shareholders will be notified in early 2014 of the amounts for use in preparing 2013 income tax returns.
Tax Designations:
| Qualified Dividend Income | | | 100.00 | % | |
| Dividends Received Deduction | | | 100.00 | % | |
Qualified Dividend Income. For taxable, non-corporate shareholders, the percentage of ordinary income dividends paid during the fiscal year that represents qualified dividend income subject to reduced tax rates under the Jobs and Growth Tax Relief Reconciliation Act of 2003.
Dividends Received Deduction. The percentage of ordinary income dividends paid during the fiscal year that qualifies for the corporate dividends received deduction.
Annual Report 2013
30
Columbia Large Cap Enhanced Core Fund
Shareholders elect the Board that oversees the funds' operations. The Board appoints officers who are responsible for day-to-day business decisions based on policies set by the Board. The following table provides basic biographical information about the funds' Board members, including their principal occupations during the past five years, although specific titles for individuals may have varied over the period. Under current Board policy, members may serve until the next Board meeting after he or she reaches the mandatory retirement age established by the Board, or the fifteenth anniversary of the first Board meeting they attended as a member of the Board.
Mr. Edward J. Boudreau, Jr., Mr. William P. Carmichael, Mr. William A. Hawkins, Mr. R. Glenn Hilliard, Ms. Minor M. Shaw and Dr. Anthony M. Santomero, were members of the Legacy Columbia Nations funds' Board ("Nations Funds"), which includes Columbia Funds Series Trust, Columbia Funds Variable Insurance Trust I and Columbia Funds Master Investment Trust, LLC and began service on the Board for the Legacy RiverSource funds ("RiverSource Funds") effective June 1, 2011.
Independent Trustees
Name,
Address,
Year of Birth | | Position Held With
Funds and Length of
Service | | Principal Occupation
During Past Five Years | | Number of
Funds in the
Fund Family
Overseen by
Board Member | | Other Present or Past
Directorships/Trusteeships
(Within Past 5 Years) | |
Kathleen Blatz
901 S. Marquette Ave.
Minneapolis, MN 55402
1954 | | Board member since 1/06 for RiverSource Funds and since 6/11 for Nations Funds | | Attorney; Chief Justice, Minnesota Supreme Court, 1998-2006 | | | 153 | | | Director, BlueCross BlueShield of Minnesota since 2009 | |
Edward J. Boudreau, Jr.
901 S. Marquette Ave.
Minneapolis, MN 55402
1944 | | Board member since 6/11 for RiverSource Funds and since 1/05 for Nations Funds | | Managing Director, E.J. Boudreau & Associates (consulting) since 2000 | | | 151 | | | Former Trustee, BofA Funds Series Trust (11 funds) | |
Pamela G. Carlton
901 S. Marquette Ave.
Minneapolis, MN 55402
1954 | | Board member since 7/07 for RiverSource Funds and since 6/11 for Nations Funds | | President, Springboard — Partners in Cross Cultural Leadership (consulting company) since 2003 | | | 153 | | | None | |
William P. Carmichael
901 S. Marquette Ave.
Minneapolis, MN 55402
1943 | | Board member since 6/11 for RiverSource Funds and since 1999 for Nations Funds | | Retired | | | 151 | | | Director, Cobra Electronics Corporation (electronic equipment manufacturer); The Finish Line (athletic shoes and apparel) since July 2003; McMoRan Exploration Company (oil and gas exploration and development) since 2010; former Trustee, BofA Funds Series Trust (11 funds); former Director, Spectrum Brands, Inc. (consumer products); former Director, Simmons Company (bedding) | |
Patricia M. Flynn
901 S. Marquette Ave.
Minneapolis, MN 55402
1950 | | Board member since 11/04 for RiverSource Funds and since 6/11 for Nations Funds | | Trustee Professor of Economics and Management, Bentley University since 1976 | | | 153 | | | None | |
William A. Hawkins
901 S. Marquette Ave.
Minneapolis, MN 55402
1942 | | Board member since 6/11 for RiverSource Funds and since 1/05 for Nations Funds | | Managing Director, Overton Partners (financial consulting), since August 2010; President and Chief Executive Officer, California General Bank, N.A., January 2008-August 2010 | | | 151 | | | Trustee, BofA Funds Series Trust (11 funds) | |
Annual Report 2013
31
Columbia Large Cap Enhanced Core Fund
Trustees and Officers (continued)
Independent Trustees (continued)
Name,
Address,
Year of Birth | | Position Held With
Funds and Length of
Service | | Principal Occupation
During Past Five Years | | Number of
Funds in the
Fund Family
Overseen by
Board Member | | Other Present or Past
Directorships/Trusteeships
(Within Past 5 Years) | |
R. Glenn Hilliard
901 S. Marquette Ave.
Minneapolis, MN 55402
1943 | | Board member since 6/11 for RiverSource Funds and since 1/05 for Nations Funds | | Chairman and Chief Executive Officer, Hilliard Group LLC (investing and consulting), since April 2003; Non-Executive Director & Chairman, CNO Financial Group, Inc. (insurance), September 2003-May 2011 | | | 151 | | | Chairman, BofA Fund Series Trust (11 funds); former Director, CNO Financial Group, Inc. (insurance) | |
Stephen R. Lewis, Jr.
901 S. Marquette Ave.
Minneapolis, MN 55402
1939 | | Chair of the Board for RiverSource Funds since 1/07, Board member for RiverSource Funds since 1/02 and since 6/11 for Nations Funds | | President Emeritus and Professor of Economics Emeritus, Carleton College since 2002 | | | 153 | | | Director, Valmont Industries, Inc. (manufacturer of irrigation systems) since 2002 | |
Catherine James Paglia
901 S. Marquette Ave.
Minneapolis, MN 55402
1952 | | Board member since 11/04 for RiverSource Funds and since 6/11 for Nations Funds | | Director, Enterprise Asset Management, Inc. (private real estate and asset management company) | | | 153 | | | Director, Valmont Industries, Inc. (manufacturer of irrigation systems) since 2012 | |
Leroy C. Richie
901 S. Marquette Ave.
Minneapolis, MN 55402
1941 | | Board member since 2000 for Legacy Seligman Funds, since 11/08 for RiverSource Funds and since 6/11 for Nations Funds | | Counsel, Lewis & Munday, P.C. (law firm) since 2004; former Vice President and General Counsel, Automotive Legal Affairs, Chrysler Corporation from 1983-1987 | | | 153 | | | Lead Outside Director, Digital Ally, Inc. (digital imaging) since September 2005; Director, Infinity, Inc. (oil and gas exploration and production) since 1994; Director, OGE Energy Corp. (energy and energy services) since November 2007 | |
Minor M. Shaw
901 S. Marquette Ave.
Minneapolis, MN 55402
1947 | | Board member since 6/11 for RiverSource Funds and since 2003 for Nations Funds | | President, Micco LLC (private investments) since 2011; President Micco Corp. since 1998 | | | 151 | | | Director, Piedmont Natural Gas; Director, BlueCross BlueShield of South Carolina since April 2008; Former Trustee, BofA Funds Series Trust (11 funds) | |
Alison Taunton-Rigby
901 S. Marquette Ave.
Minneapolis, MN 55402
1944 | | Board member since 11/02 for RiverSource Funds and since 6/11 for Nations Funds | | Chief Executive Officer and Director, RiboNovix, Inc. (biotechnology), 2003-2010 | | | 153 | | | Director, Healthways, Inc. (health and well-being improvement) since 2005; Director, ICI Mutual Insurance Company, RRG since 2011; Director, Abt Associates (government contractor) since 2001; Director, Boston Children's Hospital since 2002 | |
Annual Report 2013
32
Columbia Large Cap Enhanced Core Fund
Trustees and Officers (continued)
Interested Trustee Not Affiliated With Investment Manager*
Name,
Address,
Year of Birth | | Position Held With
Funds and Length of
Service | | Principal Occupation
During Past Five Years | | Number of
Funds in the
Fund Family
Overseen by
Board Member | | Other Present or Past
Directorships/Trusteeships
(Within Past 5 Years) | |
Anthony M. Santomero
901 S. Marquette Ave.
Minneapolis, MN 55402
1946 | | Board member since 6/11 for RiverSource Funds and since 1/08 for Nations Funds | | Richard K. Mellon Professor Emeritus of Finance, The Wharton School, University of Pennsylvania, since 2002; Senior Advisor, McKinsey & Company (consulting), 2006-2008 | | | 151 | | | Director, Renaissance Reinsurance Ltd. since May 2008; Trustee, Penn Mutual Life Insurance Company since March 2008; Director, Citigroup since 2009; Director, Citibank, N.A. since 2009; former Trustee, BofA Funds Series Trust (11 funds) | |
*Dr. Santomero is not an affiliated person of the investment manager or Ameriprise Financial. However, he is currently deemed by the funds to be an "interested person" (as defined in the 1940 Act) of the funds because he serves as a Director of Citigroup, Inc. and Citibank N.A., companies that may directly or through subsidiaries and affiliates engage from time-to-time in brokerage execution, principal transactions and lending relationships with the funds or accounts advised/managed by the investment manager.
Interested Trustee Affiliated With Investment Manager*
Name,
Address,
Year of Birth | | Position Held With
Funds and Length of
Service | | Principal Occupation
During Past Five Years | | Number of
Funds in the
Fund Family
Overseen by
Board Member | | Other Present or Past
Directorships/Trusteeships
(Within Past 5 Years) | |
William F. Truscott
53600 Ameriprise
Financial Center
Minneapolis, MN 55474
1960 | | Board member since 11/01 for RiverSource Funds and since 6/11 for Nations Funds; Senior Vice President since 2002 for RiverSource Funds and 5/10 for Nations Funds | | President, Columbia Management Investment Advisers, LLC since February 2012, (previously President, Chairman of the Board and Chief Investment Officer, 2001-April 2010); Chief Executive Officer, Global Asset Management, Ameriprise Financial, Inc. since September 2012 (previously Chief Executive Officer, U.S. Asset Management & President, Annuities, May 2010-September 2012 and President — U.S. Asset Management and Chief Investment Officer, 2005-April 2010); Chief Executive Officer, Columbia Management Investment Distributors, Inc. since February 2012, (previously Chairman of the Board and Chief Executive Officer, 2006-April 2010); Chairman of the Board and Chief Executive Officer, RiverSource Distributors, Inc. since 2006; President and Chief Executive Officer, Ameriprise Certificate Company 2006-August 2012 | | | 210 | | | Chairman of the Board, Columbia Management Investment Advisers, LLC since May 2010; Director, Columbia Management Investment Distributors, Inc. since May 2010; Director, Ameriprise Certificate Company, 2006-January 2013 | |
*Interested person (as defined under the 1940 Act) by reason of being an officer, director, security holder and/or employee of the investment manager or Ameriprise Financial.
The SAI has additional information about the Fund's Board members and is available, without charge, upon request by calling 800.345.6611; contacting your financial intermediary; or visiting columbiamanagement.com.
Annual Report 2013
33
Columbia Large Cap Enhanced Core Fund
Trustees and Officers (continued)
The Board has appointed officers who are responsible for day-to-day business decisions based on policies it has established. The officers serve at the pleasure of the Board. In addition to Mr. Truscott, who is Senior Vice President, the funds' other officers are:
Officers
Name,
Address,
Year of Birth | | Position Held With
Funds and Length of
Service | | Principal Occupation During Past Five Years | |
J. Kevin Connaughton
225 Franklin Street
Boston, MA 02110
1964 | | President and Principal Executive Officer since 5/10 for RiverSource Funds and 2009 for Nations Funds | | Senior Vice President and General Manager — Mutual Fund Products, Columbia Management Investment Advisers, LLC since May 2010; Managing Director of Columbia Management Advisors, LLC, December 2004-April 2010; Senior Vice President and Chief Financial Officer, Columbia Funds, June 2008-January 2009; Treasurer, Columbia Funds, October 2003-May 2008 | |
Amy K. Johnson
5228 Ameriprise Financial Center Minneapolis, MN 55474
1965 | | Vice President since 12/06 for RiverSource Funds and 5/10 for Nations Funds | | Senior Vice President and Chief Operating Officer, Columbia Management Investment Advisers, LLC since May 2010 (previously Chief Administrative Officer, 2009-April 2010 and Vice President — Asset Management and Trust Company Services, 2006-2009) | |
Michael G. Clarke
225 Franklin Street
Boston, MA 02110
1969 | | Treasurer since 1/11 and Chief Financial Officer since 4/11 for RiverSource Funds and Treasurer since 3/11 and Chief Financial Officer since 2009 for Nations Funds | | Vice President, Columbia Management Investment Advisers, LLC since May 2010; Managing Director of Fund Administration, Columbia Management Advisors, LLC, September 2004-April 2010; senior officer of Columbia Funds and affiliated funds since 2002 | |
Scott R. Plummer
5228 Ameriprise Financial Center Minneapolis, MN 55474
1959 | | Senior Vice President and Chief Legal Officer since 12/06 and Assistant Secretary since 6/11 for RiverSource Funds and Senior Vice President and Chief Legal Officer since 5/10 and Assistant Secretary since 6/11 for Nations Funds | | Senior Vice President, Chief Legal Officer and Assistant Secretary, Columbia Management Investment Advisers, LLC since June 2005; Vice President and Lead Chief Counsel — Asset Management, Ameriprise Financial, Inc. since May 2010 (previously Vice President and Chief Counsel — Asset Management, 2005-April 2010); Vice President, Chief Counsel and Assistant Secretary, Columbia Management Investment Distributors, Inc. since 2008; Vice President, General Counsel and Secretary, Ameriprise Certificate Company since 2005; Chief Counsel, RiverSource Distributors, Inc. since 2006 | |
Colin Moore
225 Franklin Street
Boston, MA 02110
1958 | | Senior Vice President since 5/10 for RiverSource Funds and Nations Funds | | Director and Chief Investment Officer, Columbia Management Investment Advisers, LLC since May 2010; Manager, Managing Director and Chief Investment Officer, Columbia Management Advisors, LLC, 2007-April 2010 | |
Thomas P. McGuire
225 Franklin Street
Boston, MA 02110
1972 | | Chief Compliance Officer since 3/12 | | Vice President — Asset Management Compliance, Columbia Management Investment Advisers, LLC since 2010; Chief Compliance Officer, Ameriprise Certificate Company since September 2010; Compliance Executive, Bank of America, 2005-2010 | |
Stephen T. Welsh
225 Franklin Street
Boston, MA 02110
1957 | | Vice President since 4/11 for RiverSource Funds and 2006 for Nations Funds | | President and Director, Columbia Management Investment Services Corp. since May 2010; President and Director, Columbia Management Services, Inc., July 2004- April 2010; Managing Director, Columbia Management Distributors, Inc., August 2007-April 2010 | |
Christopher O. Petersen
5228 Ameriprise Financial Center Minneapolis, MN 55474
1970 | | Vice President and Secretary since 4/11 for RiverSource Funds and 3/11 for Nations Funds | | Vice President and Chief Counsel, Ameriprise Financial, Inc. since January 2010 (formerly Vice President and Group Counsel or Counsel, April 2004-January 2010); Assistant Secretary of Legacy RiverSource Funds, January 2007-April 2011 and of the Nations Funds, May 2010-March 2011 | |
Annual Report 2013
34
Columbia Large Cap Enhanced Core Fund
Trustees and Officers (continued)
Officers (continued)
Name,
Address,
Year of Birth | | Position Held With
Funds and Length of
Service | | Principal Occupation During Past Five Years | |
Paul D. Pearson
10468 Ameriprise Financial Center Minneapolis, MN 55474
1956 | | Vice President since 4/11 and Assistant Treasurer since 1999 for RiverSource Funds and Vice President and Assistant Treasurer since 6/11 for Nations Funds | | Vice President — Investment Accounting, Columbia Management Investment Advisers, LLC, since May 2010; Vice President — Managed Assets, Investment Accounting, Ameriprise Financial Corporation, February 1998-May 2010 | |
Joseph F. DiMaria
225 Franklin Street
Boston, MA 02110
1968 | | Vice President and Chief Accounting Officer since 4/11 and Vice President since 3/11 and Chief Accounting Officer since 2008 for Nations Funds | | Vice President, Mutual Fund Administration, Columbia Management Investment Advisers, LLC, since May 2010; Director of Fund Administration, Columbia Management Advisors, LLC, January 2006-April 2010 | |
Paul B. Goucher
100 Park Avenue
New York, NY 10017
1968 | | Vice President since 4/11 and Assistant Secretary since 11/08 for RiverSource Funds and 5/10 for Nations Funds | | Vice President and Lead Chief Counsel, Ameriprise Financial, Inc. since November 2008 and January 2013, respectively (formerly, Chief Counsel, January 2010-January 2013 and Group Counsel from November 2008- January 2010); Director, Managing Director and General Counsel, J. & W. Seligman & Co. Incorporated, July 2008-November 2008 (previously, Managing Director and Associate General Counsel, January 2005-July 2008) | |
Michael E. DeFao
225 Franklin Street
Boston, MA 02110
1968 | | Vice President since 4/11 and Assistant Secretary since 5/10 for RiverSource Funds and 2011 for Nations Funds | | Vice President and Chief Counsel, Ameriprise Financial, Inc. since May 2010; Associate General Counsel, Bank of America, June 2005-April 2010 | |
Annual Report 2013
35
This page intentionally left blank.
Annual Report 2013
36
Columbia Large Cap Enhanced Core Fund
Important Information About This Report
Each fund mails one shareholder report to each shareholder address. If you would like more than one report, please call shareholder services at 800.345.6611 and additional reports will be sent to you.
The policy of the Board is to vote the proxies of the companies in which each fund holds investments consistent with the procedures as stated in the Statement of Additional Information (SAI). You may obtain a copy of the SAI without charge by calling 800.345.6611; contacting your financial intermediary; visiting columbiamanagement.com; or searching the website of the Securities and Exchange Commission (SEC) at sec.gov. Information regarding how each fund voted proxies relating to portfolio securities is filed with the SEC by August 31 for the most recent 12-month period ending June 30 of that year, and is available without charge by visiting columbiamanagement.com; or searching the website of the SEC at sec.gov.
Each fund files a complete schedule of portfolio holdings with the SEC for the first and third quarters of each fiscal year on Form N-Q. Each fund's Form N-Q is available on the SEC's website at sec.gov and may be reviewed and copied at the SEC's Public Reference Room in Washington, D.C. Information on the operation of the Public Reference Room may be obtained by calling 800.SEC.0330. Each fund's complete schedule of portfolio holdings, as filed on Form N-Q, can also be obtained without charge, upon request, by calling 800.345.6611.
Annual Report 2013
37

Columbia Large Cap Enhanced Core Fund
P.O. Box 8081
Boston, MA 02266-8081
columbiamanagement.com
This information is for use with concurrent or prior delivery of a fund prospectus. Please read and consider the investment objectives, risks, charges and expenses for any fund carefully before investing. For a prospectus which contains this and other important information about the Fund go to columbiamanagement.com. The Fund is distributed by Columbia Management Investment Distributors, Inc., member FINRA, and managed by Columbia Management Investment Advisers, LLC.
© 2013 Columbia Management Investment Advisers, LLC. All rights reserved.
ANN173_02_C01_(04/13)
Annual Report
February 28, 2013

Columbia Large Cap Index Fund
Not FDIC insured • No bank guarantee • May lose value
Columbia Large Cap Index Fund
 Dear Shareholders,
U.S. stocks flat, foreign markets strong in 2012 finale
After a strong third quarter, U.S. stock market averages treaded water as the year 2012 came to a close. However, they ended the year up strongly, as first- and third-quarter gains more than offset second- and fourth-quarter weakness. Typically a strong quarter for domestic small- and mid-cap issues, the fourth quarter of 2012 indeed proved to be another year-end positive for small-cap stocks. For the full calendar year 2012, the S&P 500 Index rose 16.00%.
Stock markets outside the United States generated some of the best returns for the fourth quarter, as optimism rebounded, thanks to the September actions of the European Central Bank in support of the euro and an improving outlook from China. Both developed and emerging foreign markets topped U.S. stocks by a solid margin.
Corporate and emerging markets led fixed income
Fixed-income investors took their cue from the equity markets and continued to favor the highest risk sectors through the end of 2012. Global fixed-income returns posted mixed results in the final quarter of the year. Gains were the highest for corporate high-yield and emerging market bonds. Although investors remained cautious ahead of the year-end budget negotiations, better economic data and a further improvement in the European sovereign debt crisis supported riskier assets and depressed government bond prices. In December, the Federal Reserve announced its intention to continue to purchase both Treasury and mortgage-backed securities and said that it would seek to keep short-term interest rates unchanged until the unemployment rate reaches 6.5%, or inflation turned noticeably higher.
Stay on track with Columbia Management
Backed by more than 100 years of experience, Columbia Management is one of the nation's largest asset managers. At the heart of our success — and, most importantly, that of our investors — are highly talented industry professionals, brought together by a unique way of working. We are dedicated to helping you take advantage of today's opportunities and anticipate tomorrow's. We stay abreast of the latest investment trends and ideas, using our collective insight to evaluate events and transform them into solutions you can use.
Visit columbiamanagement.com for:
> The Columbia Management Perspectives blog, featuring timely posts by our investment teams
> Detailed up-to-date fund performance and portfolio information
> Economic analysis and market commentary
> Quarterly fund commentaries
> Columbia Management Investor, our award-winning quarterly newsletter for shareholders
Thank you for your continued support of the Columbia Funds. We look forward to serving your investment needs for many years to come.
Best Regards,

J. Kevin Connaughton
President, Columbia Funds
The S&P 500 Index, an unmanaged index, measures the performance of 500 widely held, large-capitalization U.S. stocks and is frequently used as a general measure of market performance. Indices are not available for investment, are not professionally managed and do not reflect sales charges, fees, brokerage commissions, taxes or other expenses of investing.
Investors should consider the investment objectives, risks, charges and expenses of a mutual fund carefully before investing. For a free prospectus, which contains this and other important information about a fund, visit columbiamanagement.com. The prospectus should be read carefully before investing.
Columbia Funds are distributed by Columbia Management Investment Distributors, Inc., member FINRA, and managed by Columbia Management Investment Advisers, LLC.
© 2013 Columbia Management Investment Advisers, LLC. All rights reserved.
Columbia Large Cap Index Fund
Performance Overview | | | 2 | | |
Manager Discussion of Fund Performance | | | 4 | | |
Understanding Your Fund's Expenses | | | 6 | | |
Portfolio of Investments | | | 7 | | |
Statement of Assets and Liabilities | | | 18 | | |
Statement of Operations | | | 20 | | |
Statement of Changes in Net Assets | | | 21 | | |
Financial Highlights | | | 23 | | |
Notes to Financial Statements | | | 28 | | |
Report of Independent Registered
Public Accounting Firm | | | 36 | | |
Federal Income Tax Information | | | 37 | | |
Trustees and Officers | | | 38 | | |
Important Information About This Report | | | 45 | | |
Fund Investment Manager
Columbia Management Investment
Advisers, LLC
225 Franklin Street
Boston, MA 02110
Fund Distributor
Columbia Management Investment
Distributors, Inc.
225 Franklin Street
Boston, MA 02110
Fund Transfer Agent
Columbia Management Investment
Services Corp.
P.O. Box 8081
Boston, MA 02266-8081
For more information about any of the funds, please visit columbiamanagement.com or call 800.345.6611. Customer Service Representatives are available to answer your questions Monday through Friday from 8 a.m. to 8 p.m. Eastern time.
The views expressed in this report reflect the current views of the respective parties. These views are not guarantees of future performance and involve certain risks, uncertainties and assumptions that are difficult to predict, so actual outcomes and results may differ significantly from the views expressed. These views are subject to change at any time based upon economic, market or other conditions and the respective parties disclaim any responsibility to update such views. These views may not be relied on as investment advice and, because investment decisions for a Columbia Fund are based on numerous factors, may not be relied on as an indication of trading intent on behalf of any particular Columbia Fund. References to specific securities should not be construed as a recommendation or investment advice.
Columbia Large Cap Index Fund
Performance Summary
> Columbia Large Cap Index Fund (the Fund) Class A shares returned 12.98% for the 12-month period that ended February 28, 2013.
> The Fund underperformed its benchmark, the S&P 500 Index, which returned 13.46% for the same 12-month period.
> For the Fund and the U.S stock market, it was the fourth consecutive 12-month period of gains.
Average Annual Total Returns (%) (for period ended February 28, 2013)
| | Inception | | 1 Year | | 5 Years | | 10 Years | |
Class A | | 10/10/95 | | | 12.98 | | | | 4.54 | | | | 7.82 | | |
Class B* | | 09/23/05 | | | | | | | | | | | | | |
Excluding sales charges | | | | | | | 12.08 | | | | 3.76 | | | | 7.02 | | |
Including sales charges | | | | | | | 7.08 | | | | 3.41 | | | | 7.02 | | |
Class I* | | 11/16/11 | | | 13.28 | | | | 4.77 | | | | 8.03 | | |
Class R5* | | 11/08/12 | | | 13.26 | | | | 4.81 | | | | 8.09 | | |
Class Z | | 12/15/93 | | | 13.28 | | | | 4.81 | | | | 8.09 | | |
S&P 500 Index | | | | | | | 13.46 | | | | 4.94 | | | | 8.24 | | |
Returns for Class B are shown with and without the applicable contingent deferred sales charge (CDSC) of 5.00% in the first year, declining to 1.00% in the sixth year and eliminated thereafter. The Fund's other classes are not subject to sales charges and have limited eligibility. Please see the Fund's prospectuses for details. Performance for different share classes will vary based on differences in sales charges and fees associated with each class. All results shown assume reinvestment of distributions during the period. Returns do not reflect the deduction of taxes that a shareholder may pay on Fund distributions or on the redemption of Fund shares. Performance results reflect the effect of any fee waivers or reimbursements of Fund expenses by Columbia Management Investment Advisers, LLC and/or any of its affiliates. Absent these fee waivers or expense reimbursement arrangements, performance results would have been lower.
The performance information shown represents past performance and is not a guarantee of future results. The investment return and principal value of your investment will fluctuate so that your shares, when redeemed, may be worth more or less than their original cost. Current performance may be lower or higher than the performance information shown. You may obtain performance information current to the most recent month-end by contacting your financial intermediary, visiting columbiamanagement.com or calling 800.345.6611.
*The returns shown for periods prior to the share class inception date (including returns for the Life of the Fund, if shown, which are since Fund inception) include the returns of the Fund's oldest share class. These returns are adjusted to reflect any higher class-related operating expenses of the newer share classes, as applicable. Please visit columbiamanagement.com/mutual-funds/appended-performance for more information.
The S&P 500 Index, an unmanaged index, measures the performance of 500 widely held, large-capitalization U.S. stocks and is frequently used as a general measure of market performance.
Indices are not available for investment, are not professionally managed and do not reflect sales charges, fees, brokerage commissions, taxes or other expenses of investing. Securities in the Fund may not match those in an index.
Annual Report 2013
2
Columbia Large Cap Index Fund
Performance Overview (continued)
Performance of a Hypothetical $10,000 Investment (March 1, 2003 – February 28, 2013)
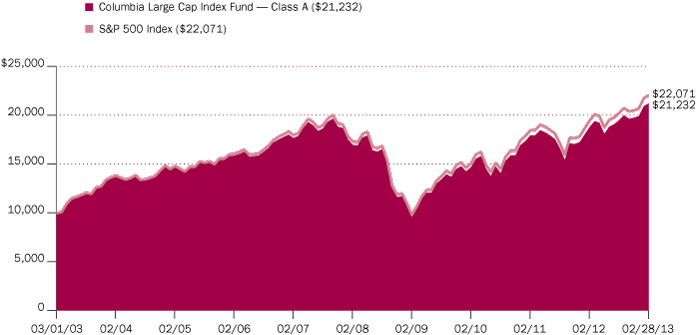
The chart above shows the change in value of a hypothetical $10,000 investment in Class A shares of Columbia Large Cap Index Fund during the stated time period, and does not reflect the deduction of taxes that a shareholder may pay on Fund distributions or on the redemption of Fund shares.
Annual Report 2013
3
Columbia Large Cap Index Fund
Manager Discussion of Fund Performance
For the 12-month period that ended February 28, 2013, the Fund's Class A shares returned 12.98%. The Fund underperformed its benchmark, the S&P 500 Index, which returned 13.46% for the same 12-month period. The Fund seeks to approximate the benchmark weights of securities, industries and sectors represented in the S&P 500 Index. As such, its return was in line with the index return, after fees and expenses, which the index does not incur. Despite periods of volatility, stock prices climbed for the fourth consecutive year, buoyed by strong gains from the telecommunication services, health care and financials sectors.
Investors Shrug Off Weak Global Growth
Europe's economic woes and U.S. struggles to avoid a fiscal cliff of tax increases and spending cuts weighed on the global economy during the 12-month period ended February 28, 2013. Yet, investors chose to look beyond the numbers and came in from the sidelines to bid stock prices significantly higher. Favorable central bank action in key markets and improving prospects for the U.S. economy gave investors confidence to favor stocks and other riskier assets. The U.S. economy expanded at a pace of just 1.6% in 2012. However, a pickup in job growth early in 2013 and steady manufacturing activity were encouraging signs. The U.S. housing market staged a solid comeback, with higher home sales, rising prices and lower inventories. Meanwhile, much of Europe headed toward recession. So far, the United Kingdom has avoided recession — but only barely so — and Japan's economy slipped into negative territory for the fifth time in 15 years. Major emerging market economies, including China, forged ahead, although mostly at a slower pace.
A Solid Year for the U.S. Stock Market
Against this economic backdrop, all ten sectors of the S&P 500 Index delivered positive returns. The strongest performance came from the telecommunication services, financials and health care sectors, each of which logged returns of more than 20% for the period. Financials, health care and consumer discretionary stocks made the greatest contributions to the Fund's returns, based on their weights in the portfolio. Within health care, pharmaceutical stocks posted strong gains. Within financials, diversified financial services companies were the sector leaders. The top-performing large-cap stocks for the 12-month period included telecommunications provider Sprint Nextel, energy-efficient home builder PulteGroup, independent petroleum refiner and marketer Tesoro, integrated oil and natural gas exploration and production company Marathon and wine, beer and spirits marketer Constellation Brands, all of which logged gains of more than 100%. Top contributors to the Fund's performance, based on their weights in the portfolio, were pharmaceutical giant Pfizer, consumer appliance manufacturer General Electric, telecom provider AT&T and class B shares of multinational conglomerate holding company Berkshire Hathaway.
Technology, energy and materials were the weakest performing sectors in the index, although all three generated modest, positive returns. Materials, technology and utilities were the weakest performing sectors for the Fund, based on their weights in the portfolio. Within the materials sector, metals & mining was the weakest industry performer, as were semiconductors & semiconductor equipment and computer peripherals in the technology sector. The list of major large-cap decliners for the period, each posting losses of 55% or more, included
Portfolio Management
Alfred Alley III, CFA
Vadim Shteyn
Morningstar Style BoxTM

The Morningstar Style BoxTM is based on a fund's portfolio holdings. For equity funds, the vertical axis shows the market capitalization of the stocks owned, and the horizontal axis shows investment style (value, blend, or growth). Information shown is based on the most recent data provided by Morningstar.
© 2013 Morningstar, Inc. All rights reserved. The Morningstar information contained herein: (1) is proprietary to Morningstar and/or its content providers; (2) may not be copied or distributed; and (3) is not warranted to be accurate, complete or timely. Neither Morningstar nor its content providers are responsible for any damages or losses arising from any use of this information.
Top Ten Holdings (%)
(at February 28, 2013) | |
Apple, Inc. | | | 3.1 | | |
Exxon Mobil Corp. | | | 3.0 | | |
General Electric Co. | | | 1.8 | | |
Chevron Corp. | | | 1.7 | | |
International Business
Machines Corp. | | | 1.6 | | |
Google, Inc., Class A | | | 1.6 | | |
Johnson & Johnson | | | 1.6 | | |
Microsoft Corp. | | | 1.6 | | |
Procter & Gamble Co. (The) | | | 1.5 | | |
AT&T, Inc. | | | 1.5 | | |
Percentages indicated are based upon total investments (excluding Money Market Funds).
For further detail about these holdings, please refer to the section entitled "Portfolio of Investments."
Fund holdings are as of the date given, are subject to change at any time, and are not recommendations to buy or sell any security.
Annual Report 2013
4
Columbia Large Cap Index Fund
Manager Discussion of Fund Performance (continued)
Advanced Micro Devices, a multinational semiconductor company; Alpha Natural Resources, a coal producer; Apollo Group, owner of for-profit educational institutions; Cliffs Natural Resources, a mining and natural resources company and retailer J.C. Penney. However, technology giants Apple, Intel, and Microsoft, as well as energy exploration and production company Occidental Petroleum and construction and machine manufacturer Caterpillar were the worst-performing stocks for the Fund, based on their weights in the portfolio.
The Fund owned stock index futures in the amount of its cash balances during the period. It did so in order to keep its investment exposure on par with the index, which is always fully invested, but to retain the liquidity necessary for trading and redemption within the Fund.
Changes to Index and Portfolio Holdings
There were 19 additions and deletions to the S&P 500 Index during the 12-month period. All changes to the index were matched by changes in the portfolio during the period.
Looking Ahead
Fourth-quarter 2012 earnings modestly beat expectations, raising confidence that many companies have the ability to manage successfully through an environment in which higher taxes and forced spending cuts weigh on consumer demands. Although the many economic and investment challenges we face in the year ahead will likely result in heightened volatility, equity valuations currently still appear reasonable relative to fixed-income alternatives, and corporate balance sheets are presently in good condition, with low debt and high cash levels. As a result, our current belief is that the equities market has the potential to remain healthy even in an environment of slower economic growth.
Portfolio Breakdown (%)
(at February 28, 2013) | |
Common Stocks | | | 97.7 | | |
Consumer Discretionary | | | 11.2 | | |
Consumer Staples | | | 10.6 | | |
Energy | | | 10.9 | | |
Financials | | | 15.5 | | |
Health Care | | | 12.0 | | |
Industrials | | | 10.0 | | |
Information Technology | | | 17.8 | | |
Materials | | | 3.4 | | |
Telecommunication Services | | | 2.9 | | |
Utilities | | | 3.4 | | |
Money Market Funds | | | 2.3 | | |
Total | | | 100.0 | | |
Percentages indicated are based upon total investments. The Fund's portfolio composition is subject to change.
Annual Report 2013
5
Columbia Large Cap Index Fund
Understanding Your Fund's Expenses
(Unaudited)
As an investor, you incur two types of costs. There are transaction costs, which generally include sales charges on purchases and may include redemption fees. There are also ongoing costs, which generally include management fees, distribution and service (Rule 12b-1) fees, and other fund expenses. The following information is intended to help you understand your ongoing costs (in dollars) of investing in the Fund and to help you compare these costs with the ongoing costs of investing in other mutual funds.
Analyzing Your Fund's Expenses
To illustrate these ongoing costs, we have provided examples and calculated the expenses paid by investors in each share class of the Fund during the period. The actual and hypothetical information in the table is based on an initial investment of $1,000 at the beginning of the period indicated and held for the entire period. Expense information is calculated two ways and each method provides you with different information. The amount listed in the "Actual" column is calculated using the Fund's actual operating expenses and total return for the period. You may use the Actual information, together with the amount invested, to estimate the expenses that you paid over the period. Simply divide your account value by $1,000 (for example, an $8,600 account value divided by $1,000 = 8.6), then multiply the results by the expenses paid during the period under the Actual column. The amount listed in the "Hypothetical" column assumes a 5% annual rate of return before expenses (which is not the Fund's actual return) and then applies the Fund's actual expense ratio for the period to the hypothetical return. You should not use the hypothetical account values and expenses to estimate either your actual account balance at the end of the period or the expenses you paid during the period. See "Compare With Other Funds" below for details on how to use the hypothetical data.
Compare With Other Funds
Since all mutual funds are required to include the same hypothetical calculations about expenses in shareholder reports, you can use this information to compare the ongoing cost of investing in the Fund with other funds. To do so, compare the hypothetical example with the 5% hypothetical examples that appear in the shareholder reports of other funds. As you compare hypothetical examples of other funds, it is important to note that hypothetical examples are meant to highlight the ongoing costs of investing in a fund only and do not reflect any transaction costs, such as sales charges, or redemption or exchange fees. Therefore, the hypothetical calculations are useful in comparing ongoing costs only, and will not help you determine the relative total costs of owning different funds. If transaction costs were included in these calculations, your costs would be higher.
September 1, 2012 – February 28, 2013
| | Account Value at the Beginning
of the Period ($) | | Account Value at the End of the
Period ($) | | Expenses Paid During the
Period ($) | | Fund's Annualized
Expense Ratio (%) | |
| | Actual | | Hypothetical | | Actual | | Hypothetical | | Actual | | Hypothetical | | Actual | |
Class A | | | 1,000.00 | | | | 1,000.00 | | | | 1,087.10 | | | | 1,022.56 | | | | 2.33 | | | | 2.26 | | | | 0.45 | | |
Class B | | | 1,000.00 | | | | 1,000.00 | | | | 1,083.00 | | | | 1,018.84 | | | | 6.20 | | | | 6.01 | | | | 1.20 | | |
Class I | | | 1,000.00 | | | | 1,000.00 | | | | 1,088.50 | | | | 1,023.80 | | | | 1.04 | | | | 1.00 | | | | 0.20 | | |
Class R5 | | | 1,000.00 | | | | 1,000.00 | | | | 1,107.30 | * | | | 1,024.10 | | | | 0.45 | * | | | 0.70 | | | | 0.14 | * | |
Class Z | | | 1,000.00 | | | | 1,000.00 | | | | 1,088.50 | | | | 1,023.80 | | | | 1.04 | | | | 1.00 | | | | 0.20 | | |
*For the period November 8, 2012 through February 28, 2013. Class R5 shares commenced operations on November 8, 2012.
Expenses paid during the period are equal to the annualized expense ratio for each class as indicated above, multiplied by the average account value over the period and then multiplied by the number of days in the Fund's most recent fiscal half year and divided by 365.
Expenses do not include fees and expenses incurred indirectly by the Fund from the underlying funds in which the Fund may invest (also referred to as "acquired funds"), including affiliated and non-affiliated pooled investment vehicles (including mutual funds and exchange-traded funds).
Had Columbia Management Investment Advisers, LLC and/or certain of its affiliates not waived/reimbursed certain fees and expenses, account value at the end of the period would have been reduced.
Annual Report 2013
6
Columbia Large Cap Index Fund
Portfolio of Investments
February 28, 2013
(Percentages represent value of investments compared to net assets)
Common Stocks 97.5%
Issuer | | Shares | | Value ($) | |
Consumer Discretionary 11.2% | |
Auto Components 0.3% | |
BorgWarner, Inc.(a) | | | 21,115 | | | | 1,571,167 | | |
Delphi Automotive PLC(a) | | | 53,280 | | | | 2,229,768 | | |
Goodyear Tire & Rubber Co. (The)(a) | | | 44,194 | | | | 573,638 | | |
Johnson Controls, Inc. | | | 123,364 | | | | 3,882,265 | | |
Total | | | | | 8,256,838 | | |
Automobiles 0.4% | |
Ford Motor Co. | | | 687,843 | | | | 8,673,700 | | |
Harley-Davidson, Inc. | | | 40,819 | | | | 2,148,304 | | |
Total | | | | | 10,822,004 | | |
Distributors 0.1% | |
Genuine Parts Co. | | | 27,987 | | | | 1,987,917 | | |
Diversified Consumer Services 0.1% | |
Apollo Group, Inc., Class A(a) | | | 18,049 | | | | 304,487 | | |
H&R Block, Inc. | | | 48,944 | | | | 1,216,748 | | |
Total | | | | | 1,521,235 | | |
Hotels, Restaurants & Leisure 1.7% | |
Carnival Corp. | | | 80,438 | | | | 2,877,267 | | |
Chipotle Mexican Grill, Inc.(a) | | | 5,682 | | | | 1,800,001 | | |
Darden Restaurants, Inc. | | | 23,202 | | | | 1,073,557 | | |
International Game Technology | | | 48,007 | | | | 765,232 | | |
Marriott International, Inc., Class A | | | 44,403 | | | | 1,751,698 | | |
McDonald's Corp. | | | 181,128 | | | | 17,370,175 | | |
Starbucks Corp. | | | 134,153 | | | | 7,354,267 | | |
Starwood Hotels & Resorts
Worldwide, Inc. | | | 35,356 | | | | 2,133,028 | | |
Wyndham Worldwide Corp. | | | 25,306 | | | | 1,524,433 | | |
Wynn Resorts Ltd. | | | 14,335 | | | | 1,675,762 | | |
Yum! Brands, Inc. | | | 81,511 | | | | 5,337,340 | | |
Total | | | | | 43,662,760 | | |
Household Durables 0.3% | |
D.R. Horton, Inc. | | | 50,378 | | | | 1,123,429 | | |
Garmin Ltd. | | | 19,698 | | | | 676,429 | | |
Harman International Industries, Inc. | | | 12,238 | | | | 519,503 | | |
Leggett & Platt, Inc. | | | 25,488 | | | | 779,423 | | |
Lennar Corp., Class A | | | 29,616 | | | | 1,142,882 | | |
Newell Rubbermaid, Inc. | | | 51,886 | | | | 1,211,019 | | |
PulteGroup, Inc.(a) | | | 61,332 | | | | 1,176,348 | | |
Whirlpool Corp. | | | 14,046 | | | | 1,586,496 | | |
Total | | | | | 8,215,529 | | |
Common Stocks (continued)
Issuer | | Shares | | Value ($) | |
Internet & Catalog Retail 1.1% | |
Amazon.com, Inc.(a) | | | 65,375 | | | | 17,276,651 | | |
Expedia, Inc. | | | 16,789 | | | | 1,071,810 | | |
Netflix, Inc.(a) | | | 10,021 | | | | 1,884,750 | | |
priceline.com, Inc.(a) | | | 8,996 | | | | 6,185,469 | | |
TripAdvisor, Inc.(a) | | | 19,774 | | | | 898,926 | | |
Total | | | | | 27,317,606 | | |
Leisure Equipment & Products 0.1% | |
Hasbro, Inc. | | | 20,862 | | | | 834,897 | | |
Mattel, Inc. | | | 61,905 | | | | 2,522,629 | | |
Total | | | | | 3,357,526 | | |
Media 3.4% | |
Cablevision Systems Corp., Class A | | | 38,929 | | | | 544,617 | | |
CBS Corp., Class B Non Voting | | | 106,606 | | | | 4,625,634 | | |
Comcast Corp., Class A | | | 479,397 | | | | 19,075,207 | | |
DIRECTV(a) | | | 108,992 | | | | 5,250,145 | | |
Discovery Communications, Inc.,
Class A(a) | | | 43,092 | | | | 3,159,936 | | |
Gannett Co., Inc. | | | 41,456 | | | | 832,022 | | |
Interpublic Group of Companies, Inc. (The) | | | 77,827 | | | | 994,629 | | |
News Corp., Class A | | | 363,760 | | | | 10,476,288 | | |
Omnicom Group, Inc. | | | 47,661 | | | | 2,741,937 | | |
Scripps Networks Interactive, Inc.,
Class A | | | 15,680 | | | | 988,624 | | |
Time Warner Cable, Inc. | | | 54,443 | | | | 4,703,331 | | |
Time Warner, Inc. | | | 170,823 | | | | 9,082,659 | | |
Viacom, Inc., Class B | | | 83,350 | | | | 4,872,641 | | |
Walt Disney Co. (The) | | | 319,709 | | | | 17,452,914 | | |
Washington Post Co. (The), Class B | | | 812 | | | | 323,614 | | |
Total | | | | | 85,124,198 | | |
Multiline Retail 0.8% | |
Dollar General Corp.(a) | | | 47,374 | | | | 2,195,311 | | |
Dollar Tree, Inc.(a) | | | 40,990 | | | | 1,852,133 | | |
Family Dollar Stores, Inc. | | | 17,280 | | | | 994,464 | | |
JCPenney Co., Inc. | | | 25,710 | | | | 451,725 | | |
Kohl's Corp. | | | 38,176 | | | | 1,759,914 | | |
Macy's, Inc. | | | 71,312 | | | | 2,930,923 | | |
Nordstrom, Inc. | | | 27,435 | | | | 1,487,526 | | |
Target Corp. | | | 117,410 | | | | 7,392,133 | | |
Total | | | | | 19,064,129 | | |
The accompanying Notes to Financial Statements are an integral part of this statement.
Annual Report 2013
7
Columbia Large Cap Index Fund
Portfolio of Investments (continued)
February 28, 2013
Common Stocks (continued)
Issuer | | Shares | | Value ($) | |
Specialty Retail 2.2% | |
Abercrombie & Fitch Co., Class A | | | 14,354 | | | | 669,327 | | |
AutoNation, Inc.(a) | | | 7,030 | | | | 307,703 | | |
AutoZone, Inc.(a) | | | 6,663 | | | | 2,532,939 | | |
Bed Bath & Beyond, Inc.(a) | | | 41,349 | | | | 2,346,556 | | |
Best Buy Co., Inc. | | | 48,186 | | | | 790,732 | | |
CarMax, Inc.(a) | | | 41,280 | | | | 1,585,565 | | |
GameStop Corp., Class A | | | 21,862 | | | | 547,862 | | |
Gap, Inc. (The) | | | 53,625 | | | | 1,765,335 | | |
Home Depot, Inc. (The) | | | 269,745 | | | | 18,477,533 | | |
Limited Brands, Inc. | | | 43,181 | | | | 1,965,599 | | |
Lowe's Companies, Inc. | | | 202,903 | | | | 7,740,749 | | |
O'Reilly Automotive, Inc.(a) | | | 20,679 | | | | 2,103,882 | | |
PetSmart, Inc. | | | 19,390 | | | | 1,262,483 | | |
Ross Stores, Inc. | | | 40,120 | | | | 2,325,355 | | |
Staples, Inc. | | | 121,575 | | | | 1,602,359 | | |
Tiffany & Co. | | | 21,499 | | | | 1,443,873 | | |
TJX Companies, Inc. | | | 131,565 | | | | 5,916,478 | | |
Urban Outfitters, Inc.(a) | | | 19,743 | | | | 799,986 | | |
Total | | | | | 54,184,316 | | |
Textiles, Apparel & Luxury Goods 0.7% | |
Coach, Inc. | | | 51,181 | | | | 2,473,578 | | |
Fossil, Inc.(a) | | | 9,746 | | | | 1,001,596 | | |
Nike, Inc., Class B | | | 131,680 | | | | 7,171,293 | | |
PVH Corp. | | | 14,100 | | | | 1,718,085 | | |
Ralph Lauren Corp. | | | 11,058 | | | | 1,918,231 | | |
VF Corp. | | | 15,899 | | | | 2,563,873 | | |
Total | | | | | 16,846,656 | | |
Total Consumer Discretionary | | | | | 280,360,714 | | |
Consumer Staples 10.6% | |
Beverages 2.3% | |
Beam, Inc. | | | 28,706 | | | | 1,751,927 | | |
Brown-Forman Corp., Class B | | | 27,343 | | | | 1,794,248 | | |
Coca-Cola Co. (The) | | | 695,885 | | | | 26,944,667 | | |
Coca-Cola Enterprises, Inc. | | | 48,679 | | | | 1,741,735 | | |
Constellation Brands, Inc., Class A(a) | | | 27,322 | | | | 1,208,725 | | |
Crimson Wine Group Ltd.(a) | | | 3,574 | | | | 28,790 | | |
Dr. Pepper Snapple Group, Inc. | | | 37,546 | | | | 1,637,757 | | |
Molson Coors Brewing Co., Class B | | | 28,116 | | | | 1,243,008 | | |
Common Stocks (continued)
Issuer | | Shares | | Value ($) | |
Monster Beverage Corp.(a) | | | 26,898 | | | | 1,356,466 | | |
PepsiCo, Inc. | | | 279,068 | | | | 21,144,982 | | |
Total | | | | | 58,852,305 | | |
Food & Staples Retailing 2.3% | |
Costco Wholesale Corp. | | | 78,014 | | | | 7,902,038 | | |
CVS Caremark Corp. | | | 224,916 | | | | 11,497,706 | | |
Kroger Co. (The) | | | 92,695 | | | | 2,707,621 | | |
Safeway, Inc. | | | 43,226 | | | | 1,031,372 | | |
SYSCO Corp. | | | 106,046 | | | | 3,410,439 | | |
Wal-Mart Stores, Inc. | | | 301,757 | | | | 21,358,361 | | |
Walgreen Co. | | | 154,989 | | | | 6,345,250 | | |
Whole Foods Market, Inc. | | | 31,128 | | | | 2,665,179 | | |
Total | | | | | 56,917,966 | | |
Food Products 1.8% | |
Archer-Daniels-Midland Co. | | | 118,812 | | | | 3,785,350 | | |
Campbell Soup Co. | | | 32,333 | | | | 1,330,826 | | |
ConAgra Foods, Inc. | | | 73,523 | | | | 2,507,870 | | |
Dean Foods Co.(a) | | | 33,418 | | | | 554,739 | | |
General Mills, Inc. | | | 116,405 | | | | 5,383,731 | | |
Hershey Co. (The) | | | 26,979 | | | | 2,248,430 | | |
HJ Heinz Co. | | | 57,850 | | | | 4,190,075 | | |
Hormel Foods Corp. | | | 24,187 | | | | 904,836 | | |
JM Smucker Co. (The) | | | 19,568 | | | | 1,864,830 | | |
Kellogg Co. | | | 44,617 | | | | 2,699,328 | | |
Kraft Foods Group, Inc. | | | 106,876 | | | | 5,180,280 | | |
McCormick & Co., Inc. | | | 23,907 | | | | 1,608,224 | | |
Mead Johnson Nutrition Co. | | | 36,627 | | | | 2,743,729 | | |
Mondelez International, Inc., Class A | | | 320,605 | | | | 8,864,728 | | |
Tyson Foods, Inc., Class A | | | 51,780 | | | | 1,173,853 | | |
Total | | | | | 45,040,829 | | |
Household Products 2.2% | |
Clorox Co. (The) | | | 23,538 | | | | 1,977,427 | | |
Colgate-Palmolive Co. | | | 80,126 | | | | 9,168,818 | | |
Kimberly-Clark Corp. | | | 70,592 | | | | 6,655,414 | | |
Procter & Gamble Co. (The) | | | 493,283 | | | | 37,578,299 | | |
Total | | | | | 55,379,958 | | |
Personal Products 0.2% | |
Avon Products, Inc. | | | 77,966 | | | | 1,524,236 | | |
Estee Lauder Companies, Inc. (The),
Class A | | | 43,310 | | | | 2,776,171 | | |
Total | | | | | 4,300,407 | | |
The accompanying Notes to Financial Statements are an integral part of this statement.
Annual Report 2013
8
Columbia Large Cap Index Fund
Portfolio of Investments (continued)
February 28, 2013
Common Stocks (continued)
Issuer | | Shares | | Value ($) | |
Tobacco 1.8% | |
Altria Group, Inc. | | | 365,350 | | | | 12,257,492 | | |
Lorillard, Inc. | | | 70,059 | | | | 2,700,074 | | |
Philip Morris International, Inc. | | | 301,385 | | | | 27,652,074 | | |
Reynolds American, Inc. | | | 58,487 | | | | 2,554,712 | | |
Total | | | | | 45,164,352 | | |
Total Consumer Staples | | | | | 265,655,817 | | |
Energy 10.9% | |
Energy Equipment & Services 1.9% | |
Baker Hughes, Inc. | | | 79,317 | | | | 3,554,988 | | |
Cameron International Corp.(a) | | | 44,510 | | | | 2,836,177 | | |
Diamond Offshore Drilling, Inc. | | | 12,541 | | | | 873,857 | | |
Ensco PLC, Class A | | | 41,907 | | | | 2,520,287 | | |
FMC Technologies, Inc.(a) | | | 42,889 | | | | 2,226,368 | | |
Halliburton Co. | | | 167,418 | | | | 6,949,521 | | |
Helmerich & Payne, Inc. | | | 19,074 | | | | 1,263,843 | | |
Nabors Industries Ltd.(a) | | | 52,388 | | | | 878,023 | | |
National Oilwell Varco, Inc. | | | 77,018 | | | | 5,247,237 | | |
Noble Corp. | | | 45,593 | | | | 1,633,141 | | |
Rowan Companies PLC, Class A(a) | | | 22,406 | | | | 775,024 | | |
Schlumberger Ltd. | | | 239,507 | | | | 18,645,620 | | |
Total | | | | | 47,404,086 | | |
Oil, Gas & Consumable Fuels 9.0% | |
Anadarko Petroleum Corp. | | | 90,162 | | | | 7,175,092 | | |
Apache Corp. | | | 70,592 | | | | 5,242,868 | | |
Cabot Oil & Gas Corp. | | | 37,857 | | | | 2,345,998 | | |
Chesapeake Energy Corp. | | | 93,530 | | | | 1,885,565 | | |
Chevron Corp. | | | 353,095 | | | | 41,365,079 | | |
ConocoPhillips | | | 218,999 | | | | 12,690,992 | | |
CONSOL Energy, Inc. | | | 41,094 | | | | 1,321,172 | | |
Denbury Resources, Inc.(a) | | | 69,818 | | | | 1,265,102 | | |
Devon Energy Corp. | | | 67,951 | | | | 3,687,021 | | |
EOG Resources, Inc. | | | 48,870 | | | | 6,143,448 | | |
EQT Corp. | | | 26,992 | | | | 1,702,925 | | |
Exxon Mobil Corp.(b) | | | 822,552 | | | | 73,659,532 | | |
Hess Corp. | | | 53,608 | | | | 3,564,932 | | |
Kinder Morgan Management LLC(c) | | | 60,281 | | | | 50 | | |
Kinder Morgan, Inc. | | | 114,090 | | | | 4,229,316 | | |
Marathon Oil Corp. | | | 127,445 | | | | 4,269,407 | | |
Common Stocks (continued)
Issuer | | Shares | | Value ($) | |
Marathon Petroleum Corp. | | | 61,192 | | | | 5,071,593 | | |
Murphy Oil Corp. | | | 33,308 | | | | 2,027,791 | | |
Newfield Exploration Co.(a) | | | 24,396 | | | | 564,036 | | |
Noble Energy, Inc. | | | 32,093 | | | | 3,556,867 | | |
Occidental Petroleum Corp. | | | 146,165 | | | | 12,033,764 | | |
Peabody Energy Corp. | | | 48,420 | | | | 1,043,935 | | |
Phillips 66 | | | 112,902 | | | | 7,108,310 | | |
Pioneer Natural Resources Co. | | | 23,852 | | | | 3,000,820 | | |
QEP Resources, Inc. | | | 32,134 | | | | 978,802 | | |
Range Resources Corp. | | | 29,340 | | | | 2,253,312 | | |
Southwestern Energy Co.(a) | | | 63,041 | | | | 2,160,415 | | |
Spectra Energy Corp. | | | 120,120 | | | | 3,488,285 | | |
Tesoro Corp. | | | 25,336 | | | | 1,424,897 | | |
Valero Energy Corp. | | | 99,864 | | | | 4,552,800 | | |
Williams Companies, Inc. (The) | | | 121,565 | | | | 4,219,521 | | |
WPX Energy, Inc.(a) | | | 35,936 | | | | 509,932 | | |
Total | | | | | 224,543,579 | | |
Total Energy | | | | | 271,947,665 | | |
Financials 15.4% | |
Capital Markets 2.0% | |
Ameriprise Financial, Inc.(d) | | | 37,131 | | | | 2,548,301 | | |
Bank of New York Mellon Corp. (The) | | | 210,829 | | | | 5,721,899 | | |
BlackRock, Inc. | | | 22,634 | | | | 5,426,501 | | |
Charles Schwab Corp. (The) | | | 197,835 | | | | 3,212,840 | | |
E*TRADE Financial Corp.(a) | | | 46,447 | | | | 497,447 | | |
Franklin Resources, Inc. | | | 24,895 | | | | 3,516,419 | | |
Goldman Sachs Group, Inc. (The) | | | 79,696 | | | | 11,935,273 | | |
Invesco Ltd. | | | 80,110 | | | | 2,146,147 | | |
Legg Mason, Inc. | | | 21,148 | | | | 602,718 | | |
Morgan Stanley | | | 249,331 | | | | 5,622,414 | | |
Northern Trust Corp. | | | 39,369 | | | | 2,093,250 | | |
State Street Corp. | | | 83,856 | | | | 4,745,411 | | |
T Rowe Price Group, Inc. | | | 45,980 | | | | 3,273,316 | | |
Total | | | | | 51,341,936 | | |
Commercial Banks 2.7% | |
BB&T Corp. | | | 126,222 | | | | 3,832,100 | | |
Comerica, Inc. | | | 34,340 | | | | 1,180,609 | | |
Fifth Third Bancorp | | | 161,912 | | | | 2,564,686 | | |
First Horizon National Corp. | | | 44,585 | | | | 473,939 | | |
The accompanying Notes to Financial Statements are an integral part of this statement.
Annual Report 2013
9
Columbia Large Cap Index Fund
Portfolio of Investments (continued)
February 28, 2013
Common Stocks (continued)
Issuer | | Shares | | Value ($) | |
Huntington Bancshares, Inc. | | | 154,338 | | | | 1,084,996 | | |
KeyCorp | | | 168,439 | | | | 1,581,642 | | |
M&T Bank Corp. | | | 21,939 | | | | 2,239,752 | | |
PNC Financial Services Group, Inc. | | | 95,412 | | | | 5,952,755 | | |
Regions Financial Corp. | | | 254,920 | | | | 1,950,138 | | |
SunTrust Banks, Inc. | | | 97,210 | | | | 2,682,024 | | |
U.S. Bancorp | | | 339,238 | | | | 11,527,307 | | |
Wells Fargo & Co. | | | 883,247 | | | | 30,984,305 | | |
Zions Bancorporation | | | 33,228 | | | | 802,124 | | |
Total | | | | | 66,856,377 | | |
Consumer Finance 0.8% | |
American Express Co. | | | 175,644 | | | | 10,916,275 | | |
Capital One Financial Corp. | | | 104,942 | | | | 5,355,190 | | |
Discover Financial Services | | | 91,067 | | | | 3,508,811 | | |
SLM Corp. | | | 83,378 | | | | 1,581,681 | | |
Total | | | | | 21,361,957 | | |
Diversified Financial Services 3.6% | |
Bank of America Corp. | | | 1,944,474 | | | | 21,836,443 | | |
Citigroup, Inc. | | | 529,056 | | | | 22,204,480 | | |
CME Group, Inc. | | | 55,335 | | | | 3,310,140 | | |
IntercontinentalExchange, Inc.(a) | | | 13,119 | | | | 2,031,084 | | |
JPMorgan Chase & Co. | | | 685,811 | | | | 33,549,874 | | |
Leucadia National Corp. | | | 52,941 | | | | 1,424,113 | | |
McGraw-Hill Companies, Inc. (The) | | | 50,100 | | | | 2,332,155 | | |
Moody's Corp. | | | 34,986 | | | | 1,681,427 | | |
NASDAQ OMX Group, Inc. (The) | | | 21,127 | | | | 668,881 | | |
NYSE Euronext | | | 43,840 | | | | 1,634,355 | | |
Total | | | | | 90,672,952 | | |
Insurance 4.0% | |
ACE Ltd. | | | 61,305 | | | | 5,234,834 | | |
Aflac, Inc. | | | 84,596 | | | | 4,225,570 | | |
Allstate Corp. (The) | | | 86,918 | | | | 3,999,966 | | |
American International Group, Inc.(a) | | | 266,340 | | | | 10,123,583 | | |
Aon PLC | | | 57,491 | | | | 3,512,125 | | |
Assurant, Inc. | | | 14,200 | | | | 596,258 | | |
Berkshire Hathaway, Inc., Class B(a) | | | 329,078 | | | | 33,618,609 | | |
Chubb Corp. (The) | | | 47,257 | | | | 3,971,006 | | |
Cincinnati Financial Corp. | | | 26,415 | | | | 1,188,939 | | |
Genworth Financial, Inc., Class A(a) | | | 88,731 | | | | 757,763 | | |
Common Stocks (continued)
Issuer | | Shares | | Value ($) | |
Hartford Financial Services Group, Inc. | | | 78,714 | | | | 1,858,438 | | |
Lincoln National Corp. | | | 49,616 | | | | 1,465,657 | | |
Loews Corp. | | | 56,098 | | | | 2,418,385 | | |
Marsh & McLennan Companies, Inc. | | | 98,213 | | | | 3,647,631 | | |
MetLife, Inc. | | | 196,835 | | | | 6,975,832 | | |
Principal Financial Group, Inc. | | | 49,788 | | | | 1,573,799 | | |
Progressive Corp. (The) | | | 100,375 | | | | 2,445,135 | | |
Prudential Financial, Inc. | | | 83,710 | | | | 4,651,765 | | |
Torchmark Corp. | | | 17,126 | | | | 962,310 | | |
Travelers Companies, Inc. (The) | | | 68,817 | | | | 5,534,263 | | |
Unum Group | | | 49,635 | | | | 1,214,568 | | |
XL Group PLC | | | 54,232 | | | | 1,553,204 | | |
Total | | | | | 101,529,640 | | |
Real Estate Investment Trusts (REITs) 2.1% | |
American Tower Corp. | | | 71,326 | | | | 5,534,898 | | |
Apartment Investment &
Management Co., Class A | | | 26,258 | | | | 777,762 | | |
AvalonBay Communities, Inc. | | | 20,635 | | | | 2,575,867 | | |
Boston Properties, Inc. | | | 27,217 | | | | 2,827,302 | | |
Equity Residential | | | 58,045 | | | | 3,194,797 | | |
HCP, Inc. | | | 81,557 | | | | 3,986,506 | | |
Health Care REIT, Inc. | | | 46,849 | | | | 3,004,895 | | |
Host Hotels & Resorts, Inc. | | | 130,752 | | | | 2,179,636 | | |
Kimco Realty Corp. | | | 73,539 | | | | 1,600,944 | | |
Plum Creek Timber Co., Inc. | | | 29,150 | | | | 1,413,775 | | |
ProLogis, Inc. | | | 83,153 | | | | 3,237,978 | | |
Public Storage | | | 26,012 | | | | 3,933,274 | | |
Simon Property Group, Inc. | | | 55,810 | | | | 8,865,976 | | |
Ventas, Inc. | | | 53,321 | | | | 3,774,060 | | |
Vornado Realty Trust | | | 30,560 | | | | 2,451,218 | | |
Weyerhaeuser Co. | | | 97,698 | | | | 2,873,298 | | |
Total | | | | | 52,232,186 | | |
Real Estate Management & Development 0.1% | |
CBRE Group, Inc., Class A(a) | | | 54,430 | | | | 1,315,573 | | |
Thrifts & Mortgage Finance 0.1% | |
Hudson City Bancorp, Inc. | | | 85,762 | | | | 730,692 | | |
People's United Financial, Inc. | | | 62,716 | | | | 821,580 | | |
Total | | | | | 1,552,272 | | |
Total Financials | | | | | 386,862,893 | | |
The accompanying Notes to Financial Statements are an integral part of this statement.
Annual Report 2013
10
Columbia Large Cap Index Fund
Portfolio of Investments (continued)
February 28, 2013
Common Stocks (continued)
Issuer | | Shares | | Value ($) | |
Health Care 11.9% | |
Biotechnology 1.7% | |
Alexion Pharmaceuticals, Inc.(a) | | | 35,051 | | | | 3,040,324 | | |
Amgen, Inc. | | | 138,439 | | | | 12,654,709 | | |
Biogen Idec, Inc.(a) | | | 42,684 | | | | 7,100,057 | | |
Celgene Corp.(a) | | | 76,311 | | | | 7,873,769 | | |
Gilead Sciences, Inc.(a) | | | 273,374 | | | | 11,675,803 | | |
Total | | | | | 42,344,662 | | |
Health Care Equipment & Supplies 2.1% | |
Abbott Laboratories | | | 285,169 | | | | 9,635,860 | | |
Baxter International, Inc. | | | 99,113 | | | | 6,700,039 | | |
Becton Dickinson and Co. | | | 35,533 | | | | 3,129,036 | | |
Boston Scientific Corp.(a) | | | 247,700 | | | | 1,830,503 | | |
CareFusion Corp.(a) | | | 40,036 | | | | 1,310,779 | | |
Covidien PLC | | | 85,404 | | | | 5,429,132 | | |
CR Bard, Inc. | | | 13,810 | | | | 1,365,118 | | |
DENTSPLY International, Inc. | | | 25,605 | | | | 1,060,559 | | |
Edwards Lifesciences Corp.(a) | | | 20,821 | | | | 1,789,149 | | |
Intuitive Surgical, Inc.(a) | | | 7,174 | | | | 3,657,951 | | |
Medtronic, Inc. | | | 182,459 | | | | 8,203,357 | | |
St. Jude Medical, Inc. | | | 55,598 | | | | 2,279,518 | | |
Stryker Corp. | | | 52,130 | | | | 3,330,064 | | |
Varian Medical Systems, Inc.(a) | | | 19,737 | | | | 1,394,024 | | |
Zimmer Holdings, Inc. | | | 31,302 | | | | 2,346,398 | | |
Total | | | | | 53,461,487 | | |
Health Care Providers & Services 1.8% | |
Aetna, Inc. | | | 60,363 | | | | 2,848,530 | | |
AmerisourceBergen Corp. | | | 42,482 | | | | 2,005,150 | | |
Cardinal Health, Inc. | | | 61,299 | | | | 2,832,627 | | |
CIGNA Corp. | | | 51,577 | | | | 3,015,191 | | |
Coventry Health Care, Inc. | | | 24,266 | | | | 1,100,706 | | |
DaVita HealthCare Partners, Inc.(a) | | | 15,123 | | | | 1,809,013 | | |
Express Scripts Holding Co.(a) | | | 147,287 | | | | 8,382,103 | | |
Five Star Quality Care, Inc.(c) | | | 23,000 | | | | 2 | | |
Humana, Inc. | | | 28,545 | | | | 1,948,482 | | |
Laboratory Corp. of America Holdings(a) | | | 17,067 | | | | 1,512,136 | | |
McKesson Corp. | | | 42,584 | | | | 4,519,440 | | |
Patterson Companies, Inc. | | | 15,091 | | | | 548,407 | | |
Quest Diagnostics, Inc. | | | 28,679 | | | | 1,610,899 | | |
Common Stocks (continued)
Issuer | | Shares | | Value ($) | |
Tenet Healthcare Corp.(a) | | | 19,209 | | | | 755,106 | | |
UnitedHealth Group, Inc. | | | 184,288 | | | | 9,850,194 | | |
WellPoint, Inc. | | | 54,782 | | | | 3,406,345 | | |
Total | | | | | 46,144,331 | | |
Health Care Technology 0.1% | |
Cerner Corp.(a) | | | 26,309 | | | | 2,300,985 | | |
Life Sciences Tools & Services 0.5% | |
Agilent Technologies, Inc. | | | 62,863 | | | | 2,607,557 | | |
Life Technologies Corp.(a) | | | 31,041 | | | | 1,804,413 | | |
PerkinElmer, Inc. | | | 20,707 | | | | 707,558 | | |
Thermo Fisher Scientific, Inc. | | | 64,986 | | | | 4,795,967 | | |
Waters Corp.(a) | | | 15,687 | | | | 1,454,499 | | |
Total | | | | | 11,369,994 | | |
Pharmaceuticals 5.7% | |
AbbVie, Inc. | | | 285,169 | | | | 10,528,440 | | |
Actavis, Inc.(a) | | | 23,049 | | | | 1,962,853 | | |
Allergan, Inc. | | | 55,482 | | | | 6,015,358 | | |
Bristol-Myers Squibb Co. | | | 297,801 | | | | 11,009,703 | | |
Eli Lilly & Co. | | | 184,235 | | | | 10,070,285 | | |
Forest Laboratories, Inc.(a) | | | 42,233 | | | | 1,554,174 | | |
Hospira, Inc.(a) | | | 29,807 | | | | 877,220 | | |
Johnson & Johnson | | | 499,964 | | | | 38,052,260 | | |
Merck & Co., Inc. | | | 548,460 | | | | 23,435,696 | | |
Mylan, Inc.(a) | | | 73,522 | | | | 2,176,986 | | |
Perrigo Co. | | | 15,921 | | | | 1,801,780 | | |
Pfizer, Inc. | | | 1,328,283 | | | | 36,355,106 | | |
Total | | | | | 143,839,861 | | |
Total Health Care | | | | | 299,461,320 | | |
Industrials 10.0% | |
Aerospace & Defense 2.3% | |
Boeing Co. (The) | | | 122,439 | | | | 9,415,559 | | |
General Dynamics Corp. | | | 59,876 | | | | 4,069,772 | | |
Honeywell International, Inc. | | | 141,328 | | | | 9,907,093 | | |
L-3 Communications Holdings, Inc. | | | 16,969 | | | | 1,294,226 | | |
Lockheed Martin Corp. | | | 48,454 | | | | 4,263,952 | | |
Northrop Grumman Corp. | | | 44,281 | | | | 2,908,376 | | |
Precision Castparts Corp. | | | 26,257 | | | | 4,899,294 | | |
Raytheon Co. | | | 59,511 | | | | 3,247,515 | | |
Rockwell Collins, Inc. | | | 25,296 | | | | 1,520,542 | | |
The accompanying Notes to Financial Statements are an integral part of this statement.
Annual Report 2013
11
Columbia Large Cap Index Fund
Portfolio of Investments (continued)
February 28, 2013
Common Stocks (continued)
Issuer | | Shares | | Value ($) | |
Textron, Inc. | | | 50,844 | | | | 1,466,849 | | |
United Technologies Corp. | | | 152,126 | | | | 13,775,009 | | |
Total | | | | | 56,768,187 | | |
Air Freight & Logistics 0.8% | |
CH Robinson Worldwide, Inc. | | | 29,081 | | | | 1,658,199 | | |
Expeditors International of
Washington, Inc. | | | 37,702 | | | | 1,464,723 | | |
FedEx Corp. | | | 52,698 | | | | 5,555,950 | | |
United Parcel Service, Inc., Class B | | | 129,085 | | | | 10,668,875 | | |
Total | | | | | 19,347,747 | | |
Airlines 0.1% | |
Southwest Airlines Co. | | | 133,139 | | | | 1,557,726 | | |
Building Products —% | |
Masco Corp. | | | 64,424 | | | | 1,240,806 | | |
Commercial Services & Supplies 0.5% | |
ADT Corp. (The) | | | 41,940 | | | | 2,008,506 | | |
Avery Dennison Corp. | | | 17,968 | | | | 733,993 | | |
Cintas Corp. | | | 19,154 | | | | 840,861 | | |
Iron Mountain, Inc. | | | 30,094 | | | | 1,038,243 | | |
Pitney Bowes, Inc. | | | 36,218 | | | | 474,456 | | |
Republic Services, Inc. | | | 53,953 | | | | 1,696,282 | | |
Stericycle, Inc.(a) | | | 15,495 | | | | 1,486,280 | | |
Tyco International Ltd. | | | 84,020 | | | | 2,689,480 | | |
Waste Management, Inc. | | | 78,671 | | | | 2,936,002 | | |
Total | | | | | 13,904,103 | | |
Construction & Engineering 0.2% | |
Fluor Corp. | | | 30,040 | | | | 1,859,476 | | |
Jacobs Engineering Group, Inc.(a) | | | 23,467 | | | | 1,146,128 | | |
Quanta Services, Inc.(a) | | | 38,456 | | | | 1,092,151 | | |
Total | | | | | 4,097,755 | | |
Electrical Equipment 0.7% | |
Eaton Corp. PLC | | | 83,308 | | | | 5,162,597 | | |
Emerson Electric Co. | | | 130,642 | | | | 7,407,401 | | |
Rockwell Automation, Inc. | | | 25,133 | | | | 2,270,515 | | |
Roper Industries, Inc. | | | 17,751 | | | | 2,211,952 | | |
Total | | | | | 17,052,465 | | |
Industrial Conglomerates 2.5% | |
3M Co. | | | 114,845 | | | | 11,943,880 | | |
Danaher Corp. | | | 104,973 | | | | 6,466,337 | | |
General Electric Co. | | | 1,891,835 | | | | 43,928,409 | | |
Total | | | | | 62,338,626 | | |
Common Stocks (continued)
Issuer | | Shares | | Value ($) | |
Machinery 1.8% | |
Caterpillar, Inc. | | | 117,976 | | | | 10,897,443 | | |
Cummins, Inc. | | | 31,890 | | | | 3,695,094 | | |
Deere & Co. | | | 70,661 | | | | 6,206,156 | | |
Dover Corp. | | | 32,295 | | | | 2,368,838 | | |
Flowserve Corp. | | | 9,018 | | | | 1,447,389 | | |
Illinois Tool Works, Inc. | | | 76,922 | | | | 4,730,703 | | |
Ingersoll-Rand PLC | | | 50,503 | | | | 2,658,983 | | |
Joy Global, Inc. | | | 19,101 | | | | 1,209,857 | | |
PACCAR, Inc. | | | 63,690 | | | | 3,020,817 | | |
Pall Corp. | | | 20,042 | | | | 1,366,464 | | |
Parker Hannifin Corp. | | | 26,914 | | | | 2,542,835 | | |
Pentair Ltd. | | | 37,939 | | | | 2,021,011 | | |
Snap-On, Inc. | | | 10,505 | | | | 843,236 | | |
Stanley Black & Decker, Inc. | | | 30,451 | | | | 2,396,494 | | |
Xylem, Inc. | | | 33,519 | | | | 921,772 | | |
Total | | | | | 46,327,092 | | |
Professional Services 0.1% | |
Dun & Bradstreet Corp. (The) | | | 8,040 | | | | 648,024 | | |
Equifax, Inc. | | | 21,577 | | | | 1,189,324 | | |
Robert Half International, Inc. | | | 25,391 | | | | 902,650 | | |
Total | | | | | 2,739,998 | | |
Road & Rail 0.8% | |
CSX Corp. | | | 186,071 | | | | 4,268,469 | | |
Norfolk Southern Corp. | | | 57,017 | | | | 4,165,092 | | |
Ryder System, Inc. | | | 9,221 | | | | 518,220 | | |
Union Pacific Corp. | | | 84,864 | | | | 11,635,703 | | |
Total | | | | | 20,587,484 | | |
Trading Companies & Distributors 0.2% | |
Fastenal Co. | | | 48,648 | | | | 2,511,696 | | |
WW Grainger, Inc. | | | 10,782 | | | | 2,441,692 | | |
Total | | | | | 4,953,388 | | |
Total Industrials | | | | | 250,915,377 | | |
Information Technology 17.8% | |
Communications Equipment 1.9% | |
Cisco Systems, Inc. | | | 957,842 | | | | 19,971,006 | | |
F5 Networks, Inc.(a) | | | 14,261 | | | | 1,346,667 | | |
Harris Corp. | | | 20,488 | | | | 984,858 | | |
JDS Uniphase Corp.(a) | | | 42,207 | | | | 597,651 | | |
The accompanying Notes to Financial Statements are an integral part of this statement.
Annual Report 2013
12
Columbia Large Cap Index Fund
Portfolio of Investments (continued)
February 28, 2013
Common Stocks (continued)
Issuer | | Shares | | Value ($) | |
Juniper Networks, Inc.(a) | | | 93,015 | | | | 1,923,550 | | |
Motorola Solutions, Inc. | | | 50,605 | | | | 3,148,137 | | |
QUALCOMM, Inc. | | | 307,424 | | | | 20,176,237 | | |
Total | | | | | 48,148,106 | | |
Computers & Peripherals 4.1% | |
Apple, Inc. | | | 169,710 | | | | 74,909,994 | | |
Dell, Inc. | | | 263,274 | | | | 3,672,672 | | |
EMC Corp.(a) | | | 380,062 | | | | 8,745,227 | | |
Hewlett-Packard Co. | | | 354,715 | | | | 7,143,960 | | |
NetApp, Inc.(a) | | | 64,638 | | | | 2,186,704 | | |
SanDisk Corp.(a) | | | 43,621 | | | | 2,198,062 | | |
Seagate Technology PLC | | | 60,612 | | | | 1,949,282 | | |
Western Digital Corp. | | | 39,553 | | | | 1,865,319 | | |
Total | | | | | 102,671,220 | | |
Electronic Equipment, Instruments & Components 0.4% | |
Amphenol Corp., Class A | | | 28,927 | | | | 2,049,767 | | |
Corning, Inc. | | | 266,617 | | | | 3,362,040 | | |
FLIR Systems, Inc. | | | 27,066 | | | | 712,919 | | |
Jabil Circuit, Inc. | | | 33,747 | | | | 632,081 | | |
Molex, Inc. | | | 24,926 | | | | 690,700 | | |
TE Connectivity Ltd. | | | 76,236 | | | | 3,059,351 | | |
Total | | | | | 10,506,858 | | |
Internet Software & Services 2.3% | |
Akamai Technologies, Inc.(a) | | | 32,017 | | | | 1,183,348 | | |
eBay, Inc.(a) | | | 210,103 | | | | 11,488,432 | | |
Google, Inc., Class A(a) | | | 48,018 | | | | 38,472,022 | | |
VeriSign, Inc.(a) | | | 28,010 | | | | 1,282,858 | | |
Yahoo!, Inc.(a) | | | 187,765 | | | | 4,001,272 | | |
Total | | | | | 56,427,932 | | |
IT Services 3.7% | |
Accenture PLC, Class A | | | 115,196 | | | | 8,565,974 | | |
Automatic Data Processing, Inc. | | | 87,584 | | | | 5,374,154 | | |
Cognizant Technology Solutions Corp.,
Class A(a) | | | 54,158 | | | | 4,157,710 | | |
Computer Sciences Corp. | | | 28,030 | | | | 1,346,281 | | |
Fidelity National Information Services, Inc. | | | 44,962 | | | | 1,692,819 | | |
Fiserv, Inc.(a) | | | 24,080 | | | | 1,977,209 | | |
International Business Machines Corp. | | | 191,620 | | | | 38,483,045 | | |
Mastercard, Inc., Class A | | | 19,279 | | | | 9,983,052 | | |
Paychex, Inc. | | | 58,358 | | | | 1,931,650 | | |
SAIC, Inc. | | | 51,192 | | | | 605,089 | | |
Common Stocks (continued)
Issuer | | Shares | | Value ($) | |
Teradata Corp.(a) | | | 30,507 | | | | 1,771,236 | | |
Total System Services, Inc. | | | 28,988 | | | | 688,755 | | |
Visa, Inc., Class A | | | 94,051 | | | | 14,920,251 | | |
Western Union Co. (The) | | | 107,629 | | | | 1,510,035 | | |
Total | | | | | 93,007,260 | | |
Office Electronics 0.1% | |
Xerox Corp. | | | 227,975 | | | | 1,848,877 | | |
Semiconductors & Semiconductor Equipment 1.9% | |
Advanced Micro Devices, Inc.(a) | | | 109,176 | | | | 271,848 | | |
Altera Corp. | | | 57,835 | | | | 2,048,516 | | |
Analog Devices, Inc. | | | 54,368 | | | | 2,458,521 | | |
Applied Materials, Inc. | | | 216,070 | | | | 2,960,159 | | |
Broadcom Corp., Class A | | | 93,611 | | | | 3,193,071 | | |
First Solar, Inc.(a) | | | 10,834 | | | | 280,059 | | |
Intel Corp. | | | 897,721 | | | | 18,717,483 | | |
KLA-Tencor Corp. | | | 30,041 | | | | 1,645,045 | | |
Lam Research Corp.(a) | | | 29,312 | | | | 1,239,898 | | |
Linear Technology Corp. | | | 41,746 | | | | 1,596,367 | | |
LSI Corp.(a) | | | 99,840 | | | | 694,886 | | |
Microchip Technology, Inc. | | | 35,109 | | | | 1,280,425 | | |
Micron Technology, Inc.(a) | | | 183,578 | | | | 1,540,219 | | |
NVIDIA Corp. | | | 112,729 | | | | 1,427,149 | | |
Teradyne, Inc.(a) | | | 33,890 | | | | 567,996 | | |
Texas Instruments, Inc. | | | 202,204 | | | | 6,949,752 | | |
Xilinx, Inc. | | | 47,073 | | | | 1,754,411 | | |
Total | | | | | 48,625,805 | | |
Software 3.4% | |
Adobe Systems, Inc.(a) | | | 89,313 | | | | 3,510,001 | | |
Autodesk, Inc.(a) | | | 40,538 | | | | 1,488,555 | | |
BMC Software, Inc.(a) | | | 23,716 | | | | 950,300 | | |
CA, Inc. | | | 60,488 | | | | 1,481,351 | | |
Citrix Systems, Inc.(a) | | | 33,685 | | | | 2,388,267 | | |
Electronic Arts, Inc.(a) | | | 55,049 | | | | 965,009 | | |
Intuit, Inc. | | | 50,206 | | | | 3,237,283 | | |
Microsoft Corp. | | | 1,366,574 | | | | 37,990,757 | | |
Oracle Corp. | | | 678,137 | | | | 23,232,974 | | |
Red Hat, Inc.(a) | | | 34,878 | | | | 1,772,151 | | |
Salesforce.com, Inc.(a) | | | 23,569 | | | | 3,988,346 | | |
Symantec Corp.(a) | | | 125,187 | | | | 2,934,383 | | |
Total | | | | | 83,939,377 | | |
Total Information Technology | | | | | 445,175,435 | | |
The accompanying Notes to Financial Statements are an integral part of this statement.
Annual Report 2013
13
Columbia Large Cap Index Fund
Portfolio of Investments (continued)
February 28, 2013
Common Stocks (continued)
Issuer | | Shares | | Value ($) | |
Materials 3.4% | |
Chemicals 2.4% | |
Air Products & Chemicals, Inc. | | | 38,400 | | | | 3,315,456 | | |
Airgas, Inc. | | | 12,681 | | | | 1,271,651 | | |
CF Industries Holdings, Inc. | | | 11,343 | | | | 2,278,015 | | |
Dow Chemical Co. (The) | | | 216,354 | | | | 6,862,749 | | |
Eastman Chemical Co. | | | 27,669 | | | | 1,929,359 | | |
Ecolab, Inc. | | | 47,559 | | | | 3,640,641 | | |
EI du Pont de Nemours & Co. | | | 168,227 | | | | 8,058,073 | | |
FMC Corp. | | | 24,787 | | | | 1,493,665 | | |
International Flavors & Fragrances, Inc. | | | 14,715 | | | | 1,073,901 | | |
LyondellBasell Industries NV, Class A | | | 68,487 | | | | 4,014,708 | | |
Monsanto Co. | | | 96,447 | | | | 9,744,040 | | |
Mosaic Co. (The) | | | 49,915 | | | | 2,922,024 | | |
PPG Industries, Inc. | | | 25,766 | | | | 3,469,650 | | |
Praxair, Inc. | | | 53,605 | | | | 6,060,045 | | |
Sherwin-Williams Co. (The) | | | 15,439 | | | | 2,494,788 | | |
Sigma-Aldrich Corp. | | | 21,708 | | | | 1,672,819 | | |
Total | | | | | 60,301,584 | | |
Construction Materials 0.1% | |
Vulcan Materials Co. | | | 23,380 | | | | 1,190,743 | | |
Containers & Packaging 0.1% | |
Ball Corp. | | | 27,756 | | | | 1,232,644 | | |
Bemis Co., Inc. | | | 18,635 | | | | 695,831 | | |
Owens-Illinois, Inc.(a) | | | 29,683 | | | | 756,917 | | |
Sealed Air Corp. | | | 35,092 | | | | 779,393 | | |
Total | | | | | 3,464,785 | | |
Metals & Mining 0.6% | |
Alcoa, Inc. | | | 192,534 | | | | 1,640,390 | | |
Allegheny Technologies, Inc. | | | 19,361 | | | | 589,930 | | |
Cliffs Natural Resources, Inc. | | | 27,328 | | | | 695,771 | | |
Freeport-McMoRan Copper & Gold, Inc. | | | 171,267 | | | | 5,466,842 | | |
Newmont Mining Corp. | | | 89,562 | | | | 3,608,453 | | |
Nucor Corp. | | | 57,305 | | | | 2,581,590 | | |
United States Steel Corp. | | | 26,030 | | | | 542,465 | | |
Total | | | | | 15,125,441 | | |
Paper & Forest Products 0.2% | |
International Paper Co. | | | 79,226 | | | | 3,486,736 | | |
MeadWestvaco Corp. | | | 31,536 | | | | 1,126,151 | | |
Total | | | | | 4,612,887 | | |
Total Materials | | | | | 84,695,440 | | |
Common Stocks (continued)
Issuer | | Shares | | Value ($) | |
Telecommunication Services 2.9% | |
Diversified Telecommunication Services 2.6% | |
AT&T, Inc. | | | 1,024,730 | | | | 36,798,054 | | |
CenturyLink, Inc. | | | 112,624 | | | | 3,904,674 | | |
Frontier Communications Corp. | | | 180,130 | | | | 745,738 | | |
Verizon Communications, Inc. | | | 514,876 | | | | 23,957,180 | | |
Windstream Corp. | | | 106,104 | | | | 911,434 | | |
Total | | | | | 66,317,080 | | |
Wireless Telecommunication Services 0.3% | |
Crown Castle International Corp.(a) | | | 52,889 | | | | 3,691,652 | | |
MetroPCS Communications, Inc.(a) | | | 57,148 | | | | 560,050 | | |
Sprint Nextel Corp.(a) | | | 542,063 | | | | 3,143,966 | | |
Total | | | | | 7,395,668 | | |
Total Telecommunication Services | | | | | 73,712,748 | | |
Utilities 3.4% | |
Electric Utilities 1.9% | |
American Electric Power Co., Inc. | | | 87,544 | | | | 4,096,184 | | |
Duke Energy Corp. | | | 127,053 | | | | 8,798,420 | | |
Edison International | | | 58,780 | | | | 2,823,203 | | |
Entergy Corp. | | | 32,065 | | | | 1,996,367 | | |
Exelon Corp. | | | 154,121 | | | | 4,776,210 | | |
FirstEnergy Corp. | | | 75,450 | | | | 2,978,766 | | |
NextEra Energy, Inc. | | | 76,351 | | | | 5,487,346 | | |
Northeast Utilities | | | 56,638 | | | | 2,351,043 | | |
Pepco Holdings, Inc. | | | 41,399 | | | | 839,986 | | |
Pinnacle West Capital Corp. | | | 19,791 | | | | 1,107,109 | | |
PPL Corp. | | | 104,946 | | | | 3,234,436 | | |
Southern Co. (The) | | | 157,698 | | | | 7,097,987 | | |
Xcel Energy, Inc. | | | 87,972 | | | | 2,524,796 | | |
Total | | | | | 48,111,853 | | |
Gas Utilities 0.1% | |
AGL Resources, Inc. | | | 21,249 | | | | 849,110 | | |
ONEOK, Inc. | | | 36,914 | | | | 1,660,761 | | |
Total | | | | | 2,509,871 | | |
Independent Power Producers & Energy Traders 0.1% | |
AES Corp. (The) | | | 111,401 | | | | 1,294,480 | | |
NRG Energy, Inc. | | | 58,143 | | | | 1,395,432 | | |
Total | | | | | 2,689,912 | | |
The accompanying Notes to Financial Statements are an integral part of this statement.
Annual Report 2013
14
Columbia Large Cap Index Fund
Portfolio of Investments (continued)
February 28, 2013
Common Stocks (continued)
Issuer | | Shares | | Value ($) | |
Multi-Utilities 1.3% | |
Ameren Corp. | | | 43,774 | | | | 1,479,124 | | |
CenterPoint Energy, Inc. | | | 77,115 | | | | 1,652,574 | | |
CMS Energy Corp. | | | 47,611 | | | | 1,266,929 | | |
Consolidated Edison, Inc. | | | 52,837 | | | | 3,117,383 | | |
Dominion Resources, Inc. | | | 103,665 | | | | 5,805,240 | | |
DTE Energy Co. | | | 31,044 | | | | 2,073,739 | | |
Integrys Energy Group, Inc. | | | 14,055 | | | | 795,091 | | |
NiSource, Inc. | | | 55,883 | | | | 1,547,959 | | |
PG&E Corp. | | | 77,573 | | | | 3,307,713 | | |
Public Service Enterprise Group, Inc. | | | 91,273 | | | | 2,974,587 | | |
SCANA Corp. | | | 23,777 | | | | 1,161,269 | | |
Sempra Energy | | | 40,578 | | | | 3,155,345 | | |
TECO Energy, Inc. | | | 36,729 | | | | 633,575 | | |
Wisconsin Energy Corp. | | | 41,507 | | | | 1,714,239 | | |
Total | | | | | 30,684,767 | | |
Total Utilities | | | | | 83,996,403 | | |
Total Common Stocks
(Cost: $2,009,573,167) | | | | | 2,442,783,812 | | |
Money Market Funds 2.3%
| | | Shares | | Value ($) | |
Columbia Short-Term Cash Fund,
0.128%(d)(e) | | | 57,654,389 | | | | 57,654,389 | | |
Total Money Market Funds
(Cost: $57,654,389) | | | | | 57,654,389 | | |
Total Investments
(Cost: $2,067,227,556) | | | | | 2,500,438,201 | | |
Other Assets & Liabilities, Net | | | | | 5,179,865 | | |
Net Assets | | | | | 2,505,618,066 | | |
Investments in Derivatives
Futures Contracts Outstanding at February 28, 2013
Contract Description | | Number of
Contracts
Long (Short) | | Notional
Market
Value ($) | | Expiration
Date | | Unrealized
Appreciation ($) | | Unrealized
Depreciation ($) | |
S&P 500 Index | | | 165 | | | | 62,423,625 | | | March 2013 | | | 2,466,828 | | | | — | | |
Notes to Portfolio of Investments
(a) Non-income producing.
(b) At February 28, 2013, investments in securities included securities valued at $5,373,000 that were partially pledged as collateral to cover initial margin deposits on open stock index futures contracts.
(c) Identifies issues considered to be illiquid as to their marketability. The aggregate value of such securities at February 28, 2013 was $52, representing less than 0.01% of net assets. Information concerning such security holdings at February 28, 2013 is as follows:
Security Description | | Acquisition Dates | | Cost ($) | |
Five Star Quality Care, Inc. | | 01/02/02 | | | 2 | | |
Kinder Morgan Management LLC | | 09/26/02 - 05/20/08 | | | 14 | | |
The accompanying Notes to Financial Statements are an integral part of this statement.
Annual Report 2013
15
Columbia Large Cap Index Fund
Portfolio of Investments (continued)
February 28, 2013
Notes to Portfolio of Investments (continued)
(d) As defined in the Investment Company Act of 1940, an affiliated company is one in which the Fund owns 5% or more of its outstanding voting securities, or a company which is under common ownership or control with the Fund. Holdings and transactions in these affiliated companies during the year ended February 28, 2013, are as follows:
Issuer | | Beginning
Cost ($) | | Purchase
Cost ($) | | Proceeds
From Sales ($) | | Realized
Gain (Loss) ($) | | Ending
Cost ($) | | Capital Gain
Distributions ($) | | Dividends —
Affiliated
Issuers ($) | | Value ($) | |
Ameriprise
Financial, Inc. | | | 1,744,781 | | | | 70,930 | | | | (1,694,668 | ) | | | 1,038,285 | | | | 1,159,328 | | | | — | | | | 64,477 | | | | 2,548,301 | | |
Columbia
Short-Term
Cash Fund | | | 36,309,837 | | | | 377,788,598 | | | | (356,444,046 | ) | | | — | | | | 57,654,389 | | | | — | | | | 70,651 | | | | 57,654,389 | | |
Total | | | 38,054,618 | | | | 377,859,528 | | | | (358,138,714 | ) | | | 1,038,285 | | | | 58,813,717 | | | | — | | | | 135,128 | | | | 60,202,690 | | |
(e) The rate shown is the seven-day current annualized yield at February 28, 2013.
Fair Value Measurements
Generally accepted accounting principles (GAAP) require disclosure regarding the inputs and valuation techniques used to measure fair value and any changes in valuation inputs or techniques. In addition, investments shall be disclosed by major category.
The Fund categorizes its fair value measurements according to a three-level hierarchy that maximizes the use of observable inputs and minimizes the use of unobservable inputs by prioritizing that the most observable input be used when available. Observable inputs are those that market participants would use in pricing an investment based on market data obtained from sources independent of the reporting entity. Unobservable inputs are those that reflect the Fund's assumptions about the information market participants would use in pricing an investment. An investment's level within the fair value hierarchy is based on the lowest level of any input that is deemed significant to the asset or liability's fair value measurement. The input levels are not necessarily an indication of the risk or liquidity associated with investments at that level. For example, certain U.S. government securities are generally high quality and liquid, however, they are reflected as Level 2 because the inputs used to determine fair value may not always be quoted prices in an active market.
Fair value inputs are summarized in the three broad levels listed below:
> Level 1 — Valuations based on quoted prices for investments in active markets that the Fund has the ability to access at the measurement date (including NAV for open-end mutual funds). Valuation adjustments are not applied to Level 1 investments.
> Level 2 — Valuations based on other significant observable inputs (including quoted prices for similar securities, interest rates, prepayment speeds, credit risks, etc.).
> Level 3 — Valuations based on significant unobservable inputs (including the Fund's own assumptions and judgment in determining the fair value of investments).
Inputs that are used in determining fair value of an investment may include price information, credit data, volatility statistics, and other factors. These inputs can be either observable or unobservable. The availability of observable inputs can vary between investments, and is affected by various factors such as the type of investment, and the volume and level of activity for that investment or similar investments in the marketplace. The inputs will be considered by the Investment Manager, along with any other relevant factors in the calculation of an investment's fair value. The Fund uses prices and inputs that are current as of the measurement date, which may include periods of market dislocations. During these periods, the availability of prices and inputs may be reduced for many investments. This condition could cause an investment to be reclassified between the various levels within the hierarchy.
Investments falling into the Level 3 category are primarily supported by quoted prices from brokers and dealers participating in the market for those investments. However, these may be classified as Level 3 investments due to lack of market transparency and corroboration to support these quoted prices. Additionally, valuation models may be used as the pricing source for any remaining investments classified as Level 3. These models rely on one or more significant unobservable inputs and/or significant assumptions by the Investment Manager. Inputs used in valuations may include, but are not limited to, financial statement analysis, capital account balances, discount rates and estimated cash flows, and comparable company data.
Under the direction of the Fund's Board of Trustees (the Board), the Investment Manager's Valuation Committee (the Committee) is responsible for carrying out the valuation procedures approved by the Board. The Committee consists of voting and non-voting members from various groups within the Investment Manager's organization, including operations and accounting, trading and investments, compliance, risk management and legal.
The accompanying Notes to Financial Statements are an integral part of this statement.
Annual Report 2013
16
Columbia Large Cap Index Fund
Portfolio of Investments (continued)
February 28, 2013
Fair Value Measurements (continued)
The Committee meets at least monthly to review and approve valuation matters, which may include a description of specific valuation determinations, data regarding pricing information received from approved pricing vendors and brokers and the results of Board-approved valuation control policies and procedures (the Policies). The Policies address, among other things, instances when market quotations are readily available, including recommendations of third party pricing vendors and a determination of appropriate pricing methodologies; events that require specific valuation determinations and assessment of fair value techniques; securities with a potential for stale pricing, including those that are illiquid, restricted, or in default; and the effectiveness of third-party pricing vendors, including periodic reviews of vendors. The Committee meets more frequently, as needed, to discuss additional valuation matters, which may include the need to review back-testing results, review time-sensitive information or approve related valuation actions. The Committee reports to the Board, with members of the Committee meeting with the Board at each of its regularly scheduled meetings to discuss valuation matters and actions during the period, similar to those described earlier.
For investments categorized as Level 3, the Committee monitors information similar to that described above, which may include: (i) data specific to the issuer or comparable issuers, (ii) general market or specific sector news and (iii) quoted prices and specific or similar security transactions. The Committee considers this data and any changes from prior periods in order to assess the reasonableness of observable and unobservable inputs, any assumptions or internal models used to value those securities and changes in fair value. This data is also used to corroborate, when available, information received from approved pricing vendors and brokers. Various factors impact the frequency of monitoring this information (which may occur as often as daily). However, the Committee may determine that changes to inputs, assumptions and models are not required as a result of the monitoring procedures performed.
The following table is a summary of the inputs used to value the Fund's investments at February 28, 2013:
Description | | Level 1
Quoted Prices in Active
Markets for Identical
Assets ($) | |
Level 2
Other Significant
Observable Inputs ($) | |
Level 3
Significant
Unobservable Inputs ($) | |
Total ($) | |
Equity Securities | |
Common Stocks | |
Consumer Discretionary | | | 280,360,714 | | | | — | | | | — | | | | 280,360,714 | | |
Consumer Staples | | | 265,655,817 | | | | — | | | | — | | | | 265,655,817 | | |
Energy | | | 271,947,615 | | | | 50 | | | | — | | | | 271,947,665 | | |
Financials | | | 386,862,893 | | | | — | | | | — | | | | 386,862,893 | | |
Health Care | | | 299,461,318 | | | | 2 | | | | — | | | | 299,461,320 | | |
Industrials | | | 250,915,377 | | | | — | | | | — | | | | 250,915,377 | | |
Information Technology | | | 445,175,435 | | | | — | | | | — | | | | 445,175,435 | | |
Materials | | | 84,695,440 | | | | — | | | | — | | | | 84,695,440 | | |
Telecommunication Services | | | 73,712,748 | | | | — | | | | — | | | | 73,712,748 | | |
Utilities | | | 83,996,403 | | | | — | | | | — | | | | 83,996,403 | | |
Total Equity Securities | | | 2,442,783,760 | | | | 52 | | | | — | | | | 2,442,783,812 | | |
Other | |
Money Market Funds | | | 57,654,389 | | | | — | | | | — | | | | 57,654,389 | | |
Total Other | | | 57,654,389 | | | | — | | | | — | | | | 57,654,389 | | |
Investments in Securities | | | 2,500,438,149 | | | | 52 | | | | — | | | | 2,500,438,201 | | |
Derivatives | |
Assets | |
Futures Contracts | | | 2,466,828 | | | | — | | | | — | | | | 2,466,828 | | |
Total | | | 2,502,904,977 | | | | 52 | | | | — | | | | 2,502,905,029 | | |
See the Portfolio of Investments for all investment classifications not indicated in the table.
The Fund's assets assigned to the Level 2 input category are generally valued using the market approach, in which a security's value is determined through reference to prices and information from market transactions for similar or identical assets.
There were no transfers of financial assets between Levels 1 and 2 during the period.
Derivative instruments are valued at unrealized appreciation (depreciation).
The accompanying Notes to Financial Statements are an integral part of this statement.
Annual Report 2013
17
Columbia Large Cap Index Fund
Statement of Assets and Liabilities
February 28, 2013
Assets | |
Investments, at value | |
Unaffiliated issuers (identified cost $2,008,413,839) | | $ | 2,440,235,511 | | |
Affiliated issuers (identified cost $58,813,717) | | | 60,202,690 | | |
Total investments (identified cost $2,067,227,556) | | | 2,500,438,201 | | |
Receivable for: | |
Capital shares sold | | | 3,208,900 | | |
Dividends | | | 6,062,946 | | |
Expense reimbursement due from Investment Manager | | | 39 | | |
Total assets | | | 2,509,710,086 | | |
Liabilities | |
Payable for: | |
Investments purchased | | | 462,422 | | |
Capital shares purchased | | | 3,389,566 | | |
Variation margin on futures contracts | | | 109,596 | | |
Investment management fees | | | 6,874 | | |
Distribution and/or service fees | | | 3,744 | | |
Administration fees | | | 6,874 | | |
Compensation of board members | | | 111,103 | | |
Other expenses | | | 1,841 | | |
Total liabilities | | | 4,092,020 | | |
Net assets applicable to outstanding capital stock | | $ | 2,505,618,066 | | |
Represented by | |
Paid-in capital | | $ | 2,111,225,060 | | |
Undistributed net investment income | | | 6,887,066 | | |
Accumulated net realized loss | | | (48,171,533 | ) | |
Unrealized appreciation (depreciation) on: | |
Investments — unaffiliated issuers | | | 431,821,672 | | |
Investments — affiliated issuers | | | 1,388,973 | | |
Futures contracts | | | 2,466,828 | | |
Total — representing net assets applicable to outstanding capital stock | | $ | 2,505,618,066 | | |
The accompanying Notes to Financial Statements are an integral part of this statement.
Annual Report 2013
18
Columbia Large Cap Index Fund
Statement of Assets and Liabilities (continued)
February 28, 2013
Class A | |
Net assets | | $ | 544,127,810 | | |
Shares outstanding | | | 18,658,682 | | |
Net asset value per share | | $ | 29.16 | | |
Class B | |
Net assets | | $ | 426,316 | | |
Shares outstanding | | | 14,579 | | |
Net asset value per share | | $ | 29.24 | | |
Class I | |
Net assets | | $ | 3,022 | | |
Shares outstanding | | | 103 | | |
Net asset value per share(a) | | $ | 29.28 | | |
Class R5 | |
Net assets | | $ | 2,716 | | |
Shares outstanding | | | 92 | | |
Net asset value per share(a) | | $ | 29.63 | | |
Class Z | |
Net assets | | $ | 1,961,058,202 | | |
Shares outstanding | | | 66,980,821 | | |
Net asset value per share | | $ | 29.28 | | |
(a) Net asset value per share rounds to this amount due to fractional shares outstanding.
The accompanying Notes to Financial Statements are an integral part of this statement.
Annual Report 2013
19
Columbia Large Cap Index Fund
Statement of Operations
Year Ended February 28, 2013
Net investment income | |
Income: | |
Dividends — unaffiliated issuers | | $ | 56,712,430 | | |
Dividends — affiliated issuers | | | 135,128 | | |
Interest | | | 733 | | |
Income from securities lending — net | | | 123,691 | | |
Foreign taxes withheld | | | (43,127 | ) | |
Total income | | | 56,928,855 | | |
Expenses: | |
Investment management fees | | | 2,516,462 | | |
Distribution and/or service fees | |
Class A | | | 1,217,590 | | |
Class B | | | 7,465 | | |
Administration fees | | | 2,516,462 | | |
Compensation of board members | | | 76,845 | | |
Line of credit interest expense | | | 294 | | |
Other | | | 16,543 | | |
Total expenses | | | 6,351,661 | | |
Fees waived or expenses reimbursed by Investment Manager and its affiliates | | | (345,458 | ) | |
Expense reductions | | | (10,834 | ) | |
Total net expenses | | | 5,995,369 | | |
Net investment income | | | 50,933,486 | | |
Realized and unrealized gain (loss) — net | |
Net realized gain (loss) on: | |
Investments — unaffiliated issuers | | | 742,154,869 | | |
Investments — affiliated issuers | | | 1,038,285 | | |
Futures contracts | | | 3,852,413 | | |
Net realized gain | | | 747,045,567 | | |
Net change in unrealized appreciation (depreciation) on: | |
Investments — unaffiliated issuers | | | (468,345,687 | ) | |
Investments — affiliated issuers | | | (508,378 | ) | |
Futures contracts | | | 658,551 | | |
Net change in unrealized appreciation (depreciation) | | | (468,195,514 | ) | |
Net realized and unrealized gain | | | 278,850,053 | | |
Net increase in net assets resulting from operations | | $ | 329,783,539 | | |
The accompanying Notes to Financial Statements are an integral part of this statement.
Annual Report 2013
20
Columbia Large Cap Index Fund
Statement of Changes in Net Assets
| | | Year Ended
February 28,
2013(a) | | Year Ended
February 29,
2012(b) | |
Operations | |
Net investment income | | $ | 50,933,486 | | | $ | 64,443,247 | | |
Net realized gain | | | 747,045,567 | | | | 60,378,260 | | |
Net change in unrealized appreciation (depreciation) | | | (468,195,514 | ) | | | 51,935,406 | | |
Net increase in net assets resulting from operations | | | 329,783,539 | | | | 176,756,913 | | |
Distributions to shareholders | |
Net investment income | |
Class A | | | (10,203,246 | ) | | | (7,494,825 | ) | |
Class B | | | (7,896 | ) | | | (22,739 | ) | |
Class I | | | (66 | ) | | | (43 | ) | |
Class R5 | | | (50 | ) | | | — | | |
Class Z | | | (42,594,114 | ) | | | (57,569,836 | ) | |
Total distributions to shareholders | | | (52,805,372 | ) | | | (65,087,443 | ) | |
Increase (decrease) in net assets from capital stock activity | | | (1,393,088,952 | ) | | | 71,992,379 | | |
Total increase (decrease) in net assets | | | (1,116,110,785 | ) | | | 183,661,849 | | |
Net assets at beginning of year | | | 3,621,728,851 | | | | 3,438,067,002 | | |
Net assets at end of year | | $ | 2,505,618,066 | | | $ | 3,621,728,851 | | |
Undistributed net investment income | | $ | 6,887,066 | | | $ | 8,786,359 | | |
(a) Class R5 shares are for the period from November 8, 2012 (commencement of operations) to February 28, 2013.
(b) Class I shares are for the period from November 16, 2011 (commencement of operations) to February 29, 2012.
The accompanying Notes to Financial Statements are an integral part of this statement.
Annual Report 2013
21
Columbia Large Cap Index Fund
Statement of Changes in Net Assets (continued)
| | | Year Ended February 28, 2013(a) | | Year Ended February 29, 2012(b) | |
| | | Shares | | Dollars ($) | | Shares | | Dollars ($) | |
Capital stock activity | |
Class A shares | |
Subscriptions(c) | | | 6,742,663 | | | | 183,652,453 | | | | 6,905,904 | | | | 171,194,657 | | |
Fund merger | | | — | | | | — | | | | 787,315 | | | | 17,981,794 | | |
Distributions reinvested | | | 360,059 | | | | 9,790,803 | | | | 286,000 | | | | 6,919,883 | | |
Redemptions | | | (6,367,900 | ) | | | (171,641,000 | ) | | | (5,024,385 | ) | | | (124,351,906 | ) | |
Net increase | | | 734,822 | | | | 21,802,256 | | | | 2,954,834 | | | | 71,744,428 | | |
Class B shares | |
Subscriptions | | | 1,184 | | | | 31,844 | | | | 697 | | | | 16,731 | | |
Distributions reinvested | | | 212 | | | | 5,783 | | | | 399 | | | | 9,714 | | |
Redemptions(c) | | | (36,162 | ) | | | (975,990 | ) | | | (89,890 | ) | | | (2,230,876 | ) | |
Net decrease | | | (34,766 | ) | | | (938,363 | ) | | | (88,794 | ) | | | (2,204,431 | ) | |
Class I shares | |
Subscriptions | | | — | | | | — | | | | 103 | | | | 2,500 | | |
Net increase | | | — | | | | — | | | | 103 | | | | 2,500 | | |
Class R5 shares | |
Subscriptions | | | 92 | | | | 2,500 | | | | — | | | | — | | |
Net increase | | | 92 | | | | 2,500 | | | | — | | | | — | | |
Class Z shares | |
Subscriptions | | | 17,960,330 | | | | 489,325,782 | | | | 16,905,590 | | | | 420,417,150 | | |
Fund merger | | | — | | | | — | | | | 4,433,356 | | | | 101,748,793 | | |
Distributions reinvested | | | 1,139,550 | | | | 31,077,280 | | | | 1,929,052 | | | | 46,823,918 | | |
Redemptions | | | (71,115,547 | ) | | | (1,934,358,407 | ) | | | (22,903,786 | ) | | | (566,539,979 | ) | |
Net increase (decrease) | | | (52,015,667 | ) | | | (1,413,955,345 | ) | | | 364,212 | | | | 2,449,882 | | |
Total net increase (decrease) | | | (51,315,519 | ) | | | (1,393,088,952 | ) | | | 3,230,355 | | | | 71,992,379 | | |
(a) Class R5 shares are for the period from November 8, 2012 (commencement of operations) to February 28, 2013.
(b) Class I shares are for the period from November 16, 2011 (commencement of operations) to February 29, 2012.
(c) Includes conversions of Class B shares to Class A shares, if any.
The accompanying Notes to Financial Statements are an integral part of this statement.
Annual Report 2013
22
Columbia Large Cap Index Fund
The following tables are intended to help you understand the Fund's financial performance. Certain information reflects financial results for a single share of a class held for the periods shown. Per share net investment income (loss) amounts are calculated based on average shares outstanding during the period. Total return assumes reinvestment of all dividends and distributions, if any. Total return does not reflect payment of sales charges, if any, and is not annualized for periods of less than one year.
| | | Year Ended
February 28, | | Year Ended
February 29, | | Year Ended February 28, | |
Class A | | 2013 | | 2012 | | 2011 | | 2010 | | 2009 | |
Per share data | |
Net asset value, beginning of period | | $ | 26.35 | | | $ | 25.62 | | | $ | 21.30 | | | $ | 14.14 | | | $ | 25.64 | | |
Income from investment operations: | |
Net investment income | | | 0.50 | | | | 0.42 | | | | 0.37 | | | | 0.34 | | | | 0.45 | | |
Net realized and unrealized gain (loss) | | | 2.88 | | | | 0.74 | | | | 4.30 | | | | 7.15 | | | | (11.54 | ) | |
Total from investment operations | | | 3.38 | | | | 1.16 | | | | 4.67 | | | | 7.49 | | | | (11.09 | ) | |
Less distributions to shareholders: | |
Net investment income | | | (0.57 | ) | | | (0.43 | ) | | | (0.35 | ) | | | (0.33 | ) | | | (0.41 | ) | |
Total distributions to shareholders | | | (0.57 | ) | | | (0.43 | ) | | | (0.35 | ) | | | (0.33 | ) | | | (0.41 | ) | |
Proceeds from regulatory settlements | | | — | | | | — | | | | — | | | | 0.00 | (a) | | | — | | |
Net asset value, end of period | | $ | 29.16 | | | $ | 26.35 | | | $ | 25.62 | | | $ | 21.30 | | | $ | 14.14 | | |
Total return | | | 12.98 | % | | | 4.67 | % | | | 22.09 | % | | | 53.09 | % | | | (43.51 | %) | |
Ratios to average net assets(b)(c) | |
Total gross expenses | | | 0.45 | %(d) | | | 0.45 | % | | | 0.45 | % | | | 0.45 | %(d) | | | 0.45 | % | |
Total net expenses(e) | | | 0.44 | %(d)(f) | | | 0.42 | %(f) | | | 0.39 | % | | | 0.39 | %(d) | | | 0.39 | %(f) | |
Net investment income | | | 1.85 | % | | | 1.72 | % | | | 1.64 | % | | | 1.75 | % | | | 2.09 | % | |
Supplemental data | |
Net assets, end of period (in thousands) | | $ | 544,128 | | | $ | 472,381 | | | $ | 383,538 | | | $ | 268,091 | | | $ | 101,119 | | |
Portfolio turnover | | | 7 | % | | | 6 | % | | | 2 | % | | | 7 | % | | | 5 | % | |
Notes to Financial Highlights
(a) Rounds to zero.
(b) In addition to the fees and expenses which the Fund bears directly, the Fund indirectly bears a pro rata share of the fees and expenses of the acquired funds in which it invests. Such indirect expenses are not included in the reported expense ratios.
(c) Certain line items from prior years have been reclassified to conform to the current presentation.
(d) Ratios include line of credit interest expense which rounds to less than 0.01%.
(e) Total net expenses include the impact of certain waivers/reimbursements made by the Investment Manager and certain of its affiliates, if applicable.
(f) The benefits derived from expense reductions had an impact of less than 0.01%.
The accompanying Notes to Financial Statements are an integral part of this statement.
Annual Report 2013
23
Columbia Large Cap Index Fund
Financial Highlights (continued)
| | | Year Ended
February 28, | | Year Ended
February 29, | | Year Ended February 28, | |
Class B | | 2013 | | 2012 | | 2011 | | 2010 | | 2009 | |
Per share data | |
Net asset value, beginning of period | | $ | 26.44 | | | $ | 25.70 | | | $ | 21.37 | | | $ | 14.20 | | | $ | 25.70 | | |
Income from investment operations: | |
Net investment income | | | 0.28 | | | | 0.22 | | | | 0.20 | | | | 0.19 | | | | 0.28 | | |
Net realized and unrealized gain (loss) | | | 2.89 | | | | 0.76 | | | | 4.32 | | | | 7.18 | | | | (11.53 | ) | |
Total from investment operations | | | 3.17 | | | | 0.98 | | | | 4.52 | | | | 7.37 | | | | (11.25 | ) | |
Less distributions to shareholders: | |
Net investment income | | | (0.37 | ) | | | (0.24 | ) | | | (0.19 | ) | | | (0.20 | ) | | | (0.25 | ) | |
Total distributions to shareholders | | | (0.37 | ) | | | (0.24 | ) | | | (0.19 | ) | | | (0.20 | ) | | | (0.25 | ) | |
Proceeds from regulatory settlements | | | — | | | | — | | | | — | | | | 0.00 | (a) | | | — | | |
Net asset value, end of period | | $ | 29.24 | | | $ | 26.44 | | | $ | 25.70 | | | $ | 21.37 | | | $ | 14.20 | | |
Total return | | | 12.08 | % | | | 3.90 | % | | | 21.22 | % | | | 51.94 | % | | | (43.94 | %) | |
Ratios to average net assets(b)(c) | |
Total gross expenses | | | 1.20 | %(d) | | | 1.20 | % | | | 1.20 | % | | | 1.20 | %(d) | | | 1.20 | % | |
Total net expenses(e) | | | 1.18 | %(d)(f) | | | 1.17 | %(f) | | | 1.14 | % | | | 1.14 | %(d) | | | 1.14 | %(f) | |
Net investment income | | | 1.04 | % | | | 0.90 | % | | | 0.87 | % | | | 1.01 | % | | | 1.28 | % | |
Supplemental data | |
Net assets, end of period (in thousands) | | $ | 426 | | | $ | 1,305 | | | $ | 3,550 | | | $ | 3,769 | | | $ | 3,248 | | |
Portfolio turnover | | | 7 | % | | | 6 | % | | | 2 | % | | | 7 | % | | | 5 | % | |
Notes to Financial Highlights
(a) Rounds to zero.
(b) In addition to the fees and expenses which the Fund bears directly, the Fund indirectly bears a pro rata share of the fees and expenses of the acquired funds in which it invests. Such indirect expenses are not included in the reported expense ratios.
(c) Certain line items from prior years have been reclassified to conform to the current presentation.
(d) Ratios include line of credit interest expense which rounds to less than 0.01%.
(e) Total net expenses include the impact of certain waivers/reimbursements made by the Investment Manager and certain of its affiliates, if applicable.
(f) The benefits derived from expense reductions had an impact of less than 0.01%.
The accompanying Notes to Financial Statements are an integral part of this statement.
Annual Report 2013
24
Columbia Large Cap Index Fund
Financial Highlights (continued)
Class I | | Year Ended
February 28,
2013 | | Year Ended
February 29,
2012(a) | |
Per share data | |
Net asset value, beginning of period | | $ | 26.45 | | | $ | 24.22 | | |
Income from investment operations: | |
Net investment income | | | 0.57 | | | | 0.15 | | |
Net realized and unrealized gain | | | 2.89 | | | | 2.49 | | |
Total from investment operations | | | 3.46 | | | | 2.64 | | |
Less distributions to shareholders: | |
Net investment income | | | (0.63 | ) | | | (0.41 | ) | |
Total distributions to shareholders | | | (0.63 | ) | | | (0.41 | ) | |
Net asset value, end of period | | $ | 29.28 | | | $ | 26.45 | | |
Total return | | | 13.28 | % | | | 11.08 | % | |
Ratios to average net assets(b) | |
Total gross expenses | | | 0.22 | %(c) | | | 0.15 | %(d) | |
Total net expenses(e) | | | 0.19 | %(c) | | | 0.15 | %(d) | |
Net investment income | | | 2.09 | % | | | 2.06 | %(d) | |
Supplemental data | |
Net assets, end of period (in thousands) | | $ | 3 | | | $ | 3 | | |
Portfolio turnover | | | 7 | % | | | 6 | % | |
Notes to Financial Highlights
(a) For the period from November 16, 2011 (commencement of operations) to February 29, 2012.
(b) In addition to the fees and expenses which the Fund bears directly, the Fund indirectly bears a pro rata share of the fees and expenses of the acquired funds in which it invests. Such indirect expenses are not included in the reported expense ratios.
(c) Ratios include line of credit interest expense which rounds to less than 0.01%.
(d) Annualized.
(e) Total net expenses include the impact of certain waivers/reimbursements made by the Investment Manager and certain of its affiliates, if applicable.
The accompanying Notes to Financial Statements are an integral part of this statement.
Annual Report 2013
25
Columbia Large Cap Index Fund
Financial Highlights (continued)
Class R5 | | Year Ended
February 28,
2013(a) | |
Per share data | |
Net asset value, beginning of period | | $ | 27.28 | | |
Income from investment operations: | |
Net investment income | | | 0.21 | | |
Net realized and unrealized gain | | | 2.68 | | |
Total from investment operations | | | 2.89 | | |
Less distributions to shareholders: | |
Net investment income | | | (0.54 | ) | |
Total distributions to shareholders | | | (0.54 | ) | |
Net asset value, end of period | | $ | 29.63 | | |
Total return | | | 10.73 | % | |
Ratios to average net assets(b) | |
Total gross expenses | | | 0.14 | %(c) | |
Total net expenses(d) | | | 0.14 | %(c) | |
Net investment income | | | 2.48 | %(c) | |
Supplemental data | |
Net assets, end of period (in thousands) | | $ | 3 | | |
Portfolio turnover | | | 7 | % | |
Notes to Financial Highlights
(a) For the period from November 8, 2012 (commencement of operations) to February 28, 2013.
(b) In addition to the fees and expenses which the Fund bears directly, the Fund indirectly bears a pro rata share of the fees and expenses of the acquired funds in which it invests. Such indirect expenses are not included in the reported expense ratios.
(c) Annualized.
(d) Total net expenses include the impact of certain waivers/reimbursements made by the Investment Manager and certain of its affiliates, if applicable.
The accompanying Notes to Financial Statements are an integral part of this statement.
Annual Report 2013
26
Columbia Large Cap Index Fund
Financial Highlights (continued)
| | | Year Ended
February 28, | | Year Ended
February 29, | | Year Ended February 28, | |
Class Z | | 2013 | | 2012 | | 2011 | | 2010 | | 2009 | |
Per share data | |
Net asset value, beginning of period | | $ | 26.45 | | | $ | 25.72 | | | $ | 21.37 | | | $ | 14.18 | | | $ | 25.79 | | |
Income from investment operations: | |
Net investment income | | | 0.57 | | | | 0.48 | | | | 0.43 | | | | 0.38 | | | | 0.51 | | |
Net realized and unrealized gain (loss) | | | 2.89 | | | | 0.74 | | | | 4.33 | | | | 7.19 | | | | (11.59 | ) | |
Total from investment operations | | | 3.46 | | | | 1.22 | | | | 4.76 | | | | 7.57 | | | | (11.08 | ) | |
Less distributions to shareholders: | |
Net investment income | | | (0.63 | ) | | | (0.49 | ) | | | (0.41 | ) | | | (0.38 | ) | | | (0.53 | ) | |
Total distributions to shareholders | | | (0.63 | ) | | | (0.49 | ) | | | (0.41 | ) | | | (0.38 | ) | | | (0.53 | ) | |
Proceeds from regulatory settlements | | | — | | | | — | | | | — | | | | 0.00 | (a) | | | — | | |
Net asset value, end of period | | $ | 29.28 | | | $ | 26.45 | | | $ | 25.72 | | | $ | 21.37 | | | $ | 14.18 | | |
Total return | | | 13.28 | % | | | 4.91 | % | | | 22.44 | % | | | 53.49 | % | | | (43.37 | %) | |
Ratios to average net assets(b)(c) | |
Total gross expenses | | | 0.20 | %(d) | | | 0.20 | % | | | 0.20 | % | | | 0.20 | %(d) | | | 0.20 | % | |
Total net expenses(e) | | | 0.19 | %(d)(f) | | | 0.16 | %(f) | | | 0.14 | % | | | 0.14 | %(d) | | | 0.14 | %(f) | |
Net investment income | | | 2.06 | % | | | 1.95 | % | | | 1.88 | % | | | 2.00 | % | | | 2.31 | % | |
Supplemental data | |
Net assets, end of period (in thousands) | | $ | 1,961,058 | | | $ | 3,148,041 | | | $ | 3,050,979 | | | $ | 2,412,760 | | | $ | 1,359,555 | | |
Portfolio turnover | | | 7 | % | | | 6 | % | | | 2 | % | | | 7 | % | | | 5 | % | |
Notes to Financial Highlights
(a) Rounds to zero.
(b) In addition to the fees and expenses which the Fund bears directly, the Fund indirectly bears a pro rata share of the fees and expenses of the acquired funds in which it invests. Such indirect expenses are not included in the reported expense ratios.
(c) Certain line items from prior years have been reclassified to conform to the current presentation.
(d) Ratios include line of credit interest expense which rounds to less than 0.01%.
(e) Total net expenses include the impact of certain waivers/reimbursements made by the Investment Manager and certain of its affiliates, if applicable.
(f) The benefits derived from expense reductions had an impact of less than 0.01%.
The accompanying Notes to Financial Statements are an integral part of this statement.
Annual Report 2013
27
Columbia Large Cap Index Fund
Notes to Financial Statements
February 28, 2013
Note 1. Organization
Columbia Large Cap Index Fund (the Fund), a series of Columbia Funds Series Trust (the Trust), is a diversified fund. The Trust is registered under the Investment Company Act of 1940, as amended (the 1940 Act), as an open-end management investment company organized as a Delaware statutory trust.
Fund Shares
The Trust may issue an unlimited number of shares (without par value). The Fund offers Class A, Class B, Class I, Class R5 and Class Z shares. All share classes have identical voting, dividend and liquidation rights. Each share class has its own expense structure and sales charges, as applicable.
Class A shares have no sales charge.
Class B shares may be subject to a maximum CDSC of 5.00% based upon the holding period after purchase. Class B shares will generally convert to Class A shares eight years after purchase. The Fund no longer accepts investments by new or existing investors in the Fund's Class B shares, except in connection with the reinvestment of any dividend and/or capital gain distributions in Class B shares of the Fund and exchanges by existing Class B shareholders of certain other funds within the Columbia Family of Funds.
Class I shares are not subject to sales charges and are only available to the Columbia Family of Funds.
Class R5 shares are not subject to sales charges and are only available to investors purchasing through authorized investment professionals. Class R5 shares commenced operations on November 8, 2012.
Class Z shares are not subject to sales charges, and are only available to certain investors.
Note 2. Summary of Significant Accounting Policies
Use of Estimates
The preparation of financial statements in accordance with U.S. generally accepted accounting principles (GAAP) requires management to make certain estimates and assumptions that affect the reported amounts of assets and liabilities, the disclosure of contingent assets and liabilities at the date of the financial statements and the reported amounts of revenue and expenses during the reporting period. Actual results could differ from those estimates.
The following is a summary of significant accounting policies consistently followed by the Fund in the preparation of its financial statements.
Security Valuation
All equity securities are valued at the close of business of the New York Stock Exchange (NYSE). Equity securities are valued at the last quoted sales price on the principal exchange or market on which they trade, except for securities traded on the NASDAQ Stock Market, which are valued at the NASDAQ official close price. Unlisted securities or listed securities for which there were no sales during the day are valued at the mean of the latest quoted bid and ask prices on such exchanges or markets.
Foreign securities are valued based on quotations from the principal market in which such securities are normally traded. If any foreign share prices are not readily available as a result of limited share activity the securities are valued at the mean of the latest quoted bid and ask prices on such exchanges or markets. Foreign currency exchange rates are generally determined at 4:00 p.m. Eastern (U.S.) time. However, many securities markets and exchanges outside the U.S. close prior to the close of the NYSE; therefore, the closing prices for securities in such markets or on such exchanges may not fully reflect events that occur after such close but before the close of the NYSE. In those situations, foreign securities will be fair valued pursuant to the policy adopted by the Board of Trustees (the Board), including utilizing a third party pricing service to determine these fair values. The third party pricing service takes into account multiple factors, including, but not limited to, movements in the U.S. securities markets, certain depositary receipts, futures contracts and foreign exchange rates that have occurred subsequent to the close of the foreign exchange or market, to determine a good faith estimate that reasonably reflects the current market conditions as of the close of the NYSE. The fair value of a security is likely to be different from the quoted or published price, if available.
Investments in other open-end investment companies, including money market funds, are valued at net asset value.
Futures and options on futures contracts are valued based upon the settlement price established each day by the board of trade or exchange on which they are traded.
Investments for which market quotations are not readily available, or that have quotations which management believes are not reliable, are valued at fair value as determined in good faith under consistently applied procedures established by and under the general supervision of the Board. If a security or class of securities (such as foreign securities) is valued at fair value, such value is likely to be different from the last quoted market price for the security.
The determination of fair value often requires significant judgment. To determine fair value, management may use assumptions including but not limited to future cash flows and
Annual Report 2013
28
Columbia Large Cap Index Fund
Notes to Financial Statements (continued)
February 28, 2013
estimated risk premiums. Multiple inputs from various sources may be used to determine fair value.
Derivative Instruments
The Fund invests in certain derivative instruments, as detailed below, to meet its investment objectives. Derivatives are instruments whose values depend on, or are derived from, in whole or in part, the value of one or more other assets, such as securities, currencies, commodities or indices. Derivative instruments may be used to maintain cash reserves while maintaining exposure to certain other assets, to offset anticipated declines in values of investments, to facilitate trading, to reduce transaction costs and to pursue higher investment returns. The Fund may also use derivative instruments to mitigate certain investment risks, such as foreign currency exchange rate risk, interest rate risk and credit risk. Derivatives may involve various risks, including the potential inability of the counterparty to fulfill its obligation under the terms of the contract, the potential for an illiquid secondary market and the potential for market movements which may expose the Fund to gains or losses in excess of the amount shown in the Statement of Assets and Liabilities.
The Fund and any counterparty are required to maintain an agreement that requires the Fund and that counterparty to monitor (on a daily basis) the net fair value of all derivatives entered into pursuant to the agreement between the Fund and such counterparty. If the net fair value of such derivatives between the Fund and that counterparty exceeds a certain threshold (as defined in the agreement), the Fund or the counterparty (as the case may be) is required to post cash and/or securities as collateral. Fair values of derivatives presented in the financial statements are not netted with the fair value of other derivatives or with any collateral amounts posted by the Fund or any counterparty.
Futures Contracts
Futures contracts represent commitments for the future purchase or sale of an asset at a specified price on a specified date. The Fund bought and sold futures contracts to maintain appropriate equity market exposure while keeping sufficient cash to accommodate daily redemptions. Upon entering into futures contracts, the Fund bears risks which may include interest rates, exchange rates or securities prices moving unexpectedly, in which case, the Fund may not achieve the anticipated benefits of the futures contracts and may realize a loss. Additional risks include counterparty credit risk, the possibility of an illiquid market, and that a change in the value of the contract or option may not correlate with changes in the value of the underlying asset.
Upon entering into a futures contract, the Fund pledges cash or securities with the broker in an amount sufficient to meet the initial margin requirement. Subsequent payments (variation margin) are made or received by the Fund each day. The variation margin payments are equal to the daily change in the contract value and are recorded as variation margin receivable or payable and are offset in unrealized gains or losses. The Fund recognizes a realized gain or loss when the contract is closed or expires. Futures contracts involve, to varying degrees, risk of loss in excess of the variation margin disclosed in the Statement of Assets and Liabilities.
Effects of Derivative Transactions in the Financial Statements
The following tables are intended to provide additional information about the effect of derivatives on the financial statements of the Fund, including: the fair value of derivatives by risk category and the location of those fair values in the Statement of Assets and Liabilities; the impact of derivative transactions on the Fund's operations over the period including realized gains or losses and unrealized gains or losses. The derivative schedules following the Portfolio of Investments present additional information regarding derivative instruments outstanding at the end of the period, if any.
The following table is a summary of the fair value of derivative instruments at February 28, 2013:
Asset Derivatives | |
Risk Exposure
Category | | Statement of Assets
and Liabilities Location | | Fair Value ($) | |
Equity contracts | | Net assets — unrealized
appreciation on futures
contracts | | | 2,466,828* | | |
*Includes cumulative appreciation (depreciation) of futures contracts as reported in the Futures Contracts Outstanding table following the Portfolio of Investments. Only the current day's variation margin is reported in receivables or payables in the Statement of Assets and Liabilities.
The effect of derivative instruments in the Statement of Operations for the year ended February 28, 2013:
Amount of Realized Gain (Loss) on Derivatives Recognized in Income | |
Risk Exposure Category | | Futures Contracts ($) | |
Equity contracts | | | 3,852,413 | | |
Change in Unrealized Appreciation (Depreciation) on
Derivatives Recognized in Income | |
Risk Exposure Category | | Futures Contracts ($) | |
Equity contracts | | | 658,551 | | |
Annual Report 2013
29
Columbia Large Cap Index Fund
Notes to Financial Statements (continued)
February 28, 2013
The following table is a summary of the volume of derivative instruments for the year ended February 28, 2013:
Derivative Instrument | | Contracts Opened | |
Futures contracts | | | 1,607 | | |
Security Transactions
Security transactions are accounted for on the trade date. Cost is determined and gains (losses) are based upon the specific identification method for both financial statement and federal income tax purposes.
Income Recognition
Corporate actions and dividend income are recorded net of any non-reclaimable tax withholdings, on the ex-dividend date or upon receipt of ex-dividend notification in the case of certain foreign securities.
The Fund may receive distributions from holdings in business development companies (BDCs), exchange traded funds (ETFs) and real estate investment trusts (REITs), which report information on the character of their distributions annually. These distributions are allocated to dividend income, capital gain and return of capital based on estimates made by the Fund's management if actual information has not yet been reported. Return of capital is recorded as a reduction of the cost basis of securities held. If the Fund no longer owns the applicable securities, return of capital is recorded as a realized gain. Management's estimates are subsequently adjusted when the actual character of the distributions is disclosed by the BDCs, ETFs and REITs, which could result in a proportionate change in return of capital to shareholders.
Awards from class action litigation are recorded as a reduction of cost basis if the Fund still owns the applicable securities on the payment date. If the Fund no longer owns the applicable securities, the proceeds are recorded as realized gains.
Expenses
General expenses of the Trust are allocated to the Fund and other funds of the Trust based upon relative net assets or other expense allocation methodologies determined by the nature of the expense. Expenses directly attributable to the Fund are charged to the Fund. Expenses directly attributable to a specific class of shares are charged to that share class.
Determination of Class Net Asset Value
All income, expenses (other than class-specific expenses, which are charged to that share class, as shown in the Statement of Operations) and realized and unrealized gains (losses) are allocated to each class of the Fund on a daily basis, based on the relative net assets of each class, for purposes of determining the net asset value of each class.
Federal Income Tax Status
The Fund intends to qualify each year as a regulated investment company under Subchapter M of the Internal Revenue Code, as amended, and will distribute substantially all of its taxable income (including net short-term capital gains), if any, for its tax year, and as such will not be subject to federal income taxes. In addition, the Fund intends to distribute in each calendar year substantially all of its net investment income, capital gains and certain other amounts, if any, such that the Fund should not be subject to federal excise tax. Therefore, no federal income or excise tax provision is recorded.
Distributions to Shareholders
Distributions from net investment income, if any, are declared and paid semi-annually. Net realized capital gains, if any, are distributed at least annually. Income distributions and capital gain distributions are determined in accordance with federal income tax regulations, which may differ from GAAP.
Guarantees and Indemnifications
Under the Trust's organizational documents and, in some cases, by contract, its officers and trustees are indemnified against certain liabilities arising out of the performance of their duties to the Trust or its funds. In addition, certain of the Fund's contracts with its service providers contain general indemnification clauses. The Fund's maximum exposure under these arrangements is unknown since the amount of any future claims that may be made against the Fund cannot be determined, and the Fund has no historical basis for predicting the likelihood of any such claims.
Recent Accounting Pronouncement
Disclosures about Offsetting Assets and Liabilities
In December 2011, the Financial Accounting Standards Board (FASB) issued Accounting Standards Update (ASU) No. 2011-11, Disclosures about Offsetting Assets and Liabilities. The objective of the FASB is to enhance current disclosure requirements on offsetting of certain assets and liabilities and to enable financial statement users to compare financial statements prepared under GAAP and International Financial Reporting Standards.
Specifically, ASU No. 2011-11 requires an entity to disclose both gross and net information for derivatives and other financial instruments that are subject to a master netting arrangement or similar agreement. The standard requires disclosure of collateral received in connection with the master netting agreements or similar agreements. The effective date of ASU No. 2011-11 is for interim and annual periods beginning on or after January 1, 2013. At this time, management is evaluating the implications of this guidance
Annual Report 2013
30
Columbia Large Cap Index Fund
Notes to Financial Statements (continued)
February 28, 2013
and the impact it will have on the financial statement amounts and footnote disclosures, if any.
Note 3. Fees and Compensation Paid to Affiliates
Investment Management Fees
Under an Investment Management Services Agreement, Columbia Management Investment Advisers, LLC (the Investment Manager), a wholly-owned subsidiary of Ameriprise Financial, Inc. (Ameriprise Financial), determines which securities will be purchased, held or sold. The investment management fee is an annual fee that is equal to 0.10% of the Fund's average daily net assets.
Administration Fees
Under an Administrative Services Agreement, the Investment Manager also serves as the Fund Administrator. The Fund pays the Fund Administrator an annual fee for administration and accounting services equal to 0.10% of the Fund's average daily net assets.
The Investment Manager, from the administration fee it receives from the Fund, pays all operating expenses of the Fund, with the exception of brokerage fees and commissions, interest, fees and expenses of Trustees who are not officers, directors or employees of the Investment Manager or its affiliates, distribution (Rule 12b-1) and/or shareholder servicing fees and any extraordinary non-recurring expenses that may arise, including litigation.
Other Expenses
Other expenses are for, among other things, certain expenses of the Fund or the Board, including: Fund boardroom and office expense, employee compensation, employee health and retirement benefits, and certain other expenses. Payment of these Fund and Board expenses is facilitated by a company providing limited administrative services to the Fund and the Board. For the year ended February 28, 2013, other expenses paid to this company were $7,783.
Compensation of Board Members
Board members are compensated for their services to the Fund as disclosed in the Statement of Operations. Under a Deferred Compensation Plan (the Plan), the Board members who are not "interested persons" of the Fund, as defined under the 1940 Act, may elect to defer payment of up to 100% of their compensation. Deferred amounts are treated as though equivalent dollar amounts had been invested in shares of certain funds managed by the Investment Manager. The Fund's liability for these amounts is adjusted for market value changes and remains in the Fund until distributed in accordance with the Plan.
Transfer Agent Fees
Under a Transfer and Dividend Disbursing Agent Agreement, Columbia Management Investment Services Corp. (the Transfer Agent), an affiliate of the Investment Manager and a wholly-owned subsidiary of Ameriprise Financial, is responsible for providing transfer agency services to the Fund. The Transfer Agent has contracted with Boston Financial Data Services (BFDS) to serve as sub-transfer agent.
The transfer agent fees are payable by the Investment Manager. The Transfer Agent pays the fees of BFDS for services as sub-transfer agent and is not entitled to reimbursement for such fees from the Fund. The Transfer Agent also receives compensation from fees for various shareholder services and reimbursements for certain out-of-pocket fees.
An annual minimum account balance fee of $20 may apply to certain accounts with a value below the Fund's initial minimum investment requirements to reduce the impact of small accounts on transfer agent fees. These minimum account balance fees are recorded as part of expense reductions in the Statement of Operations. For the year ended February 28, 2013, these minimum account balance fees reduced total expenses by $10,834.
Distribution and Service Fees
The Fund has an agreement with Columbia Management Investment Distributors, Inc. (the Distributor), an affiliate of the Investment Manager and a wholly-owned subsidiary of Ameriprise Financial, for distribution and shareholder services. Pursuant to Rule 12b-1 under the 1940 Act, the Board has approved, and the Fund has adopted, distribution and shareholder service plans (the Plans) which set the distribution and service fees for the Fund. These fees are calculated daily and are intended to compensate the Distributor and/or eligible selling and/or servicing agents for selling shares of the Fund and providing services to investors.
The Plans require the payment of a monthly combined distribution and service fee to the Distributor at the maximum annual rate of 0.25% of the average daily net assets attributable to Class A shares of the Fund. The Plans also require the payment of a monthly service fee and a monthly distribution fee at the maximum annual rates of 0.25% and 0.75%, respectively, of the average daily net assets attributable to Class B shares of the Fund.
Sales Charges
Sales charges, including front-end charges and CDSCs, received by the Distributor for distributing Fund shares were $289 for Class B shares for the year ended February 28, 2013.
Annual Report 2013
31
Columbia Large Cap Index Fund
Notes to Financial Statements (continued)
February 28, 2013
Expenses Waived/Reimbursed by the Investment Manager and its Affiliates
Effective July 1, 2012, the Investment Manager and certain of its affiliates have contractually agreed to waive fees and/or reimburse expenses (excluding certain fees and expenses described below), through June 30, 2013, unless sooner terminated at the sole discretion of the Board, so that the Fund's net operating expenses, after giving effect to fees waived/expenses reimbursed and any balance credits and/or overdraft charges from the Fund's custodian, do not exceed the following annual rates as a percentage of the class' average daily net assets:
Class A | | | 0.45 | % | |
Class B | | | 1.20 | | |
Class I | | | 0.20 | | |
Class R5* | | | 0.20 | | |
Class Z | | | 0.20 | | |
*Annual rate is contractual from November 8, 2012 (commencement of operations of Class R5 shares) through November 8, 2013.
Prior to July 1, 2012, the Investment Manager and certain of its affiliates contractually agreed to waive fees and/or reimburse expenses (excluding certain fees and expenses described below), so that the Fund's net operating expenses, after giving effect to fees waived/expenses reimbursed and any balance credits and/or overdraft charges from the Fund's custodian, did not exceed the following annual rates as a percentage of the class' average daily net assets:
Class A | | | 0.42 | % | |
Class B | | | 1.17 | | |
Class I | | | 0.17 | | |
Class Z | | | 0.17 | | |
Under the agreement, the following fees and expenses are excluded from the waiver/reimbursement commitment, and therefore will be paid by the Fund, if applicable: taxes (including foreign transaction taxes), expenses associated with investments in affiliated and non-affiliated pooled investment vehicles (including mutual funds and exchange traded funds), transaction costs and brokerage commissions, costs related to any securities lending program, dividend expenses associated with securities sold short, inverse floater program fees and expenses, transaction charges and interest on borrowed money, interest, extraordinary expenses and any other expenses the exclusion of which is specifically approved by the Board. This agreement may be modified or amended only with approval from all parties.
Note 4. Federal Tax Information
The timing and character of income and capital gain distributions are determined in accordance with income tax regulations, which may differ from GAAP because of temporary or permanent book to tax differences.
At February 28, 2013, these differences are primarily due to differing treatment for capital loss carryforwards, deferral/reversal of wash sales losses, Trustees' deferred compensation, re-characterization of distributions for investments, reversal of capital gains (losses) on a redemption-in-kind and derivative investments. To the extent these differences are permanent, reclassifications are made among the components of the Fund's net assets in the Statement of Assets and Liabilities. Temporary differences do not require reclassifications. In the Statement of Assets and Liabilities the following reclassifications were made:
Undistributed net investment income | | $ | (27,407 | ) | |
Accumulated net realized loss | | | (639,665,088 | ) | |
Paid-in capital | | | 639,692,495 | | |
Net investment income and net realized gains (losses), as disclosed in the Statement of Operations, and net assets were not affected by this reclassification.
The tax character of distributions paid during the years indicated was as follows:
| Year Ended | | February 28,
2013 ($) | | February 29,
2012 ($) | |
Ordinary income | | | 52,805,372 | | | | 65,087,443 | | |
Short-term capital gain distributions, if any, are considered ordinary income distributions for tax purposes.
At February 28, 2013, the components of distributable earnings on a tax basis were as follows:
Undistributed ordinary income | | $ | 6,968,817 | | |
Accumulated realized loss | | | (12,602,870 | ) | |
Unrealized appreciation | | | 400,266,593 | | |
At February 28, 2013, the cost of investments for federal income tax purposes was $2,100,171,608 and the aggregate gross unrealized appreciation and depreciation based on that cost was:
Unrealized appreciation | | $ | 737,125,725 | | |
Unrealized depreciation | | | (336,859,132 | ) | |
Net unrealized appreciation | | $ | 400,266,593 | | |
The following capital loss carryforward, determined at February 28, 2013, may be available to reduce taxable income
Annual Report 2013
32
Columbia Large Cap Index Fund
Notes to Financial Statements (continued)
February 28, 2013
arising from future net realized gains on investments, if any, to the extent permitted by the Internal Revenue Code:
Year of Expiration | | Amount ($) | |
2017 | | 12,602,870 | |
For the year ended February 28, 2013, $92,811,226 of capital loss carryforward was utilized.
Management of the Fund has concluded that there are no significant uncertain tax positions that would require recognition in the financial statements. However, management's conclusion may be subject to review and adjustment at a later date based on factors including, but not limited to, new tax laws, regulations, and administrative interpretations (including relevant court decisions). Generally, the Fund's federal tax returns for the prior three fiscal years remain subject to examination by the Internal Revenue Service.
Note 5. Portfolio Information
The cost of purchases and proceeds from sales of securities, excluding short-term obligations, aggregated to $161,295,995 and $1,562,125,177, respectively, for the year ended February 28, 2013.
Note 6. Redemption-in-Kind
Sales of securities for the Fund include the value of securities delivered through an in-kind redemption of certain fund shares. During the year ended February 28, 2013, securities and other assets with a value of $1,269,715,794 were distributed to shareholders to satisfy their redemption requests. The net realized gain on these securities was $652,210,537, which is not taxable to remaining shareholders in the Fund.
Note 7. Lending of Portfolio Securities
Effective December 19, 2012, the Fund no longer participates in securities lending activity. Prior to that date, the Fund participated, or was eligible to participate, in securities lending activity pursuant to a Master Securities Lending Agreement (the Agreement) with JPMorgan Chase Bank, N.A. (JPMorgan). The Agreement authorized JPMorgan as lending agent to lend securities to authorized borrowers in order to generate additional income on behalf of the Fund. Pursuant to the Agreement, the securities loaned were secured by cash or securities that either were issued or guaranteed as to principal and interest by the U.S. government, its agencies, authorities or instrumentalities with value equal to at least 100% of the market value of the loaned securities. Any additional collateral required to maintain those levels due to market fluctuations of the loaned securities was requested to be delivered the following business day. Cash collateral received was invested
by the lending agent on behalf of the Fund into authorized investments pursuant to the Agreement.
Pursuant to the Agreement, the Fund received income for lending its securities either in the form of fees or by earning interest on invested cash collateral, net of negotiated rebates paid to borrowers and fees paid to the lending agent for services provided and any other securities lending expenses. Net income earned from securities lending for the year ended February 28, 2013 is disclosed in the Statement of Operations. The Fund continued to earn and accrue interest and dividends on the securities loaned.
Note 8. Affiliated Money Market Fund
The Fund invests its daily cash balances in Columbia Short-Term Cash Fund, an affiliated money market fund established for the exclusive use by the Fund and other affiliated funds. The income earned by the Fund from such investments is included as "Dividends — affiliated issuers" in the Statement of Operations. As an investing fund, the Fund indirectly bears its proportionate share of the expenses of Columbia Short-Term Cash Fund.
Note 9. Shareholder Concentration
At February 28, 2013, one unaffiliated shareholder account owned 18.9% of the outstanding shares of the Fund. The Fund has no knowledge about whether any portion of those shares was owned beneficially by such account. Subscription and redemption activity by concentrated accounts may have a significant effect on the operations of the Fund.
Note 10. Line of Credit
The Fund has entered into a revolving credit facility with a syndicate of banks led by JPMorgan whereby the Fund may borrow for the temporary funding of shareholder redemptions or for other temporary or emergency purposes. The credit facility agreement, as amended, which is a collective agreement between the Fund and certain other funds managed by the Investment Manager, severally and not jointly, permits collective borrowings up to $500 million. Interest is charged to each participating fund based on its borrowings at a rate equal to the higher of (i) the overnight federal funds rate plus 1.00% or (ii) the one-month LIBOR rate plus 1.00%. Each borrowing under the credit facility matures no later than 60 days after the date of borrowing. The Fund also pays a commitment fee equal to its pro rata share of the amount of the credit facility at a rate of 0.08% per annum.
For the year ended February 28, 2013, the average daily loan balance outstanding on days when borrowing existed was $4,350,000 at a weighted average interest rate of 1.22%.
Annual Report 2013
33
Columbia Large Cap Index Fund
Notes to Financial Statements (continued)
February 28, 2013
Note 11. Fund Merger
At the close of business on August 12, 2011 the Fund acquired the assets and assumed the identified liabilities of RiverSource S&P 500 Index Fund, a series of RiverSource Market Advantage Series, Inc. The reorganization was completed after shareholders of RiverSource S&P 500 Index Fund approved a plan of reorganization on April 27, 2011. The purpose of the transaction was to combine two funds managed by the Investment Manager with comparable investment objectives and strategies.
The aggregate net assets of the Fund immediately before the acquisition were $3,045,750,893 and the combined net assets immediately after the acquisition were $3,165,481,480.
The merger was accomplished by a tax-free exchange of 30,883,112 shares of RiverSource S&P 500 Index Fund valued at $119,730,587 (including $7,017,237 of unrealized appreciation).
In exchange for RiverSource S&P 500 Index Fund shares, the Fund issued the following number of shares:
| | Shares | |
Class A | | | 787,315 | | |
Class Z | | | 4,433,356 | | |
For financial reporting purposes, net assets received and shares issued by the Fund were recorded at fair value; however, RiverSource S&P 500 Index Fund's cost of investments was carried forward.
The financial statements reflect the operations of the Fund for the period prior to the merger and the combined fund for the period subsequent to the merger. Because the combined investment portfolios have been managed as a single integrated portfolio since the merger was completed, it is not practicable to separate the amounts of revenue and earnings of RiverSource S&P 500 Index Fund that have been included in the combined Fund's Statement of Operations since the merger was completed.
Assuming the merger had been completed on March 1, 2011, the Fund's pro-forma net investment income, net gain on investments, net change in unrealized appreciation and net increase in net assets from operations for the year ended February 29, 2012 would have been approximately $66.0 million, $64.3 million, $32.0 million and $162.3 million, respectively.
Note 12. Subsequent Events
Management has evaluated the events and transactions that have occurred through the date the financial statements were
issued and noted no items requiring adjustment of the financial statements or additional disclosure.
Note 13. Information Regarding Pending and Settled Legal Proceedings
In December 2005, without admitting or denying the allegations, American Express Financial Corporation (AEFC, which is now known as Ameriprise Financial, Inc. (Ameriprise Financial)) entered into settlement agreements with the Securities and Exchange Commission (SEC) and Minnesota Department of Commerce (MDOC) related to market timing activities. As a result, AEFC was censured and ordered to cease and desist from committing or causing any violations of certain provisions of the Investment Advisers Act of 1940, the Investment Company Act of 1940, and various Minnesota laws. AEFC agreed to pay disgorgement of $10 million and civil money penalties of $7 million. AEFC also agreed to retain an independent distribution consultant to assist in developing a plan for distribution of all disgorgement and civil penalties ordered by the SEC in accordance with various undertakings detailed at www.sec.gov/litigation/admin/ia-2451.pdf. Ameriprise Financial and its affiliates have cooperated with the SEC and the MDOC in these legal proceedings, and have made regular reports to the funds' Boards of Trustees.
Ameriprise Financial and certain of its affiliates have historically been involved in a number of legal, arbitration and regulatory proceedings, including routine litigation, class actions, and governmental actions, concerning matters arising in connection with the conduct of their business activities. Ameriprise Financial believes that the Funds are not currently the subject of, and that neither Ameriprise Financial nor any of its affiliates are the subject of, any pending legal, arbitration or regulatory proceedings that are likely to have a material adverse effect on the Funds or the ability of Ameriprise Financial or its affiliates to perform under their contracts with the Funds. Ameriprise Financial is required to make 10-Q, 10-K and, as necessary, 8-K filings with the Securities and Exchange Commission on legal and regulatory matters that relate to Ameriprise Financial and its affiliates. Copies of these filings may be obtained by accessing the SEC website at www.sec.gov.
There can be no assurance that these matters, or the adverse publicity associated with them, will not result in increased fund redemptions, reduced sale of fund shares or other adverse consequences to the Funds. Further, although we believe proceedings are not likely to have a material adverse effect on the Funds or the ability of Ameriprise Financial or its affiliates to perform under their contracts with the Funds, these proceedings are subject to uncertainties and, as such, we are unable to estimate the possible loss or range of loss that may result. An adverse outcome in one or more of these proceedings could result in adverse judgments, settlements,
Annual Report 2013
34
Columbia Large Cap Index Fund
Notes to Financial Statements (continued)
February 28, 2013
fines, penalties or other relief that could have a material adverse effect on the consolidated financial condition or results of operations of Ameriprise Financial.
Annual Report 2013
35
Columbia Large Cap Index Fund
Report of Independent Registered Public Accounting Firm
To the Trustees of Columbia Funds Series Trust and
the Shareholders of Columbia Large Cap Index Fund
In our opinion, the accompanying statement of assets and liabilities, including the portfolio of investments, and the related statements of operations and of changes in net assets and the financial highlights present fairly, in all material respects, the financial position of Columbia Large Cap Index Fund (the "Fund") (a series of Columbia Funds Series Trust) at February 28, 2013, the results of its operations for the year then ended, the changes in its net assets for each of the two years in the period then ended and the financial highlights for each of the periods indicated, in conformity with accounting principles generally accepted in the United States of America. These financial statements and financial highlights (hereafter referred to as "financial statements") are the responsibility of the Fund's management. Our responsibility is to express an opinion on these financial statements based on our audits. We conducted our audits of these financial statements in accordance with the standards of the Public Company Accounting Oversight Board (United States). Those standards require that we plan and perform the audit to obtain reasonable assurance about whether the financial statements are free of material misstatement. An audit includes examining, on a test basis, evidence supporting the amounts and disclosures in the financial statements, assessing the accounting principles used and significant estimates made by management, and evaluating the overall financial statement presentation. We believe that our audits, which included confirmation of securities at February 28, 2013 by correspondence with the custodian, transfer agent and brokers, provide a reasonable basis for our opinion.
PricewaterhouseCoopers LLP
Minneapolis, Minnesota
April 19, 2013
Annual Report 2013
36
Columbia Large Cap Index Fund
Federal Income Tax Information
(Unaudited)
The Fund hereby designates the following tax attributes for in the fiscal year ended February 28, 2013. Shareholders will be notified in early 2014 of the amounts for use in preparing 2013 income tax returns.
Tax Designations:
| Qualified Dividend Income | | | 100.00 | % | |
| Dividends Received Deduction | | | 100.00 | % | |
Qualified Dividend Income. For taxable, non-corporate shareholders, the percentage of ordinary income dividends paid during the fiscal year that represents qualified dividend income subject to reduced tax rates under the Jobs and Growth Tax Relief Reconciliation Act of 2003.
Dividends Received Deduction. The percentage of ordinary income dividends paid during the fiscal year that qualifies for the corporate dividends received deduction.
Annual Report 2013
37
Columbia Large Cap Index Fund
Shareholders elect the Board that oversees the funds' operations. The Board appoints officers who are responsible for day-to-day business decisions based on policies set by the Board. The following table provides basic biographical information about the funds' Board members, including their principal occupations during the past five years, although specific titles for individuals may have varied over the period. Under current Board policy, members may serve until the next Board meeting after he or she reaches the mandatory retirement age established by the Board, or the fifteenth anniversary of the first Board meeting they attended as a member of the Board.
Mr. Edward J. Boudreau, Jr., Mr. William P. Carmichael, Mr. William A. Hawkins, Mr. R. Glenn Hilliard, Ms. Minor M. Shaw and Dr. Anthony M. Santomero, were members of the Legacy Columbia Nations funds' Board ("Nations Funds"), which includes Columbia Funds Series Trust, Columbia Funds Variable Insurance Trust I and Columbia Funds Master Investment Trust, LLC and began service on the Board for the Legacy RiverSource funds ("RiverSource Funds") effective June 1, 2011.
Independent Trustees
Name,
Address,
Year of Birth | | Position Held With
Funds and Length of
Service | | Principal Occupation
During Past Five Years | | Number of
Funds in the
Fund Family
Overseen by
Board Member | | Other Present or Past
Directorships/Trusteeships
(Within Past 5 Years) | |
Kathleen Blatz
901 S. Marquette Ave.
Minneapolis, MN 55402
1954 | | Board member since 1/06 for RiverSource Funds and since 6/11 for Nations Funds | | Attorney; Chief Justice, Minnesota Supreme Court, 1998-2006 | | | 153 | | | Director, BlueCross BlueShield of Minnesota since 2009 | |
Edward J. Boudreau, Jr.
901 S. Marquette Ave.
Minneapolis, MN 55402
1944 | | Board member since 6/11 for RiverSource Funds and since 1/05 for Nations Funds | | Managing Director, E.J. Boudreau & Associates (consulting) since 2000 | | | 151 | | | Former Trustee, BofA Funds Series Trust (11 funds) | |
Pamela G. Carlton
901 S. Marquette Ave.
Minneapolis, MN 55402
1954 | | Board member since 7/07 for RiverSource Funds and since 6/11 for Nations Funds | | President, Springboard — Partners in Cross Cultural Leadership (consulting company) since 2003 | | | 153 | | | None | |
William P. Carmichael
901 S. Marquette Ave.
Minneapolis, MN 55402
1943 | | Board member since 6/11 for RiverSource Funds and since 1999 for Nations Funds | | Retired | | | 151 | | | Director, Cobra Electronics Corporation (electronic equipment manufacturer); The Finish Line (athletic shoes and apparel) since July 2003; McMoRan Exploration Company (oil and gas exploration and development) since 2010; former Trustee, BofA Funds Series Trust (11 funds); former Director, Spectrum Brands, Inc. (consumer products); former Director, Simmons Company (bedding) | |
Patricia M. Flynn
901 S. Marquette Ave.
Minneapolis, MN 55402
1950 | | Board member since 11/04 for RiverSource Funds and since 6/11 for Nations Funds | | Trustee Professor of Economics and Management, Bentley University since 1976 | | | 153 | | | None | |
William A. Hawkins
901 S. Marquette Ave.
Minneapolis, MN 55402
1942 | | Board member since 6/11 for RiverSource Funds and since 1/05 for Nations Funds | | Managing Director, Overton Partners (financial consulting), since August 2010; President and Chief Executive Officer, California General Bank, N.A., January 2008-August 2010 | | | 151 | | | Trustee, BofA Funds Series Trust (11 funds) | |
Annual Report 2013
38
Columbia Large Cap Index Fund
Trustees and Officers (continued)
Independent Trustees (continued)
Name,
Address,
Year of Birth | | Position Held With
Funds and Length of
Service | | Principal Occupation
During Past Five Years | | Number of
Funds in the
Fund Family
Overseen by
Board Member | | Other Present or Past
Directorships/Trusteeships
(Within Past 5 Years) | |
R. Glenn Hilliard
901 S. Marquette Ave.
Minneapolis, MN 55402
1943 | | Board member since 6/11 for RiverSource Funds and since 1/05 for Nations Funds | | Chairman and Chief Executive Officer, Hilliard Group LLC (investing and consulting), since April 2003; Non-Executive Director & Chairman, CNO Financial Group, Inc. (insurance), September 2003-May 2011 | | | 151 | | | Chairman, BofA Fund Series Trust (11 funds); former Director, CNO Financial Group, Inc. (insurance) | |
Stephen R. Lewis, Jr.
901 S. Marquette Ave.
Minneapolis, MN 55402
1939 | | Chair of the Board for RiverSource Funds since 1/07, Board member for RiverSource Funds since 1/02 and since 6/11 for Nations Funds | | President Emeritus and Professor of Economics Emeritus, Carleton College since 2002 | | | 153 | | | Director, Valmont Industries, Inc. (manufacturer of irrigation systems) since 2002 | |
Catherine James Paglia
901 S. Marquette Ave.
Minneapolis, MN 55402
1952 | | Board member since 11/04 for RiverSource Funds and since 6/11 for Nations Funds | | Director, Enterprise Asset Management, Inc. (private real estate and asset management company) | | | 153 | | | Director, Valmont Industries, Inc. (manufacturer of irrigation systems) since 2012 | |
Leroy C. Richie
901 S. Marquette Ave.
Minneapolis, MN 55402
1941 | | Board member since 2000 for Legacy Seligman Funds, since 11/08 for RiverSource Funds and since 6/11 for Nations Funds | | Counsel, Lewis & Munday, P.C. (law firm) since 2004; former Vice President and General Counsel, Automotive Legal Affairs, Chrysler Corporation from 1983-1987 | | | 153 | | | Lead Outside Director, Digital Ally, Inc. (digital imaging) since September 2005; Director, Infinity, Inc. (oil and gas exploration and production) since 1994; Director, OGE Energy Corp. (energy and energy services) since November 2007 | |
Minor M. Shaw
901 S. Marquette Ave.
Minneapolis, MN 55402
1947 | | Board member since 6/11 for RiverSource Funds and since 2003 for Nations Funds | | President, Micco LLC (private investments) since 2011; President Micco Corp. since 1998 | | | 151 | | | Director, Piedmont Natural Gas; Director, BlueCross BlueShield of South Carolina since April 2008; Former Trustee, BofA Funds Series Trust (11 funds) | |
Alison Taunton-Rigby
901 S. Marquette Ave.
Minneapolis, MN 55402
1944 | | Board member since 11/02 for RiverSource Funds and since 6/11 for Nations Funds | | Chief Executive Officer and Director, RiboNovix, Inc., (biotechnology), 2003-2010 | | | 153 | | | Director, Healthways, Inc. (health and well-being improvement) since 2005; Director, ICI Mutual Insurance Company, RRG since 2011; Director, Abt Associates (government contractor) since 2001; Director, Boston Children's Hospital since 2002 | |
Annual Report 2013
39
Columbia Large Cap Index Fund
Trustees and Officers (continued)
Interested Trustee Not Affiliated With Investment Manager*
Name,
Address,
Year of Birth | | Position Held With
Funds and Length of
Service | | Principal Occupation
During Past Five Years | | Number of
Funds in the
Fund Family
Overseen by
Board Member | | Other Present or Past
Directorships/Trusteeships
(Within Past 5 Years) | |
Anthony M. Santomero
901 S. Marquette Ave.
Minneapolis, MN 55402
1946 | | Board member since 6/11 for RiverSource Funds and since 1/08 for Nations Funds | | Richard K. Mellon Professor Emeritus of Finance, The Wharton School, University of Pennsylvania, since 2002; Senior Advisor, McKinsey & Company (consulting), 2006-2008 | | | 151 | | | Director, Renaissance Reinsurance Ltd. since May 2008; Trustee, Penn Mutual Life Insurance Company since March 2008; Director, Citigroup since 2009; Director, Citibank, N.A. since 2009; former Trustee, BofA Funds Series Trust (11 funds) | |
*Dr. Santomero is not an affiliated person of the investment manager or Ameriprise Financial. However, he is currently deemed by the funds to be an "interested person" (as defined in the 1940 Act) of the funds because he serves as a Director of Citigroup, Inc. and Citibank N.A., companies that may directly or through subsidiaries and affiliates engage from time-to-time in brokerage execution, principal transactions and lending relationships with the funds or accounts advised/managed by the investment manager.
Interested Trustee Affiliated With Investment Manager*
Name,
Address,
Year of Birth | | Position Held With
Funds and Length of
Service | | Principal Occupation
During Past Five Years | | Number of
Funds in the
Fund Family
Overseen by
Board Member | | Other Present or Past
Directorships/Trusteeships
(Within Past 5 Years) | |
William F. Truscott
53600 Ameriprise
Financial Center
Minneapolis, MN 55474
1960 | | Board member since 11/01 for RiverSource Funds and since 6/11 for Nations Funds; Senior Vice President since 2002 for RiverSource Funds and 5/10 for Nations Funds | | President, Columbia Management Investment Advisers, LLC since February 2012, (previously President, Chairman of the Board and Chief Investment Officer, 2001-April 2010); Chief Executive Officer, Global Asset Management, Ameriprise Financial, Inc. since September 2012 (previously Chief Executive Officer, U.S. Asset Management & President, Annuities, May 2010-September 2012 and President — U.S. Asset Management and Chief Investment Officer, 2005-April 2010); Chief Executive Officer, Columbia Management Investment Distributors, Inc. since February 2012, (previously Chairman of the Board and Chief Executive Officer, 2006-April 2010); Chairman of the Board and Chief Executive Officer, RiverSource Distributors, Inc. since 2006; President and Chief Executive Officer, Ameriprise Certificate Company 2006-August 2012 | | | 210 | | | Chairman of the Board, Columbia Management Investment Advisers, LLC since May 2010; Director, Columbia Management Investment Distributors, Inc. since May 2010; Director, Ameriprise Certificate Company, 2006-January 2013 | |
*Interested person (as defined under the 1940 Act) by reason of being an officer, director, security holder and/or employee of the investment manager or Ameriprise Financial.
The SAI has additional information about the Fund's Board members and is available, without charge, upon request by calling 800.345.6611; contacting your financial intermediary; or visiting columbiamanagement.com.
Annual Report 2013
40
Columbia Large Cap Index Fund
Trustees and Officers (continued)
The Board has appointed officers who are responsible for day-to-day business decisions based on policies it has established. The officers serve at the pleasure of the Board. In addition to Mr. Truscott, who is Senior Vice President, the funds' other officers are:
Officers
Name,
Address,
Year of Birth | | Position Held With
Funds and Length of
Service | | Principal Occupation During Past Five Years | |
J. Kevin Connaughton
225 Franklin Street
Boston, MA 02110
1964 | | President and Principal Executive Officer since 5/10 for RiverSource Funds and 2009 for Nations Funds | | Senior Vice President and General Manager — Mutual Fund Products, Columbia Management Investment Advisers, LLC since May 2010; Managing Director of Columbia Management Advisors, LLC, December 2004-April 2010; Senior Vice President and Chief Financial Officer, Columbia Funds, June 2008-January 2009; Treasurer, Columbia Funds, October 2003-May 2008 | |
Amy K. Johnson
5228 Ameriprise Financial Center Minneapolis, MN 55474
1965 | | Vice President since 12/06 for RiverSource Funds and 5/10 for Nations Funds | | Senior Vice President and Chief Operating Officer, Columbia Management Investment Advisers, LLC since May 2010 (previously Chief Administrative Officer, 2009-April 2010 and Vice President — Asset Management and Trust Company Services, 2006-2009) | |
Michael G. Clarke
225 Franklin Street
Boston, MA 02110
1969 | | Treasurer since 1/11 and Chief Financial Officer since 4/11 for RiverSource Funds and Treasurer since 3/11 and Chief Financial Officer since 2009 for Nations Funds | | Vice President, Columbia Management Investment Advisers, LLC since May 2010; Managing Director of Fund Administration, Columbia Management Advisors, LLC, September 2004-April 2010; senior officer of Columbia Funds and affiliated funds since 2002 | |
Scott R. Plummer
5228 Ameriprise Financial Center Minneapolis, MN 55474
1959 | | Senior Vice President and Chief Legal Officer since 12/06 and Assistant Secretary since 6/11 for RiverSource Funds and Senior Vice President and Chief Legal Officer since 5/10 and Assistant Secretary since 6/11 for Nations Funds | | Senior Vice President, Chief Legal Officer and Assistant Secretary, Columbia Management Investment Advisers, LLC since June 2005; Vice President and Lead Chief Counsel — Asset Management, Ameriprise Financial, Inc. since May 2010 (previously Vice President and Chief Counsel — Asset Management, 2005-April 2010); Vice President, Chief Counsel and Assistant Secretary, Columbia Management Investment Distributors, Inc. since 2008; Vice President, General Counsel and Secretary, Ameriprise Certificate Company since 2005; Chief Counsel, RiverSource Distributors, Inc. since 2006 | |
Colin Moore
225 Franklin Street
Boston, MA 02110
1958 | | Senior Vice President since 5/10 for RiverSource Funds and Nations Funds | | Director and Chief Investment Officer, Columbia Management Investment Advisers, LLC since May 2010; Manager, Managing Director and Chief Investment Officer, Columbia Management Advisors, LLC, 2007-April 2010 | |
Thomas P. McGuire
225 Franklin Street
Boston, MA 02110
1972 | | Chief Compliance Officer since 3/12 | | Vice President — Asset Management Compliance, Columbia Management Investment Advisers, LLC since 2010; Chief Compliance Officer, Ameriprise Certificate Company since September 2010; Compliance Executive, Bank of America, 2005-2010 | |
Stephen T. Welsh
225 Franklin Street
Boston, MA 02110
1957 | | Vice President since 4/11 for RiverSource Funds and 2006 for Nations Funds | | President and Director, Columbia Management Investment Services Corp. since May 2010; President and Director, Columbia Management Services, Inc., July 2004- April 2010; Managing Director, Columbia Management Distributors, Inc., August 2007-April 2010 | |
Christopher O. Petersen
5228 Ameriprise Financial Center Minneapolis, MN 55474
1970 | | Vice President and Secretary since 4/11 for RiverSource Funds and 3/11 for Nations Funds | | Vice President and Chief Counsel, Ameriprise Financial, Inc. since January 2010 (formerly Vice President and Group Counsel or Counsel, April 2004-January 2010); Assistant Secretary of Legacy RiverSource Funds, January 2007-April 2011 and of the Nations Funds, May 2010-March 2011 | |
Annual Report 2013
41
Columbia Large Cap Index Fund
Trustees and Officers (continued)
Officers (continued)
Name,
Address,
Year of Birth | | Position Held With
Funds and Length of
Service | | Principal Occupation During Past Five Years | |
Paul D. Pearson
10468 Ameriprise Financial Center Minneapolis, MN 55474
1956 | | Vice President since 4/11 and Assistant Treasurer since 1999 for RiverSource Funds and Vice President and Assistant Treasurer since 6/11 for Nations Funds | | Vice President — Investment Accounting, Columbia Management Investment Advisers, LLC, since May 2010; Vice President — Managed Assets, Investment Accounting, Ameriprise Financial Corporation, February 1998-May 2010 | |
Joseph F. DiMaria
225 Franklin Street
Boston, MA 02110
1968 | | Vice President and Chief Accounting Officer since 4/11 and Vice President since 3/11 and Chief Accounting Officer since 2008 for Nations Funds | | Vice President, Mutual Fund Administration, Columbia Management Investment Advisers, LLC, since May 2010; Director of Fund Administration, Columbia Management Advisors, LLC, January 2006-April 2010 | |
Paul B. Goucher
100 Park Avenue
New York, NY 10017
1968 | | Vice President since 4/11 and Assistant Secretary since 11/08 for RiverSource Funds and 5/10 for Nations Funds | | Vice President and Lead Chief Counsel, Ameriprise Financial, Inc. since November 2008 and January 2013, respectively (formerly, Chief Counsel, January 2010-January 2013 and Group Counsel from November 2008- January 2010); Director, Managing Director and General Counsel, J. & W. Seligman & Co. Incorporated, July 2008-November 2008 (previously, Managing Director and Associate General Counsel, January 2005-July 2008) | |
Michael E. DeFao
225 Franklin Street
Boston, MA 02110
1968 | | Vice President since 4/11 and Assistant Secretary since 5/10 for RiverSource Funds and 2011 for Nations Funds | | Vice President and Chief Counsel, Ameriprise Financial, Inc. since May 2010; Associate General Counsel, Bank of America, June 2005-April 2010 | |
Annual Report 2013
42
This page intentionally left blank.
Annual Report 2013
43
This page intentionally left blank.
Annual Report 2013
44
Columbia Large Cap Index Fund
Important Information About This Report
Each fund mails one shareholder report to each shareholder address. If you would like more than one report, please call shareholder services at 800.345.6611 and additional reports will be sent to you.
The policy of the Board is to vote the proxies of the companies in which each fund holds investments consistent with the procedures as stated in the Statement of Additional Information (SAI). You may obtain a copy of the SAI without charge by calling 800.345.6611; contacting your financial intermediary; visiting columbiamanagement.com; or searching the website of the Securities and Exchange Commission (SEC) at sec.gov. Information regarding how each fund voted proxies relating to portfolio securities is filed with the SEC by August 31 for the most recent 12-month period ending June 30 of that year, and is available without charge by visiting columbiamanagement.com; or searching the website of the SEC at sec.gov.
Each fund files a complete schedule of portfolio holdings with the SEC for the first and third quarters of each fiscal year on Form N-Q. Each fund's Form N-Q is available on the SEC's website at sec.gov and may be reviewed and copied at the SEC's Public Reference Room in Washington, D.C. Information on the operation of the Public Reference Room may be obtained by calling 800.SEC.0330. Each fund's complete schedule of portfolio holdings, as filed on Form N-Q, can also be obtained without charge, upon request, by calling 800.345.6611.
Annual Report 2013
45

Columbia Large Cap Index Fund
P.O. Box 8081
Boston, MA 02266-8081
columbiamanagement.com
This information is for use with concurrent or prior delivery of a fund prospectus. Please read and consider the investment objectives, risks, charges and expenses for any fund carefully before investing. For a prospectus which contains this and other important information about the Fund go to columbiamanagement.com. The Fund is distributed by Columbia Management Investment Distributors, Inc., member FINRA, and managed by Columbia Management Investment Advisers, LLC.
© 2013 Columbia Management Investment Advisers, LLC. All rights reserved.
ANN175_02_C01_(04/13)
Annual Report
February 28, 2013

Columbia Marsico 21st Century Fund
Not FDIC insured • No bank guarantee • May lose value
Columbia Marsico 21st Century Fund
 Dear Shareholders,
U.S. stocks flat, foreign markets strong in 2012 finale
After a strong third quarter, U.S. stock market averages treaded water as the year 2012 came to a close. However, they ended the year up strongly, as first- and third-quarter gains more than offset second- and fourth-quarter weakness. Typically a strong quarter for domestic small- and mid-cap issues, the fourth quarter of 2012 indeed proved to be another year-end positive for small-cap stocks. For the full calendar year 2012, the S&P 500 Index rose 16.00%.
Stock markets outside the United States generated some of the best returns for the fourth quarter, as optimism rebounded, thanks to the September actions of the European Central Bank in support of the euro and an improving outlook from China. Both developed and emerging foreign markets topped U.S. stocks by a solid margin.
Corporate and emerging markets led fixed income
Fixed-income investors took their cue from the equity markets and continued to favor the highest risk sectors through the end of 2012. Global fixed-income returns posted mixed results in the final quarter of the year. Gains were the highest for corporate high-yield and emerging market bonds. Although investors remained cautious ahead of the year-end budget negotiations, better economic data and a further improvement in the European sovereign debt crisis supported riskier assets and depressed government bond prices. In December, the Federal Reserve announced its intention to continue to purchase both Treasury and mortgage-backed securities and said that it would seek to keep short-term interest rates unchanged until the unemployment rate reaches 6.5%, or inflation turned noticeably higher.
Stay on track with Columbia Management
Backed by more than 100 years of experience, Columbia Management is one of the nation's largest asset managers. At the heart of our success — and, most importantly, that of our investors — are highly talented industry professionals, brought together by a unique way of working. We are dedicated to helping you take advantage of today's opportunities and anticipate tomorrow's. We stay abreast of the latest investment trends and ideas, using our collective insight to evaluate events and transform them into solutions you can use.
Visit columbiamanagement.com for:
> The Columbia Management Perspectives blog, featuring timely posts by our investment teams
> Detailed up-to-date fund performance and portfolio information
> Economic analysis and market commentary
> Quarterly fund commentaries
> Columbia Management Investor, our award-winning quarterly newsletter for shareholders
Thank you for your continued support of the Columbia Funds. We look forward to serving your investment needs for many years to come.
Best Regards,

J. Kevin Connaughton
President, Columbia Funds
The S&P 500 Index, an unmanaged index, measures the performance of 500 widely held, large-capitalization U.S. stocks and is frequently used as a general measure of market performance. Indices are not available for investment, are not professionally managed and do not reflect sales charges, fees, brokerage commissions, taxes or other expenses of investing.
Investors should consider the investment objectives, risks, charges and expenses of a mutual fund carefully before investing. For a free prospectus, which contains this and other important information about a fund, visit columbiamanagement.com. The prospectus should be read carefully before investing.
Columbia Funds are distributed by Columbia Management Investment Distributors, Inc., member FINRA, and managed by Columbia Management Investment Advisers, LLC.
© 2013 Columbia Management Investment Advisers, LLC. All rights reserved.
Columbia Marsico 21st Century Fund
Performance Overview | | | 2 | | |
Manager Discussion of Fund Performance | | | 4 | | |
Understanding Your Fund's Expenses | | | 6 | | |
Portfolio of Investments | | | 7 | | |
Statement of Assets and Liabilities | | | 11 | | |
Statement of Operations | | | 13 | | |
Statement of Changes in Net Assets | | | 14 | | |
Financial Highlights | | | 16 | | |
Notes to Financial Statements | | | 22 | | |
Report of Independent Registered
Public Accounting Firm | | | 29 | | |
Federal Income Tax Information | | | 30 | | |
Trustees and Officers | | | 31 | | |
Important Information About This Report | | | 37 | | |
Fund Investment Manager
Columbia Management Investment
Advisers, LLC
225 Franklin Street
Boston, MA 02110
Fund Distributor
Columbia Management Investment
Distributors, Inc.
225 Franklin Street
Boston, MA 02110
Fund Transfer Agent
Columbia Management Investment
Services Corp.
P.O. Box 8081
Boston, MA 02266-8081
For more information about any of the funds, please visit columbiamanagement.com or call 800.345.6611. Customer Service Representatives are available to answer your questions Monday through Friday from 8 a.m. to 8 p.m. Eastern time.
The views expressed in this report reflect the current views of the respective parties. These views are not guarantees of future performance and involve certain risks, uncertainties and assumptions that are difficult to predict, so actual outcomes and results may differ significantly from the views expressed. These views are subject to change at any time based upon economic, market or other conditions and the respective parties disclaim any responsibility to update such views. These views may not be relied on as investment advice and, because investment decisions for a Columbia Fund are based on numerous factors, may not be relied on as an indication of trading intent on behalf of any particular Columbia Fund. References to specific securities should not be construed as a recommendation or investment advice.
Columbia Marsico 21st Century Fund
Performance Summary
> Columbia Marsico 21st Century Fund (the Fund) Class A shares returned 6.74% excluding sales charges for the 12-month period that ended February 28, 2013.
> The Fund underperformed its benchmark, the Russell 3000 Index, which returned 13.65% for the same 12-month period.
> Stock selection and sector allocations both detracted from Fund results relative to the benchmark during the period.
Average Annual Total Returns (%) (for period ended February 28, 2013)
| | Inception | | 1 Year | | 5 Years | | 10 Years | |
Class A | | 04/10/00 | | | | | | | | | | | | | |
Excluding sales charges | | | | | | | 6.74 | | | | -0.57 | | | | 9.46 | | |
Including sales charges | | | | | | | 0.59 | | | | -1.74 | | | | 8.81 | | |
Class B | | 04/10/00 | | | | | | | | | | | | | |
Excluding sales charges | | | | | | | 5.96 | | | | -1.30 | | | | 8.65 | | |
Including sales charges | | | | | | | 0.96 | | | | -1.70 | | | | 8.65 | | |
Class C | | 04/10/00 | | | | | | | | | | | | | |
Excluding sales charges | | | | | | | 5.96 | | | | -1.30 | | | | 8.65 | | |
Including sales charges | | | | | | | 4.96 | | | | -1.30 | | | | 8.65 | | |
Class R* | | 01/23/06 | | | 6.48 | | | | -0.81 | | | | 9.19 | | |
Class R4* | | 11/08/12 | | | 6.84 | | | | -0.55 | | | | 9.47 | | |
Class Z | | 04/10/00 | | | 7.09 | | | | -0.31 | | | | 9.75 | | |
Russell 3000 Index | | | | | | | 13.65 | | | | 5.38 | | | | 8.85 | | |
Returns for Class A are shown with and without the maximum initial sales charge of 5.75%. Returns for Class B are shown with and without the applicable contingent deferred sales charge (CDSC) of 5.00% in the first year, declining to 1.00% in the sixth year and eliminated thereafter. Returns for Class C are shown with and without the 1.00% CDSC for the first year only. The Fund's other classes are not subject to sales charges and have limited eligibility. Please see the Fund's prospectuses for details. Performance for different share classes will vary based on differences in sales charges and fees associated with each class. All results shown assume reinvestment of distributions during the period. Returns do not reflect the deduction of taxes that a shareholder may pay on Fund distributions or on the redemption of Fund shares. Performance results reflect the effect of any fee waivers or reimbursements of Fund expenses by Columbia Management Investment Advisers, LLC and/or any of its affiliates. Absent these fee waivers or expense reimbursement arrangements, performance results would have been lower.
The performance information shown represents past performance and is not a guarantee of future results. The investment return and principal value of your investment will fluctuate so that your shares, when redeemed, may be worth more or less than their original cost. Current performance may be lower or higher than the performance information shown. You may obtain performance information current to the most recent month-end by contacting your financial intermediary, visiting columbiamanagement.com or calling 800.345.6611.
*The returns shown for periods prior to the share class inception date (including returns for the Life of the Fund, if shown, which are since Fund inception) include the returns of the Fund's oldest share class. Since the Fund launched more than one share class at its inception, Class A shares were used. These returns are adjusted to reflect any higher class-related operating expenses of the newer share classes, as applicable. Please visit columbiamanagement.com/mutual-funds/appended-performance for more information.
The Russell 3000 Index, an unmanaged index, measures the performance of the 3,000 largest U.S. companies based on total market capitalization, which represents approximately 98% of the investable U.S. equity market.
Indices are not available for investment, are not professionally managed and do not reflect sales charges, fees, brokerage commissions, taxes or other expenses of investing. Securities in the Fund may not match those in an index.
Annual Report 2013
2
Columbia Marsico 21st Century Fund
Performance Overview (continued)
Performance of a Hypothetical $10,000 Investment (March 1, 2003 – February 28, 2013)
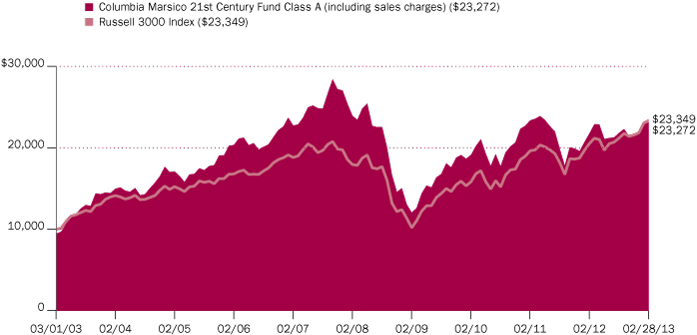
The chart above shows the change in value of a hypothetical $10,000 investment in Class A shares of Columbia Marsico 21st Century Fund during the stated time period, and does not reflect the deduction of taxes that a shareholder may pay on Fund distributions or on the redemption of Fund shares.
Annual Report 2013
3
Columbia Marsico 21st Century Fund
Manager Discussion of Fund Performance
For the 12-month period that ended February 28, 2013, the Fund's Class A shares returned 6.74% excluding sales charges. The Fund's return for the period was lower than the 13.65% return of its benchmark, the Russell 3000 Index. Underweight allocations and stock selection in the financials and consumer staples sectors, plus stock selection within the consumer discretionary and energy sectors generally accounted for the Fund's underperformance during the period. An overweight allocation to the strong-performing consumer discretionary sector, plus stock selection in materials aided results.
Stock Selection in Several Sectors Hurt Results
The financials sector was a strong performer in the Russell 3000 Index, and Fund performance was hurt both by having an underweight in financials and by stock selection in the sector as well. PNC Financial Services Group had a negative return and Capital One Financial significantly lagged the benchmark's financials sector. PNC Financial Services Group was sold from the Fund. Several holdings in the consumer discretionary sector (which was a good performing sector overall) also disappointed. Restaurants Chipotle Mexican Grill and Arcos Dorados Holdings (a Latin American McDonald's franchisee) each posted double-digit declines. The latter was sold from the portfolio. Apparel firm Ralph Lauren, online travel reservations firm priceline.com and automobile component company Borg Warner posted weak returns. Borg Warner was sold prior to period-end.
Selected energy and technology positions also hurt performance. Energy firms National Oilwell Varco and Occidental Petroleum, and software firms VMware and Bankrate disappointed and were sold from the Fund.
Consumer Discretionary Holdings, Overweight Aided Results
The consumer discretionary sector was a strong performer within the Russell 3000 Index, and the Fund benefited from having a significant portion of assets allocated to that sector. In the materials sector, agricultural materials company Monsanto (the second largest holding at period end) and LyondellBasell Industries were strong contributors to performance. Biotechnology company and top holding Biogen Idec and consulting and technology services firm Accenture also had strong price gains.
Looking Ahead
Overall, we currently think the U.S. and international economic picture is generally improving. Large capitalization stocks are presently trading at reasonable valuations. However, serious fiscal challenges remain, both in the United States and abroad. Uncertainty about government economic policy is currently high and we believe additional tax hikes and spending cuts are likely. The question is whether this fiscal tightening can be done in a balanced and sensible manner. A major policy misstep could have profound repercussions for the economy.
Still, we believe there is currently significant pent-up demand for vehicles, houses, travel and leisure activities and corporate capital spending. If this demand is unleashed, we believe it may have a beneficial impact on job growth and corporate profits.
Portfolio Management
Marsico Capital Management, LLC
Brandon Geisler
Morningstar Style BoxTM

The Morningstar Style BoxTM is based on a fund's portfolio holdings. For equity funds, the vertical axis shows the market capitalization of the stocks owned, and the horizontal axis shows investment style (value, blend, or growth). Information shown is based on the most recent data provided by Morningstar.
© 2013 Morningstar, Inc. All rights reserved. The Morningstar information contained herein: (1) is proprietary to Morningstar and/or its content providers; (2) may not be copied or distributed; and (3) is not warranted to be accurate, complete or timely. Neither Morningstar nor its content providers are responsible for any damages or losses arising from any use of this information.
Annual Report 2013
4
Columbia Marsico 21st Century Fund
Manager Discussion of Fund Performance (continued)
Against this backdrop, we are currently emphasizing companies that we believe have a high degree of earnings visibility, unleveraged balance sheets and are buying back stock and increasing dividends. There are several themes at work in the Fund. It currently has a significant consumer discretionary exposure, with many of the positions being more staple-like in nature, meaning they offer needed rather than wanted products and services. We are also currently focusing on health care, particularly pharmaceuticals. A number of drug companies offer robust new product pipelines for unmet clinical needs. Other themes include recoveries in U.S. housing, manufacturing and automobiles. We think the U.S. manufacturing sector has the potential to benefit from an inexpensive and growing supply of natural gas that provides a significant cost advantage.
During the period, we increased the Fund's allocation to the industrials, health care and consumer staples sectors. We reduced the Fund's allocations to the energy, information technology and financial sectors. At period end, the Fund's sector allocations emphasized consumer discretionary, industrials, information technology and health care. It had no investments in the utilities or telecommunication services sectors.
Top Ten Holdings (%)
(at February 28, 2013) | |
Biogen Idec, Inc. | | | 4.1 | | |
Monsanto Co. | | | 3.4 | | |
Lowe's Companies, Inc. | | | 3.4 | | |
Gilead Sciences, Inc. | | | 3.2 | | |
Precision Castparts Corp. | | | 3.1 | | |
Google, Inc., Class A | | | 3.0 | | |
McDonald's Corp. | | | 2.9 | | |
Intuitive Surgical, Inc. | | | 2.8 | | |
WW Grainger, Inc. | | | 2.7 | | |
Mastercard, Inc., Class A | | | 2.6 | | |
Percentages indicated are based upon total investments (excluding Money Market Funds).
For further detail about these holdings, please refer to the section entitled "Portfolio of Investments."
Fund holdings are as of the date given, are subject to change at any time, and are not recommendations to buy or sell any security.
Portfolio Breakdown (%)
(at February 28, 2013) | |
Common Stocks | | | 97.7 | | |
Consumer Discretionary | | | 25.3 | | |
Consumer Staples | | | 5.4 | | |
Energy | | | 3.4 | | |
Financials | | | 9.0 | | |
Health Care | | | 13.1 | | |
Industrials | | | 20.9 | | |
Information Technology | | | 15.4 | | |
Materials | | | 5.2 | | |
Money Market Funds | | | 2.3 | | |
Total | | | 100.0 | | |
Percentages indicated are based upon total investments. The Fund's portfolio composition is subject to change.
Annual Report 2013
5
Columbia Marsico 21st Century Fund
Understanding Your Fund's Expenses
(Unaudited)
As an investor, you incur two types of costs. There are transaction costs, which generally include sales charges on purchases and may include redemption fees. There are also ongoing costs, which generally include management fees, distribution and service (Rule 12b-1) fees, and other fund expenses. The following information is intended to help you understand your ongoing costs (in dollars) of investing in the Fund and to help you compare these costs with the ongoing costs of investing in other mutual funds.
Analyzing Your Fund's Expenses
To illustrate these ongoing costs, we have provided examples and calculated the expenses paid by investors in each share class of the Fund during the period. The actual and hypothetical information in the table is based on an initial investment of $1,000 at the beginning of the period indicated and held for the entire period. Expense information is calculated two ways and each method provides you with different information. The amount listed in the "Actual" column is calculated using the Fund's actual operating expenses and total return for the period. You may use the Actual information, together with the amount invested, to estimate the expenses that you paid over the period. Simply divide your account value by $1,000 (for example, an $8,600 account value divided by $1,000 = 8.6), then multiply the results by the expenses paid during the period under the Actual column. The amount listed in the "Hypothetical" column assumes a 5% annual rate of return before expenses (which is not the Fund's actual return) and then applies the Fund's actual expense ratio for the period to the hypothetical return. You should not use the hypothetical account values and expenses to estimate either your actual account balance at the end of the period or the expenses you paid during the period. See "Compare With Other Funds" below for details on how to use the hypothetical data.
Compare With Other Funds
Since all mutual funds are required to include the same hypothetical calculations about expenses in shareholder reports, you can use this information to compare the ongoing cost of investing in the Fund with other funds. To do so, compare the hypothetical example with the 5% hypothetical examples that appear in the shareholder reports of other funds. As you compare hypothetical examples of other funds, it is important to note that hypothetical examples are meant to highlight the ongoing costs of investing in a fund only and do not reflect any transaction costs, such as sales charges, or redemption or exchange fees. Therefore, the hypothetical calculations are useful in comparing ongoing costs only, and will not help you determine the relative total costs of owning different funds. If transaction costs were included in these calculations, your costs would be higher.
September 1, 2012 – February 28, 2013
| | Account Value at the Beginning
of the Period ($) | | Account Value at the End of the
Period ($) | | Expenses Paid During the
Period ($) | | Fund's Annualized
Expense Ratio (%) | |
| | Actual | | Hypothetical | | Actual | | Hypothetical | | Actual | | Hypothetical | | Actual | |
Class A | | | 1,000.00 | | | | 1,000.00 | | | | 1,065.00 | | | | 1,018.30 | | | | 6.71 | | | | 6.56 | | | | 1.31 | | |
Class B | | | 1,000.00 | | | | 1,000.00 | | | | 1,061.30 | | | | 1,014.58 | | | | 10.53 | | | | 10.29 | | | | 2.06 | | |
Class C | | | 1,000.00 | | | | 1,000.00 | | | | 1,062.20 | | | | 1,014.58 | | | | 10.53 | | | | 10.29 | | | | 2.06 | | |
Class R | | | 1,000.00 | | | | 1,000.00 | | | | 1,064.00 | | | | 1,017.06 | | | | 7.98 | | | | 7.80 | | | | 1.56 | | |
Class R4 | | | 1,000.00 | | | | 1,000.00 | | | | 1,112.00 | * | | | 1,019.74 | | | | 3.28 | * | | | 5.11 | | | | 1.02 | * | |
Class Z | | | 1,000.00 | | | | 1,000.00 | | | | 1,067.00 | | | | 1,019.54 | | | | 5.43 | | | | 5.31 | | | | 1.06 | | |
*For the period November 8, 2012 through February 28, 2013. Class R4 shares commenced operations on November 8, 2012.
Expenses paid during the period are equal to the annualized expense ratio for each class as indicated above, multiplied by the average account value over the period and then multiplied by the number of days in the Fund's most recent fiscal half year and divided by 365.
Expenses do not include fees and expenses incurred indirectly by the Fund from the underlying funds in which the Fund may invest (also referred to as "acquired funds"), including affiliated and non-affiliated pooled investment vehicles (including mutual funds and exchange-traded funds).
Had Columbia Management Investment Advisers, LLC and/or certain of its affiliates not waived/reimbursed certain fees and expenses, account value at the end of the period would have been reduced.
Annual Report 2013
6
Columbia Marsico 21st Century Fund
Portfolio of Investments
February 28, 2013
(Percentages represent value of investments compared to net assets)
Common Stocks 99.8%
Issuer | | Shares | | Value ($) | |
Consumer Discretionary 25.8% | |
Automobiles 0.9% | |
Tesla Motors, Inc.(a) | | | 273,058 | | | | 9,510,610 | | |
Hotels, Restaurants & Leisure 9.5% | |
Chipotle Mexican Grill, Inc.(a) | | | 51,208 | | | | 16,222,182 | | |
Dunkin' Brands Group, Inc. | | | 513,585 | | | | 19,079,683 | | |
McDonald's Corp. | | | 318,507 | | | | 30,544,821 | | |
Norwegian Cruise Line Holdin(a) | | | 218,947 | | | | 6,782,978 | | |
Wynn Resorts Ltd. | | | 219,194 | | | | 25,623,779 | | |
Total | | | | | 98,253,443 | | |
Internet & Catalog Retail 1.5% | |
priceline.com, Inc.(a) | | | 22,649 | | | | 15,572,999 | | |
Media 2.9% | |
Liberty Global Inc-series C(a) | | | 180,397 | | | | 11,520,152 | | |
Viacom, Inc., Class B | | | 314,764 | | | | 18,401,104 | | |
Total | | | | | 29,921,256 | | |
Multiline Retail 2.2% | |
Dollar Tree, Inc.(a) | | | 516,620 | | | | 23,343,475 | | |
Specialty Retail 7.3% | |
Foot Locker, Inc. | | | 317,583 | | | | 10,858,163 | | |
Lowe's Companies, Inc. | | | 912,135 | | | | 34,797,950 | | |
Monro Muffler Brake, Inc. | | | 138,880 | | | | 5,145,504 | | |
Ross Stores, Inc. | | | 267,412 | | | | 15,499,200 | | |
Tractor Supply Co. | | | 91,865 | | | | 9,553,041 | | |
Total | | | | | 75,853,858 | | |
Textiles, Apparel & Luxury Goods 1.5% | |
Ralph Lauren Corp. | | | 91,469 | | | | 15,867,128 | | |
Total Consumer Discretionary | | | | | 268,322,769 | | |
Consumer Staples 5.6% | |
Beverages 1.5% | |
Constellation Brands, Inc., Class A(a) | | | 342,013 | | | | 15,130,655 | | |
Food Products 3.1% | |
Green Mountain Coffee Roasters, Inc.(a) | | | 228,650 | | | | 10,920,324 | | |
Mondelez International, Inc., Class A | | | 753,518 | | | | 20,834,773 | | |
Total | | | | | 31,755,097 | | |
Household Products 1.0% | |
Church & Dwight Co., Inc. | | | 175,112 | | | | 10,849,939 | | |
Total Consumer Staples | | | | | 57,735,691 | | |
Common Stocks (continued)
Issuer | | Shares | | Value ($) | |
Energy 3.5% | |
Energy Equipment & Services 3.5% | |
Halliburton Co. | | | 297,426 | | | | 12,346,153 | | |
Schlumberger Ltd. | | | 304,694 | | | | 23,720,428 | | |
Total | | | | | 36,066,581 | | |
Total Energy | | | | | 36,066,581 | | |
Financials 9.3% | |
Capital Markets 0.7% | |
Morgan Stanley | | | 338,013 | | | | 7,622,193 | | |
Commercial Banks 2.5% | |
City National Corp. | | | 308,596 | | | | 17,531,339 | | |
Columbia Banking System, Inc. | | | 421,416 | | | | 8,428,320 | | |
Total | | | | | 25,959,659 | | |
Consumer Finance 1.5% | |
Capital One Financial Corp. | | | 294,200 | | | | 15,013,026 | | |
Diversified Financial Services 2.5% | |
Citigroup, Inc. | | | 604,663 | | | | 25,377,706 | | |
Real Estate Investment Trusts (REITs) 2.1% | |
American Tower Corp. | | | 286,443 | | | | 22,227,977 | | |
Total Financials | | | | | 96,200,561 | | |
Health Care 13.3% | |
Biotechnology 9.0% | |
Alkermes PLC(a) | | | 597,505 | | | | 12,971,834 | | |
Biogen Idec, Inc.(a) | | | 253,859 | | | | 42,226,906 | | |
BioMarin Pharmaceutical, Inc.(a) | | | 93,855 | | | | 5,440,774 | | |
Gilead Sciences, Inc.(a) | | | 786,683 | | | | 33,599,231 | | |
Total | | | | | 94,238,745 | | |
Health Care Equipment & Supplies 4.0% | |
Hologic, Inc.(a) | | | 584,087 | | | | 12,750,619 | | |
Intuitive Surgical, Inc.(a) | | | 56,092 | | | | 28,600,750 | | |
Total | | | | | 41,351,369 | | |
Pharmaceuticals 0.3% | |
Zoetis, Inc.(a) | | | 91,272 | | | | 3,053,049 | | |
Total Health Care | | | | | 138,643,163 | | |
Industrials 21.3% | |
Aerospace & Defense 5.2% | |
Precision Castparts Corp. | | | 172,698 | | | | 32,223,720 | | |
TransDigm Group, Inc. | | | 153,711 | | | | 21,879,224 | | |
Total | | | | | 54,102,944 | | |
The accompanying Notes to Financial Statements are an integral part of this statement.
Annual Report 2013
7
Columbia Marsico 21st Century Fund
Portfolio of Investments (continued)
February 28, 2013
Common Stocks (continued)
Issuer | | Shares | | Value ($) | |
Commercial Services & Supplies 1.0% | |
Copart, Inc.(a) | | | 296,424 | | | | 10,119,915 | | |
Machinery 3.8% | |
Cummins, Inc. | | | 145,792 | | | | 16,892,919 | | |
Pentair Ltd. | | | 430,935 | | | | 22,955,907 | | |
Total | | | | | 39,848,826 | | |
Professional Services 3.8% | |
IHS, Inc., Class A(a) | | | 181,350 | | | | 19,268,437 | | |
Nielsen Holdings NV(a) | | | 606,340 | | | | 20,427,595 | | |
Total | | | | | 39,696,032 | | |
Road & Rail 2.0% | |
Genesee & Wyoming, Inc., Class A(a) | | | 237,019 | | | | 21,217,941 | | |
Trading Companies & Distributors 5.5% | |
MRC Global, Inc.(a) | | | 269,214 | | | | 8,270,254 | | |
United Rentals, Inc.(a) | | | 195,818 | | | | 10,458,639 | | |
WESCO International, Inc.(a) | | | 141,045 | | | | 10,423,226 | | |
WW Grainger, Inc. | | | 122,313 | | | | 27,699,002 | | |
Total | | | | | 56,851,121 | | |
Total Industrials | | | | | 221,836,779 | | |
Information Technology 15.7% | |
Internet Software & Services 7.0% | |
Equinix, Inc.(a) | | | 99,535 | | | | 21,056,629 | | |
Facebook, Inc., Class A(a) | | | 357,882 | | | | 9,752,285 | | |
Google, Inc., Class A(a) | | | 38,926 | | | | 31,187,511 | | |
VeriSign, Inc.(a) | | | 245,185 | | | | 11,229,473 | | |
Total | | | | | 73,225,898 | | |
Common Stocks (continued)
Issuer | | Shares | | Value ($) | |
IT Services 5.4% | |
Accenture PLC, Class A | | | 230,525 | | | | 17,141,839 | | |
FleetCor Technologies, Inc.(a) | | | 170,876 | | | | 11,928,853 | | |
Mastercard, Inc., Class A | | | 51,511 | | | | 26,673,426 | | |
Total | | | | | 55,744,118 | | |
Software 3.3% | |
Red Hat, Inc.(a) | | | 427,513 | | | | 21,721,936 | | |
Salesforce.com, Inc.(a) | | | 72,896 | | | | 12,335,461 | | |
Total | | | | | 34,057,397 | | |
Total Information Technology | | | | | 163,027,413 | | |
Materials 5.3% | |
Chemicals 5.3% | |
LyondellBasell Industries NV, Class A | | | 352,910 | | | | 20,687,584 | | |
Monsanto Co. | | | 345,699 | | | | 34,925,970 | | |
Total | | | | | 55,613,554 | | |
Total Materials | | | | | 55,613,554 | | |
Total Common Stocks
(Cost: $809,230,587) | | | | | 1,037,446,511 | | |
Money Market Funds 2.4% | |
Columbia Short-Term Cash Fund,
0.128%(b)(c) | | | 24,539,509 | | | | 24,539,509 | | |
Total Money Market Funds
(Cost: $24,539,509) | | | | | 24,539,509 | | |
Total Investments
(Cost: $833,770,096) | | | | | 1,061,986,020 | | |
Other Assets & Liabilities, Net | | | | | (23,334,202 | ) | |
Net Assets | | | | | 1,038,651,818 | | |
Notes to Portfolio of Investments
(a) Non-income producing.
(b) The rate shown is the seven-day current annualized yield at February 28, 2013.
(c) As defined in the Investment Company Act of 1940, an affiliated company is one in which the Fund owns 5% or more of its outstanding voting securities, or a company which is under common ownership or control with the Fund. Holdings and transactions in these affiliated companies during the year ended February 28, 2013, are as follows:
Issuer | | Beginning
Cost ($) | | Purchase
Cost ($) | | Proceeds
From Sales ($) | | Ending
Cost ($) | | Dividends —
Affiliated
Issuers ($) | | Value ($) | |
Columbia Short-Term Cash Fund | | | — | | | | 793,003,133 | | | | (768,463,624 | ) | | | 24,539,509 | | | | 50,742 | | | | 24,539,509 | | |
The accompanying Notes to Financial Statements are an integral part of this statement.
Annual Report 2013
8
Columbia Marsico 21st Century Fund
Portfolio of Investments (continued)
February 28, 2013
Fair Value Measurements
Generally accepted accounting principles (GAAP) require disclosure regarding the inputs and valuation techniques used to measure fair value and any changes in valuation inputs or techniques. In addition, investments shall be disclosed by major category.
The Fund categorizes its fair value measurements according to a three-level hierarchy that maximizes the use of observable inputs and minimizes the use of unobservable inputs by prioritizing that the most observable input be used when available. Observable inputs are those that market participants would use in pricing an investment based on market data obtained from sources independent of the reporting entity. Unobservable inputs are those that reflect the Fund's assumptions about the information market participants would use in pricing an investment. An investment's level within the fair value hierarchy is based on the lowest level of any input that is deemed significant to the asset or liability's fair value measurement. The input levels are not necessarily an indication of the risk or liquidity associated with investments at that level. For example, certain U.S. government securities are generally high quality and liquid, however, they are reflected as Level 2 because the inputs used to determine fair value may not always be quoted prices in an active market.
Fair value inputs are summarized in the three broad levels listed below:
> Level 1 — Valuations based on quoted prices for investments in active markets that the Fund has the ability to access at the measurement date (including NAV for open-end mutual funds). Valuation adjustments are not applied to Level 1 investments.
> Level 2 — Valuations based on other significant observable inputs (including quoted prices for similar securities, interest rates, prepayment speeds, credit risks, etc.).
> Level 3 — Valuations based on significant unobservable inputs (including the Fund's own assumptions and judgment in determining the fair value of investments).
Inputs that are used in determining fair value of an investment may include price information, credit data, volatility statistics, and other factors. These inputs can be either observable or unobservable. The availability of observable inputs can vary between investments, and is affected by various factors such as the type of investment, and the volume and level of activity for that investment or similar investments in the marketplace. The inputs will be considered by the Investment Manager, along with any other relevant factors in the calculation of an investment's fair value. The Fund uses prices and inputs that are current as of the measurement date, which may include periods of market dislocations. During these periods, the availability of prices and inputs may be reduced for many investments. This condition could cause an investment to be reclassified between the various levels within the hierarchy.
Investments falling into the Level 3 category are primarily supported by quoted prices from brokers and dealers participating in the market for those investments. However, these may be classified as Level 3 investments due to lack of market transparency and corroboration to support these quoted prices. Additionally, valuation models may be used as the pricing source for any remaining investments classified as Level 3. These models rely on one or more significant unobservable inputs and/or significant assumptions by the Investment Manager. Inputs used in valuations may include, but are not limited to, financial statement analysis, capital account balances, discount rates and estimated cash flows, and comparable company data.
Under the direction of the Fund's Board of Trustees (the Board), the Investment Manager's Valuation Committee (the Committee) is responsible for carrying out the valuation procedures approved by the Board. The Committee consists of voting and non-voting members from various groups within the Investment Manager's organization, including operations and accounting, trading and investments, compliance, risk management and legal.
The Committee meets at least monthly to review and approve valuation matters, which may include a description of specific valuation determinations, data regarding pricing information received from approved pricing vendors and brokers and the results of Board-approved valuation control policies and procedures (the Policies). The Policies address, among other things, instances when market quotations are readily available, including recommendations of third party pricing vendors and a determination of appropriate pricing methodologies; events that require specific valuation determinations and assessment of fair value techniques; securities with a potential for stale pricing, including those that are illiquid, restricted, or in default; and the effectiveness of third-party pricing vendors, including periodic reviews of vendors. The Committee meets more frequently, as needed, to discuss additional valuation matters, which may include the need to review back-testing results, review time-sensitive information or approve related valuation actions. The Committee reports to the Board, with members of the Committee meeting with the Board at each of its regularly scheduled meetings to discuss valuation matters and actions during the period, similar to those described earlier.
For investments categorized as Level 3, the Committee monitors information similar to that described above, which may include: (i) data specific to the issuer or comparable issuers, (ii) general market or specific sector news and (iii) quoted prices and specific or similar security transactions. The Committee considers this data and any changes from prior periods in order to assess the reasonableness of observable and unobservable inputs, any assumptions or internal models used to value those securities and changes in fair value. This data is also used to corroborate, when available, information received from approved pricing vendors and brokers. Various factors impact the frequency of monitoring this information (which may occur as often as daily). However, the Committee may determine that changes to inputs, assumptions and models are not required as a result of the monitoring procedures performed.
The accompanying Notes to Financial Statements are an integral part of this statement.
Annual Report 2013
9
Columbia Marsico 21st Century Fund
Portfolio of Investments (continued)
February 28, 2013
Fair Value Measurements (continued)
The following table is a summary of the inputs used to value the Fund's investments at February 28, 2013:
Description | | Level 1
Quoted Prices in Active
Markets for Identical
Assets ($) | | Level 2
Other Significant
Observable Inputs ($) | | Level 3
Significant
Unobservable Inputs ($) | | Total ($) | |
Equity Securities | |
Common Stocks | |
Consumer Discretionary | | | 268,322,769 | | | | — | | | | — | | | | 268,322,769 | | |
Consumer Staples | | | 57,735,691 | | | | — | | | | — | | | | 57,735,691 | | |
Energy | | | 36,066,581 | | | | — | | | | — | | | | 36,066,581 | | |
Financials | | | 96,200,561 | | | | — | | | | — | | | | 96,200,561 | | |
Health Care | | | 138,643,163 | | | | — | | | | — | | | | 138,643,163 | | |
Industrials | | | 221,836,779 | | | | — | | | | — | | | | 221,836,779 | | |
Information Technology | | | 163,027,413 | | | | — | | | | — | | | | 163,027,413 | | |
Materials | | | 55,613,554 | | | | — | | | | — | | | | 55,613,554 | | |
Total Equity Securities | | | 1,037,446,511 | | | | — | | | | — | | | | 1,037,446,511 | | |
Other | |
Money Market Funds | | | 24,539,509 | | | | — | | | | — | | | | 24,539,509 | | |
Total Other | | | 24,539,509 | | | | — | | | | — | | | | 24,539,509 | | |
Total | | | 1,061,986,020 | | | | — | | | | — | | | | 1,061,986,020 | | |
See the Portfolio of Investments for all investment classifications not indicated in the table.
There were no transfers of financial assets between Levels 1 and 2 during the period.
The accompanying Notes to Financial Statements are an integral part of this statement.
Annual Report 2013
10
Columbia Marsico 21st Century Fund
Statement of Assets and Liabilities
February 28, 2013
Assets | |
Investments, at value | |
Unaffiliated issuers (identified cost $809,230,587) | | $ | 1,037,446,511 | | |
Affiliated issuers (identified cost $24,539,509) | | | 24,539,509 | | |
Total investments (identified cost $833,770,096) | | | 1,061,986,020 | | |
Receivable for: | |
Capital shares sold | | | 235,672 | | |
Dividends | | | 734,261 | | |
Reclaims | | | 17,905 | | |
Prepaid expenses | | | 4,612 | | |
Total assets | | | 1,062,978,470 | | |
Liabilities | |
Payable for: | |
Investments purchased | | | 20,398,264 | | |
Capital shares purchased | | | 3,350,165 | | |
Investment management fees | | | 19,550 | | |
Distribution and/or service fees | | | 11,884 | | |
Transfer agent fees | | | 331,153 | | |
Administration fees | | | 1,633 | | |
Compensation of board members | | | 82,736 | | |
Expense reimbursement due to Investment Manager | | | 10,113 | | |
Other expenses | | | 121,154 | | |
Total liabilities | | | 24,326,652 | | |
Net assets applicable to outstanding capital stock | | $ | 1,038,651,818 | | |
Represented by | |
Paid-in capital | | $ | 2,712,269,612 | | |
Excess of distributions over net investment income | | | (2,863,345 | ) | |
Accumulated net realized loss | | | (1,898,966,643 | ) | |
Unrealized appreciation (depreciation) on: | |
Investments | | | 228,215,924 | | |
Foreign currency translations | | | (3,730 | ) | |
Total — representing net assets applicable to outstanding capital stock | | $ | 1,038,651,818 | | |
The accompanying Notes to Financial Statements are an integral part of this statement.
Annual Report 2013
11
Columbia Marsico 21st Century Fund
Statement of Assets and Liabilities (continued)
February 28, 2013
Class A | |
Net assets | | $ | 526,471,445 | | |
Shares outstanding | | | 37,223,335 | | |
Net asset value per share | | $ | 14.14 | | |
Maximum offering price per share(a) | | $ | 15.00 | | |
Class B | |
Net assets | | $ | 52,822,713 | | |
Shares outstanding | | | 4,069,732 | | |
Net asset value per share | | $ | 12.98 | | |
Class C | |
Net assets | | $ | 236,372,512 | | |
Shares outstanding | | | 18,214,417 | | |
Net asset value per share | | $ | 12.98 | | |
Class R | |
Net assets | | $ | 22,756,449 | | |
Shares outstanding | | | 1,629,067 | | |
Net asset value per share | | $ | 13.97 | | |
Class R4 | |
Net assets | | $ | 2,773 | | |
Shares outstanding | | | 188 | | |
Net asset value per share(b) | | $ | 14.74 | | |
Class Z | |
Net assets | | $ | 200,225,926 | | |
Shares outstanding | | | 13,810,112 | | |
Net asset value per share | | $ | 14.50 | | |
(a) The maximum offering price per share is calculated by dividing the net asset value by 1.0 minus the maximum sales charge of 5.75%.
(b) Net asset value per share rounds to this amount due to fractional shares outstanding.
The accompanying Notes to Financial Statements are an integral part of this statement.
Annual Report 2013
12
Columbia Marsico 21st Century Fund
Statement of Operations
Year Ended February 28, 2013
Net investment income | |
Income: | |
Dividends — unaffiliated issuers | | $ | 17,017,787 | | |
Dividends — affiliated issuers | | | 50,742 | | |
Interest | | | 14 | | |
Income from securities lending — net | | | 1,824,655 | | |
Foreign taxes withheld | | | (363,843 | ) | |
Total income | | | 18,529,355 | | |
Expenses: | |
Investment management fees | | | 9,238,502 | | |
Distribution and/or service fees | |
Class A | | | 1,598,921 | | |
Class B | | | 616,562 | | |
Class C | | | 2,782,037 | | |
Class R | | | 132,545 | | |
Transfer agent fees | |
Class A | | | 1,073,908 | | |
Class B | | | 103,267 | | |
Class C | | | 466,589 | | |
Class R | | | 44,385 | | |
Class R4(a) | | | 1 | | |
Class Z | | | 521,595 | | |
Administration fees | | | 2,715,082 | | |
Compensation of board members | | | 51,573 | | |
Custodian fees | | | 9,626 | | |
Printing and postage fees | | | 141,692 | | |
Registration fees | | | 146,556 | | |
Professional fees | | | 40,754 | | |
Line of credit interest expense | | | 4,435 | | |
Other | | | 55,085 | | |
Total expenses | | | 19,743,115 | | |
Fees waived or expenses reimbursed by Investment Manager and its affiliates | | | (131,463 | ) | |
Expense reductions | | | (2,000 | ) | |
Total net expenses | | | 19,609,652 | | |
Net investment loss | | | (1,080,297 | ) | |
Realized and unrealized gain (loss) — net | |
Net realized gain (loss) on: | |
Investments | | | 231,180,927 | | |
Foreign currency translations | | | (7,829 | ) | |
Net realized gain | | | 231,173,098 | | |
Net change in unrealized appreciation (depreciation) on: | |
Investments | | | (161,139,815 | ) | |
Foreign currency translations | | | (642 | ) | |
Forward foreign currency exchange contracts | | | 124 | | |
Net change in unrealized appreciation (depreciation) | | | (161,140,333 | ) | |
Net realized and unrealized gain | | | 70,032,765 | | |
Net increase in net assets resulting from operations | | $ | 68,952,468 | | |
(a) For the period from November 8, 2012 (commencement of operations) to February 28, 2013.
The accompanying Notes to Financial Statements are an integral part of this statement.
Annual Report 2013
13
Columbia Marsico 21st Century Fund
Statement of Changes in Net Assets
| | | Year Ended
February 28,
2013(a) | | Year Ended
February 29,
2012 | |
Operations | |
Net investment loss | | $ | (1,080,297 | ) | | $ | (7,688,851 | ) | |
Net realized gain | | | 231,173,098 | | | | 166,838,681 | | |
Net change in unrealized appreciation (depreciation) | | | (161,140,333 | ) | | | (507,817,767 | ) | |
Net increase (decrease) in net assets resulting from operations | | | 68,952,468 | | | | (348,667,937 | ) | |
Distributions to shareholders | |
Net investment income | |
Class A | | | (121,266 | ) | | | — | | |
Class R4 | | | (7 | ) | | | — | | |
Class Z | | | (499,317 | ) | | | — | | |
Total distributions to shareholders | | | (620,590 | ) | | | — | | |
Increase (decrease) in net assets from capital stock activity | | | (736,286,595 | ) | | | (1,639,855,848 | ) | |
Total decrease in net assets | | | (667,954,717 | ) | | | (1,988,523,785 | ) | |
Net assets at beginning of year | | | 1,706,606,535 | | | | 3,695,130,320 | | |
Net assets at end of year | | $ | 1,038,651,818 | | | $ | 1,706,606,535 | | |
Excess of distributions over net investment income | | $ | (2,863,345 | ) | | $ | (1,213,625 | ) | |
(a) Class R4 shares are for the period from November 8, 2012 (commencement of operations) to February 28, 2013.
The accompanying Notes to Financial Statements are an integral part of this statement.
Annual Report 2013
14
Columbia Marsico 21st Century Fund
Statement of Changes in Net Assets (continued)
| | | Year Ended February 28, 2013(a) | | Year Ended February 29, 2012 | |
| | | Shares | | Dollars ($) | | Shares | | Dollars ($) | |
Capital stock activity | |
Class A shares | |
Subscriptions(b) | | | 2,935,350 | | | | 39,345,751 | | | | 9,300,938 | | | | 118,588,125 | | |
Distributions reinvested | | | 8,190 | | | | 107,943 | | | | — | | | | — | | |
Redemptions | | | (26,997,107 | ) | | | (361,326,434 | ) | | | (68,368,653 | ) | | | (877,841,428 | ) | |
Net decrease | | | (24,053,567 | ) | | | (321,872,740 | ) | | | (59,067,715 | ) | | | (759,253,303 | ) | |
Class B shares | |
Subscriptions | | | 12,672 | | | | 159,307 | | | | 30,448 | | | | 364,279 | | |
Redemptions(b) | | | (1,878,016 | ) | | | (23,192,865 | ) | | | (2,430,830 | ) | | | (28,976,210 | ) | |
Net decrease | | | (1,865,344 | ) | | | (23,033,558 | ) | | | (2,400,382 | ) | | | (28,611,931 | ) | |
Class C shares | |
Subscriptions | | | 355,966 | | | | 4,406,138 | | | | 969,332 | | | | 11,921,869 | | |
Redemptions | | | (10,071,680 | ) | | | (124,268,382 | ) | | | (17,334,797 | ) | | | (205,030,554 | ) | |
Net decrease | | | (9,715,714 | ) | | | (119,862,244 | ) | | | (16,365,465 | ) | | | (193,108,685 | ) | |
Class R shares | |
Subscriptions | | | 306,394 | | | | 4,070,405 | | | | 589,190 | | | | 7,450,288 | | |
Redemptions | | | (975,144 | ) | | | (12,901,929 | ) | | | (1,158,431 | ) | | | (14,729,624 | ) | |
Net decrease | | | (668,750 | ) | | | (8,831,524 | ) | | | (569,241 | ) | | | (7,279,336 | ) | |
Class R4 shares | |
Subscriptions | | | 188 | | | | 2,500 | | | | — | | | | — | | |
Net increase | | | 188 | | | | 2,500 | | | | — | | | | — | | |
Class Z shares | |
Subscriptions | | | 2,756,504 | | | | 37,933,107 | | | | 26,656,902 | | | | 364,029,006 | | |
Distributions reinvested | | | 29,952 | | | | 404,045 | | | | — | | | | — | | |
Redemptions | | | (22,117,135 | ) | | | (301,026,181 | ) | | | (79,185,174 | ) | | | (1,015,631,599 | ) | |
Net decrease | | | (19,330,679 | ) | | | (262,689,029 | ) | | | (52,528,272 | ) | | | (651,602,593 | ) | |
Total net decrease | | | (55,633,866 | ) | | | (736,286,595 | ) | | | (130,931,075 | ) | | | (1,639,855,848 | ) | |
(a) Class R4 shares are for the period from November 8, 2012 (commencement of operations) to February 28, 2013.
(b) Includes conversions of Class B shares to Class A shares, if any.
The accompanying Notes to Financial Statements are an integral part of this statement.
Annual Report 2013
15
Columbia Marsico 21st Century Fund
The following tables are intended to help you understand the Fund's financial performance. Certain information reflects financial results for a single share of a class held for the periods shown. Per share net investment income (loss) amounts are calculated based on average shares outstanding during the period. Total return assumes reinvestment of all dividends and distributions, if any. Total return does not reflect payment of sales charges, if any, and is not annualized for periods of less than one year.
| | | Year Ended
February 28, | | Year Ended
February 29, | | Year Ended February 28, | |
Class A | | 2013 | | 2012 | | 2011 | | 2010 | | 2009 | |
Per share data | |
Net asset value, beginning of period | | $ | 13.25 | | | $ | 14.22 | | | $ | 11.63 | | | $ | 7.31 | | | $ | 14.55 | | |
Income from investment operations: | |
Net investment income (loss) | | | 0.01 | | | | (0.03 | ) | | | (0.06 | ) | | | (0.03 | ) | | | 0.01 | | |
Net realized and unrealized gain (loss) | | | 0.88 | | | | (0.94 | ) | | | 2.65 | | | | 4.35 | | | | (7.25 | ) | |
Total from investment operations | | | 0.89 | | | | (0.97 | ) | | | 2.59 | | | | 4.32 | | | | (7.24 | ) | |
Less distributions to shareholders: | |
Net investment income | | | (0.00 | )(a) | | | — | | | | — | | | | — | | | | — | | |
Total distributions to shareholders | | | (0.00 | )(a) | | | — | | | | — | | | | — | | | | — | | |
Redemption fees: | |
Redemption fees added to paid-in capital | | | — | | | | — | | | | — | | | | — | | | | 0.00 | (a) | |
Net asset value, end of period | | $ | 14.14 | | | $ | 13.25 | | | $ | 14.22 | | | $ | 11.63 | | | $ | 7.31 | | |
Total return | | | 6.74 | % | | | (6.82 | %) | | | 22.27 | %(b) | | | 59.10 | % | | | (49.76 | %) | |
Ratios to average net assets(c)(d) | |
Total gross expenses | | | 1.36 | %(e) | | | 1.37 | %(e) | | | 1.31 | % | | | 1.31 | % | | | 1.29 | % | |
Total net expenses(f) | | | 1.35 | %(e)(g) | | | 1.37 | %(e)(g) | | | 1.31 | %(g) | | | 1.30 | %(g) | | | 1.25 | %(g) | |
Net investment income (loss) | | | 0.06 | % | | | (0.23 | %) | | | (0.47 | %) | | | (0.35 | %) | | | 0.12 | % | |
Supplemental data | |
Net assets, end of period (in thousands) | | $ | 526,471 | | | $ | 811,890 | | | $ | 1,711,839 | | | $ | 1,993,000 | | | $ | 1,967,386 | | |
Portfolio turnover | | | 65 | % | | | 104 | % | | | 87 | % | | | 119 | % | | | 152 | % | |
Notes to Financial Highlights
(a) Rounds to zero.
(b) Total return includes a reimbursement of a loss experienced by the Fund due to a compliance violation. The reimbursement had an impact of less than 0.01% on total return.
(c) In addition to the fees and expenses which the Fund bears directly, the Fund indirectly bears a pro rata share of the fees and expenses of the acquired funds in which it invests. Such indirect expenses are not included in the reported expense ratios.
(d) Certain line items from prior years have been reclassified to conform to the current presentation.
(e) Includes interest expense which rounds to less than 0.01%.
(f) Total net expenses include the impact of certain waivers/reimbursements made by the Investment Manager and certain of its affiliates, if applicable.
(g) The benefits derived from expense reductions had an impact of less than 0.01%.
The accompanying Notes to Financial Statements are an integral part of this statement.
Annual Report 2013
16
Columbia Marsico 21st Century Fund
Financial Highlights (continued)
| | | Year Ended
February 28, | | Year Ended
February 29, | | Year Ended February 28, | |
Class B | | 2013 | | 2012 | | 2011 | | 2010 | | 2009 | |
Per share data | |
Net asset value, beginning of period | | $ | 12.25 | | | $ | 13.25 | | | $ | 10.91 | | | $ | 6.92 | | | $ | 13.86 | | |
Income from investment operations: | |
Net investment loss | | | (0.08 | ) | | | (0.12 | ) | | | (0.14 | ) | | | (0.10 | ) | | | (0.07 | ) | |
Net realized and unrealized gain (loss) | | | 0.81 | | | | (0.88 | ) | | | 2.48 | | | | 4.09 | | | | (6.87 | ) | |
Total from investment operations | | | 0.73 | | | | (1.00 | ) | | | 2.34 | | | | 3.99 | | | | (6.94 | ) | |
Redemption fees: | |
Redemption fees added to paid-in capital | | | — | | | | — | | | | — | | | | — | | | | 0.00 | (a) | |
Net asset value, end of period | | $ | 12.98 | | | $ | 12.25 | | | $ | 13.25 | | | $ | 10.91 | | | $ | 6.92 | | |
Total return | | | 5.96 | % | | | (7.55 | %) | | | 21.45 | %(b) | | | 57.66 | % | | | (50.07 | %) | |
Ratios to average net assets(c)(d) | |
Total gross expenses | | | 2.10 | %(e) | | | 2.12 | %(e) | | | 2.06 | % | | | 2.06 | % | | | 2.04 | % | |
Total net expenses(f) | | | 2.10 | %(e)(g) | | | 2.12 | %(e)(g) | | | 2.06 | %(g) | | | 2.05 | %(g) | | | 2.00 | %(g) | |
Net investment loss | | | (0.67 | %) | | | (0.97 | %) | | | (1.21 | %) | | | (1.10 | %) | | | (0.63 | %) | |
Supplemental data | |
Net assets, end of period (in thousands) | | $ | 52,823 | | | $ | 72,692 | | | $ | 110,427 | | | $ | 117,307 | | | $ | 95,889 | | |
Portfolio turnover | | | 65 | % | | | 104 | % | | | 87 | % | | | 119 | % | | | 152 | % | |
Notes to Financial Highlights
(a) Rounds to zero.
(b) Total return includes a reimbursement of a loss experienced by the Fund due to a compliance violation. The reimbursement had an impact of less than 0.01% on total return.
(c) In addition to the fees and expenses which the Fund bears directly, the Fund indirectly bears a pro rata share of the fees and expenses of the acquired funds in which it invests. Such indirect expenses are not included in the reported expense ratios.
(d) Certain line items from prior years have been reclassified to conform to the current presentation.
(e) Includes interest expense which rounds to less than 0.01%.
(f) Total net expenses include the impact of certain waivers/reimbursements made by the Investment Manager and certain of its affiliates, if applicable.
(g) The benefits derived from expense reductions had an impact of less than 0.01%.
The accompanying Notes to Financial Statements are an integral part of this statement.
Annual Report 2013
17
Columbia Marsico 21st Century Fund
Financial Highlights (continued)
| | | Year Ended
February 28, | | Year Ended
February 29, | | Year Ended February 28, | |
Class C | | 2013 | | 2012 | | 2011 | | 2010 | | 2009 | |
Per share data | |
Net asset value, beginning of period | | $ | 12.25 | | | $ | 13.25 | | | $ | 10.91 | | | $ | 6.91 | | | $ | 13.86 | | |
Income from investment operations: | |
Net investment loss | | | (0.08 | ) | | | (0.12 | ) | | | (0.14 | ) | | | (0.10 | ) | | | (0.07 | ) | |
Net realized and unrealized gain (loss) | | | 0.81 | | | | (0.88 | ) | | | 2.48 | | | | 4.10 | | | | (6.88 | ) | |
Total from investment operations | | | 0.73 | | | | (1.00 | ) | | | 2.34 | | | | 4.00 | | | | (6.95 | ) | |
Redemption fees: | |
Redemption fees added to paid-in capital | | | — | | | | — | | | | — | | | | — | | | | 0.00 | (a) | |
Net asset value, end of period | | $ | 12.98 | | | $ | 12.25 | | | $ | 13.25 | | | $ | 10.91 | | | $ | 6.91 | | |
Total return | | | 5.96 | % | | | (7.55 | %) | | | 21.45 | %(b) | | | 57.89 | % | | | (50.14 | %) | |
Ratios to average net assets(c)(d) | |
Total gross expenses | | | 2.10 | %(e) | | | 2.12 | %(e) | | | 2.06 | % | | | 2.06 | % | | | 2.04 | % | |
Total net expenses(f) | | | 2.10 | %(e)(g) | | | 2.12 | %(e)(g) | | | 2.06 | %(g) | | | 2.05 | %(g) | | | 2.00 | %(g) | |
Net investment loss | | | (0.68 | %) | | | (0.97 | %) | | | (1.22 | %) | | | (1.10 | %) | | | (0.63 | %) | |
Supplemental data | |
Net assets, end of period (in thousands) | | $ | 236,373 | | | $ | 342,021 | | | $ | 586,725 | | | $ | 660,457 | | | $ | 622,098 | | |
Portfolio turnover | | | 65 | % | | | 104 | % | | | 87 | % | | | 119 | % | | | 152 | % | |
Notes to Financial Highlights
(a) Rounds to zero.
(b) Total return includes a reimbursement of a loss experienced by the Fund due to a compliance violation. The reimbursement had an impact of less than 0.01% on total return.
(c) In addition to the fees and expenses which the Fund bears directly, the Fund indirectly bears a pro rata share of the fees and expenses of the acquired funds in which it invests. Such indirect expenses are not included in the reported expense ratios.
(d) Certain line items from prior years have been reclassified to conform to the current presentation.
(e) Includes interest expense which rounds to less than 0.01%.
(f) Total net expenses include the impact of certain waivers/reimbursements made by the Investment Manager and certain of its affiliates, if applicable.
(g) The benefits derived from expense reductions had an impact of less than 0.01%.
The accompanying Notes to Financial Statements are an integral part of this statement.
Annual Report 2013
18
Columbia Marsico 21st Century Fund
Financial Highlights (continued)
| | | Year Ended
February 28, | | Year Ended
February 29, | | Year Ended February 28, | |
Class R | | 2013 | | 2012 | | 2011 | | 2010 | | 2009 | |
Per share data | |
Net asset value, beginning of period | | $ | 13.12 | | | $ | 14.11 | | | $ | 11.57 | | | $ | 7.29 | | | $ | 14.55 | | |
Income from investment operations: | |
Net investment income (loss) | | | (0.02 | ) | | | (0.06 | ) | | | (0.09 | ) | | | (0.06 | ) | | | (0.02 | ) | |
Net realized and unrealized gain (loss) | | | 0.87 | | | | (0.93 | ) | | | 2.63 | | | | 4.34 | | | | (7.24 | ) | |
Total from investment operations | | | 0.85 | | | | (0.99 | ) | | | 2.54 | | | | 4.28 | | | | (7.26 | ) | |
Redemption fees: | |
Redemption fees added to paid-in capital | | | — | | | | — | | | | — | | | | — | | | | 0.00 | (a) | |
Net asset value, end of period | | $ | 13.97 | | | $ | 13.12 | | | $ | 14.11 | | | $ | 11.57 | | | $ | 7.29 | | |
Total return | | | 6.48 | % | | | (7.02 | %) | | | 21.95 | %(b) | | | 58.71 | % | | | (49.90 | %) | |
Ratios to average net assets(c)(d) | |
Total gross expenses | | | 1.61 | %(e) | | | 1.62 | %(e) | | | 1.56 | % | | | 1.56 | % | | | 1.54 | % | |
Total net expenses(f) | | | 1.60 | %(e)(g) | | | 1.62 | %(e)(g) | | | 1.56 | %(g) | | | 1.55 | %(g) | | | 1.50 | %(g) | |
Net investment loss | | | (0.17 | %) | | | (0.46 | %) | | | (0.71 | %) | | | (0.59 | %) | | | (0.13 | %) | |
Supplemental data | |
Net assets, end of period (in thousands) | | $ | 22,756 | | | $ | 30,137 | | | $ | 40,468 | | | $ | 41,627 | | | $ | 42,429 | | |
Portfolio turnover | | | 65 | % | | | 104 | % | | | 87 | % | | | 119 | % | | | 152 | % | |
Notes to Financial Highlights
(a) Rounds to zero.
(b) Total return includes a reimbursement of a loss experienced by the Fund due to a compliance violation. The reimbursement had an impact of less than 0.01% on total return.
(c) In addition to the fees and expenses which the Fund bears directly, the Fund indirectly bears a pro rata share of the fees and expenses of the acquired funds in which it invests. Such indirect expenses are not included in the reported expense ratios.
(d) Certain line items from prior years have been reclassified to conform to the current presentation.
(e) Includes interest expense which rounds to less than 0.01%.
(f) Total net expenses include the impact of certain waivers/reimbursements made by the Investment Manager and certain of its affiliates, if applicable.
(g) The benefits derived from expense reductions had an impact of less than 0.01%.
The accompanying Notes to Financial Statements are an integral part of this statement.
Annual Report 2013
19
Columbia Marsico 21st Century Fund
Financial Highlights (continued)
Class R4 | | Year Ended
February 28,
2013(a) | |
Per share data | |
Net asset value, beginning of period | | $ | 13.29 | | |
Income from investment operations: | |
Net investment income | | | 0.01 | | |
Net realized and unrealized gain | | | 1.48 | | |
Total from investment operations | | | 1.49 | | |
Less distributions to shareholders: | |
Net investment income | | | (0.04 | ) | |
Total distributions to shareholders | | | (0.04 | ) | |
Net asset value, end of period | | $ | 14.74 | | |
Total return | | | 11.20 | % | |
Ratios to average net assets(b) | |
Total gross expenses | | | 1.02 | %(c)(d) | |
Total net expenses(e) | | | 1.02 | %(c)(d) | |
Net investment income | | | 0.28 | %(c) | |
Supplemental data | |
Net assets, end of period (in thousands) | | $ | 3 | | |
Portfolio turnover | | | 65 | % | |
Notes to Financial Highlights
(a) For the period from November 8, 2012 (commencement of operations) to February 28, 2013.
(b) In addition to the fees and expenses which the Fund bears directly, the Fund indirectly bears a pro rata share of the fees and expenses of the acquired funds in which it invests. Such indirect expenses are not included in the reported expense ratios.
(c) Annualized.
(d) Includes interest expense which rounds to less than 0.01%.
(e) Total net expenses include the impact of certain waivers/reimbursements made by the Investment Manager and certain of its affiliates, if applicable.
The accompanying Notes to Financial Statements are an integral part of this statement.
Annual Report 2013
20
Columbia Marsico 21st Century Fund
Financial Highlights (continued)
| | | Year Ended
February 28, | | Year Ended
February 29, | | Year Ended February 28, | |
Class Z | | 2013 | | 2012 | | 2011 | | 2010 | | 2009 | |
Per share data | |
Net asset value, beginning of period | | $ | 13.57 | | | $ | 14.54 | | | $ | 11.86 | | | $ | 7.44 | | | $ | 14.76 | | |
Income from investment operations: | |
Net investment income (loss) | | | 0.04 | | | | 0.01 | | | | (0.03 | ) | | | (0.01 | ) | | | 0.05 | | |
Net realized and unrealized gain (loss) | | | 0.92 | | | | (0.98 | ) | | | 2.71 | | | | 4.43 | | | | (7.37 | ) | |
Total from investment operations | | | 0.96 | | | | (0.97 | ) | | | 2.68 | | | | 4.42 | | | | (7.32 | ) | |
Less distributions to shareholders: | |
Net investment income | | | (0.03 | ) | | | — | | | | — | | | | (0.00 | )(a) | | | — | | |
Total distributions to shareholders | | | (0.03 | ) | | | — | | | | — | | | | (0.00 | )(a) | | | — | | |
Redemption fees: | |
Redemption fees added to paid-in capital | | | — | | | | — | | | | — | | | | — | | | | 0.00 | (a) | |
Net asset value, end of period | | $ | 14.50 | | | $ | 13.57 | | | $ | 14.54 | | | $ | 11.86 | | | $ | 7.44 | | |
Total return | | | 7.09 | % | | | (6.67 | %) | | | 22.60 | %(b) | | | 59.42 | % | | | (49.59 | %) | |
Ratios to average net assets(c)(d) | |
Total gross expenses | | | 1.11 | %(e) | | | 1.12 | %(e) | | | 1.06 | % | | | 1.06 | % | | | 1.04 | % | |
Total net expenses(f) | | | 1.10 | %(e)(g) | | | 1.12 | %(e)(g) | | | 1.06 | %(g) | | | 1.05 | %(g) | | | 1.00 | %(g) | |
Net investment income (loss) | | | 0.27 | % | | | 0.04 | % | | | (0.20 | %) | | | (0.10 | %) | | | 0.37 | % | |
Supplemental data | |
Net assets, end of period (in thousands) | | $ | 200,226 | | | $ | 449,867 | | | $ | 1,245,671 | | | $ | 1,008,937 | | | $ | 870,875 | | |
Portfolio turnover | | | 65 | % | | | 104 | % | | | 87 | % | | | 119 | % | | | 152 | % | |
Notes to Financial Highlights
(a) Rounds to zero.
(b) Total return includes a reimbursement of a loss experienced by the Fund due to a compliance violation. The reimbursement had an impact of less than 0.01% on total return.
(c) In addition to the fees and expenses which the Fund bears directly, the Fund indirectly bears a pro rata share of the fees and expenses of the acquired funds in which it invests. Such indirect expenses are not included in the reported expense ratios.
(d) Certain line items from prior years have been reclassified to conform to the current presentation.
(e) Includes interest expense which rounds to less than 0.01%.
(f) Total net expenses include the impact of certain waivers/reimbursements made by the Investment Manager and certain of its affiliates, if applicable.
(g) The benefits derived from expense reductions had an impact of less than 0.01%.
The accompanying Notes to Financial Statements are an integral part of this statement.
Annual Report 2013
21
Columbia Marsico 21st Century Fund
Notes to Financial Statements
February 28, 2013
Note 1. Organization
Columbia Marsico 21st Century Fund (the Fund), a series of Columbia Funds Series Trust (the Trust), is a diversified fund. The Trust is registered under the Investment Company Act of 1940, as amended (the 1940 Act), as an open-end management investment company organized as a Delaware statutory trust.
Fund Shares
The Trust may issue an unlimited number of shares (without par value). The Fund offers Class A, Class B, Class C, Class R, Class R4 and Class Z shares. All share classes have identical voting, dividend and liquidation rights. Each share class has its own expense structure and sales charges, as applicable.
Class A shares are subject to a maximum front-end sales charge of 5.75% based on the initial investment amount. Class A shares purchased without an initial sales charge in accounts aggregating $1 million to $50 million at the time of purchase are subject to a contingent deferred sales charge (CDSC) if the shares are sold within 18 months of purchase, charged as follows: 1.00% CDSC if redeemed within 12 months of purchase, and 0.50% CDSC if redeemed more than 12, but less than 18, months after purchase.
Class B shares may be subject to a maximum CDSC of 5.00% based upon the holding period after purchase. Class B shares will generally convert to Class A shares eight years after purchase. The Fund no longer accepts investments by new or existing investors in the Fund's Class B shares, except in connection with the reinvestment of any dividend and/or capital gain distributions in Class B shares of the Fund and exchanges by existing Class B shareholders of certain other funds within the Columbia Family of Funds.
Class C shares are subject to a 1.00% CDSC on shares redeemed within one year of purchase.
Class R shares are not subject to sales charges and are only available to qualifying institutional investors.
Class R4 shares are not subject to sales charges and are only available to investors purchasing through authorized investment professionals. Class R4 shares commenced operations on November 8, 2012.
Class Z shares are not subject to sales charges, and are only available to certain investors.
Note 2. Summary of Significant Accounting Policies
Use of Estimates
The preparation of financial statements in accordance with U.S. generally accepted accounting principles (GAAP) requires management to make certain estimates and
assumptions that affect the reported amounts of assets and liabilities, the disclosure of contingent assets and liabilities at the date of the financial statements and the reported amounts of revenue and expenses during the reporting period. Actual results could differ from those estimates.
The following is a summary of significant accounting policies consistently followed by the Fund in the preparation of its financial statements.
Security Valuation
All equity securities are valued at the close of business of the New York Stock Exchange (NYSE). Equity securities are valued at the last quoted sales price on the principal exchange or market on which they trade, except for securities traded on the NASDAQ Stock Market, which are valued at the NASDAQ official close price. Unlisted securities or listed securities for which there were no sales during the day are valued at the mean of the latest quoted bid and ask prices on such exchanges or markets.
Foreign securities are valued based on quotations from the principal market in which such securities are normally traded. If any foreign share prices are not readily available as a result of limited share activity the securities are valued at the mean of the latest quoted bid and ask prices on such exchanges or markets. Foreign currency exchange rates are generally determined at 4:00 p.m. Eastern (U.S.) time. However, many securities markets and exchanges outside the U.S. close prior to the close of the NYSE; therefore, the closing prices for securities in such markets or on such exchanges may not fully reflect events that occur after such close but before the close of the NYSE. In those situations, foreign securities will be fair valued pursuant to the policy adopted by the Board of Trustees (the Board), including utilizing a third party pricing service to determine these fair values. The third party pricing service takes into account multiple factors, including, but not limited to, movements in the U.S. securities markets, certain depositary receipts, futures contracts and foreign exchange rates that have occurred subsequent to the close of the foreign exchange or market, to determine a good faith estimate that reasonably reflects the current market conditions as of the close of the NYSE. The fair value of a security is likely to be different from the quoted or published price, if available.
Investments in other open-end investment companies, including money market funds, are valued at net asset value.
Investments for which market quotations are not readily available, or that have quotations which management believes are not reliable, are valued at fair value as determined in good faith under consistently applied procedures established by and under the general supervision of the Board. If a security or class of securities (such as foreign securities) is valued at fair
Annual Report 2013
22
Columbia Marsico 21st Century Fund
Notes to Financial Statements (continued)
February 28, 2013
value, such value is likely to be different from the last quoted market price for the security.
The determination of fair value often requires significant judgment. To determine fair value, management may use assumptions including but not limited to future cash flows and estimated risk premiums. Multiple inputs from various sources may be used to determine fair value.
Foreign Currency Transactions and Translations
The values of all assets and liabilities denominated in foreign currencies are translated into U.S. dollars at that day's exchange rates. Net realized and unrealized gains (losses) on foreign currency transactions and translations include gains (losses) arising from the fluctuation in exchange rates between trade and settlement dates on securities transactions, gains (losses) arising from the disposition of foreign currency and currency gains (losses) between the accrual and payment dates on dividends, interest income and foreign withholding taxes.
For financial statement purposes, the Fund does not distinguish that portion of gains (losses) on investments which is due to changes in foreign exchange rates from that which is due to changes in market prices of the investments. Such fluctuations are included with the net realized and unrealized gains (losses) on investments in the Statement of Operations.
Security Transactions
Security transactions are accounted for on the trade date. Cost is determined and gains (losses) are based upon the specific identification method for both financial statement and federal income tax purposes.
Income Recognition
Corporate actions and dividend income are recorded net of any non-reclaimable tax withholdings, on the ex-dividend date or upon receipt of ex-dividend notification in the case of certain foreign securities.
The Fund may receive distributions from holdings in business development companies (BDCs), exchange traded funds (ETFs) and real estate investment trusts (REITs), which report information on the character of their distributions annually. These distributions are allocated to dividend income, capital gain and return of capital based on estimates made by the Fund's management if actual information has not yet been reported. Return of capital is recorded as a reduction of the cost basis of securities held. If the Fund no longer owns the applicable securities, return of capital is recorded as a realized gain. Management's estimates are subsequently adjusted when the actual character of the distributions is disclosed by the BDCs, ETFs and REITs, which could result in a proportionate change in return of capital to shareholders.
Awards from class action litigation are recorded as a reduction of cost basis if the Fund still owns the applicable securities on the payment date. If the Fund no longer owns the applicable securities, the proceeds are recorded as realized gains.
Expenses
General expenses of the Trust are allocated to the Fund and other funds of the Trust based upon relative net assets or other expense allocation methodologies determined by the nature of the expense. Expenses directly attributable to the Fund are charged to the Fund. Expenses directly attributable to a specific class of shares are charged to that share class.
Determination of Class Net Asset Value
All income, expenses (other than class-specific expenses, which are charged to that share class, as shown in the Statement of Operations) and realized and unrealized gains (losses) are allocated to each class of the Fund on a daily basis, based on the relative net assets of each class, for purposes of determining the net asset value of each class.
Federal Income Tax Status
The Fund intends to qualify each year as a regulated investment company under Subchapter M of the Internal Revenue Code, as amended, and will distribute substantially all of its tax exempt and taxable income (including net short-term capital gains), if any, for its tax year, and as such will not be subject to federal income taxes. In addition, the Fund intends to distribute in each calendar year substantially all of its net investment income, capital gains and certain other amounts, if any, such that the Fund should not be subject to federal excise tax. Therefore, no federal income or excise tax provision is recorded.
Distributions to Shareholders
Distributions from net investment income, if any, are declared and paid semi-annually. Net realized capital gains, if any, are distributed at least annually. Income distributions and capital gain distributions are determined in accordance with federal income tax regulations, which may differ from GAAP.
Guarantees and Indemnifications
Under the Trust's organizational documents and, in some cases, by contract, its officers and trustees are indemnified against certain liabilities arising out of the performance of their duties to the Trust or its funds. In addition, certain of the Fund's contracts with its service providers contain general indemnification clauses. The Fund's maximum exposure under these arrangements is unknown since the amount of any future claims that may be made against the Fund cannot be determined, and the Fund has no historical basis for predicting the likelihood of any such claims.
Annual Report 2013
23
Columbia Marsico 21st Century Fund
Notes to Financial Statements (continued)
February 28, 2013
Recent Accounting Pronouncement
Disclosures about Offsetting Assets and Liabilities
In December 2011, the Financial Accounting Standards Board (FASB) issued Accounting Standards Update (ASU) No. 2011-11, Disclosures about Offsetting Assets and Liabilities. The objective of the FASB is to enhance current disclosure requirements on offsetting of certain assets and liabilities and to enable financial statement users to compare financial statements prepared under GAAP and International Financial Reporting Standards.
Specifically, ASU No. 2011-11 requires an entity to disclose both gross and net information for derivatives and other financial instruments that are subject to a master netting arrangement or similar agreement. The standard requires disclosure of collateral received in connection with the master netting agreements or similar agreements. The effective date of ASU No. 2011-11 is for interim and annual periods beginning on or after January 1, 2013. At this time, management is evaluating the implications of this guidance and the impact it will have on the financial statement amounts and footnote disclosures, if any.
Note 3. Fees and Compensation Paid to Affiliates
Investment Management Fees
Under an Investment Management Services Agreement, Columbia Management Investment Advisers, LLC (the Investment Manager), a wholly-owned subsidiary of Ameriprise Financial, Inc. (Ameriprise Financial), is responsible for the ultimate oversight of investments made by the Fund. The Fund's subadviser (see Subadvisory Agreement below) has the primary responsibility for the day-to-day portfolio management of the Fund. Effective January 23, 2013, the investment management fee is an annual fee that is equal to a percentage of the Fund's average daily net assets that declines from 0.71% to 0.54% as the Fund's net assets increase. Prior to January 23, 2013, the investment management fee was equal to a percentage of the Fund's average daily net assets that declined from 0.75% to 0.56% as the Fund's net assets increased. The effective investment management fee rate for the year ended February 28, 2013 was 0.70% of the Fund's average daily net assets.
Prior to June 30, 2012, to the extent that the Fund was not benefitting from a separate contractual expense limitation arrangement, the Investment Manager contractually agreed to waive a portion of its investment management fee. In the absence of a separate contractual expense limitation arrangement, the investment management fee waiver for the Fund was equal to a percentage of the Fund's pro-rata portion of the combined average daily net assets of the Fund and other
affiliated funds managed by the Investment Manager and sub-advised by Marsico Capital Management, LLC (Marsico), at a rate that increased from 0.00% to 0.10% as the combined daily net assets increased.
For the year ended February 28, 2013, no investment management fees were waived for the Fund.
Subadvisory Agreement
The Investment Manager has entered into a Subadvisory Agreement with Marsico to subadvise the assets of the Fund. The Investment Manager compensates Marsico to manage the investment of the Fund's assets.
Administration Fees
Under an Administrative Services Agreement, the Investment Manager also serves as the Fund Administrator. Effective January 23, 2013, the Fund pays the Fund Administrator an annual fee for administration and accounting services equal to a percentage of the Fund's average daily net assets that declines from 0.06% to 0.03% as the Fund's net assets increase. Prior to January 23, 2013, the administration fee was equal to 0.22% of the Fund's average daily net assets. The effective administration fee rate for the year ended February 28, 2013 was 0.21% of the Fund's average daily net assets.
Other Expenses
Other expenses are for, among other things, certain expenses of the Fund or the Board, including: Fund boardroom and office expense, employee compensation, employee health and retirement benefits, and certain other expenses. Payment of these Fund and Board expenses is facilitated by a company providing limited administrative services to the Fund and the Board. For the year ended February 28, 2013, other expenses paid to this company were $4,754.
Compensation of Board Members
Board members are compensated for their services to the Fund as disclosed in the Statement of Operations. Under a Deferred Compensation Plan (the Plan), the Board members who are not "interested persons" of the Fund, as defined under the 1940 Act, may elect to defer payment of up to 100% of their compensation. Deferred amounts are treated as though equivalent dollar amounts had been invested in shares of certain funds managed by the Investment Manager. The Fund's liability for these amounts is adjusted for market value changes and remains in the Fund until distributed in accordance with the Plan.
Transfer Agent Fees
Under a Transfer and Dividend Disbursing Agent Agreement, Columbia Management Investment Services Corp. (the Transfer Agent), an affiliate of the Investment Manager and a
Annual Report 2013
24
Columbia Marsico 21st Century Fund
Notes to Financial Statements (continued)
February 28, 2013
wholly-owned subsidiary of Ameriprise Financial, is responsible for providing transfer agency services to the Fund. The Transfer Agent has contracted with Boston Financial Data Services (BFDS) to serve as sub-transfer agent.
The Transfer Agent receives monthly account-based service fees based on the number of open accounts and is reimbursed by the Fund for the fees and expenses the Transfer Agent pays to financial intermediaries that maintain omnibus accounts with the Fund that is a percentage of the average aggregate value of the Fund's shares maintained in each such omnibus account (other than omnibus accounts for which American Enterprise Investment Services Inc. is the broker of record or accounts where the beneficial shareholder is a customer of Ameriprise Financial Services, Inc., which are paid a per account fee). The Transfer Agent pays the fees of BFDS for services as sub-transfer agent and is not entitled to reimbursement for such fees from the Fund (with the exception of out-of-pocket fees).
The Transfer Agent also receives compensation from fees for various shareholder services and reimbursements for certain out-of-pocket fees.
For the year ended February 28, 2013, the Fund's effective transfer agent fee rates as a percentage of average daily net assets of each class were as follows:
Class A | | | 0.17 | % | |
Class B | | | 0.17 | | |
Class C | | | 0.17 | | |
Class R | | | 0.17 | | |
Class R4* | | | 0.14 | | |
Class Z | | | 0.17 | | |
*Annualized
An annual minimum account balance fee of $20 may apply to certain accounts with a value below the Fund's initial minimum investment requirements to reduce the impact of small accounts on transfer agent fees. These minimum account balance fees are recorded as part of expense reductions in the Statement of Operations. For the year ended February 28, 2013, these minimum account balance fees reduced total expenses by $2,000.
Distribution and Service Fees
The Fund has an agreement with Columbia Management Investment Distributors, Inc. (the Distributor), an affiliate of the Investment Manager and a wholly-owned subsidiary of Ameriprise Financial, for distribution and shareholder services. Pursuant to Rule 12b-1 under the 1940 Act, the Board has approved, and the Fund has adopted, distribution and shareholder service plans (the Plans) which set the
distribution and service fees for the Fund. These fees are calculated daily and are intended to compensate the Distributor and/or eligible selling and/or servicing agents for selling shares of the Fund and providing services to investors.
The Plans require the payment of a monthly combined distribution and service fee to the Distributor at the maximum annual rate of 0.25% of the average daily net assets attributable to Class A shares of the Fund. The Plans also require the payment of a monthly service fee at the maximum annual rate of 0.25% of the average daily net assets attributable to Class B and Class C shares of the Fund and the payment of a monthly distribution fee at the maximum annual rates of 0.75%, 0.75% and 0.50% of the average daily net assets attributable to Class B, Class C and Class R shares, respectively.
Sales Charges
Sales charges, including front-end charges and CDSCs, received by the Distributor for distributing Fund shares were $161,576 for Class A, $137,504 for Class B and $6,134 for Class C shares for the year ended February 28, 2013.
Expenses Waived/Reimbursed by the Investment Manager and its Affiliates
Effective July 1, 2012, the Investment Manager and certain of its affiliates have contractually agreed to waive fees and/or reimburse expenses (excluding certain fees and expenses described below), through June 30, 2013, unless sooner terminated at the sole discretion of the Board, so that the Fund's net operating expenses, after giving effect to fees waived/expenses reimbursed and any balance credits and/or overdraft charges from the Fund's custodian, do not exceed the following annual rates as a percentage of the class' average daily net assets:
Class A | | | 1.31 | % | |
Class B | | | 2.06 | | |
Class C | | | 2.06 | | |
Class R | | | 1.56 | | |
Class R4* | | | 1.06 | | |
Class Z | | | 1.06 | | |
*Annual rate is contractual from November 8, 2012 (the commencement of operations of Class R4 shares) through November 8, 2013.
Prior to July 1, 2012, the Investment Manager and certain of its affiliates contractually agreed to waive fees and/or reimburse expenses (excluding certain fees and expenses described below), so that the Fund's net operating expenses, after giving effect to fees waived/expenses reimbursed and any balance credits and/or overdraft charges from the Fund's
Annual Report 2013
25
Columbia Marsico 21st Century Fund
Notes to Financial Statements (continued)
February 28, 2013
custodian, did not exceed the following annual rates as a percentage of the class' average daily net assets:
Class A | | | 1.45 | % | |
Class B | | | 2.20 | | |
Class C | | | 2.20 | | |
Class R | | | 1.70 | | |
Class Z | | | 1.20 | | |
Under the agreement, the following fees and expenses are excluded from the waiver/reimbursement commitment, and therefore will be paid by the Fund, if applicable: taxes (including foreign transaction taxes), expenses associated with investments in affiliated and non-affiliated pooled investment vehicles (including mutual funds and exchange traded funds), transaction costs and brokerage commissions, costs related to any securities lending program, dividend expenses associated with securities sold short, inverse floater program fees and expenses, transaction charges and interest on borrowed money, interest, extraordinary expenses and any other expenses the exclusion of which is specifically approved by the Board. This agreement may be modified or amended only with approval from all parties.
Note 4. Federal Tax Information
The timing and character of income and capital gain distributions are determined in accordance with income tax regulations, which may differ from GAAP because of temporary or permanent book to tax differences.
At February 28, 2013, these differences are primarily due to differing treatment for: capital loss carryforwards, deferral/reversal of wash sales losses, Trustees' deferred compensation, foreign currency transactions, late-year ordinary losses and derivative investments. To the extent these differences are permanent, reclassifications are made among the components of the Fund's net assets in the Statement of Assets and Liabilities. Temporary differences do not require reclassifications. In the Statement of Assets and Liabilities the following reclassifications were made:
Excess of distributions over net investment income | | $ | 51,167 | | |
Accumulated net realized loss | | | 7,829 | | |
Paid-in capital | | | (58,996 | ) | |
Net investment income and net realized gains (losses), as disclosed in the Statement of Operations, and net assets were not affected by this reclassification.
The tax character of distributions paid during the years indicated was as follows:
Year Ended | | February 28,
2013 | | February 29,
2012 | |
Ordinary income | | $ | 620,590 | | | $ | — | | |
Short-term capital gain distributions, if any, are considered ordinary income distributions for tax purposes.
At February 28, 2013, the components of distributable earnings on a tax basis were as follows:
Accumulated realized loss | | $ | (1,892,546,208 | ) | |
Unrealized appreciation | | | 219,013,786 | | |
At February 28, 2013, the cost of investments for federal income tax purposes was $842,972,234 and the aggregate gross unrealized appreciation and depreciation based on that cost was:
Unrealized appreciation | | $ | 220,883,860 | | |
Unrealized depreciation | | | (1,870,074 | ) | |
Net unrealized appreciation | | | 219,013,786 | | |
The following capital loss carryforward, determined at February 28, 2013, may be available to reduce taxable income arising from future net realized gains on investments, if any, to the extent permitted by the Internal Revenue Code:
Year of Expiration | | Amount | |
2017 | | $ | 362,781,815 | | |
2018 | | | 1,526,982,692 | | |
Total | | $ | 1,889,764,507 | | |
Unlimited capital loss carryforwards are required to be utilized prior to any capital losses which carry an expiration date. As a result of this ordering rule, capital loss carryforwards which carry an expiration date may be more likely to expire unused.
For the year ended February 28, 2013, $225,269,485 of capital loss carryforward was utilized.
Under current tax rules, regulated investment companies can elect to treat certain late-year ordinary losses incurred and post-October capital losses (capital losses realized after October 31) as arising on the first day of the following taxable year. As of February 28, 2013, the Fund will elect to treat late year ordinary losses of $2,781,701 as arising on March 1, 2013.
Management of the Fund has concluded that there are no significant uncertain tax positions that would require recognition in the financial statements. However, management's conclusion may be subject to review and adjustment at a later date based on factors including, but not limited to, new tax laws, regulations, and administrative interpretations (including
Annual Report 2013
26
Columbia Marsico 21st Century Fund
Notes to Financial Statements (continued)
February 28, 2013
relevant court decisions). Generally, the Fund's federal tax returns for the prior three fiscal years remain subject to examination by the Internal Revenue Service.
Note 5. Portfolio Information
The cost of purchases and proceeds from sales of securities, excluding short-term obligations, aggregated to $839,472,571 and $1,532,622,042, respectively, for the year ended February 28, 2013.
Note 6. Lending of Portfolio Securities
Effective December 19, 2012, the Fund no longer participates in securities lending activity. Prior to that date, the Fund participated, or was eligible to participate in securities lending activity pursuant to a Master Securities Lending Agreement (the Agreement) with JPMorgan Chase Bank, N.A. (JPMorgan). The Agreement authorized JPMorgan as lending agent to lend securities to authorized borrowers in order to generate additional income on behalf of the Fund. Pursuant to the Agreement, the securities loaned were secured by cash or securities that either were issued or guaranteed as to principal and interest by the U.S. government, its agencies, authorities or instrumentalities with value equal to at least 100% of the market value of the loaned securities. Any additional collateral required to maintain those levels due to market fluctuations of the loaned securities was requested to be delivered the following business day. Cash collateral received was invested by the lending agent on behalf of the Fund into authorized investments pursuant to the Agreement.
Pursuant to the Agreement, the Fund received income for lending its securities either in the form of fees or by earning interest on invested cash collateral, net of negotiated rebates paid to borrowers and fees paid to the lending agent for services provided and any other securities lending expenses. Net income earned from securities lending for the year ended February 28, 2013 is disclosed in the Statement of Operations. The Fund continued to earn and accrue interest and dividends on the securities loaned.
Note 7. Affiliated Money Market Fund
The Fund invests its daily cash balances in Columbia Short-Term Cash Fund, an affiliated money market fund established for the exclusive use by the Fund and other affiliated funds. The income earned by the Fund from such investments is included as "Dividends — affiliated issuers" in the Statement of Operations. As an investing fund, the Fund indirectly bears its proportionate share of the expenses of Columbia Short-Term Cash Fund.
Note 8. Shareholder Concentration
At February 28, 2013, two unaffiliated shareholder accounts owned an aggregate of 31.9% of the outstanding shares of the Fund. The Fund has no knowledge about whether any portion of those shares was owned beneficially by such accounts. Subscription and redemption activity by concentrated accounts may have a significant effect on the operations of the Fund.
Note 9. Line of Credit
The Fund has entered into a revolving credit facility with a syndicate of banks led by JPMorgan whereby the Fund may borrow for the temporary funding of shareholder redemptions or for other temporary or emergency purposes. The credit facility agreement, as amended, which is a collective agreement between the Fund and certain other funds managed by the Investment Manager, severally and not jointly, permits collective borrowings up to $500 million. Interest is charged to each participating fund based on its borrowings at a rate equal to the higher of (i) the overnight federal funds rate plus 1.00% or (ii) the one-month LIBOR rate plus 1.00%. Each borrowing under the credit facility matures no later than 60 days after the date of borrowing. The Fund also pays a commitment fee equal to its pro rata share of the amount of the credit facility at a rate of 0.08% per annum.
For the year ended February 28, 2013, the average daily loan balance outstanding on days when borrowing existed was $12,930,000 at a weighted average interest rate of 1.22%.
Note 10. Significant Risks
Consumer Discretionary Risk
The Fund's portfolio managers may invest significantly in issuers operating in the consumer discretionary sector. The Fund may be more susceptible to the particular risks of this sector than if the Fund were invested in a wider variety of issuers operating in unrelated sectors.
Note 11. Subsequent Events
Management has evaluated the events and transactions that have occurred through the date the financial statements were issued and noted no items requiring adjustment of the financial statements or additional disclosure.
Note 12. Information Regarding Pending and Settled Legal Proceedings
In December 2005, without admitting or denying the allegations, American Express Financial Corporation (AEFC, which is now known as Ameriprise Financial, Inc. (Ameriprise Financial)) entered into settlement agreements with the Securities and Exchange Commission (SEC) and Minnesota Department of Commerce (MDOC) related to market timing
Annual Report 2013
27
Columbia Marsico 21st Century Fund
Notes to Financial Statements (continued)
February 28, 2013
activities. As a result, AEFC was censured and ordered to cease and desist from committing or causing any violations of certain provisions of the Investment Advisers Act of 1940, the Investment Company Act of 1940, and various Minnesota laws. AEFC agreed to pay disgorgement of $10 million and civil money penalties of $7 million. AEFC also agreed to retain an independent distribution consultant to assist in developing a plan for distribution of all disgorgement and civil penalties ordered by the SEC in accordance with various undertakings detailed at www.sec.gov/litigation/admin/ia-2451.pdf. Ameriprise Financial and its affiliates have cooperated with the SEC and the MDOC in these legal proceedings, and have made regular reports to the funds' Boards of Trustees.
Ameriprise Financial and certain of its affiliates have historically been involved in a number of legal, arbitration and regulatory proceedings, including routine litigation, class actions, and governmental actions, concerning matters arising in connection with the conduct of their business activities. Ameriprise Financial believes that the Funds are not currently the subject of, and that neither Ameriprise Financial nor any of its affiliates are the subject of, any pending legal, arbitration or regulatory proceedings that are likely to have a material adverse effect on the Funds or the ability of Ameriprise Financial or its affiliates to perform under their contracts with the Funds. Ameriprise Financial is required to make 10-Q, 10-K and, as necessary, 8-K filings with the Securities and Exchange Commission on legal and regulatory matters that relate to Ameriprise Financial and its affiliates. Copies of these filings may be obtained by accessing the SEC website at www.sec.gov.
There can be no assurance that these matters, or the adverse publicity associated with them, will not result in increased fund redemptions, reduced sale of fund shares or other adverse consequences to the Funds. Further, although we believe proceedings are not likely to have a material adverse effect on the Funds or the ability of Ameriprise Financial or its affiliates to perform under their contracts with the Funds, these proceedings are subject to uncertainties and, as such, we are unable to estimate the possible loss or range of loss that may result. An adverse outcome in one or more of these proceedings could result in adverse judgments, settlements, fines, penalties or other relief that could have a material adverse effect on the consolidated financial condition or results of operations of Ameriprise Financial.
Annual Report 2013
28
Columbia Marsico 21st Century Fund
Report of Independent Registered Public Accounting Firm
To the Trustees of Columbia Funds Series Trust and the Shareholders of
Columbia Marsico 21st Century Fund
In our opinion, the accompanying statement of assets and liabilities, including the portfolio of investments, and the related statements of operations and of changes in net assets and the financial highlights present fairly, in all material respects, the financial position of Columbia Marsico 21st Century Fund (the "Fund") (a series of Columbia Funds Series Trust) at February 28, 2013, the results of its operations for the year then ended, the changes in its net assets for each of the two years in the period then ended and the financial highlights for each of the periods indicated, in conformity with accounting principles generally accepted in the United States of America. These financial statements and financial highlights (hereafter referred to as "financial statements") are the responsibility of the Fund's management. Our responsibility is to express an opinion on these financial statements based on our audits. We conducted our audits of these financial statements in accordance with the standards of the Public Company Accounting Oversight Board (United States). Those standards require that we plan and perform the audit to obtain reasonable assurance about whether the financial statements are free of material misstatement. An audit includes examining, on a test basis, evidence supporting the amounts and disclosures in the financial statements, assessing the accounting principles used and significant estimates made by management, and evaluating the overall financial statement presentation. We believe that our audits, which included confirmation of securities at February 28, 2013 by correspondence with the custodian, transfer agent and brokers, provide a reasonable basis for our opinion.
PricewaterhouseCoopers LLP
Minneapolis, Minnesota
April 19, 2013
Annual Report 2013
29
Columbia Marsico 21st Century Fund
Federal Income Tax Information
(Unaudited)
The Fund hereby designates the following tax attributes for the fiscal year ended February 28, 2013. Shareholders will be notified in early 2014 of the amounts for use in preparing 2013 income tax returns.
Tax Designations:
| Qualified Dividend Income | | | 100.00 | % | |
| Dividends Received Deduction | | | 100.00 | % | |
Qualified Dividend Income. For taxable, non-corporate shareholders, the percentage of ordinary income dividends paid during the fiscal year that represents qualified dividend income subject to reduced tax rates under the Jobs and Growth Tax Relief Reconciliation Act of 2003.
Dividends Received Deduction. The percentage of ordinary income dividends paid during the fiscal year that qualifies for the corporate dividends received deduction.
Annual Report 2013
30
Columbia Marsico 21st Century Fund
Shareholders elect the Board that oversees the funds' operations. The Board appoints officers who are responsible for day-to-day business decisions based on policies set by the Board. The following table provides basic biographical information about the funds' Board members, including their principal occupations during the past five years, although specific titles for individuals may have varied over the period. Under current Board policy, members may serve until the next Board meeting after he or she reaches the mandatory retirement age established by the Board, or the fifteenth anniversary of the first Board meeting they attended as a member of the Board.
Mr. Edward J. Boudreau, Jr., Mr. William P. Carmichael, Mr. William A. Hawkins, Mr. R. Glenn Hilliard, Ms. Minor M. Shaw and Dr. Anthony M. Santomero, were members of the Legacy Columbia Nations funds' Board ("Nations Funds"), which includes Columbia Funds Series Trust, Columbia Funds Variable Insurance Trust I and Columbia Funds Master Investment Trust, LLC and began service on the Board for the Legacy RiverSource funds ("RiverSource Funds") effective June 1, 2011.
Independent Trustees
Name,
Address,
Year of Birth | | Position Held With
Funds and Length of
Service | | Principal Occupation
During Past Five Years | | Number of
Funds in the
Fund Family
Overseen by
Board Member | | Other Present or Past
Directorships/Trusteeships
(Within Past 5 Years) | |
Kathleen Blatz
901 S. Marquette Ave.
Minneapolis, MN 55402
1954 | | Board member since 1/06 for RiverSource Funds and since 6/11 for Nations Funds | | Attorney; Chief Justice, Minnesota Supreme Court, 1998-2006 | | | 153 | | | Director, BlueCross BlueShield of Minnesota since 2009 | |
Edward J. Boudreau, Jr.
901 S. Marquette Ave.
Minneapolis, MN 55402
1944 | | Board member since 6/11 for RiverSource Funds and since 1/05 for Nations Funds | | Managing Director, E.J. Boudreau & Associates (consulting) since 2000 | | | 151 | | | Former Trustee, BofA Funds Series Trust (11 funds) | |
Pamela G. Carlton
901 S. Marquette Ave.
Minneapolis, MN 55402
1954 | | Board member since 7/07 for RiverSource Funds and since 6/11 for Nations Funds | | President, Springboard — Partners in Cross Cultural Leadership (consulting company) since 2003 | | | 153 | | | None | |
William P. Carmichael
901 S. Marquette Ave.
Minneapolis, MN 55402
1943 | | Board member since 6/11 for RiverSource Funds and since 1999 for Nations Funds | | Retired | | | 151 | | | Director, Cobra Electronics Corporation (electronic equipment manufacturer); The Finish Line (athletic shoes and apparel) since July 2003; McMoRan Exploration Company (oil and gas exploration and development) since 2010; former Trustee, BofA Funds Series Trust (11 funds); former Director, Spectrum Brands, Inc. (consumer products); former Director, Simmons Company (bedding) | |
Patricia M. Flynn
901 S. Marquette Ave.
Minneapolis, MN 55402
1950 | | Board member since 11/04 for RiverSource Funds and since 6/11 for Nations Funds | | Trustee Professor of Economics and Management, Bentley University since 1976 | | | 153 | | | None | |
William A. Hawkins
901 S. Marquette Ave.
Minneapolis, MN 55402
1942 | | Board member since 6/11 for RiverSource Funds and since 1/05 for Nations Funds | | Managing Director, Overton Partners (financial consulting), since August 2010; President and Chief Executive Officer, California General Bank, N.A., January 2008-August 2010. | | | 151 | | | Trustee, BofA Funds Series Trust (11 funds) | |
Annual Report 2013
31
Columbia Marsico 21st Century Fund
Trustees and Officers (continued)
Independent Trustees (continued)
Name,
Address,
Year of Birth | | Position Held With
Funds and Length of
Service | | Principal Occupation
During Past Five Years | | Number of
Funds in the
Fund Family
Overseen by
Board Member | | Other Present or Past
Directorships/Trusteeships
(Within Past 5 Years) | |
R. Glenn Hilliard
901 S. Marquette Ave.
Minneapolis, MN 55402
1943 | | Board member since 6/11 for RiverSource Funds and since 1/05 for Nations Funds | | Chairman and Chief Executive Officer, Hilliard Group LLC (investing and consulting), since April 2003; Non-Executive Director & Chairman, CNO Financial Group, Inc. (insurance), September 2003-May 2011 | | | 151 | | | Chairman, BofA Fund Series Trust (11 funds); former Director, CNO Financial Group, Inc. (insurance) | |
Stephen R. Lewis, Jr.
901 S. Marquette Ave.
Minneapolis, MN 55402
1939 | | Chair of the Board for RiverSource Funds since 1/07, Board member for RiverSource Funds since 1/02 and since 6/11 for Nations Funds | | President Emeritus and Professor of Economics Emeritus, Carleton College since 2002 | | | 153 | | | Director, Valmont Industries, Inc. (manufacturer of irrigation systems) since 2002 | |
Catherine James Paglia
901 S. Marquette Ave.
Minneapolis, MN 55402
1952 | | Board member since 11/04 for RiverSource Funds and since 6/11 for Nations Funds | | Director, Enterprise Asset Management, Inc. (private real estate and asset management company) | | | 153 | | | Director, Valmont Industries, Inc. (manufacturer of irrigation systems) since 2012 | |
Leroy C. Richie
901 S. Marquette Ave.
Minneapolis, MN 55402
1941 | | Board member since 2000 for Legacy Seligman Funds, since 11/08 for RiverSource Funds and since 6/11 for Nations Funds | | Counsel, Lewis & Munday, P.C. (law firm) since 2004; former Vice President and General Counsel, Automotive Legal Affairs, Chrysler Corporation from 1983-1987 | | | 153 | | | Lead Outside Director, Digital Ally, Inc. (digital imaging) since September 2005; Director, Infinity, Inc. (oil and gas exploration and production) since 1994; Director, OGE Energy Corp. (energy and energy services) since November 2007 | |
Minor M. Shaw
901 S. Marquette Ave.
Minneapolis, MN 55402
1947 | | Board member since 6/11 for RiverSource Funds and since 2003 for Nations Funds | | President, Micco LLC (private investments) since 2011; President Micco Corp. since 1998 | | | 151 | | | Director, Piedmont Natural Gas; Director, BlueCross BlueShield of South Carolina since April 2008; Former Trustee, BofA Funds Series Trust (11 funds) | |
Alison Taunton-Rigby
901 S. Marquette Ave.
Minneapolis, MN 55402
1944 | | Board member since 11/02 for RiverSource Funds and since 6/11 for Nations Funds | | Chief Executive Officer and Director, RiboNovix, Inc. (biotechnology), 2003-2010 | | | 153 | | | Director, Healthways, Inc. (health and well-being improvement) since 2005; Director, ICI Mutual Insurance Company, RRG since 2011; Director, Abt Associates (government contractor) since 2001; Director, Boston Children's Hospital since 2002 | |
Annual Report 2013
32
Columbia Marsico 21st Century Fund
Trustees and Officers (continued)
Interested Trustee Not Affiliated With Investment Manager*
Name,
Address,
Year of Birth | | Position Held With
Funds and Length of
Service | | Principal Occupation
During Past Five Years | | Number of
Funds in the
Fund Family
Overseen by
Board Member | | Other Present or Past
Directorships/Trusteeships
(Within Past 5 Years) | |
Anthony M. Santomero
901 S. Marquette Ave.
Minneapolis, MN 55402
1946 | | Board member since 6/11 for RiverSource Funds and since 1/08 for Nations Funds | | Richard K. Mellon Professor Emeritus of Finance, The Wharton School, University of Pennsylvania, since 2002; Senior Advisor, McKinsey & Company (consulting), 2006-2008 | | | 151 | | | Director, Renaissance Reinsurance Ltd. since May 2008; Trustee, Penn Mutual Life Insurance Company since March 2008; Director, Citigroup since 2009; Director, Citibank, N.A. since 2009; former Trustee, BofA Funds Series Trust (11 funds) | |
*Dr. Santomero is not an affiliated person of the investment manager or Ameriprise Financial. However, he is currently deemed by the funds to be an "interested person" (as defined in the 1940 Act) of the funds because he serves as a Director of Citigroup, Inc. and Citibank N.A., companies that may directly or through subsidiaries and affiliates engage from time-to-time in brokerage execution, principal transactions and lending relationships with the funds or accounts advised/managed by the investment manager.
Interested Trustee Affiliated With Investment Manager*
Name,
Address,
Year of Birth | | Position Held With
Funds and Length of
Service | | Principal Occupation
During Past Five Years | | Number of
Funds in the
Fund Family
Overseen by
Board Member | | Other Present or Past
Directorships/Trusteeships
(Within Past 5 Years) | |
William F. Truscott
53600 Ameriprise
Financial Center
Minneapolis, MN 55474
1960 | | Board member since 11/01 for RiverSource Funds and since 6/11 for Nations Funds; Senior Vice President since 2002 for RiverSource Funds and 5/10 for Nations Funds | | President, Columbia Management Investment Advisers, LLC since February 2012, (previously President, Chairman of the Board and Chief Investment Officer, 2001-April 2010); Chief Executive Officer, Global Asset Management, Ameriprise Financial, Inc. since September 2012 (previously Chief Executive Officer, U.S. Asset Management & President, Annuities, May 2010-September 2012 and President — U.S. Asset Management and Chief Investment Officer, 2005-April 2010); Chief Executive Officer, Columbia Management Investment Distributors, Inc. since February 2012, (previously Chairman of the Board and Chief Executive Officer, 2006-April 2010); Chairman of the Board and Chief Executive Officer, RiverSource Distributors, Inc. since 2006; President and Chief Executive Officer, Ameriprise Certificate Company 2006-August 2012 | | | 210 | | | Chairman of the Board, Columbia Management Investment Advisers, LLC since May 2010; Director, Columbia Management Investment Distributors, Inc. since May 2010; Director, Ameriprise Certificate Company, 2006-January 2013 | |
*Interested person (as defined under the 1940 Act) by reason of being an officer, director, security holder and/or employee of the investment manager or Ameriprise Financial.
The SAI has additional information about the Fund's Board members and is available, without charge, upon request by calling 800.345.6611; contacting your financial intermediary; or visiting columbiamanagement.com.
Annual Report 2013
33
Columbia Marsico 21st Century Fund
Trustees and Officers (continued)
The Board has appointed officers who are responsible for day-to-day business decisions based on policies it has established. The officers serve at the pleasure of the Board. In addition to Mr. Truscott, who is Senior Vice President, the funds' other officers are:
Officers
Name,
Address,
Year of Birth | | Position Held With
Funds and Length of
Service | | Principal Occupation During Past Five Years | |
J. Kevin Connaughton
225 Franklin Street
Boston, MA 02110
1964 | | President and Principal Executive Officer since 5/10 for RiverSource Funds and 2009 for Nations Funds | | Senior Vice President and General Manager — Mutual Fund Products, Columbia Management Investment Advisers, LLC since May 2010; Managing Director of Columbia Management Advisors, LLC, December 2004-April 2010; Senior Vice President and Chief Financial Officer, Columbia Funds, June 2008-January 2009; Treasurer, Columbia Funds, October 2003-May 2008 | |
Amy K. Johnson
5228 Ameriprise Financial Center Minneapolis, MN 55474
1965 | | Vice President since 12/06 for RiverSource Funds and 5/10 for Nations Funds | | Senior Vice President and Chief Operating Officer, Columbia Management Investment Advisers, LLC since May 2010 (previously Chief Administrative Officer, 2009-April 2010 and Vice President — Asset Management and Trust Company Services, 2006-2009) | |
Michael G. Clarke
225 Franklin Street
Boston, MA 02110
1969 | | Treasurer since 1/11 and Chief Financial Officer since 4/11 for RiverSource Funds and Treasurer since 3/11 and Chief Financial Officer since 2009 for Nations Funds | | Vice President, Columbia Management Investment Advisers, LLC since May 2010; Managing Director of Fund Administration, Columbia Management Advisors, LLC, September 2004-April 2010; senior officer of Columbia Funds and affiliated funds since 2002 | |
Scott R. Plummer
5228 Ameriprise Financial Center Minneapolis, MN 55474
1959 | | Senior Vice President and Chief Legal Officer since 12/06 and Assistant Secretary since 6/11 for RiverSource Funds and Senior Vice President and Chief Legal Officer since 5/10 and Assistant Secretary since 6/11 for Nations Funds | | Senior Vice President, Chief Legal Officer and Assistant Secretary, Columbia Management Investment Advisers, LLC since June 2005; Vice President and Lead Chief Counsel — Asset Management, Ameriprise Financial, Inc. since May 2010 (previously Vice President and Chief Counsel — Asset Management, 2005-April 2010); Vice President, Chief Counsel and Assistant Secretary, Columbia Management Investment Distributors, Inc. since 2008; Vice President, General Counsel and Secretary, Ameriprise Certificate Company since 2005; Chief Counsel, RiverSource Distributors, Inc. since 2006 | |
Colin Moore
225 Franklin Street
Boston, MA 02110
1958 | | Senior Vice President since 5/10 for RiverSource Funds and Nations Funds | | Director and Chief Investment Officer, Columbia Management Investment Advisers, LLC since May 2010; Manager, Managing Director and Chief Investment Officer, Columbia Management Advisors, LLC, 2007-April 2010 | |
Thomas P. McGuire
225 Franklin Street
Boston, MA 02110
1972 | | Chief Compliance Officer since 3/12 | | Vice President — Asset Management Compliance, Columbia Management Investment Advisers, LLC since 2010; Chief Compliance Officer, Ameriprise Certificate Company since September 2010; Compliance Executive, Bank of America, 2005-2010 | |
Stephen T. Welsh
225 Franklin Street
Boston, MA 02110
1957 | | Vice President since 4/11 for RiverSource Funds and 2006 for Nations Funds | | President and Director, Columbia Management Investment Services Corp. since May 2010; President and Director, Columbia Management Services, Inc., July 2004- April 2010; Managing Director, Columbia Management Distributors, Inc., August 2007-April 2010 | |
Christopher O. Petersen
5228 Ameriprise Financial Center Minneapolis, MN 55474
1970 | | Vice President and Secretary since 4/11 for RiverSource Funds and 3/11 for Nations Funds | | Vice President and Chief Counsel, Ameriprise Financial, Inc. since January 2010 (formerly Vice President and Group Counsel or Counsel, April 2004-January 2010); Assistant Secretary of Legacy RiverSource Funds, January 2007-April 2011 and of the Nations Funds, May 2010-March 2011 | |
Annual Report 2013
34
Columbia Marsico 21st Century Fund
Trustees and Officers (continued)
Officers (continued)
Name,
Address,
Year of Birth | | Position Held With
Funds and Length of
Service | | Principal Occupation During Past Five Years | |
Paul D. Pearson
10468 Ameriprise Financial Center Minneapolis, MN 55474
1956 | | Vice President since 4/11 and Assistant Treasurer since 1999 for RiverSource Funds and Vice President and Assistant Treasurer since 6/11 for Nations Funds | | Vice President — Investment Accounting, Columbia Management Investment Advisers, LLC, since May 2010; Vice President — Managed Assets, Investment Accounting, Ameriprise Financial Corporation, February 1998-May 2010 | |
Joseph F. DiMaria
225 Franklin Street
Boston, MA 02110
1968 | | Vice President and Chief Accounting Officer since 4/11 and Vice President since 3/11 and Chief Accounting Officer since 2008 for Nations Funds | | Vice President, Mutual Fund Administration, Columbia Management Investment Advisers, LLC, since May 2010; Director of Fund Administration, Columbia Management Advisors, LLC, January 2006-April 2010 | |
Paul B. Goucher
100 Park Avenue
New York, NY 10017
1968 | | Vice President since 4/11 and Assistant Secretary since 11/08 for RiverSource Funds and 5/10 for Nations Funds | | Vice President and Lead Chief Counsel, Ameriprise Financial, Inc. since November 2008 and January 2013, respectively (formerly, Chief Counsel, January 2010-January 2013 and Group Counsel from November 2008- January 2010); Director, Managing Director and General Counsel, J. & W. Seligman & Co. Incorporated, July 2008-November 2008 (previously, Managing Director and Associate General Counsel, January 2005-July 2008) | |
Michael E. DeFao
225 Franklin Street
Boston, MA 02110
1968 | | Vice President since 4/11 and Assistant Secretary since 5/10 for RiverSource Funds and 2011 for Nations Funds | | Vice President and Chief Counsel, Ameriprise Financial, Inc. since May 2010; Associate General Counsel, Bank of America, June 2005-April 2010 | |
Annual Report 2013
35
This page intentionally left blank.
Annual Report 2013
36
Columbia Marsico 21st Century Fund
Important Information About This Report
Each fund mails one shareholder report to each shareholder address. If you would like more than one report, please call shareholder services at 800.345.6611 and additional reports will be sent to you.
The policy of the Board is to vote the proxies of the companies in which each fund holds investments consistent with the procedures as stated in the Statement of Additional Information (SAI). You may obtain a copy of the SAI without charge by calling 800.345.6611; contacting your financial intermediary; visiting columbiamanagement.com; or searching the website of the Securities and Exchange Commission (SEC) at sec.gov. Information regarding how each fund voted proxies relating to portfolio securities is filed with the SEC by August 31 for the most recent 12-month period ending June 30 of that year, and is available without charge by visiting columbiamanagement.com; or searching the website of the SEC at sec.gov.
Each fund files a complete schedule of portfolio holdings with the SEC for the first and third quarters of each fiscal year on Form N-Q. Each fund's Form N-Q is available on the SEC's website at sec.gov and may be reviewed and copied at the SEC's Public Reference Room in Washington, D.C. Information on the operation of the Public Reference Room may be obtained by calling 800.SEC.0330. Each fund's complete schedule of portfolio holdings, as filed on Form N-Q, can also be obtained without charge, upon request, by calling 800.345.6611.
Annual Report 2013
37

Columbia Marsico 21st Century Fund
P.O. Box 8081
Boston, MA 02266-8081
columbiamanagement.com
This information is for use with concurrent or prior delivery of a fund prospectus. Please read and consider the investment objectives, risks, charges and expenses for any fund carefully before investing. For a prospectus which contains this and other important information about the Fund go to columbiamanagement.com. The Fund is distributed by Columbia Management Investment Distributors, Inc., member FINRA, and managed by Columbia Management Investment Advisers, LLC.
© 2013 Columbia Management Investment Advisers, LLC. All rights reserved.
ANN184_02_C01_(04/13)
Annual Report
February 28, 2013

Columbia Marsico Focused Equities Fund
Not FDIC insured • No bank guarantee • May lose value
Columbia Marsico Focused Equities Fund
 Dear Shareholders,
U.S. stocks flat, foreign markets strong in 2012 finale
After a strong third quarter, U.S. stock market averages treaded water as the year 2012 came to a close. However, they ended the year up strongly, as first- and third-quarter gains more than offset second- and fourth-quarter weakness. Typically a strong quarter for domestic small- and mid-cap issues, the fourth quarter of 2012 indeed proved to be another year-end positive for small-cap stocks. For the full calendar year 2012, the S&P 500 Index rose 16.00%.
Stock markets outside the United States generated some of the best returns for the fourth quarter, as optimism rebounded, thanks to the September actions of the European Central Bank in support of the euro and an improving outlook from China. Both developed and emerging foreign markets topped U.S. stocks by a solid margin.
Corporate and emerging markets led fixed income
Fixed-income investors took their cue from the equity markets and continued to favor the highest risk sectors through the end of 2012. Global fixed-income returns posted mixed results in the final quarter of the year. Gains were the highest for corporate high-yield and emerging market bonds. Although investors remained cautious ahead of the year-end budget negotiations, better economic data and a further improvement in the European sovereign debt crisis supported riskier assets and depressed government bond prices. In December, the Federal Reserve announced its intention to continue to purchase both Treasury and mortgage-backed securities and said that it would seek to keep short-term interest rates unchanged until the unemployment rate reaches 6.5%, or inflation turned noticeably higher.
Stay on track with Columbia Management
Backed by more than 100 years of experience, Columbia Management is one of the nation's largest asset managers. At the heart of our success — and, most importantly, that of our investors — are highly talented industry professionals, brought together by a unique way of working. We are dedicated to helping you take advantage of today's opportunities and anticipate tomorrow's. We stay abreast of the latest investment trends and ideas, using our collective insight to evaluate events and transform them into solutions you can use.
Visit columbiamanagement.com for:
> The Columbia Management Perspectives blog, featuring timely posts by our investment teams
> Detailed up-to-date fund performance and portfolio information
> Economic analysis and market commentary
> Quarterly fund commentaries
> Columbia Management Investor, our award-winning quarterly newsletter for shareholders
Thank you for your continued support of the Columbia Funds. We look forward to serving your investment needs for many years to come.
Best Regards,

J. Kevin Connaughton
President, Columbia Funds
The S&P 500 Index, an unmanaged index, measures the performance of 500 widely held, large-capitalization U.S. stocks and is frequently used as a general measure of market performance. Indices are not available for investment, are not professionally managed and do not reflect sales charges, fees, brokerage commissions, taxes or other expenses of investing.
Investors should consider the investment objectives, risks, charges and expenses of a mutual fund carefully before investing. For a free prospectus, which contains this and other important information about a fund, visit columbiamanagement.com. The prospectus should be read carefully before investing.
Columbia Funds are distributed by Columbia Management Investment Distributors, Inc., member FINRA, and managed by Columbia Management Investment Advisers, LLC.
© 2013 Columbia Management Investment Advisers, LLC. All rights reserved.
Columbia Marsico Focused Equities Fund
Performance Overview | | | 2 | | |
Manager Discussion of Fund Performance | | | 4 | | |
Understanding Your Fund's Expenses | | | 6 | | |
Portfolio of Investments | | | 7 | | |
Statement of Assets and Liabilities | | | 10 | | |
Statement of Operations | | | 12 | | |
Statement of Changes in Net Assets | | | 13 | | |
Financial Highlights | | | 15 | | |
Notes to Financial Statements | | | 21 | | |
Report of Independent Registered
Public Accounting Firm | | | 28 | | |
Federal Income Tax Information | | | 29 | | |
Trustees and Officers | | | 30 | | |
Important Information About This Report | | | 37 | | |
Fund Investment Manager
Columbia Management Investment
Advisers, LLC
225 Franklin Street
Boston, MA 02110
Fund Distributor
Columbia Management Investment
Distributors, Inc.
225 Franklin Street
Boston, MA 02110
Fund Transfer Agent
Columbia Management Investment
Services Corp.
P.O. Box 8081
Boston, MA 02266-8081
For more information about any of the funds, please visit columbiamanagement.com or call 800.345.6611. Customer Service Representatives are available to answer your questions Monday through Friday from 8 a.m. to 8 p.m. Eastern time.
The views expressed in this report reflect the current views of the respective parties. These views are not guarantees of future performance and involve certain risks, uncertainties and assumptions that are difficult to predict, so actual outcomes and results may differ significantly from the views expressed. These views are subject to change at any time based upon economic, market or other conditions and the respective parties disclaim any responsibility to update such views. These views may not be relied on as investment advice and, because investment decisions for a Columbia Fund are based on numerous factors, may not be relied on as an indication of trading intent on behalf of any particular Columbia Fund. References to specific securities should not be construed as a recommendation or investment advice.
Columbia Marsico Focused Equities Fund
Performance Summary
> Columbia Marsico Focused Equities Fund (the Fund) Class A shares returned 6.84% excluding sales charges for the 12-month period that ended February 28, 2013.
> The Fund underperformed its benchmark, the S&P 500 Index, which returned 13.46% for the same 12-month period.
> Stock selection in several sectors, as well as underweight allocations to the consumer staples and financials sectors detracted from performance.
Average Annual Total Returns (%) (for period ended February 28, 2013)
| | Inception | | 1 Year | | 5 Years | | 10 Years | |
Class A | | 12/31/97 | | | | | | | |
Excluding sales charges | | | | | 6.84 | | | | 4.05 | | | | 8.01 | | |
Including sales charges | | | | | 0.68 | | | | 2.83 | | | | 7.37 | | |
Class B | | 12/31/97 | | | | | | | |
Excluding sales charges | | | | | 6.09 | | | | 3.28 | | | | 7.21 | | |
Including sales charges | | | | | 1.90 | | | | 2.95 | | | | 7.21 | | |
Class C | | 12/31/97 | | | | | | | |
Excluding sales charges | | | | | 6.02 | | | | 3.27 | | | | 7.21 | | |
Including sales charges | | | | | 5.18 | | | | 3.27 | | | | 7.21 | | |
Class I* | | 09/27/10 | | | 7.29 | | | | 4.34 | | | | 8.16 | | |
Class R4* | | 11/08/12 | | | 6.91 | | | | 4.07 | | | | 8.02 | | |
Class Z | | 12/31/97 | | | 7.12 | | | | 4.32 | | | | 8.29 | | |
S&P 500 Index | | | | | 13.46 | | | | 4.94 | | | | 8.24 | | |
Returns for Class A are shown with and without the maximum initial sales charge of 5.75%. Returns for Class B are shown with and without the applicable contingent deferred sales charge (CDSC) of 5.00% in the first year, declining to 1.00% in the sixth year and eliminated thereafter. Returns for Class C are shown with and without the 1.00% CDSC for the first year only. The Fund's other classes are not subject to sales charges and have limited eligibility. Please see the Fund's prospectuses for details. Performance for different share classes will vary based on differences in sales charges and fees associated with each class. All results shown assume reinvestment of distributions during the period. Returns do not reflect the deduction of taxes that a shareholder may pay on Fund distributions or on the redemption of Fund shares. Performance results reflect the effect of any fee waivers or reimbursements of Fund expenses by Columbia Management Investment Advisers, LLC and/or any of its affiliates. Absent these fee waivers or expense reimbursement arrangements, performance results would have been lower.
The performance information shown represents past performance and is not a guarantee of future results. The investment return and principal value of your investment will fluctuate so that your shares, when redeemed, may be worth more or less than their original cost. Current performance may be lower or higher than the performance information shown. You may obtain performance information current to the most recent month-end by contacting your financial intermediary, visiting columbiamanagement.com or calling 800.345.6611.
*The returns shown for periods prior to the share class inception date (including returns for the Life of the Fund, if shown, which are since Fund inception) include the returns of the Fund's oldest share class. Since the Fund launched more than one share class at its inception, Class A shares were used. These returns are adjusted to reflect any higher class-related operating expenses of the newer share classes, as applicable. Please visit columbiamanagement.com/mutual-funds/appended-performance for more information.
The S&P 500 Index, an unmanaged index, measures the performance of 500 widely held, large-capitalization U.S. stocks and is frequently used as a general measure of market performance.
Indices are not available for investment, are not professionally managed and do not reflect sales charges, fees, brokerage commissions, taxes or other expenses of investing. Securities in the Fund may not match those in an index.
Annual Report 2013
2
Columbia Marsico Focused Equities Fund
Performance Overview (continued)
Performance of a Hypothetical $10,000 Investment (March 1, 2003 – February 28, 2013)
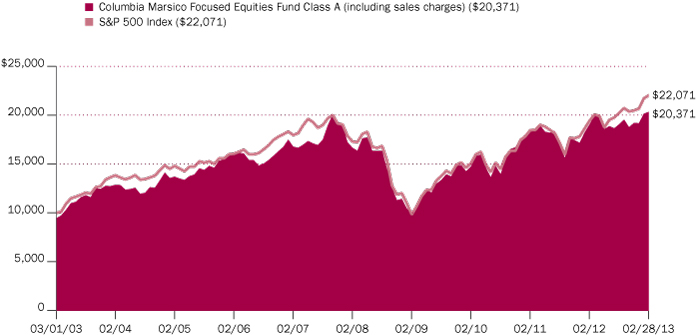
The chart above shows the change in value of a hypothetical $10,000 investment in Class A shares of Columbia Marsico Focused Equities Fund during the stated time period, and does not reflect the deduction of taxes that a shareholder may pay on Fund distributions or on the redemption of Fund shares.
Annual Report 2013
3
Columbia Marsico Focused Equities Fund
Manager Discussion of Fund Performance
For the 12-month period that ended February 28, 2013, the Fund's Class A shares returned 6.84% excluding sales charges. The Fund's benchmark, the S&P 500 Index, returned 13.46% for the same 12-month period. Stock selection in the consumer discretionary, energy, financials, consumer staples and industrials sectors was disappointing. Underweight positions in the consumer staples and financials areas also hurt performance. On the positive side, stock selection in information technology and materials and an overweight allocation to the strong-performing consumer discretionary and health care sectors aided results.
Stock Selection, Sector Underweights Detracted
Although the consumer discretionary sector was a strong performer in the benchmark, the Fund's stock selection proved disappointing. Restaurant operators Chipotle Mexican Grill and McDonald's posted negative returns. McDonald's, a long-term Fund holding, was hurt by global economic uncertainty, while unfavorable currency exchange rates hurt its international results. We trimmed the Fund's position in the stock but continue to believe it is an attractive long-term investment. Other disappointing performers in the sector included discount retailer Dollar General (which was sold from the portfolio) and athletic apparel firm Nike.
Stock selection in the energy and financial sectors also detracted from relative results. Energy services firms Halliburton and Occidental Petroleum had negative returns and were sold. The Fund's financials holdings had positive returns, but were disappointing compared to the sector's return in the index. Individual holdings with double-digit losses also weighed on results: heavy equipment engine manufacturer Cummins, Chinese Internet search engine Baidu, Mead Johnson Nutrition and software firm VMware. The latter three were sold.
Technology and Materials Aided Results
Stock selection in the information technology and materials sectors buoyed results. In the former, Apple and financial transaction processor Visa were leading contributors. We sold Apple in January 2013 owing to concerns about the company's future revenue growth. The sale had a favorable impact on Fund results because the stock declined in the final weeks of the fiscal year. Within materials, agricultural materials company Monsanto was a strong performer as it benefited from increased use of its U.S. corn and soybean products, as well as strong performance in its international seeds and traits business. Meanwhile, home improvement retailer Home Depot was also a strong contributor to Fund results. The health care and consumer discretionary sectors were also good performers in the index, and the Fund benefited from overweight allocations to both. Biotechnology firms Biogen Idec and Gilead Sciences (the top two Fund holdings) had strong price gains.
Looking Ahead
Overall, we currently think U.S. and international economic prospects are generally improving. Large capitalization stocks are presently trading at reasonable valuations. However, serious fiscal challenges remain, both in the United States and abroad. Uncertainty about government economic policy is currently high and additional tax hikes and spending cuts are likely. The question
Portfolio Management
Marsico Capital Management, LLC
Thomas Marsico
Coralie Witter, CFA
Morningstar Style BoxTM

The Morningstar Style BoxTM is based on a fund's portfolio holdings. For equity funds, the vertical axis shows the market capitalization of the stocks owned, and the horizontal axis shows investment style (value, blend, or growth). Information shown is based on the most recent data provided by Morningstar.
©2013 Morningstar, Inc. All rights reserved. The Morningstar information contained herein: (1) is proprietary to Morningstar and/or its content providers; (2) may not be copied or distributed; and (3) is not warranted to be accurate, complete or timely. Neither Morningstar nor its content providers are responsible for any damages or losses arising from any use of this information.
Annual Report 2013
4
Columbia Marsico Focused Equities Fund
Manager Discussion of Fund Performance (continued)
is whether fiscal tightening can be done in a balanced and sensible manner. A major policy misstep could have profound repercussions for the economy. Still, there currently is significant pent-up demand for vehicles, houses, travel and leisure activities and corporate capital spending. If this demand is unleashed, it may have a beneficial impact on job growth and corporate profits.
Against this current backdrop, we are emphasizing companies that we believe have a high degree of earnings visibility, unleveraged balance sheets and are buying back stock and increasing dividends. There are several themes at work in the Fund. At present, it has a significant consumer discretionary exposure, with many of the positions being more staple-like in nature, meaning they offer needed rather than wanted products and services. We are also currently focusing on health care, particularly pharmaceuticals. A number of drug companies offer robust new product pipelines for unmet clinical needs. Other themes include recoveries in U.S. housing, manufacturing and automobiles. We think the U.S. manufacturing sector has the potential to benefit from an inexpensive and growing supply of natural gas that provides a significant cost advantage.
During the period, we increased the Fund's allocation to the health care and financials sectors. We reduced allocations to the energy, information technology, consumer discretionary and materials sectors. At period end, the Fund's sector allocations emphasized consumer discretionary, financials, information technology and health care. It had no investments in the utilities or telecommunication services sectors.
Top Ten Holdings (%)
(at February 28, 2013) | |
Biogen Idec, Inc. | | | 5.3 | | |
Gilead Sciences, Inc. | | | 5.1 | | |
Wells Fargo & Co. | | | 4.7 | | |
Bristol-Myers Squibb Co. | | | 4.4 | | |
Google, Inc., Class A | | | 4.4 | | |
eBay, Inc. | | | 4.4 | | |
Visa, Inc., Class A | | | 4.3 | | |
Nike, Inc., Class B | | | 4.0 | | |
Monsanto Co. | | | 3.9 | | |
Precision Castparts Corp. | | | 3.8 | | |
Percentages indicated are based upon total investments (excluding Money Market Funds).
For further detail about these holdings, please refer to the section entitled "Portfolio of Investments."
Fund holdings are as of the date given, are subject to change at any time, and are not recommendations to buy or sell any security.
Portfolio Breakdown (%)
(at February 28, 2013) | |
Common Stocks | | | 97.3 | | |
Consumer Discretionary | | | 26.7 | | |
Consumer Staples | | | 4.5 | | |
Energy | | | 5.6 | | |
Financials | | | 14.3 | | |
Health Care | | | 17.6 | | |
Industrials | | | 7.2 | | |
Information Technology | | | 17.6 | | |
Materials | | | 3.8 | | |
Money Market Funds | | | 2.7 | | |
Total | | | 100.0 | | |
Percentages indicated are based upon total investments. The Fund's portfolio composition is subject to change.
Annual Report 2013
5
Columbia Marsico Focused Equities Fund
Understanding Your Fund's Expenses
(Unaudited)
As an investor, you incur two types of costs. There are transaction costs, which generally include sales charges on purchases and may include redemption fees. There are also ongoing costs, which generally include management fees, distribution and service (Rule 12b-1) fees, and other fund expenses. The following information is intended to help you understand your ongoing costs (in dollars) of investing in the Fund and to help you compare these costs with the ongoing costs of investing in other mutual funds.
Analyzing Your Fund's Expenses
To illustrate these ongoing costs, we have provided examples and calculated the expenses paid by investors in each share class of the Fund during the period. The actual and hypothetical information in the table is based on an initial investment of $1,000 at the beginning of the period indicated and held for the entire period. Expense information is calculated two ways and each method provides you with different information. The amount listed in the "Actual" column is calculated using the Fund's actual operating expenses and total return for the period. You may use the Actual information, together with the amount invested, to estimate the expenses that you paid over the period. Simply divide your account value by $1,000 (for example, an $8,600 account value divided by $1,000 = 8.6), then multiply the results by the expenses paid during the period under the Actual column. The amount listed in the "Hypothetical" column assumes a 5% annual rate of return before expenses (which is not the Fund's actual return) and then applies the Fund's actual expense ratio for the period to the hypothetical return. You should not use the hypothetical account values and expenses to estimate either your actual account balance at the end of the period or the expenses you paid during the period. See "Compare With Other Funds" below for details on how to use the hypothetical data.
Compare With Other Funds
Since all mutual funds are required to include the same hypothetical calculations about expenses in shareholder reports, you can use this information to compare the ongoing cost of investing in the Fund with other funds. To do so, compare the hypothetical example with the 5% hypothetical examples that appear in the shareholder reports of other funds. As you compare hypothetical examples of other funds, it is important to note that hypothetical examples are meant to highlight the ongoing costs of investing in a fund only and do not reflect any transaction costs, such as sales charges, or redemption or exchange fees. Therefore, the hypothetical calculations are useful in comparing ongoing costs only, and will not help you determine the relative total costs of owning different funds. If transaction costs were included in these calculations, your costs would be higher.
September 1, 2012 – February 28, 2013
| | Account Value at the Beginning
of the Period ($) | | Account Value at the End of the
Period ($) | | Expenses Paid During the
Period ($) | | Fund's Annualized
Expense Ratio (%) | |
| | Actual | | Hypothetical | | Actual | | Hypothetical | | Actual | | Hypothetical | | Actual | |
Class A | | | 1,000.00 | | | | 1,000.00 | | | | 1,065.70 | | | | 1,018.60 | | | | 6.40 | | | | 6.26 | | | | 1.25 | | |
Class B | | | 1,000.00 | | | | 1,000.00 | | | | 1,062.50 | | | | 1,014.88 | | | | 10.23 | | | | 9.99 | | | | 2.00 | | |
Class C | | | 1,000.00 | | | | 1,000.00 | | | | 1,061.70 | | | | 1,014.88 | | | | 10.22 | | | | 9.99 | | | | 2.00 | | |
Class I | | | 1,000.00 | | | | 1,000.00 | | | | 1,068.20 | | | | 1,020.63 | | | | 4.31 | | | | 4.21 | | | | 0.84 | | |
Class R4 | | | 1,000.00 | | | | 1,000.00 | | | | 1,108.80 | * | | | 1,019.89 | | | | 3.17 | * | | | 4.96 | | | | 0.99 | * | |
Class Z | | | 1,000.00 | | | | 1,000.00 | | | | 1,067.30 | | | | 1,019.84 | | | | 5.13 | | | | 5.01 | | | | 1.00 | | |
*For the period November 8, 2012 through February 28, 2013. Class R4 shares commenced operations on November 8, 2012.
Expenses paid during the period are equal to the annualized expense ratio for each class as indicated above, multiplied by the average account value over the period and then multiplied by the number of days in the Fund's most recent fiscal half year and divided by 365.
Expenses do not include fees and expenses incurred indirectly by the Fund from the underlying funds in which the Fund may invest (also referred to as "acquired funds"), including affiliated and non-affiliated pooled investment vehicles (including mutual funds and exchange-traded funds).
Had Columbia Management Investment Advisers, LLC and/or certain of its affiliates not waived/reimbursed certain fees and expenses, account value at the end of the period would have been reduced.
Annual Report 2013
6
Columbia Marsico Focused Equities Fund
Portfolio of Investments
February 28, 2013
(Percentages represent value of investments compared to net assets)
Common Stocks 99.1%
Issuer | | Shares | | Value ($) | |
Consumer Discretionary 27.2% | |
Hotels, Restaurants & Leisure 9.9% | |
Chipotle Mexican Grill, Inc.(a) | | | 116,444 | | | | 36,888,295 | | |
McDonald's Corp. | | | 307,323 | | | | 29,472,276 | | |
Starbucks Corp. | | | 654,329 | | | | 35,870,316 | | |
Wynn Resorts Ltd. | | | 459,318 | | | | 53,694,274 | | |
Total | | | | | 155,925,161 | | |
Media 2.1% | |
Comcast Corp., Class A | | | 825,299 | | | | 32,838,647 | | |
Specialty Retail 11.3% | |
AutoZone, Inc.(a) | | | 104,204 | | | | 39,613,151 | | |
Home Depot, Inc. (The) | | | 812,711 | | | | 55,670,703 | | |
Lowe's Companies, Inc. | | | 919,183 | | | | 35,066,831 | | |
TJX Companies, Inc. | | | 1,063,315 | | | | 47,817,276 | | |
Total | | | | | 178,167,961 | | |
Textiles, Apparel & Luxury Goods 3.9% | |
Nike, Inc., Class B | | | 1,144,557 | | | | 62,332,574 | | |
Total Consumer Discretionary | | | | | 429,264,343 | | |
Consumer Staples 4.5% | |
Beverages 1.6% | |
Anheuser-Busch InBev NV, ADR | | | 269,449 | | | | 25,325,511 | | |
Food & Staples Retailing 2.9% | |
Wal-Mart Stores, Inc. | | | 656,379 | | | | 46,458,506 | | |
Total Consumer Staples | | | | | 71,784,017 | | |
Energy 5.8% | |
Energy Equipment & Services 2.5% | |
Schlumberger Ltd. | | | 507,211 | | | | 39,486,376 | | |
Oil, Gas & Consumable Fuels 3.3% | |
Kinder Morgan, Inc. | | | 1,384,468 | | | | 51,322,229 | | |
Total Energy | | | | | 90,808,605 | | |
Financials 14.5% | |
Commercial Banks 4.6% | |
Wells Fargo & Co. | | | 2,073,368 | | | | 72,733,750 | | |
Consumer Finance 2.0% | |
American Express Co. | | | 515,896 | | | | 32,062,936 | | |
Diversified Financial Services 2.8% | |
Citigroup, Inc. | | | 1,044,776 | | | | 43,849,249 | | |
Common Stocks (continued)
Issuer | | Shares | | Value ($) | |
Insurance 3.1% | |
American International Group, Inc.(a) | | | 1,273,616 | | | | 48,410,144 | | |
Real Estate Investment Trusts (REITs) 2.0% | |
American Tower Corp. | | | 419,292 | | | | 32,537,059 | | |
Total Financials | | | | | 229,593,138 | | |
Health Care 18.0% | |
Biotechnology 10.9% | |
Biogen Idec, Inc.(a) | | | 497,694 | | | | 82,786,420 | | |
Celgene Corp.(a) | | | 82,815 | | | | 8,544,852 | | |
Gilead Sciences, Inc.(a) | | | 1,876,458 | | | | 80,143,521 | | |
Total | | | | | 171,474,793 | | |
Health Care Equipment & Supplies 2.7% | |
Intuitive Surgical, Inc.(a) | | | 83,748 | | | | 42,702,268 | | |
Pharmaceuticals 4.4% | |
Bristol-Myers Squibb Co. | | | 1,881,804 | | | | 69,570,294 | | |
Total Health Care | | | | | 283,747,355 | | |
Industrials 7.3% | |
Aerospace & Defense 3.8% | |
Precision Castparts Corp. | | | 318,520 | | | | 59,432,647 | | |
Machinery 1.1% | |
Cummins, Inc. | | | 152,721 | | | | 17,695,782 | | |
Road & Rail 2.4% | |
Union Pacific Corp. | | | 276,211 | | | | 37,871,290 | | |
Total Industrials | | | | | 114,999,719 | | |
Information Technology 18.0% | |
Internet Software & Services 10.7% | |
eBay, Inc.(a) | | | 1,261,875 | | | | 68,999,325 | | |
Equinix, Inc.(a) | | | 146,632 | | | | 31,020,000 | | |
Google, Inc., Class A(a) | | | 86,145 | | | | 69,019,374 | | |
Total | | | | | 169,038,699 | | |
IT Services 7.3% | |
Accenture PLC, Class A | | | 629,772 | | | | 46,829,846 | | |
Visa, Inc., Class A | | | 424,546 | | | | 67,349,977 | | |
Total | | | | | 114,179,823 | | |
Total Information Technology | | | | | 283,218,522 | | |
The accompanying Notes to Financial Statements are an integral part of this statement.
Annual Report 2013
7
Columbia Marsico Focused Equities Fund
Portfolio of Investments (continued)
February 28, 2013
Common Stocks (continued)
Issuer | | Shares | | Value ($) | |
Materials 3.8% | |
Chemicals 3.8% | |
Monsanto Co. | | | 599,429 | | | | 60,560,312 | | |
Total Materials | | | | | 60,560,312 | | |
Total Common Stocks
(Cost: $1,225,167,203) | | | | | 1,563,976,011 | | |
Money Market Funds 2.8%
| | | Shares | | Value ($) | |
Columbia Short-Term Cash Fund,
0.128%(b)(c) | | | 43,733,734 | | | | 43,733,734 | | |
Total Money Market Funds
(Cost: $43,733,734) | | | | | 43,733,734 | | |
Total Investments
(Cost: $1,268,900,937) | | | | | 1,607,709,745 | | |
Other Assets & Liabilities, Net | | | | | (30,590,589 | ) | |
Net Assets | | | | | 1,577,119,156 | | |
Notes to Portfolio of Investments
(a) Non-income producing.
(b) The rate shown is the seven-day current annualized yield at February 28, 2013.
(c) As defined in the Investment Company Act of 1940, an affiliated company is one in which the Fund owns 5% or more of its outstanding voting securities, or a company which is under common ownership or control with the Fund. Holdings and transactions in these affiliated companies during the year ended February 28, 2013, are as follows:
Issuer | | Beginning
Cost ($) | | Purchase
Cost ($) | | Proceeds
From Sales ($) | | Ending
Cost ($) | | Dividends —
Affiliated
Issuers ($) | | Value ($) | |
Columbia Short-Term Cash Fund | | | 115,542,763 | | | | 1,029,161,511 | | | | (1,100,970,540 | ) | | | 43,733,734 | | | | 94,285 | | | | 43,733,734 | | |
Abbreviation Legend
ADR American Depositary Receipt
Fair Value Measurements
Generally accepted accounting principles (GAAP) require disclosure regarding the inputs and valuation techniques used to measure fair value and any changes in valuation inputs or techniques. In addition, investments shall be disclosed by major category.
The Fund categorizes its fair value measurements according to a three-level hierarchy that maximizes the use of observable inputs and minimizes the use of unobservable inputs by prioritizing that the most observable input be used when available. Observable inputs are those that market participants would use in pricing an investment based on market data obtained from sources independent of the reporting entity. Unobservable inputs are those that reflect the Fund's assumptions about the information market participants would use in pricing an investment. An investment's level within the fair value hierarchy is based on the lowest level of any input that is deemed significant to the asset or liability's fair value measurement. The input levels are not necessarily an indication of the risk or liquidity associated with investments at that level. For example, certain U.S. government securities are generally high quality and liquid, however, they are reflected as Level 2 because the inputs used to determine fair value may not always be quoted prices in an active market.
Fair value inputs are summarized in the three broad levels listed below:
> Level 1 — Valuations based on quoted prices for investments in active markets that the Fund has the ability to access at the measurement date (including NAV for open-end mutual funds). Valuation adjustments are not applied to Level 1 investments.
> Level 2 — Valuations based on other significant observable inputs (including quoted prices for similar securities, interest rates, prepayment speeds, credit risks, etc.).
> Level 3 — Valuations based on significant unobservable inputs (including the Fund's own assumptions and judgment in determining the fair value of investments).
Inputs that are used in determining fair value of an investment may include price information, credit data, volatility statistics, and other factors. These inputs can be either observable or unobservable. The availability of observable inputs can vary between investments, and is affected by various factors such as the type of investment, and the volume and level of activity for that investment or similar investments in the marketplace. The inputs will be considered by the Investment Manager, along with any other relevant factors in the calculation of an investment's fair value. The Fund uses prices and inputs that are current as of the measurement date, which may include periods of market dislocations. During these periods, the availability of prices and inputs may be reduced for many investments. This condition could cause an investment to be reclassified between the various levels within the hierarchy.
The accompanying Notes to Financial Statements are an integral part of this statement.
Annual Report 2013
8
Columbia Marsico Focused Equities Fund
Portfolio of Investments (continued)
February 28, 2013
Fair Value Measurements (continued)
Investments falling into the Level 3 category are primarily supported by quoted prices from brokers and dealers participating in the market for those investments. However, these may be classified as Level 3 investments due to lack of market transparency and corroboration to support these quoted prices. Additionally, valuation models may be used as the pricing source for any remaining investments classified as Level 3. These models rely on one or more significant unobservable inputs and/or significant assumptions by the Investment Manager. Inputs used in valuations may include, but are not limited to, financial statement analysis, capital account balances, discount rates and estimated cash flows, and comparable company data.
Under the direction of the Fund's Board of Trustees (the Board), the Investment Manager's Valuation Committee (the Committee) is responsible for carrying out the valuation procedures approved by the Board. The Committee consists of voting and non-voting members from various groups within the Investment Manager's organization, including operations and accounting, trading and investments, compliance, risk management and legal.
The Committee meets at least monthly to review and approve valuation matters, which may include a description of specific valuation determinations, data regarding pricing information received from approved pricing vendors and brokers and the results of Board-approved valuation control policies and procedures (the Policies). The Policies address, among other things, instances when market quotations are readily available, including recommendations of third party pricing vendors and a determination of appropriate pricing methodologies; events that require specific valuation determinations and assessment of fair value techniques; securities with a potential for stale pricing, including those that are illiquid, restricted, or in default; and the effectiveness of third-party pricing vendors, including periodic reviews of vendors. The Committee meets more frequently, as needed, to discuss additional valuation matters, which may include the need to review back-testing results, review time-sensitive information or approve related valuation actions. The Committee reports to the Board, with members of the Committee meeting with the Board at each of its regularly scheduled meetings to discuss valuation matters and actions during the period, similar to those described earlier.
For investments categorized as Level 3, the Committee monitors information similar to that described above, which may include: (i) data specific to the issuer or comparable issuers, (ii) general market or specific sector news and (iii) quoted prices and specific or similar security transactions. The Committee considers this data and any changes from prior periods in order to assess the reasonableness of observable and unobservable inputs, any assumptions or internal models used to value those securities and changes in fair value. This data is also used to corroborate, when available, information received from approved pricing vendors and brokers. Various factors impact the frequency of monitoring this information (which may occur as often as daily). However, the Committee may determine that changes to inputs, assumptions and models are not required as a result of the monitoring procedures performed.
The following table is a summary of the inputs used to value the Fund's investments at February 28, 2013:
Description | | Level 1
Quoted Prices in Active
Markets for Identical
Assets ($) | | Level 2
Other Significant
Observable Inputs ($) | | Level 3
Significant
Unobservable Inputs ($) | | Total ($) | |
Equity Securities | |
Common Stocks | |
Consumer Discretionary | | | 429,264,343 | | | | — | | | | — | | | | 429,264,343 | | |
Consumer Staples | | | 71,784,017 | | | | — | | | | — | | | | 71,784,017 | | |
Energy | | | 90,808,605 | | | | — | | | | — | | | | 90,808,605 | | |
Financials | | | 229,593,138 | | | | — | | | | — | | | | 229,593,138 | | |
Health Care | | | 283,747,355 | | | | — | | | | — | | | | 283,747,355 | | |
Industrials | | | 114,999,719 | | | | — | | | | — | | | | 114,999,719 | | |
Information Technology | | | 283,218,522 | | | | — | | | | — | | | | 283,218,522 | | |
Materials | | | 60,560,312 | | | | — | | | | — | | | | 60,560,312 | | |
Total Equity Securities | | | 1,563,976,011 | | | | — | | | | — | | | | 1,563,976,011 | | |
Other | |
Money Market Funds | | | 43,733,734 | | | | — | | | | — | | | | 43,733,734 | | |
Total Other | | | 43,733,734 | | | | — | | | | — | | | | 43,733,734 | | |
Total | | | 1,607,709,745 | | | | — | | | | — | | | | 1,607,709,745 | | |
See the Portfolio of Investments for all investment classifications not indicated in the table.
There were no transfers of financial assets between Levels 1 and 2 during the period.
The accompanying Notes to Financial Statements are an integral part of this statement.
Annual Report 2013
9
Columbia Marsico Focused Equities Fund
Statement of Assets and Liabilities
February 28, 2013
Assets | |
Investments, at value | |
Unaffiliated issuers (identified cost $1,225,167,203) | | $ | 1,563,976,011 | | |
Affiliated issuers (identified cost $43,733,734) | | | 43,733,734 | | |
Total investments (identified cost $1,268,900,937) | | | 1,607,709,745 | �� | |
Receivable for: | |
Investments sold | | | 25,605,244 | | |
Capital shares sold | | | 1,650,334 | | |
Dividends | | | 1,691,444 | | |
Prepaid expenses | | | 5,855 | | |
Other assets | | | 3,296 | | |
Total assets | | | 1,636,665,918 | | |
Liabilities | |
Payable for: | |
Investments purchased | | | 55,005,445 | | |
Capital shares purchased | | | 3,940,960 | | |
Investment management fees | | | 28,629 | | |
Distribution and/or service fees | | | 13,023 | | |
Transfer agent fees | | | 321,451 | | |
Administration fees | | | 2,374 | | |
Compensation of board members | | | 102,567 | | |
Expense reimbursement due to Investment Manager | | | 5,419 | | |
Other expenses | | | 126,894 | | |
Total liabilities | | | 59,546,762 | | |
Net assets applicable to outstanding capital stock | | $ | 1,577,119,156 | | |
Represented by | |
Paid-in capital | | $ | 1,141,062,475 | | |
Excess of distributions over net investment income | | | (2,335,566 | ) | |
Accumulated net realized gain | | | 99,583,439 | | |
Unrealized appreciation (depreciation) on: | |
Investments | | | 338,808,808 | | |
Total — representing net assets applicable to outstanding capital stock | | $ | 1,577,119,156 | | |
The accompanying Notes to Financial Statements are an integral part of this statement.
Annual Report 2013
10
Columbia Marsico Focused Equities Fund
Statement of Assets and Liabilities (continued)
February 28, 2013
Class A | |
Net assets | | $ | 932,546,429 | | |
Shares outstanding | | | 44,739,998 | | |
Net asset value per share | | $ | 20.84 | | |
Maximum offering price per share(a) | | $ | 22.11 | | |
Class B | |
Net assets | | $ | 14,818,068 | | |
Shares outstanding | | | 807,681 | | |
Net asset value per share | | $ | 18.35 | | |
Class C | |
Net assets | | $ | 225,678,348 | | |
Shares outstanding | | | 12,248,748 | | |
Net asset value per share | | $ | 18.42 | | |
Class I | |
Net assets | | $ | 2,615 | | |
Shares outstanding | | | 121 | | |
Net asset value per share(b) | | $ | 21.53 | | |
Class R4 | |
Net assets | | $ | 2,390 | | |
Shares outstanding | | | 110 | | |
Net asset value per share(b) | | $ | 21.72 | | |
Class Z | |
Net assets | | $ | 404,071,306 | | |
Shares outstanding | | | 18,845,632 | | |
Net asset value per share | | $ | 21.44 | | |
(a) The maximum offering price per share is calculated by dividing the net asset value by 1.0 minus the maximum sales charge of 5.75%.
(b) Net asset value per share rounds to this amount due to fractional shares outstanding.
The accompanying Notes to Financial Statements are an integral part of this statement.
Annual Report 2013
11
Columbia Marsico Focused Equities Fund
Statement of Operations
Year Ended February 28, 2013
Net investment income | |
Income: | |
Dividends — unaffiliated issuers | | $ | 24,130,863 | | |
Dividends — affiliated issuers | | | 94,285 | | |
Interest | | | 363 | | |
Income from securities lending — net | | | 4,783,450 | | |
Total income | | | 29,008,961 | | |
Expenses: | |
Investment management fees | | | 12,456,659 | | |
Distribution and/or service fees | |
Class A | | | 2,485,296 | | |
Class B | | | 187,697 | | |
Class C | | | 2,414,264 | | |
Transfer agent fees | |
Class A | | | 1,876,883 | | |
Class B | | | 35,323 | | |
Class C | | | 456,105 | | |
Class R4(a) | | | 1 | | |
Class Z | | | 1,090,671 | | |
Administration fees | | | 3,771,874 | | |
Compensation of board members | | | 63,575 | | |
Custodian fees | | | 16,652 | | |
Printing and postage fees | | | 94,434 | | |
Registration fees | | | 152,092 | | |
Professional fees | | | 57,844 | | |
Other | | | 60,143 | | |
Total expenses | | | 25,219,513 | | |
Fees waived or expenses reimbursed by Investment Manager and its affiliates | | | (1,025,662 | ) | |
Expense reductions | | | (4,647 | ) | |
Total net expenses | | | 24,189,204 | | |
Net investment income | | | 4,819,757 | | |
Realized and unrealized gain (loss) — net | |
Net realized gain (loss) on: | |
Investments | | | 368,994,633 | | |
Foreign currency translations | | | (67,054 | ) | |
Net realized gain | | | 368,927,579 | | |
Net change in unrealized appreciation (depreciation) on: | |
Investments | | | (253,060,050 | ) | |
Foreign currency translations | | | (95 | ) | |
Net change in unrealized appreciation (depreciation) | | | (253,060,145 | ) | |
Net realized and unrealized gain | | | 115,867,434 | | |
Net increase in net assets resulting from operations | | $ | 120,687,191 | | |
(a) Class R4 shares are for the period from November 8, 2012 (commencement of operations) to February 28, 2013.
The accompanying Notes to Financial Statements are an integral part of this statement.
Annual Report 2013
12
Columbia Marsico Focused Equities Fund
Statement of Changes in Net Assets
| | | Year Ended
February 28,
2013(a) | | Year Ended
February 29,
2012 | |
Operations | |
Net investment income | | $ | 4,819,757 | | | $ | 2,697,486 | | |
Net realized gain | | | 368,927,579 | | | | 300,116,756 | | |
Net change in unrealized appreciation (depreciation) | | | (253,060,145 | ) | | | (219,767,843 | ) | |
Net increase in net assets resulting from operations | | | 120,687,191 | | | | 83,046,399 | | |
Distributions to shareholders | |
Net investment income | |
Class A | | | (4,477,020 | ) | | | (573,926 | ) | |
Class I | | | (24 | ) | | | (11 | ) | |
Class R4 | | | (19 | ) | | | — | | |
Class Z | | | (2,956,813 | ) | | | (2,594,756 | ) | |
Net realized gains | |
Class A | | | (187,615,794 | ) | | | (14,846,323 | ) | |
Class B | | | (3,841,675 | ) | | | (389,717 | ) | |
Class C | | | (51,321,227 | ) | | | (3,789,432 | ) | |
Class I | | | (555 | ) | | | (37 | ) | |
Class R4 | | | (339 | ) | | | — | | |
Class Z | | | (95,628,685 | ) | | | (13,503,688 | ) | |
Total distributions to shareholders | | | (345,842,151 | ) | | | (35,697,890 | ) | |
Increase (decrease) in net assets from capital stock activity | | | (649,517,051 | ) | | | (445,676,081 | ) | |
Total decrease in net assets | | | (874,672,011 | ) | | | (398,327,572 | ) | |
Net assets at beginning of year | | | 2,451,791,167 | | | | 2,850,118,739 | | |
Net assets at end of year | | $ | 1,577,119,156 | | | $ | 2,451,791,167 | | |
Excess of distributions over net investment income | | $ | (2,335,566 | ) | | $ | (65,661 | ) | |
(a) Class R4 shares are for the period from November 8, 2012 (commencement of operations) to February 28, 2013.
The accompanying Notes to Financial Statements are an integral part of this statement.
Annual Report 2013
13
Columbia Marsico Focused Equities Fund
Statement of Changes in Net Assets (continued)
| | | Year Ended February 28, 2013(a) | | Year Ended February 29, 2012 | |
| | | Shares | | Dollars ($) | | Shares | | Dollars ($) | |
Capital stock activity | |
Class A shares | |
Subscriptions(b) | | | 6,980,940 | | | | 155,143,861 | | | | 8,090,553 | | | | 184,044,149 | | |
Distributions reinvested | | | 7,681,988 | | | | 157,483,656 | | | | 528,991 | | | | 11,637,803 | | |
Redemptions | | | (16,957,060 | ) | | | (388,145,892 | ) | | | (19,811,566 | ) | | | (453,046,764 | ) | |
Net decrease | | | (2,294,132 | ) | | | (75,518,375 | ) | | | (11,192,022 | ) | | | (257,364,812 | ) | |
Class B shares | |
Subscriptions | | | 115,842 | | | | 2,125,284 | | | | 22,816 | | | | 462,254 | | |
Distributions reinvested | | | 89,978 | | | | 1,641,505 | | | | 7,804 | | | | 155,680 | | |
Redemptions(b) | | | (483,235 | ) | | | (9,837,671 | ) | | | (1,049,502 | ) | | | (21,648,084 | ) | |
Net decrease | | | (277,415 | ) | | | (6,070,882 | ) | | | (1,018,882 | ) | | | (21,030,150 | ) | |
Class C shares | |
Subscriptions | | | 1,743,011 | | | | 32,705,231 | | | | 514,678 | | | | 10,608,656 | | |
Distributions reinvested | | | 1,301,180 | | | | 23,722,704 | | | | 84,636 | | | | 1,693,561 | | |
Redemptions | | | (2,730,710 | ) | | | (54,773,353 | ) | | | (2,811,937 | ) | | | (58,086,548 | ) | |
Net increase (decrease) | | | 313,481 | | | | 1,654,582 | | | | (2,212,623 | ) | | | (45,784,331 | ) | |
Class I shares | |
Subscriptions | | | — | | | | — | | | | 32,484 | | | | 791,497 | | |
Redemptions | | | — | | | | — | | | | (1,232,495 | ) | | | (29,338,948 | ) | |
Net increase (decrease) | | | — | | | | — | | | | (1,200,011 | ) | | | (28,547,451 | ) | |
Class R4 shares | |
Subscriptions | | | 110 | | | | 2,500 | | | | — | | | | — | | |
Net increase | | | 110 | | | | 2,500 | | | | — | | | | — | | |
Class Z shares | |
Subscriptions | | | 5,199,659 | | | | 120,644,765 | | | | 10,118,134 | | | | 240,278,094 | | |
Distributions reinvested | | | 3,304,164 | | | | 70,353,848 | | | | 584,625 | | | | 13,148,224 | | |
Redemptions | | | (31,257,022 | ) | | | (760,583,489 | ) | | | (14,883,910 | ) | | | (346,375,655 | ) | |
Net decrease | | | (22,753,199 | ) | | | (569,584,876 | ) | | | (4,181,151 | ) | | | (92,949,337 | ) | |
Total net decrease | | | (25,011,155 | ) | | | (649,517,051 | ) | | | (19,804,689 | ) | | | (445,676,081 | ) | |
(a) Class R4 shares are for the period from November 8, 2012 (commencement of operations) to February 28, 2013.
(b) Includes conversions of Class B shares to Class A shares, if any.
The accompanying Notes to Financial Statements are an integral part of this statement.
Annual Report 2013
14
Columbia Marsico Focused Equities Fund
The following tables are intended to help you understand the Fund's financial performance. Certain information reflects financial results for a single share of a class held for the periods shown. Per share net investment income (loss) amounts are calculated based on average shares outstanding during the period. Total return assumes reinvestment of all dividends and distributions, if any. Total return does not reflect payment of sales charges, if any, and is not annualized for periods of less than one year.
| | | Year Ended
February 28, | | Year Ended
February 29, | | Year Ended February 28, | |
Class A | | 2013 | | 2012 | | 2011 | | 2010 | | 2009 | |
Per share data | |
Net asset value, beginning of period | | $ | 24.18 | | | $ | 23.53 | | | $ | 18.99 | | | $ | 12.76 | | | $ | 21.59 | | |
Income from investment operations: | |
Net investment income | | | 0.06 | | | | 0.02 | | | | 0.00 | (a) | | | 0.01 | | | | 0.07 | | |
Net realized and unrealized gain (loss) | | | 1.28 | | | | 0.95 | | | | 4.54 | | | | 6.25 | | | | (8.86 | ) | |
Total from investment operations | | | 1.34 | | | | 0.97 | | | | 4.54 | | | | 6.26 | | | | (8.79 | ) | |
Less distributions to shareholders: | |
Net investment income | | | (0.11 | ) | | | (0.01 | ) | | | — | | | | (0.02 | ) | | | (0.04 | ) | |
Net realized gains | | | (4.57 | ) | | | (0.31 | ) | | | — | | | | — | | | | — | | |
Tax return of capital | | | — | | | | — | | | | — | | | | (0.01 | ) | | | — | | |
Total distributions to shareholders | | | (4.68 | ) | | | (0.32 | ) | | | — | | | | (0.03 | ) | | | (0.04 | ) | |
Proceeds from regulatory settlements | | | — | | | | — | | | | — | | | | 0.00 | (a) | | | — | | |
Net asset value, end of period | | $ | 20.84 | | | $ | 24.18 | | | $ | 23.53 | | | $ | 18.99 | | | $ | 12.76 | | |
Total return | | | 6.84 | % | | | 4.26 | % | | | 23.91 | % | | | 49.12 | % | | | (40.73 | %) | |
Ratios to average net assets(b)(c) | |
Total gross expenses | | | 1.34 | % | | | 1.36 | % | | | 1.30 | %(d) | | | 1.31 | %(d) | | | 1.31 | % | |
Total net expenses(e) | | | 1.29 | %(f) | | | 1.36 | %(f) | | | 1.30 | %(d)(f) | | | 1.30 | %(d)(f) | | | 1.26 | %(f) | |
Net investment income | | | 0.28 | % | | | 0.09 | % | | | 0.01 | % | | | 0.03 | % | | | 0.37 | % | |
Supplemental data | |
Net assets, end of period (in thousands) | | $ | 932,546 | | | $ | 1,137,240 | | | $ | 1,370,199 | | | $ | 1,599,661 | | | $ | 1,312,382 | | |
Portfolio turnover | | | 76 | % | | | 90 | % | | | 77 | % | | | 77 | % | | | 85 | % | |
Notes to Financial Highlights
(a) Rounds to zero.
(b) In addition to the fees and expenses which the Fund bears directly, the Fund indirectly bears a pro rata share of the fees and expenses of the acquired funds in which it invests. Such indirect expenses are not included in the reported expense ratios.
(c) Certain line items from prior years have been reclassified to conform to the current presentation.
(d) Ratios include line of credit interest expense which rounds to less than 0.01%.
(e) Total net expenses include the impact of certain waivers/reimbursements made by the Investment Manager and certain of its affiliates, if applicable.
(f) The benefits derived from expense reductions had an impact of less than 0.01%.
The accompanying Notes to Financial Statements are an integral part of this statement.
Annual Report 2013
15
Columbia Marsico Focused Equities Fund
Financial Highlights (continued)
| | | Year Ended
February 28, | | Year Ended
February 29, | | Year Ended February 28, | |
Class B | | 2013 | | 2012 | | 2011 | | 2010 | | 2009 | |
Per share data | |
Net asset value, beginning of period | | $ | 21.88 | | | $ | 21.48 | | | $ | 17.46 | | | $ | 11.80 | | | $ | 20.07 | | |
Income from investment operations: | |
Net investment loss | | | (0.09 | ) | | | (0.15 | ) | | | (0.14 | ) | | | (0.11 | ) | | | (0.07 | ) | |
Net realized and unrealized gain (loss) | | | 1.13 | | | | 0.86 | | | | 4.16 | | | | 5.77 | | | | (8.20 | ) | |
Total from investment operations | | | 1.04 | | | | 0.71 | | | | 4.02 | | | | 5.66 | | | | (8.27 | ) | |
Less distributions to shareholders: | |
Net realized gains | | | (4.57 | ) | | | (0.31 | ) | | | — | | | | — | | | | — | | |
Tax return of capital | | | — | | | | — | | | | — | | | | (0.00 | )(a) | | | — | | |
Total distributions to shareholders | | | (4.57 | ) | | | (0.31 | ) | | | — | | | | (0.00 | )(a) | | | — | | |
Proceeds from regulatory settlements | | | — | | | | — | | | | — | | | | 0.00 | (a) | | | — | | |
Net asset value, end of period | | $ | 18.35 | | | $ | 21.88 | | | $ | 21.48 | | | $ | 17.46 | | | $ | 11.80 | | |
Total return | | | 6.09 | % | | | 3.44 | % | | | 23.02 | % | | | 48.02 | % | | | (41.21 | %) | |
Ratios to average net assets(b)(c) | |
Total gross expenses | | | 2.09 | % | | | 2.12 | % | | | 2.05 | %(d) | | | 2.06 | %(d) | | | 2.06 | % | |
Total net expenses(e) | | | 2.04 | %(f) | | | 2.12 | %(f) | | | 2.05 | %(d)(f) | | | 2.05 | %(d)(f) | | | 2.01 | %(f) | |
Net investment loss | | | (0.46 | %) | | | (0.70 | %) | | | (0.74 | %) | | | (0.72 | %) | | | (0.40 | %) | |
Supplemental data | |
Net assets, end of period (in thousands) | | $ | 14,818 | | | $ | 23,745 | | | $ | 45,196 | | | $ | 62,935 | | | $ | 64,937 | | |
Portfolio turnover | | | 76 | % | | | 90 | % | | | 77 | % | | | 77 | % | | | 85 | % | |
Notes to Financial Highlights
(a) Rounds to zero.
(b) In addition to the fees and expenses which the Fund bears directly, the Fund indirectly bears a pro rata share of the fees and expenses of the acquired funds in which it invests. Such indirect expenses are not included in the reported expense ratios.
(c) Certain line items from prior years have been reclassified to conform to the current presentation.
(d) Ratios include line of credit interest expense which rounds to less than 0.01%.
(e) Total net expenses include the impact of certain waivers/reimbursements made by the Investment Manager and certain of its affiliates, if applicable.
(f) The benefits derived from expense reductions had an impact of less than 0.01%.
The accompanying Notes to Financial Statements are an integral part of this statement.
Annual Report 2013
16
Columbia Marsico Focused Equities Fund
Financial Highlights (continued)
| | | Year Ended
February 28, | | Year Ended
February 29, | | Year Ended February 28, | |
Class C | | 2013 | | 2012 | | 2011 | | 2010 | | 2009 | |
Per share data | |
Net asset value, beginning of period | | $ | 21.96 | | | $ | 21.55 | | | $ | 17.52 | | | $ | 11.84 | | | $ | 20.13 | | |
Income from investment operations: | |
Net investment loss | | | (0.10 | ) | | | (0.14 | ) | | | (0.14 | ) | | | (0.11 | ) | | | (0.07 | ) | |
Net realized and unrealized gain (loss) | | | 1.13 | | | | 0.86 | | | | 4.17 | | | | 5.79 | | | | (8.22 | ) | |
Total from investment operations | | | 1.03 | | | | 0.72 | | | | 4.03 | | | | 5.68 | | | | (8.29 | ) | |
Less distributions to shareholders: | |
Net realized gains | | | (4.57 | ) | | | (0.31 | ) | | | — | | | | — | | | | — | | |
Tax return of capital | | | — | | | | — | | | | — | | | | (0.00 | )(a) | | | — | | |
Total distributions to shareholders | | | (4.57 | ) | | | (0.31 | ) | | | — | | | | (0.00 | )(a) | | | — | | |
Proceeds from regulatory settlements | | | — | | | | — | | | | — | | | | 0.00 | (a) | | | — | | |
Net asset value, end of period | | $ | 18.42 | | | $ | 21.96 | | | $ | 21.55 | | | $ | 17.52 | | | $ | 11.84 | | |
Total return | | | 6.02 | % | | | 3.47 | % | | | 23.00 | % | | | 48.02 | % | | | (41.18 | %) | |
Ratios to average net assets(b)(c) | |
Total gross expenses | | | 2.09 | % | | | 2.11 | % | | | 2.05 | %(d) | | | 2.06 | %(d) | | | 2.06 | % | |
Total net expenses(e) | | | 2.04 | %(f) | | | 2.11 | %(f) | | | 2.05 | %(d)(f) | | | 2.05 | %(d)(f) | | | 2.01 | %(f) | |
Net investment loss | | | (0.47 | %) | | | (0.66 | %) | | | (0.73 | %) | | | (0.72 | %) | | | (0.38 | %) | |
Supplemental data | |
Net assets, end of period (in thousands) | | $ | 225,678 | | | $ | 262,048 | | | $ | 304,857 | | | $ | 298,344 | | | $ | 258,191 | | |
Portfolio turnover | | | 76 | % | | | 90 | % | | | 77 | % | | | 77 | % | | | 85 | % | |
Notes to Financial Highlights
(a) Rounds to zero.
(b) In addition to the fees and expenses which the Fund bears directly, the Fund indirectly bears a pro rata share of the fees and expenses of the acquired funds in which it invests. Such indirect expenses are not included in the reported expense ratios.
(c) Certain line items from prior years have been reclassified to conform to the current presentation.
(d) Ratios include line of credit interest expense which rounds to less than 0.01%.
(e) Total net expenses include the impact of certain waivers/reimbursements made by the Investment Manager and certain of its affiliates, if applicable.
(f) The benefits derived from expense reductions had an impact of less than 0.01%.
The accompanying Notes to Financial Statements are an integral part of this statement.
Annual Report 2013
17
Columbia Marsico Focused Equities Fund
Financial Highlights (continued)
Class I | | Year Ended
February 28,
2013 | | Year Ended
February 29,
2012 | | Year Ended
February 28,
2011(a) | |
Per share data | |
Net asset value, beginning of period | | $ | 24.81 | | | $ | 24.04 | | | $ | 20.59 | | |
Income from investment operations: | |
Net investment income | | | 0.17 | | | | 0.10 | | | | 0.00 | (b) | |
Net realized and unrealized gain | | | 1.32 | | | | 1.07 | | | | 3.52 | | |
Total from investment operations | | | 1.49 | | | | 1.17 | | | | 3.52 | | |
Less distributions to shareholders: | |
Net investment income | | | (0.20 | ) | | | (0.09 | ) | | | (0.07 | ) | |
Net realized gains | | | (4.57 | ) | | | (0.31 | ) | | | — | | |
Total distributions to shareholders | | | (4.77 | ) | | | (0.40 | ) | | | (0.07 | ) | |
Net asset value, end of period | | $ | 21.53 | | | $ | 24.81 | | | $ | 24.04 | | |
Total return | | | 7.29 | % | | | 5.04 | % | | | 17.09 | % | |
Ratios to average net assets(c)(d) | |
Total gross expenses | | | 0.88 | % | | | 0.91 | % | | | 0.89 | %(e) | |
Total net expenses(f) | | | 0.86 | % | | | 0.91 | %(g) | | | 0.89 | %(e)(g) | |
Net investment income | | | 0.71 | % | | | 0.44 | % | | | 0.00 | %(b)(e) | |
Supplemental data | |
Net assets, end of period (in thousands) | | $ | 3 | | | $ | 3 | | | $ | 28,852 | | |
Portfolio turnover | | | 76 | % | | | 90 | % | | | 77 | % | |
Notes to Financial Highlights
(a) For the period from September 27, 2010 (commencement of operations) to February 28, 2011.
(b) Rounds to zero.
(c) In addition to the fees and expenses which the Fund bears directly, the Fund indirectly bears a pro rata share of the fees and expenses of the acquired funds in which it invests. Such indirect expenses are not included in the reported expense ratios.
(d) Certain line items from prior years have been reclassified to conform to the current presentation.
(e) Annualized.
(f) Total net expenses include the impact of certain waivers/reimbursements made by the Investment Manager and certain of its affiliates, if applicable.
(g) The benefits derived from expense reductions had an impact of less than 0.01%.
The accompanying Notes to Financial Statements are an integral part of this statement.
Annual Report 2013
18
Columbia Marsico Focused Equities Fund
Financial Highlights (continued)
Class R4 | | Year Ended
February 28,
2013(a) | |
Per share data | |
Net asset value, beginning of period | | $ | 22.72 | | |
Income from investment operations: | |
Net investment income | | | 0.01 | | |
Net realized and unrealized gain | | | 2.25 | | |
Total from investment operations | | | 2.26 | | |
Less distributions to shareholders: | |
Net investment income | | | (0.18 | ) | |
Net realized gains | | | (3.08 | ) | |
Total distributions to shareholders | | | (3.26 | ) | |
Net asset value, end of period | | $ | 21.72 | | |
Total return | | | 10.88 | % | |
Ratios to average net assets(b) | |
Total gross expenses | | | 1.03 | %(c) | |
Total net expenses(d) | | | 0.99 | %(c) | |
Net investment income | | | 0.18 | %(c) | |
Supplemental data | |
Net assets, end of period (in thousands) | | $ | 2 | | |
Portfolio turnover | | | 76 | % | |
Notes to Financial Highlights
(a) For the period from November 8, 2012 (commencement of operations) to February 28, 2013.
(b) In addition to the fees and expenses which the Fund bears directly, the Fund indirectly bears a pro rata share of the fees and expenses of the acquired funds in which it invests. Such indirect expenses are not included in the reported expense ratios.
(c) Annualized.
(d) Total net expenses include the impact of certain waivers/reimbursements made by the Investment Manager and certain of its affiliates, if applicable.
The accompanying Notes to Financial Statements are an integral part of this statement.
Annual Report 2013
19
Columbia Marsico Focused Equities Fund
Financial Highlights (continued)
| | | Year Ended
February 28, | | Year Ended
February 29, | | Year Ended February 28, | |
Class Z | | 2013 | | 2012 | | 2011 | | 2010 | | 2009 | |
Per share data | |
Net asset value, beginning of period | | $ | 24.73 | | | $ | 24.05 | | | $ | 19.39 | | | $ | 13.02 | | | $ | 22.06 | | |
Income from investment operations: | |
Net investment income | | | 0.13 | | | | 0.08 | | | | 0.06 | | | | 0.05 | | | | 0.13 | | |
Net realized and unrealized gain (loss) | | | 1.31 | | | | 0.97 | | | | 4.64 | | | | 6.39 | | | | (9.07 | ) | |
Total from investment operations | | | 1.44 | | | | 1.05 | | | | 4.70 | | | | 6.44 | | | | (8.94 | ) | |
Less distributions to shareholders: | |
Net investment income | | | (0.16 | ) | | | (0.06 | ) | | | (0.04 | ) | | | (0.05 | ) | | | (0.10 | ) | |
Net realized gains | | | (4.57 | ) | | | (0.31 | ) | | | — | | | | — | | | | — | | |
Tax return of capital | | | — | | | | — | | | | — | | | | (0.02 | ) | | | — | | |
Total distributions to shareholders | | | (4.73 | ) | | | (0.37 | ) | | | (0.04 | ) | | | (0.07 | ) | | | (0.10 | ) | |
Proceeds from regulatory settlements | | | — | | | | — | | | | — | | | | 0.00 | (a) | | | — | | |
Net asset value, end of period | | $ | 21.44 | | | $ | 24.73 | | | $ | 24.05 | | | $ | 19.39 | | | $ | 13.02 | | |
Total return | | | 7.12 | % | | | 4.51 | % | | | 24.23 | % | | | 49.53 | % | | | (40.60 | %) | |
Ratios to average net assets(b)(c) | |
Total gross expenses | | | 1.09 | % | | | 1.11 | % | | | 1.05 | %(d) | | | 1.06 | %(d) | | | 1.06 | % | |
Total net expenses(e) | | | 1.04 | %(f) | | | 1.11 | %(f) | | | 1.05 | %(d)(f) | | | 1.05 | %(d)(f) | | | 1.01 | %(f) | |
Net investment income | | | 0.55 | % | | | 0.34 | % | | | 0.28 | % | | | 0.28 | % | | | 0.65 | % | |
Supplemental data | |
Net assets, end of period (in thousands) | | $ | 404,071 | | | $ | 1,028,756 | | | $ | 1,101,015 | | | $ | 995,452 | | | $ | 874,565 | | |
Portfolio turnover | | | 76 | % | | | 90 | % | | | 77 | % | | | 77 | % | | | 85 | % | |
Notes to Financial Highlights
(a) Rounds to zero.
(b) In addition to the fees and expenses which the Fund bears directly, the Fund indirectly bears a pro rata share of the fees and expenses of the acquired funds in which it invests. Such indirect expenses are not included in the reported expense ratios.
(c) Certain line items from prior years have been reclassified to conform to the current presentation.
(d) Ratios include line of credit interest expense which rounds to less than 0.01%.
(e) Total net expenses include the impact of certain waivers/reimbursements made by the Investment Manager and certain of its affiliates, if applicable.
(f) The benefits derived from expense reductions had an impact of less than 0.01%.
The accompanying Notes to Financial Statements are an integral part of this statement.
Annual Report 2013
20
Columbia Marsico Focused Equities Fund
Notes to Financial Statements
February 28, 2013
Note 1. Organization
Columbia Marsico Focused Equities Fund (the Fund), a series of Columbia Funds Series Trust (the Trust), is a non-diversified fund. The Trust is registered under the Investment Company Act of 1940, as amended (the 1940 Act), as an open-end management investment company organized as a Delaware statutory trust.
Fund Shares
The Trust may issue an unlimited number of shares (without par value). The Fund offers Class A, Class B, Class C, Class I, Class R4 and Class Z shares. All share classes have identical voting, dividend and liquidation rights. Each share class has its own expense structure and sales charges, as applicable.
Class A shares are subject to a maximum front-end sales charge of 5.75% based on the initial investment amount. Class A shares purchased without an initial sales charge in accounts aggregating $1 million to $50 million at the time of purchase are subject to a contingent deferred sales charge (CDSC) if the shares are sold within 18 months of purchase, charged as follows: 1.00% CDSC if redeemed within 12 months of purchase, and 0.50% CDSC if redeemed more than 12, but less than 18, months after purchase.
Class B shares may be subject to a maximum CDSC of 5.00% based upon the holding period after purchase. Class B shares will generally convert to Class A shares eight years after purchase. The Fund no longer accepts investments by new or existing investors in the Fund's Class B shares, except in connection with the reinvestment of any dividend and/or capital gain distributions in Class B shares of the Fund and exchanges by existing Class B shareholders of certain other funds within the Columbia Family of Funds.
Class C shares are subject to a 1.00% CDSC on shares redeemed within one year of purchase.
Class I shares are not subject to sales charges and are only available to the Columbia Family of Funds.
Class R4 shares are not subject to sales charges and are only available to investors purchasing through authorized investment professionals. Class R4 shares commenced operations on November 8, 2012.
Class Z shares are not subject to sales charges, and are only available to certain investors.
Note 2. Summary of Significant Accounting Policies
Use of Estimates
The preparation of financial statements in accordance with U.S. generally accepted accounting principles (GAAP)
requires management to make certain estimates and assumptions that affect the reported amounts of assets and liabilities, the disclosure of contingent assets and liabilities at the date of the financial statements and the reported amounts of revenue and expenses during the reporting period. Actual results could differ from those estimates.
The following is a summary of significant accounting policies consistently followed by the Fund in the preparation of its financial statements.
Security Valuation
All equity securities are valued at the close of business of the New York Stock Exchange (NYSE). Equity securities are valued at the last quoted sales price on the principal exchange or market on which they trade, except for securities traded on the NASDAQ Stock Market, which are valued at the NASDAQ official close price. Unlisted securities or listed securities for which there were no sales during the day are valued at the mean of the latest quoted bid and ask prices on such exchanges or markets.
Foreign securities are valued based on quotations from the principal market in which such securities are normally traded. If any foreign share prices are not readily available as a result of limited share activity the securities are valued at the mean of the latest quoted bid and ask prices on such exchanges or markets. Foreign currency exchange rates are generally determined at 4:00 p.m. Eastern (U.S.) time. However, many securities markets and exchanges outside the U.S. close prior to the close of the NYSE; therefore, the closing prices for securities in such markets or on such exchanges may not fully reflect events that occur after such close but before the close of the NYSE. In those situations, foreign securities will be fair valued pursuant to the policy adopted by the Board of Trustees (the Board), including utilizing a third party pricing service to determine these fair values. The third party pricing service takes into account multiple factors, including, but not limited to, movements in the U.S. securities markets, certain depositary receipts, futures contracts and foreign exchange rates that have occurred subsequent to the close of the foreign exchange or market, to determine a good faith estimate that reasonably reflects the current market conditions as of the close of the NYSE. The fair value of a security is likely to be different from the quoted or published price, if available.
Investments in other open-end investment companies, including money market funds, are valued at net asset value.
Investments for which market quotations are not readily available, or that have quotations which management believes are not reliable, are valued at fair value as determined in good faith under consistently applied procedures established by and under the general supervision of the Board. If a security or
Annual Report 2013
21
Columbia Marsico Focused Equities Fund
Notes to Financial Statements (continued)
February 28, 2013
class of securities (such as foreign securities) is valued at fair value, such value is likely to be different from the last quoted market price for the security.
The determination of fair value often requires significant judgment. To determine fair value, management may use assumptions including but not limited to future cash flows and estimated risk premiums. Multiple inputs from various sources may be used to determine fair value.
Foreign Currency Transactions and Translations
The values of all assets and liabilities denominated in foreign currencies are translated into U.S. dollars at that day's exchange rates. Net realized and unrealized gains (losses) on foreign currency transactions and translations include gains (losses) arising from the fluctuation in exchange rates between trade and settlement dates on securities transactions, gains (losses) arising from the disposition of foreign currency and currency gains (losses) between the accrual and payment dates on dividends, interest income and foreign withholding taxes.
For financial statement purposes, the Fund does not distinguish that portion of gains (losses) on investments which is due to changes in foreign exchange rates from that which is due to changes in market prices of the investments. Such fluctuations are included with the net realized and unrealized gains (losses) on investments in the Statement of Operations.
Security Transactions
Security transactions are accounted for on the trade date. Cost is determined and gains (losses) are based upon the specific identification method for both financial statement and federal income tax purposes.
Income Recognition
Corporate actions and dividend income are recorded net of any non-reclaimable tax withholdings, on the ex-dividend date or upon receipt of ex-dividend notification in the case of certain foreign securities.
Awards from class action litigation are recorded as a reduction of cost basis if the Fund still owns the applicable securities on the payment date. If the Fund no longer owns the applicable securities, the proceeds are recorded as realized gains.
Expenses
General expenses of the Trust are allocated to the Fund and other funds of the Trust based upon relative net assets or other expense allocation methodologies determined by the nature of the expense. Expenses directly attributable to the Fund are charged to the Fund. Expenses directly attributable to a specific class of shares are charged to that share class.
Determination of Class Net Asset Value
All income, expenses (other than class-specific expenses, which are charged to that share class, as shown in the Statement of Operations) and realized and unrealized gains (losses) are allocated to each class of the Fund on a daily basis, based on the relative net assets of each class, for purposes of determining the net asset value of each class.
Federal Income Tax Status
The Fund intends to qualify each year as a regulated investment company under Subchapter M of the Internal Revenue Code, as amended, and will distribute substantially all of its tax exempt and taxable income (including net short-term capital gains), if any, for its tax year, and as such will not be subject to federal income taxes. In addition, the Fund intends to distribute in each calendar year substantially all of its net investment income, capital gains and certain other amounts, if any, such that the Fund should not be subject to federal excise tax. Therefore, no federal income or excise tax provision is recorded.
Distributions to Shareholders
Distributions from net investment income, if any, are declared and paid semi-annually. Net realized capital gains, if any, are distributed at least annually. Income distributions and capital gain distributions are determined in accordance with federal income tax regulations, which may differ from GAAP.
Guarantees and Indemnifications
Under the Trust's organizational documents and, in some cases, by contract, its officers and trustees are indemnified against certain liabilities arising out of the performance of their duties to the Trust or its funds. In addition, certain of the Fund's contracts with its service providers contain general indemnification clauses. The Fund's maximum exposure under these arrangements is unknown since the amount of any future claims that may be made against the Fund cannot be determined, and the Fund has no historical basis for predicting the likelihood of any such claims.
Recent Accounting Pronouncement
Disclosures about Offsetting Assets and Liabilities
In December 2011, the Financial Accounting Standards Board (FASB) issued Accounting Standards Update (ASU) No. 2011-11, Disclosures about Offsetting Assets and Liabilities. The objective of the FASB is to enhance current disclosure requirements on offsetting of certain assets and liabilities and to enable financial statement users to compare financial statements prepared under GAAP and International Financial Reporting Standards.
Annual Report 2013
22
Columbia Marsico Focused Equities Fund
Notes to Financial Statements (continued)
February 28, 2013
Specifically, ASU No. 2011-11 requires an entity to disclose both gross and net information for derivatives and other financial instruments that are subject to a master netting arrangement or similar agreement. The standard requires disclosure of collateral received in connection with the master netting agreements or similar agreements. The effective date of ASU No. 2011-11 is for interim and annual periods beginning on or after January 1, 2013. At this time, management is evaluating the implications of this guidance and the impact it will have on the financial statement amounts and footnote disclosures, if any.
Note 3. Fees and Compensation Paid to Affiliates
Investment Management Fees
Under an Investment Management Services Agreement, Columbia Management Investment Advisers, LLC (the Investment Manager), a wholly-owned subsidiary of Ameriprise Financial, Inc. (Ameriprise Financial), is responsible for the ultimate oversight of investments made by the Fund. The Fund's subadviser (see Subadvisory Agreement below) has the primary responsibility for the day-to-day portfolio management of the Fund. Effective January 23, 2013, the investment management fee is an annual fee that is equal to a percentage of the Fund's average daily net assets that declines from 0.71% to 0.54% as the Fund's net assets increase. Prior to January 23, 2013, the investment management fee was equal to a percentage of the Fund's average daily net assets that declined from 0.75% to 0.56% as the Fund's net assets increased. The annualized effective investment management fee rate for the year ended February 28, 2013 was 0.68% of the Fund's average daily net assets.
Prior to June 30, 2012, to the extent that the Fund was not benefitting from a separate contractual expense limitation arrangement, the Investment Manager contractually agreed to waive a portion of its investment management fee. In the absence of a separate contractual expense limitation arrangement, the investment management fee waiver for the Fund was equal to a percentage of the Fund's pro-rata portion of the combined average daily net assets of the Fund and other affiliated funds managed by the Investment Manager and sub-advised by Marsico Capital Management, LLC (Marsico), at a rate that increased from 0.00% to 0.10% as the combined daily net assets increased.
For the year ended February 28, 2013, no investment management fees were waived for the Fund.
Subadvisory Agreement
The Investment Manager has entered into a Subadvisory Agreement with Marsico to subadvise the assets of the Fund.
The Investment Manager compensates Marsico to manage the investment of the Fund's assets.
Administration Fees
Under an Administrative Services Agreement, the Investment Manager also serves as the Fund Administrator. Effective January 23, 2013, the Fund pays the Fund Administrator an annual fee for administration and accounting services equal to a percentage of the Fund's average daily net assets that declines from 0.06% to 0.03% as the Fund's net assets increase. Prior to January 23, 2013, the administration fee was equal to 0.22% of the Fund's average daily net assets. The annualized effective administration fee rate for the year ended February 28, 2013 was 0.20% of the Fund's average daily net assets.
Other Expenses
Other expenses are for, among other things, certain expenses of the Fund or the Board, including: Fund boardroom and office expense, employee compensation, employee health and retirement benefits, and certain other expenses. Payment of these Fund and Board expenses is facilitated by a company providing limited administrative services to the Fund and the Board. For the year ended February 28, 2013, other expenses paid to this company were $6,107.
Compensation of Board Members
Board members are compensated for their services to the Fund as disclosed in the Statement of Operations. Under a Deferred Compensation Plan (the Plan), the Board members who are not "interested persons" of the Fund, as defined under the 1940 Act, may elect to defer payment of up to 100% of their compensation. Deferred amounts are treated as though equivalent dollar amounts had been invested in shares of certain funds managed by the Investment Manager. The Fund's liability for these amounts is adjusted for market value changes and remains in the Fund until distributed in accordance with the Plan.
Transfer Agent Fees
Under a Transfer and Dividend Disbursing Agent Agreement, Columbia Management Investment Services Corp. (the Transfer Agent), an affiliate of the Investment Manager and a wholly-owned subsidiary of Ameriprise Financial, is responsible for providing transfer agency services to the Fund. The Transfer Agent has contracted with Boston Financial Data Services (BFDS) to serve as sub-transfer agent.
The Transfer Agent receives monthly account-based service fees based on the number of open accounts and is reimbursed by the Fund for the fees and expenses the Transfer Agent pays to financial intermediaries that maintain omnibus accounts with the Fund that is a percentage of the average aggregate
Annual Report 2013
23
Columbia Marsico Focused Equities Fund
Notes to Financial Statements (continued)
February 28, 2013
value of the Fund's shares maintained in each such omnibus account (other than omnibus accounts for which American Enterprise Investment Services Inc. is the broker of record or accounts where the beneficial shareholder is a customer of Ameriprise Financial Services, Inc., which are paid a per account fee). The Transfer Agent pays the fees of BFDS for services as sub-transfer agent and is not entitled to reimbursement for such fees from the Fund (with the exception of out-of-pocket fees).
The Transfer Agent also receives compensation from fees for various shareholder services and reimbursements for certain out-of-pocket fees. Class I shares do not pay transfer agent fees.
For the year ended February 28, 2013, the Fund's effective transfer agent fee rates as a percentage of average daily net assets of each class were as follows:
Class A | | | 0.19 | % | |
Class B | | | 0.19 | | |
Class C | | | 0.19 | | |
Class R4* | | | 0.15 | | |
Class Z | | | 0.19 | | |
*Annualized
An annual minimum account balance fee of $20 may apply to certain accounts with a value below the Fund's initial minimum investment requirements to reduce the impact of small accounts on transfer agent fees. These minimum account balance fees are recorded as part of expense reductions in the Statement of Operations. For the year ended February 28, 2013, these minimum account balance fees reduced total expenses by $4,647.
Distribution and Service Fees
The Fund has an agreement with Columbia Management Investment Distributors, Inc. (the Distributor), an affiliate of the Investment Manager and a wholly-owned subsidiary of Ameriprise Financial, for distribution and shareholder services. Pursuant to Rule 12b-1 under the 1940 Act, the Board has approved, and the Fund has adopted, distribution and shareholder service plans (the Plans) which set the distribution and service fees for the Fund. These fees are calculated daily and are intended to compensate the Distributor and/or eligible selling and/or servicing agents for selling shares of the Fund and providing services to investors.
The Plans require the payment of a monthly combined distribution and service fee to the Distributor at the maximum annual rate of 0.25% of the average daily net assets attributable to Class A shares of the Fund. The Plans also
require the payment of a monthly service fee at the maximum annual rate of 0.25% of the average daily net assets attributable to Class B and Class C shares of the Fund and the payment of a monthly distribution fee at the maximum annual rate of 0.75% of the average daily net assets attributable to Class B and Class C shares of the Fund.
Sales Charges
Sales charges, including front-end charges and CDSCs, received by the Distributor for distributing Fund shares were $177,239 for Class A, $20,409 for Class B and $5,924 for Class C shares for the year ended February 28, 2013.
Expenses Waived/Reimbursed by the Investment Manager and its Affiliates
Effective July 1, 2012, the Investment Manager and certain of its affiliates have contractually agreed to waive fees and/or reimburse expenses (excluding certain fees and expenses described below), through June 30, 2013, unless sooner terminated at the sole discretion of the Board, so that the Fund's net operating expenses, after giving effect to fees waived/expenses reimbursed and any balance credits and/or overdraft charges from the Fund's custodian, do not exceed the following annual rates as a percentage of the class' average daily net assets:
Class A | | | 1.25 | % | |
Class B | | | 2.00 | | |
Class C | | | 2.00 | | |
Class I | | | 0.84 | | |
Class R4* | | | 1.00 | | |
Class Z | | | 1.00 | | |
*Annual rate is contractual from November 8, 2012 (the commencement of operations of Class R4 shares) through November 8, 2013.
Prior to July 1, 2012, the Investment Manager and certain of its affiliates contractually agreed to waive fees and/or reimburse expenses (excluding certain fees and expenses described below), so that the Fund's net operating expenses, after giving effect to fees waived/expenses reimbursed and any balance credits and/or overdraft charges from the Fund's custodian, did not exceed the following annual rates as a percentage of the class' average daily net assets:
Class A | | | 1.45 | % | |
Class B | | | 2.20 | | |
Class C | | | 2.20 | | |
Class I | | | 1.02 | | |
Class Z | | | 1.20 | | |
Annual Report 2013
24
Columbia Marsico Focused Equities Fund
Notes to Financial Statements (continued)
February 28, 2013
Under the agreement, the following fees and expenses are excluded from the waiver/reimbursement commitment, and therefore will be paid by the Fund, if applicable: taxes (including foreign transaction taxes), expenses associated with investments in affiliated and non-affiliated pooled investment vehicles (including mutual funds and exchange traded funds), transaction costs and brokerage commissions, costs related to any securities lending program, dividend expenses associated with securities sold short, inverse floater program fees and expenses, transaction charges and interest on borrowed money, interest, extraordinary expenses and any other expenses the exclusion of which is specifically approved by the Board. This agreement may be modified or amended only with approval from all parties.
Note 4. Federal Tax Information
The timing and character of income and capital gain distributions are determined in accordance with income tax regulations, which may differ from GAAP because of temporary or permanent book to tax differences.
At February 28, 2013, these differences are primarily due to differing treatment for deferral/reversal of wash sale losses, Trustees' deferred compensation, distribution reclassifications, foreign currency transactions, late-year ordinary losses, derivative investments and earnings and profits distributed to shareholders on the redemption of shares. To the extent these differences are permanent, reclassifications are made among the components of the Fund's net assets in the Statement of Assets and Liabilities. Temporary differences do not require reclassifications. In the Statement of Assets and Liabilities the following reclassifications were made:
Excess of distributions over net investment income | | $ | 344,214 | | |
Accumulated net realized gain | | | (38,898,138 | ) | |
Paid-in capital | | | 38,553,924 | | |
Net investment income and net realized gains (losses), as disclosed in the Statement of Operations, and net assets were not affected by this reclassification.
The tax character of distributions paid during the years indicated was as follows:
| | | February 28,
2013 ($) | | February 29,
2012 ($) | |
Ordinary income | | | 30,660,079 | | | | 2,759,309 | | |
Long-term capital gains | | | 315,182,072 | | | | 32,938,581 | | |
Total | | | 345,842,151 | | | | 35,697,890 | | |
Short-term capital gain distributions, if any, are considered ordinary income distributions for tax purposes.
At February 28, 2013, the components of distributable earnings on a tax basis were as follows:
Undistributed accumulated long-term capital gains | | $ | 99,590,854 | | |
Unrealized appreciation | | | 338,801,393 | | |
At February 28, 2013, the cost of investments for federal income tax purposes was $1,268,908,352 and the aggregate gross unrealized appreciation and depreciation based on that cost was:
Unrealized appreciation | | $ | 340,406,978 | | |
Unrealized depreciation | | | (1,605,585 | ) | |
Net unrealized appreciation | | $ | 338,801,393 | | |
Under current tax rules, regulated investment companies can elect to treat certain late-year ordinary losses incurred and post-October capital losses (capital losses realized after October 31) as arising on the first day of the following taxable year. As of February 28, 2013, the Fund will elect to treat late-year ordinary losses of $2,234,270 as arising on March 1, 2013.
Management of the Fund has concluded that there are no significant uncertain tax positions that would require recognition in the financial statements. However, management's conclusion may be subject to review and adjustment at a later date based on factors including, but not limited to, new tax laws, regulations, and administrative interpretations (including relevant court decisions). Generally, the Fund's federal tax returns for the prior three fiscal years remain subject to examination by the Internal Revenue Service.
Note 5. Portfolio Information
The cost of purchases and proceeds from sales of securities, excluding short-term obligations, aggregated to $1,355,237,767 and $2,290,461,850, respectively, for the year ended February 28, 2013.
Note 6. Lending of Portfolio Securities
Effective December 19, 2012, the Fund no longer participates in securities lending activity. Prior to that date, the Fund had entered into a Master Securities Lending Agreement (the Agreement) with JPMorgan Chase Bank, N.A. (JPMorgan). The Agreement authorized JPMorgan as lending agent to lend securities to authorized borrowers in order to generate additional income on behalf of the Fund. Pursuant to the Agreement, the securities loaned were secured by cash or securities that either were issued or guaranteed as to principal and interest by the U.S. government, its agencies, authorities or instrumentalities with value equal to at least 100% of the market value of the loaned securities. Any additional collateral required to maintain those levels due to market fluctuations of
Annual Report 2013
25
Columbia Marsico Focused Equities Fund
Notes to Financial Statements (continued)
February 28, 2013
the loaned securities was requested to be delivered the following business day. Cash collateral received was invested by the lending agent on behalf of the Fund into authorized investments pursuant to the Agreement.
Pursuant to the Agreement, the Fund received income for lending its securities either in the form of fees or by earning interest on invested cash collateral, net of negotiated rebates paid to borrowers and fees paid to the lending agent for services provided and any other securities lending expenses. Net income earned from securities lending for the year ended February 28, 2013 is disclosed in the Statement of Operations. The Fund continued to earn and accrue interest and dividends on the securities loaned.
Note 7. Affiliated Money Market Fund
The Fund invests its daily cash balances in Columbia Short-Term Cash Fund, an affiliated money market fund established for the exclusive use by the Fund and other affiliated funds. The income earned by the Fund from such investments is included as "Dividends — affiliated issuers" in the Statement of Operations. As an investing fund, the Fund indirectly bears its proportionate share of the expenses of Columbia Short-Term Cash Fund.
Note 8. Shareholder Concentration
At February 28, 2013, two unaffiliated shareholder accounts owned an aggregate of 55.5% of the outstanding shares of the Fund. The Fund has no knowledge about whether any portion of those shares was owned beneficially by such accounts. Subscription and redemption activity by concentrated accounts may have a significant effect on the operations of the Fund.
Note 9. Line of Credit
The Fund has entered into a revolving credit facility with a syndicate of banks led by JPMorgan whereby the Fund may borrow for the temporary funding of shareholder redemptions or for other temporary or emergency purposes. The credit facility agreement, as amended, which is a collective agreement between the Fund and certain other funds managed by the Investment Manager, severally and not jointly, permits collective borrowings up to $500 million. Interest is charged to each participating fund based on its borrowings at a rate equal to the higher of (i) the overnight federal funds rate plus 1.00% or (ii) the one-month LIBOR rate plus 1.00%. Each borrowing under the credit facility matures no later than 60 days after the date of borrowing. The Fund also pays a commitment fee equal to its pro rata share of the amount of the credit facility at a rate of 0.08% per annum.
The Fund had no borrowings during the year ended February 28, 2013.
Note 10. Significant Risks
Non-Diversification Risk
A non-diversified fund is permitted to invest a greater percentage of its total assets in fewer issuers than a diversified fund. The Fund may, therefore, have a greater risk of loss from a few issuers than a similar fund that invests more broadly.
Consumer Discretionary Risk
The Fund's portfolio managers may invest significantly in issuers operating in the consumer discretionary sector. The Fund may be more susceptible to the particular risks of this sector than if the Fund were invested in a wider variety of issuers operating in unrelated sectors.
Note 11. Subsequent Events
Management has evaluated the events and transactions that have occurred through the date the financial statements were issued and noted no items requiring adjustment of the financial statements or additional disclosure.
Note 12. Information Regarding Pending and Settled Legal Proceedings
In December 2005, without admitting or denying the allegations, American Express Financial Corporation (AEFC, which is now known as Ameriprise Financial, Inc. (Ameriprise Financial)) entered into settlement agreements with the Securities and Exchange Commission (SEC) and Minnesota Department of Commerce (MDOC) related to market timing activities. As a result, AEFC was censured and ordered to cease and desist from committing or causing any violations of certain provisions of the Investment Advisers Act of 1940, the Investment Company Act of 1940, and various Minnesota laws. AEFC agreed to pay disgorgement of $10 million and civil money penalties of $7 million. AEFC also agreed to retain an independent distribution consultant to assist in developing a plan for distribution of all disgorgement and civil penalties ordered by the SEC in accordance with various undertakings detailed at www.sec.gov/litigation/admin/ia-2451.pdf. Ameriprise Financial and its affiliates have cooperated with the SEC and the MDOC in these legal proceedings, and have made regular reports to the funds' Boards of Trustees.
Ameriprise Financial and certain of its affiliates have historically been involved in a number of legal, arbitration and regulatory proceedings, including routine litigation, class actions, and governmental actions, concerning matters arising in connection with the conduct of their business activities. Ameriprise Financial believes that the Funds are not currently the subject of, and that neither Ameriprise Financial nor any of its affiliates are the subject of, any pending legal, arbitration or
Annual Report 2013
26
Columbia Marsico Focused Equities Fund
Notes to Financial Statements (continued)
February 28, 2013
regulatory proceedings that are likely to have a material adverse effect on the Funds or the ability of Ameriprise Financial or its affiliates to perform under their contracts with the Funds. Ameriprise Financial is required to make 10-Q, 10-K and, as necessary, 8-K filings with the Securities and Exchange Commission on legal and regulatory matters that relate to Ameriprise Financial and its affiliates. Copies of these filings may be obtained by accessing the SEC website at www.sec.gov.
There can be no assurance that these matters, or the adverse publicity associated with them, will not result in increased fund redemptions, reduced sale of fund shares or other adverse consequences to the Funds. Further, although we believe proceedings are not likely to have a material adverse effect on the Funds or the ability of Ameriprise Financial or its affiliates to perform under their contracts with the Funds, these proceedings are subject to uncertainties and, as such, we are unable to estimate the possible loss or range of loss that may result. An adverse outcome in one or more of these proceedings could result in adverse judgments, settlements, fines, penalties or other relief that could have a material adverse effect on the consolidated financial condition or results of operations of Ameriprise Financial.
Annual Report 2013
27
Columbia Marsico Focused Equities Fund
Report of Independent Registered Public Accounting Firm
To the Trustees of Columbia Funds Series Trust and
the Shareholders of Columbia Marsico Focused Equities Fund
In our opinion, the accompanying statement of assets and liabilities, including the portfolio of investments, and the related statements of operations and of changes in net assets and the financial highlights present fairly, in all material respects, the financial position of Columbia Marsico Focused Equities Fund (the "Fund") (a series of Columbia Funds Series Trust) at February 28, 2013, the results of its operations for the year then ended, the changes in its net assets for each of the two years in the period then ended and the financial highlights for each of the periods indicated, in conformity with accounting principles generally accepted in the United States of America. These financial statements and financial highlights (hereafter referred to as "financial statements") are the responsibility of the Fund's management. Our responsibility is to express an opinion on these financial statements based on our audits. We conducted our audits of these financial statements in accordance with the standards of the Public Company Accounting Oversight Board (United States). Those standards require that we plan and perform the audit to obtain reasonable assurance about whether the financial statements are free of material misstatement. An audit includes examining, on a test basis, evidence supporting the amounts and disclosures in the financial statements, assessing the accounting principles used and significant estimates made by management, and evaluating the overall financial statement presentation. We believe that our audits, which included confirmation of securities at February 28, 2013 by correspondence with the custodian, transfer agent and brokers, provide a reasonable basis for our opinion.
PricewaterhouseCoopers LLP
Minneapolis, Minnesota
April 19, 2013
Annual Report 2013
28
Columbia Marsico Focused Equities Fund
Federal Income Tax Information
(Unaudited)
The Fund hereby designates the following tax attributes for the fiscal year ended February 28, 2013. Shareholders will be notified in early 2014 of the amounts for use in preparing 2013 income tax returns.
Tax Designations:
| Qualified Dividend Income | | | 74.19 | % | |
| Dividends Received Deduction | | | 70.67 | % | |
Capital Gain Dividend | | $ | 350,101,865 | | |
Qualified Dividend Income. For taxable, non-corporate shareholders, the percentage of ordinary income dividends paid during the fiscal year that represents qualified dividend income subject to reduced tax rates under the Jobs and Growth Tax Relief Reconciliation Act of 2003.
Dividends Received Deduction. The percentage of ordinary income dividends paid during the fiscal year that qualifies for the corporate dividends received deduction.
Capital Gain Dividend. The Fund designates as a capital gain dividend the amount reflected above, or if subsequently determined to be different, the net capital gain of such fiscal period. The Fund also designates as capital gain dividends, to the extent necessary to fully distribute such capital gains, earnings and profits distributed to shareholders on the redemption of shares.
Annual Report 2013
29
Columbia Marsico Focused Equities Fund
Shareholders elect the Board that oversees the funds' operations. The Board appoints officers who are responsible for day-to-day business decisions based on policies set by the Board. The following table provides basic biographical information about the funds' Board members, including their principal occupations during the past five years, although specific titles for individuals may have varied over the period. Under current Board policy, members may serve until the next Board meeting after he or she reaches the mandatory retirement age established by the Board, or the fifteenth anniversary of the first Board meeting they attended as a member of the Board.
Mr. Edward J. Boudreau, Jr., Mr. William P. Carmichael, Mr. William A. Hawkins, Mr. R. Glenn Hilliard, Ms. Minor M. Shaw and Dr. Anthony M. Santomero, were members of the Legacy Columbia Nations funds' Board ("Nations Funds"), which includes Columbia Funds Series Trust, Columbia Funds Variable Insurance Trust I and Columbia Funds Master Investment Trust, LLC and began service on the Board for the Legacy RiverSource funds ("RiverSource Funds") effective June 1, 2011.
Independent Trustees
Name,
Address,
Year of Birth | | Position Held With
Funds and Length of
Service | | Principal Occupation
During Past Five Years | | Number of
Funds in the
Fund Family
Overseen by
Board Member | | Other Present or Past
Directorships/Trusteeships
(Within Past 5 Years) | |
Kathleen Blatz
901 S. Marquette Ave.
Minneapolis, MN 55402
1954 | | Board member since 1/06 for RiverSource Funds and since 6/11 for Nations Funds | | Attorney; Chief Justice, Minnesota Supreme Court, 1998-2006 | | | 153 | | | Director, BlueCross BlueShield of Minnesota since 2009 | |
Edward J. Boudreau, Jr.
901 S. Marquette Ave.
Minneapolis, MN 55402
1944 | | Board member since 6/11 for RiverSource Funds and since 1/05 for Nations Funds | | Managing Director, E.J. Boudreau & Associates (consulting) since 2000 | | | 151 | | | Former Trustee, BofA Funds Series Trust (11 funds) | |
Pamela G. Carlton
901 S. Marquette Ave.
Minneapolis, MN 55402
1954 | | Board member since 7/07 for RiverSource Funds and since 6/11 for Nations Funds | | President, Springboard — Partners in Cross Cultural Leadership (consulting company) since 2003 | | | 153 | | | None | |
William P. Carmichael
901 S. Marquette Ave.
Minneapolis, MN 55402
1943 | | Board member since 6/11 for RiverSource Funds and since 1999 for Nations Funds | | Retired | | | 151 | | | Director, Cobra Electronics Corporation (electronic equipment manufacturer); The Finish Line (athletic shoes and apparel) since July 2003; McMoRan Exploration Company (oil and gas exploration and development) since 2010; former Trustee, BofA Funds Series Trust (11 funds); former Director, Spectrum Brands, Inc. (consumer products); former Director, Simmons Company (bedding) | |
Patricia M. Flynn
901 S. Marquette Ave.
Minneapolis, MN 55402
1950 | | Board member since 11/04 for RiverSource Funds and since 6/11 for Nations Funds | | Trustee Professor of Economics and Management, Bentley University since 1976 | | | 153 | | | None | |
William A. Hawkins
901 S. Marquette Ave.
Minneapolis, MN 55402
1942 | | Board member since 6/11 for RiverSource Funds and since 1/05 for Nations Funds | | Managing Director, Overton Partners (financial consulting), since August 2010; President and Chief Executive Officer, California General Bank, N.A., January 2008-August 2010 | | | 151 | | | Trustee, BofA Funds Series Trust (11 funds) | |
Annual Report 2013
30
Columbia Marsico Focused Equities Fund
Trustees and Officers (continued)
Independent Trustees (continued)
Name,
Address,
Year of Birth | | Position Held With
Funds and Length of
Service | | Principal Occupation
During Past Five Years | | Number of
Funds in the
Fund Family
Overseen by
Board Member | | Other Present or Past
Directorships/Trusteeships
(Within Past 5 Years) | |
R. Glenn Hilliard
901 S. Marquette Ave.
Minneapolis, MN 55402
1943 | | Board member since 6/11 for RiverSource Funds and since 1/05 for Nations Funds | | Chairman and Chief Executive Officer, Hilliard Group LLC (investing and consulting), since April 2003; Non-Executive Director & Chairman, CNO Financial Group, Inc. (insurance), September 2003-May 2011 | | | 151 | | | Chairman, BofA Fund Series Trust (11 funds); former Director, CNO Financial Group, Inc. (insurance) | |
Stephen R. Lewis, Jr.
901 S. Marquette Ave.
Minneapolis, MN 55402
1939 | | Chair of the Board for RiverSource Funds since 1/07, Board member for RiverSource Funds since 1/02 and since 6/11 for Nations Funds | | President Emeritus and Professor of Economics Emeritus, Carleton College since 2002 | | | 153 | | | Director, Valmont Industries, Inc. (manufacturer of irrigation systems) since 2002 | |
Catherine James Paglia
901 S. Marquette Ave.
Minneapolis, MN 55402
1952 | | Board member since 11/04 for RiverSource Funds and since 6/11 for Nations Funds | | Director, Enterprise Asset Management, Inc. (private real estate and asset management company) | | | 153 | | | Director, Valmont Industries, Inc. (manufacturer of irrigation systems) since 2012 | |
Leroy C. Richie
901 S. Marquette Ave.
Minneapolis, MN 55402
1941 | | Board member since 2000 for Legacy Seligman Funds, since 11/08 for RiverSource Funds and since 6/11 for Nations Funds | | Counsel, Lewis & Munday, P.C. (law firm) since 2004; former Vice President and General Counsel, Automotive Legal Affairs, Chrysler Corporation from 1983-1987 | | | 153 | | | Lead Outside Director, Digital Ally, Inc. (digital imaging) since September 2005; Director, Infinity, Inc. (oil and gas exploration and production) since 1994; Director, OGE Energy Corp. (energy and energy services) since November 2007 | |
Minor M. Shaw
901 S. Marquette Ave.
Minneapolis, MN 55402
1947 | | Board member since 6/11 for RiverSource Funds and since 2003 for Nations Funds | | President, Micco LLC (private investments) since 2011; President Micco Corp. since 1998 | | | 151 | | | Director, Piedmont Natural Gas; Director, BlueCross BlueShield of South Carolina since April 2008; Former Trustee, BofA Funds Series Trust (11 funds) | |
Alison Taunton-Rigby
901 S. Marquette Ave.
Minneapolis, MN 55402
1944 | | Board member since 11/02 for RiverSource Funds and since 6/11 for Nations Funds | | Chief Executive Officer and Director, RiboNovix, Inc., (biotechnology) 2003-2010 | | | 153 | | | Director, Healthways, Inc. (health and well-being improvement) since 2005; Director, ICI Mutual Insurance Company, RRG since 2011; Director, Abt Associates (government contractor) since 2001; Director, Boston Children's Hospital since 2002 | |
Annual Report 2013
31
Columbia Marsico Focused Equities Fund
Trustees and Officers (continued)
Interested Trustee Not Affiliated With Investment Manager*
Name,
Address,
Year of Birth | | Position Held With
Funds and Length of
Service | | Principal Occupation
During Past Five Years | | Number of
Funds in the
Fund Family
Overseen by
Board Member | | Other Present or Past
Directorships/Trusteeships
(Within Past 5 Years) | |
Anthony M. Santomero
901 S. Marquette Ave.
Minneapolis, MN 55402
1946 | | Board member since 6/11 for RiverSource Funds and since 1/08 for Nations Funds | | Richard K. Mellon Professor Emeritus of Finance, The Wharton School, University of Pennsylvania, since 2002; Senior Advisor, McKinsey & Company (consulting), 2006-2008 | | | 151 | | | Director, Renaissance Reinsurance Ltd. since May 2008; Trustee, Penn Mutual Life Insurance Company since March 2008; Director, Citigroup since 2009; Director, Citibank, N.A. since 2009; former Trustee, BofA Funds Series Trust (11 funds) | |
*Dr. Santomero is not an affiliated person of the investment manager or Ameriprise Financial. However, he is currently deemed by the funds to be an "interested person" (as defined in the 1940 Act) of the funds because he serves as a Director of Citigroup, Inc. and Citibank N.A., companies that may directly or through subsidiaries and affiliates engage from time-to-time in brokerage execution, principal transactions and lending relationships with the funds or accounts advised/managed by the investment manager.
Interested Trustee Affiliated With Investment Manager*
Name,
Address,
Year of Birth | | Position Held With
Funds and Length of
Service | | Principal Occupation
During Past Five Years | | Number of
Funds in the
Fund Family
Overseen by
Board Member | | Other Present or Past
Directorships/Trusteeships
(Within Past 5 Years) | |
William F. Truscott
53600 Ameriprise
Financial Center
Minneapolis, MN 55474
1960 | | Board member since 11/01 for RiverSource Funds and since 6/11 for Nations Funds; Senior Vice President since 2002 for RiverSource Funds and 5/10 for Nations Funds | | President, Columbia Management Investment Advisers, LLC since February 2012, (previously President, Chairman of the Board and Chief Investment Officer, 2001-April 2010); Chief Executive Officer, Global Asset Management, Ameriprise Financial, Inc. since September 2012 (previously Chief Executive Officer, U.S. Asset Management & President, Annuities, May 2010-September 2012 and President — U.S. Asset Management and Chief Investment Officer, 2005-April 2010); Chief Executive Officer, Columbia Management Investment Distributors, Inc. since February 2012, (previously Chairman of the Board and Chief Executive Officer, 2006-April 2010); Chairman of the Board and Chief Executive Officer, RiverSource Distributors, Inc. since 2006; President and Chief Executive Officer, Ameriprise Certificate Company 2006-August 2012 | | | 210 | | | Chairman of the Board, Columbia Management Investment Advisers, LLC since May 2010; Director, Columbia Management Investment Distributors, Inc. since May 2010; Director, Ameriprise Certificate Company, 2006-January 2013 | |
*Interested person (as defined under the 1940 Act) by reason of being an officer, director, security holder and/or employee of the investment manager or Ameriprise Financial.
The SAI has additional information about the Fund's Board members and is available, without charge, upon request by calling 800.345.6611; contacting your financial intermediary; or visiting columbiamanagement.com.
Annual Report 2013
32
Columbia Marsico Focused Equities Fund
Trustees and Officers (continued)
The Board has appointed officers who are responsible for day-to-day business decisions based on policies it has established. The officers serve at the pleasure of the Board. In addition to Mr. Truscott, who is Senior Vice President, the funds' other officers are:
Officers
Name,
Address,
Year of Birth | | Position Held With
Funds and Length of
Service | | Principal Occupation During Past Five Years | |
J. Kevin Connaughton
225 Franklin Street
Boston, MA 02110
1964 | | President and Principal Executive Officer since 5/10 for RiverSource Funds and 2009 for Nations Funds | | Senior Vice President and General Manager — Mutual Fund Products, Columbia Management Investment Advisers, LLC since May 2010; Managing Director of Columbia Management Advisors, LLC, December 2004-April 2010; Senior Vice President and Chief Financial Officer, Columbia Funds, June 2008-January 2009; Treasurer, Columbia Funds, October 2003-May 2008 | |
Amy K. Johnson
5228 Ameriprise Financial Center Minneapolis, MN 55474
1965 | | Vice President since 12/06 for RiverSource Funds and 5/10 for Nations Funds | | Senior Vice President and Chief Operating Officer, Columbia Management Investment Advisers, LLC since May 2010 (previously Chief Administrative Officer, 2009-April 2010 and Vice President — Asset Management and Trust Company Services, 2006-2009) | |
Michael G. Clarke
225 Franklin Street
Boston, MA 02110
1969 | | Treasurer since 1/11 and Chief Financial Officer since 4/11 for RiverSource Funds and Treasurer since 3/11 and Chief Financial Officer since 2009 for Nations Funds | | Vice President, Columbia Management Investment Advisers, LLC since May 2010; Managing Director of Fund Administration, Columbia Management Advisors, LLC, September 2004-April 2010; senior officer of Columbia Funds and affiliated funds since 2002 | |
Scott R. Plummer
5228 Ameriprise Financial Center Minneapolis, MN 55474
1959 | | Senior Vice President and Chief Legal Officer since 12/06 and Assistant Secretary since 6/11 for RiverSource Funds and Senior Vice President and Chief Legal Officer since 5/10 and Assistant Secretary since 6/11 for Nations Funds | | Senior Vice President, Chief Legal Officer and Assistant Secretary, Columbia Management Investment Advisers, LLC since June 2005; Vice President and Lead Chief Counsel — Asset Management, Ameriprise Financial, Inc. since May 2010 (previously Vice President and Chief Counsel — Asset Management, 2005-April 2010); Vice President, Chief Counsel and Assistant Secretary, Columbia Management Investment Distributors, Inc. since 2008; Vice President, General Counsel and Secretary, Ameriprise Certificate Company since 2005; Chief Counsel, RiverSource Distributors, Inc. since 2006 | |
Colin Moore
225 Franklin Street
Boston, MA 02110
1958 | | Senior Vice President since 5/10 for RiverSource Funds and Nations Funds | | Director and Chief Investment Officer, Columbia Management Investment Advisers, LLC since May 2010; Manager, Managing Director and Chief Investment Officer, Columbia Management Advisors, LLC, 2007-April 2010 | |
Thomas P. McGuire
225 Franklin Street
Boston, MA 02110
1972 | | Chief Compliance Officer since 3/12 | | Vice President — Asset Management Compliance, Columbia Management Investment Advisers, LLC since 2010; Chief Compliance Officer, Ameriprise Certificate Company since September 2010; Compliance Executive, Bank of America, 2005-2010 | |
Stephen T. Welsh
225 Franklin Street
Boston, MA 02110
1957 | | Vice President since 4/11 for RiverSource Funds and 2006 for Nations Funds | | President and Director, Columbia Management Investment Services Corp. since May 2010; President and Director, Columbia Management Services, Inc., July 2004- April 2010; Managing Director, Columbia Management Distributors, Inc., August 2007-April 2010 | |
Christopher O. Petersen
5228 Ameriprise Financial Center Minneapolis, MN 55474
1970 | | Vice President and Secretary since 4/11 for RiverSource Funds and 3/11 for Nations Funds | | Vice President and Chief Counsel, Ameriprise Financial, Inc. since January 2010 (formerly Vice President and Group Counsel or Counsel, April 2004-January 2010); Assistant Secretary of Legacy RiverSource Funds, January 2007-April 2011 and of the Nations Funds, May 2010-March 2011 | |
Annual Report 2013
33
Columbia Marsico Focused Equities Fund
Trustees and Officers (continued)
Officers (continued)
Name,
Address,
Year of Birth | | Position Held With
Funds and Length of
Service | | Principal Occupation During Past Five Years | |
Paul D. Pearson
10468 Ameriprise Financial Center Minneapolis, MN 55474
1956 | | Vice President since 4/11 and Assistant Treasurer since 1999 for RiverSource Funds and Vice President and Assistant Treasurer since 6/11 for Nations Funds | | Vice President — Investment Accounting, Columbia Management Investment Advisers, LLC, since May 2010; Vice President — Managed Assets, Investment Accounting, Ameriprise Financial Corporation, February 1998-May 2010 | |
Joseph F. DiMaria
225 Franklin Street
Boston, MA 02110
1968 | | Vice President and Chief Accounting Officer since 4/11 and Vice President since 3/11 and Chief Accounting Officer since 2008 for Nations Funds | | Vice President, Mutual Fund Administration, Columbia Management Investment Advisers, LLC, since May 2010; Director of Fund Administration, Columbia Management Advisors, LLC, January 2006-April 2010 | |
Paul B. Goucher
100 Park Avenue
New York, NY 10017
1968 | | Vice President since 4/11 and Assistant Secretary since 11/08 for RiverSource Funds and 5/10 for Nations Funds | | Vice President and Lead Chief Counsel, Ameriprise Financial, Inc. since November 2008 and January 2013, respectively (formerly, Chief Counsel, January 2010-January 2013 and Group Counsel from November 2008- January 2010); Director, Managing Director and General Counsel, J. & W. Seligman & Co. Incorporated, July 2008-November 2008 (previously, Managing Director and Associate General Counsel, January 2005-July 2008) | |
Michael E. DeFao
225 Franklin Street
Boston, MA 02110
1968 | | Vice President since 4/11 and Assistant Secretary since 5/10 for RiverSource Funds and 2011 for Nations Funds | | Vice President and Chief Counsel, Ameriprise Financial, Inc. since May 2010; Associate General Counsel, Bank of America, June 2005-April 2010 | |
Annual Report 2013
34
This page intentionally left blank.
Annual Report 2013
35
This page intentionally left blank.
Annual Report 2013
36
Columbia Marsico Focused Equities Fund
Important Information About This Report
Each fund mails one shareholder report to each shareholder address. If you would like more than one report, please call shareholder services at 800.345.6611 and additional reports will be sent to you.
The policy of the Board is to vote the proxies of the companies in which each fund holds investments consistent with the procedures as stated in the Statement of Additional Information (SAI). You may obtain a copy of the SAI without charge by calling 800.345.6611; contacting your financial intermediary; visiting columbiamanagement.com; or searching the website of the Securities and Exchange Commission (SEC) at sec.gov. Information regarding how each fund voted proxies relating to portfolio securities is filed with the SEC by August 31 for the most recent 12-month period ending June 30 of that year, and is available without charge by visiting columbiamanagement.com; or searching the website of the SEC at sec.gov.
Each fund files a complete schedule of portfolio holdings with the SEC for the first and third quarters of each fiscal year on Form N-Q. Each fund's Form N-Q is available on the SEC's website at sec.gov and may be reviewed and copied at the SEC's Public Reference Room in Washington, D.C. Information on the operation of the Public Reference Room may be obtained by calling 800.SEC.0330. Each fund's complete schedule of portfolio holdings, as filed on Form N-Q, can also be obtained without charge, upon request, by calling 800.345.6611.
Annual Report 2013
37

Columbia Marsico Focused Equities Fund
P.O. Box 8081
Boston, MA 02266-8081
columbiamanagement.com
This information is for use with concurrent or prior delivery of a fund prospectus. Please read and consider the investment objectives, risks, charges and expenses for any fund carefully before investing. For a prospectus which contains this and other important information about the Fund go to columbiamanagement.com. The Fund is distributed by Columbia Management Investment Distributors, Inc., member FINRA, and managed by Columbia Management Investment Advisers, LLC.
© 2013 Columbia Management Investment Advisers, LLC. All rights reserved.
ANN186_02_C01_(04/13)
Annual Report
February 28, 2013

Columbia Marsico Global Fund
Not FDIC insured • No bank guarantee • May lose value
Columbia Marsico Global Fund
 Dear Shareholders,
U.S. stocks flat, foreign markets strong in 2012 finale
After a strong third quarter, U.S. stock market averages treaded water as the year 2012 came to a close. However, they ended the year up strongly, as first- and third-quarter gains more than offset second- and fourth-quarter weakness. Typically a strong quarter for domestic small- and mid-cap issues, the fourth quarter of 2012 indeed proved to be another year-end positive for small-cap stocks. For the full calendar year 2012, the S&P 500 Index rose 16.00%.
Stock markets outside the United States generated some of the best returns for the fourth quarter, as optimism rebounded, thanks to the September actions of the European Central Bank in support of the euro and an improving outlook from China. Both developed and emerging foreign markets topped U.S. stocks by a solid margin.
Corporate and emerging markets led fixed income
Fixed-income investors took their cue from the equity markets and continued to favor the highest risk sectors through the end of 2012. Global fixed-income returns posted mixed results in the final quarter of the year. Gains were the highest for corporate high-yield and emerging market bonds. Although investors remained cautious ahead of the year-end budget negotiations, better economic data and a further improvement in the European sovereign debt crisis supported riskier assets and depressed government bond prices. In December, the Federal Reserve announced its intention to continue to purchase both Treasury and mortgage-backed securities and said that it would seek to keep short-term interest rates unchanged until the unemployment rate reaches 6.5%, or inflation turned noticeably higher.
Stay on track with Columbia Management
Backed by more than 100 years of experience, Columbia Management is one of the nation's largest asset managers. At the heart of our success — and, most importantly, that of our investors — are highly talented industry professionals, brought together by a unique way of working. We are dedicated to helping you take advantage of today's opportunities and anticipate tomorrow's. We stay abreast of the latest investment trends and ideas, using our collective insight to evaluate events and transform them into solutions you can use.
Visit columbiamanagement.com for:
> The Columbia Management Perspectives blog, featuring timely posts by our investment teams
> Detailed up-to-date fund performance and portfolio information
> Economic analysis and market commentary
> Quarterly fund commentaries
> Columbia Management Investor, our award-winning quarterly newsletter for shareholders
Thank you for your continued support of the Columbia Funds. We look forward to serving your investment needs for many years to come.
Best Regards,

J. Kevin Connaughton
President, Columbia Funds
The S&P 500 Index, an unmanaged index, measures the performance of 500 widely held, large-capitalization U.S. stocks and is frequently used as a general measure of market performance. Indices are not available for investment, are not professionally managed and do not reflect sales charges, fees, brokerage commissions, taxes or other expenses of investing.
Investors should consider the investment objectives, risks, charges and expenses of a mutual fund carefully before investing. For a free prospectus, which contains this and other important information about a fund, visit columbiamanagement.com. The prospectus should be read carefully before investing.
Columbia Funds are distributed by Columbia Management Investment Distributors, Inc., member FINRA, and managed by Columbia Management Investment Advisers, LLC.
© 2013 Columbia Management Investment Advisers, LLC. All rights reserved.
Columbia Marsico Global Fund
Performance Overview | | | 2 | | |
Manager Discussion of Fund Performance | | | 4 | | |
Understanding Your Fund's Expenses | | | 7 | | |
Portfolio of Investments | | | 8 | | |
Statement of Assets and Liabilities | | | 11 | | |
Statement of Operations | | | 13 | | |
Statement of Changes in Net Assets | | | 14 | | |
Financial Highlights | | | 16 | | |
Notes to Financial Statements | | | 20 | | |
Report of Independent Registered
Public Accounting Firm | | | 26 | | |
Trustees and Officers | | | 27 | | |
Important Information About This Report | | | 33 | | |
Fund Investment Manager
Columbia Management Investment
Advisers, LLC
225 Franklin Street
Boston, MA 02110
Fund Distributor
Columbia Management Investment
Distributors, Inc.
225 Franklin Street
Boston, MA 02110
Fund Transfer Agent
Columbia Management Investment
Services Corp.
P.O. Box 8081
Boston, MA 02266-8081
For more information about any of the funds, please visit columbiamanagement.com or call 800.345.6611. Customer Service Representatives are available to answer your questions Monday through Friday from 8 a.m. to 8 p.m. Eastern time.
The views expressed in this report reflect the current views of the respective parties. These views are not guarantees of future performance and involve certain risks, uncertainties and assumptions that are difficult to predict, so actual outcomes and results may differ significantly from the views expressed. These views are subject to change at any time based upon economic, market or other conditions and the respective parties disclaim any responsibility to update such views. These views may not be relied on as investment advice and, because investment decisions for a Columbia Fund are based on numerous factors, may not be relied on as an indication of trading intent on behalf of any particular Columbia Fund. References to specific securities should not be construed as a recommendation or investment advice.
Columbia Marsico Global Fund
Performance Summary
> Columbia Marsico Global Fund (the Fund) Class A shares returned 11.02% excluding sales charges for the 12-month period ended February 28, 2013.
> The Fund outperformed its benchmark, the MSCI All Country World Index (Net), which returned 9.29% for the same 12-month period.
> Both stock selection and sector allocations benefited Fund results during the period.
Average Annual Total Returns (%) (for period ended February 28, 2013)
| | Inception | | 1 Year | | Life | |
Class A | | 04/30/08 | | | | | |
Excluding sales charges | | | | | 11.02 | | | | 2.03 | | |
Including sales charges | | | | | 4.66 | | | | 0.79 | | |
Class C | | 04/30/08 | | | | | |
Excluding sales charges | | | | | 10.28 | | | | 1.28 | | |
Including sales charges | | | | | 9.28 | | | | 1.28 | | |
Class R | | 04/30/08 | | | 10.88 | | | | 1.79 | | |
Class Z | | 04/30/08 | | | 11.37 | | | | 2.29 | | |
MSCI All Country World Index (Net) | | | | | 9.29 | | | | 0.62 | | |
Returns for Class A are shown with and without the maximum initial sales charge of 5.75%. Returns for Class C are shown with and without the 1.00% contingent deferred sales charge (CDSC) for the first year only. The Fund's other classes are not subject to sales charges and have limited eligibility. Please see the Fund's prospectuses for details. Performance for different share classes will vary based on differences in sales charges and fees associated with each class. All results shown assume reinvestment of distributions during the period. Returns do not reflect the deduction of taxes that a shareholder may pay on Fund distributions or on the redemption of Fund shares. Performance results reflect the effect of any fee waivers or reimbursements of Fund expenses by Columbia Management Investment Advisers, LLC and/or any of its affiliates. Absent these fee waivers or expense reimbursement arrangements, performance results would have been lower.
The performance information shown represents past performance and is not a guarantee of future results. The investment return and principal value of your investment will fluctuate so that your shares, when redeemed, may be worth more or less than their original cost. Current performance may be lower or higher than the performance information shown. You may obtain performance information current to the most recent month-end by contacting your financial intermediary, visiting columbiamanagement.com or calling 800.345.6611.
The MSCI All Country World Index (Net) is a free float-adjusted market capitalization weighted index that is designed to measure the equity market performance of developed and emerging markets. The index consists of 45 country indices comprising 24 developed and 21 emerging market country indices.
Indices are not available for investment, are not professionally managed and do not reflect sales charges, fees, brokerage commissions, taxes or other expenses of investing. Securities in the Fund may not match those in an index.
Annual Report 2013
2
Columbia Marsico Global Fund
Performance Overview (continued)
Performance of a Hypothetical $10,000 Investment (April 30, 2008 – February 28, 2013)
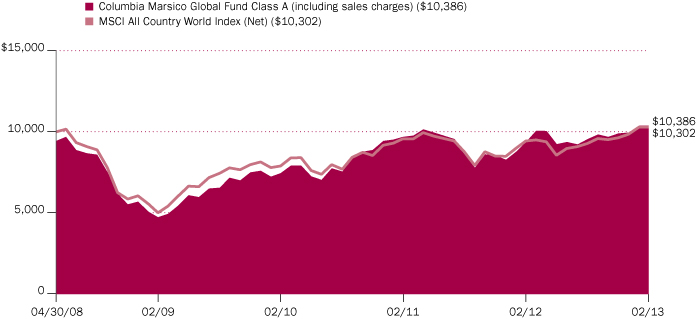
The chart above shows the change in value of a hypothetical $10,000 investment in Class A shares of Columbia Marsico Global Fund during the stated time period, and does not reflect the deduction of taxes that a shareholder may pay on Fund distributions or on the redemption of Fund shares.
Annual Report 2013
3
Columbia Marsico Global Fund
Manager Discussion of Fund Performance
For the 12-month period that ended February 28, 2013, the Fund's Class A shares returned 11.02% excluding sales charges. The Fund outperformed its benchmark, the MSCI All Country World Index (Net), which returned 9.29% for the same 12-month period. Strong stock selection in information technology generally accounted for the performance advantage, while several sector allocations aided results as well. Stock selection in industrials, energy and consumer staples detracted from performance, as did underweight allocations to the financials and consumer staples sectors.
Technology Selections, Sector Positioning Positive
Stock selection in the information technology sector significantly aided Fund performance. Mobile device advertising company Millennial Media and consulting and technology services company Accenture both registered double-digit stock price gains. We purchased Millennial Media at its initial public offering and sold the position as it reached our price target. Apple was a large constituent of the benchmark and was also a significant holding in the Fund early in the reporting period. We sold Apple late in 2012, owing to concerns about the company's future revenue growth. The timing of the sale aided performance as the stock declined sharply in the final weeks of the fiscal year.
The Fund had more exposure than the index to the strong-performing consumer discretionary sector, which also aided performance. Several stocks within the sector soared, including German media company Kabel Deutschland Holding and retailers Home Depot and Inditex, a Spain-based fashion company. Fund returns were also aided by underweight positions in the weak-performing energy and materials sectors.
Active currency management is not a central facet of the Fund's investment process, but fluctuations in major world currencies can affect performance. Overall, currencies had a positive impact on the Fund's performance during the period, aided by an underweight allocation to securities denominated in the Japanese yen, which weakened in the period.
Underweights in Financials and Consumer Staples Disappointed
Fund performance was hurt by underweights in the strong-performing financials and consumer staples sectors. Stock selection in the latter also detracted. Mead Johnson Nutrition's stock price declined after the company warned that slowing international growth for its baby formula products could affect future revenue and profit growth. Dairy and nutritional products company Danone posted weak performance on slower sales in Southern Europe. We sold both stocks. The Fund's holdings in the energy and industrials sectors also posted results that lagged the overall return of the benchmark index. Oil and gas exploration and production company Occidental Petroleum and energy services firm Halliburton posted double-digit declines and were sold. In the industrials sector, engine manufacturer Cummins recorded a negative return as a slower global growth environment led to softer demand for its heavy truck engines.
Looking Ahead
Overall, we currently think the U.S. and international economic environment is generally improving. At present, we believe large capitalization stocks are trading
Portfolio Management
Marsico Capital Management, LLC
James Gendelman
Thomas Marsico
Morningstar Style BoxTM

The Morningstar Style BoxTM is based on a fund's portfolio holdings. For equity funds, the vertical axis shows the market capitalization of the stocks owned, and the horizontal axis shows investment style (value, blend, or growth). Information shown is based on the most recent data provided by Morningstar.
© 2013 Morningstar, Inc. All rights reserved. The Morningstar information contained herein: (1) is proprietary to Morningstar and/or its content providers; (2) may not be copied or distributed; and (3) is not warranted to be accurate, complete or timely. Neither Morningstar nor its content providers are responsible for any damages or losses arising from any use of this information.
Annual Report 2013
4
Columbia Marsico Global Fund
Manager Discussion of Fund Performance (continued)
at reasonable valuations. However, serious fiscal challenges remain, both in the United States and abroad. Uncertainty about government economic policy is currently high and we believe additional tax hikes and spending cuts are likely. The question is whether this fiscal tightening can be done in a balanced and sensible manner. A major policy misstep could have profound repercussions for the economy. Still, there is currently significant pent-up demand for vehicles, houses, travel and leisure activities and corporate capital spending. If this demand is unleashed, it will have a beneficial impact on job growth and corporate profits.
Overseas, the current picture has brightened to some extent, particularly in emerging markets. Leading indicators have turned up for a variety of regions and countries, including China, Brazil and Hong Kong. Emerging market consumption, after retreating in concert with the global slowdown, is presently showing signs of revival. The current outlook has improved for Japan, where new leadership appears committed to a major stimulus program and improving trade relations with regional strategic partners, such as South Korea. China's economy currently appears to be snapping back from a rather dismal summer. At present, with inflation remaining relatively calm and bank lending looking more constrained, it appears that China can avoid a hard landing and has more room for policy stimulus if deemed necessary.
In the European Union (EU), credit conditions have improved significantly since the European Central Bank launched its bond-buying program in late summer. Intra-bank lending rates have declined. Corporate credit default swap spreads are currently at two-year lows. Funding markets have been receptive as of late to sovereign debt auctions and borrowing costs have declined significantly. It currently appears the EU may have averted the worst-case outcome. However, recessionary pressures are intensifying and, without fiscal union, the region lacks a cohesive distribution mechanism for policy stimulus. Social unrest is a material risk factor, most recently highlighted by the lack of an outcome in the Italian general election. Another risk factor for the EU is the degree to which economic growth recovers in the rest of the world, since exports represent a major part of the economies of Germany, Italy, France and the United Kingdom.
Against this backdrop, we are currently emphasizing companies that we believe have a high degree of earnings visibility, unleveraged balance sheets and are buying back stock and increasing dividends. The Fund had a degree of U.S.-centricity in its portfolio, although a number of its U.S. companies derive a significant portion of revenues from international markets. There are several investment themes currently at work in the Fund. It has a significant consumer discretionary exposure, with many of the positions being more staple-like in nature, meaning they offer needed rather than wanted products and services. We are also currently focusing on health care, particularly pharmaceuticals. A number of drug companies offer robust new product pipelines for unmet clinical needs. Other themes include recoveries in U.S. housing, manufacturing and automobiles. We think the U.S. manufacturing sector has the potential to benefit from an inexpensive and growing supply of natural gas that provides a significant cost advantage.
During the period, we significantly reduced the Fund's allocation to the information technology sector. We also trimmed holdings in the financials, consumer staples, materials and energy sectors. We increased allocations to
Top Ten Holdings (%)
(at February 28, 2013) | |
Roche Holding AG, Genusschein
Shares (Switzerland) | | | 5.3 | | |
Rolls-Royce Holdings PLC
(United Kingdom) | | | 4.5 | | |
eBay, Inc. (United States) | | | 4.2 | | |
Google, Inc., Class A (United
States) | | | 3.9 | | |
Biogen Idec, Inc. (United States) | | | 3.6 | | |
Home Depot, Inc. (The) (United
States) | | | 3.2 | | |
Gilead Sciences, Inc. (United
States) | | | 3.2 | | |
Wells Fargo & Co. (United States) | | | 3.1 | | |
Kabel Deutschland Holding AG
(Germany) | | | 3.1 | | |
Citigroup, Inc. (United States) | | | 3.1 | | |
Percentages indicated are based upon total investments (excluding Money Market Funds).
For further detail about these holdings, please refer to the section entitled "Portfolio of Investments."
Fund holdings are as of the date given, are subject to change at any time, and are not recommendations to buy or sell any security.
Country Breakdown (%)
(at February 28, 2013) | |
Belgium | | | 2.0 | | |
France | | | 2.4 | | |
Germany | | | 6.7 | | |
Hong Kong | | | 2.3 | | |
Ireland | | | 2.0 | | |
Italy | | | 0.5 | | |
Japan | | | 1.8 | | |
Singapore | | | 1.6 | | |
Spain | | | 1.7 | | |
Switzerland | | | 7.2 | | |
United Kingdom | | | 6.4 | | |
United States(a) | | | 65.4 | | |
Total | | | 100.0 | | |
Percentages indicated are based upon total investments. The Fund's portfolio composition is subject to change.
(a) Includes investments in Money Market Funds.
Annual Report 2013
5
Columbia Marsico Global Fund
Manager Discussion of Fund Performance (continued)
health care, industrials and consumer discretionary. Fund repositioning contributed to modestly higher cash levels at times throughout the period. This uninvested cash weighed on performance as the equity market rose. At period end, the Fund emphasized the consumer discretionary, health care and industrials sectors. It had no holdings in utilities or telecommunication services.
Summary of Investments in Securities
by Industry (%)
(at February 28, 2013) | |
Aerospace & Defense | | | 6.2 | | |
Automobiles | | | 5.1 | | |
Beverages | | | 1.9 | | |
Biotechnology | | | 6.0 | | |
Chemicals | | | 1.8 | | |
Commercial Banks | | | 2.8 | | |
Diversified Financial Services | | | 2.7 | | |
Electrical Equipment | | | 2.0 | | |
Energy Equipment & Services | | | 2.1 | | |
Food & Staples Retailing | | | 1.8 | | |
Food Products | | | 2.4 | | |
Health Care Equipment &
Supplies | | | 2.4 | | |
Hotels, Restaurants & Leisure | | | 5.5 | | |
Internet & Catalog Retail | | | 1.8 | | |
Internet Software & Services | | | 7.2 | | |
IT Services | | | 1.9 | | |
Machinery | | | 3.7 | | |
Media | | | 7.0 | | |
Pharmaceuticals | | | 7.1 | | |
Real Estate Management &
Development | | | 1.6 | | |
Specialty Retail | | | 8.2 | | |
Textiles, Apparel & Luxury
Goods | | | 5.7 | | |
Trading Companies &
Distributors | | | 1.5 | | |
Money Market Funds | | | 10.0 | | |
Total | | | 98.4 | | |
Percentages indicated are based upon net assets. The Fund's portfolio composition is subject to change.
Annual Report 2013
6
Columbia Marsico Global Fund
Understanding Your Fund's Expenses
(Unaudited)
As an investor, you incur two types of costs. There are transaction costs, which generally include sales charges on purchases and may include redemption fees. There are also ongoing costs, which generally include management fees, distribution and service (Rule 12b-1) fees, and other fund expenses. The following information is intended to help you understand your ongoing costs (in dollars) of investing in the Fund and to help you compare these costs with the ongoing costs of investing in other mutual funds.
Analyzing Your Fund's Expenses
To illustrate these ongoing costs, we have provided examples and calculated the expenses paid by investors in each share class of the Fund during the period. The actual and hypothetical information in the table is based on an initial investment of $1,000 at the beginning of the period indicated and held for the entire period. Expense information is calculated two ways and each method provides you with different information. The amount listed in the "Actual" column is calculated using the Fund's actual operating expenses and total return for the period. You may use the Actual information, together with the amount invested, to estimate the expenses that you paid over the period. Simply divide your account value by $1,000 (for example, an $8,600 account value divided by $1,000 = 8.6), then multiply the results by the expenses paid during the period under the Actual column. The amount listed in the "Hypothetical" column assumes a 5% annual rate of return before expenses (which is not the Fund's actual return) and then applies the Fund's actual expense ratio for the period to the hypothetical return. You should not use the hypothetical account values and expenses to estimate either your actual account balance at the end of the period or the expenses you paid during the period. See "Compare With Other Funds" below for details on how to use the hypothetical data.
Compare With Other Funds
Since all mutual funds are required to include the same hypothetical calculations about expenses in shareholder reports, you can use this information to compare the ongoing cost of investing in the Fund with other funds. To do so, compare the hypothetical example with the 5% hypothetical examples that appear in the shareholder reports of other funds. As you compare hypothetical examples of other funds, it is important to note that hypothetical examples are meant to highlight the ongoing costs of investing in a fund only and do not reflect any transaction costs, such as sales charges, or redemption or exchange fees. Therefore, the hypothetical calculations are useful in comparing ongoing costs only, and will not help you determine the relative total costs of owning different funds. If transaction costs were included in these calculations, your costs would be higher.
September 1, 2012 – February 28, 2013
| | Account Value at the Beginning
of the Period ($) | | Account Value at the End of the
Period ($) | | Expenses Paid During the
Period ($) | | Fund's Annualized
Expense Ratio (%) | |
| | Actual | | Hypothetical | | Actual | | Hypothetical | | Actual | | Hypothetical | | Actual | |
Class A | | | 1,000.00 | | | | 1,000.00 | | | | 1,088.90 | | | | 1,017.06 | | | | 8.08 | | | | 7.80 | | | | 1.56 | | |
Class C | | | 1,000.00 | | | | 1,000.00 | | | | 1,084.60 | | | | 1,013.34 | | | | 11.94 | | | | 11.53 | | | | 2.31 | | |
Class R | | | 1,000.00 | | | | 1,000.00 | | | | 1,088.50 | | | | 1,015.82 | | | | 9.37 | | | | 9.05 | | | | 1.81 | | |
Class Z | | | 1,000.00 | | | | 1,000.00 | | | | 1,090.30 | | | | 1,018.30 | | | | 6.79 | | | | 6.56 | | | | 1.31 | | |
Expenses paid during the period are equal to the annualized expense ratio for each class as indicated above, multiplied by the average account value over the period and then multiplied by the number of days in the Fund's most recent fiscal half year and divided by 365.
Expenses do not include fees and expenses incurred indirectly by the Fund from the underlying funds in which the Fund may invest (also referred to as "acquired funds"), including affiliated and non-affiliated pooled investment vehicles (including mutual funds and exchange-traded funds).
Had Columbia Management Investment Advisers, LLC and/or certain of its affiliates not waived/reimbursed certain fees and expenses, account value at the end of the period would have been reduced.
Annual Report 2013
7
Columbia Marsico Global Fund
Portfolio of Investments
February 28, 2013
(Percentages represent value of investments compared to net assets)
Common Stocks 86.5%
Issuer | | Shares | | Value ($) | |
Belgium 1.9% | |
Anheuser-Busch InBev NV | | | 3,927 | | | | 368,018 | | |
France 2.4% | |
Hermes International | | | 1,370 | | | | 455,465 | | |
Germany 4.7% | |
Bayerische Motoren Werke AG | | | 3,975 | | | | 365,465 | | |
Kabel Deutschland Holding AG | | | 6,112 | | | | 529,176 | | |
Total | | | | | 894,641 | | |
Hong Kong 2.3% | |
Wynn Macau Ltd.(a) | | | 163,727 | | | | 430,870 | | |
Ireland 2.0% | |
Eaton Corp. PLC | | | 6,192 | | | | 383,718 | | |
Italy 0.5% | |
Luxottica Group, SpA, ADR | | | 2,017 | | | | 94,033 | | |
Japan 1.8% | |
Rakuten, Inc. | | | 39,100 | | | | 337,974 | | |
Singapore 1.6% | |
Global Logistic Properties Ltd. | | | 149,000 | | | | 305,593 | | |
Spain 1.7% | |
Inditex SA | | | 2,428 | | | | 324,586 | | |
Switzerland 7.0% | |
Nestlé SA, Registered Shares | | | 6,510 | | | | 454,467 | | |
Roche Holding AG, Genusschein Shares | | | 3,888 | | | | 889,606 | | |
Total | | | | | 1,344,073 | | |
United Kingdom 6.3% | |
British Sky Broadcasting Group PLC | | | 35,439 | | | | 456,044 | | |
Rolls-Royce Holdings PLC | | | 48,583 | | | | 755,768 | | |
Total | | | | | 1,211,812 | | |
United States 54.3% | |
Accenture PLC, Class A | | | 4,955 | | | | 368,454 | | |
AutoZone, Inc.(a) | | | 687 | | | | 261,163 | | |
Biogen Idec, Inc.(a) | | | 3,647 | | | | 606,642 | | |
Bristol-Myers Squibb Co. | | | 12,370 | | | | 457,319 | | |
Citigroup, Inc. | | | 12,453 | | | | 522,652 | | |
Comcast Corp., Class A | | | 8,929 | | | | 355,285 | | |
Cummins, Inc. | | | 3,067 | | | | 355,373 | | |
Common Stocks (continued)
Issuer | | Shares | | Value ($) | |
eBay, Inc.(a) | | | 12,983 | | | | 709,910 | | |
Gilead Sciences, Inc.(a) | | | 12,466 | | | | 532,423 | | |
Google, Inc., Class A(a) | | | 823 | | | | 659,388 | | |
Home Depot, Inc. (The) | | | 7,911 | | | | 541,904 | | |
Intuitive Surgical, Inc.(a) | | | 914 | | | | 466,039 | | |
lululemon athletica, Inc.(a) | | | 2,618 | | | | 175,537 | | |
LyondellBasell Industries NV, Class A | | | 5,971 | | | | 350,020 | | |
Nike, Inc., Class B | | | 6,602 | | | | 359,545 | | |
Pentair Ltd. | | | 6,704 | | | | 357,122 | | |
Precision Castparts Corp. | | | 2,323 | | | | 433,449 | | |
Pricesmart, Inc. | | | 4,581 | | | | 339,681 | | |
Schlumberger Ltd. | | | 5,106 | | | | 397,502 | | |
Starbucks Corp. | | | 6,514 | | | | 357,097 | | |
Starwood Hotels & Resorts Worldwide, Inc. | | | 4,434 | | | | 267,503 | | |
Tesla Motors, Inc.(a) | | | 7,244 | | | | 252,309 | | |
TJX Companies, Inc. | | | 9,870 | | | | 443,854 | | |
Wells Fargo & Co. | | | 15,101 | | | | 529,743 | | |
WW Grainger, Inc. | | | 1,236 | | | | 279,905 | | |
Total | | | | | 10,379,819 | | |
Total Common Stocks
(Cost: $14,571,122) | | | | | 16,530,602 | | |
Preferred Stocks 1.9%
Germany 1.9% | |
Volkswagen AG | | | 1,633 | | | | 355,198 | | |
Total Preferred Stocks
(Cost: $377,440) | | | | | 355,198 | | |
Money Market Funds 10.0%
Columbia Short-Term Cash Fund,
0.128%(b)(c) | | | 1,904,236 | | | | 1,904,236 | | |
Total Money Market Funds
(Cost: $1,904,236) | | | | | 1,904,236 | | |
Total Investments
(Cost: $16,852,798) | | | 18,790,036 | | |
Other Assets & Liabilities, Net | | | 314,030 | | |
Net Assets | | | 19,104,066 | | |
The accompanying Notes to Financial Statements are an integral part of this statement.
Annual Report 2013
8
Columbia Marsico Global Fund
Portfolio of Investments (continued)
February 28, 2013
Notes to Portfolio of Investments
(a) Non-income producing.
(b) The rate shown is the seven-day current annualized yield at February 28, 2013.
(c) As defined in the Investment Company Act of 1940, an affiliated company is one in which the Fund owns 5% or more of its outstanding voting securities, or a company which is under common ownership or control with the Fund. Holdings and transactions in these affiliated companies during the year ended February 28, 2013, are as follows:
Issuer | | Beginning
Cost ($) | | Purchase
Cost ($) | | Proceeds
From Sales ($) | | Realized
Gain (Loss) ($) | | Ending
Cost ($) | | Dividends —
Affiliated
Issuers ($) | | Value ($) | |
Columbia Short-Term Cash Fund | | | 162,080 | | | | 15,618,329 | | | | (13,876,173 | ) | | | — | | | | 1,904,236 | | | | 1,964 | | | | 1,904,236 | | |
Abbreviation Legend
ADR American Depositary Receipt
Fair Value Measurements
Generally accepted accounting principles (GAAP) require disclosure regarding the inputs and valuation techniques used to measure fair value and any changes in valuation inputs or techniques. In addition, investments shall be disclosed by major category.
The Fund categorizes its fair value measurements according to a three-level hierarchy that maximizes the use of observable inputs and minimizes the use of unobservable inputs by prioritizing that the most observable input be used when available. Observable inputs are those that market participants would use in pricing an investment based on market data obtained from sources independent of the reporting entity. Unobservable inputs are those that reflect the Fund's assumptions about the information market participants would use in pricing an investment. An investment's level within the fair value hierarchy is based on the lowest level of any input that is deemed significant to the asset or liability's fair value measurement. The input levels are not necessarily an indication of the risk or liquidity associated with investments at that level. For example, certain U.S. government securities are generally high quality and liquid, however, they are reflected as Level 2 because the inputs used to determine fair value may not always be quoted prices in an active market.
Fair value inputs are summarized in the three broad levels listed below:
> Level 1 — Valuations based on quoted prices for investments in active markets that the Fund has the ability to access at the measurement date (including NAV for open-end mutual funds). Valuation adjustments are not applied to Level 1 investments.
> Level 2 — Valuations based on other significant observable inputs (including quoted prices for similar securities, interest rates, prepayment speeds, credit risks, etc.).
> Level 3 — Valuations based on significant unobservable inputs (including the Fund's own assumptions and judgment in determining the fair value of investments).
Inputs that are used in determining fair value of an investment may include price information, credit data, volatility statistics, and other factors. These inputs can be either observable or unobservable. The availability of observable inputs can vary between investments, and is affected by various factors such as the type of investment, and the volume and level of activity for that investment or similar investments in the marketplace. The inputs will be considered by the Investment Manager, along with any other relevant factors in the calculation of an investment's fair value. The Fund uses prices and inputs that are current as of the measurement date, which may include periods of market dislocations. During these periods, the availability of prices and inputs may be reduced for many investments. This condition could cause an investment to be reclassified between the various levels within the hierarchy.
Foreign equity securities actively traded in markets where there is a significant delay in the local close relative to the New York Stock Exchange (NYSE) are classified as Level 2. The values of these securities may include an adjustment to reflect the impact of significant market movements following the close of local trading, as described in Note 2 to the financial statements — Security Valuation.
Investments falling into the Level 3 category are primarily supported by quoted prices from brokers and dealers participating in the market for those investments. However, these may be classified as Level 3 investments due to lack of market transparency and corroboration to support these quoted prices. Additionally, valuation models may be used as the pricing source for any remaining investments classified as Level 3. These models rely on one or more significant unobservable inputs and/or significant assumptions by the Investment Manager. Inputs used in valuations may include, but are not limited to, financial statement analysis, capital account balances, discount rates and estimated cash flows, and comparable company data.
Under the direction of the Fund's Board of Trustees (the Board), the Investment Manager's Valuation Committee (the Committee) is responsible for carrying out the valuation procedures approved by the Board. The Committee consists of voting and non-voting members from various groups within the Investment Manager's organization, including operations and accounting, trading and investments, compliance, risk management and legal.
The accompanying Notes to Financial Statements are an integral part of this statement.
Annual Report 2013
9
Columbia Marsico Global Fund
Portfolio of Investments (continued)
February 28, 2013
Fair Value Measurements (continued)
The Committee meets at least monthly to review and approve valuation matters, which may include a description of specific valuation determinations, data regarding pricing information received from approved pricing vendors and brokers and the results of Board-approved valuation control policies and procedures (the Policies). The Policies address, among other things, instances when market quotations are readily available, including recommendations of third party pricing vendors and a determination of appropriate pricing methodologies; events that require specific valuation determinations and assessment of fair value techniques; securities with a potential for stale pricing, including those that are illiquid, restricted, or in default; and the effectiveness of third-party pricing vendors, including periodic reviews of vendors. The Committee meets more frequently, as needed, to discuss additional valuation matters, which may include the need to review back-testing results, review time-sensitive information or approve related valuation actions. The Committee reports to the Board, with members of the Committee meeting with the Board at each of its regularly scheduled meetings to discuss valuation matters and actions during the period, similar to those described earlier.
For investments categorized as Level 3, the Committee monitors information similar to that described above, which may include: (i) data specific to the issuer or comparable issuers, (ii) general market or specific sector news and (iii) quoted prices and specific or similar security transactions. The Committee considers this data and any changes from prior periods in order to assess the reasonableness of observable and unobservable inputs, any assumptions or internal models used to value those securities and changes in fair value. This data is also used to corroborate, when available, information received from approved pricing vendors and brokers. Various factors impact the frequency of monitoring this information (which may occur as often as daily). However, the Committee may determine that changes to inputs, assumptions and models are not required as a result of the monitoring procedures performed.
The following table is a summary of the inputs used to value the Fund's investments at February 28, 2013:
Description | | Level 1
Quoted Prices in Active
Markets for Identical
Assets ($) | | Level 2
Other Significant
Observable Inputs ($) | | Level 3
Significant
Unobservable Inputs ($) | | Total ($) | |
Equity Securities | |
Common Stocks | |
Consumer Discretionary | | | 3,108,230 | | | | 2,899,580 | | | | — | | | | 6,007,810 | | |
Consumer Staples | | | 339,681 | | | | 822,485 | | | | — | | | | 1,162,166 | | |
Energy | | | 397,502 | | | | — | | | | — | | | | 397,502 | | |
Financials | | | 1,052,395 | | | | 305,592 | | | | — | | | | 1,357,987 | | |
Health Care | | | 2,062,423 | | | | 889,606 | | | | — | | | | 2,952,029 | | |
Industrials | | | 1,809,567 | | | | 755,769 | | | | — | | | | 2,565,336 | | |
Information Technology | | | 1,737,752 | | | | — | | | | — | | | | 1,737,752 | | |
Materials | | | 350,020 | | | | — | | | | — | | | | 350,020 | | |
Preferred Stocks | |
Consumer Discretionary | | | — | | | | 355,198 | | | | — | | | | 355,198 | | |
Total Equity Securities | | | 10,857,570 | | | | 6,028,230 | | | | — | | | | 16,885,800 | | |
Other | |
Money Market Funds | | | 1,904,236 | | | | — | | | | — | | | | 1,904,236 | | |
Total Other | | | 1,904,236 | | | | — | | | | — | | | | 1,904,236 | | |
Total | | | 12,761,806 | | | | 6,028,230 | | | | — | | | | 18,790,036 | | |
See the Portfolio of Investments for all investment classifications not indicated in the table.
The Fund's assets assigned to the Level 2 input category are generally valued using the market approach, in which a security's value is determined through reference to prices and information from market transactions for similar or identical assets. These assets include certain foreign securities for which a third party statistical pricing service may be employed for purposes of fair market valuation. The models utilized by the third party statistical pricing service take into account a security's correlation to available market data including, but not limited to, intraday index, ADR, and ETF movements.
There were no transfers of financial assets between Levels 1 and 2 during the period.
The accompanying Notes to Financial Statements are an integral part of this statement.
Annual Report 2013
10
Columbia Marsico Global Fund
Statement of Assets and Liabilities
February 28, 2013
Assets | |
Investments, at value | |
Unaffiliated issuers (identified cost $14,948,562) | | $ | 16,885,800 | | |
Affiliated issuers (identified cost $1,904,236) | | | 1,904,236 | | |
Total investments (identified cost $16,852,798) | | | 18,790,036 | | |
Receivable for: | |
Investments sold | | | 393,744 | | |
Capital shares sold | | | 105,903 | | |
Dividends | | | 14,470 | | |
Reclaims | | | 5,220 | | |
Prepaid expenses | | | 1,141 | | |
Total assets | | | 19,310,514 | | |
Liabilities | |
Payable for: | |
Investments purchased | | | 94,305 | | |
Capital shares purchased | | | 6,725 | | |
Investment management fees | | | 415 | | |
Distribution and/or service fees | | | 166 | | |
Transfer agent fees | | | 1,484 | | |
Administration fees | | | 42 | | |
Compensation of board members | | | 21,272 | | |
Expense reimbursement due to Investment Manager | | | 46,500 | | |
Other expenses | | | 35,539 | | |
Total liabilities | | | 206,448 | | |
Net assets applicable to outstanding capital stock | | $ | 19,104,066 | | |
Represented by | |
Paid-in capital | | $ | 17,538,736 | | |
Excess of distributions over net investment income | | | (54,091 | ) | |
Accumulated net realized loss | | | (317,766 | ) | |
Unrealized appreciation (depreciation) on: | |
Investments | | | 1,937,238 | | |
Foreign currency translations | | | (51 | ) | |
Total — representing net assets applicable to outstanding capital stock | | $ | 19,104,066 | | |
The accompanying Notes to Financial Statements are an integral part of this statement.
Annual Report 2013
11
Columbia Marsico Global Fund
Statement of Assets and Liabilities (continued)
February 28, 2013
Class A | |
Net assets | | $ | 10,610,257 | | |
Shares outstanding | | | 983,849 | | |
Net asset value per share | | $ | 10.78 | | |
Maximum offering price per share(a) | | $ | 11.44 | | |
Class C | |
Net assets | | $ | 2,585,798 | | |
Shares outstanding | | | 245,982 | | |
Net asset value per share | | $ | 10.51 | | |
Class R | |
Net assets | | $ | 1,645,497 | | |
Shares outstanding | | | 153,856 | | |
Net asset value per share | | $ | 10.70 | | |
Class Z | |
Net assets | | $ | 4,262,514 | | |
Shares outstanding | | | 392,055 | | |
Net asset value per share | | $ | 10.87 | | |
(a) The maximum offering price per share is calculated by dividing the net asset value by 1.0 minus the maximum sales charge of 5.75%.
The accompanying Notes to Financial Statements are an integral part of this statement.
Annual Report 2013
12
Columbia Marsico Global Fund
Statement of Operations
Year Ended February 28, 2013
Net investment income | |
Income: | |
Dividends — unaffiliated issuers | | $ | 153,357 | | |
Dividends — affiliated issuers | | | 1,964 | | |
Foreign taxes withheld | | | (9,608 | ) | |
Total income | | | 145,713 | | |
Expenses: | |
Investment management fees | | | 98,982 | | |
Distribution and/or service fees | |
Class A | | | 16,294 | | |
Class C | | | 22,447 | | |
Class R | | | 6,441 | | |
Transfer agent fees | |
Class A | | | 7,217 | | |
Class C | | | 2,403 | | |
Class R | | | 1,368 | | |
Class Z | | | 2,619 | | |
Administration fees | | | 24,657 | | |
Compensation of board members | | | 8,056 | | |
Custodian fees | | | 3,903 | | |
Printing and postage fees | | | 8,280 | | |
Registration fees | | | 48,098 | | |
Professional fees | | | 22,831 | | |
Other | | | 13,842 | | |
Total expenses | | | 287,438 | | |
Fees waived or expenses reimbursed by Investment Manager and its affiliates | | | (78,204 | ) | |
Total net expenses | | | 209,234 | | |
Net investment loss | | | (63,521 | ) | |
Realized and unrealized gain (loss) — net | |
Net realized gain (loss) on: | |
Investments | | | 1,114,050 | | |
Foreign currency translations | | | (3,335 | ) | |
Net realized gain | | | 1,110,715 | | |
Net change in unrealized appreciation (depreciation) on: | |
Investments | | | 443,762 | | |
Foreign currency translations | | | (95 | ) | |
Forward foreign currency exchange contracts | | | 368 | | |
Net change in unrealized appreciation (depreciation) | | | 444,035 | | |
Net realized and unrealized gain | | | 1,554,750 | | |
Net increase in net assets resulting from operations | | $ | 1,491,229 | | |
The accompanying Notes to Financial Statements are an integral part of this statement.
Annual Report 2013
13
Columbia Marsico Global Fund
Statement of Changes in Net Assets
| | | Year Ended
February 28,
2013 | | Year Ended
February 29,
2012 | |
Operations | |
Net investment loss | | $ | (63,521 | ) | | $ | (56,126 | ) | |
Net realized gain (loss) | | | 1,110,715 | | | | (247,532 | ) | |
Net change in unrealized appreciation (depreciation) | | | 444,035 | | | | (103,783 | ) | |
Net increase (decrease) in net assets resulting from operations | | | 1,491,229 | | | | (407,441 | ) | |
Distributions to shareholders | |
Net investment income | |
Class A | | | — | | | | (4,805 | ) | |
Class C | | | — | | | | (730 | ) | |
Class R | | | — | | | | (1,118 | ) | |
Class Z | | | — | | | | (2,247 | ) | |
Net realized gains | |
Class A | | | — | | | | (39,988 | ) | |
Class C | | | — | | | | (20,597 | ) | |
Class R | | | — | | | | (11,798 | ) | |
Class Z | | | — | | | | (14,569 | ) | |
Tax return of capital | |
Class A | | | — | | | | (3,507 | ) | |
Class C | | | — | | | | (1,036 | ) | |
Class R | | | — | | | | (903 | ) | |
Class Z | | | — | | | | (1,497 | ) | |
Total distributions to shareholders | | | — | | | | (102,795 | ) | |
Increase (decrease) in net assets from capital stock activity | | | 9,181,802 | | | | 745,769 | | |
Total increase in net assets | | | 10,673,031 | | | | 235,533 | | |
Net assets at beginning of year | | | 8,431,035 | | | | 8,195,502 | | |
Net assets at end of year | | $ | 19,104,066 | | | $ | 8,431,035 | | |
Excess of distributions over net investment income | | $ | (54,091 | ) | | $ | (20,057 | ) | |
The accompanying Notes to Financial Statements are an integral part of this statement.
Annual Report 2013
14
Columbia Marsico Global Fund
Statement of Changes in Net Assets (continued)
| | | Year Ended February 28, 2013 | | Year Ended February 29, 2012 | |
| | | Shares | | Dollars ($) | | Shares | | Dollars ($) | |
Capital stock activity | |
Class A shares | |
Subscriptions | | | 839,765 | | | | 8,497,513 | | | | 206,746 | | | | 2,013,459 | | |
Distributions reinvested | | | — | | | | — | | | | 2,568 | | | | 24,649 | | |
Redemptions | | | (245,776 | ) | | | (2,456,822 | ) | | | (148,345 | ) | | | (1,331,799 | ) | |
Net increase | | | 593,989 | | | | 6,040,691 | | | | 60,969 | | | | 706,309 | | |
Class C shares | |
Subscriptions | | | 65,211 | | | | 638,876 | | | | 28,078 | | | | 260,860 | | |
Distributions reinvested | | | — | | | | — | | | | 775 | | | | 7,338 | | |
Redemptions | | | (30,288 | ) | | | (302,304 | ) | | | (22,034 | ) | | | (190,106 | ) | |
Net increase | | | 34,923 | | | | 336,572 | | | | 6,819 | | | | 78,092 | | |
Class R shares | |
Subscriptions | | | 30,075 | | | | 313,224 | | | | 877 | | | | 8,195 | | |
Distributions reinvested | | | — | | | | — | | | | 16 | | | | 150 | | |
Redemptions | | | (3 | ) | | | (35 | ) | | | — | | | | — | | |
Net increase | | | 30,072 | | | | 313,189 | | | | 893 | | | | 8,345 | | |
Class Z shares | |
Subscriptions | | | 284,021 | | | | 2,898,398 | | | | 3,282 | | | | 31,235 | | |
Distributions reinvested | | | — | | | | — | | | | 237 | | | | 2,280 | | |
Redemptions | | | (39,285 | ) | | | (407,048 | ) | | | (8,826 | ) | | | (80,492 | ) | |
Net increase (decrease) | | | 244,736 | | | | 2,491,350 | | | | (5,307 | ) | | | (46,977 | ) | |
Total net increase | | | 903,720 | | | | 9,181,802 | | | | 63,374 | | | | 745,769 | | |
The accompanying Notes to Financial Statements are an integral part of this statement.
Annual Report 2013
15
Columbia Marsico Global Fund
The following tables are intended to help you understand the Fund's financial performance. Certain information reflects financial results for a single share of a class held for the periods shown. Per share net investment income (loss) amounts are calculated based on average shares outstanding during the period. Total return assumes reinvestment of all dividends and distributions, if any. Total return does not reflect payment of sales charges, if any, and is not annualized for periods of less than one year.
| | | Year Ended
February 28, | | Year Ended
February 29, | | Year Ended February 28, | |
Class A | | 2013 | | 2012 | | 2011 | | 2010 | | 2009(a) | |
Per share data | |
Net asset value, beginning of period | | $ | 9.71 | | | $ | 10.16 | | | $ | 7.85 | | | $ | 4.98 | | | $ | 10.00 | | |
Income from investment operations: | |
Net investment income (loss) | | | (0.04 | ) | | | (0.05 | ) | | | (0.05 | ) | | | (0.03 | ) | | | 0.01 | | |
Net realized and unrealized gain (loss) | | | 1.11 | | | | (0.28 | ) | | | 2.42 | | | | 2.93 | | | | (5.03 | ) | |
Total from investment operations | | | 1.07 | | | | (0.33 | ) | | | 2.37 | | | | 2.90 | | | | (5.02 | ) | |
Less distributions to shareholders: | |
Net investment income | | | — | | | | (0.01 | ) | | | (0.06 | ) | | | (0.03 | ) | | | — | | |
Net realized gains | | | — | | | | (0.10 | ) | | | — | | | | — | | | | — | | |
Tax return of capital | | | — | | | | (0.01 | ) | | | — | | | | — | | | | — | | |
Total distributions to shareholders | | | — | | | | (0.12 | ) | | | (0.06 | ) | | | (0.03 | ) | | | — | | |
Redemption fees: | |
Redemption fees added to paid-in capital | | | — | | | | — | | | | — | | | | 0.00 | (b) | | | 0.00 | (b) | |
Net asset value, end of period | | $ | 10.78 | | | $ | 9.71 | | | $ | 10.16 | | | $ | 7.85 | | | $ | 4.98 | | |
Total return | | | 11.02 | % | | | (3.27 | %) | | | 30.23 | % | | | 58.22 | % | | | (50.20 | %) | |
Ratios to average net assets(c) | |
Total gross expenses | | | 2.18 | % | | | 3.58 | % | | | 5.38 | % | | | 5.44 | % | | | 8.79 | %(d) | |
Total net expenses(e) | | | 1.57 | % | | | 1.60 | % | | | 1.60 | %(f) | | | 1.60 | %(f) | | | 1.60 | %(d)(g) | |
Net investment income (loss) | | | (0.41 | %) | | | (0.50 | %) | | | (0.59 | %) | | | (0.42 | %) | | | 0.09 | %(d) | |
Supplemental data | |
Net assets, end of period (in thousands) | | $ | 10,610 | | | $ | 3,786 | | | $ | 3,343 | | | $ | 1,990 | | | $ | 1,113 | | |
Portfolio turnover | | | 98 | % | | | 112 | % | | | 104 | % | | | 137 | % | | | 168 | % | |
Notes to Financial Highlights
(a) For the period from April 30, 2008 (commencement of operations) to February 28, 2009.
(b) Rounds to zero.
(c) In addition to the fees and expenses which the Fund bears directly, the Fund indirectly bears a pro rata share of the fees and expenses of the acquired funds in which it invests. Such indirect expenses are not included in the reported expense ratios.
(d) Annualized.
(e) Total net expenses include the impact of certain waivers/reimbursements made by the Investment Manager and certain of its affiliates, if applicable.
(f) The benefits derived from expense reductions had an impact of less than 0.01%.
(g) The benefits derived from expense reductions had an impact of 0.01%.
The accompanying Notes to Financial Statements are an integral part of this statement.
Annual Report 2013
16
Columbia Marsico Global Fund
Financial Highlights (continued)
| | | Year Ended
February 28, | | Year Ended
February 29, | | Year Ended February 28, | |
Class C | | 2013 | | 2012 | | 2011 | | 2010 | | 2009(a) | |
Per share data | |
Net asset value, beginning of period | | $ | 9.53 | | | $ | 10.04 | | | $ | 7.78 | | | $ | 4.95 | | | $ | 10.00 | | |
Income from investment operations: | |
Net investment loss | | | (0.11 | ) | | | (0.11 | ) | | | (0.12 | ) | | | (0.08 | ) | | | (0.04 | ) | |
Net realized and unrealized gain (loss) | | | 1.09 | | | | (0.30 | ) | | | 2.39 | | | | 2.91 | | | | (5.01 | ) | |
Total from investment operations | | | 0.98 | | | | (0.41 | ) | | | 2.27 | | | | 2.83 | | | | (5.05 | ) | |
Less distributions to shareholders: | |
Net investment income | | | — | | | | (0.00 | )(b) | | | (0.01 | ) | | | — | | | | — | | |
Net realized gains | | | — | | | | (0.10 | ) | | | — | | | | — | | | | — | | |
Tax return of capital | | | — | | | | (0.00 | )(b) | | | — | | | | — | | | | — | | |
Total distributions to shareholders | | | — | | | | (0.10 | ) | | | (0.01 | ) | | | — | | | | — | | |
Redemption fees: | |
Redemption fees added to paid-in capital | | | — | | | | — | | | | — | | | | 0.00 | (b) | | | 0.00 | (b) | |
Net asset value, end of period | | $ | 10.51 | | | $ | 9.53 | | | $ | 10.04 | | | $ | 7.78 | | | $ | 4.95 | | |
Total return | | | 10.28 | % | | | (4.04 | %) | | | 29.14 | % | | | 57.17 | % | | | (50.50 | %) | |
Ratios to average net assets(c) | |
Total gross expenses | | | 3.03 | % | | | 4.32 | % | | | 6.13 | % | | | 6.19 | % | | | 9.54 | %(d) | |
Total net expenses(e) | | | 2.32 | % | | | 2.35 | % | | | 2.35 | %(f) | | | 2.35 | %(f) | | | 2.35 | %(d)(g) | |
Net investment loss | | | (1.10 | %) | | | (1.25 | %) | | | (1.33 | %) | | | (1.15 | %) | | | (0.63 | %)(d) | |
Supplemental data | |
Net assets, end of period (in thousands) | | $ | 2,586 | | | $ | 2,012 | | | $ | 2,051 | | | $ | 1,426 | | | $ | 886 | | |
Portfolio turnover | | | 98 | % | | | 112 | % | | | 104 | % | | | 137 | % | | | 168 | % | |
Notes to Financial Highlights
(a) For the period from April 30, 2008 (commencement of operations) to February 28, 2009.
(b) Rounds to zero.
(c) In addition to the fees and expenses which the Fund bears directly, the Fund indirectly bears a pro rata share of the fees and expenses of the acquired funds in which it invests. Such indirect expenses are not included in the reported expense ratios.
(d) Annualized.
(e) Total net expenses include the impact of certain waivers/reimbursements made by the Investment Manager and certain of its affiliates, if applicable.
(f) The benefits derived from expense reductions had an impact of less than 0.01%.
(g) The benefits derived from expense reductions had an impact of 0.01%.
The accompanying Notes to Financial Statements are an integral part of this statement.
Annual Report 2013
17
Columbia Marsico Global Fund
Financial Highlights (continued)
| | | Year Ended
February 28, | | Year Ended
February 29, | | Year Ended February 28, | |
Class R | | 2013 | | 2012 | | 2011 | | 2010 | | 2009(a) | |
Per share data | |
Net asset value, beginning of period | | $ | 9.65 | | | $ | 10.13 | | | $ | 7.83 | | | $ | 4.97 | | | $ | 10.00 | | |
Income from investment operations: | |
Net investment loss | | | (0.06 | ) | | | (0.07 | ) | | | (0.07 | ) | | | (0.05 | ) | | | (0.01 | ) | |
Net realized and unrealized gain (loss) | | | 1.11 | | | | (0.30 | ) | | | 2.41 | | | | 2.93 | | | | (5.02 | ) | |
Total from investment operations | | | 1.05 | | | | (0.37 | ) | | | 2.34 | | | | 2.88 | | | | (5.03 | ) | |
Less distributions to shareholders: | |
Net investment income | | | — | | | | (0.00 | )(b) | | | (0.04 | ) | | | (0.02 | ) | | | — | | |
Net realized gains | | | — | | | | (0.10 | ) | | | — | | | | — | | | | — | | |
Tax return of capital | | | — | | | | (0.01 | ) | | | — | | | | — | | | | — | | |
Total distributions to shareholders | | | — | | | | (0.11 | ) | | | (0.04 | ) | | | (0.02 | ) | | | — | | |
Redemption fees: | |
Redemption fees added to paid-in capital | | | — | | | | — | | | | — | | | | 0.00 | (b) | | | 0.00 | (b) | |
Net asset value, end of period | | $ | 10.70 | | | $ | 9.65 | | | $ | 10.13 | | | $ | 7.83 | | | $ | 4.97 | | |
Total return | | | 10.88 | % | | | (3.62 | %) | | | 29.94 | % | | | 57.86 | % | | | (50.30 | %) | |
Ratios to average net assets(c) | |
Total gross expenses | | | 2.53 | % | | | 3.82 | % | | | 5.63 | % | | | 5.69 | % | | | 9.04 | %(d) | |
Total net expenses(e) | | | 1.82 | % | | | 1.85 | % | | | 1.85 | %(f) | | | 1.85 | %(f) | | | 1.85 | %(d)(g) | |
Net investment loss | | | (0.61 | %) | | | (0.75 | %) | | | (0.82 | %) | | | (0.62 | %) | | | (0.12 | %)(d) | |
Supplemental data | |
Net assets, end of period (in thousands) | | $ | 1,645 | | | $ | 1,195 | | | $ | 1,245 | | | $ | 984 | | | $ | 621 | | |
Portfolio turnover | | | 98 | % | | | 112 | % | | | 104 | % | | | 137 | % | | | 168 | % | |
Notes to Financial Highlights
(a) For the period from April 30, 2008 (commencement of operations) to February 28, 2009.
(b) Rounds to zero.
(c) In addition to the fees and expenses which the Fund bears directly, the Fund indirectly bears a pro rata share of the fees and expenses of the acquired funds in which it invests. Such indirect expenses are not included in the reported expense ratios.
(d) Annualized.
(e) Total net expenses include the impact of certain waivers/reimbursements made by the Investment Manager and certain of its affiliates, if applicable.
(f) The benefits derived from expense reductions had an impact of less than 0.01%.
(g) The benefits derived from expense reductions had an impact of 0.01%.
The accompanying Notes to Financial Statements are an integral part of this statement.
Annual Report 2013
18
Columbia Marsico Global Fund
Financial Highlights (continued)
| | | Year Ended
February 28, | | Year Ended
February 29, | | Year Ended February 28, | |
Class Z | | 2013 | | 2012 | | 2011 | | 2010 | | 2009(a) | |
Per share data | |
Net asset value, beginning of period | | $ | 9.76 | | | $ | 10.20 | | | $ | 7.88 | | | $ | 4.99 | | | $ | 10.00 | | |
Income from investment operations: | |
Net investment income (loss) | | | (0.02 | ) | | | (0.02 | ) | | | (0.03 | ) | | | (0.01 | ) | | | 0.02 | | |
Net realized and unrealized gain (loss) | | | 1.13 | | | | (0.30 | ) | | | 2.43 | | | | 2.94 | | | | (5.03 | ) | |
Total from investment operations | | | 1.11 | | | | (0.32 | ) | | | 2.40 | | | | 2.93 | | | | (5.01 | ) | |
Less distributions to shareholders: | |
Net investment income | | | — | | | | (0.01 | ) | | | (0.08 | ) | | | (0.04 | ) | | | — | | |
Net realized gains | | | — | | | | (0.10 | ) | | | — | | | | — | | | | — | | |
Tax return of capital | | | — | | | | (0.01 | ) | | | — | | | | — | | | | — | | |
Total distributions to shareholders | | | — | | | | (0.12 | ) | | | (0.08 | ) | | | (0.04 | ) | | | — | | |
Redemption fees: | |
Redemption fees added to paid-in capital | | | — | | | | — | | | | — | | | | 0.00 | (b) | | | 0.00 | (b) | |
Net asset value, end of period | | $ | 10.87 | | | $ | 9.76 | | | $ | 10.20 | | | $ | 7.88 | | | $ | 4.99 | | |
Total return | | | 11.37 | % | | | (3.12 | %) | | | 30.47 | % | | | 58.79 | % | | | (50.10 | %) | |
Ratios to average net assets(c) | |
Total gross expenses | | | 1.88 | % | | | 3.32 | % | | | 5.13 | % | | | 5.19 | % | | | 8.54 | %(d) | |
Total net expenses(e) | | | 1.32 | % | | | 1.35 | % | | | 1.35 | %(f) | | | 1.35 | %(f) | | | 1.35 | %(d)(g) | |
Net investment income (loss) | | | (0.19 | %) | | | (0.25 | %) | | | (0.33 | %) | | | (0.13 | %) | | | 0.35 | %(d) | |
Supplemental data | |
Net assets, end of period (in thousands) | | $ | 4,263 | | | $ | 1,438 | | | $ | 1,557 | | | $ | 1,136 | | | $ | 707 | | |
Portfolio turnover | | | 98 | % | | | 112 | % | | | 104 | % | | | 137 | % | | | 168 | % | |
Notes to Financial Highlights
(a) For the period from April 30, 2008 (commencement of operations) to February 28, 2009.
(b) Rounds to zero.
(c) In addition to the fees and expenses which the Fund bears directly, the Fund indirectly bears a pro rata share of the fees and expenses of the acquired funds in which it invests. Such indirect expenses are not included in the reported expense ratios.
(d) Annualized.
(e) Total net expenses include the impact of certain waivers/reimbursements made by the Investment Manager and certain of its affiliates, if applicable.
(f) The benefits derived from expense reductions had an impact of less than 0.01%.
(g) The benefits derived from expense reductions had an impact of 0.01%.
The accompanying Notes to Financial Statements are an integral part of this statement.
Annual Report 2013
19
Columbia Marsico Global Fund
Notes to Financial Statements
February 28, 2013
Note 1. Organization
Columbia Marsico Global Fund (the Fund), a series of Columbia Funds Series Trust (the Trust), is a diversified fund. The Trust is registered under the Investment Company Act of 1940, as amended (the 1940 Act), as an open-end management investment company organized as a Delaware statutory trust.
Fund Shares
The Trust may issue an unlimited number of shares (without par value). The Fund offers Class A, Class C, Class R and Class Z shares. All share classes have identical voting, dividend and liquidation rights. Each share class has its own expense structure and sales charges, as applicable.
Class A shares are subject to a maximum front-end sales charge of 5.75% based on the initial investment amount. Class A shares purchased without an initial sales charge in accounts aggregating $1 million to $50 million at the time of purchase are subject to a contingent deferred sales charge (CDSC) if the shares are sold within 18 months of purchase, charged as follows: 1.00% CDSC if redeemed within 12 months of purchase, and 0.50% CDSC if redeemed more than 12, but less than 18, months after purchase.
Class C shares are subject to a 1.00% CDSC on shares redeemed within one year of purchase.
Class R shares are not subject to sales charges and are only available to qualifying institutional investors.
Class Z shares are not subject to sales charges, and are only available to certain investors.
Note 2. Summary of Significant Accounting Policies
Use of Estimates
The preparation of financial statements in accordance with U.S. generally accepted accounting principles (GAAP) requires management to make certain estimates and assumptions that affect the reported amounts of assets and liabilities, the disclosure of contingent assets and liabilities at the date of the financial statements and the reported amounts of revenue and expenses during the reporting period. Actual results could differ from those estimates.
The following is a summary of significant accounting policies consistently followed by the Fund in the preparation of its financial statements.
Security Valuation
All equity securities are valued at the close of business of the New York Stock Exchange (NYSE). Equity securities are valued at the last quoted sales price on the principal exchange
or market on which they trade, except for securities traded on the NASDAQ Stock Market, which are valued at the NASDAQ official close price. Unlisted securities or listed securities for which there were no sales during the day are valued at the mean of the latest quoted bid and ask prices on such exchanges or markets.
Foreign securities are valued based on quotations from the principal market in which such securities are normally traded. If any foreign share prices are not readily available as a result of limited share activity the securities are valued at the mean of the latest quoted bid and ask prices on such exchanges or markets. Foreign currency exchange rates are generally determined at 4:00 p.m. Eastern (U.S.) time. However, many securities markets and exchanges outside the U.S. close prior to the close of the NYSE; therefore, the closing prices for securities in such markets or on such exchanges may not fully reflect events that occur after such close but before the close of the NYSE. In those situations, foreign securities will be fair valued pursuant to the policy adopted by the Board of Trustees (the Board), including utilizing a third party pricing service to determine these fair values. The third party pricing service takes into account multiple factors, including, but not limited to, movements in the U.S. securities markets, certain depositary receipts, futures contracts and foreign exchange rates that have occurred subsequent to the close of the foreign exchange or market, to determine a good faith estimate that reasonably reflects the current market conditions as of the close of the NYSE. The fair value of a security is likely to be different from the quoted or published price, if available.
Investments in other open-end investment companies, including money market funds, are valued at net asset value.
Investments for which market quotations are not readily available, or that have quotations which management believes are not reliable, are valued at fair value as determined in good faith under consistently applied procedures established by and under the general supervision of the Board. If a security or class of securities (such as foreign securities) is valued at fair value, such value is likely to be different from the last quoted market price for the security.
The determination of fair value often requires significant judgment. To determine fair value, management may use assumptions including but not limited to future cash flows and estimated risk premiums. Multiple inputs from various sources may be used to determine fair value.
Foreign Currency Transactions and Translations
The values of all assets and liabilities denominated in foreign currencies are translated into U.S. dollars at that day's exchange rates. Net realized and unrealized gains (losses) on
Annual Report 2013
20
Columbia Marsico Global Fund
Notes to Financial Statements (continued)
February 28, 2013
foreign currency transactions and translations include gains (losses) arising from the fluctuation in exchange rates between trade and settlement dates on securities transactions, gains (losses) arising from the disposition of foreign currency and currency gains (losses) between the accrual and payment dates on dividends, interest income and foreign withholding taxes.
For financial statement purposes, the Fund does not distinguish that portion of gains (losses) on investments which is due to changes in foreign exchange rates from that which is due to changes in market prices of the investments. Such fluctuations are included with the net realized and unrealized gains (losses) on investments in the Statement of Operations.
Security Transactions
Security transactions are accounted for on the trade date. Cost is determined and gains (losses) are based upon the specific identification method for both financial statement and federal income tax purposes.
Income Recognition
Corporate actions and dividend income are recorded net of any non-reclaimable tax withholdings, on the ex-dividend date or upon receipt of ex-dividend notification in the case of certain foreign securities.
Awards from class action litigation are recorded as a reduction of cost basis if the Fund still owns the applicable securities on the payment date. If the Fund no longer owns the applicable securities, the proceeds are recorded as realized gains.
Expenses
General expenses of the Trust are allocated to the Fund and other funds of the Trust based upon relative net assets or other expense allocation methodologies determined by the nature of the expense. Expenses directly attributable to the Fund are charged to the Fund. Expenses directly attributable to a specific class of shares are charged to that share class.
Determination of Class Net Asset Value
All income, expenses (other than class-specific expenses, which are charged to that share class, as shown in the Statement of Operations) and realized and unrealized gains (losses) are allocated to each class of the Fund on a daily basis, based on the relative net assets of each class, for purposes of determining the net asset value of each class.
Federal Income Tax Status
The Fund intends to qualify each year as a regulated investment company under Subchapter M of the Internal Revenue Code, as amended, and will distribute substantially all of its tax exempt and taxable income (including net short-term capital gains), if any, for its tax year, and as such will not
be subject to federal income taxes. In addition, the Fund intends to distribute in each calendar year substantially all of its net investment income, capital gains and certain other amounts, if any, such that the Fund should not be subject to federal excise tax. Therefore, no federal income or excise tax provision is recorded.
Foreign Taxes
The Fund may be subject to foreign taxes on income, gains on investments or currency repatriation, a portion of which may be recoverable. The Fund will accrue such taxes and recoveries, as applicable, based upon its current interpretation of tax rules and regulations that exist in the markets in which it invests.
Realized gains in certain countries may be subject to foreign taxes at the Fund level, based on statutory rates. The Fund accrues for such foreign taxes on net realized and unrealized gains at the appropriate rate for each jurisdiction, as applicable. The amount, if any, is disclosed as a liability on the Statement of Assets and Liabilities.
Distributions to Shareholders
Distributions from net investment income, if any, are declared and paid semi-annually. Net realized capital gains, if any, are distributed at least annually. Income distributions and capital gain distributions are determined in accordance with federal income tax regulations, which may differ from GAAP.
Guarantees and Indemnifications
Under the Trust's organizational documents and, in some cases, by contract, its officers and trustees are indemnified against certain liabilities arising out of the performance of their duties to the Trust or its funds. In addition, certain of the Fund's contracts with its service providers contain general indemnification clauses. The Fund's maximum exposure under these arrangements is unknown since the amount of any future claims that may be made against the Fund cannot be determined, and the Fund has no historical basis for predicting the likelihood of any such claims.
Recent Accounting Pronouncement
Disclosures about Offsetting Assets and Liabilities
In December 2011, the Financial Accounting Standards Board (FASB) issued Accounting Standards Update (ASU) No. 2011-11, Disclosures about Offsetting Assets and Liabilities. The objective of the FASB is to enhance current disclosure requirements on offsetting of certain assets and liabilities and to enable financial statement users to compare financial statements prepared under GAAP and International Financial Reporting Standards.
Annual Report 2013
21
Columbia Marsico Global Fund
Notes to Financial Statements (continued)
February 28, 2013
Specifically, ASU No. 2011-11 requires an entity to disclose both gross and net information for derivatives and other financial instruments that are subject to a master netting arrangement or similar agreement. The standard requires disclosure of collateral received in connection with the master netting agreements or similar agreements. The effective date of ASU No. 2011-11 is for interim and annual periods beginning on or after January 1, 2013. At this time, management is evaluating the implications of this guidance and the impact it will have on the financial statement amounts and footnote disclosures, if any.
Note 3. Fees and Compensation Paid to Affiliates
Investment Management Fees
Under an Investment Management Services Agreement, Columbia Management Investment Advisers, LLC (the Investment Manager), a wholly-owned subsidiary of Ameriprise Financial, Inc. (Ameriprise Financial), is responsible for the ultimate oversight of investment made by the Fund. The Fund's subadviser (see Subadvisory Agreement below) has the primary responsibility for the day-to-day portfolio management of the Fund. Effective January 23, 2013, the investment management fee is an annual fee that is equal to a percentage of the Fund's average daily net assets that declines from 0.79% to 0.62% as the Fund's net assets increase. Prior to January 23, 2013, the investment management fee was equal to 0.80% of the Fund's average daily net assets. The effective investment management fee rate for the year ended February 28, 2013 was 0.80% of the Fund's average daily net assets.
Subadvisory Agreement
The Investment Manager has entered into a Subadvisory Agreement with Marsico Capital Management, LLC (Marsico) to subadvise the assets of the Fund. The Investment Manager compensates Marsico to manage the investment of the Fund's assets.
Administration Fees
Under an Administrative Services Agreement, the Investment Manager also serves as the Fund Administrator. Effective January 23, 2013, the Fund pays the Fund Administrator an annual fee for administration and accounting services equal to a percentage of the Fund's average daily net assets that declines from 0.08% to 0.05% as the Fund's net assets increase. Prior to January 23, 2013, the administration fee was equal to 0.22% of the Fund's average daily net assets. The effective administration fee rate for the year ended
February 28, 2013 was 0.20% of the Fund's average daily net assets.
Other Expenses
Other expenses are for, among other things, certain expenses of the Fund or the Board, including: Fund boardroom and office expense, employee compensation, employee health and retirement benefits, and certain other expenses. Payment of these Fund and Board expenses is facilitated by a company providing limited administrative services to the Fund and the Board. For the year ended February 28, 2013, other expenses paid to this company were $1,185.
Compensation of Board Members
Board members are compensated for their services to the Fund as disclosed in the Statement of Operations. Under a Deferred Compensation Plan (the Plan), the Board members who are not "interested persons" of the Fund, as defined under the 1940 Act, may elect to defer payment of up to 100% of their compensation. Deferred amounts are treated as though equivalent dollar amounts had been invested in shares of certain funds managed by the Investment Manager. The Fund's liability for these amounts is adjusted for market value changes and remains in the Fund until distributed in accordance with the Plan.
Transfer Agent Fees
Under a Transfer and Dividend Disbursing Agent Agreement, Columbia Management Investment Services Corp. (the Transfer Agent), an affiliate of the Investment Manager and a wholly-owned subsidiary of Ameriprise Financial, is responsible for providing transfer agency services to the Fund. The Transfer Agent has contracted with Boston Financial Data Services (BFDS) to serve as sub-transfer agent.
The Transfer Agent receives monthly account-based service fees based on the number of open accounts and is reimbursed by the Fund for the fees and expenses the Transfer Agent pays to financial intermediaries that maintain omnibus accounts with the Fund that is a percentage of the average aggregate value of the Fund's shares maintained in each such omnibus account (other than omnibus accounts for which American Enterprise Investment Services Inc. is the broker of record or accounts where the beneficial shareholder is a customer of Ameriprise Financial Services, Inc., which are paid a per account fee). The Transfer Agent pays the fees of BFDS for services as sub-transfer agent and is not entitled to reimbursement for such fees from the Fund (with the exception of out-of-pocket fees).
Annual Report 2013
22
Columbia Marsico Global Fund
Notes to Financial Statements (continued)
February 28, 2013
The Transfer Agent also receives compensation from fees for various shareholder services and reimbursements for certain out-of-pocket fees.
For the year ended February 28, 2013, the Fund's annualized effective transfer agent fee rates as a percentage of average daily net assets of each class were as follows:
Class A | | | 0.11 | % | |
Class C | | | 0.11 | | |
Class R | | | 0.11 | | |
Class Z | | | 0.11 | | |
An annual minimum account balance fee of $20 may apply to certain accounts with a value below the Fund's initial minimum investment requirements to reduce the impact of small accounts on transfer agent fees. These minimum account balance fees are recorded as part of expense reductions in the Statement of Operations. For the year ended February 28, 2013, no minimum account balance fees were charged by the Fund.
Distribution and Service Fees
The Fund has an agreement with Columbia Management Investment Distributors, Inc. (the Distributor), an affiliate of the Investment Manager and a wholly-owned subsidiary of Ameriprise Financial, for distribution and shareholder services. Pursuant to Rule 12b-1 under the 1940 Act, the Board has approved, and the Fund has adopted, distribution and shareholder service plans (the Plans) which set the distribution and service fees for the Fund. These fees are calculated daily and are intended to compensate the Distributor and/or eligible selling and/or servicing agents for selling shares of the Fund and providing services to investors.
The Plans require the payment of a monthly combined distribution and service fee to the Distributor at the maximum annual rate of 0.25% of the average daily net assets attributable to Class A shares of the Fund. The Plans also require the payment of a monthly service fee at the maximum annual rate of 0.25% of the average daily net assets attributable to Class C shares of the Fund and a monthly distribution fee at the maximum annual rates of 0.75% and 0.50%, respectively, of the average daily net assets attributable to Class C and Class R shares of the Fund.
Sales Charges
Sales charges, including front-end charges and CDSCs, received by the Distributor for distributing Fund shares were $42,578 for Class A and $105 for Class C shares for the year ended February 28, 2013.
Expenses Waived/Reimbursed by the Investment Manager and its Affiliates
Effective July 1, 2012, the Investment Manager and certain of its affiliates have contractually agreed to waive fees and/or reimburse expenses (excluding certain fees and expenses described below), through June 30, 2013, unless sooner terminated at the sole discretion of the Board, so that the Fund's net operating expenses, after giving effect to fees waived/expenses reimbursed and any balance credits and/or overdraft charges from the Fund's custodian, do not exceed the following annual rates as a percentage of the class' average daily net assets:
Class A | | | 1.56 | % | |
Class C | | | 2.31 | | |
Class R | | | 1.81 | | |
Class Z | | | 1.31 | | |
Prior to July 1, 2012, the Investment Manager and certain of its affiliates contractually agreed to waive fees and/or reimburse expenses (excluding certain fees and expenses described below), so that the Fund's net operating expenses, after giving effect to fees waived/expenses reimbursed and any balance credits and/or overdraft charges from the Fund's custodian, did not exceed the following annual rates as a percentage of the class' average daily net assets:
Class A | | | 1.60 | % | |
Class C | | | 2.35 | | |
Class R | | | 1.85 | | |
Class Z | | | 1.35 | | |
Under the agreement, the following fees and expenses are excluded from the waiver/reimbursement commitment, and therefore will be paid by the Fund, if applicable: taxes (including foreign transaction taxes), expenses associated with investments in affiliated and non-affiliated pooled investment vehicles (including mutual funds and exchange traded funds), transaction costs and brokerage commissions, costs related to any securities lending program, dividend expenses associated with securities sold short, inverse floater program fees and expenses, transaction charges and interest on borrowed money, interest, extraordinary expenses and any other expenses the exclusion of which is specifically approved by the Board. This agreement may be modified or amended only with approval from all parties.
Note 4. Federal Tax Information
The timing and character of income and capital gain distributions are determined in accordance with income tax regulations, which may differ from GAAP because of temporary or permanent book to tax differences.
Annual Report 2013
23
Columbia Marsico Global Fund
Notes to Financial Statements (continued)
February 28, 2013
At February 28, 2013, these differences are primarily due to differing treatment for capital loss carryforwards, deferral/reversal of wash sales losses, Trustees' deferred compensation, foreign currency transactions and late-year ordinary losses. To the extent these differences are permanent, reclassifications are made among the components of the Fund's net assets in the Statement of Assets and Liabilities. Temporary differences do not require reclassifications. In the Statement of Assets and Liabilities the following reclassifications were made:
Excess of distributions over net investment income | | $ | 29,487 | | |
Accumulated net realized loss | | | 3,335 | | |
Paid-in capital | | | (32,822 | ) | |
Net investment income and net realized gains (losses), as disclosed in the Statement of Operations, and net assets were not affected by this reclassification.
The tax character of distributions paid during the years indicated was as follows:
Year Ended | | February 28,
2013 | | February 29,
2012 | |
Ordinary income | | $ | — | | | $ | 8,900 | | |
Long-term capital gains | | | — | | | | 86,952 | | |
Tax return of capital | | | — | | | | 6,943 | | |
Total | | $ | — | | | $ | 102,795 | | |
Short-term capital gain distributions, if any, are considered ordinary income distributions for tax purposes.
At February 28, 2013, the components of distributable earnings on a tax basis were as follows:
Undistributed ordinary income | | $ | — | | |
Undistributed accumulated long-term capital gains | | | — | | |
Accumulated realized losses | | | (344,410 | ) | |
Unrealized appreciation | | | 1,930,965 | | |
At February 28, 2013, the cost of investments for federal income tax purposes was $16,859,071 and the aggregate gross unrealized appreciation and depreciation based on that cost was:
Unrealized appreciation | | $ | 2,005,753 | | |
Unrealized depreciation | | | (74,788 | ) | |
Net unrealized appreciation | | $ | 1,930,965 | | |
The following capital loss carryforward, determined at February 28, 2013, may be available to reduce taxable income arising from future net realized gains on investments, if any, to the extent permitted by the Internal Revenue Code:
Year of Expiration | | Amount | |
2018 | | $311,493 | |
For the year ended February 28, 2013, $1,018,367 of capital loss carryforward was utilized.
Under current tax rules, regulated investment companies can elect to treat certain late-year ordinary losses incurred and post-October capital losses (capital losses realized after October 31) as arising on the first day of the following taxable year. As of February 28, 2013, the Fund will elect to treat late year ordinary losses of $32,917 as arising on March 1, 2013.
Management of the Fund has concluded that there are no significant uncertain tax positions that would require recognition in the financial statements. However, management's conclusion may be subject to review and adjustment at a later date based on factors including, but not limited to, new tax laws, regulations, and administrative interpretations (including relevant court decisions). Generally, the Fund's federal tax returns for the prior three fiscal years remain subject to examination by the Internal Revenue Service.
Note 5. Portfolio Information
The cost of purchases and proceeds from sales of securities, excluding short-term obligations, aggregated to $17,984,917 and $11,139,467, respectively, for the year ended February 28, 2013.
Note 6. Affiliated Money Market Fund
The Fund may invest its daily cash balances in Columbia Short-Term Cash Fund, an affiliated money market fund established for the exclusive use by the Fund and other affiliated funds. The income earned by the Fund from such investments is included as "Dividends — affiliated issuers" in the Statement of Operations. As an investing fund, the Fund indirectly bears its proportionate share of the expenses of Columbia Short-Term Cash Fund.
Note 7. Shareholder Concentration
At February 28, 2013, two unaffiliated shareholder accounts owned an aggregate of 46.9% of the outstanding shares of the Fund. The Fund has no knowledge about whether any portion of those shares was owned beneficially by such accounts. Affiliated shareholder accounts owned 27.6% of the outstanding shares of the Fund. Subscription and redemption activity by concentrated accounts may have a significant effect on the operations of the Fund.
Note 8. Line of Credit
The Fund has entered into a revolving credit facility with a syndicate of banks led by JPMorgan Chase Bank N.A. whereby the Fund may borrow for the temporary funding of shareholder redemptions or for other temporary or emergency
Annual Report 2013
24
Columbia Marsico Global Fund
Notes to Financial Statements (continued)
February 28, 2013
purposes. The credit facility agreement, as amended, which is a collective agreement between the Fund and certain other funds managed by the Investment Manager, severally and not jointly, permits collective borrowings up to $500 million. Interest is charged to each participating fund based on its borrowings at a rate equal to the higher of (i) the overnight federal funds rate plus 1.00% or (ii) the one-month LIBOR rate plus 1.00%. Each borrowing under the credit facility matures no later than 60 days after the date of borrowing. The Fund also pays a commitment fee equal to its pro rata share of the amount of the credit facility at a rate of 0.08% per annum.
The Fund had no borrowings during the year ended February 28, 2013.
Note 9. Significant Risks
Foreign Securities Risk
Investing in foreign securities may include certain risks and considerations not typically associated with investing in U.S. securities, such as fluctuating currency values and changing local and regional economic, political and social conditions, which may result in greater market volatility. In addition, certain foreign securities may not be as liquid as U.S. securities. Investing in emerging markets may accentuate these risks.
Investments in emerging market countries are subject to additional risk. The risk of foreign investments is typically increased in less developed countries. These countries are also more likely to experience high levels of inflation, deflation or currency devaluation which could hurt their economies and securities markets.
Note 10. Subsequent Events
Management has evaluated the events and transactions that have occurred through the date the financial statements were issued and noted no items requiring adjustment of the financial statements or additional disclosure.
Note 11. Information Regarding Pending and Settled Legal Proceedings
In December 2005, without admitting or denying the allegations, American Express Financial Corporation (AEFC, which is now known as Ameriprise Financial, Inc. (Ameriprise Financial)) entered into settlement agreements with the Securities and Exchange Commission (SEC) and Minnesota Department of Commerce (MDOC) related to market timing activities. As a result, AEFC was censured and ordered to cease and desist from committing or causing any violations of certain provisions of the Investment Advisers Act of 1940, the Investment Company Act of 1940, and various Minnesota laws.
AEFC agreed to pay disgorgement of $10 million and civil money penalties of $7 million. AEFC also agreed to retain an independent distribution consultant to assist in developing a plan for distribution of all disgorgement and civil penalties ordered by the SEC in accordance with various undertakings detailed at www.sec.gov/litigation/admin/ia-2451.pdf. Ameriprise Financial and its affiliates have cooperated with the SEC and the MDOC in these legal proceedings, and have made regular reports to the funds' Boards of Trustees.
Ameriprise Financial and certain of its affiliates have historically been involved in a number of legal, arbitration and regulatory proceedings, including routine litigation, class actions, and governmental actions, concerning matters arising in connection with the conduct of their business activities. Ameriprise Financial believes that the Funds are not currently the subject of, and that neither Ameriprise Financial nor any of its affiliates are the subject of, any pending legal, arbitration or regulatory proceedings that are likely to have a material adverse effect on the Funds or the ability of Ameriprise Financial or its affiliates to perform under their contracts with the Funds. Ameriprise Financial is required to make 10-Q, 10-K and, as necessary, 8-K filings with the Securities and Exchange Commission on legal and regulatory matters that relate to Ameriprise Financial and its affiliates. Copies of these filings may be obtained by accessing the SEC website at www.sec.gov.
There can be no assurance that these matters, or the adverse publicity associated with them, will not result in increased fund redemptions, reduced sale of fund shares or other adverse consequences to the Funds. Further, although we believe proceedings are not likely to have a material adverse effect on the Funds or the ability of Ameriprise Financial or its affiliates to perform under their contracts with the Funds, these proceedings are subject to uncertainties and, as such, we are unable to estimate the possible loss or range of loss that may result. An adverse outcome in one or more of these proceedings could result in adverse judgments, settlements, fines, penalties or other relief that could have a material adverse effect on the consolidated financial condition or results of operations of Ameriprise Financial.
Annual Report 2013
25
Columbia Marsico Global Fund
Report of Independent Registered Public Accounting Firm
To the Trustees of Columbia Funds Series Trust and
the Shareholders of Columbia Marsico Global Fund
In our opinion, the accompanying statement of assets and liabilities, including the portfolio of investments, and the related statements of operations and of changes in net assets and the financial highlights present fairly, in all material respects, the financial position of Columbia Marsico Global Fund (the "Fund") (a series of Columbia Funds Series Trust) at February 28, 2013, the results of its operations for the year then ended, the changes in its net assets for each of the two years in the period then ended and the financial highlights for each of the periods indicated, in conformity with accounting principles generally accepted in the United States of America. These financial statements and financial highlights (hereafter referred to as "financial statements") are the responsibility of the Fund's management. Our responsibility is to express an opinion on these financial statements based on our audits. We conducted our audits of these financial statements in accordance with the standards of the Public Company Accounting Oversight Board (United States). Those standards require that we plan and perform the audit to obtain reasonable assurance about whether the financial statements are free of material misstatement. An audit includes examining, on a test basis, evidence supporting the amounts and disclosures in the financial statements, assessing the accounting principles used and significant estimates made by management, and evaluating the overall financial statement presentation. We believe that our audits, which included confirmation of securities at February 28, 2013 by correspondence with the custodian, transfer agent and brokers, provide a reasonable basis for our opinion.
PricewaterhouseCoopers LLP
Minneapolis, Minnesota
April 19, 2013
Annual Report 2013
26
Columbia Marsico Global Fund
Shareholders elect the Board that oversees the funds' operations. The Board appoints officers who are responsible for day-to-day business decisions based on policies set by the Board. The following table provides basic biographical information about the funds' Board members, including their principal occupations during the past five years, although specific titles for individuals may have varied over the period. Under current Board policy, members may serve until the next Board meeting after he or she reaches the mandatory retirement age established by the Board, or the fifteenth anniversary of the first Board meeting they attended as a member of the Board.
Mr. Edward J. Boudreau, Jr., Mr. William P. Carmichael, Mr. William A. Hawkins, Mr. R. Glenn Hilliard, Ms. Minor M. Shaw and Dr. Anthony M. Santomero, were members of the Legacy Columbia Nations funds' Board ("Nations Funds"), which includes Columbia Funds Series Trust, Columbia Funds Variable Insurance Trust I and Columbia Funds Master Investment Trust, LLC and began service on the Board for the Legacy RiverSource funds ("RiverSource Funds") effective June 1, 2011.
Independent Trustees
Name,
Address,
Year of Birth | | Position Held With
Funds and Length of
Service | | Principal Occupation
During Past Five Years | | Number of
Funds in the
Fund Family
Overseen by
Board Member | | Other Present or Past
Directorships/Trusteeships
(Within Past 5 Years) | |
Kathleen Blatz
901 S. Marquette Ave.
Minneapolis, MN 55402
1954 | | Board member since 1/06 for RiverSource Funds and since 6/11 for Nations Funds | | Attorney; Chief Justice, Minnesota Supreme Court, 1998-2006 | | | 153 | | | Director, BlueCross BlueShield of Minnesota since 2009 | |
Edward J. Boudreau, Jr.
901 S. Marquette Ave.
Minneapolis, MN 55402
1944 | | Board member since 6/11 for RiverSource Funds and since 1/05 for Nations Funds | | Managing Director, E.J. Boudreau & Associates (consulting) since 2000 | | | 151 | | | Former Trustee, BofA Funds Series Trust (11 funds) | |
Pamela G. Carlton
901 S. Marquette Ave.
Minneapolis, MN 55402
1954 | | Board member since 7/07 for RiverSource Funds and since 6/11 for Nations Funds | | President, Springboard — Partners in Cross Cultural Leadership (consulting company) since 2003 | | | 153 | | | None | |
William P. Carmichael
901 S. Marquette Ave.
Minneapolis, MN 55402
1943 | | Board member since 6/11 for RiverSource Funds and since 1999 for Nations Funds | | Retired | | | 151 | | | Director, Cobra Electronics Corporation (electronic equipment manufacturer); The Finish Line (athletic shoes and apparel) since July 2003; McMoRan Exploration Company (oil and gas exploration and development) since 2010; former Trustee, BofA Funds Series Trust (11 funds); former Director, Spectrum Brands, Inc. (consumer products); former Director, Simmons Company (bedding) | |
Patricia M. Flynn
901 S. Marquette Ave.
Minneapolis, MN 55402
1950 | | Board member since 11/04 for RiverSource Funds and since 6/11 for Nations Funds | | Trustee Professor of Economics and Management, Bentley University since 1976 | | | 153 | | | None | |
William A. Hawkins
901 S. Marquette Ave.
Minneapolis, MN 55402
1942 | | Board member since 6/11 for RiverSource Funds and since 1/05 for Nations Funds | | Managing Director, Overton Partners (financial consulting), since August 2010; President and Chief Executive Officer, California General Bank, N.A., January 2008-August 2010. | | | 151 | | | Trustee, BofA Funds Series Trust (11 funds) | |
Annual Report 2013
27
Columbia Marsico Global Fund
Trustees and Officers (continued)
Independent Trustees (continued)
Name,
Address,
Year of Birth | | Position Held With
Funds and Length of
Service | | Principal Occupation
During Past Five Years | | Number of
Funds in the
Fund Family
Overseen by
Board Member | | Other Present or Past
Directorships/Trusteeships
(Within Past 5 Years) | |
R. Glenn Hilliard
901 S. Marquette Ave.
Minneapolis, MN 55402
1943 | | Board member since 6/11 for RiverSource Funds and since 1/05 for Nations Funds | | Chairman and Chief Executive Officer, Hilliard Group LLC (investing and consulting), since April 2003; Non-Executive Director & Chairman, CNO Financial Group, Inc. (insurance), September 2003-May 2011 | | | 151 | | | Chairman, BofA Fund Series Trust (11 funds); former Director, CNO Financial Group, Inc. (insurance) | |
Stephen R. Lewis, Jr.
901 S. Marquette Ave.
Minneapolis, MN 55402
1939 | | Chair of the Board for RiverSource Funds since 1/07, Board member for RiverSource Funds since 1/02 and since 6/11 for Nations Funds | | President Emeritus and Professor of Economics Emeritus, Carleton College since 2002 | | | 153 | | | Director, Valmont Industries, Inc. (manufacturer of irrigation systems) since 2002 | |
Catherine James Paglia
901 S. Marquette Ave.
Minneapolis, MN 55402
1952 | | Board member since 11/04 for RiverSource Funds and since 6/11 for Nations Funds | | Director, Enterprise Asset Management, Inc. (private real estate and asset management company) | | | 153 | | | Director, Valmont Industries, Inc. (manufacturer of irrigation systems) since 2012 | |
Leroy C. Richie
901 S. Marquette Ave.
Minneapolis, MN 55402
1941 | | Board member since 2000 for Legacy Seligman Funds, since 11/08 for RiverSource Funds and since 6/11 for Nations Funds | | Counsel, Lewis & Munday, P.C. (law firm) since 2004; former Vice President and General Counsel, Automotive Legal Affairs, Chrysler Corporation from 1983-1987 | | | 153 | | | Lead Outside Director, Digital Ally, Inc. (digital imaging) since September 2005; Director, Infinity, Inc. (oil and gas exploration and production) since 1994; Director, OGE Energy Corp. (energy and energy services) since November 2007 | |
Minor M. Shaw
901 S. Marquette Ave.
Minneapolis, MN 55402
1947 | | Board member since 6/11 for RiverSource Funds and since 2003 for Nations Funds | | President, Micco LLC (private investments) since 2011; President Micco Corp. since 1998 | | | 151 | | | Director, Piedmont Natural Gas; Director, BlueCross BlueShield of South Carolina since April 2008; Former Trustee, BofA Funds Series Trust (11 funds) | |
Alison Taunton-Rigby
901 S. Marquette Ave.
Minneapolis, MN 55402
1944 | | Board member since 11/02 for RiverSource Funds and since 6/11 for Nations Funds | | Chief Executive Officer and Director, RiboNovix, Inc. (biotechnology), 2003-2010 | | | 153 | | | Director, Healthways, Inc. (health and well-being improvement) since 2005; Director, ICI Mutual Insurance Company, RRG since 2011; Director, Abt Associates (government contractor) since 2001; Director, Boston Children's Hospital since 2002 | |
Annual Report 2013
28
Columbia Marsico Global Fund
Trustees and Officers (continued)
Interested Trustee Not Affiliated With Investment Manager*
Name,
Address,
Year of Birth | | Position Held With
Funds and Length of
Service | | Principal Occupation
During Past Five Years | | Number of
Funds in the
Fund Family
Overseen by
Board Member | | Other Present or Past
Directorships/Trusteeships
(Within Past 5 Years) | |
Anthony M. Santomero
901 S. Marquette Ave.
Minneapolis, MN 55402
1946 | | Board member since 6/11 for RiverSource Funds and since 1/08 for Nations Funds | | Richard K. Mellon Professor Emeritus of Finance, The Wharton School, University of Pennsylvania, since 2002; Senior Advisor, McKinsey & Company (consulting), 2006-2008 | | | 151 | | | Director, Renaissance Reinsurance Ltd. since May 2008; Trustee, Penn Mutual Life Insurance Company since March 2008; Director, Citigroup since 2009; Director, Citibank, N.A. since 2009; former Trustee, BofA Funds Series Trust (11 funds) | |
*Dr. Santomero is not an affiliated person of the investment manager or Ameriprise Financial. However, he is currently deemed by the funds to be an "interested person" (as defined in the 1940 Act) of the funds because he serves as a Director of Citigroup, Inc. and Citibank N.A., companies that may directly or through subsidiaries and affiliates engage from time-to-time in brokerage execution, principal transactions and lending relationships with the funds or accounts advised/managed by the investment manager.
Interested Trustee Affiliated With Investment Manager*
Name,
Address,
Year of Birth | | Position Held With
Funds and Length of
Service | | Principal Occupation
During Past Five Years | | Number of
Funds in the
Fund Family
Overseen by
Board Member | | Other Present or Past
Directorships/Trusteeships
(Within Past 5 Years) | |
William F. Truscott
53600 Ameriprise
Financial Center
Minneapolis, MN 55474
1960 | | Board member since 11/01 for RiverSource Funds and since 6/11 for Nations Funds; Senior Vice President since 2002 for RiverSource Funds and 5/10 for Nations Funds | | President, Columbia Management Investment Advisers, LLC since February 2012, (previously President, Chairman of the Board and Chief Investment Officer, 2001-April 2010); Chief Executive Officer, Global Asset Management, Ameriprise Financial, Inc. since September 2012 (previously Chief Executive Officer, U.S. Asset Management & President, Annuities, May 2010-September 2012 and President — U.S. Asset Management and Chief Investment Officer, 2005-April 2010); Chief Executive Officer, Columbia Management Investment Distributors, Inc. since February 2012, (previously Chairman of the Board and Chief Executive Officer, 2006-April 2010); Chairman of the Board and Chief Executive Officer, RiverSource Distributors, Inc. since 2006; President and Chief Executive Officer, Ameriprise Certificate Company 2006-August 2012 | | | 210 | | | Chairman of the Board, Columbia Management Investment Advisers, LLC since May 2010; Director, Columbia Management Investment Distributors, Inc. since May 2010; Director, Ameriprise Certificate Company, 2006-January 2013 | |
*Interested person (as defined under the 1940 Act) by reason of being an officer, director, security holder and/or employee of the investment manager or Ameriprise Financial.
The SAI has additional information about the Fund's Board members and is available, without charge, upon request by calling 800.345.6611; contacting your financial intermediary; or visiting columbiamanagement.com.
Annual Report 2013
29
Columbia Marsico Global Fund
Trustees and Officers (continued)
The Board has appointed officers who are responsible for day-to-day business decisions based on policies it has established. The officers serve at the pleasure of the Board. In addition to Mr. Truscott, who is Senior Vice President, the funds' other officers are:
Officers
Name,
Address,
Year of Birth | | Position Held With
Funds and Length of
Service | | Principal Occupation During Past Five Years | |
J. Kevin Connaughton
225 Franklin Street
Boston, MA 02110
1964 | | President and Principal Executive Officer since 5/10 for RiverSource Funds and 2009 for Nations Funds | | Senior Vice President and General Manager — Mutual Fund Products, Columbia Management Investment Advisers, LLC since May 2010; Managing Director of Columbia Management Advisors, LLC, December 2004-April 2010; Senior Vice President and Chief Financial Officer, Columbia Funds, June 2008-January 2009; Treasurer, Columbia Funds, October 2003-May 2008 | |
Amy K. Johnson
5228 Ameriprise Financial Center Minneapolis, MN 55474
1965 | | Vice President since 12/06 for RiverSource Funds and 5/10 for Nations Funds | | Senior Vice President and Chief Operating Officer, Columbia Management Investment Advisers, LLC since May 2010 (previously Chief Administrative Officer, 2009-April 2010 and Vice President — Asset Management and Trust Company Services, 2006-2009) | |
Michael G. Clarke
225 Franklin Street
Boston, MA 02110
1969 | | Treasurer since 1/11 and Chief Financial Officer since 4/11 for RiverSource Funds and Treasurer since 3/11 and Chief Financial Officer since 2009 for Nations Funds | | Vice President, Columbia Management Investment Advisers, LLC since May 2010; Managing Director of Fund Administration, Columbia Management Advisors, LLC, September 2004-April 2010; senior officer of Columbia Funds and affiliated funds since 2002 | |
Scott R. Plummer
5228 Ameriprise Financial Center Minneapolis, MN 55474
1959 | | Senior Vice President and Chief Legal Officer since 12/06 and Assistant Secretary since 6/11 for RiverSource Funds and Senior Vice President and Chief Legal Officer since 5/10 and Assistant Secretary since 6/11 for Nations Funds | | Senior Vice President, Chief Legal Officer and Assistant Secretary, Columbia Management Investment Advisers, LLC since June 2005; Vice President and Lead Chief Counsel — Asset Management, Ameriprise Financial, Inc. since May 2010 (previously Vice President and Chief Counsel — Asset Management, 2005-April 2010); Vice President, Chief Counsel and Assistant Secretary, Columbia Management Investment Distributors, Inc. since 2008; Vice President, General Counsel and Secretary, Ameriprise Certificate Company since 2005; Chief Counsel, RiverSource Distributors, Inc. since 2006 | |
Colin Moore
225 Franklin Street
Boston, MA 02110
1958 | | Senior Vice President since 5/10 for RiverSource Funds and Nations Funds | | Director and Chief Investment Officer, Columbia Management Investment Advisers, LLC since May 2010; Manager, Managing Director and Chief Investment Officer, Columbia Management Advisors, LLC, 2007-April 2010 | |
Thomas P. McGuire
225 Franklin Street
Boston, MA 02110
1972 | | Chief Compliance Officer since 3/12 | | Vice President — Asset Management Compliance, Columbia Management Investment Advisers, LLC since 2010; Chief Compliance Officer, Ameriprise Certificate Company since September 2010; Compliance Executive, Bank of America, 2005-2010 | |
Stephen T. Welsh
225 Franklin Street
Boston, MA 02110
1957 | | Vice President since 4/11 for RiverSource Funds and 2006 for Nations Funds | | President and Director, Columbia Management Investment Services Corp. since May 2010; President and Director, Columbia Management Services, Inc., July 2004- April 2010; Managing Director, Columbia Management Distributors, Inc., August 2007-April 2010 | |
Christopher O. Petersen
5228 Ameriprise Financial Center Minneapolis, MN 55474
1970 | | Vice President and Secretary since 4/11 for RiverSource Funds and 3/11 for Nations Funds | | Vice President and Chief Counsel, Ameriprise Financial, Inc. since January 2010 (formerly Vice President and Group Counsel or Counsel, April 2004-January 2010); Assistant Secretary of Legacy RiverSource Funds, January 2007-April 2011 and of the Nations Funds, May 2010-March 2011 | |
Annual Report 2013
30
Columbia Marsico Global Fund
Trustees and Officers (continued)
Officers (continued)
Name,
Address,
Year of Birth | | Position Held With
Funds and Length of
Service | | Principal Occupation During Past Five Years | |
Paul D. Pearson
10468 Ameriprise Financial Center Minneapolis, MN 55474
1956 | | Vice President since 4/11 and Assistant Treasurer since 1999 for RiverSource Funds and Vice President and Assistant Treasurer since 6/11 for Nations Funds | | Vice President — Investment Accounting, Columbia Management Investment Advisers, LLC, since May 2010; Vice President — Managed Assets, Investment Accounting, Ameriprise Financial Corporation, February 1998-May 2010 | |
Joseph F. DiMaria
225 Franklin Street
Boston, MA 02110
1968 | | Vice President and Chief Accounting Officer since 4/11 and Vice President since 3/11 and Chief Accounting Officer since 2008 for Nations Funds | | Vice President, Mutual Fund Administration, Columbia Management Investment Advisers, LLC, since May 2010; Director of Fund Administration, Columbia Management Advisors, LLC, January 2006-April 2010 | |
Paul B. Goucher
100 Park Avenue
New York, NY 10017
1968 | | Vice President since 4/11 and Assistant Secretary since 11/08 for RiverSource Funds and 5/10 for Nations Funds | | Vice President and Lead Chief Counsel, Ameriprise Financial, Inc. since November 2008 and January 2013, respectively (formerly, Chief Counsel, January 2010-January 2013 and Group Counsel from November 2008- January 2010); Director, Managing Director and General Counsel, J. & W. Seligman & Co. Incorporated, July 2008-November 2008 (previously, Managing Director and Associate General Counsel, January 2005-July 2008) | |
Michael E. DeFao
225 Franklin Street
Boston, MA 02110
1968 | | Vice President since 4/11 and Assistant Secretary since 5/10 for RiverSource Funds and 2011 for Nations Funds | | Vice President and Chief Counsel, Ameriprise Financial, Inc. since May 2010; Associate General Counsel, Bank of America, June 2005-April 2010 | |
Annual Report 2013
31
This page intentionally left blank.
Annual Report 2013
32
Columbia Marsico Global Fund
Important Information About This Report
Each fund mails one shareholder report to each shareholder address. If you would like more than one report, please call shareholder services at 800.345.6611 and additional reports will be sent to you.
The policy of the Board is to vote the proxies of the companies in which each fund holds investments consistent with the procedures as stated in the Statement of Additional Information (SAI). You may obtain a copy of the SAI without charge by calling 800.345.6611; contacting your financial intermediary; visiting columbiamanagement.com; or searching the website of the Securities and Exchange Commission (SEC) at sec.gov. Information regarding how each fund voted proxies relating to portfolio securities is filed with the SEC by August 31 for the most recent 12-month period ending June 30 of that year, and is available without charge by visiting columbiamanagement.com; or searching the website of the SEC at sec.gov.
Each fund files a complete schedule of portfolio holdings with the SEC for the first and third quarters of each fiscal year on Form N-Q. Each fund's Form N-Q is available on the SEC's website at sec.gov and may be reviewed and copied at the SEC's Public Reference Room in Washington, D.C. Information on the operation of the Public Reference Room may be obtained by calling 800.SEC.0330. Each fund's complete schedule of portfolio holdings, as filed on Form N-Q, can also be obtained without charge, upon request, by calling 800.345.6611.
Annual Report 2013
33

Columbia Marsico Global Fund
P.O. Box 8081
Boston, MA 02266-8081
columbiamanagement.com
This information is for use with concurrent or prior delivery of a fund prospectus. Please read and consider the investment objectives, risks, charges and expenses for any fund carefully before investing. For a prospectus which contains this and other important information about the Fund go to columbiamanagement.com. The Fund is distributed by Columbia Management Investment Distributors, Inc., member FINRA, and managed by Columbia Management Investment Advisers, LLC.
© 2013 Columbia Management Investment Advisers, LLC. All rights reserved.
ANN187_02_C01_(04/13)
Annual Report
February 28, 2013

Columbia Mid Cap Index Fund
Not FDIC insured • No bank guarantee • May lose value
Columbia Mid Cap Index Fund
 Dear Shareholders,
U.S. stocks flat, foreign markets strong in 2012 finale
After a strong third quarter, U.S. stock market averages treaded water as the year 2012 came to a close. However, they ended the year up strongly, as first- and third-quarter gains more than offset second- and fourth-quarter weakness. Typically a strong quarter for domestic small- and mid-cap issues, the fourth quarter of 2012 indeed proved to be another year-end positive for small-cap stocks. For the full calendar year 2012, the S&P 500 Index rose 16.00%.
Stock markets outside the United States generated some of the best returns for the fourth quarter, as optimism rebounded, thanks to the September actions of the European Central Bank in support of the euro and an improving outlook from China. Both developed and emerging foreign markets topped U.S. stocks by a solid margin.
Corporate and emerging markets led fixed income
Fixed-income investors took their cue from the equity markets and continued to favor the highest risk sectors through the end of 2012. Global fixed-income returns posted mixed results in the final quarter of the year. Gains were the highest for corporate high-yield and emerging market bonds. Although investors remained cautious ahead of the year-end budget negotiations, better economic data and a further improvement in the European sovereign debt crisis supported riskier assets and depressed government bond prices. In December, the Federal Reserve announced its intention to continue to purchase both Treasury and mortgage-backed securities and said that it would seek to keep short-term interest rates unchanged until the unemployment rate reaches 6.5%, or inflation turned noticeably higher.
Stay on track with Columbia Management
Backed by more than 100 years of experience, Columbia Management is one of the nation's largest asset managers. At the heart of our success — and, most importantly, that of our investors — are highly talented industry professionals, brought together by a unique way of working. We are dedicated to helping you take advantage of today's opportunities and anticipate tomorrow's. We stay abreast of the latest investment trends and ideas, using our collective insight to evaluate events and transform them into solutions you can use.
Visit columbiamanagement.com for:
> The Columbia Management Perspectives blog, featuring timely posts by our investment teams
> Detailed up-to-date fund performance and portfolio information
> Economic analysis and market commentary
> Quarterly fund commentaries
> Columbia Management Investor, our award-winning quarterly newsletter for shareholders
Thank you for your continued support of the Columbia Funds. We look forward to serving your investment needs for many years to come.
Best Regards,

J. Kevin Connaughton
President, Columbia Funds
The S&P 500 Index, an unmanaged index, measures the performance of 500 widely held, large-capitalization U.S. stocks and is frequently used as a general measure of market performance. Indices are not available for investment, are not professionally managed and do not reflect sales charges, fees, brokerage commissions, taxes or other expenses of investing.
Investors should consider the investment objectives, risks, charges and expenses of a mutual fund carefully before investing. For a free prospectus, which contains this and other important information about a fund, visit columbiamanagement.com. The prospectus should be read carefully before investing.
Columbia Funds are distributed by Columbia Management Investment Distributors, Inc., member FINRA, and managed by Columbia Management Investment Advisers, LLC.
© 2013 Columbia Management Investment Advisers, LLC. All rights reserved.
Columbia Mid Cap Index Fund
Performance Overview | | | 2 | | |
Manager Discussion of Fund Performance | | | 4 | | |
Understanding Your Fund's Expenses | | | 6 | | |
Portfolio of Investments | | | 7 | | |
Statement of Assets and Liabilities | | | 16 | | |
Statement of Operations | | | 18 | | |
Statement of Changes in Net Assets | | | 19 | | |
Financial Highlights | | | 21 | | |
Notes to Financial Statements | | | 25 | | |
Report of Independent Registered
Public Accounting Firm | | | 32 | | |
Federal Income Tax Information | | | 33 | | |
Trustees and Officers | | | 34 | | |
Important Information About This Report | | | 41 | | |
Fund Investment Manager
Columbia Management Investment
Advisers, LLC
225 Franklin Street
Boston, MA 02110
Fund Distributor
Columbia Management Investment
Distributors, Inc.
225 Franklin Street
Boston, MA 02110
Fund Transfer Agent
Columbia Management Investment
Services Corp.
P.O. Box 8081
Boston, MA 02266-8081
For more information about any of the funds, please visit columbiamanagement.com or call 800.345.6611. Customer Service Representatives are available to answer your questions Monday through Friday from 8 a.m. to 8 p.m. Eastern time.
The views expressed in this report reflect the current views of the respective parties. These views are not guarantees of future performance and involve certain risks, uncertainties and assumptions that are difficult to predict, so actual outcomes and results may differ significantly from the views expressed. These views are subject to change at any time based upon economic, market or other conditions and the respective parties disclaim any responsibility to update such views. These views may not be relied on as investment advice and, because investment decisions for a Columbia Fund are based on numerous factors, may not be relied on as an indication of trading intent on behalf of any particular Columbia Fund. References to specific securities should not be construed as a recommendation or investment advice.
Columbia Mid Cap Index Fund
Performance Summary
> Columbia Mid Cap Index Fund (the Fund) Class A shares returned 14.03% for the 12-month period that ended February 28, 2013.
> The Fund underperformed its benchmark, the S&P MidCap 400 Index, which returned 14.57% for the same 12-month period.
> The Fund's portfolio is constructed to closely approximate the benchmark.
Average Annual Total Returns (%) (for period ended February 28, 2013)
| | Inception | | 1 Year | | 5 Years | | 10 Years | |
Class A | | 05/31/00 | | | 14.03 | | | | 8.18 | | | | 11.60 | | |
Class I* | | 09/27/10 | | | 14.34 | | | | 8.47 | | | | 11.88 | | |
Class R5* | | 11/08/12 | | | 14.38 | | | | 8.48 | | | | 11.88 | | |
Class Z | | 03/31/00 | | | 14.35 | | | | 8.47 | | | | 11.88 | | |
S&P MidCap 400 Index | | | | | | | 14.57 | | | | 8.60 | | | | 12.01 | | |
All results shown assume reinvestment of distributions during the period. Returns do not reflect the deduction of taxes that a shareholder may pay on Fund distributions or on the redemption of Fund shares. Performance results reflect the effect of any fee waivers or reimbursements of Fund expenses by Columbia Management Investment Advisers, LLC and/or any of its affiliates. Absent these fee waivers or expense reimbursement arrangements, performance results would have been lower.
The performance information shown represents past performance and is not a guarantee of future results. The investment return and principal value of your investment will fluctuate so that your shares, when redeemed, may be worth more or less than their original cost. Current performance may be lower or higher than the performance information shown. You may obtain performance information current to the most recent month-end by contacting your financial intermediary, visiting columbiamanagement.com or calling 800.345.6611.
*The returns shown for periods prior to the share class inception date (including returns for the Life of the Fund, if shown, which are since Fund inception) include the returns of the Fund's oldest share class. These returns are adjusted to reflect any higher class-related operating expenses of the newer share classes, as applicable. Please visit columbiamanagement.com/mutual-funds/appended-performance for more information.
The S&P MidCap 400 Index is a market-value weighted index that tracks the performance of 400 mid-cap U.S. companies.
Indices are not available for investment, are not professionally managed and do not reflect sales charges, fees, brokerage commissions, taxes or other expenses of investing. Securities in the Fund may not match those in an index.
Annual Report 2013
2
Columbia Mid Cap Index Fund
Performance Overview (continued)
Performance of a Hypothetical $10,000 Investment (March 1, 2003 – February 28, 2013)
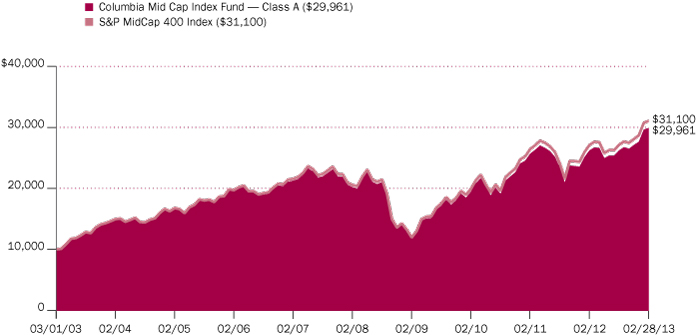
The chart above shows the change in value of a hypothetical $10,000 investment in Class A shares of Columbia Mid Cap Index Fund during the stated time period, and does not reflect the deduction of taxes that a shareholder may pay on Fund distributions or on the redemption of Fund shares.
Annual Report 2013
3
Columbia Mid Cap Index Fund
Manager Discussion of Fund Performance
For the 12-month period that ended February 28, 2013, the Fund's Class A shares returned 14.03%. The Fund's benchmark, the S&P MidCap 400 Index, returned 14.57% for the same 12-month period. The Fund seeks to approximate the benchmark weights of securities, industries and sectors represented in the S&P MidCap 400 Index. As such, its return was in line with the return of the index, after fees and expenses, which the index does not incur.
Investors Shrug Off Weak Global Growth
Europe's economic woes and U.S. struggles to avoid a fiscal cliff of tax increases and spending cuts weighed on the global economy during the 12-month period ended February 28, 2013. Yet, investors chose to look beyond the numbers and came in from the sidelines to bid stock prices significantly higher. Favorable central bank action in key markets and improving prospects for the U.S. economy gave investors confidence to favor stocks and other riskier assets. The U.S. economy expanded at a pace of just 1.6% in 2012. However, a pickup in job growth early in 2013 and steady manufacturing activity were encouraging. The housing market also showed signs of life, with rising sales, higher average prices and lower inventories. Meanwhile, much of Europe headed toward recession. So far, the United Kingdom has avoided recession — but only barely so — and Japan's economy slipped into negative territory for the fifth time in 15 years. Major emerging market economies, including China, forged ahead, although mostly at a slower pace.
A Solid Year for the U.S. Stock Market
During a period marked by solid gains for stocks across a broad spectrum of sectors, health care, utilities and industrials were the mid-cap market's leaders. Financials, industrials and consumer discretionary stocks made the largest contributions to the Fund's return. Within financials, real estate investment trusts and insurance were the strongest-performing industries. The period's top individual performers were Holly Frontier, an independent oil refiner; Regeneron Pharmaceuticals, a biopharmaceutical company; Equinix, a technology company that provides carrier-neutral data centers and Internet exchanges; Kansas City Southern, an international holding company of three major railroads and PVH Corporation, an American apparel company.
With the exception of energy, all sectors of the benchmark delivered positive returns for the period. Energy, telecommunication services and information technology were the weakest performers. Within energy, oil, gas and consumable fuels were laggards. Communications equipment was a drag on the telecommunication sector and semiconductors & semiconductor equipment was the weak link in the technology sector. Four of the five weakest individual securities for the period were in the technology sector: VeriFone Systems, a provider of secure electronic payment solutions; Rovi, a technology provider to the television and entertainment industries; Polycom, which specializes in videoconferencing technology and Riverbed Technology, a specialist in improving networks and networking technology. Green Mountain Coffee Roasters, a specialty coffee company, also detracted from Fund returns with a double-digit loss for the period.
The Fund owned stock index futures in the amount of its cash balances during the period. It did so in order to keep its investment exposure on par with the index, which is always fully invested, and to retain the liquidity necessary for trading and redemption within the Fund.
Portfolio Management
Alfred Alley III, CFA
Vadim Shteyn
Morningstar Style BoxTM
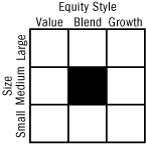
The Morningstar Style BoxTM is based on a fund's portfolio holdings. For equity funds, the vertical axis shows the market capitalization of the stocks owned, and the horizontal axis shows investment style (value, blend, or growth). Information shown is based on the most recent data provided by Morningstar.
© 2013 Morningstar, Inc. All rights reserved. The Morningstar information contained herein: (1) is proprietary to Morningstar and/or its content providers; (2) may not be copied or distributed; and (3) is not warranted to be accurate, complete or timely. Neither Morningstar nor its content providers are responsible for any damages or losses arising from any use of this information.
Top Ten Holdings (%)
(at February 28, 2013) | |
Regeneron Pharmaceuticals, Inc. | | | 1.0 | | |
HollyFrontier Corp. | | | 0.9 | | |
Kansas City Southern | | | 0.9 | | |
Equinix, Inc. | | | 0.8 | | |
AMETEK, Inc. | | | 0.8 | | |
Vertex Pharmaceuticals, Inc. | | | 0.8 | | |
Church & Dwight Co., Inc. | | | 0.7 | | |
Macerich Co. (The) | | | 0.6 | | |
Realty Income Corp. | | | 0.6 | | |
Alliance Data Systems Corp. | | | 0.6 | | |
Percentages indicated are based upon total investments (excluding Money Market Funds).
For further detail about these holdings, please refer to the section entitled "Portfolio of Investments."
Fund holdings are as of the date given, are subject to change at any time, and are not recommendations to buy or sell any security.
Annual Report 2013
4
Columbia Mid Cap Index Fund
Manager Discussion of Fund Performance (continued)
Index Changes
There were 25 additions and deletions to the S&P MidCap 400 Index during the 12-month period. All changes to the index were matched by changes in the portfolio during the period.
Looking Ahead
Fourth-quarter 2012 earnings modestly beat expectations, raising confidence that many companies have the ability to manage successfully through an environment in which higher taxes and enforced spending cuts weigh on consumer demands. Although the many economic and investment challenges we face in the year ahead will likely result in heightened volatility, equity valuations currently still appear reasonable relative to fixed-income alternatives, and corporate balance sheets are, at present, in good condition, with low debt and high cash levels. As a result, our current belief is that the equities market has the potential to remain healthy even in an environment of slower economic growth.
Portfolio Breakdown (%)
(at February 28, 2013) | |
Common Stocks | | | 95.6 | | |
Consumer Discretionary | | | 11.9 | | |
Consumer Staples | | | 3.4 | | |
Energy | | | 5.9 | | |
Financials | | | 22.0 | | |
Health Care | | | 9.1 | | |
Industrials | | | 16.9 | | |
Information Technology | | | 14.6 | | |
Materials | | | 6.6 | | |
Telecommunication Services | | | 0.4 | | |
Utilities | | | 4.8 | | |
Money Market Funds | | | 4.4 | | |
Total | | | 100.0 | | |
Percentages indicated are based upon total investments. The Fund's portfolio composition is subject to change.
Annual Report 2013
5
Columbia Mid Cap Index Fund
Understanding Your Fund's Expenses
(Unaudited)
As an investor, you incur two types of costs. There are transaction costs, which generally include sales charges on purchases and may include redemption fees. There are also ongoing costs, which generally include management fees, distribution and service (Rule 12b-1) fees, and other fund expenses. The following information is intended to help you understand your ongoing costs (in dollars) of investing in the Fund and to help you compare these costs with the ongoing costs of investing in other mutual funds.
Analyzing Your Fund's Expenses
To illustrate these ongoing costs, we have provided examples and calculated the expenses paid by investors in each share class of the Fund during the period. The actual and hypothetical information in the table is based on an initial investment of $1,000 at the beginning of the period indicated and held for the entire period. Expense information is calculated two ways and each method provides you with different information. The amount listed in the "Actual" column is calculated using the Fund's actual operating expenses and total return for the period. You may use the Actual information, together with the amount invested, to estimate the expenses that you paid over the period. Simply divide your account value by $1,000 (for example, an $8,600 account value divided by $1,000 = 8.6), then multiply the results by the expenses paid during the period under the Actual column. The amount listed in the "Hypothetical" column assumes a 5% annual rate of return before expenses (which is not the Fund's actual return) and then applies the Fund's actual expense ratio for the period to the hypothetical return. You should not use the hypothetical account values and expenses to estimate either your actual account balance at the end of the period or the expenses you paid during the period. See "Compare With Other Funds" below for details on how to use the hypothetical data.
Compare With Other Funds
Since all mutual funds are required to include the same hypothetical calculations about expenses in shareholder reports, you can use this information to compare the ongoing cost of investing in the Fund with other funds. To do so, compare the hypothetical example with the 5% hypothetical examples that appear in the shareholder reports of other funds. As you compare hypothetical examples of other funds, it is important to note that hypothetical examples are meant to highlight the ongoing costs of investing in a fund only and do not reflect any transaction costs, such as sales charges, or redemption or exchange fees. Therefore, the hypothetical calculations are useful in comparing ongoing costs only, and will not help you determine the relative total costs of owning different funds. If transaction costs were included in these calculations, your costs would be higher.
September 1, 2012 – February 28, 2013
| | Account Value at the Beginning
of the Period ($) | | Account Value at the End of the
Period ($) | | Expenses Paid During the
Period ($) | | Fund's Annualized
Expense Ratio (%) | |
| | Actual | | Hypothetical | | Actual | | Hypothetical | | Actual | | Hypothetical | | Actual | |
Class A | | | 1,000.00 | | | | 1,000.00 | | | | 1,140.40 | | | | 1,022.56 | | | | 2.39 | | | | 2.26 | | | | 0.45 | | |
Class I | | | 1,000.00 | | | | 1,000.00 | | | | 1,142.00 | | | | 1,024.05 | | | | 0.80 | | | | 0.75 | | | | 0.15 | | |
Class R5 | | | 1,000.00 | | | | 1,000.00 | | | | 1,143.40 | * | | | 1,024.00 | | | | 0.52 | * | | | 0.80 | | | | 0.16 | * | |
Class Z | | | 1,000.00 | | | | 1,000.00 | | | | 1,142.20 | | | | 1,023.80 | | | | 1.06 | | | | 1.00 | | | | 0.20 | | |
*For the period November 8, 2012 through February 28, 2013. Class R5 shares commenced operations on November 8, 2012.
Expenses paid during the period are equal to the annualized expense ratio for each class as indicated above, multiplied by the average account value over the period and then multiplied by the number of days in the Fund's most recent fiscal half year and divided by 365.
Expenses do not include fees and expenses incurred indirectly by the Fund from the underlying funds in which the Fund may invest (also referred to as "acquired funds"), including affiliated and non-affiliated pooled investment vehicles (including mutual funds and exchange-traded funds).
Had Columbia Management Investment Advisers, LLC and/or certain of its affiliates not waived/reimbursed certain fees and expenses, account value at the end of the period would have been reduced.
Annual Report 2013
6
Columbia Mid Cap Index Fund
Portfolio of Investments
February 28, 2013
(Percentages represent value of investments compared to net assets)
Common Stocks 96.8%
Issuer | | Shares | | Value ($) | |
Consumer Discretionary 12.1% | |
Auto Components 0.2% | |
Gentex Corp. | | | 281,173 | | | | 5,271,994 | | |
Automobiles 0.1% | |
Thor Industries, Inc. | | | 86,584 | | | | 3,254,693 | | |
Distributors 0.5% | |
LKQ Corp.(a) | | | 585,427 | | | | 12,405,198 | | |
Diversified Consumer Services 0.8% | |
DeVry, Inc. | | | 112,478 | | | | 3,372,091 | | |
Matthews International Corp., Class A | | | 54,166 | | | | 1,787,478 | | |
Regis Corp. | | | 113,305 | | | | 2,041,756 | | |
Service Corp. International | | | 418,961 | | | | 6,510,654 | | |
Sotheby's | | | 133,497 | | | | 5,103,590 | | |
Strayer Education, Inc. | | | 23,387 | | | | 1,148,068 | | |
Total | | | | | 19,963,637 | | |
Hotels, Restaurants & Leisure 1.3% | |
Bally Technologies, Inc.(a) | | | 80,808 | | | | 3,858,582 | | |
Bob Evans Farms, Inc. | | | 55,344 | | | | 2,252,501 | | |
Brinker International, Inc. | | | 144,059 | | | | 4,808,689 | | |
Cheesecake Factory, Inc. (The) | | | 98,320 | | | | 3,405,805 | | |
International Speedway Corp., Class A | | | 50,289 | | | | 1,515,710 | | |
Life Time Fitness, Inc.(a) | | | 78,984 | | | | 3,328,386 | | |
Panera Bread Co., Class A(a) | | | 55,656 | | | | 8,957,833 | | |
Scientific Games Corp., Class A(a) | | | 103,897 | | | | 935,073 | | |
Wendy's Co. (The) | | | 554,618 | | | | 3,155,776 | | |
WMS Industries, Inc.(a) | | | 107,512 | | | | 2,692,101 | | |
Total | | | | | 34,910,456 | | |
Household Durables 2.3% | |
Jarden Corp.(a) | | | 144,636 | | | | 8,983,342 | | |
KB Home | | | 160,146 | | | | 2,993,129 | | |
MDC Holdings, Inc. | | | 76,678 | | | | 2,946,736 | | |
Mohawk Industries, Inc.(a) | | | 114,256 | | | | 12,113,421 | | |
NVR, Inc.(a) | | | 9,055 | | | | 9,138,306 | | |
Tempur-Pedic International, Inc.(a) | | | 117,364 | | | | 4,820,139 | | |
Toll Brothers, Inc.(a) | | | 294,856 | | | | 10,060,487 | | |
Tupperware Brands Corp. | | | 108,910 | | | | 8,520,029 | | |
Total | | | | | 59,575,589 | | |
Internet & Catalog Retail 0.2% | |
HSN, Inc. | | | 71,599 | | | | 3,830,547 | | |
Common Stocks (continued)
Issuer | | Shares | | Value ($) | |
Leisure Equipment & Products 0.4% | |
Polaris Industries, Inc. | | | 126,404 | | | | 11,043,917 | | |
Media 1.2% | |
AMC Networks, Inc., Class A(a) | | | 112,974 | | | | 6,484,708 | | |
Cinemark Holdings, Inc. | | | 201,403 | | | | 5,599,003 | | |
DreamWorks Animation SKG, Inc.,
Class A(a) | | | 141,235 | | | | 2,344,501 | | |
John Wiley & Sons, Inc., Class A | | | 92,414 | | | | 3,380,504 | | |
Lamar Advertising Co., Class A(a) | | | 108,844 | | | | 5,032,947 | | |
Meredith Corp. | | | 71,008 | | | | 2,983,756 | | |
New York Times Co. (The), Class A(a) | | | 239,834 | | | | 2,319,195 | | |
Scholastic Corp. | | | 51,758 | | | | 1,557,916 | | |
Valassis Communications, Inc. | | | 77,254 | | | | 2,123,712 | | |
Total | | | | | 31,826,242 | | |
Multiline Retail 0.2% | |
Big Lots, Inc.(a) | | | 114,570 | | | | 3,815,181 | | |
Saks, Inc.(a) | | | 199,706 | | | | 2,276,648 | | |
Total | | | | | 6,091,829 | | |
Specialty Retail 4.0% | |
Aaron's, Inc. | | | 138,489 | | | | 3,779,365 | | |
Advance Auto Parts, Inc. | | | 144,500 | | | | 11,031,130 | | |
Aeropostale, Inc.(a) | | | 154,157 | | | | 2,007,124 | | |
American Eagle Outfitters, Inc. | | | 354,944 | | | | 7,340,242 | | |
ANN, Inc.(a) | | | 95,273 | | | | 2,695,273 | | |
Ascena Retail Group, Inc.(a) | | | 248,159 | | | | 4,166,590 | | |
Barnes & Noble, Inc.(a) | | | 74,335 | | | | 1,170,033 | | |
Cabela's, Inc.(a) | | | 91,040 | | | | 4,605,714 | | |
Chico's FAS, Inc. | | | 327,803 | | | | 5,566,095 | | |
Dick's Sporting Goods, Inc. | | | 193,265 | | | | 9,663,250 | | |
Foot Locker, Inc. | | | 296,872 | | | | 10,150,054 | | |
Guess?, Inc. | | | 120,803 | | | | 3,345,035 | | |
Office Depot, Inc.(a) | | | 561,802 | | | | 2,264,062 | | |
Rent-A-Center, Inc. | | | 115,897 | | | | 4,204,743 | | |
Signet Jewelers Ltd. | | | 159,520 | | | | 9,765,814 | | |
Tractor Supply Co. | | | 138,740 | | | | 14,427,572 | | |
Williams-Sonoma, Inc. | | | 169,938 | | | | 7,715,185 | | |
Total | | | | | 103,897,281 | | |
Textiles, Apparel & Luxury Goods 0.9% | |
Carter's, Inc.(a) | | | 99,992 | | | | 5,640,549 | | |
Deckers Outdoor Corp.(a) | | | 69,452 | | | | 2,801,694 | | |
The accompanying Notes to Financial Statements are an integral part of this statement.
Annual Report 2013
7
Columbia Mid Cap Index Fund
Portfolio of Investments (continued)
February 28, 2013
Common Stocks (continued)
Issuer | | Shares | | Value ($) | |
Hanesbrands, Inc.(a) | | | 192,750 | | | | 7,640,610 | | |
Under Armour, Inc., Class A(a) | | | 152,540 | | | | 7,517,171 | | |
Total | | | | | 23,600,024 | | |
Total Consumer Discretionary | | | | | 315,671,407 | | |
Consumer Staples 3.4% | |
Food & Staples Retailing 0.4% | |
Harris Teeter Supermarkets, Inc. | | | 97,122 | | | | 4,176,246 | | |
SUPERVALU, Inc. | | | 420,546 | | | | 1,669,568 | | |
United Natural Foods, Inc.(a) | | | 97,066 | | | | 4,913,481 | | |
Total | | | | | 10,759,295 | | |
Food Products 1.8% | |
Flowers Foods, Inc. | | | 225,899 | | | | 6,365,834 | | |
Green Mountain Coffee Roasters, Inc.(a) | | | 242,695 | | | | 11,591,113 | | |
Hillshire Brands Co. | | | 240,789 | | | | 7,801,564 | | |
Ingredion, Inc. | | | 150,791 | | | | 9,982,364 | | |
Lancaster Colony Corp. | | | 38,175 | | | | 2,793,265 | | |
Post Holdings, Inc.(a) | | | 64,311 | | | | 2,486,263 | | |
Smithfield Foods, Inc.(a) | | | 245,861 | | | | 5,467,949 | | |
Tootsie Roll Industries, Inc. | | | 40,418 | | | | 1,134,937 | | |
Total | | | | | 47,623,289 | | |
Household Products 1.1% | |
Church & Dwight Co., Inc. | | | 275,201 | | | | 17,051,454 | | |
Energizer Holdings, Inc. | | | 121,938 | | | | 11,209,760 | | |
Total | | | | | 28,261,214 | | |
Tobacco 0.1% | |
Universal Corp. | | | 46,165 | | | | 2,575,545 | | |
Total Consumer Staples | | | | | 89,219,343 | | |
Energy 5.9% | |
Energy Equipment & Services 2.8% | |
Atwood Oceanics, Inc.(a) | | | 112,180 | | | | 5,738,007 | | |
CARBO Ceramics, Inc. | | | 38,664 | | | | 3,510,691 | | |
Dresser-Rand Group, Inc.(a) | | | 149,041 | | | | 9,189,868 | | |
Dril-Quip, Inc.(a) | | | 71,680 | | | | 5,894,246 | | |
Helix Energy Solutions Group, Inc.(a) | | | 192,953 | | | | 4,517,030 | | |
Oceaneering International, Inc. | | | 212,541 | | | | 13,515,482 | | |
Oil States International, Inc.(a) | | | 108,123 | | | | 8,233,566 | | |
Patterson-UTI Energy, Inc. | | | 294,168 | | | | 6,865,881 | | |
Superior Energy Services, Inc.(a) | | | 310,604 | | | | 8,215,476 | | |
Common Stocks (continued)
Issuer | | Shares | | Value ($) | |
Tidewater, Inc. | | | 98,132 | | | | 4,644,588 | | |
Unit Corp.(a) | | | 85,133 | | | | 3,871,849 | | |
Total | | | | | 74,196,684 | | |
Oil, Gas & Consumable Fuels 3.1% | |
Alpha Natural Resources, Inc.(a) | | | 434,305 | | | | 3,465,754 | | |
Arch Coal, Inc. | | | 418,112 | | | | 2,186,726 | | |
Bill Barrett Corp.(a) | | | 94,841 | | | | 1,711,880 | | |
Cimarex Energy Co. | | | 170,460 | | | | 11,473,663 | | |
Energen Corp. | | | 142,105 | | | | 6,570,935 | | |
Forest Oil Corp.(a) | | | 233,122 | | | | 1,352,108 | | |
HollyFrontier Corp. | | | 399,010 | | | | 22,424,362 | | |
Northern Oil and Gas, Inc.(a) | | | 116,274 | | | | 1,594,116 | | |
Plains Exploration & Production Co.(a) | | | 254,081 | | | | 11,527,655 | | |
Quicksilver Resources, Inc.(a) | | | 235,047 | | | | 437,187 | | |
Rosetta Resources, Inc.(a) | | | 103,482 | | | | 5,037,504 | | |
SM Energy Co. | | | 130,149 | | | | 7,533,024 | | |
World Fuel Services Corp. | | | 141,990 | | | | 5,399,880 | | |
Total | | | | | 80,714,794 | | |
Total Energy | | | | | 154,911,478 | | |
Financials 22.2% | |
Capital Markets 2.4% | |
Affiliated Managers Group, Inc.(a) | | | 102,032 | | | | 14,920,139 | | |
Apollo Investment Corp. | | | 399,627 | | | | 3,472,759 | | |
Eaton Vance Corp. | | | 226,882 | | | | 8,664,624 | | |
Federated Investors, Inc., Class B | | | 184,300 | | | | 4,279,446 | | |
Greenhill & Co., Inc. | | | 51,921 | | | | 3,155,758 | | |
Janus Capital Group, Inc. | | | 368,740 | | | | 3,414,532 | | |
Raymond James Financial, Inc. | | | 219,751 | | | | 9,642,674 | | |
SEI Investments Co. | | | 265,625 | | | | 7,509,219 | | |
Waddell & Reed Financial, Inc., Class A | | | 168,356 | | | | 6,905,963 | | |
Total | | | | | 61,965,114 | | |
Commercial Banks 3.8% | |
Associated Banc-Corp. | | | 338,114 | | | | 4,865,460 | | |
BancorpSouth, Inc. | | | 163,695 | | | | 2,504,534 | | |
Bank of Hawaii Corp. | | | 88,531 | | | | 4,284,015 | | |
Cathay General Bancorp | | | 144,260 | | | | 2,811,627 | | |
City National Corp. | | | 93,247 | | | | 5,297,362 | | |
Commerce Bancshares, Inc. | | | 153,471 | | | | 5,845,710 | | |
Cullen/Frost Bankers, Inc. | | | 121,059 | | | | 7,331,333 | | |
The accompanying Notes to Financial Statements are an integral part of this statement.
Annual Report 2013
8
Columbia Mid Cap Index Fund
Portfolio of Investments (continued)
February 28, 2013
Common Stocks (continued)
Issuer | | Shares | | Value ($) | |
East West Bancorp, Inc. | | | 276,377 | | | | 6,798,874 | | |
First Niagara Financial Group, Inc. | | | 694,549 | | | | 5,681,411 | | |
FirstMerit Corp. | | | 215,971 | | | | 3,265,482 | | |
Fulton Financial Corp. | | | 392,170 | | | | 4,451,130 | | |
Hancock Holding Co. | | | 166,991 | | | | 5,043,128 | | |
International Bancshares Corp. | | | 107,247 | | | | 2,171,752 | | |
Prosperity Bancshares, Inc. | | | 86,690 | | | | 3,999,877 | | |
Signature Bank(a) | | | 90,946 | | | | 6,754,559 | | |
SVB Financial Group(a) | | | 87,687 | | | | 5,880,290 | | |
Synovus Financial Corp. | | | 1,549,280 | | | | 3,935,171 | | |
TCF Financial Corp. | | | 321,709 | | | | 4,420,282 | | |
Trustmark Corp. | | | 132,020 | | | | 3,023,258 | | |
Valley National Bancorp | | | 389,241 | | | | 3,904,087 | | |
Webster Financial Corp. | | | 158,160 | | | | 3,482,683 | | |
Westamerica Bancorporation | | | 53,938 | | | | 2,386,757 | | |
Total | | | | | 98,138,782 | | |
Diversified Financial Services 0.5% | |
CBOE Holdings, Inc. | | | 171,898 | | | | 6,174,576 | | |
MSCI, Inc.(a) | | | 240,487 | | | | 7,967,335 | | |
Total | | | | | 14,141,911 | | |
Insurance 4.6% | |
Alleghany Corp.(a) | | | 33,378 | | | | 12,612,545 | | |
American Financial Group, Inc. | | | 149,297 | | | | 6,563,096 | | |
Arthur J Gallagher & Co. | | | 245,003 | | | | 9,427,715 | | |
Aspen Insurance Holdings Ltd. | | | 139,824 | | | | 5,014,089 | | |
Brown & Brown, Inc. | | | 232,283 | | | | 6,968,490 | | |
Everest Re Group Ltd. | | | 101,845 | | | | 12,690,905 | | |
Fidelity National Financial, Inc., Class A | | | 417,205 | | | | 10,405,093 | | |
First American Financial Corp. | | | 210,105 | | | | 5,103,450 | | |
Hanover Insurance Group, Inc. (The) | | | 87,795 | | | | 3,747,091 | | |
HCC Insurance Holdings, Inc. | | | 199,528 | | | | 7,981,120 | | |
Kemper Corp. | | | 106,886 | | | | 3,381,873 | | |
Mercury General Corp. | | | 71,381 | | | | 2,774,579 | | |
Old Republic International Corp. | | | 475,276 | | | | 5,708,065 | | |
Primerica, Inc. | | | 92,000 | | | | 2,895,240 | | |
Protective Life Corp. | | | 155,880 | | | | 4,975,690 | | |
Reinsurance Group of America, Inc. | | | 145,464 | | | | 8,364,180 | | |
StanCorp Financial Group, Inc. | | | 87,133 | | | | 3,468,765 | | |
WR Berkley Corp. | | | 216,683 | | | | 8,992,344 | | |
Total | | | | | 121,074,330 | | |
Common Stocks (continued)
Issuer | | Shares | | Value ($) | |
Real Estate Investment Trusts (REITs) 9.8% | |
Alexandria Real Estate Equities, Inc. | | | 125,446 | | | | 8,924,228 | | |
American Campus Communities, Inc. | | | 206,088 | | | | 9,315,178 | | |
BioMed Realty Trust, Inc. | | | 330,515 | | | | 6,980,477 | | |
BRE Properties, Inc. | | | 151,363 | | | | 7,357,755 | | |
Camden Property Trust | | | 165,677 | | | | 11,454,908 | | |
Corporate Office Properties Trust | | | 159,136 | | | | 4,116,848 | | |
Duke Realty Corp. | | | 612,609 | | | | 9,899,761 | | |
Equity One, Inc. | | | 121,715 | | | | 2,861,520 | | |
Essex Property Trust, Inc. | | | 71,943 | | | | 10,718,788 | | |
Extra Space Storage, Inc. | | | 201,740 | | | | 7,553,146 | | |
Federal Realty Investment Trust | | | 127,293 | | | | 13,519,790 | | |
Highwoods Properties, Inc. | | | 154,674 | | | | 5,645,601 | | |
Home Properties, Inc. | | | 100,942 | | | | 6,300,800 | | |
Hospitality Properties Trust | | | 243,518 | | | | 6,501,931 | | |
Kilroy Realty Corp. | | | 146,800 | | | | 7,745,168 | | |
Liberty Property Trust | | | 232,891 | | | | 9,033,842 | | |
Macerich Co. (The) | | | 269,086 | | | | 16,174,759 | | |
Mack-Cali Realty Corp. | | | 163,613 | | | | 4,643,337 | | |
National Retail Properties, Inc. | | | 216,733 | | | | 7,466,452 | | |
Omega Healthcare Investors, Inc. | | | 220,700 | | | | 6,177,393 | | |
Potlatch Corp. | | | 79,522 | | | | 3,499,763 | | |
Rayonier, Inc. | | | 242,675 | | | | 13,558,252 | | |
Realty Income Corp. | | | 352,560 | | | | 16,094,364 | | |
Regency Centers Corp. | | | 178,033 | | | | 9,236,352 | | |
Senior Housing Properties Trust | | | 367,450 | | | | 9,219,320 | | |
SL Green Realty Corp. | | | 177,992 | | | | 14,527,707 | | |
Taubman Centers, Inc. | | | 121,524 | | | | 9,323,321 | | |
UDR, Inc. | | | 492,682 | | | | 11,755,393 | | |
Weingarten Realty Investors | | | 219,902 | | | | 6,739,996 | | |
Total | | | | | 256,346,150 | | |
Real Estate Management & Development 0.4% | |
Alexander & Baldwin, Inc.(a) | | | 84,426 | | | | 2,974,328 | | |
Jones Lang LaSalle, Inc. | | | 86,753 | | | | 8,383,810 | | |
Total | | | | | 11,358,138 | | |
Thrifts & Mortgage Finance 0.7% | |
Astoria Financial Corp. | | | 160,900 | | | | 1,573,602 | | |
New York Community Bancorp, Inc. | | | 864,899 | | | | 11,676,136 | | |
Washington Federal, Inc. | | | 209,234 | | | | 3,672,057 | | |
Total | | | | | 16,921,795 | | |
Total Financials | | | | | 579,946,220 | | |
The accompanying Notes to Financial Statements are an integral part of this statement.
Annual Report 2013
9
Columbia Mid Cap Index Fund
Portfolio of Investments (continued)
February 28, 2013
Common Stocks (continued)
Issuer | | Shares | | Value ($) | |
Health Care 9.2% | |
Biotechnology 1.9% | |
Regeneron Pharmaceuticals, Inc.(a) | | | 148,343 | | | | 24,773,281 | | |
United Therapeutics Corp.(a) | | | 93,053 | | | | 5,565,500 | | |
Vertex Pharmaceuticals, Inc.(a) | | | 427,069 | | | | 19,995,371 | | |
Total | | | | | 50,334,152 | | |
Health Care Equipment & Supplies 2.5% | |
Cooper Companies, Inc. (The) | | | 94,332 | | | | 10,004,852 | | |
Hill-Rom Holdings, Inc. | | | 119,769 | | | | 3,926,028 | | |
Hologic, Inc.(a) | | | 525,441 | | | | 11,470,377 | | |
IDEXX Laboratories, Inc.(a) | | | 107,686 | | | | 9,920,034 | | |
Masimo Corp. | | | 102,582 | | | | 2,036,253 | | |
ResMed, Inc. | | | 281,812 | | | | 12,537,816 | | |
STERIS Corp. | | | 115,168 | | | | 4,491,552 | | |
Teleflex, Inc. | | | 80,617 | | | | 6,446,135 | | |
Thoratec Corp.(a) | | | 115,735 | | | | 4,075,029 | | |
Total | | | | | 64,908,076 | | |
Health Care Providers & Services 2.9% | |
Community Health Systems, Inc. | | | 179,629 | | | | 7,591,122 | | |
Health Management Associates, Inc.,
Class A(a) | | | 504,958 | | | | 5,549,489 | | |
Health Net, Inc.(a) | | | 160,079 | | | | 4,120,434 | | |
Henry Schein, Inc.(a) | | | 173,320 | | | | 15,463,610 | | |
LifePoint Hospitals, Inc.(a) | | | 97,197 | | | | 4,285,416 | | |
Mednax, Inc.(a) | | | 98,136 | | | | 8,402,404 | | |
Omnicare, Inc. | | | 206,182 | | | | 7,682,341 | | |
Owens & Minor, Inc. | | | 124,865 | | | | 3,802,139 | | |
Universal Health Services, Inc., Class B | | | 174,233 | | | | 10,086,348 | | |
VCA Antech, Inc.(a) | | | 172,992 | | | | 3,798,904 | | |
WellCare Health Plans, Inc.(a) | | | 85,091 | | | | 4,866,354 | | |
Total | | | | | 75,648,561 | | |
Health Care Technology 0.3% | |
Allscripts-Misys Healthcare
Solutions, Inc.(a) | | | 337,718 | | | | 4,295,773 | | |
HMS Holdings Corp.(a) | | | 171,196 | | | | 4,962,972 | | |
Total | | | | | 9,258,745 | | |
Life Sciences Tools & Services 1.3% | |
Bio-Rad Laboratories, Inc., Class A(a) | | | 39,666 | | | | 4,886,851 | | |
Charles River Laboratories
International, Inc.(a) | | | 95,633 | | | | 3,896,089 | | |
Common Stocks (continued)
Issuer | | Shares | | Value ($) | |
Covance, Inc.(a) | | | 107,792 | | | | 7,177,869 | | |
Mettler-Toledo International, Inc.(a) | | | 60,356 | | | | 12,843,757 | | |
Techne Corp. | | | 68,186 | | | | 4,635,966 | | |
Total | | | | | 33,440,532 | | |
Pharmaceuticals 0.3% | |
Endo Health Solutions, Inc.(a) | | | 224,732 | | | | 6,966,692 | | |
Total Health Care | | | | | 240,556,758 | | |
Industrials 17.1% | |
Aerospace & Defense 1.3% | |
Alliant Techsystems, Inc. | | | 64,342 | | | | 4,233,703 | | |
B/E Aerospace, Inc.(a) | | | 204,729 | | | | 10,770,793 | | |
Esterline Technologies Corp.(a) | | | 60,778 | | | | 4,189,427 | | |
Exelis, Inc. | | | 369,490 | | | | 3,813,137 | | |
Huntington Ingalls Industries, Inc. | | | 97,674 | | | | 4,692,259 | | |
Triumph Group, Inc. | | | 98,487 | | | | 7,229,931 | | |
Total | | | | | 34,929,250 | | |
Air Freight & Logistics 0.1% | |
UTi Worldwide, Inc. | | | 204,385 | | | | 3,112,783 | | |
Airlines 0.4% | |
Alaska Air Group, Inc.(a) | | | 138,493 | | | | 7,139,314 | | |
JetBlue Airways Corp.(a) | | | 447,976 | | | | 2,714,735 | | |
Total | | | | | 9,854,049 | | |
Building Products 0.6% | |
Fortune Brands Home & Security, Inc.(a) | | | 320,666 | | | | 11,079,010 | | |
Lennox International, Inc. | | | 90,152 | | | | 5,325,279 | | |
Total | | | | | 16,404,289 | | |
Commercial Services & Supplies 1.9% | |
Brink's Co. (The) | | | 94,093 | | | | 2,488,760 | | |
Clean Harbors, Inc.(a) | | | 104,100 | | | | 5,361,150 | | |
Copart, Inc.(a) | | | 208,894 | | | | 7,131,641 | | |
Corrections Corp. of America | | | 197,073 | | | | 7,557,750 | | |
Deluxe Corp. | | | 100,262 | | | | 3,978,396 | | |
Herman Miller, Inc. | | | 115,104 | | | | 2,762,496 | | |
HNI Corp. | | | 88,925 | | | | 2,806,473 | | |
Mine Safety Appliances Co. | | | 61,156 | | | | 2,865,159 | | |
Rollins, Inc. | | | 129,436 | | | | 3,172,476 | | |
RR Donnelley & Sons Co. | | | 355,128 | | | | 3,707,536 | | |
Waste Connections, Inc. | | | 241,844 | | | | 8,273,483 | | |
Total | | | | | 50,105,320 | | |
The accompanying Notes to Financial Statements are an integral part of this statement.
Annual Report 2013
10
Columbia Mid Cap Index Fund
Portfolio of Investments (continued)
February 28, 2013
Common Stocks (continued)
Issuer | | Shares | | Value ($) | |
Construction & Engineering 0.9% | |
AECOM Technology Corp.(a) | | | 213,073 | | | | 6,458,243 | | |
Granite Construction, Inc. | | | 70,152 | | | | 2,181,026 | | |
KBR, Inc. | | | 290,632 | | | | 8,832,306 | | |
URS Corp. | | | 151,361 | | | | 6,396,516 | | |
Total | | | | | 23,868,091 | | |
Electrical Equipment 1.8% | |
Acuity Brands, Inc. | | | 83,872 | | | | 5,714,199 | | |
AMETEK, Inc. | | | 478,589 | | | | 20,019,378 | | |
General Cable Corp.(a) | | | 98,030 | | | | 3,229,108 | | |
Hubbell, Inc., Class B | | | 105,125 | | | | 9,767,164 | | |
Regal-Beloit Corp. | | | 87,629 | | | | 6,771,969 | | |
Total | | | | | 45,501,818 | | |
Industrial Conglomerates 0.3% | |
Carlisle Companies, Inc. | | | 123,909 | | | | 8,409,704 | | |
Machinery 5.4% | |
AGCO Corp. | | | 191,051 | | | | 9,835,305 | | |
CLARCOR, Inc. | | | 98,603 | | | | 5,027,767 | | |
Crane Co. | | | 94,185 | | | | 5,065,269 | | |
Donaldson Co., Inc. | | | 265,750 | | | | 9,574,973 | | |
Gardner Denver, Inc. | | | 96,711 | | | | 6,865,514 | | |
Graco, Inc. | | | 119,507 | | | | 6,943,357 | | |
Harsco Corp. | | | 158,724 | | | | 3,806,202 | | |
IDEX Corp. | | | 162,808 | | | | 8,291,811 | | |
ITT Corp. | | | 182,587 | | | | 4,807,516 | | |
Kennametal, Inc. | | | 156,846 | | | | 6,349,126 | | |
Lincoln Electric Holdings, Inc. | | | 163,620 | | | | 9,170,901 | | |
Nordson Corp. | | | 111,106 | | | | 7,044,120 | | |
Oshkosh Corp.(a) | | | 179,905 | | | | 6,937,137 | | |
SPX Corp. | | | 100,073 | | | | 8,056,877 | | |
Terex Corp.(a) | | | 217,645 | | | | 7,140,932 | | |
Timken Co. | | | 156,695 | | | | 8,511,672 | | |
Trinity Industries, Inc. | | | 155,473 | | | | 6,722,653 | | |
Valmont Industries, Inc. | | | 46,156 | | | | 7,271,878 | | |
Wabtec Corp. | | | 94,320 | | | | 9,223,553 | | |
Woodward, Inc. | | | 118,602 | | | | 4,439,273 | | |
Total | | | | | 141,085,836 | | |
Marine 0.4% | |
Kirby Corp.(a) | | | 110,108 | | | | 8,366,006 | | |
Matson, Inc. | | | 83,820 | | | | 2,155,012 | | |
Total | | | | | 10,521,018 | | |
Common Stocks (continued)
Issuer | | Shares | | Value ($) | |
Professional Services 0.9% | |
Corporate Executive Board Co. (The) | | | 66,108 | | | | 3,579,087 | | |
FTI Consulting, Inc.(a) | | | 81,688 | | | | 2,837,841 | | |
Manpower, Inc. | | | 154,532 | | | | 8,437,447 | | |
Towers Watson & Co. | | | 112,555 | | | | 7,492,787 | | |
Total | | | | | 22,347,162 | | |
Road & Rail 2.1% | |
Con-way, Inc. | | | 110,243 | | | | 3,875,041 | | |
Genesee & Wyoming, Inc., Class A(a) | | | 85,834 | | | | 7,683,860 | | |
JB Hunt Transport Services, Inc. | | | 179,355 | | | | 12,468,760 | | |
Kansas City Southern | | | 216,746 | | | | 22,318,336 | | |
Landstar System, Inc. | | | 91,528 | | | | 5,152,111 | | |
Werner Enterprises, Inc. | | | 87,564 | | | | 2,015,723 | | |
Total | | | | | 53,513,831 | | |
Trading Companies & Distributors 1.0% | |
GATX Corp. | | | 92,378 | | | | 4,605,043 | | |
MSC Industrial Direct Co., Inc., Class A | | | 91,465 | | | | 7,803,794 | | |
United Rentals, Inc.(a) | | | 182,365 | | | | 9,740,115 | | |
Watsco, Inc. | | | 58,428 | | | | 4,549,788 | | |
Total | | | | | 26,698,740 | | |
Total Industrials | | | | | 446,351,891 | | |
Information Technology 14.8% | |
Communications Equipment 0.9% | |
ADTRAN, Inc. | | | 123,436 | | | | 2,757,560 | | |
Ciena Corp.(a) | | | 197,362 | | | | 3,007,797 | | |
InterDigital, Inc. | | | 80,654 | | | | 3,581,038 | | |
Plantronics, Inc. | | | 84,059 | | | | 3,392,621 | | |
Polycom, Inc.(a) | | | 345,540 | | | | 3,147,869 | | |
Riverbed Technology, Inc.(a) | | | 316,481 | | | | 4,835,830 | | |
Tellabs, Inc. | | | 680,467 | | | | 1,381,348 | | |
Total | | | | | 22,104,063 | | |
Computers & Peripherals 0.7% | |
Diebold, Inc. | | | 124,522 | | | | 3,516,501 | | |
Lexmark International, Inc., Class A | | | 127,195 | | | | 2,800,834 | | |
NCR Corp.(a) | | | 314,950 | | | | 8,686,321 | | |
QLogic Corp.(a) | | | 182,630 | | | | 2,078,330 | | |
Total | | | | | 17,081,986 | | |
Electronic Equipment, Instruments & Components 2.1% | |
Arrow Electronics, Inc.(a) | | | 208,711 | | | | 8,379,747 | | |
Avnet, Inc.(a) | | | 270,305 | | | | 9,544,469 | | |
The accompanying Notes to Financial Statements are an integral part of this statement.
Annual Report 2013
11
Columbia Mid Cap Index Fund
Portfolio of Investments (continued)
February 28, 2013
Common Stocks (continued)
Issuer | | Shares | | Value ($) | |
Ingram Micro, Inc., Class A(a) | | | 295,746 | | | | 5,577,770 | | |
Itron, Inc.(a) | | | 77,223 | | | | 3,248,772 | | |
National Instruments Corp. | | | 186,266 | | | | 5,602,881 | | |
Tech Data Corp.(a) | | | 74,379 | | | | 3,946,550 | | |
Trimble Navigation Ltd.(a) | | | 248,539 | | | | 14,770,673 | | |
Vishay Intertechnology, Inc.(a) | | | 259,618 | | | | 3,424,361 | | |
Total | | | | | 54,495,223 | | |
Internet Software & Services 1.6% | |
AOL, Inc. | | | 150,940 | | | | 5,569,686 | | |
Equinix, Inc.(a) | | | 95,772 | | | | 20,260,567 | | |
Monster Worldwide, Inc.(a) | | | 230,648 | | | | 1,180,918 | | |
Rackspace Hosting, Inc.(a) | | | 215,791 | | | | 12,054,085 | | |
ValueClick, Inc.(a) | | | 139,305 | | | | 3,715,264 | | |
Total | | | | | 42,780,520 | | |
IT Services 3.1% | |
Acxiom Corp.(a) | | | 146,858 | | | | 2,674,284 | | |
Alliance Data Systems Corp.(a) | | | 98,194 | | | | 15,582,406 | | |
Broadridge Financial Solutions, Inc. | | | 240,737 | | | | 5,524,914 | | |
Convergys Corp. | | | 214,974 | | | | 3,566,419 | | |
CoreLogic, Inc.(a) | | | 191,982 | | | | 4,974,254 | | |
DST Systems, Inc. | | | 60,402 | | | | 4,102,504 | | |
Gartner, Inc.(a) | | | 184,467 | | | | 9,179,078 | | |
Global Payments, Inc. | | | 155,367 | | | | 7,490,243 | | |
Jack Henry & Associates, Inc. | | | 169,538 | | | | 7,412,201 | | |
Lender Processing Services, Inc. | | | 167,126 | | | | 4,104,615 | | |
Mantech International Corp., Class A | | | 46,641 | | | | 1,157,163 | | |
NeuStar, Inc., Class A(a) | | | 130,575 | | | | 5,725,714 | | |
VeriFone Systems, Inc.(a) | | | 212,356 | | | | 4,028,393 | | |
WEX, Inc.(a) | | | 76,232 | | | | 5,718,162 | | |
Total | | | | | 81,240,350 | | |
Office Electronics 0.2% | |
Zebra Technologies Corp., Class A(a) | | | 100,175 | | | | 4,479,826 | | |
Semiconductors & Semiconductor Equipment 1.9% | |
Atmel Corp.(a) | | | 865,954 | | | | 5,888,487 | | |
Cree, Inc.(a) | | | 229,038 | | | | 10,359,389 | | |
Cypress Semiconductor Corp. | | | 259,060 | | | | 2,727,902 | | |
Fairchild Semiconductor International, Inc.(a) | | | 250,063 | | | | 3,565,898 | | |
Integrated Device Technology, Inc.(a) | | | 283,981 | | | | 1,931,071 | | |
International Rectifier Corp.(a) | | | 136,172 | | | | 2,862,335 | | |
Intersil Corp., Class A | | | 249,741 | | | | 2,120,301 | | |
Common Stocks (continued)
Issuer | | Shares | | Value ($) | |
MEMC Electronic Materials, Inc.(a) | | | 454,886 | | | | 2,251,686 | | |
RF Micro Devices, Inc.(a) | | | 550,529 | | | | 2,537,939 | | |
Semtech Corp.(a) | | | 130,421 | | | | 3,986,970 | | |
Silicon Laboratories, Inc.(a) | | | 75,572 | | | | 3,137,749 | | |
Skyworks Solutions, Inc.(a) | | | 382,744 | | | | 8,152,447 | | |
Total | | | | | 49,522,174 | | |
Software 4.3% | |
ACI Worldwide, Inc.(a) | | | 77,576 | | | | 3,553,757 | | |
Advent Software, Inc.(a) | | | 62,282 | | | | 1,631,788 | | |
ANSYS, Inc.(a) | | | 182,468 | | | | 13,831,074 | | |
Cadence Design Systems, Inc.(a) | | | 551,518 | | | | 7,809,495 | | |
CommVault Systems, Inc.(a) | | | 83,700 | | | | 6,189,615 | | |
Compuware Corp.(a) | | | 420,017 | | | | 4,876,397 | | |
Concur Technologies, Inc.(a) | | | 88,945 | | | | 6,243,939 | | |
Factset Research Systems, Inc. | | | 80,199 | | | | 7,802,561 | | |
Fair Isaac Corp. | | | 68,777 | | | | 3,049,572 | | |
Informatica Corp.(a) | | | 212,539 | | | | 7,440,990 | | |
Mentor Graphics Corp.(a) | | | 186,092 | | | | 3,295,689 | | |
MICROS Systems, Inc.(a) | | | 158,037 | | | | 6,763,984 | | |
PTC, Inc.(a) | | | 235,340 | | | | 5,445,768 | | |
Rovi Corp.(a) | | | 203,747 | | | | 3,624,659 | | |
SolarWinds, Inc.(a) | | | 120,308 | | | | 6,792,590 | | |
Solera Holdings, Inc. | | | 135,545 | | | | 7,631,183 | | |
Synopsys, Inc.(a) | | | 293,721 | | | | 10,289,047 | | |
TIBCO Software, Inc.(a) | | | 305,926 | | | | 6,562,113 | | |
Total | | | | | 112,834,221 | | |
Total Information Technology | | | | | 384,538,363 | | |
Materials 6.7% | |
Chemicals 2.8% | |
Albemarle Corp. | | | 175,809 | | | | 11,441,650 | | |
Ashland, Inc. | | | 144,385 | | | | 11,257,698 | | |
Cabot Corp. | | | 117,514 | | | | 4,322,165 | | |
Cytec Industries, Inc. | | | 89,796 | | | | 6,500,332 | | |
Intrepid Potash, Inc. | | | 105,303 | | | | 2,075,522 | | |
Minerals Technologies, Inc. | | | 69,695 | | | | 2,804,527 | | |
NewMarket Corp. | | | 21,143 | | | | 5,321,059 | | |
Olin Corp. | | | 157,868 | | | | 3,656,223 | | |
RPM International, Inc. | | | 260,561 | | | | 7,923,660 | | |
Scotts Miracle-Gro Co., Class A | | | 76,132 | | | | 3,373,409 | | |
The accompanying Notes to Financial Statements are an integral part of this statement.
Annual Report 2013
12
Columbia Mid Cap Index Fund
Portfolio of Investments (continued)
February 28, 2013
Common Stocks (continued)
Issuer | | Shares | | Value ($) | |
Sensient Technologies Corp. | | | 98,025 | | | | 3,618,103 | | |
Valspar Corp. | | | 166,284 | | | | 10,244,757 | | |
Total | | | | | 72,539,105 | | |
Construction Materials 0.3% | |
Martin Marietta Materials, Inc. | | | 90,429 | | | | 8,783,369 | | |
Containers & Packaging 1.6% | |
AptarGroup, Inc. | | | 130,812 | | | | 7,055,999 | | |
Greif, Inc., Class A | | | 59,733 | | | | 3,038,618 | | |
Packaging Corp. of America | | | 193,419 | | | | 8,081,046 | | |
Rock Tenn Co., Class A | | | 140,047 | | | | 12,387,157 | | |
Silgan Holdings, Inc. | | | 89,075 | | | | 3,823,990 | | |
Sonoco Products Co. | | | 198,421 | | | | 6,303,835 | | |
Total | | | | | 40,690,645 | | |
Metals & Mining 1.6% | |
Carpenter Technology Corp. | | | 87,082 | | | | 4,112,883 | | |
Commercial Metals Co. | | | 229,177 | | | | 3,737,877 | | |
Compass Minerals International, Inc. | | | 65,219 | | | | 4,807,945 | | |
Reliance Steel & Aluminum Co. | | | 148,816 | | | | 9,909,657 | | |
Royal Gold, Inc. | | | 128,090 | | | | 8,395,019 | | |
Steel Dynamics, Inc. | | | 431,834 | | | | 6,594,105 | | |
Worthington Industries, Inc. | | | 103,225 | | | | 2,925,396 | | |
Total | | | | | 40,482,882 | | |
Paper & Forest Products 0.4% | |
Domtar Corp. | | | 69,458 | | | | 5,178,788 | | |
Louisiana-Pacific Corp.(a) | | | 272,532 | | | | 5,714,996 | | |
Total | | | | | 10,893,784 | | |
Total Materials | | | | | 173,389,785 | | |
Telecommunication Services 0.5% | |
Diversified Telecommunication Services 0.3% | |
tw telecom, Inc.(a) | | | 298,116 | | | | 7,548,297 | | |
Wireless Telecommunication Services 0.2% | |
Telephone & Data Systems, Inc. | | | 199,120 | | | | 4,557,857 | | |
Total Telecommunication Services | | | | | 12,106,154 | | |
Utilities 4.9% | |
Electric Utilities 2.1% | |
Cleco Corp. | | | 119,609 | | | | 5,298,679 | | |
Great Plains Energy, Inc. | | | 301,726 | | | | 6,586,678 | | |
Common Stocks (continued)
Issuer | | Shares | | Value ($) | |
Hawaiian Electric Industries, Inc. | | | 192,036 | | | | 5,183,052 | | |
IDACORP, Inc. | | | 98,794 | | | | 4,612,692 | | |
NV Energy, Inc. | | | 463,685 | | | | 9,162,415 | | |
OGE Energy Corp. | | | 194,489 | | | | 11,262,858 | | |
PNM Resources, Inc. | | | 156,890 | | | | 3,523,749 | | |
Westar Energy, Inc. | | | 249,081 | | | | 7,726,493 | | |
Total | | | | | 53,356,616 | | |
Gas Utilities 1.4% | |
Atmos Energy Corp. | | | 177,737 | | | | 6,784,222 | | |
National Fuel Gas Co. | | | 164,220 | | | | 9,555,962 | | |
Questar Corp. | | | 344,857 | | | | 8,107,588 | | |
UGI Corp. | | | 221,994 | | | | 7,951,825 | | |
WGL Holdings, Inc. | | | 101,660 | | | | 4,287,002 | | |
Total | | | | | 36,686,599 | | |
Multi-Utilities 1.1% | |
Alliant Energy Corp. | | | 218,603 | | | | 10,425,177 | | |
Black Hills Corp. | | | 87,017 | | | | 3,619,037 | | |
MDU Resources Group, Inc. | | | 371,926 | | | | 8,985,732 | | |
Vectren Corp. | | | 161,775 | | | | 5,338,575 | | |
Total | | | | | 28,368,521 | | |
Water Utilities 0.3% | |
Aqua America, Inc. | | | 275,633 | | | | 8,029,189 | | |
Total Utilities | | | | | 126,440,925 | | |
Total Common Stocks
(Cost: $1,731,983,564) | | | | | 2,523,132,324 | | |
Money Market Funds 4.4% | |
| | Shares | | Value ($) | |
Columbia Short-Term Cash Fund,
0.128%(b)(c) | | | 115,637,033 | | | | 115,637,033 | | |
Total Money Market Funds
(Cost: $115,637,033) | | | | | 115,637,033 | | |
Total Investments
(Cost: $1,847,620,597) | | | | | 2,638,769,357 | | |
Other Assets & Liabilities, Net | | | | | (31,618,787 | ) | |
Net Assets | | | | | 2,607,150,570 | | |
The accompanying Notes to Financial Statements are an integral part of this statement.
Annual Report 2013
13
Columbia Mid Cap Index Fund
Portfolio of Investments (continued)
February 28, 2013
Investments in Derivatives
Futures Contracts Outstanding at February 28, 2013
At February 28, 2013, $2,968,000 was held in a margin deposit account as collateral to cover initial margin requirements on open futures contracts.
Contract Description | | Number of
Contracts
Long (Short) | | Notional
Market
Value ($) | | Expiration
Date | | Unrealized
Appreciation ($) | | Unrealized
Depreciation ($) | |
S&P Mid Cap 400 E-Mini | | | 742 | | | | 81,746,140 | | | March 2013 | | | 5,175,131 | | | | — | | |
Notes to Portfolio of Investments
(a) Non-income producing.
(b) The rate shown is the seven-day current annualized yield at February 28, 2013.
(c) As defined in the Investment Company Act of 1940, an affiliated company is one in which the Fund owns 5% or more of its outstanding voting securities, or a company which is under common ownership or control with the Fund. Holdings and transactions in these affiliated companies during the year ended February 28, 2013, are as follows:
Issuer | | Beginning
Cost ($) | | Purchase
Cost ($) | | Proceeds
From Sales ($) | | Ending
Cost ($) | | Dividends —
Affiliated
Issuers ($) | | Value ($) | |
Columbia Short-Term Cash Fund | | | 69,812,648 | | | | 676,356,596 | | | | (630,532,211 | ) | | | 115,637,033 | | | | 99,498 | | | | 115,637,033 | | |
Fair Value Measurements
Generally accepted accounting principles (GAAP) require disclosure regarding the inputs and valuation techniques used to measure fair value and any changes in valuation inputs or techniques. In addition, investments shall be disclosed by major category.
The Fund categorizes its fair value measurements according to a three-level hierarchy that maximizes the use of observable inputs and minimizes the use of unobservable inputs by prioritizing that the most observable input be used when available. Observable inputs are those that market participants would use in pricing an investment based on market data obtained from sources independent of the reporting entity. Unobservable inputs are those that reflect the Fund's assumptions about the information market participants would use in pricing an investment. An investment's level within the fair value hierarchy is based on the lowest level of any input that is deemed significant to the asset or liability's fair value measurement. The input levels are not necessarily an indication of the risk or liquidity associated with investments at that level. For example, certain U.S. government securities are generally high quality and liquid, however, they are reflected as Level 2 because the inputs used to determine fair value may not always be quoted prices in an active market.
Fair value inputs are summarized in the three broad levels listed below:
> Level 1 — Valuations based on quoted prices for investments in active markets that the Fund has the ability to access at the measurement date (including NAV for open-end mutual funds). Valuation adjustments are not applied to Level 1 investments.
> Level 2 — Valuations based on other significant observable inputs (including quoted prices for similar securities, interest rates, prepayment speeds, credit risks, etc.).
> Level 3 — Valuations based on significant unobservable inputs (including the Fund's own assumptions and judgment in determining the fair value of investments).
Inputs that are used in determining fair value of an investment may include price information, credit data, volatility statistics, and other factors. These inputs can be either observable or unobservable. The availability of observable inputs can vary between investments, and is affected by various factors such as the type of investment, and the volume and level of activity for that investment or similar investments in the marketplace. The inputs will be considered by the Investment Manager, along with any other relevant factors in the calculation of an investment's fair value. The Fund uses prices and inputs that are current as of the measurement date, which may include periods of market dislocations. During these periods, the availability of prices and inputs may be reduced for many investments. This condition could cause an investment to be reclassified between the various levels within the hierarchy.
Investments falling into the Level 3 category are primarily supported by quoted prices from brokers and dealers participating in the market for those investments. However, these may be classified as Level 3 investments due to lack of market transparency and corroboration to support these quoted prices. Additionally, valuation models may be used as the pricing source for any remaining investments classified as Level 3. These models rely on one or more significant unobservable inputs and/or significant assumptions by the Investment Manager. Inputs used in valuations may include, but are not limited to, financial statement analysis, capital account balances, discount rates and estimated cash flows, and comparable company data.
The accompanying Notes to Financial Statements are an integral part of this statement.
Annual Report 2013
14
Columbia Mid Cap Index Fund
Portfolio of Investments (continued)
February 28, 2013
Fair Value Measurements (continued)
Under the direction of the Fund's Board of Trustees (the Board), the Investment Manager's Valuation Committee (the Committee) is responsible for carrying out the valuation procedures approved by the Board. The Committee consists of voting and non-voting members from various groups within the Investment Manager's organization, including operations and accounting, trading and investments, compliance, risk management and legal.
The Committee meets at least monthly to review and approve valuation matters, which may include a description of specific valuation determinations, data regarding pricing information received from approved pricing vendors and brokers and the results of Board-approved valuation control policies and procedures (the Policies). The Policies address, among other things, instances when market quotations are readily available, including recommendations of third party pricing vendors and a determination of appropriate pricing methodologies; events that require specific valuation determinations and assessment of fair value techniques; securities with a potential for stale pricing, including those that are illiquid, restricted, or in default; and the effectiveness of third-party pricing vendors, including periodic reviews of vendors. The Committee meets more frequently, as needed, to discuss additional valuation matters, which may include the need to review back-testing results, review time-sensitive information or approve related valuation actions. The Committee reports to the Board, with members of the Committee meeting with the Board at each of its regularly scheduled meetings to discuss valuation matters and actions during the period, similar to those described earlier.
For investments categorized as Level 3, the Committee monitors information similar to that described above, which may include: (i) data specific to the issuer or comparable issuers, (ii) general market or specific sector news and (iii) quoted prices and specific or similar security transactions. The Committee considers this data and any changes from prior periods in order to assess the reasonableness of observable and unobservable inputs, any assumptions or internal models used to value those securities and changes in fair value. This data is also used to corroborate, when available, information received from approved pricing vendors and brokers. Various factors impact the frequency of monitoring this information (which may occur as often as daily). However, the Committee may determine that changes to inputs, assumptions and models are not required as a result of the monitoring procedures performed.
The following table is a summary of the inputs used to value the Fund's investments at February 28, 2013:
Description | | Level 1
Quoted Prices in Active
Markets for Identical
Assets ($) | | Level 2
Other Significant
Observable Inputs ($) | | Level 3
Significant
Unobservable Inputs ($) | | Total ($) | |
Equity Securities | |
Common Stocks | |
Consumer Discretionary | | | 315,671,407 | | | | — | | | | — | | | | 315,671,407 | | |
Consumer Staples | | | 89,219,343 | | | | — | | | | — | | | | 89,219,343 | | |
Energy | | | 154,911,478 | | | | — | | | | — | | | | 154,911,478 | | |
Financials | | | 579,946,220 | | | | — | | | | — | | | | 579,946,220 | | |
Health Care | | | 240,556,758 | | | | — | | | | — | | | | 240,556,758 | | |
Industrials | | | 446,351,891 | | | | — | | | | — | | | | 446,351,891 | | |
Information Technology | | | 384,538,363 | | | | — | | | | — | | | | 384,538,363 | | |
Materials | | | 173,389,785 | | | | — | | | | — | | | | 173,389,785 | | |
Telecommunication Services | | | 12,106,154 | | | | — | | | | — | | | | 12,106,154 | | |
Utilities | | | 126,440,925 | | | | — | | | | — | | | | 126,440,925 | | |
Total Equity Securities | | | 2,523,132,324 | | | | — | | | | — | | | | 2,523,132,324 | | |
Other | |
Money Market Funds | | | 115,637,033 | | | | — | | | | — | | | | 115,637,033 | | |
Total Other | | | 115,637,033 | | | | — | | | | — | | | | 115,637,033 | | |
Investments in Securities | | | 2,638,769,357 | | | | — | | | | — | | | | 2,638,769,357 | | |
Derivatives | |
Assets | |
Futures Contracts | | | 5,175,131 | | | | — | | | | — | | | | 5,175,131 | | |
Total | | | 2,643,944,488 | | | | — | | | | — | | | | 2,643,944,488 | | |
See the Portfolio of Investments for all investment classifications not indicated in the table.
There were no transfers of financial assets between Levels 1 and 2 during the period.
Derivative instruments are valued at unrealized appreciation (depreciation).
The accompanying Notes to Financial Statements are an integral part of this statement.
Annual Report 2013
15
Columbia Mid Cap Index Fund
Statement of Assets and Liabilities
February 28, 2013
Assets | |
Investments, at value | |
Unaffiliated issuers (identified cost $1,731,983,564) | | $ | 2,523,132,324 | | |
Affiliated issuers (identified cost $115,637,033) | | | 115,637,033 | | |
Total investments (identified cost $1,847,620,597) | | | 2,638,769,357 | | |
Cash | | | 1,060 | | |
Margin deposits on futures contracts | | | 2,968,000 | | |
Receivable for: | |
Investments sold | | | 6,431,413 | | |
Capital shares sold | | | 7,489,873 | | |
Dividends | | | 2,655,919 | | |
Expense reimbursement due from Investment Manager | | | 15,933 | | |
Due from broker | | | 1,278,442 | | |
Prepaid expenses | | | 6,202 | | |
Total assets | | | 2,659,616,199 | | |
Liabilities | |
Due to custodian | | | 5,381,086 | | |
Payable for: | |
Investments purchased | | | 7,742,526 | | |
Capital shares purchased | | | 38,347,130 | | |
Variation margin on futures contracts | | | 158,203 | | |
Investment management fees | | | 7,234 | | |
Distribution and/or service fees | | | 4,056 | | |
Transfer agent fees | | | 616,128 | | |
Administration fees | | | 7,234 | | |
Compensation of board members | | | 83,266 | | |
Other expenses | | | 118,766 | | |
Total liabilities | | | 52,465,629 | | |
Net assets applicable to outstanding capital stock | | $ | 2,607,150,570 | | |
Represented by | |
Paid-in capital | | $ | 1,807,663,066 | | |
Undistributed net investment income | | | 1,657,924 | | |
Accumulated net realized gain | | | 1,505,689 | | |
Unrealized appreciation (depreciation) on: | |
Investments | | | 791,148,760 | | |
Futures contracts | | | 5,175,131 | | |
Total — representing net assets applicable to outstanding capital stock | | $ | 2,607,150,570 | | |
The accompanying Notes to Financial Statements are an integral part of this statement.
Annual Report 2013
16
Columbia Mid Cap Index Fund
Statement of Assets and Liabilities (continued)
February 28, 2013
Class A | |
Net assets | | $ | 592,450,244 | | |
Shares outstanding | | | 46,207,715 | | |
Net asset value per share | | $ | 12.82 | | |
Class I | |
Net assets | | $ | 3,134 | | |
Shares outstanding | | | 245 | | |
Net asset value per share(a) | | $ | 12.77 | | |
Class R5 | |
Net assets | | $ | 2,741 | | |
Shares outstanding | | | 212 | | |
Net asset value per share(a) | | $ | 12.95 | | |
Class Z | |
Net assets | | $ | 2,014,694,451 | | |
Shares outstanding | | | 157,683,894 | | |
Net asset value per share | | $ | 12.78 | | |
(a) Net asset value per share rounds to this amount due to fractional shares outstanding.
The accompanying Notes to Financial Statements are an integral part of this statement.
Annual Report 2013
17
Columbia Mid Cap Index Fund
Statement of Operations
Year Ended February 28, 2013
Net investment income | |
Income: | |
Dividends — unaffiliated issuers | | $ | 37,882,437 | | |
Dividends — affiliated issuers | | | 99,498 | | |
Interest | | | 491 | | |
Income from securities lending — net | | | 854,518 | | |
Total income | | | 38,836,944 | | |
Expenses: | |
Investment management fees | | | 2,425,603 | | |
Distribution and/or service fees | |
Class A | | | 1,238,504 | | |
Transfer agent fees | |
Class A | | | 930,655 | | |
Class Z | | | 3,552,980 | | |
Administration fees | | | 2,425,603 | | |
Compensation of board members | | | 69,236 | | |
Custodian fees | | | 26,863 | | |
Printing and postage fees | | | 218,479 | | |
Registration fees | | | 112,998 | | |
Licensing fees | | | 35,281 | | |
Professional fees | | | 63,547 | | |
Other | | | 53,319 | | |
Total expenses | | | 11,153,068 | | |
Fees waived or expenses reimbursed by Investment Manager and its affiliates | | | (5,049,926 | ) | |
Expense reductions | | | (180 | ) | |
Total net expenses | | | 6,102,962 | | |
Net investment income | | | 32,733,982 | | |
Realized and unrealized gain (loss) — net | |
Net realized gain (loss) on: | |
Investments | | $ | 41,301,307 | | |
Futures contracts | | | 9,441,527 | | |
Net realized gain | | | 50,742,834 | | |
Net change in unrealized appreciation (depreciation) on: | |
Investments | | | 177,766,088 | | |
Futures contracts | | | (946,938 | ) | |
Net change in unrealized appreciation (depreciation) | | | 176,819,150 | | |
Net realized and unrealized gain | | | 227,561,984 | | |
Net increase in net assets resulting from operations | | $ | 260,295,966 | | |
The accompanying Notes to Financial Statements are an integral part of this statement.
Annual Report 2013
18
Columbia Mid Cap Index Fund
Statement of Changes in Net Assets
| | | Year Ended
February 28,
2013(a) | | Year Ended
February 29,
2012 | |
Operations | |
Net investment income | | $ | 32,733,982 | | | $ | 28,525,200 | | |
Net realized gain | | | 50,742,834 | | | | 98,360,772 | | |
Net change in unrealized appreciation (depreciation) | | | 176,819,150 | | | | (57,284,026 | ) | |
Net increase in net assets resulting from operations | | | 260,295,966 | | | | 69,601,946 | | |
Distributions to shareholders | |
Net investment income | |
Class A | | | (6,065,718 | ) | | | (3,099,815 | ) | |
Class I | | | (44 | ) | | | (29 | ) | |
Class R5 | | | (36 | ) | | | — | | |
Class Z | | | (26,090,852 | ) | | | (24,665,554 | ) | |
Net realized gains | |
Class A | | | (22,364,190 | ) | | | (16,881,805 | ) | |
Class I | | | (133 | ) | | | (129 | ) | |
Class R5 | | | (71 | ) | | | — | | |
Class Z | | | (80,303,779 | ) | | | (108,010,412 | ) | |
Total distributions to shareholders | | | (134,824,823 | ) | | | (152,657,744 | ) | |
Increase (decrease) in net assets from capital stock activity | | | (506,077,072 | ) | | | 251,630,333 | | |
Total increase (decrease) in net assets | | | (380,605,929 | ) | | | 168,574,535 | | |
Net assets at beginning of year | | | 2,987,756,499 | | | | 2,819,181,964 | | |
Net assets at end of year | | $ | 2,607,150,570 | | | $ | 2,987,756,499 | | |
Undistributed net investment income | | $ | 1,657,924 | | | $ | 1,290,321 | | |
(a) Class R5 shares are for the period from November 8, 2012 (commencement of operations) to February 28, 2013.
The accompanying Notes to Financial Statements are an integral part of this statement.
Annual Report 2013
19
Columbia Mid Cap Index Fund
Statement of Changes in Net Assets (continued)
| | | Year Ended February 28, 2013(a) | | Year Ended February 29, 2012 | |
| | | Shares | | Dollars ($) | | Shares | | Dollars ($) | |
Capital stock activity | |
Class A shares | |
Subscriptions | | | 22,853,756 | | | | 272,819,581 | | | | 21,883,341 | | | | 252,664,365 | | |
Distributions reinvested | | | 2,376,962 | | | | 27,417,562 | | | | 1,777,674 | | | | 19,595,990 | | |
Redemptions | | | (18,508,967 | ) | | | (220,888,204 | ) | | | (11,735,101 | ) | | | (134,597,142 | ) | |
Net increase | | | 6,721,751 | | | | 79,348,939 | | | | 11,925,914 | | | | 137,663,213 | | |
Class R5 shares | |
Subscriptions | | | 212 | | | | 2,500 | | | | — | | | | — | | |
Net increase | | | 212 | | | | 2,500 | | | | — | | | | — | | |
Class Z shares | |
Subscriptions | | | 59,274,784 | | | | 705,258,535 | | | | 48,336,594 | | | | 546,829,833 | | |
Distributions reinvested | | | 5,520,124 | | | | 63,483,810 | | | | 8,311,846 | | | | 91,427,308 | | |
Redemptions | | | (119,041,735 | ) | | | (1,354,170,856 | ) | | | (46,467,848 | ) | | | (524,290,021 | ) | |
Net increase (decrease) | | | (54,246,827 | ) | | | (585,428,511 | ) | | | 10,180,592 | | | | 113,967,120 | | |
Total net increase (decrease) | | | (47,524,864 | ) | | | (506,077,072 | ) | | | 22,106,506 | | | | 251,630,333 | | |
(a) Class R5 shares are for the period from November 8, 2012 (commencement of operations) to February 28, 2013.
The accompanying Notes to Financial Statements are an integral part of this statement.
Annual Report 2013
20
Columbia Mid Cap Index Fund
The following tables are intended to help you understand the Fund's financial performance. Certain information reflects financial results for a single share of a class held for the periods shown. Per share net investment income (loss) amounts are calculated based on average shares outstanding during the period. Total return assumes reinvestment of all dividends and distributions, if any. Total return does not reflect payment of sales charges, if any, and is not annualized for periods of less than one year.
| | | Year Ended
February 28, | | Year Ended
February 29, | | Year Ended February 28, | |
Class A | | 2013 | | 2012 | | 2011 | | 2010 | | 2009 | |
Per share data | |
Net asset value, beginning of period | | $ | 11.92 | | | $ | 12.33 | | | $ | 9.44 | | | $ | 5.73 | | | $ | 10.86 | | |
Income from investment operations: | |
Net investment income | | | 0.14 | | | | 0.10 | | | | 0.09 | | | | 0.09 | | | | 0.12 | | |
Net realized and unrealized gain (loss) | | | 1.45 | | | | 0.10 | | | | 2.94 | | | | 3.71 | | | | (4.55 | ) | |
Total from investment operations | | | 1.59 | | | | 0.20 | | | | 3.03 | | | | 3.80 | | | | (4.43 | ) | |
Less distributions to shareholders: | |
Net investment income | | | (0.15 | ) | | | (0.09 | ) | | | (0.09 | ) | | | (0.09 | ) | | | (0.14 | ) | |
Net realized gains | | | (0.54 | ) | | | (0.52 | ) | | | (0.05 | ) | | | — | | | | (0.56 | ) | |
Total distributions to shareholders | | | (0.69 | ) | | | (0.61 | ) | | | (0.14 | ) | | | (0.09 | ) | | | (0.70 | ) | |
Net asset value, end of period | | $ | 12.82 | | | $ | 11.92 | | | $ | 12.33 | | | $ | 9.44 | | | $ | 5.73 | | |
Total return | | | 14.03 | % | | | 2.12 | % | | | 32.16 | % | | | 66.35 | % | | | (42.11 | %) | |
Ratios to average net assets(a)(b) | |
Total gross expenses | | | 0.66 | % | | | 0.66 | % | | | 0.50 | % | | | 0.49 | % | | | 0.49 | %(c) | |
Total net expenses(d) | | | 0.45 | %(e) | | | 0.45 | %(e) | | | 0.45 | %(e) | | | 0.43 | %(e) | | | 0.39 | %(c)(e) | |
Net investment income | | | 1.18 | % | | | 0.83 | % | | | 0.83 | % | | | 1.10 | % | | | 1.36 | % | |
Supplemental data | |
Net assets, end of period (in thousands) | | $ | 592,450 | | | $ | 470,550 | | | $ | 339,724 | | | $ | 168,264 | | | $ | 59,374 | | |
Portfolio turnover | | | 20 | % | | | 15 | % | | | 10 | % | | | 15 | % | | | 28 | % | |
Notes to Financial Highlights
(a) In addition to the fees and expenses which the Fund bears directly, the Fund indirectly bears a pro rata share of the fees and expenses of the acquired funds in which it invests. Such indirect expenses are not included in the reported expense ratios.
(b) Certain line items from prior years have been reclassified to conform to the current presentation.
(c) Ratios include line of credit interest expense which rounds to less than 0.01%.
(d) Total net expenses include the impact of certain waivers/reimbursements made by the Investment Manager and certain of its affiliates, if applicable.
(e) The benefits derived from expense reductions had an impact of less than 0.01%.
The accompanying Notes to Financial Statements are an integral part of this statement.
Annual Report 2013
21
Columbia Mid Cap Index Fund
Financial Highlights (continued)
Class I | | Year Ended
February 28,
2013 | | Year Ended
February 29,
2012 | | Year Ended
February 28,
2011(a) | |
Per share data | |
Net asset value, beginning of period | | $ | 11.88 | | | $ | 12.29 | | | $ | 10.19 | | |
Income from investment operations: | |
Net investment income | | | 0.17 | | | | 0.12 | | | | 0.04 | | |
Net realized and unrealized gain | | | 1.44 | | | | 0.11 | | | | 2.22 | | |
Total from investment operations | | | 1.61 | | | | 0.23 | | | | 2.26 | | |
Less distributions to shareholders: | |
Net investment income | | | (0.18 | ) | | | (0.12 | ) | | | (0.11 | ) | |
Net realized gains | | | (0.54 | ) | | | (0.52 | ) | | | (0.05 | ) | |
Total distributions to shareholders | | | (0.72 | ) | | | (0.64 | ) | | | (0.16 | ) | |
Net asset value, end of period | | $ | 12.77 | | | $ | 11.88 | | | $ | 12.29 | | |
Total return | | | 14.34 | % | | | 2.40 | % | | | 22.27 | % | |
Ratios to average net assets(b)(c) | |
Total gross expenses | | | 0.24 | % | | | 0.20 | % | | | 0.23 | %(d) | |
Total net expenses(e) | | | 0.15 | % | | | 0.19 | % | | | 0.19 | %(d)(f) | |
Net investment income | | | 1.48 | % | | | 1.08 | % | | | 0.92 | %(d) | |
Supplemental data | |
Net assets, end of period (in thousands) | | $ | 3 | | | $ | 3 | | | $ | 3 | | |
Portfolio turnover | | | 20 | % | | | 15 | % | | | 10 | % | |
Notes to Financial Highlights
(a) For the period from September 27, 2010 (commencement of operations) to February 28, 2011.
(b) In addition to the fees and expenses which the Fund bears directly, the Fund indirectly bears a pro rata share of the fees and expenses of the acquired funds in which it invests. Such indirect expenses are not included in the reported expense ratios.
(c) Certain line items from prior years have been reclassified to conform to the current presentation.
(d) Annualized.
(e) Total net expenses include the impact of certain waivers/reimbursements made by the Investment Manager and certain of its affiliates, if applicable.
(f) The benefits derived from expense reductions had an impact of less than 0.01%.
The accompanying Notes to Financial Statements are an integral part of this statement.
Annual Report 2013
22
Columbia Mid Cap Index Fund
Financial Highlights (continued)
Class R5 | | Year Ended
February 28,
2013(a) | |
Per share data | |
Net asset value, beginning of period | | $ | 11.81 | | |
Income from investment operations: | |
Net investment income | | | 0.07 | | |
Net realized and unrealized gain | | | 1.57 | | |
Total from investment operations | | | 1.64 | | |
Less distributions to shareholders: | |
Net investment income | | | (0.16 | ) | |
Net realized gains | | | (0.34 | ) | |
Total distributions to shareholders | | | (0.50 | ) | |
Net asset value, end of period | | $ | 12.95 | | |
Total return | | | 14.34 | % | |
Ratios to average net assets(b) | |
Total gross expenses | | | 0.21 | %(c) | |
Total net expenses(d) | | | 0.16 | %(c) | |
Net investment income | | | 1.82 | %(c) | |
Supplemental data | |
Net assets, end of period (in thousands) | | $ | 3 | | |
Portfolio turnover | | | 20 | % | |
Notes to Financial Highlights
(a) For the period from November 8, 2012 (commencement of operations) to February 28, 2013.
(b) In addition to the fees and expenses which the Fund bears directly, the Fund indirectly bears a pro rata share of the fees and expenses of the acquired funds in which it invests. Such indirect expenses are not included in the reported expense ratios.
(c) Annualized.
(d) Total net expenses include the impact of certain waivers/reimbursements made by the Investment Manager and certain of its affiliates, if applicable.
The accompanying Notes to Financial Statements are an integral part of this statement.
Annual Report 2013
23
Columbia Mid Cap Index Fund
Financial Highlights (continued)
| | | Year Ended
February 28, | | Year Ended
February 29, | | Year Ended February 28, | |
Class Z | | 2013 | | 2012 | | 2011 | | 2010 | | 2009 | |
Per share data | |
Net asset value, beginning of period | | $ | 11.88 | | | $ | 12.29 | | | $ | 9.41 | | | $ | 5.71 | | | $ | 10.84 | | |
Income from investment operations: | |
Net investment income | | | 0.16 | | | | 0.12 | | | | 0.11 | | | | 0.11 | | | | 0.15 | | |
Net realized and unrealized gain (loss) | | | 1.45 | | | | 0.11 | | | | 2.93 | | | | 3.69 | | | | (4.55 | ) | |
Total from investment operations | | | 1.61 | | | | 0.23 | | | | 3.04 | | | | 3.80 | | | | (4.40 | ) | |
Less distributions to shareholders: | |
Net investment income | | | (0.17 | ) | | | (0.12 | ) | | | (0.11 | ) | | | (0.10 | ) | | | (0.17 | ) | |
Net realized gains | | | (0.54 | ) | | | (0.52 | ) | | | (0.05 | ) | | | — | | | | (0.56 | ) | |
Total distributions to shareholders | | | (0.71 | ) | | | (0.64 | ) | | | (0.16 | ) | | | (0.10 | ) | | | (0.73 | ) | |
Net asset value, end of period | | $ | 12.78 | | | $ | 11.88 | | | $ | 12.29 | | | $ | 9.41 | | | $ | 5.71 | | |
Total return | | | 14.35 | % | | | 2.39 | % | | | 32.45 | % | | | 66.71 | % | | | (41.92 | %) | |
Ratios to average net assets(a)(b) | |
Total gross expenses | | | 0.41 | % | | | 0.41 | % | | | 0.25 | % | | | 0.24 | % | | | 0.24 | %(c) | |
Total net expenses(d) | | | 0.20 | %(e) | | | 0.20 | %(e) | | | 0.20 | %(e) | | | 0.18 | %(e) | | | 0.14 | %(c)(e) | |
Net investment income | | | 1.39 | % | | | 1.07 | % | | | 1.08 | % | | | 1.36 | % | | | 1.59 | % | |
Supplemental data | |
Net assets, end of period (in thousands) | | $ | 2,014,694 | | | $ | 2,517,203 | | | $ | 2,479,455 | | | $ | 1,791,140 | | | $ | 971,538 | | |
Portfolio turnover | | | 20 | % | | | 15 | % | | | 10 | % | | | 15 | % | | | 28 | % | |
Notes to Financial Highlights
(a) In addition to the fees and expenses which the Fund bears directly, the Fund indirectly bears a pro rata share of the fees and expenses of the acquired funds in which it invests. Such indirect expenses are not included in the reported expense ratios.
(b) Certain line items from prior years have been reclassified to conform to the current presentation.
(c) Ratios include line of credit interest expense which rounds to less than 0.01%.
(d) Total net expenses include the impact of certain waivers/reimbursements made by the Investment Manager and certain of its affiliates, if applicable.
(e) The benefits derived from expense reductions had an impact of less than 0.01%.
The accompanying Notes to Financial Statements are an integral part of this statement.
Annual Report 2013
24
Columbia Mid Cap Index Fund
Notes to Financial Statements
February 28, 2013
Note 1. Organization
Columbia Mid Cap Index Fund (the Fund), a series of Columbia Funds Series Trust (the Trust), is a diversified fund. The Trust is registered under the Investment Company Act of 1940, as amended (the 1940 Act), as an open-end management investment company organized as a Delaware statutory trust.
Fund Shares
The Trust may issue an unlimited number of shares (without par value). The Fund offers Class A, Class I, Class R5 and Class Z shares. All share classes have identical voting, dividend and liquidation rights. Each share class has its own expense structure and sales charges, as applicable.
Class A shares have no sales charge.
Class I shares are not subject to sales charges and are only available to the Columbia Family of Funds.
Class R5 shares are not subject to sales charges and are only available to investors purchasing through authorized investment professionals. Class R5 shares commenced operations on November 8, 2012.
Class Z shares are not subject to sales charges, and are only available to certain investors.
Note 2. Summary of Significant Accounting Policies
Use of Estimates
The preparation of financial statements in accordance with U.S. generally accepted accounting principles (GAAP) requires management to make certain estimates and assumptions that affect the reported amounts of assets and liabilities, the disclosure of contingent assets and liabilities at the date of the financial statements and the reported amounts of revenue and expenses during the reporting period. Actual results could differ from those estimates.
The following is a summary of significant accounting policies consistently followed by the Fund in the preparation of its financial statements.
Security Valuation
All equity securities are valued at the close of business of the New York Stock Exchange (NYSE). Equity securities are valued at the last quoted sales price on the principal exchange or market on which they trade, except for securities traded on the NASDAQ Stock Market, which are valued at the NASDAQ official close price. Unlisted securities or listed securities for which there were no sales during the day are valued at the mean of the latest quoted bid and ask prices on such exchanges or markets.
Foreign securities are valued based on quotations from the principal market in which such securities are normally traded. If any foreign share prices are not readily available as a result of limited share activity the securities are valued at the mean of the latest quoted bid and ask prices on such exchanges or markets. Foreign currency exchange rates are generally determined at 4:00 p.m. Eastern (U.S.) time. However, many securities markets and exchanges outside the U.S. close prior to the close of the NYSE; therefore, the closing prices for securities in such markets or on such exchanges may not fully reflect events that occur after such close but before the close of the NYSE. In those situations, foreign securities will be fair valued pursuant to the policy adopted by the Board of Trustees (the Board), including utilizing a third party pricing service to determine these fair values. The third party pricing service takes into account multiple factors, including, but not limited to, movements in the U.S. securities markets, certain depositary receipts, futures contracts and foreign exchange rates that have occurred subsequent to the close of the foreign exchange or market, to determine a good faith estimate that reasonably reflects the current market conditions as of the close of the NYSE. The fair value of a security is likely to be different from the quoted or published price, if available.
Investments in other open-end investment companies, including money market funds, are valued at net asset value.
Futures and options on futures contracts are valued based upon the settlement price established each day by the board of trade or exchange on which they are traded.
Investments for which market quotations are not readily available, or that have quotations which management believes are not reliable, are valued at fair value as determined in good faith under consistently applied procedures established by and under the general supervision of the Board. If a security or class of securities (such as foreign securities) is valued at fair value, such value is likely to be different from the last quoted market price for the security.
The determination of fair value often requires significant judgment. To determine fair value, management may use assumptions including but not limited to future cash flows and estimated risk premiums. Multiple inputs from various sources may be used to determine fair value.
Derivative Instruments
The Fund invests in certain derivative instruments, as detailed below, to meet its investment objectives. Derivatives are instruments whose values depend on, or are derived from, in whole or in part, the value of one or more other assets, such as securities, currencies, commodities or indices. Derivative instruments may be used to maintain cash reserves while maintaining exposure to certain other assets, to offset
Annual Report 2013
25
Columbia Mid Cap Index Fund
Notes to Financial Statements (continued)
February 28, 2013
anticipated declines in values of investments, to facilitate trading, to reduce transaction costs and to pursue higher investment returns. The Fund may also use derivative instruments to mitigate certain investment risks, such as foreign currency exchange rate risk, interest rate risk and credit risk. Derivatives may involve various risks, including the potential inability of the counterparty to fulfill its obligation under the terms of the contract, the potential for an illiquid secondary market and the potential for market movements which may expose the Fund to gains or losses in excess of the amount shown in the Statement of Assets and Liabilities.
The Fund and any counterparty are required to maintain an agreement that requires the Fund and that counterparty to monitor (on a daily basis) the net fair value of all derivatives entered into pursuant to the agreement between the Fund and such counterparty. If the net fair value of such derivatives between the Fund and that counterparty exceeds a certain threshold (as defined in the agreement), the Fund or the counterparty (as the case may be) is required to post cash and/or securities as collateral. Fair values of derivatives presented in the financial statements are not netted with the fair value of other derivatives or with any collateral amounts posted by the Fund or any counterparty.
Futures Contracts
Futures contracts represent commitments for the future purchase or sale of an asset at a specified price on a specified date. The Fund bought and sold futures contracts to maintain appropriate equity market exposure while keeping sufficient cash to accommodate daily redemptions. Upon entering into futures contracts, the Fund bears risks which may include interest rates, exchange rates or securities prices moving unexpectedly, in which case, the Fund may not achieve the anticipated benefits of the futures contracts and may realize a loss. Additional risks include counterparty credit risk, the possibility of an illiquid market, and that a change in the value of the contract or option may not correlate with changes in the value of the underlying asset.
Upon entering into a futures contract, the Fund pledges cash or securities with the broker in an amount sufficient to meet the initial margin requirement. Subsequent payments (variation margin) are made or received by the Fund each day. The variation margin payments are equal to the daily change in the contract value and are recorded as variation margin receivable or payable and are offset in unrealized gains or losses. The Fund recognizes a realized gain or loss when the contract is closed or expires. Futures contracts involve, to varying degrees, risk of loss in excess of the variation margin disclosed in the Statement of Assets and Liabilities.
Effects of Derivative Transactions in the Financial Statements
The following tables are intended to provide additional information about the effect of derivatives on the financial statements of the Fund, including: the fair value of derivatives by risk category and the location of those fair values in the Statement of Assets and Liabilities; the impact of derivative transactions on the Fund's operations over the period including realized gains or losses and unrealized gains or losses. The derivative schedules following the Portfolio of Investments present additional information regarding derivative instruments outstanding at the end of the period, if any.
The following table is a summary of the fair value of derivative instruments at February 28, 2013:
| | Asset Derivatives | |
| Risk Exposure Category | | Statement of
Assets and
Liabilities Location | | Fair Value ($) | |
Equity contracts Net assets —
unrealized appreciation | |
on futures contracts | | | 5,175,131 | * | |
*Includes cumulative appreciation (depreciation) of futures contracts as reported in the Futures Contracts Outstanding table following the Portfolio of Investments. Only the current day's variation margin is reported in receivables or payables in the Statement of Assets and Liabilities.
The effect of derivative instruments in the Statement of Operations for the year ended February 28, 2013:
Amount of Realized Gain (Loss) on Derivatives | |
Risk Exposure Category | | Futures Contracts ($) | |
Equity contracts | | | 9,441,527 | | |
Change in Unrealized Appreciation (Depreciation) on Derivatives Recognized in Income | |
Risk Exposure Category | | Futures Contracts ($) | |
Equity contracts | | | (946,938 | ) | |
The following table is a summary of the volume of derivative instruments for the year ended February 28, 2013:
Derivative Instrument | | Contracts Opened | |
Futures contracts | | | 10,226 | | |
Security Transactions
Security transactions are accounted for on the trade date. Cost is determined and gains (losses) are based upon the specific identification method for both financial statement and federal income tax purposes.
Income Recognition
Corporate actions and dividend income are recorded net of any non-reclaimable tax withholdings, on the ex-dividend date or upon receipt of ex-dividend notification in the case of certain foreign securities.
Annual Report 2013
26
Columbia Mid Cap Index Fund
Notes to Financial Statements (continued)
February 28, 2013
The Fund may receive distributions from holdings in business development companies (BDCs), exchange traded funds (ETFs) and real estate investment trusts (REITs), which report information on the character of their distributions annually. These distributions are allocated to dividend income, capital gain and return of capital based on estimates made by the Fund's management if actual information has not yet been reported. Return of capital is recorded as a reduction of the cost basis of securities held. If the Fund no longer owns the applicable securities, return of capital is recorded as a realized gain. Management's estimates are subsequently adjusted when the actual character of the distributions is disclosed by the BDCs, ETFs and REITs, which could result in a proportionate change in return of capital to shareholders.
Awards from class action litigation are recorded as a reduction of cost basis if the Fund still owns the applicable securities on the payment date. If the Fund no longer owns the applicable securities, the proceeds are recorded as realized gains.
Expenses
General expenses of the Trust are allocated to the Fund and other funds of the Trust based upon relative net assets or other expense allocation methodologies determined by the nature of the expense. Expenses directly attributable to the Fund are charged to the Fund. Expenses directly attributable to a specific class of shares are charged to that share class.
Determination of Class Net Asset Value
All income, expenses (other than class-specific expenses, which are charged to that share class, as shown in the Statement of Operations) and realized and unrealized gains (losses) are allocated to each class of the Fund on a daily basis, based on the relative net assets of each class, for purposes of determining the net asset value of each class.
Federal Income Tax Status
The Fund intends to qualify each year as a regulated investment company under Subchapter M of the Internal Revenue Code, as amended, and will distribute substantially all of its tax exempt and taxable income (including net short-term capital gains), if any, for its tax year, and as such will not be subject to federal income taxes. In addition, the Fund intends to distribute in each calendar year substantially all of its net investment income, capital gains and certain other amounts, if any, such that the Fund should not be subject to federal excise tax. Therefore, no federal income or excise tax provision is recorded.
Distributions to Shareholders
Distributions from net investment income, if any, are declared and paid semi-annually. Net realized capital gains, if any, are distributed at least annually. Income distributions and capital
gain distributions are determined in accordance with federal income tax regulations, which may differ from GAAP.
Guarantees and Indemnifications
Under the Trust's organizational documents and, in some cases, by contract, its officers and trustees are indemnified against certain liabilities arising out of the performance of their duties to the Trust or its funds. In addition, certain of the Fund's contracts with its service providers contain general indemnification clauses. The Fund's maximum exposure under these arrangements is unknown since the amount of any future claims that may be made against the Fund cannot be determined, and the Fund has no historical basis for predicting the likelihood of any such claims.
Recent Accounting Pronouncement
Disclosures about Offsetting Assets and Liabilities
In December 2011, the Financial Accounting Standards Board (FASB) issued Accounting Standards Update (ASU) No. 2011-11, Disclosures about Offsetting Assets and Liabilities. The objective of the FASB is to enhance current disclosure requirements on offsetting of certain assets and liabilities and to enable financial statement users to compare financial statements prepared under GAAP and International Financial Reporting Standards.
Specifically, ASU No. 2011-11 requires an entity to disclose both gross and net information for derivatives and other financial instruments that are subject to a master netting arrangement or similar agreement. The standard requires disclosure of collateral received in connection with the master netting agreements or similar agreements. The effective date of ASU No. 2011-11 is for interim and annual periods beginning on or after January 1, 2013. At this time, management is evaluating the implications of this guidance and the impact it will have on the financial statement amounts and footnote disclosures, if any.
Note 3. Fees and Compensation Paid to Affiliates
Investment Management Fees
Under an Investment Management Services Agreement, Columbia Management Investment Advisers, LLC (the Investment Manager), a wholly-owned subsidiary of Ameriprise Financial, Inc. (Ameriprise Financial), determines which securities will be purchased, held or sold. The investment management fee is an annual fee that is equal to 0.10% of the Fund's average daily net assets.
Annual Report 2013
27
Columbia Mid Cap Index Fund
Notes to Financial Statements (continued)
February 28, 2013
Administration Fees
Under an Administrative Services Agreement, the Investment Manager also serves as the Fund Administrator. The Fund pays the Fund Administrator an annual fee for administration and accounting services equal to 0.10% of the Fund's average daily net assets.
Other Expenses
Other expenses are for, among other things, certain expenses of the Fund or the Board, including: Fund boardroom and office expense, employee compensation, employee health and retirement benefits, and certain other expenses. Payment of these Fund and Board expenses is facilitated by a company providing limited administrative services to the Fund and the Board. For the year ended February 28, 2013, other expenses paid to this company were $7,570.
Compensation of Board Members
Board members are compensated for their services to the Fund as disclosed in the Statement of Operations. Under a Deferred Compensation Plan (the Plan), the Board members who are not "interested persons" of the Fund, as defined under the 1940 Act, may elect to defer payment of up to 100% of their compensation. Deferred amounts are treated as though equivalent dollar amounts had been invested in shares of certain funds managed by the Investment Manager. The Fund's liability for these amounts is adjusted for market value changes and remains in the Fund until distributed in accordance with the Plan.
Transfer Agent Fees
Under a Transfer and Dividend Disbursing Agent Agreement, Columbia Management Investment Services Corp. (the Transfer Agent), an affiliate of the Investment Manager and a wholly-owned subsidiary of Ameriprise Financial, is responsible for providing transfer agency services to the Fund. The Transfer Agent has contracted with Boston Financial Data Services (BFDS) to serve as sub-transfer agent.
The Transfer Agent receives monthly account-based service fees based on the number of open accounts and is reimbursed by the Fund for the fees and expenses the Transfer Agent pays to financial intermediaries that maintain omnibus accounts with the Fund that is a percentage of the average aggregate value of the Fund's shares maintained in each such omnibus account (other than omnibus accounts for which American Enterprise Investment Services Inc. is the broker of record or accounts where the beneficial shareholder is a customer of Ameriprise Financial Services, Inc., which are paid a per account fee). The Transfer Agent pays the fees of BFDS for services as sub-transfer agent and is not entitled to
reimbursement for such fees from the Fund (with the exception of out-of-pocket fees).
The Transfer Agent also receives compensation from fees for various shareholder services and reimbursements for certain out-of-pocket fees. Class I shares do not pay transfer agent fees. Total transfer agent fees for Class R5 shares are subject to an annual limitation of not more than 0.05% of the average daily net assets attributable to Class R5 shares.
For the year ended February 28, 2013, the Fund's effective transfer agent fee rates as a percentage of average daily net assets of each class were as follows:
Class A | | | 0.19 | % | |
Class R5* | | | 0.05 | | |
Class Z | | | 0.18 | | |
*Annualized
An annual minimum account balance fee of $20 may apply to certain accounts with a value below the Fund's initial minimum investment requirements to reduce the impact of small accounts on transfer agent fees. These minimum account balance fees are recorded as part of expense reductions in the Statement of Operations. For the year ended February 28, 2013, these minimum account balance fees reduced total expenses by $180.
Distribution and Service Fees
The Fund has an agreement with Columbia Management Investment Distributors, Inc. (the Distributor), an affiliate of the Investment Manager and a wholly-owned subsidiary of Ameriprise Financial, for distribution and shareholder services. Pursuant to Rule 12b-1 under the 1940 Act, the Board has approved, and the Fund has adopted, distribution and shareholder service plans (the Plans) which set the distribution and service fees for the Fund. These fees are calculated daily and are intended to compensate the Distributor and/or eligible selling and/or servicing agents for selling shares of the Fund and providing services to investors.
The Plans require the payment of a monthly combined distribution and service fee to the Distributor at the maximum annual rate of 0.25% of the average daily net assets attributable to Class A shares of the Fund.
Expenses Waived/Reimbursed by the Investment Manager and its Affiliates
Effective July 1, 2012, the Investment Manager and certain of its affiliates have contractually agreed to waive fees and/or reimburse expenses (excluding certain fees and expenses described below), through June 30, 2013, unless sooner terminated at the sole discretion of the Board, so that the Fund's net operating expenses, after giving effect to fees
Annual Report 2013
28
Columbia Mid Cap Index Fund
Notes to Financial Statements (continued)
February 28, 2013
waived/expenses reimbursed and any balance credits and/or overdraft charges from the Fund's custodian, do not exceed the following annual rates as a percentage of the class' average daily net assets:
Class A | | | 0.45 | % | |
Class I* | | | 0.20 | | |
Class R5* | | | 0.20 | | |
Class Z | | | 0.20 | | |
*For Class I and Class R5, the annual rate is contractual from November 16, 2012 through November 15, 2013. Prior to November 16, 2012, the annual rates for Class I and Class R5 shares were 0.07% and 0.12%, respectively.
Prior to July 1, 2012, the Investment Manager and certain of its affiliates contractually agreed to waive fees and/or reimburse expenses (excluding certain fees and expenses described below), so that the Fund's net operating expenses, after giving effect to fees waived/expenses reimbursed and any balance credits and/or overdraft charges from the Fund's custodian, did not exceed the following annual rates as a percentage of the class' average daily net assets:
Class A | | | 0.45 | % | |
Class I | | | 0.19 | | |
Class Z | | | 0.20 | | |
Under the agreement governing these fee waivers and/or expense reimbursement arrangements, the following fees and expenses are excluded from the waiver/reimbursement commitment, and therefore will be paid by the Fund, if applicable: taxes (including foreign transaction taxes), expenses associated with investments in affiliated and non-affiliated pooled investment vehicles (including mutual funds and exchange traded funds), transaction costs and brokerage commissions, costs related to any securities lending program, dividend expenses associated with securities sold short, inverse floater program fees and expenses, transaction charges and interest on borrowed money, interest, extraordinary expenses and any other expenses the exclusion of which is specifically approved by the Board. This agreement may be modified or amended only with approval from all parties.
Note 4. Federal Tax Information
The timing and character of income and capital gain distributions are determined in accordance with income tax regulations, which may differ from GAAP because of temporary or permanent book to tax differences.
At February 28, 2013, these differences are primarily due to differing treatment for deferral/reversal of wash sale losses, Trustees' deferred compensation, reversal of capital gains (losses) on a redemption-in-kind, derivative investments and earnings and profits distributed to shareholders on the redemption of shares. To the extent these differences are
permanent, reclassifications are made among the components of the Fund's net assets in the Statement of Assets and Liabilities. Temporary differences do not require reclassifications. In the Statement of Assets and Liabilities the following reclassifications were made:
Undistributed net investment income | | $ | (209,729 | ) | |
Accumulated net realized gain | | | 39,885,818 | | |
Paid-in capital | | | (39,676,089 | ) | |
Net investment income and net realized gains (losses), as disclosed in the Statement of Operations, and net assets were not affected by this reclassification.
The tax character of distributions paid during the years indicated was as follows:
Year Ended | | February 28,
2013 | | February 29,
2012 | |
Ordinary income | | $ | 33,428,068 | | | $ | 36,747,997 | | |
Long-term capital gains | | | 101,396,755 | | | | 115,909,747 | | |
Total | | $ | 134,824,823 | | | $ | 152,657,744 | | |
Short-term capital gain distributions, if any, are considered ordinary income distributions for tax purposes.
At February 28, 2013, the components of distributable earnings on a tax basis were as follows:
Undistributed ordinary income | | $ | 6,577,472 | | |
Undistributed accumulated long-term capital gains | | | 22,010,913 | | |
Unrealized appreciation | | | 770,981,971 | | |
At February 28, 2013, the cost of investments for federal income tax purposes was $1,867,787,386 and the aggregate gross unrealized appreciation and depreciation based on that cost was:
Unrealized appreciation | | $ | 875,843,489 | | |
Unrealized depreciation | | | (104,861,518 | ) | |
Net unrealized appreciation | | $ | 770,981,971 | | |
Management of the Fund has concluded that there are no significant uncertain tax positions that would require recognition in the financial statements. However, management's conclusion may be subject to review and adjustment at a later date based on factors including, but not limited to, new tax laws, regulations, and administrative interpretations (including relevant court decisions). Generally, the Fund's federal tax returns for the prior three fiscal years remain subject to examination by the Internal Revenue Service.
Note 5. Portfolio Information
The cost of purchases and proceeds from sales of securities, excluding short-term obligations, aggregated to $477,868,010 and $1,087,238,604, respectively, for the year ended February 28, 2013.
Annual Report 2013
29
Columbia Mid Cap Index Fund
Notes to Financial Statements (continued)
February 28, 2013
Note 6. Redemption-in-Kind
Sales of securities for the Fund include the value of securities delivered through an in-kind redemption of certain fund shares. During the year ended February 28, 2013, securities and other assets with a value of $795,950,754 were distributed to shareholders to satisfy their redemption requests. The net realized loss on these securities was $42,544,559, which is not deductible by the Fund.
Note 7. Lending of Portfolio Securities
Effective December 19, 2012, the Fund no longer participates in securities lending activity. Prior to that date, the Fund participated, or was eligible to participate, in securities lending activity pursuant to a Master Securities Lending Agreement (the Agreement) with JPMorgan Chase Bank, N.A. (JPMorgan). The Agreement authorized JPMorgan as lending agent to lend securities to authorized borrowers in order to generate additional income on behalf of the Fund. Pursuant to the Agreement, the securities loaned were secured by cash or securities that either were issued or guaranteed as to principal and interest by the U.S. government, its agencies, authorities or instrumentalities with value equal to at least 100% of the market value of the loaned securities. Any additional collateral required to maintain those levels due to market fluctuations of the loaned securities was requested to be delivered the following business day. Cash collateral received was invested by the lending agent on behalf of the Fund into authorized investments pursuant to the Agreement.
Pursuant to the Agreement, the Fund received income for lending its securities either in the form of fees or by earning interest on invested cash collateral, net of negotiated rebates paid to borrowers and fees paid to the lending agent for services provided and any other securities lending expenses. Net income earned from securities lending for the year ended February 28, 2013 is disclosed in the Statement of Operations. The Fund continued to earn and accrue interest and dividends on the securities loaned.
Note 8. Affiliated Money Market Fund
The Fund invests its daily cash balances in Columbia Short-Term Cash Fund, an affiliated money market fund established for the exclusive use by the Fund and other affiliated funds. The income earned by the Fund from such investments is included as "Dividends — affiliated issuers" in the Statement of Operations. As an investing fund, the Fund indirectly bears its proportionate share of the expenses of Columbia Short-Term Cash Fund.
Note 9. Shareholder Concentration
At February 28, 2013, two unaffiliated shareholder accounts owned an aggregate of 37.6% of the outstanding shares of the
Fund. The Fund has no knowledge about whether any portion of those shares was owned beneficially by such accounts. Subscription and redemption activity by concentrated accounts may have a significant effect on the operations of the Fund.
Note 10. Line of Credit
The Fund has entered into a revolving credit facility with a syndicate of banks led by JPMorgan whereby the Fund may borrow for the temporary funding of shareholder redemptions or for other temporary or emergency purposes. The credit facility agreement, as amended, which is a collective agreement between the Fund and certain other funds managed by the Investment Manager, severally and not jointly, permits collective borrowings up to $500 million. Interest is charged to each participating fund based on its borrowings at a rate equal to the higher of (i) the overnight federal funds rate plus 1.00% or (ii) the one-month LIBOR rate plus 1.00%. Each borrowing under the credit facility matures no later than 60 days after the date of borrowing. The Fund also pays a commitment fee equal to its pro rata share of the amount of the credit facility at a rate of 0.08% per annum.
The Fund had no borrowings during the year ended February 28, 2013.
Note 11. Subsequent Events
Management has evaluated the events and transactions that have occurred through the date the financial statements were issued and noted no items requiring adjustment of the financial statements or additional disclosure.
Note 12. Information Regarding Pending and Settled Legal Proceedings
In December 2005, without admitting or denying the allegations, American Express Financial Corporation (AEFC, which is now known as Ameriprise Financial, Inc. (Ameriprise Financial)) entered into settlement agreements with the Securities and Exchange Commission (SEC) and Minnesota Department of Commerce (MDOC) related to market timing activities. As a result, AEFC was censured and ordered to cease and desist from committing or causing any violations of certain provisions of the Investment Advisers Act of 1940, the Investment Company Act of 1940, and various Minnesota laws. AEFC agreed to pay disgorgement of $10 million and civil money penalties of $7 million. AEFC also agreed to retain an independent distribution consultant to assist in developing a plan for distribution of all disgorgement and civil penalties ordered by the SEC in accordance with various undertakings detailed at www.sec.gov/litigation/admin/ia-2451.pdf. Ameriprise Financial and its affiliates have cooperated with the SEC and the MDOC in these legal proceedings, and have made regular reports to the funds' Boards of Trustees.
Annual Report 2013
30
Columbia Mid Cap Index Fund
Notes to Financial Statements (continued)
February 28, 2013
Ameriprise Financial and certain of its affiliates have historically been involved in a number of legal, arbitration and regulatory proceedings, including routine litigation, class actions, and governmental actions, concerning matters arising in connection with the conduct of their business activities. Ameriprise Financial believes that the Funds are not currently the subject of, and that neither Ameriprise Financial nor any of its affiliates are the subject of, any pending legal, arbitration or regulatory proceedings that are likely to have a material adverse effect on the Funds or the ability of Ameriprise Financial or its affiliates to perform under their contracts with the Funds. Ameriprise Financial is required to make 10-Q, 10-K and, as necessary, 8-K filings with the Securities and Exchange Commission on legal and regulatory matters that relate to Ameriprise Financial and its affiliates. Copies of these filings may be obtained by accessing the SEC website at www.sec.gov.
There can be no assurance that these matters, or the adverse publicity associated with them, will not result in increased fund redemptions, reduced sale of fund shares or other adverse consequences to the Funds. Further, although we believe proceedings are not likely to have a material adverse effect on the Funds or the ability of Ameriprise Financial or its affiliates to perform under their contracts with the Funds, these proceedings are subject to uncertainties and, as such, we are unable to estimate the possible loss or range of loss that may result. An adverse outcome in one or more of these proceedings could result in adverse judgments, settlements, fines, penalties or other relief that could have a material adverse effect on the consolidated financial condition or results of operations of Ameriprise Financial.
Annual Report 2013
31
Columbia Mid Cap Index Fund
Report of Independent Registered Public Accounting Firm
To the Trustees of Columbia Funds Series Trust and
the Shareholders of Columbia Mid Cap Index Fund
In our opinion, the accompanying statement of assets and liabilities, including the portfolio of investments, and the related statements of operations and of changes in net assets and the financial highlights present fairly, in all material respects, the financial position of Columbia Mid Cap Index Fund (the "Fund") (a series of Columbia Funds Series Trust) at February 28, 2013, the results of its operations for the year then ended, the changes in its net assets for each of the two years in the period then ended and the financial highlights for each of the periods indicated, in conformity with accounting principles generally accepted in the United States of America. These financial statements and financial highlights (hereafter referred to as "financial statements") are the responsibility of the Fund's management. Our responsibility is to express an opinion on these financial statements based on our audits. We conducted our audits of these financial statements in accordance with the standards of the Public Company Accounting Oversight Board (United States). Those standards require that we plan and perform the audit to obtain reasonable assurance about whether the financial statements are free of material misstatement. An audit includes examining, on a test basis, evidence supporting the amounts and disclosures in the financial statements, assessing the accounting principles used and significant estimates made by management, and evaluating the overall financial statement presentation. We believe that our audits, which included confirmation of securities at February 28, 2013 by correspondence with the custodian, transfer agent and brokers, provide a reasonable basis for our opinion.
PricewaterhouseCoopers LLP
Minneapolis, Minnesota
April 19, 2013
Annual Report 2013
32
Columbia Mid Cap Index Fund
Federal Income Tax Information
(Unaudited)
The Fund hereby designates the following tax attributes for the fiscal year ended February 28, 2013. Shareholders will be notified in early 2014 of the amounts for use in preparing 2013 income tax returns.
Tax Designations:
| Qualified Dividend Income | | | 80.91 | % | |
| Dividends Received Deduction | | | 81.04 | % | |
Capital Gain Dividend | | $ | 93,562,898 | | |
Qualified Dividend Income. For taxable, non-corporate shareholders, the percentage of ordinary income dividends paid during the fiscal year that represents qualified dividend income subject to reduced tax rates under the Jobs and Growth Tax Relief Reconciliation Act of 2003.
Dividends Received Deduction. The percentage of ordinary income dividends paid during the fiscal year that qualifies for the corporate dividends received deduction.
Capital Gain Dividend. The Fund designates as a capital gain dividend the amount reflected above, or if subsequently determined to be different, the net capital gain of such fiscal period. The Fund also designates as capital gain dividends, to the extent necessary to fully distribute such capital gains, earnings and profits distributed to shareholders on the redemption of shares.
Annual Report 2013
33
Columbia Mid Cap Index Fund
Shareholders elect the Board that oversees the funds' operations. The Board appoints officers who are responsible for day-to-day business decisions based on policies set by the Board. The following table provides basic biographical information about the funds' Board members, including their principal occupations during the past five years, although specific titles for individuals may have varied over the period. Under current Board policy, members may serve until the next Board meeting after he or she reaches the mandatory retirement age established by the Board, or the fifteenth anniversary of the first Board meeting they attended as a member of the Board.
Mr. Edward J. Boudreau, Jr., Mr. William P. Carmichael, Mr. William A. Hawkins, Mr. R. Glenn Hilliard, Ms. Minor M. Shaw and Dr. Anthony M. Santomero, were members of the Legacy Columbia Nations funds' Board ("Nations Funds"), which includes Columbia Funds Series Trust, Columbia Funds Variable Insurance Trust I and Columbia Funds Master Investment Trust, LLC and began service on the Board for the Legacy RiverSource funds ("RiverSource Funds") effective June 1, 2011.
Independent Trustees
Name,
Address,
Year of Birth | | Position Held With
Funds and Length of
Service | | Principal Occupation
During Past Five Years | | Number of
Funds in the
Fund Family
Overseen by
Board Member | | Other Present or Past
Directorships/Trusteeships
(Within Past 5 Years) | |
Kathleen Blatz
901 S. Marquette Ave.
Minneapolis, MN 55402
1954 | | Board member since 1/06 for RiverSource Funds and since 6/11 for Nations Funds | | Attorney; Chief Justice, Minnesota Supreme Court, 1998-2006 | | | 153 | | | Director, BlueCross BlueShield of Minnesota since 2009 | |
Edward J. Boudreau, Jr.
901 S. Marquette Ave.
Minneapolis, MN 55402
1944 | | Board member since 6/11 for RiverSource Funds and since 1/05 for Nations Funds | | Managing Director, E.J. Boudreau & Associates (consulting) since 2000 | | | 151 | | | Former Trustee, BofA Funds Series Trust (11 funds) | |
Pamela G. Carlton
901 S. Marquette Ave.
Minneapolis, MN 55402
1954 | | Board member since 7/07 for RiverSource Funds and since 6/11 for Nations Funds | | President, Springboard — Partners in Cross Cultural Leadership (consulting company) since 2003 | | | 153 | | | None | |
William P. Carmichael
901 S. Marquette Ave.
Minneapolis, MN 55402
1943 | | Board member since 6/11 for RiverSource Funds and since 1999 for Nations Funds | | Retired | | | 151 | | | Director, Cobra Electronics Corporation (electronic equipment manufacturer); The Finish Line (athletic shoes and apparel) since July 2003; McMoRan Exploration Company (oil and gas exploration and development) since 2010; former Trustee, BofA Funds Series Trust (11 funds); former Director, Spectrum Brands, Inc. (consumer products); former Director, Simmons Company (bedding) | |
Patricia M. Flynn
901 S. Marquette Ave.
Minneapolis, MN 55402
1950 | | Board member since 11/04 for RiverSource Funds and since 6/11 for Nations Funds | | Trustee Professor of Economics and Management, Bentley University since 1976 | | | 153 | | | None | |
William A. Hawkins
901 S. Marquette Ave.
Minneapolis, MN 55402
1942 | | Board member since 6/11 for RiverSource Funds and since 1/05 for Nations Funds | | Managing Director, Overton Partners (financial consulting), since August 2010; President and Chief Executive Officer, California General Bank, N.A., January 2008-August 2010 | | | 151 | | | Trustee, BofA Funds Series Trust (11 funds) | |
Annual Report 2013
34
Columbia Mid Cap Index Fund
Trustees and Officers (continued)
Independent Trustees (continued)
Name,
Address,
Year of Birth | | Position Held With
Funds and Length of
Service | | Principal Occupation
During Past Five Years | | Number of
Funds in the
Fund Family
Overseen by
Board Member | | Other Present or Past
Directorships/Trusteeships
(Within Past 5 Years) | |
R. Glenn Hilliard
901 S. Marquette Ave.
Minneapolis, MN 55402
1943 | | Board member since 6/11 for RiverSource Funds and since 1/05 for Nations Funds | | Chairman and Chief Executive Officer, Hilliard Group LLC (investing and consulting), since April 2003; Non-Executive Director & Chairman, CNO Financial Group, Inc. (insurance), September 2003-May 2011 | | | 151 | | | Chairman, BofA Fund Series Trust (11 funds); former Director, CNO Financial Group, Inc. (insurance) | |
Stephen R. Lewis, Jr.
901 S. Marquette Ave.
Minneapolis, MN 55402
1939 | | Chair of the Board for RiverSource Funds since 1/07, Board member for RiverSource Funds since 1/02 and since 6/11 for Nations Funds | | President Emeritus and Professor of Economics Emeritus, Carleton College since 2002 | | | 153 | | | Director, Valmont Industries, Inc. (manufacturer of irrigation systems) since 2002 | |
Catherine James Paglia
901 S. Marquette Ave.
Minneapolis, MN 55402
1952 | | Board member since 11/04 for RiverSource Funds and since 6/11 for Nations Funds | | Director, Enterprise Asset Management, Inc. (private real estate and asset management company) | | | 153 | | | Director, Valmont Industries, Inc. (manufacturer of irrigation systems) since 2012 | |
Leroy C. Richie
901 S. Marquette Ave.
Minneapolis, MN 55402
1941 | | Board member since 2000 for Legacy Seligman Funds, since 11/08 for RiverSource Funds and since 6/11 for Nations Funds | | Counsel, Lewis & Munday, P.C. (law firm) since 2004; former Vice President and General Counsel, Automotive Legal Affairs, Chrysler Corporation from 1983-1987 | | | 153 | | | Lead Outside Director, Digital Ally, Inc. (digital imaging) since September 2005; Director, Infinity, Inc. (oil and gas exploration and production) since 1994; Director, OGE Energy Corp. (energy and energy services) since November 2007 | |
Minor M. Shaw
901 S. Marquette Ave.
Minneapolis, MN 55402
1947 | | Board member since 6/11 for RiverSource Funds and since 2003 for Nations Funds | | President, Micco LLC (private investments) since 2011; President Micco Corp. since 1998 | | | 151 | | | Director, Piedmont Natural Gas; Director, BlueCross BlueShield of South Carolina since April 2008; Former Trustee, BofA Funds Series Trust (11 funds) | |
Alison Taunton-Rigby
901 S. Marquette Ave.
Minneapolis, MN 55402
1944 | | Board member since 11/02 for RiverSource Funds and since 6/11 for Nations Funds | | Chief Executive Officer and Director, RiboNovix, Inc., (biotechnology), 2003-2010 | | | 153 | | | Director, Healthways, Inc. (health and well-being improvement) since 2005; Director, ICI Mutual Insurance Company, RRG since 2011; Director, Abt Associates (government contractor) since 2001; Director, Boston Children's Hospital since 2002 | |
Annual Report 2013
35
Columbia Mid Cap Index Fund
Trustees and Officers (continued)
Interested Trustee Not Affiliated With Investment Manager*
Name,
Address,
Year of Birth | | Position Held With
Funds and Length of
Service | | Principal Occupation
During Past Five Years | | Number of
Funds in the
Fund Family
Overseen by
Board Member | | Other Present or Past
Directorships/Trusteeships
(Within Past 5 Years) | |
Anthony M. Santomero
901 S. Marquette Ave.
Minneapolis, MN 55402
1946 | | Board member since 6/11 for RiverSource Funds and since 1/08 for Nations Funds | | Richard K. Mellon Professor Emeritus of Finance, The Wharton School, University of Pennsylvania, since 2002; Senior Advisor, McKinsey & Company (consulting), 2006-2008 | | | 151 | | | Director, Renaissance Reinsurance Ltd. since May 2008; Trustee, Penn Mutual Life Insurance Company since March 2008; Director, Citigroup since 2009; Director, Citibank, N.A. since 2009; former Trustee, BofA Funds Series Trust (11 funds) | |
*Dr. Santomero is not an affiliated person of the investment manager or Ameriprise Financial. However, he is currently deemed by the funds to be an "interested person" (as defined in the 1940 Act) of the funds because he serves as a Director of Citigroup, Inc. and Citibank N.A., companies that may directly or through subsidiaries and affiliates engage from time-to-time in brokerage execution, principal transactions and lending relationships with the funds or accounts advised/managed by the investment manager.
Interested Trustee Affiliated With Investment Manager*
Name,
Address,
Year of Birth | | Position Held With
Funds and Length of
Service | | Principal Occupation
During Past Five Years | | Number of
Funds in the
Fund Family
Overseen by
Board Member | | Other Present or Past
Directorships/Trusteeships
(Within Past 5 Years) | |
William F. Truscott
53600 Ameriprise
Financial Center
Minneapolis, MN 55474
1960 | | Board member since 11/01 for RiverSource Funds and since 6/11 for Nations Funds; Senior Vice President since 2002 for RiverSource Funds and 5/10 for Nations Funds | | President, Columbia Management Investment Advisers, LLC since February 2012, (previously President, Chairman of the Board and Chief Investment Officer, 2001-April 2010); Chief Executive Officer, Global Asset Management, Ameriprise Financial, Inc. since September 2012 (previously Chief Executive Officer, U.S. Asset Management & President, Annuities, May 2010-September 2012 and President — U.S. Asset Management and Chief Investment Officer, 2005-April 2010); Chief Executive Officer, Columbia Management Investment Distributors, Inc. since February 2012, (previously Chairman of the Board and Chief Executive Officer, 2006-April 2010); Chairman of the Board and Chief Executive Officer, RiverSource Distributors, Inc. since 2006; President and Chief Executive Officer, Ameriprise Certificate Company 2006-August 2012 | | | 210 | | | Chairman of the Board, Columbia Management Investment Advisers, LLC since May 2010; Director, Columbia Management Investment Distributors, Inc. since May 2010; Director, Ameriprise Certificate Company, 2006-January 2013 | |
*Interested person (as defined under the 1940 Act) by reason of being an officer, director, security holder and/or employee of the investment manager or Ameriprise Financial.
The SAI has additional information about the Fund's Board members and is available, without charge, upon request by calling 800.345.6611; contacting your financial intermediary; or visiting columbiamanagement.com.
Annual Report 2013
36
Columbia Mid Cap Index Fund
Trustees and Officers (continued)
The Board has appointed officers who are responsible for day-to-day business decisions based on policies it has established. The officers serve at the pleasure of the Board. In addition to Mr. Truscott, who is Senior Vice President, the funds' other officers are:
Officers
Name,
Address,
Year of Birth | | Position Held With
Funds and Length of
Service | | Principal Occupation During Past Five Years | |
J. Kevin Connaughton
225 Franklin Street
Boston, MA 02110
1964 | | President and Principal Executive Officer since 5/10 for RiverSource Funds and 2009 for Nations Funds | | Senior Vice President and General Manager — Mutual Fund Products, Columbia Management Investment Advisers, LLC since May 2010; Managing Director of Columbia Management Advisors, LLC, December 2004-April 2010; Senior Vice President and Chief Financial Officer, Columbia Funds, June 2008-January 2009; Treasurer, Columbia Funds, October 2003-May 2008 | |
Amy K. Johnson
5228 Ameriprise Financial Center Minneapolis, MN 55474
1965 | | Vice President since 12/06 for RiverSource Funds and 5/10 for Nations Funds | | Senior Vice President and Chief Operating Officer, Columbia Management Investment Advisers, LLC since May 2010 (previously Chief Administrative Officer, 2009-April 2010 and Vice President — Asset Management and Trust Company Services, 2006-2009) | |
Michael G. Clarke
225 Franklin Street
Boston, MA 02110
1969 | | Treasurer since 1/11 and Chief Financial Officer since 4/11 for RiverSource Funds and Treasurer since 3/11 and Chief Financial Officer since 2009 for Nations Funds | | Vice President, Columbia Management Investment Advisers, LLC since May 2010; Managing Director of Fund Administration, Columbia Management Advisors, LLC, September 2004-April 2010; senior officer of Columbia Funds and affiliated funds since 2002 | |
Scott R. Plummer
5228 Ameriprise Financial Center Minneapolis, MN 55474
1959 | | Senior Vice President and Chief Legal Officer since 12/06 and Assistant Secretary since 6/11 for RiverSource Funds and Senior Vice President and Chief Legal Officer since 5/10 and Assistant Secretary since 6/11 for Nations Funds | | Senior Vice President, Chief Legal Officer and Assistant Secretary, Columbia Management Investment Advisers, LLC since June 2005; Vice President and Lead Chief Counsel — Asset Management, Ameriprise Financial, Inc. since May 2010 (previously Vice President and Chief Counsel — Asset Management, 2005-April 2010); Vice President, Chief Counsel and Assistant Secretary, Columbia Management Investment Distributors, Inc. since 2008; Vice President, General Counsel and Secretary, Ameriprise Certificate Company since 2005; Chief Counsel, RiverSource Distributors, Inc. since 2006 | |
Colin Moore
225 Franklin Street
Boston, MA 02110
1958 | | Senior Vice President since 5/10 for RiverSource Funds and Nations Funds | | Director and Chief Investment Officer, Columbia Management Investment Advisers, LLC since May 2010; Manager, Managing Director and Chief Investment Officer, Columbia Management Advisors, LLC, 2007-April 2010 | |
Thomas P. McGuire
225 Franklin Street
Boston, MA 02110
1972 | | Chief Compliance Officer since 3/12 | | Vice President — Asset Management Compliance, Columbia Management Investment Advisers, LLC since 2010; Chief Compliance Officer, Ameriprise Certificate Company since September 2010; Compliance Executive, Bank of America, 2005-2010 | |
Stephen T. Welsh
225 Franklin Street
Boston, MA 02110
1957 | | Vice President since 4/11 for RiverSource Funds and 2006 for Nations Funds | | President and Director, Columbia Management Investment Services Corp. since May 2010; President and Director, Columbia Management Services, Inc., July 2004- April 2010; Managing Director, Columbia Management Distributors, Inc., August 2007-April 2010 | |
Christopher O. Petersen
5228 Ameriprise Financial Center Minneapolis, MN 55474
1970 | | Vice President and Secretary since 4/11 for RiverSource Funds and 3/11 for Nations Funds | | Vice President and Chief Counsel, Ameriprise Financial, Inc. since January 2010 (formerly Vice President and Group Counsel or Counsel, April 2004-January 2010); Assistant Secretary of Legacy RiverSource Funds, January 2007-April 2011 and of the Nations Funds, May 2010-March 2011 | |
Annual Report 2013
37
Columbia Mid Cap Index Fund
Trustees and Officers (continued)
Officers (continued)
Name,
Address,
Year of Birth | | Position Held With
Funds and Length of
Service | | Principal Occupation During Past Five Years | |
Paul D. Pearson
10468 Ameriprise Financial Center Minneapolis, MN 55474
1956 | | Vice President since 4/11 and Assistant Treasurer since 1999 for RiverSource Funds and Vice President and Assistant Treasurer since 6/11 for Nations Funds | | Vice President — Investment Accounting, Columbia Management Investment Advisers, LLC, since May 2010; Vice President — Managed Assets, Investment Accounting, Ameriprise Financial Corporation, February 1998-May 2010 | |
Joseph F. DiMaria
225 Franklin Street
Boston, MA 02110
1968 | | Vice President and Chief Accounting Officer since 4/11 and Vice President since 3/11 and Chief Accounting Officer since 2008 for Nations Funds | | Vice President, Mutual Fund Administration, Columbia Management Investment Advisers, LLC, since May 2010; Director of Fund Administration, Columbia Management Advisors, LLC, January 2006-April 2010 | |
Paul B. Goucher
100 Park Avenue
New York, NY 10017
1968 | | Vice President since 4/11 and Assistant Secretary since 11/08 for RiverSource Funds and 5/10 for Nations Funds | | Vice President and Lead Chief Counsel, Ameriprise Financial, Inc. since November 2008 and January 2013, respectively (formerly, Chief Counsel, January 2010-January 2013 and Group Counsel from November 2008- January 2010); Director, Managing Director and General Counsel, J. & W. Seligman & Co. Incorporated, July 2008-November 2008 (previously, Managing Director and Associate General Counsel, January 2005-July 2008) | |
Michael E. DeFao
225 Franklin Street
Boston, MA 02110
1968 | | Vice President since 4/11 and Assistant Secretary since 5/10 for RiverSource Funds and 2011 for Nations Funds | | Vice President and Chief Counsel, Ameriprise Financial, Inc. since May 2010; Associate General Counsel, Bank of America, June 2005-April 2010 | |
Annual Report 2013
38
This page intentionally left blank.
Annual Report 2013
39
This page intentionally left blank.
Annual Report 2013
40
Columbia Mid Cap Index Fund
Important Information About This Report
Each fund mails one shareholder report to each shareholder address. If you would like more than one report, please call shareholder services at 800.345.6611 and additional reports will be sent to you.
The policy of the Board is to vote the proxies of the companies in which each fund holds investments consistent with the procedures as stated in the Statement of Additional Information (SAI). You may obtain a copy of the SAI without charge by calling 800.345.6611; contacting your financial intermediary; visiting columbiamanagement.com; or searching the website of the Securities and Exchange Commission (SEC) at sec.gov. Information regarding how each fund voted proxies relating to portfolio securities is filed with the SEC by August 31 for the most recent 12-month period ending June 30 of that year, and is available without charge by visiting columbiamanagement.com; or searching the website of the SEC at sec.gov.
Each fund files a complete schedule of portfolio holdings with the SEC for the first and third quarters of each fiscal year on Form N-Q. Each fund's Form N-Q is available on the SEC's website at sec.gov and may be reviewed and copied at the SEC's Public Reference Room in Washington, D.C. Information on the operation of the Public Reference Room may be obtained by calling 800.SEC.0330. Each fund's complete schedule of portfolio holdings, as filed on Form N-Q, can also be obtained without charge, upon request, by calling 800.345.6611.
Annual Report 2013
41

Columbia Mid Cap Index Fund
P.O. Box 8081
Boston, MA 02266-8081
columbiamanagement.com
This information is for use with concurrent or prior delivery of a fund prospectus. Please read and consider the investment objectives, risks, charges and expenses for any fund carefully before investing. For a prospectus which contains this and other important information about the Fund go to columbiamanagement.com. The Fund is distributed by Columbia Management Investment Distributors, Inc., member FINRA, and managed by Columbia Management Investment Advisers, LLC.
© 2013 Columbia Management Investment Advisers, LLC. All rights reserved.
ANN196_02_C01_(04/13)
Annual Report
February 28, 2013

Columbia Mid Cap Value Fund
Not FDIC insured • No bank guarantee • May lose value
Columbia Mid Cap Value Fund
 Dear Shareholders,
U.S. stocks flat, foreign markets strong in 2012 finale
After a strong third quarter, U.S. stock market averages treaded water as the year 2012 came to a close. However, they ended the year up strongly, as first- and third-quarter gains more than offset second- and fourth-quarter weakness. Typically a strong quarter for domestic small- and mid-cap issues, the fourth quarter of 2012 indeed proved to be another year-end positive for small-cap stocks. For the full calendar year 2012, the S&P 500 Index rose 16.00%.
Stock markets outside the United States generated some of the best returns for the fourth quarter, as optimism rebounded, thanks to the September actions of the European Central Bank in support of the euro and an improving outlook from China. Both developed and emerging foreign markets topped U.S. stocks by a solid margin.
Corporate and emerging markets led fixed income
Fixed-income investors took their cue from the equity markets and continued to favor the highest risk sectors through the end of 2012. Global fixed-income returns posted mixed results in the final quarter of the year. Gains were the highest for corporate high-yield and emerging market bonds. Although investors remained cautious ahead of the year-end budget negotiations, better economic data and a further improvement in the European sovereign debt crisis supported riskier assets and depressed government bond prices. In December, the Federal Reserve announced its intention to continue to purchase both Treasury and mortgage-backed securities and said that it would seek to keep short-term interest rates unchanged until the unemployment rate reaches 6.5%, or inflation turned noticeably higher.
Stay on track with Columbia Management
Backed by more than 100 years of experience, Columbia Management is one of the nation's largest asset managers. At the heart of our success — and, most importantly, that of our investors — are highly talented industry professionals, brought together by a unique way of working. We are dedicated to helping you take advantage of today's opportunities and anticipate tomorrow's. We stay abreast of the latest investment trends and ideas, using our collective insight to evaluate events and transform them into solutions you can use.
Visit columbiamanagement.com for:
> The Columbia Management Perspectives blog, featuring timely posts by our investment teams
> Detailed up-to-date fund performance and portfolio information
> Economic analysis and market commentary
> Quarterly fund commentaries
> Columbia Management Investor, our award-winning quarterly newsletter for shareholders
Thank you for your continued support of the Columbia Funds. We look forward to serving your investment needs for many years to come.
Best Regards,

J. Kevin Connaughton
President, Columbia Funds
The S&P 500 Index, an unmanaged index, measures the performance of 500 widely held, large-capitalization U.S. stocks and is frequently used as a general measure of market performance. Indices are not available for investment, are not professionally managed and do not reflect sales charges, fees, brokerage commissions, taxes or other expenses of investing.
Investors should consider the investment objectives, risks, charges and expenses of a mutual fund carefully before investing. For a free prospectus, which contains this and other important information about a fund, visit columbiamanagement.com. The prospectus should be read carefully before investing.
Columbia Funds are distributed by Columbia Management Investment Distributors, Inc., member FINRA, and managed by Columbia Management Investment Advisers, LLC.
© 2013 Columbia Management Investment Advisers, LLC. All rights reserved.
Columbia Mid Cap Value Fund
Performance Overview | | | 2 | | |
Manager Discussion of Fund Performance | | | 4 | | |
Understanding Your Fund's Expenses | | | 6 | | |
Portfolio of Investments | | | 7 | | |
Statement of Assets and Liabilities | | | 12 | | |
Statement of Operations | | | 15 | | |
Statement of Changes in Net Assets | | | 16 | | |
Financial Highlights | | | 19 | | |
Notes to Financial Statements | | | 30 | | |
Report of Independent Registered
Public Accounting Firm | | | 37 | | |
Federal Income Tax Information | | | 38 | | |
Trustees and Officers | | | 39 | | |
Important Information About This Report | | | 45 | | |
Fund Investment Manager
Columbia Management Investment
Advisers, LLC
225 Franklin Street
Boston, MA 02110
Fund Distributor
Columbia Management Investment
Distributors, Inc.
225 Franklin Street
Boston, MA 02110
Fund Transfer Agent
Columbia Management Investment
Services Corp.
P.O. Box 8081
Boston, MA 02266-8081
For more information about any of the funds, please visit columbiamanagement.com or call 800.345.6611. Customer Service Representatives are available to answer your questions Monday through Friday from 8 a.m. to 8 p.m. Eastern time.
The views expressed in this report reflect the current views of the respective parties. These views are not guarantees of future performance and involve certain risks, uncertainties and assumptions that are difficult to predict, so actual outcomes and results may differ significantly from the views expressed. These views are subject to change at any time based upon economic, market or other conditions and the respective parties disclaim any responsibility to update such views. These views may not be relied on as investment advice and, because investment decisions for a Columbia Fund are based on numerous factors, may not be relied on as an indication of trading intent on behalf of any particular Columbia Fund. References to specific securities should not be construed as a recommendation or investment advice.
Columbia Mid Cap Value Fund
Performance Summary
> Columbia Mid Cap Value Fund (the Fund) Class A shares returned 16.03% excluding sales charges for the 12-month period that ended February 28, 2013.
> The Fund underperformed its benchmark, the Russell Midcap Value Index, which returned 18.91% for the same 12-month period.
> Stock selection in the information technology sector was the single biggest detractor from relative performance, partially offset by exposure to various aspects of an improving economy.
Average Annual Total Returns (%) (for period ended February 28, 2013)
| | Inception | | 1 Year | | 5 Years | | 10 Years | |
Class A | | 11/20/01 | | | | | | | | | | | | | |
Excluding sales charges | | | | | | | 16.03 | | | | 5.00 | | | | 11.03 | | |
Including sales charges | | | | | | | 9.35 | | | | 3.77 | | | | 10.38 | | |
Class B | | 11/20/01 | | | | | | | | | | | | | |
Excluding sales charges | | | | | | | 15.22 | | | | 4.23 | | | | 10.20 | | |
Including sales charges | | | | | | | 10.22 | | | | 3.89 | | | | 10.20 | | |
Class C | | 11/20/01 | | | | | | | | | | | | | |
Excluding sales charges | | | | | | | 15.24 | | | | 4.24 | | | | 10.20 | | |
Including sales charges | | | | | | | 14.24 | | | | 4.24 | | | | 10.20 | | |
Class I* | | 09/27/10 | | | 16.61 | | | | 5.24 | | | | 11.16 | | |
Class K* (formerly Class R4) | | 03/07/11 | | | 16.31 | | | | 5.08 | | | | 11.07 | | |
Class R* | | 01/23/06 | | | 15.76 | | | | 4.75 | | | | 10.75 | | |
Class R4* | | 11/08/12 | | | 16.19 | | | | 5.03 | | | | 11.05 | | |
Class R5* | | 11/08/12 | | | 16.22 | | | | 5.04 | | | | 11.05 | | |
Class W* | | 09/27/10 | | | 16.09 | | | | 5.01 | | | | 11.03 | | |
Class Y* | | 07/15/09 | | | 16.50 | | | | 5.25 | | | | 11.16 | | |
Class Z | | 11/20/01 | | | 16.36 | | | | 5.29 | | | | 11.31 | | |
Russell Midcap Value Index | | | | | | | 18.91 | | | | 7.36 | | | | 12.12 | | |
Returns for Class A are shown with and without the maximum initial sales charge of 5.75%. Returns for Class B are shown with and without the applicable contingent deferred sales charge (CDSC) of 5.00% in the first year, declining to 1.00% in the sixth year and eliminated thereafter. Returns for Class C are shown with and without the 1.00% CDSC for the first year only. The Fund's other classes are not subject to sales charges and have limited eligibility. Please see the Fund's prospectuses for details. Performance for different share classes will vary based on differences in sales charges and fees associated with each class. All results shown assume reinvestment of distributions during the period. Returns do not reflect the deduction of taxes that a shareholder may pay on Fund distributions or on the redemption of Fund shares. Performance results reflect the effect of any fee waivers or reimbursements of Fund expenses by Columbia Management Investment Advisers, LLC and/or any of its affiliates. Absent these fee waivers or expense reimbursement arrangements, performance results would have been lower.
The performance information shown represents past performance and is not a guarantee of future results. The investment return and principal value of your investment will fluctuate so that your shares, when redeemed, may be worth more or less than their original cost. Current performance may be lower or higher than the performance information shown. You may obtain performance information current to the most recent month-end by contacting your financial intermediary, visiting columbiamanagement.com or calling 800.345.6611.
*The returns shown for periods prior to the share class inception date (including returns for the Life of the Fund, if shown, which are since Fund inception) include the returns of the Fund's oldest share class. Since the Fund launched more than one share class at its inception, Class A shares were used. These returns are adjusted to reflect any higher class-related operating expenses of the newer share classes, as applicable. Please visit columbiamanagement.com/mutual-funds/appended-performance for more information.
The Russell Midcap Value Index, an unmanaged index, measures the performance of those Russell Midcap Index companies with lower price-to-book ratios and forecasted growth values.
Indices are not available for investment, are not professionally managed and do not reflect sales charges, fees, brokerage commissions, taxes or other expenses of investing. Securities in the Fund may not match those in an index.
Annual Report 2013
2
Columbia Mid Cap Value Fund
Performance Overview (continued)
Performance of a Hypothetical $10,000 Investment (March 1, 2003 – February 28, 2013)
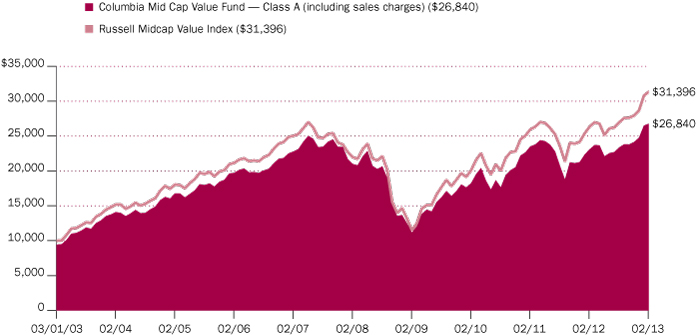
The chart above shows the change in value of a hypothetical $10,000 investment in Class A shares of Columbia Mid Cap Value Fund during the stated time period, and does not reflect the deduction of taxes that a shareholder may pay on Fund distributions or on the redemption of Fund shares.
Annual Report 2013
3
Columbia Mid Cap Value Fund
Manager Discussion of Fund Performance
For the 12-month period that ended February 28, 2013, the Fund's Class A shares returned 16.03% excluding sales charges, compared to a gain of 18.91% for the Russell Midcap Value Index. Both security selection and industry allocations contributed to the Fund's underperformance, as did a market environment that was focused on big-picture concerns rather than company-specific fundamentals.
Investors Shrug Off Weak Global Growth
Europe's economic woes, slowing growth in emerging markets and political uncertainty in the U.S. weighed on the global economy during the 12-month period ended February 28, 2013. Yet, investors chose to look beyond the numbers and came in from the sidelines to bid stock prices significantly higher. Favorable central bank action in key markets and improving prospects for the U.S. economy gave investors confidence to favor stocks and other riskier assets. The U.S. economy expanded at a pace of just 1.6% in 2012. However, a pickup in job growth early in 2013 and steady manufacturing activity were encouraging signs. The U.S. housing market staged a solid comeback, with higher home sales, rising prices and lower inventories. Against this backdrop, U.S. stocks benefited across all market capitalization ranges, ending the reporting period with double-digit gains. Mid-cap stocks outperformed small- and large-cap stocks, with value soundly beating growth stocks.
Positive Security Selection in Health Care, Materials and Telecommunications Services
Health care gave the biggest boost to relative performance, led by overall gains from investments in the health care providers and services group, pharmaceuticals and health care equipment and supplies. In materials, the containers and packaging segment stood out, thanks in large part to Packaging Corporation of America, whose stock rallied as industry consolidation and increased demand led to improved pricing. Other individual contributors included chemicals company PPG Industries, whose shares rose as the U.S. housing market improved and the company divested its commodity-based, chlor-alkali business to focus on higher-margin architectural coatings. In telecommunications services, wireless provider Sprint Nextel was a top contributor. Its stock climbed sharply, buoyed by network consolidation that reduced customer turnover and by new pricing initiatives. Other top individual contributors to Fund performance included online travel agency Expedia, whose shares benefited from hotel bookings that were much better than expected. We locked in profits and sold the position. In energy, an investment in refiner HollyFrontier rallied nicely, as widening crude oil spreads, superior cash flow and recent dividends attracted investors.
Disappointing Security Selection in Information Technology
Stock selection in the technology sector hampered performance as the Fund's positions in software, information technology services and semiconductors and semiconductor equipment underperformed the benchmark. Individual disappointments included bank ATM-maker Diebold, whose stock slid after lower-than-expected orders from small North American banks and a delayed order cycle in Latin America. An out-of-benchmark investment in speech recognition software company Nuance Communications declined after an
Portfolio Management
Lori Ensinger, CFA
David Hoffman
Morningstar Style BoxTM
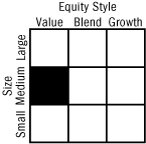
The Morningstar Style BoxTM is based on a fund's portfolio holdings. For equity funds, the vertical axis shows the market capitalization of the stocks owned, and the horizontal axis shows investment style (value, blend, or growth). Information shown is based on the most recent data provided by Morningstar.
© 2013 Morningstar, Inc. All rights reserved. The Morningstar information contained herein: (1) is proprietary to Morningstar and/or its content providers; (2) may not be copied or distributed; and (3) is not warranted to be accurate, complete or timely. Neither Morningstar nor its content providers are responsible for any damages or losses arising from any use of this information.
Annual Report 2013
4
Columbia Mid Cap Value Fund
Manager Discussion of Fund Performance (continued)
earnings shortfall that was attributed to slowing demand from health care users. Positioning in the energy and consumer staples sectors further detracted. Within energy, not owning a top performer in the benchmark hurt the most, followed by investments in coal producer Peabody Energy and exploration and production company Whiting Petroleum. Peabody's stock fell sharply along with decreased demand for metallurgical coal, which goes into steel production, and thermal coal, which is used in power generation. The timing of the Fund's overweight in Whiting hampered performance, as disappointing early-year exploration results and low oil prices pressured the stock's return. In the industrials sector, shares of temporary staffing company ManpowerGroup declined due to concerns that weak hiring globally would delay a recovery in profit margins. We sold Manpower before period end.
Looking Ahead
Despite continued concerns around fiscal issues in Washington, economic malaise in Europe, slowing growth rates in emerging economies and a sluggish U.S. recovery, we remain optimistic that stocks will benefit from an improving domestic economy and more reasoned tax and fiscal policies. At present, we're excited about opportunities among mid-cap value stocks, particularly in more economically sensitive sectors. Going forward, we plan to stay focused on bottom-up security selection that targets mid-sized companies with attractive stock valuations and the potential for improved operating profit margins.
Top Ten Holdings (%)
(at February 28, 2013) | |
Marathon Petroleum Corp. | | | 1.9 | | |
HollyFrontier Corp. | | | 1.6 | | |
Sprint Nextel Corp. | | | 1.5 | | |
Eaton Corp. PLC | | | 1.5 | | |
Principal Financial Group, Inc. | | | 1.5 | | |
Edison International | | | 1.5 | | |
Fifth Third Bancorp | | | 1.4 | | |
Zimmer Holdings, Inc. | | | 1.4 | | |
Comerica, Inc. | | | 1.4 | | |
Aon PLC | | | 1.4 | | |
Percentages indicated are based upon total investments (excluding Money Market Funds).
For further detail about these holdings, please refer to the section entitled "Portfolio of Investments."
Fund holdings are as of the date given, are subject to change at any time, and are not recommendations to buy or sell any security.
Portfolio Breakdown (%)
(at February 28, 2013) | |
Common Stocks | | | 98.6 | | |
Consumer Discretionary | | | 11.2 | | |
Consumer Staples | | | 2.3 | | |
Energy | | | 13.8 | | |
Financials | | | 28.8 | | |
Health Care | | | 6.8 | | |
Industrials | | | 11.2 | | |
Information Technology | | | 8.6 | | |
Materials | | | 5.5 | | |
Telecommunication Services | | | 1.7 | | |
Utilities | | | 8.7 | | |
Money Market Funds | | | 1.4 | | |
Total | | | 100.0 | | |
Percentages indicated are based upon total investments. The Fund's portfolio composition is subject to change.
Annual Report 2013
5
Columbia Mid Cap Value Fund
Understanding Your Fund's Expenses
(Unaudited)
As an investor, you incur two types of costs. There are transaction costs, which generally include sales charges on purchases and may include redemption fees. There are also ongoing costs, which generally include management fees, distribution and service (Rule 12b-1) fees, and other fund expenses. The following information is intended to help you understand your ongoing costs (in dollars) of investing in the Fund and to help you compare these costs with the ongoing costs of investing in other mutual funds.
Analyzing Your Fund's Expenses
To illustrate these ongoing costs, we have provided examples and calculated the expenses paid by investors in each share class of the Fund during the period. The actual and hypothetical information in the table is based on an initial investment of $1,000 at the beginning of the period indicated and held for the entire period. Expense information is calculated two ways and each method provides you with different information. The amount listed in the "Actual" column is calculated using the Fund's actual operating expenses and total return for the period. You may use the Actual information, together with the amount invested, to estimate the expenses that you paid over the period. Simply divide your account value by $1,000 (for example, an $8,600 account value divided by $1,000 = 8.6), then multiply the results by the expenses paid during the period under the Actual column. The amount listed in the "Hypothetical" column assumes a 5% annual rate of return before expenses (which is not the Fund's actual return) and then applies the Fund's actual expense ratio for the period to the hypothetical return. You should not use the hypothetical account values and expenses to estimate either your actual account balance at the end of the period or the expenses you paid during the period. See "Compare With Other Funds" below for details on how to use the hypothetical data.
Compare With Other Funds
Since all mutual funds are required to include the same hypothetical calculations about expenses in shareholder reports, you can use this information to compare the ongoing cost of investing in the Fund with other funds. To do so, compare the hypothetical example with the 5% hypothetical examples that appear in the shareholder reports of other funds. As you compare hypothetical examples of other funds, it is important to note that hypothetical examples are meant to highlight the ongoing costs of investing in a fund only and do not reflect any transaction costs, such as sales charges, or redemption or exchange fees. Therefore, the hypothetical calculations are useful in comparing ongoing costs only, and will not help you determine the relative total costs of owning different funds. If transaction costs were included in these calculations, your costs would be higher.
September 01, 2012 – February 28, 2013
| | Account Value at the Beginning
of the Period ($) | | Account Value at the End of the
Period ($) | | Expenses Paid During the
Period ($) | | Fund's Annualized
Expense Ratio (%) | |
| | Actual | | Hypothetical | | Actual | | Hypothetical | | Actual | | Hypothetical | | Actual | |
Class A | | | 1,000.00 | | | | 1,000.00 | | | | 1,146.30 | | | | 1,018.84 | | | | 6.39 | | | | 6.01 | | | | 1.20 | | |
Class B | | | 1,000.00 | | | | 1,000.00 | | | | 1,141.90 | | | | 1,015.17 | | | | 10.30 | | | | 9.69 | | | | 1.94 | | |
Class C | | | 1,000.00 | | | | 1,000.00 | | | | 1,142.10 | | | | 1,015.12 | | | | 10.36 | | | | 9.74 | | | | 1.95 | | |
Class I | | | 1,000.00 | | | | 1,000.00 | | | | 1,149.60 | | | | 1,021.12 | | | | 3.94 | | | | 3.71 | | | | 0.74 | | |
Class K (formerly
Class R4) | | | 1,000.00 | | | | 1,000.00 | | | | 1,147.70 | | | | 1,019.64 | | | | 5.54 | | | | 5.21 | | | | 1.04 | | |
Class R | | | 1,000.00 | | | | 1,000.00 | | | | 1,145.10 | | | | 1,017.60 | | | | 7.71 | | | | 7.25 | | | | 1.45 | | |
Class R4 | | | 1,000.00 | | | | 1,000.00 | | | | 1,144.90 | * | | | 1,020.58 | | | | 2.77 | * | | | 4.26 | | | | 0.85 | * | |
Class R5 | | | 1,000.00 | | | | 1,000.00 | | | | 1,145.20 | * | | | 1,020.98 | | | | 2.51 | * | | | 3.86 | | | | 0.77 | * | |
Class W | | | 1,000.00 | | | | 1,000.00 | | | | 1,147.00 | | | | 1,018.84 | | | | 6.39 | | | | 6.01 | | | | 1.20 | | |
Class Y | | | 1,000.00 | | | | 1,000.00 | | | | 1,149.00 | | | | 1,020.98 | | | | 4.10 | | | | 3.86 | | | | 0.77 | | |
Class Z | | | 1,000.00 | | | | 1,000.00 | | | | 1,148.20 | | | | 1,020.08 | | | | 5.06 | | | | 4.76 | | | | 0.95 | | |
*For the period November 8, 2012 through February 28, 2013. Class R4 and Class R5 shares commenced operations on November 8, 2012.
Expenses paid during the period are equal to the annualized expense ratio for each class as indicated above, multiplied by the average account value over the period and then multiplied by the number of days in the Fund's most recent fiscal half year and divided by 365.
Expenses do not include fees and expenses incurred indirectly by the Fund from the underlying funds in which the Fund may invest (also referred to as "acquired funds"), including affiliated and non-affiliated pooled investment vehicles (including mutual funds and exchange-traded funds).
Had Columbia Management Investment Advisers, LLC and/or certain of its affiliates not waived/reimbursed certain fees and expenses, for certain classes, account value at the end of the period would have been reduced.
Annual Report 2013
6
Columbia Mid Cap Value Fund
Portfolio of Investments
February 28, 2013
(Percentages represent value of investments compared to net assets)
Common Stocks 98.9%
Issuer | | Shares | | Value ($) | |
Consumer Discretionary 11.2% | |
Auto Components 1.7% | |
Allison Transmission Holdings, Inc. | | | 672,848 | | | | 15,542,789 | | |
BorgWarner, Inc.(a) | | | 249,350 | | | | 18,554,133 | | |
Tenneco, Inc.(a) | | | 807,735 | | | | 28,618,051 | | |
Total | | | | | 62,714,973 | | |
Automobiles 1.0% | |
Harley-Davidson, Inc. | | | 723,211 | | | | 38,062,595 | | |
Distributors 0.8% | |
Genuine Parts Co. | | | 417,400 | | | | 29,647,922 | | |
Hotels, Restaurants & Leisure 1.1% | |
Norwegian Cruise Line Holding(a) | | | 286,564 | | | | 8,877,752 | | |
Royal Caribbean Cruises Ltd. | | | 735,125 | | | | 25,633,809 | | |
Starwood Hotels & Resorts Worldwide, Inc. | | | 90,000 | | | | 5,429,700 | | |
Total | | | | | 39,941,261 | | |
Household Durables 0.9% | |
D.R. Horton, Inc. | | | 1,446,850 | | | | 32,264,755 | | |
Internet & Catalog Retail 1.1% | |
Liberty Interactive Corp., Class A(a) | | | 2,008,500 | | | | 41,937,480 | | |
Leisure Equipment & Products 0.8% | |
Mattel, Inc. | | | 784,125 | | | | 31,953,094 | | |
Media 1.1% | |
DISH Network Corp., Class A | | | 1,158,723 | | | | 40,323,560 | | |
Multiline Retail 0.6% | |
Macy's, Inc. | | | 513,875 | | | | 21,120,263 | | |
Specialty Retail 2.1% | |
Abercrombie & Fitch Co., Class A | | | 346,225 | | | | 16,144,472 | | |
Foot Locker, Inc. | | | 740,275 | | | | 25,310,002 | | |
Signet Jewelers Ltd. | | | 619,225 | | | | 37,908,955 | | |
Total | | | | | 79,363,429 | | |
Total Consumer Discretionary | | | | | 417,329,332 | | |
Consumer Staples 2.3% | |
Food Products 1.7% | |
Hershey Co. (The) | | | 279,625 | | | | 23,303,948 | | |
JM Smucker Co. (The) | | | 359,990 | | | | 34,307,047 | | |
WhiteWave Foods Co., Class A(a) | | | 281,933 | | | | 4,409,432 | | |
Total | | | | | 62,020,427 | | |
Common Stocks (continued)
Issuer | | Shares | | Value ($) | |
Household Products 0.4% | |
Clorox Co. (The) | | | 195,700 | | | | 16,440,757 | | |
Personal Products 0.2% | |
Avon Products, Inc. | | | 459,675 | | | | 8,986,646 | | |
Total Consumer Staples | | | | | 87,447,830 | | |
Energy 13.9% | |
Energy Equipment & Services 4.5% | |
Cameron International Corp.(a) | | | 483,950 | | | | 30,837,294 | | |
Dresser-Rand Group, Inc.(a) | | | 537,200 | | | | 33,123,752 | | |
Ensco PLC, Class A | | | 645,475 | | | | 38,818,866 | | |
Oceaneering International, Inc. | | | 307,600 | | | | 19,560,284 | | |
Superior Energy Services, Inc.(a) | | | 1,116,975 | | | | 29,543,989 | | |
Weatherford International Ltd.(a) | | | 1,455,750 | | | | 17,294,310 | | |
Total | | | | | 169,178,495 | | |
Oil, Gas & Consumable Fuels 9.4% | |
Cabot Oil & Gas Corp. | | | 621,150 | | | | 38,492,665 | | |
Chesapeake Energy Corp. | | | 987,550 | | | | 19,909,008 | | |
Cimarex Energy Co. | | | 316,815 | | | | 21,324,818 | | |
Gulfport Energy Corp.(a) | | | 179,900 | | | | 7,366,905 | | |
HollyFrontier Corp. | | | 1,044,925 | | | | 58,724,785 | | |
Marathon Petroleum Corp. | | | 825,325 | | | | 68,402,936 | | |
Noble Energy, Inc. | | | 388,975 | | | | 43,110,099 | | |
Peabody Energy Corp. | | | 1,402,955 | | | | 30,247,710 | | |
Southwestern Energy Co.(a) | | | 902,325 | | | | 30,922,678 | | |
Whiting Petroleum Corp.(a) | | | 615,491 | | | | 29,974,412 | | |
Total | | | | | 348,476,016 | | |
Total Energy | | | | | 517,654,511 | | |
Financials 28.9% | |
Capital Markets 2.4% | |
Raymond James Financial, Inc. | | | 1,045,225 | | | | 45,864,473 | | |
TD Ameritrade Holding Corp. | | | 2,292,600 | | | | 43,582,326 | | |
Total | | | | | 89,446,799 | | |
Commercial Banks 8.7% | |
CIT Group, Inc.(a) | | | 1,182,975 | | | | 49,519,334 | | |
City National Corp. | | | 800,962 | | | | 45,502,651 | | |
Comerica, Inc. | | | 1,489,775 | | | | 51,218,464 | | |
Cullen/Frost Bankers, Inc. | | | 618,725 | | | | 37,469,986 | | |
The accompanying Notes to Financial Statements are an integral part of this statement.
Annual Report 2013
7
Columbia Mid Cap Value Fund
Portfolio of Investments (continued)
February 28, 2013
Common Stocks (continued)
Issuer | | Shares | | Value ($) | |
East West Bancorp, Inc. | | | 828,600 | | | | 20,383,560 | | |
Fifth Third Bancorp | | | 3,287,176 | | | | 52,068,868 | | |
SVB Financial Group(a) | | | 394,602 | | | | 26,462,010 | | |
Zions Bancorporation | | | 1,703,783 | | | | 41,129,322 | | |
Total | | | | | 323,754,195 | | |
Insurance 6.3% | |
Aon PLC | | | 831,975 | | | | 50,825,353 | | |
Axis Capital Holdings Ltd. | | | 902,525 | | | | 36,759,843 | | |
Hartford Financial Services Group, Inc. | | | 1,954,643 | | | | 46,149,121 | | |
Principal Financial Group, Inc. | | | 1,737,452 | | | | 54,920,857 | | |
Reinsurance Group of America, Inc. | | | 211,280 | | | | 12,148,600 | | |
XL Group PLC | | | 1,171,748 | | | | 33,558,863 | | |
Total | | | | | 234,362,637 | | |
Real Estate Investment Trusts (REITs) 9.8% | |
Alexandria Real Estate Equities, Inc. | | | 397,000 | | | | 28,242,580 | | |
Colony Financial, Inc. | | | 424,900 | | | | 9,411,535 | | |
General Growth Properties, Inc. | | | 1,324,463 | | | | 25,350,222 | | |
Host Hotels & Resorts, Inc. | | | 2,871,497 | | | | 47,867,855 | | |
ProLogis, Inc. | | | 1,139,597 | | | | 44,375,907 | | |
Rayonier, Inc. | | | 744,659 | | | | 41,604,098 | | |
SL Green Realty Corp. | | | 473,650 | | | | 38,659,313 | | |
Taubman Centers, Inc. | | | 460,625 | | | | 35,339,150 | | |
UDR, Inc. | | | 1,919,650 | | | | 45,802,849 | | |
Weyerhaeuser Co. | | | 1,712,711 | | | | 50,370,831 | | |
Total | | | | | 367,024,340 | | |
Real Estate Management & Development 0.6% | |
CBRE Group, Inc., Class A(a) | | | 888,011 | | | | 21,463,226 | | |
Thrifts & Mortgage Finance 1.1% | |
People's United Financial, Inc. | | | 3,058,750 | | | | 40,069,625 | | |
Total Financials | | | | | 1,076,120,822 | | |
Health Care 6.8% | |
Health Care Equipment & Supplies 3.4% | |
Cooper Companies, Inc. (The) | | | 279,850 | | | | 29,680,891 | | |
Teleflex, Inc. | | | 546,825 | | | | 43,724,127 | | |
Zimmer Holdings, Inc. | | | 687,400 | | | | 51,527,504 | | |
Total | | | | | 124,932,522 | | |
Health Care Providers & Services 0.4% | |
VCA Antech, Inc.(a) | | | 742,750 | | | | 16,310,790 | | |
Common Stocks (continued)
Issuer | | Shares | | Value ($) | |
Life Sciences Tools & Services 0.5% | |
Agilent Technologies, Inc. | | | 456,225 | | | | 18,924,213 | | |
Pharmaceuticals 2.5% | |
Actavis, Inc.(a) | | | 522,715 | | | | 44,514,409 | | |
Forest Laboratories, Inc.(a) | | | 1,058,975 | | | | 38,970,280 | | |
Salix Pharmaceuticals Ltd.(a) | | | 192,700 | | | | 9,413,395 | | |
Total | | | | | 92,898,084 | | |
Total Health Care | | | | | 253,065,609 | | |
Industrials 11.3% | |
Electrical Equipment 2.4% | |
Babcock & Wilcox Co. (The) | | | 1,187,150 | | | | 32,076,793 | | |
Eaton Corp. PLC | | | 889,721 | | | | 55,136,010 | | |
Total | | | | | 87,212,803 | | |
Industrial Conglomerates 0.8% | |
Carlisle Companies, Inc. | | | 459,750 | | | | 31,203,233 | | |
Machinery 4.9% | |
AGCO Corp. | | | 652,192 | | | | 33,574,844 | | |
Crane Co. | | | 540,300 | | | | 29,057,334 | | |
Dover Corp. | | | 312,500 | | | | 22,921,875 | | |
PACCAR, Inc. | | | 457,775 | | | | 21,712,268 | | |
Parker Hannifin Corp. | | | 383,275 | | | | 36,211,822 | | |
Stanley Black & Decker, Inc. | | | 505,458 | | | | 39,779,545 | | |
Total | | | | | 183,257,688 | | |
Professional Services 0.4% | |
Towers Watson & Co. | | | 205,963 | | | | 13,710,957 | | |
Road & Rail 2.0% | |
Hertz Global Holdings, Inc.(a) | | | 1,925,100 | | | | 38,405,745 | | |
Ryder System, Inc. | | | 620,375 | | | | 34,865,075 | | |
Total | | | | | 73,270,820 | | |
Trading Companies & Distributors 0.8% | |
AerCap Holdings NV(a) | | | 870,419 | | | | 13,508,903 | | |
United Rentals, Inc.(a) | | | 326,725 | | | | 17,450,382 | | |
Total | | | | | 30,959,285 | | |
Total Industrials | | | | | 419,614,786 | | |
Information Technology 8.6% | |
Communications Equipment 1.1% | |
F5 Networks, Inc.(a) | | | 108,900 | | | | 10,283,427 | | |
Juniper Networks, Inc.(a) | | | 1,522,775 | | | | 31,490,987 | | |
Total | | | | | 41,774,414 | | |
The accompanying Notes to Financial Statements are an integral part of this statement.
Annual Report 2013
8
Columbia Mid Cap Value Fund
Portfolio of Investments (continued)
February 28, 2013
Common Stocks (continued)
Issuer | | Shares | | Value ($) | |
Computers & Peripherals 1.3% | |
Diebold, Inc. | | | 725,119 | | | | 20,477,361 | | |
SanDisk Corp.(a) | | | 572,525 | | | | 28,849,535 | | |
Total | | | | | 49,326,896 | | |
Electronic Equipment, Instruments & Components 1.1% | |
Arrow Electronics, Inc.(a) | | | 466,175 | | | | 18,716,926 | | |
FLIR Systems, Inc. | | | 769,850 | | | | 20,277,849 | | |
Total | | | | | 38,994,775 | | |
Office Electronics 0.5% | |
Xerox Corp. | | | 2,372,675 | | | | 19,242,394 | | |
Semiconductors & Semiconductor Equipment 3.6% | |
Avago Technologies Ltd. | | | 541,000 | | | | 18,513,020 | | |
Fairchild Semiconductor
International, Inc.(a) | | | 1,531,325 | | | | 21,836,695 | | |
KLA-Tencor Corp. | | | 528,225 | | | | 28,925,601 | | |
Lam Research Corp.(a) | | | 208,937 | | | | 8,838,035 | | |
Maxim Integrated Products, Inc. | | | 983,225 | | | | 30,656,955 | | |
NVIDIA Corp. | | | 2,128,750 | | | | 26,949,975 | | |
Total | | | | | 135,720,281 | | |
Software 1.0% | |
Autodesk, Inc.(a) | | | 555,725 | | | | 20,406,222 | | |
PTC, Inc.(a) | | | 664,000 | | | | 15,364,960 | | |
Total | | | | | 35,771,182 | | |
Total Information Technology | | | | | 320,829,942 | | |
Materials 5.5% | |
Chemicals 3.1% | |
Celanese Corp., Class A | | | 794,423 | | | | 37,218,718 | | |
International Flavors & Fragrances, Inc. | | | 322,225 | | | | 23,515,980 | | |
Methanex Corp. | | | 598,725 | | | | 21,901,361 | | |
PPG Industries, Inc. | | | 256,375 | | | | 34,523,457 | | |
Total | | | | | 117,159,516 | | |
Containers & Packaging 1.4% | |
Packaging Corp. of America | | | 1,204,150 | | | | 50,309,387 | | |
Metals & Mining 1.0% | |
Steel Dynamics, Inc. | | | 1,980,550 | | | | 30,242,999 | | |
United States Steel Corp. | | | 423,125 | | | | 8,817,925 | | |
Total | | | | | 39,060,924 | | |
Total Materials | | | | | 206,529,827 | | |
Common Stocks (continued)
Issuer | | Shares | | Value ($) | |
Telecommunication Services 1.7% | |
Wireless Telecommunication Services 1.7% | |
Sprint Nextel Corp.(a) | | | 9,530,175 | | | | 55,275,015 | | |
Telephone & Data Systems, Inc. | | | 380,275 | | | | 8,704,495 | | |
Total | | | | | 63,979,510 | | |
Total Telecommunication Services | | | | | 63,979,510 | | |
Utilities 8.7% | |
Electric Utilities 4.1% | |
Edison International | | | 1,126,450 | | | | 54,103,393 | | |
Great Plains Energy, Inc. | | | 1,290,200 | | | | 28,165,066 | | |
NV Energy, Inc. | | | 1,638,675 | | | | 32,380,218 | | |
PPL Corp. | | | 1,251,175 | | | | 38,561,214 | | |
Total | | | | | 153,209,891 | | |
Gas Utilities 1.0% | |
Questar Corp. | | | 1,623,100 | | | | 38,159,081 | | |
Independent Power Producers & Energy Traders 2.1% | |
AES Corp. (The) | | | 2,826,079 | | | | 32,839,038 | | |
Calpine Corp.(a) | | | 1,290,725 | | | | 23,749,340 | | |
NRG Energy, Inc. | | | 848,475 | | | | 20,363,400 | | |
Total | | | | | 76,951,778 | | |
Multi-Utilities 1.5% | |
CMS Energy Corp. | | | 941,800 | | | | 25,061,298 | | |
Sempra Energy | | | 395,249 | | | | 30,734,562 | | |
Total | | | | | 55,795,860 | | |
Total Utilities | | | | | 324,116,610 | | |
Total Common Stocks
(Cost: $2,776,532,918) | | | | | 3,686,688,779 | | |
Money Market Funds 1.4% | |
Columbia Short-Term Cash Fund,
0.128%(b)(c) | | | 51,855,363 | | | | 51,855,363 | | |
Total Money Market Funds
(Cost: $51,855,363) | | | | | 51,855,363 | | |
Total Investments
(Cost: $2,828,388,281) | | | | | 3,738,544,142 | | |
Other Assets & Liabilities, Net | | | | | (12,645,155 | ) | |
Net Assets | | | | | 3,725,898,987 | | |
The accompanying Notes to Financial Statements are an integral part of this statement.
Annual Report 2013
9
Columbia Mid Cap Value Fund
Portfolio of Investments (continued)
February 28, 2013
Notes to Portfolio of Investments
(a) Non-income producing.
(b) The rate shown is the seven-day current annualized yield at February 28, 2013.
(c) As defined in the Investment Company Act of 1940, an affiliated company is one in which the Fund owns 5% or more of its outstanding voting securities, or a company which is under common ownership or control with the Fund. Holdings and transactions in these affiliated companies during the year ended February 28, 2013, are as follows:
Issuer | | Beginning
Cost ($) | | Purchase
Cost ($) | | Proceeds
From Sales ($) | | Ending
Cost ($) | | Dividend
Income ($) | | Value ($) | |
Columbia Short-Term Cash Fund | | | 119,191,310 | | | | 1,186,669,953 | | | | (1,254,005,900 | ) | | | 51,855,363 | | | | 110,836 | | | | 51,855,363 | | |
Fair Value Measurements
Generally accepted accounting principles (GAAP) require disclosure regarding the inputs and valuation techniques used to measure fair value and any changes in valuation inputs or techniques. In addition, investments shall be disclosed by major category.
The Fund categorizes its fair value measurements according to a three-level hierarchy that maximizes the use of observable inputs and minimizes the use of unobservable inputs by prioritizing that the most observable input be used when available. Observable inputs are those that market participants would use in pricing an investment based on market data obtained from sources independent of the reporting entity. Unobservable inputs are those that reflect the Fund's assumptions about the information market participants would use in pricing an investment. An investment's level within the fair value hierarchy is based on the lowest level of any input that is deemed significant to the asset or liability's fair value measurement. The input levels are not necessarily an indication of the risk or liquidity associated with investments at that level. For example, certain U.S. government securities are generally high quality and liquid, however, they are reflected as Level 2 because the inputs used to determine fair value may not always be quoted prices in an active market.
Fair value inputs are summarized in the three broad levels listed below:
> Level 1 — Valuations based on quoted prices for investments in active markets that the Fund has the ability to access at the measurement date (including NAV for open-end mutual funds). Valuation adjustments are not applied to Level 1 investments.
> Level 2 — Valuations based on other significant observable inputs (including quoted prices for similar securities, interest rates, prepayment speeds, credit risks, etc.).
> Level 3 — Valuations based on significant unobservable inputs (including the Fund's own assumptions and judgment in determining the fair value of investments).
Inputs that are used in determining fair value of an investment may include price information, credit data, volatility statistics, and other factors. These inputs can be either observable or unobservable. The availability of observable inputs can vary between investments, and is affected by various factors such as the type of investment, and the volume and level of activity for that investment or similar investments in the marketplace. The inputs will be considered by the Investment Manager, along with any other relevant factors in the calculation of an investment's fair value. The Fund uses prices and inputs that are current as of the measurement date, which may include periods of market dislocations. During these periods, the availability of prices and inputs may be reduced for many investments. This condition could cause an investment to be reclassified between the various levels within the hierarchy.
Investments falling into the Level 3 category are primarily supported by quoted prices from brokers and dealers participating in the market for those investments. However, these may be classified as Level 3 investments due to lack of market transparency and corroboration to support these quoted prices. Additionally, valuation models may be used as the pricing source for any remaining investments classified as Level 3. These models rely on one or more significant unobservable inputs and/or significant assumptions by the Investment Manager. Inputs used in valuations may include, but are not limited to, financial statement analysis, capital account balances, discount rates and estimated cash flows, and comparable company data.
Under the direction of the Fund's Board of Trustees (the Board), the Investment Manager's Valuation Committee (the Committee) is responsible for carrying out the valuation procedures approved by the Board. The Committee consists of voting and non-voting members from various groups within the Investment Manager's organization, including operations and accounting, trading and investments, compliance, risk management and legal.
The Committee meets at least monthly to review and approve valuation matters, which may include a description of specific valuation determinations, data regarding pricing information received from approved pricing vendors and brokers and the results of Board-approved valuation control policies and procedures (the Policies). The Policies address, among other things, instances when market quotations are readily available, including recommendations of third party pricing vendors and a determination of appropriate pricing methodologies; events that require specific valuation determinations and assessment of fair value techniques; securities with a potential for stale pricing, including those that are illiquid, restricted, or in default; and the effectiveness of third-party pricing vendors, including periodic reviews of vendors. The Committee meets more frequently, as needed, to discuss additional valuation matters, which may include the need to review back-testing results, review time-sensitive information or approve related valuation actions. The Committee reports to the Board, with members of the
The accompanying Notes to Financial Statements are an integral part of this statement.
Annual Report 2013
10
Columbia Mid Cap Value Fund
Portfolio of Investments (continued)
February 28, 2013
Fair Value Measurements (continued)
Committee meeting with the Board at each of its regularly scheduled meetings to discuss valuation matters and actions during the period, similar to those described earlier.
For investments categorized as Level 3, the Committee monitors information similar to that described above, which may include: (i) data specific to the issuer or comparable issuers, (ii) general market or specific sector news and (iii) quoted prices and specific or similar security transactions. The Committee considers this data and any changes from prior periods in order to assess the reasonableness of observable and unobservable inputs, any assumptions or internal models used to value those securities and changes in fair value. This data is also used to corroborate, when available, information received from approved pricing vendors and brokers. Various factors impact the frequency of monitoring this information (which may occur as often as daily). However, the Committee may determine that changes to inputs, assumptions and models are not required as a result of the monitoring procedures performed.
The following table is a summary of the inputs used to value the Fund's investments at February 28, 2013:
Description | | Level 1
Quoted Prices in Active
Markets for Identical
Assets ($) | | Level 2
Other Significant
Observable Inputs ($) | | Level 3
Significant
Unobservable Inputs ($) | | Total ($) | |
Equity Securities | |
Common Stocks | |
Consumer Discretionary | | | 417,329,332 | | | | — | | | | — | | | | 417,329,332 | | |
Consumer Staples | | | 87,447,830 | | | | — | | | | — | | | | 87,447,830 | | |
Energy | | | 517,654,511 | | | | — | | | | — | | | | 517,654,511 | | |
Financials | | | 1,076,120,822 | | | | — | | | | — | | | | 1,076,120,822 | | |
Health Care | | | 253,065,609 | | | | — | | | | — | | | | 253,065,609 | | |
Industrials | | | 419,614,786 | | | | — | | | | — | | | | 419,614,786 | | |
Information Technology | | | 320,829,942 | | | | — | | | | — | | | | 320,829,942 | | |
Materials | | | 206,529,827 | | | | — | | | | — | | | | 206,529,827 | | |
Telecommunication Services | | | 63,979,510 | | | | — | | | | — | | | | 63,979,510 | | |
Utilities | | | 324,116,610 | | | | — | | | | — | | | | 324,116,610 | | |
Total Equity Securities | | | 3,686,688,779 | | | | — | | | | — | | | | 3,686,688,779 | | |
Other | |
Money Market Funds | | | 51,855,363 | | | | — | | | | — | | | | 51,855,363 | | |
Total Other | | | 51,855,363 | | | | — | | | | — | | | | 51,855,363 | | |
Total | | | 3,738,544,142 | | | | — | | | | — | | | | 3,738,544,142 | | |
See the Portfolio of Investments for all investment classifications not indicated in the table.
There were no transfers of financial assets between Levels 1 and 2 during the period.
The accompanying Notes to Financial Statements are an integral part of this statement.
Annual Report 2013
11
Columbia Mid Cap Value Fund
Statement of Assets and Liabilities
February 28, 2013
Assets | |
Investments, at value | |
Unaffiliated issuers (identified cost $2,776,532,918) | | $ | 3,686,688,779 | | |
Affiliated issuers (identified cost $51,855,363) | | | 51,855,363 | | |
Total investments (identified cost $2,828,388,281) | | | 3,738,544,142 | | |
Receivable for: | |
Investments sold | | | 10,888,623 | | |
Capital shares sold | | | 2,937,433 | | |
Dividends | | | 4,639,620 | | |
Prepaid expenses | | | 9,847 | | |
Other assets | | | 982 | | |
Total assets | | | 3,757,020,647 | | |
Liabilities | |
Payable for: | |
Investments purchased | | | 12,511,570 | | |
Capital shares purchased | | | 17,402,000 | | |
Investment management fees | | | 67,407 | | |
Distribution and/or service fees | | | 11,765 | | |
Transfer agent fees | | | 754,638 | | |
Administration fees | | | 5,124 | | |
Plan administration fees | | | 3 | | |
Compensation of board members | | | 96,245 | | |
Other expenses | | | 272,908 | | |
Total liabilities | | | 31,121,660 | | |
Net assets applicable to outstanding capital stock | | $ | 3,725,898,987 | | |
Represented by | |
Paid-in capital | | $ | 2,809,524,894 | | |
Undistributed net investment income | | | 2,485,205 | | |
Accumulated net realized gain | | | 3,733,027 | | |
Unrealized appreciation (depreciation) on: | |
Investments | | | 910,155,861 | | |
Total — representing net assets applicable to outstanding capital stock | | $ | 3,725,898,987 | | |
The accompanying Notes to Financial Statements are an integral part of this statement.
Annual Report 2013
12
Columbia Mid Cap Value Fund
Statement of Assets and Liabilities (continued)
February 28, 2013
Class A | |
Net assets | | $ | 991,510,011 | | |
Shares outstanding | | | 61,877,669 | | |
Net asset value per share | | $ | 16.02 | | |
Maximum offering price per share(a) | | $ | 17.00 | | |
Class B | |
Net assets | | $ | 16,759,440 | | |
Shares outstanding | | | 1,076,966 | | |
Net asset value per share | | $ | 15.56 | | |
Class C | |
Net assets | | $ | 115,248,358 | | |
Shares outstanding | | | 7,378,788 | | |
Net asset value per share | | $ | 15.62 | | |
Class I | |
Net assets | | $ | 160,368,225 | | |
Shares outstanding | | | 10,005,762 | | |
Net asset value per share | | $ | 16.03 | | |
Class K(b) | |
Net assets | | $ | 13,833 | | |
Shares outstanding | | | 861 | | |
Net asset value per share | | $ | 16.07 | | |
Class R | |
Net assets | | $ | 58,922,518 | | |
Shares outstanding | | | 3,682,679 | | |
Net asset value per share | | $ | 16.00 | | |
Class R4(c) | |
Net assets | | $ | 2,855 | | |
Shares outstanding | | | 176 | | |
Net asset value per share | | $ | 16.26 | (d) | |
Class R5(c) | |
Net assets | | $ | 2,863 | | |
Shares outstanding | | | 176 | | |
Net asset value per share | | $ | 16.26 | (d) | |
Class W | |
Net assets | | $ | 79,580,990 | | |
Shares outstanding | | | 4,965,260 | | |
Net asset value per share | | $ | 16.03 | | |
Class Y | |
Net assets | | $ | 4,974,937 | | |
Shares outstanding | | | 310,429 | | |
Net asset value per share | | $ | 16.03 | | |
The accompanying Notes to Financial Statements are an integral part of this statement.
Annual Report 2013
13
Columbia Mid Cap Value Fund
Statement of Assets and Liabilities (continued)
February 28, 2013
Class Z | |
Net assets | | $ | 2,298,514,957 | | |
Shares outstanding | | | 143,242,839 | | |
Net asset value per share | | $ | 16.05 | | |
(a) The maximum offering price per share is calculated by dividing the net asset value by 1.0 minus the maximum sales charge of 5.75%.
(b) Effective October 25, 2012, Class R4 shares were renamed Class K shares.
(c) For the period from November 8, 2012 (commencement of operations) to February 28, 2013.
(d) Net asset value per share rounds to this amount due to fractional shares outstanding.
The accompanying Notes to Financial Statements are an integral part of this statement.
Annual Report 2013
14
Columbia Mid Cap Value Fund
Statement of Operations
Year Ended February 28, 2013
Net investment income | |
Income: | |
Dividends — unaffiliated issuers | | $ | 69,951,945 | | |
Dividends — affiliated issuers | | | 110,836 | | |
Income from securities lending — net | | | 1,810,987 | | |
Foreign taxes withheld | | | (45,126 | ) | |
Total income | | | 71,828,642 | | |
Expenses: | |
Investment management fees | | | 24,254,448 | | |
Distribution and/or service fees | |
Class A | | | 2,467,831 | | |
Class B | | | 182,448 | | |
Class C | | | 1,142,607 | | |
Class R | | | 330,022 | | |
Class W | | | 181,903 | | |
Transfer agent fees | |
Class A | | | 1,986,810 | | |
Class B | | | 36,679 | | |
Class C | | | 230,085 | | |
Class K(a) | | | 6 | | |
Class R | | | 132,740 | | |
Class R4(b) | | | 1 | | |
Class W | | | 146,462 | | |
Class Y | | | 17 | | |
Class Z | | | 4,569,423 | | |
Administration fees | | | 1,847,219 | | |
Plan administration fees | |
Class K(a) | | | 31 | | |
Compensation of board members | | | 96,647 | | |
Custodian fees | | | 27,483 | | |
Printing and postage fees | | | 648,118 | | |
Registration fees | | | 295,757 | | |
Professional fees | | | 70,155 | | |
Other | | | 89,519 | | |
Total expenses | | | 38,736,411 | | |
Fees waived or expenses reimbursed by Investment Manager and its affiliates | | | (4 | ) | |
Expense reductions | | | (12,613 | ) | |
Total net expenses | | | 38,723,794 | | |
Net investment income | | | 33,104,848 | | |
Realized and unrealized gain (loss) — net | |
Net realized gain (loss) on: | |
Investments | | | 323,437,559 | | |
Net realized gain | | | 323,437,559 | | |
Net change in unrealized appreciation (depreciation) on: | |
Investments | | | 198,899,713 | | |
Net change in unrealized appreciation (depreciation) | | | 198,899,713 | | |
Net realized and unrealized gain | | | 522,337,272 | | |
Net increase in net assets resulting from operations | | $ | 555,442,120 | | |
(a) Effective October 25, 2012, Class R4 shares were renamed Class K shares.
(b) For the period from November 8, 2012 (commencement of operations) to February 28, 2013.
The accompanying Notes to Financial Statements are an integral part of this statement.
Annual Report 2013
15
Columbia Mid Cap Value Fund
Statement of Changes in Net Assets
| | | Year Ended
February 28,
2013(a) | | Year Ended
February 29,
2012(b) | |
Operations | |
Net investment income | | $ | 33,104,848 | | | $ | 30,997,981 | | |
Net realized gain | | | 323,437,559 | | | | 337,226,375 | | |
Net change in unrealized appreciation (depreciation) | | | 198,899,713 | | | | (519,995,492 | ) | |
Net increase (decrease) in net assets resulting from operations | | | 555,442,120 | | | | (151,771,136 | ) | |
Distributions to shareholders | |
Net investment income | |
Class A | | | (7,170,777 | ) | | | (6,764,702 | ) | |
Class B | | | (20,221 | ) | | | (28,753 | ) | |
Class C | | | (129,220 | ) | | | (142,957 | ) | |
Class I | | | (1,819,725 | ) | | | (1,231,267 | ) | |
Class K(c) | | | (108 | ) | | | (64 | ) | |
Class R | | | (314,169 | ) | | | (447,096 | ) | |
Class R4 | | | (7 | ) | | | — | | |
Class R5 | | | (8 | ) | | | — | | |
Class W | | | (515,159 | ) | | | (424,228 | ) | |
Class Y | | | (9,251 | ) | | | (273 | ) | |
Class Z | | | (22,426,154 | ) | | | (20,394,685 | ) | |
Total distributions to shareholders | | | (32,404,799 | ) | | | (29,434,025 | ) | |
Increase (decrease) in net assets from capital stock activity | | | (842,012,844 | ) | | | (850,671,076 | ) | |
Proceeds from regulatory settlements (Note 6) | | | — | | | | 236,136 | | |
Total decrease in net assets | | | (318,975,523 | ) | | | (1,031,640,101 | ) | |
Net assets at beginning of year | | | 4,044,874,510 | | | | 5,076,514,611 | | |
Net assets at end of year | | $ | 3,725,898,987 | | | $ | 4,044,874,510 | | |
Undistributed net investment income | | $ | 2,485,205 | | | $ | 1,785,156 | | |
(a) Class R4 and R5 shares are for the period from November 8, 2012 (commencement of operations) to February 28, 2013.
(b) Class K (formerly Class R4) shares are for the period from March 7, 2011 (commencement of operations) to February 29, 2012.
(c) Effective October 25, 2012, Class R4 shares were renamed Class K shares.
The accompanying Notes to Financial Statements are an integral part of this statement.
Annual Report 2013
16
Columbia Mid Cap Value Fund
Statement of Changes in Net Assets (continued)
| | | Year Ended February 28, 2013(a) | | Year Ended February 29, 2012(b) | |
| | | Shares | | Dollars ($) | | Shares | | Dollars ($) | |
Capital stock activity | |
Class A shares | |
Subscriptions(c) | | | 8,635,469 | | | | 123,597,572 | | | | 15,646,891 | | | | 208,981,808 | | |
Fund merger | | | — | | | | — | | | | 764,899 | | | | 10,800,090 | | |
Distributions reinvested | | | 471,483 | | | | 6,604,196 | | | | 476,451 | | | | 6,016,193 | | |
Redemptions | | | (28,860,994 | ) | | | (408,951,908 | ) | | | (41,399,061 | ) | | | (555,805,689 | ) | |
Net decrease | | | (19,754,042 | ) | | | (278,750,140 | ) | | | (24,510,820 | ) | | | (330,007,598 | ) | |
Class B shares | |
Subscriptions | | | 18,573 | | | | 256,399 | | | | 22,692 | | | | 303,307 | | |
Fund merger | | | — | | | | — | | | | 52,469 | | | | 721,378 | | |
Distributions reinvested | | | 1,294 | | | | 17,749 | | | | 2,011 | | | | 24,476 | | |
Redemptions(c) | | | (624,470 | ) | | | (8,597,881 | ) | | | (1,610,786 | ) | | | (20,994,752 | ) | |
Net decrease | | | (604,603 | ) | | | (8,323,733 | ) | | | (1,533,614 | ) | | | (19,945,591 | ) | |
Class C shares | |
Subscriptions | | | 336,505 | | | | 4,749,574 | | | | 599,445 | | | | 7,805,828 | | |
Fund merger | | | — | | | | — | | | | 21,768 | | | | 300,577 | | |
Distributions reinvested | | | 7,236 | | | | 99,746 | | | | 8,906 | | | | 108,836 | | |
Redemptions | | | (2,208,566 | ) | | | (30,709,256 | ) | | | (3,830,772 | ) | | | (49,672,691 | ) | |
Net decrease | | | (1,864,825 | ) | | | (25,859,936 | ) | | | (3,200,653 | ) | | | (41,457,450 | ) | |
Class I shares | |
Subscriptions | | | 2,101,736 | | | | 29,687,470 | | | | 4,374,216 | | | | 60,352,741 | | |
Fund merger | | | — | | | | — | | | | 262,588 | | | | 3,708,890 | | |
Distributions reinvested | | | 129,936 | | | | 1,819,598 | | | | 95,462 | | | | 1,231,178 | | |
Redemptions | | | (2,547,087 | ) | | | (36,055,306 | ) | | | (4,985,662 | ) | | | (67,344,843 | ) | |
Net decrease | | | (315,415 | ) | | | (4,548,238 | ) | | | (253,396 | ) | | | (2,052,034 | ) | |
Class K shares(d) | |
Subscriptions | | | — | | | | — | | | | 178 | | | | 2,500 | | |
Fund merger | | | — | | | | — | | | | 681 | | | | 9,625 | | |
Distributions reinvested | | | 1 | | | | 18 | | | | 1 | | | | 10 | | |
Net increase | | | 1 | | | | 18 | | | | 860 | | | | 12,135 | | |
Class R shares | |
Subscriptions | | | 1,119,132 | | | | 15,985,362 | | | | 6,538,656 | | | | 90,315,959 | | |
Distributions reinvested | | | 21,819 | | | | 304,895 | | | | 34,160 | | | | 436,403 | | |
Redemptions | | | (3,225,643 | ) | | | (45,873,020 | ) | | | (24,491,543 | ) | | | (311,990,808 | ) | |
Net decrease | | | (2,084,692 | ) | | | (29,582,763 | ) | | | (17,918,727 | ) | | | (221,238,446 | ) | |
Class R4 shares | |
Subscriptions | | | 176 | | | | 2,500 | | | | — | | | | — | | |
Redemptions | | | — | | | | — | | | | — | | | | — | | |
Net increase | | | 176 | | | | 2,500 | | | | — | | | | — | | |
The accompanying Notes to Financial Statements are an integral part of this statement.
Annual Report 2013
17
Columbia Mid Cap Value Fund
Statement of Changes in Net Assets (continued)
| | | Year Ended February 28, 2013(a) | | Year Ended February 29, 2012(b) | |
| | | Shares | | Dollars ($) | | Shares | | Dollars ($) | |
Capital stock activity (continued) | |
Class R5 shares | |
Subscriptions | | | 175 | | | | 2,500 | | | | — | | | | — | | |
Distributions reinvested | | | 1 | | | | 8 | | | | — | | | | — | | |
Net increase | | | 176 | | | | 2,508 | | | | — | | | | — | | |
Class W shares | |
Subscriptions | | | 1,499,020 | | | | 21,790,489 | | | | 2,155,313 | | | | 27,938,697 | | |
Fund merger | | | — | | | | — | | | | 7,276,910 | | | | 102,861,296 | | |
Distributions reinvested | | | 36,737 | | | | 515,108 | | | | 33,667 | | | | 424,192 | | |
Redemptions | | | (2,132,169 | ) | | | (29,795,402 | ) | | | (3,904,432 | ) | | | (51,206,898 | ) | |
Net increase (decrease) | | | (596,412 | ) | | | (7,489,805 | ) | | | 5,561,458 | | | | 80,017,287 | | |
Class Y shares | |
Subscriptions | | | 324,062 | | | | 4,836,824 | | | | — | | | | — | | |
Distributions reinvested | | | 625 | | | | 9,079 | | | | 11 | | | | 138 | | |
Redemptions | | | (16,552 | ) | | | (254,762 | ) | | | — | | | | — | | |
Net increase | | | 308,135 | | | | 4,591,141 | | | | 11 | | | | 138 | | |
Class Z shares | |
Subscriptions | | | 39,469,984 | | | | 550,791,418 | | | | 38,601,255 | | | | 513,775,179 | | |
Distributions reinvested | | | 1,267,831 | | | | 17,779,812 | | | | 1,140,867 | | | | 14,563,073 | | |
Redemptions | | | (74,156,868 | ) | | | (1,060,625,626 | ) | | | (63,576,970 | ) | | | (844,337,769 | ) | |
Net decrease | | | (33,419,053 | ) | | | (492,054,396 | ) | | | (23,834,848 | ) | | | (315,999,517 | ) | |
Total net decrease | | | (58,330,554 | ) | | | (842,012,844 | ) | | | (65,689,729 | ) | | | (850,671,076 | ) | |
(a) Class R4 and R5 shares are for the period from November 8, 2012 (commencement of operations) to February 28, 2013.
(b) Class K (formerly Class R4) shares are for the period from March 7, 2011 (commencement of operations) to February 29, 2012.
(c) Includes conversions of Class B shares to Class A shares, if any.
(d) Effective October 25, 2012, Class R4 shares were renamed Class K shares.
The accompanying Notes to Financial Statements are an integral part of this statement.
Annual Report 2013
18
Columbia Mid Cap Value Fund
The following tables are intended to help you understand the Fund's financial performance. Certain information reflects financial results for a single share of a class held for the periods shown. Per share net investment income (loss) amounts are calculated based on average shares outstanding during the period. Total return assumes reinvestment of all dividends and distributions, if any. Total return does not reflect payment of sales charges, if any, and is not annualized for periods of less than one year.
| | | Year Ended
February 28, | | Year Ended
February 29, | | Year Ended February 28, | |
Class A | | 2013 | | 2012 | | 2011 | | 2010 | | 2009 | |
Per share data | |
Net asset value, beginning of period | | $ | 13.91 | | | $ | 14.24 | | | $ | 11.18 | | | $ | 6.87 | | | $ | 13.12 | | |
Income from investment operations: | |
Net investment income | | | 0.11 | | | | 0.07 | | | | 0.13 | (a) | | | 0.07 | | | | 0.11 | | |
Net realized and unrealized gain (loss) | | | 2.10 | | | | (0.33 | ) | | | 3.07 | | | | 4.32 | | | | (6.25 | ) | |
Total from investment operations | | | 2.21 | | | | (0.26 | ) | | | 3.20 | | | | 4.39 | | | | (6.14 | ) | |
Less distributions to shareholders: | |
Net investment income | | | (0.10 | ) | | | (0.07 | ) | | | (0.14 | ) | | | (0.07 | ) | | | (0.10 | ) | |
Tax return of capital | | | — | | | | — | | | | — | | | | (0.01 | ) | | | (0.01 | ) | |
Total distributions to shareholders | | | (0.10 | ) | | | (0.07 | ) | | | (0.14 | ) | | | (0.08 | ) | | | (0.11 | ) | |
Proceeds from regulatory settlements | | | — | | | | 0.00 | (b) | | | 0.00 | (b) | | | 0.00 | (b) | | | — | | |
Net asset value, end of period | | $ | 16.02 | | | $ | 13.91 | | | $ | 14.24 | | | $ | 11.18 | | | $ | 6.87 | | |
Total return | | | 16.03 | % | | | (1.75 | %) | | | 28.87 | % | | | 64.09 | % | | | (47.05 | %) | |
Ratios to average net assets(c) | |
Total gross expenses | | | 1.19 | % | | | 1.18 | % | | | 1.13 | % | | | 1.17 | % | | | 1.17 | % | |
Total net expenses(d) | | | 1.19 | %(e) | | | 1.18 | %(e) | | | 1.13 | %(e) | | | 1.17 | %(e) | | | 1.17 | %(e) | |
Net investment income | | | 0.75 | % | | | 0.59 | % | | | 1.05 | % | | | 0.71 | % | | | 0.97 | % | |
Supplemental data | |
Net assets, end of period (in thousands) | | $ | 991,510 | | | $ | 1,135,303 | | | $ | 1,511,519 | | | $ | 1,441,388 | | | $ | 966,440 | | |
Portfolio turnover | | | 36 | % | | | 39 | % | | | 50 | % | | | 56 | % | | | 46 | % | |
Notes to Financial Highlights
(a) Net investment income per share reflects special dividends. The effect of these dividends amounted to $0.08 per share.
(b) Rounds to zero.
(c) In addition to the fees and expenses which the Fund bears directly, the Fund indirectly bears a pro rata share of the fees and expenses of the acquired funds in which it invests. Such indirect expenses are not included in the reported expense ratios.
(d) Total net expenses include the impact of certain waivers/reimbursements made by the Investment Manager and certain of its affiliates, if applicable.
(e) The benefits derived from expense reductions had an impact of less than 0.01%.
The accompanying Notes to Financial Statements are an integral part of this statement.
Annual Report 2013
19
Columbia Mid Cap Value Fund
Financial Highlights (continued)
| | | Year Ended
February 28, | | Year Ended
February 29, | | Year Ended February 28, | |
Class B | | 2013 | | 2012 | | 2011 | | 2010 | | 2009 | |
Per share data | |
Net asset value, beginning of period | | $ | 13.52 | | | $ | 13.89 | | | $ | 10.94 | | | $ | 6.73 | | | $ | 12.86 | | |
Income from investment operations: | |
Net investment income (loss) | | | 0.00 | (b) | | | (0.02 | ) | | | 0.03 | (a) | | | 0.00 | (b) | | | 0.02 | | |
Net realized and unrealized gain (loss) | | | 2.06 | | | | (0.34 | ) | | | 3.01 | | | | 4.23 | | | | (6.11 | ) | |
Total from investment operations | | | 2.06 | | | | (0.36 | ) | | | 3.04 | | | | 4.23 | | | | (6.09 | ) | |
Less distributions to shareholders: | |
Net investment income | | | (0.02 | ) | | | (0.01 | ) | | | (0.09 | ) | | | (0.02 | ) | | | (0.03 | ) | |
Tax return of capital | | | — | | | | — | | | | — | | | | (0.00 | )(b) | | | (0.01 | ) | |
Total distributions to shareholders | | | (0.02 | ) | | | (0.01 | ) | | | (0.09 | ) | | | (0.02 | ) | | | (0.04 | ) | |
Proceeds from regulatory settlements | | | — | | | | 0.00 | (b) | | | 0.00 | (b) | | | 0.00 | (b) | | | — | | |
Net asset value, end of period | | $ | 15.56 | | | $ | 13.52 | | | $ | 13.89 | | | $ | 10.94 | | | $ | 6.73 | | |
Total return | | | 15.22 | % | | | (2.55 | %) | | | 27.89 | % | | | 62.86 | % | | | (47.41 | %) | |
Ratios to average net assets(c) | |
Total gross expenses | | | 1.94 | % | | | 1.93 | % | | | 1.88 | % | | | 1.92 | % | | | 1.92 | % | |
Total net expenses(d) | | | 1.94 | %(e) | | | 1.93 | %(e) | | | 1.88 | %(e) | | | 1.92 | %(e) | | | 1.92 | %(e) | |
Net investment income (loss) | | | 0.01 | % | | | (0.19 | %) | | | 0.28 | % | | | (0.01 | %) | | | 0.18 | % | |
Supplemental data | |
Net assets, end of period (in thousands) | | $ | 16,759 | | | $ | 22,740 | | | $ | 44,651 | | | $ | 68,110 | | | $ | 66,254 | | |
Portfolio turnover | | | 36 | % | | | 39 | % | | | 50 | % | | | 56 | % | | | 46 | % | |
Notes to Financial Highlights
(a) Net investment income per share reflects special dividends. The effect of these dividends amounted to $0.08 per share.
(b) Rounds to zero.
(c) In addition to the fees and expenses which the Fund bears directly, the Fund indirectly bears a pro rata share of the fees and expenses of the acquired funds in which it invests. Such indirect expenses are not included in the reported expense ratios.
(d) Total net expenses include the impact of certain waivers/reimbursements made by the Investment Manager and certain of its affiliates, if applicable.
(e) The benefits derived from expense reductions had an impact of less than 0.01%.
The accompanying Notes to Financial Statements are an integral part of this statement.
Annual Report 2013
20
Columbia Mid Cap Value Fund
Financial Highlights (continued)
| | | Year Ended
February 28, | | Year Ended
February 29, | | Year Ended February 28, | |
Class C | | 2013 | | 2012 | | 2011 | | 2010 | | 2009 | |
Per share data | |
Net asset value, beginning of period | | $ | 13.57 | | | $ | 13.94 | | | $ | 10.98 | | | $ | 6.75 | | | $ | 12.90 | | |
Income from investment operations: | |
Net investment income (loss) | | | 0.00 | (b) | | | (0.02 | ) | | | 0.04 | (a) | | | 0.00 | (b) | | | 0.02 | | |
Net realized and unrealized gain (loss) | | | 2.07 | | | | (0.34 | ) | | | 3.01 | | | | 4.25 | | | | (6.13 | ) | |
Total from investment operations | | | 2.07 | | | | (0.36 | ) | | | 3.05 | | | | 4.25 | | | | (6.11 | ) | |
Less distributions to shareholders: | |
Net investment income | | | (0.02 | ) | | | (0.01 | ) | | | (0.09 | ) | | | (0.02 | ) | | | (0.03 | ) | |
Tax return of capital | | | — | | | | — | | | | — | | | | (0.00 | )(b) | | | (0.01 | ) | |
Total distributions to shareholders | | | (0.02 | ) | | | (0.01 | ) | | | (0.09 | ) | | | (0.02 | ) | | | (0.04 | ) | |
Proceeds from regulatory settlements | | | — | | | | 0.00 | (b) | | | 0.00 | (b) | | | 0.00 | (b) | | | — | | |
Net asset value, end of period | | $ | 15.62 | | | $ | 13.57 | | | $ | 13.94 | | | $ | 10.98 | | | $ | 6.75 | | |
Total return | | | 15.24 | % | | | (2.54 | %) | | | 27.88 | % | | | 62.97 | % | | | (47.42 | %) | |
Ratios to average net assets(c) | |
Total gross expenses | | | 1.94 | % | | | 1.93 | % | | | 1.88 | % | | | 1.92 | % | | | 1.92 | % | |
Total net expenses(d) | | | 1.94 | %(e) | | | 1.93 | %(e) | | | 1.88 | %(e) | | | 1.92 | %(e) | | | 1.92 | %(e) | |
Net investment income (loss) | | | 0.00 | %(b) | | | (0.17 | %) | | | 0.30 | % | | | (0.03 | %) | | | 0.19 | % | |
Supplemental data | |
Net assets, end of period (in thousands) | | $ | 115,248 | | | $ | 125,463 | | | $ | 173,457 | | | $ | 181,941 | | | $ | 144,370 | | |
Portfolio turnover | | | 36 | % | | | 39 | % | | | 50 | % | | | 56 | % | | | 46 | % | |
Notes to Financial Highlights
(a) Net investment income per share reflects special dividends. The effect of these dividends amounted to $0.08 per share.
(b) Rounds to zero.
(c) In addition to the fees and expenses which the Fund bears directly, the Fund indirectly bears a pro rata share of the fees and expenses of the acquired funds in which it invests. Such indirect expenses are not included in the reported expense ratios.
(d) Total net expenses include the impact of certain waivers/reimbursements made by the Investment Manager and certain of its affiliates, if applicable.
(e) The benefits derived from expense reductions had an impact of less than 0.01%.
The accompanying Notes to Financial Statements are an integral part of this statement.
Annual Report 2013
21
Columbia Mid Cap Value Fund
Financial Highlights (continued)
Class I | | Year Ended
February 28,
2013 | | Year Ended
February 29,
2012 | | Year Ended
February 28,
2011(a) | |
Per share data | |
Net asset value, beginning of period | | $ | 13.91 | | | $ | 14.24 | | | $ | 11.68 | | |
Income from investment operations: | |
Net investment income | | | 0.17 | | | | 0.13 | | | | 0.03 | | |
Net realized and unrealized gain (loss) | | | 2.12 | | | | (0.33 | ) | | | 2.58 | | |
Total from investment operations | | | 2.29 | | | | (0.20 | ) | | | 2.61 | | |
Less distributions to shareholders: | |
Net investment income | | | (0.17 | ) | | | (0.13 | ) | | | (0.05 | ) | |
Total distributions to shareholders | | | (0.17 | ) | | | (0.13 | ) | | | (0.05 | ) | |
Proceeds from regulatory settlements | | | — | | | | 0.00 | (b) | | | — | | |
Net asset value, end of period | | $ | 16.03 | | | $ | 13.91 | | | $ | 14.24 | | |
Total return | | | 16.61 | % | | | (1.32 | %) | | | 22.40 | % | |
Ratios to average net assets(c) | |
Total gross expenses | | | 0.74 | % | | | 0.73 | % | | | 0.72 | %(d) | |
Total net expenses(e) | | | 0.74 | % | | | 0.73 | % | | | 0.72 | %(d) | |
Net investment income | | | 1.19 | % | | | 1.03 | % | | | 0.53 | %(d) | |
Supplemental data | |
Net assets, end of period (in thousands) | | $ | 160,368 | | | $ | 143,562 | | | $ | 150,603 | | |
Portfolio turnover | | | 36 | % | | | 39 | % | | | 50 | % | |
Notes to Financial Highlights
(a) For the period from September 27, 2010 (commencement of operations) to February 28, 2011.
(b) Rounds to zero.
(c) In addition to the fees and expenses which the Fund bears directly, the Fund indirectly bears a pro rata share of the fees and expenses of the acquired funds in which it invests. Such indirect expenses are not included in the reported expense ratios.
(d) Annualized.
(e) Total net expenses include the impact of certain waivers/reimbursements made by the Investment Manager and certain of its affiliates, if applicable.
The accompanying Notes to Financial Statements are an integral part of this statement.
Annual Report 2013
22
Columbia Mid Cap Value Fund
Financial Highlights (continued)
Class K(a) | | Year Ended
February 28,
2013 | | Year Ended
February 29,
2012(b) | |
Per share data | |
Net asset value, beginning of period | | $ | 13.94 | | | $ | 14.06 | | |
Income from investment operations: | |
Net investment income | | | 0.13 | | | | 0.11 | | |
Net realized and unrealized gain (loss) | | | 2.13 | | | | (0.15 | ) | |
Total from investment operations | | | 2.26 | | | | (0.04 | ) | |
Less distributions to shareholders: | |
Net investment income | | | (0.13 | ) | | | (0.08 | ) | |
Total distributions to shareholders | | | (0.13 | ) | | | (0.08 | ) | |
Proceeds from regulatory settlements | | | — | | | | 0.00 | (c) | |
Net asset value, end of period | | $ | 16.07 | | | $ | 13.94 | | |
Total return | | | 16.31 | % | | | (0.23 | %) | |
Ratios to average net assets(d) | |
Total gross expenses | | | 1.04 | % | | | 1.05 | %(e) | |
Total net expenses(f) | | | 1.01 | % | | | 1.03 | %(e) | |
Net investment income | | | 0.93 | % | | | 0.86 | %(e) | |
Supplemental data | |
Net assets, end of period (in thousands) | | $ | 14 | | | $ | 12 | | |
Portfolio turnover | | | 36 | % | | | 39 | % | |
Notes to Financial Highlights
(a) Effective October 25, 2012, Class R4 shares were renamed Class K shares.
(b) For the period from March 7, 2011 (commencement of operations) to February 29, 2012.
(c) Rounds to zero.
(d) In addition to the fees and expenses which the Fund bears directly, the Fund indirectly bears a pro rata share of the fees and expenses of the acquired funds in which it invests. Such indirect expenses are not included in the reported expense ratios.
(e) Annualized.
(f) Total net expenses include the impact of certain waivers/reimbursements made by the Investment Manager and certain of its affiliates, if applicable.
The accompanying Notes to Financial Statements are an integral part of this statement.
Annual Report 2013
23
Columbia Mid Cap Value Fund
Financial Highlights (continued)
| | | Year Ended
February 28, | | Year Ended
February 29, | | Year Ended February 28, | |
Class R | | 2013 | | 2012 | | 2011 | | 2010 | | 2009 | |
Per share data | |
Net asset value, beginning of period | | $ | 13.89 | | | $ | 14.23 | | | $ | 11.18 | | | $ | 6.87 | | | $ | 13.11 | | |
Income from investment operations: | |
Net investment income | | | 0.07 | | | | 0.01 | | | | 0.10 | (a) | | | 0.04 | | | | 0.09 | | |
Net realized and unrealized gain (loss) | | | 2.11 | | | | (0.31 | ) | | | 3.07 | | | | 4.33 | | | | (6.24 | ) | |
Total from investment operations | | | 2.18 | | | | (0.30 | ) | | | 3.17 | | | | 4.37 | | | | (6.15 | ) | |
Less distributions to shareholders: | |
Net investment income | | | (0.07 | ) | | | (0.04 | ) | | | (0.12 | ) | | | (0.05 | ) | | | (0.08 | ) | |
Tax return of capital | | | — | | | | — | | | | — | | | | (0.01 | ) | | | (0.01 | ) | |
Total distributions to shareholders | | | (0.07 | ) | | | (0.04 | ) | | | (0.12 | ) | | | (0.06 | ) | | | (0.09 | ) | |
Proceeds from regulatory settlements | | | — | | | | 0.00 | (b) | | | 0.00 | (b) | | | 0.00 | (b) | | | — | | |
Net asset value, end of period | | $ | 16.00 | | | $ | 13.89 | | | $ | 14.23 | | | $ | 11.18 | | | $ | 6.87 | | |
Total return | | | 15.76 | % | | | (2.04 | %) | | | 28.53 | % | | | 63.69 | % | | | (47.13 | %) | |
Ratios to average net assets(c) | |
Total gross expenses | | | 1.44 | % | | | 1.45 | % | | | 1.38 | % | | | 1.42 | % | | | 1.42 | % | |
Total net expenses(d) | | | 1.44 | %(e) | | | 1.43 | %(e) | | | 1.38 | %(e) | | | 1.42 | %(e) | | | 1.42 | %(e) | |
Net investment income | | | 0.50 | % | | | 0.15 | % | | | 0.80 | % | | | 0.44 | % | | | 0.94 | % | |
Supplemental data | |
Net assets, end of period (in thousands) | | $ | 58,923 | | | $ | 80,096 | | | $ | 337,001 | | | $ | 276,046 | | | $ | 145,227 | | |
Portfolio turnover | | | 36 | % | | | 39 | % | | | 50 | % | | | 56 | % | | | 46 | % | |
Notes to Financial Highlights
(a) Net investment income per share reflects special dividends. The effect of these dividends amounted to $0.08 per share.
(b) Rounds to zero.
(c) In addition to the fees and expenses which the Fund bears directly, the Fund indirectly bears a pro rata share of the fees and expenses of the acquired funds in which it invests. Such indirect expenses are not included in the reported expense ratios.
(d) Total net expenses include the impact of certain waivers/reimbursements made by the Investment Manager and certain of its affiliates, if applicable.
(e) The benefits derived from expense reductions had an impact of less than 0.01%.
The accompanying Notes to Financial Statements are an integral part of this statement.
Annual Report 2013
24
Columbia Mid Cap Value Fund
Financial Highlights (continued)
Class R4 | | Year Ended
February 28,
2013(a) | |
Per share data | |
Net asset value, beginning of period | | $ | 14.24 | | |
Income from investment operations: | |
Net investment income | | | 0.06 | | |
Net realized and unrealized gain | | | 2.00 | | |
Total from investment operations | | | 2.06 | | |
Less distributions to shareholders: | |
Net investment income | | | (0.04 | ) | |
Total distributions to shareholders | | | (0.04 | ) | |
Net asset value, end of period | | $ | 16.26 | | |
Total return | | | 14.49 | % | |
Ratios to average net assets(b) | |
Total gross expenses | | | 0.85 | %(c) | |
Total net expenses(d) | | | 0.85 | %(c) | |
Net investment income | | | 1.19 | %(c) | |
Supplemental data | |
Net assets, end of period (in thousands) | | $ | 3 | | |
Portfolio turnover | | | 36 | % | |
Notes to Financial Highlights
(a) For the period from November 8, 2012 (commencement of operations) to February 28, 2013.
(b) In addition to the fees and expenses which the Fund bears directly, the Fund indirectly bears a pro rata share of the fees and expenses of the acquired funds in which it invests. Such indirect expenses are not included in the reported expense ratios.
(c) Annualized.
(d) Total net expenses include the impact of certain waivers/reimbursements made by the Investment Manager and certain of its affiliates, if applicable.
The accompanying Notes to Financial Statements are an integral part of this statement.
Annual Report 2013
25
Columbia Mid Cap Value Fund
Financial Highlights (continued)
Class R5 | | Year Ended
February 28,
2013(a) | |
Per share data | |
Net asset value, beginning of period | | $ | 14.24 | | |
Income from investment operations: | |
Net investment income | | | 0.06 | | |
Net realized and unrealized gain | | | 2.00 | | |
Total from investment operations | | | 2.06 | | |
Less distributions to shareholders: | |
Net investment income | | | (0.04 | ) | |
Total distributions to shareholders | | | (0.04 | ) | |
Net asset value, end of period | | $ | 16.26 | | |
Total return | | | 14.52 | % | |
Ratios to average net assets(b) | |
Total gross expenses | | | 0.77 | %(c) | |
Total net expenses(d) | | | 0.77 | %(c) | |
Net investment income | | | 1.28 | %(c) | |
Supplemental data | |
Net assets, end of period (in thousands) | | $ | 3 | | |
Portfolio turnover | | | 36 | % | |
Notes to Financial Highlights
(a) For the period from November 8, 2012 (commencement of operations) to February 28, 2013.
(b) In addition to the fees and expenses which the Fund bears directly, the Fund indirectly bears a pro rata share of the fees and expenses of the acquired funds in which it invests. Such indirect expenses are not included in the reported expense ratios.
(c) Annualized.
(d) Total net expenses include the impact of certain waivers/reimbursements made by the Investment Manager and certain of its affiliates, if applicable.
The accompanying Notes to Financial Statements are an integral part of this statement.
Annual Report 2013
26
Columbia Mid Cap Value Fund
Financial Highlights (continued)
Class W | | Year Ended
February 28,
2013 | | Year Ended
February 29,
2012 | | Year Ended
February 28,
2011(a) | |
Per share data | |
Net asset value, beginning of period | | $ | 13.91 | | | $ | 14.24 | | | $ | 11.69 | | |
Income from investment operations: | |
Net investment income | | | 0.11 | | | | 0.09 | | | | 0.02 | | |
Net realized and unrealized gain (loss) | | | 2.11 | | | | (0.35 | ) | | | 2.57 | | |
Total from investment operations | | | 2.22 | | | | (0.26 | ) | | | 2.59 | | |
Less distributions to shareholders: | |
Net investment income | | | (0.10 | ) | | | (0.07 | ) | | | (0.04 | ) | |
Total distributions to shareholders | | | (0.10 | ) | | | (0.07 | ) | | | (0.04 | ) | |
Proceeds from regulatory settlements | | | — | | | | 0.00 | (b) | | | — | | |
Net asset value, end of period | | $ | 16.03 | | | $ | 13.91 | | | $ | 14.24 | | |
Total return | | | 16.09 | % | | | (1.74 | %) | | | 22.17 | % | |
Ratios to average net assets(c) | |
Total gross expenses | | | 1.19 | % | | | 1.19 | % | | | 1.14 | %(d) | |
Total net expenses(e) | | | 1.19 | %(f) | | | 1.19 | %(f) | | | 1.14 | %(d)(f) | |
Net investment income | | | 0.74 | % | | | 0.69 | % | | | 0.34 | %(d) | |
Supplemental data | |
Net assets, end of period (in thousands) | | $ | 79,581 | | | $ | 77,367 | | | $ | 3 | | |
Portfolio turnover | | | 36 | % | | | 39 | % | | | 50 | % | |
Notes to Financial Highlights
(a) For the period from September 27, 2010 (commencement of operations) to February 28, 2011.
(b) Rounds to zero.
(c) In addition to the fees and expenses which the Fund bears directly, the Fund indirectly bears a pro rata share of the fees and expenses of the acquired funds in which it invests. Such indirect expenses are not included in the reported expense ratios.
(d) Annualized.
(e) Total net expenses include the impact of certain waivers/reimbursements made by the Investment Manager and certain of its affiliates, if applicable.
(f) The benefits derived from expense reductions had an impact of less than 0.01%.
The accompanying Notes to Financial Statements are an integral part of this statement.
Annual Report 2013
27
Columbia Mid Cap Value Fund
Financial Highlights (continued)
| | | Year Ended
February 28, | | Year Ended
February 29, | | Year Ended February 28, | |
Class Y | | 2013 | | 2012 | | 2011 | | 2010(a) | |
Per share data | |
Net asset value, beginning of period | | $ | 13.91 | | | $ | 14.24 | | | $ | 11.18 | | | $ | 8.86 | | |
Income from investment operations: | |
Net investment income | | | 0.18 | | | | 0.13 | | | | 0.16 | (b) | | | 0.08 | | |
Net realized and unrealized gain (loss) | | | 2.09 | | | | (0.34 | ) | | | 3.08 | | | | 2.31 | | |
Total from investment operations | | | 2.27 | | | | (0.21 | ) | | | 3.24 | | | | 2.39 | | |
Less distributions to shareholders: | |
Net investment income | | | (0.15 | ) | | | (0.12 | ) | | | (0.18 | ) | | | (0.06 | ) | |
Tax return of capital | | | — | | | | — | | | | — | | | | (0.01 | ) | |
Total distributions to shareholders | | | (0.15 | ) | | | (0.12 | ) | | | (0.18 | ) | | | (0.07 | ) | |
Proceeds from regulatory settlements | | | — | | | | 0.00 | (c) | | | 0.00 | (c) | | | 0.00 | (c) | |
Net asset value, end of period | | $ | 16.03 | | | $ | 13.91 | | | $ | 14.24 | | | $ | 11.18 | | |
Total return | | | 16.50 | % | | | (1.40 | %) | | | 29.23 | % | | | 27.00 | % | |
Ratios to average net assets(d) | |
Total gross expenses | | | 0.77 | % | | | 0.82 | % | | | 0.81 | % | | | 0.76 | %(e) | |
Total net expenses(f) | | | 0.77 | % | | | 0.82 | % | | | 0.81 | %(g) | | | 0.76 | %(e)(g) | |
Net investment income | | | 1.19 | % | | | 0.97 | % | | | 1.25 | % | | | 1.28 | %(e) | |
Supplemental data | |
Net assets, end of period (in thousands) | | $ | 4,975 | | | $ | 32 | | | $ | 33 | | | $ | 13 | | |
Portfolio turnover | | | 36 | % | | | 39 | % | | | 50 | % | | | 56 | % | |
Notes to Financial Highlights
(a) For the period from July 15, 2009 (commencement of operations) to February 28, 2010.
(b) Net investment income per share reflects special dividends. The effect of these dividends amounted to $0.08 per share.
(c) Rounds to zero.
(d) In addition to the fees and expenses which the Fund bears directly, the Fund indirectly bears a pro rata share of the fees and expenses of the acquired funds in which it invests. Such indirect expenses are not included in the reported expense ratios.
(e) Annualized.
(f) Total net expenses include the impact of certain waivers/reimbursements made by the Investment Manager and certain of its affiliates, if applicable.
(g) The benefits derived from expense reductions had an impact of less than 0.01%.
The accompanying Notes to Financial Statements are an integral part of this statement.
Annual Report 2013
28
Columbia Mid Cap Value Fund
Financial Highlights (continued)
| | | Year Ended
February 28, | | Year Ended
February 29, | | Year Ended February 28, | |
Class Z | | 2013 | | 2012 | | 2011 | | 2010 | | 2009 | |
Per share data | |
Net asset value, beginning of period | | $ | 13.93 | | | $ | 14.26 | | | $ | 11.20 | | | $ | 6.88 | | | $ | 13.13 | | |
Income from investment operations: | |
Net investment income | | | 0.14 | | | | 0.11 | | | | 0.16 | (a) | | | 0.09 | | | | 0.14 | | |
Net realized and unrealized gain (loss) | | | 2.12 | | | | (0.33 | ) | | | 3.07 | | | | 4.33 | | | | (6.25 | ) | |
Total from investment operations | | | 2.26 | | | | (0.22 | ) | | | 3.23 | | | | 4.42 | | | | (6.11 | ) | |
Less distributions to shareholders: | |
Net investment income | | | (0.14 | ) | | | (0.11 | ) | | | (0.17 | ) | | | (0.09 | ) | | | (0.13 | ) | |
Tax return of capital | | | — | | | | — | | | | — | | | | (0.01 | ) | | | (0.01 | ) | |
Total distributions to shareholders | | | (0.14 | ) | | | (0.11 | ) | | | (0.17 | ) | | | (0.10 | ) | | | (0.14 | ) | |
Proceeds from regulatory settlements | | | — | | | | 0.00 | (b) | | | 0.00 | (b) | | | 0.00 | (b) | | | — | | |
Net asset value, end of period | | $ | 16.05 | | | $ | 13.93 | | | $ | 14.26 | | | $ | 11.20 | | | $ | 6.88 | | |
Total return | | | 16.36 | % | | | (1.50 | %) | | | 29.14 | % | | | 64.55 | % | | | (46.87 | %) | |
Ratios to average net assets(c) | |
Total gross expenses | | | 0.94 | % | | | 0.93 | % | | | 0.88 | % | | | 0.92 | % | | | 0.92 | % | |
Total net expenses(d) | | | 0.94 | %(e) | | | 0.93 | %(e) | | | 0.88 | %(e) | | | 0.92 | %(e) | | | 0.92 | %(e) | |
Net investment income | | | 1.01 | % | | | 0.85 | % | | | 1.30 | % | | | 0.95 | % | | | 1.23 | % | |
Supplemental data | |
Net assets, end of period (in thousands) | | $ | 2,298,515 | | | $ | 2,460,299 | | | $ | 2,859,249 | | | $ | 2,419,305 | | | $ | 1,459,522 | | |
Portfolio turnover | | | 36 | % | | | 39 | % | | | 50 | % | | | 56 | % | | | 46 | % | |
Notes to Financial Highlights
(a) Net investment income per share reflects special dividends. The effect of these dividends amounted to $0.08 per share.
(b) Rounds to zero.
(c) In addition to the fees and expenses which the Fund bears directly, the Fund indirectly bears a pro rata share of the fees and expenses of the acquired funds in which it invests. Such indirect expenses are not included in the reported expense ratios.
(d) Total net expenses include the impact of certain waivers/reimbursements made by the Investment Manager and certain of its affiliates, if applicable.
(e) The benefits derived from expense reductions had an impact of less than 0.01%.
The accompanying Notes to Financial Statements are an integral part of this statement.
Annual Report 2013
29
Columbia Mid Cap Value Fund
Notes to Financial Statements
February 28, 2013
Note 1. Organization
Columbia Mid Cap Value Fund (the Fund), a series of Columbia Funds Series Trust (the Trust), is a diversified fund. The Trust is registered under the Investment Company Act of 1940, as amended (the 1940 Act), as an open-end management investment company organized as a Delaware statutory trust.
Fund Shares
The Trust may issue an unlimited number of shares (without par value). The Fund offers Class A, Class B, Class C, Class I, Class K, Class R, Class R4, Class R5, Class W, Class Y and Class Z shares. All share classes have identical voting, dividend and liquidation rights. Each share class has its own expense structure and sales charges, as applicable.
Class A shares are subject to a maximum front-end sales charge of 5.75% based on the initial investment amount. Class A shares purchased without an initial sales charge in accounts aggregating $1 million to $50 million at the time of purchase are subject to a contingent deferred sales charge (CDSC) if the shares are sold within 18 months of purchase, charged as follows: 1.00% CDSC if redeemed within 12 months of purchase, and 0.50% CDSC if redeemed more than 12, but less than 18, months after purchase.
Class B shares may be subject to a maximum CDSC of 5.00% based upon the holding period after purchase. Class B shares will generally convert to Class A shares eight years after purchase. The Fund no longer accepts investments by new or existing investors in the Fund's Class B shares, except in connection with the reinvestment of any dividend and/or capital gain distributions in Class B shares of the Fund and exchanges by existing Class B shareholders of certain other funds within the Columbia Family of Funds.
Class C shares are subject to a 1.00% CDSC on shares redeemed within one year of purchase.
Class I shares are not subject to sales charges and are only available to the Columbia Family of Funds.
Class K shares (formerly Class R4 shares) are not subject to sales charges; however, this share class is closed to new investors. Effective October 25, 2012, Class R4 shares were renamed Class K shares.
Class R shares are not subject to sales charges and are only available to qualifying institutional investors.
Class R4 shares are not subject to sales charges and are only available to investors purchasing through authorized investment professionals. Class R4 shares commenced operations on November 8, 2012.
Class R5 shares are not subject to sales charges and are only available to investors purchasing through authorized
investment professionals. Class R5 shares commenced operations on November 8, 2012.
Class W shares are not subject to sales charges and are only available to investors purchasing through authorized investment programs managed by investment professionals, including discretionary managed account programs.
Class Y shares are not subject to sales charges and are only available to certain categories of investors which are subject to minimum initial investment requirements.
Class Z shares are not subject to sales charges, and are only available to certain investors.
Note 2. Summary of Significant Accounting Policies
Use of Estimates
The preparation of financial statements in accordance with U.S. generally accepted accounting principles (GAAP) requires management to make certain estimates and assumptions that affect the reported amounts of assets and liabilities, the disclosure of contingent assets and liabilities at the date of the financial statements and the reported amounts of revenue and expenses during the reporting period. Actual results could differ from those estimates.
The following is a summary of significant accounting policies consistently followed by the Fund in the preparation of its financial statements.
Security Valuation
All equity securities are valued at the close of business of the New York Stock Exchange (NYSE). Equity securities are valued at the last quoted sales price on the principal exchange or market on which they trade, except for securities traded on the NASDAQ Stock Market, which are valued at the NASDAQ official close price. Unlisted securities or listed securities for which there were no sales during the day are valued at the mean of the latest quoted bid and ask prices on such exchanges or markets.
Foreign securities are valued based on quotations from the principal market in which such securities are normally traded. If any foreign share prices are not readily available as a result of limited share activity the securities are valued at the mean of the latest quoted bid and ask prices on such exchanges or markets. Foreign currency exchange rates are generally determined at 4:00 p.m. Eastern (U.S.) time. However, many securities markets and exchanges outside the U.S. close prior to the close of the NYSE; therefore, the closing prices for securities in such markets or on such exchanges may not fully reflect events that occur after such close but before the close of the NYSE. In those situations, foreign securities will be fair
Annual Report 2013
30
Columbia Mid Cap Value Fund
Notes to Financial Statements (continued)
February 28, 2013
valued pursuant to the policy adopted by the Board of Trustees (the Board), including utilizing a third party pricing service to determine these fair values. The third party pricing service takes into account multiple factors, including, but not limited to, movements in the U.S. securities markets, certain depositary receipts, futures contracts and foreign exchange rates that have occurred subsequent to the close of the foreign exchange or market, to determine a good faith estimate that reasonably reflects the current market conditions as of the close of the NYSE. The fair value of a security is likely to be different from the quoted or published price, if available.
Investments in other open-end investment companies, including money market funds, are valued at net asset value.
Investments for which market quotations are not readily available, or that have quotations which management believes are not reliable, are valued at fair value as determined in good faith under consistently applied procedures established by and under the general supervision of the Board. If a security or class of securities (such as foreign securities) is valued at fair value, such value is likely to be different from the last quoted market price for the security.
The determination of fair value often requires significant judgment. To determine fair value, management may use assumptions including but not limited to future cash flows and estimated risk premiums. Multiple inputs from various sources may be used to determine fair value.
Foreign Currency Transactions and Translations
The values of all assets and liabilities denominated in foreign currencies are translated into U.S. dollars at that day's exchange rates. Net realized and unrealized gains (losses) on foreign currency transactions and translations include gains (losses) arising from the fluctuation in exchange rates between trade and settlement dates on securities transactions, gains (losses) arising from the disposition of foreign currency and currency gains (losses) between the accrual and payment dates on dividends, interest income and foreign withholding taxes.
For financial statement purposes, the Fund does not distinguish that portion of gains (losses) on investments which is due to changes in foreign exchange rates from that which is due to changes in market prices of the investments. Such fluctuations are included with the net realized and unrealized gains (losses) on investments in the Statement of Operations.
Security Transactions
Security transactions are accounted for on the trade date. Cost is determined and gains (losses) are based upon the specific identification method for both financial statement and federal income tax purposes.
Income Recognition
Corporate actions and dividend income are recorded net of any non-reclaimable tax withholdings, on the ex-dividend date or upon receipt of ex-dividend notification in the case of certain foreign securities.
The Fund may receive distributions from holdings in business development companies (BDCs), exchange traded funds (ETFs) and real estate investment trusts (REITs), which report information on the character of their distributions annually. These distributions are allocated to dividend income, capital gain and return of capital based on estimates made by the Fund's management if actual information has not yet been reported. Return of capital is recorded as a reduction of the cost basis of securities held. If the Fund no longer owns the applicable securities, return of capital is recorded as a realized gain. Management's estimates are subsequently adjusted when the actual character of the distributions is disclosed by the BDCs, ETFs and REITs, which could result in a proportionate change in return of capital to shareholders.
Awards from class action litigation are recorded as a reduction of cost basis if the Fund still owns the applicable securities on the payment date. If the Fund no longer owns the applicable securities, the proceeds are recorded as realized gains.
Expenses
General expenses of the Trust are allocated to the Fund and other funds of the Trust based upon relative net assets or other expense allocation methodologies determined by the nature of the expense. Expenses directly attributable to the Fund are charged to the Fund. Expenses directly attributable to a specific class of shares are charged to that share class.
Determination of Class Net Asset Value
All income, expenses (other than class-specific expenses, which are charged to that share class, as shown in the Statement of Operations) and realized and unrealized gains (losses) are allocated to each class of the Fund on a daily basis, based on the relative net assets of each class, for purposes of determining the net asset value of each class.
Federal Income Tax Status
The Fund intends to qualify each year as a regulated investment company under Subchapter M of the Internal Revenue Code, as amended, and will distribute substantially all of its tax exempt and taxable income (including net short-term capital gains), if any, for its tax year, and as such will not be subject to federal income taxes. In addition, the Fund intends to distribute in each calendar year substantially all of its net investment income, capital gains and certain other
Annual Report 2013
31
Columbia Mid Cap Value Fund
Notes to Financial Statements (continued)
February 28, 2013
amounts, if any, such that the Fund should not be subject to federal excise tax. Therefore, no federal income or excise tax provision is recorded.
Distributions to Shareholders
Distributions from net investment income, if any, are declared and paid each calendar quarter. Net realized capital gains, if any, are distributed at least annually. Income distributions and capital gain distributions are determined in accordance with federal income tax regulations, which may differ from GAAP.
Guarantees and Indemnifications
Under the Trust's organizational documents and, in some cases, by contract, its officers and trustees are indemnified against certain liabilities arising out of the performance of their duties to the Trust or its funds. In addition, certain of the Fund's contracts with its service providers contain general indemnification clauses. The Fund's maximum exposure under these arrangements is unknown since the amount of any future claims that may be made against the Fund cannot be determined, and the Fund has no historical basis for predicting the likelihood of any such claims.
Recent Accounting Pronouncement
Disclosures about Offsetting Assets and Liabilities
In December 2011, the Financial Accounting Standards Board (FASB) issued Accounting Standards Update (ASU) No. 2011-11, Disclosures about Offsetting Assets and Liabilities. The objective of the FASB is to enhance current disclosure requirements on offsetting of certain assets and liabilities and to enable financial statement users to compare financial statements prepared under GAAP and International Financial Reporting Standards.
Specifically, ASU No. 2011-11 requires an entity to disclose both gross and net information for derivatives and other financial instruments that are subject to a master netting arrangement or similar agreement. The standard requires disclosure of collateral received in connection with the master netting agreements or similar agreements. The effective date of ASU No. 2011-11 is for interim and annual periods beginning on or after January 1, 2013. At this time, management is evaluating the implications of this guidance and the impact it will have on the financial statement amounts and footnote disclosures, if any.
Note 3. Fees and Compensation Paid to Affiliates
Investment Management Fees
Under an Investment Management Services Agreement, Columbia Management Investment Advisers, LLC (the
Investment Manager), a wholly-owned subsidiary of Ameriprise Financial, Inc. (Ameriprise Financial), determines which securities will be purchased, held or sold. The investment management fee is an annual fee that is equal to a percentage of the Fund's average daily net assets that declines from 0.76% to 0.62% as the Fund's net assets increase. The annualized effective investment management fee rate for the year ended February 28, 2013 was 0.66% of the Fund's average daily net assets.
Administration Fees
Under an Administrative Services Agreement, the Investment Manager also serves as the Fund Administrator. The Fund pays the Fund Administrator an annual fee for administration and accounting services equal to a percentage of the Fund's average daily net assets that declines from 0.06% to 0.03% as the Fund's net assets increase. The annualized effective administration fee rate for the year ended February 28, 2013 was 0.05% of the Fund's average daily net assets.
Other Expenses
Other expenses are for, among other things, certain expenses of the Fund or the Board, including: Fund boardroom and office expense, employee compensation, employee health and retirement benefits, and certain other expenses. Payment of these Fund and Board expenses is facilitated by a company providing limited administrative services to the Fund and the Board. For the year ended February 28, 2013, other expenses paid to this company were $10,682.
Compensation of Board Members
Board members are compensated for their services to the Fund as disclosed in the Statement of Operations. Under a Deferred Compensation Plan (the Plan), the Board members who are not "interested persons" of the Fund, as defined under the 1940 Act, may elect to defer payment of up to 100% of their compensation. Deferred amounts are treated as though equivalent dollar amounts had been invested in shares of certain funds managed by the Investment Manager. The Fund's liability for these amounts is adjusted for market value changes and remains in the Fund until distributed in accordance with the Plan.
Transfer Agent Fees
Under a Transfer and Dividend Disbursing Agent Agreement, Columbia Management Investment Services Corp. (the Transfer Agent), an affiliate of the Investment Manager and a wholly-owned subsidiary of Ameriprise Financial, is responsible for providing transfer agency services to the Fund. The Transfer Agent has contracted with Boston Financial Data Services (BFDS) to serve as sub-transfer agent.
Annual Report 2013
32
Columbia Mid Cap Value Fund
Notes to Financial Statements (continued)
February 28, 2013
The Transfer Agent receives monthly account-based service fees based on the number of open accounts and is reimbursed by the Fund for the fees and expenses the Transfer Agent pays to financial intermediaries that maintain omnibus accounts with the Fund that is a percentage of the average aggregate value of the Fund's shares maintained in each such omnibus account (other than omnibus accounts for which American Enterprise Investment Services Inc. is the broker of record or accounts where the beneficial shareholder is a customer of Ameriprise Financial Services, Inc., which are paid a per account fee). The Transfer Agent pays the fees of BFDS for services as sub-transfer agent and is not entitled to reimbursement for such fees from the Fund (with the exception of out-of-pocket fees).
The Transfer Agent also receives compensation from fees for various shareholder services and reimbursements for certain out-of-pocket fees. Class I shares do not pay transfer agent fees. Total transfer agent fees for Class K and Class R5 shares are subject to an annual limitation of not more than 0.05% of the average daily net assets attributable to each share class. Effective November 1, 2012, Class Y shares will not pay transfer agent fees for at least twelve months.
For the year ended February 28, 2013, the Fund's effective transfer agent fee rates as a percentage of average daily net assets of each class were as follows:
Class A | | | 0.20 | % | |
Class B | | | 0.20 | | |
Class C | | | 0.20 | | |
Class K | | | 0.05 | | |
Class R | | | 0.20 | | |
Class R4* | | | 0.14 | | |
Class R5* | | | 0.05 | | |
Class W | | | 0.20 | | |
Class Y* | | | 0.00 | ** | |
Class Z | | | 0.20 | | |
*Annualized
**Rounds to zero
An annual minimum account balance fee of $20 may apply to certain accounts with a value below the Fund's initial minimum investment requirements to reduce the impact of small accounts on transfer agent fees. These minimum account balance fees are recorded as part of expense reductions in the Statement of Operations. For the year ended February 28, 2013, these minimum account balance fees reduced total expenses by $12,613.
Plan Administration Fees
Under a Plan Administration Services Agreement with the Transfer Agent, the Fund pays an annual fee at a rate of 0.25%
of the Fund's average daily net assets attributable to Class K shares for the provision of various administrative, recordkeeping, communication and educational services.
Distribution and Service Fees
The Fund has an agreement with Columbia Management Investment Distributors, Inc. (the Distributor), an affiliate of the Investment Manager and a wholly-owned subsidiary of Ameriprise Financial, for distribution and shareholder services. Pursuant to Rule 12b-1 under the 1940 Act, the Board has approved, and the Fund has adopted, distribution and shareholder service plans (the Plans) which set the distribution and service fees for the Fund. These fees are calculated daily and are intended to compensate the Distributor and/or eligible selling and/or servicing agents for selling shares of the Fund and providing services to investors.
The Plans require the payment of a monthly combined distribution and service fee to the Distributor at the maximum annual rate of 0.25% of the average daily net assets attributable to Class A shares of the Fund. The Plans also require the payment of a monthly service fee at the maximum annual rate of 0.25% of the average daily net assets attributable to Class B, Class C and Class W shares of the Fund and the payment of a monthly distribution fee at the maximum annual rates of 0.75%, 0.75%, 0.50% and 0.25% of the average daily net assets attributable to Class B, Class C, Class R and Class W shares, respectively.
The Fund may pay a distribution fee up to 0.25% of the Fund's average daily net assets attributable to Class W shares and a service fee of up to 0.25% of the Fund's average daily net assets attributable to Class W shares, provided, however, that the aggregate fee shall not exceed 0.25% of the Fund's average daily net assets attributable to Class W shares.
Sales Charges
Sales charges, including front-end charges and CDSCs, received by the Distributor for distributing Fund shares were $153,828 for Class A, $18,911 for Class B and $2,703 for Class C shares for the year ended February 28, 2013.
Expenses Waived/Reimbursed by the Investment Manager and its Affiliates
Effective July 1, 2012, the Investment Manager and certain of its affiliates have contractually agreed to waive fees and/or reimburse expenses (excluding certain fees and expenses described below), through June 30, 2013, unless sooner terminated at the sole discretion of the Board, so that the Fund's net operating expenses, after giving effect to fees waived/expenses reimbursed and any balance credits and/or overdraft charges from the Fund's custodian, do not exceed
Annual Report 2013
33
Columbia Mid Cap Value Fund
Notes to Financial Statements (continued)
February 28, 2013
the following annual rates as a percentage of the class' average daily net assets:
Class A | | | 1.27 | % | |
Class B | | | 2.02 | | |
Class C | | | 2.02 | | |
Class I | | | 0.87 | | |
Class K | | | 1.17 | | |
Class R | | | 1.52 | | |
Class R4* | | | 1.02 | | |
Class R5* | | | 0.92 | | |
Class W | | | 1.27 | | |
Class Y | | | 0.87 | | |
Class Z | | | 1.02 | | |
*Annual rate is contractual from November 8, 2012 (commencement of operations of each share class) through November 8, 2013.
Prior to July 1, 2012, the Investment Manager and certain of its affiliates contractually agreed to waive fees and/or reimburse expenses (excluding certain fees and expenses described below), so that the Fund's net operating expenses, after giving effect to fees waived/expenses reimbursed and any balance credits and/or overdraft charges from the Fund's custodian, did not exceed the following annual rates as a percentage of the class' average daily net assets:
Class A | | | 1.19 | % | |
Class B | | | 1.94 | | |
Class C | | | 1.94 | | |
Class I | | | 0.80 | | |
Class K | | | 1.10 | | |
Class R | | | 1.44 | | |
Class W | | | 1.19 | | |
Class Y | | | 0.94 | | |
Class Z | | | 0.94 | | |
Under the agreement, the following fees and expenses are excluded from the waiver/reimbursement commitment, and therefore will be paid by the Fund, if applicable: taxes (including foreign transaction taxes), expenses associated with investments in affiliated and non-affiliated pooled investment vehicles (including mutual funds and exchange traded funds), transaction costs and brokerage commissions, costs related to any securities lending program, dividend expenses associated with securities sold short, inverse floater program fees and expenses, transaction charges and interest on borrowed money, interest, extraordinary expenses and any other expenses the exclusion of which is specifically approved by the Board. This agreement may be modified or amended only with approval from all parties.
Note 4. Federal Tax Information
The timing and character of income and capital gain distributions are determined in accordance with income tax regulations, which may differ from GAAP because of temporary or permanent book to tax differences.
At February 28, 2013, these differences are primarily due to differing treatment for deferral/reversal of wash sales losses, and Trustees' deferred compensation. To the extent these differences are permanent, reclassifications are made among the components of the Fund's net assets in the Statement of Assets and Liabilities. Temporary differences do not require reclassifications.
The Fund did not have any permanent differences; therefore, no reclassifications were made to the Statement of Assets and Liabilities.
The tax character of distributions paid during the years indicated was as follows:
| | | Year Ended
February 28,
2013 | | Year Ended
February 29,
2012 | |
Ordinary income | | $ | 32,404,799 | | | $ | 29,434,025 | | |
Long-term capital gains | | | — | | | | — | | |
Tax return of capital | | | — | | | | — | | |
Total | | $ | 32,404,799 | | | $ | 29,434,025 | | |
Short-term capital gain distributions, if any, are considered ordinary income distributions for tax purposes.
At February 28, 2013, the components of distributable earnings on a tax basis were as follows:
Undistributed ordinary income | | $ | 2,580,036 | | |
Undistributed accumulated long-term gain | | | 12,837,587 | | |
Unrealized appreciation | | | 901,051,300 | | |
At February 28, 2013, the cost of investments for federal income tax purposes was $2,837,492,842 and the aggregate gross unrealized appreciation and depreciation based on that cost was:
Unrealized appreciation | | $ | 983,292,601 | | |
Unrealized depreciation | | | (82,241,301 | ) | |
Net unrealized appreciation | | | 901,051,300 | | |
For the year ended February 28, 2013, $308,216,178 of capital loss carryforward was utilized.
Management of the Fund has concluded that there are no significant uncertain tax positions that would require recognition in the financial statements. However, management's conclusion may be subject to review and adjustment at a later date based on factors including, but not
Annual Report 2013
34
Columbia Mid Cap Value Fund
Notes to Financial Statements (continued)
February 28, 2013
limited to, new tax laws, regulations, and administrative interpretations (including relevant court decisions). Generally, the Fund's federal tax returns for the prior three fiscal years remain subject to examination by the Internal Revenue Service.
Note 5. Portfolio Information
The cost of purchases and proceeds from sales of securities, excluding short-term obligations, aggregated to $1,298,750,026 and $2,055,277,979, respectively, for the year ended February 28, 2013.
Note 6. Regulatory Settlements
During the year ended February 29, 2012, the Fund received $236,136 as a result of a regulatory settlement proceeding brought by the Securities and Exchange Commission against an unaffiliated third party relating to market timing and/or late trading of mutual funds. This amount represented the Fund's portion of the proceeds from the settlement (the Fund was not a party to the proceeding). The payments have been included in "Proceeds from regulatory settlements" in the Statement of Changes in Net Assets.
Note 7. Lending of Portfolio Securities
Effective December 19, 2012, the Fund no longer participates in securities lending activity. Prior to that date, the Fund participated, or was eligible to participate, in securities lending activity pursuant to a Master Securities Lending Agreement (the Agreement) with JPMorgan Chase Bank, N.A. (JPMorgan). The Agreement authorized JPMorgan as lending agent to lend securities to authorized borrowers in order to generate additional income on behalf of the Fund. Pursuant to the Agreement, the securities loaned were secured by cash or securities that either were issued or guaranteed as to principal and interest by the U.S. government, its agencies, authorities or instrumentalities with value equal to at least 100% of the market value of the loaned securities. Any additional collateral required to maintain those levels due to market fluctuations of the loaned securities was requested to be delivered the following business day. Cash collateral received was invested by the lending agent on behalf of the Fund into authorized investments pursuant to the Agreement.
Pursuant to the Agreement, the Fund received income for lending its securities either in the form of fees or by earning interest on invested cash collateral, net of negotiated rebates paid to borrowers and fees paid to the lending agent for services provided and any other securities lending expenses. Net income earned from securities lending for the year ended February 28, 2013 is disclosed in the Statement of Operations. The Fund continued to earn and accrue interest and dividends on the securities loaned.
Note 8. Affiliated Money Market Fund
The Fund invests its daily cash balances in Columbia Short-Term Cash Fund, an affiliated money market fund established for the exclusive use by the Fund and other affiliated funds. The income earned by the Fund from such investments is included as "Dividends — affiliated issuers" in the Statement of Operations. As an investing fund, the Fund indirectly bears its proportionate share of the expenses of Columbia Short-Term Cash Fund.
Note 9. Shareholder Concentration
At February 28, 2013, 2 unaffiliated shareholder accounts owned an aggregate of 37.7% of the outstanding shares of the Fund. The Fund has no knowledge about whether any portion of those shares was owned beneficially by such accounts.. Subscription and redemption activity by concentrated accounts may have a significant effect on the operations of the Fund.
Note 10. Line of Credit
The Fund has entered into a revolving credit facility with a syndicate of banks led by JPMorgan whereby the Fund may borrow for the temporary funding of shareholder redemptions or for other temporary or emergency purposes. The credit facility agreement, as amended, which is a collective agreement between the Fund and certain other funds managed by the Investment Manager, severally and not jointly, permits collective borrowings up to $500 million. Interest is charged to each participating fund based on its borrowings at a rate equal to the higher of (i) the overnight federal funds rate plus 1.00% or (ii) the one-month LIBOR rate plus 1.00%. Each borrowing under the credit facility matures no later than 60 days after the date of borrowing. The Fund also pays a commitment fee equal to its pro rata share of the amount of the credit facility at a rate of 0.08% per annum.
The Fund had no borrowings during the year ended February 28, 2013.
Note 11. Risks Relating to Certain Investments
Financial Sector Risk
The Fund's portfolio managers may invest significantly in issuers operating in the financial sector. The Fund may be more susceptible to the particular risks of this sector than if the Fund were invested in a wider variety of issuers operating in unrelated sectors.
Annual Report 2013
35
Columbia Mid Cap Value Fund
Notes to Financial Statements (continued)
February 28, 2013
Note 12. Subsequent Events
Management has evaluated the events and transactions that have occurred through the date the financial statements were issued and noted no items requiring adjustment of the financial statements or additional disclosure.
Note 13. Information Regarding Pending and Settled Legal Proceedings
In December 2005, without admitting or denying the allegations, American Express Financial Corporation (AEFC, which is now known as Ameriprise Financial, Inc. (Ameriprise Financial)) entered into settlement agreements with the Securities and Exchange Commission (SEC) and Minnesota Department of Commerce (MDOC) related to market timing activities. As a result, AEFC was censured and ordered to cease and desist from committing or causing any violations of certain provisions of the Investment Advisers Act of 1940, the Investment Company Act of 1940, and various Minnesota laws. AEFC agreed to pay disgorgement of $10 million and civil money penalties of $7 million. AEFC also agreed to retain an independent distribution consultant to assist in developing a plan for distribution of all disgorgement and civil penalties ordered by the SEC in accordance with various undertakings detailed at www.sec.gov/litigation/admin/ia-2451.pdf. Ameriprise Financial and its affiliates have cooperated with the SEC and the MDOC in these legal proceedings, and have made regular reports to the funds' Boards of Trustees.
Ameriprise Financial and certain of its affiliates have historically been involved in a number of legal, arbitration and regulatory proceedings, including routine litigation, class actions, and governmental actions, concerning matters arising in connection with the conduct of their business activities. Ameriprise Financial believes that the Funds are not currently the subject of, and that neither Ameriprise Financial nor any of its affiliates are the subject of, any pending legal, arbitration or regulatory proceedings that are likely to have a material adverse effect on the Funds or the ability of Ameriprise Financial or its affiliates to perform under their contracts with the Funds. Ameriprise Financial is required to make 10-Q, 10-K and, as necessary, 8-K filings with the Securities and Exchange Commission on legal and regulatory matters that relate to Ameriprise Financial and its affiliates. Copies of these filings may be obtained by accessing the SEC website at www.sec.gov.
There can be no assurance that these matters, or the adverse publicity associated with them, will not result in increased fund redemptions, reduced sale of fund shares or other adverse consequences to the Funds. Further, although we believe proceedings are not likely to have a material adverse effect on the Funds or the ability of Ameriprise Financial or its affiliates to perform under their contracts with the Funds, these proceedings are subject to uncertainties and, as such, we are unable to estimate the possible loss or range of loss that may result. An adverse outcome in one or more of these proceedings could result in adverse judgments, settlements, fines, penalties or other relief that could have a material adverse effect on the consolidated financial condition or results of operations of Ameriprise Financial.
Annual Report 2013
36
Columbia Mid Cap Value Fund
Report of Independent Registered Public Accounting Firm
To the Trustees of Columbia Funds Series Trust and the Shareholders of
Columbia Mid Cap Value Fund
In our opinion, the accompanying statement of assets and liabilities, including the portfolio of investments, and the related statements of operations and of changes in net assets and the financial highlights present fairly, in all material respects, the financial position of Columbia Mid Cap Value Fund (the "Fund") (a series of Columbia Funds Series Trust) at February 28, 2013, the results of its operations for the year then ended, the changes in its net assets for each of the two years in the period then ended and the financial highlights for each of the periods indicated, in conformity with accounting principles generally accepted in the United States of America. These financial statements and financial highlights (hereafter referred to as "financial statements") are the responsibility of the Fund's management. Our responsibility is to express an opinion on these financial statements based on our audits. We conducted our audits of these financial statements in accordance with the standards of the Public Company Accounting Oversight Board (United States). Those standards require that we plan and perform the audit to obtain reasonable assurance about whether the financial statements are free of material misstatement. An audit includes examining, on a test basis, evidence supporting the amounts and disclosures in the financial statements, assessing the accounting principles used and significant estimates made by management, and evaluating the overall financial statement presentation. We believe that our audits, which included confirmation of securities at February 28, 2013 by correspondence with the custodian, transfer agent and brokers, provide a reasonable basis for our opinion.
PricewaterhouseCoopers LLP
Minneapolis, Minnesota
April 19, 2013
Annual Report 2013
37
Columbia Mid Cap Value Fund
Federal Income Tax Information
(Unaudited)
The Fund hereby designates the following tax attributes for the fiscal year ended February 28, 2013. Shareholders will be notified in early 2014 of the amounts for use in preparing 2013 income tax returns.
Tax Designations:
| Qualified Dividend Income | | | 100.00 | % | |
| Dividends Received Deduction | | | 100.00 | % | |
Capital Gain Dividend | | $ | 13,479,466 | | |
Qualified Dividend Income. For taxable, non-corporate shareholders, the percentage of ordinary income dividends paid during the fiscal year that represents qualified dividend income subject to reduced tax rates under the Jobs and Growth Tax Relief Reconciliation Act of 2003.
Dividends Received Deduction. The percentage of ordinary income dividends paid during the fiscal year that qualifies for the corporate dividends received deduction.
Capital Gain Dividend. The Fund designates as a capital gain dividend the amount reflected above, or if subsequently determined to be different, the net capital gain of such fiscal period. The Fund also designates as capital gain dividends, to the extent necessary to fully distribute such capital gains, earnings and profits distributed to shareholders on the redemption of shares.
Annual Report 2013
38
Columbia Mid Cap Value Fund
Shareholders elect the Board that oversees the funds' operations. The Board appoints officers who are responsible for day-to-day business decisions based on policies set by the Board. The following table provides basic biographical information about the funds' Board members, including their principal occupations during the past five years, although specific titles for individuals may have varied over the period. Under current Board policy, members may serve until the next Board meeting after he or she reaches the mandatory retirement age established by the Board, or the fifteenth anniversary of the first Board meeting they attended as a member of the Board.
Mr. Edward J. Boudreau, Jr., Mr. William P. Carmichael, Mr. William A. Hawkins, Mr. R. Glenn Hilliard, Ms. Minor M. Shaw and Dr. Anthony M. Santomero, were members of the Legacy Columbia Nations funds' Board ("Nations Funds"), which includes Columbia Funds Series Trust, Columbia Funds Variable Insurance Trust I and Columbia Funds Master Investment Trust, LLC and began service on the Board for the Legacy RiverSource funds ("RiverSource Funds") effective June 1, 2011.
Independent Trustees
Name,
Address,
Year of Birth | | Position Held With
Funds and Length of
Service | | Principal Occupation
During Past Five Years | | Number of
Funds in the
Fund Family
Overseen by
Board Member | | Other Present or Past
Directorships/Trusteeships
(Within Past 5 Years) | |
Kathleen Blatz
901 S. Marquette Ave.
Minneapolis, MN 55402
1954 | | Board member since 1/06 for RiverSource Funds and since 6/11 for Nations Funds | | Attorney; Chief Justice, Minnesota Supreme Court, 1998-2006 | | | 153 | | | Director, BlueCross BlueShield of Minnesota since 2009 | |
Edward J. Boudreau, Jr.
901 S. Marquette Ave.
Minneapolis, MN 55402
1944 | | Board member since 6/11 for RiverSource Funds and since 1/05 for Nations Funds | | Managing Director, E.J. Boudreau & Associates (consulting) since 2000 | | | 151 | | | Former Trustee, BofA Funds Series Trust (11 funds) | |
Pamela G. Carlton
901 S. Marquette Ave.
Minneapolis, MN 55402
1954 | | Board member since 7/07 for RiverSource Funds and since 6/11 for Nations Funds | | President, Springboard — Partners in Cross Cultural Leadership (consulting company) since 2003 | | | 153 | | | None | |
William P. Carmichael
901 S. Marquette Ave.
Minneapolis, MN 55402
1943 | | Board member since 6/11 for RiverSource Funds and since 1999 for Nations Funds | | Retired | | | 151 | | | Director, Cobra Electronics Corporation (electronic equipment manufacturer); The Finish Line (athletic shoes and apparel) since July 2003; McMoRan Exploration Company (oil and gas exploration and development) since 2010; former Trustee, BofA Funds Series Trust (11 funds); former Director, Spectrum Brands, Inc. (consumer products); former Director, Simmons Company (bedding) | |
Patricia M. Flynn
901 S. Marquette Ave.
Minneapolis, MN 55402
1950 | | Board member since 11/04 for RiverSource Funds and since 6/11 for Nations Funds | | Trustee Professor of Economics and Management, Bentley University since 1976 | | | 153 | | | None | |
William A. Hawkins
901 S. Marquette Ave.
Minneapolis, MN 55402
1942 | | Board member since 6/11 for RiverSource Funds and since 1/05 for Nations Funds | | Managing Director, Overton Partners (financial consulting), since August 2010; President and Chief Executive Officer, California General Bank, N.A., January 2008-August 2010 | | | 151 | | | Trustee, BofA Funds Series Trust (11 funds) | |
Annual Report 2013
39
Columbia Mid Cap Value Fund
Trustees and Officers (continued)
Independent Trustees (continued)
Name,
Address,
Year of Birth | | Position Held With
Funds and Length of
Service | | Principal Occupation
During Past Five Years | | Number of
Funds in the
Fund Family
Overseen by
Board Member | | Other Present or Past
Directorships/Trusteeships
(Within Past 5 Years) | |
R. Glenn Hilliard
901 S. Marquette Ave.
Minneapolis, MN 55402
1943 | | Board member since 6/11 for RiverSource Funds and since 1/05 for Nations Funds | | Chairman and Chief Executive Officer, Hilliard Group LLC (investing and consulting), since April 2003; Non-Executive Director & Chairman, CNO Financial Group, Inc. (insurance), September 2003-May 2011 | | | 151 | | | Chairman, BofA Fund Series Trust (11 funds); former Director, CNO Financial Group, Inc. (insurance) | |
Stephen R. Lewis, Jr.
901 S. Marquette Ave.
Minneapolis, MN 55402
1939 | | Chair of the Board for RiverSource Funds since 1/07, Board member for RiverSource Funds since 1/02 and since 6/11 for Nations Funds | | President Emeritus and Professor of Economics Emeritus, Carleton College since 2002 | | | 153 | | | Director, Valmont Industries, Inc. (manufacturer of irrigation systems) since 2002 | |
Catherine James Paglia
901 S. Marquette Ave.
Minneapolis, MN 55402
1952 | | Board member since 11/04 for RiverSource Funds and since 6/11 for Nations Funds | | Director, Enterprise Asset Management, Inc. (private real estate and asset management company) | | | 153 | | | Director, Valmont Industries, Inc. (manufacturer of irrigation systems) since 2012 | |
Leroy C. Richie
901 S. Marquette Ave.
Minneapolis, MN 55402
1941 | | Board member since 2000 for Legacy Seligman Funds, since 11/08 for RiverSource Funds and since 6/11 for Nations Funds | | Counsel, Lewis & Munday, P.C. (law firm) since 2004; former Vice President and General Counsel, Automotive Legal Affairs, Chrysler Corporation from 1983-1987 | | | 153 | | | Lead Outside Director, Digital Ally, Inc. (digital imaging) since September 2005; Director, Infinity, Inc. (oil and gas exploration and production) since 1994; Director, OGE Energy Corp. (energy and energy services) since November 2007 | |
Minor M. Shaw
901 S. Marquette Ave.
Minneapolis, MN 55402
1947 | | Board member since 6/11 for RiverSource Funds and since 2003 for Nations Funds | | President, Micco LLC (private investments) since 2011; President Micco Corp. since 1998 | | | 151 | | | Director, Piedmont Natural Gas; Director, BlueCross BlueShield of South Carolina since April 2008; Former Trustee, BofA Funds Series Trust (11 funds) | |
Alison Taunton-Rigby
901 S. Marquette Ave.
Minneapolis, MN 55402
1944 | | Board member since 11/02 for RiverSource Funds and since 6/11 for Nations Funds | | Chief Executive Officer and Director, RiboNovix, Inc. (biotechnology), 2003-2010 | | | 153 | | | Director, Healthways, Inc. (health and well-being improvement) since 2005; Director, ICI Mutual Insurance Company, RRG since 2011; Director, Abt Associates (government contractor) since 2001; Director, Boston Children's Hospital since 2002 | |
Annual Report 2013
40
Columbia Mid Cap Value Fund
Trustees and Officers (continued)
Interested Trustee Not Affiliated With Investment Manager*
Name,
Address,
Year of Birth | | Position Held With
Funds and Length of
Service | | Principal Occupation
During Past Five Years | | Number of
Funds in the
Fund Family
Overseen by
Board Member | | Other Present or Past
Directorships/Trusteeships
(Within Past 5 Years) | |
Anthony M. Santomero
901 S. Marquette Ave.
Minneapolis, MN 55402
1946 | | Board member since 6/11 for RiverSource Funds and since 1/08 for Nations Funds | | Richard K. Mellon Professor Emeritus of Finance, The Wharton School, University of Pennsylvania, since 2002; Senior Advisor, McKinsey & Company (consulting), 2006-2008 | | | 151 | | | Director, Renaissance Reinsurance Ltd. since May 2008; Trustee, Penn Mutual Life Insurance Company since March 2008; Director, Citigroup since 2009; Director, Citibank, N.A. since 2009; former Trustee, BofA Funds Series Trust (11 funds) | |
*Dr. Santomero is not an affiliated person of the investment manager or Ameriprise Financial. However, he is currently deemed by the funds to be an "interested person" (as defined in the 1940 Act) of the funds because he serves as a Director of Citigroup, Inc. and Citibank N.A., companies that may directly or through subsidiaries and affiliates engage from time-to-time in brokerage execution, principal transactions and lending relationships with the funds or accounts advised/managed by the investment manager.
Interested Trustee Affiliated With Investment Manager*
Name,
Address,
Year of Birth | | Position Held With
Funds and Length of
Service | | Principal Occupation
During Past Five Years | | Number of
Funds in the
Fund Family
Overseen by
Board Member | | Other Present or Past
Directorships/Trusteeships
(Within Past 5 Years) | |
William F. Truscott
53600 Ameriprise
Financial Center
Minneapolis, MN 55474
1960 | | Board member since 11/01 for RiverSource Funds and since 6/11 for Nations Funds; Senior Vice President since 2002 for RiverSource Funds and 5/10 for Nations Funds | | President, Columbia Management Investment Advisers, LLC since February 2012, (previously President, Chairman of the Board and Chief Investment Officer, 2001-April 2010); Chief Executive Officer, Global Asset Management, Ameriprise Financial, Inc. since September 2012 (previously Chief Executive Officer, U.S. Asset Management & President, Annuities, May 2010-September 2012 and President — U.S. Asset Management and Chief Investment Officer, 2005-April 2010); Chief Executive Officer, Columbia Management Investment Distributors, Inc. since February 2012, (previously Chairman of the Board and Chief Executive Officer, 2006-April 2010); Chairman of the Board and Chief Executive Officer, RiverSource Distributors, Inc. since 2006; President and Chief Executive Officer, Ameriprise Certificate Company 2006-August 2012 | | | 210 | | | Chairman of the Board, Columbia Management Investment Advisers, LLC since May 2010; Director, Columbia Management Investment Distributors, Inc. since May 2010; Director, Ameriprise Certificate Company, 2006-January 2013 | |
*Interested person (as defined under the 1940 Act) by reason of being an officer, director, security holder and/or employee of the investment manager or Ameriprise Financial.
The SAI has additional information about the Fund's Board members and is available, without charge, upon request by calling 800.345.6611; contacting your financial intermediary; or visiting columbiamanagement.com.
Annual Report 2013
41
Columbia Mid Cap Value Fund
Trustees and Officers (continued)
The Board has appointed officers who are responsible for day-to-day business decisions based on policies it has established. The officers serve at the pleasure of the Board. In addition to Mr. Truscott, who is Senior Vice President, the funds' other officers are:
Officers
Name,
Address,
Year of Birth | | Position Held With
Funds and Length of
Service | | Principal Occupation During Past Five Years | |
J. Kevin Connaughton
225 Franklin Street
Boston, MA 02110
1964 | | President and Principal Executive Officer since 5/10 for RiverSource Funds and 2009 for Nations Funds | | Senior Vice President and General Manager — Mutual Fund Products, Columbia Management Investment Advisers, LLC since May 2010; Managing Director of Columbia Management Advisors, LLC, December 2004-April 2010; Senior Vice President and Chief Financial Officer, Columbia Funds, June 2008-January 2009; Treasurer, Columbia Funds, October 2003-May 2008 | |
Amy K. Johnson
5228 Ameriprise Financial Center Minneapolis, MN 55474
1965 | | Vice President since 12/06 for RiverSource Funds and 5/10 for Nations Funds | | Senior Vice President and Chief Operating Officer, Columbia Management Investment Advisers, LLC since May 2010 (previously Chief Administrative Officer, 2009-April 2010 and Vice President — Asset Management and Trust Company Services, 2006-2009) | |
Michael G. Clarke
225 Franklin Street
Boston, MA 02110
1969 | | Treasurer since 1/11 and Chief Financial Officer since 4/11 for RiverSource Funds and Treasurer since 3/11 and Chief Financial Officer since 2009 for Nations Funds | | Vice President, Columbia Management Investment Advisers, LLC since May 2010; Managing Director of Fund Administration, Columbia Management Advisors, LLC, September 2004-April 2010; senior officer of Columbia Funds and affiliated funds since 2002 | |
Scott R. Plummer
5228 Ameriprise Financial Center Minneapolis, MN 55474
1959 | | Senior Vice President and Chief Legal Officer since 12/06 and Assistant Secretary since 6/11 for RiverSource Funds and Senior Vice President and Chief Legal Officer since 5/10 and Assistant Secretary since 6/11 for Nations Funds | | Senior Vice President, Chief Legal Officer and Assistant Secretary, Columbia Management Investment Advisers, LLC since June 2005; Vice President and Lead Chief Counsel — Asset Management, Ameriprise Financial, Inc. since May 2010 (previously Vice President and Chief Counsel — Asset Management, 2005-April 2010); Vice President, Chief Counsel and Assistant Secretary, Columbia Management Investment Distributors, Inc. since 2008; Vice President, General Counsel and Secretary, Ameriprise Certificate Company since 2005; Chief Counsel, RiverSource Distributors, Inc. since 2006 | |
Colin Moore
225 Franklin Street
Boston, MA 02110
1958 | | Senior Vice President since 5/10 for RiverSource Funds and Nations Funds | | Director and Chief Investment Officer, Columbia Management Investment Advisers, LLC since May 2010; Manager, Managing Director and Chief Investment Officer, Columbia Management Advisors, LLC, 2007-April 2010 | |
Thomas P. McGuire
225 Franklin Street
Boston, MA 02110
1972 | | Chief Compliance Officer since 3/12 | | Vice President — Asset Management Compliance, Columbia Management Investment Advisers, LLC since 2010; Chief Compliance Officer, Ameriprise Certificate Company since September 2010; Compliance Executive, Bank of America, 2005-2010 | |
Stephen T. Welsh
225 Franklin Street
Boston, MA 02110
1957 | | Vice President since 4/11 for RiverSource Funds and 2006 for Nations Funds | | President and Director, Columbia Management Investment Services Corp. since May 2010; President and Director, Columbia Management Services, Inc., July 2004- April 2010; Managing Director, Columbia Management Distributors, Inc., August 2007-April 2010 | |
Christopher O. Petersen
5228 Ameriprise Financial Center Minneapolis, MN 55474
1970 | | Vice President and Secretary since 4/11 for RiverSource Funds and 3/11 for Nations Funds | | Vice President and Chief Counsel, Ameriprise Financial, Inc. since January 2010 (formerly Vice President and Group Counsel or Counsel, April 2004-January 2010); Assistant Secretary of Legacy RiverSource Funds, January 2007-April 2011 and of the Nations Funds, May 2010-March 2011 | |
Annual Report 2013
42
Columbia Mid Cap Value Fund
Trustees and Officers (continued)
Officers (continued)
Name,
Address,
Year of Birth | | Position Held With
Funds and Length of
Service | | Principal Occupation During Past Five Years | |
Paul D. Pearson
10468 Ameriprise Financial Center Minneapolis, MN 55474
1956 | | Vice President since 4/11 and Assistant Treasurer since 1999 for RiverSource Funds and Vice President and Assistant Treasurer since 6/11 for Nations Funds | | Vice President — Investment Accounting, Columbia Management Investment Advisers, LLC, since May 2010; Vice President — Managed Assets, Investment Accounting, Ameriprise Financial Corporation, February 1998-May 2010 | |
Joseph F. DiMaria
225 Franklin Street
Boston, MA 02110
1968 | | Vice President and Chief Accounting Officer since 4/11 and Vice President since 3/11 and Chief Accounting Officer since 2008 for Nations Funds | | Vice President, Mutual Fund Administration, Columbia Management Investment Advisers, LLC, since May 2010; Director of Fund Administration, Columbia Management Advisors, LLC, January 2006-April 2010 | |
Paul B. Goucher
100 Park Avenue
New York, NY 10017
1968 | | Vice President since 4/11 and Assistant Secretary since 11/08 for RiverSource Funds and 5/10 for Nations Funds | | Vice President and Lead Chief Counsel, Ameriprise Financial, Inc. since November 2008 and January 2013, respectively (formerly, Chief Counsel, January 2010-January 2013 and Group Counsel from November 2008- January 2010); Director, Managing Director and General Counsel, J. & W. Seligman & Co. Incorporated, July 2008-November 2008 (previously, Managing Director and Associate General Counsel, January 2005-July 2008) | |
Michael E. DeFao
225 Franklin Street
Boston, MA 02110
1968 | | Vice President since 4/11 and Assistant Secretary since 5/10 for RiverSource Funds and 2011 for Nations Funds | | Vice President and Chief Counsel, Ameriprise Financial, Inc. since May 2010; Associate General Counsel, Bank of America, June 2005-April 2010 | |
Annual Report 2013
43
This page intentionally left blank.
Annual Report 2013
44
Columbia Mid Cap Value Fund
Important Information About This Report
Each fund mails one shareholder report to each shareholder address. If you would like more than one report, please call shareholder services at 800.345.6611 and additional reports will be sent to you.
The policy of the Board is to vote the proxies of the companies in which each fund holds investments consistent with the procedures as stated in the Statement of Additional Information (SAI). You may obtain a copy of the SAI without charge by calling 800.345.6611; contacting your financial intermediary; visiting columbiamanagement.com; or searching the website of the Securities and Exchange Commission (SEC) at sec.gov. Information regarding how each fund voted proxies relating to portfolio securities is filed with the SEC by August 31 for the most recent 12-month period ending June 30 of that year, and is available without charge by visiting columbiamanagement.com; or searching the website of the SEC at sec.gov.
Each fund files a complete schedule of portfolio holdings with the SEC for the first and third quarters of each fiscal year on Form N-Q. Each fund's Form N-Q is available on the SEC's website at sec.gov and may be reviewed and copied at the SEC's Public Reference Room in Washington, D.C. Information on the operation of the Public Reference Room may be obtained by calling 800.SEC.0330. Each fund's complete schedule of portfolio holdings, as filed on Form N-Q, can also be obtained without charge, upon request, by calling 800.345.6611.
Annual Report 2013
45

Columbia Mid Cap Value Fund
P.O. Box 8081
Boston, MA 02266-8081
columbiamanagement.com
This information is for use with concurrent or prior delivery of a fund prospectus. Please read and consider the investment objectives, risks, charges and expenses for any fund carefully before investing. For a prospectus which contains this and other important information about the Fund go to columbiamanagement.com. The Fund is distributed by Columbia Management Investment Distributors, Inc., member FINRA, and managed by Columbia Management Investment Advisers, LLC.
© 2013 Columbia Management Investment Advisers, LLC. All rights reserved.
ANN197_02_C01_(04/13)
Annual Report
February 28, 2013

Columbia Multi-Advisor International Equity Fund
Not FDIC insured • No bank guarantee • May lose value
Columbia Multi-Advisor International Equity Fund
 Dear Shareholders,
U.S. stocks flat, foreign markets strong in 2012 finale
After a strong third quarter, U.S. stock market averages treaded water as the year 2012 came to a close. However, they ended the year up strongly, as first- and third-quarter gains more than offset third- and fourth-quarter weakness. Typically a strong quarter for domestic small- and mid-cap issues, the fourth quarter of 2012 indeed proved to be another year-end positive for small-cap stocks. For the full calendar year 2012, the S&P 500 Index rose 16.00%.
Stock markets outside the United States generated some of the best returns for the fourth quarter, as optimism rebounded, thanks to the September actions of the European Central Bank in support of the euro and an improving outlook from China. Both developed and emerging foreign markets topped U.S. stocks by a solid margin.
Corporate and emerging markets led fixed income
Fixed-income investors took their cue from the equity markets and continued to favor the highest risk sectors through the end of 2012. Global fixed-income returns posted mixed results in the final quarter of the year. Gains were the highest for corporate high-yield and emerging market bonds. Although investors remained cautious ahead of the year-end budget negotiations, better economic data and a further improvement in the European sovereign debt crisis supported riskier assets and depressed government bond prices. In December, the Federal Reserve announced its intention to continue to purchase both Treasury and mortgage-backed securities and said that it would seek to keep short-term interest rates unchanged until the unemployment rate reaches 6.5%, or inflation turned noticeably higher.
Stay on track with Columbia Management
Backed by more than 100 years of experience, Columbia Management is one of the nation's largest asset managers. At the heart of our success — and, most importantly, that of our investors — are highly talented industry professionals, brought together by a unique way of working. We are dedicated to helping you take advantage of today's opportunities and anticipate tomorrow's. We stay abreast of the latest investment trends and ideas, using our collective insight to evaluate events and transform them into solutions you can use.
Visit columbiamanagement.com for:
> The Columbia Management Perspectives blog, featuring timely posts by our investment teams
> Detailed up-to-date fund performance and portfolio information
> Economic analysis and market commentary
> Quarterly fund commentaries
> Columbia Management Investor, our award-winning quarterly newsletter for shareholders
Thank you for your continued support of the Columbia Funds. We look forward to serving your investment needs for many years to come.
Best Regards,

J. Kevin Connaughton
President, Columbia Funds
The S&P 500 Index, an unmanaged index, measures the performance of 500 widely held, large-capitalization U.S. stocks and is frequently used as a general measure of market performance. Indices are not available for investment, are not professionally managed and do not reflect sales charges, fees, brokerage commissions, taxes or other expenses of investing.
Investors should consider the investment objectives, risks, charges and expenses of a mutual fund carefully before investing. For a free prospectus, which contains this and other important information about a fund, visit columbiamanagement.com. The prospectus should be read carefully before investing.
Columbia Funds are distributed by Columbia Management Investment Distributors, Inc., member FINRA, and managed by Columbia Management Investment Advisers, LLC.
© 2013 Columbia Management Investment Advisers, LLC. All rights reserved.
Columbia Multi-Advisor International Equity Fund
Performance Overview | | | 2 | | |
Manager Discussion of Fund Performance | | | 4 | | |
Understanding Your Fund's Expenses | | | 9 | | |
Portfolio of Investments | | | 10 | | |
Statement of Assets and Liabilities | | | 21 | | |
Statement of Operations | | | 23 | | |
Statement of Changes in Net Assets | | | 24 | | |
Financial Highlights | | | 27 | | |
Notes to Financial Statements | | | 38 | | |
Report of Independent Registered
Public Accounting Firm | | | 48 | | |
Federal Income Tax Information | | | 49 | | |
Trustees and Officers | | | 50 | | |
Important Information About This Report | | | 57 | | |
Fund Investment Manager
Columbia Management Investment
Advisers, LLC
225 Franklin Street
Boston, MA 02110
Fund Distributor
Columbia Management Investment
Distributors, Inc.
225 Franklin Street
Boston, MA 02110
Fund Transfer Agent
Columbia Management Investment
Services Corp.
P.O. Box 8081
Boston, MA 02266-8081
For more information about any of the funds, please visit columbiamanagement.com or call 800.345.6611. Customer Service Representatives are available to answer your questions Monday through Friday from 8 a.m. to 8 p.m. Eastern time.
The views expressed in this report reflect the current views of the respective parties. These views are not guarantees of future performance and involve certain risks, uncertainties and assumptions that are difficult to predict, so actual outcomes and results may differ significantly from the views expressed. These views are subject to change at any time based upon economic, market or other conditions and the respective parties disclaim any responsibility to update such views. These views may not be relied on as investment advice and, because investment decisions for a Columbia Fund are based on numerous factors, may not be relied on as an indication of trading intent on behalf of any particular Columbia Fund. References to specific securities should not be construed as a recommendation or investment advice.
Columbia Multi-Advisor International Equity Fund
Performance Summary
> Columbia Multi-Advisor International Equity Fund (the Fund) Class A shares returned 6.41% excluding sales charges for the 12-month period that ended February 28, 2013.
> The Fund underperformed its benchmark, the MSCI EAFE Index (Net), which returned 9.84% for the same 12-month period.
> The Fund's exposure to emerging markets, particularly China and Brazil, held back relative results. Emerging markets are not included in the benchmark.
Average Annual Total Returns (%) (for period ended February 28, 2013)
| | Inception | | 1 Year | | 5 Years | | 10 Years | |
Class A | | 06/03/92 | | | | | | | |
Excluding sales charges | | | | | | | 6.41 | | | | -3.12 | | | | 7.95 | | |
Including sales charges | | | | | | | 0.32 | | | | -4.26 | | | | 7.31 | | |
Class B | | 06/07/93 | | | | | | | |
Excluding sales charges | | | | | | | 5.59 | | | | -3.86 | | | | 7.15 | | |
Including sales charges | | | | | | | 0.59 | | | | -4.22 | | | | 7.15 | | |
Class C | | 06/17/92 | | | | | | | |
Excluding sales charges | | | | | | | 5.64 | | | | -3.84 | | | | 7.31 | | |
Including sales charges | | | | | | | 4.64 | | | | -3.84 | | | | 7.31 | | |
Class I* | | 09/27/10 | | | 6.96 | | | | -2.75 | | | | 8.28 | | |
Class K (formerly Class R4)* | | 03/07/11 | | | 6.64 | | | | -2.96 | | | | 8.11 | | |
Class R* | | 01/23/06 | | | 6.20 | | | | -3.36 | | | | 7.68 | | |
Class R4* | | 11/08/12 | | | 6.73 | | | | -2.86 | | | | 8.22 | | |
Class R5* | | 11/08/12 | | | 6.77 | | | | -2.86 | | | | 8.23 | | |
Class W* | | 09/27/10 | | | 6.40 | | | | -3.09 | | | | 7.98 | | |
Class Y* | | 03/07/11 | | | 6.98 | | | | -2.78 | | | | 8.27 | | |
Class Z | | 12/02/91 | | | 6.72 | | | | -2.86 | | | | 8.22 | | |
MSCI EAFE Index (Net) | | | | | | | 9.84 | | | | -1.26 | | | | 9.39 | | |
Returns for Class A are shown with and without the maximum initial sales charge of 5.75%. Returns for Class B are shown with and without the applicable contingent deferred sales charge (CDSC) of 5.00% in the first year, declining to 1.00% in the sixth year and eliminated thereafter. Returns for Class C are shown with and without the 1.00% CDSC for the first year only. The Fund's other classes are not subject to sales charges and have limited eligibility. Please see the Fund's prospectuses for details. Performance for different share classes will vary based on differences in sales charges and fees associated with each class. All results shown assume reinvestment of distributions during the period. Returns do not reflect the deduction of taxes that a shareholder may pay on Fund distributions or on the redemption of Fund shares. Performance results reflect the effect of any fee waivers or reimbursements of Fund expenses by Columbia Management Investment Advisers, LLC and/or any of its affiliates. Absent these fee waivers or expense reimbursement arrangements, performance results would have been lower.
The performance information shown represents past performance and is not a guarantee of future results. The investment return and principal value of your investment will fluctuate so that your shares, when redeemed, may be worth more or less than their original cost. Current performance may be lower or higher than the performance information shown. You may obtain performance information current to the most recent month-end by contacting your financial intermediary, visiting columbiamanagement.com or calling 800.345.6611.
*The returns shown for periods prior to the share class inception date (including returns for the Life of the Fund, if shown, which are since Fund inception) include the returns of the Fund's oldest share class. These returns are adjusted to reflect any higher class-related operating expenses of the newer share classes, as applicable. Please visit columbiamanagement.com/mutual-funds/appended-performance for more information.
The MSCI EAFE (Europe, Australasia and the Far East) Index (Net) is a free float-adjusted market capitalization index that is designed to measure the equity market performance of developed markets, excluding the U.S. and Canada. The index is compiled from a composite of securities markets of Europe, Australasia and the Far East and is widely recognized by investors in foreign markets as the measurement index for portfolios of non-North American securities.
Indices are not available for investment, are not professionally managed and do not reflect sales charges, fees, brokerage commissions, taxes or other expenses of investing. Securities in the Fund may not match those in an index.
Annual Report 2013
2
Columbia Multi-Advisor International Equity Fund
Performance Overview (continued)
Performance of a Hypothetical $10,000 Investment (March 1, 2003 – February 28, 2013)
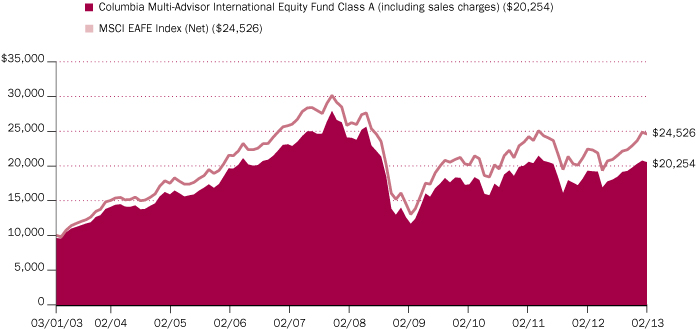
The chart above shows the change in value of a hypothetical $10,000 investment in Class A shares of Columbia Multi-Advisor International Equity Fund during the stated time period, and does not reflect the deduction of taxes that a shareholder may pay on Fund distributions or on the redemption of Fund shares.
Annual Report 2013
3
Columbia Multi-Advisor International Equity Fund
Manager Discussion of Fund Performance
For the 12-month period that ended February 28, 2013, the Fund's Class A shares returned 6.41% excluding sales charge. The Fund underperformed its benchmark, the MSCI EAFE Index (Net), which returned 9.84% for the same 12-month period. During a period in which the dominant trends in capital markets changed quickly, investments in the emerging markets of China and Brazil, which are not included in the benchmark, detracted from relative performance, as did, to lesser degrees, investments in India, Russia and Taiwan. The Fund's currency strategy also accounted for a slight loss over the period.
The Fund is managed to take advantage of opportunities across different regions, investment styles and market segments by allocating assets among three co-managers, each with a different style and regional expertise. Threadneedle International Limited focuses on European equities, while Marsico Capital Management manages international multi-cap equities. The investment team from Columbia Management Investment Advisers (Columbia) manages four separate sub-portfolios: one focuses on emerging markets; a second concentrates on the Pacific/Asia region, excluding Japan; a third manages Japanese equities exclusively and the fourth seeks incremental return from a strategy that buys and sells the currencies of major developed economies.
Investors Shrug Off Weak Global Growth
Europe's economic woes and U.S. struggles to avoid a fiscal cliff of tax increases and spending cuts weighed on the global economy during the 12-month period ended February 28, 2013. Yet, investors chose to look beyond the numbers and came in from the sidelines to bid stock prices significantly higher. Favorable central bank action in key markets and improving prospects for the U.S. economy gave investors confidence to favor stocks and other riskier assets. The U.S. economy expanded at a pace of just 1.6% in 2012. However, a pickup in job growth early in 2013 and steady manufacturing activity pointed to better times ahead. Meanwhile, much of Europe headed toward recession. So far, the United Kingdom has avoided recession — but only barely so — and Japan's economy slipped into negative territory for the fifth time in 15 years. Major emerging market economies, including China, forged ahead, although mostly at a slower pace. Against this backdrop, international markets delivered solid returns despite an early slump. The European Monetary Union's announcement in the summer that it would do whatever was necessary to hold the European euro together, support the euro currency, and aid troubled peripheral countries bolstered investor confidence. Japan's November elections, which resulted in a new government pledge to pursue pro-growth policies to end Japan's prolonged economic woes, gave additional fuel to the rally.
Exposure to China and Brazil Detracted from Relative Returns
Despite positive contributions from the Fund's emerging markets position overall, exposure to the emerging markets of China and Brazil detracted from relative results. Certain Fund holdings also contributed to the shortfall relative to the benchmark. Underweights relative to the benchmark in British banking institutions in general, and of HSBC Holdings in particular, were a drag on results, as was the decision not to own a major French pharmaceutical company that posted double-digit gains. Chinese Internet search company Baidu was a notable disappointment, as it fell on concerns about competition and the challenges of sustaining both growth and profitability.
Portfolio Management
Columbia Management Investment Advisers, LLC
Colin Moore, AIIMR
Fred Copper, CFA
Marsico Capital Management, LLC
James Gendelman
Munish Malhotra, CFA
Threadneedle International Limited
Daniel Ison, IMC
Morningstar Style BoxTM

The Morningstar Style BoxTM is based on a fund's portfolio holdings. For equity funds, the vertical axis shows the market capitalization of the stocks owned, and the horizontal axis shows investment style (value, blend, or growth). Information shown is based on the most recent data provided by Morningstar.
© 2013 Morningstar, Inc. All rights reserved. The Morningstar information contained herein: (1) is proprietary to Morningstar and/or its content providers; (2) may not be copied or distributed; and (3) is not warranted to be accurate, complete or timely. Neither Morningstar nor its content providers are responsible for any damages or losses arising from any use of this information.
Annual Report 2013
4
Columbia Multi-Advisor International Equity Fund
Manager Discussion of Fund Performance (continued)
The Fund's currency strategy contributed a slight loss, mostly during May 2012 when currency markets were challenged by worries about the ability of the Greek government to meet its debt obligations. The Fund also used currency forward contracts to manage risk, but the use of these derivatives had a negligible impact on performance.
Two of Three Investment Components Outperformed Their Benchmarks
Even though emerging markets lagged developed markets, the Fund's emerging markets portfolio, managed by Columbia, performed especially well, primarily because of strong stock selection and country allocations, most notably in the Philippines and Thailand. The Columbia Pacific/Asia excluding Japan and Japan sub-portfolios also performed well. The Threadneedle-managed European equity sleeve outperformed its benchmark, helped by stock selection in Spain, France, Germany and Finland, particularly in the consumer staples sector. The Fund also was helped by increasing emphasis on the more cyclical financials and consumer discretionary sectors. Specific investments that supported relative performance included Samsung Electronics, the South Korean consumer electronics corporation; Fuji Heavy Industries, the Japanese producer of Subaru vehicles; and Metropolitan Bank & Trust, of the Philippines. The Marsico portfolio of international multi-cap stocks trailed its benchmark, primarily because of stock selection in the telecommunication services, energy and health care sectors. An overweight relative to the benchmark in the information technology sector also held back the Marsico portfolio's performance, while underweighting the materials sector and overweighting the consumer discretionary area helped. Although the impact of currency management was generally a detraction for the Fund overall, currency had a generally positive impact on the Marsico-managed portfolio, aided by an underweight in securities denominated in the Japanese yen, which weakened in the period.
Improving Expectations for 2013
We currently anticipate that the global economy may perform somewhat better in 2013 than it did in 2012, despite challenges in some developed economies. We expect the United States, Japan and Europe to continue to struggle with structural problems, including aging populations and high debt. Europe and the United States also face modest growth prospects and continuing worries about the risk of falling back into recession.
At the same time, we currently see the upside potential in emerging markets. We continue to believe that the Fund's diversified, multi-manager mix of geographically focused investment strategies can help identify opportunities and balance risks over the longer term.
Top Ten Holdings (%)
(at February 28, 2013) | |
Nestle' SA, Registered Shares (Switzerland) | | | 2.3 | | |
Samsung Electronics Co., Ltd.
(South Korea) | | | 2.1 | | |
Diageo PLC (United Kingdom) | | | 1.6 | | |
Anheuser-Busch InBev NV
(Belgium) | | | 1.6 | | |
Allianz SE, Registered Shares
(Germany) | | | 1.4 | | |
Unilever PLC (United Kingdom) | | | 1.4 | | |
UBS AG, Registered Shares
(Switzerland) | | | 1.3 | | |
BNP Paribas SA (France) | | | 1.2 | | |
Novo Nordisk A/S, Class B
(Denmark) | | | 1.2 | | |
Swatch Group AG (The),
Registered Shares (Switzerland) | | | 1.1 | | |
Percentages indicated are based upon total investments (excluding Money Market Funds).
For further detail about these holdings, please refer to the section entitled "Portfolio of Investments."
Fund holdings are as of the date given, are subject to change at any time, and are not recommendations to buy or sell any security.
Annual Report 2013
5
Columbia Multi-Advisor International Equity Fund
Manager Discussion of Fund Performance (continued)
Country Breakdown (%)
(at February 28, 2013) | |
Argentina | | | 0.2 | | |
Australia | | | 3.6 | | |
Belgium | | | 1.5 | | |
Brazil | | | 2.0 | | |
Cambodia | | | 0.1 | | |
Canada | | | 0.8 | | |
Chile | | | 0.2 | | |
China | | | 5.6 | | |
Denmark | | | 1.1 | | |
Finland | | | 0.4 | | |
France | | | 6.2 | | |
Germany | | | 10.4 | | |
Hong Kong | | | 2.8 | | |
India | | | 2.5 | | |
Indonesia | | | 1.8 | | |
Israel | | | 0.3 | | |
Italy | | | 0.2 | | |
Japan | | | 7.7 | | |
Malta | | | 0.0 | (a) | |
Mexico | | | 0.5 | | |
Netherlands | | | 2.3 | | |
Norway | | | 0.2 | | |
Panama | | | 0.1 | | |
Peru | | | 0.3 | | |
Philippines | | | 2.5 | | |
Poland | | | 0.2 | | |
Portugal | | | 0.3 | | |
Russian Federation | | | 1.1 | | |
Singapore | | | 2.2 | | |
South Africa | | | 0.7 | | |
South Korea | | | 3.7 | | |
Spain | | | 1.9 | | |
Sweden | | | 0.2 | | |
Switzerland | | | 8.4 | | |
Taiwan | | | 3.0 | | |
Thailand | | | 2.8 | | |
Turkey | | | 0.9 | | |
United Kingdom | | | 16.2 | | |
United States(b) | | | 5.1 | | |
Total | | | 100.0 | | |
Percentages indicated are based upon total investments. The Fund's portfolio composition is subject to change.
(a) Rounds to zero.
(b) Includes investments in Money Market Funds.
Annual Report 2013
6
Columbia Multi-Advisor International Equity Fund
Manager Discussion of Fund Performance (continued)
Summary of Investments in Securities
by Industry (%)
(at February 28, 2013) | |
Aerospace & Defense | | | 1.5 | | |
Airlines | | | 0.5 | | |
Auto Components | | | 1.2 | | |
Automobiles | | | 3.9 | | |
Beverages | | | 3.6 | | |
Capital Markets | | | 1.7 | | |
Chemicals | | | 4.2 | | |
Commercial Banks | | | 12.0 | | |
Commercial Services &
Supplies | | | 0.3 | | |
Communications Equipment | | | 0.1 | | |
Computers & Peripherals | | | 0.9 | | |
Construction & Engineering | | | 1.0 | | |
Construction Materials | | | 0.7 | | |
Containers & Packaging | | | 0.3 | | |
Diversified Financial Services | | | 1.9 | | |
Diversified Telecommunication
Services | | | 0.9 | | |
Electrical Equipment | | | 1.2 | | |
Electronic Equipment,
Instruments & Components | | | 1.5 | | |
Energy Equipment & Services | | | 0.2 | | |
Food & Staples Retailing | | | 1.5 | | |
Food Products | | | 4.1 | | |
Gas Utilities | | | 0.8 | | |
Health Care Equipment &
Supplies | | | 0.5 | | |
Health Care Providers &
Services | | | 1.4 | | |
Hotels, Restaurants & Leisure | | | 2.3 | | |
Household Durables | | | 1.2 | | |
Household Products | | | 1.0 | | |
Independent Power Producers &
Energy Traders | | | 0.6 | | |
Industrial Conglomerates | | | 0.7 | | |
Insurance | | | 4.0 | | |
Internet & Catalog Retail | | | 0.4 | | |
Internet Software & Services | | | 2.1 | | |
IT Services | | | 1.3 | | |
Leisure Equipment & Products | | | 0.1 | | |
Machinery | | | 1.7 | | |
Media | | | 3.7 | | |
Metals & Mining | | | 2.1 | | |
Multiline Retail | | | 0.5 | | |
Office Electronics | | | 0.2 | | |
Annual Report 2013
7
Columbia Multi-Advisor International Equity Fund
Manager Discussion of Fund Performance (continued)
Summary of Investments in Securities
by Industry (%)
(at February 28, 2013) (continued) | |
Oil, Gas & Consumable Fuels | | | 3.9 | | |
Personal Products | | | 0.6 | | |
Pharmaceuticals | | | 5.2 | | |
Professional Services | | | 0.9 | | |
Real Estate Investment Trusts
(REITs) | | | 1.1 | | |
Real Estate Management &
Development | | | 2.3 | | |
Road & Rail | | | 0.4 | | |
Semiconductors &
Semiconductor Equipment | | | 4.3 | | |
Software | | | 1.3 | | |
Specialty Retail | | | 1.2 | | |
Textiles, Apparel & Luxury
Goods | | | 2.7 | | |
Tobacco | | | 0.8 | | |
Trading Companies & Distributors | | | 2.6 | | |
Transportation Infrastructure | | | 0.8 | | |
Water Utilities | | | 0.3 | | |
Wireless Telecommunication
Services | | | 1.7 | | |
Money Market Funds | | | 2.6 | | |
Total | | | 100.5 | | |
Percentages indicated are based upon net assets. The Fund's portfolio composition is subject to change.
Annual Report 2013
8
Columbia Multi-Advisor International Equity Fund
Understanding Your Fund's Expenses
(Unaudited)
As an investor, you incur two types of costs. There are transaction costs, which generally include sales charges on purchases and may include redemption fees. There are also ongoing costs, which generally include management fees, distribution and service (Rule 12b-1) fees, and other fund expenses. The following information is intended to help you understand your ongoing costs (in dollars) of investing in the Fund and to help you compare these costs with the ongoing costs of investing in other mutual funds.
Analyzing Your Fund's Expenses
To illustrate these ongoing costs, we have provided examples and calculated the expenses paid by investors in each share class of the Fund during the period. The actual and hypothetical information in the table is based on an initial investment of $1,000 at the beginning of the period indicated and held for the entire period. Expense information is calculated two ways and each method provides you with different information. The amount listed in the "Actual" column is calculated using the Fund's actual operating expenses and total return for the period. You may use the Actual information, together with the amount invested, to estimate the expenses that you paid over the period. Simply divide your account value by $1,000 (for example, an $8,600 account value divided by $1,000 = 8.6), then multiply the results by the expenses paid during the period under the Actual column. The amount listed in the "Hypothetical" column assumes a 5% annual rate of return before expenses (which is not the Fund's actual return) and then applies the Fund's actual expense ratio for the period to the hypothetical return. You should not use the hypothetical account values and expenses to estimate either your actual account balance at the end of the period or the expenses you paid during the period. See "Compare With Other Funds" below for details on how to use the hypothetical data.
Compare With Other Funds
Since all mutual funds are required to include the same hypothetical calculations about expenses in shareholder reports, you can use this information to compare the ongoing cost of investing in the Fund with other funds. To do so, compare the hypothetical example with the 5% hypothetical examples that appear in the shareholder reports of other funds. As you compare hypothetical examples of other funds, it is important to note that hypothetical examples are meant to highlight the ongoing costs of investing in a fund only and do not reflect any transaction costs, such as sales charges, or redemption or exchange fees. Therefore, the hypothetical calculations are useful in comparing ongoing costs only, and will not help you determine the relative total costs of owning different funds. If transaction costs were included in these calculations, your costs would be higher.
September 1, 2012 – February 28, 2013
| | Account Value at the Beginning
of the Period ($) | | Account Value at the End of the
Period ($) | | Expenses Paid During the
Period ($) | | Fund's Annualized
Expense Ratio (%) | |
| | Actual | | Hypothetical | | Actual | | Hypothetical | | Actual | | Hypothetical | | Actual | |
Class A | | | 1,000.00 | | | | 1,000.00 | | | | 1,113.80 | | | | 1,017.75 | | | | 7.44 | | | | 7.10 | | | | 1.42 | | |
Class B | | | 1,000.00 | | | | 1,000.00 | | | | 1,109.40 | | | | 1,014.03 | | | | 11.35 | | | | 10.84 | | | | 2.17 | | |
Class C | | | 1,000.00 | | | | 1,000.00 | | | | 1,109.60 | | | | 1,014.03 | | | | 11.35 | | | | 10.84 | | | | 2.17 | | |
Class I | | | 1,000.00 | | | | 1,000.00 | | | | 1,116.80 | | | | 1,020.08 | | | | 4.99 | | | | 4.76 | | | | 0.95 | | |
Class K (formerly
Class R4) | | | 1,000.00 | | | | 1,000.00 | | | | 1,115.10 | | | | 1,018.60 | | | | 6.56 | | | | 6.26 | | | | 1.25 | | |
Class R | | | 1,000.00 | | | | 1,000.00 | | | | 1,112.70 | | | | 1,016.51 | | | | 8.75 | | | | 8.35 | | | | 1.67 | | |
Class R4* | | | 1,000.00 | | | | 1,000.00 | | | | 1,081.70 | * | | | 1,018.60 | | | | 3.96 | * | | | 6.26 | | | | 1.25 | * | |
Class R5* | | | 1,000.00 | | | | 1,000.00 | | | | 1,082.00 | * | | | 1,019.59 | | | | 3.32 | * | | | 5.26 | | | | 1.05 | * | |
Class W | | | 1,000.00 | | | | 1,000.00 | | | | 1,113.80 | | | | 1,017.75 | | | | 7.44 | | | | 7.10 | | | | 1.42 | | |
Class Y | | | 1,000.00 | | | | 1,000.00 | | | | 1,116.50 | | | | 1,020.08 | | | | 4.99 | | | | 4.76 | | | | 0.95 | | |
Class Z | | | 1,000.00 | | | | 1,000.00 | | | | 1,115.30 | | | | 1,019.04 | | | | 6.08 | | | | 5.81 | | | | 1.16 | | |
*For the period November 8, 2012 through February 28, 2013. Class R4 and R5 shares commenced operations on November 8, 2012.
Expenses paid during the period are equal to the annualized expense ratio for each class as indicated above, multiplied by the average account value over the period and then multiplied by the number of days in the Fund's most recent fiscal half year and divided by 365.
Expenses do not include fees and expenses incurred indirectly by the Fund from the underlying funds in which the Fund may invest (also referred to as "acquired funds"), including affiliated and non-affiliated pooled investment vehicles (including mutual funds and exchange-traded funds).
Had Columbia Management Investment Advisers, LLC and/or certain of its affiliates not waived/reimbursed certain fees and expenses, account value at the end of the period would have been reduced.
Annual Report 2013
9
Columbia Multi-Advisor International Equity Fund
Portfolio of Investments
February 28, 2013
(Percentages represent value of investments compared to net assets)
Common Stocks 96.4%
Issuer | | Shares | | Value ($) | |
Argentina 0.2% | |
MercadoLibre, Inc. | | | 22,407 | | | | 1,918,263 | | |
Australia 3.6% | |
Amcor Ltd. | | | 259,904 | | | | 2,436,839 | | |
Australia and New Zealand Banking
Group Ltd. | | | 228,453 | | | | 6,680,928 | | |
BHP Billiton Ltd. | | | 118,709 | | | | 4,444,248 | | |
Commonwealth Bank of Australia | | | 50,555 | | | | 3,465,326 | | |
Flight Centre Ltd. | | | 52,601 | | | | 1,739,749 | | |
Monadelphous Group Ltd. | | | 103,901 | | | | 2,630,365 | | |
National Australia Bank Ltd. | | | 37,895 | | | | 1,166,217 | | |
Telstra Corp., Ltd. | | | 843,224 | | | | 3,946,807 | | |
Transurban Group | | | 92,479 | | | | 580,493 | | |
Wesfarmers Ltd. | | | 38,804 | | | | 1,623,820 | | |
Westfield Retail Trust | | | 365,393 | | | | 1,185,572 | | |
Westpac Banking Corp. | | | 134,473 | | | | 4,218,579 | | |
Total | | | | | 34,118,943 | | |
Belgium 1.5% | |
Anheuser-Busch InBev NV | | | 156,215 | | | | 14,639,666 | | |
Brazil 2.0% | |
Arezzo Industria e Comercio SA | | | 49,800 | | | | 1,006,366 | | |
BR Malls Participacoes SA | | | 402,000 | | | | 5,199,151 | | |
Cia Hering | | | 42,000 | | | | 815,004 | | |
Companhia de Bebidas Americas, ADR | | | 31,603 | | | | 1,402,541 | | |
Hypermarcas SA(a) | | | 175,900 | | | | 1,554,254 | | |
Linx SA(a) | | | 44,200 | | | | 714,337 | | |
Mills Estruturas e Servicos de
Engenharia SA | | | 135,100 | | | | 2,195,017 | | |
Qualicorp SA(a) | | | 179,800 | | | | 2,010,192 | | |
Ultrapar Participacoes SA | | | 86,200 | | | | 2,234,041 | | |
Vale SA | | | 91,900 | | | | 1,754,986 | | |
Total | | | | | 18,885,889 | | |
Cambodia 0.1% | |
NagaCorp Ltd. | | | 1,202,000 | | | | 954,827 | | |
Canada 0.8% | |
Canadian National Railway Co. | | | 39,092 | | | | 3,963,929 | | |
IMAX Corp.(a) | | | 67,679 | | | | 1,739,350 | | |
Pacific Rubiales Energy Corp. | | | 62,873 | | | | 1,539,436 | | |
Total | | | | | 7,242,715 | | |
Common Stocks (continued)
Issuer | | Shares | | Value ($) | |
Chile 0.2% | |
SACI Falabella | | | 139,600 | | | | 1,629,395 | | |
China 5.6% | |
Anhui Conch Cement Co., Ltd., Class H | | | 186,500 | | | | 680,070 | | |
Baidu, Inc., ADR(a) | | | 29,084 | | | | 2,639,664 | | |
Beijing Enterprises Holdings Ltd. | | | 107,500 | | | | 822,368 | | |
Brilliance China Automotive
Holdings Ltd.(a) | | | 862,000 | | | | 1,187,924 | | |
China Communications Construction
Co., Ltd., Class H | | | 4,614,000 | | | | 4,362,880 | | |
China Milk Products Group Ltd.(a)(b)(c) | | | 7,426,000 | | | | 239,858 | | |
China Mobile Ltd., ADR | | | 64,386 | | | | 3,528,353 | | |
China Petroleum & Chemical Corp.,
Class H | | | 3,110,000 | | | | 3,531,341 | | |
China Shenhua Energy Co., Ltd.,
Class H | | | 684,500 | | | | 2,588,722 | | |
China Telecom Corp., Ltd., Class H | | | 698,000 | | | | 361,684 | | |
China Vanke Co., Ltd., Class B | | | 1,436,370 | | | | 2,917,954 | | |
CIMC Enric Holdings Ltd. | | | 796,000 | | | | 881,193 | | |
CNOOC Ltd. | | | 1,455,089 | | | | 2,843,849 | | |
ENN Energy Holdings Ltd. | | | 492,000 | | | | 2,469,147 | | |
Guangdong Investment Ltd. | | | 3,184,000 | | | | 2,736,982 | | |
Industrial & Commercial Bank of China
Ltd., Class H | | | 11,557,000 | | | | 8,285,433 | | |
Kunlun Energy Co., Ltd. | | | 272,000 | | | | 563,384 | | |
KWG Property Holding Ltd. | | | 1,292,000 | | | | 885,125 | | |
Lenovo Group Ltd. | | | 852,000 | | | | 950,094 | | |
PetroChina Co., Ltd., Class H | | | 4,198,000 | | | | 5,753,449 | | |
Tencent Holdings Ltd. | | | 46,300 | | | | 1,594,301 | | |
Want Want China Holdings Ltd. | | | 1,131,000 | | | | 1,582,784 | | |
Wumart Stores, Inc., Class H | | | 454,000 | | | | 891,495 | | |
Zhuzhou CSR Times Electric Co., Ltd.,
Class H | | | 415,000 | | | | 1,369,485 | | |
Total | | | | | 53,667,539 | | |
Denmark 1.1% | |
Novo Nordisk A/S, Class B | | | 61,908 | | | | 10,811,802 | | |
Finland 0.4% | |
KONE OYJ, Class B | | | 45,687 | | | | 3,686,066 | | |
France 6.2% | |
Air Liquide SA | | | 21,632 | | | | 2,625,339 | | |
The accompanying Notes to Financial Statements are an integral part of this statement.
Annual Report 2013
10
Columbia Multi-Advisor International Equity Fund
Portfolio of Investments (continued)
February 28, 2013
Common Stocks (continued)
Issuer | | Shares | | Value ($) | |
AtoS | | | 58,711 | | | | 4,350,310 | | |
BNP Paribas SA | | | 206,124 | | | | 11,529,373 | | |
Edenred | | | 93,274 | | | | 3,222,135 | | |
European Aeronautic Defence and
Space Co. NV | | | 141,334 | | | | 7,204,592 | | |
L'Oreal SA | | | 25,024 | | | | 3,733,032 | | |
Pernod-Ricard SA | | | 15,778 | | | | 2,043,462 | | |
Publicis Groupe SA | | | 105,159 | | | | 6,934,097 | | |
Rexel SA | | | 90,230 | | | | 2,088,398 | | |
Schneider Electric SA | | | 122,724 | | | | 9,399,795 | | |
Societe Generale SA(a) | | | 76,012 | | | | 2,897,469 | | |
Unibail-Rodamco SE | | | 12,173 | | | | 2,809,786 | | |
Total | | | | | 58,837,788 | | |
Germany 9.4% | |
Adidas AG | | | 42,085 | | | | 3,825,164 | | |
Allianz SE, Registered Shares | | | 94,191 | | | | 12,841,636 | | |
BASF SE | | | 70,194 | | | | 6,592,389 | | |
Bayer AG, Registered Shares | | | 84,218 | | | | 8,317,350 | | |
Bayerische Motoren Werke AG | | | 45,140 | | | | 4,150,213 | | |
Brenntag AG | | | 54,103 | | | | 7,696,981 | | |
Continental AG | | | 41,682 | | | | 4,880,056 | | |
Fresenius Medical Care AG & Co. KGaA | | | 132,709 | | | | 9,095,172 | | |
Fresenius SE & Co. KGaA | | | 10,353 | | | | 1,270,368 | | |
Kabel Deutschland Holding AG | | | 112,531 | | | | 9,742,906 | | |
Lanxess AG | | | 74,664 | | | | 6,301,313 | | |
Merck KGaA | | | 33,936 | | | | 4,778,161 | | |
SAP AG | | | 116,028 | | | | 9,060,662 | | |
Total | | | | | 88,552,371 | | |
Hong Kong 2.8% | |
AAC Technologies Holdings, Inc. | | | 225,046 | | | | 955,388 | | |
AIA Group Ltd. | | | 1,199,600 | | | | 5,187,750 | | |
Cheung Kong Holdings Ltd. | | | 104,000 | | | | 1,614,827 | | |
Hang Lung Properties Ltd. | | | 186,000 | | | | 720,937 | | |
Hongkong Land Holdings Ltd. | | | 164,000 | | | | 1,264,834 | | |
Jardine Matheson Holdings Ltd. | | | 26,800 | | | | 1,696,879 | | |
Link REIT (The) | | | 444,000 | | | | 2,373,597 | | |
Sands China Ltd. | | | 1,249,200 | | | | 5,940,718 | | |
Television Broadcasts Ltd. | | | 361,000 | | | | 2,749,218 | | |
Trinity Ltd. | | | 1,342,000 | | | | 760,244 | | |
Wharf Holdings Ltd. | | | 269,000 | | | | 2,349,414 | | |
Common Stocks (continued)
Issuer | | Shares | | Value ($) | |
Wynn Macau Ltd.(a) | | | 317,200 | | | | 834,755 | | |
Total | | | | | 26,448,561 | | |
India 2.5% | |
Asian Paints Ltd. | | | 20,259 | | | | 1,589,385 | | |
Bharti Airtel Ltd. | | | 156,229 | | | | 924,398 | | |
Cairn India Ltd. | | | 523,058 | | | | 2,865,542 | | |
Cummins India Ltd. | | | 79,631 | | | | 697,031 | | |
Eicher Motors Ltd. | | | 11,500 | | | | 585,654 | | |
Havells India Ltd | | | 83,589 | | | | 979,210 | | |
HCL Technologies Ltd. | | | 57,909 | | | | 770,418 | | |
HDFC Bank Ltd., ADR | | | 90,460 | | | | 3,442,003 | | |
ICICI Bank Ltd., ADR | | | 76,452 | | | | 3,204,868 | | |
ITC Ltd. | | | 566,998 | | | | 3,072,284 | | |
Jubilant Foodworks Ltd.(a) | | | 36,350 | | | | 698,659 | | |
Tata Motors Ltd. | | | 558,885 | | | | 2,998,527 | | |
Titan Industries Ltd. | | | 435,504 | | | | 2,082,625 | | |
Total | | | | | 23,910,604 | | |
Indonesia 1.9% | |
PT Ace Hardware Indonesia Tbk | | | 9,475,500 | | | | 715,698 | | |
PT AKR Corporindo Tbk | | | 1,532,500 | | | | 708,389 | | |
PT Astra International Tbk | | | 1,539,500 | | | | 1,265,622 | | |
PT Bank Rakyat Indonesia Persero Tbk | | | 2,258,500 | | | | 2,204,387 | | |
PT Bank Tabungan Pensiunan
Nasional Tbk(a) | | | 2,346,500 | | | | 1,141,258 | | |
PT Gudang Garam Tbk | | | 339,500 | | | | 1,695,486 | | |
PT Indocement Tunggal Prakarsa Tbk | | | 1,730,000 | | | | 3,925,318 | | |
PT Indofood Sukses Makmur Tbk | | | 1,469,000 | | | | 1,107,528 | | |
PT Nippon Indosari Corpindo Tbk | | | 1,698,000 | | | | 1,088,853 | | |
PT Perusahaan Gas Negara Persero Tbk | | | 4,868,000 | | | | 2,415,451 | | |
PT Sumber Alfaria Trijaya Tbk | | | 1,950,000 | | | | 1,251,100 | | |
Total | | | | | 17,519,090 | | |
Israel 0.3% | |
Check Point Software Technologies Ltd.(a) | | | 52,655 | | | | 2,764,914 | | |
Italy 0.2% | |
Mediobanca SpA | | | 317,694 | | | | 1,920,783 | | |
Japan 7.7% | |
Activia Properties, Inc. | | | 110 | | | | 835,469 | | |
Aisin Seiki Co., Ltd. | | | 17,500 | | | | 633,357 | | |
The accompanying Notes to Financial Statements are an integral part of this statement.
Annual Report 2013
11
Columbia Multi-Advisor International Equity Fund
Portfolio of Investments (continued)
February 28, 2013
Common Stocks (continued)
Issuer | | Shares | | Value ($) | |
Arnest One Corp. | | | 103,900 | | | | 1,707,048 | | |
Astellas Pharma, Inc. | | | 27,600 | | | | 1,490,891 | | |
Canon, Inc. | | | 44,600 | | | | 1,614,046 | | |
Chiyoda Co., Ltd. | | | 32,000 | | | | 702,527 | | |
Daiichikosho Co., Ltd. | | | 64,400 | | | | 1,666,799 | | |
Dena Co., Ltd. | | | 102,100 | | | | 2,863,005 | | |
FANUC CORP. | | | 19,200 | | | | 2,960,601 | | |
Fast Retailing Co., Ltd. | | | 900 | | | | 247,060 | | |
Fuji Heavy Industries Ltd. | | | 146,000 | | | | 2,186,055 | | |
Hino Motors Ltd. | | | 140,000 | | | | 1,478,870 | | |
Hitachi Ltd. | | | 305,000 | | | | 1,709,514 | | |
Honda Motor Co., Ltd. | | | 97,500 | | | | 3,646,364 | | |
Hoshizaki Electric Co., Ltd. | | | 30,200 | | | | 827,539 | | |
Hoya Corp. | | | 136,000 | | | | 2,604,014 | | |
Industrial & Infrastructure Fund
Investment Corp. | | | 36 | | | | 323,061 | | |
ITOCHU Corp. | | | 253,100 | | | | 2,920,446 | | |
Japan Tobacco, Inc. | | | 87,400 | | | | 2,759,574 | | |
Kakaku.com, Inc. | | | 2,500 | | | | 97,076 | | |
Kinki Sharyo Co., Ltd. | | | 125,000 | | | | 404,282 | | |
Komatsu Ltd. | | | 112,800 | | | | 2,840,562 | | |
Lawson, Inc. | | | 23,500 | | | | 1,747,864 | | |
Maeda Road Construction Co., Ltd. | | | 41,000 | | | | 587,691 | | |
Marubeni Corp. | | | 379,000 | | | | 2,764,374 | | |
Mitsubishi Estate Co., Ltd. | | | 42,000 | | | | 1,047,027 | | |
Mitsubishi UFJ Financial Group, Inc. | | | 525,200 | | | | 2,910,883 | | |
Mitsui & Co., Ltd. | | | 88,200 | | | | 1,305,671 | | |
Mizuho Financial Group, Inc. | | | 1,574,900 | | | | 3,463,869 | | |
MonotaRO Co., Ltd | | | 2,200 | | | | 96,205 | | |
Nippon Prologis REIT, Inc.(a) | | | 17 | | | | 133,154 | | |
Nippon Telegraph & Telephone Corp. | | | 20,500 | | | | 936,700 | | |
Nitto Denko Corp. | | | 37,000 | | | | 2,170,829 | | |
ORIX Corp. | | | 22,180 | | | | 2,471,197 | | |
Otsuka Holdings Co., Ltd. | | | 15,400 | | | | 493,316 | | |
Rakuten, Inc. | | | 417,500 | | | | 3,608,804 | | |
Shin-Etsu Chemical Co., Ltd. | | | 27,400 | | | | 1,684,503 | | |
SoftBank Corp. | | | 9,700 | | | | 359,275 | | |
Sumitomo Mitsui Financial Group, Inc. | | | 91,600 | | | | 3,655,673 | | |
Takeda Pharmaceutical Co., Ltd. | | | 35,400 | | | | 1,829,686 | | |
Totetsu Kogyo Co., Ltd | | | 52,800 | | | | 760,779 | | |
Common Stocks (continued)
Issuer | | Shares | | Value ($) | |
Toyota Motor Corp. | | | 74,100 | | | | 3,805,745 | | |
Tsuruha Holdings, Inc. | | | 8,600 | | | | 745,098 | | |
Total | | | | | 73,096,503 | | |
Malta — % | |
BGP Holdings PLC(b)(c) | | | 2,232,232 | | | | 3 | | |
Mexico 0.5% | |
Alfa SAB de CV, Class A | | | 475,500 | | | | 1,143,997 | | |
Grupo Financiero Santander Mexico
SAB de CV, ADR, Class B(a) | | | 167,533 | | | | 2,499,592 | | |
Grupo Mexico SAB de CV, Class B | | | 282,936 | | | | 1,109,397 | | |
Total | | | | | 4,752,986 | | |
Netherlands 2.4% | |
Aegon NV | | | 1,001,881 | | | | 5,963,849 | | |
| ASML Holding NV | | | 84,118 | | | | 5,970,379 | | |
ING Groep NV-CVA(a) | | | 819,116 | | | | 6,557,695 | | |
Ziggo NV | | | 110,401 | | | | 3,726,413 | | |
Total | | | | | 22,218,336 | | |
Norway 0.2% | |
Seadrill Ltd. | | | 56,873 | | | | 2,073,898 | | |
Panama 0.1% | |
Copa Holdings SA, Class A | | | 9,953 | | | | 1,039,292 | | |
Peru 0.3% | |
Credicorp Ltd. | | | 17,535 | | | | 2,629,899 | | |
Philippines 2.5% | |
Aboitiz Power Corp. | | | 2,454,500 | | | | 2,324,109 | | |
Ayala Land, Inc. | | | 3,546,100 | | | | 2,787,468 | | |
Energy Development Corp. | | | 17,944,100 | | | | 3,345,238 | | |
GT Capital Holdings, Inc. | | | 293,720 | | | | 5,418,503 | | |
International Container Terminal
Services, Inc. | | | 529,370 | | | | 1,067,122 | | |
Metropolitan Bank & Trust | | | 1,368,340 | | | | 3,834,625 | | |
Security Bank Corp. | | | 1,020,660 | | | | 4,432,561 | | |
Total | | | | | 23,209,626 | | |
Poland 0.2% | |
Eurocash SA | | | 131,200 | | | | 2,188,594 | | |
Portugal 0.3% | |
Galp Energia SGPS SA | | | 177,361 | | | | 2,732,327 | | |
The accompanying Notes to Financial Statements are an integral part of this statement.
Annual Report 2013
12
Columbia Multi-Advisor International Equity Fund
Portfolio of Investments (continued)
February 28, 2013
Common Stocks (continued)
Issuer | | Shares | | Value ($) | |
Russian Federation 1.1% | |
Gazprom OAO, ADR | | | 98,804 | | | | 877,301 | | |
Lukoil OAO, ADR | | | 23,773 | | | | 1,533,953 | | |
Magnit OJSC, GDR(d) | | | 51,165 | | | | 2,164,044 | | |
Mail.ru Group Ltd., GDR(d) | | | 23,240 | | | | 780,873 | | |
Mobile Telesystems OJSC, ADR | | | 47,642 | | | | 985,713 | | |
Yandex NV, Class A(a) | | | 165,237 | | | | 3,831,846 | | |
Total | | | | | 10,173,730 | | |
Singapore 2.2% | |
CapitaCommercial Trust | | | 883,000 | | | | 1,182,858 | | |
DBS Group Holdings Ltd. | | | 257,000 | | | | 3,125,207 | | |
Global Logistic Properties Ltd. | | | 440,000 | | | | 902,421 | | |
Hutchison Port Holdings Trust | | | 3,684,000 | | | | 2,978,967 | | |
Keppel Corp., Ltd. | | | 361,000 | | | | 3,382,530 | | |
Mapletree Logistics Trust | | | 1,838,000 | | | | 1,809,295 | | |
Singapore Technologies Engineering Ltd. | | | 924,000 | | | | 3,164,171 | | |
Venture Corp., Ltd. | | | 280,000 | | | | 1,929,069 | | |
Wing Tai Holdings Ltd. | | | 1,426,000 | | | | 2,232,285 | | |
Total | | | | | 20,706,803 | | |
South Africa 0.7% | |
AVI Ltd. | | | 277,165 | | | | 1,704,321 | | |
Clicks Group Ltd. | | | 98,840 | | | | 648,284 | | |
Life Healthcare Group Holdings Ltd. | | | 213,070 | | | | 797,736 | | |
Naspers Ltd., Class N | | | 34,910 | | | | 2,254,254 | | |
Shoprite Holdings Ltd. | | | 76,267 | | | | 1,450,653 | | |
Total | | | | | 6,855,248 | | |
South Korea 3.8% | |
Hankook Tire Co., Ltd. | | | 18,283 | | | | 828,337 | | |
Huchems Fine Chemical Corp. | | | 33,460 | | | | 754,836 | | |
Hyundai Motor Co. | | | 49,190 | | | | 9,841,467 | | |
LG Display Co., Ltd.(a) | | | 66,000 | | | | 1,847,072 | | |
Samsung Electronics Co., Ltd. | | | 13,827 | | | | 19,584,282 | | |
Samsung SDI Co., Ltd. | | | 6,829 | | | | 873,197 | | |
SK Hynix, Inc.(a) | | | 51,480 | | | | 1,252,838 | | |
Suprema, Inc.(a) | | | 26,724 | | | | 484,190 | | |
Total | | | | | 35,466,219 | | |
Spain 1.8% | |
Amadeus IT Holding SA, Class A | | | 191,271 | | | | 4,883,428 | | |
Common Stocks (continued)
Issuer | | Shares | | Value ($) | |
Banco Bilbao Vizcaya Argentaria SA | | | 449,851 | | | | 4,357,851 | | |
Gas Natural SDG SA | | | 131,948 | | | | 2,611,534 | | |
Inditex SA | | | 41,913 | | | | 5,603,119 | | |
Total | | | | | 17,455,932 | | |
Sweden 0.2% | |
Millicom International Cellular SA, SDR | | | 22,849 | | | | 1,790,092 | | |
Switzerland 8.5% | |
Cie Financiere Richemont SA, Class A | | | 61,704 | | | | 4,949,213 | | |
Dufry AG, Registered Shares(a) | | | 13,826 | | | | 1,877,480 | | |
Nestlé SA, Registered Shares | | | 298,595 | | | | 20,845,086 | | |
Novartis AG, Registered Shares | | | 142,630 | | | | 9,658,638 | | |
Roche Holding AG, Genusschein Shares | | | 16,926 | | | | 3,872,808 | | |
SGS SA, Registered Shares | | | 2,004 | | | | 5,082,367 | | |
Swatch Group AG (The) | | | 4,888 | | | | 2,776,025 | | |
Swatch Group AG (The), Registered Shares | | | 102,948 | | | | 10,450,110 | | |
Syngenta AG | | | 20,326 | | | | 8,626,068 | | |
UBS AG, Registered Shares | | | 745,801 | | | | 11,783,887 | | |
Total | | | | | 79,921,682 | | |
Taiwan 3.0% | |
Airtac International Group | | | 180,000 | | | | 1,059,381 | | |
Asustek Computer, Inc. | | | 183,000 | | | | 2,241,510 | | |
CTCI Corp. | | | 709,000 | | | | 1,419,380 | | |
Far EasTone Telecommunications
Co., Ltd. | | | 1,356,000 | | | | 3,152,898 | | |
Giant Manufacturing Co., Ltd. | | | 160,000 | | | | 883,993 | | |
Gigabyte Technology Co., Ltd. | | | 2,290,000 | | | | 2,035,233 | | |
Hon Hai Precision Industry Co., Ltd. | | | 818,700 | | | | 2,284,176 | | |
MediaTek, Inc. | | | 90,000 | | | | 1,020,098 | | |
PChome Online, Inc. | | | 150,072 | | | | 757,191 | | |
Taiwan Semiconductor Manufacturing
Co., Ltd. | | | 611,049 | | | | 2,160,230 | | |
Taiwan Semiconductor Manufacturing
Co., Ltd., ADR | | | 494,024 | | | | 9,015,938 | | |
Tong Hsing Electronic Industries Ltd. | | | 154,000 | | | | 660,667 | | |
TPK Holding Co., Ltd. | | | 85,000 | | | | 1,641,035 | | |
Total | | | | | 28,331,730 | | |
Thailand 2.8% | |
Advanced Information Service PCL,
Foreign Registered Shares | | | 708,100 | | | | 4,922,863 | | |
The accompanying Notes to Financial Statements are an integral part of this statement.
Annual Report 2013
13
Columbia Multi-Advisor International Equity Fund
Portfolio of Investments (continued)
February 28, 2013
Common Stocks (continued)
Issuer | | Shares | | Value ($) | |
Bangkok Bank PCL, Foreign
Registered Shares | | | 859,900 | | | | 6,697,720 | | |
Bangkok Expressway PCL, Foreign
Registered Shares | | | 1,991,100 | | | | 2,880,543 | | |
BEC World PCL, Foreign
Registered Shares | | | 653,100 | | | | 1,474,031 | | |
CP ALL PCL, Foreign Registered Shares | | | 727,500 | | | | 1,153,795 | | |
Home Product Center PCL, Foreign
Registered Shares | | | 1,677,033 | | | | 924,303 | | |
Kasikornbank PCL, Foreign
Registered Shares | | | 340,900 | | | | 2,496,396 | | |
PTT PCL, Foreign Registered Shares | | | 256,200 | | | | 3,014,568 | | |
Robinson Department Store PCL, Foreign
Registered Shares | | | 603,700 | | | | 1,490,846 | | |
Siam Cement PCL, Foreign
Registered Shares | | | 55,400 | | | | 882,508 | | |
Siam Cement PCL, NVDR | | | 49,900 | | | | 777,376 | | |
Total | | | | | 26,714,949 | | |
Turkey 0.9% | |
Arcelik AS | | | 326,566 | | | | 2,072,333 | | |
Tofas Turk Otomobil Fabrikasi AS | | | 242,868 | | | | 1,507,388 | | |
Turk Traktor ve Ziraat Makineleri AS | | | 28,140 | | | | 922,930 | | |
Turkiye Garanti Bankasi AS | | | 252,736 | | | | 1,208,711 | | |
Turkiye Halk Bankasi AS | | | 297,367 | | | | 2,937,107 | | |
Total | | | | | 8,648,469 | | |
United Kingdom 16.3% | |
ARM Holdings PLC | | | 127,132 | | | | 1,840,551 | | |
Barclays PLC | | | 1,880,825 | | | | 8,726,873 | | |
BG Group PLC | | | 251,552 | | | | 4,435,746 | | |
British Sky Broadcasting Group PLC | | | 364,344 | | | | 4,688,530 | | |
Diageo PLC | | | 494,523 | | | | 14,828,851 | | |
easyJet PLC | | | 261,723 | | | | 3,946,903 | | |
Experian PLC | | | 225,682 | | | | 3,733,688 | | |
GKN PLC | | | 1,308,317 | | | | 5,395,633 | | |
HSBC Holdings PLC, ADR | | | 52,186 | | | | 2,893,192 | | |
Intercontinental Hotels Group PLC | | | 308,812 | | | | 8,954,266 | | |
Johnson Matthey PLC | | | 109,260 | | | | 3,796,496 | | |
Legal & General Group PLC | | | 2,801,491 | | | | 6,782,226 | | |
Next PLC | | | 31,348 | | | | 1,993,642 | | |
Persimmon PLC | | | 520,472 | | | | 7,198,696 | | |
Prudential PLC | | | 505,267 | | | | 7,499,555 | | |
Common Stocks (continued)
Issuer | | Shares | | Value ($) | |
Reckitt Benckiser Group PLC | | | 77,637 | | | | 5,206,255 | | |
Rio Tinto PLC | | | 193,397 | | | | 10,341,397 | | |
Rolls-Royce Holdings PLC | | | 247,518 | | | | 3,850,448 | | |
Schroders PLC | | | 75,106 | | | | 2,262,636 | | |
Shire PLC | | | 141,842 | | | | 4,437,973 | | |
Smith & Nephew PLC | | | 415,431 | | | | 4,450,067 | | |
Standard Chartered PLC | | | 336,355 | | | | 9,130,223 | | |
Telecity Group PLC | | | 361,976 | | | | 5,122,774 | | |
Tullow Oil PLC | | | 147,346 | | | | 2,706,550 | | |
Unilever PLC | | | 317,831 | | | | 12,657,157 | | |
Wolseley PLC | | | 111,555 | | | | 5,238,959 | | |
Xstrata PLC | | | 103,989 | | | | 1,825,159 | | |
Total | | | | | 153,944,446 | | |
United States 2.1% | |
Accenture PLC, Class A | | | 24,846 | | | | 1,847,549 | | |
Liberty Global, Inc., Class C(a) | | | 29,242 | | | | 1,867,394 | | |
LyondellBasell Industries NV, Class A | | | 75,557 | | | | 4,429,151 | | |
Perrigo Co. | | | 33,556 | | | | 3,797,532 | | |
Seagate Technology PLC | | | 101,116 | | | | 3,251,891 | | |
Virgin Media, Inc. | | | 47,700 | | | | 2,213,280 | | |
Wynn Resorts Ltd. | | | 22,441 | | | | 2,623,353 | | |
Total | | | | | 20,030,150 | | |
Total Common Stocks
(Cost: $716,831,409) | | | | | 911,490,130 | | |
Preferred Stocks 1.1%
Germany 1.1% | |
Henkel AG & Co. KGaA | | | 46,319 | | | | 4,074,127 | | |
Volkswagen AG | | | 28,943 | | | | 6,295,457 | | |
Total | | | | | 10,369,584 | | |
Total Preferred Stocks
(Cost: $5,386,927) | | | | | 10,369,584 | | |
Exchange-Traded Funds 0.4%
| | Shares | | Value ($) | |
iShares MSCI Pacific ex-Japan Index Fund | | | 74,040 | | | | 3,676,826 | | |
Total Exchange-Traded Funds
(Cost: $3,592,592) | | | | | 3,676,826 | | |
The accompanying Notes to Financial Statements are an integral part of this statement.
Annual Report 2013
14
Columbia Multi-Advisor International Equity Fund
Portfolio of Investments (continued)
February 28, 2013
Money Market Funds 2.6%
| | | Shares | | Value ($) | |
Columbia Short-Term Cash Fund,
0.128%(e)(f) | | | 24,514,286 | | | | 24,514,286 | | |
Total Money Market Funds
(Cost: $24,514,286) | | | | | 24,514,286 | | |
Total Investments
(Cost: $750,325,214) | | | | | 950,050,826 | | |
Other Assets & Liabilities, Net | | | | | (4,530,198 | ) | |
Net Assets | | | | | 945,520,628 | | |
Investments in Derivatives
Futures Contracts Outstanding at February 28, 2013
At February 28, 2013, $273,000 was held in a margin deposit account as collateral to cover initial margin requirements on open futures contracts.
Contract Description | | Number of
Contracts
Long (Short) | | Notional
Market
Value ($) | | Expiration
Date | | Unrealized
Appreciation ($) | | Unrealized
Depreciation ($) | |
E-Mini MSCI EAFE Index | | | 91 | | | | 7,547,995 | | | March 2013 | | | — | | | | (24,388 | ) | |
Forward Foreign Currency Exchange Contracts Open at February 28, 2013
Counterparty | | Exchange Date | | Currency to
be Delivered | | Currency to
be Received | | Unrealized
Appreciation ($) | | Unrealized
Depreciation ($) | |
Barclays Capital
| | March 14, 2013
| | | 14,436,000
(BRL) | | | | 7,018,533
(USD) | | | | —
| | | | (265,348
| ) | |
Barclays Capital
| | March 14, 2013
| | | 4,616,000
(CAD) | | | | 4,680,070
(USD) | | | | 204,975
| | | | —
| | |
Barclays Capital
| | March 14, 2013
| | | 163,373,576,000
(IDR) | | | | 16,477,416
(USD) | | | | —
| | | | (407,897
| ) | |
Barclays Capital
| | March 14, 2013
| | | 36,718,667,000
(KRW) | | | | 34,633,064
(USD) | | | | 744,892
| | | | —
| | |
Barclays Capital
| | March 14, 2013
| | | 83,194,000
(MXN) | | | | 6,581,944
(USD) | | | | 71,192
| | | | —
| | |
Barclays Capital
| | March 14, 2013
| | | 833,607,000
(PHP) | | | | 20,563,087
(USD) | | | | 62,034
| | | | —
| | |
Barclays Capital
| | March 14, 2013
| | | 143,095,000
(RUB) | | | | 4,682,581
(USD) | | | | 19,719
| | | | —
| | |
Barclays Capital
| | March 14, 2013
| | | 614,941,000
(THB) | | | | 20,570,372
(USD) | | | | —
| | | | (86,737
| ) | |
Barclays Capital
| | March 14, 2013
| | | 919,084,000
(TWD) | | | | 31,796,713
(USD) | | | | 813,568
| | | | —
| | |
Barclays Capital
| | March 14, 2013
| | | 51,378,932
(USD) | | | | 48,947,000
(AUD) | | | | —
| | | | (1,421,329
| ) | |
Barclays Capital
| | March 14, 2013
| | | 42,140,493
(USD) | | | | 31,531,000
(EUR) | | | | —
| | | | (972,165
| ) | |
Barclays Capital
| | March 14, 2013
| | | 43,885,241
(USD) | | | | 27,445,000
(GBP) | | | | —
| | | | (2,252,179
| ) | |
The accompanying Notes to Financial Statements are an integral part of this statement.
Annual Report 2013
15
Columbia Multi-Advisor International Equity Fund
Portfolio of Investments (continued)
February 28, 2013
Forward Foreign Currency Exchange Contracts Open at February 28, 2013 (continued)
Counterparty | | Exchange Date | | Currency to
be Delivered | | Currency to
be Received | | Unrealized
Appreciation ($) | | Unrealized
Depreciation ($) | |
Barclays Capital
| | March 14, 2013
| | | 101,934,034
(USD) | | | | 9,108,071,000
(JPY) | | | | —
| | | | (3,663,859
| ) | |
Barclays Capital
| | March 14, 2013
| | | 3,755,126
(USD) | | | | 21,301,000
(NOK) | | | | —
| | | | (46,013
| ) | |
Barclays Capital
| | March 14, 2013
| | | 18,793,587
(USD) | | | | 122,009,000
(SEK) | | | | 67,321
| | | | —
| | |
Barclays Capital
| | March 14, 2013
| | | 49,713,000
(ZAR) | | | | 5,624,724
(USD) | | | | 117,547
| | | | —
| | |
UBS Securities LLC
| | March 22, 2013
| | | 40,915,000
(CHF) | | | | 44,712,392
(USD) | | | | 1,051,469
| | | | —
| | |
HSBC Securities (USA), Inc.
| | March 22, 2013
| | | 84,036,000
(EUR) | | | | 113,756,579
(USD) | | | | 4,028,808
| | | | —
| | |
UBS Securities LLC
| | March 22, 2013
| | | 43,534,000
(GBP) | | | | 65,875,649
(USD) | | | | —
| | | | (160,820
| ) | |
Morgan Stanley
| | March 22, 2013
| | | 110,940,285
(USD) | | | | 107,796,000
(AUD) | | | | —
| | | | (987,931
| ) | |
State Street Bank & Trust Company
| | March 22, 2013
| | | 65,907,968
(USD) | | | | 376,204,000
(NOK) | | | | —
| | | | (420,005
| ) | |
Citigroup Global Markets Inc.
| | March 22, 2013
| | | 44,851,322
(USD) | | | | 53,379,000
(NZD) | | | | —
| | | | (777,045
| ) | |
Total | | | | | | | | | 7,181,525 | | | | (11,461,328 | ) | |
Notes to Portfolio of Investments
(a) Non-income producing.
(b) Identifies issues considered to be illiquid as to their marketability. The aggregate value of such securities at February 28, 2013 was $239,861, representing 0.03% of net assets. Information concerning such security holdings at February 28, 2013 is as follows:
Security Description | | Acquisition Dates | | Cost ($) | |
BGP Holdings PLC | | 02/04/09 - 05/14/09 | | | — | | |
China Milk Products Group Ltd. | | 09/11/06 - 07/02/09 | | | 4,479,619 | | |
(c) Represents fair value as determined in good faith under procedures approved by the Board of Trustees. At February 28, 2013, the value of these securities amounted to $239,861, which represents 0.03% of net assets.
(d) Security exempt from registration pursuant to Rule 144A under the Securities Act of 1933. This security may be resold in transactions exempt from registration, normally to qualified institutional buyers. At February 28, 2013, the value of these securities amounted to $2,944,917 or 0.31% of net assets.
(e) The rate shown is the seven-day current annualized yield at February 28, 2013.
(f) As defined in the Investment Company Act of 1940, an affiliated company is one in which the Fund owns 5% or more of its outstanding voting securities, or a company which is under common ownership or control with the Fund. Holdings and transactions in these affiliated companies during the year ended February 28, 2013, are as follows:
Issuer | | Beginning
Cost ($) | | Purchase
Cost ($) | | Proceeds
From Sales ($) | | Ending
Cost ($) | | Dividends —
Affiliated
Issuers ($) | | Value ($) | |
Columbia Short-Term Cash Fund | | | 16,462,496 | | | | 734,400,137 | | | | (726,348,347 | ) | | | 24,514,286 | | | | 46,018 | | | | 24,514,286 | | |
The accompanying Notes to Financial Statements are an integral part of this statement.
Annual Report 2013
16
Columbia Multi-Advisor International Equity Fund
Portfolio of Investments (continued)
February 28, 2013
Abbreviation Legend
ADR American Depositary Receipt
GDR Global Depositary Receipt
NVDR Non-voting Depository Receipt
SDR Swedish Depositary Receipt
Currency Legend
AUD Australian Dollar
BRL Brazilian Real
CAD Canadian Dollar
CHF Swiss Franc
EUR Euro
GBP British Pound
IDR Indonesian Rupiah
JPY Japanese Yen
KRW Korean Won
MXN Mexican Peso
NOK Norwegian Krone
PHP Philippine Peso
RUB Russian Rouble
SEK Swedish Krona
THB Thailand Baht
TWD Taiwan Dollar
ZAR South African Rand
Fair Value Measurements
Generally accepted accounting principles (GAAP) require disclosure regarding the inputs and valuation techniques used to measure fair value and any changes in valuation inputs or techniques. In addition, investments shall be disclosed by major category.
The Fund categorizes its fair value measurements according to a three-level hierarchy that maximizes the use of observable inputs and minimizes the use of unobservable inputs by prioritizing that the most observable input be used when available. Observable inputs are those that market participants would use in pricing an investment based on market data obtained from sources independent of the reporting entity. Unobservable inputs are those that reflect the Fund's assumptions about the information market participants would use in pricing an investment. An investment's level within the fair value hierarchy is based on the lowest level of any input that is deemed significant to the asset or liability's fair value measurement. The input levels are not necessarily an indication of the risk or liquidity associated with investments at that level. For example, certain U.S. government securities are generally high quality and liquid, however, they are reflected as Level 2 because the inputs used to determine fair value may not always be quoted prices in an active market.
Fair value inputs are summarized in the three broad levels listed below:
> Level 1 — Valuations based on quoted prices for investments in active markets that the Fund has the ability to access at the measurement date (including NAV for open-end mutual funds). Valuation adjustments are not applied to Level 1 investments.
> Level 2 — Valuations based on other significant observable inputs (including quoted prices for similar securities, interest rates, prepayment speeds, credit risks, etc.).
> Level 3 — Valuations based on significant unobservable inputs (including the Fund's own assumptions and judgment in determining the fair value of investments).
Inputs that are used in determining fair value of an investment may include price information, credit data, volatility statistics, and other factors. These inputs can be either observable or unobservable. The availability of observable inputs can vary between investments, and is affected by various factors such as the type of investment, and the volume and level of activity for that investment or similar investments in the marketplace. The inputs will be considered by the Investment Manager, along with any other relevant factors in the calculation of an investment's fair value. The Fund uses prices and inputs that are current as of the measurement date, which may include periods of market
The accompanying Notes to Financial Statements are an integral part of this statement.
Annual Report 2013
17
Columbia Multi-Advisor International Equity Fund
Portfolio of Investments (continued)
February 28, 2013
Fair Value Measurements (continued)
dislocations. During these periods, the availability of prices and inputs may be reduced for many investments. This condition could cause an investment to be reclassified between the various levels within the hierarchy.
Foreign equity securities actively traded in markets where there is a significant delay in the local close relative to the New York Stock Exchange (NYSE) are classified as Level 2. The values of these securities may include an adjustment to reflect the impact of significant market movements following the close of local trading, as described in Note 2 to the financial statements — Security Valuation.
Investments falling into the Level 3 category are primarily supported by quoted prices from brokers and dealers participating in the market for those investments. However, these may be classified as Level 3 investments due to lack of market transparency and corroboration to support these quoted prices. Additionally, valuation models may be used as the pricing source for any remaining investments classified as Level 3. These models rely on one or more significant unobservable inputs and/or significant assumptions by the Investment Manager. Inputs used in valuations may include, but are not limited to, financial statement analysis, capital account balances, discount rates and estimated cash flows, and comparable company data.
Under the direction of the Fund's Board of Trustees (the Board), the Investment Manager's Valuation Committee (the Committee) is responsible for carrying out the valuation procedures approved by the Board. The Committee consists of voting and non-voting members from various groups within the Investment Manager's organization, including operations and accounting, trading and investments, compliance, risk management and legal.
The Committee meets at least monthly to review and approve valuation matters, which may include a description of specific valuation determinations, data regarding pricing information received from approved pricing vendors and brokers and the results of Board-approved valuation control policies and procedures (the Policies). The Policies address, among other things, instances when market quotations are readily available, including recommendations of third party pricing vendors and a determination of appropriate pricing methodologies; events that require specific valuation determinations and assessment of fair value techniques; securities with a potential for stale pricing, including those that are illiquid, restricted, or in default; and the effectiveness of third-party pricing vendors, including periodic reviews of vendors. The Committee meets more frequently, as needed, to discuss additional valuation matters, which may include the need to review back-testing results, review time-sensitive information or approve related valuation actions. The Committee reports to the Board, with members of the Committee meeting with the Board at each of its regularly scheduled meetings to discuss valuation matters and actions during the period, similar to those described earlier.
For investments categorized as Level 3, the Committee monitors information similar to that described above, which may include: (i) data specific to the issuer or comparable issuers, (ii) general market or specific sector news and (iii) quoted prices and specific or similar security transactions. The Committee considers this data and any changes from prior periods in order to assess the reasonableness of observable and unobservable inputs, any assumptions or internal models used to value those securities and changes in fair value. This data is also used to corroborate, when available, information received from approved pricing vendors and brokers. Various factors impact the frequency of monitoring this information (which may occur as often as daily). However, the Committee may determine that changes to inputs, assumptions and models are not required as a result of the monitoring procedures performed.
The following table is a summary of the inputs used to value the Fund's investments at February 28, 2013:
Description | | Level 1
Quoted Prices in Active
Markets for Identical
Assets ($) | |
Level 2
Other Significant
Observable Inputs ($) | |
Level 3
Significant
Unobservable Inputs ($) | |
Total ($) | |
Equity Securities | |
Common Stocks | |
Consumer Discretionary | | | 11,894,142 | | | | 144,828,427 | | | | — | | | | 156,722,569 | | |
Consumer Staples | | | 2,956,795 | | | | 100,829,083 | | | | 239,858 | | | | 104,025,736 | | |
Energy | | | 5,307,429 | | | | 33,986,679 | | | | — | | | | 39,294,108 | | |
Financials | | | 19,868,706 | | | | 194,631,472 | | | | 3 | | | | 214,500,181 | | |
Health Care | | | 5,807,725 | | | | 61,303,967 | | | | — | | | | 67,111,692 | | |
Industrials | | | 8,342,235 | | | | 104,286,323 | | | | — | | | | 112,628,558 | | |
Information Technology | | | 25,984,401 | | | | 83,937,623 | | | | — | | | | 109,922,024 | | |
Materials | | | 7,293,534 | | | | 59,454,073 | | | | — | | | | 66,747,607 | | |
Telecommunication Services | | | 4,514,066 | | | | 20,121,129 | | | | — | | | | 24,635,195 | | |
Utilities | | | — | | | | 15,902,460 | | | | — | | | | 15,902,460 | | |
The accompanying Notes to Financial Statements are an integral part of this statement.
Annual Report 2012
18
Columbia Multi-Advisor International Equity Fund
Portfolio of Investments (continued)
February 28, 2013
Fair Value Measurements (continued)
Description | | Level 1
Quoted Prices in Active
Markets for Identical
Assets ($) | |
Level 2
Other Significant
Observable Inputs ($) | |
Level 3
Significant
Unobservable Inputs ($) | |
Total ($) | |
Preferred Stocks | |
Consumer Discretionary | | | — | | | | 6,295,457 | | | | — | | | | 6,295,457 | | |
Consumer Staples | | | — | | | | 4,074,127 | | | | — | | | | 4,074,127 | | |
Exchange-Traded Funds | | | 3,676,826 | | | | — | | | | — | | | | 3,676,826 | | |
Total Equity Securities | | | 95,645,859 | | | | 829,650,820 | | | | 239,861 | | | | 925,536,540 | | |
Other | |
Money Market Funds | | | 24,514,286 | | | | — | | | | — | | | | 24,514,286 | | |
Total Other | | | 24,514,286 | | | | — | | | | — | | | | 24,514,286 | | |
Investments in Securities | | | 120,160,145 | | | | 829,650,820 | | | | 239,861 | | | | 950,050,826 | | |
Derivatives | |
Assets | |
Forward Foreign Currency
Exchange Contracts | | | — | | | | 7,181,525 | | | | — | | | | 7,181,525 | | |
Liabilities | |
Futures Contracts | | | (24,388 | ) | | | — | | | | — | | | | (24,388 | ) | |
Forward Foreign Currency
Exchange Contracts | | | — | | | | (11,461,328 | ) | | | — | | | | (11,461,328 | ) | |
Total | | | 120,135,757 | | | | 825,371,017 | | | | 239,861 | | | | 945,746,635 | | |
See the Portfolio of Investments for all investment classifications not indicated in the table.
The Fund's assets assigned to the Level 2 input category are generally valued using the market approach, in which a security's value is determined through reference to prices and information from market transactions for similar or identical assets. These assets include certain foreign securities for which a third party statistical pricing service may be employed for purposes of fair market valuation. The models utilized by the third party statistical pricing service take into account a security's correlation to available market data including, but not limited to, intraday index, ADR, and ETF movements.
Financial assets were transferred from Level 2 to Level 1 as the market for these assets was deemed to be active during the period and fair values were consequently obtained using quoted prices for identical assets rather than being based upon other observable market inputs as of period end, February 28, 2013.
The following table shows transfers between Level 1 and Level 2 of the fair value hierarchy:
Transfers In | | Transfers Out | |
| Level 1 | | Level 2 | | Level 1 | | Level 2 | |
| $ | 1,394,436 | | | $ | — | | | $ | — | | | $ | 1,394,436 | | |
Transfers between Level 1 and Level 2 are determined based on the fair value at the beginning of the period for security positions held throughout the period.
Derivative instruments are valued at unrealized appreciation (depreciation).
The accompanying Notes to Financial Statements are an integral part of this statement.
Annual Report 2012
19
Columbia Multi-Advisor International Equity Fund
Portfolio of Investments (continued)
February 28, 2013
Fair Value Measurements (continued)
The following table is a reconciliation of Level 3 assets for which significant observable and/or unobservable inputs were used to determine fair value.
| | | Common Stocks ($) | |
Balance as of February 29, 2012 | | | 373,678 | | |
Accrued discounts/premiums | | | — | | |
Realized gain (loss) | | | (348,968 | ) | |
Change in unrealized appreciation (depreciation)(a) | | | 292,951 | | |
Sales | | | (77,800 | ) | |
Purchases | | | — | | |
Transfers into Level 3 | | | — | | |
Transfers out of Level 3 | | | — | | |
Balance as of February 28, 2013 | | | 239,861 | | |
(a) Change in unrealized appreciation (depreciation) relating to securities held at February 28, 2013 was $2,349.
The Fund does not hold any significant investments with unobservable inputs which are categorized as Level 3.
The Fund's assets assigned to the Level 3 category are valued utilizing the valuation technique deemed the most appropriate in the circumstances. Certain common stocks classified as Level 3 securities are valued using the market approach. To determine fair value for these securities, management considered various factors which may have included, but were not limited to, the halt price of the security, the movement in observed market prices for other securities from the issuer, the movement in certain foreign or domestic market indices, and the position of the security within the respective company's capital structure. Significant increases (decreases) to any of these inputs would result in a significantly lower (higher) fair value measurement.
Transfers in and/or out of Level 3 are determined based on the fair value at the beginning of the period for security positions held throughout the period.
The accompanying Notes to Financial Statements are an integral part of this statement.
Annual Report 2012
20
Columbia Multi-Advisor International Equity Fund
Statement of Assets and Liabilities
February 28, 2013
Assets | |
Investments, at value | |
Unaffiliated issuers (identified cost $725,810,928) | | $ | 925,536,540 | | |
Affiliated issuers (identified cost $24,514,286) | | | 24,514,286 | | |
Total investments (identified cost $750,325,214) | | | 950,050,826 | | |
Foreign currency (identified cost $3,506) | | | 3,419 | | |
Margin deposits on futures contracts | | | 273,000 | | |
Unrealized appreciation on forward foreign currency exchange contracts | | | 7,181,525 | | |
Receivable for: | |
Investments sold | | | 10,783,983 | | |
Capital shares sold | | | 1,352,292 | | |
Dividends | | | 1,705,117 | | |
Reclaims | | | 2,294,783 | | |
Prepaid expenses | | | 3,873 | | |
Trustees' deferred compensation plan | | | 117,105 | | |
Total assets | | | 973,765,923 | | |
Liabilities | |
Unrealized depreciation on forward foreign currency exchange contracts | | | 11,461,328 | | |
Payable for: | |
Investments purchased | | | 14,018,499 | | |
Capital shares purchased | | | 2,124,144 | | |
Variation margin on futures contracts | | | 11,830 | | |
Investment management fees | | | 19,950 | | |
Distribution and/or service fees | | | 4,551 | | |
Transfer agent fees | | | 129,357 | | |
Administration fees | | | 2,015 | | |
Plan administration fees | | | 24 | | |
Compensation of board members | | | 128,950 | | |
Other expenses | | | 227,542 | | |
Trustees' deferred compensation plan | | | 117,105 | | |
Total liabilities | | | 28,245,295 | | |
Net assets applicable to outstanding capital stock | | $ | 945,520,628 | | |
Represented by | |
Paid-in capital | | $ | 1,763,361,485 | | |
Excess of distributions over net investment income | | | (15,866,186 | ) | |
Accumulated net realized loss | | | (997,297,410 | ) | |
Unrealized appreciation (depreciation) on: | |
Investments | | | 199,725,612 | | |
Foreign currency translations | | | (98,682 | ) | |
Forward foreign currency exchange contracts | | | (4,279,803 | ) | |
Futures contracts | | | (24,388 | ) | |
Total — representing net assets applicable to outstanding capital stock | | $ | 945,520,628 | | |
The accompanying Notes to Financial Statements are an integral part of this statement.
Annual Report 2013
21
Columbia Multi-Advisor International Equity Fund
Statement of Assets and Liabilities (continued)
February 28, 2013
Class A | |
Net assets | | $ | 313,239,244 | | |
Shares outstanding | | | 26,052,446 | | |
Net asset value per share | | $ | 12.02 | | |
Maximum offering price per share(a) | | $ | 12.75 | | |
Class B | |
Net assets | | $ | 6,566,175 | | |
Shares outstanding | | | 602,127 | | |
Net asset value per share | | $ | 10.90 | | |
Class C | |
Net assets | | $ | 12,619,240 | | |
Shares outstanding | | | 1,171,617 | | |
Net asset value per share | | $ | 10.77 | | |
Class I | |
Net assets | | $ | 24,204,005 | | |
Shares outstanding | | | 1,984,372 | | |
Net asset value per share | | $ | 12.20 | | |
Class K(b) | |
Net assets | | $ | 121,897 | | |
Shares outstanding | | | 9,995 | | |
Net asset value per share | | $ | 12.20 | | |
Class R | |
Net assets | | $ | 1,673,303 | | |
Shares outstanding | | | 139,271 | | |
Net asset value per share | | $ | 12.01 | | |
Class R4 | |
Net assets | | $ | 2,640 | | |
Shares outstanding | | | 215 | | |
Net asset value per share(c) | | $ | 12.27 | | |
Class R5 | |
Net assets | | $ | 2,639 | | |
Shares outstanding | | | 215 | | |
Net asset value per share(c) | | $ | 12.26 | | |
Class W | |
Net assets | | $ | 270,143,984 | | |
Shares outstanding | | | 22,468,605 | | |
Net asset value per share | | $ | 12.02 | | |
Class Y | |
Net assets | | $ | 14,989,734 | | |
Shares outstanding | | | 1,227,672 | | |
Net asset value per share | | $ | 12.21 | | |
Class Z | |
Net assets | | $ | 301,957,767 | | |
Shares outstanding | | | 24,762,211 | | |
Net asset value per share | | $ | 12.19 | | |
(a) The maximum offering price per share is calculated by dividing the net asset value by 1.0 minus the maximum sales charge of 5.75%.
(b) Effective October 25, 2012, Class R4 shares were renamed Class K shares.
(c) Net asset value per share rounds to this amount due to fractional shares outstanding.
The accompanying Notes to Financial Statements are an integral part of this statement.
Annual Report 2013
22
Columbia Multi-Advisor International Equity Fund
Statement of Operations
Year Ended February 28, 2013
Net investment income | |
Income: | |
Dividends — unaffiliated issuers | | $ | 36,545,678 | | |
Dividends — affiliated issuers | | | 46,018 | | |
Interest | | | 11,781 | | |
Income from securities lending — net | | | 743,496 | | |
Foreign taxes withheld | | | (3,033,306 | ) | |
Total income | | | 34,313,667 | | |
Expenses: | |
Investment management fees | | | 8,742,256 | | |
Distribution and/or service fees | |
Class A | | | 797,791 | | |
Class B | | | 83,105 | | |
Class C | | | 132,877 | | |
Class R | | | 8,651 | | |
Class W | | | 582,357 | | |
Transfer agent fees | |
Class A | | | 642,316 | | |
Class B | | | 16,597 | | |
Class C | | | 26,727 | | |
Class K(a) | | | 63 | | |
Class R | | | 3,485 | | |
Class R4(b) | | | 2 | | |
Class W | | | 468,319 | | |
Class Y | | | 26 | | |
Class Z | | | 1,078,694 | | |
Administration fees | | | 882,560 | | |
Plan administration fees | |
Class K(a) | | | 315 | | |
Compensation of board members | | | 54,827 | | |
Custodian fees | | | 462,979 | | |
Printing and postage fees | | | 301,462 | | |
Registration fees | | | 182,463 | | |
Professional fees | | | 100,047 | | |
Line of credit interest expense | | | 3,560 | | |
Other | | | 114,636 | | |
Total expenses | | | 14,686,115 | | |
Fees waived or expenses reimbursed by Investment Manager and its affiliates | | | (68,963 | ) | |
Expense reductions | | | (35,648 | ) | |
Total net expenses | | | 14,581,504 | | |
Net investment income | | | 19,732,163 | | |
Realized and unrealized gain (loss) — net | |
Net realized gain (loss) on: | |
Investments | | | 80,083,148 | | |
Foreign currency translations | | | (1,138,224 | ) | |
Forward foreign currency exchange contracts | | | (28,947,710 | ) | |
Futures contracts | | | 1,488,967 | | |
Net realized gain | | | 51,486,181 | | |
Net change in unrealized appreciation (depreciation) on: | |
Investments | | | (28,954,117 | ) | |
Foreign currency translations | | | 144,098 | | |
Forward foreign currency exchange contracts | | | 1,282,614 | | |
Futures contracts | | | (110,009 | ) | |
Foreign capital gains tax | | | 964,814 | | |
Net change in unrealized appreciation (depreciation) | | | (26,672,600 | ) | |
Net realized and unrealized gain | | | 24,813,581 | | |
Net increase in net assets resulting from operations | | $ | 44,545,744 | | |
(a) Effective October 25, 2012, Class R4 shares were renamed Class K shares.
(b) For the period from November 8, 2012 (commencement of operations) to February 28, 2013.
The accompanying Notes to Financial Statements are an integral part of this statement.
Annual Report 2013
23
Columbia Multi-Advisor International Equity Fund
Statement of Changes in Net Assets
| | | Year Ended
February 28,
2013(a) | | Year Ended
February 29,
2012 | |
Operations | |
Net investment income | | $ | 19,732,163 | | | $ | 28,106,557 | | |
Net realized gain | | | 51,486,181 | | | | 19,443,856 | | |
Net change in unrealized appreciation (depreciation) | | | (26,672,600 | ) | | | (263,417,593 | ) | |
Net increase (decrease) in net assets resulting from operations | | | 44,545,744 | | | | (215,867,180 | ) | |
Distributions to shareholders | |
Net investment income | |
Class A | | | (10,520,289 | ) | | | — | | |
Class B | | | (158,488 | ) | | | — | | |
Class C | | | (288,442 | ) | | | — | | |
Class I | | | (865,193 | ) | | | — | | |
Class K(b) | | | (4,228 | ) | | | — | | |
Class R | | | (51,789 | ) | | | — | | |
Class R4 | | | (63 | ) | | | — | | |
Class R5 | | | (66 | ) | | | — | | |
Class W | | | (7,739,183 | ) | | | — | | |
Class Y | | | (582,398 | ) | | | — | | |
Class Z | | | (15,239,279 | ) | | | — | | |
Total distributions to shareholders | | | (35,449,418 | ) | | | — | | |
Increase (decrease) in net assets from capital stock activity | | | (867,104,937 | ) | | | 764,294,162 | | |
Proceeds from regulatory settlements (Note 6) | | | — | | | | 3,493,349 | | |
Total increase (decrease) in net assets | | | (858,008,611 | ) | | | 551,920,331 | | |
Net assets at beginning of year | | | 1,803,529,239 | | | | 1,251,608,908 | | |
Net assets at end of year | | $ | 945,520,628 | | | $ | 1,803,529,239 | | |
Undistributed (excess of distributions over) net investment income | | $ | (15,866,186 | ) | | $ | 9,873,179 | | |
(a) Class R4 and Class R5 shares are for the period from November 8, 2012 (commencement of operations) to February 28, 2013.
(b) Effective October 25, 2012, Class R4 shares were renamed Class K shares.
The accompanying Notes to Financial Statements are an integral part of this statement.
Annual Report 2013
24
Columbia Multi-Advisor International Equity Fund
Statement of Changes in Net Assets (continued)
| | | Year Ended February 28, 2013(a) | | Year Ended February 29, 2012(b) | |
| | | Shares | | Dollars ($) | | Shares | | Dollars ($) | |
Capital stock activity | |
Class A shares | |
Subscriptions(c) | | | 933,505 | | | | 10,410,498 | | | | 1,249,749 | | | | 14,338,616 | | |
Fund merger | | | — | | | | — | | | | 34,476,734 | | | | 434,440,590 | | |
Distributions reinvested | | | 844,169 | | | | 9,680,587 | | | | — | | | | — | | |
Redemptions | | | (6,272,359 | ) | | | (71,262,677 | ) | | | (7,159,583 | ) | | | (80,561,789 | ) | |
Net increase (decrease) | | | (4,494,685 | ) | | | (51,171,592 | ) | | | 28,566,900 | | | | 368,217,417 | | |
Class B shares | |
Subscriptions | | | 9,795 | | | | 103,220 | | | | 17,098 | | | | 179,680 | | |
Fund merger | | | — | | | | — | | | | 1,930,534 | | | | 22,137,479 | | |
Distributions reinvested | | | 14,419 | | | | 153,043 | | | | — | | | | — | | |
Redemptions(c) | | | (544,662 | ) | | | (5,422,078 | ) | | | (894,164 | ) | | | (9,505,958 | ) | |
Net increase (decrease) | | | (520,448 | ) | | | (5,165,815 | ) | | | 1,053,468 | | | | 12,811,201 | | |
Class C shares | |
Subscriptions | | | 76,374 | | | | 777,986 | | | | 114,245 | | | | 1,138,984 | | |
Fund merger | | | — | | | | — | | | | 1,792,925 | | | | 20,291,719 | | |
Distributions reinvested | | | 23,574 | | | | 248,324 | | | | — | | | | — | | |
Redemptions | | | (373,898 | ) | | | (3,818,948 | ) | | | (575,170 | ) | | | (5,732,863 | ) | |
Net increase (decrease) | | | (273,950 | ) | | | (2,792,638 | ) | | | 1,332,000 | | | | 15,697,840 | | |
Class I shares | |
Subscriptions | | | 627,455 | | | | 7,357,646 | | | | 15,900,534 | | | | 196,608,468 | | |
Fund merger | | | — | | | | — | | | | 19,889,124 | | | | 254,159,984 | | |
Distributions reinvested | | | 74,414 | | | | 864,547 | | | | — | | | | — | | |
Redemptions | | | (5,317,888 | ) | | | (62,865,286 | ) | | | (32,917,296 | ) | | | (361,648,370 | ) | |
Net increase (decrease) | | | (4,616,019 | ) | | | (54,643,093 | ) | | | 2,872,362 | | | | 89,120,082 | | |
Class K shares(d) | |
Subscriptions | | | — | | | | — | | | | 289 | | | | 3,528 | | |
Fund merger | | | — | | | | — | | | | 14,235 | | | | 181,792 | | |
Distributions reinvested | | | 340 | | | | 3,942 | | | | — | | | | — | | |
Redemptions | | | (1,721 | ) | | | (20,487 | ) | | | (3,148 | ) | | | (34,474 | ) | |
Net increase (decrease) | | | (1,381 | ) | | | (16,545 | ) | | | 11,376 | | | | 150,846 | | |
Class R shares | |
Subscriptions | | | 31,951 | | | | 364,188 | | | | 77,654 | | | | 830,832 | | |
Fund merger | | | — | | | | — | | | | 166,754 | | | | 2,099,341 | | |
Distributions reinvested | | | 4,361 | | | | 50,297 | | | | — | | | | — | | |
Redemptions | | | (60,128 | ) | | | (675,540 | ) | | | (104,347 | ) | | | (1,167,905 | ) | |
Net increase (decrease) | | | (23,816 | ) | | | (261,055 | ) | | | 140,061 | | | | 1,762,268 | | |
Class R4 shares | |
Subscriptions | | | 215 | | | | 2,500 | | | | — | | | | — | | |
Net increase | | | 215 | | | | 2,500 | | | | — | | | | — | | |
The accompanying Notes to Financial Statements are an integral part of this statement.
Annual Report 2013
25
Columbia Multi-Advisor International Equity Fund
Statement of Changes in Net Assets (continued)
| | | Year Ended February 28, 2013(a) | | Year Ended February 29, 2012(b) | |
| | | Shares | | Dollars ($) | | Shares | | Dollars ($) | |
Capital stock activity (continued) | |
Class R5 shares | |
Subscriptions | | | 215 | | | | 2,500 | | | | — | | | | — | | |
Net increase | | | 215 | | | | 2,500 | | | | — | | | | — | | |
Class W shares | |
Subscriptions | | | 8,691,812 | | | | 99,042,100 | | | | 10,868,215 | | | | 115,323,128 | | |
Fund merger | | | — | | | | — | | | | 15,438,672 | | | | 194,596,937 | | |
Distributions reinvested | | | 674,478 | | | | 7,738,983 | | | | — | | | | — | | |
Redemptions | | | (6,833,955 | ) | | | (76,787,419 | ) | | | (6,370,835 | ) | | | (70,049,348 | ) | |
Net increase | | | 2,532,335 | | | | 29,993,664 | | | | 19,936,052 | | | | 239,870,717 | | |
Class Y shares | |
Subscriptions | | | 196,703 | | | | 2,220,001 | | | | 199 | | | | 2,602 | | |
Fund merger | | | — | | | | — | | | | 1,172,264 | | | | 14,983,504 | | |
Redemptions | | | (43,554 | ) | | | (512,026 | ) | | | (97,940 | ) | | | (1,226,184 | ) | |
Net increase | | | 153,149 | | | | 1,707,975 | | | | 1,074,523 | | | | 13,759,922 | | |
Class Z shares | |
Subscriptions | | | 2,335,364 | | | | 26,575,742 | �� | | | 10,955,590 | | | | 121,624,727 | | |
Fund merger | | | — | | | | — | | | | 27,157,783 | | | | 346,893,533 | | |
Distributions reinvested | | | 341,514 | | | | 3,855,315 | | | | — | | | | — | | |
Redemptions | | | (70,124,076 | ) | | | (815,191,895 | ) | | | (39,228,298 | ) | | | (445,614,391 | ) | |
Net increase (decrease) | | | (67,447,198 | ) | | | (784,760,838 | ) | | | (1,114,925 | ) | | | 22,903,869 | | |
Total net increase (decrease) | | | (74,691,583 | ) | | | (867,104,937 | ) | | | 53,871,817 | | | | 764,294,162 | | |
(a) Class R4 and Class R5 shares are for the period from November 8, 2012 (commencement of operations) to February 28, 2013.
(b) Class K and Class Y shares are for the period from March 7, 2011 (commencement of operations) to February 29, 2012.
(c) Includes conversions of Class B shares to Class A shares, if any.
(d) Effective October 25, 2012, Class R4 shares were renamed Class K shares.
The accompanying Notes to Financial Statements are an integral part of this statement.
Annual Report 2013
26
Columbia Multi-Advisor International Equity Fund
The following tables are intended to help you understand the Fund's financial performance. Certain information reflects financial results for a single share of a class held for the periods shown. Per share net investment income (loss) amounts are calculated based on average shares outstanding during the period. Total return assumes reinvestment of all dividends and distributions, if any. Total return does not reflect payment of sales charges, if any, and is not annualized for periods of less than one year.
| | | Year Ended
February 28, | | Year Ended
February 29, | | Year Ended February 28, | |
Class A | | 2013 | | 2012 | | 2011 | | 2010 | | 2009 | |
Per share data | |
Net asset value, beginning of period | | $ | 11.68 | | | $ | 12.46 | | | $ | 10.68 | | | $ | 7.44 | | | $ | 15.77 | | |
Income from investment operations: | |
Net investment income | | | 0.17 | | | | 0.14 | | | | 0.14 | | | | 0.13 | | | | 0.26 | | |
Net realized and unrealized gain (loss) | | | 0.56 | | | | (0.94 | ) | | | 1.85 | | | | 3.51 | | | | (8.33 | ) | |
Total from investment operations | | | 0.73 | | | | (0.80 | ) | | | 1.99 | | | | 3.64 | | | | (8.07 | ) | |
Less distributions to shareholders: | |
Net investment income | | | (0.39 | ) | | | — | | | | (0.21 | ) | | | (0.43 | ) | | | (0.07 | ) | |
Net realized gains | | | — | | | | — | | | | — | | | | — | | | | (0.19 | ) | |
Total distributions to shareholders | | | (0.39 | ) | | | — | | | | (0.21 | ) | | | (0.43 | ) | | | (0.26 | ) | |
Proceeds from regulatory settlements | | | — | | | | 0.02 | | | | 0.00 | (a) | | | 0.03 | | | | — | | |
Redemption fees: | |
Redemption fees added to paid-in capital | | | — | | | | — | | | | — | | | | 0.00 | (a) | | | 0.00 | (a) | |
Net asset value, end of period | | $ | 12.02 | | | $ | 11.68 | | | $ | 12.46 | | | $ | 10.68 | | | $ | 7.44 | | |
Total return | | | 6.41 | % | | | (6.26 | %)(b) | | | 18.80 | % | | | 49.61 | % | | | (51.87 | %) | |
Ratios to average net assets(c)(d) | |
Total gross expenses | | | 1.39 | %(e) | | | 1.36 | % | | | 1.33 | %(e) | | | 1.26 | %(e) | | | 1.27 | % | |
Total net expenses(f) | | | 1.38 | %(e)(g) | | | 1.32 | %(g) | | | 1.33 | %(e)(g) | | | 1.26 | %(e)(g) | | | 1.27 | %(g) | |
Net investment income | | | 1.46 | % | | | 1.20 | % | | | 1.27 | % | | | 1.26 | % | | | 2.05 | % | |
Supplemental data | |
Net assets, end of period (in thousands) | | $ | 313,239 | | | $ | 356,708 | | | $ | 24,668 | | | $ | 24,243 | | | $ | 16,936 | | |
Portfolio turnover | | | 100 | % | | | 112 | % | | | 92 | % | | | 127 | % | | | 83 | % | |
Notes to Financial Highlights
(a) Rounds to zero.
(b) The Fund received proceeds from regulatory settlements. Had the Fund not received these proceeds, the total return would have been lower by 0.19%.
(c) In addition to the fees and expenses which the Fund bears directly, the Fund indirectly bears a pro rata share of the fees and expenses of the acquired funds in which it invests. Such indirect expenses are not included in the reported expense ratios.
(d) Certain line items from prior years have been reclassified to conform to the current presentation.
(e) Ratios include line of credit interest expense which rounds to less than 0.01%.
(f) Total net expenses include the impact of certain waivers/reimbursements made by the Investment Manager and certain of its affiliates, if applicable.
(g) The benefits derived from expense reductions had an impact of less than 0.01%.
The accompanying Notes to Financial Statements are an integral part of this statement.
Annual Report 2013
27
Columbia Multi-Advisor International Equity Fund
Financial Highlights (continued)
| | | Year Ended
February 28, | | Year Ended
February 29, | | Year Ended February 28, | |
Class B | | 2013 | | 2012 | | 2011 | | 2010 | | 2009 | |
Per share data | |
Net asset value, beginning of period | | $ | 10.55 | | | $ | 11.34 | | | $ | 9.75 | | | $ | 6.82 | | | $ | 14.47 | | |
Income from investment operations: | |
Net investment income | | | 0.09 | | | | 0.06 | | | | 0.07 | | | | 0.06 | | | | 0.17 | | |
Net realized and unrealized gain (loss) | | | 0.49 | | | | (0.87 | ) | | | 1.66 | | | | 3.20 | | | | (7.63 | ) | |
Total from investment operations | | | 0.58 | | | | (0.81 | ) | | | 1.73 | | | | 3.26 | | | | (7.46 | ) | |
Less distributions to shareholders: | |
Net investment income | | | (0.23 | ) | | | — | | | | (0.14 | ) | | | (0.36 | ) | | | — | | |
Net realized gains | | | — | | | | — | | | | — | | | | — | | | | (0.19 | ) | |
Total distributions to shareholders | | | (0.23 | ) | | | — | | | | (0.14 | ) | | | (0.36 | ) | | | (0.19 | ) | |
Proceeds from regulatory settlements | | | — | | | | 0.02 | | | | 0.00 | (a) | | | 0.03 | | | | — | | |
Redemption fees: | |
Redemption fees added to paid-in capital | | | — | | | | — | | | | — | | | | 0.00 | (a) | | | 0.00 | (a) | |
Net asset value, end of period | | $ | 10.90 | | | $ | 10.55 | | | $ | 11.34 | | | $ | 9.75 | | | $ | 6.82 | | |
Total return | | | 5.59 | % | | | (6.97 | %)(b) | | | 17.88 | % | | | 48.47 | % | | | (52.23 | %) | |
Ratios to average net assets(c)(d) | |
Total gross expenses | | | 2.13 | %(e) | | | 2.11 | % | | | 2.08 | %(e) | | | 2.01 | %(e) | | | 2.02 | % | |
Total net expenses(f) | | | 2.12 | %(e)(g) | | | 2.06 | %(g) | | | 2.08 | %(e)(g) | | | 2.01 | %(e)(g) | | | 2.02 | %(g) | |
Net investment income | | | 0.91 | % | | | 0.62 | % | | | 0.70 | % | | | 0.60 | % | | | 1.44 | % | |
Supplemental data | |
Net assets, end of period (in thousands) | | $ | 6,566 | | | $ | 11,838 | | | $ | 784 | | | $ | 1,190 | | | $ | 1,098 | | |
Portfolio turnover | | | 100 | % | | | 112 | % | | | 92 | % | | | 127 | % | | | 83 | % | |
Notes to Financial Highlights
(a) Rounds to zero.
(b) The Fund received proceeds from regulatory settlements. Had the Fund not received these proceeds, the total return would have been lower by 0.20%.
(c) In addition to the fees and expenses which the Fund bears directly, the Fund indirectly bears a pro rata share of the fees and expenses of the acquired funds in which it invests. Such indirect expenses are not included in the reported expense ratios.
(d) Certain line items from prior years have been reclassified to conform to the current presentation.
(e) Ratios include line of credit interest expense which rounds to less than 0.01%.
(f) Total net expenses include the impact of certain waivers/reimbursements made by the Investment Manager and certain of its affiliates, if applicable.
(g) The benefits derived from expense reductions had an impact of less than 0.01%.
The accompanying Notes to Financial Statements are an integral part of this statement.
Annual Report 2013
28
Columbia Multi-Advisor International Equity Fund
Financial Highlights (continued)
| | | Year Ended
February 28, | | Year Ended
February 29, | | Year Ended February 28, | |
Class C | | 2013 | | 2012 | | 2011 | | 2010 | | 2009 | |
Per share data | |
Net asset value, beginning of period | | $ | 10.42 | | | $ | 11.20 | | | $ | 9.63 | | | $ | 6.73 | | | $ | 14.29 | | |
Income from investment operations: | |
Net investment income | | | 0.07 | | | | 0.05 | | | | 0.07 | | | | 0.05 | | | | 0.16 | | |
Net realized and unrealized gain (loss) | | | 0.51 | | | | (0.85 | ) | | | 1.64 | | | | 3.18 | | | | (7.53 | ) | |
Total from investment operations | | | 0.58 | | | | (0.80 | ) | | | 1.71 | | | | 3.23 | | | | (7.37 | ) | |
Less distributions to shareholders: | |
Net investment income | | | (0.23 | ) | | | — | | | | (0.14 | ) | | | (0.36 | ) | | | — | | |
Net realized gains | | | — | | | | — | | | | — | | | | — | | | | (0.19 | ) | |
Total distributions to shareholders | | | (0.23 | ) | | | — | | | | (0.14 | ) | | | (0.36 | ) | | | (0.19 | ) | |
Proceeds from regulatory settlements | | | — | | | | 0.02 | | | | 0.00 | (a) | | | 0.03 | | | | — | | |
Redemption fees: | |
Redemption fees added to paid-in capital | | | — | | | | — | | | | — | | | | 0.00 | (a) | | | 0.00 | (a) | |
Net asset value, end of period | | $ | 10.77 | | | $ | 10.42 | | | $ | 11.20 | | | $ | 9.63 | | | $ | 6.73 | | |
Total return | | | 5.64 | % | | | (6.96 | %)(b) | | | 17.89 | % | | | 48.67 | % | | | (52.26 | %) | |
Ratios to average net assets(c)(d) | |
Total gross expenses | | | 2.14 | %(e) | | | 2.10 | % | | | 2.08 | %(e) | | | 2.01 | %(e) | | | 2.02 | % | |
Total net expenses(f) | | | 2.13 | %(e)(g) | | | 2.07 | %(g) | | | 2.08 | %(e)(g) | | | 2.01 | %(e)(g) | | | 2.02 | %(g) | |
Net investment income | | | 0.72 | % | | | 0.48 | % | | | 0.72 | % | | | 0.55 | % | | | 1.38 | % | |
Supplemental data | |
Net assets, end of period (in thousands) | | $ | 12,619 | | | $ | 15,058 | | | $ | 1,272 | | | $ | 1,728 | | | $ | 1,349 | | |
Portfolio turnover | | | 100 | % | | | 112 | % | | | 92 | % | | | 127 | % | | | 83 | % | |
Notes to Financial Highlights
(a) Rounds to zero.
(b) The Fund received proceeds from regulatory settlements. Had the Fund not received these proceeds, the total return would have been lower by 0.19%.
(c) In addition to the fees and expenses which the Fund bears directly, the Fund indirectly bears a pro rata share of the fees and expenses of the acquired funds in which it invests. Such indirect expenses are not included in the reported expense ratios.
(d) Certain line items from prior years have been reclassified to conform to the current presentation.
(e) Ratios include line of credit interest expense which rounds to less than 0.01%.
(f) Total net expenses include the impact of certain waivers/reimbursements made by the Investment Manager and certain of its affiliates, if applicable.
(g) The benefits derived from expense reductions had an impact of less than 0.01%.
The accompanying Notes to Financial Statements are an integral part of this statement.
Annual Report 2013
29
Columbia Multi-Advisor International Equity Fund
Financial Highlights (continued)
Class I | | Year Ended
February 28,
2013 | | Year Ended
February 29,
2012 | | Year Ended
February 28,
2011(a) | |
Per share data | |
Net asset value, beginning of period | | $ | 11.89 | | | $ | 12.62 | | | $ | 11.64 | | |
Income from investment operations: | |
Net investment income | | | 0.22 | | | | 0.22 | | | | 0.02 | | |
Net realized and unrealized gain (loss) | | | 0.58 | | | | (0.97 | ) | | | 1.21 | | |
Total from investment operations | | | 0.80 | | | | (0.75 | ) | | | 1.23 | | |
Less distributions to shareholders: | |
Net investment income | | | (0.49 | ) | | | — | | | | (0.25 | ) | |
Total distributions to shareholders | | | (0.49 | ) | | | — | | | | (0.25 | ) | |
Proceeds from regulatory settlements | | | — | | | | 0.02 | | | | 0.00 | (b) | |
Net asset value, end of period | | $ | 12.20 | | | $ | 11.89 | | | $ | 12.62 | | |
Total return | | | 6.96 | % | | | (5.78 | %)(c) | | | 10.69 | % | |
Ratios to average net assets(d)(e) | |
Total gross expenses | | | 0.93 | %(f) | | | 0.84 | % | | | 0.95 | %(f)(g) | |
Total net expenses(h) | | | 0.93 | %(f) | | | 0.84 | % | | | 0.95 | %(f)(g)(i) | |
Net investment income | | | 1.90 | % | | | 1.87 | % | | | 0.32 | %(g) | |
Supplemental data | |
Net assets, end of period (in thousands) | | $ | 24,204 | | | $ | 78,467 | | | $ | 47,056 | | |
Portfolio turnover | | | 100 | % | | | 112 | % | | | 92 | % | |
Notes to Financial Highlights
(a) For the period from September 27, 2010 (commencement of operations) to February 28, 2011.
(b) Rounds to zero.
(c) The Fund received proceeds from regulatory settlements. Had the Fund not received these proceeds, the total return would have been lower by 0.19%.
(d) In addition to the fees and expenses which the Fund bears directly, the Fund indirectly bears a pro rata share of the fees and expenses of the acquired funds in which it invests. Such indirect expenses are not included in the reported expense ratios.
(e) Certain line items from prior years have been reclassified to conform to the current presentation.
(f) Ratios include line of credit interest expense which rounds to less than 0.01%.
(g) Annualized.
(h) Total net expenses include the impact of certain waivers/reimbursements made by the Investment Manager and certain of its affiliates, if applicable.
(i) The benefits derived from expense reductions had an impact of less than 0.01%.
The accompanying Notes to Financial Statements are an integral part of this statement.
Annual Report 2013
30
Columbia Multi-Advisor International Equity Fund
Financial Highlights (continued)
Class K(a) | | Year Ended
February 28,
2013 | | Year Ended
February 29,
2012(b) | |
Per share data | |
Net asset value, beginning of period | | $ | 11.85 | | | $ | 12.54 | | |
Income from investment operations: | |
Net investment income | | | 0.18 | | | | 0.15 | | |
Net realized and unrealized gain (loss) | | | 0.58 | | | | (0.86 | ) | |
Total from investment operations | | | 0.76 | | | | (0.71 | ) | |
Less distributions to shareholders: | |
Net investment income | | | (0.41 | ) | | | — | | |
Total distributions to shareholders | | | (0.41 | ) | | | — | | |
Proceeds from regulatory settlements | | | — | | | | 0.02 | | |
Net asset value, end of period | | $ | 12.20 | | | $ | 11.85 | | |
Total return | | | 6.64 | % | | | (5.50 | %)(c) | |
Ratios to average net assets(d)(e) | |
Total gross expenses | | | 1.24 | %(f) | | | 1.21 | %(g) | |
Total net expenses(h) | | | 1.24 | %(f) | | | 1.21 | %(g) | |
Net investment income | | | 1.61 | % | | | 1.33 | %(g) | |
Supplemental data | |
Net assets, end of period (in thousands) | | $ | 122 | | | $ | 135 | | |
Portfolio turnover | | | 100 | % | | | 112 | % | |
Notes to Financial Highlights
(a) Effective October 25, 2012, Class R4 shares were renamed Class K shares.
(b) For the period from March 7, 2011 (commencement of operations) to February 29, 2012.
(c) The Fund received proceeds from regulatory settlements. Had the Fund not received these proceeds, the total return would have been lower by 0.19%.
(d) In addition to the fees and expenses which the Fund bears directly, the Fund indirectly bears a pro rata share of the fees and expenses of the acquired funds in which it invests. Such indirect expenses are not included in the reported expense ratios.
(e) Certain line items from prior years have been reclassified to conform to the current presentation.
(f) Ratios include line of credit interest expense which rounds to less than 0.01%.
(g) Annualized.
(h) Total net expenses include the impact of certain waivers/reimbursements made by the Investment Manager and certain of its affiliates, if applicable.
The accompanying Notes to Financial Statements are an integral part of this statement.
Annual Report 2013
31
Columbia Multi-Advisor International Equity Fund
Financial Highlights (continued)
| | | Year Ended
February 28, | | Year Ended
February 29, | | Year Ended February 28, | |
Class R | | 2013 | | 2012 | | 2011 | | 2010 | | 2009 | |
Per share data | |
Net asset value, beginning of period | | $ | 11.64 | | | $ | 12.45 | | | $ | 10.68 | | | $ | 7.44 | | | $ | 15.76 | | |
Income from investment operations: | |
Net investment income | | | 0.14 | | | | 0.11 | | | | 0.13 | | | | 0.09 | | | | 0.21 | | |
Net realized and unrealized gain (loss) | | | 0.57 | | | | (0.94 | ) | | | 1.83 | | | | 3.53 | | | | (8.30 | ) | |
Total from investment operations | | | 0.71 | | | | (0.83 | ) | | | 1.96 | | | | 3.62 | | | | (8.09 | ) | |
Less distributions to shareholders: | |
Net investment income | | | (0.34 | ) | | | — | | | | (0.19 | ) | | | (0.41 | ) | | | (0.04 | ) | |
Net realized gains | | | — | | | | — | | | | — | | | | — | | | | (0.19 | ) | |
Total distributions to shareholders | | | (0.34 | ) | | | — | | | | (0.19 | ) | | | (0.41 | ) | | | (0.23 | ) | |
Proceeds from regulatory settlements | | | — | | | | 0.02 | | | | 0.00 | (a) | | | 0.03 | | | | — | | |
Redemption fees: | |
Redemption fees added to paid-in capital | | | — | | | | — | | | | — | | | | 0.00 | (a) | | | 0.00 | (a) | |
Net asset value, end of period | | $ | 12.01 | | | $ | 11.64 | | | $ | 12.45 | | | $ | 10.68 | | | $ | 7.44 | | |
Total return | | | 6.20 | % | | | (6.51 | %)(b) | | | 18.47 | % | | | 49.28 | % | | | (52.00 | %) | |
Ratios to average net assets(c)(d) | |
Total gross expenses | | | 1.64 | %(e) | | | 1.62 | % | | | 1.58 | %(e) | | | 1.51 | %(e) | | | 1.52 | % | |
Total net expenses(f) | | | 1.63 | %(e)(g) | | | 1.57 | %(g) | | | 1.58 | %(e)(g) | | | 1.51 | %(e)(g) | | | 1.52 | %(g) | |
Net investment income | | | 1.22 | % | | | 0.98 | % | | | 1.13 | % | | | 0.86 | % | | | 1.70 | % | |
Supplemental data | |
Net assets, end of period (in thousands) | | $ | 1,673 | | | $ | 1,899 | | | $ | 287 | | | $ | 289 | | | $ | 112 | | |
Portfolio turnover | | | 100 | % | | | 112 | % | | | 92 | % | | | 127 | % | | | 83 | % | |
Notes to Financial Highlights
(a) Rounds to zero.
(b) The Fund received proceeds from regulatory settlements. Had the Fund not received these proceeds, the total return would have been lower by 0.19%.
(c) In addition to the fees and expenses which the Fund bears directly, the Fund indirectly bears a pro rata share of the fees and expenses of the acquired funds in which it invests. Such indirect expenses are not included in the reported expense ratios.
(d) Certain line items from prior years have been reclassified to conform to the current presentation.
(e) Ratios include line of credit interest expense which rounds to less than 0.01%.
(f) Total net expenses include the impact of certain waivers/reimbursements made by the Investment Manager and certain of its affiliates, if applicable.
(g) The benefits derived from expense reductions had an impact of less than 0.01%.
The accompanying Notes to Financial Statements are an integral part of this statement.
Annual Report 2013
32
Columbia Multi-Advisor International Equity Fund
Financial Highlights (continued)
Class R4 | | Year Ended
February 28,
2013(a) | |
Per share data | |
Net asset value, beginning of period | | $ | 11.62 | | |
Income from investment operations: | |
Net investment income | | | 0.02 | | |
Net realized and unrealized gain | | | 0.92 | | |
Total from investment operations | | | 0.94 | | |
Less distributions to shareholders: | |
Net investment income | | | (0.29 | ) | |
Total distributions to shareholders | | | (0.29 | ) | |
Net asset value, end of period | | $ | 12.27 | | |
Total return | | | 8.17 | % | |
Ratios to average net assets(b) | |
Total gross expenses | | | 1.25 | %(c) | |
Total net expenses(d) | | | 1.25 | %(c) | |
Net investment income | | | 0.55 | %(c) | |
Supplemental data | |
Net assets, end of period (in thousands) | | $ | 3 | | |
Portfolio turnover | | | 100 | % | |
Notes to Financial Highlights
(a) For the period from November 8, 2012 (commencement of operations) to February 28, 2013.
(b) In addition to the fees and expenses which the Fund bears directly, the Fund indirectly bears a pro rata share of the fees and expenses of the acquired funds in which it invests. Such indirect expenses are not included in the reported expense ratios.
(c) Annualized.
(d) Total net expenses include the impact of certain waivers/reimbursements made by the Investment Manager and certain of its affiliates, if applicable.
The accompanying Notes to Financial Statements are an integral part of this statement.
Annual Report 2013
33
Columbia Multi-Advisor International Equity Fund
Financial Highlights (continued)
Class R5 | | Year Ended
February 28,
2013(a) | |
Per share data | |
Net asset value, beginning of period | | $ | 11.62 | | |
Income from investment operations: | |
Net investment income | | | 0.03 | | |
Net realized and unrealized gain | | | 0.92 | | |
Total from investment operations | | | 0.95 | | |
Less distributions to shareholders: | |
Net investment income | | | (0.31 | ) | |
Total distributions to shareholders | | | (0.31 | ) | |
Net asset value, end of period | | $ | 12.26 | | |
Total return | | | 8.20 | % | |
Ratios to average net assets(b) | |
Total gross expenses | | | 1.05 | %(c) | |
Total net expenses(d) | | | 1.05 | %(c) | |
Net investment income | | | 0.75 | %(c) | |
Supplemental data | |
Net assets, end of period (in thousands) | | $ | 3 | | |
Portfolio turnover | | | 100 | % | |
Notes to Financial Highlights
(a) For the period from November 8, 2012 (commencement of operations) to February 28, 2013.
(b) In addition to the fees and expenses which the Fund bears directly, the Fund indirectly bears a pro rata share of the fees and expenses of the acquired funds in which it invests. Such indirect expenses are not included in the reported expense ratios.
(c) Annualized.
(d) Total net expenses include the impact of certain waivers/reimbursements made by the Investment Manager and certain of its affiliates, if applicable.
The accompanying Notes to Financial Statements are an integral part of this statement.
Annual Report 2013
34
Columbia Multi-Advisor International Equity Fund
Financial Highlights (continued)
Class W | | Year Ended
February 28,
2013 | | Year Ended
February 29,
2012 | | Year Ended
February 28,
2011(a) | |
Per share data | |
Net asset value, beginning of period | | $ | 11.68 | | | $ | 12.46 | | | $ | 11.48 | | |
Income from investment operations: | |
Net investment income | | | 0.16 | | | | 0.12 | | | | 0.02 | | |
Net realized and unrealized gain (loss) | | | 0.57 | | | | (0.92 | ) | | | 1.17 | | |
Total from investment operations | | | 0.73 | | | | (0.80 | ) | | | 1.19 | | |
Less distributions to shareholders: | |
Net investment income | | | (0.39 | ) | | | — | | | | (0.21 | ) | |
Total distributions to shareholders | | | (0.39 | ) | | | — | | | | (0.21 | ) | |
Proceeds from regulatory settlements | | | — | | | | 0.02 | | | | 0.00 | (b) | |
Net asset value, end of period | | $ | 12.02 | | | $ | 11.68 | | | $ | 12.46 | | |
Total return | | | 6.40 | % | | | (6.26 | %)(c) | | | 10.52 | % | |
Ratios to average net assets(d)(e) | |
Total gross expenses | | | 1.40 | %(f) | | | 1.38 | % | | | 1.30 | %(f)(g) | |
Total net expenses(h) | | | 1.39 | %(f)(i) | | | 1.33 | %(i) | | | 1.30 | %(f)(g)(i) | |
Net investment income | | | 1.42 | % | | | 1.06 | % | | | 0.33 | %(g) | |
Supplemental data | |
Net assets, end of period (in thousands) | | $ | 270,144 | | | $ | 232,777 | | | $ | 3 | | |
Portfolio turnover | | | 100 | % | | | 112 | % | | | 92 | % | |
Notes to Financial Highlights
(a) For the period from September 27, 2010 (commencement of operations) to February 28, 2011.
(b) Rounds to zero.
(c) The Fund received proceeds from regulatory settlements. Had the Fund not received these proceeds, the total return would have been lower by 0.19%.
(d) In addition to the fees and expenses which the Fund bears directly, the Fund indirectly bears a pro rata share of the fees and expenses of the acquired funds in which it invests. Such indirect expenses are not included in the reported expense ratios.
(e) Certain line items from prior years have been reclassified to conform to the current presentation.
(f) Ratios include line of credit interest expense which rounds to less than 0.01%.
(g) Annualized.
(h) Total net expenses include the impact of certain waivers/reimbursements made by the Investment Manager and certain of its affiliates, if applicable.
(i) The benefits derived from expense reductions had an impact of less than 0.01%.
The accompanying Notes to Financial Statements are an integral part of this statement.
Annual Report 2013
35
Columbia Multi-Advisor International Equity Fund
Financial Highlights (continued)
Class Y | | Year Ended
February 28,
2013 | | Year Ended
February 29,
2012(a) | |
Per share data | |
Net asset value, beginning of period | | $ | 11.89 | | | $ | 12.55 | | |
Income from investment operations: | |
Net investment income | | | 0.21 | | | | 0.18 | | |
Net realized and unrealized gain (loss) | | | 0.59 | | | | (0.86 | ) | |
Total from investment operations | | | 0.80 | | | | (0.68 | ) | |
Less distributions to shareholders: | |
Net investment income | | | (0.48 | ) | | | — | | |
Total distributions to shareholders | | | (0.48 | ) | | | — | | |
Proceeds from regulatory settlements | | | — | | | | 0.02 | | |
Net asset value, end of period | | $ | 12.21 | | | $ | 11.89 | | |
Total return | | | 6.98 | % | | | (5.26 | %)(b) | |
Ratios to average net assets(c)(d) | |
Total gross expenses | | | 0.95 | %(e) | | | 0.88 | %(f) | |
Total net expenses(g) | | | 0.95 | %(e) | | | 0.88 | %(f) | |
Net investment income | | | 1.79 | % | | | 1.64 | %(f) | |
Supplemental data | |
Net assets, end of period (in thousands) | | $ | 14,990 | | | $ | 12,780 | | |
Portfolio turnover | | | 100 | % | | | 112 | % | |
Notes to Financial Highlights
(a) For the period from March 7, 2011 (commencement of operations) to February 29, 2012.
(b) The Fund received proceeds from regulatory settlements. Had the Fund not received these proceeds, the total return would have been lower by 0.19%.
(c) In addition to the fees and expenses which the Fund bears directly, the Fund indirectly bears a pro rata share of the fees and expenses of the acquired funds in which it invests. Such indirect expenses are not included in the reported expense ratios.
(d) Certain line items from prior years have been reclassified to conform to the current presentation.
(e) Ratios include line of credit interest expense which rounds to less than 0.01%.
(f) Annualized.
(g) Total net expenses include the impact of certain waivers/reimbursements made by the Investment Manager and certain of its affiliates, if applicable.
The accompanying Notes to Financial Statements are an integral part of this statement.
Annual Report 2013
36
Columbia Multi-Advisor International Equity Fund
Financial Highlights (continued)
| | | Year Ended
February 28, | | Year Ended
February 29, | | Year ended February 28, | |
Class Z | | 2013 | | 2012 | | 2011 | | 2010 | | 2009 | |
Per share data | |
Net asset value, beginning of period | | $ | 11.86 | | | $ | 12.62 | | | $ | 10.81 | | | $ | 7.52 | | | $ | 15.96 | | |
Income from investment operations: | |
Net investment income | | | 0.23 | | | | 0.18 | | | | 0.18 | | | | 0.17 | | | | 0.29 | | |
Net realized and unrealized gain (loss) | | | 0.54 | | | | (0.96 | ) | | | 1.87 | | | | 3.55 | | | | (8.43 | ) | |
Total from investment operations | | | 0.77 | | | | (0.78 | ) | | | 2.05 | | | | 3.72 | | | | (8.14 | ) | |
Less distributions to shareholders: | |
Net investment income | | | (0.44 | ) | | | — | | | | (0.24 | ) | | | (0.46 | ) | | | (0.11 | ) | |
Net realized gains | | | — | | | | — | | | | — | | | | — | | | | (0.19 | ) | |
Total distributions to shareholders | | | (0.44 | ) | | | — | | | | (0.24 | ) | | | (0.46 | ) | | | (0.30 | ) | |
Proceeds from regulatory settlements | | | — | | | | 0.02 | | | | 0.00 | (a) | | | 0.03 | | | | — | | |
Redemption fees: | |
Redemption fees added to paid-in capital | | | — | | | | — | | | | — | | | | 0.00 | (a) | | | 0.00 | (a) | |
Net asset value, end of period | | $ | 12.19 | | | $ | 11.86 | | | $ | 12.62 | | | $ | 10.81 | | | $ | 7.52 | | |
Total return | | | 6.72 | % | | | (6.02 | %)(b) | | | 19.08 | % | | | 50.09 | % | | | (51.76 | %) | |
Ratios to average net assets(c)(d) | |
Total gross expenses | | | 1.13 | %(e) | | | 1.11 | % | | | 1.08 | %(e) | | | 1.01 | %(e) | | | 1.02 | % | |
Total net expenses(f) | | | 1.12 | %(e)(g) | | | 1.08 | %(g) | | | 1.08 | %(e)(g) | | | 1.01 | %(e)(g) | | | 1.02 | %(g) | |
Net investment income | | | 2.00 | % | | | 1.53 | % | | | 1.58 | % | | | 1.59 | % | | | 2.28 | % | |
Supplemental data | |
Net assets, end of period (in thousands) | | $ | 301,958 | | | $ | 1,093,867 | | | $ | 1,177,541 | | | $ | 1,375,538 | | | $ | 1,155,598 | | |
Portfolio turnover | | | 100 | % | | | 112 | % | | | 92 | % | | | 127 | % | | | 83 | % | |
Notes to Financial Highlights
(a) Rounds to zero.
(b) The Fund received proceeds from regulatory settlements. Had the Fund not received these proceeds, the total return would have been lower by 0.19%.
(c) In addition to the fees and expenses which the Fund bears directly, the Fund indirectly bears a pro rata share of the fees and expenses of the acquired funds in which it invests. Such indirect expenses are not included in the reported expense ratios.
(d) Certain line items from prior years have been reclassified to conform to the current presentation.
(e) Ratios include line of credit interest expense which rounds to less than 0.01%.
(f) Total net expenses include the impact of certain waivers/reimbursements made by the Investment Manager and certain of its affiliates, if applicable.
(g) The benefits derived from expense reductions had an impact of less than 0.01%.
The accompanying Notes to Financial Statements are an integral part of this statement.
Annual Report 2013
37
Columbia Multi-Advisor International Equity Fund
Notes to Financial Statements
February 28, 2013
Note 1. Organization
Columbia Multi-Advisor International Equity Fund (the Fund), a series of Columbia Funds Series Trust (the Trust), is a diversified fund. The Trust is registered under the Investment Company Act of 1940, as amended (the 1940 Act), as an open-end management investment company organized as a Delaware statutory trust.
Fund Shares
The Trust may issue an unlimited number of shares (without par value). The Fund offers Class A, Class B, Class C, Class I, Class K, Class R, Class R4, Class R5, Class W, Class Y and Class Z shares. All share classes have identical voting, dividend and liquidation rights. Each share class has its own expense structure and sales charges, as applicable.
Class A shares are subject to a maximum front-end sales charge of 5.75% based on the initial investment amount. Class A shares purchased without an initial sales charge in accounts aggregating $1 million to $50 million at the time of purchase are subject to a contingent deferred sales charge (CDSC) if the shares are sold within 18 months of purchase, charged as follows: 1.00% CDSC if redeemed within 12 months of purchase, and 0.50% CDSC if redeemed more than 12, but less than 18, months after purchase.
Class B shares may be subject to a maximum CDSC of 5.00% based upon the holding period after purchase. Class B shares will generally convert to Class A shares eight years after purchase. The Fund no longer accepts investments by new or existing investors in the Fund's Class B shares, except in connection with the reinvestment of any dividend and/or capital gain distributions in Class B shares of the Fund and exchanges by existing Class B shareholders of certain other funds within the Columbia Family of Funds.
Class C shares are subject to a 1.00% CDSC on shares redeemed within one year of purchase.
Class I shares are not subject to sales charges and are only available to the Columbia Family of Funds.
Class K shares (formerly Class R4 shares) are not subject to sales charges; however, this share class is closed to new investors. Effective October 25, 2012, Class R4 shares were renamed Class K shares.
Class R shares are not subject to sales charges and are only available to qualifying institutional investors.
Class R4 shares are not subject to sales charges and are only available to investors purchasing through authorized investment professionals. Class R4 shares commenced operations on November 8, 2012.
Class R5 shares are not subject to sales charges and are only available to investors purchasing through authorized investment professionals. Class R5 shares commenced operations on November 8, 2012.
Class W shares are not subject to sales charges and are only available to investors purchasing through authorized investment programs managed by investment professionals, including discretionary managed account programs.
Class Y shares are not subject to sales charges and are only available to certain categories of investors which are subject to minimum initial investment requirements.
Class Z shares are not subject to sales charges, and are only available to certain investors.
Note 2. Summary of Significant Accounting Policies
Use of Estimates
The preparation of financial statements in accordance with U.S. generally accepted accounting principles (GAAP) requires management to make certain estimates and assumptions that affect the reported amounts of assets and liabilities, the disclosure of contingent assets and liabilities at the date of the financial statements and the reported amounts of revenue and expenses during the reporting period. Actual results could differ from those estimates.
The following is a summary of significant accounting policies consistently followed by the Fund in the preparation of its financial statements.
Security Valuation
All equity securities are valued at the close of business of the New York Stock Exchange (NYSE). Equity securities are valued at the last quoted sales price on the principal exchange or market on which they trade, except for securities traded on the NASDAQ Stock Market, which are valued at the NASDAQ official close price. Unlisted securities or listed securities for which there were no sales during the day are valued at the mean of the latest quoted bid and ask prices on such exchanges or markets.
Foreign securities are valued based on quotations from the principal market in which such securities are normally traded. If any foreign share prices are not readily available as a result of limited share activity the securities are valued at the mean of the latest quoted bid and ask prices on such exchanges or markets. Foreign currency exchange rates are generally determined at 4:00 p.m. Eastern (U.S.) time. However, many securities markets and exchanges outside the U.S. close prior to the close of the NYSE; therefore, the closing prices for
Annual Report 2013
38
Columbia Multi-Advisor International Equity Fund
Notes to Financial Statements (continued)
February 28, 2013
securities in such markets or on such exchanges may not fully reflect events that occur after such close but before the close of the NYSE. In those situations, foreign securities will be fair valued pursuant to the policy adopted by the Board of Trustees (the Board), including utilizing a third party pricing service to determine these fair values. The third party pricing service takes into account multiple factors, including, but not limited to, movements in the U.S. securities markets, certain depositary receipts, futures contracts and foreign exchange rates that have occurred subsequent to the close of the foreign exchange or market, to determine a good faith estimate that reasonably reflects the current market conditions as of the close of the NYSE. The fair value of a security is likely to be different from the quoted or published price, if available.
Investments in other open-end investment companies, including money market funds, are valued at net asset value.
Forward foreign currency exchange contracts are marked-to-market based upon foreign currency exchange rates provided by a pricing service.
Futures and options on futures contracts are valued based upon the settlement price established each day by the board of trade or exchange on which they are traded.
Investments for which market quotations are not readily available, or that have quotations which management believes are not reliable, are valued at fair value as determined in good faith under consistently applied procedures established by and under the general supervision of the Board. If a security or class of securities (such as foreign securities) is valued at fair value, such value is likely to be different from the last quoted market price for the security.
The determination of fair value often requires significant judgment. To determine fair value, management may use assumptions including but not limited to future cash flows and estimated risk premiums. Multiple inputs from various sources may be used to determine fair value.
Foreign Currency Transactions and Translations
The values of all assets and liabilities denominated in foreign currencies are translated into U.S. dollars at that day's exchange rates. Net realized and unrealized gains (losses) on foreign currency transactions and translations include gains (losses) arising from the fluctuation in exchange rates between trade and settlement dates on securities transactions, gains (losses) arising from the disposition of foreign currency and currency gains (losses) between the accrual and payment dates on dividends, interest income and foreign withholding taxes.
For financial statement purposes, the Fund does not distinguish that portion of gains (losses) on investments which is due to changes in foreign exchange rates from that which is
due to changes in market prices of the investments. Such fluctuations are included with the net realized and unrealized gains (losses) on investments in the Statement of Operations.
Derivative Instruments
The Fund invests in certain derivative instruments, as detailed below, to meet its investment objectives. Derivatives are instruments whose values depend on, or are derived from, in whole or in part, the value of one or more other assets, such as securities, currencies, commodities or indices. Derivative instruments may be used to maintain cash reserves while maintaining exposure to certain other assets, to offset anticipated declines in values of investments, to facilitate trading, to reduce transaction costs and to pursue higher investment returns. The Fund may also use derivative instruments to mitigate certain investment risks, such as foreign currency exchange rate risk, interest rate risk and credit risk. Derivatives may involve various risks, including the potential inability of the counterparty to fulfill its obligation under the terms of the contract, the potential for an illiquid secondary market and the potential for market movements which may expose the Fund to gains or losses in excess of the amount shown in the Statement of Assets and Liabilities.
The Fund and any counterparty are required to maintain an agreement that requires the Fund and that counterparty to monitor (on a daily basis) the net fair value of all derivatives entered into pursuant to the agreement between the Fund and such counterparty. If the net fair value of such derivatives between the Fund and that counterparty exceeds a certain threshold (as defined in the agreement), the Fund or the counterparty (as the case may be) is required to post cash and/or securities as collateral. Fair values of derivatives presented in the financial statements are not netted with the fair value of other derivatives or with any collateral amounts posted by the Fund or any counterparty.
Forward Foreign Currency Exchange Contracts
Forward foreign currency exchange contracts are agreements between two parties to buy and sell a currency at a set price on a future date. These contracts are intended to be used to minimize the exposure to foreign exchange rate fluctuations during the period between the trade and settlement dates of the contract. The Fund utilized forward foreign currency exchange contracts to hedge the currency exposure associated with some or all of the Fund's securities, to shift investment exposure from one currency to another, to shift U.S. dollar exposure to achieve a representative weighted mix of major currencies in its benchmark, and/or to recover an underweight country exposure in its portfolio.
Annual Report 2013
39
Columbia Multi-Advisor International Equity Fund
Notes to Financial Statements (continued)
February 28, 2013
The values of forward foreign currency exchange contracts fluctuate with changes in foreign currency exchange rates. The Fund will record a realized gain or loss when the forward foreign currency exchange contract expires or is closed.
The use of forward foreign currency exchange contracts does not eliminate fluctuations in the prices of the Fund's portfolio securities. The risks of forward foreign currency exchange contracts include movement in the values of the foreign currencies relative to the U.S. dollar (or other foreign currencies) and the possibility that counterparties will not complete their contractual obligations, which may be in excess of the amount reflected, if any, in the Statement of Assets and Liabilities.
Futures Contracts
Futures contracts represent commitments for the future purchase or sale of an asset at a specified price on a specified date. The Fund bought and sold futures contracts to manage exposure to the securities market, and maintain appropriate equity market exposure while keeping sufficient cash to accommodate daily redemptions. Upon entering into futures contracts, the Fund bears risks which may include interest rates, exchange rates or securities prices moving unexpectedly, in which case, the Fund may not achieve the anticipated benefits of the futures contracts and may realize a loss. Additional risks include counterparty credit risk, the possibility of an illiquid market, and that a change in the value of the contract or option may not correlate with changes in the value of the underlying asset.
Upon entering into a futures contract, the Fund pledges cash or securities with the broker in an amount sufficient to meet the initial margin requirement. Subsequent payments (variation margin) are made or received by the Fund each day. The variation margin payments are equal to the daily change in the contract value and are recorded as variation margin receivable or payable and are offset in unrealized gains or losses. The Fund recognizes a realized gain or loss when the contract is closed or expires. Futures contracts involve, to varying degrees, risk of loss in excess of the variation margin disclosed in the Statement of Assets and Liabilities.
Effects of Derivative Transactions in the Financial Statements
The following tables are intended to provide additional information about the effect of derivatives on the financial statements of the Fund, including: the fair value of derivatives by risk category and the location of those fair values in the Statement of Assets and Liabilities; the impact of derivative transactions on the Fund's operations over the period including realized gains or losses and unrealized gains or losses. The derivative schedules following the Portfolio of
Investments present additional information regarding derivative instruments outstanding at the end of the period, if any.
The following table is a summary of the fair value of derivative instruments at February 28, 2013:
| | Asset Derivatives | |
Risk Exposure
Category | | Statement of Assets and
Liabilities Location | |
Fair Value ($) | |
Foreign exchange
contracts
| | Unrealized appreciation on
forward foreign currency
exchange contracts | | | 7,181,525 | | |
| | Liability Derivatives | |
Risk Exposure
Category | | Statement of Assets and
Liabilities Location | |
Fair Value ($) | |
Equity contracts
| | Net assets—unrealized
depreciation on
futures contracts | | | 24,388 | * | |
Foreign exchange
contracts
| | Unrealized depreciation on
forward foreign currency
exchange contracts | | | 11,461,328 | | |
Total | | | | | 11,485,716 | | |
*Includes cumulative appreciation (depreciation) of futures contracts as reported in the Futures Contracts Outstanding table following the Portfolio of Investments. Only the current day's variation margin is reported in receivables or payables in the Statement of Assets and Liabilities.
The effect of derivative instruments in the Statement of Operations for the year ended February 28, 2013:
Amount of Realized Gain (Loss) on Derivatives Recognized in Income | |
Risk Exposure
Category | | Forward Foreign
Currency Exchange
Contracts ($) | |
Futures
Contracts ($) | |
Total ($) | |
Equity contracts | | | — | | | | 1,488,967 | | | | 1,488,967 | | |
Foreign exchange
contracts | | | (28,947,710 | ) | | | — | | | | (28,947,710 | ) | |
Total | | | (28,947,710 | ) | | | 1,488,967 | | | | (27,458,743 | ) | |
Change in Unrealized Appreciation (Depreciation) on Derivatives Recognized in Income | |
Risk Exposure
Category | | Forward Foreign
Currency Exchange
Contracts ($) | |
Futures
Contracts ($) | |
Total ($) | |
Equity contracts | | | — | | | | (110,009 | ) | | | (110,009 | ) | |
Foreign exchange
contracts | | | 1,282,614 | | | | — | | | | 1,282,614 | | |
Total | | | 1,282,614 | | | | (110,009 | ) | | | 1,172,605 | | |
The following table is a summary of the volume of derivative instruments for the year ended February 28, 2013:
Derivative Instrument | | Contracts Opened | |
Forward foreign currency exchange contracts | | | 414 | | |
Futures contracts | | | 1,281 | | |
Annual Report 2013
40
Columbia Multi-Advisor International Equity Fund
Notes to Financial Statements (continued)
February 28, 2013
Security Transactions
Security transactions are accounted for on the trade date. Cost is determined and gains (losses) are based upon the specific identification method for both financial statement and federal income tax purposes.
Income Recognition
Corporate actions and dividend income are recorded net of any non-reclaimable tax withholdings, on the ex-dividend date or upon receipt of ex-dividend notification in the case of certain foreign securities.
Awards from class action litigation are recorded as a reduction of cost basis if the Fund still owns the applicable securities on the payment date. If the Fund no longer owns the applicable securities, the proceeds are recorded as realized gains.
Expenses
General expenses of the Trust are allocated to the Fund and other funds of the Trust based upon relative net assets or other expense allocation methodologies determined by the nature of the expense. Expenses directly attributable to the Fund are charged to the Fund. Expenses directly attributable to a specific class of shares are charged to that share class.
Determination of Class Net Asset Value
All income, expenses (other than class-specific expenses, which are charged to that share class, as shown in the Statement of Operations) and realized and unrealized gains (losses) are allocated to each class of the Fund on a daily basis, based on the relative net assets of each class, for purposes of determining the net asset value of each class.
Federal Income Tax Status
The Fund intends to qualify each year as a regulated investment company under Subchapter M of the Internal Revenue Code, as amended, and will distribute substantially all of its tax exempt and taxable income (including net short-term capital gains), if any, for its tax year, and as such will not be subject to federal income taxes. In addition, the Fund intends to distribute in each calendar year substantially all of its net investment income, capital gains and certain other amounts, if any, such that the Fund should not be subject to federal excise tax. Therefore, no federal income or excise tax provision is recorded.
Foreign Taxes
The Fund may be subject to foreign taxes on income, gains on investments or currency repatriation, a portion of which may be recoverable. The Fund will accrue such taxes and recoveries, as applicable, based upon its current interpretation
of tax rules and regulations that exist in the markets in which it invests.
Realized gains in certain countries may be subject to foreign taxes at the Fund level, based on statutory rates. The Fund accrues for such foreign taxes on net realized and unrealized gains at the appropriate rate for each jurisdiction, as applicable. The amount, if any, is disclosed as a liability on the Statement of Assets and Liabilities.
Distributions to Shareholders
Distributions from net investment income, if any, are declared and paid semi-annually. Net realized capital gains, if any, are distributed at least annually. Income distributions and capital gain distributions are determined in accordance with federal income tax regulations, which may differ from GAAP.
Guarantees and Indemnifications
Under the Trust's organizational documents and, in some cases, by contract, its officers and trustees are indemnified against certain liabilities arising out of the performance of their duties to the Trust or its funds. In addition, certain of the Fund's contracts with its service providers contain general indemnification clauses. The Fund's maximum exposure under these arrangements is unknown since the amount of any future claims that may be made against the Fund cannot be determined, and the Fund has no historical basis for predicting the likelihood of any such claims.
Recent Accounting Pronouncement
Disclosures about Offsetting Assets and Liabilities
In December 2011, the Financial Accounting Standards Board (FASB) issued Accounting Standards Update (ASU) No. 2011-11, Disclosures about Offsetting Assets and Liabilities. The objective of the FASB is to enhance current disclosure requirements on offsetting of certain assets and liabilities and to enable financial statement users to compare financial statements prepared under GAAP and International Financial Reporting Standards.
Specifically, ASU No. 2011-11 requires an entity to disclose both gross and net information for derivatives and other financial instruments that are subject to a master netting arrangement or similar agreement. The standard requires disclosure of collateral received in connection with the master netting agreements or similar agreements. The effective date of ASU No. 2011-11 is for interim and annual periods beginning on or after January 1, 2013. At this time, management is evaluating the implications of this guidance and the impact it will have on the financial statement amounts and footnote disclosures, if any.
Annual Report 2013
41
Columbia Multi-Advisor International Equity Fund
Notes to Financial Statements (continued)
February 28, 2013
Note 3. Fees and Compensation Paid to Affiliates
Investment Management Fees
Under an Investment Management Services Agreement, Columbia Management Investment Advisers, LLC (the Investment Manager), a wholly-owned subsidiary of Ameriprise Financial, Inc. (Ameriprise Financial), is responsible for the ultimate oversight of investments made by the Fund. The Fund's subadvisers (see Subadvisory Agreements below) have the primary responsibility for the day-to-day portfolio management of the Fund. The investment management fee is an annual fee that is equal to a percentage of the Fund's average daily net assets that declines from 0.79% to 0.62% as the Fund's net assets increase. The effective investment management fee rate for the year ended February 28, 2013 was 0.76% of the Fund's average daily net assets.
Prior to June 30, 2012, to the extent that the Fund was not benefitting from a separate contractual expense limitation arrangement, the Investment Manager contractually agreed to waive a portion of its investment management fee. In the absence of a separate contractual expense limitation arrangement, the investment management fee waiver for the Fund was equal to a percentage of the Fund's pro-rata portion of the combined average daily net assets of the Fund and other affiliated funds managed by the Investment Manager and sub-advised by Marsico Capital Management, LLC (Marsico), at a rate that increased from 0.00% to 0.10% as the combined daily net assets increased.
For the year ended February 28, 2013, no investment management fees were waived for the Fund.
Subadvisory Agreements
The Investment Manager has entered into Subadvisory Agreements with Marsico and Threadneedle International Limited, each of which subadvises a portion of the assets of the Fund. New investments in the Fund, net of any redemptions, are allocated in accordance with the Investment Manager's determination, subject to the oversight of the Board, of the allocation that is in the best interests of the shareholders. Each subadviser's proportionate share of investments in the Fund will vary due to market fluctuations. The Investment Manager compensates each subadviser to manage the investment of the Fund's assets.
Administration Fees
Under an Administrative Services Agreement, the Investment Manager also serves as the Fund Administrator. The Fund pays the Fund Administrator an annual fee for administration and accounting services equal to a percentage of the Fund's
average daily net assets that declines from 0.08% to 0.05% as the Fund's net assets increase. The effective administration fee rate for the year ended February 28, 2013 was 0.08% of the Fund's average daily net assets.
Other Expenses
Other expenses are for, among other things, certain expenses of the Fund or the Board, including: Fund boardroom and office expense, employee compensation, employee health and retirement benefits, and certain other expenses. Payment of these Fund and Board expenses is facilitated by a company providing limited administrative services to the Fund and the Board. For the year ended February 28, 2013, other expenses paid to this company were $4,346.
Compensation of Board Members
Board members are compensated for their services to the Fund as disclosed in the Statement of Operations. Under a Deferred Compensation Plan (the Plan), the Board members who are not "interested persons" of the Fund, as defined under the 1940 Act, may elect to defer payment of up to 100% of their compensation. Deferred amounts are treated as though equivalent dollar amounts had been invested in shares of certain funds managed by the Investment Manager. The Fund's liability for these amounts is adjusted for market value changes and remains in the Fund until distributed in accordance with the Plan.
Transfer Agent Fees
Under a Transfer and Dividend Disbursing Agent Agreement, Columbia Management Investment Services Corp. (the Transfer Agent), an affiliate of the Investment Manager and a wholly-owned subsidiary of Ameriprise Financial, is responsible for providing transfer agency services to the Fund. The Transfer Agent has contracted with Boston Financial Data Services (BFDS) to serve as sub-transfer agent.
The Transfer Agent receives monthly account-based service fees based on the number of open accounts and is reimbursed by the Fund for the fees and expenses the Transfer Agent pays to financial intermediaries that maintain omnibus accounts with the Fund that is a percentage of the average aggregate value of the Fund's shares maintained in each such omnibus account (other than omnibus accounts for which American Enterprise Investment Services Inc. is the broker of record or accounts where the beneficial shareholder is a customer of Ameriprise Financial Services, Inc., which are paid a per account fee). The Transfer Agent pays the fees of BFDS for services as sub-transfer agent and is not entitled to reimbursement for such fees from the Fund (with the exception of out-of-pocket fees).
The Transfer Agent also receives compensation from fees for various shareholder services and reimbursements for certain
Annual Report 2013
42
Columbia Multi-Advisor International Equity Fund
Notes to Financial Statements (continued)
February 28, 2013
out-of-pocket fees. Class I shares do not pay transfer agent fees. Total transfer agent fees for Class K and Class R5 shares are subject to an annual limitation of not more than 0.05% of the average daily net assets attributable to each share class. Effective November 1, 2012, Class Y shares will not pay transfer agent fees for at least twelve months.
For the year ended February 28, 2013, the Fund's effective transfer agent fee rates as a percentage of average daily net assets of each class were as follows:
Class A | | | 0.20 | % | |
Class B | | | 0.20 | | |
Class C | | | 0.20 | | |
Class K | | | 0.05 | | |
Class R | | | 0.20 | | |
Class R4* | | | 0.26 | | |
Class R5* | | | 0.05 | | |
Class W | | | 0.20 | | |
Class Y | | | 0.00 | ** | |
Class Z | | | 0.20 | | |
* Annualized.
**Rounds to zero.
An annual minimum account balance fee of $20 may apply to certain accounts with a value below the Fund's initial minimum investment requirements to reduce the impact of small accounts on transfer agent fees. These minimum account balance fees are recorded as part of expense reductions in the Statement of Operations. For the year ended February 28, 2013, these minimum account balance fees reduced total expenses by $35,648.
Plan Administration Fees
Under a Plan Administration Services Agreement with the Transfer Agent, the Fund pays an annual fee at a rate of 0.25% of the Fund's average daily net assets attributable to Class K shares for the provision of various administrative, recordkeeping, communication and educational services.
Distribution and Service Fees
The Fund has an agreement with Columbia Management Investment Distributors, Inc. (the Distributor), an affiliate of the Investment Manager and a wholly-owned subsidiary of Ameriprise Financial, for distribution and shareholder services. Pursuant to Rule 12b-1 under the 1940 Act, the Board has approved, and the Fund has adopted, distribution and shareholder service plans (the Plans) which set the distribution and service fees for the Fund. These fees are calculated daily and are intended to compensate the Distributor and/or eligible selling and/or servicing agents for selling shares of the Fund and providing services to investors.
The Plans require the payment of a monthly combined distribution and service fee to the Distributor at the maximum annual rate of 0.25% of the average daily net assets attributable to Class A shares of the Fund. The Plans also require the payment of a monthly service fee at the maximum annual rate of 0.25% of the average daily net assets attributable to Class B, Class C and Class W shares of the Fund and the payment of a monthly distribution fee at the maximum annual rate of 0.75%, 0.75%, 0.50% and 0.25% of the average daily net assets attributable to Class B, Class C, Class R and Class W shares of the Fund, respectively.
The Fund may pay a distribution fee up to 0.25% of the Fund's average daily net assets attributable to Class W shares and a service fee of up to 0.25% of the Fund's average daily net assets attributable to Class W shares, provided, however, that the aggregate fee shall not exceed 0.25% of the Fund's average daily net assets attributable to Class W shares.
Sales Charges
Sales charges, including front-end charges and CDSCs, received by the Distributor for distributing Fund shares were $89,083 for Class A, $2,259 for Class B and $377 for Class C shares for the year ended February 28, 2013.
Expenses Waived/Reimbursed by the Investment Manager and its Affiliates
Effective July 1, 2012, the Investment Manager and certain of its affiliates have contractually agreed to waive fees and/or reimburse expenses (excluding certain fees and expenses described below), through June 30, 2013, unless sooner terminated at the sole discretion of the Board, so that the Fund's net operating expenses, after giving effect to fees waived/expenses reimbursed and any balance credits and/or overdraft charges from the Fund's custodian, do not exceed the following annual rates as a percentage of the class' average daily net assets:
Class A | | | 1.50 | % | |
Class B | | | 2.25 | | |
Class C | | | 2.25 | | |
Class I | | | 1.05 | | |
Class K | | | 1.35 | | |
Class R | | | 1.75 | | |
Class R4* | | | 1.25 | | |
Class R5* | | | 1.10 | | |
Class W | | | 1.50 | | |
Class Y | | | 1.05 | | |
Class Z | | | 1.25 | | |
*Annual rate is contractual from November 8, 2012 (the commencement of operations of each share class) through November 8, 2013.
Annual Report 2013
43
Columbia Multi-Advisor International Equity Fund
Notes to Financial Statements (continued)
February 28, 2013
Prior to July 1, 2012, the Investment Manager and certain of its affiliates contractually agreed to waive fees and/or reimburse expenses (excluding certain fees and expenses described below), so that the Fund's net operating expenses, after giving effect to fees waived/expenses reimbursed and any balance credits and/or overdraft charges from the Fund's custodian, did not exceed the following annual rates as a percentage of the class' average daily net assets:
Class A | | | 1.32 | % | |
Class B | | | 2.07 | | |
Class C | | | 2.07 | | |
Class I | | | 0.94 | | |
Class K | | | 1.24 | | |
Class R | | | 1.57 | | |
Class W | | | 1.32 | | |
Class Y | | | 1.07 | | |
Class Z | | | 1.07 | | |
Under the agreement governing these fee waivers and/or expense reimbursement arrangements, the following fees and expenses are excluded from the waiver/reimbursement commitment, and therefore will be paid by the Fund, if applicable: taxes (including foreign transaction taxes), expenses associated with investments in affiliated and non-affiliated pooled investment vehicles (including mutual funds and exchange traded funds), transaction costs and brokerage commissions, costs related to any securities lending program, dividend expenses associated with securities sold short, inverse floater program fees and expenses, transaction charges and interest on borrowed money, interest, extraordinary expenses and any other expenses the exclusion of which is specifically approved by the Board. This agreement may be modified or amended only with approval from all parties.
Note 4. Federal Tax Information
The timing and character of income and capital gain distributions are determined in accordance with income tax regulations, which may differ from GAAP because of temporary or permanent book to tax differences.
At February 28, 2013, these differences are primarily due to differing treatment for: capital loss carryforwards, deferral/reversal of wash sales losses, Trustees' deferred compensation, foreign currency transactions, passive foreign investment company (PFIC) holdings, late-year ordinary losses, and derivative investments. To the extent these differences are permanent, reclassifications are made among the components of the Fund's net assets in the Statement of Assets and Liabilities. Temporary differences do not require
reclassifications. In the Statement of Assets and Liabilities the following reclassifications were made:
Excess of distributions over net investment income | | $ | (10,022,110 | ) | |
Accumulated net realized loss | | | 25,734,614 | | |
Paid-in capital | | | (15,712,504 | ) | |
Net investment income and net realized gains (losses), as disclosed in the Statement of Operations, and net assets were not affected by this reclassification.
The tax character of distributions paid during the years indicated was as follows:
Year Ended | | February 28,
2013 | | February 29,
2012 | |
Ordinary income | | $ | 35,449,418 | | | $ | — | | |
Short-term capital gain distributions, if any, are considered ordinary income distributions for tax purposes.
At February 28, 2013, the components of distributable earnings on a tax basis were as follows:
Accumulated realized loss | | $ | (992,770,020 | ) | |
Unrealized appreciation | | | 174,774,182 | | |
At February 28, 2013, the cost of investments for federal income tax purposes was $775,276,644 and the aggregate gross unrealized appreciation and depreciation based on that cost was:
Unrealized appreciation | | $ | 186,196,321 | | |
Unrealized depreciation | | | (11,422,139 | ) | |
Net unrealized appreciation | | $ | 174,774,182 | | |
The following capital loss carryforward, determined at February 28, 2013, may be available to reduce taxable income arising from future net realized gains on investments, if any, to the extent permitted by the Internal Revenue Code:
Year of Expiration | | Amount | |
2017 | | $ | 423,616,657 | | |
2018 | | | 553,108,969 | | |
Total | | $ | 976,725,626 | | |
For the year ended February 28, 2013, $15,712,504 of capital loss carryforward was utilized.
Under current tax rules, regulated investment companies can elect to treat certain late-year ordinary losses incurred and post-October capital losses (capital losses realized after October 31) as arising on the first day of the following taxable year. As of February 28, 2013, the Fund will elect to treat late year ordinary losses of $16,044,394 as arising on March 1, 2013.
Annual Report 2013
44
Columbia Multi-Advisor International Equity Fund
Notes to Financial Statements (continued)
February 28, 2013
Management of the Fund has concluded that there are no significant uncertain tax positions that would require recognition in the financial statements. However, management's conclusion may be subject to review and adjustment at a later date based on factors including, but not limited to, new tax laws, regulations, and administrative interpretations (including relevant court decisions). Generally, the Fund's federal tax returns for the prior three fiscal years remain subject to examination by the Internal Revenue Service.
Note 5. Portfolio Information
The cost of purchases and proceeds from sales of securities, excluding short-term obligations, aggregated to $1,133,286,697 and $2,036,702,854, respectively, for the year ended February 28, 2013.
Note 6. Regulatory Settlements
During the year ended February 29, 2012, the Fund received $3,493,349 as a result of a regulatory settlement proceeding brought by the Securities and Exchange Commission against an unaffiliated third party relating to market timing and/or late trading of mutual funds. This amount represented the Fund's portion of the proceeds from the settlement (the Fund was not a party to the proceeding). The payments have been included in "Proceeds from regulatory settlements" in the Statement of Changes in Net Assets.
Note 7. Lending of Portfolio Securities
Effective December 19, 2012, the Fund no longer participates in securities lending activity. Prior to that date, the Fund participated, or was eligible to participate, in securities lending activity pursuant to a Master Securities Lending Agreement (the Agreement) with JPMorgan Chase Bank, N.A. (JPMorgan). The Agreement authorized JPMorgan as lending agent to lend securities to authorized borrowers in order to generate additional income on behalf of the Fund. Pursuant to the Agreement, the securities loaned were secured by cash or securities that either were issued or guaranteed as to principal and interest by the U.S. government, its agencies, authorities or instrumentalities with value equal to at least 100% of the market value of the loaned securities. Any additional collateral required to maintain those levels due to market fluctuations of the loaned securities was requested to be delivered the following business day. Cash collateral received was invested by the lending agent on behalf of the Fund into authorized investments pursuant to the Agreement.
Pursuant to the Agreement, the Fund received income for lending its securities either in the form of fees or by earning interest on invested cash collateral, net of negotiated rebates paid to borrowers and fees paid to the lending agent for
services provided and any other securities lending expenses. Net income earned from securities lending for the year ended February 28, 2013 is disclosed in the Statement of Operations. The Fund continued to earn and accrue interest and dividends on the securities loaned.
Note 8. Affiliated Money Market Fund
The Fund invests its daily cash balances in Columbia Short-Term Cash Fund, an affiliated money market fund established for the exclusive use by the Fund and other affiliated funds. The income earned by the Fund from such investments is included as "Dividends — affiliated issuers" in the Statement of Operations. As an investing fund, the Fund indirectly bears its proportionate share of the expenses of Columbia Short-Term Cash Fund.
Note 9. Shareholder Concentration
At February 28, 2013, two unaffiliated shareholder accounts owned an aggregate of 58.1% of the outstanding shares of the Fund. The Fund has no knowledge about whether any portion of those shares was owned beneficially by such accounts. Subscription and redemption activity by concentrated accounts may have a significant effect on the operations of the Fund.
Note 10. Line of Credit
The Fund has entered into a revolving credit facility with a syndicate of banks led by JPMorgan whereby the Fund may borrow for the temporary funding of shareholder redemptions or for other temporary or emergency purposes. The credit facility agreement, as amended, which is a collective agreement between the Fund and certain other funds managed by the Investment Manager, severally and not jointly, permits collective borrowings up to $500 million. Interest is charged to each participating fund based on its borrowings at a rate equal to the higher of (i) the overnight federal funds rate plus 1.00% or (ii) the one-month LIBOR rate plus 1.00%. Each borrowing under the credit facility matures no later than 60 days after the date of borrowing. The Fund also pays a commitment fee equal to its pro rata share of the amount of the credit facility at a rate of 0.08% per annum.
For the year ended February 28, 2013, the average daily loan balance outstanding on days when borrowing existed was $7,953,846 at a weighted average interest rate of 1.23%.
Note 11. Fund Merger
At the close of business on April 8, 2011, the Fund acquired the assets and assumed the identified liabilities of RiverSource Disciplined International Equity Fund, a series of RiverSource International Series, Inc., Threadneedle International Opportunity Fund, a series of RiverSource International Series, Inc., Columbia International Stock Fund, a series of
Annual Report 2013
45
Columbia Multi-Advisor International Equity Fund
Notes to Financial Statements (continued)
February 28, 2013
Columbia Funds Series Trust I, and Columbia International Growth Fund, a series of Columbia Funds Series Trust I (the acquired funds). The reorganization was completed after shareholders of the acquired funds approved the plan of reorganization on February 15, 2011. The purpose of the transaction was to combine certain funds managed by the Investment Manager with comparable investment objectives and strategies.
The aggregate net assets of the Fund immediately before the acquisition were $1,220,172,344 and the combined net assets immediately after the acquisition were $2,509,957,223.
The merger was accomplished by a tax-free exchange of 48,647,948 shares of RiverSource Disciplined International Equity Fund valued at $370,503,572 (including $51,911,561 of unrealized appreciation), 42,587,382 shares of Threadneedle International Opportunity Fund valued at $404,664,438 (including $79,018,855 of unrealized appreciation), 30,636,953 shares of Columbia International Stock Fund valued at $379,467,637 (including $70,789,734 of unrealized appreciation) and 9,357,405 shares of Columbia International Growth Fund valued at $135,149,232 (including $32,859,049 of unrealized appreciation).
In exchange for shares of the acquired funds, the Fund issued the following number of shares:
| | | Shares | |
Class A | | | 34,476,734 | | |
Class B | | | 1,930,534 | | |
Class C | | | 1,792,925 | | |
Class I | | | 19,889,124 | | |
Class R | | | 166,754 | | |
Class R4 | | | 14,235 | | |
Class W | | | 15,438,672 | | |
Class Y | | | 1,172,264 | | |
Class Z | | | 27,157,783 | | |
For financial reporting purposes, net assets received and shares issued by the Fund were recorded at fair value; however, the acquired funds' cost of investments were carried forward.
The financial statements reflect the operations of the Fund for the period prior to the merger and the combined fund for the period subsequent to the merger. Because the combined investment portfolios have been managed as a single integrated portfolio since the merger was completed, it is not practicable to separate the amounts of revenue and earnings of the acquired funds that have been included in the combined Fund's Statement of Operations since the merger was completed.
Assuming the merger had been completed on March 1, 2011, the Fund's pro-forma net investment income, net gain on investments, net change in unrealized depreciation and net decrease in net assets from operations for the year ended February 29, 2012, would have been approximately $35.1 million, $37.2 million, $(286.6) million and $(214.3) million, respectively.
Note 12. Significant Risks
Foreign Securities Risk
Investing in foreign securities may include certain risks and considerations not typically associated with investing in U.S. securities, such as fluctuating currency values and changing local and regional economic, political and social conditions, which may result in greater market volatility. In addition, certain foreign securities may not be as liquid as U.S. securities. Investing in emerging markets may accentuate these risks.
Investments in emerging market countries are subject to additional risk. The risk of foreign investments is typically increased in less developed countries. These countries are also more likely to experience high levels of inflation, deflation or currency devaluation which could hurt their economies and securities markets.
Note 13. Subsequent Events
Management has evaluated the events and transactions that have occurred through the date the financial statements were issued and noted no items requiring adjustment of the financial statements or additional disclosure.
Note 14. Information Regarding Pending and Settled Legal Proceedings
In December 2005, without admitting or denying the allegations, American Express Financial Corporation (AEFC, which is now known as Ameriprise Financial, Inc. (Ameriprise Financial)) entered into settlement agreements with the Securities and Exchange Commission (SEC) and Minnesota Department of Commerce (MDOC) related to market timing activities. As a result, AEFC was censured and ordered to cease and desist from committing or causing any violations of certain provisions of the Investment Advisers Act of 1940, the Investment Company Act of 1940, and various Minnesota laws. AEFC agreed to pay disgorgement of $10 million and civil money penalties of $7 million. AEFC also agreed to retain an independent distribution consultant to assist in developing a plan for distribution of all disgorgement and civil penalties ordered by the SEC in accordance with various undertakings detailed at www.sec.gov/litigation/admin/ia-2451.pdf. Ameriprise
Annual Report 2013
46
Columbia Multi-Advisor International Equity Fund
Notes to Financial Statements (continued)
February 28, 2013
Financial and its affiliates have cooperated with the SEC and the MDOC in these legal proceedings, and have made regular reports to the funds' Boards of Trustees.
Ameriprise Financial and certain of its affiliates have historically been involved in a number of legal, arbitration and regulatory proceedings, including routine litigation, class actions, and governmental actions, concerning matters arising in connection with the conduct of their business activities. Ameriprise Financial believes that the Funds are not currently the subject of, and that neither Ameriprise Financial nor any of its affiliates are the subject of, any pending legal, arbitration or regulatory proceedings that are likely to have a material adverse effect on the Funds or the ability of Ameriprise Financial or its affiliates to perform under their contracts with the Funds. Ameriprise Financial is required to make 10-Q, 10-K and, as necessary, 8-K filings with the Securities and Exchange Commission on legal and regulatory matters that relate to Ameriprise Financial and its affiliates. Copies of these filings may be obtained by accessing the SEC website at www.sec.gov.
There can be no assurance that these matters, or the adverse publicity associated with them, will not result in increased fund redemptions, reduced sale of fund shares or other adverse consequences to the Funds. Further, although we believe proceedings are not likely to have a material adverse effect on the Funds or the ability of Ameriprise Financial or its affiliates to perform under their contracts with the Funds, these proceedings are subject to uncertainties and, as such, we are unable to estimate the possible loss or range of loss that may result. An adverse outcome in one or more of these proceedings could result in adverse judgments, settlements, fines, penalties or other relief that could have a material adverse effect on the consolidated financial condition or results of operations of Ameriprise Financial.
Annual Report 2013
47
Columbia Multi-Advisor International Equity Fund
Report of Independent Registered Public Accounting Firm
To the Trustees of Columbia Funds Series Trust and
the Shareholders of Columbia Multi-Advisor International Equity Fund
In our opinion, the accompanying statement of assets and liabilities, including the portfolio of investments, and the related statements of operations and of changes in net assets and the financial highlights present fairly, in all material respects, the financial position of Columbia Multi-Advisor International Equity Fund (the "Fund") (a series of Columbia Funds Series Trust) at February 28, 2013, the results of its operations for the year then ended, the changes in its net assets for each of the two years in the period then ended and the financial highlights for each of the periods indicated, in conformity with accounting principles generally accepted in the United States of America. These financial statements and financial highlights (hereafter referred to as "financial statements") are the responsibility of the Fund's management. Our responsibility is to express an opinion on these financial statements based on our audits. We conducted our audits of these financial statements in accordance with the standards of the Public Company Accounting Oversight Board (United States). Those standards require that we plan and perform the audit to obtain reasonable assurance about whether the financial statements are free of material misstatement. An audit includes examining, on a test basis, evidence supporting the amounts and disclosures in the financial statements, assessing the accounting principles used and significant estimates made by management, and evaluating the overall financial statement presentation. We believe that our audits, which included confirmation of securities at February 28, 2013 by correspondence with the custodian, transfer agent and brokers, provide a reasonable basis for our opinion.
PricewaterhouseCoopers LLP
Minneapolis, Minnesota
April 19, 2013
Annual Report 2013
48
Columbia Multi-Advisor International Equity Fund
Federal Income Tax Information
(Unaudited)
The Fund hereby designates the following tax attributes for the fiscal year ended February 28, 2013. Shareholders will be notified in early 2014 of the amounts for use in preparing 2013 income tax returns.
Tax Designations:
| Qualified Dividend Income | | | 63.57 | % | |
| Dividends Received Deduction | | | 1.64 | % | |
Foreign Taxes Paid | | $ | 1,483,857 | | |
Foreign Source Income | | $ | 28,698,233 | | |
Qualified Dividend Income. For taxable, non-corporate shareholders, the percentage of ordinary income dividends paid during the fiscal year that represents qualified dividend income subject to reduced tax rates under the Jobs and Growth Tax Relief Reconciliation Act of 2003.
Dividends Received Deduction. The percentage of ordinary income dividends paid during the fiscal year that qualifies for the corporate dividends received deduction.
Foreign Taxes. The Fund makes the election to pass through to shareholders the foreign taxes paid. These taxes, and the corresponding foreign source income, are provided.
Annual Report 2013
49
Columbia Multi-Advisor International Equity Fund
Shareholders elect the Board that oversees the funds' operations. The Board appoints officers who are responsible for day-to-day business decisions based on policies set by the Board. The following table provides basic biographical information about the funds' Board members, including their principal occupations during the past five years, although specific titles for individuals may have varied over the period. Under current Board policy, members may serve until the next Board meeting after he or she reaches the mandatory retirement age established by the Board, or the fifteenth anniversary of the first Board meeting they attended as a member of the Board.
Mr. Edward J. Boudreau, Jr., Mr. William P. Carmichael, Mr. William A. Hawkins, Mr. R. Glenn Hilliard, Ms. Minor M. Shaw and Dr. Anthony M. Santomero, were members of the Legacy Columbia Nations funds' Board ("Nations Funds"), which includes Columbia Funds Series Trust, Columbia Funds Variable Insurance Trust I and Columbia Funds Master Investment Trust, LLC and began service on the Board for the Legacy RiverSource funds ("RiverSource Funds") effective June 1, 2011.
Independent Trustees
Name,
Address,
Year of Birth | | Position Held With
Funds and Length of
Service | | Principal Occupation
During Past Five Years | | Number of
Funds in the
Fund Family
Overseen by
Board Member | | Other Present or Past
Directorships/Trusteeships
(Within Past 5 Years) | |
Kathleen Blatz
901 S. Marquette Ave.
Minneapolis, MN 55402
1954 | | Board member since 1/06 for RiverSource Funds and since 6/11 for Nations Funds | | Attorney; Chief Justice, Minnesota Supreme Court, 1998-2006 | | | 153 | | | Director, BlueCross BlueShield of Minnesota since 2009 | |
Edward J. Boudreau, Jr.
901 S. Marquette Ave.
Minneapolis, MN 55402
1944 | | Board member since 6/11 for RiverSource Funds and since 1/05 for Nations Funds | | Managing Director, E.J. Boudreau & Associates (consulting) since 2000 | | | 151 | | | Former Trustee, BofA Funds Series Trust (11 funds) | |
Pamela G. Carlton
901 S. Marquette Ave.
Minneapolis, MN 55402
1954 | | Board member since 7/07 for RiverSource Funds and since 6/11 for Nations Funds | | President, Springboard — Partners in Cross Cultural Leadership (consulting company) since 2003 | | | 153 | | | None | |
William P. Carmichael
901 S. Marquette Ave.
Minneapolis, MN 55402
1943 | | Board member since 6/11 for RiverSource Funds and since 1999 for Nations Funds | | Retired | | | 151 | | | Director, Cobra Electronics Corporation (electronic equipment manufacturer); The Finish Line (athletic shoes and apparel) since July 2003; McMoRan Exploration Company (oil and gas exploration and development) since 2010; former Trustee, BofA Funds Series Trust (11 funds); former Director, Spectrum Brands, Inc. (consumer products); former Director, Simmons Company (bedding) | |
Patricia M. Flynn
901 S. Marquette Ave.
Minneapolis, MN 55402
1950 | | Board member since 11/04 for RiverSource Funds and since 6/11 for Nations Funds | | Trustee Professor of Economics and Management, Bentley University since 1976 | | | 153 | | | None | |
William A. Hawkins
901 S. Marquette Ave.
Minneapolis, MN 55402
1942 | | Board member since 6/11 for RiverSource Funds and since 1/05 for Nations Funds | | Managing Director, Overton Partners (financial consulting), since August 2010; President and Chief Executive Officer, California General Bank, N.A., January 2008-August 2010 | | | 151 | | | Trustee, BofA Funds Series Trust (11 funds) | |
Annual Report 2013
50
Columbia Multi-Advisor International Equity Fund
Trustees and Officers (continued)
Independent Trustees (continued)
Name,
Address,
Year of Birth | | Position Held With
Funds and Length of
Service | | Principal Occupation
During Past Five Years | | Number of
Funds in the
Fund Family
Overseen by
Board Member | | Other Present or Past
Directorships/Trusteeships
(Within Past 5 Years) | |
R. Glenn Hilliard
901 S. Marquette Ave.
Minneapolis, MN 55402
1943 | | Board member since 6/11 for RiverSource Funds and since 1/05 for Nations Funds | | Chairman and Chief Executive Officer, Hilliard Group LLC (investing and consulting), since April 2003; Non-Executive Director & Chairman, CNO Financial Group, Inc. (insurance), September 2003-May 2011 | | | 151 | | | Chairman, BofA Fund Series Trust (11 funds); former Director, CNO Financial Group, Inc. (insurance) | |
Stephen R. Lewis, Jr.
901 S. Marquette Ave.
Minneapolis, MN 55402
1939 | | Chair of the Board for RiverSource Funds since 1/07, Board member for RiverSource Funds since 1/02 and since 6/11 for Nations Funds | | President Emeritus and Professor of Economics Emeritus, Carleton College since 2002 | | | 153 | | | Director, Valmont Industries, Inc. (manufacturer of irrigation systems) since 2002 | |
Catherine James Paglia
901 S. Marquette Ave.
Minneapolis, MN 55402
1952 | | Board member since 11/04 for RiverSource Funds and since 6/11 for Nations Funds | | Director, Enterprise Asset Management, Inc. (private real estate and asset management company) | | | 153 | | | Director, Valmont Industries, Inc. (manufacturer of irrigation systems) since 2012 | |
Leroy C. Richie
901 S. Marquette Ave.
Minneapolis, MN 55402
1941 | | Board member since 2000 for Legacy Seligman Funds, since 11/08 for RiverSource Funds and since 6/11 for Nations Funds | | Counsel, Lewis & Munday, P.C. (law firm) since 2004; former Vice President and General Counsel, Automotive Legal Affairs, Chrysler Corporation from 1983-1987 | | | 153 | | | Lead Outside Director, Digital Ally, Inc. (digital imaging) since September 2005; Director, Infinity, Inc. (oil and gas exploration and production) since 1994; Director, OGE Energy Corp. (energy and energy services) since November 2007 | |
Minor M. Shaw
901 S. Marquette Ave.
Minneapolis, MN 55402
1947 | | Board member since 6/11 for RiverSource Funds and since 2003 for Nations Funds | | President, Micco LLC (private investments) since 2011; President Micco Corp. since 1998 | | | 151 | | | Director, Piedmont Natural Gas; Director, BlueCross BlueShield of South Carolina since April 2008; Former Trustee, BofA Funds Series Trust (11 funds) | |
Alison Taunton-Rigby
901 S. Marquette Ave.
Minneapolis, MN 55402
1944 | | Board member since 11/02 for RiverSource Funds and since 6/11 for Nations Funds | | Chief Executive Officer and Director, RiboNovix, Inc. (biotechnology), 2003-2010 | | | 153 | | | Director, Healthways, Inc. (health and well-being improvement) since 2005; Director, ICI Mutual Insurance Company, RRG since 2011; Director, Abt Associates (government contractor) since 2001; Director, Boston Children's Hospital since 2002 | |
Annual Report 2013
51
Columbia Multi-Advisor International Equity Fund
Trustees and Officers (continued)
Interested Trustee Not Affiliated With Investment Manager*
Name,
Address,
Year of Birth | | Position Held With
Funds and Length of
Service | | Principal Occupation
During Past Five Years | | Number of
Funds in the
Fund Family
Overseen by
Board Member | | Other Present or Past
Directorships/Trusteeships
(Within Past 5 Years) | |
Anthony M. Santomero
901 S. Marquette Ave.
Minneapolis, MN 55402
1946 | | Board member since 6/11 for RiverSource Funds and since 1/08 for Nations Funds | | Richard K. Mellon Professor Emeritus of Finance, The Wharton School, University of Pennsylvania, since 2002; Senior Advisor, McKinsey & Company (consulting), 2006-2008 | | | 151 | | | Director, Renaissance Reinsurance Ltd. since May 2008; Trustee, Penn Mutual Life Insurance Company since March 2008; Director, Citigroup since 2009; Director, Citibank, N.A. since 2009; former Trustee, BofA Funds Series Trust (11 funds) | |
*Dr. Santomero is not an affiliated person of the investment manager or Ameriprise Financial. However, he is currently deemed by the funds to be an "interested person" (as defined in the 1940 Act) of the funds because he serves as a Director of Citigroup, Inc. and Citibank N.A., companies that may directly or through subsidiaries and affiliates engage from time-to-time in brokerage execution, principal transactions and lending relationships with the funds or accounts advised/managed by the investment manager.
Interested Trustee Affiliated With Investment Manager*
Name,
Address,
Year of Birth | | Position Held With
Funds and Length of
Service | | Principal Occupation
During Past Five Years | | Number of
Funds in the
Fund Family
Overseen by
Board Member | | Other Present or Past
Directorships/Trusteeships
(Within Past 5 Years) | |
William F. Truscott
53600 Ameriprise
Financial Center
Minneapolis, MN 55474
1960 | | Board member since 11/01 for RiverSource Funds and since 6/11 for Nations Funds; Senior Vice President since 2002 for RiverSource Funds and 5/10 for Nations Funds | | President, Columbia Management Investment Advisers, LLC since February 2012, (previously President, Chairman of the Board and Chief Investment Officer, 2001-April 2010); Chief Executive Officer, Global Asset Management, Ameriprise Financial, Inc. since September 2012 (previously Chief Executive Officer, U.S. Asset Management & President, Annuities, May 2010-September 2012 and President — U.S. Asset Management and Chief Investment Officer, 2005-April 2010); Chief Executive Officer, Columbia Management Investment Distributors, Inc. since February 2012, (previously Chairman of the Board and Chief Executive Officer, 2006-April 2010); Chairman of the Board and Chief Executive Officer, RiverSource Distributors, Inc. since 2006; President and Chief Executive Officer, Ameriprise Certificate Company 2006-August 2012 | | | 210 | | | Chairman of the Board, Columbia Management Investment Advisers, LLC since May 2010; Director, Columbia Management Investment Distributors, Inc. since May 2010; Director, Ameriprise Certificate Company, 2006-January 2013 | |
*Interested person (as defined under the 1940 Act) by reason of being an officer, director, security holder and/or employee of the investment manager or Ameriprise Financial.
The SAI has additional information about the Fund's Board members and is available, without charge, upon request by calling 800.345.6611; contacting your financial intermediary; or visiting columbiamanagement.com.
Annual Report 2013
52
Columbia Multi-Advisor International Equity Fund
Trustees and Officers (continued)
The Board has appointed officers who are responsible for day-to-day business decisions based on policies it has established. The officers serve at the pleasure of the Board. In addition to Mr. Truscott, who is Senior Vice President, the funds' other officers are:
Officers
Name,
Address,
Year of Birth | | Position Held With
Funds and Length of
Service | | Principal Occupation During Past Five Years | |
J. Kevin Connaughton
225 Franklin Street
Boston, MA 02110
1964 | | President and Principal Executive Officer since 5/10 for RiverSource Funds and 2009 for Nations Funds | | Senior Vice President and General Manager — Mutual Fund Products, Columbia Management Investment Advisers, LLC since May 2010; Managing Director of Columbia Management Advisors, LLC, December 2004-April 2010; Senior Vice President and Chief Financial Officer, Columbia Funds, June 2008-January 2009; Treasurer, Columbia Funds, October 2003-May 2008 | |
Amy K. Johnson
5228 Ameriprise Financial Center Minneapolis, MN 55474
1965 | | Vice President since 12/06 for RiverSource Funds and 5/10 for Nations Funds | | Senior Vice President and Chief Operating Officer, Columbia Management Investment Advisers, LLC since May 2010 (previously Chief Administrative Officer, 2009-April 2010 and Vice President — Asset Management and Trust Company Services, 2006-2009) | |
Michael G. Clarke
225 Franklin Street
Boston, MA 02110
1969 | | Treasurer since 1/11 and Chief Financial Officer since 4/11 for RiverSource Funds and Treasurer since 3/11 and Chief Financial Officer since 2009 for Nations Funds | | Vice President, Columbia Management Investment Advisers, LLC since May 2010; Managing Director of Fund Administration, Columbia Management Advisors, LLC, September 2004-April 2010; senior officer of Columbia Funds and affiliated funds since 2002 | |
Scott R. Plummer
5228 Ameriprise Financial Center Minneapolis, MN 55474
1959 | | Senior Vice President and Chief Legal Officer since 12/06 and Assistant Secretary since 6/11 for RiverSource Funds and Senior Vice President and Chief Legal Officer since 5/10 and Assistant Secretary since 6/11 for Nations Funds | | Senior Vice President, Chief Legal Officer and Assistant Secretary, Columbia Management Investment Advisers, LLC since June 2005; Vice President and Lead Chief Counsel — Asset Management, Ameriprise Financial, Inc. since May 2010 (previously Vice President and Chief Counsel — Asset Management, 2005-April 2010); Vice President, Chief Counsel and Assistant Secretary, Columbia Management Investment Distributors, Inc. since 2008; Vice President, General Counsel and Secretary, Ameriprise Certificate Company since 2005; Chief Counsel, RiverSource Distributors, Inc. since 2006 | |
Colin Moore
225 Franklin Street
Boston, MA 02110
1958 | | Senior Vice President since 5/10 for RiverSource Funds and Nations Funds | | Director and Chief Investment Officer, Columbia Management Investment Advisers, LLC since May 2010; Manager, Managing Director and Chief Investment Officer, Columbia Management Advisors, LLC, 2007-April 2010 | |
Thomas P. McGuire
225 Franklin Street
Boston, MA 02110
1972 | | Chief Compliance Officer since 3/12 | | Vice President — Asset Management Compliance, Columbia Management Investment Advisers, LLC since 2010; Chief Compliance Officer, Ameriprise Certificate Company since September 2010; Compliance Executive, Bank of America, 2005-2010 | |
Stephen T. Welsh
225 Franklin Street
Boston, MA 02110
1957 | | Vice President since 4/11 for RiverSource Funds and 2006 for Nations Funds | | President and Director, Columbia Management Investment Services Corp. since May 2010; President and Director, Columbia Management Services, Inc., July 2004- April 2010; Managing Director, Columbia Management Distributors, Inc., August 2007-April 2010 | |
Christopher O. Petersen
5228 Ameriprise Financial Center Minneapolis, MN 55474
1970 | | Vice President and Secretary since 4/11 for RiverSource Funds and 3/11 for Nations Funds | | Vice President and Chief Counsel, Ameriprise Financial, Inc. since January 2010 (formerly Vice President and Group Counsel or Counsel, April 2004-January 2010); Assistant Secretary of Legacy RiverSource Funds, January 2007-April 2011 and of the Nations Funds, May 2010-March 2011 | |
Annual Report 2013
53
Columbia Multi-Advisor International Equity Fund
Trustees and Officers (continued)
Officers (continued)
Name,
Address,
Year of Birth | | Position Held With
Funds and Length of
Service | | Principal Occupation During Past Five Years | |
Paul D. Pearson
10468 Ameriprise Financial Center Minneapolis, MN 55474
1956 | | Vice President since 4/11 and Assistant Treasurer since 1999 for RiverSource Funds and Vice President and Assistant Treasurer since 6/11 for Nations Funds | | Vice President — Investment Accounting, Columbia Management Investment Advisers, LLC, since May 2010; Vice President — Managed Assets, Investment Accounting, Ameriprise Financial Corporation, February 1998-May 2010 | |
Joseph F. DiMaria
225 Franklin Street
Boston, MA 02110
1968 | | Vice President and Chief Accounting Officer since 4/11 and Vice President since 3/11 and Chief Accounting Officer since 2008 for Nations Funds | | Vice President, Mutual Fund Administration, Columbia Management Investment Advisers, LLC, since May 2010; Director of Fund Administration, Columbia Management Advisors, LLC, January 2006-April 2010 | |
Paul B. Goucher
100 Park Avenue
New York, NY 10017
1968 | | Vice President since 4/11 and Assistant Secretary since 11/08 for RiverSource Funds and 5/10 for Nations Funds | | Vice President and Lead Chief Counsel, Ameriprise Financial, Inc. since November 2008 and January 2013, respectively (formerly, Chief Counsel, January 2010-January 2013 and Group Counsel from November 2008- January 2010); Director, Managing Director and General Counsel, J. & W. Seligman & Co. Incorporated, July 2008-November 2008 (previously, Managing Director and Associate General Counsel, January 2005-July 2008) | |
Michael E. DeFao
225 Franklin Street
Boston, MA 02110
1968 | | Vice President since 4/11 and Assistant Secretary since 5/10 for RiverSource Funds and 2011 for Nations Funds | | Vice President and Chief Counsel, Ameriprise Financial, Inc. since May 2010; Associate General Counsel, Bank of America, June 2005-April 2010 | |
Annual Report 2013
54
This page intentionally left blank.
Annual Report 2013
55
This page intentionally left blank.
Annual Report 2013
56
Columbia Multi-Advisor International Equity Fund
Important Information About This Report
Each fund mails one shareholder report to each shareholder address. If you would like more than one report, please call shareholder services at 800.345.6611 and additional reports will be sent to you.
The policy of the Board is to vote the proxies of the companies in which each fund holds investments consistent with the procedures as stated in the Statement of Additional Information (SAI). You may obtain a copy of the SAI without charge by calling 800.345.6611; contacting your financial intermediary; visiting columbiamanagement.com; or searching the website of the Securities and Exchange Commission (SEC) at sec.gov. Information regarding how each fund voted proxies relating to portfolio securities is filed with the SEC by August 31 for the most recent 12-month period ending June 30 of that year, and is available without charge by visiting columbiamanagement.com; or searching the website of the SEC at sec.gov.
Each fund files a complete schedule of portfolio holdings with the SEC for the first and third quarters of each fiscal year on Form N-Q. Each fund's Form N-Q is available on the SEC's website at sec.gov and may be reviewed and copied at the SEC's Public Reference Room in Washington, D.C. Information on the operation of the Public Reference Room may be obtained by calling 800.SEC.0330. Each fund's complete schedule of portfolio holdings, as filed on Form N-Q, can also be obtained without charge, upon request, by calling 800.345.6611.
Annual Report 2013
57

Columbia Multi-Advisor International Equity Fund
P.O. Box 8081
Boston, MA 02266-8081
columbiamanagement.com
This information is for use with concurrent or prior delivery of a fund prospectus. Please read and consider the investment objectives, risks, charges and expenses for any fund carefully before investing. For a prospectus which contains this and other important information about the Fund go to columbiamanagement.com. The Fund is distributed by Columbia Management Investment Distributors, Inc., member FINRA, and managed by Columbia Management Investment Advisers, LLC.
© 2013 Columbia Management Investment Advisers, LLC. All rights reserved.
ANN201_02_C01_(04/13)
Annual Report
February 28, 2013

Columbia Marsico Growth Fund
Not FDIC insured • No bank guarantee • May lose value
Columbia Marsico Growth Fund
 Dear Shareholders,
U.S. stocks flat, foreign markets strong in 2012 finale
After a strong third quarter, U.S. stock market averages treaded water as the year 2012 came to a close. However, they ended the year up strongly, as first- and third-quarter gains more than offset second- and fourth-quarter weakness. Typically a strong quarter for domestic small- and mid-cap issues, the fourth quarter of 2012 indeed proved to be another year-end positive for small-cap stocks. For the full calendar year 2012, the S&P 500 Index rose 16.00%.
Stock markets outside the United States generated some of the best returns for the fourth quarter, as optimism rebounded, thanks to the September actions of the European Central Bank in support of the euro and an improving outlook from China. Both developed and emerging foreign markets topped U.S. stocks by a solid margin.
Corporate and emerging markets led fixed income
Fixed-income investors took their cue from the equity markets and continued to favor the highest risk sectors through the end of 2012. Global fixed-income returns posted mixed results in the final quarter of the year. Gains were the highest for corporate high-yield and emerging market bonds. Although investors remained cautious ahead of the year-end budget negotiations, better economic data and a further improvement in the European sovereign debt crisis supported riskier assets and depressed government bond prices. In December, the Federal Reserve announced its intention to continue to purchase both Treasury and mortgage-backed securities and said that it would seek to keep short-term interest rates unchanged until the unemployment rate reaches 6.5%, or inflation turned noticeably higher.
Stay on track with Columbia Management
Backed by more than 100 years of experience, Columbia Management is one of the nation's largest asset managers. At the heart of our success — and, most importantly, that of our investors — are highly talented industry professionals, brought together by a unique way of working. We are dedicated to helping you take advantage of today's opportunities and anticipate tomorrow's. We stay abreast of the latest investment trends and ideas, using our collective insight to evaluate events and transform them into solutions you can use.
Visit columbiamanagement.com for:
> The Columbia Management Perspectives blog, featuring timely posts by our investment teams
> Detailed up-to-date fund performance and portfolio information
> Economic analysis and market commentary
> Quarterly fund commentaries
> Columbia Management Investor, our award-winning quarterly newsletter for shareholders
Thank you for your continued support of the Columbia Funds. We look forward to serving your investment needs for many years to come.
Best Regards,

J. Kevin Connaughton
President, Columbia Funds
The S&P 500 Index, an unmanaged index, measures the performance of 500 widely held, large-capitalization U.S. stocks and is frequently used as a general measure of market performance. Indices are not available for investment, are not professionally managed and do not reflect sales charges, fees, brokerage commissions, taxes or other expenses of investing.
Investors should consider the investment objectives, risks, charges and expenses of a mutual fund carefully before investing. For a free prospectus, which contains this and other important information about a fund, visit columbiamanagement.com. The prospectus should be read carefully before investing.
Columbia Funds are distributed by Columbia Management Investment Distributors, Inc., member FINRA, and managed by Columbia Management Investment Advisers, LLC.
© 2013 Columbia Management Investment Advisers, LLC. All rights reserved.
Columbia Marsico Growth Fund
Performance Overview | | | 2 | | |
Manager Discussion of Fund Performance | | | 4 | | |
Understanding Your Fund's Expenses | | | 6 | | |
Portfolio of Investments | | | 7 | | |
Statement of Assets and Liabilities | | | 11 | | |
Statement of Operations | | | 13 | | |
Statement of Changes in Net Assets | | | 14 | | |
Financial Highlights | | | 16 | | |
Notes to Financial Statements | | | 25 | | |
Report of Independent Registered
Public Accounting Firm | | | 32 | | |
Federal Income Tax Information | | | 33 | | |
Trustees and Officers | | | 34 | | |
Important Information About This Report | | | 41 | | |
Fund Investment Manager
Columbia Management Investment
Advisers, LLC
225 Franklin Street
Boston, MA 02110
Fund Distributor
Columbia Management Investment
Distributors, Inc.
225 Franklin Street
Boston, MA 02110
Fund Transfer Agent
Columbia Management Investment
Services Corp.
P.O. Box 8081
Boston, MA 02266-8081
For more information about any of the funds, please visit columbiamanagement.com or call 800.345.6611. Customer Service Representatives are available to answer your questions Monday through Friday from 8 a.m. to 8 p.m. Eastern time.
The views expressed in this report reflect the current views of the respective parties. These views are not guarantees of future performance and involve certain risks, uncertainties and assumptions that are difficult to predict, so actual outcomes and results may differ significantly from the views expressed. These views are subject to change at any time based upon economic, market or other conditions and the respective parties disclaim any responsibility to update such views. These views may not be relied on as investment advice and, because investment decisions for a Columbia Fund are based on numerous factors, may not be relied on as an indication of trading intent on behalf of any particular Columbia Fund. References to specific securities should not be construed as a recommendation or investment advice.
Columbia Marsico Growth Fund
Performance Summary
> Columbia Marsico Growth Fund (the Fund) Class A shares returned 6.78% excluding sales charges for the 12-month period that ended February 28, 2013.
> The Fund underperformed its benchmark, the S&P 500 Index, which returned 13.46% for the same 12-month period.
> Stock selection and sector allocations generally accounted for the Fund's shortfall relative to the benchmark.
Average Annual Total Returns (%) (for period ended February 28, 2013)
| | Inception | | 1 Year | | 5 Years | | 10 Years | |
Class A | | 12/31/97 | | | | | | | | | | | | | |
Excluding sales charges | | | | | | | 6.78 | | | | 3.36 | | | | 7.56 | | |
Including sales charges | | | | | | | 0.63 | | | | 2.14 | | | | 6.93 | | |
Class B | | 12/31/97 | | | | | | | | | | | | | |
Excluding sales charges | | | | | | | 5.96 | | | | 2.59 | | | | 6.77 | | |
Including sales charges | | | | | | | 0.96 | | | | 2.23 | | | | 6.77 | | |
Class C | | 12/31/97 | | | | | | | |
Excluding sales charges | | | | | | | 5.96 | | | | 2.58 | | | | 6.76 | | |
Including sales charges | | | | | | | 4.96 | | | | 2.58 | | | | 6.76 | | |
Class I* | | 09/27/10 | | | 7.20 | | | | 3.61 | | | | 7.69 | | |
Class R* | | 01/23/06 | | | 6.50 | | | | 3.11 | | | | 7.27 | | |
Class R4* | | 11/08/12 | | | 6.87 | | | | 3.38 | | | | 7.57 | | |
Class R5* | | 11/08/12 | | | 6.89 | | | | 3.39 | | | | 7.57 | | |
Class W* | | 09/27/10 | | | 6.76 | | | | 3.37 | | | | 7.56 | | |
Class Z | | 12/31/97 | | | 7.02 | | | | 3.62 | | | | 7.83 | | |
S&P 500 Index | | | | | | | 13.46 | | | | 4.94 | | | | 8.24 | | |
Returns for Class A are shown with and without the maximum initial sales charge of 5.75%. Returns for Class B are shown with and without the applicable contingent deferred sales charge (CDSC) of 5.00% in the first year, declining to 1.00% in the sixth year and eliminated thereafter. Returns for Class C are shown with and without the 1.00% CDSC for the first year only. The Fund's other classes are not subject to sales charges and have limited eligibility. Please see the Fund's prospectuses for details. Performance for different share classes will vary based on differences in sales charges and fees associated with each class. All results shown assume reinvestment of distributions during the period. Returns do not reflect the deduction of taxes that a shareholder may pay on Fund distributions or on the redemption of Fund shares. Performance results reflect the effect of any fee waivers or reimbursements of Fund expenses by Columbia Management Investment Advisers, LLC and/or any of its affiliates. Absent these fee waivers or expense reimbursement arrangements, performance results would have been lower.
The performance information shown represents past performance and is not a guarantee of future results. The investment return and principal value of your investment will fluctuate so that your shares, when redeemed, may be worth more or less than their original cost. Current performance may be lower or higher than the performance information shown. You may obtain performance information current to the most recent month-end by contacting your financial intermediary, visiting columbiamanagement.com or calling 800.345.6611.
*The returns shown for periods prior to the share class inception date (including returns for the Life of the Fund, if shown, which are since Fund inception) include the returns of the Fund's oldest share class. Since the Fund launched more than one share class at its inception, Class A shares were used. These returns are adjusted to reflect any higher class-related operating expenses of the newer share classes, as applicable. Please visit columbiamanagement.com/mutual-funds/appended-performance for more information.
The S&P 500 Index, an unmanaged index, measures the performance of 500 widely held, large-capitalization U.S. stocks and is frequently used as a general measure of market performance.
Indices are not available for investment, are not professionally managed and do not reflect sales charges, fees, brokerage commissions, taxes or other expenses of investing. Securities in the Fund may not match those in an index.
Annual Report 2013
2
Columbia Marsico Growth Fund
Performance Overview (continued)
Performance of a Hypothetical $10,000 Investment (March 1, 2003 – February 28, 2013)
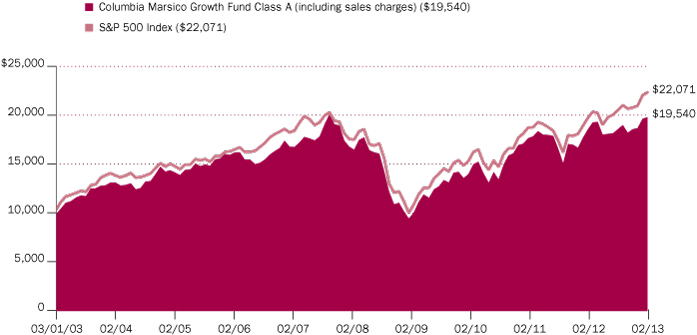
The chart above shows the change in value of a hypothetical $10,000 investment in Class A shares of Columbia Marsico Growth Fund during the stated time period, and does not reflect the deduction of taxes that a shareholder may pay on Fund distributions or on the redemption of Fund shares.
Annual Report 2013
3
Columbia Marsico Growth Fund
Manager Discussion of Fund Performance
For the 12-month period that ended February 28, 2013, the Fund's Class A shares returned 6.78% excluding sales charges. The Fund's benchmark, the S&P 500 Index, returned 13.46% for the same 12-month period. Stock selection in the consumer discretionary, energy, financials and consumer staples sectors was disappointing. Underweight positions in the consumer staples and financials areas also hurt performance. On the positive side, stock selection in information technology and materials and an overweight allocation to the strong-performing consumer discretionary sector aided results.
Stock Selection, Underweights in Strong Sectors Hurt Results
The consumer discretionary sector was a strong performer within the S&P 500 Index during the period. However, a number of the Fund's stock selections in the sector disappointed. Leather goods company Coach and discount retailer Dollar General had double-digit price declines and were sold. McDonald's, a long-term Fund holding, was hurt by global economic uncertainty, while unfavorable currency exchange rates hurt its international results. We trimmed the Fund's position in the stock, but continue to believe it is an attractive long-term investment. Nike also had disappointing returns during the period.
Stock selection in the energy and financial sectors also detracted from relative performance. Energy firms National Oilwell Varco, Halliburton and Occidental Petroleum had negative returns and were sold. The Fund's financials holdings had positive returns, but were disappointing compared to the sector's return in the benchmark. In addition, Chinese Internet search engine Baidu, Facebook and software firm VMware sustained double-digit losses and were sold. Heavy equipment engine manufacturer Cummins and Mead Johnson Nutrition (which was sold) also detracted from Fund performance. Fund results also were hampered by underweight positions in three strong-performing sectors in the benchmark: consumer staples, financials and telecommunication services.
Solid Returns from Certain Consumer Discretionary Holdings
The consumer discretionary sector was a good performer in the benchmark index, and the Fund benefited by having more exposure than the index to the sector. Home improvement retailer Home Depot and discount retailer TJX were notably strong performers. Stock selection in the information technology and materials sectors also buoyed results. In the former, Apple, the largest constituent of the S&P 500 Index and a large Fund holding early in the period, and financial transaction processor Visa were leading contributors. We sold Apple in January 2013 owing to concerns about the company's future revenue growth. Our conviction was confirmed as the stock declined in the final weeks of the fiscal year. Within materials, agricultural materials company Monsanto and specialty chemical firm LyondellBasell Industries were strong performers. Monsanto benefited from increased use of its U.S. corn and soybean products, as well as strong performance in its international seeds and traits business. LyondellBasell's ethylene margins increased during the period, driven by lower feedstock costs in the United States, as ethane supply continued to outpace demand. Meanwhile, biotechnology firms Gilead Sciences and Biogen Idec (the number one and three Fund holdings) also had strong price gains.
Portfolio Management
Marsico Capital Management, LLC
Thomas Marsico
Coralie Witter, CFA
Morningstar Style BoxTM
The Morningstar Style BoxTM is based on a fund's portfolio holdings. For equity funds, the vertical axis shows the market capitalization of the stocks owned, and the horizontal axis shows investment style (value, blend, or growth). Information shown is based on the most recent data provided by Morningstar.
© 2013 Morningstar, Inc. All rights reserved. The Morningstar information contained herein: (1) is proprietary to Morningstar and/or its content providers; (2) may not be copied or distributed; and (3) is not warranted to be accurate, complete or timely. Neither Morningstar nor its content providers are responsible for any damages or losses arising from any use of this information.
Annual Report 2013
4
Columbia Marsico Growth Fund
Manager Discussion of Fund Performance (continued)
Looking Ahead
Overall, we currently think the U.S. and international economic picture is generally improving. We believe large capitalization stocks are presently trading at reasonable valuations. However, serious fiscal challenges remain, both in the United States and abroad. Uncertainty about government economic policy is currently high and we believe additional tax hikes and spending cuts are likely. The question is whether this fiscal tightening can be done in a balanced and sensible manner. A major policy misstep could have profound repercussions for the economy.
Still, there currently is significant pent-up demand for vehicles, houses, travel and leisure activities and corporate capital spending. If this demand is unleashed, we believe it may have a beneficial impact on job growth and corporate profits.
Against this current backdrop, we are emphasizing companies that we believe have a high degree of earnings visibility, unleveraged balance sheets and are buying back stock and increasing dividends. There are several themes at work in the Fund. It currently has significant exposure to the consumer discretionary sector, with many of the positions being more staple-like in nature, meaning they offer needed rather than wanted products and services. We are also currently focusing on health care, particularly pharmaceuticals. A number of drug companies offer robust new product pipelines for unmet clinical needs. Other current themes include recoveries in U.S. housing, manufacturing and automobiles. We think the U.S. manufacturing sector has the potential to benefit from an inexpensive and growing supply of natural gas that provides a significant cost advantage.
During the period, we increased the Fund's allocation to the health care, financials and industrials sectors. We reduced allocations to the energy, information technology, consumer discretionary and materials sectors. At period end, the Fund's sector allocations emphasized consumer discretionary, health care, information technology and industrials. It had no investments in the utilities or telecommunication services sectors.
Top Ten Holdings (%)
(at February 28, 2013) | |
Gilead Sciences, Inc. | | | 4.8 | | |
Bristol-Myers Squibb Co. | | | 4.1 | | |
Biogen Idec, Inc. | | | 4.1 | | |
eBay, Inc. | | | 4.0 | | |
Google, Inc., Class A | | | 3.4 | | |
Starwood Hotels &
Resorts Worldwide, Inc. | | | 3.3 | | |
Schlumberger Ltd. | | | 3.3 | | |
Wells Fargo & Co. | | | 3.1 | | |
Lowe's Companies, Inc. | | | 3.1 | | |
CBS Corp., Class B Non Voting | | | 2.9 | | |
Percentages indicated are based upon total investments (excluding Money Market Funds).
For further detail about these holdings, please refer to the section entitled "Portfolio of Investments."
Fund holdings are as of the date given, are subject to change at any time, and are not recommendations to buy or sell any security.
Portfolio Breakdown (%)
(at February 28, 2013) | |
Common Stocks | | | 98.1 | | |
Consumer Discretionary | | | 33.7 | | |
Consumer Staples | | | 2.0 | | |
Energy | | | 4.7 | | |
Financials | | | 9.2 | | |
Health Care | | | 15.2 | | |
Industrials | | | 13.3 | | |
Information Technology | | | 15.1 | | |
Materials | | | 4.9 | | |
Money Market Funds | | | 1.9 | | |
Preferred Stocks | | | 0.0 | (a) | |
Financials | | | 0.0 | (a) | |
Total | | | 100.0 | | |
Percentages indicated are based upon total investments. The Fund's portfolio composition is subject to change.
(a) Rounds to zero.
Annual Report 2013
5
Columbia Marsico Growth Fund
Understanding Your Fund's Expenses
(Unaudited)
As an investor, you incur two types of costs. There are transaction costs, which generally include sales charges on purchases and may include redemption fees. There are also ongoing costs, which generally include management fees, distribution and service (Rule 12b-1) fees, and other fund expenses. The following information is intended to help you understand your ongoing costs (in dollars) of investing in the Fund and to help you compare these costs with the ongoing costs of investing in other mutual funds.
Analyzing Your Fund's Expenses
To illustrate these ongoing costs, we have provided examples and calculated the expenses paid by investors in each share class of the Fund during the period. The actual and hypothetical information in the table is based on an initial investment of $1,000 at the beginning of the period indicated and held for the entire period. Expense information is calculated two ways and each method provides you with different information. The amount listed in the "Actual" column is calculated using the Fund's actual operating expenses and total return for the period. You may use the Actual information, together with the amount invested, to estimate the expenses that you paid over the period. Simply divide your account value by $1,000 (for example, an $8,600 account value divided by $1,000 = 8.6), then multiply the results by the expenses paid during the period under the Actual column. The amount listed in the "Hypothetical" column assumes a 5% annual rate of return before expenses (which is not the Fund's actual return) and then applies the Fund's actual expense ratio for the period to the hypothetical return. You should not use the hypothetical account values and expenses to estimate either your actual account balance at the end of the period or the expenses you paid during the period. See "Compare With Other Funds" below for details on how to use the hypothetical data.
Compare With Other Funds
Since all mutual funds are required to include the same hypothetical calculations about expenses in shareholder reports, you can use this information to compare the ongoing cost of investing in the Fund with other funds. To do so, compare the hypothetical example with the 5% hypothetical examples that appear in the shareholder reports of other funds. As you compare hypothetical examples of other funds, it is important to note that hypothetical examples are meant to highlight the ongoing costs of investing in a fund only and do not reflect any transaction costs, such as sales charges, or redemption or exchange fees. Therefore, the hypothetical calculations are useful in comparing ongoing costs only, and will not help you determine the relative total costs of owning different funds. If transaction costs were included in these calculations, your costs would be higher.
September 1, 2012 – February 28, 2013
| | Account Value at the Beginning
of the Period ($) | | Account Value at the End of the
Period ($) | | Expenses Paid During the
Period ($) | | Fund's Annualized
Expense Ratio (%) | |
| | Actual | | Hypothetical | | Actual | | Hypothetical | | Actual | | Hypothetical | | Actual | |
Class A | | | 1,000.00 | | | | 1,000.00 | | | | 1,065.30 | | | | 1,018.60 | | | | 6.40 | | | | 6.26 | | | | 1.25 | | |
Class B | | | 1,000.00 | | | | 1,000.00 | | | | 1,061.20 | | | | 1,014.88 | | | | 10.22 | | | | 9.99 | | | | 2.00 | | |
Class C | | | 1,000.00 | | | | 1,000.00 | | | | 1,060.60 | | | | 1,014.88 | | | | 10.22 | | | | 9.99 | | | | 2.00 | | |
Class I | | | 1,000.00 | | | | 1,000.00 | | | | 1,067.00 | | | | 1,020.48 | | | | 4.46 | | | | 4.36 | | | | 0.87 | | |
Class R | | | 1,000.00 | | | | 1,000.00 | | | | 1,064.00 | | | | 1,017.36 | | | | 7.68 | | | | 7.50 | | | | 1.50 | | |
Class R4 | | | 1,000.00 | | | | 1,000.00 | | | | 1,108.90 | * | | | 1,019.84 | | | | 3.21 | * | | | 5.01 | | | | 1.00 | * | |
Class R5 | | | 1,000.00 | | | | 1,000.00 | | | | 1,109.20 | * | | | 1,020.38 | | | | 2.85 | * | | | 4.46 | | | | 0.89 | * | |
Class W | | | 1,000.00 | | | | 1,000.00 | | | | 1,064.80 | | | | 1,018.60 | | | | 6.40 | | | | 6.26 | | | | 1.25 | | |
Class Z | | | 1,000.00 | | | | 1,000.00 | | | | 1,066.20 | | | | 1,019.84 | | | | 5.12 | | | | 5.01 | | | | 1.00 | | |
*For the period November 8, 2012 through February 28, 2013. Class R4 and Class R5 shares commenced operations on November 8, 2012.
Expenses paid during the period are equal to the annualized expense ratio for each class as indicated above, multiplied by the average account value over the period and then multiplied by the number of days in the Fund's most recent fiscal half year and divided by 365.
Expenses do not include fees and expenses incurred indirectly by the Fund from the underlying funds in which the Fund may invest (also referred to as "acquired funds"), including affiliated and non-affiliated pooled investment vehicles (including mutual funds and exchange-traded funds).
Had Columbia Management Investment Advisers, LLC and/or certain of its affiliates not waived/reimbursed certain fees and expenses, account value at the end of the period would have been reduced.
Annual Report 2013
6
Columbia Marsico Growth Fund
Portfolio of Investments
February 28, 2013
(Percentages represent value of investments compared to net assets)
Common Stocks 99.1%
Issuer | | Shares | | Value ($) | |
Consumer Discretionary 34.1% | |
Hotels, Restaurants & Leisure 11.2% | |
Chipotle Mexican Grill, Inc.(a) | | | 77,091 | | | | 24,421,658 | | |
McDonald's Corp. | | | 442,877 | | | | 42,471,904 | | |
Starbucks Corp. | | | 593,254 | | | | 32,522,184 | | |
Starwood Hotels & Resorts
Worldwide, Inc. | | | 1,158,984 | | | | 69,921,505 | | |
Wynn Resorts Ltd. | | | 526,499 | | | | 61,547,733 | | |
Yum! Brands, Inc. | | | 164,446 | | | | 10,767,924 | | |
Total | | | | | 241,652,908 | | |
Internet & Catalog Retail 2.2% | |
priceline.com, Inc.(a) | | | 68,969 | | | | 47,421,705 | | |
Media 6.4% | |
CBS Corp., Class B Non Voting | | | 1,439,982 | | | | 62,480,819 | | |
Comcast Corp., Class A | | | 1,130,295 | | | | 44,974,438 | | |
Liberty Global, Inc., Class A(a) | | | 437,731 | | | | 30,155,289 | | |
Total | | | | | 137,610,546 | | |
Specialty Retail 11.5% | |
AutoZone, Inc.(a) | | | 152,795 | | | | 58,085,019 | | |
Foot Locker, Inc. | | | 323,091 | | | | 11,046,481 | | |
GNC Holdings, Inc., Class A | | | 560,447 | | | | 22,978,327 | | |
Home Depot, Inc. (The) | | | 653,513 | | | | 44,765,641 | | |
Lowe's Companies, Inc. | | | 1,720,629 | | | | 65,641,996 | | |
TJX Companies, Inc. | | | 981,338 | | | | 44,130,770 | | |
Total | | | | | 246,648,234 | | |
Textiles, Apparel & Luxury Goods 2.8% | |
lululemon athletica, Inc.(a) | | | 242,587 | | | | 16,265,458 | | |
Nike, Inc., Class B | | | 793,743 | | | | 43,227,244 | | |
Total | | | | | 59,492,702 | | |
Total Consumer Discretionary | | | | | 732,826,095 | | |
Consumer Staples 2.0% | |
Food & Staples Retailing 2.0% | |
Wal-Mart Stores, Inc. | | | 598,184 | | | | 42,339,464 | | |
Total Consumer Staples | | | | | 42,339,464 | | |
Energy 4.7% | |
Energy Equipment & Services 3.2% | |
Schlumberger Ltd. | | | 891,220 | | | | 69,381,477 | | |
Common Stocks (continued)
Issuer | | Shares | | Value ($) | |
Oil, Gas & Consumable Fuels 1.5% | |
Kinder Morgan, Inc. | | | 863,547 | | | | 32,011,687 | | |
Total Energy | | | | | 101,393,164 | | |
Financials 9.3% | |
Commercial Banks 3.1% | |
Wells Fargo & Co. | | | 1,893,677 | | | | 66,430,189 | | |
Consumer Finance 1.0% | |
American Express Co. | | | 345,751 | | | | 21,488,425 | | |
Diversified Financial Services 2.7% | |
Citigroup, Inc. | | | 1,360,252 | | | | 57,089,776 | | |
Insurance 0.6% | |
American International Group, Inc.(a) | | | 335,482 | | | | 12,751,671 | | |
Real Estate Investment Trusts (REITs) 1.9% | |
American Tower Corp. | | | 524,770 | | | | 40,722,152 | | |
Total Financials | | | | | 198,482,213 | | |
Health Care 15.3% | |
Biotechnology 9.4% | |
Biogen Idec, Inc.(a) | | | 521,726 | | | | 86,783,903 | | |
Celgene Corp.(a) | | | 114,667 | | | | 11,831,341 | | |
Gilead Sciences, Inc.(a) | | | 2,402,075 | | | | 102,592,623 | | |
Total | | | | | 201,207,867 | | |
Health Care Equipment & Supplies 1.8% | |
Intuitive Surgical, Inc.(a) | | | 78,328 | | | | 39,938,664 | | |
Pharmaceuticals 4.1% | |
Bristol-Myers Squibb Co. | | | 2,381,966 | | | | 88,061,283 | | |
Total Health Care | | | | | 329,207,814 | | |
Industrials 13.4% | |
Aerospace & Defense 3.4% | |
Precision Castparts Corp. | | | 271,668 | | | | 50,690,532 | | |
Rolls-Royce Holdings PLC | | | 1,494,863 | | | | 23,254,439 | | |
Total | | | | | 73,944,971 | | |
Industrial Conglomerates 1.2% | |
Danaher Corp. | | | 429,383 | | | | 26,449,993 | | |
Machinery 3.6% | |
Cummins, Inc. | | | 192,619 | | | | 22,318,763 | | |
Pentair Ltd. | | | 1,028,004 | | | | 54,761,773 | | |
Total | | | | | 77,080,536 | | |
The accompanying Notes to Financial Statements are an integral part of this statement.
Annual Report 2013
7
Columbia Marsico Growth Fund
Portfolio of Investments (continued)
February 28, 2013
Common Stocks (continued)
Issuer | | Shares | | Value ($) | |
Road & Rail 2.1% | |
Union Pacific Corp. | | | 326,547 | | | | 44,772,859 | | |
Trading Companies & Distributors 3.1% | |
United Rentals, Inc.(a) | | | 219,425 | | | | 11,719,489 | | |
WW Grainger, Inc. | | | 238,754 | | | | 54,068,231 | | |
Total | | | | | 65,787,720 | | |
Total Industrials | | | | | 288,036,079 | | |
Information Technology 15.3% | |
Communications Equipment 1.6% | |
Motorola Solutions, Inc. | | | 194,761 | | | | 12,116,082 | | |
QUALCOMM, Inc. | | | 336,638 | | | | 22,093,552 | | |
Total | | | | | 34,209,634 | | |
Internet Software & Services 9.1% | |
eBay, Inc.(a) | | | 1,550,161 | | | | 84,762,803 | | |
Equinix, Inc.(a) | | | 178,418 | | | | 37,744,328 | | |
Google, Inc., Class A(a) | | | 89,758 | | | | 71,914,110 | | |
Total | | | | | 194,421,241 | | |
IT Services 3.9% | |
Accenture PLC, Class A | | | 299,490 | | | | 22,270,076 | | |
Visa, Inc., Class A | | | 383,412 | | | | 60,824,480 | | |
Total | | | | | 83,094,556 | | |
Software 0.7% | |
Intuit, Inc. | | | 243,097 | | | | 15,674,894 | | |
Total Information Technology | | | | | 327,400,325 | | |
Common Stocks (continued)
Issuer | | Shares | | Value ($) | |
Materials 5.0% | |
Chemicals 5.0% | |
LyondellBasell Industries NV, Class A | | | 776,859 | | | | 45,539,475 | | |
Monsanto Co. | | | 609,696 | | | | 61,597,587 | | |
Total | | | | | 107,137,062 | | |
Total Materials | | | | | 107,137,062 | | |
Total Common Stocks
(Cost: $1,660,348,012) | | | | | 2,126,822,216 | | |
Preferred Stocks —% | |
Financials —% | |
Commercial Banks —% | |
Wells Fargo & Co., 8.000% | | | 14,678 | | | | 427,130 | | |
Total Financials | | | | | 427,130 | | |
Total Preferred Stocks
(Cost: $279,319) | | | | | 427,130 | | |
Money Market Funds 1.9% | |
Columbia Short-Term Cash Fund,
0.128%(b)(c) | | | 40,312,087 | | | | 40,312,087 | | |
Total Money Market Funds
(Cost: $40,312,087) | | | | | 40,312,087 | | |
Total Investments
(Cost: $1,700,939,418) | | | | | 2,167,561,433 | | |
Other Assets & Liabilities, Net | | | | | (21,386,881 | ) | |
Net Assets | | | | | 2,146,174,552 | | |
Notes to Portfolio of Investments
(a) Non-income producing.
(b) As defined in the Investment Company Act of 1940, an affiliated company is one in which the Fund owns 5% or more of its outstanding voting securities, or a company which is under common ownership or control with the Fund. Holdings and transactions in these affiliated companies during the year ended February 28, 2013, are as follows:
Issuer | | Beginning
Cost ($) | | Purchase
Cost ($) | | Proceeds
From Sales ($) | | Ending
Cost ($) | | Dividends —
Affiliated
Issuers ($) | | Value ($) | |
Columbia Short-Term Cash Fund | | | 43,906,157 | | | | 1,968,497,539 | | | | (1,972,091,609 | ) | | | 40,312,087 | | | | 170,070 | | | | 40,312,087 | | |
(c) The rate shown is the seven-day current annualized yield at February 28, 2013.
The accompanying Notes to Financial Statements are an integral part of this statement.
Annual Report 2013
8
Columbia Marsico Growth Fund
Portfolio of Investments (continued)
February 28, 2013
Fair Value Measurements
Generally accepted accounting principles (GAAP) require disclosure regarding the inputs and valuation techniques used to measure fair value and any changes in valuation inputs or techniques. In addition, investments shall be disclosed by major category.
The Fund categorizes its fair value measurements according to a three-level hierarchy that maximizes the use of observable inputs and minimizes the use of unobservable inputs by prioritizing that the most observable input be used when available. Observable inputs are those that market participants would use in pricing an investment based on market data obtained from sources independent of the reporting entity. Unobservable inputs are those that reflect the Fund's assumptions about the information market participants would use in pricing an investment. An investment's level within the fair value hierarchy is based on the lowest level of any input that is deemed significant to the asset or liability's fair value measurement. The input levels are not necessarily an indication of the risk or liquidity associated with investments at that level. For example, certain U.S. government securities are generally high quality and liquid, however, they are reflected as Level 2 because the inputs used to determine fair value may not always be quoted prices in an active market.
Fair value inputs are summarized in the three broad levels listed below:
> Level 1 — Valuations based on quoted prices for investments in active markets that the Fund has the ability to access at the measurement date (including NAV for open-end mutual funds). Valuation adjustments are not applied to Level 1 investments.
> Level 2 — Valuations based on other significant observable inputs (including quoted prices for similar securities, interest rates, prepayment speeds, credit risks, etc.).
> Level 3 — Valuations based on significant unobservable inputs (including the Fund's own assumptions and judgment in determining the fair value of investments).
Inputs that are used in determining fair value of an investment may include price information, credit data, volatility statistics, and other factors. These inputs can be either observable or unobservable. The availability of observable inputs can vary between investments, and is affected by various factors such as the type of investment, and the volume and level of activity for that investment or similar investments in the marketplace. The inputs will be considered by the Investment Manager, along with any other relevant factors in the calculation of an investment's fair value. The Fund uses prices and inputs that are current as of the measurement date, which may include periods of market dislocations. During these periods, the availability of prices and inputs may be reduced for many investments. This condition could cause an investment to be reclassified between the various levels within the hierarchy.
Foreign equity securities actively traded in markets where there is a significant delay in the local close relative to the New York Stock Exchange (NYSE) are classified as Level 2. The values of these securities may include an adjustment to reflect the impact of significant market movements following the close of local trading, as described in Note 2 to the financial statements — Security Valuation.
Investments falling into the Level 3 category are primarily supported by quoted prices from brokers and dealers participating in the market for those investments. However, these may be classified as Level 3 investments due to lack of market transparency and corroboration to support these quoted prices. Additionally, valuation models may be used as the pricing source for any remaining investments classified as Level 3. These models rely on one or more significant unobservable inputs and/or significant assumptions by the Investment Manager. Inputs used in valuations may include, but are not limited to, financial statement analysis, capital account balances, discount rates and estimated cash flows, and comparable company data.
Under the direction of the Fund's Board of Trustees (the Board), the Investment Manager's Valuation Committee (the Committee) is responsible for carrying out the valuation procedures approved by the Board. The Committee consists of voting and non-voting members from various groups within the Investment Manager's organization, including operations and accounting, trading and investments, compliance, risk management and legal.
The Committee meets at least monthly to review and approve valuation matters, which may include a description of specific valuation determinations, data regarding pricing information received from approved pricing vendors and brokers and the results of Board-approved valuation control policies and procedures (the Policies). The Policies address, among other things, instances when market quotations are readily available, including recommendations of third party pricing vendors and a determination of appropriate pricing methodologies; events that require specific valuation determinations and assessment of fair value techniques; securities with a potential for stale pricing, including those that are illiquid, restricted, or in default; and the effectiveness of third- party pricing vendors, including periodic reviews of vendors. The Committee meets more frequently, as needed, to discuss additional valuation matters, which may include the need to review back-testing results, review time-sensitive information or approve related valuation actions. The Committee reports to the Board, with members of the Committee meeting with the Board at each of its regularly scheduled meetings to discuss valuation matters and actions during the period, similar to those described earlier.
For investments categorized as Level 3, the Committee monitors information similar to that described above, which may include: (i) data specific to the issuer or comparable issuers, (ii) general market or specific sector news and (iii) quoted prices and specific or similar security transactions. The Committee considers this data and any changes from prior periods in order to assess the reasonableness of observable and unobservable inputs, any assumptions or internal models used to value those securities and changes in fair value. This data is also used to corroborate, when available, information received from approved pricing vendors and brokers. Various factors impact the frequency of monitoring this information (which may occur as often as daily). However, the Committee may determine that changes to inputs, assumptions and models are not required as a result of the monitoring procedures performed.
The accompanying Notes to Financial Statements are an integral part of this statement.
Annual Report 2013
9
Columbia Marsico Growth Fund
Portfolio of Investments (continued)
February 28, 2013
Fair Value Measurements (continued)
The following table is a summary of the inputs used to value the Fund's investments at February 28, 2013:
Description | | Level 1
Quoted Prices in Active
Markets for Identical
Assets ($) | | Level 2
Other Significant
Observable Inputs ($) | | Level 3
Significant
Unobservable Inputs ($) | | Total ($) | |
Equity Securities | |
Common Stocks | |
Consumer Discretionary | | | 732,826,095 | | | | — | | | | — | | | | 732,826,095 | | |
Consumer Staples | | | 42,339,464 | | | | — | | | | — | | | | 42,339,464 | | |
Energy | | | 101,393,164 | | | | — | | | | — | | | | 101,393,164 | | |
Financials | | | 198,482,213 | | | | — | | | | — | | | | 198,482,213 | | |
Health Care | | | 329,207,814 | | | | — | | | | — | | | | 329,207,814 | | |
Industrials | | | 264,781,640 | | | | 23,254,439 | | | | — | | | | 288,036,079 | | |
Information Technology | | | 327,400,325 | | | | — | | | | — | | | | 327,400,325 | | |
Materials | | | 107,137,062 | | | | — | | | | — | | | | 107,137,062 | | |
Preferred Stocks | |
Financials | | | 427,130 | | | | — | | | | — | | | | 427,130 | | |
Total Equity Securities | | | 2,103,994,907 | | | | 23,254,439 | | | | — | | | | 2,127,249,346 | | |
Other | |
Money Market Funds | | | 40,312,087 | | | | — | | | | — | | | | 40,312,087 | | |
Total Other | | | 40,312,087 | | | | — | | | | — | | | | 40,312,087 | | |
Total | | | 2,144,306,994 | | | | 23,254,439 | | | | — | | | | 2,167,561,433 | | |
See the Portfolio of Investments for all investment classifications not indicated in the table.
The Fund's assets assigned to the Level 2 input category are generally valued using the market approach, in which a security's value is determined through reference to prices and information from market transactions for similar or identical assets. These assets include certain foreign securities for which a third party statistical pricing service may be employed for purposes of fair market valuation. The models utilized by the third party statistical pricing service take into account a security's correlation to available market data including, but not limited to, intraday index, ADR, and ETF movements.
There were no transfers of financial assets between Levels 1 and 2 during the period.
The accompanying Notes to Financial Statements are an integral part of this statement.
Annual Report 2013
10
Columbia Marsico Growth Fund
Statement of Assets and Liabilities
February 28, 2013
Assets | |
Investments, at value | |
Unaffiliated issuers (identified cost $1,660,627,331) | | $ | 2,127,249,346 | | |
Affiliated issuers (identified cost $40,312,087) | | | 40,312,087 | | |
Total investments (identified cost $1,700,939,418) | | | 2,167,561,433 | | |
Receivable for: | |
Investments sold | | | 24,377,167 | | |
Capital shares sold | | | 991,579 | | |
Dividends | | | 2,373,527 | | |
Prepaid expenses | | | 8,054 | | |
Total assets | | | 2,195,311,760 | | |
Liabilities | |
Payable for: | |
Investments purchased | | | 26,765,513 | | |
Capital shares purchased | | | 21,160,177 | | |
Investment management fees | | | 37,780 | | |
Distribution and/or service fees | | | 12,475 | | |
Transfer agent fees | | | 778,667 | | |
Administration fees | | | 3,177 | | |
Compensation of board members | | | 163,332 | | |
Expense reimbursement due to Investment Manager | | | 921 | | |
Other expenses | | | 215,166 | | |
Total liabilities | | | 49,137,208 | | |
Net assets applicable to outstanding capital stock | | $ | 2,146,174,552 | | |
Represented by | |
Paid-in capital | | $ | 1,588,733,982 | | |
Excess of distributions over net investment income | | | (156,749 | ) | |
Accumulated net realized gain | | | 90,975,304 | | |
Unrealized appreciation (depreciation) on: | |
Investments | | | 466,622,015 | | |
Total — representing net assets applicable to outstanding capital stock | | $ | 2,146,174,552 | | |
The accompanying Notes to Financial Statements are an integral part of this statement.
Annual Report 2013
11
Columbia Marsico Growth Fund
Statement of Assets and Liabilities (continued)
February 28, 2013
Class A | |
Net assets | | $ | 593,793,822 | | |
Shares outstanding | | | 25,069,663 | | |
Net asset value per share | | $ | 23.69 | | |
Maximum offering price per share(a) | | $ | 25.14 | | |
Class B | |
Net assets | | $ | 18,658,940 | | |
Shares outstanding | | | 874,954 | | |
Net asset value per share | | $ | 21.33 | | |
Class C | |
Net assets | | $ | 276,437,248 | | |
Shares outstanding | | | 12,945,321 | | |
Net asset value per share | | $ | 21.35 | | |
Class I | |
Net assets | | $ | 3,303 | | |
Shares outstanding | | | 137 | | |
Net asset value per share(b) | | $ | 24.17 | | |
Class R | |
Net assets | | $ | 19,530,458 | | |
Shares outstanding | | | 836,185 | | |
Net asset value per share | | $ | 23.36 | | |
Class R4 | |
Net assets | | $ | 65,643 | | |
Shares outstanding | | | 2,686 | | |
Net asset value per share | | $ | 24.44 | | |
Class R5 | |
Net assets | | $ | 2,758 | | |
Shares outstanding | | | 113 | | |
Net asset value per share(b) | | $ | 24.43 | | |
Class W | |
Net assets | | $ | 3,294 | | |
Shares outstanding | | | 139 | | |
Net asset value per share(b) | | $ | 23.69 | | |
Class Z | |
Net assets | | $ | 1,237,679,086 | | |
Shares outstanding | | | 51,299,998 | | |
Net asset value per share | | $ | 24.13 | | |
(a) The maximum offering price per share is calculated by dividing the net asset value by 1.0 minus the maximum sales charge of 5.75%.
(b) Net asset value per share rounds to this amount due to fractional shares outstanding.
The accompanying Notes to Financial Statements are an integral part of this statement.
Annual Report 2013
12
Columbia Marsico Growth Fund
Statement of Operations
Year Ended February 28, 2013
Net investment income | |
Income: | |
Dividends — unaffiliated issuers | | $ | 39,242,827 | | |
Dividends — affiliated issuers | | | 170,070 | | |
Interest | | | 284 | | |
Income from securities lending — net | | | 337,698 | | |
Foreign taxes withheld | | | (616,978 | ) | |
Total income | | | 39,133,901 | | |
Expenses: | |
Investment management fees | | | 17,356,927 | | |
Distribution and/or service fees | |
Class A | | | 1,619,044 | | |
Class B | | | 229,932 | | |
Class C | | | 2,998,685 | | |
Class R | | | 102,012 | | |
Class W | | | 8 | | |
Transfer agent fees | |
Class A | | | 1,384,714 | | |
Class B | | | 49,251 | | |
Class C | | | 641,865 | | |
Class R | | | 43,627 | | |
Class R4(a) | | | 1 | | |
Class W | | | 7 | | |
Class Z | | | 3,512,848 | | |
Administration fees | | | 5,475,810 | | |
Compensation of board members | | | 89,100 | | |
Custodian fees | | | 29,244 | | |
Printing and postage fees | | | 437,345 | | |
Registration fees | | | 212,347 | | |
Professional fees | | | 55,794 | | |
Other | | | 86,774 | | |
Total expenses | | | 34,325,335 | | |
Fees waived or expenses reimbursed by Investment Manager and its affiliates | | | (2,313,639 | ) | |
Expense reductions | | | (2,965 | ) | |
Total net expenses | | | 32,008,731 | | |
Net investment income | | | 7,125,170 | | |
Realized and unrealized gain (loss) — net | |
Net realized gain (loss) on: | |
Investments | | | 611,493,259 | | |
Foreign currency translations | | | (10,131 | ) | |
Net realized gain | | | 611,483,128 | | |
Net change in unrealized appreciation (depreciation) on: | |
Investments | | | (474,435,054 | ) | |
Net change in unrealized appreciation (depreciation) | | | (474,435,054 | ) | |
Net realized and unrealized gain | | | 137,048,074 | | |
Net increase in net assets resulting from operations | | $ | 144,173,244 | | |
(a) For the period from November 8, 2012 (commencement of operations) to February 28, 2013.
The accompanying Notes to Financial Statements are an integral part of this statement.
Annual Report 2013
13
Columbia Marsico Growth Fund
Statement of Changes in Net Assets
| | | Year Ended
February 28,
2013(a) | | Year Ended
February 29,
2012 | |
Operations | |
Net investment income | | $ | 7,125,170 | | | $ | 5,080,417 | | |
Net realized gain | | | 611,483,128 | | | | 285,743,025 | | |
Net change in unrealized appreciation (depreciation) | | | (474,435,054 | ) | | | (152,622,301 | ) | |
Net increase in net assets resulting from operations | | | 144,173,244 | | | | 138,201,141 | | |
Distributions to shareholders | |
Net investment income | |
Class A | | | (1,780,654 | ) | | | — | | |
Class I | | | (30 | ) | | | — | | |
Class R | | | (4,564 | ) | | | — | | |
Class R4 | | | (12 | ) | | | — | | |
Class R5 | | | (13 | ) | | | — | | |
Class W | | | (10 | ) | | | — | | |
Class Z | | | (10,566,047 | ) | | | — | | |
Total distributions to shareholders | | | (12,351,330 | ) | | | — | | |
Increase (decrease) in net assets from capital stock activity | | | (1,201,164,689 | ) | | | (471,969,904 | ) | |
Total decrease in net assets | | | (1,069,342,775 | ) | | | (333,768,763 | ) | |
Net assets at beginning of year | | | 3,215,517,327 | | | | 3,549,286,090 | | |
Net assets at end of year | | $ | 2,146,174,552 | | | $ | 3,215,517,327 | | |
Undistributed (excess of distributions over) net investment income | | $ | (156,749 | ) | | $ | 5,079,542 | | |
(a) Class R4 and Class R5 shares are for the period from November 8, 2012 (commencement of operations) to February 28, 2013.
The accompanying Notes to Financial Statements are an integral part of this statement.
Annual Report 2013
14
Columbia Marsico Growth Fund
Statement of Changes in Net Assets (continued)
| | | Year Ended February 28, 2013(a) | | Year Ended February 29, 2012 | |
| | | Shares | | Dollars ($) | | Shares | | Dollars ($) | |
Capital stock activity | |
Class A shares | |
Subscriptions(b) | | | 2,514,851 | | | | 56,427,371 | | | | 5,762,153 | | | | 117,329,302 | | |
Distributions reinvested | | | 67,517 | | | | 1,489,735 | | | | — | | | | — | | |
Redemptions | | | (10,263,560 | ) | | | (230,701,898 | ) | | | (21,227,889 | ) | | | (438,105,302 | ) | |
Net decrease | | | (7,681,192 | ) | | | (172,784,792 | ) | | | (15,465,736 | ) | | | (320,776,000 | ) | |
Class B shares | |
Subscriptions | | | 14,345 | | | | 292,426 | | | | 28,105 | | | | 533,083 | | |
Redemptions(b) | | | (482,875 | ) | | | (9,839,116 | ) | | | (842,848 | ) | | | (15,772,245 | ) | |
Net decrease | | | (468,530 | ) | | | (9,546,690 | ) | | | (814,743 | ) | | | (15,239,162 | ) | |
Class C shares | |
Subscriptions | | | 529,146 | | | | 10,734,279 | | | | 745,332 | | | | 14,022,626 | | |
Redemptions | | | (3,968,353 | ) | | | (80,319,452 | ) | | | (4,551,349 | ) | | | (85,153,704 | ) | |
Net decrease | | | (3,439,207 | ) | | | (69,585,173 | ) | | | (3,806,017 | ) | | | (71,131,078 | ) | |
Class I shares | |
Subscriptions | | | — | | | | — | | | | 748,324 | | | | 14,748,479 | | |
Redemptions | | | — | | | | — | | | | (1,268,025 | ) | | | (26,235,246 | ) | |
Net decrease | | | — | | | | — | | | | (519,701 | ) | | | (11,486,767 | ) | |
Class R shares | |
Subscriptions | | | 225,764 | | | | 4,962,159 | | | | 395,608 | | | | 8,029,454 | | |
Distributions reinvested | | | 187 | | | | 4,065 | | | | — | | | | — | | |
Redemptions | | | (354,540 | ) | | | (7,840,576 | ) | | | (412,020 | ) | | | (8,328,400 | ) | |
Net decrease | | | (128,589 | ) | | | (2,874,352 | ) | | | (16,412 | ) | | | (298,946 | ) | |
Class R4 shares | |
Subscriptions | | | 2,686 | | | | 65,383 | | | | — | | | | — | | |
Net increase | | | 2,686 | | | | 65,383 | | | | — | | | | — | | |
Class R5 shares | |
Subscriptions | | | 113 | | | | 2,500 | | | | — | | | | — | | |
Net increase | | | 113 | | | | 2,500 | | | | — | | | | — | | |
Class Z shares | |
Subscriptions | | | 20,275,822 | | | | 465,764,921 | | | | 27,905,610 | | | | 591,479,176 | | |
Distributions reinvested | | | 346,104 | | | | 7,778,747 | | | | — | | | | — | | |
Redemptions | | | (62,160,960 | ) | | | (1,419,985,233 | ) | | | (30,752,853 | ) | | | (644,517,127 | ) | |
Net decrease | | | (41,539,034 | ) | | | (946,441,565 | ) | | | (2,847,243 | ) | | | (53,037,951 | ) | |
Total net decrease | | | (53,253,753 | ) | | | (1,201,164,689 | ) | | | (23,469,852 | ) | | | (471,969,904 | ) | |
(a) Class R4 and Class R5 shares are for the period from November 8, 2012 (commencement of operations) to February 28, 2013.
(b) Includes conversions of Class B shares to Class A shares, if any.
The accompanying Notes to Financial Statements are an integral part of this statement.
Annual Report 2013
15
Columbia Marsico Growth Fund
The following tables are intended to help you understand the Fund's financial performance. Certain information reflects financial results for a single share of a class held for the periods shown. Per share net investment income (loss) amounts are calculated based on average shares outstanding during the period. Total return assumes reinvestment of all dividends and distributions, if any. Total return does not reflect payment of sales charges, if any, and is not annualized for periods of less than one year.
| | | Year Ended
February 28, | | Year Ended
February 29, | | Year Ended February 28, | |
Class A | | 2013 | | 2012 | | 2011 | | 2010 | | 2009(a)(b) | |
Per share data | |
Net asset value, beginning of period | | $ | 22.25 | | | $ | 21.19 | | | $ | 16.75 | | | $ | 11.30 | | | $ | 20.26 | | |
Income from investment operations: | |
Net investment income (loss) | | | 0.05 | | | | 0.02 | | | | (0.01 | ) | | | 0.03 | | | | 0.06 | | |
Net realized and unrealized gain (loss) | | | 1.45 | | | | 1.04 | | | | 4.45 | | | | 5.50 | | | | (9.01 | ) | |
Total from investment operations | | | 1.50 | | | | 1.06 | | | | 4.44 | | | | 5.53 | | | | (8.95 | ) | |
Less distributions to shareholders: | |
Net investment income | | | (0.06 | ) | | | — | | | | — | | | | (0.08 | ) | | | (0.01 | ) | |
Total distributions to shareholders | | | (0.06 | ) | | | — | | | | — | | | | (0.08 | ) | | | (0.01 | ) | |
Proceeds from regulatory settlements | | | — | | | | — | | | | 0.00 | (c) | | | 0.00 | (c) | | | — | | |
Net asset value, end of period | | $ | 23.69 | | | $ | 22.25 | | | $ | 21.19 | | | $ | 16.75 | | | $ | 11.30 | | |
Total return | | | 6.78 | % | | | 5.00 | % | | | 26.51 | % | | | 49.09 | % | | | (44.21 | %) | |
Ratios to average net assets(d)(e) | |
Total gross expenses | | | 1.36 | % | | | 1.33 | %(f) | | | 1.30 | %(f) | | | 1.28 | %(f) | | | 1.26 | % | |
Total net expenses(g) | | | 1.26 | %(h) | | | 1.28 | %(f)(h) | | | 1.30 | %(f)(h) | | | 1.28 | %(f)(h) | | | 1.24 | %(h) | |
Net investment income (loss) | | | 0.24 | % | | | 0.08 | % | | | (0.05 | %) | | | 0.23 | % | | | 0.36 | % | |
Supplemental data | |
Net assets, end of period (in thousands) | | $ | 593,794 | | | $ | 728,788 | | | $ | 1,021,724 | | | $ | 1,569,860 | | | $ | 1,383,438 | | |
Portfolio turnover | | | 90 | % | | | 65 | % | | | 67 | % | | | 69 | % | | | 21 | %(i) | |
Turnover of Columbia Marsico Growth Master Portfolio | | | — | | | | — | | | | — | | | | — | | | | 54 | % | |
Notes to Financial Highlights
(a) The per share amounts and percentages reflect income and expenses assuming inclusion of the Fund's proportionate share of the income and expenses of Columbia Marsico Growth Master Portfolio.
(b) Effective November 10, 2008, the Fund converted to a stand-alone fund. Prior to November 10, 2008, the Fund operated in a master-feeder structure.
(c) Rounds to zero.
(d) In addition to the fees and expenses which the Fund bears directly, the Fund indirectly bears a pro rata share of the fees and expenses of the acquired funds in which it invests. Such indirect expenses are not included in the reported expense ratios.
(e) Certain line items from prior years have been reclassified to conform to the current presentation.
(f) Includes interest expense which rounds to less than 0.01%.
(g) Total net expenses include the impact of certain waivers/reimbursements made by the Investment Manager and certain of its affiliates, if applicable.
(h) The benefits derived from expense reductions had an impact of less than 0.01%.
(i) Amount represents results after the Fund's conversion to a stand-alone structure on November 10, 2008.
The accompanying Notes to Financial Statements are an integral part of this statement.
Annual Report 2013
16
Columbia Marsico Growth Fund
Financial Highlights (continued)
| | | Year Ended
February 28, | | Year Ended
February 29, | | Year Ended February 28, | |
Class B | | 2013 | | 2012 | | 2011 | | 2010 | | 2009(a)(b) | |
Per share data | |
Net asset value, beginning of period | | $ | 20.13 | | | $ | 19.31 | | | $ | 15.38 | | | $ | 10.42 | | | $ | 18.83 | | |
Income from investment operations: | |
Net investment loss | | | (0.10 | ) | | | (0.13 | ) | | | (0.13 | ) | | | (0.07 | ) | | | (0.06 | ) | |
Net realized and unrealized gain (loss) | | | 1.30 | | | | 0.95 | | | | 4.06 | | | | 5.07 | | | | (8.35 | ) | |
Total from investment operations | | | 1.20 | | | | 0.82 | | | | 3.93 | | | | 5.00 | | | | (8.41 | ) | |
Less distributions to shareholders: | |
Net investment income | | | — | | | | — | | | | — | | | | (0.04 | ) | | | — | | |
Total distributions to shareholders | | | — | | | | — | | | | — | | | | (0.04 | ) | | | — | | |
Proceeds from regulatory settlements | | | — | | | | — | | | | 0.00 | (c) | | | 0.00 | (c) | | | — | | |
Net asset value, end of period | | $ | 21.33 | | | $ | 20.13 | | | $ | 19.31 | | | $ | 15.38 | | | $ | 10.42 | | |
Total return | | | 5.96 | % | | | 4.25 | % | | | 25.55 | % | | | 48.10 | % | | | (44.66 | %) | |
Ratios to average net assets(d)(e) | |
Total gross expenses | | | 2.10 | % | | | 2.09 | %(f) | | | 2.05 | %(f) | | | 2.03 | %(f) | | | 2.01 | % | |
Total net expenses(g) | | | 2.01 | %(h) | | | 2.03 | %(f)(h) | | | 2.05 | %(f)(h) | | | 2.03 | %(f)(h) | | | 1.99 | %(h) | |
Net investment loss | | | (0.52 | %) | | | (0.68 | %) | | | (0.78 | %) | | | (0.52 | %) | | | (0.39 | %) | |
Supplemental data | |
Net assets, end of period (in thousands) | | $ | 18,659 | | | $ | 27,041 | | | $ | 41,675 | | | $ | 47,847 | | | $ | 44,407 | | |
Portfolio turnover | | | 90 | % | | | 65 | % | | | 67 | % | | | 69 | % | | | 21 | %(i) | |
Turnover of Columbia Marsico Growth Master Portfolio | | | — | | | | — | | | | — | | | | — | | | | 54 | % | |
Notes to Financial Highlights
(a) The per share amounts and percentages reflect income and expenses assuming inclusion of the Fund's proportionate share of the income and expenses of Columbia Marsico Growth Master Portfolio.
(b) Effective November 10, 2008, the Fund converted to a stand-alone fund. Prior to November 10, 2008, the Fund operated in a master-feeder structure.
(c) Rounds to zero.
(d) In addition to the fees and expenses which the Fund bears directly, the Fund indirectly bears a pro rata share of the fees and expenses of the acquired funds in which it invests. Such indirect expenses are not included in the reported expense ratios.
(e) Certain line items from prior years have been reclassified to conform to the current presentation.
(f) Includes interest expense which rounds to less than 0.01%.
(g) Total net expenses include the impact of certain waivers/reimbursements made by the Investment Manager and certain of its affiliates, if applicable.
(h) The benefits derived from expense reductions had an impact of less than 0.01%.
(i) Amount represents results after the Fund's conversion to a stand-alone structure on November 10, 2008.
The accompanying Notes to Financial Statements are an integral part of this statement.
Annual Report 2013
17
Columbia Marsico Growth Fund
Financial Highlights (continued)
| | | Year Ended
February 28, | | Year Ended
February 29, | | Year Ended February 28, | |
Class C | | 2013 | | 2012 | | 2011 | | 2010 | | 2009(a)(b) | |
Per share data | |
Net asset value, beginning of period | | $ | 20.15 | | | $ | 19.34 | | | $ | 15.40 | | | $ | 10.44 | | | $ | 18.86 | | |
Income from investment operations: | |
Net investment loss | | | (0.10 | ) | | | (0.13 | ) | | | (0.13 | ) | | | (0.07 | ) | | | (0.06 | ) | |
Net realized and unrealized gain (loss) | | | 1.30 | | | | 0.94 | | | | 4.07 | | | | 5.07 | | | | (8.36 | ) | |
Total from investment operations | | | 1.20 | | | | 0.81 | | | | 3.94 | | | | 5.00 | | | | (8.42 | ) | |
Less distributions to shareholders: | |
Net investment income | | | — | | | | — | | | | — | | | | (0.04 | ) | | | — | | |
Total distributions to shareholders | | | — | | | | — | | | | — | | | | (0.04 | ) | | | — | | |
Proceeds from regulatory settlements | | | — | | | | — | | | | 0.00 | (c) | | | 0.00 | (c) | | | — | | |
Net asset value, end of period | | $ | 21.35 | | | $ | 20.15 | | | $ | 19.34 | | | $ | 15.40 | | | $ | 10.44 | | |
Total return | | | 5.96 | % | | | 4.19 | % | | | 25.58 | % | | | 48.00 | % | | | (44.64 | %) | |
Ratios to average net assets(d)(e) | |
Total gross expenses | | | 2.10 | % | | | 2.09 | %(f) | | | 2.05 | %(f) | | | 2.03 | %(f) | | | 2.01 | % | |
Total net expenses(g) | | | 2.01 | %(h) | | | 2.03 | %(f)(h) | | | 2.05 | %(f)(h) | | | 2.03 | %(f)(h) | | | 1.99 | %(h) | |
Net investment loss | | | (0.51 | %) | | | (0.67 | %) | | | (0.78 | %) | | | (0.52 | %) | | | (0.39 | %) | |
Supplemental data | |
Net assets, end of period (in thousands) | | $ | 276,437 | | | $ | 330,213 | | | $ | 390,384 | | | $ | 399,082 | | | $ | 384,025 | | |
Portfolio turnover | | | 90 | % | | | 65 | % | | | 67 | % | | | 69 | % | | | 21 | %(i) | |
Turnover of Columbia Marsico Growth Master Portfolio | | | — | | | | — | | | | — | | | | — | | | | 54 | % | |
Notes to Financial Highlights
(a) The per share amounts and percentages reflect income and expenses assuming inclusion of the Fund's proportionate share of the income and expenses of Columbia Marsico Growth Master Portfolio.
(b) Effective November 10, 2008, the Fund converted to a stand-alone fund. Prior to November 10, 2008, the Fund operated in a master-feeder structure.
(c) Rounds to zero.
(d) In addition to the fees and expenses which the Fund bears directly, the Fund indirectly bears a pro rata share of the fees and expenses of the acquired funds in which it invests. Such indirect expenses are not included in the reported expense ratios.
(e) Certain line items from prior years have been reclassified to conform to the current presentation.
(f) Includes interest expense which rounds to less than 0.01%.
(g) Total net expenses include the impact of certain waivers/reimbursements made by the Investment Manager and certain of its affiliates, if applicable.
(h) The benefits derived from expense reductions had an impact of less than 0.01%.
(i) Amount represents results after the Fund's conversion to a stand-alone structure on November 10, 2008.
The accompanying Notes to Financial Statements are an integral part of this statement.
Annual Report 2013
18
Columbia Marsico Growth Fund
Financial Highlights (continued)
Class I | | Year Ended
February 28,
2013 | | Year Ended
February 29,
2012 | | Year Ended
February 28,
2011(a) | |
Per share data | |
Net asset value, beginning of period | | $ | 22.77 | | | $ | 21.55 | | | $ | 18.29 | | |
Income from investment operations: | |
Net investment income | | | 0.15 | | | | 0.13 | | | | 0.01 | | |
Net realized and unrealized gain | | | 1.47 | | | | 1.09 | | | | 3.29 | | |
Total from investment operations | | | 1.62 | | | | 1.22 | | | | 3.30 | | |
Less distributions to shareholders: | |
Net investment income | | | (0.22 | ) | | | — | | | | (0.04 | ) | |
Total distributions to shareholders | | | (0.22 | ) | | | — | | | | (0.04 | ) | |
Net asset value, end of period | | $ | 24.17 | | | $ | 22.77 | | | $ | 21.55 | | |
Total return | | | 7.20 | % | | | 5.66 | % | | | 18.05 | % | |
Ratios to average net assets(b)(c) | |
Total gross expenses | | | 0.87 | % | | | 0.89 | %(d) | | | 0.88 | %(d)(e) | |
Total net expenses(f) | | | 0.87 | % | | | 0.88 | %(d)(g) | | | 0.88 | %(d)(e)(g) | |
Net investment income | | | 0.65 | % | | | 0.64 | % | | | 0.06 | %(e) | |
Supplemental data | |
Net assets, end of period (in thousands) | | $ | 3 | | | $ | 3 | | | $ | 11,201 | | |
Portfolio turnover | | | 90 | % | | | 65 | % | | | 67 | % | |
Notes to Financial Highlights
(a) For the period from September 27, 2010 (commencement of operations) to February 28, 2011.
(b) In addition to the fees and expenses which the Fund bears directly, the Fund indirectly bears a pro rata share of the fees and expenses of the acquired funds in which it invests. Such indirect expenses are not included in the reported expense ratios.
(c) Certain line items from prior years have been reclassified to conform to the current presentation.
(d) Includes interest expense which rounds to less than 0.01%.
(e) Annualized.
(f) Total net expenses include the impact of certain waivers/reimbursements made by the Investment Manager and certain of its affiliates, if applicable.
(g) The benefits derived from expense reductions had an impact of less than 0.01%.
The accompanying Notes to Financial Statements are an integral part of this statement.
Annual Report 2013
19
Columbia Marsico Growth Fund
Financial Highlights (continued)
| | | Year Ended
February 28, | | Year Ended
February 29, | | Year Ended February 28, | |
Class R | | 2013 | | 2012 | | 2011 | | 2010 | | 2009(a)(b) | |
Per share data | |
Net asset value, beginning of period | | $ | 21.94 | | | $ | 20.94 | | | $ | 16.60 | | | $ | 11.20 | | | $ | 20.13 | | |
Income from investment operations: | |
Net investment income (loss) | | | (0.00 | )(c) | | | (0.03 | ) | | | (0.05 | ) | | | (0.00 | )(c) | | | 0.02 | | |
Net realized and unrealized gain (loss) | | | 1.43 | | | | 1.03 | | | | 4.39 | | | | 5.45 | | | | (8.95 | ) | |
Total from investment operations | | | 1.43 | | | | 1.00 | | | | 4.34 | | | | 5.45 | | | | (8.93 | ) | |
Less distributions to shareholders: | |
Net investment income | | | (0.01 | ) | | | — | | | | — | | | | (0.05 | ) | | | — | | |
Total distributions to shareholders | | | (0.01 | ) | | | — | | | | — | | | | (0.05 | ) | | | — | | |
Proceeds from regulatory settlements | | | — | | | | — | | | | 0.00 | (c) | | | 0.00 | (c) | | | — | | |
Net asset value, end of period | | $ | 23.36 | | | $ | 21.94 | | | $ | 20.94 | | | $ | 16.60 | | | $ | 11.20 | | |
Total return | | | 6.50 | % | | | 4.78 | % | | | 26.14 | % | | | 48.79 | % | | | (44.36 | %) | |
Ratios to average net assets(d)(e) | |
Total gross expenses | | | 1.61 | % | | | 1.58 | %(f) | | | 1.55 | %(f) | | | 1.53 | %(f) | | | 1.51 | % | |
Total net expenses(g) | | | 1.51 | %(h) | | | 1.53 | %(f)(h) | | | 1.55 | %(f)(h) | | | 1.53 | %(f)(h) | | | 1.49 | %(h) | |
Net investment income (loss) | | | (0.00 | %)(c) | | | (0.16 | %) | | | (0.27 | %) | | | (0.02 | %) | | | 0.15 | % | |
Supplemental data | |
Net assets, end of period (in thousands) | | $ | 19,530 | | | $ | 21,166 | | | $ | 20,548 | | | $ | 14,848 | | | $ | 9,941 | | |
Portfolio turnover | | | 90 | % | | | 65 | % | | | 67 | % | | | 69 | % | | | 21 | %(i) | |
Turnover of Columbia Marsico Growth Master Portfolio | | | — | | | | — | | | | — | | | | — | | | | 54 | % | |
Notes to Financial Highlights
(a) The per share amounts and percentages reflect income and expenses assuming inclusion of the Fund's proportionate share of the income and expenses of Columbia Marsico Growth Master Portfolio.
(b) Effective November 10, 2008, the Fund converted to a stand-alone fund. Prior to November 10, 2008, the Fund operated in a master-feeder structure.
(c) Rounds to zero.
(d) In addition to the fees and expenses which the Fund bears directly, the Fund indirectly bears a pro rata share of the fees and expenses of the acquired funds in which it invests. Such indirect expenses are not included in the reported expense ratios.
(e) Certain line items from prior years have been reclassified to conform to the current presentation.
(f) Includes interest expense which rounds to less than 0.01%.
(g) Total net expenses include the impact of certain waivers/reimbursements made by the Investment Manager and certain of its affiliates, if applicable.
(h) The benefits derived from expense reductions had an impact of less than 0.01%.
(i) Amount represents results after the Fund's conversion to a stand-alone structure on November 10, 2008.
The accompanying Notes to Financial Statements are an integral part of this statement.
Annual Report 2013
20
Columbia Marsico Growth Fund
Financial Highlights (continued)
Class R4 | | Year Ended
February 28,
2013(a) | |
Per share data | |
Net asset value, beginning of period | | $ | 22.14 | | |
Income from investment operations: | |
Net investment income | | | 0.08 | | |
Net realized and unrealized gain | | | 2.32 | | |
Total from investment operations | | | 2.40 | | |
Less distributions to shareholders: | |
Net investment income | | | (0.10 | ) | |
Total distributions to shareholders | | | (0.10 | ) | |
Net asset value, end of period | | $ | 24.44 | | |
Total return | | | 10.89 | % | |
Ratios to average net assets(b) | |
Total gross expenses | | | 1.01 | %(c) | |
Total net expenses(d) | | | 1.00 | %(c) | |
Net investment income | | | 1.11 | %(c) | |
Supplemental data | |
Net assets, end of period (in thousands) | | $ | 66 | | |
Portfolio turnover | | | 90 | % | |
Notes to Financial Highlights
(a) For the period from November 8, 2012 (commencement of operations) to February 28, 2013.
(b) In addition to the fees and expenses which the Fund bears directly, the Fund indirectly bears a pro rata share of the fees and expenses of the acquired funds in which it invests. Such indirect expenses are not included in the reported expense ratios.
(c) Annualized.
(d) Total net expenses include the impact of certain waivers/reimbursements made by the Investment Manager and certain of its affiliates, if applicable.
The accompanying Notes to Financial Statements are an integral part of this statement.
Annual Report 2013
21
Columbia Marsico Growth Fund
Financial Highlights (continued)
Class R5 | | Year Ended
February 28,
2013(a) | |
Per share data | |
Net asset value, beginning of period | | $ | 22.14 | | |
Income from investment operations: | |
Net investment income | | | 0.09 | | |
Net realized and unrealized gain | | | 2.32 | | |
Total from investment operations | | | 2.41 | | |
Less distributions to shareholders: | |
Net investment income | | | (0.12 | ) | |
Total distributions to shareholders | | | (0.12 | ) | |
Net asset value, end of period | | $ | 24.43 | | |
Total return | | | 10.92 | % | |
Ratios to average net assets(b) | |
Total gross expenses | | | 0.89 | %(c) | |
Total net expenses(d) | | | 0.89 | %(c) | |
Net investment income | | | 1.22 | %(c) | |
Supplemental data | |
Net assets, end of period (in thousands) | | $ | 3 | | |
Portfolio turnover | | | 90 | % | |
Notes to Financial Highlights
(a) For the period from November 8, 2012 (commencement of operations) to February 28, 2013.
(b) In addition to the fees and expenses which the Fund bears directly, the Fund indirectly bears a pro rata share of the fees and expenses of the acquired funds in which it invests. Such indirect expenses are not included in the reported expense ratios.
(c) Annualized.
(d) Total net expenses include the impact of certain waivers/reimbursements made by the Investment Manager and certain of its affiliates, if applicable.
The accompanying Notes to Financial Statements are an integral part of this statement.
Annual Report 2013
22
Columbia Marsico Growth Fund
Financial Highlights (continued)
Class W | | Year Ended
February 28,
2013 | | Year Ended
February 29,
2012 | | Year Ended
February 28,
2011(a) | |
Per share data | |
Net asset value, beginning of period | | $ | 22.26 | | | $ | 21.20 | | | $ | 17.98 | | |
Income from investment operations: | |
Net investment income | | | 0.06 | | | | 0.02 | | | | 0.01 | | |
Net realized and unrealized gain | | | 1.44 | | | | 1.04 | | | | 3.21 | | |
Total from investment operations | | | 1.50 | | | | 1.06 | | | | 3.22 | | |
Less distributions to shareholders: | |
Net investment income | | | (0.07 | ) | | | — | | | | — | | |
Total distributions to shareholders | | | (0.07 | ) | | | — | | | | — | | |
Net asset value, end of period | | $ | 23.69 | | | $ | 22.26 | | | $ | 21.20 | | |
Total return | | | 6.76 | % | | | 5.00 | % | | | 17.91 | % | |
Ratios to average net assets(b)(c) | |
Total gross expenses | | | 1.35 | % | | | 1.29 | %(d) | | | 1.28 | %(d)(e) | |
Total net expenses(f) | | | 1.26 | % | | | 1.26 | %(d)(g) | | | 1.28 | %(d)(e)(g) | |
Net investment income | | | 0.25 | % | | | 0.11 | % | | | 0.17 | %(e) | |
Supplemental data | |
Net assets, end of period (in thousands) | | $ | 3 | | | $ | 3 | | | $ | 3 | | |
Portfolio turnover | | | 90 | % | | | 65 | % | | | 67 | % | |
Notes to Financial Highlights
(a) For the period from September 27, 2010 (commencement of operations) to February 28, 2011.
(b) In addition to the fees and expenses which the Fund bears directly, the Fund indirectly bears a pro rata share of the fees and expenses of the acquired funds in which it invests. Such indirect expenses are not included in the reported expense ratios.
(c) Certain line items from prior years have been reclassified to conform to the current presentation.
(d) Includes interest expense which rounds to less than 0.01%.
(e) Annualized.
(f) Total net expenses include the impact of certain waivers/reimbursements made by the Investment Manager and certain of its affiliates, if applicable.
(g) The benefits derived from expense reductions had an impact of less than 0.01%.
The accompanying Notes to Financial Statements are an integral part of this statement.
Annual Report 2013
23
Columbia Marsico Growth Fund
Financial Highlights (continued)
| | | Year Ended
February 28, | | Year Ended
February 29, | | Year Ended February 28, | |
Class Z | | 2013 | | 2012 | | 2011 | | 2010 | | 2009(a)(b) | |
Per share data | |
Net asset value, beginning of period | | $ | 22.71 | | | $ | 21.57 | | | $ | 17.02 | | | $ | 11.47 | | | $ | 20.63 | | |
Income from investment operations: | |
Net investment income | | | 0.10 | | | | 0.07 | | | | 0.04 | | | | 0.07 | | | | 0.11 | | |
Net realized and unrealized gain (loss) | | | 1.48 | | | | 1.07 | | | | 4.52 | | | | 5.60 | | | | (9.17 | ) | |
Total from investment operations | | | 1.58 | | | | 1.14 | | | | 4.56 | | | | 5.67 | | | | (9.06 | ) | |
Less distributions to shareholders: | |
Net investment income | | | (0.16 | ) | | | — | | | | (0.01 | ) | | | (0.12 | ) | | | (0.10 | ) | |
Total distributions to shareholders | | | (0.16 | ) | | | — | | | | (0.01 | ) | | | (0.12 | ) | | | (0.10 | ) | |
Proceeds from regulatory settlements | | | — | | | | — | | | | 0.00 | (c) | | | 0.00 | (c) | | | — | | |
Net asset value, end of period | | $ | 24.13 | | | $ | 22.71 | | | $ | 21.57 | | | $ | 17.02 | | | $ | 11.47 | | |
Total return | | | 7.02 | % | | | 5.29 | % | | | 26.81 | % | | | 49.55 | % | | | (44.09 | %) | |
Ratios to average net assets(d)(e) | |
Total gross expenses | | | 1.10 | % | | | 1.08 | %(f) | | | 1.05 | %(f) | | | 1.03 | %(f) | | | 1.01 | % | |
Total net expenses(g) | | | 1.02 | %(h) | | | 1.03 | %(f)(h) | | | 1.05 | %(f)(h) | | | 1.03 | %(f)(h) | | | 0.99 | %(h) | |
Net investment income | | | 0.43 | % | | | 0.34 | % | | | 0.24 | % | | | 0.48 | % | | | 0.63 | % | |
Supplemental data | |
Net assets, end of period (in thousands) | | $ | 1,237,679 | | | $ | 2,108,304 | | | $ | 2,063,751 | | | $ | 1,676,013 | | | $ | 1,329,782 | | |
Portfolio turnover | | | 90 | % | | | 65 | % | | | 67 | % | | | 69 | % | | | 21 | %(i) | |
Turnover of Columbia Marsico Growth Master Portfolio | | | — | | | | — | | | | — | | | | — | | | | 54 | % | |
Notes to Financial Highlights
(a) The per share amounts and percentages reflect income and expenses assuming inclusion of the Fund's proportionate share of the income and expenses of Columbia Marsico Growth Master Portfolio.
(b) Effective November 10, 2008, the Fund converted to a stand-alone fund. Prior to November 10, 2008, the Fund operated in a master-feeder structure.
(c) Rounds to zero.
(d) In addition to the fees and expenses which the Fund bears directly, the Fund indirectly bears a pro rata share of the fees and expenses of the acquired funds in which it invests. Such indirect expenses are not included in the reported expense ratios.
(e) Certain line items from prior years have been reclassified to conform to the current presentation.
(f) Includes interest expense which rounds to less than 0.01%.
(g) Total net expenses include the impact of certain waivers/reimbursements made by the Investment Manager and certain of its affiliates, if applicable.
(h) The benefits derived from expense reductions had an impact of less than 0.01%.
(i) Amount represents results after the Fund's conversion to a stand-alone structure on November 10, 2008.
The accompanying Notes to Financial Statements are an integral part of this statement.
Annual Report 2013
24
Columbia Marsico Growth Fund
Notes to Financial Statements
February 28, 2013
Note 1. Organization
Columbia Marsico Growth Fund (the Fund), a series of Columbia Funds Series Trust (the Trust), is a diversified fund. The Trust is registered under the Investment Company Act of 1940, as amended (the 1940 Act), as an open-end management investment company organized as a Delaware statutory trust.
Fund Shares
The Trust may issue an unlimited number of shares (without par value). The Fund offers Class A, Class B, Class C, Class I, Class R, Class R4, Class R5, Class W and Class Z shares. All share classes have identical voting, dividend and liquidation rights. Each share class has its own expense structure and sales charges, as applicable.
Class A shares are subject to a maximum front-end sales charge of 5.75% based on the initial investment amount. Class A shares purchased without an initial sales charge in accounts aggregating $1 million to $50 million at the time of purchase are subject to a contingent deferred sales charge (CDSC) if the shares are sold within 18 months of purchase, charged as follows: 1.00% CDSC if redeemed within 12 months of purchase, and 0.50% CDSC if redeemed more than 12, but less than 18, months after purchase.
Class B shares may be subject to a maximum CDSC of 5.00% based upon the holding period after purchase. Class B shares will generally convert to Class A shares eight years after purchase. The Fund no longer accepts investments by new or existing investors in the Fund's Class B shares, except in connection with the reinvestment of any dividend and/or capital gain distributions in Class B shares of the Fund and exchanges by existing Class B shareholders of certain other funds within the Columbia Family of Funds.
Class C shares are subject to a 1.00% CDSC on shares redeemed within one year of purchase.
Class I shares are not subject to sales charges and are only available to the Columbia Family of Funds.
Class R shares are not subject to sales charges and are only available to qualifying institutional investors.
Class R4 shares are not subject to sales charges and are only available to investors purchasing through authorized investment professionals. Class R4 shares commenced operations on November 8, 2012.
Class R5 shares are not subject to sales charges and are only available to investors purchasing through authorized investment professionals. Class R5 shares commenced operations on November 8, 2012.
Class W shares are not subject to sales charges and are only available to investors purchasing through authorized investment programs managed by investment professionals, including discretionary managed account programs.
Class Z shares are not subject to sales charges, and are only available to certain investors.
Note 2. Summary of Significant Accounting Policies
Use of Estimates
The preparation of financial statements in accordance with U.S. generally accepted accounting principles (GAAP) requires management to make certain estimates and assumptions that affect the reported amounts of assets and liabilities, the disclosure of contingent assets and liabilities at the date of the financial statements and the reported amounts of revenue and expenses during the reporting period. Actual results could differ from those estimates.
The following is a summary of significant accounting policies consistently followed by the Fund in the preparation of its financial statements.
Security Valuation
All equity securities are valued at the close of business of the New York Stock Exchange (NYSE). Equity securities are valued at the last quoted sales price on the principal exchange or market on which they trade, except for securities traded on the NASDAQ Stock Market, which are valued at the NASDAQ official close price. Unlisted securities or listed securities for which there were no sales during the day are valued at the mean of the latest quoted bid and ask prices on such exchanges or markets.
Foreign securities are valued based on quotations from the principal market in which such securities are normally traded. If any foreign share prices are not readily available as a result of limited share activity the securities are valued at the mean of the latest quoted bid and ask prices on such exchanges or markets. Foreign currency exchange rates are generally determined at 4:00 p.m. Eastern (U.S.) time. However, many securities markets and exchanges outside the U.S. close prior to the close of the NYSE; therefore, the closing prices for securities in such markets or on such exchanges may not fully reflect events that occur after such close but before the close of the NYSE. In those situations, foreign securities will be fair valued pursuant to the policy adopted by the Board of Trustees (the Board), including utilizing a third party pricing service to determine these fair values. The third party pricing service takes into account multiple factors, including, but not limited to, movements in the U.S. securities markets, certain
Annual Report 2013
25
Columbia Marsico Growth Fund
Notes to Financial Statements (continued)
February 28, 2013
depositary receipts, futures contracts and foreign exchange rates that have occurred subsequent to the close of the foreign exchange or market, to determine a good faith estimate that reasonably reflects the current market conditions as of the close of the NYSE. The fair value of a security is likely to be different from the quoted or published price, if available.
Investments in other open-end investment companies, including money market funds, are valued at net asset value.
Investments for which market quotations are not readily available, or that have quotations which management believes are not reliable, are valued at fair value as determined in good faith under consistently applied procedures established by and under the general supervision of the Board. If a security or class of securities (such as foreign securities) is valued at fair value, such value is likely to be different from the last quoted market price for the security.
The determination of fair value often requires significant judgment. To determine fair value, management may use assumptions including but not limited to future cash flows and estimated risk premiums. Multiple inputs from various sources may be used to determine fair value.
Foreign Currency Transactions and Translations
The values of all assets and liabilities denominated in foreign currencies are translated into U.S. dollars at that day's exchange rates. Net realized and unrealized gains (losses) on foreign currency transactions and translations include gains (losses) arising from the fluctuation in exchange rates between trade and settlement dates on securities transactions, gains (losses) arising from the disposition of foreign currency and currency gains (losses) between the accrual and payment dates on dividends, interest income and foreign withholding taxes.
For financial statement purposes, the Fund does not distinguish that portion of gains (losses) on investments which is due to changes in foreign exchange rates from that which is due to changes in market prices of the investments. Such fluctuations are included with the net realized and unrealized gains (losses) on investments in the Statement of Operations.
Security Transactions
Security transactions are accounted for on the trade date. Cost is determined and gains (losses) are based upon the specific identification method for both financial statement and federal income tax purposes.
Income Recognition
Corporate actions and dividend income are recorded net of any non-reclaimable tax withholdings, on the ex-dividend date or upon receipt of ex-dividend notification in the case of certain foreign securities.
Awards from class action litigation are recorded as a reduction of cost basis if the Fund still owns the applicable securities on the payment date. If the Fund no longer owns the applicable securities, the proceeds are recorded as realized gains.
Expenses
General expenses of the Trust are allocated to the Fund and other funds of the Trust based upon relative net assets or other expense allocation methodologies determined by the nature of the expense. Expenses directly attributable to the Fund are charged to the Fund. Expenses directly attributable to a specific class of shares are charged to that share class.
Determination of Class Net Asset Value
All income, expenses (other than class-specific expenses, which are charged to that share class, as shown in the Statement of Operations) and realized and unrealized gains (losses) are allocated to each class of the Fund on a daily basis, based on the relative net assets of each class, for purposes of determining the net asset value of each class.
Federal Income Tax Status
The Fund intends to qualify each year as a regulated investment company under Subchapter M of the Internal Revenue Code, as amended, and will distribute substantially all of its taxable income (including net short-term capital gains), if any, for its tax year, and as such will not be subject to federal income taxes. In addition, the Fund intends to distribute in each calendar year substantially all of its net investment income, capital gains and certain other amounts, if any, such that the Fund should not be subject to federal excise tax. Therefore, no federal income or excise tax provision is recorded.
Distributions to Shareholders
Distributions from net investment income, if any, are declared and paid semi-annually. Net realized capital gains, if any, are distributed at least annually. Income distributions and capital gain distributions are determined in accordance with federal income tax regulations, which may differ from GAAP.
Guarantees and Indemnifications
Under the Trust's organizational documents and, in some cases, by contract, its officers and trustees are indemnified against certain liabilities arising out of the performance of their duties to the Trust or its funds. In addition, certain of the Fund's contracts with its service providers contain general indemnification clauses. The Fund's maximum exposure under these arrangements is unknown since the amount of any future claims that may be made against the Fund cannot be determined, and the Fund has no historical basis for predicting the likelihood of any such claims.
Annual Report 2013
26
Columbia Marsico Growth Fund
Notes to Financial Statements (continued)
February 28, 2013
Recent Accounting Pronouncement
Disclosures about Offsetting Assets and Liabilities
In December 2011, the Financial Accounting Standards Board (FASB) issued Accounting Standards Update (ASU) No. 2011-11, Disclosures about Offsetting Assets and Liabilities. The objective of the FASB is to enhance current disclosure requirements on offsetting of certain assets and liabilities and to enable financial statement users to compare financial statements prepared under GAAP and International Financial Reporting Standards.
Specifically, ASU No. 2011-11 requires an entity to disclose both gross and net information for derivatives and other financial instruments that are subject to a master netting arrangement or similar agreement. The standard requires disclosure of collateral received in connection with the master netting agreements or similar agreements. The effective date of ASU No. 2011-11 is for interim and annual periods beginning on or after January 1, 2013. At this time, management is evaluating the implications of this guidance and the impact it will have on the financial statement amounts and footnote disclosures, if any.
Note 3. Fees and Compensation Paid to Affiliates
Investment Management Fees
Under an Investment Management Services Agreement, Columbia Management Investment Advisers, LLC (the Investment Manager), a wholly-owned subsidiary of Ameriprise Financial, Inc. (Ameriprise Financial), is responsible for the ultimate oversight of investments made by the Fund. The Fund's subadviser (see Subadvisory Agreement below) has the primary responsibility for the day-to-day portfolio management of the Fund. Effective January 23, 2013, the investment management fee is an annual fee that is equal to a percentage of the Fund's average daily net assets that declines from 0.71% to 0.54% as the Fund's net assets increase. Prior to January 23, 2013, the investment management fee was equal to a percentage of the Fund's average daily net assets that declined from 0.75% to 0.56% as the Fund's net assets increased. The effective investment management fee rate for the year ended February 28, 2013 was 0.65% of the Fund's average daily net assets.
Prior to June 30, 2012, to the extent that the Fund was not benefitting from a separate contractual expense limitation arrangement, the Investment Manager contractually agreed to waive a portion of its investment management fee. In the absence of a separate contractual expense limitation arrangement, the investment management fee waiver for the Fund was equal to a percentage of the Fund's pro-rata portion of the combined average daily net assets of the Fund and other
affiliated funds managed by the Investment Manager and sub-advised by Marsico Capital Management, LLC (Marsico), at a rate that increased from 0.00% to 0.10% as the combined daily net assets increased.
For the year ended February 28, 2013, no investment management fees were waived for the Fund.
Subadvisory Agreement
The Investment Manager has entered into a Subadvisory Agreement with Marsico to subadvise the assets of the Fund. The Investment Manager compensates Marsico to manage the investment of the Fund's assets.
Administration Fees
Under an Administrative Services Agreement, the Investment Manager also serves as the Fund Administrator. Effective January 23, 2013, the Fund pays the Fund Administrator an annual fee for administration and accounting services equal to a percentage of the Fund's average daily net assets that declines from 0.06% to 0.03% as the Fund's net assets increase. Prior to January 23, 2013, the administration fee was equal to 0.22% of the Fund's average daily net assets. The effective administration fee rate for the year ended February 28, 2013 was 0.21% of the Fund's average daily net assets.
Other Expenses
Other expenses are for, among other things, certain expenses of the Fund or the Board, including: Fund boardroom and office expense, employee compensation, employee health and retirement benefits, and certain other expenses. Payment of these Fund and Board expenses is facilitated by a company providing limited administrative services to the Fund and the Board. For the year ended February 28, 2013, other expenses paid to this company were $8,319.
Compensation of Board Members
Board members are compensated for their services to the Fund as disclosed in the Statement of Operations. Under a Deferred Compensation Plan (the Plan), the Board members who are not "interested persons" of the Fund, as defined under the 1940 Act, may elect to defer payment of up to 100% of their compensation. Deferred amounts are treated as though equivalent dollar amounts had been invested in shares of certain funds managed by the Investment Manager. The Fund's liability for these amounts is adjusted for market value changes and remains in the Fund until distributed in accordance with the Plan.
Transfer Agent Fees
Under a Transfer and Dividend Disbursing Agent Agreement, Columbia Management Investment Services Corp. (the Transfer Agent), an affiliate of the Investment Manager and a
Annual Report 2013
27
Columbia Marsico Growth Fund
Notes to Financial Statements (continued)
February 28, 2013
wholly-owned subsidiary of Ameriprise Financial, is responsible for providing transfer agency services to the Fund. The Transfer Agent has contracted with Boston Financial Data Services (BFDS) to serve as sub-transfer agent.
The Transfer Agent receives monthly account-based service fees based on the number of open accounts and is reimbursed by the Fund for the fees and expenses the Transfer Agent pays to financial intermediaries that maintain omnibus accounts with the Fund that is a percentage of the average aggregate value of the Fund's shares maintained in each such omnibus account (other than omnibus accounts for which American Enterprise Investment Services Inc. is the broker of record or accounts where the beneficial shareholder is a customer of Ameriprise Financial Services, Inc., which are paid a per account fee). The Transfer Agent pays the fees of BFDS for services as sub-transfer agent and is not entitled to reimbursement for such fees from the Fund (with the exception of out-of-pocket fees).
The Transfer Agent also receives compensation from fees for various shareholder services and reimbursements for certain out-of-pocket fees. Class I shares do not pay transfer agent fees. Total transfer agent fees for Class R5 shares are subject to an annual limitation of not more than 0.05% of the average daily net assets attributable to Class R5 shares.
For the year ended February 28, 2013, the Fund's effective transfer agent fee rates as a percentage of average daily net assets of each class were as follows:
Class A | | | 0.21 | % | |
Class B | | | 0.21 | | |
Class C | | | 0.21 | | |
Class R | | | 0.21 | | |
Class R4* | | | 0.17 | | |
Class R5* | | | 0.05 | | |
Class W | | | 0.23 | | |
Class Z | | | 0.21 | | |
*Annualized
An annual minimum account balance fee of $20 may apply to certain accounts with a value below the Fund's initial minimum investment requirements to reduce the impact of small accounts on transfer agent fees. These minimum account balance fees are recorded as part of expense reductions in the Statement of Operations. For the year ended February 28, 2013, these minimum account balance fees reduced total expenses by $2,965.
Distribution and Service Fees
The Fund has an agreement with Columbia Management Investment Distributors, Inc. (the Distributor), an affiliate of the Investment Manager and a wholly-owned subsidiary of Ameriprise Financial, for distribution and shareholder services. Pursuant to Rule 12b-1 under the 1940 Act, the Board has approved, and the Fund has adopted, distribution and shareholder service plans (the Plans) which set the distribution and service fees for the Fund. These fees are calculated daily and are intended to compensate the Distributor and/or eligible selling and/or servicing agents for selling shares of the Fund and providing services to investors.
The Plans require the payment of a monthly combined distribution and service fee to the Distributor at the maximum annual rate of 0.25% of the average daily net assets attributable to Class A shares of the Fund. The Plans also require the payment of a monthly service fee at the maximum annual rate of 0.25% of the average daily net assets attributable to Class B, Class C and Class W shares of the Fund and the payment of a monthly distribution fee at the maximum annual rates of 0.75%, 0.75%, 0.50% and 0.25% of the average daily net assets attributable to Class B, Class C, Class R and Class W shares of the Fund.
The Fund may pay a distribution fee up to 0.25% of the Fund's average daily net assets attributable to Class W shares and a service fee of up to 0.25% of the Fund's average daily net assets attributable to Class W shares, provided, however, that the aggregate fee shall not exceed 0.25% of the Fund's average daily net assets attributable to Class W shares.
Sales Charges
Sales charges, including front-end charges and CDSCs, received by the Distributor for distributing Fund shares were $209,740 for Class A, $17,146 for Class B and $9,298 for Class C shares for the year ended February 28, 2013.
Expenses Waived/Reimbursed by the Investment Manager and its Affiliates
Effective July 1, 2012, the Investment Manager and certain of its affiliates have contractually agreed to waive fees and/or reimburse expenses (excluding certain fees and expenses described below), through June 30, 2013, unless sooner terminated at the sole discretion of the Board, so that the Fund's net operating expenses, after giving effect to fees waived/expenses reimbursed and any balance credits and/or overdraft charges from the Fund's custodian, do not exceed
Annual Report 2013
28
Columbia Marsico Growth Fund
Notes to Financial Statements (continued)
February 28, 2013
the following annual rates as a percentage of the class' average daily net assets:
Class A | | | 1.25 | % | |
Class B | | | 2.00 | | |
Class C | | | 2.00 | | |
Class I | | | 0.87 | | |
Class R | | | 1.50 | | |
Class R4* | | | 1.00 | | |
Class R5* | | | 0.92 | | |
Class W | | | 1.25 | | |
Class Z | | | 1.00 | | |
*Annual rate is contractual from November 8, 2012 (commencement of operations) through November 8, 2013.
Prior to July 1, 2012, the Investment Manager and certain of its affiliates contractually agreed to waive fees and/or reimburse expenses (excluding certain fees and expenses described below), so that the Fund's net operating expenses, after giving effect to fees waived/expenses reimbursed and any balance credits and/or overdraft charges from the Fund's custodian, did not exceed the following annual rates as a percentage of the class' average daily net assets:
Class A | | | 1.29 | % | |
Class B | | | 2.04 | | |
Class C | | | 2.04 | | |
Class I | | | 0.87 | | |
Class R | | | 1.54 | | |
Class W | | | 1.29 | | |
Class Z | | | 1.04 | | |
Under the agreement governing these fee waivers and/or expense reimbursement arrangements, the following fees and expenses are excluded from the waiver/reimbursement commitment, and therefore will be paid by the Fund, if applicable: taxes (including foreign transaction taxes), expenses associated with investments in affiliated and non-affiliated pooled investment vehicles (including mutual funds and exchange traded funds), transaction costs and brokerage commissions, costs related to any securities lending program, dividend expenses associated with securities sold short, inverse floater program fees and expenses, transaction charges and interest on borrowed money, interest, extraordinary expenses and any other expenses the exclusion of which is specifically approved by the Board. This agreement may be modified or amended only with approval from all parties.
Note 4. Federal Tax Information
The timing and character of income and capital gain distributions are determined in accordance with income tax
regulations, which may differ from GAAP because of temporary or permanent book to tax differences.
At February 28, 2013, these differences are primarily due to differing treatment for: capital loss carryforwards, deferral/reversal of wash sales losses, Trustees' deferred compensation, foreign capital gains tax, foreign currency transactions and post-October capital losses. To the extent these differences are permanent, reclassifications are made among the components of the Fund's net assets in the Statement of Assets and Liabilities. Temporary differences do not require reclassifications. In the Statement of Assets and Liabilities the following reclassifications were made:
Excess of distributions over
net investment income | | $ | (10,131 | ) | |
Accumulated net realized gain | | | 10,131 | | |
Net investment income and net realized gains (losses), as disclosed in the Statement of Operations, and net assets were not affected by this reclassification.
The tax character of distributions paid during the years indicated was as follows:
Year Ended | | February 28,
2013 | | February 29,
2012 | |
Ordinary income | | $ | 12,351,330 | | | $ | — | | |
Short-term capital gain distributions, if any, are considered ordinary income distributions for tax purposes.
At February 28, 2013, the components of distributable earnings on a tax basis were as follows:
Undistributed ordinary income | | $ | 3,060 | | |
Undistributed accumulated long-term gain | | | 93,441,757 | | |
Unrealized appreciation | | | 464,156,905 | | |
At February 28, 2013, the cost of investments for federal income tax purposes was $1,703,404,528 and the aggregate gross unrealized appreciation and depreciation based on that cost was:
Unrealized appreciation | | $ | 464,172,916 | | |
Unrealized depreciation | | | (16,011 | ) | |
Net unrealized appreciation | | $ | 464,156,905 | | |
For the year ended February 28, 2013, $465,006,297 of capital loss carryforward was utilized.
Management of the Fund has concluded that there are no significant uncertain tax positions that would require recognition in the financial statements. However, management's conclusion may be subject to review and adjustment at a later date based on factors including, but not limited to, new tax laws, regulations, and administrative interpretations (including relevant court decisions). Generally, the Fund's federal tax returns for the prior three fiscal years
Annual Report 2013
29
Columbia Marsico Growth Fund
Notes to Financial Statements (continued)
February 28, 2013
remain subject to examination by the Internal Revenue Service.
Note 5. Portfolio Information
The cost of purchases and proceeds from sales of securities, excluding short-term obligations, aggregated to $2,310,646,571 and $3,516,670,361, respectively, for the year ended February 28, 2013.
Note 6. Lending of Portfolio Securities
Effective December 19, 2012, the Fund no longer participates in securities lending activity. Prior to that date, the Fund participated, or was eligible to participate, in securities lending activity pursuant to a Master Securities Lending Agreement (the Agreement) with JPMorgan Chase Bank, N.A. (JPMorgan). The Agreement authorized JPMorgan as lending agent to lend securities to authorized borrowers in order to generate additional income on behalf of the Fund. Pursuant to the Agreement, the securities loaned were secured by cash or securities that either were issued or guaranteed as to principal and interest by the U.S. government, its agencies, authorities or instrumentalities with value equal to at least 100% of the market value of the loaned securities. Any additional collateral required to maintain those levels due to market fluctuations of the loaned securities was requested to be delivered the following business day. Cash collateral received was invested by the lending agent on behalf of the Fund into authorized investments pursuant to the Agreement.
Pursuant to the Agreement, the Fund received income for lending its securities either in the form of fees or by earning interest on invested cash collateral, net of negotiated rebates paid to borrowers and fees paid to the lending agent for services provided and any other securities lending expenses. Net income earned from securities lending for the year ended February 28, 2013 is disclosed in the Statement of Operations. The Fund continued to earn and accrue interest and dividends on the securities loaned.
Note 7. Affiliated Money Market Fund
The Fund invests its daily cash balances in Columbia Short-Term Cash Fund, an affiliated money market fund established for the exclusive use by the Fund and other affiliated funds. The income earned by the Fund from such investments is included as "Dividends — affiliated issuers" in the Statement of Operations. As an investing fund, the Fund indirectly bears its proportionate share of the expenses of Columbia Short-Term Cash Fund.
Note 8. Shareholder Concentration
At February 28, 2013, three unaffiliated shareholder accounts owned an aggregate of 58.0% of the outstanding shares of the
Fund. The Fund has no knowledge about whether any portion of those shares was owned beneficially by such accounts. Subscription and redemption activity by concentrated accounts may have a significant effect on the operations of the Fund.
Note 9. Line of Credit
The Fund has entered into a revolving credit facility with a syndicate of banks led by JPMorgan whereby the Fund may borrow for the temporary funding of shareholder redemptions or for other temporary or emergency purposes. The credit facility agreement, as amended, which is a collective agreement between the Fund and certain other funds managed by the Investment Manager, severally and not jointly, permits collective borrowings up to $500 million. Interest is charged to each participating fund based on its borrowings at a rate equal to the higher of (i) the overnight federal funds rate plus 1.00% or (ii) the one-month LIBOR rate plus 1.00%. Each borrowing under the credit facility matures no later than 60 days after the date of borrowing. The Fund also pays a commitment fee equal to its pro rata share of the amount of the credit facility at a rate of 0.08% per annum.
The Fund had no borrowings during the year ended February 28, 2013.
Note 10. Significant Risks
Consumer Discretionary Risk
The Fund's portfolio managers may invest significantly in issuers operating in the consumer discretionary sector. The Fund may be more susceptible to the particular risks of this sector than if the Fund were invested in a wider variety of issuers operating in unrelated sectors.
Note 11. Subsequent Events
Management has evaluated the events and transactions that have occurred through the date the financial statements were issued and noted no items requiring adjustment of the financial statements or additional disclosure.
Note 12. Information Regarding Pending and Settled Legal Proceedings
In December 2005, without admitting or denying the allegations, American Express Financial Corporation (AEFC, which is now known as Ameriprise Financial, Inc. (Ameriprise Financial)) entered into settlement agreements with the Securities and Exchange Commission (SEC) and Minnesota Department of Commerce (MDOC) related to market timing activities. As a result, AEFC was censured and ordered to cease and desist from committing or causing any violations of certain provisions of the Investment Advisers Act of 1940, the Investment Company Act of 1940, and various Minnesota laws. AEFC agreed to pay disgorgement of $10 million and civil
Annual Report 2013
30
Columbia Marsico Growth Fund
Notes to Financial Statements (continued)
February 28, 2013
money penalties of $7 million. AEFC also agreed to retain an independent distribution consultant to assist in developing a plan for distribution of all disgorgement and civil penalties ordered by the SEC in accordance with various undertakings detailed at www.sec.gov/litigation/admin/ia-2451.pdf. Ameriprise Financial and its affiliates have cooperated with the SEC and the MDOC in these legal proceedings, and have made regular reports to the funds' Boards of Trustees.
Ameriprise Financial and certain of its affiliates have historically been involved in a number of legal, arbitration and regulatory proceedings, including routine litigation, class actions, and governmental actions, concerning matters arising in connection with the conduct of their business activities. Ameriprise Financial believes that the Funds are not currently the subject of, and that neither Ameriprise Financial nor any of its affiliates are the subject of, any pending legal, arbitration or regulatory proceedings that are likely to have a material adverse effect on the Funds or the ability of Ameriprise Financial or its affiliates to perform under their contracts with the Funds. Ameriprise Financial is required to make 10-Q, 10-K and, as necessary, 8-K filings with the Securities and Exchange Commission on legal and regulatory matters that relate to Ameriprise Financial and its affiliates. Copies of these filings may be obtained by accessing the SEC website at www.sec.gov.
There can be no assurance that these matters, or the adverse publicity associated with them, will not result in increased fund redemptions, reduced sale of fund shares or other adverse consequences to the Funds. Further, although we believe proceedings are not likely to have a material adverse effect on the Funds or the ability of Ameriprise Financial or its affiliates to perform under their contracts with the Funds, these proceedings are subject to uncertainties and, as such, we are unable to estimate the possible loss or range of loss that may result. An adverse outcome in one or more of these proceedings could result in adverse judgments, settlements, fines, penalties or other relief that could have a material adverse effect on the consolidated financial condition or results of operations of Ameriprise Financial.
Annual Report 2013
31
Columbia Marsico Growth Fund
Report of Independent Registered Public Accounting Firm
To the Trustees of Columbia Funds Series Trust and
the Shareholders of Columbia Marsico Growth Fund
In our opinion, the accompanying statement of assets and liabilities, including the portfolio of investments, and the related statements of operations and of changes in net assets and the financial highlights present fairly, in all material respects, the financial position of Columbia Marsico Growth Fund (the "Fund") (a series of Columbia Funds Series Trust) at February 28, 2013, the results of its operations for the year then ended, the changes in its net assets for each of the two years in the period then ended and the financial highlights for each of the periods indicated, in conformity with accounting principles generally accepted in the United States of America. These financial statements and financial highlights (hereafter referred to as "financial statements") are the responsibility of the Fund's management. Our responsibility is to express an opinion on these financial statements based on our audits. We conducted our audits of these financial statements in accordance with the standards of the Public Company Accounting Oversight Board (United States). Those standards require that we plan and perform the audit to obtain reasonable assurance about whether the financial statements are free of material misstatement. An audit includes examining, on a test basis, evidence supporting the amounts and disclosures in the financial statements, assessing the accounting principles used and significant estimates made by management, and evaluating the overall financial statement presentation. We believe that our audits, which included confirmation of securities at February 28, 2013 by correspondence with the custodian, transfer agent and brokers, provide a reasonable basis for our opinion.
PricewaterhouseCoopers LLP
Minneapolis, Minnesota
April 19, 2013
Annual Report 2013
32
Columbia Marsico Growth Fund
Federal Income Tax Information
(Unaudited)
The Fund hereby designates the following tax attributes for the fiscal year ended February 28, 2013. Shareholders will be notified in early 2014 of the amounts for use in preparing 2013 income tax returns.
Tax Designations:
| Qualified Dividend Income | | | 100.00 | % | |
| Dividends Received Deduction | | | 100.00 | % | |
Capital Gain Dividend | | $ | 98,113,845 | | |
Qualified Dividend Income. For taxable, non-corporate shareholders, the percentage of ordinary income dividends paid during the fiscal year that represents qualified dividend income subject to reduced tax rates under the Jobs and Growth Tax Relief Reconciliation Act of 2003.
Dividends Received Deduction. The percentage of ordinary income dividends paid during the fiscal year that qualifies for the corporate dividends received deduction.
Capital Gain Dividend. The Fund designates as a capital gain dividend the amount reflected above, or if subsequently determined to be different, the net capital gain of such fiscal period. The Fund also designates as capital gain dividends, to the extent necessary to fully distribute such capital gains, earnings and profits distributed to shareholders on the redemption of shares.
Annual Report 2013
33
Columbia Marsico Growth Fund
Shareholders elect the Board that oversees the funds' operations. The Board appoints officers who are responsible for day-to-day business decisions based on policies set by the Board. The following table provides basic biographical information about the funds' Board members, including their principal occupations during the past five years, although specific titles for individuals may have varied over the period. Under current Board policy, members may serve until the next Board meeting after he or she reaches the mandatory retirement age established by the Board, or the fifteenth anniversary of the first Board meeting they attended as a member of the Board.
Mr. Edward J. Boudreau, Jr., Mr. William P. Carmichael, Mr. William A. Hawkins, Mr. R. Glenn Hilliard, Ms. Minor M. Shaw and Dr. Anthony M. Santomero, were members of the Legacy Columbia Nations funds' Board ("Nations Funds"), which includes Columbia Funds Series Trust, Columbia Funds Variable Insurance Trust I and Columbia Funds Master Investment Trust, LLC and began service on the Board for the Legacy RiverSource funds ("RiverSource Funds") effective June 1, 2011.
Independent Trustees
Name,
Address,
Year of Birth | | Position Held With
Funds and Length of
Service | | Principal Occupation
During Past Five Years | | Number of
Funds in the
Fund Family
Overseen by
Board Member | | Other Present or Past
Directorships/Trusteeships
(Within Past 5 Years) | |
Kathleen Blatz
901 S. Marquette Ave.
Minneapolis, MN 55402
1954 | | Board member since 1/06 for RiverSource Funds and since 6/11 for Nations Funds | | Attorney; Chief Justice, Minnesota Supreme Court, 1998-2006 | | | 153 | | | Director, BlueCross BlueShield of Minnesota since 2009 | |
Edward J. Boudreau, Jr.
901 S. Marquette Ave.
Minneapolis, MN 55402
1944 | | Board member since 6/11 for RiverSource Funds and since 1/05 for Nations Funds | | Managing Director, E.J. Boudreau & Associates (consulting) since 2000 | | | 151 | | | Former Trustee, BofA Funds Series Trust (11 funds) | |
Pamela G. Carlton
901 S. Marquette Ave.
Minneapolis, MN 55402
1954 | | Board member since 7/07 for RiverSource Funds and since 6/11 for Nations Funds | | President, Springboard — Partners in Cross Cultural Leadership (consulting company) since 2003 | | | 153 | | | None | |
William P. Carmichael
901 S. Marquette Ave.
Minneapolis, MN 55402
1943 | | Board member since 6/11 for RiverSource Funds and since 1999 for Nations Funds | | Retired | | | 151 | | | Director, Cobra Electronics Corporation (electronic equipment manufacturer); The Finish Line (athletic shoes and apparel) since July 2003; McMoRan Exploration Company (oil and gas exploration and development) since 2010; former Trustee, BofA Funds Series Trust (11 funds); former Director, Spectrum Brands, Inc. (consumer products); former Director, Simmons Company (bedding) | |
Patricia M. Flynn
901 S. Marquette Ave.
Minneapolis, MN 55402
1950 | | Board member since 11/04 for RiverSource Funds and since 6/11 for Nations Funds | | Trustee Professor of Economics and Management, Bentley University since 1976 | | | 153 | | | None | |
William A. Hawkins
901 S. Marquette Ave.
Minneapolis, MN 55402
1942 | | Board member since 6/11 for RiverSource Funds and since 1/05 for Nations Funds | | Managing Director, Overton Partners (financial consulting), since August 2010; President and Chief Executive Officer, California General Bank, N.A., January 2008-August 2010 | | | 151 | | | Trustee, BofA Funds Series Trust (11 funds) | |
Annual Report 2013
34
Columbia Marsico Growth Fund
Trustees and Officers (continued)
Independent Trustees (continued)
Name,
Address,
Year of Birth | | Position Held With
Funds and Length of
Service | | Principal Occupation
During Past Five Years | | Number of
Funds in the
Fund Family
Overseen by
Board Member | | Other Present or Past
Directorships/Trusteeships
(Within Past 5 Years) | |
R. Glenn Hilliard
901 S. Marquette Ave.
Minneapolis, MN 55402
1943 | | Board member since 6/11 for RiverSource Funds and since 1/05 for Nations Funds | | Chairman and Chief Executive Officer, Hilliard Group LLC (investing and consulting), since April 2003; Non-Executive Director & Chairman, CNO Financial Group, Inc. (insurance), September 2003-May 2011 | | | 151 | | | Chairman, BofA Fund Series Trust (11 funds); former Director, CNO Financial Group, Inc. (insurance) | |
Stephen R. Lewis, Jr.
901 S. Marquette Ave.
Minneapolis, MN 55402
1939 | | Chair of the Board for RiverSource Funds since 1/07, Board member for RiverSource Funds since 1/02 and since 6/11 for Nations Funds | | President Emeritus and Professor of Economics Emeritus, Carleton College since 2002 | | | 153 | | | Director, Valmont Industries, Inc. (manufacturer of irrigation systems) since 2002 | |
Catherine James Paglia
901 S. Marquette Ave.
Minneapolis, MN 55402
1952 | | Board member since 11/04 for RiverSource Funds and since 6/11 for Nations Funds | | Director, Enterprise Asset Management, Inc. (private real estate and asset management company) | | | 153 | | | Director, Valmont Industries, Inc. (manufacturer of irrigation systems) since 2012 | |
Leroy C. Richie
901 S. Marquette Ave.
Minneapolis, MN 55402
1941 | | Board member since 2000 for Legacy Seligman Funds, since 11/08 for RiverSource Funds and since 6/11 for Nations Funds | | Counsel, Lewis & Munday, P.C. (law firm) since 2004; former Vice President and General Counsel, Automotive Legal Affairs, Chrysler Corporation from 1983-1987 | | | 153 | | | Lead Outside Director, Digital Ally, Inc. (digital imaging) since September 2005; Director, Infinity, Inc. (oil and gas exploration and production) since 1994; Director, OGE Energy Corp. (energy and energy services) since November 2007 | |
Minor M. Shaw
901 S. Marquette Ave.
Minneapolis, MN 55402
1947 | | Board member since 6/11 for RiverSource Funds and since 2003 for Nations Funds | | President, Micco LLC (private investments) since 2011; President Micco Corp. since 1998 | | | 151 | | | Director, Piedmont Natural Gas; Director, BlueCross BlueShield of South Carolina since April 2008; Former Trustee, BofA Funds Series Trust (11 funds) | |
Alison Taunton-Rigby
901 S. Marquette Ave.
Minneapolis, MN 55402
1944 | | Board member since 11/02 for RiverSource Funds and since 6/11 for Nations Funds | | Chief Executive Officer and Director, RiboNovix, Inc. (biotechnology), 2003-2010 | | | 153 | | | Director, Healthways, Inc. (health and well-being improvement) since 2005; Director, ICI Mutual Insurance Company, RRG since 2011; Director, Abt Associates (government contractor) since 2001; Director, Boston Children's Hospital since 2002 | |
Annual Report 2013
35
Columbia Marsico Growth Fund
Trustees and Officers (continued)
Interested Trustee Not Affiliated With Investment Manager*
Name,
Address,
Year of Birth | | Position Held With
Funds and Length of
Service | | Principal Occupation
During Past Five Years | | Number of
Funds in the
Fund Family
Overseen by
Board Member | | Other Present or Past
Directorships/Trusteeships
(Within Past 5 Years) | |
Anthony M. Santomero
901 S. Marquette Ave.
Minneapolis, MN 55402
1946 | | Board member since 6/11 for RiverSource Funds and since 1/08 for Nations Funds | | Richard K. Mellon Professor Emeritus of Finance, The Wharton School, University of Pennsylvania, since 2002; Senior Advisor, McKinsey & Company (consulting), 2006-2008 | | | 151 | | | Director, Renaissance Reinsurance Ltd. since May 2008; Trustee, Penn Mutual Life Insurance Company since March 2008; Director, Citigroup since 2009; Director, Citibank, N.A. since 2009; former Trustee, BofA Funds Series Trust (11 funds) | |
*Dr. Santomero is not an affiliated person of the investment manager or Ameriprise Financial. However, he is currently deemed by the funds to be an "interested person" (as defined in the 1940 Act) of the funds because he serves as a Director of Citigroup, Inc. and Citibank N.A., companies that may directly or through subsidiaries and affiliates engage from time-to-time in brokerage execution, principal transactions and lending relationships with the funds or accounts advised/managed by the investment manager.
Interested Trustee Affiliated With Investment Manager*
Name,
Address,
Year of Birth | | Position Held With
Funds and Length of
Service | | Principal Occupation
During Past Five Years | | Number of
Funds in the
Fund Family
Overseen by
Board Member | | Other Present or Past
Directorships/Trusteeships
(Within Past 5 Years) | |
William F. Truscott
53600 Ameriprise
Financial Center
Minneapolis, MN 55474
1960 | | Board member since 11/01 for RiverSource Funds and since 6/11 for Nations Funds; Senior Vice President since 2002 for RiverSource Funds and 5/10 for Nations Funds | | President, Columbia Management Investment Advisers, LLC since February 2012, (previously President, Chairman of the Board and Chief Investment Officer, 2001-April 2010); Chief Executive Officer, Global Asset Management, Ameriprise Financial, Inc. since September 2012 (previously Chief Executive Officer, U.S. Asset Management & President, Annuities, May 2010-September 2012 and President — U.S. Asset Management and Chief Investment Officer, 2005-April 2010); Chief Executive Officer, Columbia Management Investment Distributors, Inc. since February 2012, (previously Chairman of the Board and Chief Executive Officer, 2006-April 2010); Chairman of the Board and Chief Executive Officer, RiverSource Distributors, Inc. since 2006; President and Chief Executive Officer, Ameriprise Certificate Company 2006-August 2012 | | | 210 | | | Chairman of the Board, Columbia Management Investment Advisers, LLC since May 2010; Director, Columbia Management Investment Distributors, Inc. since May 2010; Director, Ameriprise Certificate Company, 2006-January 2013 | |
*Interested person (as defined under the 1940 Act) by reason of being an officer, director, security holder and/or employee of the investment manager or Ameriprise Financial.
The SAI has additional information about the Fund's Board members and is available, without charge, upon request by calling 800.345.6611; contacting your financial intermediary; or visiting columbiamanagement.com.
Annual Report 2013
36
Columbia Marsico Growth Fund
Trustees and Officers (continued)
The Board has appointed officers who are responsible for day-to-day business decisions based on policies it has established. The officers serve at the pleasure of the Board. In addition to Mr. Truscott, who is Senior Vice President, the funds' other officers are:
Officers
Name,
Address,
Year of Birth | | Position Held With
Funds and Length of
Service | | Principal Occupation During Past Five Years | |
J. Kevin Connaughton
225 Franklin Street
Boston, MA 02110
1964 | | President and Principal Executive Officer since 5/10 for RiverSource Funds and 2009 for Nations Funds | | Senior Vice President and General Manager — Mutual Fund Products, Columbia Management Investment Advisers, LLC since May 2010; Managing Director of Columbia Management Advisors, LLC, December 2004-April 2010; Senior Vice President and Chief Financial Officer, Columbia Funds, June 2008-January 2009; Treasurer, Columbia Funds, October 2003-May 2008 | |
Amy K. Johnson
5228 Ameriprise Financial Center Minneapolis, MN 55474
1965 | | Vice President since 12/06 for RiverSource Funds and 5/10 for Nations Funds | | Senior Vice President and Chief Operating Officer, Columbia Management Investment Advisers, LLC since May 2010 (previously Chief Administrative Officer, 2009-April 2010 and Vice President — Asset Management and Trust Company Services, 2006-2009) | |
Michael G. Clarke
225 Franklin Street
Boston, MA 02110
1969 | | Treasurer since 1/11 and Chief Financial Officer since 4/11 for RiverSource Funds and Treasurer since 3/11 and Chief Financial Officer since 2009 for Nations Funds | | Vice President, Columbia Management Investment Advisers, LLC since May 2010; Managing Director of Fund Administration, Columbia Management Advisors, LLC, September 2004-April 2010; senior officer of Columbia Funds and affiliated funds since 2002 | |
Scott R. Plummer
5228 Ameriprise Financial Center Minneapolis, MN 55474
1959 | | Senior Vice President and Chief Legal Officer since 12/06 and Assistant Secretary since 6/11 for RiverSource Funds and Senior Vice President and Chief Legal Officer since 5/10 and Assistant Secretary since 6/11 for Nations Funds | | Senior Vice President, Chief Legal Officer and Assistant Secretary, Columbia Management Investment Advisers, LLC since June 2005; Vice President and Lead Chief Counsel — Asset Management, Ameriprise Financial, Inc. since May 2010 (previously Vice President and Chief Counsel — Asset Management, 2005-April 2010); Vice President, Chief Counsel and Assistant Secretary, Columbia Management Investment Distributors, Inc. since 2008; Vice President, General Counsel and Secretary, Ameriprise Certificate Company since 2005; Chief Counsel, RiverSource Distributors, Inc. since 2006 | |
Colin Moore
225 Franklin Street
Boston, MA 02110
1958 | | Senior Vice President since 5/10 for RiverSource Funds and Nations Funds | | Director and Chief Investment Officer, Columbia Management Investment Advisers, LLC since May 2010; Manager, Managing Director and Chief Investment Officer, Columbia Management Advisors, LLC, 2007-April 2010 | |
Thomas P. McGuire
225 Franklin Street
Boston, MA 02110
1972 | | Chief Compliance Officer since 3/12 | | Vice President — Asset Management Compliance, Columbia Management Investment Advisers, LLC since 2010; Chief Compliance Officer, Ameriprise Certificate Company since September 2010; Compliance Executive, Bank of America, 2005-2010 | |
Stephen T. Welsh
225 Franklin Street
Boston, MA 02110
1957 | | Vice President since 4/11 for RiverSource Funds and 2006 for Nations Funds | | President and Director, Columbia Management Investment Services Corp. since May 2010; President and Director, Columbia Management Services, Inc., July 2004- April 2010; Managing Director, Columbia Management Distributors, Inc., August 2007-April 2010 | |
Christopher O. Petersen
5228 Ameriprise Financial Center Minneapolis, MN 55474
1970 | | Vice President and Secretary since 4/11 for RiverSource Funds and 3/11 for Nations Funds | | Vice President and Chief Counsel, Ameriprise Financial, Inc. since January 2010 (formerly Vice President and Group Counsel or Counsel, April 2004-January 2010); Assistant Secretary of Legacy RiverSource Funds, January 2007-April 2011 and of the Nations Funds, May 2010-March 2011 | |
Annual Report 2013
37
Columbia Marsico Growth Fund
Trustees and Officers (continued)
Officers (continued)
Name,
Address,
Year of Birth | | Position Held With
Funds and Length of
Service | | Principal Occupation During Past Five Years | |
Paul D. Pearson
10468 Ameriprise Financial Center Minneapolis, MN 55474
1956 | | Vice President since 4/11 and Assistant Treasurer since 1999 for RiverSource Funds and Vice President and Assistant Treasurer since 6/11 for Nations Funds | | Vice President — Investment Accounting, Columbia Management Investment Advisers, LLC, since May 2010; Vice President — Managed Assets, Investment Accounting, Ameriprise Financial Corporation, February 1998-May 2010 | |
Joseph F. DiMaria
225 Franklin Street
Boston, MA 02110
1968 | | Vice President and Chief Accounting Officer since 4/11 and Vice President since 3/11 and Chief Accounting Officer since 2008 for Nations Funds | | Vice President, Mutual Fund Administration, Columbia Management Investment Advisers, LLC, since May 2010; Director of Fund Administration, Columbia Management Advisors, LLC, January 2006-April 2010 | |
Paul B. Goucher
100 Park Avenue
New York, NY 10017
1968 | | Vice President since 4/11 and Assistant Secretary since 11/08 for RiverSource Funds and 5/10 for Nations Funds | | Vice President and Lead Chief Counsel, Ameriprise Financial, Inc. since November 2008 and January 2013, respectively (formerly, Chief Counsel, January 2010-January 2013 and Group Counsel from November 2008- January 2010); Director, Managing Director and General Counsel, J. & W. Seligman & Co. Incorporated, July 2008-November 2008 (previously, Managing Director and Associate General Counsel, January 2005-July 2008) | |
Michael E. DeFao
225 Franklin Street
Boston, MA 02110
1968 | | Vice President since 4/11 and Assistant Secretary since 5/10 for RiverSource Funds and 2011 for Nations Funds | | Vice President and Chief Counsel, Ameriprise Financial, Inc. since May 2010; Associate General Counsel, Bank of America, June 2005-April 2010 | |
Annual Report 2013
38
This page intentionally left blank.
Annual Report 2013
39
This page intentionally left blank.
Annual Report 2013
40
Columbia Marsico Growth Fund
Important Information About This Report
Each fund mails one shareholder report to each shareholder address. If you would like more than one report, please call shareholder services at 800.345.6611 and additional reports will be sent to you.
The policy of the Board is to vote the proxies of the companies in which each fund holds investments consistent with the procedures as stated in the Statement of Additional Information (SAI). You may obtain a copy of the SAI without charge by calling 800.345.6611; contacting your financial intermediary; visiting columbiamanagement.com; or searching the website of the Securities and Exchange Commission (SEC) at sec.gov. Information regarding how each fund voted proxies relating to portfolio securities is filed with the SEC by August 31 for the most recent 12-month period ending June 30 of that year, and is available without charge by visiting columbiamanagement.com; or searching the website of the SEC at sec.gov.
Each fund files a complete schedule of portfolio holdings with the SEC for the first and third quarters of each fiscal year on Form N-Q. Each fund's Form N-Q is available on the SEC's website at sec.gov and may be reviewed and copied at the SEC's Public Reference Room in Washington, D.C. Information on the operation of the Public Reference Room may be obtained by calling 800.SEC.0330. Each fund's complete schedule of portfolio holdings, as filed on Form N-Q, can also be obtained without charge, upon request, by calling 800.345.6611.
Annual Report 2013
41

Columbia Marsico Growth Fund
P.O. Box 8081
Boston, MA 02266-8081
columbiamanagement.com
This information is for use with concurrent or prior delivery of a fund prospectus. Please read and consider the investment objectives, risks, charges and expenses for any fund carefully before investing. For a prospectus which contains this and other important information about the Fund go to columbiamanagement.com. The Fund is distributed by Columbia Management Investment Distributors, Inc., member FINRA, and managed by Columbia Management Investment Advisers, LLC.
© 2013 Columbia Management Investment Advisers, LLC. All rights reserved.
ANN188_02_C01_(04/13)
Annual Report
February 28, 2013

Columbia Overseas Value Fund
Not FDIC insured • No bank guarantee • May lose value
Columbia Overseas Value Fund
 Dear Shareholders,
U.S. stocks flat, foreign markets strong in 2012 finale
After a strong third quarter, U.S. stock market averages treaded water as the year 2012 came to a close. However, they ended the year up strongly, as first- and third-quarter gains more than offset second- and fourth-quarter weakness. Typically a strong quarter for domestic small- and mid-cap issues, the fourth quarter of 2012 indeed proved to be another year-end positive for small-cap stocks. For the full calendar year 2012, the S&P 500 Index rose 16.00%.
Stock markets outside the United States generated some of the best returns for the fourth quarter, as optimism rebounded, thanks to the September actions of the European Central Bank in support of the euro and an improving outlook from China. Both developed and emerging foreign markets topped U.S. stocks by a solid margin.
Corporate and emerging markets led fixed income
Fixed-income investors took their cue from the equity markets and continued to favor the highest risk sectors through the end of 2012. Global fixed-income returns posted mixed results in the final quarter of the year. Gains were the highest for corporate high-yield and emerging market bonds. Although investors remained cautious ahead of the year-end budget negotiations, better economic data and a further improvement in the European sovereign debt crisis supported riskier assets and depressed government bond prices. In December, the Federal Reserve announced its intention to continue to purchase both Treasury and mortgage-backed securities and said that it would seek to keep short-term interest rates unchanged until the unemployment rate reaches 6.5%, or inflation turned noticeably higher.
Stay on track with Columbia Management
Backed by more than 100 years of experience, Columbia Management is one of the nation's largest asset managers. At the heart of our success — and, most importantly, that of our investors — are highly talented industry professionals, brought together by a unique way of working. We are dedicated to helping you take advantage of today's opportunities and anticipate tomorrow's. We stay abreast of the latest investment trends and ideas, using our collective insight to evaluate events and transform them into solutions you can use.
Visit columbiamanagement.com for:
> The Columbia Management Perspectives blog, featuring timely posts by our investment teams
> Detailed up-to-date fund performance and portfolio information
> Economic analysis and market commentary
> Quarterly fund commentaries
> Columbia Management Investor, our award-winning quarterly newsletter for shareholders
Thank you for your continued support of the Columbia Funds. We look forward to serving your investment needs for many years to come.
Best Regards,

J. Kevin Connaughton
President, Columbia Funds
The S&P 500 Index, an unmanaged index, measures the performance of 500 widely held, large-capitalization U.S. stocks and is frequently used as a general measure of market performance. Indices are not available for investment, are not professionally managed and do not reflect sales charges, fees, brokerage commissions, taxes or other expenses of investing.
Investors should consider the investment objectives, risks, charges and expenses of a mutual fund carefully before investing. For a free prospectus, which contains this and other important information about a fund, visit columbiamanagement.com. The prospectus should be read carefully before investing.
Columbia Funds are distributed by Columbia Management Investment Distributors, Inc., member FINRA, and managed by Columbia Management Investment Advisers, LLC.
© 2013 Columbia Management Investment Advisers, LLC. All rights reserved.
Columbia Overseas Value Fund
Performance Overview | | | 2 | | |
Manager Discussion of Fund Performance | | | 4 | | |
Understanding Your Fund's Expenses | | | 7 | | |
Portfolio of Investments | | | 8 | | |
Statement of Assets and Liabilities | | | 14 | | |
Statement of Operations | | | 16 | | |
Statement of Changes in Net Assets | | | 17 | | |
Financial Highlights | | | 19 | | |
Notes to Financial Statements | | | 22 | | |
Report of Independent Registered
Public Accounting Firm | | | 30 | | |
Federal Income Tax Information | | | 31 | | |
Trustees and Officers | | | 32 | | |
Important Information About This Report | | | 37 | | |
Fund Investment Manager
Columbia Management Investment
Advisers, LLC
225 Franklin Street
Boston, MA 02110
Fund Distributor
Columbia Management Investment
Distributors, Inc.
225 Franklin Street
Boston, MA 02110
Fund Transfer Agent
Columbia Management Investment
Services Corp.
P.O. Box 8081
Boston, MA 02266-8081
For more information about any of the funds, please visit columbiamanagement.com or call 800.345.6611. Customer Service Representatives are available to answer your questions Monday through Friday from 8 a.m. to 8 p.m. Eastern time.
The views expressed in this report reflect the current views of the respective parties. These views are not guarantees of future performance and involve certain risks, uncertainties and assumptions that are difficult to predict, so actual outcomes and results may differ significantly from the views expressed. These views are subject to change at any time based upon economic, market or other conditions and the respective parties disclaim any responsibility to update such views. These views may not be relied on as investment advice and, because investment decisions for a Columbia Fund are based on numerous factors, may not be relied on as an indication of trading intent on behalf of any particular Columbia Fund. References to specific securities should not be construed as a recommendation or investment advice.
Columbia Overseas Value Fund
Performance Summary
> Columbia Overseas Value Fund (the Fund) Class Z shares returned 8.45% for the 12-month period that ended February 28, 2013.
> The Fund underperformed its benchmark, the MSCI EAFE Value Index (Net), which returned 9.68% for the same 12-month period.
> Cyclical downturns in specific industries led to disappointing results from several holdings, despite positive contributions from longer-term investments.
Average Annual Total Returns (%) (for period ended February 28, 2013)
| | Inception | | 1 Year | | Life | |
Class I* | | 03/31/11 | | | 8.49 | | | | -2.05 | | |
Class W* | | 03/31/11 | | | 8.24 | | | | -2.20 | | |
Class Z | | 03/31/08 | | | 8.45 | | | | -2.07 | | |
MSCI EAFE Value Index (Net) | | | | | | | 9.68 | | | | -1.76 | | |
All results shown assume reinvestment of distributions during the period. Returns do not reflect the deduction of taxes that a shareholder may pay on Fund distributions or on the redemption of Fund shares. Performance results reflect the effect of any fee waivers or reimbursements of Fund expenses by Columbia Management Investment Advisers, LLC and/or any of its affiliates. Absent these fee waivers or expense reimbursement arrangements, performance results would have been lower.
The performance information shown represents past performance and is not a guarantee of future results. The investment return and principal value of your investment will fluctuate so that your shares, when redeemed, may be worth more or less than their original cost. Current performance may be lower or higher than the performance information shown. You may obtain performance information current to the most recent month-end by contacting your financial intermediary, visiting columbiamanagement.com or calling 800.345.6611.
*The returns shown for periods prior to the share class inception date (including returns for the Life of the Fund, if shown, which are since Fund inception) include the returns of the Fund's oldest share class. These returns are adjusted to reflect any higher class-related operating expenses of the newer share classes, as applicable. Please visit columbiamanagement.com/mutual-funds/appended-performance for more information.
The MSCI Europe, Australasia, Far East (EAFE) Value Index (Net) is a subset of the MSCI EAFE Index (Net), and constituents of the index include securities from Europe, Australasia and the Far East. The index generally represents approximately 50% of the free float-adjusted market capitalization of the MSCI EAFE Index (Net), and consists of those securities classified by Morgan Stanley Capital International, Inc. (MSCI) as most representing the value style, such as, higher book value-to-price ratios, higher forward earnings-to-price ratios, higher dividend yields and lower forecasted growth rates than securities representing the growth style.
Indices are not available for investment, are not professionally managed and do not reflect sales charges, fees, brokerage commissions, taxes or other expenses of investing. Securities in the Fund may not match those in an index.
Annual Report 2013
2
Columbia Overseas Value Fund
Performance Overview (continued)
Performance of a Hypothetical $10,000 Investment (March 31, 2008 – February 28, 2013)
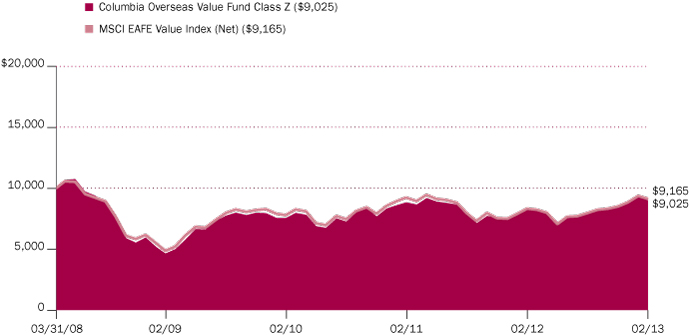
The chart above shows the change in value of a hypothetical $10,000 investment in Class Z shares of Columbia Overseas Value Fund during the stated time period, and does not reflect the deduction of taxes that a shareholder may pay on Fund distributions or on the redemption of Fund shares.
Annual Report 2013
3
Columbia Overseas Value Fund
Manager Discussion of Fund Performance
For the 12-month period that ended February 28, 2013, the Fund's Class Z shares returned 8.45%. The Fund's benchmark, the MSCI EAFE Value Index (Net), returned 9.68% for the same 12-month period. Weaker earnings from several holdings exposed to cyclical pressures hurt relative performance and partially accounted for the shortfall relative to the index. An overweight relative to the benchmark in Canada and relative underexposure to Australia also detracted from results. A decision to underweight defensive sectors, such as telecommunication services and utilities, helped relative performance when the market rallied.
Investors Shrug Off Weak Global Growth
Europe's economic woes and U.S. struggles to avoid a fiscal cliff of tax increases and spending cuts weighed on the global economy during the 12-month period ended February 28, 2013. Yet, investors chose to look beyond the numbers and came in from the sidelines to bid stock prices significantly higher. Favorable central bank action in key markets, a new government in Japan, which pledged to end the country's prolonged cycle of economic woes, and improving prospects for the U.S. and emerging economies gave investors confidence to favor stocks and other riskier assets. The U.S. economy expanded at a pace of just 1.6% in 2012. However, a pickup in job growth early in 2013 and steady manufacturing activity were encouraging. Meanwhile, much of Europe headed toward recession, and Japan's economy slipped into negative territory for the fifth time in 15 years. Major emerging market economies, including China, forged ahead, although mostly at a slower pace.
Cyclical Factors Led to Disappointments
Short-term pressures led to disappointing performance from several holdings. One particular disappointment was Electromagnetic GeoServices AS, a Norwegian energy services company that specializes in identifying potential offshore oil drilling sites. Because the company relies on contract work, its earnings slowed with a decline in energy exploration activity. Nevertheless, we maintained the position because we believe in the company's proprietary technology and we think the corporation's longer-term outlook remains solid. We also retained Centerra Gold, a Canada-based gold miner. The company's stock price fell precipitously after the Kyrgyz Republic government in central Asia threatened to renegotiate its contract for Centerra's most significant mine. We also retained exposure to two other notable underperformers: KHD Humboldt Wedag International and Capro. KHD Humboldt is a German industrials firm specializing in the construction of cement factories. Its share price fell with a decline in new orders. However, the company is strong in the Russian and Indian markets, where we see long-term opportunities, and its less energy-intensive plants should give it a competitive edge. Capro is a South Korean chemical company that specializes in an important ingredient used in nylon production that was hurt by weakening demand from China.
Restructurings Led to Solid Results from Several Investments
Corporate efficiency programs helped several holdings raise their earnings, pay out healthy stock dividends to shareholders and support their stock prices. Freenet AG is a German telecommunications service provider that improved its
Portfolio Management
Colin Moore, AIIMR
Fred Copper, CFA
Morningstar Style BoxTM
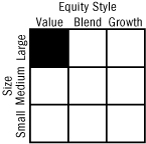
The Morningstar Style BoxTM is based on a fund's portfolio holdings. For equity funds, the vertical axis shows the market capitalization of the stocks owned, and the horizontal axis shows investment style (value, blend, or growth). Information shown is based on the most recent data provided by Morningstar.
© 2013 Morningstar, Inc. All rights reserved. The Morningstar information contained herein: (1) is proprietary to Morningstar and/or its content providers; (2) may not be copied or distributed; and (3) is not warranted to be accurate, complete or timely. Neither Morningstar nor its content providers are responsible for any damages or losses arising from any use of this information.
Top Ten Holdings (%)
(at February 28, 2013) | |
Royal Dutch Shell PLC,
Class B (United Kingdom) | | | 3.9 | | |
HSBC Holdings PLC
(United Kingdom) | | | 3.7 | | |
Total SA (France) | | | 3.0 | | |
Sanofi (France) | | | 2.8 | | |
Australia and New Zealand
Banking Group Ltd. (Australia) | | | 2.4 | | |
Novartis AG, Registered
Shares (Switzerland) | | | 2.3 | | |
Sumitomo Mitsui Financial
Group, Inc. (Japan) | | | 2.1 | | |
Banco Santander SA (Spain) | | | 2.0 | | |
Vodafone Group PLC
(United Kingdom) | | | 2.0 | | |
Allianz SE, Registered Shares
(Germany) | | | 1.8 | | |
Percentages indicated are based upon total investments (excluding Money Market Funds).
For further detail about these holdings, please refer to the section entitled "Portfolio of Investments."
Fund holdings are as of the date given, are subject to change at any time, and are not recommendations to buy or sell any security.
Annual Report 2013
4
Columbia Overseas Value Fund
Manager Discussion of Fund Performance (continued)
profitability, stemmed client losses and raised its dividend. Meanwhile, restructuring by Smurfit Kappa Group PLC, an Irish paper and packaging company operating throughout Europe and Latin America, helped it reduce its debt and begin paying stock dividends. The new weak yen policy helped boost two Japanese holdings: Arnest One, and Fuji Heavy Industries. Homebuilder Arnest One was among the real-estate-related companies expected to benefit if the declining yen helped raise property values. The stock also gained with the announcement of a pending merger with five other companies into a combined corporation better able to compete with larger builders. Fuji is the manufacturer of Subaru vehicles, and the weakened yen should boost company earnings when foreign profits are translated into the yen. Two-thirds of the company's sales are outside Japan.
Looking Ahead
At present, we have a positive view of the market opportunities for the short run, as we believe monetary easing by central banks should continue to stimulate growth and support equities.
Our longer-term view is less positive, however, because current loose monetary policies have the potential to lead to rising inflation. Japan is particularly vulnerable because it has become a major importer of energy, and a weaker yen should only make energy supplies more expensive. Moreover, other major industrialized nations may be pressured by their high levels of aggregate debt, which is the combination of government, corporate and household debt. With aging populations and high indebtedness, these economies may be limited in their ability to invest for the future, which puts a damper on their long-term growth prospects.
Country Breakdown (%)
(at February 28, 2013) | |
Australia | | | 6.7 | | |
Brazil | | | 0.5 | | |
Canada | | | 1.2 | | |
China | | | 1.3 | | |
France | | | 10.5 | | |
Germany | | | 8.5 | | |
Greece | | | 0.1 | | |
Hong Kong | | | 2.3 | | |
Ireland | | | 3.5 | | |
Italy | | | 2.6 | | |
Japan | | | 18.4 | | |
Netherlands | | | 2.1 | | |
Norway | | | 1.7 | | |
Philippines | | | 0.6 | | |
Poland | | | 0.7 | | |
Russian Federation | | | 0.6 | | |
Singapore | | | 1.7 | | |
South Korea | | | 3.0 | | |
Spain | | | 3.9 | | |
Sweden | | | 2.9 | | |
Switzerland | | | 5.4 | | |
Thailand | | | 1.5 | | |
United Arab Emirates | | | 0.9 | | |
United Kingdom | | | 16.9 | | |
United States | | | 2.5 | | |
Total | | | 100.0 | | |
Percentages indicated are based upon total investments. The Fund's portfolio composition is subject to change.
Annual Report 2013
5
Columbia Overseas Value Fund
Manager Discussion of Fund Performance (continued)
Summary of Investments in Securities
by Industry (%)
(at February 28, 2013) | |
Aerospace & Defense | | | 1.1 | | |
Auto Components | | | 1.2 | | |
Automobiles | | | 2.0 | | |
Biotechnology | | | 0.8 | | |
Capital Markets | | | 1.7 | | |
Chemicals | | | 1.5 | | |
Commercial Banks | | | 23.0 | | |
Construction & Engineering | | | 2.2 | | |
Containers & Packaging | | | 1.1 | | |
Diversified Financial Services | | | 2.5 | | |
Diversified Telecommunication
Services | | | 1.8 | | |
Electric Utilities | | | 1.5 | | |
Electronic Equipment,
Instruments & Components | | | 0.9 | | |
Energy Equipment & Services | | | 1.5 | | |
Food & Staples Retailing | | | 2.5 | | |
Food Products | | | 0.5 | | |
Household Durables | | | 1.1 | | |
Independent Power
Producers & Energy Traders | | | 0.6 | | |
Industrial Conglomerates | | | 1.1 | | |
Insurance | | | 7.9 | | |
Internet & Catalog Retail | | | 1.4 | | |
IT Services | | | 0.7 | | |
Machinery | | | 3.2 | | |
Media | | | 1.9 | | |
Metals & Mining | | | 3.9 | | |
Office Electronics | | | 0.9 | | |
Oil, Gas & Consumable Fuels | | | 12.0 | | |
Pharmaceuticals | | | 9.3 | | |
Real Estate Management &
Development | | | 3.2 | | |
Specialty Retail | | | 1.0 | | |
Textiles, Apparel & Luxury
Goods | | | 1.3 | | |
Trading Companies &
Distributors | | | 1.0 | | |
Water Utilities | | | 0.5 | | |
Wireless Telecommunication
Services | | | 2.6 | | |
Money Market Funds | | | 0.5 | | |
Total | | | 99.9 | | |
Percentages indicated are based upon net assets. The Fund's portfolio composition is subject to change.
Annual Report 2013
6
Columbia Overseas Value Fund
Understanding Your Fund's Expenses
(Unaudited)
As an investor, you incur two types of costs. There are transaction costs, which generally include sales charges on purchases and may include redemption fees. There are also ongoing costs, which generally include management fees, distribution and service (Rule 12b-1) fees, and other fund expenses. The following information is intended to help you understand your ongoing costs (in dollars) of investing in the Fund and to help you compare these costs with the ongoing costs of investing in other mutual funds.
Analyzing Your Fund's Expenses
To illustrate these ongoing costs, we have provided examples and calculated the expenses paid by investors in each share class of the Fund during the period. The actual and hypothetical information in the table is based on an initial investment of $1,000 at the beginning of the period indicated and held for the entire period. Expense information is calculated two ways and each method provides you with different information. The amount listed in the "Actual" column is calculated using the Fund's actual operating expenses and total return for the period. You may use the Actual information, together with the amount invested, to estimate the expenses that you paid over the period. Simply divide your account value by $1,000 (for example, an $8,600 account value divided by $1,000 = 8.6), then multiply the results by the expenses paid during the period under the Actual column. The amount listed in the "Hypothetical" column assumes a 5% annual rate of return before expenses (which is not the Fund's actual return) and then applies the Fund's actual expense ratio for the period to the hypothetical return. You should not use the hypothetical account values and expenses to estimate either your actual account balance at the end of the period or the expenses you paid during the period. See "Compare With Other Funds" below for details on how to use the hypothetical data.
Compare With Other Funds
Since all mutual funds are required to include the same hypothetical calculations about expenses in shareholder reports, you can use this information to compare the ongoing cost of investing in the Fund with other funds. To do so, compare the hypothetical example with the 5% hypothetical examples that appear in the shareholder reports of other funds. As you compare hypothetical examples of other funds, it is important to note that hypothetical examples are meant to highlight the ongoing costs of investing in a fund only and do not reflect any transaction costs, such as sales charges, or redemption or exchange fees. Therefore, the hypothetical calculations are useful in comparing ongoing costs only, and will not help you determine the relative total costs of owning different funds. If transaction costs were included in these calculations, your costs would be higher.
September 1, 2012 – February 28, 2013
| | Account Value at the Beginning
of the Period ($) | | Account Value at the End of the
Period ($) | | Expenses Paid During the
Period ($) | | Fund's Annualized
Expense Ratio (%) | |
| | Actual | | Hypothetical | | Actual | | Hypothetical | | Actual | | Hypothetical | | Actual | |
Class I | | | 1,000.00 | | | | 1,000.00 | | | | 1,133.90 | | | | 1,018.99 | | | | 6.19 | | | | 5.86 | | | | 1.17 | | |
Class W | | | 1,000.00 | | | | 1,000.00 | | | | 1,131.80 | | | | 1,017.60 | | | | 7.66 | | | | 7.25 | | | | 1.45 | | |
Class Z | | | 1,000.00 | | | | 1,000.00 | | | | 1,133.70 | | | | 1,019.04 | | | | 6.14 | | | | 5.81 | | | | 1.16 | | |
Expenses paid during the period are equal to the annualized expense ratio for each class as indicated above, multiplied by the average account value over the period and then multiplied by the number of days in the Fund's most recent fiscal half year and divided by 365.
Expenses do not include fees and expenses incurred indirectly by the Fund from the underlying funds in which the Fund may invest (also referred to as "acquired funds"), including affiliated and non-affiliated pooled investment vehicles (including mutual funds and exchange-traded funds).
Had Columbia Management Investment Advisers, LLC and/or certain of its affiliates not waived/reimbursed certain fees and expenses, account value at the end of the period would have been reduced.
Columbia Management Investment Advisers, LLC and/or certain of its affiliates have contractually agreed to waive certain fees and to absorb certain expenses until June 30, 2014, unless sooner terminated at the sole discretion of the Fund's Board, such that net expenses (excluding fees and expenses of acquired funds) will not exceed 0.96% for Class I. Any amounts waived will not be reimbursed by the Fund. This change becomes effective March 16, 2013. If this change had been in place for the entire six month period ended February 28, 2013, the actual expenses paid would have been $5.08 for and the hypothetical expenses paid would have been $4.81 for Class I. See Note 3 to Notes to Financial Statements for expense waiver details. Other share classes may have had expense waiver changes; however, the changes were not considered material.
Annual Report 2013
7
Columbia Overseas Value Fund
Portfolio of Investments
February 28, 2013
(Percentages represent value of investments compared to net assets)
Common Stocks 98.9%
Issuer | | Shares | | Value ($) | |
Australia 6.7% | |
Australia and New Zealand Banking
Group Ltd. | | | 23,799 | | | | 695,983 | | |
BlueScope Steel Ltd.(a) | | | 49,670 | | | | 229,894 | | |
Commonwealth Bank of Australia | | | 5,079 | | | | 348,143 | | |
National Australia Bank Ltd. | | | 14,172 | | | | 436,143 | | |
Westpac Banking Corp. | | | 8,093 | | | | 253,887 | | |
Total | | | | | 1,964,050 | | |
Brazil 0.5% | |
Cia de Saneamento Basico do
Estado de Sao Paulo(a) | | | 3,000 | | | | 145,453 | | |
Canada 1.2% | |
Centerra Gold, Inc. | | | 5,417 | | | | 35,194 | | |
Eastern Platinum Ltd.(a) | | | 692,061 | | | | 130,863 | | |
Yamana Gold, Inc. | | | 12,217 | | | | 179,712 | | |
Total | | | | | 345,769 | | |
China 1.3% | |
Asian Citrus Holdings Ltd. | | | 298,000 | | | | 142,729 | | |
China Communications Construction Co.,
Ltd., Class H | | | 193,000 | | | | 182,496 | | |
Shanghai Mechanical and Electrical
Industry Co., Ltd. | | | 51,000 | | | | 60,128 | | |
Total | | | | | 385,353 | | |
France 10.5% | |
AXA SA | | | 24,382 | | | | 421,797 | | |
BNP Paribas SA | | | 9,285 | | | | 519,349 | | |
CNP Assurances | | | 14,563 | | | | 216,437 | | |
Metropole Television SA | | | 13,436 | | | | 219,925 | | |
Sanofi | | | 8,587 | | | | 810,938 | | |
Total SA | | | 17,350 | | | | 866,211 | | |
Total | | | | | 3,054,657 | | |
Germany 8.5% | |
Allianz SE, Registered Shares | | | 3,870 | | | | 527,621 | | |
Aurubis AG | | | 3,110 | | | | 217,721 | | |
BASF SE | | | 2,592 | | | | 243,432 | | |
Bayerische Motoren Werke AG | | | 2,297 | | | | 211,188 | | |
Deutsche Bank AG, Registered Shares | | | 4,811 | | | | 219,644 | | |
Deutsche Telekom AG, Registered Shares | | | 20,018 | | | | 214,523 | | |
Freenet AG | | | 8,170 | | | | 182,179 | | |
Common Stocks (continued)
Issuer | | Shares | | Value ($) | |
Gildemeister AG | | | 9,577 | | | | 236,435 | | |
KHD Humboldt Wedag International AG | | | 39,685 | | | | 241,940 | | |
Siemens AG, Registered Shares | | | 1,853 | | | | 192,325 | | |
Total | | | | | 2,487,008 | | |
Greece 0.1% | |
National Bank of Greece SA(a) | | | 25,701 | | | | 32,767 | | |
Hong Kong 2.3% | |
Hongkong Land Holdings Ltd. | | | 32,000 | | | | 246,797 | | |
K Wah International Holdings Ltd. | | | 317,000 | | | | 181,692 | | |
Wharf Holdings Ltd. | | | 29,000 | | | | 253,282 | | |
Total | | | | | 681,771 | | |
Ireland 3.5% | |
DCC PLC | | | 3,735 | | | | 131,292 | | |
Dragon Oil PLC | | | 33,789 | | | | 316,016 | | |
Jazz Pharmaceuticals PLC(a) | | | 4,498 | | | | 261,694 | | |
Smurfit Kappa Group PLC | | | 20,635 | | | | 320,029 | | |
Total | | | | | 1,029,031 | | |
Italy 2.6% | |
ENI SpA | | | 15,254 | | | | 347,177 | | |
Recordati SpA | | | 21,522 | | | | 213,303 | | |
UniCredit SpA(a) | | | 41,476 | | | | 209,206 | | |
Total | | | | | 769,686 | | |
Japan 18.4% | |
Aisin Seiki Co., Ltd. | | | 6,400 | | | | 231,628 | | |
Arnest One Corp. | | | 19,700 | | | | 323,665 | | |
Canon, Inc. | | | 6,900 | | | | 249,707 | | |
CyberAgent, Inc. | | | 67 | | | | 124,549 | | |
Daiichikosho Co., Ltd. | | | 8,400 | | | | 217,409 | | |
Fuji Heavy Industries Ltd. | | | 20,000 | | | | 299,460 | | |
Fuji Machine Manufacturing Co., Ltd. | | | 21,300 | | | | 168,047 | | |
Fuyo General Lease Co., Ltd. | | | 8,700 | | | | 310,003 | | |
Hino Motors Ltd. | | | 10,000 | | | | 105,634 | | |
Hitachi Ltd. | | | 45,000 | | | | 252,223 | | |
Honda Motor Co., Ltd. | | | 2,400 | | | | 89,757 | | |
ITOCHU Corp. | | | 25,500 | | | | 294,237 | | |
Japan Petroleum Exploration Co. | | | 4,100 | | | | 155,370 | | |
Kato Sangyo Co., Ltd. | | | 11,200 | | | | 209,722 | | |
Kinki Sharyo Co., Ltd. | | | 48,000 | | | | 155,244 | | |
The accompanying Notes to Financial Statements are an integral part of this statement.
Annual Report 2013
8
Columbia Overseas Value Fund
Portfolio of Investments (continued)
February 28, 2013
Common Stocks (continued)
Issuer | | Shares | | Value ($) | |
Mitsubishi UFJ Financial Group, Inc. | | | 60,100 | | | | 333,100 | | |
Nippon Telegraph & Telephone Corp. | | | 4,400 | | | | 201,048 | | |
Otsuka Holdings Co., Ltd. | | | 6,500 | | | | 208,218 | | |
Shinko Plantech Co., Ltd. | | | 29,500 | | | | 243,936 | | |
Sumitomo Mitsui Financial Group, Inc. | | | 15,000 | | | | 598,636 | | |
Totetsu Kogyo Co., Ltd | | | 7,900 | | | | 113,829 | | |
Tsuruha Holdings, Inc. | | | 2,100 | | | | 181,942 | | |
Xebio Co., Ltd. | | | 7,000 | | | | 136,949 | | |
Yodogawa Steel Works Ltd. | | | 46,000 | | | | 170,639 | | |
Total | | | | | 5,374,952 | | |
Netherlands 2.1% | |
ING Groep NV-CVA(a) | | | 35,628 | | | | 285,231 | | |
Koninklijke Ahold NV | | | 22,922 | | | | 328,929 | | |
Total | | | | | 614,160 | | |
Norway 1.7% | |
Atea ASA | | | 16,832 | | | | 192,107 | | |
Electromagnetic GeoServices AS(a) | | | 112,707 | | | | 188,104 | | |
Kongsberg Automotive Holding ASA(a) | | | 423,931 | | | | 108,308 | | |
Total | | | | | 488,519 | | |
Philippines 0.6% | |
Energy Development Corp. | | | 957,600 | | | | 178,521 | | |
Poland 0.7% | |
PGE SA | | | 38,411 | | | | 195,985 | | |
Russian Federation 0.6% | |
Sberbank of Russia, ADR | | | 12,601 | | | | 173,153 | | |
Singapore 1.7% | |
Ausgroup Ltd. | | | 263,000 | | | | 112,423 | | |
DBS Group Holdings Ltd. | | | 31,400 | | | | 381,835 | | |
Total | | | | | 494,258 | | |
South Korea 3.0% | |
Capro Corp. | | | 6,930 | | | | 73,238 | | |
GS Home Shopping, Inc. | | | 889 | | | | 159,236 | | |
Hyundai Home Shopping Network Corp. | | | 2,080 | | | | 260,302 | | |
LG Fashon Corp. | | | 4,147 | | | | 113,467 | | |
Youngone Holdings Co., Ltd. | | | 3,949 | | | | 253,827 | | |
Total | | | | | 860,070 | | |
Common Stocks (continued)
Issuer | | Shares | | Value ($) | |
Spain 3.9% | |
Banco Santander SA | | | 75,419 | | | | 571,062 | | |
Duro Felguera SA | | | 30,904 | | | | 213,672 | | |
Iberdrola SA | | | 49,313 | | | | 243,334 | | |
Telefonica SA | | | 9,271 | | | | 121,008 | | |
Total | | | | | 1,149,076 | | |
Sweden 2.9% | |
MQ Holding AB | | | 51,424 | | | | 142,686 | | |
Nordea Bank AB | | | 33,247 | | | | 383,549 | | |
Saab AB, Class B | | | 14,758 | | | | 323,778 | | |
Total | | | | | 850,013 | | |
Switzerland 5.4% | |
Baloise Holding AG, Registered Shares | | | 2,480 | | | | 222,113 | | |
Novartis AG, Registered Shares | | | 9,673 | | | | 655,037 | | |
Roche Holding AG, Genusschein Shares | | | 893 | | | | 204,326 | | |
Zurich Insurance Group AG | | | 1,774 | | | | 484,345 | | |
Total | | | | | 1,565,821 | | |
Thailand 1.5% | |
Bangkok Bank PCL, Foreign
Registered Shares | | | 33,300 | | | | 259,372 | | |
PTT PCL, Foreign Registered Shares | | | 16,300 | | | | 191,794 | | |
Total | | | | | 451,166 | | |
United Arab Emirates 0.9% | |
Emaar Properties PJSC | | | 184,892 | | | | 266,581 | | |
United Kingdom 16.8% | |
Amarin Corp. PLC, ADR(a) | | | 14,181 | | | | 114,724 | | |
AstraZeneca PLC | | | 8,224 | | | | 372,919 | | |
Aviva PLC | | | 57,544 | | | | 309,712 | | |
Barclays PLC | | | 93,313 | | | | 432,965 | | |
| BP PLC | | | 73,268 | | | | 491,300 | | |
HSBC Holdings PLC | | | 96,780 | | | | 1,071,904 | | |
Intermediate Capital Group PLC | | | 48,206 | | | | 284,807 | | |
Lancashire Holdings Ltd. | | | 9,850 | | | | 135,650 | | |
Royal Dutch Shell PLC, Class B | | | 33,799 | | | | 1,137,361 | | |
Vodafone Group PLC | | | 226,476 | | | | 568,046 | | |
Total | | | | | 4,919,388 | | |
The accompanying Notes to Financial Statements are an integral part of this statement.
Annual Report 2013
9
Columbia Overseas Value Fund
Portfolio of Investments (continued)
February 28, 2013
Common Stocks (continued)
Issuer | | Shares | | Value ($) | |
United States 1.5% | |
CF Industries Holdings, Inc. | | | 654 | | | | 131,343 | | |
Onyx Pharmaceuticals, Inc.(a) | | | 1,579 | | | | 118,914 | | |
Stillwater Mining Co.(a) | | | 13,290 | | | | 173,302 | | |
Total | | | | | 423,559 | | |
Total Common Stocks
(Cost: $25,972,889) | | | | | 28,900,767 | | |
Exchange-Traded Funds 0.5%
iShares MSCI EAFE Index Fund | | | 2,410 | | | | 140,214 | | |
Total Exchange-Traded Funds
(Cost: $135,201) | | | | | 140,214 | | |
Money Market Funds 0.5%
| | | Shares | | Value ($) | |
Columbia Short-Term Cash Fund,
0.128%(b)(c)(d) | | | 149,527 | | | | 149,527 | | |
Total Money Market Funds
(Cost: $149,527) | | | | | 149,527 | | |
Total Investments
(Cost: $26,257,617) | | | 29,190,508 | | |
Other Assets & Liabilities, Net | | | 15,833 | | |
Net Assets | | | 29,206,341 | | |
Investments in Derivatives
Open Options Contracts Written at February 28, 2013
Issuer | | Puts/Calls | | Number of
Contracts | | Exercise
Price ($) | | Premium
Received ($) | | Expiration
Date | | Value ($) | |
Vertex Pharmaceuticals, Inc. | | Put | | | 12 | | | | 40 | | | | 1,614 | | | April 2013 | | | 1,740 | | |
Forward Foreign Currency Exchange Contracts Open at February 28, 2013
Counterparty | | Exchange Date | | Currency to
be Delivered | | Currency to
be Received | | Unrealized
Appreciation ($) | | Unrealized
Depreciation ($) | |
Morgan Stanley | | March 14, 2013
| | | 588,826
(USD) | | | | 561,000
(AUD) | | | | —
| | | | (16,243
| ) | |
Morgan Stanley | | March 14, 2013
| | | 282,513
(USD) | | | | 211,000
(EUR) | | | | —
| | | | (7,021
| ) | |
Morgan Stanley | | March 14, 2013
| | | 1,614,737
(USD) | | | | 1,012,000
(GBP) | | | | —
| | | | (79,570
| ) | |
Morgan Stanley | | March 14, 2013
| | | 363,762
(USD) | | | | 32,935,000
(JPY) | | | | —
| | | | (8,415
| ) | |
Morgan Stanley | | March 14, 2013
| | | 30,814
(USD) | | | | 37,000
(NZD) | | | | —
| | | | (247
| ) | |
Morgan Stanley | | March 14, 2013
| | | 294,927
(USD) | | | | 361,000
(SGD) | | | | —
| | | | (3,423
| ) | |
Morgan Stanley | | March 14, 2013
| | | 145,228
(USD) | | | | 261,000
(TRY) | | | | —
| | | | (320
| ) | |
Morgan Stanley | | March 14, 2013
| | | 316,000
(CAD) | | | | 320,292
(USD) | | | | 13,938
| | | | —
| | |
Morgan Stanley | | March 14, 2013
| | | 246,000
(CHF) | | | | 265,329
(USD) | | | | 2,843
| | | | —
| | |
Morgan Stanley | | March 14, 2013
| | | 907,854,000
(KRW) | | | | 857,518
(USD) | | | | 19,647
| | | | —
| | |
The accompanying Notes to Financial Statements are an integral part of this statement.
Annual Report 2013
10
Columbia Overseas Value Fund
Portfolio of Investments (continued)
February 28, 2013
Forward Foreign Currency Exchange Contracts Open at February 28, 2013 (continued)
Counterparty | | Exchange Date | | Currency to
be Delivered | | Currency to
be Received | | Unrealized
Appreciation ($) | | Unrealized
Depreciation ($) | |
Morgan Stanley | | March 14, 2013
| | | 645,000
(PLN) | | | | 207,967
(USD) | | | | 5,152
| | | | —
| | |
Morgan Stanley | | March 14, 2013
| | | 12,344,000
(THB) | | | | 412,581
(USD) | | | | —
| | | | (2,079
| ) | |
Total | | | | | | | | | 41,580 | | | | (117,318 | ) | |
Notes to Portfolio of Investments
(a) Non-income producing.
(b) The rate shown is the seven-day current annualized yield at February 28, 2013.
(c) At February 28, 2013, cash or short-term securities were designated to cover open put and/or call options written.
(d) As defined in the Investment Company Act of 1940, an affiliated company is one in which the Fund owns 5% or more of its outstanding voting securities, or a company which is under common ownership or control with the Fund. Holdings and transactions in these affiliated companies during the year ended February 28, 2013, are as follows:
Issuer | | Beginning
Cost ($) | | Purchase
Cost ($) | | Proceeds
From Sales ($) | | Ending
Cost ($) | | Dividends —
Affiliated
Issuers ($) | | Value ($) | |
Columbia Short-Term Cash Fund | | | — | | | | 4,335,696 | | | | (4,186,169 | ) | | | 149,527 | | | | 122 | | | | 149,527 | | |
Abbreviation Legend
ADR American Depositary Receipt
Currency Legend
AUD Australian Dollar
CAD Canadian Dollar
CHF Swiss Franc
EUR Euro
GBP British Pound
JPY Japanese Yen
KRW Korean Won
NZD New Zealand Dollar
PLN Polish Zloty
SGD Singapore Dollar
THB Thailand Baht
TRY Turkish Lira
USD US Dollar
The accompanying Notes to Financial Statements are an integral part of this statement.
Annual Report 2013
11
Columbia Overseas Value Fund
Portfolio of Investments (continued)
February 28, 2013
Fair Value Measurements
Generally accepted accounting principles (GAAP) require disclosure regarding the inputs and valuation techniques used to measure fair value and any changes in valuation inputs or techniques. In addition, investments shall be disclosed by major category.
The Fund categorizes its fair value measurements according to a three-level hierarchy that maximizes the use of observable inputs and minimizes the use of unobservable inputs by prioritizing that the most observable input be used when available. Observable inputs are those that market participants would use in pricing an investment based on market data obtained from sources independent of the reporting entity. Unobservable inputs are those that reflect the Fund's assumptions about the information market participants would use in pricing an investment. An investment's level within the fair value hierarchy is based on the lowest level of any input that is deemed significant to the asset or liability's fair value measurement. The input levels are not necessarily an indication of the risk or liquidity associated with investments at that level. For example, certain U.S. government securities are generally high quality and liquid, however, they are reflected as Level 2 because the inputs used to determine fair value may not always be quoted prices in an active market.
Fair value inputs are summarized in the three broad levels listed below:
> Level 1 — Valuations based on quoted prices for investments in active markets that the Fund has the ability to access at the measurement date (including NAV for open-end mutual funds). Valuation adjustments are not applied to Level 1 investments.
> Level 2 — Valuations based on other significant observable inputs (including quoted prices for similar securities, interest rates, prepayment speeds, credit risks, etc.).
> Level 3 — Valuations based on significant unobservable inputs (including the Fund's own assumptions and judgment in determining the fair value of investments).
Inputs that are used in determining fair value of an investment may include price information, credit data, volatility statistics, and other factors. These inputs can be either observable or unobservable. The availability of observable inputs can vary between investments, and is affected by various factors such as the type of investment, and the volume and level of activity for that investment or similar investments in the marketplace. The inputs will be considered by the Investment Manager, along with any other relevant factors in the calculation of an investment's fair value. The Fund uses prices and inputs that are current as of the measurement date, which may include periods of market dislocations. During these periods, the availability of prices and inputs may be reduced for many investments. This condition could cause an investment to be reclassified between the various levels within the hierarchy.
Foreign equity securities actively traded in markets where there is a significant delay in the local close relative to the New York Stock Exchange (NYSE) are classified as Level 2. The values of these securities may include an adjustment to reflect the impact of significant market movements following the close of local trading, as described in Note 2 to the financial statements — Security Valuation.
Investments falling into the Level 3 category are primarily supported by quoted prices from brokers and dealers participating in the market for those investments. However, these may be classified as Level 3 investments due to lack of market transparency and corroboration to support these quoted prices. Additionally, valuation models may be used as the pricing source for any remaining investments classified as Level 3. These models rely on one or more significant unobservable inputs and/or significant assumptions by the Investment Manager. Inputs used in valuations may include, but are not limited to, financial statement analysis, capital account balances, discount rates and estimated cash flows, and comparable company data.
Under the direction of the Fund's Board of Trustees (the Board), the Investment Manager's Valuation Committee (the Committee) is responsible for carrying out the valuation procedures approved by the Board. The Committee consists of voting and non-voting members from various groups within the Investment Manager's organization, including operations and accounting, trading and investments, compliance, risk management and legal.
The Committee meets at least monthly to review and approve valuation matters, which may include a description of specific valuation determinations, data regarding pricing information received from approved pricing vendors and brokers and the results of Board-approved valuation control policies and procedures (the Policies). The Policies address, among other things, instances when market quotations are readily available, including recommendations of third party pricing vendors and a determination of appropriate pricing methodologies; events that require specific valuation determinations and assessment of fair value techniques; securities with a potential for stale pricing, including those that are illiquid, restricted, or in default; and the effectiveness of third-party pricing vendors, including periodic reviews of vendors. The Committee meets more frequently, as needed, to discuss additional valuation matters, which may include the need to review back-testing results, review time-sensitive information or approve related valuation actions. The Committee reports to the Board, with members of the Committee meeting with the Board at each of its regularly scheduled meetings to discuss valuation matters and actions during the period, similar to those described earlier.
For investments categorized as Level 3, the Committee monitors information similar to that described above, which may include: (i) data specific to the issuer or comparable issuers, (ii) general market or specific sector news and (iii) quoted prices and specific or similar security transactions. The Committee considers this data and any changes from prior periods in order to assess the reasonableness of observable and unobservable inputs, any assumptions or internal models used to value those securities and changes in fair value. This data is also used to corroborate, when available, information received from approved pricing vendors and brokers. Various factors impact the frequency of monitoring this information (which may occur as often as daily). However, the Committee may determine that changes to inputs, assumptions and models are not required as a result of the monitoring procedures performed.
The accompanying Notes to Financial Statements are an integral part of this statement.
Annual Report 2013
12
Columbia Overseas Value Fund
Portfolio of Investments (continued)
February 28, 2013
Fair Value Measurements (continued)
The following table is a summary of the inputs used to value the Fund's investments at February 28, 2013:
Description | | Level 1
Quoted Prices in Active
Markets for Identical
Assets ($) | | Level 2
Other Significant
Observable Inputs ($) | | Level 3
Significant
Unobservable Inputs ($) | | Total ($) | |
Equity Securities | |
Common Stocks | |
Consumer Discretionary | | | — | | | | 2,892,357 | | | | — | | | | 2,892,357 | | |
Consumer Staples | | | — | | | | 863,323 | | | | — | | | | 863,323 | | |
Energy | | | — | | | | 3,937,268 | | | | — | | | | 3,937,268 | | |
Financials | | | — | | | | 11,066,767 | | | | — | | | | 11,066,767 | | |
Health Care | | | 495,332 | | | | 2,464,740 | | | | — | | | | 2,960,072 | | |
Industrials | | | — | | | | 2,531,479 | | | | — | | | | 2,531,479 | | |
Information Technology | | | — | | | | 694,037 | | | | — | | | | 694,037 | | |
Materials | | | 650,413 | | | | 1,254,953 | | | | — | | | | 1,905,366 | | |
Telecommunication Services | | | — | | | | 1,286,805 | | | | — | | | | 1,286,805 | | |
Utilities | | | 145,453 | | | | 617,840 | | | | — | | | | 763,293 | | |
Exchange-Traded Funds | | | 140,214 | | | | — | | | | — | | | | 140,214 | | |
Total Equity Securities | | | 1,431,412 | | | | 27,609,569 | | | | — | | | | 29,040,981 | | |
Other | |
Money Market Funds | | | 149,527 | | | | — | | | | — | | | | 149,527 | | |
Total Other | | | 149,527 | | | | — | | | | — | | | | 149,527 | | |
Investments in Securities | | | 1,580,939 | | | | 27,609,569 | | | | — | | | | 29,190,508 | | |
Derivatives | |
Assets | |
Forward Foreign Currency
Exchange Contracts | | | — | | | | 41,580 | | | | — | | | | 41,580 | | |
Liabilities | |
Forward Foreign Currency
Exchange Contracts | | | — | | | | (117,318 | ) | | | — | | | | (117,318 | ) | |
Options Contracts Written | | | (1,740 | ) | | | — | | | | — | | | | (1,740 | ) | |
Total | | | 1,579,199 | | | | 27,533,831 | | | | — | | | | 29,113,030 | | |
See the Portfolio of Investments for all investment classifications not indicated in the table.
The Fund's assets assigned to the Level 2 input category are generally valued using the market approach, in which a security's value is determined through reference to prices and information from market transactions for similar or identical assets. These assets include certain foreign securities for which a third party statistical pricing service may be employed for purposes of fair market valuation. The models utilized by the third party statistical pricing service take into account a security's correlation to available market data including, but not limited to, intraday index, ADR, and ETF movements.
There were no transfers of financial assets between Levels 1 and 2 during the period.
Forward foreign currency exchange contracts are valued at unrealized appreciation (depreciation).
The accompanying Notes to Financial Statements are an integral part of this statement.
Annual Report 2013
13
Columbia Overseas Value Fund
Statement of Assets and Liabilities
February 28, 2013
Assets | |
Investments, at value | |
Unaffiliated issuers (identified cost $26,108,090) | | $ | 29,040,981 | | |
Affiliated issuers (identified cost $149,527) | | | 149,527 | | |
Total investments (identified cost $26,257,617) | | | 29,190,508 | | |
Unrealized appreciation on forward foreign currency exchange contracts | | | 41,580 | | |
Receivable for: | |
Investments sold | | | 5,705 | | |
Capital shares sold | | | 10,368 | | |
Dividends | | | 78,388 | | |
Reclaims | | | 26,583 | | |
Prepaid expenses | | | 48,354 | | |
Total assets | | | 29,401,486 | | |
Liabilities | |
Option contracts written, at value (premiums received $1,614) | | | 1,740 | | |
Disbursements in excess of cash | | | 225 | | |
Unrealized depreciation on forward foreign currency exchange contracts | | | 117,318 | | |
Payable for: | |
Investments purchased | | | 8,262 | | |
Capital shares purchased | | | 400 | | |
Investment management fees | | | 632 | | |
Transfer agent fees | | | 3,405 | | |
Administration fees | | | 64 | | |
Compensation of board members | | | 21,476 | | |
Other expenses | | | 41,623 | | |
Total liabilities | | | 195,145 | | |
Net assets applicable to outstanding capital stock | | $ | 29,206,341 | | |
Represented by | |
Paid-in capital | | $ | 32,886,260 | | |
Excess of distributions over net investment income | | | (97,583 | ) | |
Accumulated net realized loss | | | (6,437,587 | ) | |
Unrealized appreciation (depreciation) on: | |
Investments | | | 2,932,891 | | |
Foreign currency translations | | | (1,776 | ) | |
Forward foreign currency exchange contracts | | | (75,738 | ) | |
Options contracts written | | | (126 | ) | |
Total — representing net assets applicable to outstanding capital stock | | $ | 29,206,341 | | |
The accompanying Notes to Financial Statements are an integral part of this statement.
Annual Report 2013
14
Columbia Overseas Value Fund
Statement of Assets and Liabilities (continued)
February 28, 2013
Class A | |
Net assets | | $ | 2,714 | | |
Shares outstanding | | | 355 | | |
Net asset value per share | | $ | 7.65 | | |
Maximum offering price per share(a) | | $ | 8.12 | | |
Class B | |
Net assets | | $ | 2,500 | | |
Shares outstanding | | | 327 | | |
Net asset value per share | | $ | 7.65 | | |
Class C | |
Net assets | | $ | 2,500 | | |
Shares outstanding | | | 327 | | |
Net asset value per share | | $ | 7.65 | | |
Class I | |
Net assets | | $ | 26,513,800 | | |
Shares outstanding | | | 3,466,053 | | |
Net asset value per share | | $ | 7.65 | | |
Class K | |
Net assets | | $ | 2,500 | | |
Shares outstanding | | | 327 | | |
Net asset value per share | | $ | 7.65 | | |
Class W | |
Net assets | | $ | 2,429 | | |
Shares outstanding | | | 318 | | |
Net asset value per share(b) | | $ | 7.65 | | |
Class Z | |
Net assets | | $ | 2,679,898 | | |
Shares outstanding | | | 349,788 | | |
Net asset value per share | | $ | 7.66 | | |
(a) The maximum offering price per share is calculated by dividing the net asset value by 1.0 minus the maximum sales charge of 5.75%.
(b) Net asset value per share rounds to this amount due to fractional shares outstanding.
The accompanying Notes to Financial Statements are an integral part of this statement.
Annual Report 2013
15
Columbia Overseas Value Fund
Statement of Operations
Year Ended February 28, 2013
Net investment income | |
Income: | |
Dividends — unaffiliated issuers | | $ | 1,217,798 | | |
Dividends — affiliated issuers | | | 122 | | |
Foreign taxes withheld | | | (95,520 | ) | |
Total income | | | 1,122,400 | | |
Expenses: | |
Investment management fees | | | 230,197 | | |
Distribution and/or service fees | |
Class W | | | 6 | | |
Transfer agent fees | |
Class Z | | | 36 | | |
Administration fees | | | 23,311 | | |
Compensation of board members | | | 10,164 | | |
Custodian fees | | | 25,858 | | |
Printing and postage fees | | | 24,851 | | |
Registration fees | | | 29,858 | | |
Professional fees | | | 31,842 | | |
Other | | | 13,064 | | |
Total expenses | | | 389,187 | | |
Fees waived or expenses reimbursed by Investment Manager and its affiliates | | | (76,755 | ) | |
Total net expenses | | | 312,432 | | |
Net investment income | | | 809,968 | | |
Realized and unrealized gain (loss) — net | |
Net realized gain (loss) on: | |
Investments | | | (629,914 | ) | |
Foreign currency translations | | | (24,382 | ) | |
Forward foreign currency exchange contracts | | | (136,887 | ) | |
Options contracts written | | | 526 | | |
Net realized loss | | | (790,657 | ) | |
Net change in unrealized appreciation (depreciation) on: | |
Investments | | | 2,411,805 | | |
Foreign currency translations | | | (1,076 | ) | |
Forward foreign currency exchange contracts | | | (66,998 | ) | |
Options contracts written | | | (126 | ) | |
Foreign capital gains tax | | | 21,792 | | |
Net change in unrealized appreciation (depreciation) | | | 2,365,397 | | |
Net realized and unrealized gain | | | 1,574,740 | | |
Net increase in net assets resulting from operations | | $ | 2,384,708 | | |
The accompanying Notes to Financial Statements are an integral part of this statement.
Annual Report 2013
16
Columbia Overseas Value Fund
Statement of Changes in Net Assets
| | | Year Ended
February 28,
2013 | | Year Ended
February 29,
2012(a) | |
Operations | |
Net investment income | | $ | 809,968 | | | $ | 1,111,245 | | |
Net realized loss | | | (790,657 | ) | | | (3,236,572 | ) | |
Net change in unrealized appreciation (depreciation) | | | 2,365,397 | | | | (371,989 | ) | |
Net increase (decrease) in net assets resulting from operations | | | 2,384,708 | | | | (2,497,316 | ) | |
Distributions to shareholders | |
Net investment income | |
Class I | | | (619,005 | ) | | | (970,671 | ) | |
Class W | | | (50 | ) | | | (74 | ) | |
Class Z | | | (60,434 | ) | | | (80,114 | ) | |
Total distributions to shareholders | | | (679,489 | ) | | | (1,050,859 | ) | |
Increase (decrease) in net assets from capital stock activity | | | (3,398,069 | ) | | | 25,757,219 | | |
Total increase (decrease) in net assets | | | (1,692,850 | ) | | | 22,209,044 | | |
Net assets at beginning of year | | | 30,899,191 | | | | 8,690,147 | | |
Net assets at end of year | | $ | 29,206,341 | | | $ | 30,899,191 | | |
Excess of distributions over net investment income | | $ | (97,583 | ) | | $ | (73,962 | ) | |
(a) Class I and Class W shares are for the period from March 31, 2011 (commencement of operations) to February 29, 2012.
The accompanying Notes to Financial Statements are an integral part of this statement.
Annual Report 2013
17
Columbia Overseas Value Fund
Statement of Changes in Net Assets (continued)
| | | Year Ended February 28, 2013(a) | | Year Ended February 29, 2012(b) | |
| | | Shares | | Dollars ($) | | Shares | | Dollars ($) | |
Capital stock activity | |
Class A shares | |
Subscriptions | | | 355 | | | | 2,714 | | | | — | | | | — | | |
Net increase | | | 355 | | | | 2,714 | | | | — | | | | — | | |
Class B shares | |
Subscriptions | | | 327 | | | | 2,500 | | | | — | | | | — | | |
Net increase | | | 327 | | | | 2,500 | | | | — | | | | — | | |
Class C shares | |
Subscriptions | | | 327 | | | | 2,500 | | | | — | | | | — | | |
Net increase | | | 327 | | | | 2,500 | | | | — | | | | — | | |
Class I shares | |
Subscriptions | | | 48,851 | | | | 348,518 | | | | 5,156,913 | | | | 40,043,379 | | |
Distributions reinvested | | | 84,884 | | | | 618,950 | | | | 156,044 | | | | 970,591 | | |
Redemptions | | | (599,923 | ) | | | (4,381,289 | ) | | | (1,380,716 | ) | | | (10,437,922 | ) | |
Net increase (decrease) | | | (466,188 | ) | | | (3,413,821 | ) | | | 3,932,241 | | | | 30,576,048 | | |
Class K shares | |
Subscriptions | | | 327 | | | | 2,500 | | | | — | | | | — | | |
Net increase | | | 327 | | | | 2,500 | | | | — | | | | — | | |
Class W shares | |
Subscriptions | | | — | | | | — | | | | 318 | | | | 2,500 | | |
Net increase | | | — | | | | — | | | | 318 | | | | 2,500 | | |
Class Z shares | |
Subscriptions | | | — | | | | — | | | | — | | | | (1,443 | ) | |
Distributions reinvested | | | 839 | | | | 5,538 | | | | 12,859 | | | | 80,114 | | |
Redemptions | | | — | | | | — | | | | (750,789 | ) | | | (4,900,000 | ) | |
Net increase (decrease) | | | 839 | | | | 5,538 | | | | (737,930 | ) | | | (4,821,329 | ) | |
Total net increase (decrease) | | | (464,013 | ) | | | (3,398,069 | ) | | | 3,194,629 | | | | 25,757,219 | | |
(a) Class A, Class B, Class C and Class K shares commenced operations on February 28, 2013.
(b) Class I and Class W shares are for the period from March 31, 2011 (commencement of operations) to February 29, 2012.
The accompanying Notes to Financial Statements are an integral part of this statement.
Annual Report 2013
18
Columbia Overseas Value Fund
The following tables are intended to help you understand the Fund's financial performance. Certain information reflects financial results for a single share of a class held for the periods shown. Per share net investment income (loss) amounts are calculated based on average shares outstanding during the period. Total return assumes reinvestment of all dividends and distributions, if any. Total return does not reflect payment of sales charges, if any, and is not annualized for periods of less than one year.
Class I | | Year Ended
February 28,
2013 | | Year Ended
February 29,
2012(a) | |
Per share data | |
Net asset value, beginning of period | | $ | 7.22 | | | $ | 7.87 | | |
Income from investment operations: | |
Net investment income | | | 0.20 | | | | 0.22 | | |
Net realized and unrealized gain (loss) | | | 0.40 | | | | (0.62 | ) | |
Total from investment operations | | | 0.60 | | | | (0.40 | ) | |
Less distributions to shareholders: | |
Net investment income | | | (0.17 | ) | | | (0.25 | ) | |
Total distributions to shareholders | | | (0.17 | ) | | | (0.25 | ) | |
Net asset value, end of period | | $ | 7.65 | | | $ | 7.22 | | |
Total return | | | 8.49 | % | | | (4.55 | %) | |
Ratios to average net assets(b) | |
Total gross expenses | | | 1.33 | % | | | 1.76 | %(c) | |
Total net expenses(d) | | | 1.07 | % | | | 0.84 | %(c) | |
Net investment income | | | 2.78 | % | | | 3.37 | %(c) | |
Supplemental data | |
Net assets, end of period (in thousands) | | $ | 26,514 | | | $ | 28,376 | | |
Portfolio turnover | | | 46 | % | | | 96 | % | |
Notes to Financial Highlights
(a) For the period from March 31, 2011 (commencement of operations) to February 29, 2012.
(b) In addition to the fees and expenses which the Fund bears directly, the Fund indirectly bears a pro rata share of the fees and expenses of the acquired funds in which it invests. Such indirect expenses are not included in the reported expense ratios.
(c) Annualized.
(d) Total net expenses include the impact of certain waivers/reimbursements made by the Investment Manager and certain of its affiliates, if applicable.
The accompanying Notes to Financial Statements are an integral part of this statement.
Annual Report 2013
19
Columbia Overseas Value Fund
Financial Highlights (continued)
Class W | | Year Ended
February 28,
2013 | | Year Ended
February 29,
2012(a) | |
Per share data | |
Net asset value, beginning of period | | $ | 7.22 | | | $ | 7.87 | | |
Income from investment operations: | |
Net investment income | | | 0.17 | | | | 0.22 | | |
Net realized and unrealized gain (loss) | | | 0.42 | | | | (0.64 | ) | |
Total from investment operations | | | 0.59 | | | | (0.42 | ) | |
Less distributions to shareholders: | |
Net investment income | | | (0.16 | ) | | | (0.23 | ) | |
Total distributions to shareholders | | | (0.16 | ) | | | (0.23 | ) | |
Net asset value, end of period | | $ | 7.65 | | | $ | 7.22 | | |
Total return | | | 8.24 | % | | | (4.81 | %) | |
Ratios to average net assets(b) | |
Total gross expenses | | | 1.58 | % | | | 2.09 | %(c) | |
Total net expenses(d) | | | 1.33 | % | | | 1.12 | %(c) | |
Net investment income | | | 2.46 | % | | | 3.24 | %(c) | |
Supplemental data | |
Net assets, end of period (in thousands) | | $ | 2 | | | $ | 2 | | |
Portfolio turnover | | | 46 | % | | | 96 | % | |
Notes to Financial Highlights
(a) For the period from March 31, 2011 (commencement of operations) to February 29, 2012.
(b) In addition to the fees and expenses which the Fund bears directly, the Fund indirectly bears a pro rata share of the fees and expenses of the acquired funds in which it invests. Such indirect expenses are not included in the reported expense ratios.
(c) Annualized.
(d) Total net expenses include the impact of certain waivers/reimbursements made by the Investment Manager and certain of its affiliates, if applicable.
The accompanying Notes to Financial Statements are an integral part of this statement.
Annual Report 2013
20
Columbia Overseas Value Fund
Financial Highlights (continued)
| | | Year Ended
February 28, | | Year Ended
February 29, | | Year Ended February 28, | |
Class Z | | 2013 | | 2012 | | 2011 | | 2010 | | 2009(a) | |
Per share data | |
Net asset value, beginning of period | | $ | 7.23 | | | $ | 8.00 | | | $ | 6.98 | | | $ | 4.46 | | | $ | 10.00 | | |
Income from investment operations: | |
Net investment income | | | 0.19 | | | | 0.32 | | | | 0.16 | | | | 0.17 | | | | 0.27 | | |
Net realized and unrealized gain (loss) | | | 0.41 | | | | (0.85 | ) | | | 1.01 | | | | 2.63 | | | | (5.56 | ) | |
Total from investment operations | | | 0.60 | | | | (0.53 | ) | | | 1.17 | | | | 2.80 | | | | (5.29 | ) | |
Less distributions to shareholders: | |
Net investment income | | | (0.17 | ) | | | (0.24 | ) | | | (0.15 | ) | | | (0.28 | ) | | | (0.23 | ) | |
Tax return of capital | | | — | | | | — | | | | — | | | | — | | | | (0.02 | ) | |
Total distributions to shareholders | | | (0.17 | ) | | | (0.24 | ) | | | (0.15 | ) | | | (0.28 | ) | | | (0.25 | ) | |
Net asset value, end of period | | $ | 7.66 | | | $ | 7.23 | | | $ | 8.00 | | | $ | 6.98 | | | $ | 4.46 | | |
Total return | | | 8.45 | % | | | (6.17 | %) | | | 17.06 | % | | | 62.60 | % | | | (53.41 | %) | |
Ratios to average net assets(b) | |
Total gross expenses | | | 1.32 | % | | | 1.87 | % | | | 3.65 | % | | | 3.02 | % | | | 3.99 | %(c) | |
Total net expenses(d) | | | 1.07 | % | | | 0.98 | % | | | 1.15 | %(e) | | | 1.14 | %(e) | | | 1.10 | %(c)(e) | |
Net investment income | | | 2.72 | % | | | 3.80 | % | | | 2.18 | % | | | 2.46 | % | | | 3.72 | %(c) | |
Supplemental data | |
Net assets, end of period (in thousands) | | $ | 2,680 | | | $ | 2,521 | | | $ | 8,690 | | | $ | 7,572 | | | $ | 4,664 | | |
Portfolio turnover | | | 46 | % | | | 96 | % | | | 48 | % | | | 62 | % | | | 66 | % | |
Notes to Financial Highlights
(a) For the period from March 31, 2008 (commencement of operations) to February 28, 2009.
(b) In addition to the fees and expenses which the Fund bears directly, the Fund indirectly bears a pro rata share of the fees and expenses of the acquired funds in which it invests. Such indirect expenses are not included in the reported expense ratios.
(c) Annualized.
(d) Total net expenses include the impact of certain waivers/reimbursements made by the Investment Manager and certain of its affiliates, if applicable.
(e) The benefits derived from expense reductions had an impact of less than 0.01%.
The accompanying Notes to Financial Statements are an integral part of this statement.
Annual Report 2013
21
Columbia Overseas Value Fund
Notes to Financial Statements
February 28, 2013
Note 1. Organization
Columbia Overseas Value Fund (the Fund), a series of Columbia Funds Series Trust (the Trust), is a diversified fund. The Trust is registered under the Investment Company Act of 1940, as amended (the 1940 Act), as an open-end management investment company organized as a Delaware statutory trust.
Fund Shares
The Trust may issue an unlimited number of shares (without par value). The Fund offers Class A, Class B, Class C, Class I, Class K, Class W and Class Z shares. All share classes have identical voting, dividend and liquidation rights. Each share class has its own expense structure and sales charges, as applicable.
Class A shares are subject to a maximum front-end sales charge of 5.75% based on the initial investment amount. Class A shares purchased without an initial sales charge in accounts aggregating $1 million to $50 million at the time of purchase are subject to a contingent deferred sales charge (CDSC) if the shares are sold within 18 months of purchase, charged as follows: 1.00% CDSC if redeemed within 12 months of purchase, and 0.50% CDSC if redeemed more than 12, but less than 18, months after purchase. Class A shares commenced operations on February 28, 2013.
Class B shares may be subject to a maximum CDSC of 5.00% based upon the holding period after purchase. Class B shares will generally convert to Class A shares eight years after purchase. The Fund no longer accepts investments by new or existing investors in the Fund's Class B shares, except in connection with the reinvestment of any dividend and/or capital gain distributions in Class B shares of the Fund and exchanges by existing Class B shareholders of certain other funds within the Columbia Family of Funds. Class B shares commenced operations on February 28, 2013.
Class C shares are subject to a 1.00% CDSC on shares redeemed within one year of purchase. Class C shares commenced operations on February 28, 2013.
Class I shares are not subject to sales charges and are only available to the Columbia Family of Funds.
Class K shares are not subject to sales charges and are closed to new investors. Class K shares commenced operations on February 28, 2013.
Class W shares are not subject to sales charges and are only available to investors purchasing through authorized investment programs managed by investment professionals, including discretionary managed account programs.
Class Z shares are not subject to sales charges, and are only available to certain investors.
Note 2. Summary of Significant Accounting Policies
Use of Estimates
The preparation of financial statements in accordance with U.S. generally accepted accounting principles (GAAP) requires management to make certain estimates and assumptions that affect the reported amounts of assets and liabilities, the disclosure of contingent assets and liabilities at the date of the financial statements and the reported amounts of revenue and expenses during the reporting period. Actual results could differ from those estimates.
The following is a summary of significant accounting policies consistently followed by the Fund in the preparation of its financial statements.
Security Valuation
All equity securities are valued at the close of business of the New York Stock Exchange (NYSE). Equity securities are valued at the last quoted sales price on the principal exchange or market on which they trade, except for securities traded on the NASDAQ Stock Market, which are valued at the NASDAQ official close price. Unlisted securities or listed securities for which there were no sales during the day are valued at the mean of the latest quoted bid and ask prices on such exchanges or markets.
Foreign securities are valued based on quotations from the principal market in which such securities are normally traded. If any foreign share prices are not readily available as a result of limited share activity the securities are valued at the mean of the latest quoted bid and ask prices on such exchanges or markets. Foreign currency exchange rates are generally determined at 4:00 p.m. Eastern (U.S.) time. However, many securities markets and exchanges outside the U.S. close prior to the close of the NYSE; therefore, the closing prices for securities in such markets or on such exchanges may not fully reflect events that occur after such close but before the close of the NYSE. In those situations, foreign securities will be fair valued pursuant to the policy adopted by the Board of Trustees (the Board), including utilizing a third party pricing service to determine these fair values. The third party pricing service takes into account multiple factors, including, but not limited to, movements in the U.S. securities markets, certain depositary receipts, futures contracts and foreign exchange rates that have occurred subsequent to the close of the foreign exchange or market, to determine a good faith estimate that reasonably reflects the current market conditions as of the close of the NYSE. The fair value of a security is likely to be different from the quoted or published price, if available.
Investments in other open-end investment companies, including money market funds, are valued at net asset value.
Annual Report 2013
22
Columbia Overseas Value Fund
Notes to Financial Statements (continued)
February 28, 2013
Forward foreign currency exchange contracts are marked-to-market based upon foreign currency exchange rates provided by a pricing service.
Option contracts are valued at the mean of the latest quoted bid and asked prices on their primary exchanges. Option contracts, including over-the-counter (OTC) option contracts, with no readily available market value are valued using quotations obtained from independent brokers as of the close of the NYSE.
Investments for which market quotations are not readily available, or that have quotations which management believes are not reliable, are valued at fair value as determined in good faith under consistently applied procedures established by and under the general supervision of the Board. If a security or class of securities (such as foreign securities) is valued at fair value, such value is likely to be different from the last quoted market price for the security.
The determination of fair value often requires significant judgment. To determine fair value, management may use assumptions including but not limited to future cash flows and estimated risk premiums. Multiple inputs from various sources may be used to determine fair value.
Foreign Currency Transactions and Translations
The values of all assets and liabilities denominated in foreign currencies are translated into U.S. dollars at that day's exchange rates. Net realized and unrealized gains (losses) on foreign currency transactions and translations include gains (losses) arising from the fluctuation in exchange rates between trade and settlement dates on securities transactions, gains (losses) arising from the disposition of foreign currency and currency gains (losses) between the accrual and payment dates on dividends, interest income and foreign withholding taxes.
For financial statement purposes, the Fund does not distinguish that portion of gains (losses) on investments which is due to changes in foreign exchange rates from that which is due to changes in market prices of the investments. Such fluctuations are included with the net realized and unrealized gains (losses) on investments in the Statement of Operations.
Derivative Instruments
The Fund invests in certain derivative instruments, as detailed below, to meet its investment objectives. Derivatives are instruments whose values depend on, or are derived from, in whole or in part, the value of one or more other assets, such as securities, currencies, commodities or indices. Derivative instruments may be used to maintain cash reserves while maintaining exposure to certain other assets, to offset anticipated declines in values of investments, to facilitate trading, to reduce transaction costs and to pursue higher investment returns. The Fund may also use derivative
instruments to mitigate certain investment risks, such as foreign currency exchange rate risk, interest rate risk and credit risk. Derivatives may involve various risks, including the potential inability of the counterparty to fulfill its obligation under the terms of the contract, the potential for an illiquid secondary market and the potential for market movements which may expose the Fund to gains or losses in excess of the amount shown in the Statement of Assets and Liabilities.
The Fund and any counterparty are required to maintain an agreement that requires the Fund and that counterparty to monitor (on a daily basis) the net fair value of all derivatives entered into pursuant to the agreement between the Fund and such counterparty. If the net fair value of such derivatives between the Fund and that counterparty exceeds a certain threshold (as defined in the agreement), the Fund or the counterparty (as the case may be) is required to post cash and/or securities as collateral. Fair values of derivatives presented in the financial statements are not netted with the fair value of other derivatives or with any collateral amounts posted by the Fund or any counterparty.
Forward Foreign Currency Exchange Contracts
Forward foreign currency exchange contracts are agreements between two parties to buy and sell a currency at a set price on a future date. These contracts are intended to be used to minimize the exposure to foreign exchange rate fluctuations during the period between the trade and settlement dates of the contract. The Fund utilized forward foreign currency exchange contracts to hedge the currency exposure associated with some or all of the Fund's securities and to shift investment exposure from one currency to another.
The values of forward foreign currency exchange contracts fluctuate with changes in foreign currency exchange rates. The Fund will record a realized gain or loss when the forward foreign currency exchange contract expires or is closed.
The use of forward foreign currency exchange contracts does not eliminate fluctuations in the prices of the Fund's portfolio securities. The risks of forward foreign currency exchange contracts include movement in the values of the foreign currencies relative to the U.S. dollar (or other foreign currencies) and the possibility that counterparties will not complete their contractual obligations, which may be in excess of the amount reflected, if any, in the Statement of Assets and Liabilities.
Options Contracts
Options are contracts which entitle the holder to purchase or sell securities or other identified assets at a specified price, or in the case of index option contracts, to receive or pay the difference between the index value and the strike price of the index option contract. The Fund purchased and wrote option
Annual Report 2013
23
Columbia Overseas Value Fund
Notes to Financial Statements (continued)
February 28, 2013
contracts to decrease the Fund's exposure to equity risk and to increase return on investments, to facilitate buying and selling of securities for investments and to establish exposures in the Fund where options provide a more efficient exposure than the underlying securities or where direct exposure is not available such as with the volatility index (VIX). Completion of transactions for option contracts traded in the OTC market depends upon the performance of the other party. Cash collateral may be collected or posted by the Fund to secure certain OTC option contract trades. Cash collateral held or posted by the Fund for such option contract trades must be returned to the counterparty or the Fund upon closure, exercise or expiration of the contract.
Option contracts purchased are recorded as investments and options contracts written are recorded as liabilities of the Fund. The Fund will realize a gain or loss when the option contract expires. When option contracts are exercised, the proceeds on sales for a written call or purchased put option contract, or the purchase cost for a written put or purchased call option contract, is adjusted by the amount of premium received or paid.
The risk in buying an option contract is that the Fund pays a premium whether or not the option contract is exercised. The Fund also has the additional risk of being unable to enter into a closing transaction if a liquid secondary market does not exist. The risk in writing a call option contract is that the Fund gives up the opportunity for profit if the market price of the security increases. The risk in writing a put option contract is that the Fund may incur a loss if the market price of the security decreases and the option contract is exercised. The Fund's maximum payout in the case of written put option contracts represents the maximum potential amount of future payments (undiscounted) that the Fund could be required to make under the contract. For OTC options contracts, the transaction is also subject to counterparty credit risk. The maximum payout amount may be offset by the subsequent sale, if any, of assets obtained upon the exercise of the put option contracts by holders of the option contracts or proceeds received upon entering into the contracts. The maximum payout amount was $48,000 at February 28, 2013.
Contracts and premiums associated with options contracts written for the year ended February 28, 2013 are as follows:
| | | Calls | | Puts | |
| | | Contracts | | Premiums | | Contracts | | Premiums | |
Balance at
February 29, 2012 | | | — | | | $ | — | | | | — | | | $ | — | | |
Opened | | | 15 | | | | 60 | | | | 48 | | | | 2,080 | | |
Expired | | | (15 | ) | | | (60 | ) | | | (36 | ) | | | (466 | ) | |
Balance at
February 28, 2013 | | | — | | | $ | — | | | | 12 | | | $ | 1,614 | | |
Effects of Derivative Transactions in the Financial Statements
The following tables are intended to provide additional information about the effect of derivatives on the financial statements of the Fund, including: the fair value of derivatives by risk category and the location of those fair values in the Statement of Assets and Liabilities; the impact of derivative transactions on the Fund's operations over the period including realized gains or losses and unrealized gains or losses. The derivative schedules following the Portfolio of Investments present additional information regarding derivative instruments outstanding at the end of the period, if any.
The following table is a summary of the fair value of derivative instruments at February 28, 2013:
| | Asset Derivatives | |
Risk Exposure
Category | | Statement of Assets and
Liabilities Location | |
Fair Value ($) | |
Foreign exchange
contracts | | Unrealized appreciation on
forward foreign currency
exchange contracts | | | 41,580
| | |
| | Liability Derivatives | |
Risk Exposure
Category | | Statement of Assets and
Liabilities Location | |
Fair Value ($) | |
Equity contracts | | Options contracts written,
at value | | | 1,740
| | |
Foreign exchange
contracts | | Unrealized depreciation on
forward foreign currency
exchange contracts | | | 117,318
| | |
Total | | | | | | | 119,058 | | |
The effect of derivative instruments in the Statement of Operations for the annual ended February 28, 2013:
Amount of Realized Gain (Loss) on Derivatives Recognized in Income | |
Risk Exposure
Category | | Forward Foreign
Currency
Exchange
Contracts ($) | | Options
Contracts
Written and
Purchased ($) | | Total ($) | |
Equity contracts | | | — | | | | (52,821 | ) | | | (52,821 | ) | |
Foreign exchange
contracts | | | (136,887
| ) | | | —
| | | | (136,887
| ) | |
Total | | | (136,887 | ) | | | (52,821 | ) | | | (189,708 | ) | |
Change in Unrealized Appreciation (Depreciation) on Derivatives
Recognized in Income | |
Risk Exposure
Category | | Forward Foreign
Currency
Exchange
Contracts ($) | | Options
Contracts
Written and
Purchased ($) | | Total ($) | |
Equity contracts | | | — | | | | 11,814 | | | | 11,814 | | |
Foreign exchange
contracts | | | (66,998
| ) | | | —
| | | | (66,998
| ) | |
Total | | | (66,998 | ) | | | 11,814 | | | | (55,184 | ) | |
Annual Report 2013
24
Columbia Overseas Value Fund
Notes to Financial Statements (continued)
February 28, 2013
The following table is a summary of the volume of derivative instruments for the annual ended February 28, 2013:
Derivative Instrument | | Contracts Opened | |
Forward foreign currency exchange contracts | | | 131 | | |
Options contracts | | | 582 | | |
Security Transactions
Security transactions are accounted for on the trade date. Cost is determined and gains (losses) are based upon the specific identification method for both financial statement and federal income tax purposes.
Income Recognition
Corporate actions and dividend income are recorded net of any non-reclaimable tax withholdings, on the ex-dividend date or upon receipt of ex-dividend notification in the case of certain foreign securities.
Awards from class action litigation are recorded as a reduction of cost basis if the Fund still owns the applicable securities on the payment date. If the Fund no longer owns the applicable securities, the proceeds are recorded as realized gains.
Expenses
General expenses of the Trust are allocated to the Fund and other funds of the Trust based upon relative net assets or other expense allocation methodologies determined by the nature of the expense. Expenses directly attributable to the Fund are charged to the Fund. Expenses directly attributable to a specific class of shares are charged to that share class.
Determination of Class Net Asset Value
All income, expenses (other than class-specific expenses, which are charged to that share class, as shown in the Statement of Operations) and realized and unrealized gains (losses) are allocated to each class of the Fund on a daily basis, based on the relative net assets of each class, for purposes of determining the net asset value of each class.
Federal Income Tax Status
The Fund intends to qualify each year as a regulated investment company under Subchapter M of the Internal Revenue Code, as amended, and will distribute substantially all of its tax exempt and taxable income (including net short-term capital gains), if any, for its tax year, and as such will not be subject to federal income taxes. In addition, the Fund intends to distribute in each calendar year substantially all of its net investment income, capital gains and certain other amounts, if any, such that the Fund should not be subject to federal excise tax. Therefore, no federal income or excise tax provision is recorded.
Foreign Taxes
The Fund may be subject to foreign taxes on income, gains on investments or currency repatriation, a portion of which may be recoverable. The Fund will accrue such taxes and recoveries, as applicable, based upon its current interpretation of tax rules and regulations that exist in the markets in which it invests.
Realized gains in certain countries may be subject to foreign taxes at the Fund level, based on statutory rates. The Fund accrues for such foreign taxes on net realized and unrealized gains at the appropriate rate for each jurisdiction, as applicable. The amount, if any, is disclosed as a liability on the Statement of Assets and Liabilities.
Distributions to Shareholders
Distributions from net investment income, if any, are declared and paid annually. Net realized capital gains, if any, are distributed along with the income distribution. Income distributions and capital gain distributions are determined in accordance with federal income tax regulations, which may differ from GAAP.
Guarantees and Indemnifications
Under the Trust's organizational documents and, in some cases, by contract, its officers and trustees are indemnified against certain liabilities arising out of the performance of their duties to the Trust or its funds. In addition, certain of the Fund's contracts with its service providers contain general indemnification clauses. The Fund's maximum exposure under these arrangements is unknown since the amount of any future claims that may be made against the Fund cannot be determined, and the Fund has no historical basis for predicting the likelihood of any such claims.
Recent Accounting Pronouncement
Disclosures about Offsetting Assets and Liabilities
In December 2011, the Financial Accounting Standards Board (FASB) issued Accounting Standards Update (ASU) No. 2011-11, Disclosures about Offsetting Assets and Liabilities. The objective of the FASB is to enhance current disclosure requirements on offsetting of certain assets and liabilities and to enable financial statement users to compare financial statements prepared under GAAP and International Financial Reporting Standards.
Specifically, ASU No. 2011-11 requires an entity to disclose both gross and net information for derivatives and other financial instruments that are subject to a master netting arrangement or similar agreement. The standard requires disclosure of collateral received in connection with the master netting agreements or similar agreements. The effective date
Annual Report 2013
25
Columbia Overseas Value Fund
Notes to Financial Statements (continued)
February 28, 2013
of ASU No. 2011-11 is for interim and annual periods beginning on or after January 1, 2013. At this time, management is evaluating the implications of this guidance and the impact it will have on the financial statement amounts and footnote disclosures, if any.
Note 3. Fees and Compensation Paid to Affiliates
Investment Management Fees
Under an Investment Management Services Agreement, Columbia Management Investment Advisers, LLC (the Investment Manager), a wholly-owned subsidiary of Ameriprise Financial, Inc. (Ameriprise Financial), determines which securities will be purchased, held or sold. The investment management fee is an annual fee that is equal to a percentage of the Fund's average daily net assets that declines from 0.79% to 0.62% as the Fund's net assets increase. The effective investment management fee rate for the year ended February 28, 2013 was 0.79% of the Fund's average daily net assets.
Administration Fees
Under an Administrative Services Agreement, the Investment Manager also serves as the Fund Administrator. The Fund pays the Fund Administrator an annual fee for administration and accounting services equal to a percentage of the Fund's average daily net assets that declines from 0.08% to 0.05% as the Fund's net assets increase. The effective administration fee rate for the year ended February 28, 2013 was 0.08% of the Fund's average daily net assets.
Other Expenses
Other expenses are for, among other things, certain expenses of the Fund or the Board, including: Fund boardroom and office expense, employee compensation, employee health and retirement benefits, and certain other expenses. Payment of these Fund and Board expenses is facilitated by a company providing limited administrative services to the Fund and the Board. For the year ended February 28, 2013, other expenses paid to this company were $1,231.
Compensation of Board Members
Board members are compensated for their services to the Fund as disclosed in the Statement of Operations. Under a Deferred Compensation Plan (the Plan), the Board members who are not "interested persons" of the Fund, as defined under the 1940 Act, may elect to defer payment of up to 100% of their compensation. Deferred amounts are treated as though equivalent dollar amounts had been invested in shares of certain funds managed by the Investment Manager. The Fund's liability for these amounts is adjusted for market value
changes and remains in the Fund until distributed in accordance with the Plan.
Transfer Agent Fees
Under a Transfer and Dividend Disbursing Agent Agreement, Columbia Management Investment Services Corp. (the Transfer Agent), an affiliate of the Investment Manager and a wholly-owned subsidiary of Ameriprise Financial, is responsible for providing transfer agency services to the Fund. The Transfer Agent has contracted with Boston Financial Data Services (BFDS) to serve as sub-transfer agent.
The Transfer Agent receives monthly account-based service fees based on the number of open accounts and is reimbursed by the Fund for the fees and expenses the Transfer Agent pays to financial intermediaries that maintain omnibus accounts with the Fund that is a percentage of the average aggregate value of the Fund's shares maintained in each such omnibus account (other than omnibus accounts for which American Enterprise Investment Services Inc. is the broker of record or accounts where the beneficial shareholder is a customer of Ameriprise Financial Services, Inc., which are paid a per account fee). The Transfer Agent pays the fees of BFDS for services as sub-transfer agent and is not entitled to reimbursement for such fees from the Fund (with the exception of out-of-pocket fees).
The Transfer Agent also receives compensation from fees for various shareholder services and reimbursements for certain out-of-pocket fees. Class I shares do not pay transfer agent fees. Total transfer agent fees for Class K shares are subject to an annual limitation of not more than 0.05% of the average daily net assets attributable to Class K shares.
For the year ended February 28, 2013, the Fund's effective transfer agent fee rates as a percentage of average daily net assets of each class were as follows:
*Rounds to zero.
An annual minimum account balance fee of $20 may apply to certain accounts with a value below the Fund's initial minimum investment requirements to reduce the impact of small accounts on transfer agent fees. These minimum account balance fees are recorded as part of expense reductions in the Statement of Operations. For the year ended February 28, 2013, no minimum account balance fees were charged by the Fund.
Distribution and Service Fees
The Fund has an agreement with Columbia Management Investment Distributors, Inc. (the Distributor), an affiliate of the Investment Manager and a wholly-owned subsidiary of Ameriprise Financial, for distribution and shareholder
Annual Report 2013
26
Columbia Overseas Value Fund
Notes to Financial Statements (continued)
February 28, 2013
services. Pursuant to Rule 12b-1 under the 1940 Act, the Board of Trustees has approved, and the Fund has adopted, a shareholder service plan (the Plan) which set the service fees for the Fund. These fees are calculated daily and are intended to compensate the Distributor and/or eligible selling and/or servicing agents for selling shares of the Fund and providing services to investors.
The Plans require the payment of a monthly combined distribution and service fee to the Distributor at the maximum annual rate of 0.25% of the average daily net assets attributable to Class A shares of the Fund. The Plans also require the payment of a monthly service fee at the maximum annual rate of 0.25% of the average daily net assets attributable to Class B, Class C and Class W shares of the Fund and the payment of a monthly distribution fee at the maximum annual rate of 0.75%, 0.75% and 0.25% of the average daily net assets attributable to Class B, Class C and Class W shares of the Fund.
The Fund may pay a distribution fee up to 0.25% of the Fund's average daily net assets attributable to Class W shares and a service fee of up to 0.25% of the Fund's average daily net assets attributable to Class W shares, provided, however, that the aggregate fee shall not exceed 0.25% of the Fund's average daily net assets attributable to Class W shares.
Expenses Waived/Reimbursed by the Investment Manager and its Affiliates
Effective July 1, 2012, the Investment Manager and certain of its affiliates have contractually agreed to waive fees and/or reimburse expenses (excluding certain fees and expenses described below), through March 15, 2013, unless sooner terminated at the sole discretion of the Board, so that the Fund's net operating expenses, after giving effect to fees waived/expenses reimbursed and any balance credits and/or overdraft charges from the Fund's custodian, do not exceed the following annual rates as a percentage of the class' average daily net assets:
Class A | | | 1.56 | % | |
Class B | | | 2.31 | | |
Class C | | | 2.31 | | |
Class I | | | 1.31 | | |
Class K | | | 1.61 | | |
Class W | | | 1.56 | | |
Class Z | | | 1.31 | | |
Prior to July 1, 2012, the Investment Manager and certain of its affiliates contractually agreed to waive fees and/or reimburse expenses (excluding certain fees and expenses described below), so that the Fund's net operating expenses,
after giving effect to fees waived/expenses reimbursed and any balance credits and/or overdraft charges from the Fund's custodian, did not exceed the following annual rates as a percentage of the class' average daily net assets:
Class I | | | 0.80 | % | |
Class W | | | 1.25 | | |
Class Z | | | 1.00 | | |
Under the agreement governing these fee waivers and/or expense reimbursement arrangements, the following fees and expenses are excluded from the waiver/reimbursement commitment, and therefore will be paid by the Fund, if applicable: taxes (including foreign transaction taxes), expenses associated with investments in affiliated and non-affiliated pooled investment vehicles (including mutual funds and exchange traded funds), transaction costs and brokerage commissions, costs related to any securities lending program, dividend expenses associated with securities sold short, inverse floater program fees and expenses, transaction charges and interest on borrowed money, interest, extraordinary expenses and any other expenses the exclusion of which is specifically approved by the Board. This agreement may be modified or amended only with approval from all parties.
Effective March 16, 2013, the Investment Manager and certain of its affiliates have contractually agreed to waive fees and/or reimburse expenses in the same manner as above, through June 30, 2014, unless sooner terminated at the sole discretion of the Board, so that the Fund's net operating expenses, after giving effect to fees waived/expenses reimbursed and any balance credits and/or overdraft charges from the Fund's custodian, will not exceed the following annual rates as a percentage of the class' average daily net assets:
Class A | | | 1.41 | % | |
Class B | | | 2.16 | | |
Class C | | | 2.16 | | |
Class I | | | 0.96 | | |
Class K | | | 1.26 | | |
Class W | | | 1.41 | | |
Class Z | | | 1.16 | | |
Note 4. Federal Tax Information
The timing and character of income and capital gain distributions are determined in accordance with income tax regulations, which may differ from GAAP because of temporary or permanent book to tax differences.
At February 28, 2013, these differences are primarily due to differing treatment for capital loss carryforwards, deferral/reversal of wash sales losses, Trustees' deferred
Annual Report 2013
27
Columbia Overseas Value Fund
Notes to Financial Statements (continued)
February 28, 2013
compensation, foreign currency transactions, passive foreign investment company (PFIC) holdings, post-October capital losses and derivative investments. To the extent these differences are permanent, reclassifications are made among the components of the Fund's net assets in the Statement of Assets and Liabilities. Temporary differences do not require reclassifications. In the Statement of Assets and Liabilities the following reclassifications were made:
Excess of distributions over net investment income | | $ | (154,100 | ) | |
Accumulated net realized loss | | | 154,100 | | |
Paid-in capital | | | — | | |
Net investment income and net realized gains (losses), as disclosed in the Statement of Operations, and net assets were not affected by this reclassification.
The tax character of distributions paid during the years indicated was as follows:
Year Ended | | February 28,
2013 | | February 29,
2012 | |
Ordinary income | | $ | 679,489 | | | $ | 1,050,859 | | |
Short-term capital gain distributions, if any, are considered ordinary income distributions for tax purposes.
At February 28, 2013, the components of distributable earnings on a tax basis were as follows:
Undistributed ordinary income | | $ | 8,543 | | |
Accumulated realized loss | | | (5,692,581 | ) | |
Unrealized appreciation | | | 2,032,513 | | |
At February 28, 2013, the cost of investments for federal income tax purposes was $27,157,995 and the aggregate gross unrealized appreciation and depreciation based on that cost was:
Unrealized appreciation | | $ | 3,708,242 | | |
Unrealized depreciation | | | (1,675,729 | ) | |
Net unrealized appreciation | | $ | 2,032,513 | | |
The following capital loss carryforward, determined at February 28, 2013, may be available to reduce taxable income arising from future net realized gains on investments, if any, to the extent permitted by the Internal Revenue Code:
Year of Expiration | | Amount ($) | |
2017 | | | 365,313 | | |
2018 | | | 2,028,503 | | |
Unlimited short-term | | | 2,526,529 | | |
Unlimited long-term | | | 546,941 | | |
Total | | | 5,467,286 | | |
Unlimited capital loss carryforwards are required to be utilized prior to any capital losses which carry an expiration date. As a result of this ordering rule, capital loss
carryforwards which carry an expiration date may be more likely to expire unused.
Under current tax rules, regulated investment companies can elect to treat certain late-year ordinary losses incurred and post-October capital losses (capital losses realized after October 31) as arising on the first day of the following taxable year. As of February 28, 2013, the Fund will elect to treat post-October capital losses of $225,295 as arising on March 1, 2013.
Management of the Fund has concluded that there are no significant uncertain tax positions that would require recognition in the financial statements. However, management's conclusion may be subject to review and adjustment at a later date based on factors including, but not limited to, new tax laws, regulations, and administrative interpretations (including relevant court decisions). Generally, the Fund's federal tax returns for the prior three fiscal years remain subject to examination by the Internal Revenue Service.
Note 5. Portfolio Information
The cost of purchases and proceeds from sales of securities, excluding short-term obligations, aggregated to $13,445,226 and $17,142,245 respectively, for the year ended February 28, 2013.
Note 6. Affiliated Money Market Fund
The Fund invests its daily cash balances in Columbia Short-Term Cash Fund, an affiliated money market fund established for the exclusive use by the Fund and other affiliated funds. The income earned by the Fund from such investments is included as "Dividends — affiliated issuers" in the Statement of Operations. As an investing fund, the Fund indirectly bears its proportionate share of the expenses of Columbia Short-Term Cash Fund.
Note 7. Shareholder Concentration
At February 28, 2013, affiliated shareholder accounts owned 100% of the outstanding shares of the Fund. Subscription and redemption activity by concentrated accounts may have a significant effect on the operations of the Fund.
Note 8. Line of Credit
The Fund has entered into a revolving credit facility with a syndicate of banks led by JPMorgan Chase Bank N.A. whereby the Fund may borrow for the temporary funding of shareholder redemptions or for other temporary or emergency purposes. The credit facility agreement, as amended, which is a collective agreement between the Fund and certain other funds managed by the Investment Manager, severally and not jointly, permits collective borrowings up to $500 million. Interest is charged to each participating fund based on its borrowings at a rate equal to the higher of (i) the overnight
Annual Report 2013
28
Columbia Overseas Value Fund
Notes to Financial Statements (continued)
February 28, 2013
federal funds rate plus 1.00% or (ii) the one-month LIBOR rate plus 1.00%. Each borrowing under the credit facility matures no later than 60 days after the date of borrowing. The Fund also pays a commitment fee equal to its pro rata share of the amount of the credit facility at a rate of 0.08% per annum.
The Fund had no borrowings during the year ended February 28, 2013.
Note 9. Significant Risks
Foreign Securities Risk
Investing in foreign securities may include certain risks and considerations not typically associated with investing in U.S. securities, such as fluctuating currency values and changing local and regional economic, political and social conditions, which may result in greater market volatility. In addition, certain foreign securities may not be as liquid as U.S. securities. Investing in emerging markets may accentuate these risks.
Investments in emerging market countries are subject to additional risk. The risk of foreign investments is typically increased in less developed countries. These countries are also more likely to experience high levels of inflation, deflation or currency devaluation which could hurt their economies and securities markets.
Note 10. Subsequent Events
Management has evaluated the events and transactions that have occurred through the date the financial statements were issued. Other than as noted in Note 3 above and as noted below, there were no items requiring adjustment of the financial statements or additional disclosure.
At the close of business on March 15, 2013, the Fund acquired the assets and assumed the identified liabilities of Columbia Multi-Advisor International Value Fund, a series of Columbia Funds Series Trust II (the acquired fund). The reorganization was completed after shareholders of the acquired fund approved the plan of reorganization on February 27, 2013. The purpose of the transaction was to combine two funds managed by the Investment Manager with comparable investment objectives and strategies.
Note 11. Information Regarding Pending and Settled Legal Proceedings
In December 2005, without admitting or denying the allegations, American Express Financial Corporation (AEFC, which is now known as Ameriprise Financial, Inc. (Ameriprise Financial)) entered into settlement agreements with the Securities and Exchange Commission (SEC) and Minnesota Department of Commerce (MDOC) related to market timing activities. As a result, AEFC was censured and ordered to cease and desist from committing or causing any violations of certain
provisions of the Investment Advisers Act of 1940, the Investment Company Act of 1940, and various Minnesota laws. AEFC agreed to pay disgorgement of $10 million and civil money penalties of $7 million. AEFC also agreed to retain an independent distribution consultant to assist in developing a plan for distribution of all disgorgement and civil penalties ordered by the SEC in accordance with various undertakings detailed at www.sec.gov/litigation/admin/ia-2451.pdf. Ameriprise Financial and its affiliates have cooperated with the SEC and the MDOC in these legal proceedings, and have made regular reports to the funds' Boards of Trustees.
Ameriprise Financial and certain of its affiliates have historically been involved in a number of legal, arbitration and regulatory proceedings, including routine litigation, class actions, and governmental actions, concerning matters arising in connection with the conduct of their business activities. Ameriprise Financial believes that the Funds are not currently the subject of, and that neither Ameriprise Financial nor any of its affiliates are the subject of, any pending legal, arbitration or regulatory proceedings that are likely to have a material adverse effect on the Funds or the ability of Ameriprise Financial or its affiliates to perform under their contracts with the Funds. Ameriprise Financial is required to make 10-Q, 10-K and, as necessary, 8-K filings with the Securities and Exchange Commission on legal and regulatory matters that relate to Ameriprise Financial and its affiliates. Copies of these filings may be obtained by accessing the SEC website at www.sec.gov.
There can be no assurance that these matters, or the adverse publicity associated with them, will not result in increased fund redemptions, reduced sale of fund shares or other adverse consequences to the Funds. Further, although we believe proceedings are not likely to have a material adverse effect on the Funds or the ability of Ameriprise Financial or its affiliates to perform under their contracts with the Funds, these proceedings are subject to uncertainties and, as such, we are unable to estimate the possible loss or range of loss that may result. An adverse outcome in one or more of these proceedings could result in adverse judgments, settlements, fines, penalties or other relief that could have a material adverse effect on the consolidated financial condition or results of operations of Ameriprise Financial.
Annual Report 2013
29
Columbia Overseas Value Fund
Report of Independent Registered Public Accounting Firm
To the Trustees of Columbia Funds Series Trust and
the Shareholders of Columbia Overseas Value Fund
In our opinion, the accompanying statement of assets and liabilities, including the portfolio of investments, and the related statements of operations and of changes in net assets and the financial highlights present fairly, in all material respects, the financial position of Columbia Overseas Value Fund (the "Fund") (a series of Columbia Funds Series Trust) at February 28, 2013, the results of its operations for the year then ended, the changes in its net assets for each of the two years in the period then ended and the financial highlights for each of the periods indicated, in conformity with accounting principles generally accepted in the United States of America. These financial statements and financial highlights (hereafter referred to as "financial statements") are the responsibility of the Fund's management. Our responsibility is to express an opinion on these financial statements based on our audits. We conducted our audits of these financial statements in accordance with the standards of the Public Company Accounting Oversight Board (United States). Those standards require that we plan and perform the audit to obtain reasonable assurance about whether the financial statements are free of material misstatement. An audit includes examining, on a test basis, evidence supporting the amounts and disclosures in the financial statements, assessing the accounting principles used and significant estimates made by management, and evaluating the overall financial statement presentation. We believe that our audits, which included confirmation of securities at February 28, 2013 by correspondence with the custodian, transfer agent and brokers, provide a reasonable basis for our opinion.
PricewaterhouseCoopers LLP
Minneapolis, Minnesota
April 19, 2013
Annual Report 2013
30
Columbia Overseas Value Fund
Federal Income Tax Information
(Unaudited)
The Fund hereby designates the following tax attributes for the fiscal year ended February 28, 2013. Shareholders will be notified in early 2014 of the amounts for use in preparing 2013 income tax returns.
Tax Designations:
| Qualified Dividend Income | | | 100 | % | |
| Dividends Received Deduction | | | 0.08 | % | |
| Foreign Taxes Paid | | $ | 74,176 | | |
| Foreign Source Income | | $ | 1,141,596 | | |
Qualified Dividend Income. For taxable, non-corporate shareholders, the percentage of ordinary income dividends paid during the fiscal year that represents qualified dividend income subject to reduced tax rates under the Jobs and Growth Tax Relief Reconciliation Act of 2003.
Dividends Received Deduction. The percentage of ordinary income dividends paid during the fiscal year that qualifies for the corporate dividends received deduction.
Foreign Taxes. The Fund makes the election to pass through to shareholders the foreign taxes paid. These taxes, and the corresponding foreign source income, are provided.
Annual Report 2013
31
Columbia Overseas Value Fund
Shareholders elect the Board that oversees the funds' operations. The Board appoints officers who are responsible for day-to-day business decisions based on policies set by the Board. The following table provides basic biographical information about the funds' Board members, including their principal occupations during the past five years, although specific titles for individuals may have varied over the period. Under current Board policy, members may serve until the next Board meeting after he or she reaches the mandatory retirement age established by the Board, or the fifteenth anniversary of the first Board meeting they attended as a member of the Board.
Mr. Edward J. Boudreau, Jr., Mr. William P. Carmichael, Mr. William A. Hawkins, Mr. R. Glenn Hilliard, Ms. Minor M. Shaw and Dr. Anthony M. Santomero, were members of the Legacy Columbia Nations funds' Board ("Nations Funds"), which includes Columbia Funds Series Trust, Columbia Funds Variable Insurance Trust I and Columbia Funds Master Investment Trust, LLC and began service on the Board for the Legacy RiverSource funds ("RiverSource Funds") effective June 1, 2011.
Independent Trustees
Name,
Address,
Year of Birth | | Position Held With
Funds and Length of
Service | | Principal Occupation
During Past Five Years | | Number of
Funds in the
Fund Family
Overseen by
Board Member | | Other Present or Past
Directorships/Trusteeships
(Within Past 5 Years) | |
Kathleen Blatz
901 S. Marquette Ave.
Minneapolis, MN 55402
1954 | | Board member since 1/06 for RiverSource Funds and since 6/11 for Nations Funds | | Attorney; Chief Justice, Minnesota Supreme Court, 1998-2006 | | | 153 | | | Director, BlueCross BlueShield of Minnesota since 2009 | |
Edward J. Boudreau, Jr.
901 S. Marquette Ave.
Minneapolis, MN 55402
1944 | | Board member since 6/11 for RiverSource Funds and since 1/05 for Nations Funds | | Managing Director, E.J. Boudreau & Associates (consulting) since 2000 | | | 151 | | | Former Trustee, BofA Funds Series Trust (11 funds) | |
Pamela G. Carlton
901 S. Marquette Ave.
Minneapolis, MN 55402
1954 | | Board member since 7/07 for RiverSource Funds and since 6/11 for Nations Funds | | President, Springboard — Partners in Cross Cultural Leadership (consulting company) since 2003 | | | 153 | | | None | |
William P. Carmichael
901 S. Marquette Ave.
Minneapolis, MN 55402
1943 | | Board member since 6/11 for RiverSource Funds and since 1999 for Nations Funds | | Retired | | | 151 | | | Director, Cobra Electronics Corporation (electronic equipment manufacturer); The Finish Line (athletic shoes and apparel) since July 2003; McMoRan Exploration Company (oil and gas exploration and development) since 2010; former Trustee, BofA Funds Series Trust (11 funds); former Director, Spectrum Brands, Inc. (consumer products); former Director, Simmons Company (bedding) | |
Patricia M. Flynn
901 S. Marquette Ave.
Minneapolis, MN 55402
1950 | | Board member since 11/04 for RiverSource Funds and since 6/11 for Nations Funds | | Trustee Professor of Economics and Management, Bentley University since 1976 | | | 153 | | | None | |
William A. Hawkins
901 S. Marquette Ave.
Minneapolis, MN 55402
1942 | | Board member since 6/11 for RiverSource Funds and since 1/05 for Nations Funds | | Managing Director, Overton Partners (financial consulting), since August 2010; President and Chief Executive Officer, California General Bank, N.A., January 2008-August 2010 | | | 151 | | | Trustee, BofA Funds Series Trust (11 funds) | |
Annual Report 2013
32
Columbia Overseas Value Fund
Trustees and Officers (continued)
Independent Trustees (continued)
Name,
Address,
Year of Birth | | Position Held With
Funds and Length of
Service | | Principal Occupation
During Past Five Years | | Number of
Funds in the
Fund Family
Overseen by
Board Member | | Other Present or Past
Directorships/Trusteeships
(Within Past 5 Years) | |
R. Glenn Hilliard
901 S. Marquette Ave.
Minneapolis, MN 55402
1943 | | Board member since 6/11 for RiverSource Funds and since 1/05 for Nations Funds | | Chairman and Chief Executive Officer, Hilliard Group LLC (investing and consulting), since April 2003; Non-Executive Director & Chairman, CNO Financial Group, Inc. (insurance), September 2003-May 2011 | | | 151 | | | Chairman, BofA Fund Series Trust (11 funds); former Director, CNO Financial Group, Inc. (insurance) | |
Stephen R. Lewis, Jr.
901 S. Marquette Ave.
Minneapolis, MN 55402
1939 | | Chair of the Board for RiverSource Funds since 1/07, Board member for RiverSource Funds since 1/02 and since 6/11 for Nations Funds | | President Emeritus and Professor of Economics Emeritus, Carleton College since 2002 | | | 153 | | | Director, Valmont Industries, Inc. (manufacturer of irrigation systems) since 2002 | |
Catherine James Paglia
901 S. Marquette Ave.
Minneapolis, MN 55402
1952 | | Board member since 11/04 for RiverSource Funds and since 6/11 for Nations Funds | | Director, Enterprise Asset Management, Inc. (private real estate and asset management company) | | | 153 | | | Director, Valmont Industries, Inc. (manufacturer of irrigation systems) since 2012 | |
Leroy C. Richie
901 S. Marquette Ave.
Minneapolis, MN 55402
1941 | | Board member since 2000 for Legacy Seligman Funds, since 11/08 for RiverSource Funds and since 6/11 for Nations Funds | | Counsel, Lewis & Munday, P.C. (law firm) since 2004; former Vice President and General Counsel, Automotive Legal Affairs, Chrysler Corporation from 1983-1987 | | | 153 | | | Lead Outside Director, Digital Ally, Inc. (digital imaging) since September 2005; Director, Infinity, Inc. (oil and gas exploration and production) since 1994; Director, OGE Energy Corp. (energy and energy services) since November 2007 | |
Minor M. Shaw
901 S. Marquette Ave.
Minneapolis, MN 55402
1947 | | Board member since 6/11 for RiverSource Funds and since 2003 for Nations Funds | | President, Micco LLC (private investments) since 2011; President Micco Corp. since 1998 | | | 151 | | | Director, Piedmont Natural Gas; Director, BlueCross BlueShield of South Carolina since April 2008; Former Trustee, BofA Funds Series Trust (11 funds) | |
Alison Taunton-Rigby
901 S. Marquette Ave.
Minneapolis, MN 55402
1944 | | Board member since 11/02 for RiverSource Funds and since 6/11 for Nations Funds | | Chief Executive Officer and Director, RiboNovix, Inc. (biotechnology), 2003-2010 | | | 153 | | | Director, Healthways, Inc. (health and well-being improvement) since 2005; Director, ICI Mutual Insurance Company, RRG since 2011; Director, Abt Associates (government contractor) since 2001; Director, Boston Children's Hospital since 2002 | |
Annual Report 2013
33
Columbia Overseas Value Fund
Trustees and Officers (continued)
Interested Trustee Not Affiliated With Investment Manager*
Name,
Address,
Year of Birth | | Position Held With
Funds and Length of
Service | | Principal Occupation
During Past Five Years | | Number of
Funds in the
Fund Family
Overseen by
Board Member | | Other Present or Past
Directorships/Trusteeships
(Within Past 5 Years) | |
Anthony M. Santomero
901 S. Marquette Ave.
Minneapolis, MN 55402
1946 | | Board member since 6/11 for RiverSource Funds and since 1/08 for Nations Funds | | Richard K. Mellon Professor Emeritus of Finance, The Wharton School, University of Pennsylvania, since 2002; Senior Advisor, McKinsey & Company (consulting), 2006-2008 | | | 151 | | | Director, Renaissance Reinsurance Ltd. since May 2008; Trustee, Penn Mutual Life Insurance Company since March 2008; Director, Citigroup since 2009; Director, Citibank, N.A. since 2009; former Trustee, BofA Funds Series Trust (11 funds) | |
*Dr. Santomero is not an affiliated person of the investment manager or Ameriprise Financial. However, he is currently deemed by the funds to be an "interested person" (as defined in the 1940 Act) of the funds because he serves as a Director of Citigroup, Inc. and Citibank N.A., companies that may directly or through subsidiaries and affiliates engage from time-to-time in brokerage execution, principal transactions and lending relationships with the funds or accounts advised/managed by the investment manager.
Interested Trustee Affiliated With Investment Manager*
Name,
Address,
Year of Birth | | Position Held With
Funds and Length of
Service | | Principal Occupation
During Past Five Years | | Number of
Funds in the
Fund Family
Overseen by
Board Member | | Other Present or Past
Directorships/Trusteeships
(Within Past 5 Years) | |
William F. Truscott
53600 Ameriprise
Financial Center
Minneapolis, MN 55474
1960 | | Board member since 11/01 for RiverSource Funds and since 6/11 for Nations Funds; Senior Vice President since 2002 for RiverSource Funds and 5/10 for Nations Funds | | President, Columbia Management Investment Advisers, LLC since February 2012, (previously President, Chairman of the Board and Chief Investment Officer, 2001-April 2010); Chief Executive Officer, Global Asset Management, Ameriprise Financial, Inc. since September 2012 (previously Chief Executive Officer, U.S. Asset Management & President, Annuities, May 2010-September 2012 and President — U.S. Asset Management and Chief Investment Officer, 2005-April 2010); Chief Executive Officer, Columbia Management Investment Distributors, Inc. since February 2012, (previously Chairman of the Board and Chief Executive Officer, 2006-April 2010); Chairman of the Board and Chief Executive Officer, RiverSource Distributors, Inc. since 2006; President and Chief Executive Officer, Ameriprise Certificate Company 2006-August 2012 | | | 210 | | | Chairman of the Board, Columbia Management Investment Advisers, LLC since May 2010; Director, Columbia Management Investment Distributors, Inc. since May 2010; Director, Ameriprise Certificate Company, 2006-January 2013 | |
*Interested person (as defined under the 1940 Act) by reason of being an officer, director, security holder and/or employee of the investment manager or Ameriprise Financial.
The SAI has additional information about the Fund's Board members and is available, without charge, upon request by calling 800.345.6611; contacting your financial intermediary; or visiting columbiamanagement.com.
Annual Report 2013
34
Columbia Overseas Value Fund
Trustees and Officers (continued)
The Board has appointed officers who are responsible for day-to-day business decisions based on policies it has established. The officers serve at the pleasure of the Board. In addition to Mr. Truscott, who is Senior Vice President, the funds' other officers are:
Officers
Name,
Address,
Year of Birth | | Position Held With
Funds and Length of
Service | | Principal Occupation During Past Five Years | |
J. Kevin Connaughton
225 Franklin Street
Boston, MA 02110
1964 | | President and Principal Executive Officer since 5/10 for RiverSource Funds and 2009 for Nations Funds | | Senior Vice President and General Manager — Mutual Fund Products, Columbia Management Investment Advisers, LLC since May 2010; Managing Director of Columbia Management Advisors, LLC, December 2004-April 2010; Senior Vice President and Chief Financial Officer, Columbia Funds, June 2008-January 2009; Treasurer, Columbia Funds, October 2003-May 2008 | |
Amy K. Johnson
5228 Ameriprise Financial Center Minneapolis, MN 55474
1965 | | Vice President since 12/06 for RiverSource Funds and 5/10 for Nations Funds | | Senior Vice President and Chief Operating Officer, Columbia Management Investment Advisers, LLC since May 2010 (previously Chief Administrative Officer, 2009-April 2010 and Vice President — Asset Management and Trust Company Services, 2006-2009) | |
Michael G. Clarke
225 Franklin Street
Boston, MA 02110
1969 | | Treasurer since 1/11 and Chief Financial Officer since 4/11 for RiverSource Funds and Treasurer since 3/11 and Chief Financial Officer since 2009 for Nations Funds | | Vice President, Columbia Management Investment Advisers, LLC since May 2010; Managing Director of Fund Administration, Columbia Management Advisors, LLC, September 2004-April 2010; senior officer of Columbia Funds and affiliated funds since 2002 | |
Scott R. Plummer
5228 Ameriprise Financial Center Minneapolis, MN 55474
1959 | | Senior Vice President and Chief Legal Officer since 12/06 and Assistant Secretary since 6/11 for RiverSource Funds and Senior Vice President and Chief Legal Officer since 5/10 and Assistant Secretary since 6/11 for Nations Funds | | Senior Vice President, Chief Legal Officer and Assistant Secretary, Columbia Management Investment Advisers, LLC since June 2005; Vice President and Lead Chief Counsel — Asset Management, Ameriprise Financial, Inc. since May 2010 (previously Vice President and Chief Counsel — Asset Management, 2005-April 2010); Vice President, Chief Counsel and Assistant Secretary, Columbia Management Investment Distributors, Inc. since 2008; Vice President, General Counsel and Secretary, Ameriprise Certificate Company since 2005; Chief Counsel, RiverSource Distributors, Inc. since 2006 | |
Colin Moore
225 Franklin Street
Boston, MA 02110
1958 | | Senior Vice President since 5/10 for RiverSource Funds and Nations Funds | | Director and Chief Investment Officer, Columbia Management Investment Advisers, LLC since May 2010; Manager, Managing Director and Chief Investment Officer, Columbia Management Advisors, LLC, 2007-April 2010 | |
Thomas P. McGuire
225 Franklin Street
Boston, MA 02110
1972 | | Chief Compliance Officer since 3/12 | | Vice President — Asset Management Compliance, Columbia Management Investment Advisers, LLC since 2010; Chief Compliance Officer, Ameriprise Certificate Company since September 2010; Compliance Executive, Bank of America, 2005-2010 | |
Stephen T. Welsh
225 Franklin Street
Boston, MA 02110
1957 | | Vice President since 4/11 for RiverSource Funds and 2006 for Nations Funds | | President and Director, Columbia Management Investment Services Corp. since May 2010; President and Director, Columbia Management Services, Inc., July 2004- April 2010; Managing Director, Columbia Management Distributors, Inc., August 2007-April 2010 | |
Christopher O. Petersen
5228 Ameriprise Financial Center Minneapolis, MN 55474
1970 | | Vice President and Secretary since 4/11 for RiverSource Funds and 3/11 for Nations Funds | | Vice President and Chief Counsel, Ameriprise Financial, Inc. since January 2010 (formerly Vice President and Group Counsel or Counsel, April 2004-January 2010); Assistant Secretary of Legacy RiverSource Funds, January 2007-April 2011 and of the Nations Funds, May 2010-March 2011 | |
Annual Report 2013
35
Columbia Overseas Value Fund
Trustees and Officers (continued)
Officers (continued)
Name,
Address,
Year of Birth | | Position Held With
Funds and Length of
Service | | Principal Occupation During Past Five Years | |
Paul D. Pearson
10468 Ameriprise Financial Center Minneapolis, MN 55474
1956 | | Vice President since 4/11 and Assistant Treasurer since 1999 for RiverSource Funds and Vice President and Assistant Treasurer since 6/11 for Nations Funds | | Vice President — Investment Accounting, Columbia Management Investment Advisers, LLC, since May 2010; Vice President — Managed Assets, Investment Accounting, Ameriprise Financial Corporation, February 1998-May 2010 | |
Joseph F. DiMaria
225 Franklin Street
Boston, MA 02110
1968 | | Vice President and Chief Accounting Officer since 4/11 and Vice President since 3/11 and Chief Accounting Officer since 2008 for Nations Funds | | Vice President, Mutual Fund Administration, Columbia Management Investment Advisers, LLC, since May 2010; Director of Fund Administration, Columbia Management Advisors, LLC, January 2006-April 2010 | |
Paul B. Goucher
100 Park Avenue
New York, NY 10017
1968 | | Vice President since 4/11 and Assistant Secretary since 11/08 for RiverSource Funds and 5/10 for Nations Funds | | Vice President and Lead Chief Counsel, Ameriprise Financial, Inc. since November 2008 and January 2013, respectively (formerly, Chief Counsel, January 2010-January 2013 and Group Counsel from November 2008- January 2010); Director, Managing Director and General Counsel, J. & W. Seligman & Co. Incorporated, July 2008-November 2008 (previously, Managing Director and Associate General Counsel, January 2005-July 2008) | |
Michael E. DeFao
225 Franklin Street
Boston, MA 02110
1968 | | Vice President since 4/11 and Assistant Secretary since 5/10 for RiverSource Funds and 2011 for Nations Funds | | Vice President and Chief Counsel, Ameriprise Financial, Inc. since May 2010; Associate General Counsel, Bank of America, June 2005-April 2010 | |
Annual Report 2013
36
Columbia Overseas Value Fund
Important Information About This Report
Each fund mails one shareholder report to each shareholder address. If you would like more than one report, please call shareholder services at 800.345.6611 and additional reports will be sent to you.
The policy of the Board is to vote the proxies of the companies in which each fund holds investments consistent with the procedures as stated in the Statement of Additional Information (SAI). You may obtain a copy of the SAI without charge by calling 800.345.6611; contacting your financial intermediary; visiting columbiamanagement.com; or searching the website of the Securities and Exchange Commission (SEC) at sec.gov. Information regarding how each fund voted proxies relating to portfolio securities is filed with the SEC by August 31 for the most recent 12-month period ending June 30 of that year, and is available without charge by visiting columbiamanagement.com; or searching the website of the SEC at sec.gov.
Each fund files a complete schedule of portfolio holdings with the SEC for the first and third quarters of each fiscal year on Form N-Q. Each fund's Form N-Q is available on the SEC's website at sec.gov and may be reviewed and copied at the SEC's Public Reference Room in Washington, D.C. Information on the operation of the Public Reference Room may be obtained by calling 800.SEC.0330. Each fund's complete schedule of portfolio holdings, as filed on Form N-Q, can also be obtained without charge, upon request, by calling 800.345.6611.
Annual Report 2013
37

Columbia Overseas Value Fund
P.O. Box 8081
Boston, MA 02266-8081
columbiamanagement.com
This information is for use with concurrent or prior delivery of a fund prospectus. Please read and consider the investment objectives, risks, charges and expenses for any fund carefully before investing. For a prospectus which contains this and other important information about the Fund go to columbiamanagement.com. The Fund is distributed by Columbia Management Investment Distributors, Inc., member FINRA, and managed by Columbia Management Investment Advisers, LLC.
© 2013 Columbia Management Investment Advisers, LLC. All rights reserved.
ANN208_02_C01_(04/13)
Annual Report
February 28, 2013

Columbia Small Cap Index Fund
Not FDIC insured • No bank guarantee • May lose value
Columbia Small Cap Index Fund
 Dear Shareholders,
U.S. stocks flat, foreign markets strong in 2012 finale
After a strong third quarter, U.S. stock market averages treaded water as the year 2012 came to a close. However, they ended the year up strongly, as first- and third-quarter gains more than offset second- and fourth-quarter weakness. Typically a strong quarter for domestic small- and mid-cap issues, the fourth quarter of 2012 indeed proved to be another year-end positive for small-cap stocks. For the full calendar year 2012, the S&P 500 Index rose 16.00%.
Stock markets outside the United States generated some of the best returns for the fourth quarter, as optimism rebounded, thanks to the September actions of the European Central Bank in support of the euro and an improving outlook from China. Both developed and emerging foreign markets topped U.S. stocks by a solid margin.
Corporate and emerging markets led fixed income
Fixed-income investors took their cue from the equity markets and continued to favor the highest risk sectors through the end of 2012. Global fixed-income returns posted mixed results in the final quarter of the year. Gains were the highest for corporate high-yield and emerging market bonds. Although investors remained cautious ahead of the year-end budget negotiations, better economic data and a further improvement in the European sovereign debt crisis supported riskier assets and depressed government bond prices. In December, the Federal Reserve announced its intention to continue to purchase both Treasury and mortgage-backed securities and said that it would seek to keep short-term interest rates unchanged until the unemployment rate reaches 6.5%, or inflation turned noticeably higher.
Stay on track with Columbia Management
Backed by more than 100 years of experience, Columbia Management is one of the nation's largest asset managers. At the heart of our success — and, most importantly, that of our investors — are highly talented industry professionals, brought together by a unique way of working. We are dedicated to helping you take advantage of today's opportunities and anticipate tomorrow's. We stay abreast of the latest investment trends and ideas, using our collective insight to evaluate events and transform them into solutions you can use.
Visit columbiamanagement.com for:
> The Columbia Management Perspectives blog, featuring timely posts by our investment teams
> Detailed up-to-date fund performance and portfolio information
> Economic analysis and market commentary
> Quarterly fund commentaries
> Columbia Management Investor, our award-winning quarterly newsletter for shareholders
Thank you for your continued support of the Columbia Funds. We look forward to serving your investment needs for many years to come.
Best Regards,

J. Kevin Connaughton
President, Columbia Funds
The S&P 500 Index, an unmanaged index, measures the performance of 500 widely held, large-capitalization U.S. stocks and is frequently used as a general measure of market performance. Indices are not available for investment, are not professionally managed and do not reflect sales charges, fees, brokerage commissions, taxes or other expenses of investing.
Investors should consider the investment objectives, risks, charges and expenses of a mutual fund carefully before investing. For a free prospectus, which contains this and other important information about a fund, visit columbiamanagement.com. The prospectus should be read carefully before investing.
Columbia Funds are distributed by Columbia Management Investment Distributors, Inc., member FINRA, and managed by Columbia Management Investment Advisers, LLC.
© 2013 Columbia Management Investment Advisers, LLC. All rights reserved.
Columbia Small Cap Index Fund
Performance Overview | | | 2 | | |
Manager Discussion of Fund Performance | | | 4 | | |
Understanding Your Fund's Expenses | | | 6 | | |
Portfolio of Investments | | | 7 | | |
Statement of Assets and Liabilities | | | 19 | | |
Statement of Operations | | | 21 | | |
Statement of Changes in Net Assets | | | 22 | | |
Financial Highlights | | | 24 | | |
Notes to Financial Statements | | | 30 | | |
Report of Independent Registered
Public Accounting Firm | | | 38 | | |
Federal Income Tax Information | | | 39 | | |
Trustees and Officers | | | 40 | | |
Important Information About This Report | | | 45 | | |
Fund Investment Manager
Columbia Management Investment
Advisers, LLC
225 Franklin Street
Boston, MA 02110
Fund Distributor
Columbia Management Investment
Distributors, Inc.
225 Franklin Street
Boston, MA 02110
Fund Transfer Agent
Columbia Management Investment
Services Corp.
P.O. Box 8081
Boston, MA 02266-8081
For more information about any of the funds, please visit columbiamanagement.com or call 800.345.6611. Customer Service Representatives are available to answer your questions Monday through Friday from 8 a.m. to 8 p.m. Eastern time.
The views expressed in this report reflect the current views of the respective parties. These views are not guarantees of future performance and involve certain risks, uncertainties and assumptions that are difficult to predict, so actual outcomes and results may differ significantly from the views expressed. These views are subject to change at any time based upon economic, market or other conditions and the respective parties disclaim any responsibility to update such views. These views may not be relied on as investment advice and, because investment decisions for a Columbia Fund are based on numerous factors, may not be relied on as an indication of trading intent on behalf of any particular Columbia Fund. References to specific securities should not be construed as a recommendation or investment advice.
Annual Report 2013
Columbia Small Cap Index Fund
Performance Summary
> Columbia Small Cap Index Fund (the Fund) Class A shares returned 14.32% for the 12-month period that ended February 28, 2013.
> The Fund underperformed its benchmark, the S&P SmallCap 600 Index, which returned 14.65% for the same 12-month period.
> The Fund's portfolio is constructed to closely approximate the benchmark.
Average Annual Total Returns (%) (for period ended February 28, 2013)
| | | Inception | | 1 Year | | 5 Years | | 10 Years | |
Class A | | 10/15/96 | | | 14.32 | | | | 8.06 | | | | 11.57 | | |
Class B * | | 03/07/11 | | | | | | | |
Excluding sales charges | | | | | | | 13.45 | | | | 7.25 | | | | 10.74 | | |
Including sales charges | | | | | | | 8.45 | | | | 6.95 | | | | 10.74 | | |
Class I* | | 11/16/11 | | | 14.63 | | | | 8.14 | | | | 11.61 | | |
Class K* (formerly Class R4) | | 03/07/11 | | | 14.27 | | | | 8.05 | | | | 11.56 | | |
Class R5* | | 11/08/12 | | | 14.39 | | | | 8.08 | | | | 11.58 | | |
Class Z | | 10/15/96 | | | 14.54 | | | | 8.32 | | | | 11.84 | | |
S&P SmallCap 600 Index | | | | | | | 14.65 | | | | 8.37 | | | | 11.98 | | |
Returns for Class B are shown with and without the applicable contingent deferred sales charge (CDSC) of 5.00% in the first year, declining to 1.00% in the sixth year and eliminated thereafter. The Fund's other classes are not subject to sales charges and have limited eligibility. Please see the Fund's prospectuses for details. Performance for different share classes will vary based on differences in sales charges and fees associated with each class. All results shown assume reinvestment of distributions during the period. Returns do not reflect the deduction of taxes that a shareholder may pay on Fund distributions or on the redemption of Fund shares. Performance results reflect the effect of any fee waivers or reimbursements of Fund expenses by Columbia Management Investment Advisers, LLC and/or any of its affiliates. Absent these fee waivers or expense reimbursement arrangements, performance results would have been lower.
The performance information shown represents past performance and is not a guarantee of future results. The investment return and principal value of your investment will fluctuate so that your shares, when redeemed, may be worth more or less than their original cost. Current performance may be lower or higher than the performance information shown. You may obtain performance information current to the most recent month-end by contacting your financial intermediary, visiting columbiamanagement.com or calling 800.345.6611.
*The returns shown for periods prior to the share class inception date (including returns for the Life of the Fund, if shown, which are since Fund inception) include the returns of the Fund's oldest share class. Since the Fund launched more than one share class at its inception, Class A shares were used. These returns are adjusted to reflect any higher class-related operating expenses of the newer share classes, as applicable. Please visit columbiamanagement.com/mutual-funds/appended-performance for more information.
The S&P SmallCap 600 Index tracks the performance of 600 domestic companies traded on major stock exchanges. The S&P SmallCap 600 is heavily weighted with the stocks of companies with small market capitalizations.
Indices are not available for investment, are not professionally managed and do not reflect sales charges, fees, brokerage commissions, taxes or other expenses of investing. Securities in the Fund may not match those in an index.
Annual Report 2013
2
Columbia Small Cap Index Fund
Performance Overview (continued)
Performance of a Hypothetical $10,000 Investment (March 1, 2003 – February 28, 2013)
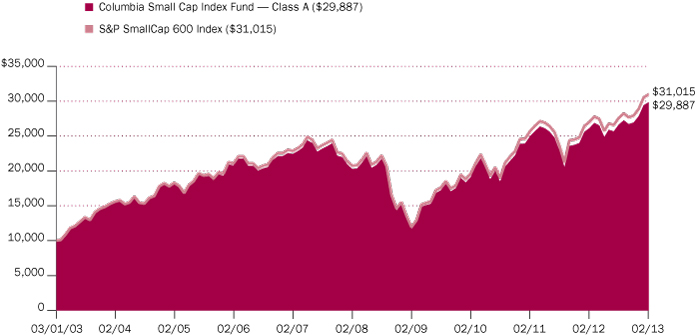
The chart above shows the change in value of a hypothetical $10,000 investment in Class A shares of Columbia Small Cap Index Fund during the stated time period, and does not reflect the deduction of taxes that a shareholder may pay on Fund distributions or on the redemption of Fund shares.
Annual Report 2013
3
Columbia Small Cap Index Fund
Manager Discussion of Fund Performance
For the 12-month period that ended February 28, 2013, the Fund's Class A shares returned 14.32%. The Fund's benchmark, the S&P SmallCap 600 Index, returned 14.65%. The Fund seeks to approximate the benchmark weights of securities, industries and sectors represented in the S&P SmallCap 600 Index. As such, its return was in line with the return of the index, after fees and expenses, which the index does not incur.
Investors Shrug Off Weak Global Growth
Europe's economic woes and U.S. struggles to avoid a fiscal cliff of tax increases and spending cuts weighed on the global economy during the 12-month period ended February 28, 2013. Yet, investors chose to look beyond the numbers and came in from the sidelines to bid stock prices significantly higher. Favorable central bank action in key markets and improving prospects for the U.S. economy gave investors confidence to favor stocks and other riskier assets. The U.S. economy expanded at a pace of just 1.6% in 2012. However, a pickup in job growth early in 2013 and steady manufacturing activity were encouraging signs. The U.S. housing market staged a solid comeback, with higher home sales, rising prices and lower inventories. Meanwhile, much of Europe headed toward recession. So far, the United Kingdom has avoided recession — but only barely so — and Japan's economy slipped into negative territory for the fifth time in 15 years. Major emerging market economies, including China, forged ahead, although mostly at a slower pace.
A Solid Year for the U.S. Stock Market
Against this economic backdrop, eight of the ten sectors that make up the S&P SmallCap 600 Index delivered positive returns. The strongest performance came from the materials, financials and consumer staples sectors. The financials, industrials and consumer discretionary sectors made the largest contributions to the Fund's return for the period, based on their weights in the portfolio. Within financials, real estate investment trusts and commercial banks were the top industry performers while equipment and suppliers were leaders within health care. The top-performing small cap stocks for the period were Headwaters, a manufacturer of building products; Christopher & Banks, retailer of women's clothing; Lumber Liquidators, a retailer of hardwood flooring; AMN Healthcare Services, a health care staffing company and Medidata Solutions, a technology company that focuses on the health care sector. Top contributors to the Fund's performance included Cymer, which supplies deep ultraviolet light sources to computer chipmakers; Eagle Materials, which manufactures building materials; Geo Group, provider of correctional, detention and community reentry services; Extra Space Storage, which offers self-storage units and 3D Systems, a three-dimension printing company.
The weakest-performing small-cap sectors were energy, telecommunication services and information technology. The sectors that contributed the least to the Fund's returns, based on their weights in the portfolio, were energy, telecommunication services and utilities. Within energy, oil, gas and consumable fuels was one of the weakest industry performers for the period. Within health care, health care technology was a significant laggard. The list of major small-cap decliners included international tanker company Overseas Shipholding Group, magnetic electronic manufacturer Pulse Electronics, biopharmaceutical company Savient Pharmaceuticals, solar energy company STR Holdings and
Portfolio Management
Alfred Alley III, CFA
Vadim Shteyn
Morningstar Style BoxTM
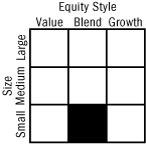
The Morningstar Style BoxTM is based on a fund's portfolio holdings. For equity funds, the vertical axis shows the market capitalization of the stocks owned, and the horizontal axis shows investment style (value, blend, or growth). Information shown is based on the most recent data provided by Morningstar.
© 2013 Morningstar, Inc. All rights reserved. The Morningstar information contained herein: (1) is proprietary to Morningstar and/or its content providers; (2) may not be copied or distributed; and (3) is not warranted to be accurate, complete or timely. Neither Morningstar nor its content providers are responsible for any damages or losses arising from any use of this information.
Top Ten Holdings (%)
(at February 28, 2013) | |
Tanger Factory Outlet Centers | | | 0.6 | | |
Brunswick Corp. | | | 0.6 | | |
Cymer, Inc. | | | 0.6 | | |
Eagle Materials, Inc. | | | 0.5 | | |
Mid-America Apartment
Communities, Inc. | | | 0.5 | | |
ProAssurance Corp. | | | 0.5 | | |
AO Smith Corp. | | | 0.5 | | |
Cubist Pharmaceuticals, Inc. | | | 0.5 | | |
3D Systems Corp. | | | 0.5 | | |
Teledyne Technologies, Inc. | | | 0.5 | | |
Percentages indicated are based upon total investments (excluding Money Market Funds).
For further detail about these holdings, please refer to the section entitled "Portfolio of Investments."
Fund holdings are as of the date given, are subject to change at any time, and are not recommendations to buy or sell any security.
Annual Report 2013
4
Columbia Small Cap Index Fund
Manager Discussion of Fund Performance (continued)
Dolan Co., a leading provider of business information and professional services to legal, financial and real estate sectors in the United States. The worst-performing stocks for the Fund, based on their weights in the portfolio, were Quality Systems, which provides information systems to medical and dental practices; Swift Energy, a U.S oil and natural gas producer; GT Advanced Technologies, an equipment and service provider to the solar and LED industries; Lufkin Industries, a manufacturer of components for the energy industry and Stone Energy, an independent oil and gas company.
The Fund owned stock index futures in the amount of its cash balances during the period. It did so in order to keep its investment exposure on par with the index, which is always fully invested, and to retain the liquidity necessary for trading and redemption within the Fund.
Changes to Index and Portfolio Holdings
There were 30 additions and deletions to the S&P SmallCap600 Index during the 12-month period. All changes to the index were matched by changes in the portfolio during the period.
Looking Ahead
Fourth-quarter 2012 earnings modestly beat expectations, raising confidence that many companies have the ability to manage successfully through an environment in which higher taxes and enforced spending cuts weigh on consumer demands. Although the many economic and investment challenges we face in the year ahead will likely result in heightened volatility, equity valuations currently still appear reasonable relative to fixed-income alternatives, and corporate balance sheets, at present, are in good condition, with low debt and high cash levels. As a result, our current belief is that the equities market has the potential to remain healthy even in an environment of slower economic growth.
Portfolio Breakdown (%)
(at February 28, 2013) | |
Common Stocks | | | 97.3 | | |
Consumer Discretionary | | | 14.9 | | |
Consumer Staples | | | 3.8 | | |
Energy | | | 4.4 | | |
Financials | | | 20.3 | | |
Health Care | | | 10.3 | | |
Industrials | | | 15.1 | | |
Information Technology | | | 17.7 | | |
Materials | | | 6.5 | | |
Telecommunication Services | | | 0.4 | | |
Utilities | | | 3.9 | | |
Money Market Funds | | | 2.7 | | |
Rights | | | 0.0 | (a) | |
Total | | | 100.0 | | |
Percentages indicated are based upon total investments. The Fund's portfolio composition is subject to change.
(a) Rounds to zero.
Annual Report 2013
5
Columbia Small Cap Index Fund
Understanding Your Fund's Expenses
(Unaudited)
As an investor, you incur two types of costs. There are transaction costs, which generally include sales charges on purchases and may include redemption fees. There are also ongoing costs, which generally include management fees, distribution and service (Rule 12b-1) fees, and other fund expenses. The following information is intended to help you understand your ongoing costs (in dollars) of investing in the Fund and to help you compare these costs with the ongoing costs of investing in other mutual funds.
Analyzing Your Fund's Expenses
To illustrate these ongoing costs, we have provided examples and calculated the expenses paid by investors in each share class of the Fund during the period. The actual and hypothetical information in the table is based on an initial investment of $1,000 at the beginning of the period indicated and held for the entire period. Expense information is calculated two ways and each method provides you with different information. The amount listed in the "Actual" column is calculated using the Fund's actual operating expenses and total return for the period. You may use the Actual information, together with the amount invested, to estimate the expenses that you paid over the period. Simply divide your account value by $1,000 (for example, an $8,600 account value divided by $1,000 = 8.6), then multiply the results by the expenses paid during the period under the Actual column. The amount listed in the "Hypothetical" column assumes a 5% annual rate of return before expenses (which is not the Fund's actual return) and then applies the Fund's actual expense ratio for the period to the hypothetical return. You should not use the hypothetical account values and expenses to estimate either your actual account balance at the end of the period or the expenses you paid during the period. See "Compare With Other Funds" below for details on how to use the hypothetical data.
Compare With Other Funds
Since all mutual funds are required to include the same hypothetical calculations about expenses in shareholder reports, you can use this information to compare the ongoing cost of investing in the Fund with other funds. To do so, compare the hypothetical example with the 5% hypothetical examples that appear in the shareholder reports of other funds. As you compare hypothetical examples of other funds, it is important to note that hypothetical examples are meant to highlight the ongoing costs of investing in a fund only and do not reflect any transaction costs, such as sales charges, or redemption or exchange fees. Therefore, the hypothetical calculations are useful in comparing ongoing costs only, and will not help you determine the relative total costs of owning different funds. If transaction costs were included in these calculations, your costs would be higher.
September 1, 2012 – February 28, 2013
| | | Account Value at the Beginning
of the Period ($) | | Account Value at the End of the
Period ($) | | Expenses Paid During the
Period ($) | | Fund's Annualized
Expense Ratio (%) | |
| | | Actual | | Hypothetical | | Actual | | Hypothetical | | Actual | | Hypothetical | | Actual | |
Class A | | | 1,000.00 | | | | 1,000.00 | | | | 1,120.80 | | | | 1,022.56 | | | | 2.37 | | | | 2.26 | | | | 0.45 | | |
Class B | | | 1,000.00 | | | | 1,000.00 | | | | 1,116.70 | | | | 1,018.84 | | | | 6.30 | | | | 6.01 | | | | 1.20 | | |
Class I | | | 1,000.00 | | | | 1,000.00 | | | | 1,122.20 | | | | 1,023.85 | | | | 1.00 | | | | 0.95 | | | | 0.19 | | |
Class K (formerly
Class R4) | | | 1,000.00 | | | | 1,000.00 | | | | 1,120.50 | | | | 1,022.56 | | | | 2.37 | | | | 2.26 | | | | 0.45 | | |
Class R5 | | | 1,000.00 | | | | 1,000.00 | | | | 1,145.10 | * | | | 1,023.80 | | | | 0.65 | * | | | 1.00 | | | | 0.20 | * | |
Class Z | | | 1,000.00 | | | | 1,000.00 | | | | 1,122.10 | | | | 1,023.80 | | | | 1.05 | | | | 1.00 | | | | 0.20 | | |
*For the period November 8, 2012 through February 28, 2013. Class R5 shares commenced operations on November 8, 2012.
Expenses paid during the period are equal to the annualized expense ratio for each class as indicated above, multiplied by the average account value over the period and then multiplied by the number of days in the Fund's most recent fiscal half year and divided by 365.
Expenses do not include fees and expenses incurred indirectly by the Fund from the underlying funds in which the Fund may invest (also referred to as "acquired funds"), including affiliated and non-affiliated pooled investment vehicles (including mutual funds and exchange-traded funds).
Had Columbia Management Investment Advisers, LLC and/or certain of its affiliates not waived/reimbursed certain fees and expenses, account value at the end of the period would have been reduced.
Annual Report 2013
6
Columbia Small Cap Index Fund
Portfolio of Investments
February 28, 2013
(Percentages represent value of investments compared to net assets)
Common Stocks 97.7%
Issuer | | Shares | | Value ($) | |
Consumer Discretionary 15.0% | |
Auto Components 0.5% | |
Dorman Products, Inc. | | | 96,150 | | | | 3,361,404 | | |
Drew Industries, Inc. | | | 67,097 | | | | 2,440,989 | | |
Spartan Motors, Inc. | | | 111,026 | | | | 587,327 | | |
Standard Motor Products, Inc. | | | 70,009 | | | | 1,731,323 | | |
Superior Industries International, Inc. | | | 82,639 | | | | 1,797,398 | | |
Total | | | | | 9,918,441 | | |
Automobiles 0.1% | |
Winnebago Industries, Inc.(a) | | | 101,105 | | | | 1,959,415 | | |
Distributors 0.4% | |
Pool Corp. | | | 166,627 | | | | 7,618,187 | | |
VOXX International Corp.(a) | | | 67,619 | | | | 672,809 | | |
Total | | | | | 8,290,996 | | |
Diversified Consumer Services 0.9% | |
American Public Education, Inc.(a) | | | 64,444 | | | | 2,512,027 | | |
Capella Education Co.(a) | | | 40,813 | | | | 1,292,140 | | |
Career Education Corp.(a) | | | 181,948 | | | | 582,234 | | |
Coinstar, Inc.(a) | | | 100,268 | | | | 5,132,719 | | |
Corinthian Colleges, Inc.(a) | | | 278,425 | | | | 593,045 | | |
Hillenbrand, Inc. | | | 223,405 | | | | 5,515,869 | | |
ITT Educational Services, Inc.(a) | | | 55,750 | | | | 768,235 | | |
Lincoln Educational Services Corp. | | | 76,396 | | | | 482,059 | | |
Universal Technical Institute, Inc. | | | 77,262 | | | | 900,875 | | |
Total | | | | | 17,779,203 | | |
Hotels, Restaurants & Leisure 2.9% | |
Biglari Holdings, Inc.(a) | | | 4,299 | | | | 1,609,460 | | |
BJ's Restaurants, Inc.(a) | | | 87,982 | | | | 2,708,966 | | |
Boyd Gaming Corp.(a) | | | 200,798 | | | | 1,319,243 | | |
Buffalo Wild Wings, Inc.(a) | | | 66,358 | | | | 5,221,711 | | |
CEC Entertainment, Inc. | | | 59,979 | | | | 1,814,365 | | |
Cracker Barrel Old Country Store, Inc. | | | 84,513 | | | | 6,362,139 | | |
DineEquity, Inc.(a) | | | 55,231 | | | | 3,860,094 | | |
Interval Leisure Group, Inc. | | | 137,933 | | | | 2,878,662 | | |
Jack in the Box, Inc.(a) | | | 153,089 | | | | 4,846,798 | | |
Marcus Corp. | | | 67,093 | | | | 819,205 | | |
Marriott Vacations Worldwide Corp.(a) | | | 102,217 | | | | 4,217,473 | | |
Monarch Casino & Resort, Inc.(a) | | | 33,980 | | | | 341,839 | | |
Multimedia Games Holdings Co., Inc.(a) | | | 100,967 | | | | 1,888,083 | | |
Common Stocks (continued)
Issuer | | Shares | | Value ($) | |
Papa John's International, Inc.(a) | | | 61,888 | | | | 3,218,795 | | |
Pinnacle Entertainment, Inc.(a) | | | 201,954 | | | | 2,827,356 | | |
Red Robin Gourmet Burgers, Inc.(a) | | | 46,269 | | | | 1,984,015 | | |
Ruby Tuesday, Inc.(a) | | | 213,475 | | | | 1,566,906 | | |
Ruth's Hospitality Group, Inc.(a) | | | 126,738 | | | | 1,148,246 | | |
SHFL Entertainment, Inc.(a) | | | 199,634 | | | | 3,166,195 | | |
Sonic Corp.(a) | | | 194,383 | | | | 2,194,584 | | |
Texas Roadhouse, Inc. | | | 209,183 | | | | 4,045,599 | | |
Total | | | | | 58,039,734 | | |
Household Durables 1.6% | |
American Greetings Corp., Class A | | | 112,790 | | | | 1,827,198 | | |
Blyth, Inc. | | | 40,167 | | | | 573,987 | | |
Ethan Allen Interiors, Inc. | | | 92,597 | | | | 2,587,160 | | |
Helen of Troy Ltd.(a) | | | 113,478 | | | | 4,207,764 | | |
iRobot Corp.(a) | | | 93,085 | | | | 1,995,742 | | |
La-Z-Boy, Inc. | | | 187,097 | | | | 3,427,617 | | |
M/I Homes, Inc.(a) | | | 76,488 | | | | 1,751,575 | | |
Meritage Homes Corp.(a) | | | 110,466 | | | | 4,472,768 | | |
Ryland Group, Inc. (The) | | | 161,091 | | | | 5,754,171 | | |
Standard Pacific Corp.(a) | | | 393,147 | | | | 3,200,217 | | |
Universal Electronics, Inc.(a) | | | 53,669 | | | | 1,048,692 | | |
Total | | | | | 30,846,891 | | |
Internet & Catalog Retail 0.2% | |
Blue Nile, Inc.(a) | | | 44,587 | | | | 1,512,837 | | |
Nutrisystem, Inc. | | | 101,817 | | | | 837,954 | | |
PetMed Express, Inc. | | | 71,373 | | | | 902,868 | | |
Total | | | | | 3,253,659 | | |
Leisure Equipment & Products 1.0% | |
Arctic Cat, Inc.(a) | | | 47,274 | | | | 1,717,464 | | |
Brunswick Corp. | | | 319,398 | | | | 11,638,863 | | |
Callaway Golf Co. | | | 253,270 | | | | 1,701,974 | | |
JAKKS Pacific, Inc. | | | 73,838 | | | | 899,347 | | |
Sturm Ruger & Co., Inc. | | | 68,360 | | | | 3,733,140 | | |
Total | | | | | 19,690,788 | | |
Media 0.6% | |
Arbitron, Inc. | | | 93,340 | | | | 4,372,046 | | |
Digital Generation, Inc.(a) | | | 90,698 | | | | 702,909 | | |
EW Scripps Co., Class A(a) | | | 101,959 | | | | 1,102,177 | | |
Harte-Hanks, Inc. | | | 154,525 | | | | 1,123,397 | | |
The accompanying Notes to Financial Statements are an integral part of this statement.
Annual Report 2013
7
Columbia Small Cap Index Fund
Portfolio of Investments (continued)
February 28, 2013
Common Stocks (continued)
Issuer | | Shares | | Value ($) | |
Live Nation Entertainment, Inc.(a) | | | 503,570 | | | | 5,332,806 | | |
Total | | | | | 12,633,335 | | |
Multiline Retail 0.1% | |
Fred's, Inc., Class A | | | 120,439 | | | | 1,634,357 | | |
Tuesday Morning Corp.(a) | | | 151,617 | | | | 1,349,392 | | |
Total | | | | | 2,983,749 | | |
Specialty Retail 4.3% | |
Big 5 Sporting Goods Corp. | | | 60,055 | | | | 936,257 | | |
Brown Shoe Co., Inc. | | | 145,374 | | | | 2,384,134 | | |
Buckle, Inc. (The) | | | 97,711 | | | | 4,378,430 | | |
Cato Corp. (The), Class A | | | 96,120 | | | | 2,466,439 | | |
Children's Place Retail Stores, Inc. (The)(a) | | | 84,161 | | | | 3,825,959 | | |
Christopher & Banks Corp.(a) | | | 131,942 | | | | 798,249 | | |
Coldwater Creek, Inc.(a) | | | 71,860 | | | | 257,977 | | |
Finish Line, Inc., Class A (The) | | | 181,362 | | | | 3,284,466 | | |
Genesco, Inc.(a) | | | 86,167 | | | | 5,056,280 | | |
Group 1 Automotive, Inc. | | | 76,190 | | | | 4,399,211 | | |
Haverty Furniture Companies, Inc. | | | 70,086 | | | | 1,286,078 | | |
Hibbett Sports, Inc.(a) | | | 92,093 | | | | 4,866,194 | | |
HOT Topic, Inc. | | | 150,950 | | | | 1,630,260 | | |
Jos. A. Bank Clothiers, Inc.(a) | | | 99,701 | | | | 4,137,591 | | |
Kirkland's, Inc.(a) | | | 53,599 | | | | 623,892 | | |
Lithia Motors, Inc., Class A | | | 74,752 | | | | 3,072,307 | | |
Lumber Liquidators Holdings, Inc.(a) | | | 96,838 | | | | 5,731,841 | | |
MarineMax, Inc.(a) | | | 84,784 | | | | 1,097,953 | | |
Men's Wearhouse, Inc. (The) | | | 170,675 | | | | 4,799,381 | | |
Monro Muffler Brake, Inc. | | | 104,931 | | | | 3,887,694 | | |
OfficeMax, Inc. | | | 309,476 | | | | 3,704,428 | | |
PEP Boys-Manny, Moe & Jack (The)(a) | | | 189,442 | | | | 2,108,489 | | |
Rue21, Inc.(a) | | | 55,991 | | | | 1,511,757 | | |
Select Comfort Corp.(a) | | | 199,926 | | | | 4,104,481 | | |
Sonic Automotive, Inc., Class A | | | 130,636 | | | | 2,918,408 | | |
Stage Stores, Inc. | | | 113,837 | | | | 2,810,636 | | |
Stein Mart, Inc. | | | 98,261 | | | | 836,201 | | |
Vitamin Shoppe, Inc.(a) | | | 107,623 | | | | 5,655,589 | | |
Zale Corp.(a) | | | 93,512 | | | | 367,502 | | |
Zumiez, Inc.(a) | | | 79,418 | | | | 1,818,672 | | |
Total | | | | | 84,756,756 | | |
Common Stocks (continued)
Issuer | | Shares | | Value ($) | |
Textiles, Apparel & Luxury Goods 2.4% | |
Crocs, Inc.(a) | | | 324,578 | | | | 4,920,602 | | |
Fifth & Pacific Companies, Inc.(a) | | | 403,764 | | | | 7,304,091 | | |
Iconix Brand Group, Inc.(a) | | | 243,396 | | | | 5,749,014 | | |
K-Swiss, Inc., Class A(a) | | | 86,381 | | | | 406,854 | | |
Maidenform Brands, Inc.(a) | | | 84,096 | | | | 1,613,802 | | |
Movado Group, Inc. | | | 63,238 | | | | 2,279,098 | | |
Oxford Industries, Inc. | | | 50,851 | | | | 2,471,867 | | |
Perry Ellis International, Inc. | | | 42,882 | | | | 695,546 | | |
Quiksilver, Inc.(a) | | | 443,973 | | | | 2,774,831 | | |
Skechers U.S.A., Inc., Class A(a) | | | 136,898 | | | | 2,861,168 | | |
Steven Madden Ltd.(a) | | | 145,773 | | | | 6,427,132 | | |
True Religion Apparel, Inc. | | | 86,478 | | | | 2,308,098 | | |
Wolverine World Wide, Inc. | | | 174,871 | | | | 7,379,556 | | |
Total | | | | | 47,191,659 | | |
Total Consumer Discretionary | | | | | 297,344,626 | | |
Consumer Staples 3.8% | |
Beverages 0.2% | |
Boston Beer Co., Inc. (The), Class A(a) | | | 29,935 | | | | 4,652,797 | | |
Food & Staples Retailing 0.7% | |
Andersons, Inc. (The) | | | 61,718 | | | | 3,029,120 | | |
Casey's General Stores, Inc. | | | 136,670 | | | | 7,734,155 | | |
Nash Finch Co. | | | 43,782 | | | | 839,301 | | |
Spartan Stores, Inc. | | | 77,615 | | | | 1,293,066 | | |
Total | | | | | 12,895,642 | | |
Food Products 2.3% | |
B&G Foods, Inc. | | | 187,521 | | | | 5,513,117 | | |
Cal-Maine Foods, Inc. | | | 49,503 | | | | 2,004,377 | | |
Calavo Growers, Inc. | | | 45,367 | | | | 1,277,081 | | |
Darling International, Inc.(a) | | | 420,153 | | | | 7,012,354 | | |
Diamond Foods, Inc.(a) | | | 78,734 | | | | 1,222,739 | | |
Hain Celestial Group, Inc. (The)(a) | | | 159,974 | | | | 8,758,577 | | |
J&J Snack Foods Corp. | | | 52,847 | | | | 3,658,069 | | |
Sanderson Farms, Inc. | | | 71,297 | | | | 3,616,897 | | |
Seneca Foods Corp., Class A(a) | | | 27,668 | | | | 844,427 | | |
Snyders-Lance, Inc. | | | 171,546 | | | | 4,247,479 | | |
TreeHouse Foods, Inc.(a) | | | 129,090 | | | | 7,537,565 | | |
Total | | | | | 45,692,682 | | |
The accompanying Notes to Financial Statements are an integral part of this statement.
Annual Report 2013
8
Columbia Small Cap Index Fund
Portfolio of Investments (continued)
February 28, 2013
Common Stocks (continued)
Issuer | | Shares | | Value ($) | |
Household Products 0.2% | |
Central Garden and Pet Co., Class A(a) | | | 146,802 | | | | 1,281,581 | | |
WD-40 Co. | | | 52,704 | | | | 2,857,084 | | |
Total | | | | | 4,138,665 | | |
Personal Products 0.3% | |
Inter Parfums, Inc. | | | 57,829 | | | | 1,449,195 | | |
Medifast, Inc.(a) | | | 48,749 | | | | 1,130,002 | | |
Prestige Brands Holdings, Inc.(a) | | | 180,188 | | | | 4,286,672 | | |
Total | | | | | 6,865,869 | | |
Tobacco 0.1% | |
Alliance One International, Inc.(a) | | | 293,914 | | | | 1,096,299 | | |
Total Consumer Staples | | | | | 75,341,954 | | |
Energy 4.4% | |
Energy Equipment & Services 2.6% | |
Basic Energy Services, Inc.(a) | | | 97,576 | | | | 1,427,537 | | |
Bristow Group, Inc. | | | 128,360 | | | | 7,478,253 | | |
C&J Energy Services, Inc.(a) | | | 156,900 | | | | 3,796,980 | | |
Era Group, Inc.(a) | | | 70,679 | | | | 1,427,009 | | |
Exterran Holdings, Inc.(a) | | | 231,550 | | | | 5,842,006 | | |
Geospace Technologies Corp.(a) | | | 45,490 | | | | 4,427,087 | | |
Gulf Island Fabrication, Inc. | | | 51,417 | | | | 1,224,239 | | |
Hornbeck Offshore Services, Inc.(a) | | | 113,694 | | | | 4,831,995 | | |
ION Geophysical Corp.(a) | | | 428,569 | | | | 2,845,698 | | |
Lufkin Industries, Inc. | | | 119,942 | | | | 7,769,843 | | |
Matrix Service Co.(a) | | | 92,436 | | | | 1,438,304 | | |
Pioneer Energy Services Corp.(a) | | | 221,293 | | | | 1,931,888 | | |
SEACOR Holdings, Inc. | | | 70,679 | | | | 4,910,777 | | |
Tetra Technologies, Inc.(a) | | | 278,564 | | | | 2,571,146 | | |
Total | | | | | 51,922,762 | | |
Oil, Gas & Consumable Fuels 1.8% | |
Approach Resources, Inc.(a) | | | 118,249 | | | | 2,926,663 | | |
Carrizo Oil & Gas, Inc.(a) | | | 130,135 | | | | 3,056,871 | | |
Cloud Peak Energy, Inc.(a) | | | 217,989 | | | | 3,736,331 | | |
Comstock Resources, Inc.(a) | | | 159,799 | | | | 2,256,362 | | |
Contango Oil & Gas Co. | | | 45,538 | | | | 1,765,053 | | |
Gulfport Energy Corp.(a) | | | 236,455 | | | | 9,682,832 | | |
PDC Energy, Inc.(a) | | | 107,972 | | | | 5,035,814 | | |
Penn Virginia Corp. | | | 196,550 | | | | 799,959 | | |
Petroquest Energy, Inc.(a) | | | 201,110 | | | | 772,262 | | |
Common Stocks (continued)
Issuer | | Shares | | Value ($) | |
Stone Energy Corp.(a) | | | 176,610 | | | | 3,611,675 | | |
Swift Energy Co.(a) | | | 153,137 | | | | 2,070,412 | | |
Total | | | | | 35,714,234 | | |
Total Energy | | | | | 87,636,996 | | |
Financials 20.4% | |
Capital Markets 1.5% | |
Calamos Asset Management, Inc., Class A | | | 72,732 | | | | 813,144 | | |
Financial Engines, Inc.(a) | | | 146,903 | | | | 4,800,790 | | |
HFF, Inc., Class A | | | 116,362 | | | | 2,136,406 | | |
Investment Technology Group, Inc.(a) | | | 135,423 | | | | 1,639,973 | | |
Piper Jaffray Companies(a) | | | 58,033 | | | | 2,238,333 | | |
Prospect Capital Corp. | | | 704,902 | | | | 7,859,657 | | |
Stifel Financial Corp.(a) | | | 202,440 | | | | 6,992,278 | | |
SWS Group, Inc.(a) | | | 100,869 | | | | 646,570 | | |
Virtus Investment Partners, Inc.(a) | | | 20,687 | | | | 3,475,623 | | |
Total | | | | | 30,602,774 | | |
Commercial Banks 6.3% | |
Bank of the Ozarks, Inc. | | | 105,191 | | | | 4,038,283 | | |
Banner Corp. | | | 62,358 | | | | 1,852,656 | | |
BBCN Bancorp, Inc. | | | 278,427 | | | | 3,446,926 | | |
Boston Private Financial Holdings, Inc. | | | 281,625 | | | | 2,571,236 | | |
City Holding Co. | | | 55,650 | | | | 2,110,248 | | |
Columbia Banking System, Inc. | | | 141,590 | | | | 2,831,800 | | |
Community Bank System, Inc. | | | 141,230 | | | | 4,077,310 | | |
CVB Financial Corp. | | | 314,139 | | | | 3,329,873 | | |
First BanCorp(a) | | | 250,099 | | | | 1,368,042 | | |
First Commonwealth Financial Corp. | | | 366,087 | | | | 2,661,453 | | |
First Financial Bancorp | | | 208,735 | | | | 3,199,908 | | |
First Financial Bankshares, Inc. | | | 106,720 | | | | 4,759,734 | | |
First Midwest Bancorp, Inc. | | | 267,012 | | | | 3,337,650 | | |
FNB Corp. | | | 498,743 | | | | 5,665,721 | | |
Glacier Bancorp, Inc. | | | 256,642 | | | | 4,475,836 | | |
Hanmi Financial Corp.(a) | | | 112,345 | | | | 1,908,742 | | |
Home Bancshares, Inc. | | | 81,895 | | | | 2,772,146 | | |
Independent Bank Corp. | | | 81,076 | | | | 2,569,298 | | |
MB Financial, Inc. | | | 196,000 | | | | 4,647,160 | | |
National Penn Bancshares, Inc. | | | 432,171 | | | | 4,235,276 | | |
NBT Bancorp, Inc. | | | 120,390 | | | | 2,463,179 | | |
Old National Bancorp | | | 361,766 | | | | 4,883,841 | | |
The accompanying Notes to Financial Statements are an integral part of this statement.
Annual Report 2013
9
Columbia Small Cap Index Fund
Portfolio of Investments (continued)
February 28, 2013
Common Stocks (continued)
Issuer | | Shares | | Value ($) | |
PacWest Bancorp | | | 114,804 | | | | 3,137,593 | | |
Pinnacle Financial Partners, Inc.(a) | | | 116,348 | | | | 2,525,915 | | |
PrivateBancorp, Inc. | | | 223,088 | | | | 3,995,506 | | |
S&T Bancorp, Inc. | | | 106,082 | | | | 1,915,841 | | |
Simmons First National Corp., Class A | | | 59,387 | | | | 1,492,989 | | |
Sterling Bancorp | | | 110,441 | | | | 1,123,185 | | |
Susquehanna Bancshares, Inc. | | | 665,233 | | | | 7,736,660 | | |
Texas Capital Bancshares, Inc.(a) | | | 144,804 | | | | 6,119,417 | | |
Tompkins Financial Corp. | | | 40,993 | | | | 1,698,340 | | |
UMB Financial Corp. | | | 115,877 | | | | 5,282,832 | | |
Umpqua Holdings Corp. | | | 399,313 | | | | 5,011,378 | | |
United Bankshares, Inc. | | | 163,218 | | | | 4,243,668 | | |
United Community Banks, Inc.(a) | | | 164,740 | | | | 1,774,250 | | |
Wilshire Bancorp, Inc.(a) | | | 221,285 | | | | 1,298,943 | | |
Wintrust Financial Corp. | | | 130,011 | | | | 4,745,402 | | |
Total | | | | | 125,308,237 | | |
Consumer Finance 1.4% | |
Cash America International, Inc. | | | 103,645 | | | | 5,248,583 | | |
Encore Capital Group, Inc.(a) | | | 76,925 | | | | 2,273,134 | | |
Ezcorp, Inc., Class A(a) | | | 171,069 | | | | 3,537,707 | | |
First Cash Financial Services, Inc.(a) | | | 94,003 | | | | 4,973,699 | | |
Portfolio Recovery Associates, Inc.(a) | | | 60,233 | | | | 7,042,743 | | |
World Acceptance Corp.(a) | | | 46,110 | | | | 3,628,857 | | |
Total | | | | | 26,704,723 | | |
Diversified Financial Services 0.4% | |
Interactive Brokers Group, Inc., Class A | | | 145,700 | | | | 2,143,247 | | |
MarkeTaxess Holdings, Inc. | | | 133,054 | | | | 5,197,089 | | |
Total | | | | | 7,340,336 | | |
Insurance 2.2% | |
AMERISAFE, Inc.(a) | | | 64,885 | | | | 2,116,549 | | |
eHealth, Inc.(a) | | | 72,253 | | | | 1,122,089 | | |
Employers Holdings, Inc. | | | 109,616 | | | | 2,303,032 | | |
Horace Mann Educators Corp. | | | 140,487 | | | | 2,874,364 | | |
Infinity Property & Casualty Corp. | | | 41,649 | | | | 2,340,257 | | |
Meadowbrook Insurance Group, Inc. | | | 166,930 | | | | 1,173,518 | | |
National Financial Partners Corp.(a) | | | 142,117 | | | | 2,794,020 | | |
Navigators Group, Inc. (The)(a) | | | 37,566 | | | | 2,109,707 | | |
ProAssurance Corp. | | | 219,306 | | | | 10,283,258 | | |
RLI Corp. | | | 60,573 | | | | 4,175,903 | | |
Safety Insurance Group, Inc. | | | 45,362 | | | | 2,132,014 | | |
Common Stocks (continued)
Issuer | | Shares | | Value ($) | |
Selective Insurance Group, Inc. | | | 196,224 | | | | 4,364,022 | | |
Stewart Information Services Corp. | | | 63,525 | | | | 1,470,604 | | |
Tower Group, Inc. | | | 118,382 | | | | 2,207,824 | | |
United Fire Group, Inc. | | | 77,980 | | | | 1,916,748 | | |
Total | | | | | 43,383,909 | | |
Real Estate Investment Trusts (REITs) 7.6% | |
Acadia Realty Trust | | | 180,767 | | | | 4,866,248 | | |
Cedar Realty Trust, Inc. | | | 195,026 | | | | 1,119,449 | | |
Colonial Properties Trust | | | 295,498 | | | | 6,370,937 | | |
Cousins Properties, Inc. | | | 310,476 | | | | 3,017,827 | | |
DiamondRock Hospitality Co. | | | 696,208 | | | | 6,224,099 | | |
EastGroup Properties, Inc. | | | 105,727 | | | | 6,006,351 | | |
EPR Properties | | | 167,120 | | | | 8,153,785 | | |
Franklin Street Properties Corp. | | | 257,420 | | | | 3,539,525 | | |
Geo Group, Inc. (The) | | | 254,302 | | | | 8,783,591 | | |
Getty Realty Corp. | | | 95,321 | | | | 1,894,981 | | |
Government Properties Income Trust | | | 154,010 | | | | 4,075,104 | | |
Healthcare Realty Trust, Inc. | | | 311,212 | | | | 8,278,239 | | |
Inland Real Estate Corp. | | | 277,254 | | | | 2,678,274 | | |
Kite Realty Group Trust | | | 250,413 | | | | 1,650,222 | | |
LaSalle Hotel Properties | | | 336,287 | | | | 8,538,327 | | |
Lexington Realty Trust | | | 541,814 | | | | 6,209,188 | | |
LTC Properties, Inc. | | | 108,811 | | | | 4,196,840 | | |
Medical Properties Trust, Inc. | | | 483,669 | | | | 7,022,874 | | |
Mid-America Apartment Communities, Inc. | | | 150,802 | | | | 10,471,691 | | |
Parkway Properties, Inc. | | | 119,026 | | | | 2,012,730 | | |
Pennsylvania Real Estate Investment Trust | | | 187,744 | | | | 3,388,779 | | |
Post Properties, Inc. | | | 194,129 | | | | 9,267,718 | | |
PS Business Parks, Inc. | | | 64,115 | | | | 4,743,869 | | |
Sabra Health Care REIT, Inc. | | | 132,181 | | | | 3,493,544 | | |
Saul Centers, Inc. | | | 45,442 | | | | 1,988,542 | | |
Sovran Self Storage, Inc. | | | 108,582 | | | | 6,606,129 | | |
Tanger Factory Outlet Centers | | | 335,024 | | | | 11,822,997 | | |
Universal Health Realty Income Trust | | | 45,261 | | | | 2,584,856 | | |
Urstadt Biddle Properties, Inc., Class A | | | 91,071 | | | | 1,924,330 | | |
Total | | | | | 150,931,046 | | |
Real Estate Management & Development 0.1% | |
Forestar Group, Inc.(a) | | | 123,766 | | | | 2,156,004 | | |
Thrifts & Mortgage Finance 0.9% | |
Bank Mutual Corp. | | | 153,706 | | | | 879,198 | | |
The accompanying Notes to Financial Statements are an integral part of this statement.
Annual Report 2013
10
Columbia Small Cap Index Fund
Portfolio of Investments (continued)
February 28, 2013
Common Stocks (continued)
Issuer | | Shares | | Value ($) | |
Brookline Bancorp, Inc. | | | 249,849 | | | | 2,273,626 | | |
Dime Community Bancshares, Inc. | | | 102,894 | | | | 1,462,124 | | |
Northwest Bancshares, Inc. | | | 348,331 | | | | 4,350,654 | | |
Oritani Financial Corp. | | | 138,873 | | | | 2,042,822 | | |
Provident Financial Services, Inc. | | | 193,161 | | | | 2,895,483 | | |
TrustCo Bank Corp. | | | 335,130 | | | | 1,746,027 | | |
ViewPoint Financial Group, Inc. | | | 127,083 | | | | 2,649,681 | | |
Total | | | | | 18,299,615 | | |
Total Financials | | | | | 404,726,644 | | |
Health Care 10.3% | |
Biotechnology 1.0% | |
Acorda Therapeutics, Inc.(a) | | | 143,270 | | | | 4,262,282 | | |
Arqule, Inc.(a) | | | 209,065 | | | | 514,300 | | |
Cubist Pharmaceuticals, Inc.(a) | | | 229,769 | | | | 9,749,099 | | |
Emergent Biosolutions, Inc.(a) | | | 90,814 | | | | 1,406,709 | | |
Momenta Pharmaceuticals, Inc.(a) | | | 162,301 | | | | 2,067,715 | | |
Spectrum Pharmaceuticals, Inc. | | | 185,140 | | | | 2,110,596 | | |
Total | | | | | 20,110,701 | | |
Health Care Equipment & Supplies 3.4% | |
Abaxis, Inc. | | | 73,609 | | | | 3,122,494 | | |
ABIOMED, Inc.(a) | | | 128,794 | | | | 2,065,856 | | |
Align Technology, Inc.(a) | | | 255,511 | | | | 8,033,266 | | |
Analogic Corp. | | | 43,635 | | | | 3,237,281 | | |
Cantel Medical Corp. | | | 76,657 | | | | 2,386,332 | | |
CONMED Corp. | | | 101,628 | | | | 3,161,647 | | |
CryoLife, Inc. | | | 89,085 | | | | 546,091 | | |
Cyberonics, Inc.(a) | | | 85,048 | | | | 3,890,946 | | |
Greatbatch, Inc.(a) | | | 84,537 | | | | 2,288,416 | | |
Haemonetics Corp.(a) | | | 184,012 | | | | 7,590,495 | | |
ICU Medical, Inc.(a) | | | 45,794 | | | | 2,599,267 | | |
Integra LifeSciences Holdings Corp.(a) | | | 69,474 | | | | 2,830,371 | | |
Invacare Corp. | | | 103,672 | | | | 1,504,281 | | |
Meridian Bioscience, Inc. | | | 147,300 | | | | 3,122,760 | | |
Merit Medical Systems, Inc.(a) | | | 142,298 | | | | 1,696,192 | | |
Natus Medical, Inc.(a) | | | 106,860 | | | | 1,357,122 | | |
Neogen Corp.(a) | | | 79,648 | | | | 3,729,119 | | |
NuVasive, Inc.(a) | | | 155,291 | | | | 2,883,754 | | |
Palomar Medical Technologies, Inc.(a) | | | 63,592 | | | | 702,056 | | |
SurModics, Inc.(a) | | | 43,374 | | | | 1,099,965 | | |
Common Stocks (continued)
Issuer | | Shares | | Value ($) | |
Symmetry Medical, Inc.(a) | | | 131,250 | | | | 1,368,937 | | |
West Pharmaceutical Services, Inc. | | | 121,736 | | | | 7,355,289 | | |
Total | | | | | 66,571,937 | | |
Health Care Providers & Services 3.1% | |
Air Methods Corp. | | | 124,325 | | | | 5,568,517 | | |
Almost Family, Inc. | | | 29,624 | | | | 609,958 | | |
Amedisys, Inc.(a) | | | 110,389 | | | | 1,247,396 | | |
AMN Healthcare Services, Inc.(a) | | | 158,355 | | | | 2,232,806 | | |
Amsurg Corp.(a) | | | 113,019 | | | | 3,413,174 | | |
Bio-Reference Labs, Inc.(a) | | | 86,965 | | | | 2,302,833 | | |
Centene Corp.(a) | | | 184,214 | | | | 8,293,314 | | |
Chemed Corp. | | | 68,813 | | | | 5,311,675 | | |
Corvel Corp.(a) | | | 21,994 | | | | 1,056,592 | | |
Cross Country Healthcare, Inc.(a) | | | 110,246 | | | | 628,402 | | |
Ensign Group, Inc. (The) | | | 62,339 | | | | 1,952,458 | | |
Gentiva Health Services, Inc.(a) | | | 101,637 | | | | 1,069,221 | | |
Hanger, Inc.(a) | | | 122,184 | | | | 3,623,977 | | |
Healthways, Inc.(a) | | | 121,061 | | | | 1,555,634 | | |
IPC The Hospitalist Co., Inc.(a) | | | 59,521 | | | | 2,482,026 | | |
Kindred Healthcare, Inc.(a) | | | 190,103 | | | | 2,142,461 | | |
Landauer, Inc. | | | 33,726 | | | | 1,980,053 | | |
LHC Group, Inc.(a) | | | 52,730 | | | | 1,071,474 | | |
Magellan Health Services, Inc.(a) | | | 98,636 | | | | 5,085,672 | | |
Molina Healthcare, Inc.(a) | | | 106,364 | | | | 3,394,075 | | |
MWI Veterinary Supply, Inc.(a) | | | 42,910 | | | | 5,417,817 | | |
PharMerica Corp.(a) | | | 105,189 | | | | 1,507,358 | | |
Total | | | | | 61,946,893 | | |
Health Care Technology 0.6% | |
Computer Programs & Systems, Inc. | | | 37,151 | | | | 1,937,053 | | |
HealthStream, Inc.(a) | | | 70,174 | | | | 1,501,022 | | |
Medidata Solutions, Inc.(a) | | | 79,496 | | | | 4,143,332 | | |
Omnicell, Inc.(a) | | | 118,370 | | | | 2,133,027 | | |
Quality Systems, Inc. | | | 141,918 | | | | 2,628,321 | | |
Total | | | | | 12,342,755 | | |
Life Sciences Tools & Services 0.6% | |
Affymetrix, Inc.(a) | | | 252,201 | | | | 1,026,458 | | |
Cambrex Corp.(a) | | | 106,548 | | | | 1,226,367 | | |
Enzo Biochem, Inc.(a) | | | 119,113 | | | | 357,339 | | |
Luminex Corp.(a) | | | 134,944 | | | | 2,277,855 | | |
The accompanying Notes to Financial Statements are an integral part of this statement.
Annual Report 2013
11
Columbia Small Cap Index Fund
Portfolio of Investments (continued)
February 28, 2013
Common Stocks (continued)
Issuer | | Shares | | Value ($) | |
PAREXEL International Corp.(a) | | | 209,868 | | | | 7,280,321 | | |
Total | | | | | 12,168,340 | | |
Pharmaceuticals 1.6% | |
Akorn, Inc.(a) | | | 241,744 | | | | 3,336,067 | | |
Hi-Tech Pharmacal Co., Inc. | | | 39,554 | | | | 1,463,894 | | |
Medicines Co. (The)(a) | | | 192,167 | | | | 6,112,832 | | |
Questcor Pharmaceuticals, Inc. | | | 208,529 | | | | 6,798,045 | | |
Salix Pharmaceuticals Ltd.(a) | | | 178,437 | | | | 8,716,648 | | |
Viropharma, Inc.(a) | | | 235,138 | | | | 5,864,342 | | |
Total | | | | | 32,291,828 | | |
Total Health Care | | | | | 205,432,454 | | |
Industrials 15.1% | |
Aerospace & Defense 2.0% | |
AAR Corp. | | | 142,493 | | | | 2,503,602 | | |
Aerovironment, Inc.(a) | | | 67,979 | | | | 1,503,696 | | |
American Science & Engineering, Inc. | | | 29,611 | | | | 1,851,872 | | |
Cubic Corp. | | | 57,232 | | | | 2,388,864 | | |
Curtiss-Wright Corp. | | | 166,897 | | | | 5,792,995 | | |
Engility Holdings, Inc.(a) | | | 59,151 | | | | 1,116,179 | | |
GenCorp, Inc.(a) | | | 215,842 | | | | 2,600,896 | | |
Moog, Inc., Class A(a) | | | 161,799 | | | | 7,274,483 | | |
National Presto Industries, Inc. | | | 17,447 | | | | 1,325,798 | | |
Orbital Sciences Corp.(a) | | | 212,257 | | | | 3,137,158 | | |
Teledyne Technologies, Inc.(a) | | | 131,630 | | | | 9,685,335 | | |
Total | | | | | 39,180,878 | | |
Air Freight & Logistics 0.7% | |
Atlas Air Worldwide Holdings, Inc.(a) | | | 94,800 | | | | 4,473,612 | | |
Forward Air Corp. | | | 104,809 | | | | 3,953,396 | | |
HUB Group, Inc., Class A(a) | | | 126,662 | | | | 4,778,957 | | |
Total | | | | | 13,205,965 | | |
Airlines 0.3% | |
Allegiant Travel Co. | | | 54,372 | | | | 4,365,528 | | |
Skywest, Inc. | | | 182,859 | | | | 2,560,026 | | |
Total | | | | | 6,925,554 | | |
Building Products 1.4% | |
AAON, Inc. | | | 66,497 | | | | 1,599,918 | | |
AO Smith Corp. | | | 138,361 | | | | 9,896,962 | | |
Apogee Enterprises, Inc. | | | 101,265 | | | | 2,611,624 | | |
Gibraltar Industries, Inc.(a) | | | 102,502 | | | | 1,757,909 | | |
Common Stocks (continued)
Issuer | | Shares | | Value ($) | |
Griffon Corp. | | | 162,665 | | | | 1,833,235 | | |
NCI Building Systems, Inc.(a) | | | 67,510 | | | | 1,103,789 | | |
Quanex Building Products Corp. | | | 131,739 | | | | 2,622,923 | | |
Simpson Manufacturing Co., Inc. | | | 143,101 | | | | 4,164,239 | | |
Universal Forest Products, Inc. | | | 70,600 | | | | 2,864,948 | | |
Total | | | | | 28,455,547 | | |
Commercial Services & Supplies 2.0% | |
ABM Industries, Inc. | | | 179,928 | | | | 4,084,366 | | |
Consolidated Graphics, Inc.(a) | | | 29,156 | | | | 1,125,422 | | |
G&K Services, Inc., Class A | | | 68,224 | | | | 2,842,894 | | |
Healthcare Services Group, Inc. | | | 241,646 | | | | 5,823,668 | | |
Interface, Inc. | | | 204,684 | | | | 3,747,764 | | |
Mobile Mini, Inc.(a) | | | 135,339 | | | | 3,643,326 | | |
Tetra Tech, Inc.(a) | | | 227,774 | | | | 6,573,558 | | |
Unifirst Corp. | | | 53,412 | | | | 4,462,038 | | |
United Stationers, Inc. | | | 143,514 | | | | 5,195,207 | | |
Viad Corp. | | | 72,277 | | | | 1,984,726 | | |
Total | | | | | 39,482,969 | | |
Construction & Engineering 0.9% | |
Aegion Corp.(a) | | | 140,138 | | | | 3,367,516 | | |
Comfort Systems U.S.A., Inc. | | | 133,003 | | | | 1,659,877 | | |
Dycom Industries, Inc.(a) | | | 116,299 | | | | 2,436,464 | | |
EMCOR Group, Inc. | | | 237,394 | | | | 9,156,287 | | |
Orion Marine Group, Inc.(a) | | | 96,883 | | | | 922,326 | | |
Total | | | | | 17,542,470 | | |
Electrical Equipment 1.8% | |
AZZ, Inc. | | | 90,310 | | | | 4,033,245 | | |
Belden, Inc. | | | 157,551 | | | | 7,934,269 | | |
Brady Corp., Class A | | | 164,141 | | | | 5,589,001 | | |
Encore Wire Corp. | | | 66,344 | | | | 2,168,785 | | |
EnerSys, Inc.(a) | | | 172,974 | | | | 7,071,177 | | |
Franklin Electric Co., Inc. | | | 68,773 | | | | 4,475,059 | | |
II-VI, Inc.(a) | | | 194,618 | | | | 3,372,730 | | |
Powell Industries, Inc.(a) | | | 32,310 | | | | 1,880,765 | | |
Vicor Corp.(a) | | | 70,104 | | | | 370,149 | | |
Total | | | | | 36,895,180 | | |
Machinery 3.6% | |
Actuant Corp., Class A | | | 260,014 | | | | 7,907,026 | | |
Albany International Corp., Class A | | | 103,057 | | | | 2,943,308 | | |
Astec Industries, Inc. | | | 74,797 | | | | 2,663,521 | | |
The accompanying Notes to Financial Statements are an integral part of this statement.
Annual Report 2013
12
Columbia Small Cap Index Fund
Portfolio of Investments (continued)
February 28, 2013
Common Stocks (continued)
Issuer | | Shares | | Value ($) | |
Barnes Group, Inc. | | | 167,960 | | | | 4,469,416 | | |
Briggs & Stratton Corp. | | | 169,564 | | | | 4,147,535 | | |
CIRCOR International, Inc. | | | 62,177 | | | | 2,591,537 | | |
EnPro Industries, Inc.(a) | | | 73,893 | | | | 3,438,241 | | |
ESCO Technologies, Inc. | | | 95,082 | | | | 3,856,526 | | |
Federal Signal Corp.(a) | | | 222,241 | | | | 1,733,480 | | |
John Bean Technologies Corp. | | | 103,193 | | | | 1,901,847 | | |
Kaydon Corp. | | | 114,532 | | | | 2,864,445 | | |
Lindsay Corp. | | | 45,388 | | | | 3,878,405 | | |
Lydall, Inc.(a) | | | 60,613 | | | | 912,832 | | |
Mueller Industries, Inc. | | | 100,235 | | | | 5,330,497 | | |
Standex International Corp. | | | 45,398 | | | | 2,443,320 | | |
Tennant Co. | | | 66,300 | | | | 3,094,221 | | |
Titan International, Inc. | | | 170,320 | | | | 3,595,455 | | |
Toro Co. (The) | | | 209,549 | | | | 9,450,660 | | |
Watts Water Technologies, Inc., Class A | | | 99,870 | | | | 4,687,898 | | |
Total | | | | | 71,910,170 | | |
Professional Services 1.1% | |
CDI Corp. | | | 49,674 | | | | 817,634 | | |
Dolan Co. (The)(a) | | | 102,800 | | | | 299,148 | | |
Exponent, Inc.(a) | | | 47,175 | | | | 2,371,487 | | |
Heidrick & Struggles International, Inc. | | | 58,342 | | | | 793,451 | | |
Insperity, Inc. | | | 78,732 | | | | 2,232,052 | | |
Kelly Services, Inc., Class A | | | 96,579 | | | | 1,705,585 | | |
Korn/Ferry International(a) | | | 173,382 | | | | 3,209,301 | | |
Navigant Consulting, Inc.(a) | | | 182,502 | | | | 2,323,251 | | |
On Assignment, Inc.(a) | | | 155,522 | | | | 3,399,711 | | |
Resources Connection, Inc. | | | 147,937 | | | | 1,806,311 | | |
TrueBlue, Inc.(a) | | | 143,301 | | | | 2,778,606 | | |
Total | | | | | 21,736,537 | | |
Road & Rail 0.8% | |
Arkansas Best Corp. | | | 84,995 | | | | 980,842 | | |
Heartland Express, Inc. | | | 163,811 | | | | 2,222,915 | | |
Knight Transportation, Inc. | | | 210,504 | | | | 3,296,493 | | |
Old Dominion Freight Line, Inc.(a) | | | 252,069 | | | | 9,061,881 | | |
Total | | | | | 15,562,131 | | |
Trading Companies & Distributors 0.5% | |
Applied Industrial Technologies, Inc. | | | 150,001 | | | | 6,511,544 | | |
Common Stocks (continued)
Issuer | | Shares | | Value ($) | |
Kaman Corp. | | | 94,706 | | | | 3,305,239 | | |
Total | | | | | 9,816,783 | | |
Total Industrials | | | | | 300,714,184 | | |
Information Technology 17.8% | |
Communications Equipment 1.6% | |
Arris Group, Inc.(a) | | | 404,469 | | | | 7,017,537 | | |
Bel Fuse, Inc., Class B | | | 37,540 | | | | 625,416 | | |
Black Box Corp. | | | 58,993 | | | | 1,431,170 | | |
Comtech Telecommunications Corp. | | | 62,057 | | | | 1,661,887 | | |
Digi International, Inc.(a) | | | 94,062 | | | | 927,451 | | |
Harmonic, Inc.(a) | | | 413,066 | | | | 2,350,346 | | |
Ixia(a) | | | 188,456 | | | | 3,821,888 | | |
NETGEAR, Inc.(a) | | | 136,540 | | | | 4,649,187 | | |
Oplink Communications, Inc.(a) | | | 68,244 | | | | 1,048,228 | | |
PC-Tel, Inc. | | | 62,095 | | | | 429,697 | | |
Procera Networks, Inc.(a) | | | 69,580 | | | | 814,086 | | |
Symmetricom, Inc.(a) | | | 145,859 | | | | 720,544 | | |
Viasat, Inc.(a) | | | 142,890 | | | | 6,710,114 | | |
Total | | | | | 32,207,551 | | |
Computers & Peripherals 1.1% | |
3D Systems Corp.(a) | | | 262,520 | | | | 9,702,721 | | |
Avid Technology, Inc.(a) | | | 108,323 | | | | 750,678 | | |
Electronics for Imaging, Inc.(a) | | | 159,593 | | | | 3,680,215 | | |
Intermec, Inc.(a) | | | 200,210 | | | | 1,982,079 | | |
Intevac, Inc.(a) | | | 83,716 | | | | 400,163 | | |
Super Micro Computer, Inc.(a) | | | 93,932 | | | | 1,099,004 | | |
Synaptics, Inc.(a) | | | 117,524 | | | | 4,085,134 | | |
Total | | | | | 21,699,994 | | |
Electronic Equipment, Instruments & Components 4.1% | |
Agilysys, Inc.(a) | | | 50,549 | | | | 465,556 | | |
Anixter International, Inc. | | | 95,486 | | | | 6,580,895 | | |
Badger Meter, Inc. | | | 51,043 | | | | 2,590,943 | | |
Benchmark Electronics, Inc.(a) | | | 197,806 | | | | 3,445,781 | | |
Checkpoint Systems, Inc.(a) | | | 144,828 | | | | 1,717,660 | | |
Cognex Corp. | | | 142,540 | | | | 5,871,223 | | |
Coherent, Inc. | | | 85,469 | | | | 4,936,689 | | |
CTS Corp. | | | 120,527 | | | | 1,181,165 | | |
Daktronics, Inc. | | | 132,683 | | | | 1,354,693 | | |
DTS, Inc.(a) | | | 66,823 | | | | 1,329,778 | | |
The accompanying Notes to Financial Statements are an integral part of this statement.
Annual Report 2013
13
Columbia Small Cap Index Fund
Portfolio of Investments (continued)
February 28, 2013
Common Stocks (continued)
Issuer | | Shares | | Value ($) | |
Electro Scientific Industries, Inc. | | | 89,138 | | | | 981,409 | | |
FARO Technologies, Inc.(a) | | | 60,551 | | | | 2,564,335 | | |
FEI Co. | | | 135,954 | | | | 8,611,326 | | |
Insight Enterprises, Inc.(a) | | | 158,964 | | | | 3,055,288 | | |
Littelfuse, Inc. | | | 77,892 | | | | 5,154,114 | | |
Measurement Specialties, Inc.(a) | | | 54,703 | | | | 1,986,813 | | |
Mercury Systems, Inc.(a) | | | 115,029 | | | | 787,949 | | |
Methode Electronics, Inc. | | | 125,611 | | | | 1,646,760 | | |
MTS Systems Corp. | | | 55,991 | | | | 3,023,514 | | |
Newport Corp.(a) | | | 136,666 | | | | 2,234,489 | | |
OSI Systems, Inc.(a) | | | 67,037 | | | | 3,863,342 | | |
Park Electrochemical Corp. | | | 69,017 | | | | 1,746,130 | | |
Plexus Corp.(a) | | | 125,159 | | | | 3,048,873 | | |
Radisys Corp.(a) | | | 81,907 | | | | 343,190 | | |
Rofin-Sinar Technologies, Inc.(a) | | | 100,204 | | | | 2,662,420 | | |
Rogers Corp.(a) | | | 59,181 | | | | 2,823,526 | | |
Scansource, Inc.(a) | | | 98,650 | | | | 2,960,486 | | |
SYNNEX Corp.(a) | | | 94,590 | | | | 3,606,717 | | |
TTM Technologies, Inc.(a) | | | 187,068 | | | | 1,533,958 | | |
Total | | | | | 82,109,022 | | |
Internet Software & Services 2.0% | |
Blucora, Inc.(a) | | | 145,359 | | | | 2,253,065 | | |
comScore, Inc.(a) | | | 115,683 | | | | 1,843,987 | | |
Dealertrack Technologies, Inc.(a) | | | 152,381 | | | | 4,493,716 | | |
Dice Holdings, Inc.(a) | | | 178,705 | | | | 1,722,716 | | |
Digital River, Inc.(a) | | | 126,762 | | | | 1,805,091 | | |
j2 Global, Inc. | | | 153,815 | | | | 5,488,119 | | |
Liquidity Services, Inc.(a) | | | 87,530 | | | | 2,980,396 | | |
LivePerson, Inc.(a) | | | 179,387 | | | | 2,595,730 | | |
LogMeIn, Inc.(a) | | | 79,644 | | | | 1,422,442 | | |
NIC, Inc. | | | 209,815 | | | | 3,717,922 | | |
OpenTable, Inc.(a) | | | 81,072 | | | | 4,507,603 | | |
Perficient, Inc.(a) | | | 118,148 | | | | 1,368,154 | | |
QuinStreet, Inc.(a) | | | 91,564 | | | | 524,662 | | |
Stamps.com, Inc.(a) | | | 50,110 | | | | 1,222,183 | | |
United Online, Inc. | | | 324,588 | | | | 1,915,069 | | |
XO Group, Inc.(a) | | | 87,702 | | | | 802,473 | | |
Total | | | | | 38,663,328 | | |
IT Services 1.9% | |
CACI International, Inc., Class A(a) | | | 81,439 | | | | 4,133,029 | | |
Common Stocks (continued)
Issuer | | Shares | | Value ($) | |
Cardtronics, Inc.(a) | | | 158,633 | | | | 4,181,566 | | |
Ciber, Inc.(a) | | | 238,754 | | | | 1,062,455 | | |
CSG Systems International, Inc.(a) | | | 120,287 | | | | 2,334,771 | | |
ExlService Holdings, Inc.(a) | | | 92,895 | | | | 2,811,932 | | |
Forrester Research, Inc. | | | 51,700 | | | | 1,419,682 | | |
Heartland Payment Systems, Inc. | | | 133,890 | | | | 4,163,979 | | |
Higher One Holdings, Inc.(a) | | | 112,823 | | | | 1,008,638 | | |
iGATE Corp.(a) | | | 108,782 | | | | 2,078,824 | | |
MAXIMUS, Inc. | | | 121,619 | | | | 8,851,431 | | |
Sykes Enterprises, Inc.(a) | | | 139,033 | | | | 2,066,030 | | |
TeleTech Holdings, Inc.(a) | | | 80,485 | | | | 1,505,874 | | |
Virtusa Corp.(a) | | | 71,903 | | | | 1,506,368 | | |
Total | | | | | 37,124,579 | | |
Semiconductors & Semiconductor Equipment 4.4% | |
Advanced Energy Industries, Inc.(a) | | | 125,668 | | | | 2,267,051 | | |
ATMI, Inc.(a) | | | 114,210 | | | | 2,501,199 | | |
Brooks Automation, Inc. | | | 236,634 | | | | 2,392,370 | | |
Cabot Microelectronics Corp.(a) | | | 82,747 | | | | 2,827,465 | | |
Ceva, Inc.(a) | | | 79,980 | | | | 1,210,097 | | |
Cirrus Logic, Inc.(a) | | | 233,635 | | | | 5,616,585 | | |
Cohu, Inc. | | | 81,231 | | | | 817,184 | | |
Cymer, Inc.(a) | | | 111,044 | | | | 10,980,031 | | |
Diodes, Inc.(a) | | | 128,037 | | | | 2,551,777 | | |
DSP Group, Inc.(a) | | | 77,683 | | | | 562,425 | | |
Entropic Communications, Inc.(a) | | | 315,902 | | | | 1,393,128 | | |
Exar Corp.(a) | | | 163,857 | | | | 1,925,320 | | |
GT Advanced Technologies, Inc.(a) | | | 424,587 | | | | 1,214,319 | | |
Hittite Microwave Corp.(a) | | | 96,697 | | | | 6,267,900 | | |
Kopin Corp.(a) | | | 219,959 | | | | 708,268 | | |
Kulicke & Soffa Industries, Inc.(a) | | | 267,755 | | | | 2,897,109 | | |
Micrel, Inc. | | | 167,688 | | | | 1,764,078 | | |
Microsemi Corp.(a) | | | 322,243 | | | | 6,647,873 | | |
MKS Instruments, Inc. | | | 187,761 | | | | 5,095,834 | | |
Monolithic Power Systems, Inc. | | | 112,648 | | | | 2,770,014 | | |
Nanometrics, Inc.(a) | | | 75,990 | | | | 1,120,852 | | |
Pericom Semiconductor Corp.(a) | | | 76,374 | | | | 536,145 | | |
Power Integrations, Inc. | | | 103,354 | | | | 4,321,231 | | |
Rubicon Technology, Inc.(a) | | | 61,106 | | | | 315,307 | | |
Rudolph Technologies, Inc.(a) | | | 115,385 | | | | 1,271,543 | | |
Sigma Designs, Inc.(a) | | | 119,370 | | | | 555,070 | | |
The accompanying Notes to Financial Statements are an integral part of this statement.
Annual Report 2013
14
Columbia Small Cap Index Fund
Portfolio of Investments (continued)
February 28, 2013
Common Stocks (continued)
Issuer | | Shares | | Value ($) | |
STR Holdings, Inc.(a) | | | 137,738 | | | | 275,476 | | |
Supertex, Inc. | | | 37,237 | | | | 841,184 | | |
Tessera Technologies, Inc. | | | 186,364 | | | | 3,324,734 | | |
TriQuint Semiconductor, Inc.(a) | | | 593,309 | | | | 2,788,552 | | |
Ultratech, Inc.(a) | | | 96,404 | | | | 3,950,636 | | |
Veeco Instruments, Inc.(a) | | | 139,700 | | | | 4,457,827 | | |
Volterra Semiconductor Corp.(a) | | | 89,378 | | | | 1,371,952 | | |
Total | | | | | 87,540,536 | | |
Software 2.7% | |
Blackbaud, Inc. | | | 161,125 | | | | 4,479,275 | | |
Bottomline Technologies de, Inc.(a) | | | 133,362 | | | | 3,618,111 | | |
Ebix, Inc. | | | 114,378 | | | | 1,833,479 | | |
EPIQ Systems, Inc. | | | 113,985 | | | | 1,417,973 | | |
Interactive Intelligence Group, Inc.(a) | | | 53,105 | | | | 2,209,699 | | |
Manhattan Associates, Inc.(a) | | | 70,897 | | | | 4,952,864 | | |
MicroStrategy, Inc., Class A(a) | | | 31,634 | | | | 3,222,872 | | |
Monotype Imaging Holdings, Inc. | | | 132,051 | | | | 2,773,071 | | |
Netscout Systems, Inc.(a) | | | 128,254 | | | | 3,261,499 | | |
Progress Software Corp.(a) | | | 206,433 | | | | 4,648,871 | | |
Sourcefire, Inc.(a) | | | 107,349 | | | | 5,757,127 | | |
Synchronoss Technologies, Inc.(a) | | | 96,763 | | | | 2,919,340 | | |
Take-Two Interactive Software, Inc.(a) | | | 323,773 | | | | 4,740,037 | | |
Tyler Technologies, Inc.(a) | | | 93,757 | | | | 5,287,895 | | |
VASCO Data Security International, Inc.(a) | | | 102,888 | | | | 850,884 | | |
Websense, Inc.(a) | | | 130,219 | | | | 1,951,983 | | |
Total | | | | | 53,924,980 | | |
Total Information Technology | | | | | 353,269,990 | | |
Materials 6.5% | |
Chemicals 2.7% | |
A. Schulman, Inc. | | | 104,528 | | | | 3,276,953 | | |
American Vanguard Corp. | | | 85,086 | | | | 2,640,219 | | |
Balchem Corp. | | | 104,792 | | | | 4,226,261 | | |
Calgon Carbon Corp.(a) | | | 203,506 | | | | 3,471,812 | | |
H.B. Fuller Co. | | | 177,973 | | | | 7,273,756 | | |
Hawkins, Inc. | | | 32,722 | | | | 1,290,556 | | |
Innophos Holdings, Inc. | | | 77,485 | | | | 3,783,592 | | |
Koppers Holdings, Inc. | | | 73,427 | | | | 3,045,752 | | |
Kraton Performance Polymers, Inc.(a) | | | 115,135 | | | | 2,767,845 | | |
LSB Industries, Inc.(a) | | | 67,120 | | | | 2,600,900 | | |
Common Stocks (continued)
Issuer | | Shares | | Value ($) | |
OM Group, Inc.(a) | | | 115,518 | | | | 2,834,812 | | |
PolyOne Corp. | | | 317,792 | | | | 7,242,480 | | |
Quaker Chemical Corp. | | | 46,668 | | | | 2,679,210 | | |
Stepan Co. | | | 59,319 | | | | 3,632,696 | | |
Tredegar Corp. | | | 85,948 | | | | 2,104,007 | | |
Zep, Inc. | | | 79,885 | | | | 1,195,080 | | |
Total | | | | | 54,065,931 | | |
Construction Materials 0.9% | |
Eagle Materials, Inc. | | | 165,857 | | | | 10,666,264 | | |
Headwaters, Inc.(a) | | | 253,823 | | | | 2,388,474 | | |
Texas Industries, Inc.(a) | | | 74,008 | | | | 4,296,164 | | |
Total | | | | | 17,350,902 | | |
Containers & Packaging 0.1% | |
Myers Industries, Inc. | | | 110,789 | | | | 1,630,814 | | |
Metals & Mining 1.6% | |
AK Steel Holding Corp. | | | 484,950 | | | | 1,818,563 | | |
AM Castle & Co.(a) | | | 59,331 | | | | 974,808 | | |
AMCOL International Corp. | | | 90,075 | | | | 2,633,793 | | |
Century Aluminum Co.(a) | | | 183,094 | | | | 1,484,892 | | |
Globe Specialty Metals, Inc. | | | 227,593 | | | | 3,252,304 | | |
Haynes International, Inc. | | | 43,854 | | | | 2,258,481 | | |
Kaiser Aluminum Corp. | | | 59,949 | | | | 3,671,277 | | |
Materion Corp. | | | 72,894 | | | | 2,016,248 | | |
Olympic Steel, Inc. | | | 32,724 | | | | 676,405 | | |
RTI International Metals, Inc.(a) | | | 108,198 | | | | 3,210,235 | | |
Stillwater Mining Co.(a) | | | 416,743 | | | | 5,434,329 | | |
Suncoke Energy, Inc.(a) | | | 249,617 | | | | 4,116,184 | | |
Total | | | | | 31,547,519 | | |
Paper & Forest Products 1.2% | |
Buckeye Technologies, Inc. | | | 138,005 | | | | 3,826,879 | | |
Clearwater Paper Corp.(a) | | | 82,781 | | | | 4,005,772 | | |
Deltic Timber Corp. | | | 38,850 | | | | 2,773,501 | | |
KapStone Paper and Packaging Corp. | | | 136,944 | | | | 3,648,188 | | |
Neenah Paper, Inc. | | | 56,580 | | | | 1,652,136 | | |
PH Glatfelter Co. | | | 152,894 | | | | 2,775,026 | | |
Schweitzer-Mauduit International, Inc. | | | 110,722 | | | | 4,080,106 | | |
Wausau Paper Corp. | | | 165,410 | | | | 1,632,597 | | |
Total | | | | | 24,394,205 | | |
Total Materials | | | | | 128,989,371 | | |
The accompanying Notes to Financial Statements are an integral part of this statement.
Annual Report 2013
15
Columbia Small Cap Index Fund
Portfolio of Investments (continued)
February 28, 2013
Common Stocks (continued)
Issuer | | Shares | | Value ($) | |
Telecommunication Services 0.4% | |
Diversified Telecommunication Services 0.3% | |
Atlantic Tele-Network, Inc. | | | 33,329 | | | | 1,566,463 | | |
Cbeyond, Inc.(a) | | | 106,387 | | | | 746,837 | | |
Cincinnati Bell, Inc.(a) | | | 711,494 | | | | 2,312,356 | | |
General Communication, Inc., Class A(a) | | | 116,047 | | | | 980,597 | | |
Lumos Networks Corp. | | | 52,889 | | | | 603,992 | | |
Total | | | | | 6,210,245 | | |
Wireless Telecommunication Services 0.1% | |
NTELOS Holdings Corp. | | | 55,089 | | | | 687,510 | | |
U.S.A. Mobility, Inc. | | | 78,279 | | | | 909,602 | | |
Total | | | | | 1,597,112 | | |
Total Telecommunication Services | | | | | 7,807,357 | | |
Utilities 4.0% | |
Electric Utilities 1.3% | |
Allete, Inc. | | | 124,726 | | | | 5,862,122 | | |
El Paso Electric Co. | | | 143,120 | | | | 4,773,052 | | |
UIL Holdings Corp. | | | 180,322 | | | | 7,061,409 | | |
UNS Energy Corp. | | | 147,643 | | | | 6,942,174 | | |
Total | | | | | 24,638,757 | | |
Gas Utilities 1.8% | |
Laclede Group, Inc. (The) | | | 74,832 | | | | 3,050,152 | | |
New Jersey Resources Corp. | | | 148,728 | | | | 6,627,320 | | |
Northwest Natural Gas Co. | | | 95,880 | | | | 4,367,334 | | |
Piedmont Natural Gas Co., Inc. | | | 257,138 | | | | 8,290,129 | | |
South Jersey Industries, Inc. | | | 111,533 | | | | 6,149,930 | | |
Southwest Gas Corp. | | | 164,617 | | | | 7,457,150 | | |
Total | | | | | 35,942,015 | | |
Common Stocks (continued)
Issuer | | Shares | | Value ($) | |
Multi-Utilities 0.7% | |
Avista Corp. | | | 213,219 | | | | 5,584,206 | | |
CH Energy Group, Inc. | | | 53,334 | | | | 3,473,643 | | |
NorthWestern Corp. | | | 132,777 | | | | 5,175,648 | | |
Total | | | | | 14,233,497 | | |
Water Utilities 0.2% | |
American States Water Co. | | | 68,552 | | | | 3,630,514 | | |
Total Utilities | | | | | 78,444,783 | | |
Total Common Stocks
(Cost: $1,316,848,493) | | | | | 1,939,708,359 | | |
Rights —%
Information Technology —% | |
Electronic Equipment, Instruments & Components —% | |
Gerber Scientific, Inc.(a)(b)(c)(d) | | | 112,391 | | | | — | | |
Total Information Technology | | | | | — | | |
Total Rights
(Cost: $—) | | | | | — | | |
Money Market Funds 2.7%
| | Shares | | Value ($) | |
Columbia Short-Term Cash Fund,
0.128%(e)(f) | | | 53,859,530 | | | | 53,859,530 | | |
Total Money Market Funds
(Cost: $53,859,530) | | | | | 53,859,530 | | |
Total Investments
(Cost: $1,370,708,023) | | | | | 1,993,567,889 | | |
Other Assets & Liabilities, Net | | | | | (8,609,290 | ) | |
Net Assets | | | | | 1,984,958,599 | | |
Investments in Derivatives
Futures Contracts Outstanding at February 28, 2013
At February 28, 2013, $2,000,000 was held in a margin deposit account as collateral to cover initial margin requirements on open futures contracts.
Contract Description | | Number of
Contracts
Long (Short) | | Notional
Market
Value ($) | | Expiration
Date | | Unrealized
Appreciation ($) | | Unrealized
Depreciation ($) | |
Russell 2000 Mini Index | | | 500 | | | | 45,510,000 | | | March 2013 | | | 3,549,283 | | | | — | | |
The accompanying Notes to Financial Statements are an integral part of this statement.
Annual Report 2013
16
Columbia Small Cap Index Fund
Portfolio of Investments (continued)
February 28, 2013
Notes to Portfolio of Investments
(a) Non-income producing.
(b) Negligible market value.
(c) Represents fair value as determined in good faith under procedures approved by the Board of Trustees. At February 28, 2013, the value of these securities amounted to $0, which represents 0.00% of net assets.
(d) Identifies issues considered to be illiquid as to their marketability. The aggregate value of such securities at February 28, 2013 was $0, representing 0.00% of net assets. Information concerning such security holdings at February 28, 2013 is as follows:
Security Description | | Acquisition Dates | | Cost ($) | |
Gerber Scientific, Inc. | | 08/22/11 | | | — | | |
(e) The rate shown is the seven-day current annualized yield at February 28, 2013.
(f) As defined in the Investment Company Act of 1940, an affiliated company is one in which the Fund owns 5% or more of its outstanding voting securities, or a company which is under common ownership or control with the Fund. Holdings and transactions in these affiliated companies during the year ended February 28, 2013, are as follows:
Issuer | | Beginning
Cost ($) | | Purchase
Cost ($) | | Proceeds
from Sales ($) | | Ending
Cost ($) | | Dividends —
Affiliated
Issuers ($) | | Value ($) | |
Columbia Short-Term Cash Fund | | | 37,258,392 | | | | 334,279,753 | | | | (317,678,615 | ) | | | 53,859,530 | | | | 58,331 | | | | 53,859,530 | | |
Fair Value Measurements
Generally accepted accounting principles (GAAP) require disclosure regarding the inputs and valuation techniques used to measure fair value and any changes in valuation inputs or techniques. In addition, investments shall be disclosed by major category.
The Fund categorizes its fair value measurements according to a three-level hierarchy that maximizes the use of observable inputs and minimizes the use of unobservable inputs by prioritizing that the most observable input be used when available. Observable inputs are those that market participants would use in pricing an investment based on market data obtained from sources independent of the reporting entity. Unobservable inputs are those that reflect the Fund's assumptions about the information market participants would use in pricing an investment. An investment's level within the fair value hierarchy is based on the lowest level of any input that is deemed significant to the asset or liability's fair value measurement. The input levels are not necessarily an indication of the risk or liquidity associated with investments at that level. For example, certain U.S. government securities are generally high quality and liquid, however, they are reflected as Level 2 because the inputs used to determine fair value may not always be quoted prices in an active market.
Fair value inputs are summarized in the three broad levels listed below:
> Level 1 — Valuations based on quoted prices for investments in active markets that the Fund has the ability to access at the measurement date (including NAV for open-end mutual funds). Valuation adjustments are not applied to Level 1 investments.
> Level 2 — Valuations based on other significant observable inputs (including quoted prices for similar securities, interest rates, prepayment speeds, credit risks, etc.).
> Level 3 — Valuations based on significant unobservable inputs (including the Fund's own assumptions and judgment in determining the fair value of investments).
Inputs that are used in determining fair value of an investment may include price information, credit data, volatility statistics, and other factors. These inputs can be either observable or unobservable. The availability of observable inputs can vary between investments, and is affected by various factors such as the type of investment, and the volume and level of activity for that investment or similar investments in the marketplace. The inputs will be considered by the Investment Manager, along with any other relevant factors in the calculation of an investment's fair value. The Fund uses prices and inputs that are current as of the measurement date, which may include periods of market dislocations. During these periods, the availability of prices and inputs may be reduced for many investments. This condition could cause an investment to be reclassified between the various levels within the hierarchy.
Investments falling into the Level 3 category are primarily supported by quoted prices from brokers and dealers participating in the market for those investments. However, these may be classified as Level 3 investments due to lack of market transparency and corroboration to support these quoted prices. Additionally, valuation models may be used as the pricing source for any remaining investments classified as Level 3. These models rely on one or more significant unobservable inputs and/or significant assumptions by the Investment Manager. Inputs used in valuations may include, but are not limited to, financial statement analysis, capital account balances, discount rates and estimated cash flows, and comparable company data.
Under the direction of the Fund's Board of Trustees (the Board), the Investment Manager's Valuation Committee (the Committee) is responsible for carrying out the valuation procedures approved by the Board. The Committee consists of voting and non-voting members from various groups within the Investment Manager's organization, including operations and accounting, trading and investments, compliance, risk management and legal.
The accompanying Notes to Financial Statements are an integral part of this statement.
Annual Report 2013
17
Columbia Small Cap Index Fund
Portfolio of Investments (continued)
February 28, 2013
Fair Value Measurements (continued)
The Committee meets at least monthly to review and approve valuation matters, which may include a description of specific valuation determinations, data regarding pricing information received from approved pricing vendors and brokers and the results of Board-approved valuation control policies and procedures (the Policies). The Policies address, among other things, instances when market quotations are readily available, including recommendations of third party pricing vendors and a determination of appropriate pricing methodologies; events that require specific valuation determinations and assessment of fair value techniques; securities with a potential for stale pricing, including those that are illiquid, restricted, or in default; and the effectiveness of third-party pricing vendors, including periodic reviews of vendors. The Committee meets more frequently, as needed, to discuss additional valuation matters, which may include the need to review back-testing results, review time-sensitive information or approve related valuation actions. The Committee reports to the Board, with members of the Committee meeting with the Board at each of its regularly scheduled meetings to discuss valuation matters and actions during the period, similar to those described earlier.
For investments categorized as Level 3, the Committee monitors information similar to that described above, which may include: (i) data specific to the issuer or comparable issuers, (ii) general market or specific sector news and (iii) quoted prices and specific or similar security transactions. The Committee considers this data and any changes from prior periods in order to assess the reasonableness of observable and unobservable inputs, any assumptions or internal models used to value those securities and changes in fair value. This data is also used to corroborate, when available, information received from approved pricing vendors and brokers. Various factors impact the frequency of monitoring this information (which may occur as often as daily). However, the Committee may determine that changes to inputs, assumptions and models are not required as a result of the monitoring procedures performed.
The following table is a summary of the inputs used to value the Fund's investments at February 28, 2013:
Description | | Level 1
Quoted Prices in Active
Markets for Identical
Assets ($) | | Level 2
Other Significant
Observable Inputs ($) | | Level 3
Significant
Unobservable Inputs ($) | | Total ($) | |
Equity Securities | |
Common Stocks | |
Consumer Discretionary | | | 297,344,626 | | | | — | | | | — | | | | 297,344,626 | | |
Consumer Staples | | | 75,341,954 | | | | — | | | | — | | | | 75,341,954 | | |
Energy | | | 87,636,996 | | | | — | | | | — | | | | 87,636,996 | | |
Financials | | | 404,726,644 | | | | — | | | | — | | | | 404,726,644 | | |
Health Care | | | 205,432,454 | | | | — | | | | — | | | | 205,432,454 | | |
Industrials | | | 300,714,184 | | | | — | | | | — | | | | 300,714,184 | | |
Information Technology | | | 353,269,990 | | | | — | | | | — | | | | 353,269,990 | | |
Materials | | | 128,989,371 | | | | — | | | | — | | | | 128,989,371 | | |
Telecommunication Services | | | 7,807,357 | | | | — | | | | — | | | | 7,807,357 | | |
Utilities | | | 78,444,783 | | | | — | | | | — | | | | 78,444,783 | | |
Total Equity Securities | | | 1,939,708,359 | | | | — | | | | — | | | | 1,939,708,359 | | |
Other | |
Money Market Funds | | | 53,859,530 | | | | — | | | | — | | | | 53,859,530 | | |
Total Other | | | 53,859,530 | | | | — | | | | — | | | | 53,859,530 | | |
Investments in Securities | | | 1,993,567,889 | | | | — | | | | — | | | | 1,993,567,889 | | |
Derivatives | |
Assets | |
Futures Contracts | | | 3,549,283 | | | | — | | | | — | | | | 3,549,283 | | |
Total | | | 1,997,117,172 | | | | — | | | | — | | | | 1,997,117,172 | | |
See the Portfolio of Investments for all investment classifications not indicated in the table.
There were no transfers of financial assets between Levels 1 and 2 during the period.
Derivative instruments are valued at unrealized appreciation (depreciation).
The accompanying Notes to Financial Statements are an integral part of this statement.
Annual Report 2013
18
Columbia Small Cap Index Fund
Statement of Assets and Liabilities
February 28, 2013
Assets | |
Investments, at value | |
Unaffiliated issuers (identified cost $1,316,848,493) | | $ | 1,939,708,359 | | |
Affiliated issuers (identified cost $53,859,530) | | | 53,859,530 | | |
Total investments (identified cost $1,370,708,023) | | | 1,993,567,889 | | |
Margin deposits on futures contracts | | | 2,000,000 | | |
Receivable for: | |
Investments sold | | | 14,217,590 | | |
Capital shares sold | | | 2,614,243 | | |
Dividends | | | 1,420,293 | | |
Variation margin on futures contracts | | | 48,991 | | |
Expense reimbursement due from Investment Manager | | | 57 | | |
Due from broker | | | 508,000 | | |
Total assets | | | 2,014,377,063 | | |
Liabilities | |
Payable for: | |
Investments purchased | | | 4,472,190 | | |
Capital shares purchased | | | 24,824,572 | | |
Investment management fees | | | 5,487 | | |
Distribution and/or service fees | | | 5,027 | | |
Administration fees | | | 5,487 | | |
Plan administration fees | | | 1,941 | | |
Compensation of board members | | | 102,265 | | |
Other expenses | | | 1,495 | | |
Total liabilities | | | 29,418,464 | | |
Net assets applicable to outstanding capital stock | | $ | 1,984,958,599 | | |
Represented by | |
Paid-in capital | | $ | 1,368,477,003 | | |
Undistributed net investment income | | | 1,421,240 | | |
Accumulated net realized loss | | | (11,348,793 | ) | |
Unrealized appreciation (depreciation) on: | |
Investments | | | 622,859,866 | | |
Futures contracts | | | 3,549,283 | | |
Total — representing net assets applicable to outstanding capital stock | | $ | 1,984,958,599 | | |
The accompanying Notes to Financial Statements are an integral part of this statement.
Annual Report 2013
19
Columbia Small Cap Index Fund
Statement of Assets and Liabilities (continued)
February 28, 2013
Class A | |
Net assets | | $ | 687,933,544 | | |
Shares outstanding | | | 36,216,292 | | |
Net asset value per share | | $ | 19.00 | | |
Class B | |
Net assets | | $ | 11,595,502 | | |
Shares outstanding | | | 612,048 | | |
Net asset value per share | | $ | 18.95 | | |
Class I | |
Net assets | | $ | 2,885 | | |
Shares outstanding | | | 152 | | |
Net asset value per share(a) | | $ | 19.01 | | |
Class K | |
Net assets | | $ | 9,783,926 | | |
Shares outstanding | | | 513,586 | | |
Net asset value per share | | $ | 19.05 | | |
Class R5 | |
Net assets | | $ | 80,919 | | |
Shares outstanding | | | 4,186 | | |
Net asset value per share | | $ | 19.33 | | |
Class Z | |
Net assets | | $ | 1,275,561,823 | | |
Shares outstanding | | | 66,924,378 | | |
Net asset value per share | | $ | 19.06 | | |
(a) Net asset value per share rounds to this amount due to fractional shares outstanding.
The accompanying Notes to Financial Statements are an integral part of this statement.
Annual Report 2013
20
Columbia Small Cap Index Fund
Statement of Operations
Year Ended February 28, 2013
Net investment income | |
Income: | |
Dividends — unaffiliated issuers | | $ | 33,056,357 | | |
Dividends — affiliated issuers | | | 58,331 | | |
Income from securities lending — net | | | 1,326,196 | | |
Total income | | | 34,440,884 | | |
Expenses: | |
Investment management fees | | | 1,875,113 | | |
Distribution and/or service fees | |
Class A | | | 1,504,811 | | |
Class B | | | 132,481 | | |
Administration fees | | | 1,875,113 | | |
Plan administration fees | |
Class K(a) | | | 22,940 | | |
Compensation of board members | | | 62,847 | | |
Line of credit interest expense | | | 206 | | |
Other | | | 13,315 | | |
Total expenses | | | 5,486,826 | | |
Fees waived or expenses reimbursed by Investment Manager and its affiliates | | | (67,196 | ) | |
Expense reductions | | | (4,728 | ) | |
Total net expenses | | | 5,414,902 | | |
Net investment income | | | 29,025,982 | | |
Realized and unrealized gain (loss) — net | |
Net realized gain (loss) on: | |
Investments | | | 16,208,334 | | |
Futures contracts | | | 6,305,107 | | |
Net realized gain | | | 22,513,441 | | |
Net change in unrealized appreciation (depreciation) on: | |
Investments | | | 158,074,960 | | |
Futures contracts | | | 1,250,556 | | |
Net change in unrealized appreciation (depreciation) | | | 159,325,516 | | |
Net realized and unrealized gain | | | 181,838,957 | | |
Net increase in net assets resulting from operations | | $ | 210,864,939 | | |
(a) Effective October 25, 2012, Class R4 shares were renamed Class K shares.
The accompanying Notes to Financial Statements are an integral part of this statement.
Annual Report 2013
21
Columbia Small Cap Index Fund
Statement of Changes in Net Assets
| | | Year ended
February 28,
2013(a) | | Year ended
February 29,
2012(b)(c) | |
Operations | |
Net investment income | | $ | 29,025,982 | | | $ | 18,720,208 | | |
Net realized gain | | | 22,513,441 | | | | 124,014,430 | | |
Net change in unrealized appreciation (depreciation) | | | 159,325,516 | | | | (37,882,488 | ) | |
Net increase in net assets resulting from operations | | | 210,864,939 | | | | 104,852,150 | | |
Distributions to shareholders | |
Net investment income | |
Class A | | | (8,835,568 | ) | | | (3,701,970 | ) | |
Class B | | | (92,006 | ) | | | (12,461 | ) | |
Class I | | | (47 | ) | | | (24 | ) | |
Class K(d) | | | (130,672 | ) | | | (64,558 | ) | |
Class R5 | | | (43 | ) | | | — | | |
Class Z | | | (19,265,834 | ) | | | (14,626,391 | ) | |
Net realized gains | |
Class A | | | (29,052,987 | ) | | | (19,220,754 | ) | |
Class B | | | (714,002 | ) | | | (462,560 | ) | |
Class I | | | (133 | ) | | | (70 | ) | |
Class K(d) | | | (444,667 | ) | | | (250,641 | ) | |
Class R5 | | | (44 | ) | | | — | | |
Class Z | | | (54,131,198 | ) | | | (85,869,199 | ) | |
Total distributions to shareholders | | | (112,667,201 | ) | | | (124,208,628 | ) | |
Increase (decrease) in net assets from capital stock activity | | | (411,521,182 | ) | | | 452,887,679 | | |
Proceeds from regulatory settlements (Note 7) | | | — | | | | 20,242 | | |
Total increase (decrease) in net assets | | | (313,323,444 | ) | | | 433,551,443 | | |
Net assets at beginning of year | | | 2,298,282,043 | | | | 1,864,730,600 | | |
Net assets at end of year | | $ | 1,984,958,599 | | | $ | 2,298,282,043 | | |
Undistributed net investment income | | $ | 1,421,240 | | | $ | 221,253 | | |
(a) Class R5 shares are for the period from November 8, 2012 (commencement of operations) to February 28, 2013.
(b) Class B and Class R4 shares are for the period from March 7, 2011 (commencement of operations) to February 29, 2012.
(c) Class I shares are for the period from November 16, 2011 (commencement of operations) to February 29, 2012.
(d) Effective October 25, 2012, Class R4 shares were renamed Class K shares.
The accompanying Notes to Financial Statements are an integral part of this statement.
Annual Report 2013
22
Columbia Small Cap Index Fund
Statement of Changes in Net Assets (continued)
| | | Year ended February 28, 2013(a) | | Year ended February 29, 2012(b)(c) | |
| | | Shares | | Dollars($) | | Shares | | Dollars($) | |
Capital stock activity | |
Class A shares | |
Subscriptions(d) | | | 12,272,612 | | | | 217,416,726 | | | | 7,323,046 | | | | 125,611,197 | | |
Fund merger | | | — | | | | — | | | | 20,611,091 | | | | 361,216,966 | | |
Distributions reinvested | | | 2,152,007 | | | | 36,499,212 | | | | 1,345,701 | | | | 22,192,742 | | |
Redemptions | | | (10,363,166 | ) | | | (183,280,250 | ) | | | (7,319,115 | ) | | | (123,339,421 | ) | |
Net increase | | | 4,061,453 | | | | 70,635,688 | | | | 21,960,723 | | | | 385,681,484 | | |
Class B shares | |
Subscriptions | | | 27,883 | | | | 494,004 | | | | 13,734 | | | | 228,153 | | |
Fund merger | | | — | | | | — | | | | 1,666,330 | | | | 29,135,680 | | |
Distributions reinvested | | | 47,789 | | | | 805,040 | | | | 29,110 | | | | 467,212 | | |
Redemptions(d) | | | (445,467 | ) | | | (7,667,104 | ) | | | (727,331 | ) | | | (12,870,503 | ) | |
Net increase (decrease) | | | (369,795 | ) | | | (6,368,060 | ) | | | 981,843 | | | | 16,960,542 | | |
Class I shares | |
Subscriptions | | | — | | | | — | | | | 152 | | | | 2,500 | | |
Net increase | | | — | | | | — | | | | 152 | | | | 2,500 | | |
Class K shares(e) | |
Subscriptions | | | 79,667 | | | | 1,426,562 | | | | 109,033 | | | | 1,879,937 | | |
Fund merger | | | — | | | | — | | | | 558,110 | | | | 9,804,641 | | |
Distributions reinvested | | | 33,822 | | | | 575,180 | | | | 19,581 | | | | 315,054 | | |
Redemptions | | | (153,729 | ) | | | (2,719,736 | ) | | | (132,898 | ) | | | (2,292,545 | ) | |
Net increase (decrease) | | | (40,240 | ) | | | (717,994 | ) | | | 553,826 | | | | 9,707,087 | | |
Class R5 shares | |
Subscriptions | | | 4,186 | | | | 81,292 | | | | — | | | | — | | |
Net increase | | | 4,186 | | | | 81,292 | | | | — | | | | — | | |
Class Z shares | |
Subscriptions | | | 18,712,233 | | | | 335,164,984 | | | | 16,655,344 | | | | 282,842,375 | | |
Distributions reinvested | | | 2,446,478 | | | | 41,655,862 | | | | 4,048,483 | | | | 68,860,680 | | |
Redemptions | | | (49,712,101 | ) | | | (851,972,954 | ) | | | (18,313,870 | ) | | | (311,166,989 | ) | |
Net increase (decrease) | | | (28,553,390 | ) | | | (475,152,108 | ) | | | 2,389,957 | | | | 40,536,066 | | |
Total net increase (decrease) | | | (24,897,786 | ) | | | (411,521,182 | ) | | | 25,886,501 | | | | 452,887,679 | | |
(a) Class R5 shares are for the period from November 8, 2012 (commencement of operations) to February 28, 2013.
(b) Class B and Class R4 shares are for the period from March 7, 2011 (commencement of operations) to February 29, 2012.
(c) Class I shares are for the period from November 16, 2011 (commencement of operations) to February 29, 2012.
(d) Includes conversions of Class B shares to Class A shares, if any.
(e) Effective October 25, 2012, Class R4 shares were renamed Class K shares.
The accompanying Notes to Financial Statements are an integral part of this statement.
Annual Report 2013
23
Columbia Small Cap Index Fund
The following tables are intended to help you understand the Fund's financial performance. Certain information reflects financial results for a single share of a class held for the periods shown. Per share net investment income (loss) amounts are calculated based on average shares outstanding during the period. Total return assumes reinvestment of all dividends and distributions, if any. Total return does not reflect payment of sales charges, if any, and is not annualized for periods of less than one year.
| | | Year Ended
February 28, | | Year Ended
February 29, | | Year Ended February 28, | |
Class A | | 2013 | | 2012 | | 2011 | | 2010 | | 2009 | |
Per share data | |
Net asset value, beginning of period | | $ | 17.75 | | | $ | 18.01 | | | $ | 13.97 | | | $ | 8.58 | | | $ | 17.70 | | |
Income from investment operations: | |
Net investment income | | | 0.24 | | | | 0.12 | | | | 0.12 | | | | 0.08 | | | | 0.17 | | |
Net realized and unrealized gain (loss) | | | 2.14 | | | | 0.66 | | | | 4.14 | | | | 5.40 | | | | (7.25 | ) | |
Total from investment operations | | | 2.38 | | | | 0.78 | | | | 4.26 | | | | 5.48 | | | | (7.08 | ) | |
Less distributions to shareholders: | |
Net investment income | | | (0.25 | ) | | | (0.12 | ) | | | (0.12 | ) | | | (0.09 | ) | | | (0.17 | ) | |
Net realized gains | | | (0.88 | ) | | | (0.92 | ) | | | (0.10 | ) | | | — | | | | (1.87 | ) | |
Total distributions to shareholders | | | (1.13 | ) | | | (1.04 | ) | | | (0.22 | ) | | | (0.09 | ) | | | (2.04 | ) | |
Proceeds from regulatory settlements | | | — | | | | 0.00 | (a) | | | — | | | | 0.00 | (a) | | | — | | |
Net asset value, end of period | | $ | 19.00 | | | $ | 17.75 | | | $ | 18.01 | | | $ | 13.97 | | | $ | 8.58 | | |
Total return | | | 14.32 | % | | | 4.65 | % | | | 30.55 | % | | | 63.90 | % | | | (42.43 | %) | |
Ratios to average net assets(b)(c) | |
Total gross expenses | | | 0.45 | %(d) | | | 0.45 | % | | | 0.45 | % | | | 0.45 | % | | | 0.45 | %(d) | |
Total net expenses(e) | | | 0.45 | %(d)(f) | | | 0.45 | %(f) | | | 0.45 | % | | | 0.45 | % | | | 0.45 | %(d)(f) | |
Net investment income | | | 1.37 | % | | | 0.74 | % | | | 0.73 | % | | | 0.68 | % | | | 1.15 | % | |
Supplemental data | |
Net assets, end of period (in thousands) | | $ | 687,934 | | | $ | 570,806 | | | $ | 183,578 | | | $ | 96,238 | | | $ | 33,273 | | |
Portfolio turnover | | | 17 | % | | | 20 | % | | | 14 | % | | | 14 | % | | | 35 | % | |
Notes to Financial Highlights
(a) Rounds to zero.
(b) In addition to the fees and expenses which the Fund bears directly, the Fund indirectly bears a pro rata share of the fees and expenses of the acquired funds in which it invests. Such indirect expenses are not included in the reported expense ratios.
(c) Certain line items from prior years have been reclassified to conform to the current presentation.
(d) Ratios include line of credit interest expense which rounds to less than 0.01%.
(e) Total net expenses include the impact of certain waivers/reimbursements made by the Investment Manager and certain of its affiliates, if applicable.
(f) The benefits derived from expense reductions had an impact of less than 0.01%.
The accompanying Notes to Financial Statements are an integral part of this statement.
Annual Report 2013
24
Columbia Small Cap Index Fund
Financial Highlights (continued)
Class B | | Year ended
February 28,
2013 | | Year ended
February 29,
2012(a) | |
Per share data | |
Net asset value, beginning of period | | $ | 17.73 | | | $ | 17.82 | | |
Income from investment operations: | |
Net investment income | | | 0.11 | | | | 0.00 | (b) | |
Net realized and unrealized gain | | | 2.13 | | | | 0.84 | | |
Total from investment operations | | | 2.24 | | | | 0.84 | | |
Less distributions to shareholders: | |
Net investment income | | | (0.14 | ) | | | (0.01 | ) | |
Net realized gains | | | (0.88 | ) | | | (0.92 | ) | |
Total distributions to shareholders | | | (1.02 | ) | | | (0.93 | ) | |
Proceeds from regulatory settlements | | | — | | | | 0.00 | (b) | |
Net asset value, end of period | | $ | 18.95 | | | $ | 17.73 | | |
Total return | | | 13.45 | % | | | 4.97 | % | |
Ratios to average net assets(c) | |
Total gross expenses | | | 1.20 | %(d) | | | 1.20 | %(e) | |
Total net expenses(f) | | | 1.20 | %(d)(g) | | | 1.20 | %(e)(g) | |
Net investment income | | | 0.61 | % | | | 0.01 | %(e) | |
Supplemental data | |
Net assets, end of period (in thousands) | | $ | 11,596 | | | $ | 17,410 | | |
Portfolio turnover | | | 17 | % | | | 20 | % | |
Notes to Financial Highlights
(a) For the period from March 7, 2011 (commencement of operations) to February 29, 2012.
(b) Rounds to zero.
(c) In addition to the fees and expenses which the Fund bears directly, the Fund indirectly bears a pro rata share of the fees and expenses of the acquired funds in which it invests. Such indirect expenses are not included in the reported expense ratios.
(d) Ratios include line of credit interest expense which rounds to less than 0.01%.
(e) Annualized.
(f) Total net expenses include the impact of certain waivers/reimbursements made by the Investment Manager and certain of its affiliates, if applicable.
(g) The benefits derived from expense reductions had an impact of less than 0.01%.
The accompanying Notes to Financial Statements are an integral part of this statement.
Annual Report 2013
25
Columbia Small Cap Index Fund
Financial Highlights (continued)
Class I | | Year ended
February 28,
2013 | | Year ended
February 29,
2012(a) | |
Per share data | |
Net asset value, beginning of period | | $ | 17.76 | | | $ | 16.47 | | |
Income from investment operations: | |
Net investment income | | | 0.29 | | | | 0.05 | | |
Net realized and unrealized gain | | | 2.14 | | | | 1.87 | | |
Total from investment operations | | | 2.43 | | | | 1.92 | | |
Less distributions to shareholders: | |
Net investment income | | | (0.30 | ) | | | (0.17 | ) | |
Net realized gains | | | (0.88 | ) | | | (0.46 | ) | |
Total distributions to shareholders | | | (1.18 | ) | | | (0.63 | ) | |
Proceeds from regulatory settlements | | | — | | | | 0.00 | (b) | |
Net asset value, end of period | | $ | 19.01 | | | $ | 17.76 | | |
Total return | | | 14.63 | % | | | 12.03 | % | |
Ratios to average net assets(c) | |
Total gross expenses | | | 0.18 | %(d) | | | 0.17 | %(e) | |
Total net expenses(f) | | | 0.18 | %(d) | | | 0.17 | %(e) | |
Net investment income | | | 1.65 | % | | | 1.09 | %(e) | |
Supplemental data | |
Net assets, end of period (in thousands) | | $ | 3 | | | $ | 3 | | |
Portfolio turnover | | | 17 | % | | | 20 | % | |
Notes to Financial Highlights
(a) For the period from November 16, 2011 (commencement of operations) to February 29, 2012.
(b) Rounds to zero.
(c) In addition to the fees and expenses which the Fund bears directly, the Fund indirectly bears a pro rata share of the fees and expenses of the acquired funds in which it invests. Such indirect expenses are not included in the reported expense ratios.
(d) Ratios include line of credit interest expense which rounds to less than 0.01%.
(e) Annualized.
(f) Total net expenses include the impact of certain waivers/reimbursements made by the Investment Manager and certain of its affiliates, if applicable.
The accompanying Notes to Financial Statements are an integral part of this statement.
Annual Report 2013
26
Columbia Small Cap Index Fund
Financial Highlights (continued)
Class K(a) | | Year ended
February 28,
2013 | | Year ended
February 29,
2012(b) | |
Per share data | |
Net asset value, beginning of period | | $ | 17.80 | | | $ | 17.87 | | |
Income from investment operations: | |
Net investment income | | | 0.24 | | | | 0.13 | | |
Net realized and unrealized gain | | | 2.14 | | | | 0.84 | | |
Total from investment operations | | | 2.38 | | | | 0.97 | | |
Less distributions to shareholders: | |
Net investment income | | | (0.25 | ) | | | (0.12 | ) | |
Net realized gains | | | (0.88 | ) | | | (0.92 | ) | |
Total distributions to shareholders | | | (1.13 | ) | | | (1.04 | ) | |
Proceeds from regulatory settlements | | | — | | | | 0.00 | (c) | |
Net asset value, end of period | | $ | 19.05 | | | $ | 17.80 | | |
Total return | | | 14.27 | % | | | 5.76 | % | |
Ratios to average net assets(d) | |
Total gross expenses | | | 0.45 | %(e) | | | 0.45 | %(f) | |
Total net expenses(g) | | | 0.45 | %(e) | | | 0.45 | %(f) | |
Net investment income | | | 1.37 | % | | | 0.76 | %(f) | |
Supplemental data | |
Net assets, end of period (in thousands) | | $ | 9,784 | | | $ | 9,858 | | |
Portfolio turnover | | | 17 | % | | | 20 | % | |
Notes to Financial Highlights
(a) Effective October 25, 2012, Class R4 shares were renamed Class K shares.
(b) For the period from March 7, 2011 (commencement of operations) to February 29, 2012.
(c) Rounds to zero.
(d) In addition to the fees and expenses which the Fund bears directly, the Fund indirectly bears a pro rata share of the fees and expenses of the acquired funds in which it invests. Such indirect expenses are not included in the reported expense ratios.
(e) Ratios include line of credit interest expense which rounds to less than 0.01%.
(f) Annualized.
(g) Total net expenses include the impact of certain waivers/reimbursements made by the Investment Manager and certain of its affiliates, if applicable.
The accompanying Notes to Financial Statements are an integral part of this statement.
Annual Report 2013
27
Columbia Small Cap Index Fund
Financial Highlights (continued)
Class R5 | | Year ended
February 28,
2013(a) | |
Per share data | |
Net asset value, beginning of period | | $ | 17.47 | | |
Income from investment operations: | |
Net investment income | | | 0.07 | | |
Net realized and unrealized gain | | | 2.40 | | |
Total from investment operations | | | 2.47 | | |
Less distributions to shareholders: | |
Net investment income | | | (0.30 | ) | |
Net realized gains | | | (0.31 | ) | |
Total distributions to shareholders | | | (0.61 | ) | |
Net asset value, end of period | | $ | 19.33 | | |
Total return | | | 14.51 | % | |
Ratios to average net assets(b) | |
Total gross expenses | | | 0.24 | %(c) | |
Total net expenses(d) | | | 0.20 | %(c) | |
Net investment income | | | 1.44 | %(c) | |
Supplemental data | |
Net assets, end of period (in thousands) | | $ | 81 | | |
Portfolio turnover | | | 17 | % | |
Notes to Financial Highlights
(a) For the period from November 8, 2012 (commencement of operations) to February 28, 2013.
(b) In addition to the fees and expenses which the Fund bears directly, the Fund indirectly bears a pro rata share of the fees and expenses of the acquired funds in which it invests. Such indirect expenses are not included in the reported expense ratios.
(c) Annualized.
(d) Total net expenses include the impact of certain waivers/reimbursements made by the Investment Manager and certain of its affiliates, if applicable.
The accompanying Notes to Financial Statements are an integral part of this statement.
Annual Report 2013
28
Columbia Small Cap Index Fund
Financial Highlights (continued)
| | | Year Ended
February 28, | | Year Ended
February 29, | | Year Ended February 28, | |
Class Z | | 2013 | | 2012 | | 2011 | | 2010 | | 2009 | |
Per share data | |
Net asset value, beginning of period | | $ | 17.81 | | | $ | 18.06 | | | $ | 14.01 | | | $ | 8.60 | | | $ | 17.76 | | |
Income from investment operations: | |
Net investment income | | | 0.29 | | | | 0.16 | | | | 0.15 | | | | 0.12 | | | | 0.21 | | |
Net realized and unrealized gain (loss) | | | 2.14 | | | | 0.66 | | | | 4.15 | | | | 5.40 | | | | (7.27 | ) | |
Total from investment operations | | | 2.43 | | | | 0.82 | | | | 4.30 | | | | 5.52 | | | | (7.06 | ) | |
Less distributions to shareholders: | |
Net investment income | | | (0.30 | ) | | | (0.15 | ) | | | (0.15 | ) | | | (0.11 | ) | | | (0.23 | ) | |
Net realized gains | | | (0.88 | ) | | | (0.92 | ) | | | (0.10 | ) | | | — | | | | (1.87 | ) | |
Total distributions to shareholders | | | (1.18 | ) | | | (1.07 | ) | | | (0.25 | ) | | | (0.11 | ) | | | (2.10 | ) | |
Proceeds from regulatory settlements | | | — | | | | 0.00 | (a) | | | — | | | | 0.00 | (a) | | | — | | |
Net asset value, end of period | | $ | 19.06 | | | $ | 17.81 | | | $ | 18.06 | | | $ | 14.01 | | | $ | 8.60 | | |
Total return | | | 14.54 | % | | | 4.92 | % | | | 30.81 | % | | | 64.34 | % | | | (42.28 | %) | |
Ratios to average net assets(b)(c) | |
Total gross expenses | | | 0.20 | %(d) | | | 0.20 | % | | | 0.20 | % | | | 0.20 | % | | | 0.20 | %(d) | |
Total net expenses(e) | | | 0.20 | %(d)(f) | | | 0.20 | %(f) | | | 0.20 | % | | | 0.20 | % | | | 0.20 | %(d)(f) | |
Net investment income | | | 1.64 | % | | | 0.96 | % | | | 0.97 | % | | | 0.95 | % | | | 1.39 | % | |
Supplemental data | |
Net assets, end of period (in thousands) | | $ | 1,275,562 | | | $ | 1,700,205 | | | $ | 1,681,152 | | | $ | 1,309,989 | | | $ | 660,059 | | |
Portfolio turnover | | | 17 | % | | | 20 | % | | | 14 | % | | | 14 | % | | | 35 | % | |
Notes to Financial Highlights
(a) Rounds to zero.
(b) In addition to the fees and expenses which the Fund bears directly, the Fund indirectly bears a pro rata share of the fees and expenses of the acquired funds in which it invests. Such indirect expenses are not included in the reported expense ratios.
(c) Certain line items from prior years have been reclassified to conform to the current presentation.
(d) Ratios include line of credit interest expense which rounds to less than 0.01%.
(e) Total net expenses include the impact of certain waivers/reimbursements made by the Investment Manager and certain of its affiliates, if applicable.
(f) The benefits derived from expense reductions had an impact of less than 0.01%.
The accompanying Notes to Financial Statements are an integral part of this statement.
Annual Report 2013
29
Columbia Small Cap Index Fund
Notes to Financial Statements
February 28, 2013
Note 1. Organization
Columbia Small Cap Index Fund (the Fund), a series of Columbia Funds Series Trust (the Trust), is a diversified fund. The Trust is registered under the Investment Company Act of 1940, as amended (the 1940 Act), as an open-end management investment company organized as a Delaware statutory trust.
Fund Shares
The Trust may issue an unlimited number of shares (without par value). The Fund offers Class A, Class B, Class I, Class K, Class R5 and Class Z shares. All share classes have identical voting, dividend and liquidation rights. Each share class has its own expense structure and sales charges, as applicable.
Class A shares have no sales charge.
Class B shares may be subject to a maximum Contingent Deferred Sales Charge (CDSC) of 5.00% based upon the holding period after purchase. Class B shares will generally convert to Class A shares eight years after purchase. The Fund no longer accepts investments by new or existing investors in the Fund's Class B shares, except in connection with the reinvestment of any dividend and/or capital gain distributions in Class B shares of the Fund and exchanges by existing Class B shareholders of certain other funds within the Columbia Family of Funds.
Class I shares are not subject to sales charges and are only available to the Columbia Family of Funds.
Class K shares (formerly Class R4 shares) are not subject to sales charges; however, this share class is closed to new investors. Effective October 25, 2012, Class R4 shares were renamed Class K shares.
Class R5 shares are not subject to sales charges and are only available to investors purchasing through authorized investment professionals. Class R5 shares commenced operations on November 8, 2012.
Class Z shares are not subject to sales charges, and are only available to certain investors.
Note 2. Summary of Significant Accounting Policies
Use of Estimates
The preparation of financial statements in accordance with U.S. generally accepted accounting principles (GAAP) requires management to make certain estimates and assumptions that affect the reported amounts of assets and liabilities, the disclosure of contingent assets and liabilities at the date of the financial statements and the reported amounts
of revenue and expenses during the reporting period. Actual results could differ from those estimates.
The following is a summary of significant accounting policies consistently followed by the Fund in the preparation of its financial statements.
Security Valuation
All equity securities are valued at the close of business of the New York Stock Exchange (NYSE). Equity securities are valued at the last quoted sales price on the principal exchange or market on which they trade, except for securities traded on the NASDAQ Stock Market, which are valued at the NASDAQ official close price. Unlisted securities or listed securities for which there were no sales during the day are valued at the mean of the latest quoted bid and ask prices on such exchanges or markets.
Foreign securities are valued based on quotations from the principal market in which such securities are normally traded. If any foreign share prices are not readily available as a result of limited share activity the securities are valued at the mean of the latest quoted bid and ask prices on such exchanges or markets. Foreign currency exchange rates are generally determined at 4:00 p.m. Eastern (U.S.) time. However, many securities markets and exchanges outside the U.S. close prior to the close of the NYSE; therefore, the closing prices for securities in such markets or on such exchanges may not fully reflect events that occur after such close but before the close of the NYSE. In those situations, foreign securities will be fair valued pursuant to the policy adopted by the Board of Trustees (the Board), including utilizing a third party pricing service to determine these fair values. The third party pricing service takes into account multiple factors, including, but not limited to, movements in the U.S. securities markets, certain depositary receipts, futures contracts and foreign exchange rates that have occurred subsequent to the close of the foreign exchange or market, to determine a good faith estimate that reasonably reflects the current market conditions as of the close of the NYSE. The fair value of a security is likely to be different from the quoted or published price, if available.
Investments in other open-end investment companies, including money market funds, are valued at net asset value.
Futures and options on futures contracts are valued based upon the settlement price established each day by the board of trade or exchange on which they are traded.
Investments for which market quotations are not readily available, or that have quotations which management believes are not reliable, are valued at fair value as determined in good faith under consistently applied procedures established by and under the general supervision of the Board. If a security or
Annual Report 2013
30
Columbia Small Cap Index Fund
Notes to Financial Statements (continued)
February 28, 2013
class of securities (such as foreign securities) is valued at fair value, such value is likely to be different from the last quoted market price for the security.
The determination of fair value often requires significant judgment. To determine fair value, management may use assumptions including but not limited to future cash flows and estimated risk premiums. Multiple inputs from various sources may be used to determine fair value.
Derivative Instruments
The Fund invests in certain derivative instruments, as detailed below, to meet its investment objectives. Derivatives are instruments whose values depend on, or are derived from, in whole or in part, the value of one or more other assets, such as securities, currencies, commodities or indices. Derivative instruments may be used to maintain cash reserves while maintaining exposure to certain other assets, to offset anticipated declines in values of investments, to facilitate trading, to reduce transaction costs and to pursue higher investment returns. The Fund may also use derivative instruments to mitigate certain investment risks, such as foreign currency exchange rate risk, interest rate risk and credit risk. Derivatives may involve various risks, including the potential inability of the counterparty to fulfill its obligation under the terms of the contract, the potential for an illiquid secondary market and the potential for market movements which may expose the Fund to gains or losses in excess of the amount shown in the Statement of Assets and Liabilities.
The Fund and any counterparty are required to maintain an agreement that requires the Fund and that counterparty to monitor (on a daily basis) the net fair value of all derivatives entered into pursuant to the agreement between the Fund and such counterparty. If the net fair value of such derivatives between the Fund and that counterparty exceeds a certain threshold (as defined in the agreement), the Fund or the counterparty (as the case may be) is required to post cash and/or securities as collateral. Fair values of derivatives presented in the financial statements are not netted with the fair value of other derivatives or with any collateral amounts posted by the Fund or any counterparty.
Futures Contracts
Futures contracts represent commitments for the future purchase or sale of an asset at a specified price on a specified date. The Fund bought and sold futures contracts to maintain appropriate equity market exposure while keeping sufficient cash to accommodate daily redemptions. Upon entering into futures contracts, the Fund bears risks which may include interest rates, exchange rates or securities prices moving
unexpectedly, in which case, the Fund may not achieve the anticipated benefits of the futures contracts and may realize a loss. Additional risks include counterparty credit risk, the possibility of an illiquid market, and that a change in the value of the contract or option may not correlate with changes in the value of the underlying asset.
Upon entering into a futures contract, the Fund pledges cash or securities with the broker in an amount sufficient to meet the initial margin requirement. Subsequent payments (variation margin) are made or received by the Fund each day. The variation margin payments are equal to the daily change in the contract value and are recorded as variation margin receivable or payable and are offset in unrealized gains or losses. The Fund recognizes a realized gain or loss when the contract is closed or expires. Futures contracts involve, to varying degrees, risk of loss in excess of the variation margin disclosed in the Statement of Assets and Liabilities.
Effects of Derivative Transactions in the Financial Statements
The following tables are intended to provide additional information about the effect of derivatives on the financial statements of the Fund, including: the fair value of derivatives by risk category and the location of those fair values in the Statement of Assets and Liabilities; the impact of derivative transactions on the Fund's operations over the period including realized gains or losses and unrealized gains or losses. The derivative schedules following the Portfolio of Investments present additional information regarding derivative instruments outstanding at the end of the period, if any.
The following table is a summary of the fair value of derivative instruments at February 28, 2013:
Asset Derivatives | |
Risk Exposure
Category | | Statement of Assets
and Liabilities Location | | Fair Value ($) | |
Equity contracts | | Net assets — unrealized
appreciation on futures
contracts | | | 3,549,283* | | |
*Includes cumulative appreciation (depreciation) of futures contracts as reported in the Futures Contracts Outstanding table following the Portfolio of Investments. Only the current day's variation margin is reported in receivables or payables in the Statement of Assets and Liabilities.
The effect of derivative instruments in the Statement of Operations for the year ended February 28, 2013:
Amount of Realized Gain (Loss) on Derivatives Recognized in Income | |
Risk Exposure Category | | Futures Contracts ($) | |
Equity contracts | | | 6,305,107 | | |
Annual Report 2013
31
Columbia Small Cap Index Fund
Notes to Financial Statements (continued)
February 28, 2013
Change in Unrealized Appreciation (Depreciation) on
Derivatives Recognized in Income | |
Risk Exposure Category | | Futures Contracts ($) | |
Equity contracts | | | 1,250,556 | | |
The following table is a summary of the volume of derivative instruments for the year ended February 28, 2013:
Derivative Instrument | | Contracts Opened | |
Futures contracts | | | 6,645 | | |
Security Transactions
Security transactions are accounted for on the trade date. Cost is determined and gains (losses) are based upon the specific identification method for both financial statement and federal income tax purposes.
Income Recognition
Corporate actions and dividend income are recorded net of any non-reclaimable tax withholdings, on the ex-dividend date or upon receipt of ex-dividend notification in the case of certain foreign securities.
The Fund may receive distributions from holdings in business development companies (BDCs), exchange traded funds (ETFs) and real estate investment trusts (REITs), which report information on the character of their distributions annually. These distributions are allocated to dividend income, capital gain and return of capital based on estimates made by the Fund's management if actual information has not yet been reported. Return of capital is recorded as a reduction of the cost basis of securities held. If the Fund no longer owns the applicable securities, return of capital is recorded as a realized gain. Management's estimates are subsequently adjusted when the actual character of the distributions is disclosed by the BDCs, ETFs and REITs, which could result in a proportionate change in return of capital to shareholders.
Awards from class action litigation are recorded as a reduction of cost basis if the Fund still owns the applicable securities on the payment date. If the Fund no longer owns the applicable securities, the proceeds are recorded as realized gains.
Expenses
General expenses of the Trust are allocated to the Fund and other funds of the Trust based upon relative net assets or other expense allocation methodologies determined by the nature of the expense. Expenses directly attributable to the Fund are charged to the Fund. Expenses directly attributable to a specific class of shares are charged to that share class.
Determination of Class Net Asset Value
All income, expenses (other than class-specific expenses, which are charged to that share class, as shown in the
Statement of Operations) and realized and unrealized gains (losses) are allocated to each class of the Fund on a daily basis, based on the relative net assets of each class, for purposes of determining the net asset value of each class.
Federal Income Tax Status
The Fund intends to qualify each year as a regulated investment company under Subchapter M of the Internal Revenue Code, as amended, and will distribute substantially all of its and taxable income (including net short-term capital gains), if any, for its tax year, and as such will not be subject to federal income taxes. In addition, the Fund intends to distribute in each calendar year substantially all of its net investment income, capital gains and certain other amounts, if any, such that the Fund should not be subject to federal excise tax. Therefore, no federal income or excise tax provision is recorded.
Distributions to Shareholders
Distributions from net investment income, if any, are declared and paid semi-annually. Net realized capital gains, if any, are distributed at least annually. Income distributions and capital gain distributions are determined in accordance with federal income tax regulations, which may differ from GAAP.
Guarantees and Indemnifications
Under the Trust's organizational documents and, in some cases, by contract, its officers and trustees are indemnified against certain liabilities arising out of the performance of their duties to the Trust or its funds. In addition, certain of the Fund's contracts with its service providers contain general indemnification clauses. The Fund's maximum exposure under these arrangements is unknown since the amount of any future claims that may be made against the Fund cannot be determined, and the Fund has no historical basis for predicting the likelihood of any such claims.
Recent Accounting Pronouncement
Disclosures about Offsetting Assets and Liabilities
In December 2011, the Financial Accounting Standards Board (FASB) issued Accounting Standards Update (ASU) No. 2011-11, Disclosures about Offsetting Assets and Liabilities. The objective of the FASB is to enhance current disclosure requirements on offsetting of certain assets and liabilities and to enable financial statement users to compare financial statements prepared under GAAP and International Financial Reporting Standards.
Specifically, ASU No. 2011-11 requires an entity to disclose both gross and net information for derivatives and other financial instruments that are subject to a master netting arrangement or similar agreement. The standard requires
Annual Report 2013
32
Columbia Small Cap Index Fund
Notes to Financial Statements (continued)
February 28, 2013
disclosure of collateral received in connection with the master netting agreements or similar agreements. The effective date of ASU No. 2011-11 is for interim and annual periods beginning on or after January 1, 2013. At this time, management is evaluating the implications of this guidance and the impact it will have on the financial statement amounts and footnote disclosures, if any.
Note 3. Fees and Compensation Paid to Affiliates
Investment Management Fees
Under an Investment Management Services Agreement, Columbia Management Investment Advisers, LLC (the Investment Manager), a wholly-owned subsidiary of Ameriprise Financial, Inc. (Ameriprise Financial), determines which securities will be purchased, held or sold. The investment management fee is an annual fee that is equal to 0.10% of the Fund's average daily net assets.
Administration Fees
Under an Administrative Services Agreement, the Investment Manager also serves as the Fund Administrator. The Fund pays the Fund Administrator an annual fee for administration and accounting services equal to 0.10% of the Fund's average daily net assets.
The Investment Manager, from the administration fee it receives from the Fund, pays all operating expenses of the Fund, with the exception of brokerage fees and commissions, interest, fees and expenses of Trustees who are not officers, directors or employees of the Investment Manager or its affiliates, distribution (Rule 12b-1) and/or shareholder servicing fees, plan administration and any extraordinary non-recurring expenses that may arise, including litigation.
Other Expenses
Other expenses are for, among other things, certain expenses of the Fund or the Board, including: Fund boardroom and office expense, employee compensation, employee health and retirement benefits, and certain other expenses. Payment of these Fund and Board expenses is facilitated by a company providing limited administrative services to the Fund and the Board. For the year ended February 28, 2013, other expenses paid to this company were $6,123.
Compensation of Board Members
Board members are compensated for their services to the Fund as disclosed in the Statement of Operations. Under a Deferred Compensation Plan (the Plan), the Board members who are not "interested persons" of the Fund, as defined under the 1940 Act, may elect to defer payment of up to 100% of their
compensation. Deferred amounts are treated as though equivalent dollar amounts had been invested in shares of certain funds managed by the Investment Manager. The Fund's liability for these amounts is adjusted for market value changes and remains in the Fund until distributed in accordance with the Plan.
Transfer Agent Fees
Under a Transfer and Dividend Disbursing Agent Agreement, Columbia Management Investment Services Corp. (the Transfer Agent), an affiliate of the Investment Manager and a wholly-owned subsidiary of Ameriprise Financial, is responsible for providing transfer agency services to the Fund. The Transfer Agent has contracted with Boston Financial Data Services (BFDS) to serve as sub-transfer agent.
The transfer agent fees are payable by the Investment Manager. The Transfer Agent pays the fees of BFDS for services as sub-transfer agent and is not entitled to reimbursement for such fees from the Fund. The Transfer Agent also receives compensation from fees for various shareholder services and reimbursements for certain out-of-pocket fees.
An annual minimum account balance fee of $20 may apply to certain accounts with a value below the Fund's initial minimum investment requirements to reduce the impact of small accounts on transfer agent fees. These minimum account balance fees are recorded as part of expense reductions in the Statement of Operations. For the year ended February 28, 2013, these minimum account balance fees reduced total expenses by $4,728.
Plan Administration Fees
Under a Plan Administration Services Agreement with the Transfer Agent, the Fund pays an annual fee at a rate of 0.25% of the Fund's average daily net assets attributable to Class K shares for the provision of various administrative, recordkeeping, communication and educational services.
Distribution and Service Fees
The Fund has an agreement with Columbia Management Investment Distributors, Inc. (the Distributor), an affiliate of the Investment Manager and a wholly-owned subsidiary of Ameriprise Financial, for distribution and shareholder services. Pursuant to Rule 12b-1 under the 1940 Act, the Board has approved, and the Fund has adopted, distribution and shareholder service plans (the Plans) which set the distribution and service fees for the Fund. These fees are calculated daily and are intended to compensate the Distributor and/or eligible selling and/or servicing agents for selling shares of the Fund and providing services to investors.
Annual Report 2013
33
Columbia Small Cap Index Fund
Notes to Financial Statements (continued)
February 28, 2013
The Plans require the payment of a monthly combined distribution and service fee to the Distributor at the maximum annual rate of 0.25% of the average daily net assets attributable to Class A shares of the Fund. The Plans also require the payment of a monthly service fee and a monthly distribution fee at the maximum annual rate of 0.25% and 0.75%, respectively, of the average daily net assets attributable to Class B shares of the Fund.
Sales Charges
Sales charges, including CDSCs, received by the Distributor for distributing Fund shares were $2,669 for Class B and shares for the year ended February 28, 2013.
Expenses Waived/Reimbursed by the Investment Manager and its Affiliates
The Investment Manager and certain of its affiliates have contractually agreed to waive fees and/or reimburse expenses (excluding certain fees and expenses described below), through June 30, 2013, unless sooner terminated at the sole discretion of the Board, so that the Fund's net operating expenses, after giving effect to fees waived/expenses reimbursed and any balance credits and/or overdraft charges from the Fund's custodian, do not exceed the following annual rates as a percentage of the class' average daily net assets:
Class A | | | 0.45 | % | |
Class B | | | 1.20 | | |
Class I | | | 0.20 | | |
Class K | | | 0.45 | | |
Class R5* | | | 0.20 | | |
Class Z | | | 0.20 | | |
*Annual rate is contractual from November 8, 2012 (the commencement of operations of Class R5 shares) through November 8, 2013.
Under the agreement governing these fee waivers and/or expense reimbursement arrangements, the following fees and expenses are excluded from the waiver/reimbursement commitment, and therefore will be paid by the Fund, if applicable: taxes (including foreign transaction taxes), expenses associated with investments in affiliated and non-affiliated pooled investment vehicles (including mutual funds and exchange traded funds), transaction costs and brokerage commissions, costs related to any securities lending program, dividend expenses associated with securities sold short, inverse floater program fees and expenses, transaction charges and interest on borrowed money, interest, extraordinary expenses and any other expenses the exclusion of which is specifically approved by the Board. This agreement may be modified or amended only with approval from all parties.
Note 4. Federal Tax Information
The timing and character of income and capital gain distributions are determined in accordance with income tax regulations, which may differ from GAAP because of temporary or permanent book to tax differences.
At February 28, 2013, these differences are primarily due to differing treatment for deferral/reversal of wash sales losses, Trustees' deferred compensation, reversal of capital gains (losses) on a redemption-in-kind and derivative investments. To the extent these differences are permanent, reclassifications are made among the components of the Fund's net assets in the Statement of Assets and Liabilities. Temporary differences do not require reclassifications. In the Statement of Assets and Liabilities the following reclassifications were made:
Undistributed net investment income | | $ | 498,175 | | |
Accumulated net realized loss | | | 62,724,234 | | |
Paid-in capital | | | (63,222,409 | ) | |
Net investment income and net realized gains (losses), as disclosed in the Statement of Operations, and net assets were not affected by this reclassification.
The tax character of distributions paid during the years indicated was as follows:
Year ended | | February 28,
2013 | | February 29,
2012 | |
Ordinary income | | $ | 28,324,170 | | | $ | 22,262,162 | | |
Long-term capital gains | | | 84,343,031 | | | | 101,946,466 | | |
Total | | $ | 112,667,201 | | | $ | 124,208,628 | | |
Short-term capital gain distributions, if any, are considered ordinary income distributions for tax purposes.
At February 28, 2013, the components of distributable earnings on a tax basis were as follows:
Undistributed ordinary income | | $ | 3,454,657 | | |
Undistributed accumulated long-term gain | | | 42,366,479 | | |
Unrealized appreciation | | | 570,762,239 | | |
At February 28, 2013, the cost of investments for federal income tax purposes was $1,422,805,650 and the aggregate gross unrealized appreciation and depreciation based on that cost was:
Unrealized appreciation | | $ | 671,551,673 | | |
Unrealized depreciation | | | (100,789,434 | ) | |
Net unrealized appreciation | | | 570,762,239 | | |
Management of the Fund has concluded that there are no significant uncertain tax positions that would require recognition in the financial statements. However, management's conclusion may be subject to review and
Annual Report 2013
34
Columbia Small Cap Index Fund
Notes to Financial Statements (continued)
February 28, 2013
adjustment at a later date based on factors including, but not limited to, new tax laws, regulations, and administrative interpretations (including relevant court decisions). Generally, the Fund's federal tax returns for the prior three fiscal years remain subject to examination by the Internal Revenue Service.
Note 5. Portfolio Information
The cost of purchases and proceeds from sales of securities, excluding short-term obligations, aggregated to $310,883,705 and $813,743,272, respectively, for the year ended February 28, 2013.
Note 6. Redemption-in-Kind
Sales of securities for the Fund include the value of securities delivered through an in-kind redemption of certain fund shares. During the year ended February 28, 2013, securities and other assets with a value of $528,195,742 were distributed to shareholders to satisfy their redemption requests. The net realized loss on these securities was $57,272,252, which is not deductible by the Fund.
Note 7. Regulatory Settlements
During the year ended February 29, 2012, the Fund received $20,242 as a result of a regulatory settlement proceeding brought by the Securities and Exchange Commission against an unaffiliated third party relating to market timing and/or late trading of mutual funds. This amount represented the Fund's portion of the proceeds from the settlement (the Fund was not a party to the proceeding). The payments have been included in "Proceeds from regulatory settlements" in the Statement of Changes in Net Assets.
Note 8. Lending of Portfolio Securities
Effective December 19, 2012, the Fund no longer participates in securities lending activity. Prior to that date, the Fund participated, or was eligible to participate, in securities lending activity pursuant to a Master Securities Lending Agreement (the Agreement) with JPMorgan Chase Bank, N.A. (JPMorgan). The Agreement authorized JPMorgan as lending agent to lend securities to authorized borrowers in order to generate additional income on behalf of the Fund. Pursuant to the Agreement, the securities loaned were secured by cash or securities that either were issued or guaranteed as to principal and interest by the U.S. government, its agencies, authorities or instrumentalities with value equal to at least 100% of the market value of the loaned securities. Any additional collateral required to maintain those levels due to market fluctuations of the loaned securities was requested to be delivered the following business day. Cash collateral received was invested
by the lending agent on behalf of the Fund into authorized investments pursuant to the Agreement.
Pursuant to the Agreement, the Fund received income for lending its securities either in the form of fees or by earning interest on invested cash collateral, net of negotiated rebates paid to borrowers and fees paid to the lending agent for services provided and any other securities lending expenses. Net income earned from securities lending for the year ended February 28, 2013 is disclosed in the Statement of Operations. The Fund continued to earn and accrue interest and dividends on the securities loaned.
Note 9. Affiliated Money Market Fund
The Fund invests its daily cash balances in Columbia Short-Term Cash Fund, an affiliated money market fund established for the exclusive use by the Fund and other affiliated funds. The income earned by the Fund from such investments is included as "Dividends — affiliated issuers" in the Statement of Operations. As an investing fund, the Fund indirectly bears its proportionate share of the expenses of Columbia Short-Term Cash Fund.
Note 10. Shareholder Concentration
At February 28, 2013, one unaffiliated shareholder account owned 24.0% of the outstanding shares of the Fund. The Fund has no knowledge about whether any portion of those shares was owned beneficially by such account. Subscription and redemption activity by concentrated accounts may have a significant effect on the operations of the Fund.
Note 11. Line of Credit
The Fund has entered into a revolving credit facility with a syndicate of banks led by JPMorgan whereby the Fund may borrow for the temporary funding of shareholder redemptions or for other temporary or emergency purposes. The credit facility agreement, as amended, which is a collective agreement between the Fund and certain other funds managed by the Investment Manager, severally and not jointly, permits collective borrowings up to $500 million. Interest is charged to each participating fund based on its borrowings at a rate equal to the higher of (i) the overnight federal funds rate plus 1.00% or (ii) the one-month LIBOR rate plus 1.00%. Each borrowing under the credit facility matures no later than 60 days after the date of borrowing. The Fund also pays a commitment fee equal to its pro rata share of the amount of the credit facility at a rate of 0.08% per annum.
For the year ended February 28, 2013, the average daily loan balance outstanding on days when borrowing existed was $6,000,000 at a weighted average interest rate of 1.24%.
Annual Report 2013
35
Columbia Small Cap Index Fund
Notes to Financial Statements (continued)
February 28, 2013
Note 12. Fund Merger
At the close of business on June 3, 2011, the Fund acquired the assets and assumed the identified liabilities of RiverSource Small Company Index Fund, a series of RiverSource Market Advantage Series, Inc (the acquired fund). The reorganization was completed after shareholders of the acquired fund approved the plan of reorganization on February 15, 2011. The purpose of the transaction was to combine two funds managed by the Investment Manager with comparable investment objectives and strategies.
The aggregate net assets of the Fund immediately before the acquisition were $1,858,175,305 and the combined net assets immediately after the acquisition were $2,258,332,592.
The merger was accomplished by a tax-free exchange of 77,975,673 shares of the acquired fund valued at $400,157,287 (including $76,110,521 of unrealized appreciation).
In exchange for the acquired fund's shares, the Fund issued the following number of shares:
| | | Shares | |
Class A | | | 20,611,091 | | |
Class B | | | 1,666,330 | | |
Class R4 | | | 558,110 | | |
For financial reporting purposes, net assets received and shares issued by the Fund were recorded at fair value; however, the acquired fund's cost of investments was carried forward.
The financial statements reflect the operations of the Fund for the period prior to the merger and the combined fund for the period subsequent to the merger. Because the combined investment portfolios have been managed as a single integrated portfolio since the merger was completed, it is not practicable to separate the amounts of revenue and earnings of the acquired fund that have been included in the combined Fund's Statement of Operations since the merger was completed.
Assuming the merger had been completed on March 1, 2011 the Fund's pro-forma net investment income, net realized gain on investments, net change in unrealized depreciation and net increase in net assets from operations for the year ended February 29, 2012 would have been approximately $19.4 million, $134.7 million, $(48.4) million and $105.7 million, respectively.
Note 13. Significant Risks
Financial Sector Risk
The Fund's portfolio managers may invest significantly in issuers operating in the financial sector. The Fund may be more susceptible to the particular risks of this sector than if the Fund were invested in a wider variety of issuers operating in unrelated sectors.
Note 14. Subsequent Events
Management has evaluated the events and transactions that have occurred through the date the financial statements were issued and noted no items requiring adjustment of the financial statements or additional disclosure.
Note 15. Information Regarding Pending and Settled Legal Proceedings
In December 2005, without admitting or denying the allegations, American Express Financial Corporation (AEFC, which is now known as Ameriprise Financial, Inc. (Ameriprise Financial)) entered into settlement agreements with the Securities and Exchange Commission (SEC) and Minnesota Department of Commerce (MDOC) related to market timing activities. As a result, AEFC was censured and ordered to cease and desist from committing or causing any violations of certain provisions of the Investment Advisers Act of 1940, the Investment Company Act of 1940, and various Minnesota laws. AEFC agreed to pay disgorgement of $10 million and civil money penalties of $7 million. AEFC also agreed to retain an independent distribution consultant to assist in developing a plan for distribution of all disgorgement and civil penalties ordered by the SEC in accordance with various undertakings detailed at www.sec.gov/litigation/admin/ia-2451.pdf. Ameriprise Financial and its affiliates have cooperated with the SEC and the MDOC in these legal proceedings, and have made regular reports to the funds' Boards of Trustees.
Ameriprise Financial and certain of its affiliates have historically been involved in a number of legal, arbitration and regulatory proceedings, including routine litigation, class actions, and governmental actions, concerning matters arising in connection with the conduct of their business activities. Ameriprise Financial believes that the Funds are not currently the subject of, and that neither Ameriprise Financial nor any of its affiliates are the subject of, any pending legal, arbitration or regulatory proceedings that are likely to have a material adverse effect on the Funds or the ability of Ameriprise Financial or its affiliates to perform under their contracts with the Funds. Ameriprise Financial is required to make 10-Q, 10-K and, as necessary, 8-K filings with the Securities and Exchange Commission on legal and regulatory matters that
Annual Report 2013
36
Columbia Small Cap Index Fund
Notes to Financial Statements (continued)
February 28, 2013
relate to Ameriprise Financial and its affiliates. Copies of these filings may be obtained by accessing the SEC website at www.sec.gov.
There can be no assurance that these matters, or the adverse publicity associated with them, will not result in increased fund redemptions, reduced sale of fund shares or other adverse consequences to the Funds. Further, although we believe proceedings are not likely to have a material adverse effect on the Funds or the ability of Ameriprise Financial or its affiliates to perform under their contracts with the Funds, these proceedings are subject to uncertainties and, as such, we are unable to estimate the possible loss or range of loss that may result. An adverse outcome in one or more of these proceedings could result in adverse judgments, settlements, fines, penalties or other relief that could have a material adverse effect on the consolidated financial condition or results of operations of Ameriprise Financial.
Annual Report 2013
37
Columbia Small Cap Index Fund
Report of Independent Registered Public Accounting Firm
To the Trustees of Columbia Funds Series Trust and
the Shareholders of Columbia Small Cap Index Fund
In our opinion, the accompanying statement of assets and liabilities, including the portfolio of investments, and the related statements of operations and of changes in net assets and the financial highlights present fairly, in all material respects, the financial position of Columbia Small Cap Index Fund (the "Fund") (a series of Columbia Funds Series Trust) at February 28, 2013, the results of its operations for the year then ended, the changes in its net assets for each of the two years in the period then ended and the financial highlights for each of the periods indicated, in conformity with accounting principles generally accepted in the United States of America. These financial statements and financial highlights (hereafter referred to as "financial statements") are the responsibility of the Fund's management. Our responsibility is to express an opinion on these financial statements based on our audits. We conducted our audits of these financial statements in accordance with the standards of the Public Company Accounting Oversight Board (United States). Those standards require that we plan and perform the audit to obtain reasonable assurance about whether the financial statements are free of material misstatement. An audit includes examining, on a test basis, evidence supporting the amounts and disclosures in the financial statements, assessing the accounting principles used and significant estimates made by management, and evaluating the overall financial statement presentation. We believe that our audits, which included confirmation of securities at February 28, 2013 by correspondence with the custodian, transfer agent and brokers, provide a reasonable basis for our opinion.
PricewaterhouseCoopers LLP
Minneapolis, Minnesota
April 19, 2013
Annual Report 2013
38
Columbia Small Cap Index Fund
Federal Income Tax Information
(Unaudited)
The Fund hereby designates the following tax attributes for the fiscal year ended February 28, 2013. Shareholders will be notified in early 2014 of the amounts for use in preparing 2013 income tax returns.
Tax Designations
| Qualified Dividend Income | | | 89.21 | % | |
| Dividends Received Deduction | | | 89.35 | % | |
Capital Gain Dividend | | $ | 76,588,622 | | |
Qualified Dividend Income. For taxable, non-corporate shareholders, the percentage of ordinary income dividends paid during the fiscal year that represents qualified dividend income subject to reduced tax rates under the Jobs and Growth Tax Relief Reconciliation Act of 2003.
Dividends Received Deduction. The percentage of ordinary income dividends paid during the fiscal year that qualifies for the corporate dividends received deduction.
Capital Gain Dividend. The Fund designates as a capital gain dividend the amount reflected above, or if subsequently determined to be different, the net capital gain of such fiscal period. The Fund also designates as capital gain dividends, to the extent necessary to fully distribute such capital gains, earnings and profits distributed to shareholders on the redemption of shares.
Annual Report 2013
39
Columbia Small Cap Index Fund
Shareholders elect the Board that oversees the funds' operations. The Board appoints officers who are responsible for day-to-day business decisions based on policies set by the Board. The following table provides basic biographical information about the funds' Board members, including their principal occupations during the past five years, although specific titles for individuals may have varied over the period. Under current Board policy, members may serve until the next Board meeting after he or she reaches the mandatory retirement age established by the Board, or the fifteenth anniversary of the first Board meeting they attended as a member of the Board.
Mr. Edward J. Boudreau, Jr., Mr. William P. Carmichael, Mr. William A. Hawkins, Mr. R. Glenn Hilliard, Ms. Minor M. Shaw and Dr. Anthony M. Santomero, were members of the Legacy Columbia Nations funds' Board ("Nations Funds"), which includes Columbia Funds Series Trust, Columbia Funds Variable Insurance Trust I and Columbia Funds Master Investment Trust, LLC and began service on the Board for the Legacy RiverSource funds ("RiverSource Funds") effective June 1, 2011.
Independent Trustees
Name,
Address,
Year of Birth | | Position Held With
Funds and Length of
Service | | Principal Occupation
During Past Five Years | | Number of
Funds in the
Fund Family
Overseen by
Board Member | | Other Present or Past
Directorships/Trusteeships
(Within Past 5 Years) | |
Kathleen Blatz
901 S. Marquette Ave.
Minneapolis, MN 55402
1954 | | Board member since 1/06 for RiverSource Funds and since 6/11 for Nations Funds | | Attorney; Chief Justice, Minnesota Supreme Court, 1998-2006 | | | 153 | | | Director, BlueCross BlueShield of Minnesota since 2009 | |
Edward J. Boudreau, Jr.
901 S. Marquette Ave.
Minneapolis, MN 55402
1944 | | Board member since 6/11 for RiverSource Funds and since 1/05 for Nations Funds | | Managing Director, E.J. Boudreau & Associates (consulting) since 2000 | | | 151 | | | Former Trustee, BofA Funds Series Trust (11 funds) | |
Pamela G. Carlton
901 S. Marquette Ave.
Minneapolis, MN 55402
1954 | | Board member since 7/07 for RiverSource Funds and since 6/11 for Nations Funds | | President, Springboard — Partners in Cross Cultural Leadership (consulting company) since 2003 | | | 153 | | | None | |
William P. Carmichael
901 S. Marquette Ave.
Minneapolis, MN 55402
1943 | | Board member since 6/11 for RiverSource Funds and since 1999 for Nations Funds | | Retired | | | 151 | | | Director, Cobra Electronics Corporation (electronic equipment manufacturer); The Finish Line (athletic shoes and apparel) since July 2003; McMoRan Exploration Company (oil and gas exploration and development) since 2010; former Trustee, BofA Funds Series Trust (11 funds); former Director, Spectrum Brands, Inc. (consumer products); former Director, Simmons Company (bedding) | |
Patricia M. Flynn
901 S. Marquette Ave.
Minneapolis, MN 55402
1950 | | Board member since 11/04 for RiverSource Funds and since 6/11 for Nations Funds | | Trustee Professor of Economics and Management, Bentley University since 1976 | | | 153 | | | None | |
William A. Hawkins
901 S. Marquette Ave.
Minneapolis, MN 55402
1942 | | Board member since 6/11 for RiverSource Funds and since 1/05 for Nations Funds | | Managing Director, Overton Partners (financial consulting), since August 2010; President and Chief Executive Officer, California General Bank, N.A., January 2008-August 2010 | | | 151 | | | Trustee, BofA Funds Series Trust (11 funds) | |
Annual Report 2013
40
Columbia Small Cap Index Fund
Trustees and Officers (continued)
Independent Trustees (continued)
Name,
Address,
Year of Birth | | Position Held With
Funds and Length of
Service | | Principal Occupation
During Past Five Years | | Number of
Funds in the
Fund Family
Overseen by
Board Member | | Other Present or Past
Directorships/Trusteeships
(Within Past 5 Years) | |
R. Glenn Hilliard
901 S. Marquette Ave.
Minneapolis, MN 55402
1943 | | Board member since 6/11 for RiverSource Funds and since 1/05 for Nations Funds | | Chairman and Chief Executive Officer, Hilliard Group LLC (investing and consulting), since April 2003; Non-Executive Director & Chairman, CNO Financial Group, Inc. (insurance), September 2003-May 2011 | | | 151 | | | Chairman, BofA Fund Series Trust (11 funds); former Director, CNO Financial Group, Inc. (insurance) | |
Stephen R. Lewis, Jr.
901 S. Marquette Ave.
Minneapolis, MN 55402
1939 | | Chair of the Board for RiverSource Funds since 1/07, Board member for RiverSource Funds since 1/02 and since 6/11 for Nations Funds | | President Emeritus and Professor of Economics Emeritus, Carleton College since 2002 | | | 153 | | | Director, Valmont Industries, Inc. (manufacturer of irrigation systems) since 2002 | |
Catherine James Paglia
901 S. Marquette Ave.
Minneapolis, MN 55402
1952 | | Board member since 11/04 for RiverSource Funds and since 6/11 for Nations Funds | | Director, Enterprise Asset Management, Inc. (private real estate and asset management company) | | | 153 | | | Director, Valmont Industries, Inc. (manufacturer of irrigation systems) since 2012 | |
Leroy C. Richie
901 S. Marquette Ave.
Minneapolis, MN 55402
1941 | | Board member since 2000 for Legacy Seligman Funds, since 11/08 for RiverSource Funds and since 6/11 for Nations Funds | | Counsel, Lewis & Munday, P.C. (law firm) since 2004; former Vice President and General Counsel, Automotive Legal Affairs, Chrysler Corporation from 1983-1987 | | | 153 | | | Lead Outside Director, Digital Ally, Inc. (digital imaging) since September 2005; Director, Infinity, Inc. (oil and gas exploration and production) since 1994; Director, OGE Energy Corp. (energy and energy services) since November 2007 | |
Minor M. Shaw
901 S. Marquette Ave.
Minneapolis, MN 55402
1947 | | Board member since 6/11 for RiverSource Funds and since 2003 for Nations Funds | | President, Micco LLC (private investments) since 2011; President Micco Corp. since 1998 | | | 151 | | | Director, Piedmont Natural Gas; Director, BlueCross BlueShield of South Carolina since April 2008; Former Trustee, BofA Funds Series Trust (11 funds) | |
Alison Taunton-Rigby
901 S. Marquette Ave.
Minneapolis, MN 55402
1944 | | Board member since 11/02 for RiverSource Funds and since 6/11 for Nations Funds | | Chief Executive Officer and Director, RiboNovix, Inc. (biotechnology), 2003-2010 | | | 153 | | | Director, Healthways, Inc. (health and well-being improvement) since 2005; Director, ICI Mutual Insurance Company, RRG since 2011; Director, Abt Associates (government contractor) since 2001; Director, Boston Children's Hospital since 2002 | |
Annual Report 2013
41
Columbia Small Cap Index Fund
Trustees and Officers (continued)
Interested Trustee Not Affiliated With Investment Manager*
Name,
Address,
Year of Birth | | Position Held With
Funds and Length of
Service | | Principal Occupation
During Past Five Years | | Number of
Funds in the
Fund Family
Overseen by
Board Member | | Other Present or Past
Directorships/Trusteeships
(Within Past 5 Years) | |
Anthony M. Santomero
901 S. Marquette Ave.
Minneapolis, MN 55402
1946 | | Board member since 6/11 for RiverSource Funds and since 1/08 for Nations Funds | | Richard K. Mellon Professor Emeritus of Finance, The Wharton School, University of Pennsylvania, since 2002; Senior Advisor, McKinsey & Company (consulting), 2006-2008 | | | 151 | | | Director, Renaissance Reinsurance Ltd. since May 2008; Trustee, Penn Mutual Life Insurance Company since March 2008; Director, Citigroup since 2009; Director, Citibank, N.A. since 2009; former Trustee, BofA Funds Series Trust (11 funds) | |
*Dr. Santomero is not an affiliated person of the investment manager or Ameriprise Financial. However, he is currently deemed by the funds to be an "interested person" (as defined in the 1940 Act) of the funds because he serves as a Director of Citigroup, Inc. and Citibank N.A., companies that may directly or through subsidiaries and affiliates engage from time-to-time in brokerage execution, principal transactions and lending relationships with the funds or accounts advised/managed by the investment manager.
Interested Trustee Affiliated With Investment Manager*
Name,
Address,
Year of Birth | | Position Held With
Funds and Length of
Service | | Principal Occupation
During Past Five Years | | Number of
Funds in the
Fund Family
Overseen by
Board Member | | Other Present or Past
Directorships/Trusteeships
(Within Past 5 Years) | |
William F. Truscott
53600 Ameriprise
Financial Center
Minneapolis, MN 55474
1960 | | Board member since 11/01 for RiverSource Funds and since 6/11 for Nations Funds; Senior Vice President since 2002 for RiverSource Funds and 5/10 for Nations Funds | | President, Columbia Management Investment Advisers, LLC since February 2012, (previously President, Chairman of the Board and Chief Investment Officer, 2001-April 2010); Chief Executive Officer, Global Asset Management, Ameriprise Financial, Inc. since September 2012 (previously Chief Executive Officer, U.S. Asset Management & President, Annuities, May 2010-September 2012 and President — U.S. Asset Management and Chief Investment Officer, 2005-April 2010); Chief Executive Officer, Columbia Management Investment Distributors, Inc. since February 2012, (previously Chairman of the Board and Chief Executive Officer, 2006-April 2010); Chairman of the Board and Chief Executive Officer, RiverSource Distributors, Inc. since 2006; President and Chief Executive Officer, Ameriprise Certificate Company 2006-August 2012 | | | 210 | | | Chairman of the Board, Columbia Management Investment Advisers, LLC since May 2010; Director, Columbia Management Investment Distributors, Inc. since May 2010; Director, Ameriprise Certificate Company, 2006-January 2013 | |
*Interested person (as defined under the 1940 Act) by reason of being an officer, director, security holder and/or employee of the investment manager or Ameriprise Financial.
The SAI has additional information about the Fund's Board members and is available, without charge, upon request by calling 800.345.6611; contacting your financial intermediary; or visiting columbiamanagement.com.
Annual Report 2013
42
Columbia Small Cap Index Fund
Trustees and Officers (continued)
The Board has appointed officers who are responsible for day-to-day business decisions based on policies it has established. The officers serve at the pleasure of the Board. In addition to Mr. Truscott, who is Senior Vice President, the funds' other officers are:
Officers
Name,
Address,
Year of Birth | | Position Held With
Funds and Length of
Service | | Principal Occupation During Past Five Years | |
J. Kevin Connaughton
225 Franklin Street
Boston, MA 02110
1964 | | President and Principal Executive Officer since 5/10 for RiverSource Funds and 2009 for Nations Funds | | Senior Vice President and General Manager — Mutual Fund Products, Columbia Management Investment Advisers, LLC since May 2010; Managing Director of Columbia Management Advisors, LLC, December 2004-April 2010; Senior Vice President and Chief Financial Officer, Columbia Funds, June 2008-January 2009; Treasurer, Columbia Funds, October 2003-May 2008 | |
Amy K. Johnson
5228 Ameriprise Financial Center Minneapolis, MN 55474
1965 | | Vice President since 12/06 for RiverSource Funds and 5/10 for Nations Funds | | Senior Vice President and Chief Operating Officer, Columbia Management Investment Advisers, LLC since May 2010 (previously Chief Administrative Officer, 2009-April 2010 and Vice President — Asset Management and Trust Company Services, 2006-2009) | |
Michael G. Clarke
225 Franklin Street
Boston, MA 02110
1969 | | Treasurer since 1/11 and Chief Financial Officer since 4/11 for RiverSource Funds and Treasurer since 3/11 and Chief Financial Officer since 2009 for Nations Funds | | Vice President, Columbia Management Investment Advisers, LLC since May 2010; Managing Director of Fund Administration, Columbia Management Advisors, LLC, September 2004-April 2010; senior officer of Columbia Funds and affiliated funds since 2002 | |
Scott R. Plummer
5228 Ameriprise Financial Center Minneapolis, MN 55474
1959 | | Senior Vice President and Chief Legal Officer since 12/06 and Assistant Secretary since 6/11 for RiverSource Funds and Senior Vice President and Chief Legal Officer since 5/10 and Assistant Secretary since 6/11 for Nations Funds | | Senior Vice President, Chief Legal Officer and Assistant Secretary, Columbia Management Investment Advisers, LLC since June 2005; Vice President and Lead Chief Counsel — Asset Management, Ameriprise Financial, Inc. since May 2010 (previously Vice President and Chief Counsel — Asset Management, 2005-April 2010); Vice President, Chief Counsel and Assistant Secretary, Columbia Management Investment Distributors, Inc. since 2008; Vice President, General Counsel and Secretary, Ameriprise Certificate Company since 2005; Chief Counsel, RiverSource Distributors, Inc. since 2006 | |
Colin Moore
225 Franklin Street
Boston, MA 02110
1958 | | Senior Vice President since 5/10 for RiverSource Funds and Nations Funds | | Director and Chief Investment Officer, Columbia Management Investment Advisers, LLC since May 2010; Manager, Managing Director and Chief Investment Officer, Columbia Management Advisors, LLC, 2007-April 2010 | |
Thomas P. McGuire
225 Franklin Street
Boston, MA 02110
1972 | | Chief Compliance Officer since 3/12 | | Vice President — Asset Management Compliance, Columbia Management Investment Advisers, LLC since 2010; Chief Compliance Officer, Ameriprise Certificate Company since September 2010; Compliance Executive, Bank of America, 2005-2010 | |
Stephen T. Welsh
225 Franklin Street
Boston, MA 02110
1957 | | Vice President since 4/11 for RiverSource Funds and 2006 for Nations Funds | | President and Director, Columbia Management Investment Services Corp. since May 2010; President and Director, Columbia Management Services, Inc., July 2004- April 2010; Managing Director, Columbia Management Distributors, Inc., August 2007-April 2010 | |
Christopher O. Petersen
5228 Ameriprise Financial Center Minneapolis, MN 55474
1970 | | Vice President and Secretary since 4/11 for RiverSource Funds and 3/11 for Nations Funds | | Vice President and Chief Counsel, Ameriprise Financial, Inc. since January 2010 (formerly Vice President and Group Counsel or Counsel, April 2004-January 2010); Assistant Secretary of Legacy RiverSource Funds, January 2007-April 2011 and of the Nations Funds, May 2010-March 2011 | |
Annual Report 2013
43
Columbia Small Cap Index Fund
Trustees and Officers (continued)
Officers (continued)
Name,
Address,
Year of Birth | | Position Held With
Funds and Length of
Service | | Principal Occupation During Past Five Years | |
Paul D. Pearson
10468 Ameriprise Financial Center Minneapolis, MN 55474
1956 | | Vice President since 4/11 and Assistant Treasurer since 1999 for RiverSource Funds and Vice President and Assistant Treasurer since 6/11 for Nations Funds | | Vice President — Investment Accounting, Columbia Management Investment Advisers, LLC, since May 2010; Vice President — Managed Assets, Investment Accounting, Ameriprise Financial Corporation, February 1998-May 2010 | |
Joseph F. DiMaria
225 Franklin Street
Boston, MA 02110
1968 | | Vice President and Chief Accounting Officer since 4/11 and Vice President since 3/11 and Chief Accounting Officer since 2008 for Nations Funds | | Vice President, Mutual Fund Administration, Columbia Management Investment Advisers, LLC, since May 2010; Director of Fund Administration, Columbia Management Advisors, LLC, January 2006-April 2010 | |
Paul B. Goucher
100 Park Avenue
New York, NY 10017
1968 | | Vice President since 4/11 and Assistant Secretary since 11/08 for RiverSource Funds and 5/10 for Nations Funds | | Vice President and Lead Chief Counsel, Ameriprise Financial, Inc. since November 2008 and January 2013, respectively (formerly, Chief Counsel, January 2010-January 2013 and Group Counsel from November 2008- January 2010); Director, Managing Director and General Counsel, J. & W. Seligman & Co. Incorporated, July 2008-November 2008 (previously, Managing Director and Associate General Counsel, January 2005-July 2008) | |
Michael E. DeFao
225 Franklin Street
Boston, MA 02110
1968 | | Vice President since 4/11 and Assistant Secretary since 5/10 for RiverSource Funds and 2011 for Nations Funds | | Vice President and Chief Counsel, Ameriprise Financial, Inc. since May 2010; Associate General Counsel, Bank of America, June 2005-April 2010 | |
Annual Report 2013
44
Columbia Small Cap Index Fund
Important Information About This Report
Each fund mails one shareholder report to each shareholder address. If you would like more than one report, please call shareholder services at 800.345.6611 and additional reports will be sent to you.
The policy of the Board is to vote the proxies of the companies in which each fund holds investments consistent with the procedures as stated in the Statement of Additional Information (SAI). You may obtain a copy of the SAI without charge by calling 800.345.6611; contacting your financial intermediary; visiting columbiamanagement.com; or searching the website of the Securities and Exchange Commission (SEC) at sec.gov. Information regarding how each fund voted proxies relating to portfolio securities is filed with the SEC by August 31 for the most recent 12-month period ending June 30 of that year, and is available without charge by visiting columbiamanagement.com; or searching the website of the SEC at sec.gov.
Each fund files a complete schedule of portfolio holdings with the SEC for the first and third quarters of each fiscal year on Form N-Q. Each fund's Form N-Q is available on the SEC's website at sec.gov and may be reviewed and copied at the SEC's Public Reference Room in Washington, D.C. Information on the operation of the Public Reference Room may be obtained by calling 800.SEC.0330. Each fund's complete schedule of portfolio holdings, as filed on Form N-Q, can also be obtained without charge, upon request, by calling 800.345.6611.
Annual Report 2013
45

Columbia Small Cap Index Fund
P.O. Box 8081
Boston, MA 02266-8081
columbiamanagement.com
This information is for use with concurrent or prior delivery of a fund prospectus. Please read and consider the investment objectives, risks, charges and expenses for any fund carefully before investing. For a prospectus which contains this and other important information about the Fund go to columbiamanagement.com. The Fund is distributed by Columbia Management Investment Distributors, Inc., member FINRA, and managed by Columbia Management Investment Advisers, LLC.
© 2013 Columbia Management Investment Advisers, LLC. All rights reserved.
ANN228_02_C01_(04/13)
Annual Report
February 28, 2013

Columbia Small Cap Value Fund II
Not FDIC insured • No bank guarantee • May lose value
Columbia Small Cap Value Fund II
 Dear Shareholders,
U.S. stocks flat, foreign markets strong in 2012 finale
After a strong third quarter, U.S. stock market averages treaded water as the year 2012 came to a close. However, they ended the year up strongly, as first- and third-quarter gains more than offset second- and fourth-quarter weakness. Typically a strong quarter for domestic small- and mid-cap issues, the fourth quarter of 2012 indeed proved to be another year-end positive for small-cap stocks. For the full calendar year 2012, the S&P 500 Index rose 16.00%.
Stock markets outside the United States generated some of the best returns for the fourth quarter, as optimism rebounded, thanks to the September actions of the European Central Bank in support of the euro and an improving outlook from China. Both developed and emerging foreign markets topped U.S. stocks by a solid margin.
Corporate and emerging markets led fixed income
Fixed-income investors took their cue from the equity markets and continued to favor the highest risk sectors through the end of 2012. Global fixed-income returns posted mixed results in the final quarter of the year. Gains were the highest for corporate high-yield and emerging market bonds. Although investors remained cautious ahead of the year-end budget negotiations, better economic data and a further improvement in the European sovereign debt crisis supported riskier assets and depressed government bond prices. In December, the Federal Reserve announced its intention to continue to purchase both Treasury and mortgage-backed securities and said that it would seek to keep short-term interest rates unchanged until the unemployment rate reaches 6.5%, or inflation turned noticeably higher.
Stay on track with Columbia Management
Backed by more than 100 years of experience, Columbia Management is one of the nation's largest asset managers. At the heart of our success — and, most importantly, that of our investors — are highly talented industry professionals, brought together by a unique way of working. We are dedicated to helping you take advantage of today's opportunities and anticipate tomorrow's. We stay abreast of the latest investment trends and ideas, using our collective insight to evaluate events and transform them into solutions you can use.
Visit columbiamanagement.com for:
> The Columbia Management Perspectives blog, featuring timely posts by our investment teams
> Detailed up-to-date fund performance and portfolio information
> Economic analysis and market commentary
> Quarterly fund commentaries
> Columbia Management Investor, our award-winning quarterly newsletter for shareholders
Thank you for your continued support of the Columbia Funds. We look forward to serving your investment needs for many years to come.
Best Regards,

J. Kevin Connaughton
President, Columbia Funds
The S&P 500 Index, an unmanaged index, measures the performance of 500 widely held, large-capitalization U.S. stocks and is frequently used as a general measure of market performance. Indices are not available for investment, are not professionally managed and do not reflect sales charges, fees, brokerage commissions, taxes or other expenses of investing.
Investors should consider the investment objectives, risks, charges and expenses of a mutual fund carefully before investing. For a free prospectus, which contains this and other important information about a fund, visit columbiamanagement.com. The prospectus should be read carefully before investing.
Columbia Funds are distributed by Columbia Management Investment Distributors, Inc., member FINRA, and managed by Columbia Management Investment Advisers, LLC.
© 2013 Columbia Management Investment Advisers, LLC. All rights reserved.
Columbia Small Cap Value Fund II
Performance Overview | | | 2 | | |
Manager Discussion of Fund Performance | | | 4 | | |
Understanding Your Fund's Expenses | | | 6 | | |
Portfolio of Investments | | | 7 | | |
Statement of Assets and Liabilities | | | 12 | | |
Statement of Operations | | | 14 | | |
Statement of Changes in Net Assets | | | 15 | | |
Financial Highlights | | | 17 | | |
Notes to Financial Statements | | | 26 | | |
Report of Independent Registered
Public Accounting Firm | | | 33 | | |
Federal Income Tax Information | | | 34 | | |
Trustees and Officers | | | 35 | | |
Important Information About This Report | | | 41 | | |
Fund Investment Manager
Columbia Management Investment
Advisers, LLC
225 Franklin Street
Boston, MA 02110
Fund Distributor
Columbia Management Investment
Distributors, Inc.
225 Franklin Street
Boston, MA 02110
Fund Transfer Agent
Columbia Management Investment
Services Corp.
P.O. Box 8081
Boston, MA 02266-8081
For more information about any of the funds, please visit columbiamanagement.com or call 800.345.6611. Customer Service Representatives are available to answer your questions Monday through Friday from 8 a.m. to 8 p.m. Eastern time.
The views expressed in this report reflect the current views of the respective parties. These views are not guarantees of future performance and involve certain risks, uncertainties and assumptions that are difficult to predict, so actual outcomes and results may differ significantly from the views expressed. These views are subject to change at any time based upon economic, market or other conditions and the respective parties disclaim any responsibility to update such views. These views may not be relied on as investment advice and, because investment decisions for a Columbia Fund are based on numerous factors, may not be relied on as an indication of trading intent on behalf of any particular Columbia Fund. References to specific securities should not be construed as a recommendation or investment advice.
Columbia Small Cap Value Fund II
Performance Summary
> Columbia Small Cap Value Fund II (the Fund) Class A shares returned 14.70% excluding sales charges for the 12-month period that ended February 28, 2013.
> The Fund underperformed its benchmark, the Russell 2000 Value Index, which returned 16.89% for the same 12-month period.
> Industry allocations generally accounted for the Fund's shortfall relative to the benchmark. Stock selection was a slight detractor from performance.
Average Annual Total Returns (%) (for period ended February 28, 2013)
| | Inception | | 1 Year | | 5 Years | | 10 Years | |
Class A | | 05/01/02 | | | | | | | | | | | | | |
Excluding sales charges | | | | | | | 14.70 | | | | 6.75 | | | | 11.83 | | |
Including sales charges | | | | | | | 8.11 | | | | 5.50 | | | | 11.17 | | |
Class B | | 05/01/02 | | | | | | | | | | | | | |
Excluding sales charges | | | | | | | 13.94 | | | | 5.96 | | | | 10.99 | | |
Including sales charges | | | | | | | 8.94 | | | | 5.64 | | | | 10.99 | | |
Class C | | 05/01/02 | | | | | | | | | | | | | |
Excluding sales charges | | | | | | | 13.87 | | | | 5.95 | | | | 11.00 | | |
Including sales charges | | | | | | | 12.87 | | | | 5.95 | | | | 11.00 | | |
Class I* | | 09/27/10 | | | 15.31 | | | | 7.02 | | | | 11.97 | | |
Class R* | | 01/23/06 | | | 14.47 | | | | 6.49 | | | | 11.54 | | |
Class R4* | | 11/08/12 | | | 14.84 | | | | 6.78 | | | | 11.85 | | |
Class R5* | | 11/08/12 | | | 14.87 | | | | 6.78 | | | | 11.85 | | |
Class Y* | | 11/08/12 | | | 14.89 | | | | 6.79 | | | | 11.85 | | |
Class Z | | 05/01/02 | | | 15.02 | | | | 7.02 | | | | 12.12 | | |
Russell 2000 Value Index | | | | | | | 16.89 | | | | 6.74 | | | | 10.96 | | |
Returns for Class A are shown with and without the maximum initial sales charge of 5.75%. Returns for Class B are shown with and without the applicable contingent deferred sales charge (CDSC) of 5.00% in the first year, declining to 1.00% in the sixth year and eliminated thereafter. Returns for Class C are shown with and without the 1.00% CDSC for the first year only. The Fund's other classes are not subject to sales charges and have limited eligibility. Please see the Fund's prospectuses for details. Performance for different share classes will vary based on differences in sales charges and fees associated with each class. All results shown assume reinvestment of distributions during the period. Returns do not reflect the deduction of taxes that a shareholder may pay on Fund distributions or on the redemption of Fund shares. Performance results reflect the effect of any fee waivers or reimbursements of Fund expenses by Columbia Management Investment Advisers, LLC and/or any of its affiliates. Absent these fee waivers or expense reimbursement arrangements, performance results would have been lower.
The performance information shown represents past performance and is not a guarantee of future results. The investment return and principal value of your investment will fluctuate so that your shares, when redeemed, may be worth more or less than their original cost. Current performance may be lower or higher than the performance information shown. You may obtain performance information current to the most recent month-end by contacting your financial intermediary, visiting columbiamanagement.com or calling 800.345.6611.
*The returns shown for periods prior to the share class inception date (including returns for the Life of the Fund, if shown, which are since Fund inception) include the returns of the Fund's oldest share class. Since the Fund launched more than one share class at its inception, Class A shares were used. These returns are adjusted to reflect any higher class-related operating expenses of the newer share classes, as applicable. Please visit columbiamanagement.com/mutual-funds/appended-performance for more information.
The Russell 2000 Value Index, an unmanaged index, tracks the performance of those Russell 2000 Index companies with lower price-to-book ratios and lower forecasted growth values.
Indices are not available for investment, are not professionally managed and do not reflect sales charges, fees, brokerage commissions, taxes or other expenses of investing. Securities in the Fund may not match those in an index.
Annual Report 2013
2
Columbia Small Cap Value Fund II
Performance Overview (continued)
Performance of a Hypothetical $10,000 Investment (March 1, 2003 – February 28, 2013)
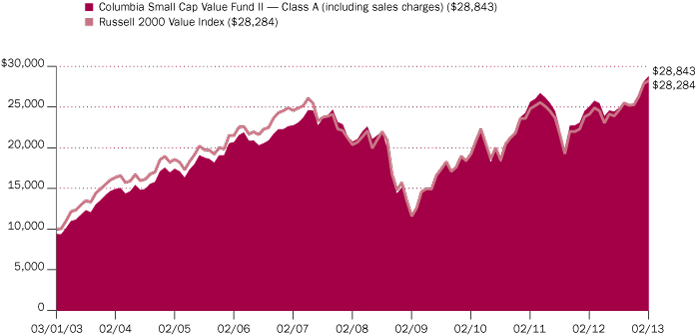
The chart above shows the change in value of a hypothetical $10,000 investment in Class A shares of Columbia Small Cap Value Fund II during the stated time period, and does not reflect the deduction of taxes that a shareholder may pay on Fund distributions or on the redemption of Fund shares.
Annual Report 2013
3
Columbia Small Cap Value Fund II
Manager Discussion of Fund Performance
For the 12-month period that ended February 28, 2013, the Fund's Class A shares returned 14.70% excluding sales charges. The Fund underperformed its benchmark, the Russell 2000 Value Index, which returned 16.89% over the same period. Sector allocations — including an underweight in the strong performing financials sector, an overweight in the weak information technology sector and a small cash position — generally accounted for the shortfall relative to the benchmark. Stock selection also had a slight negative impact for the period, as the positive contribution from the Fund's industrials, materials and technology holdings was more than offset by the negative impact of holdings in the energy and consumer discretionary sectors.
A lack of exposure to telecommunication services was positive for the Fund, as it was the weakest performer within the benchmark — and the only small-cap sector with a negative return for the period.
Investors Shrug Off Sluggish Global Growth
Europe's economic woes and U.S. struggles to avoid a fiscal cliff of tax increases and spending cuts weighed on the global economy during the 12-month period ended February 28, 2013. Yet, investors chose to look beyond the numbers and came in from the sidelines to bid stock prices significantly higher. Favorable central bank action in key markets and improving prospects for the U.S. economy gave investors confidence to favor stocks and other riskier assets. The U.S. economy expanded at a pace of just 1.6% in 2012. However, a pickup in job growth early in 2013 and steady manufacturing activity were encouraging signs. The U.S. housing market staged a solid comeback, with higher home sales, rising prices and lower inventories. Against this back drop, small-cap stocks posted strong gains for the year, despite periods of sharp volatility. Value stocks outperformed growth by a sizable margin.
Favorable Stock Selection in Industrials, Materials and Technology
Stock picks in the industrials sector had the biggest positive impact on relative performance, followed by security selection in materials and information technology. Top contributors within industrials included check printing and graphic arts company Deluxe Corp. and wallboard manufacturer USG. Shares of Deluxe posted steep gains, fueled by growth in the non-check parts of the business and by effective cost control. USG's stock soared, as the housing recovery drove improved demand. In materials, stock picks in aggregate helped, as did our decision to trim the metals weight earlier in the year when scrap prices began to fall on weakening demand. Information technology winners included an out-of-benchmark position in German metering company Elster Group, which rallied on news of a takeover.
Security selection in financials also contributed to the Fund's performance relative to the benchmark, led by steep gains from Geo Group, a company that operates correctional and detention facilities. Geo's conversion to a real estate investment trust late in the period helped unlock value and drive gains.
Results in Energy and Consumer Discretionary Lagged
Stock picks in the energy and consumer discretionary sectors hampered relative performance. In energy, companies with natural gas exposure suffered as gas prices dropped early in the period and oil prices increased. Companies that invested to
Portfolio Management
Christian Stadlinger, Ph.D., CFA
Jarl Ginsberg, CFA, CAIA
Morningstar Style BoxTM
The Morningstar Style BoxTM is based on a fund's portfolio holdings. For equity funds, the vertical axis shows the market capitalization of the stocks owned, and the horizontal axis shows investment style (value, blend, or growth). Information shown is based on the most recent data provided by Morningstar.
© 2013 Morningstar, Inc. All rights reserved. The Morningstar information contained herein: (1) is proprietary to Morningstar and/or its content providers; (2) may not be copied or distributed; and (3) is not warranted to be accurate, complete or timely. Neither Morningstar nor its content providers are responsible for any damages or losses arising from any use of this information.
Top Ten Holdings (%)
(at February 28, 2013) | |
First Industrial Realty Trust, Inc. | | | 1.2 | | |
American Assets Trust, Inc. | | | 1.2 | | |
Avista Corp. | | | 1.2 | | |
AMERISAFE, Inc. | | | 1.2 | | |
CubeSmart | | | 1.2 | | |
Kilroy Realty Corp. | | | 1.2 | | |
Trinity Industries, Inc. | | | 1.1 | | |
Community Bank System, Inc. | | | 1.1 | | |
Sterling Bancorp | | | 1.1 | | |
Deluxe Corp. | | | 1.1 | | |
Percentages indicated are based upon total investments (excluding Money Market Funds).
For further detail about these holdings, please refer to the section entitled "Portfolio of Investments."
Fund holdings are as of the date given, are subject to change at any time, and are not recommendations to buy or sell any security.
Annual Report 2013
4
Columbia Small Cap Value Fund II
Manager Discussion of Fund Performance (continued)
shift their mix more toward oil were penalized if they could not quickly deliver cash flow. Individual detractors in the Fund included drilling and production services company Key Energy Services (which we sold) and exploration and production companies Midstates Petroleum and Swift Energy. In consumer discretionary, the stock of for-profit education company Bridgepoint Education — which was not in the Russell benchmark — fell sharply amid news that one of its institutions might be denied future accreditation. We sold the position.
Continued Focus on Security Selection
Although continued modest economic growth could aid stock returns, we rely on bottom-up stock picking that targets small companies with strong underlying earnings prospects and attractively priced shares. We particularly like companies that have been overlooked by analysts on Wall Street, companies in industries that may be out of favor and underperforming companies that are showing evidence of improvement. Security selection will continue to drive industry allocations, which at period end included overweights in health care, industrials and materials, and underweights in consumer discretionary, financials, utilities and energy.
Portfolio Breakdown (%)
(at February 28, 2013) | |
Common Stocks | | | 98.2 | | |
Consumer Discretionary | | | 8.5 | | |
Consumer Staples | | | 2.3 | | |
Energy | | | 6.2 | | |
Financials | | | 35.0 | | |
Health Care | | | 7.0 | | |
Industrials | | | 15.1 | | |
Information Technology | | | 12.3 | | |
Materials | | | 7.2 | | |
Utilities | | | 4.6 | | |
Money Market Funds | | | 1.8 | | |
Total | | | 100.0 | | |
Percentages indicated are based upon total investments. The Fund's portfolio composition is subject to change.
Annual Report 2013
5
Columbia Small Cap Value Fund II
Understanding Your Fund's Expenses
(Unaudited)
As an investor, you incur two types of costs. There are transaction costs, which generally include sales charges on purchases and may include redemption fees. There are also ongoing costs, which generally include management fees, distribution and service (Rule 12b-1) fees, and other fund expenses. The following information is intended to help you understand your ongoing costs (in dollars) of investing in the Fund and to help you compare these costs with the ongoing costs of investing in other mutual funds.
Analyzing Your Fund's Expenses
To illustrate these ongoing costs, we have provided examples and calculated the expenses paid by investors in each share class of the Fund during the period. The actual and hypothetical information in the table is based on an initial investment of $1,000 at the beginning of the period indicated and held for the entire period. Expense information is calculated two ways and each method provides you with different information. The amount listed in the "Actual" column is calculated using the Fund's actual operating expenses and total return for the period. You may use the Actual information, together with the amount invested, to estimate the expenses that you paid over the period. Simply divide your account value by $1,000 (for example, an $8,600 account value divided by $1,000 = 8.6), then multiply the results by the expenses paid during the period under the Actual column. The amount listed in the "Hypothetical" column assumes a 5% annual rate of return before expenses (which is not the Fund's actual return) and then applies the Fund's actual expense ratio for the period to the hypothetical return. You should not use the hypothetical account values and expenses to estimate either your actual account balance at the end of the period or the expenses you paid during the period. See "Compare With Other Funds" below for details on how to use the hypothetical data.
Compare With Other Funds
Since all mutual funds are required to include the same hypothetical calculations about expenses in shareholder reports, you can use this information to compare the ongoing cost of investing in the Fund with other funds. To do so, compare the hypothetical example with the 5% hypothetical examples that appear in the shareholder reports of other funds. As you compare hypothetical examples of other funds, it is important to note that hypothetical examples are meant to highlight the ongoing costs of investing in a fund only and do not reflect any transaction costs, such as sales charges, or redemption or exchange fees. Therefore, the hypothetical calculations are useful in comparing ongoing costs only, and will not help you determine the relative total costs of owning different funds. If transaction costs were included in these calculations, your costs would be higher.
September 1, 2012 – February 28, 2013
| | Account Value at the Beginning
of the Period ($) | | Account Value at the End of the
Period ($) | | Expenses Paid During the
Period ($) | | Fund's Annualized
Expense Ratio (%) | |
| | Actual | | Hypothetical | | Actual | | Hypothetical | | Actual | | Hypothetical | | Actual | |
Class A | | | 1,000.00 | | | | 1,000.00 | | | | 1,155.80 | | | | 1,018.30 | | | | 7.00 | | | | 6.56 | | | | 1.31 | | |
Class B | | | 1,000.00 | | | | 1,000.00 | | | | 1,152.00 | | | | 1,014.58 | | | | 10.99 | | | | 10.29 | | | | 2.06 | | |
Class C | | | 1,000.00 | | | | 1,000.00 | | | | 1,151.40 | | | | 1,014.58 | | | | 10.99 | | | | 10.29 | | | | 2.06 | | |
Class I | | | 1,000.00 | | | | 1,000.00 | | | | 1,158.60 | | | | 1,020.53 | | | | 4.60 | | | | 4.31 | | | | 0.86 | | |
Class R | | | 1,000.00 | | | | 1,000.00 | | | | 1,154.30 | | | | 1,017.06 | | | | 8.33 | | | | 7.80 | | | | 1.56 | | |
Class R4 | | | 1,000.00 | | | | 1,000.00 | | | | 1,176.00 | * | | | 1,019.54 | | | | 3.51 | * | | | 5.31 | | | | 1.06 | * | |
Class R5 | | | 1,000.00 | | | | 1,000.00 | | | | 1,176.30 | * | | | 1,020.23 | | | | 3.04 | * | | | 4.61 | | | | 0.92 | * | |
Class Y | | | 1,000.00 | | | | 1,000.00 | | | | 1,176.60 | * | | | 1,020.48 | | | | 2.88 | * | | | 4.36 | | | | 0.87 | * | |
Class Z | | | 1,000.00 | | | | 1,000.00 | | | | 1,156.80 | | | | 1,019.54 | | | | 5.67 | | | | 5.31 | | | | 1.06 | | |
*For the period November 8, 2012 through February 28, 2013. Class R4, R5 and Y shares commenced operations on November 8, 2012.
Expenses paid during the period are equal to the annualized expense ratio for each class as indicated above, multiplied by the average account value over the period and then multiplied by the number of days in the Fund's most recent fiscal half year and divided by 365.
Expenses do not include fees and expenses incurred indirectly by the Fund from the underlying funds in which the Fund may invest (also referred to as "acquired funds"), including affiliated and non-affiliated pooled investment vehicles (including mutual funds and exchange-traded funds).
Had Columbia Management Investment Advisers, LLC and/or certain of its affiliates not waived/reimbursed certain fees and expenses, for certain classes, account value at the end of the period would have been reduced.
Annual Report 2013
6
Columbia Small Cap Value Fund II
Portfolio of Investments
February 28, 2013
(Percentages represent value of investments compared to net assets)
Common Stocks 99.0%
Issuer | | Shares | | Value ($) | |
Consumer Discretionary 8.6% | |
Auto Components 1.6% | |
Tenneco, Inc.(a) | | | 335,000 | | | | 11,869,050 | | |
Tower International, Inc.(a)(b) | | | 950,000 | | | | 11,438,000 | | |
Total | | | | | 23,307,050 | | |
Diversified Consumer Services 1.0% | |
Stewart Enterprises, Inc., Class A | | | 1,625,000 | | | | 13,763,750 | | |
Hotels, Restaurants & Leisure 1.3% | |
Krispy Kreme Doughnuts, Inc.(a) | | | 498,100 | | | | 6,574,920 | | |
Sonic Corp.(a) | | | 1,100,000 | | | | 12,419,000 | | |
Total | | | | | 18,993,920 | | |
Household Durables 2.0% | |
Helen of Troy Ltd.(a) | | | 410,000 | | | | 15,202,800 | | |
KB Home | | | 430,000 | | | | 8,036,700 | | |
Standard Pacific Corp.(a) | | | 725,000 | | | | 5,901,500 | | |
Total | | | | | 29,141,000 | | |
Specialty Retail 2.7% | |
OfficeMax, Inc. | | | 900,000 | | | | 10,773,000 | | |
Pier 1 Imports, Inc. | | | 505,000 | | | | 11,347,350 | | |
Sonic Automotive, Inc., Class A | | | 650,000 | | | | 14,521,000 | | |
Zale Corp.(a) | | | 702,060 | | | | 2,759,096 | | |
Total | | | | | 39,400,446 | | |
Total Consumer Discretionary | | | | | 124,606,166 | | |
Consumer Staples 2.3% | |
Food & Staples Retailing 1.0% | |
Harris Teeter Supermarkets, Inc. | | | 330,000 | | | | 14,190,000 | | |
Food Products 0.5% | |
Dole Food Co., Inc.(a) | | | 600,000 | | | | 6,720,000 | | |
Personal Products 0.8% | |
Nu Skin Enterprises, Inc., Class A | | | 300,000 | | | | 12,360,000 | | |
Total Consumer Staples | | | | | 33,270,000 | | |
Energy 6.2% | |
Energy Equipment & Services 3.4% | |
Helix Energy Solutions Group, Inc.(a) | | | 550,000 | | | | 12,875,500 | | |
Hercules Offshore, Inc.(a) | | | 2,043,000 | | | | 13,851,540 | | |
Hornbeck Offshore Services, Inc.(a) | | | 340,000 | | | | 14,450,000 | | |
Tesco Corp.(a) | | | 648,600 | | | | 8,243,706 | | |
Total | | | | | 49,420,746 | | |
Common Stocks (continued)
Issuer | | Shares | | Value ($) | |
Oil, Gas & Consumable Fuels 2.8% | |
Delek U.S. Holdings, Inc. | | | 270,800 | | | | 10,117,088 | | |
Gulfport Energy Corp.(a) | | | 275,000 | | | | 11,261,250 | | |
Midstates Petroleum Co., Inc.(a) | | | 1,275,000 | | | | 9,511,500 | | |
PDC Energy, Inc.(a) | | | 213,200 | | | | 9,943,648 | | |
Total | | | | | 40,833,486 | | |
Total Energy | | | | | 90,254,232 | | |
Financials 35.3% | |
Capital Markets 1.9% | |
Apollo Investment Corp. | | | 838,934 | | | | 7,290,336 | | |
Medley Capital Corp. | | | 751,157 | | | | 11,252,332 | | |
Walter Investment Management(a) | | | 210,000 | | | | 9,643,200 | | |
Total | | | | | 28,185,868 | | |
Commercial Banks 11.4% | |
Community Bank System, Inc. | | | 560,000 | | | | 16,167,200 | | |
FNB Corp. | | | 657,768 | | | | 7,472,245 | | |
Independent Bank Corp. | | | 475,000 | | | | 15,052,750 | | |
PrivateBancorp, Inc. | | | 575,000 | | | | 10,298,250 | | |
Prosperity Bancshares, Inc. | | | 327,000 | | | | 15,087,780 | | |
Renasant Corp. | | | 641,900 | | | | 14,128,219 | | |
Sandy Spring Bancorp, Inc. | | | 575,000 | | | | 11,132,000 | | |
Sterling Bancorp(b) | | | 1,583,843 | | | | 16,107,683 | | |
Susquehanna Bancshares, Inc. | | | 1,247,001 | | | | 14,502,622 | | |
Texas Capital Bancshares, Inc.(a) | | | 205,000 | | | | 8,663,300 | | |
Umpqua Holdings Corp. | | | 1,150,000 | | | | 14,432,500 | | |
Western Alliance Bancorp(a) | | | 935,000 | | | | 12,435,500 | | |
Wintrust Financial Corp. | | | 272,300 | | | | 9,938,950 | | |
Total | | | | | 165,418,999 | | |
Insurance 7.9% | |
American Equity Investment Life
Holding Co. | | | 945,265 | | | | 13,120,278 | | |
AMERISAFE, Inc.(a) | | | 516,334 | | | | 16,842,815 | | |
Amtrust Financial Services, Inc. | | | 475,000 | | | | 15,793,750 | | |
Argo Group International Holdings Ltd. | | | 290,000 | | | | 11,014,200 | | |
CNO Financial Group, Inc. | | | 1,350,000 | | | | 14,769,000 | | |
National Financial Partners Corp.(a) | | | 725,000 | | | | 14,253,500 | | |
Platinum Underwriters Holdings Ltd. | | | 283,200 | | | | 14,975,616 | | |
Symetra Financial Corp. | | | 1,075,000 | | | | 14,157,750 | | |
Total | | | | | 114,926,909 | | |
The accompanying Notes to Financial Statements are an integral part of this statement.
Annual Report 2013
7
Columbia Small Cap Value Fund II
Portfolio of Investments (continued)
February 28, 2013
Common Stocks (continued)
Issuer | | Shares | | Value ($) | |
Real Estate Investment Trusts (REITs) 9.9% | |
American Assets Trust, Inc. | | | 565,000 | | | | 17,079,950 | | |
Brandywine Realty Trust | | | 971,845 | | | | 13,362,869 | | |
CubeSmart | | | 1,125,000 | | | | 16,582,500 | | |
First Industrial Realty Trust, Inc.(a) | | | 1,100,000 | | | | 17,457,000 | | |
Geo Group, Inc. (The) | | | 430,000 | | | | 14,852,200 | | |
Highwoods Properties, Inc. | | | 275,320 | | | | 10,049,180 | | |
Kilroy Realty Corp. | | | 314,000 | | | | 16,566,640 | | |
LaSalle Hotel Properties | | | 375,000 | | | | 9,521,250 | | |
MFA Financial, Inc. | | | 963,618 | | | | 8,556,928 | | |
Omega Healthcare Investors, Inc. | | | 350,000 | | | | 9,796,500 | | |
PennyMac Mortgage Investment Trust | | | 420,000 | | | | 10,676,400 | | |
Total | | | | | 144,501,417 | | |
Thrifts & Mortgage Finance 4.2% | |
EverBank Financial Corp. | | | 930,000 | | | | 14,043,000 | | |
Flushing Financial Corp. | | | 550,639 | | | | 8,700,096 | | |
Ocwen Financial Corp.(a) | | | 325,000 | | | | 12,811,500 | | |
Oritani Financial Corp. | | | 789,189 | | | | 11,608,970 | | |
Radian Group, Inc. | | | 1,550,000 | | | | 13,655,500 | | |
Total | | | | | 60,819,066 | | |
Total Financials | | | | | 513,852,259 | | |
Health Care 7.0% | |
Health Care Equipment & Supplies 2.5% | |
CONMED Corp. | | | 467,000 | | | | 14,528,370 | | |
ICU Medical, Inc.(a) | | | 206,000 | | | | 11,692,560 | | |
Symmetry Medical, Inc.(a) | | | 1,025,000 | | | | 10,690,750 | | |
Total | | | | | 36,911,680 | | |
Health Care Providers & Services 3.8% | |
Kindred Healthcare, Inc.(a) | | | 1,050,000 | | | | 11,833,500 | | |
LHC Group, Inc.(a) | | | 410,000 | | | | 8,331,200 | | |
Vanguard Health Systems, Inc.(a) | | | 670,000 | | | | 9,962,900 | | |
VCA Antech, Inc.(a) | | | 535,000 | | | | 11,748,600 | | |
WellCare Health Plans, Inc.(a) | | | 230,000 | | | | 13,153,700 | | |
Total | | | | | 55,029,900 | | |
Health Care Technology 0.7% | |
MedAssets, Inc.(a) | | | 550,000 | | | | 10,158,500 | | |
Total Health Care | | | | | 102,100,080 | | |
Common Stocks (continued)
Issuer | | Shares | | Value ($) | |
Industrials 15.3% | |
Airlines 0.8% | |
Alaska Air Group, Inc.(a) | | | 235,000 | | | | 12,114,250 | | |
Building Products 0.9% | |
USG Corp.(a) | | | 475,000 | | | | 13,404,500 | | |
Commercial Services & Supplies 3.8% | |
Cenveo, Inc.(a) | | | 1,950,000 | | | | 4,095,000 | | |
Deluxe Corp. | | | 405,000 | | | | 16,070,400 | | |
Steelcase, Inc., Class A | | | 575,000 | | | | 8,136,250 | | |
TMS International Corp., Class A(a)(b) | | | 859,456 | | | | 11,843,304 | | |
United Stationers, Inc. | | | 425,000 | | | | 15,385,000 | | |
Total | | | | | 55,529,954 | | |
Construction & Engineering 1.7% | |
EMCOR Group, Inc. | | | 298,262 | | | | 11,503,965 | | |
MasTec, Inc.(a) | | | 435,300 | | | | 13,098,177 | | |
Total | | | | | 24,602,142 | | |
Machinery 2.1% | |
Trinity Industries, Inc. | | | 380,000 | | | | 16,431,200 | | |
Wabash National Corp.(a) | | | 1,450,000 | | | | 13,833,000 | | |
Total | | | | | 30,264,200 | | |
Professional Services 1.1% | |
Navigant Consulting, Inc.(a) | | | 1,200,000 | | | | 15,276,000 | | |
Road & Rail 1.5% | |
Swift Transportation Co.(a) | | | 925,000 | | | | 12,515,250 | | |
Werner Enterprises, Inc. | | | 385,000 | | | | 8,862,700 | | |
Total | | | | | 21,377,950 | | |
Trading Companies & Distributors 3.4% | |
Beacon Roofing Supply, Inc.(a) | | | 260,000 | | | | 9,594,000 | | |
Houston Wire & Cable Co.(b) | | | 506,343 | | | | 5,893,833 | | |
Textainer Group Holdings Ltd. | | | 260,000 | | | | 10,514,400 | | |
Titan Machinery, Inc.(a) | | | 362,701 | | | | 10,246,303 | | |
United Rentals, Inc.(a) | | | 250,000 | | | | 13,352,500 | | |
Total | | | | | 49,601,036 | | |
Total Industrials | | | | | 222,170,032 | | |
Information Technology 12.4% | |
Communications Equipment 0.9% | |
Calix, Inc.(a) | | | 524,800 | | | | 4,497,536 | | |
Ciena Corp.(a) | | | 600,000 | | | | 9,144,000 | | |
Total | | | | | 13,641,536 | | |
The accompanying Notes to Financial Statements are an integral part of this statement.
Annual Report 2013
8
Columbia Small Cap Value Fund II
Portfolio of Investments (continued)
February 28, 2013
Common Stocks (continued)
Issuer | | Shares | | Value ($) | |
Electronic Equipment, Instruments & Components 1.7% | |
Anixter International, Inc. | | | 153,000 | | | | 10,544,760 | | |
Rofin-Sinar Technologies, Inc.(a) | | | 290,000 | | | | 7,705,300 | | |
Rogers Corp.(a) | | | 145,000 | | | | 6,917,950 | | |
Total | | | | | 25,168,010 | | |
Internet Software & Services 0.8% | |
Perficient, Inc.(a) | | | 285,000 | | | | 3,300,300 | | |
Saba Software, Inc.(a) | | | 1,000,000 | | | | 8,740,000 | | |
Total | | | | | 12,040,300 | | |
IT Services 2.9% | |
Global Cash Access Holdings, Inc.(a) | | | 1,424,127 | | | | 10,111,302 | | |
Lender Processing Services, Inc. | | | 431,000 | | | | 10,585,360 | | |
NeuStar, Inc., Class A(a) | | | 315,000 | | | | 13,812,750 | | |
Unisys Corp.(a) | | | 324,600 | | | | 7,459,308 | | |
Total | | | | | 41,968,720 | | |
Semiconductors & Semiconductor Equipment 4.2% | |
Cirrus Logic, Inc.(a) | | | 275,000 | | | | 6,611,000 | | |
Fairchild Semiconductor
International, Inc.(a) | | | 780,000 | | | | 11,122,800 | | |
Integrated Silicon Solution(a) | | | 625,000 | | | | 5,312,500 | | |
IXYS Corp. | | | 1,009,506 | | | | 10,064,775 | | |
Kulicke & Soffa Industries, Inc.(a) | | | 1,200,000 | | | | 12,984,000 | | |
Micrel, Inc. | | | 917,732 | | | | 9,654,540 | | |
Rudolph Technologies, Inc.(a) | | | 508,100 | | | | 5,599,262 | | |
Total | | | | | 61,348,877 | | |
Software 1.9% | |
Envivio, Inc.(a) | | | 800,000 | | | | 1,360,000 | | |
EPIQ Systems, Inc. | | | 800,000 | | | | 9,952,000 | | |
Mentor Graphics Corp.(a) | | | 871,847 | | | | 15,440,410 | | |
Total | | | | | 26,752,410 | | |
Total Information Technology | | | | | 180,919,853 | | |
Materials 7.3% | |
Chemicals 0.7% | |
OM Group, Inc.(a) | | | 425,000 | | | | 10,429,500 | | |
Containers & Packaging 0.9% | |
Boise, Inc. | | | 1,450,000 | | | | 12,455,500 | | |
Common Stocks (continued)
Issuer | | Shares | | Value ($) | |
Metals & Mining 1.6% | |
Metals U.S.A. Holdings Corp. | | | 750,000 | | | | 15,555,000 | | |
Worthington Industries, Inc. | | | 260,000 | | | | 7,368,400 | | |
Total | | | | | 22,923,400 | | |
Paper & Forest Products 4.1% | |
Boise Cascade Co.(a) | | | 381,081 | | | | 10,327,295 | | |
Clearwater Paper Corp.(a) | | | 290,000 | | | | 14,033,100 | | |
KapStone Paper and Packaging Corp. | | | 361,000 | | | | 9,617,040 | | |
Neenah Paper, Inc. | | | 449,213 | | | | 13,117,020 | | |
Schweitzer-Mauduit International, Inc. | | | 350,000 | | | | 12,897,500 | | |
Total | | | | | 59,991,955 | | |
Total Materials | | | | | 105,800,355 | | |
Utilities 4.6% | |
Electric Utilities 1.0% | |
UIL Holdings Corp. | | | 395,000 | | | | 15,468,200 | | |
Gas Utilities 2.4% | |
New Jersey Resources Corp. | | | 305,000 | | | | 13,590,800 | | |
South Jersey Industries, Inc. | | | 240,000 | | | | 13,233,600 | | |
Southwest Gas Corp. | | | 171,800 | | | | 7,782,540 | | |
Total | | | | | 34,606,940 | | |
Multi-Utilities 1.2% | |
Avista Corp. | | | 650,000 | | | | 17,023,500 | | |
Total Utilities | | | | | 67,098,640 | | |
Total Common Stocks
(Cost: $1,088,281,896) | | | | | 1,440,071,617 | | |
Money Market Funds 1.8%
Columbia Short-Term Cash Fund,
0.128%(b)(c) | | | 26,045,945 | | | | 26,045,945 | | |
Total Money Market Funds
(Cost: $26,045,945) | | | | | 26,045,945 | | |
Total Investments
(Cost: $1,114,327,841) | | | | | 1,466,117,562 | | |
Other Assets & Liabilities, Net | | | | | (11,399,805 | ) | |
Net Assets | | | | | 1,454,717,757 | | |
The accompanying Notes to Financial Statements are an integral part of this statement.
Annual Report 2013
9
Columbia Small Cap Value Fund II
Portfolio of Investments (continued)
February 28, 2013
Notes to Portfolio of Investments
(a) Non-income producing.
(b) As defined in the Investment Company Act of 1940, an affiliated company is one in which the Fund owns 5% or more of its outstanding voting securities, or a company which is under common ownership or control with the Fund. Holdings and transactions in these affiliated companies during the year ended February 28, 2013, are as follows:
Issuer | | Beginning
Cost ($) | | Purchase
Cost ($) | | Proceeds
From Sales ($) | | Realized
Gain/Loss ($) | | Ending
Cost ($) | | Dividend
Income ($) | | Value ($) | |
Columbia Short-Term
Cash Fund | | | 38,239,245 | | | | 541,846,027 | | | | (554,039,327 | ) | | | — | | | | 26,045,945 | | | | 46,288 | | | | 26,045,945 | | |
Houston Wire &
Cable Co.* | | | 14,482,596 | | | | — | | | | (5,304,275 | ) | | | (2,706,902 | ) | | | 6,471,419 | | | | 249,025 | | | | 5,893,833 | | |
Sterling Bancorp | | | 17,506,547 | | | | — | | | | (1,321,843 | ) | | | (118,393 | ) | | | 16,066,311 | | | | 582,962 | | | | 16,107,683 | | |
TMS International Corp. | | | 12,134,398 | | | | — | | | | (866,745 | ) | | | (131,528 | ) | | | 11,136,125 | | | | — | | | | 11,843,304 | | |
Tower International, Inc.* | | | 13,408,471 | | | | 329,743 | | | | (924,692 | ) | | | (178,395 | ) | | | 12,635,127 | | | | — | | | | 11,438,000 | | |
Total | | | 95,771,257 | | | | 542,175,770 | | | | (562,456,882 | ) | | | (3,135,218 | ) | | | 72,354,927 | | | | 878,275 | | | | 71,328,765 | | |
*At February 28, 2013, the Fund owned less than five percent of the company's outstanding voting shares.
(c) The rate shown is the seven-day current annualized yield at February 28, 2013.
Fair Value Measurements
Generally accepted accounting principles (GAAP) require disclosure regarding the inputs and valuation techniques used to measure fair value and any changes in valuation inputs or techniques. In addition, investments shall be disclosed by major category.
The Fund categorizes its fair value measurements according to a three-level hierarchy that maximizes the use of observable inputs and minimizes the use of unobservable inputs by prioritizing that the most observable input be used when available. Observable inputs are those that market participants would use in pricing an investment based on market data obtained from sources independent of the reporting entity. Unobservable inputs are those that reflect the Fund's assumptions about the information market participants would use in pricing an investment. An investment's level within the fair value hierarchy is based on the lowest level of any input that is deemed significant to the asset or liability's fair value measurement. The input levels are not necessarily an indication of the risk or liquidity associated with investments at that level. For example, certain U.S. government securities are generally high quality and liquid, however, they are reflected as Level 2 because the inputs used to determine fair value may not always be quoted prices in an active market.
Fair value inputs are summarized in the three broad levels listed below:
> Level 1 — Valuations based on quoted prices for investments in active markets that the Fund has the ability to access at the measurement date (including NAV for open-end mutual funds). Valuation adjustments are not applied to Level 1 investments.
> Level 2 — Valuations based on other significant observable inputs (including quoted prices for similar securities, interest rates, prepayment speeds, credit risks, etc.).
> Level 3 — Valuations based on significant unobservable inputs (including the Fund's own assumptions and judgment in determining the fair value of investments).
Inputs that are used in determining fair value of an investment may include price information, credit data, volatility statistics, and other factors. These inputs can be either observable or unobservable. The availability of observable inputs can vary between investments, and is affected by various factors such as the type of investment, and the volume and level of activity for that investment or similar investments in the marketplace. The inputs will be considered by the Investment Manager, along with any other relevant factors in the calculation of an investment's fair value. The Fund uses prices and inputs that are current as of the measurement date, which may include periods of market dislocations. During these periods, the availability of prices and inputs may be reduced for many investments. This condition could cause an investment to be reclassified between the various levels within the hierarchy.
Investments falling into the Level 3 category are primarily supported by quoted prices from brokers and dealers participating in the market for those investments. However, these may be classified as Level 3 investments due to lack of market transparency and corroboration to support these quoted prices. Additionally, valuation models may be used as the pricing source for any remaining investments classified as Level 3. These models rely on one or more significant unobservable inputs and/or significant assumptions by the Investment Manager. Inputs used in valuations may include, but are not limited to, financial statement analysis, capital account balances, discount rates and estimated cash flows, and comparable company data.
The accompanying Notes to Financial Statements are an integral part of this statement.
Annual Report 2013
10
Columbia Small Cap Value Fund II
Portfolio of Investments (continued)
February 28, 2013
Fair Value Measurements (continued)
Under the direction of the Fund's Board of Trustees (the Board), the Investment Manager's Valuation Committee (the Committee) is responsible for carrying out the valuation procedures approved by the Board. The Committee consists of voting and non-voting members from various groups within the Investment Manager's organization, including operations and accounting, trading and investments, compliance, risk management and legal.
The Committee meets at least monthly to review and approve valuation matters, which may include a description of specific valuation determinations, data regarding pricing information received from approved pricing vendors and brokers and the results of Board-approved valuation control policies and procedures (the Policies). The Policies address, among other things, instances when market quotations are readily available, including recommendations of third party pricing vendors and a determination of appropriate pricing methodologies; events that require specific valuation determinations and assessment of fair value techniques; securities with a potential for stale pricing, including those that are illiquid, restricted, or in default; and the effectiveness of third-party pricing vendors, including periodic reviews of vendors. The Committee meets more frequently, as needed, to discuss additional valuation matters, which may include the need to review back-testing results, review time-sensitive information or approve related valuation actions. The Committee reports to the Board, with members of the Committee meeting with the Board at each of its regularly scheduled meetings to discuss valuation matters and actions during the period, similar to those described earlier.
For investments categorized as Level 3, the Committee monitors information similar to that described above, which may include: (i) data specific to the issuer or comparable issuers, (ii) general market or specific sector news and (iii) quoted prices and specific or similar security transactions. The Committee considers this data and any changes from prior periods in order to assess the reasonableness of observable and unobservable inputs, any assumptions or internal models used to value those securities and changes in fair value. This data is also used to corroborate, when available, information received from approved pricing vendors and brokers. Various factors impact the frequency of monitoring this information (which may occur as often as daily). However, the Committee may determine that changes to inputs, assumptions and models are not required as a result of the monitoring procedures performed.
The following table is a summary of the inputs used to value the Fund's investments at February 28, 2013:
Description | | Level 1
Quoted Prices inActive
Markets for Identical
Assets ($) | | Level 2
Other Significant
Observable Inputs ($) | | Level 3
Significant
Unobservable Inputs ($) | | Total ($) | |
Equity Securities | |
Common Stocks | |
Consumer Discretionary | | | 124,606,166 | | | | — | | | | — | | | | 124,606,166 | | |
Consumer Staples | | | 33,270,000 | | | | — | | | | — | | | | 33,270,000 | | |
Energy | | | 90,254,232 | | | | — | | | | — | | | | 90,254,232 | | |
Financials | | | 513,852,259 | | | | — | | | | — | | | | 513,852,259 | | |
Health Care | | | 102,100,080 | | | | — | | | | — | | | | 102,100,080 | | |
Industrials | | | 222,170,032 | | | | — | | | | — | | | | 222,170,032 | | |
Information Technology | | | 180,919,853 | | | | — | | | | — | | | | 180,919,853 | | |
Materials | | | 105,800,355 | | | | — | | | | — | | | | 105,800,355 | | |
Utilities | | | 67,098,640 | | | | — | | | | — | | | | 67,098,640 | | |
Total Equity Securities | | | 1,440,071,617 | | | | — | | | | — | | | | 1,440,071,617 | | |
Other | |
Money Market Funds | | | 26,045,945 | | | | — | | | | — | | | | 26,045,945 | | |
Total Other | | | 26,045,945 | | | | — | | | | — | | | | 26,045,945 | | |
Total | | | 1,466,117,562 | | | | — | | | | — | | | | 1,466,117,562 | | |
See the Portfolio of Investments for all investment classifications not indicated in the table.
There were no transfers of financial assets between Levels 1 and 2 during the period.
The accompanying Notes to Financial Statements are an integral part of this statement.
Annual Report 2013
11
Columbia Small Cap Value Fund II
Statement of Assets and Liabilities
February 28, 2013
Assets | |
Investments, at value | |
Unaffiliated issuers (identified cost $1,061,079,460) | | $ | 1,412,120,630 | | |
Affiliated issuers (identified cost $53,248,381) | | | 53,996,932 | | |
Total investments (identified cost $1,114,327,841) | | | 1,466,117,562 | | |
Receivable for: | |
Investments sold | | | 1,727,559 | | |
Capital shares sold | | | 1,890,430 | | |
Dividends | | | 1,825,625 | | |
Expense reimbursement due from Investment Manager | | | 1,619 | | |
Prepaid expenses | | | 4,634 | | |
Total assets | | | 1,471,567,429 | | |
Liabilities | |
Payable for: | |
Investments purchased | | | 6,211,433 | | |
Capital shares purchased | | | 10,075,121 | | |
Investment management fees | | | 29,779 | | |
Distribution and/or service fees | | | 2,464 | | |
Transfer agent fees | | | 296,440 | | |
Administration fees | | | 2,998 | | |
Compensation of board members | | | 67,919 | | |
Other expenses | | | 163,518 | | |
Total liabilities | | | 16,849,672 | | |
Net assets applicable to outstanding capital stock | | $ | 1,454,717,757 | | |
Represented by | |
Paid-in capital | | $ | 1,060,955,139 | | |
Undistributed net investment income | | | 927,915 | | |
Accumulated net realized gain | | | 41,044,982 | | |
Unrealized appreciation (depreciation) on: | |
Investments — unaffiliated issuers | | | 351,041,170 | | |
Investments — affiliated issuers | | | 748,551 | | |
Total — representing net assets applicable to outstanding capital stock | | $ | 1,454,717,757 | | |
The accompanying Notes to Financial Statements are an integral part of this statement.
Annual Report 2013
12
Columbia Small Cap Value Fund II
Statement of Assets and Liabilities (continued)
February 28, 2013
Class A | |
Net assets | | $ | 257,083,309 | | |
Shares outstanding | | | 15,995,559 | | |
Net asset value per share | | $ | 16.07 | | |
Maximum offering price per share(a) | | $ | 17.05 | | |
Class B | |
Net assets | | $ | 2,010,123 | | |
Shares outstanding | | | 132,105 | | |
Net asset value per share | | $ | 15.22 | | |
Class C | |
Net assets | | $ | 16,190,263 | | |
Shares outstanding | | | 1,064,815 | | |
Net asset value per share | | $ | 15.20 | | |
Class I | |
Net assets | | $ | 23,685,224 | | |
Shares outstanding | | | 1,462,104 | | |
Net asset value per share | | $ | 16.20 | | |
Class R | |
Net assets | | $ | 15,421,121 | | |
Shares outstanding | | | 964,886 | | |
Net asset value per share | | $ | 15.98 | | |
Class R4 | |
Net assets | | $ | 2,848 | | |
Shares outstanding | | | 173 | | |
Net asset value per share(b) | | $ | 16.42 | | |
Class R5 | |
Net assets | | $ | 2,849 | | |
Shares outstanding | | | 173 | | |
Net asset value per share(b) | | $ | 16.42 | | |
Class Y | |
Net assets | | $ | 2,848 | | |
Shares outstanding | | | 173 | | |
Net asset value per share(b) | | $ | 16.44 | | |
Class Z | |
Net assets | | $ | 1,140,319,172 | | |
Shares outstanding | | | 70,417,425 | | |
Net asset value per share | | $ | 16.19 | | |
(a) The maximum offering price per share is calculated by dividing the net asset value by 1.0 minus the maximum sales charge of 5.75%.
(b) Net asset value per share rounds to this amount due to fractional shares outstanding.
The accompanying Notes to Financial Statements are an integral part of this statement.
Annual Report 2013
13
Columbia Small Cap Value Fund II
Statement of Operations
Year Ended February 28, 2013
Net investment income | |
Income: | |
Dividends — unaffiliated issuers | | $ | 29,442,540 | | |
Dividends — affiliated issuers | | | 878,275 | | |
Income from securities lending — net | | | 870,731 | | |
Total income | | | 31,191,546 | | |
Expenses: | |
Investment management fees | | | 11,200,318 | | |
Distribution and/or service fees | |
Class A | | | 855,798 | | |
Class B | | | 20,296 | | |
Class C | | | 165,520 | | |
Class R | | | 87,050 | | |
Transfer agent fees | |
Class A | | | 774,195 | | |
Class B | | | 4,558 | | |
Class C | | | 37,132 | | |
Class R | | | 39,178 | | |
Class R4(a) | | | 2 | | |
Class Z | | | 2,471,494 | | |
Administration fees | | | 1,127,515 | | |
Compensation of board members | | | 48,750 | | |
Custodian fees | | | 12,598 | | |
Printing and postage fees | | | 279,280 | | |
Registration fees | | | 203,231 | | |
Professional fees | | | 31,950 | | |
Other | | | 52,247 | | |
Total expenses | | | 17,411,112 | | |
Fees waived or expenses reimbursed by Investment Manager and its affiliates | | | (355,517 | ) | |
Expense reductions | | | (140 | ) | |
Total net expenses | | | 17,055,455 | | |
Net investment income | | | 14,136,091 | | |
Realized and unrealized gain (loss) — net | |
Net realized gain (loss) on: | |
Investments — unaffiliated issuers | | | 199,580,342 | | |
Investments — affiliated issuers | | | (3,135,218 | ) | |
Net realized gain | | | 196,445,124 | | |
Net change in unrealized appreciation (depreciation) on: | |
Investments — unaffiliated issuers | | | (7,884,481 | ) | |
Investments — affiliated issuers | | | 578,897 | | |
Net change in unrealized appreciation (depreciation) | | | (7,305,584 | ) | |
Net realized and unrealized gain | | | 189,139,540 | | |
Net increase in net assets resulting from operations | | $ | 203,275,631 | | |
(a) Class R4 shares are for the period from November 8, 2012 (commencement of operations) to February 28, 2013.
The accompanying Notes to Financial Statements are an integral part of this statement.
Annual Report 2013
14
Columbia Small Cap Value Fund II
Statement of Changes in Net Assets
| | | Year ended
February 28,
2013(a) | | Year ended
February 29,
2012 | |
Operations | |
Net investment income | | $ | 14,136,091 | | | $ | 5,480,956 | | |
Net realized gain | | | 196,445,124 | | | | 90,655,128 | | |
Net change in unrealized appreciation (depreciation) | | | (7,305,584 | ) | | | (138,119,208 | ) | |
Net increase (decrease) in net assets resulting from operations | | | 203,275,631 | | | | (41,983,124 | ) | |
Distributions to shareholders | |
Net investment income | |
Class A | | | (2,349,976 | ) | | | (792,164 | ) | |
Class B | | | (3,255 | ) | | | — | | |
Class C | | | (26,606 | ) | | | — | | |
Class I | | | (274,717 | ) | | | (69,261 | ) | |
Class R | | | (89,079 | ) | | | — | | |
Class R4 | | | (25 | ) | | | — | | |
Class R5 | | | (26 | ) | | | — | | |
Class Y | | | (27 | ) | | | — | | |
Class Z | | | (10,764,552 | ) | | | (4,323,653 | ) | |
Net realized gains | |
Class A | | | (6,552,473 | ) | | | — | | |
Class B | | | (43,346 | ) | | | — | | |
Class C | | | (354,355 | ) | | | — | | |
Class I | | | (492,523 | ) | | | — | | |
Class R | | | (339,078 | ) | | | — | | |
Class R4 | | | (56 | ) | | | — | | |
Class R5 | | | (56 | ) | | | — | | |
Class Y | | | (56 | ) | | | — | | |
Class Z | | | (22,798,039 | ) | | | — | | |
Total distributions to shareholders | | | (44,088,245 | ) | | | (5,185,078 | ) | |
Increase (decrease) in net assets from capital stock activity | | | (514,033,494 | ) | | | (68,924,549 | ) | |
Total decrease in net assets | | | (354,846,108 | ) | | | (116,092,751 | ) | |
Net assets at beginning of year | | | 1,809,563,865 | | | | 1,925,656,616 | | |
Net assets at end of year | | $ | 1,454,717,757 | | | $ | 1,809,563,865 | | |
Undistributed net investment income | | $ | 927,915 | | | $ | 300,087 | | |
(a) Class R4, R5 and Y shares are for the period from November 8, 2012 (commencement of operations) to February 28, 2013.
The accompanying Notes to Financial Statements are an integral part of this statement.
Annual Report 2013
15
Columbia Small Cap Value Fund II
Statement of Changes in Net Assets (continued)
| | | Year Ended February 28, 2013(a) | | Year Ended February 29, 2012 | |
| | | Shares | | Dollars ($) | | Shares | | Dollars ($) | |
Capital stock activity | |
Class A shares | |
Subscriptions(b) | | | 3,741,070 | | | | 54,524,154 | | | | 13,451,845 | | | | 182,346,875 | | |
Distributions reinvested | | | 583,298 | | | | 8,323,395 | | | | 57,361 | | | | 741,676 | | |
Redemptions | | | (24,756,419 | ) | | | (363,919,210 | ) | | | (15,385,558 | ) | | | (208,855,941 | ) | |
Net decrease | | | (20,432,051 | ) | | | (301,071,661 | ) | | | (1,876,352 | ) | | | (25,767,390 | ) | |
Class B shares | |
Subscriptions | | | 364 | | | | 4,913 | | | | 223 | | | | 2,904 | | |
Distributions reinvested | | | 2,994 | | | | 40,513 | | | | — | | | | — | | |
Redemptions(b) | | | (41,852 | ) | | | (574,462 | ) | | | (49,002 | ) | | | (644,763 | ) | |
Net decrease | | | (38,494 | ) | | | (529,036 | ) | | | (48,779 | ) | | | (641,859 | ) | |
Class C shares | |
Subscriptions | | | 20,218 | | | | 278,710 | | | | 27,629 | | | | 365,594 | | |
Distributions reinvested | | | 21,899 | | | | 296,075 | | | | — | | | | — | | |
Redemptions | | | (306,004 | ) | | | (4,227,095 | ) | | | (354,210 | ) | | | (4,652,081 | ) | |
Net decrease | | | (263,887 | ) | | | (3,652,310 | ) | | | (326,581 | ) | | | (4,286,487 | ) | |
Class I shares | |
Subscriptions | | | 838,970 | | | | 12,463,105 | | | | 849,346 | | | | 12,388,439 | | |
Distributions reinvested | | | 53,408 | | | | 767,133 | | | | 5,322 | | | | 69,244 | | |
Redemptions | | | (259,202 | ) | | | (3,924,399 | ) | | | (2,002,637 | ) | | | (27,538,968 | ) | |
Net increase (decrease) | | | 633,176 | | | | 9,305,839 | | | | (1,147,969 | ) | | | (15,081,285 | ) | |
Class R shares | |
Subscriptions | | | 306,892 | | | | 4,422,283 | | | | 569,369 | | | | 7,806,518 | | |
Distributions reinvested | | | 28,949 | | | | 411,082 | | | | — | | | | — | | |
Redemptions | | | (769,184 | ) | | | (11,143,741 | ) | | | (1,037,533 | ) | | | (14,127,631 | ) | |
Net decrease | | | (433,343 | ) | | | (6,310,376 | ) | | | (468,164 | ) | | | (6,321,113 | ) | |
Class R4 shares | |
Subscriptions | | | 173 | | | | 2,500 | | | | — | | | | — | | |
Net increase | | | 173 | | | | 2,500 | | | | — | | | | — | | |
Class R5 shares | |
Subscriptions | | | 173 | | | | 2,500 | | | | — | | | | — | | |
Net increase | | | 173 | | | | 2,500 | | | | — | | | | — | | |
Class Y shares | |
Subscriptions | | | 173 | | | | 2,500 | | | | — | | | | — | | |
Net increase | | | 173 | | | | 2,500 | | | | — | | | | — | | |
Class Z shares | |
Subscriptions | | | 16,561,724 | | | | 243,481,776 | | | | 21,007,313 | | | | 290,129,852 | | |
Distributions reinvested | | | 1,806,437 | | | | 25,950,757 | | | | 237,550 | | | | 3,092,901 | | |
Redemptions | | | (32,609,372 | ) | | | (481,215,983 | ) | | | (22,438,284 | ) | | | (310,049,168 | ) | |
Net decrease | | | (14,241,211 | ) | | | (211,783,450 | ) | | | (1,193,421 | ) | | | (16,826,415 | ) | |
Total net decrease | | | (34,775,291 | ) | | | (514,033,494 | ) | | | (5,061,266 | ) | | | (68,924,549 | ) | |
(a) Class R4, R5 and Y shares are for the period from November 8, 2012 (commencement of operations) to February 28, 2013.
(b) Includes conversions of Class B shares to Class A shares, if any.
The accompanying Notes to Financial Statements are an integral part of this statement.
Annual Report 2013
16
Columbia Small Cap Value Fund II
The following tables are intended to help you understand the Fund's financial performance. Certain information reflects financial results for a single share of a class held for the periods shown. Per share net investment income (loss) amounts are calculated based on average shares outstanding during the period. Total return assumes reinvestment of all dividends and distributions, if any. Total return does not reflect payment of sales charges, if any, and is not annualized for periods of less than one year.
| | | Year Ended
February 28, | | Year Ended
February 29, | | Year Ended February 28, | |
Class A | | 2013 | | 2012 | | 2011 | | 2010 | | 2009 | |
Per share data | |
Net asset value, beginning of period | | $ | 14.44 | | | $ | 14.77 | | | $ | 11.05 | | | $ | 6.74 | | | $ | 12.21 | | |
Income from investment operations: | |
Net investment income | | | 0.11 | | | | 0.02 | | | | 0.00 | (a) | | | 0.04 | | | | 0.11 | | |
Net realized and unrealized gain (loss) | | | 1.96 | | | | (0.33 | ) | | | 3.74 | | | | 4.32 | | | | (5.47 | ) | |
Total from investment operations | | | 2.07 | | | | (0.31 | ) | | | 3.74 | | | | 4.36 | | | | (5.36 | ) | |
Less distributions to shareholders: | |
Net investment income | | | (0.12 | ) | | | (0.02 | ) | | | (0.02 | ) | | | (0.04 | ) | | | (0.11 | ) | |
Net realized gains | | | (0.32 | ) | | | — | | | | — | | | | — | | | | — | | |
Tax return of capital | | | — | | | | — | | | | — | | | | (0.01 | ) | | | — | | |
Total distributions to shareholders | | | (0.44 | ) | | | (0.02 | ) | | | (0.02 | ) | | | (0.05 | ) | | | (0.11 | ) | |
Net asset value, end of period | | $ | 16.07 | | | $ | 14.44 | | | $ | 14.77 | | | $ | 11.05 | | | $ | 6.74 | | |
Total return | | | 14.70 | % | | | (2.08 | %) | | | 33.89 | % | | | 64.73 | % | | | (44.03 | %) | |
Ratios to average net assets(b) | |
Total gross expenses | | | 1.33 | % | | | 1.37 | % | | | 1.36 | % | | | 1.32 | % | | | 1.28 | % | |
Total net expenses(c) | | | 1.31 | %(d) | | | 1.31 | %(d) | | | 1.35 | %(d) | | | 1.32 | %(d) | | | 1.28 | %(d) | |
Net investment income (loss) | | | 0.76 | % | | | 0.15 | % | | | (0.01 | %) | | | 0.44 | % | | | 1.05 | % | |
Supplemental data | |
Net assets, end of period (in thousands) | | $ | 257,083 | | | $ | 525,941 | | | $ | 565,730 | | | $ | 414,901 | | | $ | 235,871 | | |
Portfolio turnover | | | 42 | % | | | 41 | % | | | 60 | % | | | 70 | % | | | 56 | % | |
Notes to Financial Highlights
(a) Rounds to zero.
(b) In addition to the fees and expenses which the Fund bears directly, the Fund indirectly bears a pro rata share of the fees and expenses of the acquired funds in which it invests. Such indirect expenses are not included in the reported expense ratios.
(c) Total net expenses include the impact of certain waivers/reimbursements made by the Investment Manager and certain of its affiliates, if applicable.
(d) The benefits derived from expense reductions had an impact of less than 0.01%.
The accompanying Notes to Financial Statements are an integral part of this statement.
Annual Report 2013
17
Columbia Small Cap Value Fund II
Financial Highlights (continued)
| | | Year Ended
February 28, | | Year Ended
February 29, | | Year Ended February 28, | |
Class B | | 2013 | | 2012 | | 2011 | | 2010 | | 2009 | |
Per share data | |
Net asset value, beginning of period | | $ | 13.70 | | | $ | 14.10 | | | $ | 10.61 | | | $ | 6.49 | | | $ | 11.74 | | |
Income from investment operations: | |
Net investment income (loss) | | | 0.00 | (a) | | | (0.08 | ) | | | (0.09 | ) | | | (0.03 | ) | | | 0.03 | | |
Net realized and unrealized gain (loss) | | | 1.87 | | | | (0.32 | ) | | | 3.58 | | | | 4.15 | | | | (5.24 | ) | |
Total from investment operations | | | 1.87 | | | | (0.40 | ) | | | 3.49 | | | | 4.12 | | | | (5.21 | ) | |
Less distributions to shareholders: | |
Net investment income | | | (0.03 | ) | | | — | | | | — | | | | — | | | | (0.04 | ) | |
Net realized gains | | | (0.32 | ) | | | — | | | | — | | | | — | | | | — | | |
Total distributions to shareholders | | | (0.35 | ) | | | — | | | | — | | | | — | | | | (0.04 | ) | |
Net asset value, end of period | | $ | 15.22 | | | $ | 13.70 | | | $ | 14.10 | | | $ | 10.61 | | | $ | 6.49 | | |
Total return | | | 13.94 | % | | | (2.84 | %) | | | 32.89 | % | | | 63.48 | % | | | (44.46 | %) | |
Ratios to average net assets(b) | |
Total gross expenses | | | 2.08 | % | | | 2.10 | % | | | 2.11 | % | | | 2.07 | % | | | 2.03 | % | |
Total net expenses(c) | | | 2.06 | %(d) | | | 2.05 | %(d) | | | 2.10 | %(d) | | | 2.07 | %(d) | | | 2.03 | %(d) | |
Net investment income (loss) | | | 0.01 | % | | | (0.62 | %) | | | (0.77 | %) | | | (0.29 | %) | | | 0.29 | % | |
Supplemental data | |
Net assets, end of period (in thousands) | | $ | 2,010 | | | $ | 2,337 | | | $ | 3,093 | | | $ | 3,031 | | | $ | 2,373 | | |
Portfolio turnover | | | 42 | % | | | 41 | % | | | 60 | % | | | 70 | % | | | 56 | % | |
Notes to Financial Highlights
(a) Rounds to $0.00.
(b) In addition to the fees and expenses which the Fund bears directly, the Fund indirectly bears a pro rata share of the fees and expenses of the acquired funds in which it invests. Such indirect expenses are not included in the reported expense ratios.
(c) Total net expenses include the impact of certain waivers/reimbursements made by the Investment Manager and certain of its affiliates, if applicable.
(d) The benefits derived from expense reductions had an impact of less than 0.01%.
The accompanying Notes to Financial Statements are an integral part of this statement.
Annual Report 2013
18
Columbia Small Cap Value Fund II
Financial Highlights (continued)
| | | Year Ended
February 28, | | Year Ended
February 29, | | Year Ended February 28, | |
Class C | | 2013 | | 2012 | | 2011 | | 2010 | | 2009 | |
Per share data | |
Net asset value, beginning of period | | $ | 13.69 | | | $ | 14.09 | | | $ | 10.60 | | | $ | 6.49 | | | $ | 11.73 | | |
Income from investment operations: | |
Net investment income (loss) | | | (0.00 | )(a) | | | (0.08 | ) | | | (0.09 | ) | | | (0.02 | ) | | | 0.03 | | |
Net realized and unrealized gain (loss) | | | 1.86 | | | | (0.32 | ) | | | 3.58 | | | | 4.13 | | | | (5.23 | ) | |
Total from investment operations | | | 1.86 | | | | (0.40 | ) | | | 3.49 | | | | 4.11 | | | | (5.20 | ) | |
Less distributions to shareholders: | |
Net investment income | | | (0.03 | ) | | | — | | | | — | | | | — | | | | (0.04 | ) | |
Net realized gains | | | (0.32 | ) | | | — | | | | — | | | | — | | | | — | | |
Total distributions to shareholders | | | (0.35 | ) | | | — | | | | — | | | | — | | | | (0.04 | ) | |
Net asset value, end of period | | $ | 15.20 | | | $ | 13.69 | | | $ | 14.09 | | | $ | 10.60 | | | $ | 6.49 | | |
Total return | | | 13.87 | % | | | (2.84 | %) | | | 32.92 | % | | | 63.33 | % | | | (44.41 | %) | |
Ratios to average net assets(b) | |
Total gross expenses | | | 2.08 | % | | | 2.10 | % | | | 2.11 | % | | | 2.07 | % | | | 2.03 | % | |
Total net expenses(c) | | | 2.06 | %(d) | | | 2.06 | %(d) | | | 2.10 | %(d) | | | 2.07 | %(d) | | | 2.03 | %(d) | |
Net investment income (loss) | | | (0.00 | %)(e) | | | (0.62 | %) | | | (0.77 | %) | | | (0.27 | %) | | | 0.29 | % | |
Supplemental data | |
Net assets, end of period (in thousands) | | $ | 16,190 | | | $ | 18,191 | | | $ | 23,321 | | | $ | 23,588 | | | $ | 22,159 | | |
Portfolio turnover | | | 42 | % | | | 41 | % | | | 60 | % | | | 70 | % | | | 56 | % | |
Notes to Financial Highlights
(a) Rounds to $0.00.
(b) In addition to the fees and expenses which the Fund bears directly, the Fund indirectly bears a pro rata share of the fees and expenses of the acquired funds in which it invests. Such indirect expenses are not included in the reported expense ratios.
(c) Total net expenses include the impact of certain waivers/reimbursements made by the Investment Manager and certain of its affiliates, if applicable.
(d) The benefits derived from expense reductions had an impact of less than 0.01%.
(e) Rounds to 0.00%.
The accompanying Notes to Financial Statements are an integral part of this statement.
Annual Report 2013
19
Columbia Small Cap Value Fund II
Financial Highlights (continued)
Class I | | Year Ended
February 28,
2013 | | Year Ended
February 29,
2012 | | Year Ended
February 28,
2011(a) | |
Per share data | |
Net asset value, beginning of period | | $ | 14.54 | | | $ | 14.87 | | | $ | 11.72 | | |
Income from investment operations: | |
Net investment income (loss) | | | 0.17 | | | | 0.07 | | | | (0.01 | ) | |
Net realized and unrealized gain (loss) | | | 1.99 | | | | (0.32 | ) | | | 3.23 | | |
Total from investment operations | | | 2.16 | | | | (0.25 | ) | | | 3.22 | | |
Less distributions to shareholders: | |
Net investment income | | | (0.18 | ) | | | (0.08 | ) | | | (0.07 | ) | |
Net realized gains | | | (0.32 | ) | | | — | | | | — | | |
Total distributions to shareholders | | | (0.50 | ) | | | (0.08 | ) | | | (0.07 | ) | |
Net asset value, end of period | | $ | 16.20 | | | $ | 14.54 | | | $ | 14.87 | | |
Total return | | | 15.31 | % | | | (1.64 | %) | | | 27.55 | % | |
Ratios to average net assets(b) | |
Total gross expenses | | | 0.86 | % | | | 0.87 | % | | | 0.92 | %(c) | |
Total net expenses(d) | | | 0.86 | % | | | 0.87 | % | | | 0.92 | %(c)(e) | |
Net investment income (loss) | | | 1.18 | % | | | 0.52 | % | | | (0.12 | %)(c) | |
Supplemental data | |
Net assets, end of period (in thousands) | | $ | 23,685 | | | $ | 12,055 | | | $ | 29,390 | | |
Portfolio turnover | | | 42 | % | | | 41 | % | | | 60 | % | |
Notes to Financial Highlights
(a) For the period from September 27, 2010 (commencement of operations) to February 28, 2011.
(b) In addition to the fees and expenses which the Fund bears directly, the Fund indirectly bears a pro rata share of the fees and expenses of the acquired funds in which it invests. Such indirect expenses are not included in the reported expense ratios.
(c) Annualized.
(d) Total net expenses include the impact of certain waivers/reimbursements made by the Investment Manager and certain of its affiliates, if applicable.
(e) The benefits derived from expense reductions had an impact of less than 0.01%.
The accompanying Notes to Financial Statements are an integral part of this statement.
Annual Report 2013
20
Columbia Small Cap Value Fund II
Financial Highlights (continued)
| | | Year Ended
February 28, | | Year Ended
February 29, | | Year Ended February 28, | |
Class R | | 2013 | | 2012 | | 2011 | | 2010 | | 2009 | |
Per share data | |
Net asset value, beginning of period | | $ | 14.36 | | | $ | 14.71 | | | $ | 11.01 | | | $ | 6.72 | | | $ | 12.17 | | |
Income from investment operations: | |
Net investment income (loss) | | | 0.07 | | | | (0.02 | ) | | | (0.03 | ) | | | 0.02 | | | | 0.09 | | |
Net realized and unrealized gain (loss) | | | 1.96 | | | | (0.33 | ) | | | 3.73 | | | | 4.30 | | | | (5.45 | ) | |
Total from investment operations | | | 2.03 | | | | (0.35 | ) | | | 3.70 | | | | 4.32 | | | | (5.36 | ) | |
Less distributions to shareholders: | |
Net investment income | | | (0.09 | ) | | | — | | | | — | | | | (0.03 | ) | | | (0.09 | ) | |
Net realized gains | | | (0.32 | ) | | | — | | | | — | | | | — | | | | — | | |
Tax return of capital | | | — | | | | — | | | | — | | | | (0.00 | )(a) | | | — | | |
Total distributions to shareholders | | | (0.41 | ) | | | — | | | | — | | | | (0.03 | ) | | | (0.09 | ) | |
Net asset value, end of period | | $ | 15.98 | | | $ | 14.36 | | | $ | 14.71 | | | $ | 11.01 | | | $ | 6.72 | | |
Total return | | | 14.47 | % | | | (2.38 | %) | | | 33.61 | % | | | 64.32 | % | | | (44.18 | %) | |
Ratios to average net assets(b) | |
Total gross expenses | | | 1.58 | % | | | 1.60 | % | | | 1.61 | % | | | 1.57 | % | | | 1.53 | % | |
Total net expenses(c) | | | 1.56 | %(d) | | | 1.56 | %(d) | | | 1.60 | %(d) | | | 1.57 | %(d) | | | 1.53 | %(d) | |
Net investment income (loss) | | | 0.50 | % | | | (0.12 | %) | | | (0.26 | %) | | | 0.20 | % | | | 0.82 | % | |
Supplemental data | |
Net assets, end of period (in thousands) | | $ | 15,421 | | | $ | 20,081 | | | $ | 27,450 | | | $ | 22,755 | | | $ | 14,765 | | |
Portfolio turnover | | | 42 | % | | | 41 | % | | | 60 | % | | | 70 | % | | | 56 | % | |
Notes to Financial Highlights
(a) Rounds to zero.
(b) In addition to the fees and expenses which the Fund bears directly, the Fund indirectly bears a pro rata share of the fees and expenses of the acquired funds in which it invests. Such indirect expenses are not included in the reported expense ratios.
(c) Total net expenses include the impact of certain waivers/reimbursements made by the Investment Manager and certain of its affiliates, if applicable.
(d) The benefits derived from expense reductions had an impact of less than 0.01%.
The accompanying Notes to Financial Statements are an integral part of this statement.
Annual Report 2013
21
Columbia Small Cap Value Fund II
Financial Highlights (continued)
Class R4 | | Year Ended
February 28,
2013(a) | |
Per share data | |
Net asset value, beginning of period | | $ | 14.41 | | |
Income from investment operations: | |
Net investment income | | | 0.08 | | |
Net realized and unrealized gain | | | 2.40 | | |
Total from investment operations | | | 2.48 | | |
Less distributions to shareholders: | |
Net investment income | | | (0.15 | ) | |
Net realized gains | | | (0.32 | ) | |
Total distributions to shareholders | | | (0.47 | ) | |
Net asset value, end of period | | $ | 16.42 | | |
Total return | | | 17.60 | % | |
Ratios to average net assets(b) | |
Total gross expenses | | | 1.11 | %(c) | |
Total net expenses(d) | | | 1.06 | %(c) | |
Net investment income | | | 1.73 | %(c) | |
Supplemental data | |
Net assets, end of period (in thousands) | | $ | 3 | | |
Portfolio turnover | | | 42 | % | |
Notes to Financial Highlights
(a) For the period from November 8, 2012 (commencement of operations) to February 28, 2013.
(b) In addition to the fees and expenses which the Fund bears directly, the Fund indirectly bears a pro rata share of the fees and expenses of the acquired funds in which it invests. Such indirect expenses are not included in the reported expense ratios.
(c) Annualized.
(d) Total net expenses include the impact of certain waivers/reimbursements made by the Investment Manager and certain of its affiliates, if applicable.
The accompanying Notes to Financial Statements are an integral part of this statement.
Annual Report 2013
22
Columbia Small Cap Value Fund II
Financial Highlights (continued)
Class R5 | | Year Ended
February 28,
2013(a) | |
Per share data | |
Net asset value, beginning of period | | $ | 14.41 | | |
Income from investment operations: | |
Net investment income | | | 0.09 | | |
Net realized and unrealized gain | | | 2.39 | | |
Total from investment operations | | | 2.48 | | |
Less distributions to shareholders: | |
Net investment income | | | (0.15 | ) | |
Net realized gains | | | (0.32 | ) | |
Total distributions to shareholders | | | (0.47 | ) | |
Net asset value, end of period | | $ | 16.42 | | |
Total return | | | 17.63 | % | |
Ratios to average net assets(b) | |
Total gross expenses | | | 0.92 | %(c) | |
Total net expenses(d) | | | 0.92 | %(c) | |
Net investment income | | | 1.87 | %(c) | |
Supplemental data | |
Net assets, end of period (in thousands) | | $ | 3 | | |
Portfolio turnover | | | 42 | % | |
Notes to Financial Highlights
(a) For the period from November 8, 2012 (commencement of operations) to February 28, 2013.
(b) In addition to the fees and expenses which the Fund bears directly, the Fund indirectly bears a pro rata share of the fees and expenses of the acquired funds in which it invests. Such indirect expenses are not included in the reported expense ratios.
(c) Annualized.
(d) Total net expenses include the impact of certain waivers/reimbursements made by the Investment Manager and certain of its affiliates, if applicable.
The accompanying Notes to Financial Statements are an integral part of this statement.
Annual Report 2013
23
Columbia Small Cap Value Fund II
Financial Highlights (continued)
Class Y | | Year Ended
February 28,
2013(a) | |
Per share data | |
Net asset value, beginning of period | | $ | 14.43 | | |
Income from investment operations: | |
Net investment income | | | 0.09 | | |
Net realized and unrealized gain | | | 2.40 | | |
Total from investment operations | | | 2.49 | | |
Less distributions to shareholders: | |
Net investment income | | | (0.16 | ) | |
Net realized gains | | | (0.32 | ) | |
Total distributions to shareholders | | | (0.48 | ) | |
Net asset value, end of period | | $ | 16.44 | | |
Total return | | | 17.66 | % | |
Ratios to average net assets(b) | |
Total gross expenses | | | 0.87 | %(c) | |
Total net expenses(d) | | | 0.87 | %(c) | |
Net investment income | | | 1.92 | %(c) | |
Supplemental data | |
Net assets, end of period (in thousands) | | $ | 3 | | |
Portfolio turnover | | | 42 | % | |
Notes to Financial Highlights
(a) For the period from November 8, 2012 (commencement of operations) to February 28, 2013.
(b) In addition to the fees and expenses which the Fund bears directly, the Fund indirectly bears a pro rata share of the fees and expenses of the acquired funds in which it invests. Such indirect expenses are not included in the reported expense ratios.
(c) Annualized.
(d) Total net expenses include the impact of certain waivers/reimbursements made by the Investment Manager and certain of its affiliates, if applicable.
The accompanying Notes to Financial Statements are an integral part of this statement.
Annual Report 2013
24
Columbia Small Cap Value Fund II
Financial Highlights (continued)
| | | Year Ended
February 28, | | Year Ended
February 29, | | Year Ended February 28, | |
Class Z | | 2013 | | 2012 | | 2011 | | 2010 | | 2009 | |
Per share data | |
Net asset value, beginning of period | | $ | 14.54 | | | $ | 14.87 | | | $ | 11.11 | | | $ | 6.78 | | | $ | 12.29 | | |
Income from investment operations: | |
Net investment income | | | 0.15 | | | | 0.05 | | | | 0.03 | | | | 0.07 | | | | 0.14 | | |
Net realized and unrealized gain (loss) | | | 1.97 | | | | (0.33 | ) | | | 3.78 | | | | 4.33 | | | | (5.51 | ) | |
Total from investment operations | | | 2.12 | | | | (0.28 | ) | | | 3.81 | | | | 4.40 | | | | (5.37 | ) | |
Less distributions to shareholders: | |
Net investment income | | | (0.15 | ) | | | (0.05 | ) | | | (0.05 | ) | | | (0.06 | ) | | | (0.14 | ) | |
Net realized gains | | | (0.32 | ) | | | — | | | | — | | | | — | | | | — | | |
Tax return of capital | | | — | | | | — | | | | — | | | | (0.01 | ) | | | — | | |
Total distributions to shareholders | | | (0.47 | ) | | | (0.05 | ) | | | (0.05 | ) | | | (0.07 | ) | | | (0.14 | ) | |
Net asset value, end of period | | $ | 16.19 | | | $ | 14.54 | | | $ | 14.87 | | | $ | 11.11 | | | $ | 6.78 | | |
Total return | | | 15.02 | % | | | (1.84 | %) | | | 34.31 | % | | | 64.94 | % | | | (43.87 | %) | |
Ratios to average net assets(a) | |
Total gross expenses | | | 1.08 | % | | | 1.11 | % | | | 1.11 | % | | | 1.07 | % | | | 1.03 | % | |
Total net expenses(b) | | | 1.06 | %(c) | | | 1.06 | %(c) | | | 1.10 | %(c) | | | 1.07 | %(c) | | | 1.03 | %(c) | |
Net investment income | | | 1.01 | % | | | 0.40 | % | | | 0.23 | % | | | 0.68 | % | | | 1.33 | % | |
Supplemental data | |
Net assets, end of period (in thousands) | | $ | 1,140,319 | | | $ | 1,230,960 | | | $ | 1,276,673 | | | $ | 951,951 | | | $ | 540,951 | | |
Portfolio turnover | | | 42 | % | | | 41 | % | | | 60 | % | | | 70 | % | | | 56 | % | |
Notes to Financial Highlights
(a) In addition to the fees and expenses which the Fund bears directly, the Fund indirectly bears a pro rata share of the fees and expenses of the acquired funds in which it invests. Such indirect expenses are not included in the reported expense ratios.
(b) Total net expenses include the impact of certain waivers/reimbursements made by the Investment Manager and certain of its affiliates, if applicable.
(c) The benefits derived from expense reductions had an impact of less than 0.01%.
The accompanying Notes to Financial Statements are an integral part of this statement.
Annual Report 2013
25
Columbia Small Cap Value Fund II
Notes to Financial Statements
February 28, 2013
Note 1. Organization
Columbia Small Cap Value Fund II (the Fund), a series of Columbia Funds Series Trust (the Trust), is a diversified fund. The Trust is registered under the Investment Company Act of 1940, as amended (the 1940 Act), as an open-end management investment company organized as a Delaware statutory trust.
Fund Shares
The Trust may issue an unlimited number of shares (without par value). The Fund offers Class A, Class B, Class C, Class I, Class R, Class R4, Class R5, Class Y and Class Z shares. All share classes have identical voting, dividend and liquidation rights. Each share class has its own expense structure and sales charges, as applicable.
Class A shares are subject to a maximum front-end sales charge of 5.75% based on the initial investment amount. Class A shares purchased without an initial sales charge in accounts aggregating $1 million to $50 million at the time of purchase are subject to a contingent deferred sales charge (CDSC) if the shares are sold within 18 months of purchase, charged as follows: 1.00% CDSC if redeemed within 12 months of purchase, and 0.50% CDSC if redeemed more than 12, but less than 18, months after purchase.
Class B shares may be subject to a maximum CDSC of 5.00% based upon the holding period after purchase. Class B shares will generally convert to Class A shares eight years after purchase. The Fund no longer accepts investments by new or existing investors in the Fund's Class B shares, except in connection with the reinvestment of any dividend and/or capital gain distributions in Class B shares of the Fund and exchanges by existing Class B shareholders of certain other funds within the Columbia Family of Funds.
Class C shares are subject to a 1.00% CDSC on shares redeemed within one year of purchase.
Class I shares are not subject to sales charges and are only available to the Columbia Family of Funds.
Class R shares are not subject to sales charges and are only available to qualifying institutional investors.
Class R4 shares are not subject to sales charges and are only available to investors purchasing through authorized investment professionals. Class R4 shares commenced operations on November 8, 2012.
Class R5 shares are not subject to sales charges and are only available to investors purchasing through authorized investment professionals. Class R5 shares commenced operations on November 8, 2012.
Class Y shares are not subject to sales charges and are only available to certain categories of investors which are subject to
minimum initial investment requirements. Class Y shares commenced operations on November 8, 2012.
Class Z shares are not subject to sales charges, and are only available to certain investors.
Note 2. Summary of Significant Accounting Policies
Use of Estimates
The preparation of financial statements in accordance with U.S. generally accepted accounting principles (GAAP) requires management to make certain estimates and assumptions that affect the reported amounts of assets and liabilities, the disclosure of contingent assets and liabilities at the date of the financial statements and the reported amounts of revenue and expenses during the reporting period. Actual results could differ from those estimates.
The following is a summary of significant accounting policies consistently followed by the Fund in the preparation of its financial statements.
Security Valuation
All equity securities are valued at the close of business of the New York Stock Exchange (NYSE). Equity securities are valued at the last quoted sales price on the principal exchange or market on which they trade, except for securities traded on the NASDAQ Stock Market, which are valued at the NASDAQ official close price. Unlisted securities or listed securities for which there were no sales during the day are valued at the mean of the latest quoted bid and ask prices on such exchanges or markets.
Foreign securities are valued based on quotations from the principal market in which such securities are normally traded. If any foreign share prices are not readily available as a result of limited share activity the securities are valued at the mean of the latest quoted bid and ask prices on such exchanges or markets. Foreign currency exchange rates are generally determined at 4:00 p.m. Eastern (U.S.) time. However, many securities markets and exchanges outside the U.S. close prior to the close of the NYSE; therefore, the closing prices for securities in such markets or on such exchanges may not fully reflect events that occur after such close but before the close of the NYSE. In those situations, foreign securities will be fair valued pursuant to the policy adopted by the Board of Trustees (the Board), including utilizing a third party pricing service to determine these fair values. The third party pricing service takes into account multiple factors, including, but not limited to, movements in the U.S. securities markets, certain depositary receipts, futures contracts and foreign exchange rates that have occurred subsequent to the close of the foreign exchange or market, to determine a good faith estimate that
Annual Report 2013
26
Columbia Small Cap Value Fund II
Notes to Financial Statements (continued)
February 28, 2013
reasonably reflects the current market conditions as of the close of the NYSE. The fair value of a security is likely to be different from the quoted or published price, if available.
Investments in other open-end investment companies, including money market funds, are valued at net asset value.
Investments for which market quotations are not readily available, or that have quotations which management believes are not reliable, are valued at fair value as determined in good faith under consistently applied procedures established by and under the general supervision of the Board. If a security or class of securities (such as foreign securities) is valued at fair value, such value is likely to be different from the last quoted market price for the security.
The determination of fair value often requires significant judgment. To determine fair value, management may use assumptions including but not limited to future cash flows and estimated risk premiums. Multiple inputs from various sources may be used to determine fair value.
Foreign Currency Transactions and Translations
The values of all assets and liabilities denominated in foreign currencies are translated into U.S. dollars at that day's exchange rates. Net realized and unrealized gains (losses) on foreign currency transactions and translations include gains (losses) arising from the fluctuation in exchange rates between trade and settlement dates on securities transactions, gains (losses) arising from the disposition of foreign currency and currency gains (losses) between the accrual and payment dates on dividends, interest income and foreign withholding taxes.
For financial statement purposes, the Fund does not distinguish that portion of gains (losses) on investments which is due to changes in foreign exchange rates from that which is due to changes in market prices of the investments. Such fluctuations are included with the net realized and unrealized gains (losses) on investments in the Statement of Operations.
Security Transactions
Security transactions are accounted for on the trade date. Cost is determined and gains (losses) are based upon the specific identification method for both financial statement and federal income tax purposes.
Income Recognition
Corporate actions and dividend income are recorded net of any non-reclaimable tax withholdings, on the ex-dividend date or upon receipt of ex-dividend notification in the case of certain foreign securities.
The Fund may receive distributions from holdings in business development companies (BDCs), exchange traded funds (ETFs) and real estate investment trusts (REITs), which report
information on the character of their distributions annually. These distributions are allocated to dividend income, capital gain and return of capital based on estimates made by the Fund's management if actual information has not yet been reported. Return of capital is recorded as a reduction of the cost basis of securities held. If the Fund no longer owns the applicable securities, return of capital is recorded as a realized gain. Management's estimates are subsequently adjusted when the actual character of the distributions is disclosed by the BDCs, ETFs and REITs, which could result in a proportionate change in return of capital to shareholders.
Awards from class action litigation are recorded as a reduction of cost basis if the Fund still owns the applicable securities on the payment date. If the Fund no longer owns the applicable securities, the proceeds are recorded as realized gains.
Expenses
General expenses of the Trust are allocated to the Fund and other funds of the Trust based upon relative net assets or other expense allocation methodologies determined by the nature of the expense. Expenses directly attributable to the Fund are charged to the Fund. Expenses directly attributable to a specific class of shares are charged to that share class.
Determination of Class Net Asset Value
All income, expenses (other than class-specific expenses, which are charged to that share class, as shown in the Statement of Operations) and realized and unrealized gains (losses) are allocated to each class of the Fund on a daily basis, based on the relative net assets of each class, for purposes of determining the net asset value of each class.
Federal Income Tax Status
The Fund intends to qualify each year as a regulated investment company under Subchapter M of the Internal Revenue Code, as amended, and will distribute substantially all of its tax exempt and taxable income (including net short-term capital gains), if any, for its tax year, and as such will not be subject to federal income taxes. In addition, the Fund intends to distribute in each calendar year substantially all of its net investment income, capital gains and certain other amounts, if any, such that the Fund should not be subject to federal excise tax. Therefore, no federal income or excise tax provision is recorded.
Distributions to Shareholders
Distributions from net investment income, if any, are declared and paid semi-annually. Net realized capital gains, if any, are distributed at least annually. Income distributions and capital gain distributions are determined in accordance with federal income tax regulations, which may differ from GAAP.
Annual Report 2013
27
Columbia Small Cap Value Fund II
Notes to Financial Statements (continued)
February 28, 2013
Guarantees and Indemnifications
Under the Trust's organizational documents and, in some cases, by contract, its officers and trustees are indemnified against certain liabilities arising out of the performance of their duties to the Trust or its funds. In addition, certain of the Fund's contracts with its service providers contain general indemnification clauses. The Fund's maximum exposure under these arrangements is unknown since the amount of any future claims that may be made against the Fund cannot be determined, and the Fund has no historical basis for predicting the likelihood of any such claims.
Recent Accounting Pronouncement
Disclosures about Offsetting Assets and Liabilities
In December 2011, the Financial Accounting Standards Board (FASB) issued Accounting Standards Update (ASU) No. 2011-11, Disclosures about Offsetting Assets and Liabilities. The objective of the FASB is to enhance current disclosure requirements on offsetting of certain assets and liabilities and to enable financial statement users to compare financial statements prepared under GAAP and International Financial Reporting Standards.
Specifically, ASU No. 2011-11 requires an entity to disclose both gross and net information for derivatives and other financial instruments that are subject to a master netting arrangement or similar agreement. The standard requires disclosure of collateral received in connection with the master netting agreements or similar agreements. The effective date of ASU No. 2011-11 is for interim and annual periods beginning on or after January 1, 2013. At this time, management is evaluating the implications of this guidance and the impact it will have on the financial statement amounts and footnote disclosures, if any.
Note 3. Fees and Compensation Paid to Affiliates
Investment Management Fees
Under an Investment Management Services Agreement, Columbia Management Investment Advisers, LLC (the Investment Manager), a wholly-owned subsidiary of Ameriprise Financial, Inc. (Ameriprise Financial), determines which securities will be purchased, held or sold. The investment management fee is an annual fee that is equal to a percentage of the Fund's average daily net assets that declines from 0.79% to 0.70% as the Fund's net assets increase. The annualized effective investment management fee rate for the year ended February 28, 2013 was 0.74% of the Fund's average daily net assets.
Administration Fees
Under an Administrative Services Agreement, the Investment Manager also serves as the Fund Administrator. The Fund pays the Fund Administrator an annual fee for administration and accounting services equal to a percentage of the Fund's average daily net assets that declines from 0.08% to 0.05% as the Fund's net assets increase. The annualized effective administration fee rate for the year ended February 28, 2013 was 0.07% of the Fund's average daily net assets.
Other Expenses
Other expenses are for, among other things, certain expenses of the Fund or the Board, including: Fund boardroom and office expense, employee compensation, employee health and retirement benefits, and certain other expenses. Payment of these Fund and Board expenses is facilitated by a company providing limited administrative services to the Fund and the Board. For the year ended February 28, 2013, other expenses paid to this company were $5,123.
Compensation of Board Members
Board members are compensated for their services to the Fund as disclosed in the Statement of Operations. Under a Deferred Compensation Plan (the Plan), the Board members who are not "interested persons" of the Fund, as defined under the 1940 Act, may elect to defer payment of up to 100% of their compensation. Deferred amounts are treated as though equivalent dollar amounts had been invested in shares of certain funds managed by the Investment Manager. The Fund's liability for these amounts is adjusted for market value changes and remains in the Fund until distributed in accordance with the Plan.
Transfer Agent Fees
Under a Transfer and Dividend Disbursing Agent Agreement, Columbia Management Investment Services Corp. (the Transfer Agent), an affiliate of the Investment Manager and a wholly-owned subsidiary of Ameriprise Financial, is responsible for providing transfer agency services to the Fund. The Transfer Agent has contracted with Boston Financial Data Services (BFDS) to serve as sub-transfer agent.
The Transfer Agent receives monthly account-based service fees based on the number of open accounts and is reimbursed by the Fund for the fees and expenses the Transfer Agent pays to financial intermediaries that maintain omnibus accounts with the Fund that is a percentage of the average aggregate value of the Fund's shares maintained in each such omnibus account (other than omnibus accounts for which American Enterprise Investment Services Inc. is the broker of record or accounts where the beneficial shareholder is a customer of Ameriprise Financial Services, Inc., which are paid a per
Annual Report 2013
28
Columbia Small Cap Value Fund II
Notes to Financial Statements (continued)
February 28, 2013
account fee). The Transfer Agent pays the fees of BFDS for services as sub-transfer agent and is not entitled to reimbursement for such fees from the Fund (with the exception of out-of-pocket fees).
The Transfer Agent also receives compensation from fees for various shareholder services and reimbursements for certain out-of-pocket fees. Class I shares do not pay transfer agent fees. Total transfer agent fees for Class R5 shares are subject to an annual limitation of not more than 0.05% of the average daily net assets attributable to Class R5 shares. Effective November 8, 2012, Class Y shares will not pay transfer agent fees for at least twelve months.
For the year ended February 28, 2013, the Fund's effective transfer agent fee rates as a percentage of average daily net assets of each class were as follows:
Class A | | | 0.23 | % | |
Class B | | | 0.22 | | |
Class C | | | 0.22 | | |
Class R | | | 0.22 | | |
Class R4* | | | 0.24 | | |
Class R5* | | | 0.05 | | |
Class Z | | | 0.22 | | |
*Annualized
An annual minimum account balance fee of $20 may apply to certain accounts with a value below the Fund's initial minimum investment requirements to reduce the impact of small accounts on transfer agent fees. These minimum account balance fees are recorded as part of expense reductions in the Statement of Operations. For the year ended February 28, 2013, these minimum account balance fees reduced total expenses by $140.
Distribution and Service Fees
The Fund has an agreement with Columbia Management Investment Distributors, Inc. (the Distributor), an affiliate of the Investment Manager and a wholly-owned subsidiary of Ameriprise Financial, for distribution and shareholder services. Pursuant to Rule 12b-1 under the 1940 Act, the Board has approved, and the Fund has adopted, distribution and shareholder service plans (the Plans) which set the distribution and service fees for the Fund. These fees are calculated daily and are intended to compensate the Distributor and/or eligible selling and/or servicing agents for selling shares of the Fund and providing services to investors.
The Plans require the payment of a monthly combined distribution and service fee to the Distributor at the maximum annual rate of 0.25% of the average daily net assets attributable to Class A shares of the Fund. The Plans also require the payment of a monthly service fee at the maximum
annual rate of 0.25% of the average daily net assets attributable to Class B and Class C shares of the Fund and the payment of a monthly distribution fee at the maximum annual rates of 0.75%, 0.75% and 0.50% of the average daily net assets attributable to Class B, Class C and Class R shares, respectively.
Sales Charges
Sales charges, including front-end charges and CDSCs, received by the Distributor for distributing Fund shares were $2,787 for Class A, $4,515 for Class B and $105 for Class C shares for the year ended February 28, 2013.
Expenses Waived/Reimbursed by the Investment Manager and its Affiliates
Effective April 23, 2012, the Investment Manager and certain of its affiliates have contractually agreed to waive fees and/or reimburse expenses (excluding certain fees and expenses described below), through June 30, 2014, unless sooner terminated at the sole discretion of the Board, so that the Fund's net operating expenses, after giving effect to fees waived/expenses reimbursed and any balance credits and/or overdraft charges from the Fund's custodian, do not exceed the following annual rates as a percentage of the class' average daily net assets:
Class A | | | 1.31 | % | |
Class B | | | 2.06 | | |
Class C | | | 2.06 | | |
Class I | | | 0.98 | | |
Class R | | | 1.56 | | |
Class R4 | | | 1.06 | | |
Class R5 | | | 1.03 | | |
Class Y | | | 0.98 | | |
Class Z | | | 1.06 | | |
Prior to April 23, 2012, the Investment Manager and certain of its affiliates contractually agreed to waive fees and/or reimburse expenses (excluding certain fees and expenses described below), so that the Fund's net operating expenses, after giving effect to fees waived/expenses reimbursed and any balance credits and/or overdraft charges from the Fund's custodian, did not exceed the following annual rates as a percentage of the class' average daily net assets:
Class A | | | 1.31 | % | |
Class B | | | 2.06 | | |
Class C | | | 2.06 | | |
Class I | | | 0.90 | | |
Class R | | | 1.56 | | |
Class Z | | | 1.06 | | |
Annual Report 2013
29
Columbia Small Cap Value Fund II
Notes to Financial Statements (continued)
February 28, 2013
Under the agreement, the following fees and expenses are excluded from the waiver/reimbursement commitment, and therefore will be paid by the Fund, if applicable: taxes (including foreign transaction taxes), expenses associated with investments in affiliated and non-affiliated pooled investment vehicles (including mutual funds and exchange traded funds), transaction costs and brokerage commissions, costs related to any securities lending program, dividend expenses associated with securities sold short, inverse floater program fees and expenses, transaction charges and interest on borrowed money, interest, extraordinary expenses and any other expenses the exclusion of which is specifically approved by the Board. This agreement may be modified or amended only with approval from all parties.
Note 4. Federal Tax Information
The timing and character of income and capital gain distributions are determined in accordance with income tax regulations, which may differ from GAAP because of temporary or permanent book to tax differences.
At February 28, 2013, these differences are primarily due to differing treatment for: deferral/reversal of wash sale losses, Trustees' deferred compensation, and reversal of capital gains (losses) on a redemption-in-kind. To the extent these differences are permanent, reclassifications are made among the components of the Fund's net assets in the Statement of Assets and Liabilities. Temporary differences do not require reclassifications. In the Statement of Assets and Liabilities the following reclassifications were made:
Accumulated net realized gain | | $ | (24,653,586 | ) | |
Paid-in capital | | | 24,653,586 | | |
Net investment income and net realized gains (losses), as disclosed in the Statement of Operations, and net assets were not affected by this reclassification.
The tax character of distributions paid during the years indicated was as follows:
| | | Year Ended
February 28,
2013 | | Year Ended
February 29,
2012 | |
Ordinary income | | $ | 13,508,263 | | | $ | 5,185,078 | | |
Long-term capital gains | | | 30,579,982 | | | | — | | |
Total | | $ | 44,088,245 | | | $ | 5,185,078 | | |
Short-term capital gain distributions, if any, are considered ordinary income distributions for tax purposes.
At February 28, 2013, the components of distributable earnings on a tax basis were as follows:
Undistributed ordinary income | | $ | 995,184 | | |
Undistributed accumulated long-term capital gain | | | 43,849,077 | | |
Unrealized appreciation | | | 348,985,625 | | |
At February 28, 2013, the cost of investments for federal income tax purposes was $1,117,131,937 and the aggregate gross unrealized appreciation and depreciation based on that cost was:
Unrealized appreciation | | $ | 384,670,918 | | |
Unrealized depreciation | | | (35,685,293 | ) | |
Net unrealized appreciation | | $ | 348,985,625 | | |
For the year ended February 28, 2013, $91,084,175 of capital loss carryforward was utilized.
Management of the Fund has concluded that there are no significant uncertain tax positions that would require recognition in the financial statements. However, management's conclusion may be subject to review and adjustment at a later date based on factors including, but not limited to, new tax laws, regulations, and administrative interpretations (including relevant court decisions). Generally, the Fund's federal tax returns for the prior three fiscal years remain subject to examination by the Internal Revenue Service.
Note 5. Portfolio Information
The cost of purchases and proceeds from sales of securities, excluding short-term obligations, aggregated to $622,773,827 and $1,161,300,825, respectively, for the year ended February 28, 2013.
Note 6. Redemption-in-Kind
Sales of securities for the Fund include the value of securities delivered through an in-kind redemption of certain fund shares. During the year ended February 28, 2013, securities and other assets with a value of $137,428,434 were distributed to shareholders to satisfy their redemption requests. The net realized gain on these securities was $25,040,667, which is not taxable to remaining shareholders in the Fund.
Note 7. Lending of Portfolio Securities
Effective December 19, 2012, the Fund no longer participates in securities lending activity. Prior to that date, the Fund participated, or was eligible to participate, in securities lending activity pursuant to a Master Securities Lending Agreement (the Agreement) with JPMorgan Chase Bank, N.A. (JPMorgan). The Agreement authorized JPMorgan as lending agent to lend securities to authorized borrowers in order to generate additional income on behalf of the Fund. Pursuant to
Annual Report 2013
30
Columbia Small Cap Value Fund II
Notes to Financial Statements (continued)
February 28, 2013
the Agreement, the securities loaned were secured by cash or securities that either were issued or guaranteed as to principal and interest by the U.S. government, its agencies, authorities or instrumentalities with value equal to at least 100% of the market value of the loaned securities. Any additional collateral required to maintain those levels due to market fluctuations of the loaned securities was requested to be delivered the following business day. Cash collateral received was invested by the lending agent on behalf of the Fund into authorized investments pursuant to the Agreement.
Pursuant to the Agreement, the Fund received income for lending its securities either in the form of fees or by earning interest on invested cash collateral, net of negotiated rebates paid to borrowers and fees paid to the lending agent for services provided and any other securities lending expenses. Net income earned from securities lending for the year ended February 28, 2013 is disclosed in the Statement of Operations. The Fund continued to earn and accrue interest and dividends on the securities loaned.
Note 8. Affiliated Money Market Fund
The Fund invests its daily cash balances in Columbia Short-Term Cash Fund, an affiliated money market fund established for the exclusive use by the Fund and other affiliated funds. The income earned by the Fund from such investments is included as "Dividends — affiliated issuers" in the Statement of Operations. As an investing fund, the Fund indirectly bears its proportionate share of the expenses of Columbia Short-Term Cash Fund.
Note 9. Shareholder Concentration
At February 28, 2013, three unaffiliated shareholder accounts owned an aggregate of 47.2% of the outstanding shares of the Fund. The Fund has no knowledge about whether any portion of those shares was owned beneficially by such accounts.
Note 10. Line of Credit
The Fund has entered into a revolving credit facility with a syndicate of banks led by JPMorgan whereby the Fund may borrow for the temporary funding of shareholder redemptions or for other temporary or emergency purposes. The credit facility agreement, as amended, which is a collective agreement between the Fund and certain other funds managed by the Investment Manager, severally and not jointly, permits collective borrowings up to $500 million. Interest is charged to each participating fund based on its borrowings at a rate equal to the higher of (i) the overnight federal funds rate plus 1.00% or (ii) the one-month LIBOR rate plus 1.00%. Each borrowing under the credit facility matures no later than 60 days after the date of borrowing. The Fund also pays a commitment fee equal to its pro rata share of the amount of the credit facility at a rate of 0.08% per annum.
The Fund had no borrowings during the year ended February 28, 2013.
Note 11. Financial Sector Risk
The Fund's portfolio managers may invest significantly in issuers operating in the financial sector. The Fund may be more susceptible to the particular risks of this sector than if the Fund were invested in a wider variety of issuers operating in unrelated sectors.
Note 12. Subsequent Events
Management has evaluated the events and transactions that have occurred through the date the financial statements were issued and noted no items requiring adjustment of the financial statements or additional disclosure.
Note 13. Information Regarding Pending and Settled Legal Proceedings
In December 2005, without admitting or denying the allegations, American Express Financial Corporation (AEFC, which is now known as Ameriprise Financial, Inc. (Ameriprise Financial)) entered into settlement agreements with the Securities and Exchange Commission (SEC) and Minnesota Department of Commerce (MDOC) related to market timing activities. As a result, AEFC was censured and ordered to cease and desist from committing or causing any violations of certain provisions of the Investment Advisers Act of 1940, the Investment Company Act of 1940, and various Minnesota laws. AEFC agreed to pay disgorgement of $10 million and civil money penalties of $7 million. AEFC also agreed to retain an independent distribution consultant to assist in developing a plan for distribution of all disgorgement and civil penalties ordered by the SEC in accordance with various undertakings detailed at www.sec.gov/litigation/admin/ia-2451.pdf. Ameriprise Financial and its affiliates have cooperated with the SEC and the MDOC in these legal proceedings, and have made regular reports to the funds' Boards of Trustees.
Ameriprise Financial and certain of its affiliates have historically been involved in a number of legal, arbitration and regulatory proceedings, including routine litigation, class actions, and governmental actions, concerning matters arising in connection with the conduct of their business activities. Ameriprise Financial believes that the Funds are not currently the subject of, and that neither Ameriprise Financial nor any of its affiliates are the subject of, any pending legal, arbitration or regulatory proceedings that are likely to have a material adverse effect on the Funds or the ability of Ameriprise Financial or its affiliates to perform under their contracts with the Funds. Ameriprise Financial is required to make 10-Q, 10-K and, as necessary, 8-K filings with the Securities and Exchange Commission on legal and regulatory matters that relate to
Annual Report 2013
31
Columbia Small Cap Value Fund II
Notes to Financial Statements (continued)
February 28, 2013
Ameriprise Financial and its affiliates. Copies of these filings may be obtained by accessing the SEC website at www.sec.gov.
There can be no assurance that these matters, or the adverse publicity associated with them, will not result in increased fund redemptions, reduced sale of fund shares or other adverse consequences to the Funds. Further, although we believe proceedings are not likely to have a material adverse effect on the Funds or the ability of Ameriprise Financial or its affiliates to perform under their contracts with the Funds, these proceedings are subject to uncertainties and, as such, we are unable to estimate the possible loss or range of loss that may result. An adverse outcome in one or more of these proceedings could result in adverse judgments, settlements, fines, penalties or other relief that could have a material adverse effect on the consolidated financial condition or results of operations of Ameriprise Financial.
Annual Report 2013
32
Columbia Small Cap Value Fund II
Report of Independent Registered Public Accounting Firm
To the Trustees of Columbia Funds Series Trust and
the Shareholders of Columbia Small Cap Value Fund II
In our opinion, the accompanying statement of assets and liabilities, including the portfolio of investments, and the related statements of operations and of changes in net assets and the financial highlights present fairly, in all material respects, the financial position of Columbia Small Cap Value Fund II (the "Fund") (a series of Columbia Funds Series Trust) at February 28, 2013, the results of its operations for the year then ended, the changes in its net assets for each of the two years in the period then ended and the financial highlights for each of the periods indicated, in conformity with accounting principles generally accepted in the United States of America. These financial statements and financial highlights (hereafter referred to as "financial statements") are the responsibility of the Fund's management. Our responsibility is to express an opinion on these financial statements based on our audits. We conducted our audits of these financial statements in accordance with the standards of the Public Company Accounting Oversight Board (United States). Those standards require that we plan and perform the audit to obtain reasonable assurance about whether the financial statements are free of material misstatement. An audit includes examining, on a test basis, evidence supporting the amounts and disclosures in the financial statements, assessing the accounting principles used and significant estimates made by management, and evaluating the overall financial statement presentation. We believe that our audits, which included confirmation of securities at February 28, 2013 by correspondence with the custodian, transfer agent and brokers, provide a reasonable basis for our opinion.
PricewaterhouseCoopers LLP
Minneapolis, Minnesota
April 19, 2013
Annual Report 2013
33
Columbia Small Cap Value Fund II
Federal Income Tax Information
(Unaudited)
The Fund hereby designates the following tax attributes for the fiscal year ended February 28, 2013. Shareholders will be notified in early 2014 of the amounts for use in preparing 2013 income tax returns.
Tax Designations:
| Qualified Dividend Income | | | 100.00 | % | |
| Dividends Received Deduction | | | 100.00 | % | |
Capital Gain Dividend | | $ | 78,150,512 | | |
Qualified Dividend Income. For taxable, non-corporate shareholders, the percentage of ordinary income dividends paid during the fiscal year that represents qualified dividend income subject to reduced tax rates under the Jobs and Growth Tax Relief Reconciliation Act of 2003.
Dividends Received Deduction. The percentage of ordinary income dividends paid during the fiscal year that qualifies for the corporate dividends received deduction.
Capital Gain Dividend. The Fund designates as a capital gain dividend the amount reflected above, or if subsequently determined to be different, the net capital gain of such fiscal period. The Fund also designates as capital gain dividends, to the extent necessary to fully distribute such capital gains, earnings and profits distributed to shareholders on the redemption of shares.
Annual Report 2013
34
Columbia Small Cap Value Fund II
Shareholders elect the Board that oversees the funds' operations. The Board appoints officers who are responsible for day-to-day business decisions based on policies set by the Board. The following table provides basic biographical information about the funds' Board members, including their principal occupations during the past five years, although specific titles for individuals may have varied over the period. Under current Board policy, members may serve until the next Board meeting after he or she reaches the mandatory retirement age established by the Board, or the fifteenth anniversary of the first Board meeting they attended as a member of the Board.
Mr. Edward J. Boudreau, Jr., Mr. William P. Carmichael, Mr. William A. Hawkins, Mr. R. Glenn Hilliard, Ms. Minor M. Shaw and Dr. Anthony M. Santomero, were members of the Legacy Columbia Nations funds' Board ("Nations Funds"), which includes Columbia Funds Series Trust, Columbia Funds Variable Insurance Trust I and Columbia Funds Master Investment Trust, LLC and began service on the Board for the Legacy RiverSource funds ("RiverSource Funds") effective June 1, 2011.
Independent Trustees
Name,
Address,
Year of Birth | | Position Held With
Funds and Length of
Service | | Principal Occupation
During Past Five Years | | Number of
Funds in the
Fund Family
Overseen by
Board Member | | Other Present or Past
Directorships/Trusteeships
(Within Past 5 Years) | |
Kathleen Blatz
901 S. Marquette Ave.
Minneapolis, MN 55402
1954 | | Board member since 1/06 for RiverSource Funds and since 6/11 for Nations Funds | | Attorney; Chief Justice, Minnesota Supreme Court, 1998-2006 | | | 153 | | | Director, BlueCross BlueShield of Minnesota since 2009 | |
Edward J. Boudreau, Jr.
901 S. Marquette Ave.
Minneapolis, MN 55402
1944 | | Board member since 6/11 for RiverSource Funds and since 1/05 for Nations Funds | | Managing Director, E.J. Boudreau & Associates (consulting) since 2000 | | | 151 | | | Former Trustee, BofA Funds Series Trust (11 funds) | |
Pamela G. Carlton
901 S. Marquette Ave.
Minneapolis, MN 55402
1954 | | Board member since 7/07 for RiverSource Funds and since 6/11 for Nations Funds | | President, Springboard — Partners in Cross Cultural Leadership (consulting company) since 2003 | | | 153 | | | None | |
William P. Carmichael
901 S. Marquette Ave.
Minneapolis, MN 55402
1943 | | Board member since 6/11 for RiverSource Funds and since 1999 for Nations Funds | | Retired | | | 151 | | | Director, Cobra Electronics Corporation (electronic equipment manufacturer); The Finish Line (athletic shoes and apparel) since July 2003; McMoRan Exploration Company (oil and gas exploration and development) since 2010; former Trustee, BofA Funds Series Trust (11 funds); former Director, Spectrum Brands, Inc. (consumer products); former Director, Simmons Company (bedding) | |
Patricia M. Flynn
901 S. Marquette Ave.
Minneapolis, MN 55402
1950 | | Board member since 11/04 for RiverSource Funds and since 6/11 for Nations Funds | | Trustee Professor of Economics and Management, Bentley University since 1976 | | | 153 | | | None | |
William A. Hawkins
901 S. Marquette Ave.
Minneapolis, MN 55402
1942 | | Board member since 6/11 for RiverSource Funds and since 1/05 for Nations Funds | | Managing Director, Overton Partners (financial consulting), since August 2010; President and Chief Executive Officer, California General Bank, N.A., January 2008-August 2010 | | | 151 | | | Trustee, BofA Funds Series Trust (11 funds) | |
Annual Report 2013
35
Columbia Small Cap Value Fund II
Trustees and Officers (continued)
Independent Trustees (continued)
Name,
Address,
Year of Birth | | Position Held With
Funds and Length of
Service | | Principal Occupation
During Past Five Years | | Number of
Funds in the
Fund Family
Overseen by
Board Member | | Other Present or Past
Directorships/Trusteeships
(Within Past 5 Years) | |
R. Glenn Hilliard
901 S. Marquette Ave.
Minneapolis, MN 55402
1943 | | Board member since 6/11 for RiverSource Funds and since 1/05 for Nations Funds | | Chairman and Chief Executive Officer, Hilliard Group LLC (investing and consulting), since April 2003; Non-Executive Director & Chairman, CNO Financial Group, Inc. (insurance), September 2003-May 2011 | | | 151 | | | Chairman, BofA Fund Series Trust (11 funds); former Director, CNO Financial Group, Inc. (insurance) | |
Stephen R. Lewis, Jr.
901 S. Marquette Ave.
Minneapolis, MN 55402
1939 | | Chair of the Board for RiverSource Funds since 1/07, Board member for RiverSource Funds since 1/02 and since 6/11 for Nations Funds | | President Emeritus and Professor of Economics Emeritus, Carleton College since 2002 | | | 153 | | | Director, Valmont Industries, Inc. (manufacturer of irrigation systems) since 2002 | |
Catherine James Paglia
901 S. Marquette Ave.
Minneapolis, MN 55402
1952 | | Board member since 11/04 for RiverSource Funds and since 6/11 for Nations Funds | | Director, Enterprise Asset Management, Inc. (private real estate and asset management company) | | | 153 | | | Director, Valmont Industries, Inc. (manufacturer of irrigation systems) since 2012 | |
Leroy C. Richie
901 S. Marquette Ave.
Minneapolis, MN 55402
1941 | | Board member since 2000 for Legacy Seligman Funds, since 11/08 for RiverSource Funds and since 6/11 for Nations Funds | | Counsel, Lewis & Munday, P.C. (law firm) since 2004; former Vice President and General Counsel, Automotive Legal Affairs, Chrysler Corporation from 1983-1987 | | | 153 | | | Lead Outside Director, Digital Ally, Inc. (digital imaging) since September 2005; Director, Infinity, Inc. (oil and gas exploration and production) since 1994; Director, OGE Energy Corp. (energy and energy services) since November 2007 | |
Minor M. Shaw
901 S. Marquette Ave.
Minneapolis, MN 55402
1947 | | Board member since 6/11 for RiverSource Funds and since 2003 for Nations Funds | | President, Micco LLC (private investments) since 2011; President Micco Corp. since 1998 | | | 151 | | | Director, Piedmont Natural Gas; Director, BlueCross BlueShield of South Carolina since April 2008; Former Trustee, BofA Funds Series Trust (11 funds) | |
Alison Taunton-Rigby
901 S. Marquette Ave.
Minneapolis, MN 55402
1944 | | Board member since 11/02 for RiverSource Funds and since 6/11 for Nations Funds | | Chief Executive Officer and Director, RiboNovix, Inc. (biotechnology), 2003-2010 | | | 153 | | | Director, Healthways, Inc. (health and well-being improvement) since 2005; Director, ICI Mutual Insurance Company, RRG since 2011; Director, Abt Associates (government contractor) since 2001; Director, Boston Children's Hospital since 2002 | |
Annual Report 2013
36
Columbia Small Cap Value Fund II
Trustees and Officers (continued)
Interested Trustee Not Affiliated With Investment Manager*
Name,
Address,
Year of Birth | | Position Held With
Funds and Length of
Service | | Principal Occupation
During Past Five Years | | Number of
Funds in the
Fund Family
Overseen by
Board Member | | Other Present or Past
Directorships/Trusteeships
(Within Past 5 Years) | |
Anthony M. Santomero
901 S. Marquette Ave.
Minneapolis, MN 55402
1946 | | Board member since 6/11 for RiverSource Funds and since 1/08 for Nations Funds | | Richard K. Mellon Professor Emeritus of Finance, The Wharton School, University of Pennsylvania, since 2002; Senior Advisor, McKinsey & Company (consulting), 2006-2008 | | | 151 | | | Director, Renaissance Reinsurance Ltd. since May 2008; Trustee, Penn Mutual Life Insurance Company since March 2008; Director, Citigroup since 2009; Director, Citibank, N.A. since 2009; former Trustee, BofA Funds Series Trust (11 funds) | |
*Dr. Santomero is not an affiliated person of the investment manager or Ameriprise Financial. However, he is currently deemed by the funds to be an "interested person" (as defined in the 1940 Act) of the funds because he serves as a Director of Citigroup, Inc. and Citibank N.A., companies that may directly or through subsidiaries and affiliates engage from time-to-time in brokerage execution, principal transactions and lending relationships with the funds or accounts advised/managed by the investment manager.
Interested Trustee Affiliated With Investment Manager*
Name,
Address,
Year of Birth | | Position Held With
Funds and Length of
Service | | Principal Occupation
During Past Five Years | | Number of
Funds in the
Fund Family
Overseen by
Board Member | | Other Present or Past
Directorships/Trusteeships
(Within Past 5 Years) | |
William F. Truscott
53600 Ameriprise
Financial Center
Minneapolis, MN 55474
1960 | | Board member since 11/01 for RiverSource Funds and since 6/11 for Nations Funds; Senior Vice President since 2002 for RiverSource Funds and 5/10 for Nations Funds | | President, Columbia Management Investment Advisers, LLC since February 2012, (previously President, Chairman of the Board and Chief Investment Officer, 2001-April 2010); Chief Executive Officer, Global Asset Management, Ameriprise Financial, Inc. since September 2012 (previously Chief Executive Officer, U.S. Asset Management & President, Annuities, May 2010-September 2012 and President — U.S. Asset Management and Chief Investment Officer, 2005-April 2010); Chief Executive Officer, Columbia Management Investment Distributors, Inc. since February 2012, (previously Chairman of the Board and Chief Executive Officer, 2006-April 2010); Chairman of the Board and Chief Executive Officer, RiverSource Distributors, Inc. since 2006; President and Chief Executive Officer, Ameriprise Certificate Company 2006-August 2012 | | | 210 | | | Chairman of the Board, Columbia Management Investment Advisers, LLC since May 2010; Director, Columbia Management Investment Distributors, Inc. since May 2010; Director, Ameriprise Certificate Company, 2006-January 2013 | |
*Interested person (as defined under the 1940 Act) by reason of being an officer, director, security holder and/or employee of the investment manager or Ameriprise Financial.
The SAI has additional information about the Fund's Board members and is available, without charge, upon request by calling 800.345.6611; contacting your financial intermediary; or visiting columbiamanagement.com.
Annual Report 2013
37
Columbia Small Cap Value Fund II
Trustees and Officers (continued)
The Board has appointed officers who are responsible for day-to-day business decisions based on policies it has established. The officers serve at the pleasure of the Board. In addition to Mr. Truscott, who is Senior Vice President, the funds' other officers are:
Officers
Name,
Address,
Year of Birth | | Position Held With
Funds and Length of
Service | | Principal Occupation During Past Five Years | |
J. Kevin Connaughton
225 Franklin Street
Boston, MA 02110
1964 | | President and Principal Executive Officer since 5/10 for RiverSource Funds and 2009 for Nations Funds | | Senior Vice President and General Manager — Mutual Fund Products, Columbia Management Investment Advisers, LLC since May 2010; Managing Director of Columbia Management Advisors, LLC, December 2004-April 2010; Senior Vice President and Chief Financial Officer, Columbia Funds, June 2008-January 2009; Treasurer, Columbia Funds, October 2003-May 2008 | |
Amy K. Johnson
5228 Ameriprise Financial Center Minneapolis, MN 55474
1965 | | Vice President since 12/06 for RiverSource Funds and 5/10 for Nations Funds | | Senior Vice President and Chief Operating Officer, Columbia Management Investment Advisers, LLC since May 2010 (previously Chief Administrative Officer, 2009-April 2010 and Vice President — Asset Management and Trust Company Services, 2006-2009) | |
Michael G. Clarke
225 Franklin Street
Boston, MA 02110
1969 | | Treasurer since 1/11 and Chief Financial Officer since 4/11 for RiverSource Funds and Treasurer since 3/11 and Chief Financial Officer since 2009 for Nations Funds | | Vice President, Columbia Management Investment Advisers, LLC since May 2010; Managing Director of Fund Administration, Columbia Management Advisors, LLC, September 2004-April 2010; senior officer of Columbia Funds and affiliated funds since 2002 | |
Scott R. Plummer
5228 Ameriprise Financial Center Minneapolis, MN 55474
1959 | | Senior Vice President and Chief Legal Officer since 12/06 and Assistant Secretary since 6/11 for RiverSource Funds and Senior Vice President and Chief Legal Officer since 5/10 and Assistant Secretary since 6/11 for Nations Funds | | Senior Vice President, Chief Legal Officer and Assistant Secretary, Columbia Management Investment Advisers, LLC since June 2005; Vice President and Lead Chief Counsel — Asset Management, Ameriprise Financial, Inc. since May 2010 (previously Vice President and Chief Counsel — Asset Management, 2005-April 2010); Vice President, Chief Counsel and Assistant Secretary, Columbia Management Investment Distributors, Inc. since 2008; Vice President, General Counsel and Secretary, Ameriprise Certificate Company since 2005; Chief Counsel, RiverSource Distributors, Inc. since 2006 | |
Colin Moore
225 Franklin Street
Boston, MA 02110
1958 | | Senior Vice President since 5/10 for RiverSource Funds and Nations Funds | | Director and Chief Investment Officer, Columbia Management Investment Advisers, LLC since May 2010; Manager, Managing Director and Chief Investment Officer, Columbia Management Advisors, LLC, 2007-April 2010 | |
Thomas P. McGuire
225 Franklin Street
Boston, MA 02110
1972 | | Chief Compliance Officer since 3/12 | | Vice President — Asset Management Compliance, Columbia Management Investment Advisers, LLC since 2010; Chief Compliance Officer, Ameriprise Certificate Company since September 2010; Compliance Executive, Bank of America, 2005-2010 | |
Stephen T. Welsh
225 Franklin Street
Boston, MA 02110
1957 | | Vice President since 4/11 for RiverSource Funds and 2006 for Nations Funds | | President and Director, Columbia Management Investment Services Corp. since May 2010; President and Director, Columbia Management Services, Inc., July 2004- April 2010; Managing Director, Columbia Management Distributors, Inc., August 2007-April 2010 | |
Christopher O. Petersen
5228 Ameriprise Financial Center Minneapolis, MN 55474
1970 | | Vice President and Secretary since 4/11 for RiverSource Funds and 3/11 for Nations Funds | | Vice President and Chief Counsel, Ameriprise Financial, Inc. since January 2010 (formerly Vice President and Group Counsel or Counsel, April 2004-January 2010); Assistant Secretary of Legacy RiverSource Funds, January 2007-April 2011 and of the Nations Funds, May 2010-March 2011 | |
Annual Report 2013
38
Columbia Small Cap Value Fund II
Trustees and Officers (continued)
Officers (continued)
Name,
Address,
Year of Birth | | Position Held With
Funds and Length of
Service | | Principal Occupation During Past Five Years | |
Paul D. Pearson
10468 Ameriprise Financial Center Minneapolis, MN 55474
1956 | | Vice President since 4/11 and Assistant Treasurer since 1999 for RiverSource Funds and Vice President and Assistant Treasurer since 6/11 for Nations Funds | | Vice President — Investment Accounting, Columbia Management Investment Advisers, LLC, since May 2010; Vice President — Managed Assets, Investment Accounting, Ameriprise Financial Corporation, February 1998-May 2010 | |
Joseph F. DiMaria
225 Franklin Street
Boston, MA 02110
1968 | | Vice President and Chief Accounting Officer since 4/11 and Vice President since 3/11 and Chief Accounting Officer since 2008 for Nations Funds | | Vice President, Mutual Fund Administration, Columbia Management Investment Advisers, LLC, since May 2010; Director of Fund Administration, Columbia Management Advisors, LLC, January 2006-April 2010 | |
Paul B. Goucher
100 Park Avenue
New York, NY 10017
1968 | | Vice President since 4/11 and Assistant Secretary since 11/08 for RiverSource Funds and 5/10 for Nations Funds | | Vice President and Lead Chief Counsel, Ameriprise Financial, Inc. since November 2008 and January 2013, respectively (formerly, Chief Counsel, January 2010-January 2013 and Group Counsel from November 2008- January 2010); Director, Managing Director and General Counsel, J. & W. Seligman & Co. Incorporated, July 2008-November 2008 (previously, Managing Director and Associate General Counsel, January 2005-July 2008) | |
Michael E. DeFao
225 Franklin Street
Boston, MA 02110
1968 | | Vice President since 4/11 and Assistant Secretary since 5/10 for RiverSource Funds and 2011 for Nations Funds | | Vice President and Chief Counsel, Ameriprise Financial, Inc. since May 2010; Associate General Counsel, Bank of America, June 2005-April 2010 | |
Annual Report 2013
39
This page intentionally left blank.
Annual Report 2013
40
Columbia Small Cap Value Fund II
Important Information About This Report
Each fund mails one shareholder report to each shareholder address. If you would like more than one report, please call shareholder services at 800.345.6611 and additional reports will be sent to you.
The policy of the Board is to vote the proxies of the companies in which each fund holds investments consistent with the procedures as stated in the Statement of Additional Information (SAI). You may obtain a copy of the SAI without charge by calling 800.345.6611; contacting your financial intermediary; visiting columbiamanagement.com; or searching the website of the Securities and Exchange Commission (SEC) at sec.gov. Information regarding how each fund voted proxies relating to portfolio securities is filed with the SEC by August 31 for the most recent 12-month period ending June 30 of that year, and is available without charge by visiting columbiamanagement.com; or searching the website of the SEC at sec.gov.
Each fund files a complete schedule of portfolio holdings with the SEC for the first and third quarters of each fiscal year on Form N-Q. Each fund's Form N-Q is available on the SEC's website at sec.gov and may be reviewed and copied at the SEC's Public Reference Room in Washington, D.C. Information on the operation of the Public Reference Room may be obtained by calling 800.SEC.0330. Each fund's complete schedule of portfolio holdings, as filed on Form N-Q, can also be obtained without charge, upon request, by calling 800.345.6611.
Annual Report 2013
41

Columbia Small Cap Value Fund II
P.O. Box 8081
Boston, MA 02266-8081
columbiamanagement.com
This information is for use with concurrent or prior delivery of a fund prospectus. Please read and consider the investment objectives, risks, charges and expenses for any fund carefully before investing. For a prospectus which contains this and other important information about the Fund go to columbiamanagement.com. The Fund is distributed by Columbia Management Investment Distributors, Inc., member FINRA, and managed by Columbia Management Investment Advisers, LLC.
© 2013 Columbia Management Investment Advisers, LLC. All rights reserved.
ANN230_02_C01_(04/13)
Annual Report
February 28, 2013

Columbia Marsico International Opportunities Fund
Not FDIC insured • No bank guarantee • May lose value
Columbia Marsico International Opportunities Fund
 Dear Shareholders,
U.S. stocks flat, foreign markets strong in 2012 finale
After a strong third quarter, U.S. stock market averages treaded water as the year 2012 came to a close. However, they ended the year up strongly, as first- and third-quarter gains more than offset second- and fourth-quarter weakness. Typically a strong quarter for domestic small- and mid-cap issues, the fourth quarter of 2012 indeed proved to be another year-end positive for small-cap stocks. For the full calendar year 2012, the S&P 500 Index rose 16.00%.
Stock markets outside the United States generated some of the best returns for the fourth quarter, as optimism rebounded, thanks to the September actions of the European Central Bank in support of the euro and an improving outlook from China. Both developed and emerging foreign markets topped U.S. stocks by a solid margin.
Corporate and emerging markets led fixed income
Fixed-income investors took their cue from the equity markets and continued to favor the highest risk sectors through the end of 2012. Global fixed-income returns posted mixed results in the final quarter of the year. Gains were the highest for corporate high-yield and emerging market bonds. Although investors remained cautious ahead of the year-end budget negotiations, better economic data and a further improvement in the European sovereign debt crisis supported riskier assets and depressed government bond prices. In December, the Federal Reserve announced its intention to continue to purchase both Treasury and mortgage-backed securities and said that it would seek to keep short-term interest rates unchanged until the unemployment rate reaches 6.5%, or inflation turned noticeably higher.
Stay on track with Columbia Management
Backed by more than 100 years of experience, Columbia Management is one of the nation's largest asset managers. At the heart of our success — and, most importantly, that of our investors — are highly talented industry professionals, brought together by a unique way of working. We are dedicated to helping you take advantage of today's opportunities and anticipate tomorrow's. We stay abreast of the latest investment trends and ideas, using our collective insight to evaluate events and transform them into solutions you can use.
Visit columbiamanagement.com for:
> The Columbia Management Perspectives blog, featuring timely posts by our investment teams
> Detailed up-to-date fund performance and portfolio information
> Economic analysis and market commentary
> Quarterly fund commentaries
> Columbia Management Investor, our award-winning quarterly newsletter for shareholders
Thank you for your continued support of the Columbia Funds. We look forward to serving your investment needs for many years to come.
Best Regards,

J. Kevin Connaughton
President, Columbia Funds
The S&P 500 Index, an unmanaged index, measures the performance of 500 widely held, large-capitalization U.S. stocks and is frequently used as a general measure of market performance. Indices are not available for investment, are not professionally managed and do not reflect sales charges, fees, brokerage commissions, taxes or other expenses of investing.
Investors should consider the investment objectives, risks, charges and expenses of a mutual fund carefully before investing. For a free prospectus, which contains this and other important information about a fund, visit columbiamanagement.com. The prospectus should be read carefully before investing.
Columbia Funds are distributed by Columbia Management Investment Distributors, Inc., member FINRA, and managed by Columbia Management Investment Advisers, LLC.
© 2013 Columbia Management Investment Advisers, LLC. All rights reserved.
Columbia Marsico International Opportunities Fund
Performance Overview | | | 2 | | |
Manager Discussion of Fund Performance | | | 4 | | |
Understanding Your Fund's Expenses | | | 7 | | |
Portfolio of Investments | | | 8 | | |
Statement of Assets and Liabilities | | | 12 | | |
Statement of Operations | | | 14 | | |
Statement of Changes in Net Assets | | | 15 | | |
Financial Highlights | | | 17 | | |
Notes to Financial Statements | | | 24 | | |
Report of Independent Registered
Public Accounting Firm | | | 31 | | |
Federal Income Tax Information | | | 32 | | |
Trustees and Officers | | | 33 | | |
Important Information About This Report | | | 41 | | |
Fund Investment Manager
Columbia Management Investment
Advisers, LLC
225 Franklin Street
Boston, MA 02110
Fund Distributor
Columbia Management Investment
Distributors, Inc.
225 Franklin Street
Boston, MA 02110
Fund Transfer Agent
Columbia Management Investment
Services Corp.
P.O. Box 8081
Boston, MA 02266-8081
For more information about any of the funds, please visit columbiamanagement.com or call 800.345.6611. Customer Service Representatives are available to answer your questions Monday through Friday from 8 a.m. to 8 p.m. Eastern time.
The views expressed in this report reflect the current views of the respective parties. These views are not guarantees of future performance and involve certain risks, uncertainties and assumptions that are difficult to predict, so actual outcomes and results may differ significantly from the views expressed. These views are subject to change at any time based upon economic, market or other conditions and the respective parties disclaim any responsibility to update such views. These views may not be relied on as investment advice and, because investment decisions for a Columbia Fund are based on numerous factors, may not be relied on as an indication of trading intent on behalf of any particular Columbia Fund. References to specific securities should not be construed as a recommendation or investment advice.
Columbia Marsico International Opportunities Fund
Performance Summary
> Columbia Marsico International Opportunities Fund (the Fund) Class A shares returned 7.12% excluding sales charges for the 12-month period that ended February 28, 2013.
> The Fund underperformed its benchmark, the MSCI EAFE Index (Net), which returned 9.84% for the same 12-month period.
> A combination of stock selection and sector allocation detracted from the Fund's returns relative to the benchmark for the period.
Average Annual Total Returns (%) (for period ended February 28, 2013)
| | Inception | | 1 Year | | 5 Years | | 10 Years | |
Class A | | 08/01/00 | | | | | | | |
Excluding sales charges | | | | | | | 7.12 | | | | -2.79 | | | | 9.34 | | |
Including sales charges | | | | | | | 0.92 | | | | -3.94 | | | | 8.70 | | |
Class B | | 08/01/00 | | | | | | | |
Excluding sales charges | | | | | | | 6.43 | | | | -3.50 | | | | 8.53 | | |
Including sales charges | | | | | | | 1.43 | | | | -3.87 | | | | 8.53 | | |
Class C | | 08/01/00 | | | | | | | |
Excluding sales charges | | | | | | | 6.33 | | | | -3.51 | | | | 8.53 | | |
Including sales charges | | | | | | | 5.33 | | | | -3.51 | | | | 8.53 | | |
Class I* | | 09/27/10 | | | 7.64 | | | | -2.47 | | | | 9.52 | | |
Class R* | | 01/23/06 | | | 6.88 | | | | -3.03 | | | | 9.08 | | |
Class R4* | | 11/08/12 | | | 7.21 | | | | -2.77 | | | | 9.35 | | |
Class Z | | 08/01/00 | | | 7.52 | | | | -2.53 | | | | 9.62 | | |
MSCI EAFE Index (Net) | | | | | | | 9.84 | | | | -1.26 | | | | 9.39 | | |
Returns for Class A are shown with and without the maximum initial sales charge of 5.75%. Returns for Class B are shown with and without the applicable contingent deferred sales charge (CDSC) of 5.00% in the first year, declining to 1.00% in the sixth year and eliminated thereafter. Returns for Class C are shown with and without the 1.00% CDSC for the first year only. The Fund's other classes are not subject to sales charges and have limited eligibility. Please see the Fund's prospectuses for details. Performance for different share classes will vary based on differences in sales charges and fees associated with each class. All results shown assume reinvestment of distributions during the period. Returns do not reflect the deduction of taxes that a shareholder may pay on Fund distributions or on the redemption of Fund shares. Performance results reflect the effect of any fee waivers or reimbursements of Fund expenses by Columbia Management Investment Advisers, LLC and/or any of its affiliates. Absent these fee waivers or expense reimbursement arrangements, performance results would have been lower.
The performance information shown represents past performance and is not a guarantee of future results. The investment return and principal value of your investment will fluctuate so that your shares, when redeemed, may be worth more or less than their original cost. Current performance may be lower or higher than the performance information shown. You may obtain performance information current to the most recent month-end by contacting your financial intermediary, visiting columbiamanagement.com or calling 800.345.6611.
*The returns shown for periods prior to the share class inception date (including returns for the Life of the Fund, if shown, which are since Fund inception) include the returns of the Fund's oldest share class. Since the Fund launched more than one share class at its inception, Class A shares were used. These returns are adjusted to reflect any higher class-related operating expenses of the newer share classes, as applicable. Please visit columbiamanagement.com/mutual-funds/appended-performance for more information.
The MSCI EAFE Index (Net) is a free float-adjusted market capitalization index that is designed to measure the equity market performance of developed markets, excluding the US & Canada. The index is compiled from a composite of securities markets of Europe, Australasia and the Far East and is widely recognized by investors in foreign markets as the measurement index for portfolios of non-North American securities.
Indices are not available for investment, are not professionally managed and do not reflect sales charges, fees, brokerage commissions, taxes or other expenses of investing. Securities in the Fund may not match those in an index.
Annual Report 2013
2
Columbia Marsico International Opportunities Fund
Performance Overview (continued)
Performance of a Hypothetical $10,000 Investment (March 1, 2003 – February 28, 2013)
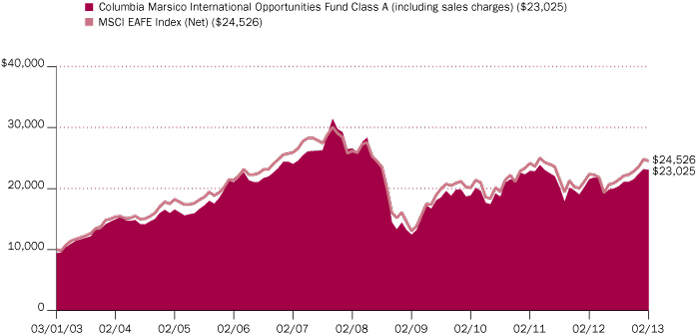
The chart above shows the change in value of a hypothetical $10,000 investment in Class A shares of Columbia Marsico International Opportunities Fund during the stated time period, and does not reflect the deduction of taxes that a shareholder may pay on Fund distributions or on the redemption of Fund shares.
Annual Report 2013
3
Columbia Marsico International Opportunities Fund
Manager Discussion of Fund Performance
For the 12-month period that ended February 28, 2013, the Fund's Class A shares returned 7.12% excluding sales charges. The Fund's benchmark, the MSCI EAFE Index (Net), returned 9.84%. Stock selection in the telecommunication services, energy and health care sectors accounted for some of this shortfall relative to the index. An overweight relative to the index in the weak-performing information technology sector and underweights in the strong-performing financials and consumer staples sectors also detracted from results. Fund performance was aided by stock selection in the materials, industrials and consumer discretionary sectors. We also did well to underweight the weakest-performing sectors of the index — energy, utilities and materials.
Stock Selection in Energy, Health Care and Telecommunication Services Detracted from Results
Stock selection in energy hurt performance. Oil and gas exploration firms OGX Petróleo e Gás Participações (which was sold) and Tullow Oil each declined sharply. Telecommunications company China Unicom's stock price fell sharply in the period due, in part, to handset subsidies for new subscribers, and the shares were sold. Millicom International Cellular, a mobile phone network provider, also disappointed. In health care, Dublin-based pharmaceutical holding Shire posted a double-digit loss after U.S. regulators approved a generic version of its attention deficit and hyperactivity disorder drug. We continue to hold a position in Shire as we currently find its valuation, strong free cash flow yield and growing product pipeline to be attractive. A few information technology holdings had disappointing performances, including Chinese internet services company Baidu, Check Point Software Technologies, and equipment company Canon, which was sold.
Good Choices in Materials, Consumer Discretionary and Technology Aided Results
Stock selection and an underweight allocation to materials benefitted the Fund's results for the period. Specialty chemical company LyondellBasell Industries contributed positively to performance. The firm's ethylene margins increased during the period, driven by lower feedstock costs in the United States, as ethane supply continued to outpace demand. Consumer discretionary was a strong performing area of the benchmark index and the Fund benefitted from its significant overweight allocation to the sector. In addition, several consumer holdings registered solid gains. Spain-based fashion retailer Inditex's stock price soared and the position was sold. Media companies Kabel Deutschland Holding and British Sky Broadcasting Group posted double-digit stock price gains. Semiconductor positions ARM Holdings, Samsung Electronics and ASML Holding (both sold during the period) posted solid results. To varying degrees, each of these companies reaped the benefits of customer demand for ever smaller, more advanced and pricier chips with applications in the burgeoning global market for smartphones. Other leading individual holdings included Canadian National Railway, pharmaceutical company Roche Holding and brewer Anheuser-Busch InBev.
Currency Management was Beneficial
Active currency management is not a central facet of the Fund's investment process, but fluctuations in major world currencies can affect performance.
Portfolio Management
Marsico Capital Management, LLC
James Gendelman
Munish Malhotra, CFA
Morningstar Style BoxTM

The Morningstar Style BoxTM is based on a fund's portfolio holdings. For equity funds, the vertical axis shows the market capitalization of the stocks owned, and the horizontal axis shows investment style (value, blend, or growth). Information shown is based on the most recent data provided by Morningstar.
© 2013 Morningstar, Inc. All rights reserved. The Morningstar information contained herein: (1) is proprietary to Morningstar and/or its content providers; (2) may not be copied or distributed; and (3) is not warranted to be accurate, complete or timely. Neither Morningstar nor its content providers are responsible for any damages or losses arising from any use of this information.
Top Ten Holdings (%)
(at February 28, 2013) | |
AIA Group Ltd. (Hong Kong) | | | 2.9 | | |
Nestlé SA, Registered Shares
(Switzerland) | | | 2.9 | | |
Telecity Group PLC
(United Kingdom) | | | 2.9 | | |
British Sky Broadcasting
Group PLC (United Kingdom) | | | 2.6 | | |
Anheuser-Busch InBev NV
(Belgium) | | | 2.6 | | |
Standard Chartered PLC
(United Kingdom) | | | 2.6 | | |
Diageo PLC (United Kingdom) | | | 2.6 | | |
Shire PLC (United Kingdom) | | | 2.5 | | |
LyondellBasell Industries NV,
Class A (United States) | | | 2.5 | | |
Bayerische Motoren Werke AG
(Germany) | | | 2.3 | | |
Percentages indicated are based upon total investments (excluding Money Market Funds).
For further detail about these holdings, please refer to the section entitled "Portfolio of Investments."
Fund holdings are as of the date given, are subject to change at any time, and are not recommendations to buy or sell any security.
Annual Report 2013
4
Columbia Marsico International Opportunities Fund
Manager Discussion of Fund Performance (continued)
During this 12-month period, currency had a net positive impact, as performance benefitted from the Fund's underweight allocation to securities denominated in the Japanese yen, which weakened in the period.
Looking Ahead
We currently think the U.S. and international economic backdrop is generally improving. However, serious fiscal challenges still remain, both in the United States and abroad, and uncertainty about government economic policy is high. Overseas, the picture has brightened, particularly in emerging markets. Leading indicators have turned up for China, Brazil, Hong Kong and other regions. Emerging market consumption, after retreating in concert with the global slowdown, is showing signs of revival. Even in Japan, there is an improved outlook, as new leadership appears committed to a major stimulus program and improving trade relations with regional strategic partners, such as South Korea. China's economy appears to be snapping back from a rather dismal summer. With inflation remaining relatively calm and bank lending looking more constrained, it appears that China may avoid a hard landing and has more room for policy stimulus if deemed necessary.
In the European Union (EU), credit conditions have improved significantly since the European Central Bank launched its bond-buying program in late summer 2012. Intra-bank lending rates have declined. Corporate credit default swap spreads are currently at two-year lows. Funding markets have been receptive to sovereign debt auctions and borrowing costs have declined significantly. It appears the EU may have averted a worst-case outcome, yet recessionary pressures are intensifying at present and, without fiscal union, the region lacks a cohesive distribution mechanism for policy stimulus. Social unrest is a material risk factor, most recently highlighted by the lack of an outcome in the Italian general election. Another current risk factor for the EU is the degree to which economic growth recovers in the rest of the world, since exports represent a major part of the economies of Germany, Italy, France and the United Kingdom.
With these factors in mind, we are currently emphasizing companies that we believe have a high degree of earnings visibility, unleveraged balance sheets and that are buying back stock and increasing dividends. During the period, we increased the Fund's allocation to the consumer discretionary, financials, consumer staples and health sectors, while reducing its weight in the industrials, energy, materials and telecommunication sectors. At period end, the Fund's largest sector allocations were to consumer discretionary, information technology and financials.
Portfolio Breakdown (%)
(at February 28, 2013) | |
Common Stocks | | | 97.3 | | |
Argentina | | | 1.0 | | |
Belgium | | | 2.5 | | |
Brazil | | | 2.1 | | |
Canada | | | 3.1 | | |
China | | | 3.1 | | |
Denmark | | | 1.6 | | |
France | | | 5.4 | | |
Germany | | | 6.5 | | |
Hong Kong | | | 3.2 | | |
Israel | | | 1.5 | | |
Japan | | | 13.2 | | |
Netherlands | | | 2.1 | | |
Norway | | | 1.1 | | |
Russian Federation | | | 2.1 | | |
Singapore | | | 0.5 | | |
South Africa | | | 1.2 | | |
South Korea | | | 2.2 | | |
Sweden | | | 1.0 | | |
Switzerland | | | 8.9 | | |
Taiwan | | | 1.0 | | |
United Kingdom | | | 23.1 | | |
United States | | | 10.9 | | |
Money Market Funds | | | 2.7 | | |
Total | | | 100.0 | | |
Percentages indicated are based upon total investments. The Fund's portfolio composition is subject to change.
Annual Report 2013
5
Columbia Marsico International Opportunities Fund
Manager Discussion of Fund Performance (continued)
Summary of Investments in Securities
by Industry (%)
(at February 28, 2013) | |
Aerospace & Defense | | | 2.1 | | |
Automobiles | | | 6.6 | | |
Beverages | | | 6.2 | | |
Capital Markets | | | 1.4 | | |
Chemicals | | | 2.5 | | |
Commercial Banks | | | 7.3 | | |
Computers & Peripherals | | | 1.8 | | |
Diversified Telecommunication
Services | | | 2.1 | | |
Electrical Equipment | | | 1.4 | | |
Electronic Equipment,
Instruments & Components | | | 1.4 | | |
Energy Equipment & Services | | | 1.2 | | |
Food Products | | | 2.9 | | |
Gas Utilities | | | 0.6 | | |
Health Care Providers &
Services | | | 0.7 | | |
Hotels, Restaurants & Leisure | | | 3.7 | | |
Insurance | | | 2.9 | | |
Internet & Catalog Retail | | | 2.0 | | |
Internet Software & Services | | | 9.1 | | |
IT Services | | | 1.0 | | |
Machinery | | | 2.9 | | |
Media | | | 8.5 | | |
Metals & Mining | | | 1.0 | | |
Multiline Retail | | | 1.1 | | |
Oil, Gas & Consumable Fuels | | | 2.6 | | |
Pharmaceuticals | | | 8.3 | | |
Real Estate Investment
Trusts (REITs) | | | 1.6 | | |
Real Estate Management &
Development | | | 3.0 | | |
Road & Rail | | | 2.2 | | |
Semiconductors &
Semiconductor Equipment | | | 2.0 | | |
Software | | | 1.5 | | |
Specialty Retail | | | 1.0 | | |
Textiles, Apparel & Luxury
Goods | | | 3.7 | | |
Trading Companies &
Distributors | | | 1.5 | | |
Wireless Telecommunication
Services | | | 1.0 | | |
Money Market Funds | | | 2.7 | | |
Total | | | 101.5 | | |
Percentages indicated are based upon net assets. The Fund's portfolio composition is subject to change.
Annual Report 2013
6
Columbia Marsico International Opportunities Fund
Understanding Your Fund's Expenses
(Unaudited)
As an investor, you incur two types of costs. There are transaction costs, which generally include sales charges on purchases and may include redemption fees. There are also ongoing costs, which generally include management fees, distribution and service (Rule 12b-1) fees, and other fund expenses. The following information is intended to help you understand your ongoing costs (in dollars) of investing in the Fund and to help you compare these costs with the ongoing costs of investing in other mutual funds.
Analyzing Your Fund's Expenses
To illustrate these ongoing costs, we have provided examples and calculated the expenses paid by investors in each share class of the Fund during the period. The actual and hypothetical information in the table is based on an initial investment of $1,000 at the beginning of the period indicated and held for the entire period. Expense information is calculated two ways and each method provides you with different information. The amount listed in the "Actual" column is calculated using the Fund's actual operating expenses and total return for the period. You may use the Actual information, together with the amount invested, to estimate the expenses that you paid over the period. Simply divide your account value by $1,000 (for example, an $8,600 account value divided by $1,000 = 8.6), then multiply the results by the expenses paid during the period under the Actual column. The amount listed in the "Hypothetical" column assumes a 5% annual rate of return before expenses (which is not the Fund's actual return) and then applies the Fund's actual expense ratio for the period to the hypothetical return. You should not use the hypothetical account values and expenses to estimate either your actual account balance at the end of the period or the expenses you paid during the period. See "Compare With Other Funds" below for details on how to use the hypothetical data.
Compare With Other Funds
Since all mutual funds are required to include the same hypothetical calculations about expenses in shareholder reports, you can use this information to compare the ongoing cost of investing in the Fund with other funds. To do so, compare the hypothetical example with the 5% hypothetical examples that appear in the shareholder reports of other funds. As you compare hypothetical examples of other funds, it is important to note that hypothetical examples are meant to highlight the ongoing costs of investing in a fund only and do not reflect any transaction costs, such as sales charges, or redemption or exchange fees. Therefore, the hypothetical calculations are useful in comparing ongoing costs only, and will not help you determine the relative total costs of owning different funds. If transaction costs were included in these calculations, your costs would be higher.
September 1, 2012 – February 28, 2013
| | Account Value at the Beginning
of the Period ($) | | Account Value at the End of the
Period ($) | | Expenses Paid During the
Period ($) | | Fund's Annualized
Expense Ratio (%) | |
| | Actual | | Hypothetical | | Actual | | Hypothetical | | Actual | | Hypothetical | | Actual | |
Class A | | | 1,000.00 | | | | 1,000.00 | | | | 1,130.50 | | | | 1,017.65 | | | | 7.61 | | | | 7.20 | | | | 1.44 | | |
Class B | | | 1,000.00 | | | | 1,000.00 | | | | 1,127.10 | | | | 1,013.93 | | | | 11.55 | | | | 10.94 | | | | 2.19 | | |
Class C | | | 1,000.00 | | | | 1,000.00 | | | | 1,126.00 | | | | 1,013.93 | | | | 11.54 | | | | 10.94 | | | | 2.19 | | |
Class I | | | 1,000.00 | | | | 1,000.00 | | | | 1,133.50 | | | | 1,019.84 | | | | 5.29 | | | | 5.01 | | | | 1.00 | | |
Class R | | | 1,000.00 | | | | 1,000.00 | | | | 1,129.40 | | | | 1,016.41 | | | | 8.92 | | | | 8.45 | | | | 1.69 | | |
Class R4 | | | 1,000.00 | | | | 1,000.00 | | | | 1,106.50 | * | | | 1,019.09 | | | | 3.68 | * | | | 5.76 | | | | 1.15 | * | |
Class Z | | | 1,000.00 | | | | 1,000.00 | | | | 1,132.60 | | | | 1,018.84 | | | | 6.35 | | | | 6.01 | | | | 1.20 | | |
*For the period November 8, 2012 through February 28, 2013. Class R4 shares commenced operations on November 8, 2012.
Expenses paid during the period are equal to the annualized expense ratio for each class as indicated above, multiplied by the average account value over the period and then multiplied by the number of days in the Fund's most recent fiscal half year and divided by 365.
Expenses do not include fees and expenses incurred indirectly by the Fund from the underlying funds in which the Fund may invest (also referred to as "acquired funds"), including affiliated and non-affiliated pooled investment vehicles (including mutual funds and exchange-traded funds).
Annual Report 2013
7
Columbia Marsico International Opportunities Fund
Portfolio of Investments
February 28, 2013
(Percentages represent value of investments compared to net assets)
Common Stocks 98.8%
Issuer | | Shares | | Value ($) | |
Argentina 1.0% | |
MercadoLibre, Inc. | | | 44,653 | | | | 3,822,743 | | |
Belgium 2.6% | |
Anheuser-Busch InBev NV | | | 100,370 | | | | 9,406,160 | | |
Brazil 2.1% | |
BR Malls Participacoes SA | | | 608,000 | | | | 7,863,393 | | |
Canada 3.1% | |
Canadian National Railway Co. | | | 78,913 | | | | 8,001,778 | | |
IMAX Corp.(a) | | | 137,151 | | | | 3,524,781 | | |
Total | | | | | 11,526,559 | | |
China 3.2% | |
Baidu, Inc., ADR(a) | | | 59,486 | | | | 5,398,949 | | |
CNOOC Ltd. | | | 2,120,300 | | | | 4,143,948 | | |
ENN Energy Holdings Ltd. | | | 402,000 | | | | 2,017,474 | | |
Total | | | | | 11,560,371 | | |
Denmark 1.6% | |
Novo Nordisk A/S, Class B | | | 33,257 | | | | 5,808,104 | | |
France 5.5% | |
BNP Paribas SA | | | 92,691 | | | | 5,184,593 | | |
Pernod-Ricard SA | | | 31,974 | | | | 4,141,060 | | |
Schneider Electric SA | | | 67,132 | | | | 5,141,839 | | |
Unibail-Rodamco SE | | | 24,716 | | | | 5,704,976 | | |
Total | | | | | 20,172,468 | | |
Germany 6.6% | |
Adidas AG | | | 85,741 | | | | 7,793,120 | | |
Bayerische Motoren Werke AG | | | 91,475 | | | | 8,410,296 | | |
Fresenius SE & Co. KGaA | | | 20,971 | | | | 2,573,253 | | |
Kabel Deutschland Holding AG | | | 61,527 | | | | 5,326,992 | | |
Total | | | | | 24,103,661 | | |
Hong Kong 3.3% | |
AIA Group Ltd. | | | 2,430,800 | | | | 10,512,156 | | |
Hang Lung Properties Ltd. | | | 377,000 | | | | 1,461,254 | | |
Total | | | | | 11,973,410 | | |
Israel 1.5% | |
Check Point Software Technologies Ltd.(a) | | | 106,817 | | | | 5,608,961 | | |
Common Stocks (continued)
Issuer | | Shares | | Value ($) | |
Japan 13.4% | |
Dena Co., Ltd. | | | 207,100 | | | | 5,807,330 | | |
FANUC CORP. | | | 38,700 | | | | 5,967,461 | | |
Honda Motor Co., Ltd. | | | 197,700 | | | | 7,393,705 | | |
Hoya Corp. | | | 275,500 | | | | 5,275,044 | | |
Komatsu Ltd. | | | 179,600 | | | | 4,522,739 | | |
Marubeni Corp. | | | 775,000 | | | | 5,652,743 | | |
Mizuho Financial Group, Inc. | | | 3,185,000 | | | | 7,005,158 | | |
Rakuten, Inc. | | | 846,000 | | | | 7,312,690 | | |
Total | | | | | 48,936,870 | | |
Netherlands 2.1% | |
Ziggo NV | | | 224,923 | | | | 7,591,923 | | |
Norway 1.1% | |
Seadrill Ltd. | | | 115,252 | | | | 4,202,714 | | |
Russian Federation 2.1% | |
Yandex NV, Class A(a) | | | 335,495 | | | | 7,780,129 | | |
Singapore 0.5% | |
Global Logistic Properties Ltd. | | | 891,000 | | | | 1,827,402 | | |
South Africa 1.3% | |
Naspers Ltd., Class N | | | 70,820 | | | | 4,573,082 | | |
South Korea 2.2% | |
Hyundai Motor Co. | | | 40,793 | | | | 8,161,475 | | |
Sweden 1.0% | |
Millicom International Cellular SA, SDR | | | 46,278 | | | | 3,625,623 | | |
Switzerland 9.0% | |
Dufry AG, Registered Shares(a) | | | 28,073 | | | | 3,812,129 | | |
Nestlé SA, Registered Shares | | | 149,503 | | | | 10,436,889 | | |
Roche Holding AG, Genusschein Shares | | | 34,108 | | | | 7,804,191 | | |
Swatch Group AG (The) | | | 9,913 | | | | 5,629,855 | | |
UBS AG, Registered Shares | | | 333,139 | | | | 5,263,700 | | |
Total | | | | | 32,946,764 | | |
Taiwan 1.0% | |
Taiwan Semiconductor Manufacturing
Co., Ltd., ADR | | | 202,977 | | | | 3,704,330 | | |
The accompanying Notes to Financial Statements are an integral part of this statement.
Annual Report 2013
8
Columbia Marsico International Opportunities Fund
Portfolio of Investments (continued)
February 28, 2013
Common Stocks (continued)
Issuer | | Shares | | Value ($) | |
United Kingdom 23.5% | |
ARM Holdings PLC | | | 260,023 | | | | 3,764,477 | | |
Barclays PLC | | | 1,152,507 | | | | 5,347,537 | | |
British Sky Broadcasting Group PLC | | | 738,801 | | | | 9,507,198 | | |
Diageo PLC | | | 310,195 | | | | 9,301,560 | | |
Intercontinental Hotels Group PLC | | | 284,303 | | | | 8,243,607 | | |
Next PLC | | | 63,527 | | | | 4,040,134 | | |
Rolls-Royce Holdings PLC | | | 501,594 | | | | 7,802,914 | | |
Shire PLC | | | 287,621 | | | | 8,999,128 | | |
Standard Chartered PLC | | | 343,141 | | | | 9,314,426 | | |
Telecity Group PLC | | | 733,460 | | | | 10,380,108 | | |
Tullow Oil PLC | | | 295,889 | | | | 5,435,087 | | |
Xstrata PLC | | | 210,733 | | | | 3,698,673 | | |
Total | | | | | 85,834,849 | | |
United States 11.1% | |
Accenture PLC, Class A | | | 50,351 | | | | 3,744,100 | | |
Liberty Global, Inc., Class C(a) | | | 59,232 | | | | 3,782,555 | | |
LyondellBasell Industries NV, Class A | | | 153,117 | | | | 8,975,719 | | |
Common Stocks (continued)
Issuer | | Shares | | Value ($) | |
Perrigo Co. | | | 68,002 | | | | 7,695,786 | | |
Seagate Technology PLC | | | 203,254 | | | | 6,536,649 | | |
Virgin Media, Inc. | | | 95,729 | | | | 4,441,826 | | |
Wynn Resorts Ltd. | | | 45,296 | | | | 5,295,102 | | |
Total | | | | | 40,471,737 | | |
Total Common Stocks
(Cost: $287,972,892) | | | | | 361,502,728 | | |
Money Market Funds 2.7%
Columbia Short-Term Cash Fund,
0.128%(b)(c) | | | 9,973,643 | | | | 9,973,643 | | |
Total Money Market Funds
(Cost: $9,973,643) | | | | | 9,973,643 | | |
Total Investments
(Cost: $297,946,535) | | | 371,476,371 | | |
Other Assets & Liabilities, Net | | | (5,477,880 | ) | |
Net Assets | | | 365,998,491 | | |
Notes to Portfolio of Investments
(a) Non-income producing.
(b) The rate shown is the seven-day current annualized yield at February 28, 2013.
(c) As defined in the Investment Company Act of 1940, an affiliated company is one in which the Fund owns 5% or more of its outstanding voting securities, or a company which is under common ownership or control with the Fund. Holdings and transactions in these affiliated companies during the year ended February 28, 2013, are as follows:
Issuer | |
Beginning
Cost ($) | |
Purchase
Cost ($) | | Proceeds
From Sales ($) | |
Realized
Gain/Loss ($) | |
Ending
Cost ($) | | Dividends
or Interest
Income ($) | | Value ($) | |
Columbia
Short-Term
Cash Fund | | | 10,488,856 | | | | 236,699,999 | | | | (237,215,212) | | | | — | | | | 9,973,643 | | | | 14,481 | | | | 9,973,643 | | |
Abbreviation Legend
ADR American Depositary Receipt
SDR Swedish Depositary Receipt
The accompanying Notes to Financial Statements are an integral part of this statement.
Annual Report 2013
9
Columbia Marsico International Opportunities Fund
Portfolio of Investments (continued)
February 28, 2013
Fair Value Measurements
Generally accepted accounting principles (GAAP) require disclosure regarding the inputs and valuation techniques used to measure fair value and any changes in valuation inputs or techniques. In addition, investments shall be disclosed by major category.
The Fund categorizes its fair value measurements according to a three-level hierarchy that maximizes the use of observable inputs and minimizes the use of unobservable inputs by prioritizing that the most observable input be used when available. Observable inputs are those that market participants would use in pricing an investment based on market data obtained from sources independent of the reporting entity. Unobservable inputs are those that reflect the Fund's assumptions about the information market participants would use in pricing an investment. An investment's level within the fair value hierarchy is based on the lowest level of any input that is deemed significant to the asset or liability's fair value measurement. The input levels are not necessarily an indication of the risk or liquidity associated with investments at that level. For example, certain U.S. government securities are generally high quality and liquid, however, they are reflected as Level 2 because the inputs used to determine fair value may not always be quoted prices in an active market.
Fair value inputs are summarized in the three broad levels listed below:
> Level 1 — Valuations based on quoted prices for investments in active markets that the Fund has the ability to access at the measurement date (including NAV for open-end mutual funds). Valuation adjustments are not applied to Level 1 investments.
> Level 2 — Valuations based on other significant observable inputs (including quoted prices for similar securities, interest rates, prepayment speeds, credit risks, etc.).
> Level 3 — Valuations based on significant unobservable inputs (including the Fund's own assumptions and judgment in determining the fair value of investments).
Inputs that are used in determining fair value of an investment may include price information, credit data, volatility statistics, and other factors. These inputs can be either observable or unobservable. The availability of observable inputs can vary between investments, and is affected by various factors such as the type of investment, and the volume and level of activity for that investment or similar investments in the marketplace. The inputs will be considered by the Investment Manager, along with any other relevant factors in the calculation of an investment's fair value. The Fund uses prices and inputs that are current as of the measurement date, which may include periods of market dislocations. During these periods, the availability of prices and inputs may be reduced for many investments. This condition could cause an investment to be reclassified between the various levels within the hierarchy.
Foreign equity securities actively traded in markets where there is a significant delay in the local close relative to the New York Stock Exchange (NYSE) are classified as Level 2. The values of these securities may include an adjustment to reflect the impact of significant market movements following the close of local trading, as described in Note 2 to the financial statements — Security Valuation.
Investments falling into the Level 3 category are primarily supported by quoted prices from brokers and dealers participating in the market for those investments. However, these may be classified as Level 3 investments due to lack of market transparency and corroboration to support these quoted prices. Additionally, valuation models may be used as the pricing source for any remaining investments classified as Level 3. These models rely on one or more significant unobservable inputs and/or significant assumptions by the Investment Manager. Inputs used in valuations may include, but are not limited to, financial statement analysis, capital account balances, discount rates and estimated cash flows, and comparable company data.
Under the direction of the Fund's Board of Trustees (the Board), the Investment Manager's Valuation Committee (the Committee) is responsible for carrying out the valuation procedures approved by the Board. The Committee consists of voting and non-voting members from various groups within the Investment Manager's organization, including operations and accounting, trading and investments, compliance, risk management and legal.
The Committee meets at least monthly to review and approve valuation matters, which may include a description of specific valuation determinations, data regarding pricing information received from approved pricing vendors and brokers and the results of Board-approved valuation control policies and procedures (the Policies). The Policies address, among other things, instances when market quotations are readily available, including recommendations of third party pricing vendors and a determination of appropriate pricing methodologies; events that require specific valuation determinations and assessment of fair value techniques; securities with a potential for stale pricing, including those that are illiquid, restricted, or in default; and the effectiveness of third-party pricing vendors, including periodic reviews of vendors. The Committee meets more frequently, as needed, to discuss additional valuation matters, which may include the need to review back-testing results, review time-sensitive information or approve related valuation actions. The Committee reports to the Board, with members of the Committee meeting with the Board at each of its regularly scheduled meetings to discuss valuation matters and actions during the period, similar to those described earlier.
For investments categorized as Level 3, the Committee monitors information similar to that described above, which may include: (i) data specific to the issuer or comparable issuers, (ii) general market or specific sector news and (iii) quoted prices and specific or similar security transactions. The Committee considers this data and any changes from prior periods in order to assess the reasonableness of observable and unobservable inputs, any assumptions or internal models used to value those securities and changes in fair value. This data is also used to corroborate, when available, information received from approved pricing vendors and brokers. Various factors impact the frequency of monitoring this information (which may occur as often as daily). However, the Committee may determine that changes to inputs, assumptions and models are not required as a result of the monitoring procedures performed.
The accompanying Notes to Financial Statements are an integral part of this statement.
Annual Report 2013
10
Columbia Marsico International Opportunities Fund
Portfolio of Investments (continued)
February 28, 2013
Fair Value Measurements (continued)
The following table is a summary of the inputs used to value the Fund's investments at February 28, 2013:
Description | | Level 1
Quoted Prices in Active
Markets for Identical
Assets ($) | |
Level 2
Other Significant
Observable Inputs ($) | |
Level 3
Significant
Unobservable Inputs ($) | |
Total ($) | |
Equity Securities | |
Common Stocks | |
Consumer Discretionary | | | 17,044,264 | | | | 80,204,283 | | | | — | | | | 97,248,547 | | |
Consumer Staples | | | — | | | | 33,285,669 | | | | — | | | | 33,285,669 | | |
Energy | | | — | | | | 13,781,749 | | | | — | | | | 13,781,749 | | |
Financials | | | 7,863,393 | | | | 51,621,202 | | | | — | | | | 59,484,595 | | |
Health Care | | | 7,695,786 | | | | 25,184,676 | | | | — | | | | 32,880,462 | | |
Industrials | | | 8,001,778 | | | | 29,087,696 | | | | — | | | | 37,089,474 | | |
Information Technology | | | 36,595,861 | | | | 25,226,959 | | | | — | | | | 61,822,820 | | |
Materials | | | 8,975,719 | | | | 3,698,673 | | | | — | | | | 12,674,392 | | |
Telecommunication Services | | | — | | | | 11,217,546 | | | | — | | | | 11,217,546 | | |
Utilities | | | — | | | | 2,017,474 | | | | — | | | | 2,017,474 | | |
Total Equity Securities | | | 86,176,801 | | | | 275,325,927 | | | | — | | | | 361,502,728 | | |
Other | |
Money Market Funds | | | 9,973,643 | | | | — | | | | — | | | | 9,973,643 | | |
Total Other | | | 9,973,643 | | | | — | | | | — | | | | 9,973,643 | | |
Total | | | 96,150,444 | | | | 275,325,927 | | | | — | | | | 371,476,371 | | |
See the Portfolio of Investments for all investment classifications not indicated in the table.
The Fund's assets assigned to the Level 2 input category are generally valued using the market approach, in which a security's value is determined through reference to prices and information from market transactions for similar or identical assets. These assets include certain foreign securities for which a third party statistical pricing service may be employed for purposes of fair market valuation. The models utilized by the third party statistical pricing service take into account a security's correlation to available market data including, but not limited to, intraday index, ADR, and ETF movements.
There were no transfers of financial assets between Levels 1 and 2 during the period.
The accompanying Notes to Financial Statements are an integral part of this statement.
Annual Report 2013
11
Columbia Marsico International Opportunities Fund
Statement of Assets and Liabilities
February 28, 2013
Assets | |
Investments, at value | |
Unaffiliated issuers (identified cost $287,972,892) | | $ | 361,502,728 | | |
Affiliated issuers (identified cost $9,973,643) | | | 9,973,643 | | |
Total investments (identified cost $297,946,535) | | | 371,476,371 | | |
Foreign currency (identified cost $1) | | | 1 | | |
Receivable for: | |
Investments sold | | | 4,366,046 | | |
Capital shares sold | | | 125,295 | | |
Dividends | | | 387,792 | | |
Reclaims | | | 289,464 | | |
Prepaid expenses | | | 2,140 | | |
Total assets | | | 376,647,109 | | |
Liabilities | |
Payable for: | |
Investments purchased | | | 4,732,235 | | |
Capital shares purchased | | | 5,686,878 | | |
Investment management fees | | | 8,061 | | |
Distribution and/or service fees | | | 1,298 | | |
Transfer agent fees | | | 65,540 | | |
Administration fees | | | 816 | | |
Compensation of board members | | | 63,957 | | |
Other expenses | | | 89,833 | | |
Total liabilities | | | 10,648,618 | | |
Net assets applicable to outstanding capital stock | | $ | 365,998,491 | | |
Represented by | |
Paid-in capital | | $ | 966,168,532 | | |
Undistributed net investment income | | | 1,698,106 | | |
Accumulated net realized loss | | | (675,378,532 | ) | |
Unrealized appreciation (depreciation) on: | |
Investments | | | 73,529,836 | | |
Foreign currency translations | | | (19,451 | ) | |
Total — representing net assets applicable to outstanding capital stock | | $ | 365,998,491 | | |
The accompanying Notes to Financial Statements are an integral part of this statement.
Annual Report 2013
12
Columbia Marsico International Opportunities Fund
Statement of Assets and Liabilities (continued)
February 28, 2013
Class A | |
Net assets | | $ | 85,963,275 | | |
Shares outstanding | | | 7,137,233 | | |
Net asset value per share | | $ | 12.04 | | |
Maximum offering price per share(a) | | $ | 12.77 | | |
Class B | |
Net assets | | $ | 5,644,657 | | |
Shares outstanding | | | 501,451 | | |
Net asset value per share | | $ | 11.26 | | |
Class C | |
Net assets | | $ | 19,402,396 | | |
Shares outstanding | | | 1,722,503 | | |
Net asset value per share | | $ | 11.26 | | |
Class I | |
Net assets | | $ | 2,773 | | |
Shares outstanding | | | 224 | | |
Net asset value per share(b) | | $ | 12.40 | | |
Class R | |
Net assets | | $ | 1,066,523 | | |
Shares outstanding | | | 89,140 | | |
Net asset value per share | | $ | 11.96 | | |
Class R4 | |
Net assets | | $ | 2,767 | | |
Shares outstanding | | | 224 | | |
Net asset value per share(b) | | $ | 12.36 | | |
Class Z | |
Net assets | | $ | 253,916,100 | | |
Shares outstanding | | | 20,651,961 | | |
Net asset value per share | | $ | 12.30 | | |
(a) The maximum offering price per share is calculated by dividing the net asset value by 1.0 minus the maximum sales charge of 5.75%.
(b) Net asset value per share rounds to this amount due to fractional shares outstanding.
The accompanying Notes to Financial Statements are an integral part of this statement.
Annual Report 2013
13
Columbia Marsico International Opportunities Fund
Statement of Operations
Year Ended February 28, 2013
Net investment income | |
Income: | |
Dividends — unaffiliated issuers | | $ | 12,179,728 | | |
Dividends — affiliated issuers | | | 14,481 | | |
Interest | | | 8 | | |
Income from securities lending — net | | | 181,930 | | |
Foreign taxes withheld | | | (1,126,797 | ) | |
Total income | | | 11,249,350 | | |
Expenses: | |
Investment management fees | | | 3,412,658 | | |
Distribution and/or service fees | |
Class A | | | 219,593 | | |
Class B | | | 66,189 | | |
Class C | | | 214,980 | | |
Class R | | | 5,474 | | |
Transfer agent fees | |
Class A | | | 156,311 | | |
Class B | | | 11,797 | | |
Class C | | | 38,291 | | |
Class R | | | 1,951 | | |
Class R4(a) | | | 1 | | |
Class Z | | | 553,323 | | |
Administration fees | | | 885,760 | | |
Compensation of board members | | | 26,041 | | |
Custodian fees | | | 58,169 | | |
Registration fees | | | 100,869 | | |
Professional fees | | | 22,612 | | |
Line of credit interest expense | | | 3,501 | | |
Other | | | 35,217 | | |
Total expenses | | | 5,812,737 | | |
Expense reductions | | | (840 | ) | |
Total net expenses | | | 5,811,897 | | |
Net investment income | | | 5,437,453 | | |
Realized and unrealized gain (loss) — net | |
Net realized gain (loss) on: | |
Investments | | | 57,720,985 | | |
Foreign currency translations | | | (119,992 | ) | |
Net realized gain | | | 57,600,993 | | |
Net change in unrealized appreciation (depreciation) on: | |
Investments | | | (41,667,322 | ) | |
Foreign currency translations | | | (9,164 | ) | |
Forward foreign currency exchange contracts | | | 1,122 | | |
Net change in unrealized appreciation (depreciation) | | | (41,675,364 | ) | |
Net realized and unrealized gain | | | 15,925,629 | | |
Net increase in net assets resulting from operations | | $ | 21,363,082 | | |
(a) For the period from November 8, 2012 (commencement of operations) to February 28, 2013.
The accompanying Notes to Financial Statements are an integral part of this statement.
Annual Report 2013
14
Columbia Marsico International Opportunities Fund
Statement of Changes in Net Assets
| | | Year Ended
February 28,
2013(a) | | Year Ended
February 29,
2012 | |
Operations | |
Net investment income | | $ | 5,437,453 | | | $ | 2,428,401 | | |
Net realized gain | | | 57,600,993 | | | | 38,430,553 | | |
Net change in unrealized appreciation (depreciation) | | | (41,675,364 | ) | | | (139,833,031 | ) | |
Net increase (decrease) in net assets resulting from operations | | | 21,363,082 | | | | (98,974,077 | ) | |
Increase (decrease) in net assets from capital stock activity | | | (247,398,822 | ) | | | (488,348,486 | ) | |
Total decrease in net assets | | | (226,035,740 | ) | | | (587,322,563 | ) | |
Net assets at beginning of year | | | 592,034,231 | | | | 1,179,356,794 | | |
Net assets at end of year | | $ | 365,998,491 | | | $ | 592,034,231 | | |
Undistributed (excess of distributions over) net investment income | | $ | 1,698,106 | | | $ | (5,656,758 | ) | |
(a) Class R4 shares are for the period from November 8, 2012 (commencement of operations) to February 28, 2013.
The accompanying Notes to Financial Statements are an integral part of this statement.
Annual Report 2013
15
Columbia Marsico International Opportunities Fund
Statement of Changes in Net Assets (continued)
| | | Year Ended February 28, 2013(a) | | Year Ended February 29, 2012 | |
| | | Shares | | Dollars ($) | | Shares | | Dollars ($) | |
Capital stock activity | |
Class A shares | |
Subscriptions(b) | | | 1,016,881 | | | | 11,285,228 | | | | 1,273,100 | | | | 13,913,096 | | |
Redemptions | | | (2,754,250 | ) | | | (30,480,105 | ) | | | (4,255,513 | ) | | | (46,769,929 | ) | |
Net decrease | | | (1,737,369 | ) | | | (19,194,877 | ) | | | (2,982,413 | ) | | | (32,856,833 | ) | |
Class B shares | |
Subscriptions | | | 2,689 | | | | 27,821 | | | | 8,257 | | | | 87,801 | | |
Redemptions(b) | | | (293,158 | ) | | | (3,070,607 | ) | | | (526,165 | ) | | | (5,413,370 | ) | |
Net decrease | | | (290,469 | ) | | | (3,042,786 | ) | | | (517,908 | ) | | | (5,325,569 | ) | |
Class C shares | |
Subscriptions | | | 25,275 | | | | 264,079 | | | | 64,246 | | | | 671,759 | | |
Redemptions | | | (720,687 | ) | | | (7,571,568 | ) | | | (1,150,108 | ) | | | (11,781,850 | ) | |
Net decrease | | | (695,412 | ) | | | (7,307,489 | ) | | | (1,085,862 | ) | | | (11,110,091 | ) | |
Class I shares | |
Subscriptions | | | — | | | | — | | | | 479 | | | | 5,731 | | |
Redemptions | | | — | | | | — | | | | (2,806,050 | ) | | | (33,452,888 | ) | |
Net decrease | | | — | | | | — | | | | (2,805,571 | ) | | | (33,447,157 | ) | |
Class R shares | |
Subscriptions | | | 16,220 | | | | 179,911 | | | | 20,559 | | | | 222,038 | | |
Redemptions | | | (73,644 | ) | | | (815,024 | ) | | | (126,968 | ) | | | (1,340,977 | ) | |
Net decrease | | | (57,424 | ) | | | (635,113 | ) | | | (106,409 | ) | | | (1,118,939 | ) | |
Class R4 shares | |
Subscriptions | | | 224 | | | | 2,500 | | | | — | | | | — | | |
Net increase | | | 224 | | | | 2,500 | | | | — | | | | — | | |
Class Z shares | |
Subscriptions | | | 1,344,611 | | | | 14,977,512 | | | | 6,287,545 | | | | 72,299,881 | | |
Redemptions | | | (20,592,493 | ) | | | (232,198,569 | ) | | | (44,241,556 | ) | | | (476,789,778 | ) | |
Net decrease | | | (19,247,882 | ) | | | (217,221,057 | ) | | | (37,954,011 | ) | | | (404,489,897 | ) | |
Total net decrease | | | (22,028,332 | ) | | | (247,398,822 | ) | | | (45,452,174 | ) | | | (488,348,486 | ) | |
(a) Class R4 shares are for the period from November 8, 2012 (commencement of operations) to February 28, 2013.
(b) Includes conversions of Class B shares to Class A shares, if any.
The accompanying Notes to Financial Statements are an integral part of this statement.
Annual Report 2013
16
Columbia Marsico International Opportunities Fund
The following tables are intended to help you understand the Fund's financial performance. Certain information reflects financial results for a single share of a class held for the periods shown. Per share net investment income (loss) amounts are calculated based on average shares outstanding during the period. Total return assumes reinvestment of all dividends and distributions, if any. Total return does not reflect payment of sales charges, if any, and is not annualized for periods of less than one year.
| | | Year Ended
February 28, | | Year Ended
February 29, | | Year Ended February 28, | |
Class A | | 2013 | | 2012 | | 2011 | | 2010 | | 2009 | |
Per share data | |
Net asset value, beginning of period | | $ | 11.24 | | | $ | 11.96 | | | $ | 10.00 | | | $ | 6.76 | | | $ | 14.58 | | |
Income from investment operations: | |
Net investment income | | | 0.12 | | | | 0.01 | | | | 0.05 | | | | 0.05 | | | | 0.12 | (a) | |
Net realized and unrealized gain (loss) | | | 0.68 | | | | (0.73 | ) | | | 2.08 | | | | 3.44 | | | | (7.82 | ) | |
Total from investment operations | | | 0.80 | | | | (0.72 | ) | | | 2.13 | | | | 3.49 | | | | (7.70 | ) | |
Less distributions to shareholders: | |
Net investment income | | | — | | | | — | | | | (0.17 | ) | | | (0.25 | ) | | | — | | |
Net realized gains | | | — | | | | — | | | | — | | | | — | | | | (0.12 | ) | |
Total distributions to shareholders | | | — | | | | — | | | | (0.17 | ) | | | (0.25 | ) | | | (0.12 | ) | |
Redemption fees: | |
Redemption fees added to paid-in capital | | | — | | | | — | | | | — | | | | 0.00 | (b) | | | 0.00 | (b) | |
Net asset value, end of period | | $ | 12.04 | | | $ | 11.24 | | | $ | 11.96 | | | $ | 10.00 | | | $ | 6.76 | | |
Total return | | | 7.12 | % | | | (6.02 | %) | | | 21.39 | % | | | 51.97 | % | | | (53.26 | %) | |
Ratios to average net assets(c)(d) | |
Total gross expenses | | | 1.49 | %(e) | | | 1.53 | % | | | 1.51 | %(e) | | | 1.47 | % | | | 1.52 | % | |
Total net expenses(f) | | | 1.49 | %(e)(g) | | | 1.53 | %(g) | | | 1.51 | %(e)(g) | | | 1.47 | %(g) | | | 1.52 | %(g) | |
Net investment income | | | 1.10 | % | | | 0.06 | % | | | 0.47 | % | | | 0.50 | % | | | 1.05 | % | |
Supplemental data | |
Net assets, end of period (in thousands) | | $ | 85,963 | | | $ | 99,757 | | | $ | 141,821 | | | $ | 168,801 | | | $ | 198,012 | | |
Portfolio turnover | | | 73 | % | | | 86 | % | | | 105 | % | | | 116 | % | | | 117 | % | |
Notes to Financial Highlights
(a) Net investment income per share reflects special dividends. The effect of these dividends amounted to $0.03 per share.
(b) Rounds to zero.
(c) In addition to the fees and expenses which the Fund bears directly, the Fund indirectly bears a pro rata share of the fees and expenses of the acquired funds in which it invests. Such indirect expenses are not included in the reported expense ratios.
(d) Certain line items from prior years have been reclassified to conform to the current presentation.
(e) Ratios include line of credit interest expense which rounds to less than 0.01%.
(f) Total net expenses include the impact of certain waivers/reimbursements made by the Investment Manager and certain of its affiliates, if applicable.
(g) The benefits derived from expense reductions had an impact of less than 0.01%.
The accompanying Notes to Financial Statements are an integral part of this statement.
Annual Report 2013
17
Columbia Marsico International Opportunities Fund
Financial Highlights (continued)
| | | Year Ended
February 28, | | Year Ended
February 29, | | Year Ended February 28, | |
Class B | | 2013 | | 2012 | | 2011 | | 2010 | | 2009 | |
Per share data | |
Net asset value, beginning of period | | $ | 10.58 | | | $ | 11.35 | | | $ | 9.51 | | | $ | 6.38 | | | $ | 13.87 | | |
Income from investment operations: | |
Net investment income (loss) | | | 0.04 | | | | (0.07 | ) | | | (0.03 | ) | | | (0.03 | ) | | | 0.03 | (a) | |
Net realized and unrealized gain (loss) | | | 0.64 | | | | (0.70 | ) | | | 1.98 | | | | 3.27 | | | | (7.40 | ) | |
Total from investment operations | | | 0.68 | | | | (0.77 | ) | | | 1.95 | | | | 3.24 | | | | (7.37 | ) | |
Less distributions to shareholders: | |
Net investment income | | | — | | | | — | | | | (0.11 | ) | | | (0.11 | ) | | | — | | |
Net realized gains | | | — | | | | — | | | | — | | | | — | | | | (0.12 | ) | |
Total distributions to shareholders | | | — | | | | — | | | | (0.11 | ) | | | (0.11 | ) | | | (0.12 | ) | |
Redemption fees: | |
Redemption fees added to paid-in capital | | | — | | | | — | | | | — | | | | 0.00 | (b) | | | 0.00 | (b) | |
Net asset value, end of period | | $ | 11.26 | | | $ | 10.58 | | | $ | 11.35 | | | $ | 9.51 | | | $ | 6.38 | | |
Total return | | | 6.43 | % | | | (6.78 | %) | | | 20.50 | % | | | 50.91 | % | | | (53.60 | %) | |
Ratios to average net assets(c)(d) | |
Total gross expenses | | | 2.24 | %(e) | | | 2.27 | % | | | 2.26 | %(e) | | | 2.22 | % | | | 2.27 | % | |
Total net expenses(f) | | | 2.24 | %(e)(g) | | | 2.27 | %(g) | | | 2.26 | %(e)(g) | | | 2.22 | %(g) | | | 2.27 | %(g) | |
Net investment income (loss) | | | 0.40 | % | | | (0.65 | %) | | | (0.27 | %) | | | (0.35 | %) | | | 0.32 | % | |
Supplemental data | |
Net assets, end of period (in thousands) | | $ | 5,645 | | | $ | 8,381 | | | $ | 14,862 | | | $ | 17,810 | | | $ | 15,281 | | |
Portfolio turnover | | | 73 | % | | | 86 | % | | | 105 | % | | | 116 | % | | | 117 | % | |
Notes to Financial Highlights
(a) Net investment income per share reflects special dividends. The effect of these dividends amounted to $0.03 per share.
(b) Rounds to zero.
(c) In addition to the fees and expenses which the Fund bears directly, the Fund indirectly bears a pro rata share of the fees and expenses of the acquired funds in which it invests. Such indirect expenses are not included in the reported expense ratios.
(d) Certain line items from prior years have been reclassified to conform to the current presentation.
(e) Ratios include line of credit interest expense which rounds to less than 0.01%.
(f) Total net expenses include the impact of certain waivers/reimbursements made by the Investment Manager and certain of its affiliates, if applicable.
(g) The benefits derived from expense reductions had an impact of less than 0.01%.
The accompanying Notes to Financial Statements are an integral part of this statement.
Annual Report 2013
18
Columbia Marsico International Opportunities Fund
Financial Highlights (continued)
| | | Year Ended
February 28, | | Year Ended
February 29, | | Year Ended February 28, | |
Class C | | 2013 | | 2012 | | 2011 | | 2010 | | 2009 | |
Per share data | |
Net asset value, beginning of period | | $ | 10.59 | | | $ | 11.36 | | | $ | 9.51 | | | $ | 6.39 | | | $ | 13.88 | | |
Income from investment operations: | |
Net investment income (loss) | | | 0.04 | | | | (0.07 | ) | | | (0.03 | ) | | | (0.03 | ) | | | 0.03 | (a) | |
Net realized and unrealized gain (loss) | | | 0.63 | | | | (0.70 | ) | | | 1.99 | | | | 3.26 | | | | (7.40 | ) | |
Total from investment operations | | | 0.67 | | | | (0.77 | ) | | | 1.96 | | | | 3.23 | | | | (7.37 | ) | |
Less distributions to shareholders: | |
Net investment income | | | — | | | | — | | | | (0.11 | ) | | | (0.11 | ) | | | — | | |
Net realized gains | | | — | | | | — | | | | — | | | | — | | | | (0.12 | ) | |
Total distributions to shareholders | | | — | | | | — | | | | (0.11 | ) | | | (0.11 | ) | | | (0.12 | ) | |
Redemption fees: | |
Redemption fees added to paid-in capital | | | — | | | | — | | | | — | | | | 0.00 | (b) | | | 0.00 | (b) | |
Net asset value, end of period | | $ | 11.26 | | | $ | 10.59 | | | $ | 11.36 | | | $ | 9.51 | | | $ | 6.39 | | |
Total return | | | 6.33 | % | | | (6.78 | %) | | | 20.60 | % | | | 50.67 | % | | | (53.57 | %) | |
Ratios to average net assets(c)(d) | |
Total gross expenses | | | 2.24 | %(e) | | | 2.28 | % | | | 2.26 | %(e) | | | 2.22 | % | | | 2.27 | % | |
Total net expenses(f) | | | 2.24 | %(e)(g) | | | 2.28 | %(g) | | | 2.26 | %(e)(g) | | | 2.22 | %(g) | | | 2.27 | %(g) | |
Net investment income (loss) | | | 0.37 | % | | | (0.68 | %) | | | (0.30 | %) | | | (0.35 | %) | | | 0.30 | % | |
Supplemental data | |
Net assets, end of period (in thousands) | | $ | 19,402 | | | $ | 25,608 | | | $ | 39,789 | | | $ | 44,466 | | | $ | 38,668 | | |
Portfolio turnover | | | 73 | % | | | 86 | % | | | 105 | % | | | 116 | % | | | 117 | % | |
Notes to Financial Highlights
(a) Net investment income per share reflects special dividends. The effect of these dividends amounted to $0.03 per share.
(b) Rounds to zero.
(c) In addition to the fees and expenses which the Fund bears directly, the Fund indirectly bears a pro rata share of the fees and expenses of the acquired funds in which it invests. Such indirect expenses are not included in the reported expense ratios.
(d) Certain line items from prior years have been reclassified to conform to the current presentation.
(e) Ratios include line of credit interest expense which rounds to less than 0.01%.
(f) Total net expenses include the impact of certain waivers/reimbursements made by the Investment Manager and certain of its affiliates, if applicable.
(g) The benefits derived from expense reductions had an impact of less than 0.01%.
The accompanying Notes to Financial Statements are an integral part of this statement.
Annual Report 2013
19
Columbia Marsico International Opportunities Fund
Financial Highlights (continued)
Class I | | Year Ended
February 28,
2013 | | Year Ended
February 29,
2012 | | Year Ended
February 28,
2011(a) | |
Per share data | |
Net asset value, beginning of period | | $ | 11.52 | | | $ | 12.14 | | | $ | 11.18 | | |
Income from investment operations: | |
Net investment income (loss) | | | 0.17 | | | | 0.12 | | | | (0.01 | ) | |
Net realized and unrealized gain (loss) | | | 0.71 | | | | (0.74 | ) | | | 1.17 | | |
Total from investment operations | | | 0.88 | | | | (0.62 | ) | | | 1.16 | | |
Less distributions to shareholders: | |
Net investment income | | | — | | | | — | | | | (0.20 | ) | |
Total distributions to shareholders | | | — | | | | — | | | | (0.20 | ) | |
Net asset value, end of period | | $ | 12.40 | | | $ | 11.52 | | | $ | 12.14 | | |
Total return | | | 7.64 | % | | | (5.11 | %) | | | 10.44 | % | |
Ratios to average net assets(b)(c) | |
Total gross expenses | | | 1.04 | %(d) | | | 1.12 | % | | | 1.10 | %(d)(e) | |
Total net expenses(f) | | | 1.04 | %(d) | | | 1.12 | %(g) | | | 1.10 | %(d)(e)(g) | |
Net investment income (loss) | | | 1.50 | % | | | 1.00 | % | | | (0.24 | %)(e) | |
Supplemental data | |
Net assets, end of period (in thousands) | | $ | 3 | | | $ | 3 | | | $ | 34,072 | | |
Portfolio turnover | | | 73 | % | | | 86 | % | | | 105 | % | |
Notes to Financial Highlights
(a) For the period from September 27, 2010 (commencement of operations) to February 28, 2011.
(b) In addition to the fees and expenses which the Fund bears directly, the Fund indirectly bears a pro rata share of the fees and expenses of the acquired funds in which it invests. Such indirect expenses are not included in the reported expense ratios.
(c) Certain line items from prior years have been reclassified to conform to the current presentation.
(d) Ratios include line of credit interest expense which rounds to less than 0.01%.
(e) Annualized.
(f) Total net expenses include the impact of certain waivers/reimbursements made by the Investment Manager and certain of its affiliates, if applicable.
(g) The benefits derived from expense reductions had an impact of less than 0.01%.
The accompanying Notes to Financial Statements are an integral part of this statement.
Annual Report 2013
20
Columbia Marsico International Opportunities Fund
Financial Highlights (continued)
| | | Year Ended
February 28, | | Year Ended
February 29, | | Year Ended February 28, | |
Class R | | 2013 | | 2012 | | 2011 | | 2010 | | 2009 | |
Per share data | |
Net asset value, beginning of period | | $ | 11.19 | | | $ | 11.94 | | | $ | 9.99 | | | $ | 6.73 | | | $ | 14.56 | | |
Income from investment operations: | |
Net investment income (loss) | | | 0.10 | | | | (0.02 | ) | | | 0.01 | | | | 0.01 | | | | 0.06 | (a) | |
Net realized and unrealized gain (loss) | | | 0.67 | | | | (0.73 | ) | | | 2.09 | | | | 3.45 | | | | (7.77 | ) | |
Total from investment operations | | | 0.77 | | | | (0.75 | ) | | | 2.10 | | | | 3.46 | | | | (7.71 | ) | |
Less distributions to shareholders: | |
Net investment income | | | — | | | | — | | | | (0.15 | ) | | | (0.20 | ) | | | — | | |
Net realized gains | | | — | | | | — | | | | — | | | | — | | | | (0.12 | ) | |
Total distributions to shareholders | | | — | | | | — | | | | (0.15 | ) | | | (0.20 | ) | | | (0.12 | ) | |
Redemption fees: | |
Redemption fees added to paid-in capital | | | — | | | | — | | | | — | | | | 0.00 | (b) | | | 0.00 | (b) | |
Net asset value, end of period | | $ | 11.96 | | | $ | 11.19 | | | $ | 11.94 | | | $ | 9.99 | | | $ | 6.73 | | |
Total return | | | 6.88 | % | | | (6.28 | %) | | | 21.08 | % | | | 51.73 | % | | | (53.40 | %) | |
Ratios to average net assets(c)(d) | |
Total gross expenses | | | 1.74 | %(e) | | | 1.77 | % | | | 1.76 | %(e) | | | 1.72 | % | | | 1.77 | % | |
Total net expenses(f) | | | 1.74 | %(e)(g) | | | 1.77 | %(g) | | | 1.76 | %(e)(g) | | | 1.72 | %(g) | | | 1.77 | %(g) | |
Net investment income (loss) | | | 0.88 | % | | | (0.17 | %) | | | 0.12 | % | | | 0.15 | % | | | 0.58 | % | |
Supplemental data | |
Net assets, end of period (in thousands) | | $ | 1,067 | | | $ | 1,640 | | | $ | 3,020 | | | $ | 3,327 | | | $ | 2,592 | | |
Portfolio turnover | | | 73 | % | | | 86 | % | | | 105 | % | | | 116 | % | | | 117 | % | |
Notes to Financial Highlights
(a) Net investment income per share reflects special dividends. The effect of these dividends amounted to $0.03 per share.
(b) Rounds to zero.
(c) In addition to the fees and expenses which the Fund bears directly, the Fund indirectly bears a pro rata share of the fees and expenses of the acquired funds in which it invests. Such indirect expenses are not included in the reported expense ratios.
(d) Certain line items from prior years have been reclassified to conform to the current presentation.
(e) Ratios include line of credit interest expense which rounds to less than 0.01%.
(f) Total net expenses include the impact of certain waivers/reimbursements made by the Investment Manager and certain of its affiliates, if applicable.
(g) The benefits derived from expense reductions had an impact of less than 0.01%.
The accompanying Notes to Financial Statements are an integral part of this statement.
Annual Report 2013
21
Columbia Marsico International Opportunities Fund
Financial Highlights (continued)
Class R4 | | Year Ended
February 28,
2013(a) | |
Per share data | |
Net asset value, beginning of period | | $ | 11.17 | | |
Income from investment operations: | |
Net investment income | | | 0.03 | | |
Net realized and unrealized gain | | | 1.16 | | |
Total from investment operations | | | 1.19 | | |
Net asset value, end of period | | $ | 12.36 | | |
Total return | | | 10.65 | % | |
Ratios to average net assets(b) | |
Total gross expenses | | | 1.15 | %(c)(d) | |
Total net expenses(e) | | | 1.15 | %(c)(d) | |
Net investment income | | | 0.93 | %(c) | |
Supplemental data | |
Net assets, end of period (in thousands) | | $ | 3 | | |
Portfolio turnover | | | 73 | % | |
Notes to Financial Highlights
(a) For the period from November 8, 2012 (commencement of operations) to February 28, 2013.
(b) In addition to the fees and expenses which the Fund bears directly, the Fund indirectly bears a pro rata share of the fees and expenses of the acquired funds in which it invests. Such indirect expenses are not included in the reported expense ratios.
(c) Annualized.
(d) Ratios include line of credit interest expense which rounds to less than 0.01%.
(e) Total net expenses include the impact of certain waivers/reimbursements made by the Investment Manager and certain of its affiliates, if applicable.
The accompanying Notes to Financial Statements are an integral part of this statement.
Annual Report 2013
22
Columbia Marsico International Opportunities Fund
Financial Highlights (continued)
| | | Year Ended
February 28, | | Year Ended
February 29, | | Year Ended February 28, | |
Class Z | | 2013 | | 2012 | | 2011 | | 2010 | | 2009 | |
Per share data | |
Net asset value, beginning of period | | $ | 11.44 | | | $ | 12.15 | | | $ | 10.15 | | | $ | 6.87 | | | $ | 14.79 | | |
Income from investment operations: | |
Net investment income | | | 0.16 | | | | 0.04 | | | | 0.07 | | | | 0.06 | | | | 0.15 | (a) | |
Net realized and unrealized gain (loss) | | | 0.70 | | | | (0.75 | ) | | | 2.13 | | | | 3.52 | | | | (7.95 | ) | |
Total from investment operations | | | 0.86 | | | | (0.71 | ) | | | 2.20 | | | | 3.58 | | | | (7.80 | ) | |
Less distributions to shareholders: | |
Net investment income | | | — | | | | — | | | | (0.20 | ) | | | (0.30 | ) | | | — | | |
Net realized gains | | | — | | | | — | | | | — | | | | — | | | | (0.12 | ) | |
Total distributions to shareholders | | | — | | | | — | | | | (0.20 | ) | | | (0.30 | ) | | | (0.12 | ) | |
Redemption fees: | |
Redemption fees added to paid-in capital | | | — | | | | — | | | | — | | | | 0.00 | (b) | | | 0.00 | (b) | |
Net asset value, end of period | | $ | 12.30 | | | $ | 11.44 | | | $ | 12.15 | | | $ | 10.15 | | | $ | 6.87 | | |
Total return | | | 7.52 | % | | | (5.84 | %) | | | 21.75 | % | | | 52.47 | % | | | (53.17 | %) | |
Ratios to average net assets(c)(d) | |
Total gross expenses | | | 1.24 | %(e) | | | 1.28 | % | | | 1.26 | %(e) | | | 1.22 | % | | | 1.27 | % | |
Total net expenses(f) | | | 1.24 | %(e)(g) | | | 1.28 | %(g) | | | 1.26 | %(e)(g) | | | 1.22 | %(g) | | | 1.27 | %(g) | |
Net investment income | | | 1.40 | % | | | 0.38 | % | | | 0.67 | % | | | 0.65 | % | | | 1.32 | % | |
Supplemental data | |
Net assets, end of period (in thousands) | | $ | 253,916 | | | $ | 456,645 | | | $ | 945,793 | | | $ | 968,569 | | | $ | 824,068 | | |
Portfolio turnover | | | 73 | % | | | 86 | % | | | 105 | % | | | 116 | % | | | 117 | % | |
Notes to Financial Highlights
(a) Net investment income per share reflects special dividends. The effect of these dividends amounted to $0.03 per share.
(b) Rounds to zero.
(c) In addition to the fees and expenses which the Fund bears directly, the Fund indirectly bears a pro rata share of the fees and expenses of the acquired funds in which it invests. Such indirect expenses are not included in the reported expense ratios.
(d) Certain line items from prior years have been reclassified to conform to the current presentation.
(e) Ratios include line of credit interest expense which rounds to less than 0.01%.
(f) Total net expenses include the impact of certain waivers/reimbursements made by the Investment Manager and certain of its affiliates, if applicable.
(g) The benefits derived from expense reductions had an impact of less than 0.01%.
The accompanying Notes to Financial Statements are an integral part of this statement.
Annual Report 2013
23
Columbia Marsico International Opportunities Fund
Notes to Financial Statements
February 28, 2013
Note 1. Organization
Columbia Marsico International Opportunities Fund (the Fund), a series of Columbia Funds Series Trust (the Trust), is a diversified fund. The Trust is registered under the Investment Company Act of 1940, as amended (the 1940 Act), as an open-end management investment company organized as a Delaware statutory trust.
Fund Shares
The Trust may issue an unlimited number of shares (without par value). The Fund offers Class A, Class B, Class C, Class I, Class R, Class R4 and Class Z shares. All share classes have identical voting, dividend and liquidation rights. Each share class has its own expense structure and sales charges, as applicable.
Class A shares are subject to a maximum front-end sales charge of 5.75% based on the initial investment amount. Class A shares purchased without an initial sales charge in accounts aggregating $1 million to $50 million at the time of purchase are subject to a contingent deferred sales charge (CDSC) if the shares are sold within 18 months of purchase, charged as follows: 1.00% CDSC if redeemed within 12 months of purchase, and 0.50% CDSC if redeemed more than 12, but less than 18, months after purchase.
Class B shares may be subject to a maximum CDSC of 5.00% based upon the holding period after purchase. Class B shares will generally convert to Class A shares eight years after purchase. The Fund no longer accepts investments by new or existing investors in the Fund's Class B shares, except in connection with the reinvestment of any dividend and/or capital gain distributions in Class B shares of the Fund and exchanges by existing Class B shareholders of certain other funds within the Columbia Family of Funds.
Class C shares are subject to a 1.00% CDSC on shares redeemed within one year of purchase.
Class I shares are not subject to sales charges and are only available to the Columbia Family of Funds.
Class R shares are not subject to sales charges and are only available to qualifying institutional investors.
Class R4 shares are not subject to sales charges and are only available to investors purchasing through authorized investment professionals. Class R4 shares commenced operations on November 8, 2012.
Class Z shares are not subject to sales charges, and are only available to certain investors.
Note 2. Summary of Significant Accounting Policies
Use of Estimates
The preparation of financial statements in accordance with U.S. generally accepted accounting principles (GAAP) requires management to make certain estimates and assumptions that affect the reported amounts of assets and liabilities, the disclosure of contingent assets and liabilities at the date of the financial statements and the reported amounts of revenue and expenses during the reporting period. Actual results could differ from those estimates.
The following is a summary of significant accounting policies consistently followed by the Fund in the preparation of its financial statements.
Security Valuation
All equity securities are valued at the close of business of the New York Stock Exchange (NYSE). Equity securities are valued at the last quoted sales price on the principal exchange or market on which they trade, except for securities traded on the NASDAQ Stock Market, which are valued at the NASDAQ official close price. Unlisted securities or listed securities for which there were no sales during the day are valued at the mean of the latest quoted bid and ask prices on such exchanges or markets.
Foreign securities are valued based on quotations from the principal market in which such securities are normally traded. If any foreign share prices are not readily available as a result of limited share activity the securities are valued at the mean of the latest quoted bid and ask prices on such exchanges or markets. Foreign currency exchange rates are generally determined at 4:00 p.m. Eastern (U.S.) time. However, many securities markets and exchanges outside the U.S. close prior to the close of the NYSE; therefore, the closing prices for securities in such markets or on such exchanges may not fully reflect events that occur after such close but before the close of the NYSE. In those situations, foreign securities will be fair valued pursuant to the policy adopted by the Board of Trustees (the Board), including utilizing a third party pricing service to determine these fair values. The third party pricing service takes into account multiple factors, including, but not limited to, movements in the U.S. securities markets, certain depositary receipts, futures contracts and foreign exchange rates that have occurred subsequent to the close of the foreign exchange or market, to determine a good faith estimate that reasonably reflects the current market conditions as of the close of the NYSE. The fair value of a security is likely to be different from the quoted or published price, if available.
Annual Report 2013
24
Columbia Marsico International Opportunities Fund
Notes to Financial Statements (continued)
February 28, 2013
Investments in other open-end investment companies, including money market funds, are valued at net asset value.
Investments for which market quotations are not readily available, or that have quotations which management believes are not reliable, are valued at fair value as determined in good faith under consistently applied procedures established by and under the general supervision of the Board. If a security or class of securities (such as foreign securities) is valued at fair value, such value is likely to be different from the last quoted market price for the security.
The determination of fair value often requires significant judgment. To determine fair value, management may use assumptions including but not limited to future cash flows and estimated risk premiums. Multiple inputs from various sources may be used to determine fair value.
Foreign Currency Transactions and Translations
The values of all assets and liabilities denominated in foreign currencies are translated into U.S. dollars at that day's exchange rates. Net realized and unrealized gains (losses) on foreign currency transactions and translations include gains (losses) arising from the fluctuation in exchange rates between trade and settlement dates on securities transactions, gains (losses) arising from the disposition of foreign currency and currency gains (losses) between the accrual and payment dates on dividends, interest income and foreign withholding taxes.
For financial statement purposes, the Fund does not distinguish that portion of gains (losses) on investments which is due to changes in foreign exchange rates from that which is due to changes in market prices of the investments. Such fluctuations are included with the net realized and unrealized gains (losses) on investments in the Statement of Operations.
Security Transactions
Security transactions are accounted for on the trade date. Cost is determined and gains (losses) are based upon the specific identification method for both financial statement and federal income tax purposes.
Income Recognition
Corporate actions and dividend income are recorded net of any non-reclaimable tax withholdings, on the ex-dividend date or upon receipt of ex-dividend notification in the case of certain foreign securities.
Awards from class action litigation are recorded as a reduction of cost basis if the Fund still owns the applicable securities on the payment date. If the Fund no longer owns the applicable securities, the proceeds are recorded as realized gains.
Expenses
General expenses of the Trust are allocated to the Fund and other funds of the Trust based upon relative net assets or other expense allocation methodologies determined by the nature of the expense. Expenses directly attributable to the Fund are charged to the Fund. Expenses directly attributable to a specific class of shares are charged to that share class.
Determination of Class Net Asset Value
All income, expenses (other than class-specific expenses, which are charged to that share class, as shown in the Statement of Operations) and realized and unrealized gains (losses) are allocated to each class of the Fund on a daily basis, based on the relative net assets of each class, for purposes of determining the net asset value of each class.
Federal Income Tax Status
The Fund intends to qualify each year as a regulated investment company under Subchapter M of the Internal Revenue Code, as amended, and will distribute substantially all of its taxable income (including net short-term capital gains), if any, for its tax year, and as such will not be subject to federal income taxes. In addition, the Fund intends to distribute in each calendar year substantially all of its net investment income, capital gains and certain other amounts, if any, such that the Fund should not be subject to federal excise tax. Therefore, no federal income or excise tax provision is recorded.
Foreign Taxes
The Fund may be subject to foreign taxes on income, gains on investments or currency repatriation, a portion of which may be recoverable. The Fund will accrue such taxes and recoveries, as applicable, based upon its current interpretation of tax rules and regulations that exist in the markets in which it invests.
Realized gains in certain countries may be subject to foreign taxes at the Fund level, based on statutory rates. The Fund accrues for such foreign taxes on net realized and unrealized gains at the appropriate rate for each jurisdiction, as applicable. The amount, if any, is disclosed as a liability on the Statement of Assets and Liabilities.
Distributions to Shareholders
Distributions from net investment income, if any, are declared and paid semi-annually. Net realized capital gains, if any, are distributed at least annually. Income distributions and capital gain distributions are determined in accordance with federal income tax regulations, which may differ from GAAP.
Guarantees and Indemnifications
Under the Trust's organizational documents and, in some cases, by contract, its officers and trustees are indemnified against certain liabilities arising out of the performance of
Annual Report 2013
25
Columbia Marsico International Opportunities Fund
Notes to Financial Statements (continued)
February 28, 2013
their duties to the Trust or its funds. In addition, certain of the Fund's contracts with its service providers contain general indemnification clauses. The Fund's maximum exposure under these arrangements is unknown since the amount of any future claims that may be made against the Fund cannot be determined, and the Fund has no historical basis for predicting the likelihood of any such claims.
Recent Accounting Pronouncement
Disclosures about Offsetting Assets and Liabilities
In December 2011, the Financial Accounting Standards Board (FASB) issued Accounting Standards Update (ASU) No. 2011-11, Disclosures about Offsetting Assets and Liabilities. The objective of the FASB is to enhance current disclosure requirements on offsetting of certain assets and liabilities and to enable financial statement users to compare financial statements prepared under GAAP and International Financial Reporting Standards.
Specifically, ASU No. 2011-11 requires an entity to disclose both gross and net information for derivatives and other financial instruments that are subject to a master netting arrangement or similar agreement. The standard requires disclosure of collateral received in connection with the master netting agreements or similar agreements. The effective date of ASU No. 2011-11 is for interim and annual periods beginning on or after January 1, 2013. At this time, management is evaluating the implications of this guidance and the impact it will have on the financial statement amounts and footnote disclosures, if any.
Note 3. Fees and Compensation Paid to Affiliates
Investment Management Fees
Under an Investment Management Services Agreement, Columbia Management Investment Advisers, LLC (the Investment Manager), a wholly-owned subsidiary of Ameriprise Financial, Inc. (Ameriprise Financial), is responsible for the ultimate oversight of investment made by the Fund. The Fund's subadviser (see Subadvisory Agreement below) has the primary responsibility for the day-to-day portfolio management of the Fund. Effective January 23, 2013, the investment management fee is an annual fee that is equal to a percentage of the Fund's average daily net assets that declines from 0.79% to 0.62% as the Fund's net assets increase. Prior to January 23, 2013, the investment management fee was equal to 0.80% of the Fund's average daily net assets. The effective investment management fee rate for the year ended February 28, 2013 was 0.80% of the Fund's average daily net assets.
Prior to June 30, 2012, to the extent that the Fund was not benefitting from a separate contractual expense limitation
arrangement, the Investment Manager contractually agreed to waive a portion of its investment management fee. In the absence of a separate contractual expense limitation arrangement, the investment management fee waiver for the Fund was equal to a percentage of the Fund's pro-rata portion of the combined average daily net assets of the Fund and other affiliated funds managed by the Investment Manager and sub-advised by Marsico Capital Management, LLC (Marsico), at a rate that increased from 0.00% to 0.10% as the combined daily net assets increased.
For the year ended February 28, 2013, no investment management fees were waived for the Fund.
Subadvisory Agreement
The Investment Manager has entered into a Subadvisory Agreement with Marsico to subadvise the assets of the Fund. The Investment Manager compensates Marsico to manage the investment of the Fund's assets.
Administration Fees
Under an Administrative Services Agreement, the Investment Manager also serves as the Fund Administrator. Effective January 23, 2013, the Fund pays the Fund Administrator an annual fee for administration and accounting services equal to a percentage of the Fund's average daily net assets that declines from 0.08% to 0.05% as the Fund's net assets increase. Prior to January 23, 2013, the administration fee was equal to 0.22% of the Fund's average daily net assets. The effective administration fee rate for the year ended February 28, 2013 was 0.21% of the Fund's average daily net assets.
Other Expenses
Other expenses are for, among other things, certain expenses of the Fund or the Board, including: Fund boardroom and office expense, employee compensation, employee health and retirement benefits, and certain other expenses. Payment of these Fund and Board expenses is facilitated by a company providing limited administrative services to the Fund and the Board. For the year ended February 28, 2013, other expenses paid to this company were $2,307.
Compensation of Board Members
Board members are compensated for their services to the Fund as disclosed in the Statement of Operations. Under a Deferred Compensation Plan (the Plan), the Board members who are not "interested persons" of the Fund, as defined under the 1940 Act, may elect to defer payment of up to 100% of their compensation. Deferred amounts are treated as though equivalent dollar amounts had been invested in shares of certain funds managed by the Investment Manager. The Fund's liability for these amounts is adjusted for market value
Annual Report 2013
26
Columbia Marsico International Opportunities Fund
Notes to Financial Statements (continued)
February 28, 2013
changes and remains in the Fund until distributed in accordance with the Plan.
Transfer Agent Fees
Under a Transfer and Dividend Disbursing Agent Agreement, Columbia Management Investment Services Corp. (the Transfer Agent), an affiliate of the Investment Manager and a wholly-owned subsidiary of Ameriprise Financial, is responsible for providing transfer agency services to the Fund. The Transfer Agent has contracted with Boston Financial Data Services (BFDS) to serve as sub-transfer agent.
The Transfer Agent receives monthly account-based service fees based on the number of open accounts and is reimbursed by the Fund for the fees and expenses the Transfer Agent pays to financial intermediaries that maintain omnibus accounts with the Fund that is a percentage of the average aggregate value of the Fund's shares maintained in each such omnibus account (other than omnibus accounts for which American Enterprise Investment Services Inc. is the broker of record or accounts where the beneficial shareholder is a customer of Ameriprise Financial Services, Inc., which are paid a per account fee). The Transfer Agent pays the fees of BFDS for services as sub-transfer agent and is not entitled to reimbursement for such fees from the Fund (with the exception of out-of-pocket fees).
The Transfer Agent also receives compensation from fees for various shareholder services and reimbursements for certain out-of-pocket fees. Class I shares do not pay transfer agent fees.
For the year ended February 28, 2013, the Fund's effective transfer agent fee rates as a percentage of average daily net assets of each class were as follows:
Class A | | | 0.18 | % | |
Class B | | | 0.18 | | |
Class C | | | 0.18 | | |
Class R | | | 0.18 | | |
Class R4 | | | 0.16 | * | |
Class Z | | | 0.18 | | |
*Annualized.
An annual minimum account balance fee of $20 may apply to certain accounts with a value below the Fund's initial minimum investment requirements to reduce the impact of small accounts on transfer agent fees. These minimum account balance fees are recorded as part of expense reductions in the Statement of Operations. For the year ended February 28, 2013, these minimum account balance fees reduced total expenses by $840.
Distribution and Service Fees
The Fund has an agreement with Columbia Management Investment Distributors, Inc. (the Distributor), an affiliate of
the Investment Manager and a wholly-owned subsidiary of Ameriprise Financial, for distribution and shareholder services. Pursuant to Rule 12b-1 under the 1940 Act, the Board has approved, and the Fund has adopted, distribution and shareholder service plans (the Plans) which set the distribution and service fees for the Fund. These fees are calculated daily and are intended to compensate the Distributor and/or eligible selling and/or servicing agents for selling shares of the Fund and providing services to investors.
The Plans require the payment of a monthly combined distribution and service fee to the Distributor at the maximum annual rate of 0.25% of the average daily net assets attributable to Class A shares of the Fund. The Plans also require the payment of a monthly service fee at the maximum annual rate of 0.25% of the average daily net assets attributable to Class B and Class C shares of the Fund and the payment of a monthly distribution fee at the maximum annual rates of 0.75%, 0.75% and 0.50% of the average daily net assets attributable to Class B, Class C and Class R shares, respectively.
Sales Charges
Sales charges, including front-end charges and CDSCs, received by the Distributor for distributing Fund shares were $18,959 for Class A, $7,973 for Class B and $258 for Class C shares for the year ended February 28, 2013.
Expenses Waived/Reimbursed by the Investment Manager and its Affiliates
Effective July 1, 2012, the Investment Manager and certain of its affiliates have contractually agreed to waive fees and/or reimburse expenses (excluding certain fees and expenses described below), through June 30, 2013, unless sooner terminated at the sole discretion of the Board, so that the Fund's net operating expenses, after giving effect to fees waived/expenses reimbursed and any balance credits and/or overdraft charges from the Fund's custodian, do not exceed the following annual rates as a percentage of the class' average daily net assets:
Class A | | | 1.49 | % | |
Class B | | | 2.24 | | |
Class C | | | 2.24 | | |
Class I | | | 1.11 | | |
Class R | | | 1.74 | | |
Class R4* | | | 1.24 | | |
Class Z | | | 1.24 | | |
*Annual rate is contractual from November 8, 2012 (the commencement of operations of Class R4 shares) through November 8, 2013.
Annual Report 2013
27
Columbia Marsico International Opportunities Fund
Notes to Financial Statements (continued)
February 28, 2013
Prior to July 1, 2012, the Investment Manager and certain of its affiliates contractually agreed to waive fees and/or reimburse expenses (excluding certain fees and expenses described below), so that the Fund's net operating expenses, after giving effect to fees waived/expenses reimbursed and any balance credits and/or overdraft charges from the Fund's custodian, did not exceed the following annual rates as a percentage of the class' average daily net assets:
Class A | | | 1.60 | % | |
Class B | | | 2.35 | | |
Class C | | | 2.35 | | |
Class I | | | 1.25 | | |
Class R | | | 1.85 | | |
Class Z | | | 1.35 | | |
Under the agreement, the following fees and expenses are excluded from the waiver/reimbursement commitment, and therefore will be paid by the Fund, if applicable: taxes (including foreign transaction taxes), expenses associated with investments in affiliated and non-affiliated pooled investment vehicles (including mutual funds and exchange traded funds), transaction costs and brokerage commissions, costs related to any securities lending program, dividend expenses associated with securities sold short, inverse floater program fees and expenses, transaction charges and interest on borrowed money, interest, extraordinary expenses and any other expenses the exclusion of which is specifically approved by the Board. This agreement may be modified or amended only with approval from all parties.
Note 4. Federal Tax Information
The timing and character of income and capital gain distributions are determined in accordance with income tax regulations, which may differ from GAAP because of temporary or permanent book to tax differences.
At February 28, 2013, these differences are primarily due to differing treatment for capital loss carryforwards, deferral/reversal of wash sales losses, Trustees' deferred compensation, foreign currency transactions and passive foreign investment company (PFIC) holdings. To the extent these differences are permanent, reclassifications are made among the components of the Fund's net assets in the Statement of Assets and Liabilities. Temporary differences do not require reclassifications. In the Statement of Assets and Liabilities the following reclassifications were made:
Undistributed net investment income | | $ | 1,917,411 | | |
Accumulated net realized gain | | | (1,917,411 | ) | |
Paid-in capital | | | — | | |
Net investment income and net realized gains (losses), as disclosed in the Statement of Operations, and net assets were not affected by this reclassification.
For the years ended February 28, 2013 and February 29, 2012, there were no distributions.
At February 28, 2013, the components of distributable earnings on a tax basis were as follows:
Undistributed ordinary income | | $ | 3,728,037 | | |
Accumulated realized loss | | | (671,495,970 | ) | |
Unrealized appreciation | | | 67,649,425 | | |
At February 28, 2013, the cost of investments for federal income tax purposes was $303,826,946 and the aggregate gross unrealized appreciation and depreciation based on that cost was:
Unrealized appreciation | | $ | 71,487,448 | | |
Unrealized depreciation | | | (3,838,023 | ) | |
Net unrealized appreciation | | $ | 67,649,425 | | |
The following capital loss carryforward, determined at February 28, 2013, may be available to reduce taxable income arising from future net realized gains on investments, if any, to the extent permitted by the Internal Revenue Code:
Year of Expiration | | Amount ($) | |
2017 | | | 250,947,376 | | |
2018 | | | 420,548,594 | | |
Total | | | 671,495,970 | | |
For the year ended February 28, 2013, $38,623,495 of capital loss carryforward was utilized.
Management of the Fund has concluded that there are no significant uncertain tax positions that would require recognition in the financial statements. However, management's conclusion may be subject to review and adjustment at a later date based on factors including, but not limited to, new tax laws, regulations, and administrative interpretations (including relevant court decisions). Generally, the Fund's federal tax returns for the prior three fiscal years remain subject to examination by the Internal Revenue Service.
Note 5. Portfolio Information
The cost of purchases and proceeds from sales of securities, excluding short-term obligations, aggregated to $308,834,246 and $545,114,584, respectively, for the year ended February 28, 2013.
Note 6. Lending of Portfolio Securities
Effective December 19, 2012, the Fund no longer participates in securities lending activity. Prior to that date, the Fund participated, or was eligible to participate, in securities lending activity pursuant to a Master Securities Lending Agreement
Annual Report 2013
28
Columbia Marsico International Opportunities Fund
Notes to Financial Statements (continued)
February 28, 2013
(the Agreement) with JPMorgan Chase Bank, N.A. (JPMorgan). The Agreement authorized JPMorgan as lending agent to lend securities to authorized borrowers in order to generate additional income on behalf of the Fund. Pursuant to the Agreement, the securities loaned were secured by cash or securities that either were issued or guaranteed as to principal and interest by the U.S. government, its agencies, authorities or instrumentalities with value equal to at least 100% of the market value of the loaned securities. Any additional collateral required to maintain those levels due to market fluctuations of the loaned securities was requested to be delivered the following business day. Cash collateral received was invested by the lending agent on behalf of the Fund into authorized investments pursuant to the Agreement.
Pursuant to the Agreement, the Fund received income for lending its securities either in the form of fees or by earning interest on invested cash collateral, net of negotiated rebates paid to borrowers and fees paid to the lending agent for services provided and any other securities lending expenses. Net income earned from securities lending for the year ended February 28, 2013 is disclosed in the Statement of Operations. The Fund continued to earn and accrue interest and dividends on the securities loaned.
Note 7. Affiliated Money Market Fund
The Fund invests its daily cash balances in Columbia Short-Term Cash Fund, an affiliated money market fund established for the exclusive use by the Fund and other affiliated funds. The income earned by the Fund from such investments is included as "Dividends — affiliated issuers" in the Statement of Operations. As an investing fund, the Fund indirectly bears its proportionate share of the expenses of Columbia Short-Term Cash Fund.
Note 8. Shareholder Concentration
At February 28, 2013, two unaffiliated shareholder accounts owned an aggregate of 63.3% of the outstanding shares of the Fund. The Fund has no knowledge about whether any portion of those shares was owned beneficially by such accounts. Subscription and redemption activity by concentrated accounts may have a significant effect on the operations of the Fund.
Note 9. Line of Credit
The Fund has entered into a revolving credit facility with a syndicate of banks led by JPMorgan whereby the Fund may borrow for the temporary funding of shareholder redemptions or for other temporary or emergency purposes. The credit facility agreement, as amended, which is a collective agreement between the Fund and certain other funds managed by the Investment Manager, severally and not jointly, permits
collective borrowings up to $500 million. Interest is charged to each participating fund based on its borrowings at a rate equal to the higher of (i) the overnight federal funds rate plus 1.00% or (ii) the one-month LIBOR rate plus 1.00%. Each borrowing under the credit facility matures no later than 60 days after the date of borrowing. The Fund also pays a commitment fee equal to its pro rata share of the amount of the credit facility at a rate of 0.08% per annum.
For the year ended February 28, 2013, the average daily loan balance outstanding on days when borrowing existed was $14,542,857 at a weighted average interest rate of 1.22%.
Note 10. Significant Risks
Foreign Securities Risk
Investing in foreign securities may include certain risks and considerations not typically associated with investing in U.S. securities, such as fluctuating currency values and changing local and regional economic, political and social conditions, which may result in greater market volatility. In addition, certain foreign securities may not be as liquid as U.S. securities. Investing in emerging markets may accentuate these risks.
Investments in emerging market countries are subject to additional risk. The risk of foreign investments is typically increased in less developed countries. These countries are also more likely to experience high levels of inflation, deflation or currency devaluation which could hurt their economies and securities markets.
Note 11. Subsequent Events
Management has evaluated the events and transactions that have occurred through the date the financial statements were issued and noted no items requiring adjustment of the financial statements or additional disclosure.
Note 12. Information Regarding Pending and Settled Legal Proceedings
In December 2005, without admitting or denying the allegations, American Express Financial Corporation (AEFC, which is now known as Ameriprise Financial, Inc. (Ameriprise Financial)) entered into settlement agreements with the Securities and Exchange Commission (SEC) and Minnesota Department of Commerce (MDOC) related to market timing activities. As a result, AEFC was censured and ordered to cease and desist from committing or causing any violations of certain provisions of the Investment Advisers Act of 1940, the Investment Company Act of 1940, and various Minnesota laws. AEFC agreed to pay disgorgement of $10 million and civil money penalties of $7 million. AEFC also agreed to retain an independent distribution consultant to assist in developing a
Annual Report 2013
29
Columbia Marsico International Opportunities Fund
Notes to Financial Statements (continued)
February 28, 2013
plan for distribution of all disgorgement and civil penalties ordered by the SEC in accordance with various undertakings detailed at www.sec.gov/litigation/admin/ia-2451.pdf. Ameriprise Financial and its affiliates have cooperated with the SEC and the MDOC in these legal proceedings, and have made regular reports to the funds' Boards of Trustees.
Ameriprise Financial and certain of its affiliates have historically been involved in a number of legal, arbitration and regulatory proceedings, including routine litigation, class actions, and governmental actions, concerning matters arising in connection with the conduct of their business activities. Ameriprise Financial believes that the Funds are not currently the subject of, and that neither Ameriprise Financial nor any of its affiliates are the subject of, any pending legal, arbitration or regulatory proceedings that are likely to have a material adverse effect on the Funds or the ability of Ameriprise Financial or its affiliates to perform under their contracts with the Funds. Ameriprise Financial is required to make 10-Q, 10-K and, as necessary, 8-K filings with the Securities and Exchange Commission on legal and regulatory matters that relate to Ameriprise Financial and its affiliates. Copies of these filings may be obtained by accessing the SEC website at www.sec.gov.
There can be no assurance that these matters, or the adverse publicity associated with them, will not result in increased fund redemptions, reduced sale of fund shares or other adverse consequences to the Funds. Further, although we believe proceedings are not likely to have a material adverse effect on the Funds or the ability of Ameriprise Financial or its affiliates to perform under their contracts with the Funds, these proceedings are subject to uncertainties and, as such, we are unable to estimate the possible loss or range of loss that may result. An adverse outcome in one or more of these proceedings could result in adverse judgments, settlements, fines, penalties or other relief that could have a material adverse effect on the consolidated financial condition or results of operations of Ameriprise Financial.
Annual Report 2013
30
Columbia Marsico International Opportunities Fund
Report of Independent Registered Public Accounting Firm
To the Trustees of Columbia Funds Series Trust and
the Shareholders of Columbia Marsico International Opportunities Fund
In our opinion, the accompanying statement of assets and liabilities, including the portfolio of investments, and the related statements of operations and of changes in net assets and the financial highlights present fairly, in all material respects, the financial position of Columbia Marsico International Opportunities Fund (the "Fund") (a series of Columbia Funds Series Trust) at February 28, 2013, the results of its operations for the year then ended, the changes in its net assets for each of the two years in the period then ended and the financial highlights for each of the periods indicated, in conformity with accounting principles generally accepted in the United States of America. These financial statements and financial highlights (hereafter referred to as "financial statements") are the responsibility of the Fund's management. Our responsibility is to express an opinion on these financial statements based on our audits. We conducted our audits of these financial statements in accordance with the standards of the Public Company Accounting Oversight Board (United States). Those standards require that we plan and perform the audit to obtain reasonable assurance about whether the financial statements are free of material misstatement. An audit includes examining, on a test basis, evidence supporting the amounts and disclosures in the financial statements, assessing the accounting principles used and significant estimates made by management, and evaluating the overall financial statement presentation. We believe that our audits, which included confirmation of securities at February 28, 2013 by correspondence with the custodian, transfer agent and brokers, provide a reasonable basis for our opinion.
PricewaterhouseCoopers LLP
Minneapolis, Minnesota
April 19, 2013
Annual Report 2013
31
Columbia Marsico International Opportunities Fund
Federal Income Tax Information
(Unaudited)
The Fund hereby designates the following tax attributes for the fiscal year ended February 28, 2013. Shareholders will be notified in early 2014 of the amounts for use in preparing 2013 income tax returns.
Tax Designations:
Foreign Taxes Paid | | $ | 601,944 | | |
Foreign Source Income | | $ | 9,559,996 | | |
Foreign Taxes. The Fund makes the election to pass through to shareholders the foreign taxes paid. These taxes, and the corresponding foreign source income, are provided.
Annual Report 2013
32
Columbia Marsico International Opportunities Fund
Shareholders elect the Board that oversees the funds' operations. The Board appoints officers who are responsible for day-to-day business decisions based on policies set by the Board. The following table provides basic biographical information about the funds' Board members, including their principal occupations during the past five years, although specific titles for individuals may have varied over the period. Under current Board policy, members may serve until the next Board meeting after he or she reaches the mandatory retirement age established by the Board, or the fifteenth anniversary of the first Board meeting they attended as a member of the Board.
Mr. Edward J. Boudreau, Jr., Mr. William P. Carmichael, Mr. William A. Hawkins, Mr. R. Glenn Hilliard, Ms. Minor M. Shaw and Dr. Anthony M. Santomero, were members of the Legacy Columbia Nations funds' Board ("Nations Funds"), which includes Columbia Funds Series Trust, Columbia Funds Variable Insurance Trust I and Columbia Funds Master Investment Trust, LLC and began service on the Board for the Legacy RiverSource funds ("RiverSource Funds") effective June 1, 2011.
Independent Trustees
Name,
Address,
Year of Birth | | Position Held With
Funds and Length of
Service | | Principal Occupation
During Past Five Years | | Number of
Funds in the
Fund Family
Overseen by
Board Member | | Other Present or Past
Directorships/Trusteeships
(Within Past 5 Years) | |
Kathleen Blatz
901 S. Marquette Ave.
Minneapolis, MN 55402
1954 | | Board member since 1/06 for RiverSource Funds and since 6/11 for Nations Funds | | Attorney; Chief Justice, Minnesota Supreme Court, 1998-2006 | | | 153 | | | Director, BlueCross BlueShield of Minnesota since 2009 | |
Edward J. Boudreau, Jr.
901 S. Marquette Ave.
Minneapolis, MN 55402
1944 | | Board member since 6/11 for RiverSource Funds and since 1/05 for Nations Funds | | Managing Director, E.J. Boudreau & Associates (consulting) since 2000 | | | 151 | | | Former Trustee, BofA Funds Series Trust (11 funds) | |
Pamela G. Carlton
901 S. Marquette Ave.
Minneapolis, MN 55402
1954 | | Board member since 7/07 for RiverSource Funds and since 6/11 for Nations Funds | | President, Springboard — Partners in Cross Cultural Leadership (consulting company) since 2003 | | | 153 | | | None | |
William P. Carmichael
901 S. Marquette Ave.
Minneapolis, MN 55402
1943 | | Board member since 6/11 for RiverSource Funds and since 1999 for Nations Funds | | Retired | | | 151 | | | Director, Cobra Electronics Corporation (electronic equipment manufacturer); The Finish Line (athletic shoes and apparel) since July 2003; McMoRan Exploration Company (oil and gas exploration and development) since 2010; former Trustee, BofA Funds Series Trust (11 funds); former Director, Spectrum Brands, Inc. (consumer products); former Director, Simmons Company (bedding) | |
Patricia M. Flynn
901 S. Marquette Ave.
Minneapolis, MN 55402
1950 | | Board member since 11/04 for RiverSource Funds and since 6/11 for Nations Funds | | Trustee Professor of Economics and Management, Bentley University since 1976 | | | 153 | | | None | |
William A. Hawkins
901 S. Marquette Ave.
Minneapolis, MN 55402
1942 | | Board member since 6/11 for RiverSource Funds and since 1/05 for Nations Funds | | Managing Director, Overton Partners (financial consulting), since August 2010; President and Chief Executive Officer, California General Bank, N.A., January 2008-August 2010. | | | 151 | | | Trustee, BofA Funds Series Trust (11 funds) | |
Annual Report 2013
33
Columbia Marsico International Opportunities Fund
Trustees and Officers (continued)
Independent Trustees (continued)
Name,
Address,
Year of Birth | | Position Held With
Funds and Length of
Service | | Principal Occupation
During Past Five Years | | Number of
Funds in the
Fund Family
Overseen by
Board Member | | Other Present or Past
Directorships/Trusteeships
(Within Past 5 Years) | |
R. Glenn Hilliard
901 S. Marquette Ave.
Minneapolis, MN 55402
1943 | | Board member since 6/11 for RiverSource Funds and since 1/05 for Nations Funds | | Chairman and Chief Executive Officer, Hilliard Group LLC (investing and consulting), since April 2003; Non-Executive Director & Chairman, CNO Financial Group, Inc. (insurance), September 2003-May 2011 | | | 151 | | | Chairman, BofA Fund Series Trust (11 funds); former Director, CNO Financial Group, Inc. (insurance) | |
Stephen R. Lewis, Jr.
901 S. Marquette Ave.
Minneapolis, MN 55402
1939 | | Chair of the Board for RiverSource Funds since 1/07, Board member for RiverSource Funds since 1/02 and since 6/11 for Nations Funds | | President Emeritus and Professor of Economics Emeritus, Carleton College since 2002 | | | 153 | | | Director, Valmont Industries, Inc. (manufacturer of irrigation systems) since 2002 | |
Catherine James Paglia
901 S. Marquette Ave.
Minneapolis, MN 55402
1952 | | Board member since 11/04 for RiverSource Funds and since 6/11 for Nations Funds | | Director, Enterprise Asset Management, Inc. (private real estate and asset management company) | | | 153 | | | Director, Valmont Industries, Inc. (manufacturer of irrigation systems) since 2012 | |
Leroy C. Richie
901 S. Marquette Ave.
Minneapolis, MN 55402
1941 | | Board member since 2000 for Legacy Seligman Funds, since 11/08 for RiverSource Funds and since 6/11 for Nations Funds | | Counsel, Lewis & Munday, P.C. (law firm) since 2004; former Vice President and General Counsel, Automotive Legal Affairs, Chrysler Corporation from 1983-1987 | | | 153 | | | Lead Outside Director, Digital Ally, Inc. (digital imaging) since September 2005; Director, Infinity, Inc. (oil and gas exploration and production) since 1994; Director, OGE Energy Corp. (energy and energy services) since November 2007 | |
Minor M. Shaw
901 S. Marquette Ave.
Minneapolis, MN 55402
1947 | | Board member since 6/11 for RiverSource Funds and since 2003 for Nations Funds | | President, Micco LLC (private investments) since 2011; President Micco Corp. since 1998 | | | 151 | | | Director, Piedmont Natural Gas; Director, BlueCross BlueShield of South Carolina since April 2008; Former Trustee, BofA Funds Series Trust (11 funds) | |
Alison Taunton-Rigby
901 S. Marquette Ave.
Minneapolis, MN 55402
1944 | | Board member since 11/02 for RiverSource Funds and since 6/11 for Nations Funds | | Chief Executive Officer and Director, RiboNovix, Inc. (biotechnology), 2003-2010 | | | 153 | | | Director, Healthways, Inc. (health and well-being improvement) since 2005; Director, ICI Mutual Insurance Company, RRG since 2011; Director, Abt Associates (government contractor) since 2001; Director, Boston Children's Hospital since 2002 | |
Annual Report 2013
34
Columbia Marsico International Opportunities Fund
Trustees and Officers (continued)
Interested Trustee Not Affiliated With Investment Manager*
Name,
Address,
Year of Birth | | Position Held With
Funds and Length of
Service | | Principal Occupation
During Past Five Years | | Number of
Funds in the
Fund Family
Overseen by
Board Member | | Other Present or Past
Directorships/Trusteeships
(Within Past 5 Years) | |
Anthony M. Santomero
901 S. Marquette Ave.
Minneapolis, MN 55402
1946 | | Board member since 6/11 for RiverSource Funds and since 1/08 for Nations Funds | | Richard K. Mellon Professor Emeritus of Finance, The Wharton School, University of Pennsylvania, since 2002; Senior Advisor, McKinsey & Company (consulting), 2006-2008 | | | 151 | | | Director, Renaissance Reinsurance Ltd. since May 2008; Trustee, Penn Mutual Life Insurance Company since March 2008; Director, Citigroup since 2009; Director, Citibank, N.A. since 2009; former Trustee, BofA Funds Series Trust (11 funds) | |
*Dr. Santomero is not an affiliated person of the investment manager or Ameriprise Financial. However, he is currently deemed by the funds to be an "interested person" (as defined in the 1940 Act) of the funds because he serves as a Director of Citigroup, Inc. and Citibank N.A., companies that may directly or through subsidiaries and affiliates engage from time-to-time in brokerage execution, principal transactions and lending relationships with the funds or accounts advised/managed by the investment manager.
Interested Trustee Affiliated With Investment Manager*
Name,
Address,
Year of Birth | | Position Held With
Funds and Length of
Service | | Principal Occupation
During Past Five Years | | Number of
Funds in the
Fund Family
Overseen by
Board Member | | Other Present or Past
Directorships/Trusteeships
(Within Past 5 Years) | |
William F. Truscott
53600 Ameriprise
Financial Center
Minneapolis, MN 55474
1960 | | Board member since 11/01 for RiverSource Funds and since 6/11 for Nations Funds; Senior Vice President since 2002 for RiverSource Funds and 5/10 for Nations Funds | | President, Columbia Management Investment Advisers, LLC since February 2012, (previously President, Chairman of the Board and Chief Investment Officer, 2001-April 2010); Chief Executive Officer, Global Asset Management, Ameriprise Financial, Inc. since September 2012 (previously Chief Executive Officer, U.S. Asset Management & President, Annuities, May 2010-September 2012 and President — U.S. Asset Management and Chief Investment Officer, 2005-April 2010); Chief Executive Officer, Columbia Management Investment Distributors, Inc. since February 2012, (previously Chairman of the Board and Chief Executive Officer, 2006-April 2010); Chairman of the Board and Chief Executive Officer, RiverSource Distributors, Inc. since 2006; President and Chief Executive Officer, Ameriprise Certificate Company 2006-August 2012 | | | 210 | | | Chairman of the Board, Columbia Management Investment Advisers, LLC since May 2010; Director, Columbia Management Investment Distributors, Inc. since May 2010; Director, Ameriprise Certificate Company, 2006-January 2013 | |
*Interested person (as defined under the 1940 Act) by reason of being an officer, director, security holder and/or employee of the investment manager or Ameriprise Financial.
The SAI has additional information about the Fund's Board members and is available, without charge, upon request by calling 800.345.6611; contacting your financial intermediary; or visiting columbiamanagement.com.
Annual Report 2013
35
Columbia Marsico International Opportunities Fund
Trustees and Officers (continued)
The Board has appointed officers who are responsible for day-to-day business decisions based on policies it has established. The officers serve at the pleasure of the Board. In addition to Mr. Truscott, who is Senior Vice President, the funds' other officers are:
Officers
Name,
Address,
Year of Birth | | Position Held With
Funds and Length of
Service | | Principal Occupation During Past Five Years | |
J. Kevin Connaughton
225 Franklin Street
Boston, MA 02110
1964 | | President and Principal Executive Officer since 5/10 for RiverSource Funds and 2009 for Nations Funds | | Senior Vice President and General Manager — Mutual Fund Products, Columbia Management Investment Advisers, LLC since May 2010; Managing Director of Columbia Management Advisors, LLC, December 2004-April 2010; Senior Vice President and Chief Financial Officer, Columbia Funds, June 2008-January 2009; Treasurer, Columbia Funds, October 2003-May 2008 | |
Amy K. Johnson
5228 Ameriprise Financial Center Minneapolis, MN 55474
1965 | | Vice President since 12/06 for RiverSource Funds and 5/10 for Nations Funds | | Senior Vice President and Chief Operating Officer, Columbia Management Investment Advisers, LLC since May 2010 (previously Chief Administrative Officer, 2009-April 2010 and Vice President — Asset Management and Trust Company Services, 2006-2009) | |
Michael G. Clarke
225 Franklin Street
Boston, MA 02110
1969 | | Treasurer since 1/11 and Chief Financial Officer since 4/11 for RiverSource Funds and Treasurer since 3/11 and Chief Financial Officer since 2009 for Nations Funds | | Vice President, Columbia Management Investment Advisers, LLC since May 2010; Managing Director of Fund Administration, Columbia Management Advisors, LLC, September 2004-April 2010; senior officer of Columbia Funds and affiliated funds since 2002 | |
Scott R. Plummer
5228 Ameriprise Financial Center Minneapolis, MN 55474
1959 | | Senior Vice President and Chief Legal Officer since 12/06 and Assistant Secretary since 6/11 for RiverSource Funds and Senior Vice President and Chief Legal Officer since 5/10 and Assistant Secretary since 6/11 for Nations Funds | | Senior Vice President, Chief Legal Officer and Assistant Secretary, Columbia Management Investment Advisers, LLC since June 2005; Vice President and Lead Chief Counsel — Asset Management, Ameriprise Financial, Inc. since May 2010 (previously Vice President and Chief Counsel — Asset Management, 2005-April 2010); Vice President, Chief Counsel and Assistant Secretary, Columbia Management Investment Distributors, Inc. since 2008; Vice President, General Counsel and Secretary, Ameriprise Certificate Company since 2005; Chief Counsel, RiverSource Distributors, Inc. since 2006 | |
Colin Moore
225 Franklin Street
Boston, MA 02110
1958 | | Senior Vice President since 5/10 for RiverSource Funds and Nations Funds | | Director and Chief Investment Officer, Columbia Management Investment Advisers, LLC since May 2010; Manager, Managing Director and Chief Investment Officer, Columbia Management Advisors, LLC, 2007-April 2010 | |
Thomas P. McGuire
225 Franklin Street
Boston, MA 02110
1972 | | Chief Compliance Officer since 3/12 | | Vice President — Asset Management Compliance, Columbia Management Investment Advisers, LLC since 2010; Chief Compliance Officer, Ameriprise Certificate Company since September 2010; Compliance Executive, Bank of America, 2005-2010 | |
Stephen T. Welsh
225 Franklin Street
Boston, MA 02110
1957 | | Vice President since 4/11 for RiverSource Funds and 2006 for Nations Funds | | President and Director, Columbia Management Investment Services Corp. since May 2010; President and Director, Columbia Management Services, Inc., July 2004- April 2010; Managing Director, Columbia Management Distributors, Inc., August 2007-April 2010 | |
Christopher O. Petersen
5228 Ameriprise Financial Center Minneapolis, MN 55474
1970 | | Vice President and Secretary since 4/11 for RiverSource Funds and 3/11 for Nations Funds | | Vice President and Chief Counsel, Ameriprise Financial, Inc. since January 2010 (formerly Vice President and Group Counsel or Counsel, April 2004-January 2010); Assistant Secretary of Legacy RiverSource Funds, January 2007-April 2011 and of the Nations Funds, May 2010-March 2011 | |
Annual Report 2013
36
Columbia Marsico International Opportunities Fund
Trustees and Officers (continued)
Officers (continued)
Name,
Address,
Year of Birth | | Position Held With
Funds and Length of
Service | | Principal Occupation During Past Five Years | |
Paul D. Pearson
10468 Ameriprise Financial Center Minneapolis, MN 55474
1956 | | Vice President since 4/11 and Assistant Treasurer since 1999 for RiverSource Funds and Vice President and Assistant Treasurer since 6/11 for Nations Funds | | Vice President — Investment Accounting, Columbia Management Investment Advisers, LLC, since May 2010; Vice President — Managed Assets, Investment Accounting, Ameriprise Financial Corporation, February 1998-May 2010 | |
Joseph F. DiMaria
225 Franklin Street
Boston, MA 02110
1968 | | Vice President and Chief Accounting Officer since 4/11 and Vice President since 3/11 and Chief Accounting Officer since 2008 for Nations Funds | | Vice President, Mutual Fund Administration, Columbia Management Investment Advisers, LLC, since May 2010; Director of Fund Administration, Columbia Management Advisors, LLC, January 2006-April 2010 | |
Paul B. Goucher
100 Park Avenue
New York, NY 10017
1968 | | Vice President since 4/11 and Assistant Secretary since 11/08 for RiverSource Funds and 5/10 for Nations Funds | | Vice President and Lead Chief Counsel, Ameriprise Financial, Inc. since November 2008 and January 2013, respectively (formerly, Chief Counsel, January 2010-January 2013 and Group Counsel from November 2008- January 2010); Director, Managing Director and General Counsel, J. & W. Seligman & Co. Incorporated, July 2008-November 2008 (previously, Managing Director and Associate General Counsel, January 2005-July 2008) | |
Michael E. DeFao
225 Franklin Street
Boston, MA 02110
1968 | | Vice President since 4/11 and Assistant Secretary since 5/10 for RiverSource Funds and 2011 for Nations Funds | | Vice President and Chief Counsel, Ameriprise Financial, Inc. since May 2010; Associate General Counsel, Bank of America, June 2005-April 2010 | |
Annual Report 2013
37
This page intentionally left blank.
Annual Report 2013
38
This page intentionally left blank.
Annual Report 2013
39
This page intentionally left blank.
Annual Report 2013
40
Columbia Marsico International Opportunities Fund
Important Information About This Report
Each fund mails one shareholder report to each shareholder address. If you would like more than one report, please call shareholder services at 800.345.6611 and additional reports will be sent to you.
The policy of the Board is to vote the proxies of the companies in which each fund holds investments consistent with the procedures as stated in the Statement of Additional Information (SAI). You may obtain a copy of the SAI without charge by calling 800.345.6611; contacting your financial intermediary; visiting columbiamanagement.com; or searching the website of the Securities and Exchange Commission (SEC) at sec.gov. Information regarding how each fund voted proxies relating to portfolio securities is filed with the SEC by August 31 for the most recent 12-month period ending June 30 of that year, and is available without charge by visiting columbiamanagement.com; or searching the website of the SEC at sec.gov.
Each fund files a complete schedule of portfolio holdings with the SEC for the first and third quarters of each fiscal year on Form N-Q. Each fund's Form N-Q is available on the SEC's website at sec.gov and may be reviewed and copied at the SEC's Public Reference Room in Washington, D.C. Information on the operation of the Public Reference Room may be obtained by calling 800.SEC.0330. Each fund's complete schedule of portfolio holdings, as filed on Form N-Q, can also be obtained without charge, upon request, by calling 800.345.6611.
Annual Report 2013
41

Columbia Marsico International Opportunities Fund
P.O. Box 8081
Boston, MA 02266-8081
columbiamanagement.com
This information is for use with concurrent or prior delivery of a fund prospectus. Please read and consider the investment objectives, risks, charges and expenses for any fund carefully before investing. For a prospectus which contains this and other important information about the Fund go to columbiamanagement.com. The Fund is distributed by Columbia Management Investment Distributors, Inc., member FINRA, and managed by Columbia Management Investment Advisers, LLC.
© 2013 Columbia Management Investment Advisers, LLC. All rights reserved.
ANN189_02_C01_(04/13)
Annual Report
February 28, 2013

Columbia International Value Fund
Not FDIC insured • No bank guarantee • May lose value
Columbia International Value Fund
 Dear Shareholders,
U.S. stocks flat, foreign markets strong in 2012 finale
After a strong third quarter, U.S. stock market averages treaded water as the year 2012 came to a close. However, they ended the year up strongly, as first- and third-quarter gains more than offset second- and fourth-quarter weakness. Typically a strong quarter for domestic small- and mid-cap issues, the fourth quarter of 2012 indeed proved to be another year-end positive for small-cap stocks. For the full calendar year 2012, the S&P 500 Index rose 16.00%.
Stock markets outside the United States generated some of the best returns for the fourth quarter, as optimism rebounded, thanks to the September actions of the European Central Bank in support of the euro and an improving outlook from China. Both developed and emerging foreign markets topped U.S. stocks by a solid margin.
Corporate and emerging markets led fixed income
Fixed-income investors took their cue from the equity markets and continued to favor the highest risk sectors through the end of 2012. Global fixed-income returns posted mixed results in the final quarter of the year. Gains were the highest for corporate high-yield and emerging market bonds. Although investors remained cautious ahead of the year-end budget negotiations, better economic data and a further improvement in the European sovereign debt crisis supported riskier assets and depressed government bond prices. In December, the Federal Reserve announced its intention to continue to purchase both Treasury and mortgage-backed securities and said that it would seek to keep short-term interest rates unchanged until the unemployment rate reaches 6.5%, or inflation turned noticeably higher.
Stay on track with Columbia Management
Backed by more than 100 years of experience, Columbia Management is one of the nation's largest asset managers. At the heart of our success — and, most importantly, that of our investors — are highly talented industry professionals, brought together by a unique way of working. We are dedicated to helping you take advantage of today's opportunities and anticipate tomorrow's. We stay abreast of the latest investment trends and ideas, using our collective insight to evaluate events and transform them into solutions you can use.
Visit columbiamanagement.com for:
> The Columbia Management Perspectives blog, featuring timely posts by our investment teams
> Detailed up-to-date fund performance and portfolio information
> Economic analysis and market commentary
> Quarterly fund commentaries
> Columbia Management Investor, our award-winning quarterly newsletter for shareholders
Thank you for your continued support of the Columbia Funds. We look forward to serving your investment needs for many years to come.
Best Regards,

J. Kevin Connaughton
President, Columbia Funds
The S&P 500 Index, an unmanaged index, measures the performance of 500 widely held, large-capitalization U.S. stocks and is frequently used as a general measure of market performance. Indices are not available for investment, are not professionally managed and do not reflect sales charges, fees, brokerage commissions, taxes or other expenses of investing.
Investors should consider the investment objectives, risks, charges and expenses of a mutual fund carefully before investing. For a free prospectus, which contains this and other important information about a fund, visit columbiamanagement.com. The prospectus should be read carefully before investing.
Columbia Funds are distributed by Columbia Management Investment Distributors, Inc., member FINRA, and managed by Columbia Management Investment Advisers, LLC.
© 2013 Columbia Management Investment Advisers, LLC. All rights reserved.
Columbia International Value Fund
Performance Overview | | | 2 | | |
Manager Discussion of Fund Performance | | | 4 | | |
Understanding Your Fund's Expenses | | | 6 | | |
Portfolio of Investments | | | 7 | | |
Statement of Assets and Liabilities | | | 8 | | |
Statement of Operations | | | 10 | | |
Statement of Changes in Net Assets | | | 11 | | |
Financial Highlights | | | 13 | | |
Notes to Financial Statements | | | 21 | | |
Report of Independent Registered
Public Accounting Firm | | | 27 | | |
Federal Income Tax Information | | | 28 | | |
Columbia International Value Master Portfolio | | | 29 | | |
Portfolio of Investments | | | 30 | | |
Financial Statements | | | 34 | | |
Financial Highlights | | | 37 | | |
Notes to Financial Statements | | | 38 | | |
Report of Independent Registered
Public Accounting Firm | | | 43 | | |
Trustees and Officers | | | 44 | | |
Important Information About This Report | | | 49 | | |
Fund Investment Manager
Columbia Management Investment
Advisers, LLC
225 Franklin Street
Boston, MA 02110
Fund Distributor
Columbia Management Investment
Distributors, Inc.
225 Franklin Street
Boston, MA 02110
Fund Transfer Agent
Columbia Management Investment
Services Corp.
P.O. Box 8081
Boston, MA 02266-8081
For more information about any of the funds, please visit columbiamanagement.com or call 800.345.6611. Customer Service Representatives are available to answer your questions Monday through Friday from 8 a.m. to 8 p.m. Eastern time.
The views expressed in this report reflect the current views of the respective parties. These views are not guarantees of future performance and involve certain risks, uncertainties and assumptions that are difficult to predict, so actual outcomes and results may differ significantly from the views expressed. These views are subject to change at any time based upon economic, market or other conditions and the respective parties disclaim any responsibility to update such views. These views may not be relied on as investment advice and, because investment decisions for a Columbia Fund are based on numerous factors, may not be relied on as an indication of trading intent on behalf of any particular Columbia Fund. References to specific securities should not be construed as a recommendation or investment advice.
Columbia International Value Fund
Performance Summary
> Columbia International Value Fund (the Fund) Class A shares returned 1.56% excluding sales charges for the 12-month period that ended February 28, 2013.
> The Fund's benchmark, the MSCI EAFE Value Index (Net), returned 9.68% for the same 12-month period.
> The Fund had more exposure than the benchmark to Brazil and less exposure to Australia and the financials sector, which generally accounted for its underperformance versus the benchmark during the period. Additionally, stock selection within the commercial banks and pharmaceuticals industries had a negative effect and represented a drag on relative performance.
Average Annual Total Returns (%) (for period ended February 28, 2013)
| | Inception | | 1 Year | | 5 Years | | 10 Years | |
Class A | | 12/27/95 | | | | | | | | | | | | | |
Excluding sales charges | | | | | | | 1.56 | | | | -2.37 | | | | 9.19 | | |
Including sales charges | | | | | | | -4.27 | | | | -3.52 | | | | 8.54 | | |
Class B | | 05/22/98 | | | | | | | | | | | | | |
Excluding sales charges | | | | | | | 0.84 | | | | -3.07 | | | | 8.38 | | |
Including sales charges | | | | | | | -4.04 | | | | -3.38 | | | | 8.38 | | |
Class C | | 06/15/98 | | | | | | | | | | | | | |
Excluding sales charges | | | | | | | 0.85 | | | | -3.10 | | | | 8.37 | | |
Including sales charges | | | | | | | -0.13 | | | | -3.10 | | | | 8.37 | | |
Class I* | | 09/27/10 | | | 2.00 | | | | -2.90 | | | | 8.89 | | |
Class R* | | 09/27/10 | | | 1.39 | | | | -2.65 | | | | 8.87 | | |
Class R4* | | 11/08/12 | | | 1.65 | | | | -2.35 | | | | 9.19 | | |
Class R5* | | 11/08/12 | | | 1.64 | | | | -2.36 | | | | 9.19 | | |
Class Z | | 12/27/95 | | | 1.86 | | | | -2.12 | | | | 9.46 | | |
MSCI EAFE Value Index (Net) | | | | | | | 9.68 | | | | -1.84 | | | | 9.58 | | |
Returns for Class A are shown with and without the maximum initial sales charge of 5.75%. Returns for Class B are shown with and without the applicable contingent deferred sales charge (CDSC) of 5.00% in the first year, declining to 1.00% in the sixth year and eliminated thereafter. Returns for Class C are shown with and without the 1.00% CDSC for the first year only. The Fund's other classes are not subject to sales charges and have limited eligibility. Please see the Fund's prospectuses for details. Performance for different share classes will vary based on differences in sales charges and fees associated with each class. All results shown assume reinvestment of distributions during the period. Returns do not reflect the deduction of taxes that a shareholder may pay on Fund distributions or on the redemption of Fund shares. Performance results reflect the effect of any fee waivers or reimbursements of Fund expenses by Columbia Management Investment Advisers, LLC and/or any of its affiliates. Absent these fee waivers or expense reimbursement arrangements, performance results would have been lower.
The performance information shown represents past performance and is not a guarantee of future results. The investment return and principal value of your investment will fluctuate so that your shares, when redeemed, may be worth more or less than their original cost. Current performance may be lower or higher than the performance information shown. You may obtain performance information current to the most recent month-end by contacting your financial intermediary, visiting columbiamanagement.com or calling 800.345.6611.
*The returns shown for periods prior to the share class inception date (including returns for the Life of the Fund, if shown, which are since Fund inception) include the returns of the Fund's oldest share class. Since the Fund launched more than one share class at its inception, Class A shares were used. These returns are adjusted to reflect any higher class-related operating expenses of the newer share classes, as applicable. Please visit columbiamanagement.com/mutual-funds/appended-performance for more information.
The MSCI Europe, Australasia, Far East (EAFE) Value Index (Net) is a subset of the MSCI EAFE Index (Net), and constituents of the index include securities from Europe, Australasia and the Far East. The index generally represents approximately 50% of the free float-adjusted market capitalization of the MSCI EAFE Index (Net), and consists of those securities classified by Morgan Stanley Capital International, Inc. (MSCI) as most representing the value style, such as, higher book value-to-price ratios, higher forward earnings-to-price ratios, higher dividend yields and lower forecasted growth rates than securities representing the growth style.
Indices are not available for investment, are not professionally managed and do not reflect sales charges, fees, brokerage commissions, taxes or other expenses of investing. Securities in the Fund may not match those in an index.
Annual Report 2013
2
Columbia International Value Fund
Performance Overview (continued)
Performance of a Hypothetical $10,000 Investment (March 1, 2003 – February 28, 2013)
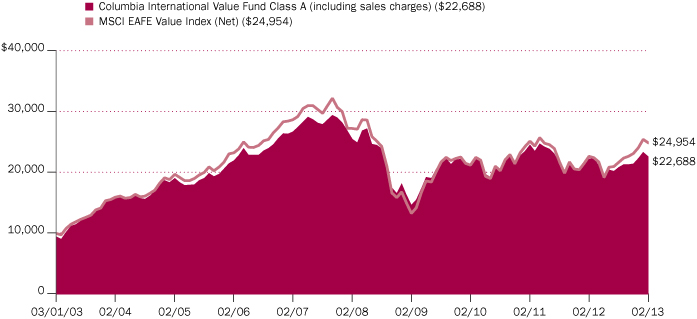
The chart above shows the change in value of a hypothetical $10,000 investment in Class A shares of Columbia International Value Fund during the stated time period, and does not reflect the deduction of taxes that a shareholder may pay on Fund distributions or on the redemption of Fund shares.
Annual Report 2013
3
Columbia International Value Fund
Manager Discussion of Fund Performance
For the 12-month period that ended February 28, 2013, the Fund's Class A shares returned 1.56% excluding sales charges. The Fund underperformed its benchmark, the MSCI EAFE Value Index (Net), which returned 9.68% for the same period. International stock markets closed broadly higher during the 12-month period, despite continued concerns about the viability of the euro zone. Growing optimism over improving global economic conditions outside developed Europe helped fuel equity market gains worldwide. During the period, the Fund's overweight in Brazil and significant underweight allocations to Australia and to the financials sector accounted for the majority of the underperformance versus the benchmark. Additionally, stock selection within the commercial banks and pharmaceuticals industries had a negative effect and represented a drag on relative performance. It is important to note that the Fund's bottom-up, fundamental approach to security selection remains the key driver of country, sector and industry allocations.
Portfolio Activity
During the fiscal year, holdings in the financials, telecommunications services and information technology sectors detracted from relative performance. These included Banco Santander Brasil, Telecom Italia and France Telecom, as well as Japan's Fujifilm and TDK Corp.
From a country perspective, holdings in Brazil had the greatest negative impact on returns, led by electric utilities firm Eletrobras, energy company Petrobras and telecommunications firm TIM Participacoes.
The Fund's holdings in the materials, consumer discretionary and consumer staples sectors aided relative performance. Mexico-based Cemex, one of the world's largest materials suppliers and cement producers, Japanese automaker Toyota and France's Carrefour, a multinational retailer, all delivered solid returns for the year.
Research Drove Portfolio Changes
Driven by its pursuit to invest in attractively valued companies and to sell their shares at prices estimated to be close to their true worth, security-specific buying and selling shifted the Fund's sector weights during the period. Sales included shares of Switzerland-based chemicals company Akzo Nobel, France-based communications equipment company Alcatel-Lucent and Germany's Deutsche Bank, AG. The Fund added positions in Banco Santander Brasil, Brazil's third largest full service private sector bank; Germany's automaker Daimler AG and France's GDF Suez, the world's largest utility company by market capitalization.
Looking Ahead
Although the Fund delivered positive returns, it was a challenging period relative to its benchmark. However, we continue to believe that the Fund is well positioned for the period ahead, and we remain firmly committed to the value investing philosophy.
Portfolio Management
Brandes Investment Partners, L.P.
Brent Woods, CFA
Amelia Maccoun Morris, CFA
Jeffery Germain, CFA
Luiz Sauerbronn
Shingo Omura, CFA
Morningstar Style BoxTM

The Morningstar Style BoxTM is based on a fund's portfolio holdings. For equity funds, the vertical axis shows the market capitalization of the stocks owned, and the horizontal axis shows investment style (value, blend, or growth). Information shown is based on the most recent data provided by Morningstar.
© 2013 Morningstar, Inc. All rights reserved. The Morningstar information contained herein: (1) is proprietary to Morningstar and/or its content providers; (2) may not be copied or distributed; and (3) is not warranted to be accurate, complete or timely. Neither Morningstar nor its content providers are responsible for any damages or losses arising from any use of this information.
Annual Report 2013
4
Columbia International Value Fund
Manager Discussion of Fund Performance (continued)
Top Ten Holdings (%)
(at February 28, 2013) | |
CRH PLC (Ireland) | | | 3.1 | | |
GDF Suez (France) | | | 3.1 | | |
Total SA (France) | | | 3.1 | | |
BP PLC (United Kingdom) | | | 3.0 | | |
Nippon Telegraph & Telephone
Corp. (Japan) | | | 2.9 | | |
Carrefour SA (France) | | | 2.8 | | |
TE Connectivity Ltd. (Switzerland) | | | 2.7 | | |
Swiss Re AG (Switzerland) | | | 2.4 | | |
AstraZeneca PLC
(United Kingdom) | | | 2.2 | | |
Daiichi Sankyo Co., Ltd. (Japan) | | | 2.2 | | |
Percentages indicated are based upon total investments (excluding Money Market Funds).
For further detail about these holdings, please refer to the section entitled Master Portfolio's "Portfolio of Investments."
Fund holdings are as of the date given, are subject to change at any time, and are not recommendations to buy or sell any security.
Portfolio Breakdown (%)
(at February 28, 2013) | |
Common Stocks | | | 98.8 | | |
Brazil | | | 5.8 | | |
France | | | 14.0 | | |
Germany | | | 3.2 | | |
Ireland | | | 3.1 | | |
Italy | | | 5.9 | | |
Japan | | | 27.1 | | |
Mexico | | | 2.1 | | |
Netherlands | | | 5.9 | | |
Russian Federation | | | 1.6 | | |
South Korea | | | 1.6 | | |
Spain | | | 1.0 | | |
Sweden | | | 1.9 | | |
Switzerland | | | 6.7 | | |
United Kingdom | | | 18.3 | | |
United States | | | 0.6 | | |
Money Market Funds | | | 1.2 | | |
Total | | | 100.0 | | |
Percentages indicated are based upon total investments. The Master Portfolio's portfolio composition is subject to change.
Annual Report 2013
5
Columbia International Value Fund
Understanding Your Fund's Expenses
(Unaudited)
As an investor, you incur two types of costs. There are transaction costs, which generally include sales charges on purchases and may include redemption fees. There are also ongoing costs, which generally include management fees, distribution and service (Rule 12b-1) fees, and other fund expenses. The following information is intended to help you understand your ongoing costs (in dollars) of investing in the Fund and to help you compare these costs with the ongoing costs of investing in other mutual funds.
Analyzing Your Fund's Expenses
To illustrate these ongoing costs, we have provided examples and calculated the expenses paid by investors in each share class of the Fund during the period. The actual and hypothetical information in the table is based on an initial investment of $1,000 at the beginning of the period indicated and held for the entire period. Expense information is calculated two ways and each method provides you with different information. The amount listed in the "Actual" column is calculated using the Fund's actual operating expenses and total return for the period. You may use the Actual information, together with the amount invested, to estimate the expenses that you paid over the period. Simply divide your account value by $1,000 (for example, an $8,600 account value divided by $1,000 = 8.6), then multiply the results by the expenses paid during the period under the Actual column. The amount listed in the "Hypothetical" column assumes a 5% annual rate of return before expenses (which is not the Fund's actual return) and then applies the Fund's actual expense ratio for the period to the hypothetical return. You should not use the hypothetical account values and expenses to estimate either your actual account balance at the end of the period or the expenses you paid during the period. See "Compare With Other Funds" below for details on how to use the hypothetical data.
Compare With Other Funds
Since all mutual funds are required to include the same hypothetical calculations about expenses in shareholder reports, you can use this information to compare the ongoing cost of investing in the Fund with other funds. To do so, compare the hypothetical example with the 5% hypothetical examples that appear in the shareholder reports of other funds. As you compare hypothetical examples of other funds, it is important to note that hypothetical examples are meant to highlight the ongoing costs of investing in a fund only and do not reflect any transaction costs, such as sales charges, or redemption or exchange fees. Therefore, the hypothetical calculations are useful in comparing ongoing costs only, and will not help you determine the relative total costs of owning different funds. If transaction costs were included in these calculations, your costs would be higher.
September 1, 2012 – February 28, 2013
| | Account Value at the Beginning
of the Period ($) | | Account Value at the End of the
Period ($) | | Expenses Paid During the
Period ($) | | Fund's Annualized
Expense Ratio (%) | |
| | Actual | | Hypothetical | | Actual | | Hypothetical | | Actual | | Hypothetical | | Actual | |
Class A | | | 1,000.00 | | | | 1,000.00 | | | | 1,082.80 | | | | 1,017.55 | | | | 7.54 | | | | 7.30 | | | | 1.46 | | |
Class B | | | 1,000.00 | | | | 1,000.00 | | | | 1,079.30 | | | | 1,013.84 | | | | 11.39 | | | | 11.03 | | | | 2.21 | | |
Class C | | | 1,000.00 | | | | 1,000.00 | | | | 1,078.60 | | | | 1,013.84 | | | | 11.39 | | | | 11.03 | | | | 2.21 | | |
Class I | | | 1,000.00 | | | | 1,000.00 | | | | 1,085.30 | | | | 1,019.49 | | | | 5.53 | | | | 5.36 | | | | 1.07 | | |
Class R | | | 1,000.00 | | | | 1,000.00 | | | | 1,082.30 | | | | 1,016.31 | | | | 8.83 | | | | 8.55 | | | | 1.71 | | |
Class R4 | | | 1,000.00 | | | | 1,000.00 | | | | 1,086.40 | * | | | 1,018.79 | | | | 3.84 | * | | | 6.06 | | | | 1.21 | * | |
Class R5 | | | 1,000.00 | | | | 1,000.00 | | | | 1,086.40 | * | | | 1,019.39 | | | | 3.46 | * | | | 5.46 | | | | 1.09 | * | |
Class Z | | | 1,000.00 | | | | 1,000.00 | | | | 1,084.90 | | | | 1,018.79 | | | | 6.25 | | | | 6.06 | | | | 1.21 | | |
*For the period November 8, 2012 through February 28, 2013. Class R4 and Class R5 shares commenced operations on November 8, 2012.
Expenses paid during the period are equal to the annualized expense ratio for each class as indicated above, multiplied by the average account value over the period and then multiplied by the number of days in the Fund's most recent fiscal half year and divided by 365.
Expenses do not include fees and expenses incurred indirectly by the Fund from the underlying funds in which the Fund may invest (also referred to as "acquired funds"), including affiliated and non-affiliated pooled investment vehicles (including mutual funds and exchange-traded funds).
Had Columbia Management Investment Advisers, LLC and/or certain of its affiliates not waived/reimbursed certain fees and expenses, account value at the end of the period would have been reduced.
Annual Report 2013
6
Columbia International Value Fund
Portfolio of Investments
February 28, 2013
Investment Company 100.2%
| | | Value ($) | |
Investment in Columbia Funds
Master Investment Trust LLC,
Columbia International Value
Master Portfolio(a) | | | 651,082,560 | | |
Total Investments | | | 651,082,560 | | |
Other Assets & Liabilities, Net | | | (1,102,326 | ) | |
Net Assets | | | 649,980,234 | | |
Notes to Portfolio of Investments:
(a) The financial statements of Columbia International Value Master Portfolio, including its investment portfolio, are included elsewhere within this report and should be read in conjunction with Columbia International Value Fund's financial statements.
Columbia International Value Fund Invests only in Columbia International Value Master Portfolio (the Master Portfolio). At February 28, 2013, Columbia International Value Fund owned 91.0% of the Master Portfolio. Columbia International Value Master Portfolio was invested in the following industries at February 28, 2013.
Summary of Investments in Securities by Industry (%)
(at February 28, 2013) | |
Automobiles | | | 4.3 | | |
Capital Markets | | | 1.7 | | |
Commercial Banks | | | 8.5 | | |
Commercial Services & Supplies | | | 1.2 | | |
Communications Equipment | | | 1.8 | | |
Computers & Peripherals | | | 0.6 | | |
Construction Materials | | | 4.2 | | |
Diversified Telecommunication Services | | | 10.3 | | |
Electric Utilities | | | 0.5 | | |
Electronic Equipment, Instruments & Components | | | 4.7 | | |
Food & Staples Retailing | | | 9.0 | | |
Food Products | | | 1.7 | | |
Insurance | | | 7.7 | | |
Media | | | 1.6 | | |
Metals & Mining | | | 1.6 | | |
Multiline Retail | | | 2.0 | | |
Multi-Utilities | | | 3.0 | | |
Office Electronics | | | 1.9 | | |
Oil, Gas & Consumable Fuels | | | 11.3 | | |
Pharmaceuticals | | | 14.0 | | |
Semiconductors & Semiconductor Equipment | | | 0.9 | | |
Specialty Retail | | | 1.2 | | |
Wireless Telecommunication Services | | | 4.1 | | |
Money Market Funds | | | 1.2 | | |
Total | | | 99.0 | | |
Percentages indicated are based upon the Master Portfolio's net assets. The Master Portfolio's portfolio composition is subject to change.
The accompanying Notes to Financial Statements are an integral part of this statement.
Annual Report 2013
7
Columbia International Value Fund
Statement of Assets and Liabilities
February 28, 2013
Assets | |
Investments, at value | |
Columbia International Value Master Portfolio (identified cost $731,564,934) | | $ | 651,082,560 | | |
Receivable from Master Portfolio | | | 51,645 | | |
Receivable for: | |
Capital shares sold | | | 1,181,791 | | |
Expense reimbursement due from Investment Manager | | | 3,370 | | |
Prepaid expenses | | | 3,094 | | |
Total assets | | | 652,322,460 | | |
Liabilities | |
Disbursements in excess of cash | | | 51,645 | | |
Payable for: | |
Capital shares purchased | | | 1,942,035 | | |
Distribution and/or service fees | | | 1,896 | | |
Transfer agent fees | | | 166,139 | | |
Administration fees | | | 3,039 | | |
Compensation of board members | | | 33,664 | | |
Other expenses | | | 143,808 | | |
Total liabilities | | | 2,342,226 | | |
Net assets applicable to outstanding capital stock | | $ | 649,980,234 | | |
Represented by | |
Paid-in capital | | $ | 1,262,314,736 | | |
Excess of distributions over net investment income | | | (4,672,914 | ) | |
Accumulated net realized loss | | | (527,179,214 | ) | |
Unrealized appreciation (depreciation) on: | |
Investments | | | (80,482,374 | ) | |
Total — representing net assets applicable to outstanding capital stock | | $ | 649,980,234 | | |
The accompanying Notes to Financial Statements are an integral part of this statement.
Annual Report 2013
8
Columbia International Value Fund
Statement of Assets and Liabilities (continued)
February 28, 2013
Class A | |
Net assets | | $ | 168,944,194 | | |
Shares outstanding | | | 13,147,454 | | |
Net asset value per share | | $ | 12.85 | | |
Maximum offering price per share(a) | | $ | 13.63 | | |
Class B | |
Net assets | | $ | 518,061 | | |
Shares outstanding | | | 41,810 | | |
Net asset value per share | | $ | 12.39 | | |
Class C | |
Net assets | | $ | 26,193,245 | | |
Shares outstanding | | | 2,121,000 | | |
Net asset value per share | | $ | 12.35 | | |
Class I | |
Net assets | | $ | 2,239 | | |
Shares outstanding | | | 179 | | |
Net asset value per share(b) | | $ | 12.48 | | |
Class R | |
Net assets | | $ | 97,988 | | |
Shares outstanding | | | 7,616 | | |
Net asset value per share | | $ | 12.87 | | |
Class R4 | |
Net assets | | $ | 2,618 | | |
Shares outstanding | | | 200 | | |
Net asset value per share(b) | | $ | 13.10 | | |
Class R5 | |
Net assets | | $ | 695,878 | | |
Shares outstanding | | | 53,142 | | |
Net asset value per share | | $ | 13.09 | | |
Class Z | |
Net assets | | $ | 453,526,011 | | |
Shares outstanding | | | 34,925,529 | | |
Net asset value per share | | $ | 12.99 | | |
(a) The maximum offering price per share is calculated by dividing the net asset value by 1.0 minus the maximum sales charge of 5.75%.
(b) Net asset value per share rounds to this amount due to fractional shares outstanding.
The accompanying Notes to Financial Statements are an integral part of this statement.
Annual Report 2013
9
Columbia International Value Fund
Statement of Operations
Year Ended February 28, 2013
Net investment income | |
Income allocated from Master Portfolio: | |
Dividends — unaffiliated issuers | | $ | 50,156,442 | | |
Dividends — affiliated issuers | | | 18,772 | | |
Interest | | | 71,816 | | |
Income from securities lending — net | | | 1,216,040 | | |
Foreign taxes withheld | | | (5,194,049 | ) | |
Expenses allocated from Master Portfolio(a) | | | (9,214,434 | ) | |
Line of credit interest expense allocated from Master Portfolio | | | (11,031 | ) | |
Total income | | | 37,043,556 | | |
Expenses: | |
Distribution and/or service fees | |
Class A | | | 481,054 | | |
Class B | | | 6,286 | | |
Class C | | | 290,049 | | |
Class R | | | 251 | | |
Transfer agent fees | |
Class A | | | 384,165 | | |
Class B | | | 1,254 | | |
Class C | | | 57,906 | | |
Class R | | | 103 | | |
Class R4(b) | | | 1 | | |
Class R5(b) | | | 10 | | |
Class Z | | | 1,589,441 | | |
Administration fees | | | 1,734,302 | | |
Compensation of board members | | | 2,788 | | |
Printing and postage fees | | | 297,198 | | |
Registration fees | | | 184,633 | | |
Professional fees | | | 8,217 | | |
Other | | | 3,997 | | |
Total expenses | | | 5,041,655 | | |
Fees waived or expenses reimbursed by Investment Manager and its affiliates | | | (1,437,231 | ) | |
Expense reductions | | | (1,120 | ) | |
Total net expenses | | | 3,603,304 | | |
Net investment income | | | 33,440,252 | | |
Realized and unrealized gain (loss) — net | |
Net realized gain (loss) allocated from Master Portfolio on: | |
Investments | | | (136,747,530 | ) | |
Foreign currency translations | | | 178,746 | | |
Net realized loss | | | (136,568,784 | ) | |
Net change in unrealized appreciation (depreciation) allocated from Master Portfolio on: | |
Investments | | | 116,298,605 | | |
Net change in unrealized appreciation (depreciation) | | | 116,298,605 | | |
Net realized and unrealized loss | | | (20,270,179 | ) | |
Net increase in net assets resulting from operations | | $ | 13,170,073 | | |
(a) Net expenses allocated from Master Portfolio include the Fund's pro-rata portion of the Master Portfolio's investment management fees, administration fees, compensation of board members, custodian fees and other expenses.
(b) For the period from November 8, 2012 (commencement of operations) to February 28, 2013.
The accompanying Notes to Financial Statements are an integral part of this statement.
Annual Report 2013
10
Columbia International Value Fund
Statement of Changes in Net Assets
| | | Year Ended
February 28,
2013(a) | | Year Ended
February 29,
2012 | |
Operations | |
Net investment income | | $ | 33,440,252 | | | $ | 40,306,342 | | |
Net realized loss allocated from Master Portfolio | | | (136,568,784 | ) | | | (101,422,275 | ) | |
Net change in unrealized appreciation (depreciation) allocated from Master Portfolio | | | 116,298,605 | | | | (107,890,152 | ) | |
Net increase (decrease) in net assets resulting from operations | | | 13,170,073 | | | | (169,006,085 | ) | |
Distributions to shareholders | |
Net investment income | |
Class A | | | (6,459,913 | ) | | | (8,774,790 | ) | |
Class B | | | (16,623 | ) | | | (27,711 | ) | |
Class C | | | (822,662 | ) | | | (1,145,212 | ) | |
Class I | | | (92 | ) | | | (33,455 | ) | |
Class R | | | (3,062 | ) | | | (82 | ) | |
Class R4 | | | (93 | ) | | | — | | |
Class R5 | | | (95 | ) | | | — | | |
Class Z | | | (29,203,054 | ) | | | (36,299,996 | ) | |
Tax return of capital | |
Class A | | | (222,193 | ) | | | — | | |
Class B | | | (572 | ) | | | — | | |
Class C | | | (28,296 | ) | | | — | | |
Class I | | | (3 | ) | | | — | | |
Class R | | | (105 | ) | | | — | | |
Class R4 | | | (3 | ) | | | — | | |
Class R5 | | | (3 | ) | | | — | | |
Class Z | | | (1,004,458 | ) | | | — | | |
Total distributions to shareholders | | | (37,761,227 | ) | | | (46,281,246 | ) | |
Increase (decrease) in net assets from capital stock activity | | | (511,679,724 | ) | | | (337,926,958 | ) | |
Proceeds from regulatory settlements (Note 5) | | | — | | | | 81,090 | | |
Total decrease in net assets | | | (536,270,878 | ) | | | (553,133,199 | ) | |
Net assets at beginning of year | | | 1,186,251,112 | | | | 1,739,384,311 | | |
Net assets at end of year | | $ | 649,980,234 | | | $ | 1,186,251,112 | | |
Excess of distributions over net investment income | | $ | (4,672,914 | ) | | $ | (2,445,137 | ) | |
(a) Class R4 and Class R5 shares are for the period from November 8, 2012 (commencement of operations) to February 28, 2013.
The accompanying Notes to Financial Statements are an integral part of this statement.
Annual Report 2013
11
Columbia International Value Fund
Statement of Changes in Net Assets (continued)
| | | Year Ended February 28, 2013(a) | | Year Ended February 29, 2012 | |
| | | Shares | | Dollars ($) | | Shares | | Dollars ($) | |
Capital stock activity | |
Class A shares | |
Subscriptions(b) | | | 2,747,144 | | | | 34,280,047 | | | | 3,807,023 | | | | 51,147,403 | | |
Distributions reinvested | | | 355,352 | | | | 4,458,659 | | | | 500,111 | | | | 6,030,999 | | |
Redemptions | | | (7,141,317 | ) | | | (89,527,344 | ) | | | (11,441,576 | ) | | | (156,058,831 | ) | |
Net decrease | | | (4,038,821 | ) | | | (50,788,638 | ) | | | (7,134,442 | ) | | | (98,880,429 | ) | |
Class B shares | |
Subscriptions | | | 3,954 | | | | 46,229 | | | | 15,890 | | | | 209,769 | | |
Distributions reinvested | | | 1,199 | | | | 14,561 | | | | 1,770 | | | | 20,511 | | |
Redemptions(b) | | | (26,993 | ) | | | (324,804 | ) | | | (52,388 | ) | | | (673,782 | ) | |
Net decrease | | | (21,840 | ) | | | (264,014 | ) | | | (34,728 | ) | | | (443,502 | ) | |
Class C shares | |
Subscriptions | | | 116,197 | | | | 1,393,386 | | | | 249,459 | | | | 3,293,863 | | |
Distributions reinvested | | | 48,183 | | | | 583,499 | | | | 65,034 | | | | 752,044 | | |
Redemptions | | | (805,033 | ) | | | (9,611,764 | ) | | | (1,521,712 | ) | | | (19,861,019 | ) | |
Net decrease | | | (640,653 | ) | | | (7,634,879 | ) | | | (1,207,219 | ) | | | (15,815,112 | ) | |
Class I shares | |
Subscriptions | | | — | | | | — | | | | 29,397 | | | | 431,921 | | |
Distributions reinvested | | | — | | | | — | | | | 2,341 | | | | 33,356 | | |
Redemptions | | | — | | | | — | | | | (2,291,500 | ) | | | (33,085,036 | ) | |
Net decrease | | | — | | | | — | | | | (2,259,762 | ) | | | (32,619,759 | ) | |
Class R shares | |
Subscriptions | | | 7,905 | | | | 98,959 | | | | 411 | | | | 4,831 | | |
Distributions reinvested | | | 245 | | | | 3,086 | | | | — | | | | — | | |
Redemptions | | | (1,126 | ) | | | (13,522 | ) | | | — | | | | — | | |
Net increase | | | 7,024 | | | | 88,523 | | | | 411 | | | | 4,831 | | |
Class R4 shares | |
Subscriptions | | | 200 | | | | 2,500 | | | | — | | | | — | | |
Net increase | | | 200 | | | | 2,500 | | | | — | | | | — | | |
Class R5 shares | |
Subscriptions | | | 53,142 | | | | 719,869 | | | | — | | | | — | | |
Net increase | | | 53,142 | | | | 719,869 | | | | — | | | | — | | |
Class Z shares | |
Subscriptions | | | 16,323,796 | | | | 204,554,101 | | | | 20,014,598 | | | | 273,478,830 | | |
Distributions reinvested | | | 2,021,034 | | | | 25,616,171 | | | | 2,074,910 | | | | 25,186,240 | | |
Redemptions | | | (53,114,547 | ) | | | (683,973,357 | ) | | | (36,032,727 | ) | | | (488,838,057 | ) | |
Net decrease | | | (34,769,717 | ) | | | (453,803,085 | ) | | | (13,943,219 | ) | | | (190,172,987 | ) | |
Total net decrease | | | (39,410,665 | ) | | | (511,679,724 | ) | | | (24,578,959 | ) | | | (337,926,958 | ) | |
(a) Class R4 and Class R5 shares are for the period from November 8, 2012 (commencement of operations) to February 28, 2013.
(b) Includes conversions of Class B shares to Class A shares, if any.
The accompanying Notes to Financial Statements are an integral part of this statement.
Annual Report 2013
12
Columbia International Value Fund
The following tables are intended to help you understand the Fund's financial performance. Certain information reflects financial results for a single share of a class held for the periods shown. The per share amounts and percentages reflect income and expenses assuming inclusion of the Fund's proportionate share of the income and expenses of Columbia International Value Master Portfolio. Per share net investment income (loss) amounts are calculated based on average shares outstanding during the period. Total return assumes reinvestment of all dividends and distributions, if any. Total return does not reflect payment of sales charges, if any, and is not annualized for periods of less than one year.
| | | Year Ended
February 28, | | Year Ended
February 29, | | Year Ended February 28, | |
Class A | | 2013 | | 2012 | | 2011 | | 2010 | | 2009 | |
Per share data | |
Net asset value, beginning of period | | $ | 13.14 | | | $ | 15.12 | | | $ | 13.48 | | | $ | 9.40 | | | $ | 18.95 | | |
Income from investment operations: | |
Net investment income | | | 0.39 | | | | 0.39 | | | | 0.22 | | | | 0.33 | (a) | | | 0.52 | | |
Net realized and unrealized gain (loss) | | | (0.20 | ) | | | (1.88 | ) | | | 1.81 | | | | 3.96 | | | | (7.83 | ) | |
Total from investment operations | | | 0.19 | | | | (1.49 | ) | | | 2.03 | | | | 4.29 | | | | (7.31 | ) | |
Less distributions to shareholders: | |
Net investment income | | | (0.46 | ) | | | (0.49 | ) | | | (0.39 | ) | | | (0.21 | ) | | | (0.53 | ) | |
Net realized gains | | | — | | | | — | | | | — | | | | — | | | | (1.70 | ) | |
Tax return of capital | | | (0.02 | ) | | | — | | | | — | | | | — | | | | (0.01 | ) | |
Total distributions to shareholders | | | (0.48 | ) | | | (0.49 | ) | | | (0.39 | ) | | | (0.21 | ) | | | (2.24 | ) | |
Proceeds from regulatory settlements | | | — | | | | 0.00 | (b) | | | 0.00 | (b) | | | 0.00 | (b) | | | — | | |
Redemption fees: | |
Redemption fees added to paid-in capital | | | — | | | | — | | | | — | | | | 0.00 | (b) | | | 0.00 | (b) | |
Net asset value, end of period | | $ | 12.85 | | | $ | 13.14 | | | $ | 15.12 | | | $ | 13.48 | | | $ | 9.40 | | |
Total return | | | 1.56 | % | | | (9.51 | %) | | | 15.47 | % | | | 45.57 | % | | | (42.59 | %) | |
Ratios to average net assets(c) | |
Total gross expenses | | | 1.57 | %(d) | | | 1.53 | %(d) | | | 1.48 | %(d) | | | 1.42 | %(d) | | | 1.38 | %(d) | |
Total net expenses(e) | | | 1.43 | %(d)(f) | | | 1.41 | %(d)(f) | | | 1.48 | %(d)(f) | | | 1.42 | %(d)(f) | | | 1.38 | %(d)(f) | |
Net investment income | | | 3.09 | % | | | 2.87 | % | | | 1.61 | % | | | 2.56 | % | | | 3.31 | % | |
Supplemental data | |
Net assets, end of period (in thousands) | | $ | 168,944 | | | $ | 225,747 | | | $ | 367,847 | | | $ | 380,578 | | | $ | 241,097 | | |
Notes to Financial Highlights
(a) Net investment income per share reflects special dividends. The effect of these dividends amounted to $0.13 per share.
(b) Rounds to zero.
(c) Certain line items from prior years have been reclassified to conform to the current presentation.
(d) Ratios include line of credit interest expense allocated from Master Portfolio which rounds to less than 0.01%.
(e) Total net expenses include the impact of certain waivers/reimbursements made by the Investment Manager and certain of its affiliates, if applicable.
(f) The benefits derived from expense reductions had an impact of less than 0.01%.
The accompanying Notes to Financial Statements are an integral part of this statement.
Annual Report 2013
13
Columbia International Value Fund
Financial Highlights (continued)
| | | Year Ended
February 28, | | Year Ended
February 29, | | Year Ended February 28, | |
Class B | | 2013 | | 2012 | | 2011 | | 2010 | | 2009 | |
Per share data | |
Net asset value, beginning of period | | $ | 12.68 | | | $ | 14.61 | | | $ | 13.02 | | | $ | 9.09 | | | $ | 18.39 | | |
Income from investment operations: | |
Net investment income | | | 0.29 | | | | 0.27 | | | | 0.21 | | | | 0.24 | (a) | | | 0.37 | | |
Net realized and unrealized gain (loss) | | | (0.19 | ) | | | (1.81 | ) | | | 1.67 | | | | 3.82 | | | | (7.53 | ) | |
Total from investment operations | | | 0.10 | | | | (1.54 | ) | | | 1.88 | | | | 4.06 | | | | (7.16 | ) | |
Less distributions to shareholders: | |
Net investment income | | | (0.38 | ) | | | (0.39 | ) | | | (0.29 | ) | | | (0.13 | ) | | | (0.43 | ) | |
Net realized gains | | | — | | | | — | | | | — | | | | — | | | | (1.70 | ) | |
Tax return of capital | | | (0.01 | ) | | | — | | | | — | | | | — | | | | (0.01 | ) | |
Total distributions to shareholders | | | (0.39 | ) | | | (0.39 | ) | | | (0.29 | ) | | | (0.13 | ) | | | (2.14 | ) | |
Proceeds from regulatory settlements | | | — | | | | 0.00 | (b) | | | 0.00 | (b) | | | 0.00 | (b) | | | — | | |
Redemption fees: | |
Redemption fees added to paid-in capital | | | — | | | | — | | | | — | | | | 0.00 | (b) | | | 0.00 | (b) | |
Net asset value, end of period | | $ | 12.39 | | | $ | 12.68 | | | $ | 14.61 | | | $ | 13.02 | | | $ | 9.09 | | |
Total return | | | 0.84 | % | | | (10.28 | %) | | | 14.75 | % | | | 44.61 | % | | | (43.01 | %) | |
Ratios to average net assets(c) | |
Total gross expenses | | | 2.32 | %(d) | | | 2.27 | %(d) | | | 2.23 | %(d) | | | 2.17 | %(d) | | | 2.13 | %(d) | |
Total net expenses(e) | | | 2.18 | %(d)(f) | | | 2.16 | %(d)(f) | | | 2.23 | %(d)(f) | | | 2.17 | %(d)(f) | | | 2.13 | %(d)(f) | |
Net investment income | | | 2.41 | % | | | 2.05 | % | | | 1.62 | % | | | 1.95 | % | | | 2.43 | % | |
Supplemental data | |
Net assets, end of period (in thousands) | | $ | 518 | | | $ | 807 | | | $ | 1,437 | | | $ | 8,476 | | | $ | 18,743 | | |
Notes to Financial Highlights
(a) Net investment income per share reflects special dividends. The effect of these dividends amounted to $0.13 per share.
(b) Rounds to zero.
(c) Certain line items from prior years have been reclassified to conform to the current presentation.
(d) Ratios include line of credit interest expense allocated from Master Portfolio which rounds to less than 0.01%.
(e) Total net expenses include the impact of certain waivers/reimbursements made by the Investment Manager and certain of its affiliates, if applicable.
(f) The benefits derived from expense reductions had an impact of less than 0.01%.
The accompanying Notes to Financial Statements are an integral part of this statement.
Annual Report 2013
14
Columbia International Value Fund
Financial Highlights (continued)
| | | Year Ended
February 28, | | Year Ended
February 29, | | Year Ended February 28, | |
Class C | | 2013 | | 2012 | | 2011 | | 2010 | | 2009 | |
Per share data | |
Net asset value, beginning of period | | $ | 12.64 | | | $ | 14.56 | | | $ | 12.99 | | | $ | 9.08 | | | $ | 18.37 | | |
Income from investment operations: | |
Net investment income | | | 0.28 | | | | 0.27 | | | | 0.12 | | | | 0.22 | (a) | | | 0.34 | | |
Net realized and unrealized gain (loss) | | | (0.18 | ) | | | (1.80 | ) | | | 1.74 | | | | 3.82 | | | | (7.49 | ) | |
Total from investment operations | | | 0.10 | | | | (1.53 | ) | | | 1.86 | | | | 4.04 | | | | (7.15 | ) | |
Less distributions to shareholders: | |
Net investment income | | | (0.38 | ) | | | (0.39 | ) | | | (0.29 | ) | | | (0.13 | ) | | | (0.43 | ) | |
Net realized gains | | | — | | | | — | | | | — | | | | — | | | | (1.70 | ) | |
Tax return of capital | | | (0.01 | ) | | | — | | | | — | | | | — | | | | (0.01 | ) | |
Total distributions to shareholders | | | (0.39 | ) | | | (0.39 | ) | | | (0.29 | ) | | | (0.13 | ) | | | (2.14 | ) | |
Proceeds from regulatory settlements | | | — | | | | 0.00 | (b) | | | 0.00 | (b) | | | 0.00 | (b) | | | — | | |
Redemption fees: | |
Redemption fees added to paid-in capital | | | — | | | | — | | | | — | | | | 0.00 | (b) | | | 0.00 | (b) | |
Net asset value, end of period | | $ | 12.35 | | | $ | 12.64 | | | $ | 14.56 | | | $ | 12.99 | | | $ | 9.08 | | |
Total return | | | 0.85 | % | | | (10.24 | %) | | | 14.62 | % | | | 44.44 | % | | | (43.00 | %) | |
Ratios to average net assets(c) | |
Total gross expenses | | | 2.32 | %(d) | | | 2.28 | %(d) | | | 2.23 | %(d) | | | 2.17 | %(d) | | | 2.13 | %(d) | |
Total net expenses(e) | | | 2.18 | %(d)(f) | | | 2.16 | %(d)(f) | | | 2.23 | %(d)(f) | | | 2.17 | %(d)(f) | | | 2.13 | %(d)(f) | |
Net investment income | | | 2.35 | % | | | 2.10 | % | | | 0.89 | % | | | 1.81 | % | | | 2.28 | % | |
Supplemental data | |
Net assets, end of period (in thousands) | | $ | 26,193 | | | $ | 34,910 | | | $ | 57,793 | | | $ | 63,914 | | | $ | 49,750 | | |
Notes to Financial Highlights
(a) Net investment income per share reflects special dividends. The effect of these dividends amounted to $0.13 per share.
(b) Rounds to zero.
(c) Certain line items from prior years have been reclassified to conform to the current presentation.
(d) Ratios include line of credit interest expense allocated from Master Portfolio which rounds to less than 0.01%.
(e) Total net expenses include the impact of certain waivers/reimbursements made by the Investment Manager and certain of its affiliates, if applicable.
(f) The benefits derived from expense reductions had an impact of less than 0.01%.
The accompanying Notes to Financial Statements are an integral part of this statement.
Annual Report 2013
15
Columbia International Value Fund
Financial Highlights (continued)
Class I | | Year Ended
February 28,
2013 | | Year Ended
February 29,
2012 | | Year Ended
February 28,
2011(a) | |
Per share data | |
Net asset value, beginning of period | | $ | 12.77 | | | $ | 15.27 | | | $ | 13.93 | | |
Income from investment operations: | |
Net investment income (loss) | | | 0.40 | | | | 0.70 | | | | (0.00 | )(b) | |
Net realized and unrealized gain (loss) | | | (0.16 | ) | | | (2.65 | ) | | | 1.67 | | |
Total from investment operations | | | 0.24 | | | | (1.95 | ) | | | 1.67 | | |
Less distributions to shareholders: | |
Net investment income | | | (0.51 | ) | | | (0.55 | ) | | | (0.33 | ) | |
Tax return of capital | | | (0.02 | ) | | | — | | | | — | | |
Total distributions to shareholders | | | (0.53 | ) | | | (0.55 | ) | | | (0.33 | ) | |
Proceeds from regulatory settlements | | | — | | | | 0.00 | (b) | | | 0.00 | (b) | |
Net asset value, end of period | | $ | 12.48 | | | $ | 12.77 | | | $ | 15.27 | | |
Total return | | | 2.00 | % | | | (12.47 | %) | | | 12.22 | % | |
Ratios to average net assets(c) | |
Total gross expenses | | | 1.13 | %(d) | | | 1.06 | %(d) | | | 1.07 | %(d)(e) | |
Total net expenses(f) | | | 1.04 | %(d) | | | 1.06 | %(d)(g) | | | 1.07 | %(d)(e)(g) | |
Net investment income (loss) | | | 3.31 | % | | | 4.77 | % | | | (0.05 | %)(e) | |
Supplemental data | |
Net assets, end of period (in thousands) | | $ | 2 | | | $ | 2 | | | $ | 34,506 | | |
Notes to Financial Highlights
(a) For the period from September 27, 2010 (commencement of operations) to February 28, 2011.
(b) Rounds to zero.
(c) Certain line items from prior years have been reclassified to conform to the current presentation.
(d) Ratios include line of credit interest expense allocated from Master Portfolio which rounds to less than 0.01%.
(e) Annualized.
(f) Total net expenses include the impact of certain waivers/reimbursements made by the Investment Manager and certain of its affiliates, if applicable.
(g) The benefits derived from expense reductions had an impact of less than 0.01%.
The accompanying Notes to Financial Statements are an integral part of this statement.
Annual Report 2013
16
Columbia International Value Fund
Financial Highlights (continued)
Class R | | Year Ended
February 28,
2013 | | Year Ended
February 29,
2012 | | Year Ended
February 28,
2011(a) | |
Per share data | |
Net asset value, beginning of period | | $ | 13.15 | | | $ | 15.15 | | | $ | 13.78 | | |
Income from investment operations: | |
Net investment income | | | 0.15 | | | | 0.25 | | | | 0.02 | | |
Net realized and unrealized gain (loss) | | | 0.02 | (b) | | | (1.79 | ) | | | 1.60 | | |
Total from investment operations | | | 0.17 | | | | (1.54 | ) | | | 1.62 | | |
Less distributions to shareholders: | |
Net investment income | | | (0.44 | ) | | | (0.46 | ) | | | (0.25 | ) | |
Tax return of capital | | | (0.01 | ) | | | — | | | | — | | |
Total distributions to shareholders | | | (0.45 | ) | | | (0.46 | ) | | | (0.25 | ) | |
Proceeds from regulatory settlements | | | — | | | | 0.00 | (c) | | | 0.00 | (c) | |
Net asset value, end of period | | $ | 12.87 | | | $ | 13.15 | | | $ | 15.15 | | |
Total return | | | 1.39 | % | | | (9.90 | %) | | | 11.92 | % | |
Ratios to average net assets(d) | |
Total gross expenses | | | 1.85 | %(e) | | | 1.86 | %(e) | | | 1.77 | %(e)(f) | |
Total net expenses(g) | | | 1.70 | %(e)(h) | | | 1.64 | %(e)(h) | | | 1.77 | %(e)(f)(h) | |
Net investment income | | | 1.16 | % | | | 1.94 | % | | | 0.40 | %(f) | |
Supplemental data | |
Net assets, end of period (in thousands) | | $ | 98 | | | $ | 8 | | | $ | 3 | | |
Notes to Financial Highlights
(a) For the period from September 27, 2010 (commencement of operations) to February 28, 2011.
(b) Calculation of the net gain (loss) per share (both realized and unrealized) does not correlate to the aggregate realized and unrealized gain (loss) presented in the Statement of Operations due to the timing of sales and repurchases of Fund shares in relation to fluctuations in the market value of the portfolio.
(c) Rounds to zero.
(d) Certain line items from prior years have been reclassified to conform to the current presentation.
(e) Ratios include line of credit interest expense allocated from Master Portfolio which rounds to less than 0.01%.
(f) Annualized.
(g) Total net expenses include the impact of certain waivers/reimbursements made by the Investment Manager and certain of its affiliates, if applicable.
(h) The benefits derived from expense reductions had an impact of less than 0.01%.
The accompanying Notes to Financial Statements are an integral part of this statement.
Annual Report 2013
17
Columbia International Value Fund
Financial Highlights (continued)
Class R4 | | Year Ended
February 28,
2013(a) | |
Per share data | |
Net asset value, beginning of period | | $ | 12.51 | | |
Income from investment operations: | |
Net investment income | | | 0.02 | | |
Net realized and unrealized gain | | | 1.05 | (b) | |
Total from investment operations | | | 1.07 | | |
Less distributions to shareholders: | |
Net investment income | | | (0.46 | ) | |
Tax return of capital | | | (0.02 | ) | |
Total distributions to shareholders | | | (0.48 | ) | |
Net asset value, end of period | | $ | 13.10 | | |
Total return | | | 8.64 | % | |
Ratios to average net assets(c) | |
Total gross expenses | | | 1.31 | %(d)(e) | |
Total net expenses(f) | | | 1.21 | %(d)(e) | |
Net investment income | | | 0.59 | %(d) | |
Supplemental data | |
Net assets, end of period (in thousands) | | $ | 3 | | |
Notes to Financial Highlights
(a) For the period from November 8, 2012 (commencement of operations) to February 28, 2013.
(b) Calculation of the net gain (loss) per share (both realized and unrealized) does not correlate to the aggregate realized and unrealized gain (loss) presented in the Statement of Operations due to the timing of sales and repurchases of Fund shares in relation to fluctuations in the market value of the portfolio.
(c) In addition to the fees and expenses which the Fund bears directly, the Fund indirectly bears a pro rata share of the fees and expenses of the acquired funds in which it invests. Such indirect expenses are not included in the reported expense ratios.
(d) Annualized.
(e) Ratios include line of credit interest expense allocated from Master Portfolio which rounds to less than 0.01%.
(f) Total net expenses include the impact of certain waivers/reimbursements made by the Investment Manager and certain of its affiliates, if applicable.
The accompanying Notes to Financial Statements are an integral part of this statement.
Annual Report 2013
18
Columbia International Value Fund
Financial Highlights (continued)
Class R5 | | Year Ended
February 28,
2013(a) | |
Per share data | |
Net asset value, beginning of period | | $ | 12.51 | | |
Income from investment operations: | |
Net investment income | | | 0.07 | | |
Net realized and unrealized gain | | | 1.00 | (b) | |
Total from investment operations | | | 1.07 | | |
Less distributions to shareholders: | |
Net investment income | | | (0.47 | ) | |
Tax return of capital | | | (0.02 | ) | |
Total distributions to shareholders | | | (0.49 | ) | |
Net asset value, end of period | | $ | 13.09 | | |
Total return | | | 8.64 | % | |
Ratios to average net assets(c) | |
Total gross expenses | | | 1.28 | %(d)(e) | |
Total net expenses(f) | | | 1.09 | %(d)(e) | |
Net investment income | | | 1.88 | %(d) | |
Supplemental data | |
Net assets, end of period (in thousands) | | $ | 696 | | |
Notes to Financial Highlights
(a) For the period from November 8, 2012 (commencement of operations) to February 28, 2013.
(b) Calculation of the net gain (loss) per share (both realized and unrealized) does not correlate to the aggregate realized and unrealized gain (loss) presented in the Statement of Operations due to the timing of sales and repurchases of Fund shares in relation to fluctuations in the market value of the portfolio.
(c) In addition to the fees and expenses which the Fund bears directly, the Fund indirectly bears a pro rata share of the fees and expenses of the acquired funds in which it invests. Such indirect expenses are not included in the reported expense ratios.
(d) Annualized.
(e) Ratios include line of credit interest expense allocated from Master Portfolio which rounds to less than 0.01%.
(f) Total net expenses include the impact of certain waivers/reimbursements made by the Investment Manager and certain of its affiliates, if applicable.
The accompanying Notes to Financial Statements are an integral part of this statement.
Annual Report 2013
19
Columbia International Value Fund
Financial Highlights (continued)
| | | Year Ended
February 28, | | Year Ended
February 29, | | Year Ended February 28, | |
Class Z | | 2013 | | 2012 | | 2011 | | 2010 | | 2009 | |
Per share data | |
Net asset value, beginning of period | | $ | 13.27 | | | $ | 15.28 | | | $ | 13.62 | | | $ | 9.49 | | | $ | 19.10 | | |
Income from investment operations: | |
Net investment income | | | 0.42 | | | | 0.42 | | | | 0.26 | | | | 0.36 | (a) | | | 0.50 | | |
Net realized and unrealized gain (loss) | | | (0.19 | ) | | | (1.90 | ) | | | 1.83 | | | | 4.01 | | | | (7.83 | ) | |
Total from investment operations | | | 0.23 | | | | (1.48 | ) | | | 2.09 | | | | 4.37 | | | | (7.33 | ) | |
Less distributions to shareholders: | |
Net investment income | | | (0.49 | ) | | | (0.53 | ) | | | (0.43 | ) | | | (0.24 | ) | | | (0.57 | ) | |
Net realized gains | | | — | | | | — | | | | — | | | | — | | | | (1.70 | ) | |
Tax return of capital | | | (0.02 | ) | | | — | | | | — | | | | — | | | | (0.01 | ) | |
Total distributions to shareholders | | | (0.51 | ) | | | (0.53 | ) | | | (0.43 | ) | | | (0.24 | ) | | | (2.28 | ) | |
Proceeds from regulatory settlements | | | — | | | | 0.00 | (b) | | | 0.00 | (b) | | | 0.00 | (b) | | | — | | |
Redemption fees: | |
Redemption fees added to paid-in capital | | | — | | | | — | | | | — | | | | 0.00 | (b) | | | 0.00 | (b) | |
Net asset value, end of period | | $ | 12.99 | | | $ | 13.27 | | | $ | 15.28 | | | $ | 13.62 | | | $ | 9.49 | | |
Total return | | | 1.86 | % | | | (9.35 | %) | | | 15.74 | % | | | 45.94 | % | | | (42.41 | %) | |
Ratios to average net assets(c) | |
Total gross expenses | | | 1.32 | %(d) | | | 1.27 | %(d) | | | 1.23 | %(d) | | | 1.17 | %(d) | | | 1.13 | %(d) | |
Total net expenses(e) | | | 1.18 | %(d)(f) | | | 1.16 | %(d)(f) | | | 1.23 | %(d)(f) | | | 1.17 | %(d)(f) | | | 1.13 | %(d)(f) | |
Net investment income | | | 3.35 | % | | | 3.09 | % | | | 1.85 | % | | | 2.76 | % | | | 3.20 | % | |
Supplemental data | |
Net assets, end of period (in thousands) | | $ | 453,526 | | | $ | 924,777 | | | $ | 1,277,799 | | | $ | 1,187,812 | | | $ | 844,122 | | |
Notes to Financial Highlights
(a) Net investment income per share reflects special dividends. The effect of these dividends amounted to $0.13 per share.
(b) Rounds to zero.
(c) Certain line items from prior years have been reclassified to conform to the current presentation.
(d) Ratios include line of credit interest expense allocated from Master Portfolio which rounds to less than 0.01%.
(e) Total net expenses include the impact of certain waivers/reimbursements made by the Investment Manager and certain of its affiliates, if applicable.
(f) The benefits derived from expense reductions had an impact of less than 0.01%.
The accompanying Notes to Financial Statements are an integral part of this statement.
Annual Report 2013
20
Columbia International Value Fund
Notes to Financial Statements
February 28, 2013
Note 1. Organization
Columbia International Value Fund (the Feeder Fund), a series of Columbia Funds Series Trust (the Trust), is a diversified fund. The Trust is registered under the Investment Company Act of 1940, as amended (the 1940 Act), as an open-end management investment company organized as a Delaware statutory trust.
The value of the Feeder Fund's investment in Columbia International Value Master Portfolio (the Master Portfolio) included in the Statement of Assets and Liabilities reflects the Feeder Fund's proportionate amount of beneficial interest in the net assets of the Master Portfolio, which is equal to 91.0% at February 28, 2013. The financial statements of the Master Portfolio, including its investment portfolio, are included elsewhere within this report and should be read in conjunction with the Feeder Fund's financial statements. Another fund that is managed by Columbia Management Investment Advisers, LLC (the Investment Manager), not registered under the 1940 Act, and whose financial statements are not presented here, also invests in the Master Portfolio.
Fund Shares
The Trust may issue an unlimited number of shares (without par value). The Feeder Fund offers Class A, Class B, Class C, Class I, Class R, Class R4, Class R5 and Class Z shares. All share classes have identical voting, dividend and liquidation rights. Each share class has its own expense structure and sales charges, as applicable.
Class A shares are subject to a maximum front-end sales charge of 5.75% based on the initial investment amount. Class A shares purchased without an initial sales charge in accounts aggregating $1 million to $50 million at the time of purchase are subject to a contingent deferred sales charge (CDSC) if the shares are sold within 18 months of purchase, charged as follows: 1.00% CDSC if redeemed within 12 months of purchase, and 0.50% CDSC if redeemed more than 12, but less than 18, months after purchase.
Class B shares may be subject to a maximum CDSC of 5.00% based upon the holding period after purchase. Class B shares will generally convert to Class A shares eight years after purchase. The Feeder Fund no longer accepts investments by new or existing investors in the Feeder Fund's Class B shares, except in connection with the reinvestment of any dividend and/or capital gain distributions in Class B shares of the Feeder Fund and exchanges by existing Class B shareholders of certain other funds within the Columbia Family of Funds.
Class C shares are subject to a 1.00% CDSC on shares redeemed within one year of purchase.
Class I shares are not subject to sales charges and are only available to the Columbia Family of Funds.
Class R shares are not subject to sales charges and are only available to qualifying institutional investors.
Class R4 shares are not subject to sales charges and are only available to investors purchasing through authorized investment professionals. Class R4 shares commenced operations on November 8, 2012.
Class R5 shares are not subject to sales charges and are only available to investors purchasing through authorized investment professionals. Class R5 shares commenced operations on November 8, 2012.
Class Z shares are not subject to sales charges, and are only available to certain investors.
Note 2. Summary of Significant Accounting Policies
Use of Estimates
The preparation of financial statements in accordance with U.S. generally accepted accounting principles (GAAP) requires management to make certain estimates and assumptions that affect the reported amounts of assets and liabilities, the disclosure of contingent assets and liabilities at the date of the financial statements and the reported amounts of revenue and expenses during the reporting period. Actual results could differ from those estimates.
The following is a summary of significant accounting policies consistently followed by the Feeder Fund in the preparation of its financial statements.
Security Valuation
The Feeder Fund invests all or substantially all of its assets in the Master Portfolio, an open-end management investment company having the same investment objectives as the Feeder Fund. See the Notes to Financial Statements for the Master Portfolio included elsewhere in this report for the Master Portfolio's valuation policies.
Foreign Currency Transactions and Translation
The values of all assets and liabilities denominated in foreign currencies are translated into U.S. dollars at that day's exchange rates. Net realized and unrealized gains (losses) on foreign currency transactions and translations include gains (losses) arising from the fluctuation in exchange rates between trade and settlement dates on securities transactions, gains (losses) arising from the disposition of foreign currency and currency gains (losses) between the accrual and payment dates on dividends, interest income and foreign withholding taxes.
For financial statement purposes, the Feeder Fund does not distinguish that portion of gains (losses) on investments which is due to changes in foreign exchange rates from that which is due to changes in market prices of the investments. Such
Annual Report 2013
21
Columbia International Value Fund
Notes to Financial Statements (continued)
February 28, 2013
fluctuations are included with the net realized and unrealized gains (losses) on investments in the Statement of Operations.
Security Transactions
Security transactions are accounted for on the trade date. Cost is determined and gains (losses) are based upon the specific identification method for both financial statement and federal income tax purposes.
Expenses
General expenses of the Trust are allocated to the Feeder Fund and other funds of the Trust based upon relative net assets or other expense allocation methodologies determined by the nature of the expense. Expenses directly attributable to the Feeder Fund are charged to the Feeder Fund. Expenses directly attributable to a specific class of shares are charged to that share class.
Determination of Class Net Asset Value
All income, expenses (other than class-specific expenses, which are charged to that share class, as shown in the Statement of Operations) and realized and unrealized gains (losses) are allocated to each class of the Feeder Fund on a daily basis, based on the relative net assets of each class, for purposes of determining the net asset value of each class.
The Feeder Fund records its proportionate share of investment income, realized and unrealized gains (losses) and expenses reported by the Master Portfolio on a daily basis. The investment income, realized and unrealized gains (losses) and expenses are allocated daily to investors of the Master Portfolio based upon the relative value of their investment in the Master Portfolio.
Federal Income Tax Status
The Feeder Fund intends to qualify each year as a regulated investment company under Subchapter M of the Internal Revenue Code, as amended, and will distribute substantially all of its taxable income, if any, for its tax year, and as such will not be subject to federal income taxes. In addition, the Feeder Fund intends to distribute in each calendar year substantially all of its net investment income, capital gains and certain other amounts, if any, such that the Feeder Fund should not be subject to federal excise tax. Therefore, no federal income or excise tax provision is recorded.
Foreign Taxes
The Feeder Fund may be subject to foreign taxes on income, gains on investments or currency repatriation, a portion of which may be recoverable. The Feeder Fund will accrue such
taxes and recoveries, as applicable, based upon its current interpretation of tax rules and regulations that exist in the markets in which it invests.
Realized gains in certain countries may be subject to foreign taxes at the Feeder Fund level, based on statutory rates. The Feeder Fund accrues for such foreign taxes on net realized and unrealized gains at the appropriate rate for each jurisdiction.
Distributions to Shareholders
Distributions from net investment income, if any, are declared and paid semi-annually. Net realized capital gains, if any, are distributed at least annually. Income distributions and capital gain distributions are determined in accordance with federal income tax regulations, which may differ from GAAP.
Guarantees and Indemnifications
Under the Trust's organizational documents and, in some cases, by contract, its officers and trustees are indemnified against certain liabilities arising out of the performance of their duties to the Trust or its Feeder Fund. In addition, certain of the Feeder Fund's contracts with its service providers contain general indemnification clauses. The Feeder Fund's maximum exposure under these arrangements is unknown since the amount of any future claims that may be made against the Feeder Fund cannot be determined, and the Feeder Fund has no historical basis for predicting the likelihood of any such claims.
Recent Accounting Pronouncement
Disclosures about Offsetting Assets and Liabilities
In December 2011, the Financial Accounting Standards Board (FASB) issued Accounting Standards Update (ASU) No. 2011-11, Disclosures about Offsetting Assets and Liabilities. The objective of the FASB is to enhance current disclosure requirements on offsetting of certain assets and liabilities and to enable financial statement users to compare financial statements prepared under GAAP and International Financial Reporting Standards.
Specifically, ASU No. 2011-11 requires an entity to disclose both gross and net information for derivatives and other financial instruments that are subject to a master netting arrangement or similar agreement. The standard requires disclosure of collateral received in connection with the master netting agreements or similar agreements. The effective date of ASU No. 2011-11 is for interim and annual periods beginning on or after January 1, 2013. At this time, management is evaluating the implications of this guidance and the impact it will have on the financial statement amounts and footnote disclosures, if any.
Annual Report 2013
22
Columbia International Value Fund
Notes to Financial Statements (continued)
February 28, 2013
Note 3. Fees and Compensation Paid to Affiliates
Investment Management Fees
Under an Investment Management Services Agreement, the Investment Manager, a wholly-owned subsidiary of Ameriprise Financial, Inc. (Ameriprise Financial), determines which securities will be purchased, held or sold. The Feeder Fund indirectly pays for investment management and subadvisory services and a portion of the administrative services through its investment in the Master Portfolio (see Notes to Financial Statements of the Master Portfolio).
Administration Fees
Under an Administrative Services Agreement, the Investment Manager also serves as the Fund Administrator. The Feeder Fund pays the Fund Administrator an annual fee for administration and accounting services equal to 0.17% of the Fund's average daily net assets.
Other Expenses
Other expenses are for, among other things, certain expenses of the Feeder Fund or the Board of Trustees (the Board), including: Fund boardroom and office expense, employee compensation, employee health and retirement benefits, and certain other expenses. Payment of these Feeder Fund and Board expenses is facilitated by a company providing limited administrative services to the Feeder Fund and the Board. For the year ended February 28, 2013, other expenses paid to this company were $2,762.
Compensation of Board Members
Board members are compensated for their services to the Feeder Fund as disclosed in the Statement of Operations. Under a Deferred Compensation Plan (the Plan), the Board members who are not "interested persons" of the Feeder Fund, as defined under the 1940 Act, may elect to defer payment of up to 100% of their compensation. Deferred amounts are treated as though equivalent dollar amounts had been invested in shares of certain funds managed by the Investment Manager. The Feeder Fund's liability for these amounts is adjusted for market value changes and remains in the Feeder Fund until distributed in accordance with the Plan.
Transfer Agent Fees
Under a Transfer and Dividend Disbursing Agent Agreement, Columbia Management Investment Services Corp. (the Transfer Agent), an affiliate of the Investment Manager and a wholly-owned subsidiary of Ameriprise Financial, is responsible for providing transfer agency services to the Feeder Fund. The Transfer Agent has contracted with Boston Financial Data Services (BFDS) to serve as sub-transfer agent.
The Transfer Agent receives monthly account-based service fees based on the number of open accounts and is reimbursed by the Feeder Fund for the fees and expenses the Transfer Agent pays to financial intermediaries that maintain omnibus accounts with the Feeder Fund that is a percentage of the average aggregate value of the Feeder Fund's shares maintained in each such omnibus account (other than omnibus accounts for which American Enterprise Investment Services Inc. is the broker of record or accounts where the beneficial shareholder is a customer of Ameriprise Financial Services, Inc., which are paid a per account fee). The Transfer Agent pays the fees of BFDS for services as sub-transfer agent and is not entitled to reimbursement for such fees from the Feeder Fund (with the exception of out-of-pocket fees).
The Transfer Agent also receives compensation from fees for various shareholder services and reimbursements for certain out-of-pocket fees. Class I shares do not pay transfer agent fees. Total transfer agent fees for Class R5 shares are subject to an annual limitation of not more than 0.05% of the average daily net assets attributable to Class R5 shares.
For the year ended February 28, 2013, the Feeder Fund's effective transfer agent fee rates as a percentage of average daily net assets of each class were as follows:
Class A | | | 0.20 | % | |
Class B | | | 0.20 | | |
Class C | | | 0.20 | | |
Class R | | | 0.20 | | |
Class R4 | | | 0.17 | * | |
Class R5 | | | 0.02 | * | |
Class Z | | | 0.20 | | |
*Annualized.
An annual minimum account balance fee of $20 may apply to certain accounts with a value below the Feeder Fund's initial minimum investment requirements to reduce the impact of small accounts on transfer agent fees. These minimum account balance fees are recorded as part of expense reductions in the Statement of Operations. For the year ended February 28, 2013, these minimum account balance fees reduced total expenses by $1,120.
Distribution and Service Fees
The Feeder Fund has an agreement with Columbia Management Investment Distributors, Inc. (the Distributor), an affiliate of the Investment Manager and a wholly-owned subsidiary of Ameriprise Financial, for distribution and shareholder services. Pursuant to Rule 12b-1 under the 1940 Act, the Board has approved, and the Feeder Fund has adopted, distribution and shareholder service plans (the Plans) which set the distribution and service fees for the Feeder Fund.
Annual Report 2013
23
Columbia International Value Fund
Notes to Financial Statements (continued)
February 28, 2013
These fees are calculated daily and are intended to compensate the Distributor and/or eligible selling and/or servicing agents for selling shares of the Feeder Fund and providing services to investors.
The Plans require the payment of a monthly combined distribution and service fee to the Distributor at the maximum annual rate of 0.25% of the average daily net assets attributable to Class A shares of the Feeder Fund. The Plans also required the payment of a monthly service fee at the maximum annual rate of 0.25% of the average daily net assets attributable to Class B and Class C shares of the Feeder Fund and the payment of a monthly distribution fee to the Distributor at the maximum annual rates of 0.75%, 0.75% and 0.50% of the average daily net assets attributable to Class B, Class C and Class R shares, respectively.
Sales Charges
Sales charges, including front-end charges and CDSCs, received by the Distributor for distributing Feeder Fund shares were $66,038 for Class A, $486 for Class B and $884 for Class C shares for the year ended February 28, 2013.
Expenses Waived/Reimbursed by the Investment Manager and its Affiliates
Effective July 1, 2012, the Investment Manager and certain of its affiliates have contractually agreed to waive fees and/or reimburse expenses (excluding certain fees and expenses described below), through June 30, 2013, unless sooner terminated at the sole discretion of the Board, so that the Feeder Fund's net operating expenses, after giving effect to fees waived/expenses reimbursed and any balance credits and/or overdraft charges from the Feeder Fund's custodian, do not exceed the following annual rates as a percentage of the class' average daily net assets:
Class A | | | 1.46 | % | |
Class B | | | 2.21 | | |
Class C | | | 2.21 | | |
Class I | | | 1.07 | | |
Class R | | | 1.71 | | |
Class R4* | | | 1.21 | | |
Class R5* | | | 1.12 | | |
Class Z | | | 1.21 | | |
*Annnual rate is contractual from November 8, 2012 (the commencement of operations of each share class) through November 8, 2013.
Prior to July 1, 2012, the Investment Manager and certain of its affiliates contractually agreed to waive fees and/or reimburse expenses (excluding certain fees and expenses described below), so that the Feeder Fund's net operating
expenses, after giving effect to fees waived/expenses reimbursed and any balance credits and/or overdraft charges from the Feeder Fund's custodian, did not exceed the following annual rates as a percentage of the class' average daily net assets:
Class A | | | 1.37 | % | |
Class B | | | 2.12 | | |
Class C | | | 2.12 | | |
Class I | | | 0.97 | | |
Class R | | | 1.62 | | |
Class Z | | | 1.12 | | |
Under the agreement, the following fees and expenses are excluded from the waiver/reimbursement commitment, and therefore will be paid by the Feeder Fund, if applicable: taxes (including foreign transaction taxes), expenses associated with investments in affiliated and non-affiliated pooled investment vehicles (including mutual funds and exchange traded funds), transaction costs and brokerage commissions, costs related to any securities lending program, dividend expenses associated with securities sold short, inverse floater program fees and expenses, transaction charges and interest on borrowed money, interest, extraordinary expenses and any other expenses the exclusion of which is specifically approved by the Board. This agreement may be modified or amended only with approval from all parties.
Note 4. Federal Tax Information
The timing and character of income and capital gain distributions are determined in accordance with income tax regulations, which may differ from GAAP because of temporary or permanent book to tax differences.
At February 28, 2013, these differences are primarily due to differing treatment for capital loss carryforwards, deferral/reversal of wash sales losses, Trustees' deferred compensation, passive foreign investment company (PFIC) holdings and post-October capital losses. To the extent these differences are permanent, reclassifications are made among the components of the Feeder Fund's net assets in the Statement of Assets and Liabilities. Temporary differences do not require reclassifications. In the Statement of Assets and Liabilities the following reclassifications were made:
Excess of distributions over
net investment income | | $ | 837,565 | | |
Accumulated net realized loss | | | (964,352 | ) | |
Paid-in capital | | | 126,787 | | |
Net investment income and net realized gains (losses), as disclosed in the Statement of Operations, and net assets were not affected by this reclassification.
Annual Report 2013
24
Columbia International Value Fund
Notes to Financial Statements (continued)
February 28, 2013
The tax character of distributions paid during the years indicated was as follows:
Year Ended | | February 28,
2013 | | February 29,
2012 | |
Ordinary income | | $ | 36,505,594 | | | $ | 46,281,246 | | |
Tax return of capital | | | 1,255,633 | | | | — | | |
Total | | $ | 37,761,227 | | | $ | 46,281,246 | | |
Short-term capital gain distributions, if any, are considered ordinary income distributions for tax purposes.
At February 28, 2013, the components of distributable earnings on a tax basis were as follows:
Undistributed ordinary income | | | — | | |
Undistributed accumulated long-term gain | | | — | | |
Unrealized depreciation | | | N/A* | | |
*See the Master Portfolio notes to financial statements for tax basis information.
The following capital loss carryforward, determined at February 28, 2013, may be available to reduce taxable income arising from future net realized gains on investments, if any, to the extent permitted by the Internal Revenue Code:
Year of Expiration | | Amount ($) | |
2018 | | | 185,725,377 | | |
2019 | | | 68,376,538 | | |
Unlimited long-term | | | 171,398,112 | | |
Total | | | 425,500,027 | | |
Unlimited capital loss carryforwards are required to be utilized prior to any capital losses which carry an expiration date. As a result of this ordering rule, capital loss carryforwards which carry an expiration date may be more likely to expire unused.
Under current tax rules, regulated investment companies can elect to treat certain late-year ordinary losses incurred and post-October capital losses (capital losses realized after October 31) as arising on the first day of the following taxable year. As of February 28, 2013, the Feeder Fund will elect to treat late year ordinary losses of $2,206,883 and post-October capital losses of $98,895,321 as arising on March 1, 2013.
Management of the Feeder Fund has concluded that there are no significant uncertain tax positions that would require recognition in the financial statements. However, management's conclusion may be subject to review and adjustment at a later date based on factors including, but not limited to, new tax laws, regulations, and administrative interpretations (including relevant court decisions). Generally, the Feeder Fund's federal tax returns for the prior three fiscal years remain subject to examination by the Internal Revenue Service.
Note 5. Regulatory Settlements
During the year ended February 29, 2012, the Feeder Fund received $81,090 as a result of a regulatory settlement proceeding brought by the Securities and Exchange Commission against an unaffiliated third party relating to market timing and/or late trading of mutual funds. This amount represented the Feeder Fund's portion of the proceeds from the settlement (the Feeder Fund was not a party to the proceeding). The payments have been included in "Proceeds from regulatory settlements" in the Statement of Changes in Net Assets.
Note 6. Shareholder Concentration
At February 28, 2013, three unaffiliated shareholder accounts owned 55.8% of the outstanding shares of the Feeder Fund. The Feeder Fund has no knowledge about whether any portion of those shares was owned beneficially. Subscription and redemption activity of these accounts may have a significant effect on the operations of the Feeder Fund.
Note 7. Significant Risks
Foreign Securities Risk
Investing in foreign securities may include certain risks and considerations not typically associated with investing in U.S. securities, such as fluctuating currency values and changing local and regional economic, political and social conditions, which may result in greater market volatility. In addition, certain foreign securities may not be as liquid as U.S. securities. Investing in emerging markets may accentuate these risks.
Investments in emerging market countries are subject to additional risk. The risk of foreign investments is typically increased in less developed countries. These countries are also more likely to experience high levels of inflation, deflation or currency devaluation which could hurt their economies and securities markets.
Note 8. Subsequent Events
Management has evaluated the events and transactions that have occurred through the date the financial statements were issued and noted no items requiring adjustment of the financial statements or additional disclosure.
Note 9. Information Regarding Pending and Settled Legal Proceedings
In December 2005, without admitting or denying the allegations, American Express Financial Corporation (AEFC, which is now known as Ameriprise Financial, Inc. (Ameriprise Financial)) entered into settlement agreements with the Securities and Exchange Commission (SEC) and Minnesota
Annual Report 2013
25
Columbia International Value Fund
Notes to Financial Statements (continued)
February 28, 2013
Department of Commerce (MDOC) related to market timing activities. As a result, AEFC was censured and ordered to cease and desist from committing or causing any violations of certain provisions of the Investment Advisers Act of 1940, the Investment Company Act of 1940, and various Minnesota laws. AEFC agreed to pay disgorgement of $10 million and civil money penalties of $7 million. AEFC also agreed to retain an independent distribution consultant to assist in developing a plan for distribution of all disgorgement and civil penalties ordered by the SEC in accordance with various undertakings detailed at www.sec.gov/litigation/admin/ia-2451.pdf. Ameriprise Financial and its affiliates have cooperated with the SEC and the MDOC in these legal proceedings, and have made regular reports to the funds' Boards of Trustees.
Ameriprise Financial and certain of its affiliates have historically been involved in a number of legal, arbitration and regulatory proceedings, including routine litigation, class actions, and governmental actions, concerning matters arising in connection with the conduct of their business activities. Ameriprise Financial believes that the Funds are not currently the subject of, and that neither Ameriprise Financial nor any of its affiliates are the subject of, any pending legal, arbitration or regulatory proceedings that are likely to have a material adverse effect on the Funds or the ability of Ameriprise Financial or its affiliates to perform under their contracts with the Funds. Ameriprise Financial is required to make 10-Q, 10-K and, as necessary, 8-K filings with the Securities and Exchange Commission on legal and regulatory matters that relate to Ameriprise Financial and its affiliates. Copies of these filings may be obtained by accessing the SEC website at www.sec.gov.
There can be no assurance that these matters, or the adverse publicity associated with them, will not result in increased fund redemptions, reduced sale of fund shares or other adverse consequences to the Funds. Further, although we believe proceedings are not likely to have a material adverse effect on the Funds or the ability of Ameriprise Financial or its affiliates to perform under their contracts with the Funds, these proceedings are subject to uncertainties and, as such, we are unable to estimate the possible loss or range of loss that may result. An adverse outcome in one or more of these proceedings could result in adverse judgments, settlements, fines, penalties or other relief that could have a material adverse effect on the consolidated financial condition or results of operations of Ameriprise Financial.
Annual Report 2013
26
Columbia International Value Fund
Report of Independent Registered Public Accounting Firm
To the Trustees of Columbia Funds Series Trust and
the Shareholders of Columbia International Value Fund
In our opinion, the accompanying statement of assets and liabilities, including the portfolio of investments, and the related statements of operations and of changes in net assets and the financial highlights present fairly, in all material respects, the financial position of Columbia International Value Fund (the "Fund") (a series of Columbia Funds Series Trust) at February 28, 2013, the results of its operations for the year then ended, the changes in its net assets for each of the two years in the period then ended and the financial highlights for each of the periods indicated, in conformity with accounting principles generally accepted in the United States of America. These financial statements and financial highlights (hereafter referred to as "financial statements") are the responsibility of the Fund's management. Our responsibility is to express an opinion on these financial statements based on our audits. We conducted our audits of these financial statements in accordance with the standards of the Public Company Accounting Oversight Board (United States). Those standards require that we plan and perform the audit to obtain reasonable assurance about whether the financial statements are free of material misstatement. An audit includes examining, on a test basis, evidence supporting the amounts and disclosures in the financial statements, assessing the accounting principles used and significant estimates made by management, and evaluating the overall financial statement presentation. We believe that our audits, which included confirmation of securities at February 28, 2013 by correspondence with the custodian, transfer agent and brokers, provide a reasonable basis for our opinion.
PricewaterhouseCoopers LLP
Minneapolis, Minnesota
April 19, 2013
Annual Report 2013
27
Columbia International Value Fund
Federal Income Tax Information
(Unaudited)
The Fund hereby designates the following tax attributes for the fiscal year ended February 28, 2013. Shareholders will be notified in early 2014 of the amounts for use in preparing 2013 income tax returns.
Tax Designations:
| Qualified Dividend Income | | | 76.21 | % | |
Foreign Taxes Paid | | $ | 2,220,842 | | |
Foreign Source Income | | $ | 32,418,866 | | |
Qualified Dividend Income. For taxable, non-corporate shareholders, the percentage of ordinary income dividends paid during the fiscal year that represents qualified dividend income subject to reduced tax rates under the Jobs and Growth Tax Relief Reconciliation Act of 2003.
Foreign Taxes. The Fund makes the election to pass through to shareholders the foreign taxes paid. These taxes, and the corresponding foreign source income, are provided.
Annual Report 2013
28
Columbia Funds Master Investment Trust, LLC
Columbia International Value Master Portfolio Annual Report
February 28, 2013
The following pages should be read in conjunction with Columbia International Value Fund's Annual Report.
29
Columbia International Value Master Portfolio
Portfolio of Investments
February 28, 2013
(Percentages represent value of investments compared to net assets)
Common Stocks 97.8%
Issuer | | Shares | | Value ($) | |
Brazil 5.7% | |
Banco Santander Brasil SA, ADR | | | 1,038,900 | | | | 7,594,359 | | |
Centrais Eletricas Brasileiras SA, ADR | | | 1,096,040 | | | | 3,825,180 | | |
Petroleo Brasileiro SA, ADR | | | 733,143 | | | | 12,265,482 | | |
Telefonica Brasil SA, ADR | | | 294,756 | | | | 7,769,768 | | |
Tim Participacoes SA, ADR | | | 439,070 | | | | 9,554,163 | | |
Total | | | | | 41,008,952 | | |
France 13.9% | |
Carrefour SA | | | 724,092 | | | | 19,693,793 | | |
France Telecom SA | | | 1,255,470 | | | | 12,108,949 | | |
GDF Suez | | | 1,134,818 | | | | 21,421,032 | | |
Natixis | | | 1,287,146 | | | | 5,326,019 | | |
Renault SA | | | 84,100 | | | | 5,312,264 | | |
Sanofi | | | 150,686 | | | | 14,230,458 | | |
Total SA | | | 428,981 | | | | 21,417,176 | | |
Total | | | | | 99,509,691 | | |
Germany 3.1% | |
Daimler AG, Registered Shares | | | 179,327 | | | | 10,652,221 | | |
Deutsche Telekom AG,
Registered Shares | | | 1,103,100 | | | | 11,821,358 | | |
Total | | | | | 22,473,579 | | |
Ireland 3.1% | |
CRH PLC | | | 1,007,198 | | | | 21,850,508 | | |
Italy 5.9% | |
ENI SpA | | | 667,087 | | | | 15,182,745 | | |
Intesa Sanpaolo SpA | | | 6,061,838 | | | | 9,760,120 | | |
Italcementi SpA, Savings Shares | | | 890,500 | | | | 2,629,191 | | |
Telecom Italia SpA, Savings Shares | | | 22,133,310 | | | | 14,313,005 | | |
Total | | | | | 41,885,061 | | |
Japan 26.9% | |
Astellas Pharma, Inc. | | | 212,200 | | | | 11,462,571 | | |
Canon, Inc. | | | 374,400 | | | | 13,549,299 | | |
Dai Nippon Printing Co., Ltd. | | | 966,000 | | | | 8,489,982 | | |
Daiichi Sankyo Co., Ltd. | | | 852,600 | | | | 15,248,924 | | |
FUJIFILM Holdings Corp. | | | 432,305 | | | | 8,299,063 | | |
Mitsubishi UFJ Financial Group, Inc. | | | 1,729,931 | | | | 9,588,019 | | |
MS&AD Insurance Group Holdings, Inc. | | | 452,100 | | | | 9,349,526 | | |
Nippon Telegraph & Telephone Corp. | | | 446,100 | | | | 20,383,511 | | |
Common Stocks (continued)
Issuer | | Shares | | Value ($) | |
NKSJ Holdings, Inc. | | | 359,750 | | | | 7,608,338 | | |
Ono Pharmaceutical Co., Ltd. | | | 182,500 | | | | 9,685,086 | | |
Rohm Co., Ltd. | | | 191,400 | | | | 6,789,780 | | |
Seven & I Holdings Co., Ltd. | | | 237,200 | | | | 6,923,405 | | |
Sumitomo Mitsui Financial Group, Inc. | | | 209,742 | | | | 8,370,612 | | |
Sumitomo Mitsui Trust Holdings, Inc. | | | 1,436,000 | | | | 5,574,221 | | |
Taisho Pharmaceutical Holdings Co., Ltd. | | | 100,999 | | | | 6,956,272 | | |
Takeda Pharmaceutical Co., Ltd. | | | 237,700 | | | | 12,285,770 | | |
TDK Corp. | | | 185,000 | | | | 6,378,667 | | |
Tokio Marine Holdings, Inc. | | | 386,800 | | | | 10,904,166 | | |
Toyota Motor Corp. | | | 283,900 | | | | 14,580,986 | | |
Total | | | | | 192,428,198 | | |
Mexico 2.1% | |
America Movil SAB de CV, Class L, ADR | | | 443,600 | | | | 9,266,804 | | |
Cemex SAB de CV, ADR(a) | | | 524,695 | | | | 5,635,224 | | |
Total | | | | | 14,902,028 | | |
Netherlands 5.8% | |
Aegon NV | | | 1,833,373 | | | | 10,913,431 | | |
Koninklijke Ahold NV | | | 1,016,432 | | | | 14,585,706 | | |
Unilever NV-CVA | | | 314,449 | | | | 12,194,767 | | |
Wolters Kluwer NV | | | 198,500 | | | | 3,946,107 | | |
Total | | | | | 41,640,011 | | |
Russian Federation 1.5% | |
Lukoil OAO, ADR | | | 171,900 | | | | 11,091,848 | | |
South Korea 1.6% | |
POSCO | | | 34,205 | | | | 11,140,176 | | |
Spain 1.0% | |
Telefonica SA | | | 554,896 | | | | 7,242,696 | | |
Sweden 1.8% | |
Telefonaktiebolaget LM Ericsson,
Class B | | | 1,081,068 | | | | 13,142,105 | | |
Switzerland 6.7% | |
Swiss Re AG | | | 205,800 | | | | 16,461,231 | | |
TE Connectivity Ltd. | | | 464,643 | | | | 18,646,124 | | |
UBS AG, Registered Shares | | | 791,630 | | | | 12,508,000 | | |
Total | | | | | 47,615,355 | | |
The accompanying Notes to Financial Statements are an integral part of this statement.
Annual Report 2013
30
Columbia International Value Master Portfolio
Portfolio of Investments (continued)
February 28, 2013
Common Stocks (continued)
Issuer | | Shares | | Value ($) | |
United Kingdom 18.1% | |
AstraZeneca PLC | | | 346,885 | | | | 15,729,558 | | |
Barclays PLC | | | 1,501,007 | | | | 6,964,549 | | |
| BP PLC | | | 3,102,300 | | | | 20,802,556 | | |
GlaxoSmithKline PLC | | | 665,648 | | | | 14,668,725 | | |
HSBC Holdings PLC | | | 689,939 | | | | 7,641,539 | | |
ITV PLC | | | 3,904,676 | | | | 7,333,528 | | |
J Sainsbury PLC | | | 1,694,829 | | | | 8,868,900 | | |
Kingfisher PLC | | | 2,063,100 | | | | 8,642,658 | | |
Marks & Spencer Group PLC | | | 2,540,880 | | | | 14,265,453 | | |
Vodafone Group PLC | | | 4,205,890 | | | | 10,549,199 | | |
Wm Morrison Supermarkets PLC | | | 3,598,665 | | | | 14,149,120 | | |
Total | | | | | 129,615,785 | | |
Common Stocks (continued)
Issuer | | Shares | | Value ($) | |
United States 0.6% | |
Seagate Technology PLC | | | 140,900 | | | | 4,531,344 | | |
Total Common Stocks
(Cost: $784,598,651) | | | | | 700,077,337 | | |
Money Market Funds 1.2% | |
Columbia Short-Term Cash Fund,
0.128%(b)(c) | | | 8,630,043 | | | | 8,630,043 | | |
Total Money Market Funds
(Cost: $8,630,043) | | | | | 8,630,043 | | |
Total Investments
(Cost: $793,228,694) | | | | | 708,707,380 | | |
Other Assets & Liabilities, Net | | | | | 6,884,452 | | |
Net Assets | | | | | 715,591,832 | | |
Notes to Portfolio of Investments
(a) Non-income producing.
(b) The rate shown is the seven-day current annualized yield at February 28, 2013.
(c) As defined in the Investment Company Act of 1940, an affiliated company is one in which the Fund owns 5% or more of its outstanding voting securities, or a company which is under common ownership or control with the Fund. Holdings and transactions in these affiliated companies during the year ended February 28, 2013, are as follows:
Issuer | | Beginning
Cost ($) | | Purchase
Cost ($) | | Proceeds
From Sales ($) | | Realized
Gain/Loss ($) | | Ending
Cost ($) | | Dividends
or Interest
Income ($) | | Value ($) | |
Columbia
Short-Term
Cash Fund | | | 47,968,082 | | | | 512,203,264 | | | | (551,541,303) | | | | — | | | | 8,630,043 | | | | 20,397 | | | | 8,630,043 | | |
Abbreviation Legend
ADR American Depositary Receipt
Fair Value Measurements
Generally accepted accounting principles (GAAP) require disclosure regarding the inputs and valuation techniques used to measure fair value and any changes in valuation inputs or techniques. In addition, investments shall be disclosed by major category.
The Fund categorizes its fair value measurements according to a three-level hierarchy that maximizes the use of observable inputs and minimizes the use of unobservable inputs by prioritizing that the most observable input be used when available. Observable inputs are those that market participants would use in pricing an investment based on market data obtained from sources independent of the reporting entity. Unobservable inputs are those that reflect the Fund's assumptions about the information market participants would use in pricing an investment. An investment's level within the fair value hierarchy is based on the lowest level of any input that is deemed significant to the asset or liability's fair value measurement. The input levels are not necessarily an indication of the risk or liquidity associated with investments at that level. For example, certain U.S. government securities are generally high quality and liquid, however, they are reflected as Level 2 because the inputs used to determine fair value may not always be quoted prices in an active market.
Fair value inputs are summarized in the three broad levels listed below:
> Level 1 — Valuations based on quoted prices for investments in active markets that the Fund has the ability to access at the measurement date (including NAV for open-end mutual funds). Valuation adjustments are not applied to Level 1 investments.
The accompanying Notes to Financial Statements are an integral part of this statement.
Annual Report 2013
31
Columbia International Value Master Portfolio
Portfolio of Investments (continued)
February 28, 2013
Fair Value Measurements (continued)
> Level 2 — Valuations based on other significant observable inputs (including quoted prices for similar securities, interest rates, prepayment speeds, credit risks, etc.).
> Level 3 — Valuations based on significant unobservable inputs (including the Fund's own assumptions and judgment in determining the fair value of investments).
Inputs that are used in determining fair value of an investment may include price information, credit data, volatility statistics, and other factors. These inputs can be either observable or unobservable. The availability of observable inputs can vary between investments, and is affected by various factors such as the type of investment, and the volume and level of activity for that investment or similar investments in the marketplace. The inputs will be considered by the Investment Manager, along with any other relevant factors in the calculation of an investment's fair value. The Fund uses prices and inputs that are current as of the measurement date, which may include periods of market dislocations. During these periods, the availability of prices and inputs may be reduced for many investments. This condition could cause an investment to be reclassified between the various levels within the hierarchy.
Foreign equity securities actively traded in markets where there is a significant delay in the local close relative to the New York Stock Exchange (NYSE) are classified as Level 2. The values of these securities may include an adjustment to reflect the impact of significant market movements following the close of local trading, as described in Note 2 to the financial statements — Security Valuation.
Investments falling into the Level 3 category are primarily supported by quoted prices from brokers and dealers participating in the market for those investments. However, these may be classified as Level 3 investments due to lack of market transparency and corroboration to support these quoted prices. Additionally, valuation models may be used as the pricing source for any remaining investments classified as Level 3. These models rely on one or more significant unobservable inputs and/or significant assumptions by the Investment Manager. Inputs used in valuations may include, but are not limited to, financial statement analysis, capital account balances, discount rates and estimated cash flows, and comparable company data.
Under the direction of the Fund's Board of Trustees (the Board), the Investment Manager's Valuation Committee (the Committee) is responsible for carrying out the valuation procedures approved by the Board. The Committee consists of voting and non-voting members from various groups within the Investment Manager's organization, including operations and accounting, trading and investments, compliance, risk management and legal.
The Committee meets at least monthly to review and approve valuation matters, which may include a description of specific valuation determinations, data regarding pricing information received from approved pricing vendors and brokers and the results of Board-approved valuation control policies and procedures (the Policies). The Policies address, among other things, instances when market quotations are readily available, including recommendations of third party pricing vendors and a determination of appropriate pricing methodologies; events that require specific valuation determinations and assessment of fair value techniques; securities with a potential for stale pricing, including those that are illiquid, restricted, or in default; and the effectiveness of third-party pricing vendors, including periodic reviews of vendors. The Committee meets more frequently, as needed, to discuss additional valuation matters, which may include the need to review back-testing results, review time-sensitive information or approve related valuation actions. The Committee reports to the Board, with members of the Committee meeting with the Board at each of its regularly scheduled meetings to discuss valuation matters and actions during the period, similar to those described earlier.
For investments categorized as Level 3, the Committee monitors information similar to that described above, which may include: (i) data specific to the issuer or comparable issuers, (ii) general market or specific sector news and (iii) quoted prices and specific or similar security transactions. The Committee considers this data and any changes from prior periods in order to assess the reasonableness of observable and unobservable inputs, any assumptions or internal models used to value those securities and changes in fair value. This data is also used to corroborate, when available, information received from approved pricing vendors and brokers. Various factors impact the frequency of monitoring this information (which may occur as often as daily). However, the Committee may determine that changes to inputs, assumptions and models are not required as a result of the monitoring procedures performed.
The accompanying Notes to Financial Statements are an integral part of this statement.
Annual Report 2013
32
Columbia International Value Master Portfolio
Portfolio of Investments (continued)
February 28, 2013
Fair Value Measurements (continued)
The following table is a summary of the inputs used to value the Fund's investments at February 28, 2013:
Description | | Level 1
Quoted Prices in Active
Markets for Identical
Assets ($) | | Level 2
Other Significant
Observable Inputs ($) | | Level 3
Significant
Unobservable Inputs ($) | | Total ($) | |
Equity Securities | |
Common Stocks | |
Consumer Discretionary | | | — | | | | 64,733,217 | | | | — | | | | 64,733,217 | | |
Consumer Staples | | | — | | | | 76,415,691 | | | | — | | | | 76,415,691 | | |
Energy | | | 23,357,330 | | | | 57,402,477 | | | | — | | | | 80,759,807 | | |
Financials | | | 7,594,359 | | | | 120,969,771 | | | | — | | | | 128,564,130 | | |
Health Care | | | — | | | | 100,267,364 | | | | — | | | | 100,267,364 | | |
Industrials | | | — | | | | 8,489,982 | | | | — | | | | 8,489,982 | | |
Information Technology | | | 23,177,468 | | | | 48,158,914 | | | | — | | | | 71,336,382 | | |
Materials | | | 5,635,224 | | | | 35,619,875 | | | | — | | | | 41,255,099 | | |
Telecommunication Services | | | 26,590,735 | | | | 76,418,718 | | | | — | | | | 103,009,453 | | |
Utilities | | | 3,825,180 | | | | 21,421,032 | | | | — | | | | 25,246,212 | | |
Total Equity Securities | | | 90,180,296 | | | | 609,897,041 | | | | — | | | | 700,077,337 | | |
Other | |
Money Market Funds | | | 8,630,043 | | | | — | | | | — | | | | 8,630,043 | | |
Total Other | | | 8,630,043 | | | | — | | | | — | | | | 8,630,043 | | |
Total | | | 98,810,339 | | | | 609,897,041 | | | | — | | | | 708,707,380 | | |
See the Portfolio of Investments for all investment classifications not indicated in the table.
The Fund's assets assigned to the Level 2 input category are generally valued using the market approach, in which a security's value is determined through reference to prices and information from market transactions for similar or identical assets. These assets include certain foreign securities for which a third party statistical pricing service may be employed for purposes of fair market valuation. The models utilized by the third party statistical pricing service take into account a security's correlation to available market data including, but not limited to, intraday index, ADR, and ETF movements.
There were no transfers of financial assets between Levels 1 and 2 during the period.
The accompanying Notes to Financial Statements are an integral part of this statement.
Annual Report 2013
33
Columbia International Value Master Portfolio
Statement of Assets and Liabilities
February 28, 2013
Assets | |
Investments, at value | |
Unaffiliated issuers (identified cost $784,598,651) | | $ | 700,077,337 | | |
Affiliated issuers (identified cost $8,630,043) | | | 8,630,043 | | |
Total investments (identified cost $793,228,694) | | | 708,707,380 | | |
Foreign currency (identified cost $6) | | | 6 | | |
Receivable from feeder funds | | | 7,995 | | |
Receivable for: | |
Dividends | | | 6,563,850 | | |
Reclaims | | | 500,833 | | |
Prepaid expenses | | | 773 | | |
Total assets | | | 715,780,837 | | |
Liabilities | |
Payable to feeder funds | | | 51,645 | | |
Payable for: | |
Investment management fees | | | 16,404 | | |
Administration fees | | | 982 | | |
Compensation of board members | | | 59,515 | | |
Expense reimbursement due to Investment Manager | | | 54 | | |
Other expenses | | | 60,405 | | |
Total liabilities | | | 189,005 | | |
Net assets applicable to outstanding capital stock | | $ | 715,591,832 | | |
The accompanying Notes to Financial Statements are an integral part of this statement.
Annual Report 2013
34
Columbia International Value Master Portfolio
Statement of Operations
Year Ended February 28, 2013
Net investment income | |
Income: | |
Dividends — unaffiliated issuers | | $ | 54,489,821 | | |
Dividends — affiliated issuers | | | 20,397 | | |
Interest | | | 77,853 | | |
Income from securities lending — net | | | 1,318,414 | | |
Foreign taxes withheld | | | (5,638,727 | ) | |
Total income | | | 50,267,758 | | |
Expenses: | |
Investment management fees | | | 9,074,397 | | |
Administration fees | | | 555,578 | | |
Compensation of board members | | | 20,942 | | |
Custodian fees | | | 135,264 | | |
Professional fees | | | 30,638 | | |
Line of credit interest expense | | | 12,065 | | |
Other | | | 358,649 | | |
Total expenses | | | 10,187,533 | | |
Fees waived or expenses reimbursed by Investment Manager and its affiliates | | | (151,300 | ) | |
Total net expenses | | | 10,036,233 | | |
Net investment income | | | 40,231,525 | | |
Realized and unrealized gain (loss) — net | |
Net realized gain (loss) on: | |
Investments | | | (155,058,993 | ) | |
Foreign currency translations | | | 81,985 | | |
Net realized loss | | | (154,977,008 | ) | |
Net change in unrealized appreciation (depreciation) on: | |
Investments | | | 133,135,078 | | |
Foreign currency translations | | | (43,868 | ) | |
Net change in unrealized appreciation (depreciation) | | | 133,091,210 | | |
Net realized and unrealized loss | | | (21,885,798 | ) | |
Net increase in net assets resulting from operations | | $ | 18,345,727 | | |
The accompanying Notes to Financial Statements are an integral part of this statement.
Annual Report 2013
35
Columbia International Value Master Portfolio
Statement of Changes in Net Assets
| | | Year Ended
February 28,
2013 | | Year Ended
February 29,
2012 | |
Operations | |
Net investment income | | $ | 40,231,525 | | | $ | 50,576,529 | | |
Net realized loss | | | (154,977,008 | ) | | | (114,304,604 | ) | |
Net change in unrealized appreciation (depreciation) | | | 133,091,210 | | | | (120,829,715 | ) | |
Net increase (decrease) in net assets resulting from operations | | | 18,345,727 | | | | (184,557,790 | ) | |
Contributions and withdrawals | |
Contributions | | | 95,990,171 | | | | 278,469,573 | | |
Withdrawals | | | (689,416,929 | ) | | | (781,643,335 | ) | |
Net contributions (withdrawals) | | | (593,426,758 | ) | | | (503,173,762 | ) | |
Total decrease in net assets | | | (575,081,031 | ) | | | (687,731,552 | ) | |
Net assets at beginning of year | | | 1,290,672,863 | | | | 1,978,404,415 | | |
Net assets at end of year | | $ | 715,591,832 | | | $ | 1,290,672,863 | | |
The accompanying Notes to Financial Statements are an integral part of this statement.
Annual Report 2013
36
Columbia International Value Master Portfolio
The following table shows certain financial information for evaluating the Portfolio's results. Total returns are not annualized for periods of less than one year.
| | | Year Ended
February 28, | | Year Ended
February 29, | | Year Ended February 28, | |
| | | 2013 | | 2012 | | 2011 | | 2010 | | 2009 | |
Total return | | | 2.14 | % | | | (9.07 | %) | | | 16.11 | % | | | 46.24 | % | | | (42.12 | %) | |
Ratios to average net assets(a)(b) | |
Total gross expenses | | | 0.91 | %(c) | | | 0.88 | %(c) | | | 0.86 | %(c) | | | 0.87 | %(c) | | | 0.84 | %(c) | |
Total net expenses(d) | | | 0.90 | %(c) | | | 0.88 | %(c) | | | 0.86 | %(c)(e) | | | 0.87 | %(c)(e) | | | 0.84 | %(c)(e) | |
Net investment income | | | 3.61 | % | | | 3.41 | % | | | 2.21 | % | | | 3.08 | % | | | 3.58 | % | |
Supplemental data | |
Portfolio turnover | | | 13 | % | | | 16 | % | | | 7 | % | | | 22 | % | | | 5 | % | |
Notes to Financial Highlights
(a) In addition to the fees and expenses which the Master Portfolio bears directly, the Master Portfolio indirectly bears a pro rata share of the fees and expenses of the acquired funds in which it invests. Such indirect expenses are not included in the reported expense ratios.
(b) Certain line items from prior years have been reclassified to conform to the current presentation.
(c) Ratios include line of credit interest expense which rounds to less than 0.01%.
(d) The Investment Manager and certain of its affiliates agreed to waive/reimburse certain fees and expenses, if applicable.
(e) The benefits derived from expense reductions had an impact of less than 0.01%.
The accompanying Notes to Financial Statements are an integral part of this statement.
Annual Report 2013
37
Columbia International Value Master Portfolio
Notes to Financial Statements
February 28, 2013
Note 1. Organization
Columbia Funds Master Investment Trust, LLC (the Master Trust), is registered under the Investment Company Act of 1940, as amended (the 1940 Act), as an open-end management investment company. Information presented in these financial statements pertains to Columbia International Value Master Portfolio (the Master Portfolio).
The following investors were invested in the Master Portfolio at February 28, 2013:
Columbia International Value Fund (the Feeder Fund) | | | 91.0 | % | |
Columbia Management Private Funds VII, LLC —
International Value Fund | | | 9.0 | | |
The Master Portfolio serves as a master portfolio for the Columbia International Value Fund which operates as a feeder fund in a master/feeder structure.
Each investor in the Master Portfolio is treated as an owner of its proportionate share of the net assets, income, expenses and realized and unrealized gains (losses) of the Master Portfolio.
Note 2. Summary of Significant Accounting Policies
Use of Estimates
The preparation of financial statements in accordance with U.S. generally accepted accounting principles (GAAP) requires management to make certain estimates and assumptions that affect the reported amounts of assets and liabilities, the disclosure of contingent assets and liabilities at the date of the financial statements and the reported amounts of revenue and expenses during the reporting period. Actual results could differ from those estimates.
The following is a summary of significant accounting policies consistently followed by the Master Portfolio in the preparation of its financial statements.
Security Valuation
All equity securities are valued at the close of business of the New York Stock Exchange (NYSE). Equity securities are valued at the last quoted sales price on the principal exchange or market on which they trade, except for securities traded on the NASDAQ Stock Market, which are valued at the NASDAQ official close price. Unlisted securities or listed securities for which there were no sales during the day are valued at the mean of the latest quoted bid and ask prices on such exchanges or markets.
Foreign securities are valued based on quotations from the principal market in which such securities are normally traded. If any foreign share prices are not readily available as a result of limited share activity the securities are valued at the mean of the latest quoted bid and ask prices on such exchanges or
markets. Foreign currency exchange rates are generally determined at 4:00 p.m. Eastern (U.S.) time. However, many securities markets and exchanges outside the U.S. close prior to the close of the NYSE; therefore, the closing prices for securities in such markets or on such exchanges may not fully reflect events that occur after such close but before the close of the NYSE. In those situations, foreign securities will be fair valued pursuant to the policy adopted by the Board of Trustees (the Board), including utilizing a third party pricing service to determine these fair values. The third party pricing service takes into account multiple factors, including, but not limited to, movements in the U.S. securities markets, certain depositary receipts, futures contracts and foreign exchange rates that have occurred subsequent to the close of the foreign exchange or market, to determine a good faith estimate that reasonably reflects the current market conditions as of the close of the NYSE. The fair value of a security is likely to be different from the quoted or published price, if available.
Investments in other open-end investment companies, including money market funds, are valued at net asset value.
Investments for which market quotations are not readily available, or that have quotations which management believes are not reliable, are valued at fair value as determined in good faith under consistently applied procedures established by and under the general supervision of the Board. If a security or class of securities (such as foreign securities) is valued at fair value, such value is likely to be different from the last quoted market price for the security.
The determination of fair value often requires significant judgment. To determine fair value, management may use assumptions including but not limited to future cash flows and estimated risk premiums. Multiple inputs from various sources may be used to determine fair value.
Foreign Currency Transactions and Translation
The values of all assets and liabilities denominated in foreign currencies are translated into U.S. dollars at that day's exchange rates. Net realized and unrealized gains (losses) on foreign currency transactions and translations include gains (losses) arising from the fluctuation in exchange rates between trade and settlement dates on securities transactions, gains (losses) arising from the disposition of foreign currency and currency gains (losses) between the accrual and payment dates on dividends, interest income and foreign withholding taxes.
For financial statement purposes, the Master Portfolio does not distinguish that portion of gains (losses) on investments which is due to changes in foreign exchange rates from that which is due to changes in market prices of the investments. Such fluctuations are included with the net realized and unrealized gains (losses) on investments in the Statement of Operations.
Annual Report 2013
38
Columbia International Value Master Portfolio
Notes to Financial Statements (continued)
February 28, 2013
Security Transactions
Security transactions are accounted for on the trade date. Cost is determined and gains (losses) are based upon the specific identification method for both financial statement and federal income tax purposes.
Income Recognition
Corporate actions and dividend income are recorded net of any non-reclaimable tax withholdings, on the ex-dividend date or upon receipt of ex-dividend notification in the case of certain foreign securities.
Awards from class action litigation are recorded as a reduction of cost if the Master Portfolio still owns the applicable securities on the payment date. If the Master Portfolio no longer owns the applicable securities, the proceeds are recorded as realized gains.
Federal Income Tax Status
The Master Portfolio is treated as a partnership for federal income tax purposes and therefore is not subject to federal income tax. Each investor in the Master Portfolio will be subject to taxation on its allocated share of the Master Portfolio's ordinary income and capital gains.
The Master Portfolio's assets, income and distributions will be managed in such a way that the Feeder Fund will be able to continue to qualify as a registered investment company by investing its assets through its Master Portfolio.
Foreign Taxes
The Master Portfolio may be subject to foreign taxes on income, gains on investments or currency repatriation, a portion of which may be recoverable. The Master Portfolio will accrue such taxes and recoveries, as applicable, based upon its current interpretation of tax rules and regulations that exist in the markets in which it invests.
Realized gains in certain countries may be subject to foreign taxes at the Master Portfolio level, based on statutory rates. The Master Portfolio accrues for such foreign taxes on net realized and unrealized gains at the appropriate rate for each jurisdiction, as applicable.
Guarantees and Indemnifications
Under the Master Trust's organizational documents and, in some cases, by contract, its officers and trustees are indemnified against certain liabilities arising out of the performance of their duties to the Master Trust or its Master Portfolio. In addition, certain of the Master Portfolio's contracts with its service providers contain general indemnification clauses. The Master Portfolio's maximum exposure under these arrangements is unknown since the
amount of any future claims that may be made against the Master Portfolio cannot be determined, and the Master Portfolio has no historical basis for predicting the likelihood of any such claims.
Recent Accounting Pronouncement
Disclosures about Offsetting Assets and Liabilities
In December 2011, the Financial Accounting Standards Board (FASB) issued Accounting Standards Update (ASU) No. 2011-11, Disclosures about Offsetting Assets and Liabilities. The objective of the FASB is to enhance current disclosure requirements on offsetting of certain assets and liabilities and to enable financial statement users to compare financial statements prepared under GAAP and International Financial Reporting Standards.
Specifically, ASU No. 2011-11 requires an entity to disclose both gross and net information for derivatives and other financial instruments that are subject to a master netting arrangement or similar agreement. The standard requires disclosure of collateral received in connection with the master netting agreements or similar agreements. The effective date of ASU No. 2011-11 is for interim and annual periods beginning on or after January 1, 2013. At this time, management is evaluating the implications of this guidance and the impact it will have on the financial statement amounts and footnote disclosures, if any.
Note 3. Fees and Compensation Paid to Affiliates
Investment Management Fees
Under an Investment Management Services Agreement, Columbia Management Investment Advisers, LLC (the Investment Manager), a wholly-owned subsidiary of Ameriprise Financial, Inc. (Ameriprise Financial), is responsible for the ultimate oversight of investments made by the Master Portfolio. The Master Portfolio's subadviser (see Subadvisory Agreement below) has the primary responsibility for the day-to-day portfolio management of the Master Portfolio. The investment management fee is an annual fee that is equal to a percentage of the Master Portfolio's average daily net assets that declines from 0.85% to 0.66% as the Master Portfolio's net assets increase. The effective investment management fee rate for the year ended February 28, 2013 was 0.81% of the Master Portfolio's average daily net assets.
Subadvisory Agreement
The Investment Manager has entered into a Subadvisory Agreement with Brandes Investment Partners, L.P. (Brandes), the subadviser of the Master Portfolio. The Investment
Annual Report 2013
39
Columbia International Value Master Portfolio
Notes to Financial Statements (continued)
February 28, 2013
Manager compensates Brandes to manage the investment of the Master Portfolio's assets.
Administration Fees
Under an Administrative Services Agreement, the Investment Manager also serves as the Master Portfolio Administrator. The Master Portfolio pays the Master Portfolio Administrator an annual fee for administration and accounting services equal to 0.05% of the Master Portfolio's average daily net assets.
Other Expenses
Other expenses are for, among other things, certain expenses of the Master Portfolio or the Board, including: Master Portfolio boardroom and office expense, employee compensation, employee health and retirement benefits, and certain other expenses. Payment of these Master Portfolio and Board expenses is facilitated by a company providing limited administrative services to the Master Portfolio and the Board. For the year ended February 28, 2013, other expenses paid to this company were $1,339.
Compensation of Board Members
Board members are compensated for their services to the Master Portfolio as disclosed in the Statement of Operations. Under a Deferred Compensation Plan (the Plan), the Board members who are not "interested persons" of the Master Portfolio, as defined under the 1940 Act, may elect to defer payment of up to 100% of their compensation. Deferred amounts are treated as though equivalent dollar amounts had been invested in shares of certain funds managed by the Investment Manager. The Master Portfolio's liability for these amounts is adjusted for market value changes and remains in the Master Portfolio until distributed in accordance with the Plan.
Expenses Waived/Reimbursed by the Investment Manager and its Affiliates
The Investment Manager and certain of its affilates have voluntarily agreed to waive fees and/or reimburse certain expenses (excluding certain fees and expenses, such as brokerage commissions, interest, taxes and extraordinary expenses, but including custodian charges relating to overdrafts, if any) so that the Master Portfolio's ordinary net operating expenses, after giving effect to fees waived/expenses reimbursed and any balance credits and/or overdraft charges from the Master Portfolio's custodian, do not exceed the annual rate of 0.90% of the Master Portfolio's average daily net assets. This arrangement may be modified or terminated by the Investment Manager at any time.
Note 4. Federal Tax Information
At February 28, 2013, the cost of investments for federal income tax purposes was $799,072,706 and the aggregate gross unrealized appreciation and depreciation based on that cost was:
Unrealized appreciation | | $ | 65,403,541 | | |
Unrealized depreciation | | | (155,768,867 | ) | |
Net unrealized depreciation | | $ | (90,365,326 | ) | |
Management of the Master Portfolio has concluded that there are no significant uncertain tax positions that would require recognition in the financial statements. However, management's conclusion may be subject to review and adjustment at a later date based on factors including, but not limited to, new tax laws, regulations, and administrative interpretations (including relevant court decisions). Generally, the Master Portfolio's federal tax returns for the prior three fiscal years remain subject to examination by the Internal Revenue Service.
Note 5. Portfolio Information
The cost of purchases and proceeds from sales of securities, excluding short-term obligations, aggregated to $135,695,191 and $652,291,744, respectively, for the year ended February 28, 2013.
Note 6. Lending of Portfolio Securities
Effective December 19, 2012, the Master Portfolio no longer participates in securities lending activity. Prior to that date, the Master Portfolio participated, or was eligible to participate, in securities lending activity pursuant to a Master Securities Lending Agreement (the Agreement) with JPMorgan Chase Bank, N.A. (JPMorgan). The Agreement authorized JPMorgan as lending agent to lend securities to authorized borrowers in order to generate additional income on behalf of the Master Portfolio. Pursuant to the Agreement, the securities loaned were secured by cash or securities that either were issued or guaranteed as to principal and interest by the U.S. government, its agencies, authorities or instrumentalities with value equal to at least 100% of the market value of the loaned securities. Any additional collateral required to maintain those levels due to market fluctuations of the loaned securities was requested to be delivered the following business day. Cash collateral received was invested by the lending agent on behalf of the Master Portfolio into authorized investments pursuant to the Agreement.
Pursuant to the Agreement, the Master Portfolio received income for lending its securities either in the form of fees or
Annual Report 2013
40
Columbia International Value Master Portfolio
Notes to Financial Statements (continued)
February 28, 2013
by earning interest on invested cash collateral, net of negotiated rebates paid to borrowers and fees paid to the lending agent for services provided and any other securities lending expenses. Net income earned from securities lending for the year ended February 28, 2013 is disclosed in the Statement of Operations. The Master Portfolio continued to earn and accrue interest and dividends on the securities loaned.
Note 7. Affiliated Money Market Fund
The Master Portfolio may invest its daily cash balances in Columbia Short-Term Cash Fund, an affiliated money market fund established for the exclusive use by the Master Portfolio and other affiliated funds. The income earned by the Master Portfolio from such investments is included as "Dividends from affiliates" in the Statement of Operations. As an investing fund, the Master Portfolio indirectly bears its proportionate share of the expenses of Columbia Short-Term Cash Fund.
Note 8. Line of Credit
The Master Portfolio has entered into a revolving credit facility with a syndicate of banks led by JPMorgan whereby the Master Portfolio may borrow for the temporary funding of shareholder redemptions or for other temporary or emergency purposes. The credit facility agreement, as amended, which is a collective agreement between the Master Portfolio and certain other funds managed by the Investment Manager, severally and not jointly, permits collective borrowings up to $500 million. Interest is charged to each participating fund based on its borrowings at a rate equal to the higher of (i) the overnight federal funds rate plus 1.00% or (ii) the one-month LIBOR rate plus 1.00%. Each borrowing under the credit facility matures no later than 60 days after the date of borrowing. The Master Portfolio also pays a commitment fee equal to its pro rata share of the amount of the credit facility at a rate of 0.08% per annum.
For the year ended February 28, 2013, the average daily loan balance outstanding on days when borrowing existed was $10,265,714 at a weighted average interest rate of 1.21%.
Note 9. Significant Risks
Foreign Securities Risk
Investing in foreign securities may include certain risks and considerations not typically associated with investing in U.S. securities, such as fluctuating currency values and changing local and regional economic, political and social conditions, which may result in greater market volatility. In addition, certain foreign securities may not be as liquid as U.S. securities. Investing in emerging markets may accentuate these risks.
Investments in emerging market countries are subject to additional risk. The risk of foreign investments is typically increased in less developed countries. These countries are also more likely to experience high levels of inflation, deflation or currency devaluation which could hurt their economies and securities markets.
Note 10. Subsequent Events
Management has evaluated the events and transactions that have occurred through the date the financial statements were issued. Other than as noted below, there were no items requiring adjustment of the financial statements or additional disclosure.
Effective on or about June 1, 2013, the Investment Manager will assume day-to-day management responsibilities for the Master Portfolio from Brandes. Prior to the Effective Date, Brandes will continue to serve as subadviser of the Master Portfolio.
Note 11. Information Regarding Pending and Settled Legal Proceedings
In December 2005, without admitting or denying the allegations, American Express Financial Corporation (AEFC, which is now known as Ameriprise Financial, Inc. (Ameriprise Financial)) entered into settlement agreements with the Securities and Exchange Commission (SEC) and Minnesota Department of Commerce (MDOC) related to market timing activities. As a result, AEFC was censured and ordered to cease and desist from committing or causing any violations of certain provisions of the Investment Advisers Act of 1940, the Investment Company Act of 1940, and various Minnesota laws. AEFC agreed to pay disgorgement of $10 million and civil money penalties of $7 million. AEFC also agreed to retain an independent distribution consultant to assist in developing a plan for distribution of all disgorgement and civil penalties ordered by the SEC in accordance with various undertakings detailed at www.sec.gov/litigation/admin/ia-2451.pdf. Ameriprise Financial and its affiliates have cooperated with the SEC and the MDOC in these legal proceedings, and have made regular reports to the funds' Boards of Trustees.
Ameriprise Financial and certain of its affiliates have historically been involved in a number of legal, arbitration and regulatory proceedings, including routine litigation, class actions, and governmental actions, concerning matters arising in connection with the conduct of their business activities. Ameriprise Financial believes that the Funds are not currently the subject of, and that neither Ameriprise Financial nor any of its affiliates are the subject of, any pending legal, arbitration or regulatory proceedings that are likely to have a material adverse effect on the Funds or the ability of Ameriprise Financial or its affiliates to perform under their contracts with
Annual Report 2013
41
Columbia International Value Master Portfolio
Notes to Financial Statements (continued)
February 28, 2013
the Funds. Ameriprise Financial is required to make 10-Q, 10-K and, as necessary, 8-K filings with the Securities and Exchange Commission on legal and regulatory matters that relate to Ameriprise Financial and its affiliates. Copies of these filings may be obtained by accessing the SEC website at www.sec.gov.
There can be no assurance that these matters, or the adverse publicity associated with them, will not result in increased fund redemptions, reduced sale of fund shares or other adverse consequences to the Funds. Further, although we believe proceedings are not likely to have a material adverse effect on the Funds or the ability of Ameriprise Financial or its affiliates to perform under their contracts with the Funds, these proceedings are subject to uncertainties and, as such, we are unable to estimate the possible loss or range of loss that may result. An adverse outcome in one or more of these proceedings could result in adverse judgments, settlements, fines, penalties or other relief that could have a material adverse effect on the consolidated financial condition or results of operations of Ameriprise Financial.
Annual Report 2013
42
Columbia International Value Master Portfolio
Report of Independent Registered Public Accounting Firm
To the Holders and Trustees of Columbia Funds Master Investment Trust, LLC
In our opinion, the accompanying statement of assets and liabilities, including the portfolio of investments, and the related statements of operations and of changes in net assets and the financial highlights present fairly, in all material respects, the financial position of Columbia International Value Master Portfolio (constituting a series of Columbia Funds Master Investment Trust, LLC, hereafter referred to as the "Master Portfolio") at February 28, 2013, the results of its operations for the year then ended, the changes in its net assets for each of the two years in the period then ended and the financial highlights for each of the periods indicated, in conformity with accounting principles generally accepted in the United States of America. These financial statements and financial highlights (hereafter referred to as "financial statements") are the responsibility of the Fund's management. Our responsibility is to express an opinion on these financial statements based on our audits. We conducted our audits of these financial statements in accordance with the standards of the Public Company Accounting Oversight Board (United States). Those standards require that we plan and perform the audit to obtain reasonable assurance about whether the financial statements are free of material misstatement. An audit includes examining, on a test basis, evidence supporting the amounts and disclosures in the financial statements, assessing the accounting principles used and significant estimates made by management, and evaluating the overall financial statement presentation. We believe that our audits provide a reasonable basis for our opinion.
PricewaterhouseCoopers LLP
Minneapolis, Minnesota
April 19, 2013
Annual Report 2013
43
Columbia International Value Fund
Shareholders elect the Board that oversees the funds' operations. The Board appoints officers who are responsible for day-to-day business decisions based on policies set by the Board. The following table provides basic biographical information about the funds' Board members, including their principal occupations during the past five years, although specific titles for individuals may have varied over the period. Under current Board policy, members may serve until the next Board meeting after he or she reaches the mandatory retirement age established by the Board, or the fifteenth anniversary of the first Board meeting they attended as a member of the Board.
Mr. Edward J. Boudreau, Jr., Mr. William P. Carmichael, Mr. William A. Hawkins, Mr. R. Glenn Hilliard, Ms. Minor M. Shaw and Dr. Anthony M. Santomero, were members of the Legacy Columbia Nations funds' Board ("Nations Funds"), which includes Columbia Funds Series Trust, Columbia Funds Variable Insurance Trust I and Columbia Funds Master Investment Trust, LLC and began service on the Board for the Legacy RiverSource funds ("RiverSource Funds") effective June 1, 2011.
Independent Trustees
Name,
Address,
Year of Birth | | Position Held With
Funds and Length of
Service | | Principal Occupation
During Past Five Years | | Number of
Funds in the
Fund Family
Overseen by
Board Member | | Other Present or Past
Directorships/Trusteeships
(Within Past 5 Years) | |
Kathleen Blatz
901 S. Marquette Ave.
Minneapolis, MN 55402
1954 | | Board member since 1/06 for RiverSource Funds and since 6/11 for Nations Funds | | Attorney; Chief Justice, Minnesota Supreme Court, 1998-2006 | | | 153 | | | Director, BlueCross BlueShield of Minnesota since 2009 | |
Edward J. Boudreau, Jr.
901 S. Marquette Ave.
Minneapolis, MN 55402
1944 | | Board member since 6/11 for RiverSource Funds and since 1/05 for Nations Funds | | Managing Director, E.J. Boudreau & Associates (consulting) since 2000 | | | 151 | | | Former Trustee, BofA Funds Series Trust (11 funds) | |
Pamela G. Carlton
901 S. Marquette Ave.
Minneapolis, MN 55402
1954 | | Board member since 7/07 for RiverSource Funds and since 6/11 for Nations Funds | | President, Springboard — Partners in Cross Cultural Leadership (consulting company) since 2003 | | | 153 | | | None | |
William P. Carmichael
901 S. Marquette Ave.
Minneapolis, MN 55402
1943 | | Board member since 6/11 for RiverSource Funds and since 1999 for Nations Funds | | Retired | | | 151 | | | Director, Cobra Electronics Corporation (electronic equipment manufacturer); The Finish Line (athletic shoes and apparel) since July 2003; McMoRan Exploration Company (oil and gas exploration and development) since 2010; former Trustee, BofA Funds Series Trust (11 funds); former Director, Spectrum Brands, Inc. (consumer products); former Director, Simmons Company (bedding) | |
Patricia M. Flynn
901 S. Marquette Ave.
Minneapolis, MN 55402
1950 | | Board member since 11/04 for RiverSource Funds and since 6/11 for Nations Funds | | Trustee Professor of Economics and Management, Bentley University since 1976 | | | 153 | | | None | |
William A. Hawkins
901 S. Marquette Ave.
Minneapolis, MN 55402
1942 | | Board member since 6/11 for RiverSource Funds and since 1/05 for Nations Funds | | Managing Director, Overton Partners (financial consulting), since August 2010; President and Chief Executive Officer, California General Bank, N.A., January 2008-August 2010. | | | 151 | | | Trustee, BofA Funds Series Trust (11 funds) | |
Annual Report 2013
44
Columbia International Value Fund
Trustees and Officers (continued)
Independent Trustees (continued)
Name,
Address,
Year of Birth | | Position Held With
Funds and Length of
Service | | Principal Occupation
During Past Five Years | | Number of
Funds in the
Fund Family
Overseen by
Board Member | | Other Present or Past
Directorships/Trusteeships
(Within Past 5 Years) | |
R. Glenn Hilliard
901 S. Marquette Ave.
Minneapolis, MN 55402
1943 | | Board member since 6/11 for RiverSource Funds and since 1/05 for Nations Funds | | Chairman and Chief Executive Officer, Hilliard Group LLC (investing and consulting), since April 2003; Non-Executive Director & Chairman, CNO Financial Group, Inc. (insurance), September 2003-May 2011 | | | 151 | | | Chairman, BofA Fund Series Trust (11 funds); former Director, CNO Financial Group, Inc. (insurance) | |
Stephen R. Lewis, Jr.
901 S. Marquette Ave.
Minneapolis, MN 55402
1939 | | Chair of the Board for RiverSource Funds since 1/07, Board member for RiverSource Funds since 1/02 and since 6/11 for Nations Funds | | President Emeritus and Professor of Economics Emeritus, Carleton College since 2002 | | | 153 | | | Director, Valmont Industries, Inc. (manufacturer of irrigation systems) since 2002 | |
Catherine James Paglia
901 S. Marquette Ave.
Minneapolis, MN 55402
1952 | | Board member since 11/04 for RiverSource Funds and since 6/11 for Nations Funds | | Director, Enterprise Asset Management, Inc. (private real estate and asset management company) | | | 153 | | | Director, Valmont Industries, Inc. (manufacturer of irrigation systems) since 2012 | |
Leroy C. Richie
901 S. Marquette Ave.
Minneapolis, MN 55402
1941 | | Board member since 2000 for Legacy Seligman Funds, since 11/08 for RiverSource Funds and since 6/11 for Nations Funds | | Counsel, Lewis & Munday, P.C. (law firm) since 2004; former Vice President and General Counsel, Automotive Legal Affairs, Chrysler Corporation from 1983-1987 | | | 153 | | | Lead Outside Director, Digital Ally, Inc. (digital imaging) since September 2005; Director, Infinity, Inc. (oil and gas exploration and production) since 1994; Director, OGE Energy Corp. (energy and energy services) since November 2007 | |
Minor M. Shaw
901 S. Marquette Ave.
Minneapolis, MN 55402
1947 | | Board member since 6/11 for RiverSource Funds and since 2003 for Nations Funds | | President, Micco LLC (private investments) since 2011; President Micco Corp. since 1998 | | | 151 | | | Director, Piedmont Natural Gas; Director, BlueCross BlueShield of South Carolina since April 2008; Former Trustee, BofA Funds Series Trust (11 funds) | |
Alison Taunton-Rigby
901 S. Marquette Ave.
Minneapolis, MN 55402
1944 | | Board member since 11/02 for RiverSource Funds and since 6/11 for Nations Funds | | Chief Executive Officer and Director, RiboNovix, Inc. (biotechnology), 2003-2010 | | | 153 | | | Director, Healthways, Inc. (health and well-being improvement) since 2005; Director, ICI Mutual Insurance Company, RRG since 2011; Director, Abt Associates (government contractor) since 2001; Director, Boston Children's Hospital since 2002 | |
Annual Report 2013
45
Columbia International Value Fund
Trustees and Officers (continued)
Interested Trustee Not Affiliated With Investment Manager*
Name,
Address,
Year of Birth | | Position Held With
Funds and Length of
Service | | Principal Occupation
During Past Five Years | | Number of
Funds in the
Fund Family
Overseen by
Board Member | | Other Present or Past
Directorships/Trusteeships
(Within Past 5 Years) | |
Anthony M. Santomero
901 S. Marquette Ave.
Minneapolis, MN 55402
1946 | | Board member since 6/11 for RiverSource Funds and since 1/08 for Nations Funds | | Richard K. Mellon Professor Emeritus of Finance, The Wharton School, University of Pennsylvania, since 2002; Senior Advisor, McKinsey & Company (consulting), 2006-2008 | | | 151 | | | Director, Renaissance Reinsurance Ltd. since May 2008; Trustee, Penn Mutual Life Insurance Company since March 2008; Director, Citigroup since 2009; Director, Citibank, N.A. since 2009; former Trustee, BofA Funds Series Trust (11 funds) | |
*Dr. Santomero is not an affiliated person of the investment manager or Ameriprise Financial. However, he is currently deemed by the funds to be an "interested person" (as defined in the 1940 Act) of the funds because he serves as a Director of Citigroup, Inc. and Citibank N.A., companies that may directly or through subsidiaries and affiliates engage from time-to-time in brokerage execution, principal transactions and lending relationships with the funds or accounts advised/managed by the investment manager.
Interested Trustee Affiliated With Investment Manager*
Name,
Address,
Year of Birth | | Position Held With
Funds and Length of
Service | | Principal Occupation
During Past Five Years | | Number of
Funds in the
Fund Family
Overseen by
Board Member | | Other Present or Past
Directorships/Trusteeships
(Within Past 5 Years) | |
William F. Truscott
53600 Ameriprise
Financial Center
Minneapolis, MN 55474
1960 | | Board member since 11/01 for RiverSource Funds and since 6/11 for Nations Funds; Senior Vice President since 2002 for RiverSource Funds and 5/10 for Nations Funds | | President, Columbia Management Investment Advisers, LLC since February 2012, (previously President, Chairman of the Board and Chief Investment Officer, 2001-April 2010); Chief Executive Officer, Global Asset Management, Ameriprise Financial, Inc. since September 2012 (previously Chief Executive Officer, U.S. Asset Management & President, Annuities, May 2010-September 2012 and President — U.S. Asset Management and Chief Investment Officer, 2005-April 2010); Chief Executive Officer, Columbia Management Investment Distributors, Inc. since February 2012, (previously Chairman of the Board and Chief Executive Officer, 2006-April 2010); Chairman of the Board and Chief Executive Officer, RiverSource Distributors, Inc. since 2006; President and Chief Executive Officer, Ameriprise Certificate Company 2006-August 2012 | | | 210 | | | Chairman of the Board, Columbia Management Investment Advisers, LLC since May 2010; Director, Columbia Management Investment Distributors, Inc. since May 2010; Director, Ameriprise Certificate Company, 2006-January 2013 | |
*Interested person (as defined under the 1940 Act) by reason of being an officer, director, security holder and/or employee of the investment manager or Ameriprise Financial.
The SAI has additional information about the Fund's Board members and is available, without charge, upon request by calling 800.345.6611; contacting your financial intermediary; or visiting columbiamanagement.com.
Annual Report 2013
46
Columbia International Value Fund
Trustees and Officers (continued)
The Board has appointed officers who are responsible for day-to-day business decisions based on policies it has established. The officers serve at the pleasure of the Board. In addition to Mr. Truscott, who is Senior Vice President, the funds' other officers are:
Officers
Name,
Address,
Year of Birth | | Position Held With
Funds and Length of
Service | | Principal Occupation During Past Five Years | |
J. Kevin Connaughton
225 Franklin Street
Boston, MA 02110
1964 | | President and Principal Executive Officer since 5/10 for RiverSource Funds and 2009 for Nations Funds | | Senior Vice President and General Manager — Mutual Fund Products, Columbia Management Investment Advisers, LLC since May 2010; Managing Director of Columbia Management Advisors, LLC, December 2004-April 2010; Senior Vice President and Chief Financial Officer, Columbia Funds, June 2008-January 2009; Treasurer, Columbia Funds, October 2003-May 2008 | |
Amy K. Johnson
5228 Ameriprise Financial Center Minneapolis, MN 55474
1965 | | Vice President since 12/06 for RiverSource Funds and 5/10 for Nations Funds | | Senior Vice President and Chief Operating Officer, Columbia Management Investment Advisers, LLC since May 2010 (previously Chief Administrative Officer, 2009-April 2010 and Vice President — Asset Management and Trust Company Services, 2006-2009) | |
Michael G. Clarke
225 Franklin Street
Boston, MA 02110
1969 | | Treasurer since 1/11 and Chief Financial Officer since 4/11 for RiverSource Funds and Treasurer since 3/11 and Chief Financial Officer since 2009 for Nations Funds | | Vice President, Columbia Management Investment Advisers, LLC since May 2010; Managing Director of Fund Administration, Columbia Management Advisors, LLC, September 2004-April 2010; senior officer of Columbia Funds and affiliated funds since 2002 | |
Scott R. Plummer
5228 Ameriprise Financial Center Minneapolis, MN 55474
1959 | | Senior Vice President and Chief Legal Officer since 12/06 and Assistant Secretary since 6/11 for RiverSource Funds and Senior Vice President and Chief Legal Officer since 5/10 and Assistant Secretary since 6/11 for Nations Funds | | Senior Vice President, Chief Legal Officer and Assistant Secretary, Columbia Management Investment Advisers, LLC since June 2005; Vice President and Lead Chief Counsel — Asset Management, Ameriprise Financial, Inc. since May 2010 (previously Vice President and Chief Counsel — Asset Management, 2005-April 2010); Vice President, Chief Counsel and Assistant Secretary, Columbia Management Investment Distributors, Inc. since 2008; Vice President, General Counsel and Secretary, Ameriprise Certificate Company since 2005; Chief Counsel, RiverSource Distributors, Inc. since 2006 | |
Colin Moore
225 Franklin Street
Boston, MA 02110
1958 | | Senior Vice President since 5/10 for RiverSource Funds and Nations Funds | | Director and Chief Investment Officer, Columbia Management Investment Advisers, LLC since May 2010; Manager, Managing Director and Chief Investment Officer, Columbia Management Advisors, LLC, 2007-April 2010 | |
Thomas P. McGuire
225 Franklin Street
Boston, MA 02110
1972 | | Chief Compliance Officer since 3/12 | | Vice President — Asset Management Compliance, Columbia Management Investment Advisers, LLC since 2010; Chief Compliance Officer, Ameriprise Certificate Company since September 2010; Compliance Executive, Bank of America, 2005-2010 | |
Stephen T. Welsh
225 Franklin Street
Boston, MA 02110
1957 | | Vice President since 4/11 for RiverSource Funds and 2006 for Nations Funds | | President and Director, Columbia Management Investment Services Corp. since May 2010; President and Director, Columbia Management Services, Inc., July 2004- April 2010; Managing Director, Columbia Management Distributors, Inc., August 2007-April 2010 | |
Christopher O. Petersen
5228 Ameriprise Financial Center Minneapolis, MN 55474
1970 | | Vice President and Secretary since 4/11 for RiverSource Funds and 3/11 for Nations Funds | | Vice President and Chief Counsel, Ameriprise Financial, Inc. since January 2010 (formerly Vice President and Group Counsel or Counsel, April 2004-January 2010); Assistant Secretary of Legacy RiverSource Funds, January 2007-April 2011 and of the Nations Funds, May 2010-March 2011 | |
Annual Report 2013
47
Columbia International Value Fund
Trustees and Officers (continued)
Officers (continued)
Name,
Address,
Year of Birth | | Position Held With
Funds and Length of
Service | | Principal Occupation During Past Five Years | |
Paul D. Pearson
10468 Ameriprise Financial Center Minneapolis, MN 55474
1956 | | Vice President since 4/11 and Assistant Treasurer since 1999 for RiverSource Funds and Vice President and Assistant Treasurer since 6/11 for Nations Funds | | Vice President — Investment Accounting, Columbia Management Investment Advisers, LLC, since May 2010; Vice President — Managed Assets, Investment Accounting, Ameriprise Financial Corporation, February 1998-May 2010 | |
Joseph F. DiMaria
225 Franklin Street
Boston, MA 02110
1968 | | Vice President and Chief Accounting Officer since 4/11 and Vice President since 3/11 and Chief Accounting Officer since 2008 for Nations Funds | | Vice President, Mutual Fund Administration, Columbia Management Investment Advisers, LLC, since May 2010; Director of Fund Administration, Columbia Management Advisors, LLC, January 2006-April 2010 | |
Paul B. Goucher
100 Park Avenue
New York, NY 10017
1968 | | Vice President since 4/11 and Assistant Secretary since 11/08 for RiverSource Funds and 5/10 for Nations Funds | | Vice President and Lead Chief Counsel, Ameriprise Financial, Inc. since November 2008 and January 2013, respectively (formerly, Chief Counsel, January 2010-January 2013 and Group Counsel from November 2008- January 2010); Director, Managing Director and General Counsel, J. & W. Seligman & Co. Incorporated, July 2008-November 2008 (previously, Managing Director and Associate General Counsel, January 2005-July 2008) | |
Michael E. DeFao
225 Franklin Street
Boston, MA 02110
1968 | | Vice President since 4/11 and Assistant Secretary since 5/10 for RiverSource Funds and 2011 for Nations Funds | | Vice President and Chief Counsel, Ameriprise Financial, Inc. since May 2010; Associate General Counsel, Bank of America, June 2005-April 2010 | |
Annual Report 2013
48
Columbia International Value Fund
Important Information About This Report
Each fund mails one shareholder report to each shareholder address. If you would like more than one report, please call shareholder services at 800.345.6611 and additional reports will be sent to you.
The policy of the Board is to vote the proxies of the companies in which each fund holds investments consistent with the procedures as stated in the Statement of Additional Information (SAI). You may obtain a copy of the SAI without charge by calling 800.345.6611; contacting your financial intermediary; visiting columbiamanagement.com; or searching the website of the Securities and Exchange Commission (SEC) at sec.gov. Information regarding how each fund voted proxies relating to portfolio securities is filed with the SEC by August 31 for the most recent 12-month period ending June 30 of that year, and is available without charge by visiting columbiamanagement.com; or searching the website of the SEC at sec.gov.
Each fund files a complete schedule of portfolio holdings with the SEC for the first and third quarters of each fiscal year on Form N-Q. Each fund's Form N-Q is available on the SEC's website at sec.gov and may be reviewed and copied at the SEC's Public Reference Room in Washington, D.C. Information on the operation of the Public Reference Room may be obtained by calling 800.SEC.0330. Each fund's complete schedule of portfolio holdings, as filed on Form N-Q, can also be obtained without charge, upon request, by calling 800.345.6611.
Annual Report 2013
49

Columbia International Value Fund
P.O. Box 8081
Boston, MA 02266-8081
columbiamanagement.com
This information is for use with concurrent or prior delivery of a fund prospectus. Please read and consider the investment objectives, risks, charges and expenses for any fund carefully before investing. For a prospectus which contains this and other important information about the Fund go to columbiamanagement.com. The Fund is distributed by Columbia Management Investment Distributors, Inc., member FINRA, and managed by Columbia Management Investment Advisers, LLC.
© 2013 Columbia Management Investment Advisers, LLC. All rights reserved.
ANN170_02_C01_(04/13)
Annual Report
February 28, 2013

Columbia Small Cap Growth Fund II
Not FDIC insured • No bank guarantee • May lose value
Columbia Small Cap Growth Fund II
 Dear Shareholders,
U.S. stocks flat, foreign markets strong in 2012 finale
After a strong third quarter, U.S. stock market averages treaded water as the year 2012 came to a close. However, they ended the year up strongly, as first- and third-quarter gains more than offset second- and fourth-quarter weakness. Typically a strong quarter for domestic small- and mid-cap issues, the fourth quarter of 2012 indeed proved to be another year-end positive for small-cap stocks. For the full calendar year 2012, the S&P 500 Index rose 16.00%.
Stock markets outside the United States generated some of the best returns for the fourth quarter, as optimism rebounded, thanks to the September actions of the European Central Bank in support of the euro and an improving outlook from China. Both developed and emerging foreign markets topped U.S. stocks by a solid margin.
Corporate and emerging markets led fixed income
Fixed-income investors took their cue from the equity markets and continued to favor the highest risk sectors through the end of 2012. Global fixed-income returns posted mixed results in the final quarter of the year. Gains were the highest for corporate high-yield and emerging market bonds. Although investors remained cautious ahead of the year-end budget negotiations, better economic data and a further improvement in the European sovereign debt crisis supported riskier assets and depressed government bond prices. In December, the Federal Reserve announced its intention to continue to purchase both Treasury and mortgage-backed securities and said that it would seek to keep short-term interest rates unchanged until the unemployment rate reaches 6.5%, or inflation turned noticeably higher.
Stay on track with Columbia Management
Backed by more than 100 years of experience, Columbia Management is one of the nation's largest asset managers. At the heart of our success — and, most importantly, that of our investors — are highly talented industry professionals, brought together by a unique way of working. We are dedicated to helping you take advantage of today's opportunities and anticipate tomorrow's. We stay abreast of the latest investment trends and ideas, using our collective insight to evaluate events and transform them into solutions you can use.
Visit columbiamanagement.com for:
> The Columbia Management Perspectives blog, featuring timely posts by our investment teams
> Detailed up-to-date fund performance and portfolio information
> Economic analysis and market commentary
> Quarterly fund commentaries
> Columbia Management Investor, our award-winning quarterly newsletter for shareholders
Thank you for your continued support of the Columbia Funds. We look forward to serving your investment needs for many years to come.
Best Regards,

J. Kevin Connaughton
President, Columbia Funds
The S&P 500 Index, an unmanaged index, measures the performance of 500 widely held, large-capitalization U.S. stocks and is frequently used as a general measure of market performance. Indices are not available for investment, are not professionally managed and do not reflect sales charges, fees, brokerage commissions, taxes or other expenses of investing.
Investors should consider the investment objectives, risks, charges and expenses of a mutual fund carefully before investing. For a free prospectus, which contains this and other important information about a fund, visit columbiamanagement.com. The prospectus should be read carefully before investing.
Columbia Funds are distributed by Columbia Management Investment Distributors, Inc., member FINRA, and managed by Columbia Management Investment Advisers, LLC.
© 2013 Columbia Management Investment Advisers, LLC. All rights reserved.
Columbia Small Cap Growth Fund II
Performance Overview | | | 2 | | |
Manager Discussion of Fund Performance | | | 4 | | |
Understanding Your Fund's Expenses | | | 6 | | |
Portfolio of Investments | | | 7 | | |
Statement of Assets and Liabilities | | | 13 | | |
Statement of Operations | | | 15 | | |
Statement of Changes in Net Assets | | | 16 | | |
Financial Highlights | | | 18 | | |
Notes to Financial Statements | | | 23 | | |
Report of Independent Registered
Public Accounting Firm | | | 29 | | |
Trustees and Officers | | | 30 | | |
Shareholder Meeting Results | | | 35 | | |
Important Information About This Report | | | 37 | | |
Fund Investment Manager
Columbia Management Investment
Advisers, LLC
225 Franklin Street
Boston, MA 02110
Fund Distributor
Columbia Management Investment
Distributors, Inc.
225 Franklin Street
Boston, MA 02110
Fund Transfer Agent
Columbia Management Investment
Services Corp.
P.O. Box 8081
Boston, MA 02266-8081
For more information about any of the funds, please visit columbiamanagement.com or call 800.345.6611. Customer Service Representatives are available to answer your questions Monday through Friday from 8 a.m. to 8 p.m. Eastern time.
The views expressed in this report reflect the current views of the respective parties. These views are not guarantees of future performance and involve certain risks, uncertainties and assumptions that are difficult to predict, so actual outcomes and results may differ significantly from the views expressed. These views are subject to change at any time based upon economic, market or other conditions and the respective parties disclaim any responsibility to update such views. These views may not be relied on as investment advice and, because investment decisions for a Columbia Fund are based on numerous factors, may not be relied on as an indication of trading intent on behalf of any particular Columbia Fund. References to specific securities should not be construed as a recommendation or investment advice.
Columbia Small Cap Growth Fund II
Performance Summary
> Columbia Small Cap Growth Fund II (the Fund) Class A shares returned 7.51% excluding sales charges for the 12-month period that ended February 28, 2013.
> The Fund underperformed its benchmark, the Russell 2000 Growth Index, which returned 11.17% for the same 12-month period.
> Stock selection detracted from performance relative to the benchmark, and the impact was particularly notable in the technology sector.
Average Annual Total Returns (%) (for period ended February 28, 2013)
| | Inception | | 1 Year | | 5 Years | | 10 Years | |
Class A | | 12/12/95 | | | | | | | | | | | | | |
Excluding sales charges | | | | | | | 7.51 | | | | 4.27 | | | | 8.70 | | |
Including sales charges | | | | | | | 1.32 | | | | 3.05 | | | | 8.06 | | |
Class B | | 12/12/95 | | | | | | | | | | | | | |
Excluding sales charges | | | | | | | 6.76 | | | | 3.50 | | | | 7.89 | | |
Including sales charges | | | | | | | 1.76 | | | | 3.15 | | | | 7.89 | | |
Class C | | 09/22/97 | | | | | | | | | | | | | |
Excluding sales charges | | | | | | | 6.78 | | | | 3.51 | | | | 7.89 | | |
Including sales charges | | | | | | | 5.78 | | | | 3.51 | | | | 7.89 | | |
Class I* | | 11/16/11 | | | 7.99 | | | | 4.40 | | | | 8.76 | | |
Class Z | | 12/12/95 | | | 7.84 | | | | 4.54 | | | | 8.97 | | |
Russell 2000 Growth Index | | | | | | | 11.17 | | | | 7.83 | | | | 11.22 | | |
Returns for Class A are shown with and without the maximum initial sales charge of 5.75%. Returns for Class B are shown with and without the applicable contingent deferred sales charge (CDSC) of 5.00% in the first year, declining to 1.00% in the sixth year and eliminated thereafter. Returns for Class C are shown with and without the 1.00% CDSC for the first year only. The Fund's other classes are not subject to sales charges and have limited eligibility. Please see the Fund's prospectus for details. Performance for different share classes will vary based on differences in sales charges and fees associated with each class. All results shown assume reinvestment of distributions during the period. Returns do not reflect the deduction of taxes that a shareholder may pay on Fund distributions or on the redemption of Fund shares. Performance results reflect the effect of any fee waivers or reimbursements of Fund expenses by Columbia Management Investment Advisers, LLC and/or any of its affiliates. Absent these fee waivers or expense reimbursement arrangements, performance results would have been lower.
The performance information shown represents past performance and is not a guarantee of future results. The investment return and principal value of your investment will fluctuate so that your shares, when redeemed, may be worth more or less than their original cost. Current performance may be lower or higher than the performance information shown. You may obtain performance information current to the most recent month-end by contacting your financial intermediary, visiting columbiamanagement.com or calling 800.345.6611.
*The returns shown for periods prior to the share class inception date (including returns for the Life of the Fund, if shown, which are since Fund inception) include the returns of the Fund's oldest share class. Since the Fund launched more than one share class at its inception, Class A shares were used. These returns are adjusted to reflect any higher class-related operating expenses of the newer share classes, as applicable. Please visit columbiamanagement.com/mutual-funds/appended-performance for more information.
The Russell 2000 Growth Index, an unmanaged index, measures the performance of those Russell 2000 Index companies with higher price-to-book ratios and higher forecasted growth values.
Indices are not available for investment, are not professionally managed and do not reflect sales charges, fees, brokerage commissions, taxes or other expenses of investing. Securities in the Fund may not match those in an index.
Annual Report 2013
2
Columbia Small Cap Growth Fund II
Performance Overview (continued)
Performance of a Hypothetical $10,000 Investment (March 1, 2003 – February 28, 2013)

The chart above shows the change in value of a hypothetical $10,000 investment in Class A shares of Columbia Small Cap Growth Fund II during the stated time period, and does not reflect the deduction of taxes that a shareholder may pay on Fund distributions or on the redemption of Fund shares.
Annual Report 2013
3
Columbia Small Cap Growth Fund II
Manager Discussion of Fund Performance
For the 12-month period that ended February 28, 2013, the Fund's Class A shares returned 7.51% excluding sales charges. The Fund underperformed its benchmark, the Russell 2000 Growth Index, which returned 11.17% for the same 12-month period. Security selection detracted from relative performance, particularly in the information technology sector, but also in consumer staples, consumer discretionary and materials. Sector allocations, which were in line with those in the benchmark, had little impact on relative results.
Investors Shrug Off Weak Global Growth
Europe's economic woes and U.S. struggles to avoid a fiscal cliff of tax increases and spending cuts weighed on the global economy during the 12-month period ended February 28, 2013. Yet, investors chose to look beyond the numbers and came in from the sidelines to bid stock prices significantly higher. Favorable central bank action in key markets and improving prospects for the U.S. economy gave investors confidence to favor stocks and other riskier assets. The U.S. economy expanded at a pace of just 1.6% in 2012. However, a pickup in job growth early in 2013 and steady manufacturing activity were encouraging signs. The U.S. housing market staged a solid comeback, with higher home sales, rising prices and lower inventories. Against this backdrop, the U.S. stock market posted strong gains across all market capitalization ranges, value stocks leading growth stocks by a wide margin.
Disappointments from Stock Selection
Stock selection generally accounted for the Fund's shortfall relative to the index, with disappointments concentrated in the technology and consumer sectors. The single biggest laggard for the Fund was BroadSoft, a technology company whose software helps telecommunications and cable companies deliver services over Internet protocol-based networks — and an overweight for the Fund relative to the benchmark. Broadsoft's share price fell early in the period after the company lowered pricing to gain market share and ended up with a revenue and earnings shortfall. We sold the stock, but later bought it back. Elsewhere, consumer discretionary holdings Tempur-Pedic International, which is not in the benchmark, and Body Central and Coinstar, which were overweights relative to the benchmark, hurt relative performance. Shares of premium mattress maker Tempur-Pedic declined after heightened competition pressured sales in North America. Body Central, a young women's clothing retailer, fell sharply due to weak sales trends and heavy price discounting to help reduce excess inventory. An investment in Coinstar declined due to troughing revenue in the company's Redbox DVD rental business. We sold all three of these stocks before period end. In the consumer staples sector, the Fund had no exposure to some of the biggest gainers within the benchmark, which detracted from overall performance.
Gains from Health Care and Industrials
Security selection in the health care and industrials sectors aided relative performance. In health care, top individual contributors included Onyx Pharmaceuticals and Brookdale Senior Living. Shares of biotechnology company Onyx surged after the Food and Drug Administration (FDA) announced its support for a new cancer treatment under development. The Fund's returns from Onyx relative to the benchmark were enhanced by its overweight in the portfolio. Shares of Brookdale, which is not in the benchmark, were buoyed by improved
Portfolio Management
Wayne Collette, CFA
Lawrence Lin, CFA
George Myers, CFA
Brian Neigut
Morningstar Style BoxTM
The Morningstar Style BoxTM is based on a fund's portfolio holdings. For equity funds, the vertical axis shows the market capitalization of the stocks owned, and the horizontal axis shows investment style (value, blend, or growth). Information shown is based on the most recent data provided by Morningstar.
© 2013 Morningstar, Inc. All rights reserved. The Morningstar information contained herein: (1) is proprietary to Morningstar and/or its content providers; (2) may not be copied or distributed; and (3) is not warranted to be accurate, complete or timely. Neither Morningstar nor its content providers are responsible for any damages or losses arising from any use of this information.
Annual Report 2013
4
Columbia Small Cap Growth Fund II
Manager Discussion of Fund Performance (continued)
demand, increased occupancy rates and the expansion of other services such as outpatient therapy. Brookdale owns and operates senior living communities. Gains from these stocks more than offset the loss incurred from an overweight position in biotech company Idenix Pharmaceuticals, whose share price slid after the FDA placed a hold last August on further trials for its new hepatitis C treatment. Elsewhere, top performers included wood and laminate flooring retailer Lumber Liquidators (in the consumer discretionary sector), whose steep stock price gains were fueled by an improved housing market, continued low interest rates and new initiatives aimed at boosting sales. Similarly, in industrials, shares of wallboard manufacturer USG rallied nicely, thanks to a promising outlook for residential and non-residential construction. Gains from Lumber Liquidators and USG were enhanced in the portfolio because the Fund had more exposure than the benchmark to both.
Top Ten Holdings (%)
(at February 28, 2013) | |
Domino's Pizza, Inc. | | | 1.9 | | |
CommVault Systems, Inc. | | | 1.9 | | |
Aspen Technology, Inc. | | | 1.7 | | |
OSI Systems, Inc. | | | 1.6 | | |
Brookdale Senior Living, Inc. | | | 1.6 | | |
HMS Holdings Corp. | | | 1.5 | | |
Align Technology, Inc. | | | 1.4 | | |
Guidewire Software, Inc. | | | 1.4 | | |
Pier 1 Imports, Inc. | | | 1.3 | | |
Oasis Petroleum, Inc. | | | 1.3 | | |
Percentages indicated are based upon total investments (excluding Money Market Funds).
For further detail about these holdings, please refer to the section entitled "Portfolio of Investments."
Fund holdings are as of the date given, are subject to change at any time, and are not recommendations to buy or sell any security.
Portfolio Breakdown (%)
(at February 28, 2013) | |
Common Stocks | | | 99.5 | | |
Consumer Discretionary | | | 14.3 | | |
Consumer Staples | | | 3.0 | | |
Energy | | | 6.3 | | |
Financials | | | 7.7 | | |
Health Care | | | 22.9 | | |
Industrials | | | 17.3 | | |
Information Technology | | | 24.8 | | |
Materials | | | 1.7 | | |
Telecommunication Services | | | 0.8 | | |
Utilities | | | 0.7 | | |
Money Market Funds | | | 0.5 | | |
Warrants | | | 0.0 | (a) | |
Total | | | 100.0 | | |
Percentages indicated are based upon total investments. The Fund's portfolio composition is subject to change.
(a) Rounds to zero.
Annual Report 2013
5
Columbia Small Cap Growth Fund II
Understanding Your Fund's Expenses
(Unaudited)
As an investor, you incur two types of costs. There are transaction costs, which generally include sales charges on purchases and may include redemption fees. There are also ongoing costs, which generally include management fees, distribution and service (Rule 12b-1) fees, and other fund expenses. The following information is intended to help you understand your ongoing costs (in dollars) of investing in the Fund and to help you compare these costs with the ongoing costs of investing in other mutual funds.
Analyzing Your Fund's Expenses
To illustrate these ongoing costs, we have provided examples and calculated the expenses paid by investors in each share class of the Fund during the period. The actual and hypothetical information in the table is based on an initial investment of $1,000 at the beginning of the period indicated and held for the entire period. Expense information is calculated two ways and each method provides you with different information. The amount listed in the "Actual" column is calculated using the Fund's actual operating expenses and total return for the period. You may use the Actual information, together with the amount invested, to estimate the expenses that you paid over the period. Simply divide your account value by $1,000 (for example, an $8,600 account value divided by $1,000 = 8.6), then multiply the results by the expenses paid during the period under the Actual column. The amount listed in the "Hypothetical" column assumes a 5% annual rate of return before expenses (which is not the Fund's actual return) and then applies the Fund's actual expense ratio for the period to the hypothetical return. You should not use the hypothetical account values and expenses to estimate either your actual account balance at the end of the period or the expenses you paid during the period. See "Compare With Other Funds" below for details on how to use the hypothetical data.
Compare With Other Funds
Since all mutual funds are required to include the same hypothetical calculations about expenses in shareholder reports, you can use this information to compare the ongoing cost of investing in the Fund with other funds. To do so, compare the hypothetical example with the 5% hypothetical examples that appear in the shareholder reports of other funds. As you compare hypothetical examples of other funds, it is important to note that hypothetical examples are meant to highlight the ongoing costs of investing in a fund only and do not reflect any transaction costs, such as sales charges, or redemption or exchange fees. Therefore, the hypothetical calculations are useful in comparing ongoing costs only, and will not help you determine the relative total costs of owning different funds. If transaction costs were included in these calculations, your costs would be higher.
September 1, 2012 – February 28, 2013
| | Account Value at the Beginning
of the Period ($) | | Account Value at the End of the
Period ($) | | Expenses Paid During the
Period ($) | | Fund's Annualized
Expense Ratio (%) | |
| | Actual | | Hypothetical | | Actual | | Hypothetical | | Actual | | Hypothetical | | Actual | |
Class A | | | 1,000.00 | | | | 1,000.00 | | | | 1,083.10 | | | | 1,018.65 | | | | 6.40 | | | | 6.21 | | | | 1.24 | | |
Class B | | | 1,000.00 | | | | 1,000.00 | | | | 1,078.90 | | | | 1,014.93 | | | | 10.26 | | | | 9.94 | | | | 1.99 | | |
Class C | | | 1,000.00 | | | | 1,000.00 | | | | 1,079.90 | | | | 1,014.93 | | | | 10.26 | | | | 9.94 | | | | 1.99 | | |
Class I | | | 1,000.00 | | | | 1,000.00 | | | | 1,085.90 | | | | 1,020.98 | | | | 3.98 | | | | 3.86 | | | | 0.77 | | |
Class Z | | | 1,000.00 | | | | 1,000.00 | | | | 1,084.40 | | | | 1,019.89 | | | | 5.12 | | | | 4.96 | | | | 0.99 | | |
Expenses paid during the period are equal to the annualized expense ratio for each class as indicated above, multiplied by the average account value over the period and then multiplied by the number of days in the Fund's most recent fiscal half year and divided by 365.
Expenses do not include fees and expenses incurred indirectly by the Fund from the underlying funds in which the Fund may invest (also referred to as "acquired funds"), including affiliated and non-affiliated pooled investment vehicles (including mutual funds and exchange-traded funds).
Annual Report 2013
6
Columbia Small Cap Growth Fund II
Portfolio of Investments
February 28, 2013
(Percentages represent value of investments compared to net assets)
Common Stocks 98.9%
Issuer | | Shares | | Value ($) | |
Consumer Discretionary 14.2% | |
Hotels, Restaurants & Leisure 4.3% | |
Bloomin' Brands, Inc.(a) | | | 47,910 | | | | 824,531 | | |
Buffalo Wild Wings, Inc.(a) | | | 5,550 | | | | 436,730 | | |
Domino's Pizza, Inc. | | | 87,465 | | | | 4,165,083 | | |
Life Time Fitness, Inc.(a) | | | 27,453 | | | | 1,156,869 | | |
Six Flags Entertainment Corp. | | | 40,385 | | | | 2,698,122 | | |
Total | | | | | 9,281,335 | | |
Household Durables 0.2% | |
Tri Pointe Homes, Inc.(a) | | | 27,509 | | | | 506,166 | | |
Internet & Catalog Retail 0.8% | |
HomeAway, Inc.(a) | | | 60,955 | | | | 1,798,172 | | |
Leisure Equipment & Products 0.6% | |
Brunswick Corp. | | | 33,770 | | | | 1,230,579 | | |
Media 0.6% | |
National CineMedia, Inc. | | | 66,279 | | | | 1,010,755 | | |
Shutterstock, Inc.(a) | | | 10,150 | | | | 330,890 | | |
Total | | | | | 1,341,645 | | |
Specialty Retail 6.9% | |
Asbury Automotive Group, Inc.(a) | | | 45,649 | | | | 1,541,110 | | |
Cabela's, Inc.(a) | | | 24,511 | | | | 1,240,012 | | |
Conn's, Inc.(a) | | | 37,586 | | | | 1,204,255 | | |
GameStop Corp., Class A | | | 54,024 | | | | 1,353,841 | | |
Lumber Liquidators Holdings, Inc.(a) | | | 27,913 | | | | 1,652,171 | | |
Pier 1 Imports, Inc. | | | 127,898 | | | | 2,873,868 | | |
Rent-A-Center, Inc. | | | 23,810 | | | | 863,827 | | |
Select Comfort Corp.(a) | | | 27,079 | | | | 555,932 | | |
Tile Shop Holdings, Inc.(a) | | | 130,955 | | | | 2,308,737 | | |
Vitamin Shoppe, Inc.(a) | | | 29,295 | | | | 1,539,452 | | |
Total | | | | | 15,133,205 | | |
Textiles, Apparel & Luxury Goods 0.8% | |
Tumi Holdings, Inc.(a) | | | 75,304 | | | | 1,780,186 | | |
Total Consumer Discretionary | | | | | 31,071,288 | | |
Consumer Staples 3.0% | |
Food & Staples Retailing 1.4% | |
Casey's General Stores, Inc. | | | 43,155 | | | | 2,442,141 | | |
Harris Teeter Supermarkets, Inc. | | | 12,459 | | | | 535,737 | | |
Total | | | | | 2,977,878 | | |
Common Stocks (continued)
Issuer | | Shares | | Value ($) | |
Food Products 0.4% | |
Hain Celestial Group, Inc. (The)(a) | | | 17,706 | | | | 969,404 | | |
Personal Products 1.2% | |
Elizabeth Arden, Inc.(a) | | | 66,125 | | | | 2,572,263 | | |
Total Consumer Staples | | | | | 6,519,545 | | |
Energy 6.3% | |
Energy Equipment & Services 1.8% | |
Dril-Quip, Inc.(a) | | | 13,620 | | | | 1,119,973 | | |
Rowan Companies PLC, Class A(a) | | | 33,500 | | | | 1,158,765 | | |
Superior Energy Services, Inc.(a) | | | 59,170 | | | | 1,565,046 | | |
Total | | | | | 3,843,784 | | |
Oil, Gas & Consumable Fuels 4.5% | |
Carrizo Oil & Gas, Inc.(a) | | | 36,102 | | | | 848,036 | | |
Energy XXI Bermuda Ltd. | | | 36,810 | | | | 1,094,361 | | |
Golar LNG Ltd. | | | 33,508 | | | | 1,270,288 | | |
Gulfport Energy Corp.(a) | | | 32,330 | | | | 1,323,914 | | |
Kodiak Oil & Gas Corp.(a) | | | 116,433 | | | | 1,036,254 | | |
Oasis Petroleum, Inc.(a) | | | 77,064 | | | | 2,828,249 | | |
PDC Energy, Inc.(a) | | | 15,760 | | | | 735,046 | | |
Western Refining, Inc. | | | 20,390 | | | | 731,797 | | |
Total | | | | | 9,867,945 | | |
Total Energy | | | | | 13,711,729 | | |
Financials 7.7% | |
Commercial Banks 1.2% | |
Signature Bank(a) | | | 34,616 | | | | 2,570,930 | | |
Consumer Finance 1.7% | |
DFC Global Corp.(a) | | | 86,380 | | | | 1,613,579 | | |
Portfolio Recovery Associates, Inc.(a) | | | 19,266 | | | | 2,252,677 | | |
Total | | | | | 3,866,256 | | |
Real Estate Investment Trusts (REITs) 3.9% | |
DiamondRock Hospitality Co. | | | 187,734 | | | | 1,678,342 | | |
Omega Healthcare Investors, Inc. | | | 67,749 | | | | 1,896,294 | | |
Redwood Trust, Inc. | | | 112,688 | | | | 2,283,059 | | |
Summit Hotel Properties, Inc. | | | 153,569 | | | | 1,474,262 | | |
Tanger Factory Outlet Centers | | | 34,040 | | | | 1,201,272 | | |
Total | | | | | 8,533,229 | | |
The accompanying Notes to Financial Statements are an integral part of this statement.
Annual Report 2013
7
Columbia Small Cap Growth Fund II
Portfolio of Investments (continued)
February 28, 2013
Common Stocks (continued)
Issuer | | Shares | | Value ($) | |
Thrifts & Mortgage Finance 0.9% | |
Nationstar Mortgage Holdings, Inc.(a) | | | 13,553 | | | | 522,197 | | |
Radian Group, Inc. | | | 158,890 | | | | 1,399,821 | | |
Total | | | | | 1,922,018 | | |
Total Financials | | | | | 16,892,433 | | |
Health Care 22.7% | |
Biotechnology 8.2% | |
Alkermes PLC(a) | | | 68,241 | | | | 1,481,512 | | |
Alnylam Pharmaceuticals, Inc.(a) | | | 74,665 | | | | 1,768,814 | | |
Amarin Corp. PLC, ADR(a) | | | 109,557 | | | | 886,316 | | |
Ariad Pharmaceuticals, Inc.(a) | | | 67,009 | | | | 1,409,199 | | |
Cepheid, Inc.(a) | | | 41,333 | | | | 1,505,761 | | |
Dynavax Technologies Corp.(a) | | | 255,745 | | | | 521,720 | | |
Exact Sciences Corp.(a) | | | 103,871 | | | | 1,109,342 | | |
Idenix Pharmaceuticals, Inc.(a) | | | 257,738 | | | | 1,085,077 | | |
Infinity Pharmaceuticals, Inc.(a) | | | 37,685 | | | | 1,556,014 | | |
Keryx Biopharmaceuticals, Inc.(a) | | | 79,017 | | | | 508,079 | | |
Onyx Pharmaceuticals, Inc.(a) | | | 27,387 | | | | 2,062,515 | | |
Puma Biotechnology, Inc.(a) | | | 29,833 | | | | 767,007 | | |
Rigel Pharmaceuticals, Inc.(a) | | | 149,562 | | | | 1,005,057 | | |
Sarepta Therapeutics, Inc.(a) | | | 36,883 | | | | 1,079,565 | | |
TESARO, Inc.(a) | | | 64,288 | | | | 1,276,760 | | |
Total | | | | | 18,022,738 | | |
Health Care Equipment & Supplies 4.3% | |
Align Technology, Inc.(a) | | | 97,049 | | | | 3,051,221 | | |
Endologix, Inc.(a) | | | 59,370 | | | | 894,112 | | |
Insulet Corp.(a) | | | 67,937 | | | | 1,533,338 | | |
Masimo Corp. | | | 80,767 | | | | 1,603,225 | | |
NxStage Medical, Inc.(a) | | | 125,143 | | | | 1,404,104 | | |
Volcano Corp.(a) | | | 48,142 | | | | 1,041,793 | | |
Total | | | | | 9,527,793 | | |
Health Care Providers & Services 3.2% | |
Brookdale Senior Living, Inc.(a) | | | 124,534 | | | | 3,447,101 | | |
Catamaran Corp.(a) | | | 27,060 | | | | 1,453,393 | | |
IPC The Hospitalist Co., Inc.(a) | | | 49,132 | | | | 2,048,804 | | |
Total | | | | | 6,949,298 | | |
Common Stocks (continued)
Issuer | | Shares | | Value ($) | |
Health Care Technology 2.9% | |
athenahealth, Inc.(a) | | | 18,504 | | | | 1,735,490 | | |
HMS Holdings Corp.(a) | | | 112,036 | | | | 3,247,924 | | |
Vocera Communications, Inc.(a) | | | 47,400 | | | | 1,249,938 | | |
Total | | | | | 6,233,352 | | |
Life Sciences Tools & Services 1.6% | |
Fluidigm Corp.(a) | | | 67,286 | | | | 1,161,356 | | |
Icon PLC | | | 77,604 | | | | 2,418,141 | | |
Total | | | | | 3,579,497 | | |
Pharmaceuticals 2.5% | |
Akorn, Inc.(a) | | | 68,163 | | | | 940,649 | | |
Impax Laboratories, Inc.(a) | | | 126,323 | | | | 2,504,985 | | |
Salix Pharmaceuticals Ltd.(a) | | | 41,526 | | | | 2,028,545 | | |
Total | | | | | 5,474,179 | | |
Total Health Care | | | | | 49,786,857 | | |
Industrials 17.1% | |
Aerospace & Defense 0.7% | |
LMI Aerospace, Inc.(a) | | | 72,205 | | | | 1,599,341 | | |
Airlines 1.1% | |
Alaska Air Group, Inc.(a) | | | 26,008 | | | | 1,340,712 | | |
U.S. Airways Group, Inc.(a) | | | 83,460 | | | | 1,120,868 | | |
Total | | | | | 2,461,580 | | |
Building Products 1.1% | |
USG Corp.(a) | | | 88,331 | | | | 2,492,701 | | |
Commercial Services & Supplies 1.6% | |
Clean Harbors, Inc.(a) | | | 36,318 | | | | 1,870,377 | | |
Tetra Tech, Inc.(a) | | | 56,045 | | | | 1,617,459 | | |
Total | | | | | 3,487,836 | | |
Electrical Equipment 1.3% | |
Acuity Brands, Inc. | | | 23,025 | | | | 1,568,693 | | |
Regal-Beloit Corp. | | | 15,640 | | | | 1,208,659 | | |
Total | | | | | 2,777,352 | | |
Machinery 3.0% | |
Chart Industries, Inc.(a) | | | 17,332 | | | | 1,257,610 | | |
CLARCOR, Inc. | | | 18,641 | | | | 950,504 | | |
Proto Labs, Inc.(a) | | | 28,659 | | | | 1,332,357 | | |
Trinity Industries, Inc. | | | 21,541 | | | | 931,433 | | |
Woodward, Inc. | | | 54,979 | | | | 2,057,864 | | |
Total | | | | | 6,529,768 | | |
The accompanying Notes to Financial Statements are an integral part of this statement.
Annual Report 2013
8
Columbia Small Cap Growth Fund II
Portfolio of Investments (continued)
February 28, 2013
Common Stocks (continued)
Issuer | | Shares | | Value ($) | |
Marine 0.8% | |
Costamare, Inc. | | | 109,612 | | | | 1,690,217 | | |
Professional Services 1.4% | |
Advisory Board Co. (The)(a) | | | 25,721 | | | | 1,306,884 | | |
Wageworks, Inc.(a) | | | 77,572 | | | | 1,831,475 | | |
Total | | | | | 3,138,359 | | |
Road & Rail 3.4% | |
Avis Budget Group, Inc.(a) | | | 62,261 | | | | 1,455,039 | | |
Genesee & Wyoming, Inc., Class A(a) | | | 16,360 | | | | 1,464,547 | | |
Knight Transportation, Inc. | | | 77,989 | | | | 1,221,308 | | |
Roadrunner Transportation Systems, Inc.(a) | | | 93,920 | | | | 2,139,498 | | |
Werner Enterprises, Inc. | | | 54,884 | | | | 1,263,430 | | |
Total | | | | | 7,543,822 | | |
Trading Companies & Distributors 2.7% | |
TAL International Group, Inc. | | | 51,206 | | | | 2,204,419 | | |
Titan Machinery, Inc.(a) | | | 72,341 | | | | 2,043,633 | | |
United Rentals, Inc.(a) | | | 30,303 | | | | 1,618,483 | | |
Total | | | | | 5,866,535 | | |
Total Industrials | | | | | 37,587,511 | | |
Information Technology 24.7% | |
Computers & Peripherals 0.4% | |
Stratasys Ltd.(a) | | | 14,033 | | | | 886,044 | | |
Electronic Equipment, Instruments & Components 4.9% | |
Cognex Corp. | | | 47,582 | | | | 1,959,903 | | |
FEI Co. | | | 40,643 | | | | 2,574,328 | | |
IPG Photonics Corp. | | | 24,850 | | | | 1,473,356 | | |
OSI Systems, Inc.(a) | | | 59,889 | | | | 3,451,403 | | |
Universal Display Corp.(a) | | | 37,755 | | | | 1,184,752 | | |
Total | | | | | 10,643,742 | | |
Internet Software & Services 3.3% | |
Cornerstone OnDemand, Inc.(a) | | | 53,952 | | | | 1,826,815 | | |
CoStar Group, Inc.(a) | | | 22,440 | | | | 2,260,606 | | |
Demandware, Inc.(a) | | | 42,898 | | | | 1,134,652 | | |
Stamps.com, Inc.(a) | | | 41,688 | | | | 1,016,770 | | |
Trulia, Inc.(a) | | | 45,875 | | | | 1,093,660 | | |
Total | | | | | 7,332,503 | | |
Common Stocks (continued)
Issuer | | Shares | | Value ($) | |
IT Services 1.2% | |
Cardtronics, Inc.(a) | | | 33,480 | | | | 882,533 | | |
WEX, Inc.(a) | | | 22,567 | | | | 1,692,750 | | |
Total | | | | | 2,575,283 | | |
Semiconductors & Semiconductor Equipment 1.9% | |
Cavium, Inc.(a) | | | 25,275 | | | | 933,153 | | |
Microsemi Corp.(a) | | | 33,906 | | | | 699,481 | | |
Silicon Laboratories, Inc.(a) | | | 43,310 | | | | 1,798,231 | | |
Ultratech, Inc.(a) | | | 19,085 | | | | 782,103 | | |
Total | | | | | 4,212,968 | | |
Software 13.0% | |
Aspen Technology, Inc.(a) | | | 120,721 | | | | 3,713,378 | | |
BroadSoft, Inc.(a) | | | 76,316 | | | | 1,602,636 | | |
CommVault Systems, Inc.(a) | | | 56,145 | | | | 4,151,923 | | |
Fortinet, Inc.(a) | | | 61,709 | | | | 1,492,124 | | |
Guidewire Software, Inc.(a) | | | 81,244 | | | | 2,969,468 | | |
Imperva, Inc.(a) | | | 51,504 | | | | 1,879,896 | | |
Infoblox, Inc.(a) | | | 49,434 | | | | 1,042,563 | | |
Proofpoint, Inc.(a) | | | 86,892 | | | | 1,214,750 | | |
QLIK Technologies, Inc.(a) | | | 69,247 | | | | 1,800,422 | | |
Sourcefire, Inc.(a) | | | 14,680 | | | | 787,288 | | |
Splunk, Inc.(a) | | | 42,407 | | | | 1,532,165 | | |
TIBCO Software, Inc.(a) | | | 28,427 | | | | 609,759 | | |
TiVo, Inc.(a) | | | 159,524 | | | | 1,976,502 | | |
Tyler Technologies, Inc.(a) | | | 19,582 | | | | 1,104,425 | | |
Ultimate Software Group, Inc.(a) | | | 26,399 | | | | 2,594,230 | | |
Total | | | | | 28,471,529 | | |
Total Information Technology | | | | | 54,122,069 | | |
Materials 1.7% | |
Construction Materials 1.1% | |
Eagle Materials, Inc. | | | 36,335 | | | | 2,336,704 | | |
Metals & Mining 0.6% | |
Walter Energy, Inc. | | | 43,890 | | | | 1,395,263 | | |
Total Materials | | | | | 3,731,967 | | |
Telecommunication Services 0.8% | |
Diversified Telecommunication Services 0.8% | |
Cogent Communications Group, Inc. | | | 68,606 | | | | 1,725,441 | | |
Total Telecommunication Services | | | | | 1,725,441 | | |
The accompanying Notes to Financial Statements are an integral part of this statement.
Annual Report 2013
9
Columbia Small Cap Growth Fund II
Portfolio of Investments (continued)
February 28, 2013
Common Stocks (continued)
Issuer | | Shares | | Value ($) | |
Utilities 0.7% | |
Electric Utilities 0.7% | |
UIL Holdings Corp. | | | 38,209 | | | | 1,496,264 | | |
Total Utilities | | | | | 1,496,264 | | |
Total Common Stocks
(Cost: $185,513,231) | | | | | 216,645,104 | | |
Warrants —%
Energy —% | |
Oil, Gas & Consumable Fuels —% | |
Magnum Hunter Resources Corp.(a)(b) | | | 34,795 | | | | 112 | | |
Total Energy | | | | | 112 | | |
Total Warrants
(Cost: $30,196) | | | | | 112 | | |
Money Market Funds 0.5%
| | | Shares | | Value ($) | |
Columbia Short-Term Cash Fund,
0.128%(c)(d) | | | 1,195,350 | | | | 1,195,350 | | |
Total Money Market Funds
(Cost: $1,195,350) | | | | | 1,195,350 | | |
Total Investments
(Cost: $186,738,777) | | | 217,840,566 | | |
Other Assets & Liabilities, Net | | | 1,291,495 | | |
Net Assets | | | 219,132,061 | | |
Notes to Portfolio of Investments
(a) Non-income producing.
(b) Identifies issues considered to be illiquid as to their marketability. The aggregate value of such securities at February 28, 2013 was $112, representing less than 0.01% of net assets. Information concerning such security holdings at February 28, 2013 is as follows:
Security Description | | Acquisition Dates | | Cost ($) | |
Magnum Hunter Resources Corp. | | 03/07/11 - 06/29/11 | | | 30,196 | | |
(c) The rate shown is the seven-day current annualized yield at February 28, 2013.
(d) As defined in the Investment Company Act of 1940, an affiliated company is one in which the Fund owns 5% or more of its outstanding voting securities, or a company which is under common ownership or control with the Fund. Holdings and transactions in these affiliated companies during the year ended February 28, 2013, are as follows:
Issuer | | Beginning
Cost ($) | | Purchase
Cost ($) | | Proceeds
From Sales ($) | | Ending
Cost ($) | | Dividends —
Affiliated
Issuers ($) | | Value ($) | |
Columbia Short-Term Cash Fund | | | 8,309,425 | | | | 158,540,523 | | | | (165,654,598 | ) | | | 1,195,350 | | | | 11,350 | | | | 1,195,350 | | |
Abbreviation Legend
ADR American Depositary Receipt
Fair Value Measurements
Generally accepted accounting principles (GAAP) require disclosure regarding the inputs and valuation techniques used to measure fair value and any changes in valuation inputs or techniques. In addition, investments shall be disclosed by major category.
The Fund categorizes its fair value measurements according to a three-level hierarchy that maximizes the use of observable inputs and minimizes the use of unobservable inputs by prioritizing that the most observable input be used when available. Observable inputs are those that market participants would use in pricing an investment based on market data obtained from sources independent of the reporting entity. Unobservable inputs are those that reflect the Fund's assumptions about the information market participants would use in pricing an investment. An investment's level within the fair value hierarchy is based on the lowest level of any input that is deemed significant to the
The accompanying Notes to Financial Statements are an integral part of this statement.
Annual Report 2013
10
Columbia Small Cap Growth Fund II
Portfolio of Investments (continued)
February 28, 2013
Fair Value Measurements (continued)
asset or liability's fair value measurement. The input levels are not necessarily an indication of the risk or liquidity associated with investments at that level. For example, certain U.S. government securities are generally high quality and liquid, however, they are reflected as Level 2 because the inputs used to determine fair value may not always be quoted prices in an active market.
Fair value inputs are summarized in the three broad levels listed below:
> Level 1 — Valuations based on quoted prices for investments in active markets that the Fund has the ability to access at the measurement date (including NAV for open-end mutual funds). Valuation adjustments are not applied to Level 1 investments.
> Level 2 — Valuations based on other significant observable inputs (including quoted prices for similar securities, interest rates, prepayment speeds, credit risks, etc.).
> Level 3 — Valuations based on significant unobservable inputs (including the Fund's own assumptions and judgment in determining the fair value of investments).
Inputs that are used in determining fair value of an investment may include price information, credit data, volatility statistics, and other factors. These inputs can be either observable or unobservable. The availability of observable inputs can vary between investments, and is affected by various factors such as the type of investment, and the volume and level of activity for that investment or similar investments in the marketplace. The inputs will be considered by the Investment Manager, along with any other relevant factors in the calculation of an investment's fair value. The Fund uses prices and inputs that are current as of the measurement date, which may include periods of market dislocations. During these periods, the availability of prices and inputs may be reduced for many investments. This condition could cause an investment to be reclassified between the various levels within the hierarchy.
Investments falling into the Level 3 category are primarily supported by quoted prices from brokers and dealers participating in the market for those investments. However, these may be classified as Level 3 investments due to lack of market transparency and corroboration to support these quoted prices. Additionally, valuation models may be used as the pricing source for any remaining investments classified as Level 3. These models rely on one or more significant unobservable inputs and/or significant assumptions by the Investment Manager. Inputs used in valuations may include, but are not limited to, financial statement analysis, capital account balances, discount rates and estimated cash flows, and comparable company data.
Under the direction of the Fund's Board of Trustees (the Board), the Investment Manager's Valuation Committee (the Committee) is responsible for carrying out the valuation procedures approved by the Board. The Committee consists of voting and non-voting members from various groups within the Investment Manager's organization, including operations and accounting, trading and investments, compliance, risk management and legal.
The Committee meets at least monthly to review and approve valuation matters, which may include a description of specific valuation determinations, data regarding pricing information received from approved pricing vendors and brokers and the results of Board-approved valuation control policies and procedures (the Policies). The Policies address, among other things, instances when market quotations are readily available, including recommendations of third party pricing vendors and a determination of appropriate pricing methodologies; events that require specific valuation determinations and assessment of fair value techniques; securities with a potential for stale pricing, including those that are illiquid, restricted, or in default; and the effectiveness of third-party pricing vendors, including periodic reviews of vendors. The Committee meets more frequently, as needed, to discuss additional valuation matters, which may include the need to review back-testing results, review time-sensitive information or approve related valuation actions. The Committee reports to the Board, with members of the Committee meeting with the Board at each of its regularly scheduled meetings to discuss valuation matters and actions during the period, similar to those described earlier.
For investments categorized as Level 3, the Committee monitors information similar to that described above, which may include: (i) data specific to the issuer or comparable issuers, (ii) general market or specific sector news and (iii) quoted prices and specific or similar security transactions. The Committee considers this data and any changes from prior periods in order to assess the reasonableness of observable and unobservable inputs, any assumptions or internal models used to value those securities and changes in fair value. This data is also used to corroborate, when available, information received from approved pricing vendors and brokers. Various factors impact the frequency of monitoring this information (which may occur as often as daily). However, the Committee may determine that changes to inputs, assumptions and models are not required as a result of the monitoring procedures performed.
The accompanying Notes to Financial Statements are an integral part of this statement.
Annual Report 2013
11
Columbia Small Cap Growth Fund II
Portfolio of Investments (continued)
February 28, 2013
Fair Value Measurements (continued)
The following table is a summary of the inputs used to value the Fund's investments at February 28, 2013:
Description | | Level 1
Quoted Prices in Active
Markets for Identical
Assets ($) | | Level 2
Other Significant
Observable Inputs ($) | | Level 3
Significant
Unobservable Inputs ($) | | Total ($) | |
Equity Securities | |
Common Stocks | |
Consumer Discretionary | | | 31,071,288 | | | | — | | | | — | | | | 31,071,288 | | |
Consumer Staples | | | 6,519,545 | | | | — | | | | — | | | | 6,519,545 | | |
Energy | | | 13,711,729 | | | | — | | | | — | | | | 13,711,729 | | |
Financials | | | 16,892,433 | | | | — | | | | — | | | | 16,892,433 | | |
Health Care | | | 49,786,857 | | | | — | | | | — | | | | 49,786,857 | | |
Industrials | | | 37,587,511 | | | | — | | | | — | | | | 37,587,511 | | |
Information Technology | | | 54,122,069 | | | | — | | | | — | | | | 54,122,069 | | |
Materials | | | 3,731,967 | | | | — | | | | — | | | | 3,731,967 | | |
Telecommunication Services | | | 1,725,441 | | | | — | | | | — | | | | 1,725,441 | | |
Utilities | | | 1,496,264 | | | | — | | | | — | | | | 1,496,264 | | |
Warrants | |
Energy | | | — | | | | 112 | | | | — | | | | 112 | | |
Total Equity Securities | | | 216,645,104 | | | | 112 | | | | — | | | | 216,645,216 | | |
Other | |
Money Market Funds | | | 1,195,350 | | | | — | | | | — | | | | 1,195,350 | | |
Total Other | | | 1,195,350 | | | | — | | | | — | | | | 1,195,350 | | |
Total | | | 217,840,454 | | | | 112 | | | | — | | | | 217,840,566 | | |
See the Portfolio of Investments for all investment classifications not indicated in the table.
The Fund's assets assigned to the Level 2 input category are generally valued using the market approach, in which a security's value is determined through reference to prices and information from market transactions for similar or identical assets.
There were no transfers of financial assets between Levels 1 and 2 during the period.
The accompanying Notes to Financial Statements are an integral part of this statement.
Annual Report 2013
12
Columbia Small Cap Growth Fund II
Statement of Assets and Liabilities
February 28, 2013
Assets | |
Investments, at value | |
Unaffiliated issuers (identified cost $185,543,427) | | $ | 216,645,216 | | |
Affiliated issuers (identified cost $1,195,350) | | | 1,195,350 | | |
Total investments (identified cost $186,738,777) | | | 217,840,566 | | |
Receivable for: | |
Investments sold | | | 4,915,533 | | |
Capital shares sold | | | 38,120 | | |
Dividends | | | 62,059 | | |
Prepaid expenses | | | 1,726 | | |
Trustees' deferred compensation plan | | | 7,472 | | |
Total assets | | | 222,865,476 | | |
Liabilities | |
Payable for: | |
Investments purchased | | | 3,143,022 | | |
Capital shares purchased | | | 395,391 | | |
Investment management fees | | | 4,206 | | |
Distribution and/or service fees | | | 886 | | |
Transfer agent fees | | | 36,096 | | |
Administration fees | | | 703 | | |
Compensation of board members | | | 71,566 | | |
Other expenses | | | 74,073 | | |
Trustees' deferred compensation plan | | | 7,472 | | |
Total liabilities | | | 3,733,415 | | |
Net assets applicable to outstanding capital stock | | $ | 219,132,061 | | |
Represented by | |
Paid-in capital | | $ | 196,304,960 | | |
Excess of distributions over net investment income | | | (401,716 | ) | |
Accumulated net realized loss | | | (7,872,972 | ) | |
Unrealized appreciation (depreciation) on: | |
Investments | | | 31,101,789 | | |
Total — representing net assets applicable to outstanding capital stock | | $ | 219,132,061 | | |
The accompanying Notes to Financial Statements are an integral part of this statement.
Annual Report 2013
13
Columbia Small Cap Growth Fund II
Statement of Assets and Liabilities (continued)
February 28, 2013
Class A | |
Net assets | | $ | 120,323,132 | | |
Shares outstanding | | | 9,232,622 | | |
Net asset value per share | | $ | 13.03 | | |
Maximum offering price per share(a) | | $ | 13.82 | | |
Class B | |
Net assets | | $ | 469,868 | | |
Shares outstanding | | | 41,901 | | |
Net asset value per share | | $ | 11.21 | | |
Class C | |
Net assets | | $ | 1,727,166 | | |
Shares outstanding | | | 150,369 | | |
Net asset value per share | | $ | 11.49 | | |
Class I | |
Net assets | | $ | 3,003 | | |
Shares outstanding | | | 218 | | |
Net asset value per share | | $ | 13.78 | | |
Class Z | |
Net assets | | $ | 96,608,892 | | |
Shares outstanding | | | 7,023,794 | | |
Net asset value per share | | $ | 13.75 | | |
(a) The maximum offering price per share is calculated by dividing the net asset value by 1.0 minus the maximum sales charge of 5.75%.
The accompanying Notes to Financial Statements are an integral part of this statement.
Annual Report 2013
14
Columbia Small Cap Growth Fund II
Statement of Operations
Year Ended February 28, 2013
Net investment income | |
Income: | |
Dividends — unaffiliated issuers | | $ | 1,951,653 | | |
Dividends — affiliated issuers | | | 11,350 | | |
Foreign taxes withheld | | | (3,176 | ) | |
Total income | | | 1,959,827 | | |
Expenses: | |
Investment management fees | | | 1,774,196 | | |
Distribution and/or service fees | |
Class A | | | 298,496 | | |
Class B | | | 6,231 | | |
Class C | | | 18,021 | | |
Transfer agent fees | |
Class A | | | 216,437 | | |
Class B | | | 1,120 | | |
Class C | | | 3,265 | | |
Class Z | | | 236,955 | | |
Administration fees | | | 296,544 | | |
Compensation of board members | | | 9,481 | | |
Custodian fees | | | 16,055 | | |
Printing and postage fees | | | 827 | | |
Registration fees | | | 90,839 | | |
Professional fees | | | 2,527 | | |
Other | | | 17,029 | | |
Total expenses | | | 2,988,023 | | |
Expense reductions | | | (12,204 | ) | |
Total net expenses | | | 2,975,819 | | |
Net investment loss | | | (1,015,992 | ) | |
Realized and unrealized gain (loss) — net | |
Net realized gain (loss) on: | |
Investments | | | 26,416,168 | | |
Foreign currency translations | | | (456 | ) | |
Net realized gain | | | 26,415,712 | | |
Net change in unrealized appreciation (depreciation) on: | |
Investments | | | (10,186,923 | ) | |
Foreign currency translations | | | 2 | | |
Net change in unrealized appreciation (depreciation) | | | (10,186,921 | ) | |
Net realized and unrealized gain | | | 16,228,791 | | |
Net increase in net assets resulting from operations | | $ | 15,212,799 | | |
The accompanying Notes to Financial Statements are an integral part of this statement.
Annual Report 2013
15
Columbia Small Cap Growth Fund II
Statement of Changes in Net Assets
| | | Year Ended
February 28,
2013 | | Year Ended
February 29,
2012 | |
Operations | |
Net investment loss | | $ | (1,015,992 | ) | | $ | (2,792,156 | ) | |
Net realized gain | | | 26,415,712 | | | | 42,087,122 | | |
Net change in unrealized appreciation (depreciation) | | | (10,186,921 | ) | | | (42,049,514 | ) | |
Net increase (decrease) in net assets resulting from operations | | | 15,212,799 | | | | (2,754,548 | ) | |
Increase (decrease) in net assets from capital stock activity | | | (107,615,645 | ) | | | (56,617,816 | ) | |
Proceeds from regulatory settlements (Note 6) | | | — | | | | 950,234 | | |
Total decrease in net assets | | | (92,402,846 | ) | | | (58,422,130 | ) | |
Net assets at beginning of year | | | 311,534,907 | | | | 369,957,037 | | |
Net assets at end of year | | $ | 219,132,061 | | | $ | 311,534,907 | | |
Excess of distributions over net investment income | | $ | (401,716 | ) | | $ | (793,098 | ) | |
The accompanying Notes to Financial Statements are an integral part of this statement.
Annual Report 2013
16
Columbia Small Cap Growth Fund II
Statement of Changes in Net Assets (continued)
| | | Year Ended February 28, 2013 | | Year Ended February 29, 2012(a) | |
| | | Shares | | Dollars ($) | | Shares | | Dollars ($) | |
Capital stock activity | |
Class A shares | |
Subscriptions(b) | | | 146,342 | | | | 1,761,138 | | | | 289,854 | | | | 3,448,311 | | |
Redemptions | | | (1,437,069 | ) | | | (17,420,973 | ) | | | (1,744,440 | ) | | | (20,573,515 | ) | |
Net decrease | | | (1,290,727 | ) | | | (15,659,835 | ) | | | (1,454,586 | ) | | | (17,125,204 | ) | |
Class B shares | |
Subscriptions | | | 2,222 | | | | 24,896 | | | | — | | | | — | | |
Redemptions(b) | | | (58,140 | ) | | | (604,319 | ) | | | (91,823 | ) | | | (931,997 | ) | |
Net decrease | | | (55,918 | ) | | | (579,423 | ) | | | (91,823 | ) | | | (931,997 | ) | |
Class C shares | |
Subscriptions | | | 940 | | | | 9,931 | | | | 16,314 | | | | 179,734 | | |
Redemptions | | | (38,958 | ) | | | (414,931 | ) | | | (69,145 | ) | | | (731,862 | ) | |
Net decrease | | | (38,018 | ) | | | (405,000 | ) | | | (52,831 | ) | | | (552,128 | ) | |
Class I shares | |
Subscriptions | | | — | | | | — | | | | 992,391 | | | | 11,207,102 | | |
Redemptions | | | — | | | | — | | | | (992,173 | ) | | | (12,766,009 | ) | |
Net increase | | | — | | | | — | | | | 218 | | | | (1,558,907 | ) | |
Class Z shares | |
Subscriptions | | | 512,690 | | | | 6,421,596 | | | | 2,825,452 | | | | 34,934,986 | | |
Redemptions | | | (7,679,160 | ) | | | (97,392,983 | ) | | | (5,808,519 | ) | | | (71,384,566 | ) | |
Net decrease | | | (7,166,470 | ) | | | (90,971,387 | ) | | | (2,983,067 | ) | | | (36,449,580 | ) | |
Total net decrease | | | (8,551,133 | ) | | | (107,615,645 | ) | | | (4,582,089 | ) | | | (56,617,816 | ) | |
(a) Class I shares are for the period from November 16, 2011 (commencement of operations) to February 29, 2012.
(b) Includes conversions of Class B shares to Class A shares, if any.
The accompanying Notes to Financial Statements are an integral part of this statement.
Annual Report 2013
17
Columbia Small Cap Growth Fund II
The following tables are intended to help you understand the Fund's financial performance. Certain information reflects financial results for a single share of a class held for the periods shown. Per share net investment income (loss) amounts are calculated based on average shares outstanding during the period. Total return assumes reinvestment of all dividends and distributions, if any. Total return does not reflect payment of sales charges, if any, and is not annualized for periods of less than one year.
| | | Year Ended
February 28, | | Year Ended
February 29, | | Year Ended February 28, | |
Class A | | 2013 | | 2012 | | 2011 | | 2010 | | 2009 | |
Per share data | |
Net asset value, beginning of period | | $ | 12.12 | | | $ | 12.17 | | | $ | 8.92 | | | $ | 5.99 | | | $ | 10.57 | | |
Income from investment operations: | |
Net investment loss | | | (0.06 | ) | | | (0.11 | ) | | | (0.10 | ) | | | (0.07 | ) | | | (0.07 | ) | |
Net realized and unrealized gain (loss) | | | 0.97 | | | | 0.03 | | | | 3.35 | | | | 2.99 | | | | (4.51 | ) | |
Total from investment operations | | | 0.91 | | | | (0.08 | ) | | | 3.25 | | | | 2.92 | | | | (4.58 | ) | |
Proceeds from regulatory settlements | | | — | | | | 0.03 | | | | 0.00 | (a) | | | 0.01 | | | | — | | |
Net asset value, end of period | | $ | 13.03 | | | $ | 12.12 | | | $ | 12.17 | | | $ | 8.92 | | | $ | 5.99 | | |
Total return | | | 7.51 | % | | | (0.41 | %)(b) | | | 36.43 | % | | | 48.91 | % | | | (43.33 | %) | |
Ratios to average net assets(c)(d) | |
Total gross expenses | | | 1.29 | % | | | 1.35 | % | | | 1.32 | %(e) | | | 1.37 | %(e) | | | 1.32 | %(e) | |
Total net expenses(f) | | | 1.29 | %(g) | | | 1.34 | %(g) | | | 1.32 | %(e)(g) | | | 1.36 | %(e)(g) | | | 1.27 | %(e)(g) | |
Net investment loss | | | (0.52 | %) | | | (0.98 | %) | | | (1.00 | %) | | | (0.90 | %) | | | (0.80 | %) | |
Supplemental data | |
Net assets, end of period (in thousands) | | $ | 120,323 | | | $ | 127,494 | | | $ | 145,802 | | | $ | 119,894 | | | $ | 90,647 | | |
Portfolio turnover | | | 106 | % | | | 112 | % | | | 147 | % | | | 105 | % | | | 130 | % | |
Notes to Financial Highlights
(a) Rounds to zero.
(b) The Fund received proceeds from regulatory settlements. Had the Fund not received these proceeds, the total return would have been lower by 0.32%.
(c) In addition to the fees and expenses which the Fund bears directly, the Fund indirectly bears a pro rata share of the fees and expenses of the acquired funds in which it invests. Such indirect expenses are not included in the reported expense ratios.
(d) Certain line items from prior years have been reclassified to conform to the current presentation.
(e) Ratios include line of credit interest expense which rounds to less than 0.01%.
(f) Total net expenses include the impact of certain waivers/reimbursements made by the Investment Manager and certain of its affiliates, if applicable.
(g) The benefits derived from expense reductions had an impact of less than 0.01%.
The accompanying Notes to Financial Statements are an integral part of this statement.
Annual Report 2013
18
Columbia Small Cap Growth Fund II
Financial Highlights (continued)
| | | Year Ended
February 28, | | Year Ended
February 29, | | Year Ended February 28, | |
Class B | | 2013 | | 2012 | | 2011 | | 2010 | | 2009 | |
Per share data | |
Net asset value, beginning of period | | $ | 10.50 | | | $ | 10.63 | | | $ | 7.85 | | | $ | 5.31 | | | $ | 9.44 | | |
Income from investment operations: | |
Net investment loss | | | (0.13 | ) | | | (0.18 | ) | | | (0.15 | ) | | | (0.12 | ) | | | (0.13 | ) | |
Net realized and unrealized gain (loss) | | | 0.84 | | | | 0.02 | | | | 2.93 | | | | 2.65 | | | | (4.00 | ) | |
Total from investment operations | | | 0.71 | | | | (0.16 | ) | | | 2.78 | | | | 2.53 | | | | (4.13 | ) | |
Proceeds from regulatory settlements | | | — | | | | 0.03 | | | | 0.00 | (a) | | | 0.01 | | | | — | | |
Net asset value, end of period | | $ | 11.21 | | | $ | 10.50 | | | $ | 10.63 | | | $ | 7.85 | | | $ | 5.31 | | |
Total return | | | 6.76 | % | | | (1.22 | %)(b) | | | 35.41 | % | | | 47.83 | % | | | (43.75 | %) | |
Ratios to average net assets(c)(d) | |
Total gross expenses | | | 2.05 | % | | | 2.10 | % | | | 2.07 | %(e) | | | 2.12 | %(e) | | | 2.07 | %(e) | |
Total net expenses(f) | | | 2.05 | %(g) | | | 2.09 | %(g) | | | 2.07 | %(e)(g) | | | 2.11 | %(e)(g) | | | 2.02 | %(e)(g) | |
Net investment loss | | | (1.26 | %) | | | (1.74 | %) | | | (1.74 | %) | | | (1.66 | %) | | | (1.54 | %) | |
Supplemental data | |
Net assets, end of period (in thousands) | | $ | 470 | | | $ | 1,027 | | | $ | 2,016 | | | $ | 3,340 | | | $ | 3,362 | | |
Portfolio turnover | | | 106 | % | | | 112 | % | | | 147 | % | | | 105 | % | | | 130 | % | |
Notes to Financial Highlights
(a) Rounds to zero.
(b) The Fund received proceeds from regulatory settlements. Had the Fund not received these proceeds, the total return would have been lower by 0.34%.
(c) In addition to the fees and expenses which the Fund bears directly, the Fund indirectly bears a pro rata share of the fees and expenses of the acquired funds in which it invests. Such indirect expenses are not included in the reported expense ratios.
(d) Certain line items from prior years have been reclassified to conform to the current presentation.
(e) Ratios include line of credit interest expense which rounds to less than 0.01%.
(f) Total net expenses include the impact of certain waivers/reimbursements made by the Investment Manager and certain of its affiliates, if applicable.
(g) The benefits derived from expense reductions had an impact of less than 0.01%.
The accompanying Notes to Financial Statements are an integral part of this statement.
Annual Report 2013
19
Columbia Small Cap Growth Fund II
Financial Highlights (continued)
| | | Year Ended
February 28, | | Year Ended
February 29, | | Year Ended February 28, | |
Class C | | 2013 | | 2012 | | 2011 | | 2010 | | 2009 | |
Per share data | |
Net asset value, beginning of period | | $ | 10.76 | | | $ | 10.89 | | | $ | 8.04 | | | $ | 5.44 | | | $ | 9.67 | | |
Income from investment operations: | |
Net investment loss | | | (0.13 | ) | | | (0.19 | ) | | | (0.16 | ) | | | (0.12 | ) | | | (0.13 | ) | |
Net realized and unrealized gain (loss) | | | 0.86 | | | | 0.03 | | | | 3.01 | | | | 2.71 | | | | (4.10 | ) | |
Total from investment operations | | | 0.73 | | | | (0.16 | ) | | | 2.85 | | | | 2.59 | | | | (4.23 | ) | |
Proceeds from regulatory settlements | | | — | | | | 0.03 | | | | 0.00 | (a) | | | 0.01 | | | | — | | |
Net asset value, end of period | | $ | 11.49 | | | $ | 10.76 | | | $ | 10.89 | | | $ | 8.04 | | | $ | 5.44 | | |
Total return | | | 6.78 | % | | | (1.19 | %)(b) | | | 35.45 | % | | | 47.79 | % | | | (43.74 | %) | |
Ratios to average net assets(c)(d) | |
Total gross expenses | | | 2.04 | % | | | 2.10 | % | | | 2.07 | %(e) | | | 2.12 | %(e) | | | 2.07 | %(e) | |
Total net expenses(f) | | | 2.04 | %(g) | | | 2.10 | %(g) | | | 2.07 | %(e)(g) | | | 2.11 | %(e)(g) | | | 2.02 | %(e)(g) | |
Net investment loss | | | (1.27 | %) | | | (1.73 | %) | | | (1.75 | %) | | | (1.66 | %) | | | (1.55 | %) | |
Supplemental data | |
Net assets, end of period (in thousands) | | $ | 1,727 | | | $ | 2,027 | | | $ | 2,627 | | | $ | 2,629 | | | $ | 2,081 | | |
Portfolio turnover | | | 106 | % | | | 112 | % | | | 147 | % | | | 105 | % | | | 130 | % | |
Notes to Financial Highlights
(a) Rounds to zero.
(b) The Fund received proceeds from regulatory settlements. Had the Fund not received these proceeds, the total return would have been lower by 0.32%.
(c) In addition to the fees and expenses which the Fund bears directly, the Fund indirectly bears a pro rata share of the fees and expenses of the acquired funds in which it invests. Such indirect expenses are not included in the reported expense ratios.
(d) Certain line items from prior years have been reclassified to conform to the current presentation.
(e) Ratios include line of credit interest expense which rounds to less than 0.01%.
(f) Total net expenses include the impact of certain waivers/reimbursements made by the Investment Manager and certain of its affiliates, if applicable.
(g) The benefits derived from expense reductions had an impact of less than 0.01%.
The accompanying Notes to Financial Statements are an integral part of this statement.
Annual Report 2013
20
Columbia Small Cap Growth Fund II
Financial Highlights (continued)
Class I | | Year Ended
February 28,
2013 | | Year Ended
February 29,
2012(a) | |
Per share data | |
Net asset value, beginning of period | | $ | 12.76 | | | $ | 11.47 | | |
Income from investment operations: | |
Net investment income (loss) | | | (0.01 | ) | | | (0.02 | ) | |
Net realized and unrealized gain | | | 1.03 | | | | 1.28 | | |
Total from investment operations | | | 1.02 | | | | 1.26 | | |
Proceeds from regulatory settlements | | | — | | | | 0.03 | | |
Net asset value, end of period | | $ | 13.78 | | | $ | 12.76 | | |
Total return | | | 7.99 | % | | | 11.25 | %(b) | |
Ratios to average net assets(c) | |
Total gross expenses | | | 0.86 | % | | | 0.91 | %(d) | |
Total net expenses(e) | | | 0.86 | % | | | 0.91 | %(d)(f) | |
Net investment income (loss) | | | (0.09 | %) | | | (0.56 | %)(d) | |
Supplemental data | |
Net assets, end of period (in thousands) | | $ | 3 | | | $ | 3 | | |
Portfolio turnover | | | 106 | % | | | 112 | % | |
Notes to Financial Highlights
(a) For the period from November 16, 2011 (commencement of operations) to February 29, 2012.
(b) The Fund received proceeds from regulatory settlements. Had the Fund not received these proceeds, the total return would have been lower by 0.31%.
(c) In addition to the fees and expenses which the Fund bears directly, the Fund indirectly bears a pro rata share of the fees and expenses of the acquired funds in which it invests. Such indirect expenses are not included in the reported expense ratios.
(d) Annualized.
(e) Total net expenses include the impact of certain waivers/reimbursements made by the Investment Manager and certain of its affiliates, if applicable.
(f) The benefits derived from expense reductions had an impact of less than 0.01%.
The accompanying Notes to Financial Statements are an integral part of this statement.
Annual Report 2013
21
Columbia Small Cap Growth Fund II
Financial Highlights (continued)
| | | Year Ended
February 28, | | Year Ended
February 29, | | Year Ended February 28, | |
Class Z | | 2013 | | 2012 | | 2011 | | 2010 | | 2009 | |
Per share data | |
Net asset value, beginning of period | | $ | 12.75 | | | $ | 12.78 | | | $ | 9.34 | | | $ | 6.25 | | | $ | 11.01 | | |
Income from investment operations: | |
Net investment loss | | | (0.04 | ) | | | (0.09 | ) | | | (0.08 | ) | | | (0.06 | ) | | | (0.05 | ) | |
Net realized and unrealized gain (loss) | | | 1.04 | | | | 0.02 | | | | 3.52 | | | | 3.14 | | | | (4.71 | ) | |
Total from investment operations | | | 1.00 | | | | (0.07 | ) | | | 3.44 | | | | 3.08 | | | | (4.76 | ) | |
Proceeds from regulatory settlements | | | — | | | | 0.04 | | | | 0.00 | (a) | | | 0.01 | | | | — | | |
Net asset value, end of period | | $ | 13.75 | | | $ | 12.75 | | | $ | 12.78 | | | $ | 9.34 | | | $ | 6.25 | | |
Total return | | | 7.84 | % | | | (0.23 | %)(b) | | | 36.83 | % | | | 49.44 | % | | | (43.23 | %) | |
Ratios to average net assets(c)(d) | |
Total gross expenses | | | 1.05 | % | | | 1.10 | % | | | 1.07 | %(e) | | | 1.12 | %(e) | | | 1.07 | %(e) | |
Total net expenses(f) | | | 1.05 | %(g) | | | 1.09 | %(g) | | | 1.07 | %(e)(g) | | | 1.11 | %(e)(g) | | | 1.02 | %(e)(g) | |
Net investment loss | | | (0.28 | %) | | | (0.73 | %) | | | (0.75 | %) | | | (0.65 | %) | | | (0.54 | %) | |
Supplemental data | |
Net assets, end of period (in thousands) | | $ | 96,609 | | | $ | 180,984 | | | $ | 219,512 | | | $ | 214,574 | | | $ | 143,511 | | |
Portfolio turnover | | | 106 | % | | | 112 | % | | | 147 | % | | | 105 | % | | | 130 | % | |
Notes to Financial Highlights
(a) Rounds to zero.
(b) The Fund received proceeds from regulatory settlements. Had the Fund not received these proceeds, the total return would have been lower by 0.32%.
(c) In addition to the fees and expenses which the Fund bears directly, the Fund indirectly bears a pro rata share of the fees and expenses of the acquired funds in which it invests. Such indirect expenses are not included in the reported expense ratios.
(d) Certain line items from prior years have been reclassified to conform to the current presentation.
(e) Ratios include line of credit interest expense which rounds to less than 0.01%.
(f) Total net expenses include the impact of certain waivers/reimbursements made by the Investment Manager and certain of its affiliates, if applicable.
(g) The benefits derived from expense reductions had an impact of less than 0.01%.
The accompanying Notes to Financial Statements are an integral part of this statement.
Annual Report 2013
22
Columbia Small Cap Growth Fund II
Notes to Financial Statements
February 28, 2013
Note 1. Organization
Columbia Small Cap Growth Fund II (the Fund), a series of Columbia Funds Series Trust (the Trust), is a diversified fund. The Trust is registered under the Investment Company Act of 1940, as amended (the 1940 Act), as an open-end management investment company organized as a Delaware statutory trust.
Fund Shares
The Trust may issue an unlimited number of shares (without par value). The Fund offers Class A, Class B, Class C, Class I and Class Z shares. All share classes have identical voting, dividend and liquidation rights. Each share class has its own expense structure and sales charges, as applicable.
The Fund is closed to new investors and new accounts, subject to certain limited exceptions.
Class A shares are subject to a maximum front-end sales charge of 5.75% based on the initial investment amount. Class A shares purchased without an initial sales charge in accounts aggregating $1 million to $50 million at the time of purchase are subject to a contingent deferred sales charge (CDSC) if the shares are sold within 18 months of purchase, charged as follows: 1.00% CDSC if redeemed within 12 months of purchase, and 0.50% CDSC if redeemed more than 12, but less than 18, months after purchase.
Class B shares may be subject to a maximum CDSC of 5.00% based upon the holding period after purchase. Class B shares will generally convert to Class A shares eight years after purchase.
Class C shares are subject to a 1.00% CDSC on shares redeemed within one year of purchase.
Class I shares are not subject to sales charges and are only available to the Columbia Family of Funds.
Class Z shares are not subject to sales charges, and are only available to certain investors.
Note 2. Summary of Significant Accounting Policies
Use of Estimates
The preparation of financial statements in accordance with U.S. generally accepted accounting principles (GAAP) requires management to make certain estimates and assumptions that affect the reported amounts of assets and liabilities, the disclosure of contingent assets and liabilities at the date of the financial statements and the reported amounts of revenue and expenses during the reporting period. Actual results could differ from those estimates.
The following is a summary of significant accounting policies consistently followed by the Fund in the preparation of its financial statements.
Security Valuation
All equity securities are valued at the close of business of the New York Stock Exchange (NYSE). Equity securities are valued at the last quoted sales price on the principal exchange or market on which they trade, except for securities traded on the NASDAQ Stock Market, which are valued at the NASDAQ official close price. Unlisted securities or listed securities for which there were no sales during the day are valued at the mean of the latest quoted bid and ask prices on such exchanges or markets.
Foreign securities are valued based on quotations from the principal market in which such securities are normally traded. If any foreign share prices are not readily available as a result of limited share activity the securities are valued at the mean of the latest quoted bid and ask prices on such exchanges or markets. Foreign currency exchange rates are generally determined at 4:00 p.m. Eastern (U.S.) time. However, many securities markets and exchanges outside the U.S. close prior to the close of the NYSE; therefore, the closing prices for securities in such markets or on such exchanges may not fully reflect events that occur after such close but before the close of the NYSE. In those situations, foreign securities will be fair valued pursuant to the policy adopted by the Board of Trustees (the Board), including utilizing a third party pricing service to determine these fair values. The third party pricing service takes into account multiple factors, including, but not limited to, movements in the U.S. securities markets, certain depositary receipts, futures contracts and foreign exchange rates that have occurred subsequent to the close of the foreign exchange or market, to determine a good faith estimate that reasonably reflects the current market conditions as of the close of the NYSE. The fair value of a security is likely to be different from the quoted or published price, if available.
Investments in other open-end investment companies, including money market funds, are valued at net asset value.
Investments for which market quotations are not readily available, or that have quotations which management believes are not reliable, are valued at fair value as determined in good faith under consistently applied procedures established by and under the general supervision of the Board. If a security or class of securities (such as foreign securities) is valued at fair value, such value is likely to be different from the last quoted market price for the security.
The determination of fair value often requires significant judgment. To determine fair value, management may use assumptions including but not limited to future cash flows and
Annual Report 2013
23
Columbia Small Cap Growth Fund II
Notes to Financial Statements (continued)
February 28, 2013
estimated risk premiums. Multiple inputs from various sources may be used to determine fair value.
Foreign Currency Transactions and Translations
The values of all assets and liabilities denominated in foreign currencies are translated into U.S. dollars at that day's exchange rates. Net realized and unrealized gains (losses) on foreign currency transactions and translations include gains (losses) arising from the fluctuation in exchange rates between trade and settlement dates on securities transactions, gains (losses) arising from the disposition of foreign currency and currency gains (losses) between the accrual and payment dates on dividends, interest income and foreign withholding taxes.
For financial statement purposes, the Fund does not distinguish that portion of gains (losses) on investments which is due to changes in foreign exchange rates from that which is due to changes in market prices of the investments. Such fluctuations are included with the net realized and unrealized gains (losses) on investments in the Statement of Operations.
Security Transactions
Security transactions are accounted for on the trade date. Cost is determined and gains (losses) are based upon the specific identification method for both financial statement and federal income tax purposes.
Income Recognition
Corporate actions and dividend income are recorded on the ex-dividend date.
The Fund may receive distributions from holdings in business development companies (BDCs), exchange traded funds (ETFs) and real estate investment trusts (REITs), which report information on the character of their distributions annually. These distributions are allocated to dividend income, capital gain and return of capital based on estimates made by the Fund's management if actual information has not yet been reported. Return of capital is recorded as a reduction of the cost basis of securities held. If the Fund no longer owns the applicable securities, return of capital is recorded as a realized gain. Management's estimates are subsequently adjusted when the actual character of the distributions is disclosed by the BDCs, ETFs and REITs, which could result in a proportionate change in return of capital to shareholders.
Awards from class action litigation are recorded as a reduction of cost basis if the Fund still owns the applicable securities on the payment date. If the Fund no longer owns the applicable securities, the proceeds are recorded as realized gains.
Expenses
General expenses of the Trust are allocated to the Fund and other funds of the Trust based upon relative net assets or other
expense allocation methodologies determined by the nature of the expense. Expenses directly attributable to the Fund are charged to the Fund. Expenses directly attributable to a specific class of shares are charged to that share class.
Determination of Class Net Asset Value
All income, expenses (other than class-specific expenses, which are charged to that share class, as shown in the Statement of Operations) and realized and unrealized gains (losses) are allocated to each class of the Fund on a daily basis, based on the relative net assets of each class, for purposes of determining the net asset value of each class.
Federal Income Tax Status
The Fund intends to qualify each year as a regulated investment company under Subchapter M of the Internal Revenue Code, as amended, and will distribute substantially all of its tax exempt and taxable income (including net short-term capital gains), if any, for its tax year, and as such will not be subject to federal income taxes. In addition, the Fund intends to distribute in each calendar year substantially all of its net investment income, capital gains and certain other amounts, if any, such that the Fund should not be subject to federal excise tax. Therefore, no federal income or excise tax provision is recorded.
Distributions to Shareholders
Distributions from net investment income, if any, are declared and paid annually. Net realized capital gains, if any, are distributed along with the income distribution. Income distributions and capital gain distributions are determined in accordance with federal income tax regulations, which may differ from GAAP.
Guarantees and Indemnifications
Under the Trust's organizational documents and, in some cases, by contract, its officers and trustees are indemnified against certain liabilities arising out of the performance of their duties to the Trust or its funds. In addition, certain of the Fund's contracts with its service providers contain general indemnification clauses. The Fund's maximum exposure under these arrangements is unknown since the amount of any future claims that may be made against the Fund cannot be determined, and the Fund has no historical basis for predicting the likelihood of any such claims.
Recent Accounting Pronouncement
Disclosures about Offsetting Assets and Liabilities
In December 2011, the Financial Accounting Standards Board (FASB) issued Accounting Standards Update (ASU) No. 2011-11, Disclosures about Offsetting Assets and Liabilities. The objective of the FASB is to enhance current
Annual Report 2013
24
Columbia Small Cap Growth Fund II
Notes to Financial Statements (continued)
February 28, 2013
disclosure requirements on offsetting of certain assets and liabilities and to enable financial statement users to compare financial statements prepared under GAAP and International Financial Reporting Standards.
Specifically, ASU No. 2011-11 requires an entity to disclose both gross and net information for derivatives and other financial instruments that are subject to a master netting arrangement or similar agreement. The standard requires disclosure of collateral received in connection with the master netting agreements or similar agreements. The effective date of ASU No. 2011-11 is for interim and annual periods beginning on or after January 1, 2013. At this time, management is evaluating the implications of this guidance and the impact it will have on the financial statement amounts and footnote disclosures, if any.
Note 3. Fees and Compensation Paid to Affiliates
Investment Management Fees
Under an Investment Management Services Agreement, Columbia Management Investment Advisers, LLC (the Investment Manager), a wholly-owned subsidiary of Ameriprise Financial, Inc. (Ameriprise Financial), determines which securities will be purchased, held or sold. The investment management fee is an annual fee that is equal to a percentage of the Fund's average daily net assets that declines from 0.70% to 0.60% as the Fund's net assets increase. The effective investment management fee rate for the year ended February 28, 2013 was 0.70% of the Fund's average daily net assets.
Administration Fees
Under an Administrative Services Agreement, the Investment Manager also serves as the Fund Administrator. The Fund pays the Fund Administrator an annual fee for administration and accounting services equal to 0.12% of the Fund's average daily net assets.
Other Expenses
Other expenses are for, among other things, certain expenses of the Fund or the Board, including: Fund boardroom and office expense, employee compensation, employee health and retirement benefits, and certain other expenses. Payment of these Fund and Board expenses is facilitated by a company providing limited administrative services to the Fund and the Board. For the year ended February 28, 2013, other expenses paid to this company were $1,713.
Compensation of Board Members
Board members are compensated for their services to the Fund as disclosed in the Statement of Operations. Under a Deferred Compensation Plan (the Plan), the Board members who are not
"interested persons" of the Fund, as defined under the 1940 Act, may elect to defer payment of up to 100% of their compensation. Deferred amounts are treated as though equivalent dollar amounts had been invested in shares of certain funds managed by the Investment Manager. The Fund's liability for these amounts is adjusted for market value changes and remains in the Fund until distributed in accordance with the Plan.
Transfer Agent Fees
Under a Transfer and Dividend Disbursing Agent Agreement, Columbia Management Investment Services Corp. (the Transfer Agent), an affiliate of the Investment Manager and a wholly-owned subsidiary of Ameriprise Financial, is responsible for providing transfer agency services to the Fund. The Transfer Agent has contracted with Boston Financial Data Services (BFDS) to serve as sub-transfer agent.
The Transfer Agent receives monthly account-based service fees based on the number of open accounts and is reimbursed by the Fund for the fees and expenses the Transfer Agent pays to financial intermediaries that maintain omnibus accounts with the Fund that is a percentage of the average aggregate value of the Fund's shares maintained in each such omnibus account (other than omnibus accounts for which American Enterprise Investment Services Inc. is the broker of record or accounts where the beneficial shareholder is a customer of Ameriprise Financial Services, Inc., which are paid a per account fee). The Transfer Agent pays the fees of BFDS for services as sub-transfer agent and is not entitled to reimbursement for such fees from the Fund (with the exception of out-of-pocket fees).
The Transfer Agent also receives compensation from fees for various shareholder services and reimbursements for certain out-of-pocket fees. Class I shares do not pay transfer agent fees.
For the year ended February 28, 2013, the Fund's effective transfer agent fee rates as a percentage of average daily net assets of each class were as follows:
Class A | | | 0.18 | % | |
Class B | | | 0.18 | | |
Class C | | | 0.18 | | |
Class Z | | | 0.18 | | |
An annual minimum account balance fee of $20 may apply to certain accounts with a value below the Fund's initial minimum investment requirements to reduce the impact of small accounts on transfer agent fees. These minimum account balance fees are recorded as part of expense reductions in the Statement of Operations. For the year ended February 28, 2013, these minimum account balance fees reduced total expenses by $12,204.
Annual Report 2013
25
Columbia Small Cap Growth Fund II
Notes to Financial Statements (continued)
February 28, 2013
Distribution and Service Fees
The Fund has an agreement with Columbia Management Investment Distributors, Inc. (the Distributor), an affiliate of the Investment Manager and a wholly-owned subsidiary of Ameriprise Financial, for distribution and shareholder services. Pursuant to Rule 12b-1 under the 1940 Act, the Board has approved, and the Fund has adopted, distribution and shareholder service plans (the Plans) which set the distribution and service fees for the Fund. These fees are calculated daily and are intended to compensate the Distributor and/or eligible selling and/or servicing agents for selling shares of the Fund and providing services to investors.
The Plans require the payment of a monthly combined distribution and service fee to the Distributor at the maximum annual rate of 0.25% of the average daily net assets attributable to Class A shares of the Fund. The Plans also require the payment of a monthly service fee at the maximum annual rate of 0.25% of the average daily net assets attributable to Class B and Class C shares of the Fund and the payment of a monthly distribution fee at the minimum annual rate of 0.75% of the average daily net assets attributable to Class B and Class C shares of the Fund.
Sales Charges
Sales charges, including front-end charges and CDSCs, received by the Distributor for distributing Fund shares were $7,487 for Class A, $2,277 for Class B and $7 for Class C shares for the year ended February 28, 2013.
Expenses Waived/Reimbursed by the Investment Manager and its Affiliates
Effective July 1, 2012, the Investment Manager and certain of its affiliates have contractually agreed to waive fees and/or reimburse expenses (excluding certain fees and expenses described below), through June 30, 2013, unless sooner terminated at the sole discretion of the Board, so that the Fund's net operating expenses, after giving effect to fees waived/expenses reimbursed and any balance credits and/or overdraft charges from the Fund's custodian, do not exceed the following annual rates as a percentage of the class' average daily net assets:
Class A | | | 1.41 | % | |
Class B | | | 2.16 | | |
Class C | | | 2.16 | | |
Class I | | | 1.02 | | |
Class Z | | | 1.16 | | |
Prior to July 1, 2012, the Investment Manager and certain of its affiliates contractually agreed to waive fees and/or reimburse expenses (excluding certain fees and expenses described below), so that the Fund's net operating expenses,
after giving effect to fees waived/expenses reimbursed and any balance credits and/or overdraft charges from the Fund's custodian, did not exceed the following annual rates as a percentage of the class' average daily net assets:
Class A | | | 1.35 | % | |
Class B | | | 2.10 | | |
Class C | | | 2.10 | | |
Class I | | | 0.97 | | |
Class Z | | | 1.10 | | |
Under the agreement governing these fee waivers and/or expense reimbursement arrangements, the following fees and expenses are excluded from the waiver/reimbursement commitment, and therefore will be paid by the Fund, if applicable: taxes (including foreign transaction taxes), expenses associated with investments in affiliated and non-affiliated pooled investment vehicles (including mutual funds and exchange traded funds), transaction costs and brokerage commissions, costs related to any securities lending program, dividend expenses associated with securities sold short, inverse floater program fees and expenses, transaction charges and interest on borrowed money, interest, extraordinary expenses and any other expenses the exclusion of which is specifically approved by the Board. This agreement may be modified or amended only with approval from all parties.
Note 4. Federal Tax Information
The timing and character of income and capital gain distributions are determined in accordance with income tax regulations, which may differ from GAAP because of temporary or permanent book to tax differences.
At February 28, 2013, these differences are primarily due to differing treatment for capital loss carryforwards, deferral/reversal of wash sales losses, Trustees' deferred compensation, foreign currency transactions, net operating losses, passive foreign investment company (PFIC) holdings and late-year ordinary losses. To the extent these differences are permanent, reclassifications are made among the components of the Fund's net assets in the Statement of Assets and Liabilities. Temporary differences do not require reclassifications. In the Statement of Assets and Liabilities the following reclassifications were made:
Excess of distributions over net investment income | | $ | 1,407,374 | | |
Accumulated net realized loss | | | (1,047,509 | ) | |
Paid-in capital | | | (359,865 | ) | |
Net investment income and net realized gains (losses), as disclosed in the Statement of Operations, and net assets were not affected by this reclassification.
For the years ended February 28, 2013 and February 29, 2012, there were no distributions.
Annual Report 2013
26
Columbia Small Cap Growth Fund II
Notes to Financial Statements (continued)
February 28, 2013
At February 28, 2013, the components of distributable earnings on a tax basis were as follows:
Accumulated realized loss | | $ | (7,961,572 | ) | |
Unrealized appreciation | | | 30,859,295 | | |
At February 28, 2013, the cost of investments for federal income tax purposes was $186,981,270 and the aggregate gross unrealized appreciation and depreciation based on that cost was:
Unrealized appreciation | | $ | 39,356,643 | | |
Unrealized depreciation | | | (8,497,348 | ) | |
Net unrealized appreciation | | $ | 30,859,295 | | |
The following capital loss carryforward, determined at February 28, 2013, may be available to reduce taxable income arising from future net realized gains on investments, if any, to the extent permitted by the Internal Revenue Code:
Year of Expiration | | Amount | |
2018 | | $ | 7,630,478 | | |
For the year ended February 28, 2013, $24,897,111 of capital loss carryforward was utilized.
Under current tax rules, regulated investment companies can elect to treat certain late-year ordinary losses incurred and post-October capital losses (capital losses realized after October 31) as arising on the first day of the following taxable year. As of February 28, 2013, the Fund will elect to treat late year ordinary losses of $331,094 as arising on March 1, 2013.
Management of the Fund has concluded that there are no significant uncertain tax positions that would require recognition in the financial statements. However, management's conclusion may be subject to review and adjustment at a later date based on factors including, but not limited to, new tax laws, regulations, and administrative interpretations (including relevant court decisions). Generally, the Fund's federal tax returns for the prior three fiscal years remain subject to examination by the Internal Revenue Service.
Note 5. Portfolio Information
The cost of purchases and proceeds from sales of securities, excluding short-term obligations, aggregated to $265,961,012 and $378,283,997, respectively, for the year ended February 28, 2013.
Note 6. Regulatory Settlements
During the year ended February 29, 2012, the Fund received $950,234 as a result of a regulatory settlement proceeding brought by the Securities and Exchange Commission against an unaffiliated third party relating to market timing and/or late trading of mutual funds. This amount represented the Fund's portion of the proceeds from the settlement (the Fund was not a party to the proceeding). The payments have been included
in "Proceeds from regulatory settlements" in the Statement of Changes in Net Assets.
Note 7. Affiliated Money Market Fund
The Fund invests its daily cash balances in Columbia Short-Term Cash Fund, an affiliated money market fund established for the exclusive use by the Fund and other affiliated funds. The income earned by the Fund from such investments is included as "Dividends — affiliated issuers" in the Statement of Operations. As an investing fund, the Fund indirectly bears its proportionate share of the expenses of Columbia Short-Term Cash Fund.
Note 8. Shareholder Concentration
At February 28, 2013, one unaffiliated shareholder account owned 44.8% of the outstanding shares of the Fund. The Fund has no knowledge about whether any portion of those shares was owned beneficially by such account. Subscription and redemption activity by concentrated accounts may have a significant effect on the operations of the Fund.
Note 9. Line of Credit
The Fund has entered into a revolving credit facility with a syndicate of banks led by JPMorgan Chase Bank N.A. whereby the Fund may borrow for the temporary funding of shareholder redemptions or for other temporary or emergency purposes. The credit facility agreement, as amended, which is a collective agreement between the Fund and certain other funds managed by the Investment Manager, severally and not jointly, permits collective borrowings up to $500 million. Interest is charged to each participating fund based on its borrowings at a rate equal to the higher of (i) the overnight federal funds rate plus 1.00% or (ii) the one-month LIBOR rate plus 1.00%. Each borrowing under the credit facility matures no later than 60 days after the date of borrowing. The Fund also pays a commitment fee equal to its pro rata share of the amount of the credit facility at a rate of 0.08% per annum.
The Fund had no borrowings during the year ended February 28, 2013.
Note 10. Risks Relating to Certain Investments
Health Care Sector Risk
The Fund's portfolio managers may invest significantly in issuers operating in the health care sector. The Fund may be more susceptible to the particular risks of this sector than if the Fund were invested in a wider variety of issuers operating in unrelated sectors.
Annual Report 2013
27
Columbia Small Cap Growth Fund II
Notes to Financial Statements (continued)
February 28, 2013
Technology and Technology-related Investment Risk
At February 28, 2013, the Fund invested a substantial portion of its assets in technology and technology-related companies. The market prices of technology and technology-related stocks tend to exhibit a greater degree of market risk and price volatility than other types of investments.
Note 11. Subsequent Events
Management has evaluated the events and transactions that have occurred through the date the financial statements were issued. Other than as noted below, there were no items requiring adjustment of the financial statements or additional disclosure.
In September 2012, the Board of Trustees approved a proposal to merge the Fund into Columbia Small Cap Growth Fund I. The proposal was approved at a special meeting of shareholders held on February 27, 2013. The merger, which was a tax-free reorganization for U.S. federal income tax proposes, was effective March 15, 2013.
Note 12. Information Regarding Pending and Settled Legal Proceedings
In December 2005, without admitting or denying the allegations, American Express Financial Corporation (AEFC, which is now known as Ameriprise Financial, Inc. (Ameriprise Financial)) entered into settlement agreements with the Securities and Exchange Commission (SEC) and Minnesota Department of Commerce (MDOC) related to market timing activities. As a result, AEFC was censured and ordered to cease and desist from committing or causing any violations of certain provisions of the Investment Advisers Act of 1940, the Investment Company Act of 1940, and various Minnesota laws. AEFC agreed to pay disgorgement of $10 million and civil money penalties of $7 million. AEFC also agreed to retain an independent distribution consultant to assist in developing a plan for distribution of all disgorgement and civil penalties ordered by the SEC in accordance with various undertakings detailed at www.sec.gov/litigation/admin/ia-2451.pdf. Ameriprise Financial and its affiliates have cooperated with the SEC and the MDOC in these legal proceedings, and have made regular reports to the funds' Boards of Trustees.
Ameriprise Financial and certain of its affiliates have historically been involved in a number of legal, arbitration and regulatory proceedings, including routine litigation, class actions, and governmental actions, concerning matters arising in connection with the conduct of their business activities. Ameriprise Financial believes that the Funds are not currently the subject of, and that neither Ameriprise Financial nor any of its affiliates are the subject of, any pending legal, arbitration or regulatory proceedings that are likely to have a material adverse effect on the Funds or the ability of Ameriprise Financial or its affiliates to
perform under their contracts with the Funds. Ameriprise Financial is required to make 10-Q, 10-K and, as necessary, 8-K filings with the Securities and Exchange Commission on legal and regulatory matters that relate to Ameriprise Financial and its affiliates. Copies of these filings may be obtained by accessing the SEC website at www.sec.gov.
There can be no assurance that these matters, or the adverse publicity associated with them, will not result in increased fund redemptions, reduced sale of fund shares or other adverse consequences to the Funds. Further, although we believe proceedings are not likely to have a material adverse effect on the Funds or the ability of Ameriprise Financial or its affiliates to perform under their contracts with the Funds, these proceedings are subject to uncertainties and, as such, we are unable to estimate the possible loss or range of loss that may result. An adverse outcome in one or more of these proceedings could result in adverse judgments, settlements, fines, penalties or other relief that could have a material adverse effect on the consolidated financial condition or results of operations of Ameriprise Financial.
Annual Report 2013
28
Columbia Small Cap Growth Fund II
Report of Independent Registered Public Accounting Firm
To the Trustees of Columbia Funds Series Trust and
the Shareholders of Columbia Small Cap Growth Fund II
In our opinion, the accompanying statement of assets and liabilities, including the portfolio of investments, and the related statements of operations and of changes in net assets and the financial highlights present fairly, in all material respects, the financial position of Columbia Small Cap Growth Fund II (the "Fund") (a series of Columbia Funds Series Trust) at February 28, 2013, the results of its operations for the year then ended, the changes in its net assets for each of the two years in the period then ended and the financial highlights for each of the periods indicated, in conformity with accounting principles generally accepted in the United States of America. These financial statements and financial highlights (hereafter referred to as "financial statements") are the responsibility of the Fund's management. Our responsibility is to express an opinion on these financial statements based on our audits. We conducted our audits of these financial statements in accordance with the standards of the Public Company Accounting Oversight Board (United States). Those standards require that we plan and perform the audit to obtain reasonable assurance about whether the financial statements are free of material misstatement. An audit includes examining, on a test basis, evidence supporting the amounts and disclosures in the financial statements, assessing the accounting principles used and significant estimates made by management, and evaluating the overall financial statement presentation. We believe that our audits, which included confirmation of securities at February 28, 2013 by correspondence with the custodian, transfer agent and brokers, provide a reasonable basis for our opinion.
PricewaterhouseCoopers LLP
Minneapolis, Minnesota
April 19, 2013
Annual Report 2013
29
Columbia Small Cap Growth Fund II
Shareholders elect the Board that oversees the funds' operations. The Board appoints officers who are responsible for day-to-day business decisions based on policies set by the Board. The following table provides basic biographical information about the funds' Board members, including their principal occupations during the past five years, although specific titles for individuals may have varied over the period. Under current Board policy, members may serve until the next Board meeting after he or she reaches the mandatory retirement age established by the Board, or the fifteenth anniversary of the first Board meeting they attended as a member of the Board.
Mr. Edward J. Boudreau, Jr., Mr. William P. Carmichael, Mr. William A. Hawkins, Mr. R. Glenn Hilliard, Ms. Minor M. Shaw and Dr. Anthony M. Santomero, were members of the Legacy Columbia Nations funds' Board ("Nations Funds"), which includes Columbia Funds Series Trust, Columbia Funds Variable Insurance Trust I and Columbia Funds Master Investment Trust, LLC and began service on the Board for the Legacy RiverSource funds ("RiverSource Funds") effective June 1, 2011.
Independent Trustees
Name,
Address,
Year of Birth | | Position Held With
Funds and Length of
Service | | Principal Occupation
During Past Five Years | | Number of
Funds in the
Fund Family
Overseen by
Board Member | | Other Present or Past
Directorships/Trusteeships
(Within Past 5 Years) | |
Kathleen Blatz
901 S. Marquette Ave.
Minneapolis, MN 55402
1954 | | Board member since 1/06 for RiverSource Funds and since 6/11 for Nations Funds | | Attorney; Chief Justice, Minnesota Supreme Court, 1998-2006 | | | 153 | | | Director, BlueCross BlueShield of Minnesota since 2009 | |
Edward J. Boudreau, Jr.
901 S. Marquette Ave.
Minneapolis, MN 55402
1944 | | Board member since 6/11 for RiverSource Funds and since 1/05 for Nations Funds | | Managing Director, E.J. Boudreau & Associates (consulting) since 2000 | | | 151 | | | Former Trustee, BofA Funds Series Trust (11 funds) | |
Pamela G. Carlton
901 S. Marquette Ave.
Minneapolis, MN 55402
1954 | | Board member since 7/07 for RiverSource Funds and since 6/11 for Nations Funds | | President, Springboard — Partners in Cross Cultural Leadership (consulting company) since 2003 | | | 153 | | | None | |
William P. Carmichael
901 S. Marquette Ave.
Minneapolis, MN 55402
1943 | | Board member since 6/11 for RiverSource Funds and since 1999 for Nations Funds | | Retired | | | 151 | | | Director, Cobra Electronics Corporation (electronic equipment manufacturer); The Finish Line (athletic shoes and apparel) since July 2003; McMoRan Exploration Company (oil and gas exploration and development) since 2010; former Trustee, BofA Funds Series Trust (11 funds); former Director, Spectrum Brands, Inc. (consumer products); former Director, Simmons Company (bedding) | |
Patricia M. Flynn
901 S. Marquette Ave.
Minneapolis, MN 55402
1950 | | Board member since 11/04 for RiverSource Funds and since 6/11 for Nations Funds | | Trustee Professor of Economics and Management, Bentley University; former Dean, McCallum Graduate School of Business, Bentley University since 1976 | | | 153 | | | None | |
William A. Hawkins
901 S. Marquette Ave.
Minneapolis, MN 55402
1942 | | Board member since 6/11 for RiverSource Funds and since 1/05 for Nations Funds | | Managing Director, Overton Partners (financial consulting), since August 2010; President and Chief Executive Officer, California General Bank, N.A., January 2008-August 2010. | | | 151 | | | Trustee, BofA Funds Series Trust (11 funds) | |
Annual Report 2013
30
Columbia Small Cap Growth Fund II
Trustees and Officers (continued)
Independent Trustees (continued)
Name,
Address,
Year of Birth | | Position Held With
Funds and Length of
Service | | Principal Occupation
During Past Five Years | | Number of
Funds in the
Fund Family
Overseen by
Board Member | | Other Present or Past
Directorships/Trusteeships
(Within Past 5 Years) | |
R. Glenn Hilliard
901 S. Marquette Ave.
Minneapolis, MN 55402
1943 | | Board member since 6/11 for RiverSource Funds and since 1/05 for Nations Funds | | Chairman and Chief Executive Officer, Hilliard Group LLC (investing and consulting), since April 2003; Non-Executive Director & Chairman, CNO Financial Group, Inc. (insurance), September 2003-May 2011 | | | 151 | | | Chairman, BofA Fund Series Trust (11 funds); former Director, CNO Financial Group, Inc. (insurance) | |
Stephen R. Lewis, Jr.
901 S. Marquette Ave.
Minneapolis, MN 55402
1939 | | Chair of the Board for RiverSource Funds since 1/07, Board member for RiverSource Funds since 1/02 and since 6/11 for Nations Funds | | President Emeritus and Professor of Economics Emeritus, Carleton College since 2002 | | | 153 | | | Director, Valmont Industries, Inc. (manufacturer of irrigation systems) since 2002 | |
Catherine James Paglia
901 S. Marquette Ave.
Minneapolis, MN 55402
1952 | | Board member since 11/04 for RiverSource Funds and since 6/11 for Nations Funds | | Director, Enterprise Asset Management, Inc. (private real estate and asset management company) | | | 153 | | | Director, Valmont Industries, Inc. (manufacturer of irrigation systems) since 2012 | |
Leroy C. Richie
901 S. Marquette Ave.
Minneapolis, MN 55402
1941 | | Board member since 2000 for Legacy Seligman Funds, since 11/08 for RiverSource Funds and since 6/11 for Nations Funds | | Counsel, Lewis & Munday, P.C. (law firm) since 2004; former Vice President and General Counsel, Automotive Legal Affairs, Chrysler Corporation from 1983-1987 | | | 153 | | | Lead Outside Director, Digital Ally, Inc. (digital imaging) since September 2005; Director, Infinity, Inc. (oil and gas exploration and production) since 1994; Director, OGE Energy Corp. (energy and energy services) since November 2007 | |
Minor M. Shaw
901 S. Marquette Ave.
Minneapolis, MN 55402
1947 | | Board member since 6/11 for RiverSource Funds and since 2003 for Nations Funds | | President, Micco LLC (private investments) since 2011; President Micco Corp. since 1998 | | | 151 | | | Director, Piedmont Natural Gas; Director, BlueCross BlueShield of South Carolina since April 2008; Former Trustee, BofA Funds Series Trust (11 funds) | |
Alison Taunton-Rigby
901 S. Marquette Ave.
Minneapolis, MN 55402
1944 | | Board member since 11/02 for RiverSource Funds and since 6/11 for Nations Funds | | Chief Executive Officer and Director, RiboNovix, Inc. (biotechnology), 2003-2010 | | | 153 | | | Director, Healthways, Inc. (health and well-being improvement) since 2005; Director, ICI Mutual Insurance Company, RRG since 2011; Director, Abt Associates (government contractor) since 2001; Director, Boston Children's Hospital since 2002 | |
Annual Report 2013
31
Columbia Small Cap Growth Fund II
Trustees and Officers (continued)
Interested Trustee Not Affiliated With Investment Manager*
Name,
Address,
Year of Birth | | Position Held With
Funds and Length of
Service | | Principal Occupation
During Past Five Years | | Number of
Funds in the
Fund Family
Overseen by
Board Member | | Other Present or Past
Directorships/Trusteeships
(Within Past 5 Years) | |
Anthony M. Santomero
901 S. Marquette Ave.
Minneapolis, MN 55402
1946 | | Board member since 6/11 for RiverSource Funds and since 1/08 for Nations Funds | | Richard K. Mellon Professor Emeritus of Finance, The Wharton School, University of Pennsylvania, since 2002; Senior Advisor, McKinsey & Company (consulting), 2006-2008 | | | 151 | | | Director, Renaissance Reinsurance Ltd. since May 2008; Trustee, Penn Mutual Life Insurance Company since March 2008; Director, Citigroup since 2009; Director, Citibank, N.A. since 2009; former Trustee, BofA Funds Series Trust (11 funds) | |
*Dr. Santomero is not an affiliated person of the investment manager or Ameriprise Financial. However, he is currently deemed by the funds to be an "interested person" (as defined in the 1940 Act) of the funds because he serves as a Director of Citigroup, Inc. and Citibank N.A., companies that may directly or through subsidiaries and affiliates engage from time-to-time in brokerage execution, principal transactions and lending relationships with the funds or accounts advised/managed by the investment manager.
Interested Trustee Affiliated With Investment Manager*
Name,
Address,
Year of Birth | | Position Held With
Funds and Length of
Service | | Principal Occupation
During Past Five Years | | Number of
Funds in the
Fund Family
Overseen by
Board Member | | Other Present or Past
Directorships/Trusteeships
(Within Past 5 Years) | |
William F. Truscott
53600 Ameriprise
Financial Center
Minneapolis, MN 55474
1960 | | Board member since 11/01 for RiverSource Funds and since 6/11 for Nations Funds; Senior Vice President since 2002 for RiverSource Funds and 5/10 for Nations Funds | | President, Columbia Management Investment Advisers, LLC since February 2012, (previously President, Chairman of the Board and Chief Investment Officer, 2001-April 2010); Chief Executive Officer, Global Asset Management, Ameriprise Financial, Inc. since September 2012 (previously Chief Executive Officer, U.S. Asset Management & President, Annuities, May 2010-September 2012 and President — U.S. Asset Management and Chief Investment Officer, 2005-April 2010); Chief Executive Officer, Columbia Management Investment Distributors, Inc. since February 2012, (previously Chairman of the Board and Chief Executive Officer, 2006-April 2010); Chairman of the Board and Chief Executive Officer, RiverSource Distributors, Inc. since 2006; President and Chief Executive Officer, Ameriprise Certificate Company 2006-August 2012. | | | 210 | | | Chairman of the Board, Columbia Management Investment Advisers, LLC since May 2010; Director, Columbia Management Investment Distributors, Inc. since May 2010; Director, Ameriprise Certificate Company, 2006-January 2013 | |
*Interested person (as defined under the 1940 Act) by reason of being an officer, director, security holder and/or employee of the investment manager or Ameriprise Financial.
The SAI has additional information about the Fund's Board members and is available, without charge, upon request by calling 800.345.6611; contacting your financial intermediary; or visiting columbiamanagement.com.
Annual Report 2013
32
Columbia Small Cap Growth Fund II
Trustees and Officers (continued)
The Board has appointed officers who are responsible for day-to-day business decisions based on policies it has established. The officers serve at the pleasure of the Board. In addition to Mr. Truscott, who is Senior Vice President, the funds' other officers are:
Officers
Name,
Address,
Year of Birth | | Position Held With
Funds and Length of
Service | | Principal Occupation During Past Five Years | |
J. Kevin Connaughton
225 Franklin Street
Boston, MA 02110
1964 | | President and Principal Executive Officer since 5/10 for RiverSource Funds and 2009 for Nations Funds | | Senior Vice President and General Manager — Mutual Fund Products, Columbia Management Investment Advisers, LLC since May 2010; Managing Director of Columbia Management Advisors, LLC, December 2004-April 2010; Senior Vice President and Chief Financial Officer, Columbia Funds, June 2008-January 2009; Treasurer, Columbia Funds, October 2003-May 2008 | |
Amy K. Johnson
5228 Ameriprise Financial Center Minneapolis, MN 55474
1965 | | Vice President since 12/06 for RiverSource Funds and 5/10 for Nations Funds | | Senior Vice President and Chief Operating Officer, Columbia Management Investment Advisers, LLC since May 2010 (previously Chief Administrative Officer, 2009-April 2010 and Vice President — Asset Management and Trust Company Services, 2006-2009) | |
Michael G. Clarke
225 Franklin Street
Boston, MA 02110
1969 | | Treasurer since 1/11 and Chief Financial Officer since 4/11 for RiverSource Funds and Treasurer since 3/11 and Chief Financial Officer since 2009 for Nations Funds | | Vice President, Columbia Management Investment Advisers, LLC since May 2010; Managing Director of Fund Administration, Columbia Management Advisors, LLC, September 2004-April 2010; senior officer of Columbia Funds and affiliated funds since 2002 | |
Scott R. Plummer
5228 Ameriprise Financial Center Minneapolis, MN 55474
1959 | | Senior Vice President and Chief Legal Officer since 12/06 and Assistant Secretary since 6/11 for RiverSource Funds and Senior Vice President and Chief Legal Officer since 5/10 and Assistant Secretary since 6/11 for Nations Funds | | Senior Vice President, Chief Legal Officer and Assistant Secretary, Columbia Management Investment Advisers, LLC since June 2005; Vice President and Lead Chief Counsel — Asset Management, Ameriprise Financial, Inc. since May 2010 (previously Vice President and Chief Counsel — Asset Management, 2005-April 2010); Vice President, Chief Counsel and Assistant Secretary, Columbia Management Investment Distributors, Inc. since 2008; Vice President, General Counsel and Secretary, Ameriprise Certificate Company since 2005; Chief Counsel, RiverSource Distributors, Inc. since 2006 | |
Colin Moore
225 Franklin Street
Boston, MA 02110
1958 | | Senior Vice President since 5/10 for RiverSource Funds and Nations Funds | | Director and Chief Investment Officer, Columbia Management Investment Advisers, LLC since May 2010; Manager, Managing Director and Chief Investment Officer, Columbia Management Advisors, LLC, 2007-April 2010 | |
Thomas P. McGuire
225 Franklin Street
Boston, MA 02110
1972 | | Chief Compliance Officer since 3/12 | | Vice President — Asset Management Compliance, Columbia Management Investment Advisers, LLC since 2010; Chief Compliance Officer, Ameriprise Certificate Company since September 2010; Compliance Executive, Bank of America, 2005-2010 | |
Stephen T. Welsh
225 Franklin Street
Boston, MA 02110
1957 | | Vice President since 4/11 for RiverSource Funds and 2006 for Nations Funds | | President and Director, Columbia Management Investment Services Corp. since May 2010; President and Director, Columbia Management Services, Inc., July 2004- April 2010; Managing Director, Columbia Management Distributors, Inc., August 2007-April 2010 | |
Christopher O. Petersen
5228 Ameriprise Financial Center Minneapolis, MN 55474
1970 | | Vice President and Secretary since 4/11 for RiverSource Funds and 3/11 for Nations Funds | | Vice President and Chief Counsel, Ameriprise Financial, Inc. since January 2010 (formerly Vice President and Group Counsel or Counsel, April 2004-January 2010); Assistant Secretary of Legacy RiverSource Funds, January 2007-April 2011 and of the Nations Funds, May 2010-March 2011 | |
Annual Report 2013
33
Columbia Small Cap Growth Fund II
Trustees and Officers (continued)
Officers (continued)
Name,
Address,
Year of Birth | | Position Held With
Funds and Length of
Service | | Principal Occupation During Past Five Years | |
Paul D. Pearson
10468 Ameriprise Financial Center Minneapolis, MN 55474
1956 | | Vice President since 4/11 and Assistant Treasurer since 1999 for RiverSource Funds and Vice President and Assistant Treasurer since 6/11 for Nations Funds | | Vice President — Investment Accounting, Columbia Management Investment Advisers, LLC, since May 2010; Vice President — Managed Assets, Investment Accounting, Ameriprise Financial Corporation, February 1998-May 2010 | |
Joseph F. DiMaria
225 Franklin Street
Boston, MA 02110
1968 | | Vice President and Chief Accounting Officer since 4/11 and Vice President since 3/11 and Chief Accounting Officer since 2008 for Nations Funds | | Vice President, Mutual Fund Administration, Columbia Management Investment Advisers, LLC, since May 2010; Director of Fund Administration, Columbia Management Advisors, LLC, January 2006-April 2010 | |
Paul B. Goucher
100 Park Avenue
New York, NY 10017
1968 | | Vice President since 4/11 and Assistant Secretary since 11/08 for RiverSource Funds and 5/10 for Nations Funds | | Vice President and Lead Chief Counsel, Ameriprise Financial, Inc. since November 2008 and January 2013, respectively (formerly, Chief Counsel, January 2010-January 2013 and Group Counsel from November 2008- January 2010); Director, Managing Director and General Counsel, J. & W. Seligman & Co. Incorporated, July 2008-November 2008 (previously, Managing Director and Associate General Counsel, January 2005-July 2008) | |
Michael E. DeFao
225 Franklin Street
Boston, MA 02110
1968 | | Vice President since 4/11 and Assistant Secretary since 5/10 for RiverSource Funds and 2011 for Nations Funds | | Vice President and Chief Counsel, Ameriprise Financial, Inc. since May 2010; Associate General Counsel, Bank of America, June 2005-April 2010 | |
Annual Report 2013
34
Columbia Small Cap Growth Fund II
Shareholder Meeting Results
Special Meeting of Shareholders Held on February 27, 2013 (Unaudited)
Columbia Small Cap Growth Fund II
At a Joint Special Meeting of Shareholders held on February 27, 2013 (the "Meeting"), shareholders of the Fund approved an Agreement and Plan of Reorganization pursuant to which the Fund will transfer its assets to Columbia Small Cap Growth Fund I (the "Acquiring Fund") in exchange for shares of the Acquiring Fund and the assumption by the Acquiring Fund of the Fund's liabilities. The votes cast for or against as well as the number of abstentions and broker non-votes as to the proposal are set forth below. A vote is based on the total number of Fund shares outstanding as of the record date for the Meeting.
| | | Votes For | | Votes Against | | Abstentions | | Broker Non-Votes | |
| | | | | | 10,432,106 | | | | 136,879 | | | | 379,970 | | | | 0 | | |
Annual Report 2013
35
This page intentionally left blank.
Annual Report 2013
36
Columbia Small Cap Growth Fund II
Important Information About This Report
Each fund mails one shareholder report to each shareholder address. If you would like more than one report, please call shareholder services at 800.345.6611 and additional reports will be sent to you.
The policy of the Board is to vote the proxies of the companies in which each fund holds investments consistent with the procedures as stated in the Statement of Additional Information (SAI). You may obtain a copy of the SAI without charge by calling 800.345.6611; contacting your financial intermediary; visiting columbiamanagement.com; or searching the website of the Securities and Exchange Commission (SEC) at sec.gov. Information regarding how each fund voted proxies relating to portfolio securities is filed with the SEC by August 31 for the most recent 12-month period ending June 30 of that year, and is available without charge by visiting columbiamanagement.com; or searching the website of the SEC at sec.gov.
Each fund files a complete schedule of portfolio holdings with the SEC for the first and third quarters of each fiscal year on Form N-Q. Each fund's Form N-Q is available on the SEC's website at sec.gov and may be reviewed and copied at the SEC's Public Reference Room in Washington, D.C. Information on the operation of the Public Reference Room may be obtained by calling 800.SEC.0330. Each fund's complete schedule of portfolio holdings, as filed on Form N-Q, can also be obtained without charge, upon request, by calling 800.345.6611.
Annual Report 2013
37

Columbia Small Cap Growth Fund II
P.O. Box 8081
Boston, MA 02266-8081
columbiamanagement.com
This information is for use with concurrent or prior delivery of a fund prospectus. Please read and consider the investment objectives, risks, charges and expenses for any fund carefully before investing. For a prospectus which contains this and other important information about the Fund go to columbiamanagement.com. The Fund is distributed by Columbia Management Investment Distributors, Inc., member FINRA, and managed by Columbia Management Investment Advisers, LLC.
© 2013 Columbia Management Investment Advisers, LLC. All rights reserved.
ANN227_02_C01_(04/13)
Annual Report
February 28, 2013

Columbia Large Cap Value Fund
Not FDIC insured • No bank guarantee • May lose value
Columbia Large Cap Value Fund
 Dear Shareholders,
U.S. stocks flat, foreign markets strong in 2012 finale
After a strong third quarter, U.S. stock market averages treaded water as the year 2012 came to a close. However, they ended the year up strongly, as first- and third-quarter gains more than offset second- and fourth-quarter weakness. Typically a strong quarter for domestic small- and mid-cap issues, the fourth quarter of 2012 indeed proved to be another year-end positive for small-cap stocks. For the full calendar year 2012, the S&P 500 Index rose 16.00%.
Stock markets outside the United States generated some of the best returns for the fourth quarter, as optimism rebounded, thanks to the September actions of the European Central Bank in support of the euro and an improving outlook from China. Both developed and emerging foreign markets topped U.S. stocks by a solid margin.
Corporate and emerging markets led fixed income
Fixed-income investors took their cue from the equity markets and continued to favor the highest risk sectors through the end of 2012. Global fixed-income returns posted mixed results in the final quarter of the year. Gains were the highest for corporate high-yield and emerging market bonds. Although investors remained cautious ahead of the year-end budget negotiations, better economic data and a further improvement in the European sovereign debt crisis supported riskier assets and depressed government bond prices. In December, the Federal Reserve announced its intention to continue to purchase both Treasury and mortgage-backed securities and said that it would seek to keep short-term interest rates unchanged until the unemployment rate reaches 6.5%, or inflation turned noticeably higher.
Stay on track with Columbia Management
Backed by more than 100 years of experience, Columbia Management is one of the nation's largest asset managers. At the heart of our success — and, most importantly, that of our investors — are highly talented industry professionals, brought together by a unique way of working. We are dedicated to helping you take advantage of today's opportunities and anticipate tomorrow's. We stay abreast of the latest investment trends and ideas, using our collective insight to evaluate events and transform them into solutions you can use.
Visit columbiamanagement.com for:
> The Columbia Management Perspectives blog, featuring timely posts by our investment teams
> Detailed up-to-date fund performance and portfolio information
> Economic analysis and market commentary
> Quarterly fund commentaries
> Columbia Management Investor, our award-winning quarterly newsletter for shareholders
Thank you for your continued support of the Columbia Funds. We look forward to serving your investment needs for many years to come.
Best Regards,

J. Kevin Connaughton
President, Columbia Funds
The S&P 500 Index, an unmanaged index, measures the performance of 500 widely held, large-capitalization U.S. stocks and is frequently used as a general measure of market performance. Indices are not available for investment, are not professionally managed and do not reflect sales charges, fees, brokerage commissions, taxes or other expenses of investing.
Investors should consider the investment objectives, risks, charges and expenses of a mutual fund carefully before investing. For a free prospectus, which contains this and other important information about a fund, visit columbiamanagement.com. The prospectus should be read carefully before investing.
Columbia Funds are distributed by Columbia Management Investment Distributors, Inc., member FINRA, and managed by Columbia Management Investment Advisers, LLC.
© 2013 Columbia Management Investment Advisers, LLC. All rights reserved.
Columbia Large Cap Value Fund
Performance Overview | | | 2 | | |
Manager Discussion of Fund Performance | | | 4 | | |
Understanding Your Fund's Expenses | | | 6 | | |
Portfolio of Investments | | | 7 | | |
Statement of Assets and Liabilities | | | 12 | | |
Statement of Operations | | | 14 | | |
Statement of Changes in Net Assets | | | 15 | | |
Financial Highlights | | | 17 | | |
Notes to Financial Statements | | | 25 | | |
Report of Independent Registered
Public Accounting Firm | | | 33 | | |
Federal Income Tax Information | | | 34 | | |
Trustees and Officers | | | 35 | | |
Shareholder Meeting Results | | | 40 | | |
Important Information About This Report | | | 41 | | |
Fund Investment Manager
Columbia Management Investment
Advisers, LLC
225 Franklin Street
Boston, MA 02110
Fund Distributor
Columbia Management Investment
Distributors, Inc.
225 Franklin Street
Boston, MA 02110
Fund Transfer Agent
Columbia Management Investment
Services Corp.
P.O. Box 8081
Boston, MA 02266-8081
For more information about any of the funds, please visit columbiamanagement.com or call 800.345.6611. Customer Service Representatives are available to answer your questions Monday through Friday from 8 a.m. to 8 p.m. Eastern time.
The views expressed in this report reflect the current views of the respective parties. These views are not guarantees of future performance and involve certain risks, uncertainties and assumptions that are difficult to predict, so actual outcomes and results may differ significantly from the views expressed. These views are subject to change at any time based upon economic, market or other conditions and the respective parties disclaim any responsibility to update such views. These views may not be relied on as investment advice and, because investment decisions for a Columbia Fund are based on numerous factors, may not be relied on as an indication of trading intent on behalf of any particular Columbia Fund. References to specific securities should not be construed as a recommendation or investment advice.
Columbia Large Cap Value Fund
Performance Summary
> Columbia Large Cap Value Fund (the Fund) Class A shares returned 11.78% excluding sales charges for the 12-month period that ended February 28, 2013.
> The Fund underperformed its benchmark, the Russell 1000 Value Index, which returned 17.63% for the same 12-month period.
> The Fund's stock selections lagged the benchmark in a number of key industry groups.
Average Annual Total Returns (%) (for period ended February 28, 2013)
| | Inception | | 1 Year | | 5 Years | | 10 Years | |
Class A | | 12/06/89 | | | | | | | |
Excluding sales charges | | | | | | | 11.78 | | | | 2.06 | | | | 7.46 | | |
Including sales charges | | | | | | | 5.35 | | | | 0.86 | | | | 6.82 | | |
Class B | | 06/07/93 | | | | | | | |
Excluding sales charges | | | | | | | 10.95 | | | | 1.27 | | | | 6.63 | | |
Including sales charges | | | | | | | 5.95 | | | | 0.89 | | | | 6.63 | | |
Class C | | 06/17/92 | | | | | | | |
Excluding sales charges | | | | | | | 10.85 | | | | 1.27 | | | | 6.63 | | |
Including sales charges | | | | | | | 9.85 | | | | 1.27 | | | | 6.63 | | |
Class I* | | 09/27/10 | | | 12.15 | | | | 2.38 | | | | 7.75 | | |
Class R* | | 01/23/06 | | | 11.43 | | | | 1.81 | | | | 7.18 | | |
Class W* | | 09/27/10 | | | 11.78 | | | | 2.03 | | | | 7.42 | | |
Class Y* | | 07/15/09 | | | 12.15 | | | | 2.42 | | | | 7.78 | | |
Class Z | | 09/19/89 | | | 12.04 | | | | 2.29 | | | | 7.71 | | |
Russell 1000 Value Index | | | | | | | 17.63 | | | | 3.88 | | | | 8.77 | | |
Returns for Class A are shown with and without the maximum initial sales charge of 5.75%. Returns for Class B are shown with and without the applicable contingent deferred sales charge (CDSC) of 5.00% in the first year, declining to 1.00% in the sixth year and eliminated thereafter. Returns for Class C are shown with and without the 1.00% CDSC for the first year only. The Fund's other classes are not subject to sales charges and have limited eligibility. Please see the Fund's prospectuses for details. Performance for different share classes will vary based on differences in sales charges and fees associated with each class. All results shown assume reinvestment of distributions during the period. Returns do not reflect the deduction of taxes that a shareholder may pay on Fund distributions or on the redemption of Fund shares. Performance results reflect the effect of any fee waivers or reimbursements of Fund expenses by Columbia Management Investment Advisers, LLC and/or any of its affiliates. Absent these fee waivers or expense reimbursement arrangements, performance results would have been lower.
The performance information shown represents past performance and is not a guarantee of future results. The investment return and principal value of your investment will fluctuate so that your shares, when redeemed, may be worth more or less than their original cost. Current performance may be lower or higher than the performance information shown. You may obtain performance information current to the most recent month-end by contacting your financial intermediary, visiting columbiamanagement.com or calling 800.345.6611.
*The returns shown for periods prior to the share class inception date (including returns for the Life of the Fund, if shown, which are since Fund inception) include the returns of the Fund's oldest share class. These returns are adjusted to reflect any higher class-related operating expenses of the newer share classes, as applicable. Please visit columbiamanagement.com/mutual-funds/appended-performance for more information.
The Russell 1000 Value Index, an unmanaged index, measures the performance of those stocks in the Russell 1000 Index with lower price-to-book ratios and lower forecasted growth values.
Indices are not available for investment, are not professionally managed and do not reflect sales charges, fees, brokerage commissions, taxes or other expenses of investing. Securities in the Fund may not match those in an index.
Annual Report 2013
2
Columbia Large Cap Value Fund
Performance Overview (continued)
Performance of a Hypothetical $10,000 Investment (March 1, 2003 – February 28, 2013)
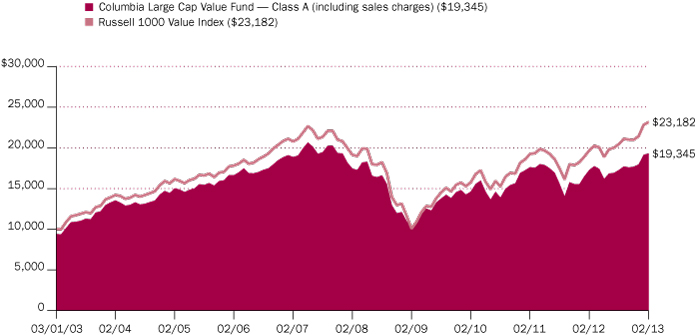
The chart above shows the change in value of a hypothetical $10,000 investment in Class A shares of Columbia Large Cap Value Fund during the stated time period, and does not reflect the deduction of taxes that a shareholder may pay on Fund distributions or on the redemption of Fund shares.
Annual Report 2013
3
Columbia Large Cap Value Fund
Manager Discussion of Fund Performance
For the 12-month period that ended February 28, 2013, the Fund's Class A shares returned 11.78% excluding sales charges. The Fund underperformed its benchmark, the Russell 1000 Value Index, which returned 17.63% for the same 12-month period. Stock selections in a number of key industry groups lagged the benchmark and generally accounted for the performance shortfall.
Investors Shrug Off Weak Global Growth
Europe's economic woes and U.S. struggles to avoid a fiscal cliff of tax increases and spending cuts weighed on the global economy during the 12-month period ended February 28, 2013. Yet, investors chose to look beyond the numbers and came in from the sidelines to bid stock prices significantly higher. Favorable central bank action in key markets and improving prospects for the U.S. economy gave investors confidence to favor stocks and other riskier assets. The U.S. economy expanded at a pace of just 1.6% in 2012. However, a pickup in job growth early in 2013 and steady manufacturing activity were encouraging signs. The U.S. housing market staged a solid comeback, with higher home sales, rising prices and lower inventories. Meanwhile, much of Europe headed toward recession. So far, the United Kingdom has avoided recession — but only barely so — and Japan's economy slipped into negative territory for the fifth time in 15 years. Major emerging market economies, including China, forged ahead, although mostly at a slower pace. Against this backdrop, U.S. stocks registered impressive gains for the 12-month period.
Selection in Four Key Sectors Detracted from Returns
The industrials sector was perhaps the Fund's biggest disappointment during the 12-month period. Although the sector outperformed the market, the Fund's investments in Caterpillar and Parker Hannifin were a significant drag on performance. Caterpillar, which derives the majority of its earnings from international operations, was especially vulnerable to a slowdown in demand in Europe, Latin America and China. Stock selection within the consumer staples sector was also a negative factor. Shares of tobacco company Lorillard, which began the period as a major holding of the Fund, declined when the company found itself unable to raise prices high enough to combat declining sales volumes. In response to these deteriorating fundamentals, we sold more than 50 percent of the Fund's holdings in Lorillard during the period. Stock selection in the energy and materials sectors also detracted from overall results.
A Bright Spot in Financials
The Fund did well with stock selection in the financials sector. Holdings such as Bank of America, Goldman Sachs, and JP Morgan overcame what had been extremely negative investor sentiment and staged a strong rally during the second half of the period. The Fund, which had built positions in these companies when their shares traded at steep discounts to book value, participated fully in this rally. Before the period was through, the Fund had added to its financial holdings, notably through purchases of Citigroup, Travelers and Wells Fargo.
In positioning the Fund for the future, we added to an already overweight position in health care, investing in such names as Amgen, Express Scripts and Roche. We are optimistic that the full implementation of the Affordable Care Act will help the bottom lines of many companies in this sector. On the sell side, the Fund pared positions in several technology firms, including Microsoft and Intel,
Portfolio Management
Paul Stocking
Steve Schroll
Dean Ramos, CFA
Effective March 11, 2013, Mr. Ramus became a member of the portfolio management replacing Laton Spahr.
Morningstar Style BoxTM

The Morningstar Style BoxTM is based on a fund's portfolio holdings. For equity funds, the vertical axis shows the market capitalization of the stocks owned, and the horizontal axis shows investment style (value, blend, or growth). Information shown is based on the most recent data provided by Morningstar.
© 2013 Morningstar, Inc. All rights reserved. The Morningstar information contained herein: (1) is proprietary to Morningstar and/or its content providers; (2) may not be copied or distributed; and (3) is not warranted to be accurate, complete or timely. Neither Morningstar nor its content providers are responsible for any damages or losses arising from any use of this information.
Annual Report 2013
4
Columbia Large Cap Value Fund
Manager Discussion of Fund Performance (continued)
and also eliminated its positions in LSI, Apple and Nokia. The common theme in these sales was a concern about these companies' ability to maintain their market share in new platforms.
Top Ten Holdings (%)
(at Febraury 28, 2013) | |
JPMorgan Chase & Co. | | | 3.3 | | |
Wells Fargo & Co. | | | 3.2 | | |
Pfizer, Inc. | | | 2.9 | | |
General Electric Co. | | | 2.7 | | |
Johnson & Johnson | | | 2.4 | | |
Goldman Sachs Group, Inc. (The) | | | 2.3 | | |
ACE Ltd. | | | 2.3 | | |
XL Group PLC | | | 2.2 | | |
Chevron Corp. | | | 2.1 | | |
Procter & Gamble Co. (The) | | | 2.1 | | |
Percentages indicated are based upon total investments (excluding Money Market Funds).
For further detail about these holdings, please refer to the section entitled "Portfolio of Investments."
Fund holdings are as of the date given, are subject to change at any time, and are not recommendations to buy or sell any security.
Portfolio Breakdown (%)
(at Febraury 28, 2013) | |
Common Stocks | | | 99.9 | | |
Consumer Discretionary | | | 10.4 | | |
Consumer Staples | | | 8.4 | | |
Energy | | | 11.5 | | |
Financials | | | 23.9 | | |
Health Care | | | 15.9 | | |
Industrials | | | 13.1 | | |
Information Technology | | | 8.3 | | |
Materials | | | 3.0 | | |
Telecommunication Services | | | 3.1 | | |
Utilities | | | 2.3 | | |
Money Market Funds | | | 0.1 | | |
Total | | | 100.0 | | |
Percentages indicated are based upon total investments. The Fund's portfolio composition is subject to change.
Annual Report 2013
5
Columbia Large Cap Value Fund
Understanding Your Fund's Expenses
(Unaudited)
As an investor, you incur two types of costs. There are transaction costs, which generally include sales charges on purchases and may include redemption fees. There are also ongoing costs, which generally include management fees, distribution and service (Rule 12b-1) fees, and other fund expenses. The following information is intended to help you understand your ongoing costs (in dollars) of investing in the Fund and to help you compare these costs with the ongoing costs of investing in other mutual funds.
Analyzing Your Fund's Expenses
To illustrate these ongoing costs, we have provided examples and calculated the expenses paid by investors in each share class of the Fund during the period. The actual and hypothetical information in the table is based on an initial investment of $1,000 at the beginning of the period indicated and held for the entire period. Expense information is calculated two ways and each method provides you with different information. The amount listed in the "Actual" column is calculated using the Fund's actual operating expenses and total return for the period. You may use the Actual information, together with the amount invested, to estimate the expenses that you paid over the period. Simply divide your account value by $1,000 (for example, an $8,600 account value divided by $1,000 = 8.6), then multiply the results by the expenses paid during the period under the Actual column. The amount listed in the "Hypothetical" column assumes a 5% annual rate of return before expenses (which is not the Fund's actual return) and then applies the Fund's actual expense ratio for the period to the hypothetical return. You should not use the hypothetical account values and expenses to estimate either your actual account balance at the end of the period or the expenses you paid during the period. See "Compare With Other Funds" below for details on how to use the hypothetical data.
Compare With Other Funds
Since all mutual funds are required to include the same hypothetical calculations about expenses in shareholder reports, you can use this information to compare the ongoing cost of investing in the Fund with other funds. To do so, compare the hypothetical example with the 5% hypothetical examples that appear in the shareholder reports of other funds. As you compare hypothetical examples of other funds, it is important to note that hypothetical examples are meant to highlight the ongoing costs of investing in a fund only and do not reflect any transaction costs, such as sales charges, or redemption or exchange fees. Therefore, the hypothetical calculations are useful in comparing ongoing costs only, and will not help you determine the relative total costs of owning different funds. If transaction costs were included in these calculations, your costs would be higher.
September 1, 2012 – February 28, 2013
| | Account Value at the Beginning
of the Period ($) | | Account Value at the End of the
Period ($) | | Expenses Paid During the
Period ($) | | Fund's Annualized
Expense Ratio (%) | |
| | Actual | | Hypothetical | | Actual | | Hypothetical | | Actual | | Hypothetical | | Actual | |
Class A | | | 1,000.00 | | | | 1,000.00 | | | | 1,117.90 | | | | 1,018.94 | | | | 6.20 | | | | 5.91 | | | | 1.18 | | |
Class B | | | 1,000.00 | | | | 1,000.00 | | | | 1,113.90 | | | | 1,015.22 | | | | 10.12 | | | | 9.64 | | | | 1.93 | | |
Class C | | | 1,000.00 | | | | 1,000.00 | | | | 1,112.80 | | | | 1,015.22 | | | | 10.11 | | | | 9.64 | | | | 1.93 | | |
Class I | | | 1,000.00 | | | | 1,000.00 | | | | 1,119.50 | | | | 1,021.03 | | | | 3.99 | | | | 3.81 | | | | 0.76 | | |
Class R | | | 1,000.00 | | | | 1,000.00 | | | | 1,116.70 | | | | 1,017.70 | | | | 7.51 | | | | 7.15 | | | | 1.43 | | |
Class W | | | 1,000.00 | | | | 1,000.00 | | | | 1,117.90 | | | | 1,018.94 | | | | 6.20 | | | | 5.91 | | | | 1.18 | | |
Class Y | | | 1,000.00 | | | | 1,000.00 | | | | 1,119.60 | | | | 1,021.03 | | | | 3.99 | | | | 3.81 | | | | 0.76 | | |
Class Z | | | 1,000.00 | | | | 1,000.00 | | | | 1,119.10 | | | | 1,020.18 | | | | 4.89 | | | | 4.66 | | | | 0.93 | | |
Expenses paid during the period are equal to the annualized expense ratio for each class as indicated above, multiplied by the average account value over the period and then multiplied by the number of days in the Fund's most recent fiscal half year and divided by 365.
Expenses do not include fees and expenses incurred indirectly by the Fund from the underlying funds in which the Fund may invest (also referred to as "acquired funds"), including affiliated and non-affiliated pooled investment vehicles (including mutual funds and exchange-traded funds).
Had Columbia Management Investment Advisers, LLC and/or certain of its affiliates not waived/reimbursed certain fees and expenses, account value at the end of the period would have been reduced.
Annual Report 2013
6
Columbia Large Cap Value Fund
Portfolio of Investments
February 28, 2013
(Percentages represent value of investments compared to net assets)
Common Stocks 98.3%
Issuer | | Shares | | Value ($) | |
Consumer Discretionary 10.2% | |
Automobiles 0.9% | |
Ford Motor Co. | | | 473,636 | | | | 5,972,550 | | |
Hotels, Restaurants & Leisure 1.2% | |
Carnival Corp. | | | 111,460 | | | | 3,986,924 | | |
McDonald's Corp. | | | 35,982 | | | | 3,450,674 | | |
Total | | | | | 7,437,598 | | |
Media 4.4% | |
Comcast Corp., Class A | | | 155,334 | | | | 6,180,740 | | |
News Corp., Class A | | | 138,453 | | | | 3,987,446 | | |
Time Warner, Inc. | | | 132,597 | | | | 7,050,183 | | |
Viacom, Inc., Class B | | | 81,856 | | | | 4,785,302 | | |
Walt Disney Co. (The) | | | 90,900 | | | | 4,962,231 | | |
Total | | | | | 26,965,902 | | |
Multiline Retail 2.2% | |
Kohl's Corp. | | | 62,536 | | | | 2,882,910 | | |
Target Corp. | | | 167,811 | | | | 10,565,380 | | |
Total | | | | | 13,448,290 | | |
Specialty Retail 1.5% | |
Home Depot, Inc. (The) | | | 134,245 | | | | 9,195,782 | | |
Total Consumer Discretionary | | | | | 63,020,122 | | |
Consumer Staples 8.3% | |
Beverages 0.6% | |
PepsiCo, Inc. | | | 52,322 | | | | 3,964,438 | | |
Food & Staples Retailing 1.8% | |
SYSCO Corp. | | | 145,460 | | | | 4,677,994 | | |
Wal-Mart Stores, Inc. | | | 43,469 | | | | 3,076,736 | | |
Walgreen Co. | | | 78,209 | | | | 3,201,876 | | |
Total | | | | | 10,956,606 | | |
Food Products 2.0% | |
Hershey Co. (The) | | | 23,778 | | | | 1,981,659 | | |
Kellogg Co. | | | 101,453 | | | | 6,137,906 | | |
Kraft Foods Group, Inc. | | | 30,156 | | | | 1,461,661 | | |
Mondelez International, Inc., Class A | | | 90,471 | | | | 2,501,523 | | |
Total | | | | | 12,082,749 | | |
Household Products 2.0% | |
Procter & Gamble Co. (The) | | | 166,239 | | | | 12,664,087 | | |
Common Stocks (continued)
Issuer | | Shares | | Value ($) | |
Tobacco 1.9% | |
Lorillard, Inc. | | | 215,647 | | | | 8,311,035 | | |
Philip Morris International, Inc. | | | 34,649 | | | | 3,179,046 | | |
Total | | | | | 11,490,081 | | |
Total Consumer Staples | | | | | 51,157,961 | | |
Energy 11.3% | |
Energy Equipment & Services 2.2% | |
Cameron International Corp.(a) | | | 46,467 | | | | 2,960,877 | | |
National Oilwell Varco, Inc. | | | 40,127 | | | | 2,733,852 | | |
Schlumberger Ltd. | | | 78,995 | | | | 6,149,761 | | |
Seadrill Ltd. | | | 53,928 | | | | 1,977,540 | | |
Total | | | | | 13,822,030 | | |
Oil, Gas & Consumable Fuels 9.1% | |
Anadarko Petroleum Corp. | | | 38,816 | | | | 3,088,977 | | |
| BP PLC, ADR | | | 156,687 | | | | 6,330,155 | | |
Cameco Corp. | | | 118,191 | | | | 2,520,812 | | |
Chevron Corp. | | | 111,211 | | | | 13,028,369 | | |
Enbridge, Inc. | | | 33,559 | | | | 1,495,389 | | |
EQT Corp. | | | 59,322 | | | | 3,742,625 | | |
Occidental Petroleum Corp. | | | 61,812 | | | | 5,088,982 | | |
Phillips 66 | | | 59,382 | | | | 3,738,691 | | |
Pioneer Natural Resources Co. | | | 47,641 | | | | 5,993,714 | | |
Royal Dutch Shell PLC, ADR | | | 40,057 | | | | 2,629,742 | | |
Suncor Energy, Inc. | | | 163,054 | | | | 4,932,384 | | |
Valero Energy Corp. | | | 69,271 | | | | 3,158,065 | | |
Total | | | | | 55,747,905 | | |
Total Energy | | | | | 69,569,935 | | |
Financials 23.5% | |
Capital Markets 3.9% | |
BlackRock, Inc. | | | 11,207 | | | | 2,686,878 | | |
Goldman Sachs Group, Inc. (The) | | | 94,873 | | | | 14,208,181 | | |
Morgan Stanley | | | 315,762 | | | | 7,120,433 | | |
Total | | | | | 24,015,492 | | |
Commercial Banks 4.0% | |
CIT Group, Inc.(a) | | | 125,510 | | | | 5,253,848 | | |
Wells Fargo & Co. | | | 554,922 | | | | 19,466,664 | | |
Total | | | | | 24,720,512 | | |
The accompanying Notes to Financial Statements are an integral part of this statement.
Annual Report 2013
7
Columbia Large Cap Value Fund
Portfolio of Investments (continued)
February 28, 2013
Common Stocks (continued)
Issuer | | Shares | | Value ($) | |
Consumer Finance 0.5% | |
Capital One Financial Corp. | | | 58,249 | | | | 2,972,447 | | |
Diversified Financial Services 5.7% | |
Bank of America Corp. | | | 251,154 | | | | 2,820,459 | | |
Citigroup, Inc. | | | 291,252 | | | | 12,223,846 | | |
JPMorgan Chase & Co. | | | 412,656 | | | | 20,187,132 | | |
Total | | | | | 35,231,437 | | |
Insurance 9.4% | |
ACE Ltd. | | | 164,419 | | | | 14,039,738 | | |
Aflac, Inc. | | | 51,349 | | | | 2,564,883 | | |
American International Group, Inc.(a) | | | 25,629 | | | | 974,158 | | |
Everest Re Group Ltd. | | | 26,980 | | | | 3,361,978 | | |
MetLife, Inc. | | | 307,454 | | | | 10,896,170 | | |
Travelers Companies, Inc. (The) | | | 156,049 | | | | 12,549,461 | | |
XL Group PLC | | | 467,911 | | | | 13,400,971 | | |
Total | | | | | 57,787,359 | | |
Total Financials | | | | | 144,727,247 | | |
Health Care 15.7% | |
Biotechnology 0.6% | |
Amgen, Inc. | | | 40,304 | | | | 3,684,189 | | |
Health Care Equipment & Supplies 1.3% | |
Boston Scientific Corp.(a) | | | 532,278 | | | | 3,933,535 | | |
Medtronic, Inc. | | | 84,491 | | | | 3,798,715 | | |
Total | | | | | 7,732,250 | | |
Health Care Providers & Services 1.9% | |
Express Scripts Holding Co.(a) | | | 61,687 | | | | 3,510,607 | | |
UnitedHealth Group, Inc. | | | 134,495 | | | | 7,188,758 | | |
Universal Health Services, Inc., Class B | | | 22,300 | | | | 1,290,947 | | |
Total | | | | | 11,990,312 | | |
Life Sciences Tools & Services 1.7% | |
Agilent Technologies, Inc. | | | 63,569 | | | | 2,636,842 | | |
Thermo Fisher Scientific, Inc. | | | 104,751 | | | | 7,730,624 | | |
Total | | | | | 10,367,466 | | |
Pharmaceuticals 10.2% | |
AstraZeneca PLC, ADR | | | 69,252 | | | | 3,146,811 | | |
Bristol-Myers Squibb Co. | | | 218,028 | | | | 8,060,495 | | |
Johnson & Johnson | | | 191,234 | | | | 14,554,820 | | |
Common Stocks (continued)
Issuer | | Shares | | Value ($) | |
Merck & Co., Inc. | | | 257,083 | | | | 10,985,156 | | |
Novartis AG, ADR | | | 64,067 | | | | 4,343,743 | | |
Pfizer, Inc. | | | 645,298 | | | | 17,661,806 | | |
Roche Holding AG, ADR | | | 70,798 | | | | 4,061,681 | | |
Total | | | | | 62,814,512 | | |
Total Health Care | | | | | 96,588,729 | | |
Industrials 12.9% | |
Aerospace & Defense 3.3% | |
Boeing Co. (The) | | | 66,842 | | | | 5,140,150 | | |
Honeywell International, Inc. | | | 108,736 | | | | 7,622,393 | | |
United Technologies Corp. | | | 81,045 | | | | 7,338,625 | | |
Total | | | | | 20,101,168 | | |
Airlines 1.1% | |
Delta Air Lines, Inc.(a) | | | 133,828 | | | | 1,909,726 | | |
United Continental Holdings, Inc.(a) | | | 176,557 | | | | 4,715,837 | | |
Total | | | | | 6,625,563 | | |
Commercial Services & Supplies 1.4% | |
ADT Corp. (The) | | | 72,287 | | | | 3,461,824 | | |
Republic Services, Inc. | | | 101,318 | | | | 3,185,438 | | |
Tyco International Ltd. | | | 69,177 | | | | 2,214,356 | | |
Total | | | | | 8,861,618 | | |
Electrical Equipment 1.6% | |
ABB Ltd., ADR | | | 125,834 | | | | 2,858,948 | | |
Eaton Corp. PLC | | | 114,546 | | | | 7,098,416 | | |
Total | | | | | 9,957,364 | | |
Industrial Conglomerates 2.6% | |
General Electric Co. | | | 702,145 | | | | 16,303,807 | | |
Machinery 2.6% | |
Caterpillar, Inc. | | | 59,927 | | | | 5,535,457 | | |
Illinois Tool Works, Inc. | | | 48,663 | | | | 2,992,775 | | |
Joy Global, Inc. | | | 22,964 | | | | 1,454,540 | | |
Parker Hannifin Corp. | | | 41,873 | | | | 3,956,161 | | |
Pentair Ltd. | | | 35,360 | | | | 1,883,627 | | |
Total | | | | | 15,822,560 | | |
Road & Rail 0.3% | |
CSX Corp. | | | 75,914 | | | | 1,741,467 | | |
Total Industrials | | | | | 79,413,547 | | |
The accompanying Notes to Financial Statements are an integral part of this statement.
Annual Report 2013
8
Columbia Large Cap Value Fund
Portfolio of Investments (continued)
February 28, 2013
Common Stocks (continued)
Issuer | | Shares | | Value ($) | |
Information Technology 8.2% | |
Communications Equipment 2.0% | |
Cisco Systems, Inc. | | | 590,017 | | | | 12,301,855 | | |
Electronic Equipment, Instruments & Components 0.5% | |
TE Connectivity Ltd. | | | 68,870 | | | | 2,763,753 | | |
Internet Software & Services 0.6% | |
eBay, Inc.(a) | | | 68,800 | | | | 3,761,984 | | |
IT Services 1.0% | |
Accenture PLC, Class A | | | 45,506 | | | | 3,383,826 | | |
Mastercard, Inc., Class A | | | 5,856 | | | | 3,032,354 | | |
Total | | | | | 6,416,180 | | |
Semiconductors & Semiconductor Equipment 2.6% | |
Analog Devices, Inc. | | | 72,097 | | | | 3,260,226 | | |
Fairchild Semiconductor
International, Inc.(a) | | | 205,626 | | | | 2,932,227 | | |
Infineon Technologies, ADR | | | 172,978 | | | | 1,464,259 | | |
Intel Corp. | | | 171,816 | | | | 3,582,363 | | |
Microchip Technology, Inc. | | | 50,304 | | | | 1,834,587 | | |
ON Semiconductor Corp.(a) | | | 406,162 | | | | 3,249,296 | | |
Total | | | | | 16,322,958 | | |
Software 1.5% | |
Microsoft Corp. | | | 56,974 | | | | 1,583,877 | | |
Oracle Corp. | | | 218,930 | | | | 7,500,542 | | |
Total | | | | | 9,084,419 | | |
Total Information Technology | | | | | 50,651,149 | | |
Materials 2.9% | |
Chemicals 2.5% | |
Dow Chemical Co. (The) | | | 226,054 | | | | 7,170,433 | | |
LyondellBasell Industries NV, Class A | | | 39,055 | | | | 2,289,404 | | |
Mosaic Co. (The) | | | 101,039 | | | | 5,914,823 | | |
Total | | | | | 15,374,660 | | |
Common Stocks (continued)
Issuer | | Shares | | Value ($) | |
Paper & Forest Products 0.4% | |
International Paper Co. | | | 61,231 | | | | 2,694,776 | | |
Total Materials | | | | | 18,069,436 | | |
Telecommunication Services 3.0% | |
Diversified Telecommunication Services 3.0% | |
AT&T, Inc. | | | 267,416 | | | | 9,602,909 | | |
Deutsche Telekom AG, ADR | | | 274,620 | | | | 2,935,688 | | |
Verizon Communications, Inc. | | | 132,112 | | | | 6,147,171 | | |
Total | | | | | 18,685,768 | | |
Total Telecommunication Services | | | | | 18,685,768 | | |
Utilities 2.3% | |
Electric Utilities 0.6% | |
Duke Energy Corp. | | | 49,644 | | | | 3,437,847 | | |
Multi-Utilities 1.7% | |
Dominion Resources, Inc. | | | 52,693 | | | | 2,950,808 | | |
PG&E Corp. | | | 73,257 | | | | 3,123,679 | | |
Sempra Energy | | | 60,182 | | | | 4,679,752 | | |
Total | | | | | 10,754,239 | | |
Total Utilities | | | | | 14,192,086 | | |
Total Common Stocks
(Cost: $476,618,190) | | | | | 606,075,980 | | |
Money Market Funds 0.1%
| | Shares | | Value ($) | |
Columbia Short-Term Cash Fund,
0.128%(b)(c) | | | 661,713 | | | | 661,713 | | |
Total Money Market Funds
(Cost: $661,713) | | | | | 661,713 | | |
Total Investments
(Cost: $477,279,903) | | | | | 606,737,693 | | |
Other Assets & Liabilities, Net | | | | | 9,660,207 | | |
Net Assets | | | | | 616,397,900 | | |
Notes to Portfolio of Investments
(a) Non-income producing.
(b) The rate shown is the seven-day current annualized yield at February 28, 2013.
The accompanying Notes to Financial Statements are an integral part of this statement.
Annual Report 2013
9
Columbia Large Cap Value Fund
Portfolio of Investments (continued)
February 28, 2013
Notes to Portfolio of Investments (continued)
(c) As defined in the Investment Company Act of 1940, an affiliated company is one in which the Fund owns 5% or more of its outstanding voting securities, or a company which is under common ownership or control with the Fund. Holdings and transactions in these affiliated companies during the year ended February 28, 2013, are as follows:
Issuer | | Beginning
Cost ($) | | Purchase
Cost ($) | | Proceeds
From Sales ($) | | Ending
Cost ($) | | Dividends —
Affiliated
Issuers ($) | | Value ($) | |
Columbia Short-Term Cash Fund | | | 35,033,376 | | | | 792,741,718 | | | | (827,113,381 | ) | | | 661,713 | | | | 21,928 | | | | 661,713 | | |
Abbreviation Legend
ADR American Depositary Receipt
Fair Value Measurements
Generally accepted accounting principles (GAAP) require disclosure regarding the inputs and valuation techniques used to measure fair value and any changes in valuation inputs or techniques. In addition, investments shall be disclosed by major category.
The Fund categorizes its fair value measurements according to a three-level hierarchy that maximizes the use of observable inputs and minimizes the use of unobservable inputs by prioritizing that the most observable input be used when available. Observable inputs are those that market participants would use in pricing an investment based on market data obtained from sources independent of the reporting entity. Unobservable inputs are those that reflect the Fund's assumptions about the information market participants would use in pricing an investment. An investment's level within the fair value hierarchy is based on the lowest level of any input that is deemed significant to the asset or liability's fair value measurement. The input levels are not necessarily an indication of the risk or liquidity associated with investments at that level. For example, certain U.S. government securities are generally high quality and liquid, however, they are reflected as Level 2 because the inputs used to determine fair value may not always be quoted prices in an active market.
Fair value inputs are summarized in the three broad levels listed below:
> Level 1 — Valuations based on quoted prices for investments in active markets that the Fund has the ability to access at the measurement date (including NAV for open-end mutual funds). Valuation adjustments are not applied to Level 1 investments.
> Level 2 — Valuations based on other significant observable inputs (including quoted prices for similar securities, interest rates, prepayment speeds, credit risks, etc.).
> Level 3 — Valuations based on significant unobservable inputs (including the Fund's own assumptions and judgment in determining the fair value of investments).
Inputs that are used in determining fair value of an investment may include price information, credit data, volatility statistics, and other factors. These inputs can be either observable or unobservable. The availability of observable inputs can vary between investments, and is affected by various factors such as the type of investment, and the volume and level of activity for that investment or similar investments in the marketplace. The inputs will be considered by the Investment Manager, along with any other relevant factors in the calculation of an investment's fair value. The Fund uses prices and inputs that are current as of the measurement date, which may include periods of market dislocations. During these periods, the availability of prices and inputs may be reduced for many investments. This condition could cause an investment to be reclassified between the various levels within the hierarchy.
Investments falling into the Level 3 category are primarily supported by quoted prices from brokers and dealers participating in the market for those investments. However, these may be classified as Level 3 investments due to lack of market transparency and corroboration to support these quoted prices. Additionally, valuation models may be used as the pricing source for any remaining investments classified as Level 3. These models rely on one or more significant unobservable inputs and/or significant assumptions by the Investment Manager. Inputs used in valuations may include, but are not limited to, financial statement analysis, capital account balances, discount rates and estimated cash flows, and comparable company data.
Under the direction of the Fund's Board of Trustees (the Board), the Investment Manager's Valuation Committee (the Committee) is responsible for carrying out the valuation procedures approved by the Board. The Committee consists of voting and non-voting members from various groups within the Investment Manager's organization, including operations and accounting, trading and investments, compliance, risk management and legal.
The accompanying Notes to Financial Statements are an integral part of this statement.
Annual Report 2013
10
Columbia Large Cap Value Fund
Portfolio of Investments (continued)
February 28, 2013
Fair Value Measurements (continued)
The Committee meets at least monthly to review and approve valuation matters, which may include a description of specific valuation determinations, data regarding pricing information received from approved pricing vendors and brokers and the results of Board-approved valuation control policies and procedures (the Policies). The Policies address, among other things, instances when market quotations are readily available, including recommendations of third party pricing vendors and a determination of appropriate pricing methodologies; events that require specific valuation determinations and assessment of fair value techniques; securities with a potential for stale pricing, including those that are illiquid, restricted, or in default; and the effectiveness of third-party pricing vendors, including periodic reviews of vendors. The Committee meets more frequently, as needed, to discuss additional valuation matters, which may include the need to review back-testing results, review time-sensitive information or approve related valuation actions. The Committee reports to the Board, with members of the Committee meeting with the Board at each of its regularly scheduled meetings to discuss valuation matters and actions during the period, similar to those described earlier.
For investments categorized as Level 3, the Committee monitors information similar to that described above, which may include: (i) data specific to the issuer or comparable issuers, (ii) general market or specific sector news and (iii) quoted prices and specific or similar security transactions. The Committee considers this data and any changes from prior periods in order to assess the reasonableness of observable and unobservable inputs, any assumptions or internal models used to value those securities and changes in fair value. This data is also used to corroborate, when available, information received from approved pricing vendors and brokers. Various factors impact the frequency of monitoring this information (which may occur as often as daily). However, the Committee may determine that changes to inputs, assumptions and models are not required as a result of the monitoring procedures performed.
The following table is a summary of the inputs used to value the Fund's investments at February 28, 2013:
Description | | Level 1
Quoted Prices in Active
Markets for Identical
Assets ($) | | Level 2
Other Significant
Observable Inputs ($) | | Level 3
Significant
Unobservable Inputs ($) | | Total ($) | |
Equity Securities | |
Common Stocks | |
Consumer Discretionary | | | 63,020,122 | | | | — | | | | — | | | | 63,020,122 | | |
Consumer Staples | | | 51,157,961 | | | | — | | | | — | | | | 51,157,961 | | |
Energy | | | 69,569,935 | | | | — | | | | — | | | | 69,569,935 | | |
Financials | | | 144,727,247 | | | | — | | | | — | | | | 144,727,247 | | |
Health Care | | | 96,588,729 | | | | — | | | | — | | | | 96,588,729 | | |
Industrials | | | 79,413,547 | | | | — | | | | — | | | | 79,413,547 | | |
Information Technology | | | 50,651,149 | | | | — | | | | — | | | | 50,651,149 | | |
Materials | | | 18,069,436 | | | | — | | | | — | | | | 18,069,436 | | |
Telecommunication Services | | | 18,685,768 | | | | — | | | | — | | | | 18,685,768 | | |
Utilities | | | 14,192,086 | | | | — | | | | — | | | | 14,192,086 | | |
Total Equity Securities | | | 606,075,980 | | | | — | | | | — | | | | 606,075,980 | | |
Other | |
Money Market Funds | | | 661,713 | | | | — | | | | — | | | | 661,713 | | |
Total Other | | | 661,713 | | | | — | | | | — | | | | 661,713 | | |
Total | | | 606,737,693 | | | | — | | | | — | | | | 606,737,693 | | |
See the Portfolio of Investments for all investment classifications not indicated in the table.
There were no transfers of financial assets between Levels 1 and 2 during the period.
The accompanying Notes to Financial Statements are an integral part of this statement.
Annual Report 2013
11
Columbia Large Cap Value Fund
Statement of Assets and Liabilities
February 28, 2013
Assets | |
Investments, at value | |
Unaffiliated issuers (identified cost $476,618,190) | | $ | 606,075,980 | | |
Affiliated issuers (identified cost $661,713) | | | 661,713 | | |
Total investments (identified cost $477,279,903) | | | 606,737,693 | | |
Cash | | | 535 | | |
Receivable for: | |
Investments sold | | | 9,432,187 | | |
Capital shares sold | | | 120,584 | | |
Dividends | | | 2,089,688 | | |
Reclaims | | | 33,193 | | |
Expense reimbursement due from Investment Manager | | | 1,038 | | |
Prepaid expenses | | | 2,948 | | |
Total assets | | | 618,417,866 | | |
Liabilities | |
Payable for: | |
Capital shares purchased | | | 1,666,397 | | |
Investment management fees | | | 11,905 | | |
Distribution and/or service fees | | | 3,653 | | |
Transfer agent fees | | | 106,629 | | |
Administration fees | | | 1,002 | | |
Compensation of board members | | | 118,362 | | |
Other expenses | | | 112,018 | | |
Total liabilities | | | 2,019,966 | | |
Net assets applicable to outstanding capital stock | | $ | 616,397,900 | | |
Represented by | |
Paid-in capital | | $ | 802,850,415 | | |
Undistributed net investment income | | | 1,403,285 | | |
Accumulated net realized loss | | | (317,313,301 | ) | |
Unrealized appreciation (depreciation) on: | |
Investments | | | 129,457,790 | | |
Foreign currency translations | | | (289 | ) | |
Total — representing net assets applicable to outstanding capital stock | | $ | 616,397,900 | | |
The accompanying Notes to Financial Statements are an integral part of this statement.
Annual Report 2013
12
Columbia Large Cap Value Fund
Statement of Assets and Liabilities (continued)
February 28, 2013
Class A | |
Net assets | | $ | 394,732,482 | | |
Shares outstanding | | | 30,845,423 | | |
Net asset value per share | | $ | 12.80 | | |
Maximum offering price per share(a) | | $ | 13.58 | | |
Class B | |
Net assets | | $ | 9,507,815 | | |
Shares outstanding | | | 772,919 | | |
Net asset value per share | | $ | 12.30 | | |
Class C | |
Net assets | | $ | 24,376,121 | | |
Shares outstanding | | | 1,981,101 | | |
Net asset value per share | | $ | 12.30 | | |
Class I | |
Net assets | | $ | 3,141 | | |
Shares outstanding | | | 244 | | |
Net asset value per share(b) | | $ | 12.85 | | |
Class R | |
Net assets | | $ | 724,550 | | |
Shares outstanding | | | 56,653 | | |
Net asset value per share | | $ | 12.79 | | |
Class W | |
Net assets | | $ | 3,134 | | |
Shares outstanding | | | 245 | | |
Net asset value per share(b) | | $ | 12.80 | | |
Class Y | |
Net assets | | $ | 7,416,897 | | |
Shares outstanding | | | 577,541 | | |
Net asset value per share | | $ | 12.84 | | |
Class Z | |
Net assets | | $ | 179,633,760 | | |
Shares outstanding | | | 14,010,116 | | |
Net asset value per share | | $ | 12.82 | | |
(a) The maximum offering price per share is calculated by dividing the net asset value by 1.0 minus the maximum sales charge of 5.75%.
(b) Net asset value per share rounds to this amount due to fractional shares outstanding.
The accompanying Notes to Financial Statements are an integral part of this statement.
Annual Report 2013
13
Columbia Large Cap Value Fund
Statement of Operations
Year Ended February 28, 2013
Net investment income | |
Income: | |
Dividends — unaffiliated issuers | | $ | 20,447,858 | | |
Dividends — affiliated issuers | | | 21,928 | | |
Interest | | | 25,359 | | |
Income from securities lending — net | | | 102,822 | | |
Foreign taxes withheld | | | (110,824 | ) | |
Total income | | | 20,487,143 | | |
Expenses: | |
Investment management fees | | | 5,637,656 | | |
Distribution and/or service fees | |
Class A | | | 976,920 | | |
Class B | | | 117,282 | | |
Class C | | | 242,609 | | |
Class R | | | 3,385 | | |
Class W | | | 7 | | |
Transfer agent fees | |
Class A | | | 793,005 | | |
Class B | | | 23,597 | | |
Class C | | | 49,207 | | |
Class R | | | 1,356 | | |
Class W | | | 6 | | |
Class Y | | | 13 | | |
Class Z | | | 738,073 | | |
Administration fees | | | 471,796 | | |
Compensation of board members | | | 41,904 | | |
Custodian fees | | | 10,090 | | |
Printing and postage fees | | | 172,978 | | |
Registration fees | | | 124,112 | | |
Professional fees | | | 32,900 | | |
Other | | | 47,792 | | |
Total expenses | | | 9,484,688 | | |
Fees waived or expenses reimbursed by Investment Manager and its affiliates | | | (751,090 | ) | |
Expense reductions | | | (24,534 | ) | |
Total net expenses | | | 8,709,064 | | |
Net investment income | | | 11,778,079 | | |
Realized and unrealized gain (loss) — net | |
Net realized gain (loss) on: | |
Investments | | | 107,501,334 | | |
Foreign currency translations | | | 857 | | |
Futures contracts | | | (5,464,381 | ) | |
Net realized gain | | | 102,037,810 | | |
Net change in unrealized appreciation (depreciation) on: | |
Investments | | | (52,724,020 | ) | |
Foreign currency translations | | | (289 | ) | |
Net change in unrealized appreciation (depreciation) | | | (52,724,309 | ) | |
Net realized and unrealized gain | | | 49,313,501 | | |
Net increase in net assets resulting from operations | | $ | 61,091,580 | | |
The accompanying Notes to Financial Statements are an integral part of this statement.
Annual Report 2013
14
Columbia Large Cap Value Fund
Statement of Changes in Net Assets
| | | Year Ended
February 28,
2013 | | Year Ended
February 29,
2012 | |
Operations | |
Net investment income | | $ | 11,778,079 | | | $ | 20,667,252 | | |
Net realized gain | | | 102,037,810 | | | | 219,249,955 | | |
Net change in unrealized appreciation (depreciation) | | | (52,724,309 | ) | | | (302,758,214 | ) | |
Net increase (decrease) in net assets resulting from operations | | | 61,091,580 | | | | (62,841,007 | ) | |
Distributions to shareholders | |
Net investment income | |
Class A | | | (6,384,012 | ) | | | (3,791,237 | ) | |
Class B | | | (107,779 | ) | | | (56,167 | ) | |
Class C | | | (223,661 | ) | | | (72,197 | ) | |
Class I | | | (57 | ) | | | (247,786 | ) | |
Class R | | | (9,812 | ) | | | (7,381 | ) | |
Class W | | | (47 | ) | | | (27 | ) | |
Class Y | | | (132,791 | ) | | | (79,940 | ) | |
Class Z | | | (7,665,930 | ) | | | (12,189,936 | ) | |
Total distributions to shareholders | | | (14,524,089 | ) | | | (16,444,671 | ) | |
Increase (decrease) in net assets from capital stock activity | | | (921,819,017 | ) | | | (523,674,599 | ) | |
Proceeds from regulatory settlements (Note 6) | | | — | | | | 7,701 | | |
Total decrease in net assets | | | (875,251,526 | ) | | | (602,952,576 | ) | |
Net assets at beginning of year | | | 1,491,649,426 | | | | 2,094,602,002 | | |
Net assets at end of year | | $ | 616,397,900 | | | $ | 1,491,649,426 | | |
Undistributed net investment income | | $ | 1,403,285 | | | $ | 4,148,438 | | |
The accompanying Notes to Financial Statements are an integral part of this statement.
Annual Report 2013
15
Columbia Large Cap Value Fund
Statement of Changes in Net Assets (continued)
| | | Year Ended February 28, 2013 | | Year Ended February 29, 2012 | |
| | | Shares | | Dollars ($) | | Shares | | Dollars ($) | |
Capital stock activity | |
Class A shares | |
Subscriptions(a) | | | 1,160,059 | | | | 13,544,000 | | | | 2,516,984 | | | | 28,006,998 | | |
Distributions reinvested | | | 451,055 | | | | 5,236,994 | | | | 286,957 | | | | 3,023,396 | | |
Redemptions | | | (6,759,884 | ) | | | (79,096,265 | ) | | | (10,020,773 | ) | | | (110,684,735 | ) | |
Net decrease | | | (5,148,770 | ) | | | (60,315,271 | ) | | | (7,216,832 | ) | | | (79,654,341 | ) | |
Class B shares | |
Subscriptions | | | 7,189 | | | | 81,517 | | | | 12,309 | | | | 132,984 | | |
Distributions reinvested | | | 8,123 | | | | 90,585 | | | | 4,559 | | | | 44,511 | | |
Redemptions(a) | | | (715,567 | ) | | | (8,065,868 | ) | | | (2,284,160 | ) | | | (24,546,532 | ) | |
Net decrease | | | (700,255 | ) | | | (7,893,766 | ) | | | (2,267,292 | ) | | | (24,369,037 | ) | |
Class C shares | |
Subscriptions | | | 139,175 | | | | 1,580,453 | | | | 137,370 | | | | 1,461,967 | | |
Distributions reinvested | | | 15,847 | | | | 176,811 | | | | 5,696 | | | | 55,644 | | |
Redemptions | | | (520,751 | ) | | | (5,840,852 | ) | | | (931,321 | ) | | | (9,936,545 | ) | |
Net decrease | | | (365,729 | ) | | | (4,083,588 | ) | | | (788,255 | ) | | | (8,418,934 | ) | |
Class I shares | |
Subscriptions | | | — | | | | — | | | | 208,708 | | | | 2,492,014 | | |
Distributions reinvested | | | — | | | | — | | | | 21,122 | | | | 247,752 | | |
Redemptions | | | — | | | | — | | | | (10,457,952 | ) | | | (123,524,428 | ) | |
Net increase (decrease) | | | — | | | | — | | | | (10,228,122 | ) | | | (120,784,662 | ) | |
Class R shares | |
Subscriptions | | | 40,305 | | | | 488,171 | | | | 52,204 | | | | 568,939 | | |
Distributions reinvested | | | 792 | | | | 9,237 | | | | 707 | | | | 7,351 | | |
Redemptions | | | (106,451 | ) | | | (1,249,573 | ) | | | (31,949 | ) | | | (351,744 | ) | |
Net increase (decrease) | | | (65,354 | ) | | | (752,165 | ) | | | 20,962 | | | | 224,546 | | |
Class Y shares | |
Subscriptions | | | 15,975 | | | | 187,500 | | | | 28,100 | | | | 289,000 | | |
Distributions reinvested | | | 5 | | | | 54 | | | | 15 | | | | 162 | | |
Redemptions | | | (3,921 | ) | | | (45,967 | ) | | | (56,388 | ) | | | (595,126 | ) | |
Net increase (decrease) | | | 12,059 | | | | 141,587 | | | | (28,273 | ) | | | (305,964 | ) | |
Class Z shares | |
Subscriptions | | | 1,232,472 | | | | 14,429,406 | | | | 8,668,714 | | | | 95,993,762 | | |
Distributions reinvested | | | 253,102 | | | | 2,972,403 | | | | 775,119 | | | | 8,249,986 | | |
Redemptions | | | (75,102,654 | ) | | | (866,317,623 | ) | | | (35,561,203 | ) | | | (394,609,955 | ) | |
Net decrease | | | (73,617,080 | ) | | | (848,915,814 | ) | | | (26,117,370 | ) | | | (290,366,207 | ) | |
Total net decrease | | | (79,885,129 | ) | | | (921,819,017 | ) | | | (46,625,182 | ) | | | (523,674,599 | ) | |
(a) Includes conversions of Class B shares to Class A shares, if any.
The accompanying Notes to Financial Statements are an integral part of this statement.
Annual Report 2013
16
Columbia Large Cap Value Fund
The following tables are intended to help you understand the Fund's financial performance. Certain information reflects financial results for a single share of a class held for the periods shown. Per share net investment income (loss) amounts are calculated based on average shares outstanding during the period. Total return assumes reinvestment of all dividends and distributions, if any. Total return does not reflect payment of sales charges, if any, and is not annualized for periods of less than one year.
| | | Year Ended
February 28, | | Year Ended
February 29, | | Year Ended February 28, | |
Class A | | 2013 | | 2012 | | 2011 | | 2010 | | 2009 | |
Per share data | |
Net asset value, beginning of period | | $ | 11.64 | | | $ | 11.98 | | | $ | 10.07 | | | $ | 7.00 | | | $ | 12.37 | | |
Income from investment operations: | |
Net investment income | | | 0.17 | | | | 0.12 | | | | 0.11 | (a) | | | 0.09 | | | | 0.18 | | |
Net realized and unrealized gain (loss) | | | 1.18 | | | | (0.36 | ) | | | 1.93 | | | | 3.08 | | | | (5.36 | ) | |
Total from investment operations | | | 1.35 | | | | (0.24 | ) | | | 2.04 | | | | 3.17 | | | | (5.18 | ) | |
Less distributions to shareholders: | |
Net investment income | | | (0.19 | ) | | | (0.10 | ) | | | (0.13 | ) | | | (0.10 | ) | | | (0.19 | ) | |
Total distributions to shareholders | | | (0.19 | ) | | | (0.10 | ) | | | (0.13 | ) | | | (0.10 | ) | | | (0.19 | ) | |
Proceeds from regulatory settlements | | | — | | | | 0.00 | (b) | | | — | | | | 0.00 | (b) | | | — | | |
Net asset value, end of period | | $ | 12.80 | | | $ | 11.64 | | | $ | 11.98 | | | $ | 10.07 | | | $ | 7.00 | | |
Total return | | | 11.78 | % | | | (1.94 | %) | | | 20.45 | % | | | 45.49 | % | | | (42.36 | %) | |
Ratios to average net assets(c)(d) | |
Total gross expenses | | | 1.25 | % | | | 1.16 | % | | | 1.18 | %(e) | | | 1.13 | % | | | 1.10 | %(e) | |
Total net expenses(f) | | | 1.16 | %(g) | | | 1.09 | %(g) | | | 1.18 | %(e)(g) | | | 1.12 | %(g) | | | 1.04 | %(e)(g) | |
Net investment income | | | 1.45 | % | | | 1.13 | % | | | 1.02 | % | | | 0.95 | % | | | 1.68 | % | |
Supplemental data | |
Net assets, end of period (in thousands) | | $ | 394,732 | | | $ | 418,906 | | | $ | 517,861 | | | $ | 891,894 | | | $ | 672,426 | | |
Portfolio turnover | | | 86 | % | | | 74 | % | | | 79 | % | | | 61 | % | | | 61 | % | |
Notes to Financial Highlights
(a) Net investment income per share reflects special dividends. The effect of these dividends amounted to $0.04 per share.
(b) Rounds to zero.
(c) In addition to the fees and expenses which the Fund bears directly, the Fund indirectly bears a pro rata share of the fees and expenses of the acquired funds in which it invests. Such indirect expenses are not included in the reported expense ratios.
(d) Certain line items from prior years have been reclassified to conform to the current presentation.
(e) Ratios include line of credit interest expense which rounds to less than 0.01%.
(f) Total net expenses include the impact of certain waivers/reimbursements made by the Investment Manager and certain of its affiliates, if applicable.
(g) The benefits derived from expense reductions had an impact of less than 0.01%.
The accompanying Notes to Financial Statements are an integral part of this statement.
Annual Report 2013
17
Columbia Large Cap Value Fund
Financial Highlights (continued)
| | | Year Ended
February 28, | | Year Ended
February 29, | | Year Ended February 28, | |
Class B | | 2013 | | 2012 | | 2011 | | 2010 | | 2009 | |
Per share data | |
Net asset value, beginning of period | | $ | 11.19 | | | $ | 11.54 | | | $ | 9.72 | | | $ | 6.75 | | | $ | 11.94 | | |
Income from investment operations: | |
Net investment income | | | 0.07 | | | | 0.04 | | | | 0.03 | (a) | | | 0.02 | | | | 0.09 | | |
Net realized and unrealized gain (loss) | | | 1.14 | | | | (0.36 | ) | | | 1.85 | | | | 2.99 | | | | (5.17 | ) | |
Total from investment operations | | | 1.21 | | | | (0.32 | ) | | | 1.88 | | | | 3.01 | | | | (5.08 | ) | |
Less distributions to shareholders: | |
Net investment income | | | (0.10 | ) | | | (0.03 | ) | | | (0.06 | ) | | | (0.04 | ) | | | (0.11 | ) | |
Total distributions to shareholders | �� | | (0.10 | ) | | | (0.03 | ) | | | (0.06 | ) | | | (0.04 | ) | | | (0.11 | ) | |
Proceeds from regulatory settlements | | | — | | | | 0.00 | (b) | | | — | | | | 0.00 | (b) | | | — | | |
Net asset value, end of period | | $ | 12.30 | | | $ | 11.19 | | | $ | 11.54 | | | $ | 9.72 | | | $ | 6.75 | | |
Total return | | | 10.95 | % | | | (2.76 | %) | | | 19.48 | % | | | 44.59 | % | | | (42.84 | %) | |
Ratios to average net assets(c)(d) | |
Total gross expenses | | | 2.00 | % | | | 1.91 | % | | | 1.93 | %(e) | | | 1.88 | % | | | 1.85 | %(e) | |
Total net expenses(f) | | | 1.90 | %(g) | | | 1.83 | %(g) | | | 1.93 | %(e)(g) | | | 1.87 | %(g) | | | 1.79 | %(e)(g) | |
Net investment income | | | 0.67 | % | | | 0.33 | % | | | 0.32 | % | | | 0.23 | % | | | 0.89 | % | |
Supplemental data | |
Net assets, end of period (in thousands) | | $ | 9,508 | | | $ | 16,489 | | | $ | 43,173 | | | $ | 96,524 | | | $ | 127,489 | | |
Portfolio turnover | | | 86 | % | | | 74 | % | | | 79 | % | | | 61 | % | | | 61 | % | |
Notes to Financial Highlights
(a) Net investment income per share reflects special dividends. The effect of these dividends amounted to $0.04 per share.
(b) Rounds to zero.
(c) In addition to the fees and expenses which the Fund bears directly, the Fund indirectly bears a pro rata share of the fees and expenses of the acquired funds in which it invests. Such indirect expenses are not included in the reported expense ratios.
(d) Certain line items from prior years have been reclassified to conform to the current presentation.
(e) Ratios include line of credit interest expense which rounds to less than 0.01%.
(f) Total net expenses include the impact of certain waivers/reimbursements made by the Investment Manager and certain of its affiliates, if applicable.
(g) The benefits derived from expense reductions had an impact of less than 0.01%.
The accompanying Notes to Financial Statements are an integral part of this statement.
Annual Report 2013
18
Columbia Large Cap Value Fund
Financial Highlights (continued)
| | | Year Ended
February 28, | | Year Ended
February 29, | | Year Ended February 28, | |
Class C | | 2013 | | 2012 | | 2011 | | 2010 | | 2009 | |
Per share data | |
Net asset value, beginning of period | | $ | 11.20 | | | $ | 11.54 | | | $ | 9.72 | | | $ | 6.75 | | | $ | 11.94 | | |
Income from investment operations: | |
Net investment income | | | 0.08 | | | | 0.04 | | | | 0.03 | (a) | | | 0.02 | | | | 0.09 | | |
Net realized and unrealized gain (loss) | | | 1.12 | | | | (0.35 | ) | | | 1.85 | | | | 2.99 | | | | (5.17 | ) | |
Total from investment operations | | | 1.20 | | | | (0.31 | ) | | | 1.88 | | | | 3.01 | | | | (5.08 | ) | |
Less distributions to shareholders: | |
Net investment income | | | (0.10 | ) | | | (0.03 | ) | | | (0.06 | ) | | | (0.04 | ) | | | (0.11 | ) | |
Total distributions to shareholders | | | (0.10 | ) | | | (0.03 | ) | | | (0.06 | ) | | | (0.04 | ) | | | (0.11 | ) | |
Proceeds from regulatory settlements | | | — | | | | 0.00 | (b) | | | — | | | | 0.00 | (b) | | | — | | |
Net asset value, end of period | | $ | 12.30 | | | $ | 11.20 | | | $ | 11.54 | | | $ | 9.72 | | | $ | 6.75 | | |
Total return | | | 10.85 | % | | | (2.68 | %) | | | 19.48 | % | | | 44.59 | % | | | (42.84 | %) | |
Ratios to average net assets(c)(d) | |
Total gross expenses | | | 2.00 | % | | | 1.91 | % | | | 1.93 | %(e) | | | 1.88 | % | | | 1.85 | %(e) | |
Total net expenses(f) | | | 1.91 | %(g) | | | 1.84 | %(g) | | | 1.93 | %(e)(g) | | | 1.87 | %(g) | | | 1.79 | %(e)(g) | |
Net investment income | | | 0.70 | % | | | 0.37 | % | | | 0.32 | % | | | 0.21 | % | | | 0.90 | % | |
Supplemental data | |
Net assets, end of period (in thousands) | | $ | 24,376 | | | $ | 26,274 | | | $ | 36,187 | | | $ | 37,229 | | | $ | 31,091 | | |
Portfolio turnover | | | 86 | % | | | 74 | % | | | 79 | % | | | 61 | % | | | 61 | % | |
Notes to Financial Highlights
(a) Net investment income per share reflects special dividends. The effect of these dividends amounted to $0.04 per share.
(b) Rounds to zero.
(c) In addition to the fees and expenses which the Fund bears directly, the Fund indirectly bears a pro rata share of the fees and expenses of the acquired funds in which it invests. Such indirect expenses are not included in the reported expense ratios.
(d) Certain line items from prior years have been reclassified to conform to the current presentation.
(e) Ratios include line of credit interest expense which rounds to less than 0.01%.
(f) Total net expenses include the impact of certain waivers/reimbursements made by the Investment Manager and certain of its affiliates, if applicable.
(g) The benefits derived from expense reductions had an impact of less than 0.01%.
The accompanying Notes to Financial Statements are an integral part of this statement.
Annual Report 2013
19
Columbia Large Cap Value Fund
Financial Highlights (continued)
Class I | | Year Ended
February 28,
2013 | | Year Ended
February 29,
2012 | | Year Ended
February 28,
2011(a) | |
Per share data | |
Net asset value, beginning of period | | $ | 11.69 | | | $ | 12.03 | | | $ | 10.23 | | |
Income from investment operations: | |
Net investment income | | | 0.22 | | | | 0.17 | | | | 0.05 | | |
Net realized and unrealized gain (loss) | | | 1.17 | | | | (0.37 | ) | | | 1.80 | | |
Total from investment operations | | | 1.39 | | | | (0.20 | ) | | | 1.85 | | |
Less distributions to shareholders: | |
Net investment income | | | (0.23 | ) | | | (0.14 | ) | | | (0.05 | ) | |
Total distributions to shareholders | | | (0.23 | ) | | | (0.14 | ) | | | (0.05 | ) | |
Proceeds from regulatory settlements | | | — | | | | 0.00 | (b) | | | — | | |
Net asset value, end of period | | $ | 12.85 | | | $ | 11.69 | | | $ | 12.03 | | |
Total return | | | 12.15 | % | | | (1.57 | %) | | | 18.07 | % | |
Ratios to average net assets(c) | |
Total gross expenses | | | 0.81 | % | | | 0.71 | % | | | 0.70 | %(d) | |
Total net expenses(e) | | | 0.76 | % | | | 0.71 | %(f) | | | 0.70 | %(d)(f) | |
Net investment income | | | 1.85 | % | | | 1.45 | % | | | 1.04 | %(d) | |
Supplemental data | |
Net assets, end of period (in thousands) | | $ | 3 | | | $ | 3 | | | $ | 123,018 | | |
Portfolio turnover | | | 86 | % | | | 74 | % | | | 79 | % | |
Notes to Financial Highlights
(a) For the period from September 28, 2010 (commencement of operations) to February 28, 2011.
(b) Rounds to zero.
(c) In addition to the fees and expenses which the Fund bears directly, the Fund indirectly bears a pro rata share of the fees and expenses of the acquired funds in which it invests. Such indirect expenses are not included in the reported expense ratios.
(d) Annualized.
(e) Total net expenses include the impact of certain waivers/reimbursements made by the Investment Manager and certain of its affiliates, if applicable.
(f) The benefits derived from expense reductions had an impact of less than 0.01%.
The accompanying Notes to Financial Statements are an integral part of this statement.
Annual Report 2013
20
Columbia Large Cap Value Fund
Financial Highlights (continued)
| | | Year Ended
February 28, | | Year Ended
February 29, | | Year Ended February 28, | |
Class R | | 2013 | | 2012 | | 2011 | | 2010 | | 2009 | |
Per share data | |
Net asset value, beginning of period | | $ | 11.64 | | | $ | 11.98 | | | $ | 10.07 | | | $ | 6.99 | | | $ | 12.36 | | |
Income from investment operations: | |
Net investment income | | | 0.13 | | | | 0.10 | | | | 0.06 | (a) | | | 0.07 | | | | 0.15 | | |
Net realized and unrealized gain (loss) | | | 1.18 | | | | (0.37 | ) | | | 1.95 | | | | 3.09 | | | | (5.36 | ) | |
Total from investment operations | | | 1.31 | | | | (0.27 | ) | | | 2.01 | | | | 3.16 | | | | (5.21 | ) | |
Less distributions to shareholders: | |
Net investment income | | | (0.16 | ) | | | (0.07 | ) | | | (0.10 | ) | | | (0.08 | ) | | | (0.16 | ) | |
Total distributions to shareholders | | | (0.16 | ) | | | (0.07 | ) | | | (0.10 | ) | | | (0.08 | ) | | | (0.16 | ) | |
Proceeds from regulatory settlements | | | — | | | | 0.00 | (b) | | | — | | | | 0.00 | (b) | | | — | | |
Net asset value, end of period | | $ | 12.79 | | | $ | 11.64 | | | $ | 11.98 | | | $ | 10.07 | | | $ | 6.99 | | |
Total return | | | 11.43 | % | | | (2.19 | %) | | | 20.16 | % | | | 45.34 | % | | | (42.54 | %) | |
Ratios to average net assets(c)(d) | |
Total gross expenses | | | 1.49 | % | | | 1.38 | % | | | 1.43 | %(e) | | | 1.38 | % | | | 1.35 | %(e) | |
Total net expenses(f) | | | 1.40 | %(g) | | | 1.31 | %(g) | | | 1.43 | %(e)(g) | | | 1.37 | %(g) | | | 1.29 | %(e)(g) | |
Net investment income | | | 1.14 | % | | | 0.94 | % | | | 0.59 | % | | | 0.71 | % | | | 1.45 | % | |
Supplemental data | |
Net assets, end of period (in thousands) | | $ | 725 | | | $ | 1,420 | | | $ | 1,211 | | | $ | 252 | | | $ | 147 | | |
Portfolio turnover | | | 86 | % | | | 74 | % | | | 79 | % | | | 61 | % | | | 61 | % | |
Notes to Financial Highlights
(a) Net investment income per share reflects special dividends. The effect of these dividends amounted to $0.04 per share.
(b) Rounds to zero.
(c) In addition to the fees and expenses which the Fund bears directly, the Fund indirectly bears a pro rata share of the fees and expenses of the acquired funds in which it invests. Such indirect expenses are not included in the reported expense ratios.
(d) Certain line items from prior years have been reclassified to conform to the current presentation.
(e) Ratios include line of credit interest expense which rounds to less than 0.01%.
(f) Total net expenses include the impact of certain waivers/reimbursements made by the Investment Manager and certain of its affiliates, if applicable.
(g) The benefits derived from expense reductions had an impact of less than 0.01%.
The accompanying Notes to Financial Statements are an integral part of this statement.
Annual Report 2013
21
Columbia Large Cap Value Fund
Financial Highlights (continued)
Class W | | Year Ended
February 28,
2013 | | Year Ended
February 29,
2012 | | Year Ended
February 28,
2011(a) | |
Per share data | |
Net asset value, beginning of period | | $ | 11.64 | | | $ | 11.99 | | | $ | 10.21 | | |
Income from investment operations: | |
Net investment income | | | 0.17 | | | | 0.14 | | | | 0.03 | | |
Net realized and unrealized gain (loss) | | | 1.18 | | | | (0.38 | ) | | | 1.78 | | |
Total from investment operations | | | 1.35 | | | | (0.24 | ) | | | 1.81 | | |
Less distributions to shareholders: | |
Net investment income | | | (0.19 | ) | | | (0.11 | ) | | | (0.03 | ) | |
Total distributions to shareholders | | | (0.19 | ) | | | (0.11 | ) | | | (0.03 | ) | |
Proceeds from regulatory settlements | | | — | | | | 0.00 | (b) | | | — | | |
Net asset value, end of period | | $ | 12.80 | | | $ | 11.64 | | | $ | 11.99 | | |
Total return | | | 11.78 | % | | | (1.94 | %) | | | 17.79 | % | |
Ratios to average net assets(c) | |
Total gross expenses | | | 1.26 | % | | | 1.09 | % | | | 1.22 | %(d) | |
Total net expenses(e) | | | 1.16 | %(f) | | | 1.01 | %(f) | | | 1.22 | %(d)(f) | |
Net investment income | | | 1.45 | % | | | 1.22 | % | | | 0.54 | %(d) | |
Supplemental data | |
Net assets, end of period (in thousands) | | $ | 3 | | | $ | 3 | | | $ | 3 | | |
Portfolio turnover | | | 86 | % | | | 74 | % | | | 79 | % | |
Notes to Financial Highlights
(a) For the period from September 27, 2010 (commencement of operations) to February 28, 2011.
(b) Rounds to zero.
(c) In addition to the fees and expenses which the Fund bears directly, the Fund indirectly bears a pro rata share of the fees and expenses of the acquired funds in which it invests. Such indirect expenses are not included in the reported expense ratios.
(d) Annualized.
(e) Total net expenses include the impact of certain waivers/reimbursements made by the Investment Manager and certain of its affiliates, if applicable.
(f) The benefits derived from expense reductions had an impact of less than 0.01%.
The accompanying Notes to Financial Statements are an integral part of this statement.
Annual Report 2013
22
Columbia Large Cap Value Fund
Financial Highlights (continued)
| | | Year Ended
February 28, | | Year Ended
February 29, | | Year Ended February 28, | |
Class Y | | 2013 | | 2012 | | 2011 | | 2010(a) | |
Per share data | |
Net asset value, beginning of period | | $ | 11.68 | | | $ | 12.02 | | | $ | 10.10 | | | $ | 8.65 | | |
Income from investment operations: | |
Net investment income | | | 0.22 | | | | 0.17 | | | | 0.17 | (b) | | | 0.08 | | |
Net realized and unrealized gain (loss) | | | 1.17 | | | | (0.37 | ) | | | 1.92 | | | | 1.45 | | |
Total from investment operations | | | 1.39 | | | | (0.20 | ) | | | 2.09 | | | | 1.53 | | |
Less distributions to shareholders: | |
Net investment income | | | (0.23 | ) | | | (0.14 | ) | | | (0.17 | ) | | | (0.08 | ) | |
Total distributions to shareholders | | | (0.23 | ) | | | (0.14 | ) | | | (0.17 | ) | | | (0.08 | ) | |
Proceeds from regulatory settlements | | | — | | | | 0.00 | (c) | | | — | | | | — | | |
Net asset value, end of period | | $ | 12.84 | | | $ | 11.68 | | | $ | 12.02 | | | $ | 10.10 | | |
Total return | | | 12.15 | % | | | (1.58 | %) | | | 20.98 | % | | | 17.67 | % | |
Ratios to average net assets(d)(e) | |
Total gross expenses | | | 0.80 | % | | | 0.73 | % | | | 0.71 | %(f) | | | 0.72 | %(g) | |
Total net expenses(h) | | | 0.75 | % | | | 0.73 | %(i) | | | 0.71 | %(f)(i) | | | 0.72 | %(g)(i) | |
Net investment income | | | 1.86 | % | | | 1.50 | % | | | 1.62 | % | | | 1.36 | %(g) | |
Supplemental data | |
Net assets, end of period (in thousands) | | $ | 7,417 | | | $ | 6,602 | | | $ | 7,138 | | | $ | 11,497 | | |
Portfolio turnover | | | 86 | % | | | 74 | % | | | 79 | % | | | 61 | % | |
Notes to Financial Highlights
(a) For the period from July 15, 2009 (commencement of operations) to February 28, 2010.
(b) Net investment income per share reflects special dividends. The effect of these dividends amounted to $0.04 per share.
(c) Rounds to zero.
(d) In addition to the fees and expenses which the Fund bears directly, the Fund indirectly bears a pro rata share of the fees and expenses of the acquired funds in which it invests. Such indirect expenses are not included in the reported expense ratios.
(e) Certain line items from prior years have been reclassified to conform to the current presentation.
(f) Ratios include line of credit interest expense which rounds to less than 0.01%.
(g) Annualized.
(h) Total net expenses include the impact of certain waivers/reimbursements made by the Investment Manager and certain of its affiliates, if applicable.
(i) The benefits derived from expense reductions had an impact of less than 0.01%.
The accompanying Notes to Financial Statements are an integral part of this statement.
Annual Report 2013
23
Columbia Large Cap Value Fund
Financial Highlights (continued)
| | | Year Ended
February 28, | | Year Ended
February 29, | | Year Ended February 28, | |
Class Z | | 2013 | | 2012 | | 2011 | | 2010 | | 2009 | |
Per share data | |
Net asset value, beginning of period | | $ | 11.66 | | | $ | 12.01 | | | $ | 10.09 | | | $ | 7.01 | | | $ | 12.40 | | |
Income from investment operations: | |
Net investment income | | | 0.18 | | | | 0.15 | | | | 0.14 | (a) | | | 0.11 | | | | 0.20 | | |
Net realized and unrealized gain (loss) | | | 1.20 | | | | (0.38 | ) | | | 1.94 | | | | 3.09 | | | | (5.39 | ) | |
Total from investment operations | | | 1.38 | | | | (0.23 | ) | | | 2.08 | | | | 3.20 | | | | (5.19 | ) | |
Less distributions to shareholders: | |
Net investment income | | | (0.22 | ) | | | (0.12 | ) | | | (0.16 | ) | | | (0.12 | ) | | | (0.22 | ) | |
Total distributions to shareholders | | | (0.22 | ) | | | (0.12 | ) | | | (0.16 | ) | | | (0.12 | ) | | | (0.22 | ) | |
Proceeds from regulatory settlements | | | — | | | | 0.00 | (b) | | | — | | | | 0.00 | (b) | | | 0.02 | | |
Net asset value, end of period | | $ | 12.82 | | | $ | 11.66 | | | $ | 12.01 | | | $ | 10.09 | | | $ | 7.01 | | |
Total return | | | 12.04 | % | | | (1.78 | %) | | | 20.81 | % | | | 45.93 | % | | | (42.27 | %) | |
Ratios to average net assets(c)(d) | |
Total gross expenses | | | 0.98 | % | | | 0.91 | % | | | 0.93 | %(e) | | | 0.88 | % | | | 0.85 | %(e) | |
Total net expenses(f) | | | 0.89 | %(g) | | | 0.84 | %(g) | | | 0.93 | %(e)(g) | | | 0.87 | %(g) | | | 0.79 | %(e)(g) | |
Net investment income | | | 1.49 | % | | | 1.37 | % | | | 1.32 | % | | | 1.21 | % | | | 1.91 | % | |
Supplemental data | |
Net assets, end of period (in thousands) | | $ | 179,634 | | | $ | 1,021,952 | | | $ | 1,366,011 | | | $ | 1,290,563 | | | $ | 907,353 | | |
Portfolio turnover | | | 86 | % | | | 74 | % | | | 79 | % | | | 61 | % | | | 61 | % | |
Notes to Financial Highlights
(a) Net investment income per share reflects special dividends. The effect of these dividends amounted to $0.04 per share.
(b) Rounds to zero.
(c) In addition to the fees and expenses which the Fund bears directly, the Fund indirectly bears a pro rata share of the fees and expenses of the acquired funds in which it invests. Such indirect expenses are not included in the reported expense ratios.
(d) Certain line items from prior years have been reclassified to conform to the current presentation.
(e) Ratios include line of credit interest expense which rounds to less than 0.01%.
(f) Total net expenses include the impact of certain waivers/reimbursements made by the Investment Manager and certain of its affiliates, if applicable.
(g) The benefits derived from expense reductions had an impact of less than 0.01%.
The accompanying Notes to Financial Statements are an integral part of this statement.
Annual Report 2013
24
Columbia Large Cap Value Fund
Notes to Financial Statements
February 28, 2013
Note 1. Organization
Columbia Large Cap Value Fund (the Fund), a series of Columbia Funds Series Trust (the Trust), is a diversified fund. The Trust is registered under the Investment Company Act of 1940, as amended (the 1940 Act), as an open-end management investment company organized as a Delaware statutory trust.
Fund Shares
The Trust may issue an unlimited number of shares (without par value). The Fund offers Class A, Class B, Class C, Class I, Class R, Class W, Class Y and Class Z shares. All share classes have identical voting, dividend and liquidation rights. Each share class has its own expense structure and sales charges, as applicable.
Class A shares are subject to a maximum front-end sales charge of 5.75% based on the initial investment amount. Class A shares purchased without an initial sales charge in accounts aggregating $1 million to $50 million at the time of purchase are subject to a contingent deferred sales charge (CDSC) if the shares are sold within 18 months of purchase, charged as follows: 1.00% CDSC if redeemed within 12 months of purchase, and 0.50% CDSC if redeemed more than 12, but less than 18, months after purchase.
Class B shares may be subject to a maximum CDSC of 5.00% based upon the holding period after purchase. Class B shares will generally convert to Class A shares eight years after purchase. The Fund no longer accepts investments by new or existing investors in the Fund's Class B shares, except in connection with the reinvestment of any dividend and/or capital gain distributions in Class B shares of the Fund and exchanges by existing Class B shareholders of certain other funds within the Columbia Family of Funds.
Class C shares are subject to a 1.00% CDSC on shares redeemed within one year of purchase.
Class I shares are not subject to sales charges and are only available to the Columbia Family of Funds.
Class R shares are not subject to sales charges and are only available to qualifying institutional investors.
Class W shares are not subject to sales charges and are only available to investors purchasing through authorized investment programs managed by investment professionals, including discretionary managed account programs.
Class Y shares are not subject to sales charges and are only available to certain categories of investors which are subject to minimum initial investment requirements.
Class Z shares are not subject to sales charges, and are only available to certain investors.
Note 2. Summary of Significant Accounting Policies
Use of Estimates
The preparation of financial statements in accordance with U.S. generally accepted accounting principles (GAAP) requires management to make certain estimates and assumptions that affect the reported amounts of assets and liabilities, the disclosure of contingent assets and liabilities at the date of the financial statements and the reported amounts of revenue and expenses during the reporting period. Actual results could differ from those estimates.
The following is a summary of significant accounting policies consistently followed by the Fund in the preparation of its financial statements.
Security Valuation
All equity securities are valued at the close of business of the New York Stock Exchange (NYSE). Equity securities are valued at the last quoted sales price on the principal exchange or market on which they trade, except for securities traded on the NASDAQ Stock Market, which are valued at the NASDAQ official close price. Unlisted securities or listed securities for which there were no sales during the day are valued at the mean of the latest quoted bid and ask prices on such exchanges or markets.
Foreign securities are valued based on quotations from the principal market in which such securities are normally traded. If any foreign share prices are not readily available as a result of limited share activity the securities are valued at the mean of the latest quoted bid and ask prices on such exchanges or markets. Foreign currency exchange rates are generally determined at 4:00 p.m. Eastern (U.S.) time. However, many securities markets and exchanges outside the U.S. close prior to the close of the NYSE; therefore, the closing prices for securities in such markets or on such exchanges may not fully reflect events that occur after such close but before the close of the NYSE. In those situations, foreign securities will be fair valued pursuant to the policy adopted by the Board of Trustees (the Board), including utilizing a third party pricing service to determine these fair values. The third party pricing service takes into account multiple factors, including, but not limited to, movements in the U.S. securities markets, certain depositary receipts, futures contracts and foreign exchange rates that have occurred subsequent to the close of the foreign exchange or market, to determine a good faith estimate that reasonably reflects the current market conditions as of the close of the NYSE. The fair value of a security is likely to be different from the quoted or published price, if available.
Annual Report 2013
25
Columbia Large Cap Value Fund
Notes to Financial Statements (continued)
February 28, 2013
Investments in other open-end investment companies, including money market funds, are valued at net asset value.
Futures and options on futures contracts are valued based upon the settlement price established each day by the board of trade or exchange on which they are traded.
Investments for which market quotations are not readily available, or that have quotations which management believes are not reliable, are valued at fair value as determined in good faith under consistently applied procedures established by and under the general supervision of the Board. If a security or class of securities (such as foreign securities) is valued at fair value, such value is likely to be different from the last quoted market price for the security.
The determination of fair value often requires significant judgment. To determine fair value, management may use assumptions including but not limited to future cash flows and estimated risk premiums. Multiple inputs from various sources may be used to determine fair value.
Foreign Currency Transactions and Translations
The values of all assets and liabilities denominated in foreign currencies are translated into U.S. dollars at that day's exchange rates. Net realized and unrealized gains (losses) on foreign currency transactions and translations include gains (losses) arising from the fluctuation in exchange rates between trade and settlement dates on securities transactions, gains (losses) arising from the disposition of foreign currency and currency gains (losses) between the accrual and payment dates on dividends, interest income and foreign withholding taxes.
For financial statement purposes, the Fund does not distinguish that portion of gains (losses) on investments which is due to changes in foreign exchange rates from that which is due to changes in market prices of the investments. Such fluctuations are included with the net realized and unrealized gains (losses) on investments in the Statement of Operations.
Derivative Instruments
The Fund invests in certain derivative instruments, as detailed below, to meet its investment objectives. Derivatives are instruments whose values depend on, or are derived from, in whole or in part, the value of one or more other assets, such as securities, currencies, commodities or indices. Derivative instruments may be used to maintain cash reserves while maintaining exposure to certain other assets, to offset anticipated declines in values of investments, to facilitate trading, to reduce transaction costs and to pursue higher investment returns. The Fund may also use derivative instruments to mitigate certain investment risks, such as foreign currency exchange rate risk, interest rate risk and credit risk. Derivatives may involve various risks, including the potential inability of the counterparty to fulfill its
obligation under the terms of the contract, the potential for an illiquid secondary market and the potential for market movements which may expose the Fund to gains or losses in excess of the amount shown in the Statement of Assets and Liabilities.
The Fund and any counterparty are required to maintain an agreement that requires the Fund and that counterparty to monitor (on a daily basis) the net fair value of all derivatives entered into pursuant to the agreement between the Fund and such counterparty. If the net fair value of such derivatives between the Fund and that counterparty exceeds a certain threshold (as defined in the agreement), the Fund or the counterparty (as the case may be) is required to post cash and/or securities as collateral. Fair values of derivatives presented in the financial statements are not netted with the fair value of other derivatives or with any collateral amounts posted by the Fund or any counterparty.
Futures Contracts
Futures contracts represent commitments for the future purchase or sale of an asset at a specified price on a specified date. The Fund bought and sold futures contracts to produce incremental earnings. Upon entering into futures contracts, the Fund bears risks which may include interest rates, exchange rates or securities prices moving unexpectedly, in which case, the Fund may not achieve the anticipated benefits of the futures contracts and may realize a loss. Additional risks include counterparty credit risk, the possibility of an illiquid market, and that a change in the value of the contract or option may not correlate with changes in the value of the underlying asset.
Upon entering into a futures contract, the Fund pledges cash or securities with the broker in an amount sufficient to meet the initial margin requirement. Subsequent payments (variation margin) are made or received by the Fund each day. The variation margin payments are equal to the daily change in the contract value and are recorded as variation margin receivable or payable and are offset in unrealized gains or losses. The Fund recognizes a realized gain or loss when the contract is closed or expires. Futures contracts involve, to varying degrees, risk of loss in excess of the variation margin disclosed in the Statement of Assets and Liabilities.
Effects of Derivative Transactions in the Financial Statements
The following tables are intended to provide additional information about the effect of derivatives on the financial statements of the Fund, including: the fair value of derivatives by risk category and the location of those fair values in the Statement of Assets and Liabilities; the impact of derivative transactions on the Fund's operations over the period including
Annual Report 2013
26
Columbia Large Cap Value Fund
Notes to Financial Statements (continued)
February 28, 2013
realized gains or losses and unrealized gains or losses. The derivative schedules following the Portfolio of Investments present additional information regarding derivative instruments outstanding at the end of the period, if any.
The following table is a summary of the fair value of derivative instruments at February 28, 2013:
At February 28, 2013, the Fund had no outstanding derivatives.
The effect of derivative instruments in the Statement of Operations for the year ended February 28, 2013:
Amount of Realized Gain (Loss) on Derivatives Recognized in Income | |
Risk Exposure
Category | | Futures
Contracts ($) | |
Equity contracts | | | (5,464,381 | ) | |
The following table is a summary of the volume of derivative instruments for the year ended February 28, 2013:
Derivative Instrument | | Contracts Opened | |
Futures contracts | | | 565 | | |
Security Transactions
Security transactions are accounted for on the trade date. Cost is determined and gains (losses) are based upon the specific identification method for both financial statement and federal income tax purposes.
Income Recognition
Corporate actions and dividend income are recorded on the ex-dividend date.
Awards from class action litigation are recorded as a reduction of cost basis if the Fund still owns the applicable securities on the payment date. If the Fund no longer owns the applicable securities, the proceeds are recorded as realized gains.
Expenses
General expenses of the Trust are allocated to the Fund and other funds of the Trust based upon relative net assets or other expense allocation methodologies determined by the nature of the expense. Expenses directly attributable to the Fund are charged to the Fund. Expenses directly attributable to a specific class of shares are charged to that share class.
Determination of Class Net Asset Value
All income, expenses (other than class-specific expenses, which are charged to that share class, as shown in the Statement of Operations) and realized and unrealized gains (losses) are allocated to each class of the Fund on a daily basis, based on the relative net assets of each class, for purposes of determining the net asset value of each class.
Federal Income Tax Status
The Fund intends to qualify each year as a regulated investment company under Subchapter M of the Internal Revenue Code, as amended, and will distribute substantially all of its taxable income (including net short-term capital gains), if any, for its tax year, and as such will not be subject to federal income taxes. In addition, the Fund intends to distribute in each calendar year substantially all of its net investment income, capital gains and certain other amounts, if any, such that the Fund should not be subject to federal excise tax. Therefore, no federal income or excise tax provision is recorded.
Distributions to Shareholders
Distributions from net investment income, if any, are declared and paid each calendar quarter. Net realized capital gains, if any, are distributed at least annually. Income distributions and capital gain distributions are determined in accordance with federal income tax regulations, which may differ from GAAP.
Guarantees and Indemnifications
Under the Trust's organizational documents and, in some cases, by contract, its officers and trustees are indemnified against certain liabilities arising out of the performance of their duties to the Trust or its funds. In addition, certain of the Fund's contracts with its service providers contain general indemnification clauses. The Fund's maximum exposure under these arrangements is unknown since the amount of any future claims that may be made against the Fund cannot be determined, and the Fund has no historical basis for predicting the likelihood of any such claims.
Recent Accounting Pronouncement
Disclosures about Offsetting Assets and Liabilities
In December 2011, the Financial Accounting Standards Board (FASB) issued Accounting Standards Update (ASU) No. 2011-11, Disclosures about Offsetting Assets and Liabilities. The objective of the FASB is to enhance current disclosure requirements on offsetting of certain assets and liabilities and to enable financial statement users to compare financial statements prepared under GAAP and International Financial Reporting Standards.
Specifically, ASU No. 2011-11 requires an entity to disclose both gross and net information for derivatives and other financial instruments that are subject to a master netting arrangement or similar agreement. The standard requires disclosure of collateral received in connection with the master netting agreements or similar agreements. The effective date of ASU No. 2011-11 is for interim and annual periods beginning on or after January 1, 2013. At this time,
Annual Report 2013
27
Columbia Large Cap Value Fund
Notes to Financial Statements (continued)
February 28, 2013
management is evaluating the implications of this guidance and the impact it will have on the financial statement amounts and footnote disclosures, if any.
Note 3. Fees and Compensation Paid to Affiliates
Investment Management Fees
Under an Investment Management Services Agreement, Columbia Management Investment Advisers, LLC (the Investment Manager), a wholly-owned subsidiary of Ameriprise Financial, Inc. (Ameriprise Financial), determines which securities will be purchased, held or sold. The management fee is an annual fee that is equal to a percentage of the Fund's average daily net assets that declines from 0.71% to 0.54% as the Fund's net assets increase. The effective investment management fee rate for the year ended February 28, 2013 was 0.69% of the Fund's average daily net assets.
Administration Fees
Under an Administrative Services Agreement, the Investment Manager serves as the Fund Administrator. The Fund pays the Fund Administrator an annual fee for administration and accounting services equal to a percentage of the Fund's average daily net assets that declines from 0.06% to 0.03% as the Fund's net assets increase. The effective administration fee rate for the year ended February 28, 2013 was 0.06% of the Fund's average daily net assets.
Other Expenses
Other expenses are for, among other things, certain expenses of the Fund or the Board, including: Fund boardroom and office expense, employee compensation, employee health and retirement benefits, and certain other expenses. Payment of these Fund and Board expenses is facilitated by a company providing limited administrative services to the Fund and the Board. For the year ended February 28, 2013, other expenses paid to this company were $3,524.
Compensation of Board Members
Board members are compensated for their services to the Fund as disclosed in the Statement of Operations. Under a Deferred Compensation Plan (the Plan), the Board members who are not "interested persons" of the Fund, as defined under the 1940 Act, may elect to defer payment of up to 100% of their compensation. Deferred amounts are treated as though equivalent dollar amounts had been invested in shares of certain funds managed by the Investment Manager. The Fund's liability for these amounts is adjusted for market value
changes and remains in the Fund until distributed in accordance with the Plan.
Transfer Agent Fees
Under a Transfer and Dividend Disbursing Agent Agreement, Columbia Management Investment Services Corp. (the Transfer Agent), an affiliate of the Investment Manager and a wholly-owned subsidiary of Ameriprise Financial, is responsible for providing transfer agency services to the Fund. The Transfer Agent has contracted with Boston Financial Data Services (BFDS) to serve as sub-transfer agent.
The Transfer Agent receives monthly account-based service fees based on the number of open accounts and is reimbursed by the Fund for the fees and expenses the Transfer Agent pays to financial intermediaries that maintain omnibus accounts with the Fund that is a percentage of the average aggregate value of the Fund's shares maintained in each such omnibus account (other than omnibus accounts for which American Enterprise Investment Services Inc. is the broker of record or accounts where the beneficial shareholder is a customer of Ameriprise Financial Services, Inc., which are paid a per account fee). The Transfer Agent pays the fees of BFDS for services as sub-transfer agent and is not entitled to reimbursement for such fees from the Fund (with the exception of out-of-pocket fees).
The Transfer Agent also receives compensation from fees for various shareholder services and reimbursements for certain out-of-pocket fees. Class I shares do not pay transfer agent fees. Effective November 1, 2012, Class Y shares will not pay transfer agent fees for at least twelve months.
For the year ended February 28, 2013, the Fund's effective transfer agent fee rates as a percentage of average daily net assets of each class were as follows:
Class A | | | 0.20 | % | |
Class B | | | 0.20 | | |
Class C | | | 0.20 | | |
Class R | | | 0.20 | | |
Class W | | | 0.20 | | |
Class Y | | | 0.00 | * | |
Class Z | | | 0.19 | | |
*Rounds to zero.
An annual minimum account balance fee of $20 may apply to certain accounts with a value below the Fund's initial minimum investment requirements to reduce the impact of small accounts on transfer agent fees. These minimum account balance fees are recorded as part of expense reductions in the Statement of Operations. For the year ended February 28,
Annual Report 2013
28
Columbia Large Cap Value Fund
Notes to Financial Statements (continued)
February 28, 2013
2013, these minimum account balance fees reduced total expenses by $24,534.
Distribution and Service Fees
The Fund has an agreement with Columbia Management Investment Distributors, Inc. (the Distributor), an affiliate of the Investment Manager and a wholly-owned subsidiary of Ameriprise Financial, for distribution and shareholder services. Pursuant to Rule 12b-1 under the 1940 Act, the Board has approved, and the Fund has adopted, distribution and shareholder service plans (the Plans) which set the distribution and service fees for the Fund. These fees are calculated daily and are intended to compensate the Distributor and/or eligible selling and/or servicing agents for selling shares of the Fund and providing services to investors.
The Plans require the payment of a monthly combined distribution and service fee to the Distributor at the maximum annual rate of 0.25% of the average daily net assets attributable to Class A shares of the Fund. The Plans also require the payment of a monthly service fee at the maximum annual rate of 0.25% of the average daily net assets attributable to Class B, Class C and Class W shares of the Fund and the payment of a monthly distribution fee at the maximum annual rate of 0.75%, 0.75%, 0.50% and 0.25% of the average daily net assets attributable to Class B, Class C, Class R and Class W shares of the Fund, respectively.
The Fund may pay a distribution fee up to 0.25% of the Fund's average daily net assets attributable to Class W shares and a service fee of up to 0.25% of the Fund's average daily net assets attributable to Class W shares, provided, however, that the aggregate fee shall not exceed 0.25% of the Fund's average daily net assets attributable to Class W shares.
Sales Charges
Sales charges, including front-end charges and CDSCs, received by the Distributor for distributing Fund shares were $91,282 for Class A, $6,135 for Class B and $531 for Class C shares for the year ended February 28, 2013.
Expenses Waived/Reimbursed by the Investment Manager and its Affiliates
Effective July 1, 2012, the Investment Manager and certain of its affiliates have contractually agreed to waive fees and/or reimburse expenses (excluding certain fees and expenses described below), through June 30, 2013, unless sooner terminated at the sole discretion of the Board, so that the Fund's net operating expenses, after giving effect to fees waived/expenses reimbursed and any balance credits and/or overdraft charges from the Fund's custodian, do not exceed
the following annual rates as a percentage of the class' average daily net assets:
Class A | | | 1.18 | % | |
Class B | | | 1.93 | | |
Class C | | | 1.93 | | |
Class I | | | 0.76 | | |
Class R | | | 1.43 | | |
Class W | | | 1.18 | | |
Class Y | | | 0.76 | | |
Class Z | | | 0.93 | | |
Prior to July 1, 2012, the Investment Manager and certain of its affiliates contractually agreed to waive fees and/or reimburse expenses (excluding certain fees and expenses described below), so that the Fund's net operating expenses, after giving effect to fees waived/expenses reimbursed and any balance credits and/or overdraft charges from the Fund's custodian, did not exceed the following annual rates as a percentage of the class' average daily net assets:
Class A | | | 1.11 | % | |
Class B | | | 1.86 | | |
Class C | | | 1.86 | | |
Class I | | | 0.75 | | |
Class R | | | 1.36 | | |
Class W | | | 1.11 | | |
Class Y | | | 0.86 | | |
Class Z | | | 0.86 | | |
Under the agreement governing these fee waivers and/or expense reimbursement arrangements, the following fees and expenses are excluded from the waiver/reimbursement commitment, and therefore will be paid by the Fund, if applicable: taxes (including foreign transaction taxes), expenses associated with investments in affiliated and non-affiliated pooled investment vehicles (including mutual funds and exchange traded funds), transaction costs and brokerage commissions, costs related to any securities lending program, dividend expenses associated with securities sold short, inverse floater program fees and expenses, transaction charges and interest on borrowed money, interest, extraordinary expenses and any other expenses the exclusion of which is specifically approved by the Board. This agreement may be modified or amended only with approval from all parties.
Note 4. Federal Tax Information
The timing and character of income and capital gain distributions are determined in accordance with income tax regulations, which may differ from GAAP because of temporary or permanent book to tax differences.
Annual Report 2013
29
Columbia Large Cap Value Fund
Notes to Financial Statements (continued)
February 28, 2013
At February 28, 2013, these differences are primarily due to differing treatment for capital loss carryforwards, deferral/reversal of wash sales losses, Trustees' deferred compensation, foreign currency transactions and post-October capital losses. To the extent these differences are permanent, reclassifications are made among the components of the Fund's net assets in the Statement of Assets and Liabilities. Temporary differences do not require reclassifications. In the Statement of Assets and Liabilities the following reclassifications were made:
Undistributed net investment income | | $ | 857 | | |
Accumulated net realized loss | | | (857 | ) | |
Paid-in capital | | | — | | |
Net investment income and net realized gains (losses), as disclosed in the Statement of Operations, and net assets were not affected by this reclassification.
The tax character of distributions paid during the years indicated was as follows:
Year Ended | | February 28,
2013 | | February 29,
2012 | |
Ordinary income | | $ | 14,524,089 | | | $ | 16,444,671 | | |
Short-term capital gain distributions, if any, are considered ordinary income distributions for tax purposes.
At February 28, 2013, the components of distributable earnings on a tax basis were as follows:
Undistributed ordinary income | | $ | 1,521,035 | | |
Accumulated realized loss | | | (316,740,694 | ) | |
Unrealized appreciation | | | 128,885,183 | | |
At February 28, 2013, the cost of investments for federal income tax purposes was $477,852,510 and the aggregate gross unrealized appreciation and depreciation based on that cost was:
Unrealized appreciation | | $ | 136,620,598 | | |
Unrealized depreciation | | | (7,735,415 | ) | |
Net unrealized appreciation | | $ | 128,885,183 | | |
The following capital loss carryforward, determined at February 28, 2013, may be available to reduce taxable income arising from future net realized gains on investments, if any, to the extent permitted by the Internal Revenue Code:
Year of Expiration | | Amount | |
2018 | | $ | 316,740,694 | | |
Total | | $ | 316,740,694 | | |
For the year ended February 28, 2013, $93,653,959 of capital loss carryforward was utilized.
Management of the Fund has concluded that there are no significant uncertain tax positions that would require recognition in the financial statements. However, management's conclusion may be subject to review and adjustment at a later date based on factors including, but not limited to, new tax laws, regulations, and administrative interpretations (including relevant court decisions). Generally, the Fund's federal tax returns for the prior three fiscal years remain subject to examination by the Internal Revenue Service.
Note 5. Portfolio Information
The cost of purchases and proceeds from sales of securities, excluding short-term obligations, aggregated to $706,773,775 and $1,610,914,986, respectively, for the year ended February 28, 2013.
Note 6. Regulatory Settlements
During the year ended February 29, 2012, the Fund received $7,701 as a result of a regulatory settlement proceeding brought by the Securities and Exchange Commission against an unaffiliated third party relating to market timing and/or late trading of mutual funds. This amount represented the Fund's portion of the proceeds from the settlement (the Fund was not a party to the proceeding). The payments have been included in "Proceeds from regulatory settlements" in the Statement of Changes in Net Assets.
Note 7. Lending of Portfolio Securities
Effective December 19, 2012, the Fund no longer participates in securities lending activity. Prior to that date, the Fund participated, or was eligible to participate, in securities lending activity pursuant to a Master Securities Lending Agreement (the Agreement) with JPMorgan Chase Bank, N.A. (JPMorgan). The Agreement authorized JPMorgan as lending agent to lend securities to authorized borrowers in order to generate additional income on behalf of the Fund. Pursuant to the Agreement, the securities loaned were secured by cash or securities that either were issued or guaranteed as to principal and interest by the U.S. government, its agencies, authorities or instrumentalities with value equal to at least 100% of the market value of the loaned securities. Any additional collateral required to maintain those levels due to market fluctuations of the loaned securities was requested to be delivered the following business day. Cash collateral received was invested by the lending agent on behalf of the Fund into authorized investments pursuant to the Agreement.
Pursuant to the Agreement, the Fund received income for lending its securities either in the form of fees or by earning interest on invested cash collateral, net of negotiated rebates paid to borrowers and fees paid to the lending agent for
Annual Report 2013
30
Columbia Large Cap Value Fund
Notes to Financial Statements (continued)
February 28, 2013
services provided and any other securities lending expenses. Net income earned from securities lending for the year ended February 28, 2013 is disclosed in the Statement of Operations. The Fund continued to earn and accrue interest and dividends on the securities loaned.
Note 8. Affiliated Money Market Fund
The Fund invests its daily cash balances in Columbia Short-Term Cash Fund, an affiliated money market fund established for the exclusive use by the Fund and other affiliated funds. The income earned by the Fund from such investments is included as "Dividends — affiliated issuers" in the Statement of Operations. As an investing fund, the Fund indirectly bears its proportionate share of the expenses of Columbia Short-Term Cash Fund.
Note 9. Shareholder Concentration
At February 28, 2013, one unaffiliated shareholder account owned 28.3% of the outstanding shares of the Fund. The Fund has no knowledge about whether any portion of those shares was owned beneficially by such account. Subscription and redemption activity by concentrated accounts may have a significant effect on the operations of the Fund.
Note 10. Line of Credit
The Fund has entered into a revolving credit facility with a syndicate of banks led by JPMorgan whereby the Fund may borrow for the temporary funding of shareholder redemptions or for other temporary or emergency purposes. The credit facility agreement, as amended, which is a collective agreement between the Fund and certain other funds managed by the Investment Manager, severally and not jointly, permits collective borrowings up to $500 million. Interest is charged to each participating fund based on its borrowings at a rate equal to the higher of (i) the overnight federal funds rate plus 1.00% or (ii) the one-month LIBOR rate plus 1.00%. Each borrowing under the credit facility matures no later than 60 days after the date of borrowing. The Fund also pays a commitment fee equal to its pro rata share of the amount of the credit facility at a rate of 0.08% per annum.
The Fund had no borrowings during the year ended February 28, 2013.
Note 11. Fund Merger
On February 27, 2013, shareholders of the Fund approved a proposal to merge the Fund into Columbia Equity Value Fund. The merger, which will be a tax-free reorganization for U.S. federal income tax proposes, is expected to take place on April 26, 2013.
Note 12. Significant Risks
Financial Sector Risk
The Fund's portfolio managers may invest significantly in issuers operating in the financial sector. The Fund may be more susceptible to the particular risks of this sector than if the Fund were invested in a wider variety of issuers operating in unrelated sectors.
Note 13. Subsequent Events
Management has evaluated the events and transactions that have occurred through the date the financial statements were issued and noted no items requiring adjustment of the financial statements or additional disclosure.
Note 14. Information Regarding Pending and Settled Legal Proceedings
In December 2005, without admitting or denying the allegations, American Express Financial Corporation (AEFC, which is now known as Ameriprise Financial, Inc. (Ameriprise Financial)) entered into settlement agreements with the Securities and Exchange Commission (SEC) and Minnesota Department of Commerce (MDOC) related to market timing activities. As a result, AEFC was censured and ordered to cease and desist from committing or causing any violations of certain provisions of the Investment Advisers Act of 1940, the Investment Company Act of 1940, and various Minnesota laws. AEFC agreed to pay disgorgement of $10 million and civil money penalties of $7 million. AEFC also agreed to retain an independent distribution consultant to assist in developing a plan for distribution of all disgorgement and civil penalties ordered by the SEC in accordance with various undertakings detailed at www.sec.gov/litigation/admin/ia-2451.pdf. Ameriprise Financial and its affiliates have cooperated with the SEC and the MDOC in these legal proceedings, and have made regular reports to the funds' Boards of Trustees.
Ameriprise Financial and certain of its affiliates have historically been involved in a number of legal, arbitration and regulatory proceedings, including routine litigation, class actions, and governmental actions, concerning matters arising in connection with the conduct of their business activities. Ameriprise Financial believes that the Funds are not currently the subject of, and that neither Ameriprise Financial nor any of its affiliates are the subject of, any pending legal, arbitration or regulatory proceedings that are likely to have a material adverse effect on the Funds or the ability of Ameriprise Financial or its affiliates to perform under their contracts with the Funds. Ameriprise Financial is required to make 10-Q, 10-K and, as necessary, 8-K filings with the Securities and Exchange Commission on legal and regulatory matters that
Annual Report 2013
31
Columbia Large Cap Value Fund
Notes to Financial Statements (continued)
February 28, 2013
relate to Ameriprise Financial and its affiliates. Copies of these filings may be obtained by accessing the SEC website at www.sec.gov.
There can be no assurance that these matters, or the adverse publicity associated with them, will not result in increased fund redemptions, reduced sale of fund shares or other adverse consequences to the Funds. Further, although we believe proceedings are not likely to have a material adverse effect on the Funds or the ability of Ameriprise Financial or its affiliates to perform under their contracts with the Funds, these proceedings are subject to uncertainties and, as such, we are unable to estimate the possible loss or range of loss that may result. An adverse outcome in one or more of these proceedings could result in adverse judgments, settlements, fines, penalties or other relief that could have a material adverse effect on the consolidated financial condition or results of operations of Ameriprise Financial.
Annual Report 2013
32
Columbia Large Cap Value Fund
Report of Independent Registered Public Accounting Firm
To the Trustees of Columbia Funds Series Trust and
the Shareholders of Columbia Large Cap Value Fund
In our opinion, the accompanying statement of assets and liabilities, including the portfolio of investments, and the related statements of operations and of changes in net assets and the financial highlights present fairly, in all material respects, the financial position of Columbia Large Cap Value Fund (the "Fund") (a series of Columbia Funds Series Trust) at February 28, 2013, the results of its operations for the year then ended, the changes in its net assets for each of the two years in the period then ended and the financial highlights for each of the periods indicated, in conformity with accounting principles generally accepted in the United States of America. These financial statements and financial highlights (hereafter referred to as "financial statements") are the responsibility of the Fund's management. Our responsibility is to express an opinion on these financial statements based on our audits. We conducted our audits of these financial statements in accordance with the standards of the Public Company Accounting Oversight Board (United States). Those standards require that we plan and perform the audit to obtain reasonable assurance about whether the financial statements are free of material misstatement. An audit includes examining, on a test basis, evidence supporting the amounts and disclosures in the financial statements, assessing the accounting principles used and significant estimates made by management, and evaluating the overall financial statement presentation. We believe that our audits, which included confirmation of securities at February 28, 2013 by correspondence with the custodian, transfer agent and brokers, provide a reasonable basis for our opinion.
PricewaterhouseCoopers LLP
Minneapolis, Minnesota
April 19, 2013
Annual Report 2013
33
Columbia Large Cap Value Fund
Federal Income Tax Information
(Unaudited)
The Fund hereby designates the following tax attributes for the fiscal year ended February 28, 2013. Shareholders will be notified in early 2014 of the amounts for use in preparing 2013 income tax returns.
Tax Designations:
| Qualified Dividend Income | | | 100 | % | |
| Dividends Received Deduction | | | 100 | % | |
Qualified Dividend Income. For taxable, non-corporate shareholders, the percentage of ordinary income dividends paid during the fiscal year that represents qualified dividend income subject to reduced tax rates under the Jobs and Growth Tax Relief Reconciliation Act of 2003.
Dividends Received Deduction. The percentage of ordinary income dividends paid during the fiscal year that qualifies for the corporate dividends received deduction.
Annual Report 2013
34
Columbia Large Cap Value Fund
Shareholders elect the Board that oversees the funds' operations. The Board appoints officers who are responsible for day-to-day business decisions based on policies set by the Board. The following table provides basic biographical information about the funds' Board members, including their principal occupations during the past five years, although specific titles for individuals may have varied over the period. Under current Board policy, members may serve until the next Board meeting after he or she reaches the mandatory retirement age established by the Board, or the fifteenth anniversary of the first Board meeting they attended as a member of the Board.
Mr. Edward J. Boudreau, Jr., Mr. William P. Carmichael, Mr. William A. Hawkins, Mr. R. Glenn Hilliard, Ms. Minor M. Shaw and Dr. Anthony M. Santomero, were members of the Legacy Columbia Nations funds' Board ("Nations Funds"), which includes Columbia Funds Series Trust, Columbia Funds Variable Insurance Trust I and Columbia Funds Master Investment Trust, LLC and began service on the Board for the Legacy RiverSource funds ("RiverSource Funds") effective June 1, 2011.
Independent Trustees
Name,
Address,
Year of Birth | | Position Held With
Funds and Length of
Service | | Principal Occupation
During Past Five Years | | Number of
Funds in the
Fund Family
Overseen by
Board Member | | Other Present or Past
Directorships/Trusteeships
(Within Past 5 Years) | |
Kathleen Blatz
901 S. Marquette Ave.
Minneapolis, MN 55402
1954 | | Board member since 1/06 for RiverSource Funds and since 6/11 for Nations Funds | | Attorney; Chief Justice, Minnesota Supreme Court, 1998-2006 | | | 153 | | | Director, BlueCross BlueShield of Minnesota since 2009 | |
Edward J. Boudreau, Jr.
901 S. Marquette Ave.
Minneapolis, MN 55402
1944 | | Board member since 6/11 for RiverSource Funds and since 1/05 for Nations Funds | | Managing Director, E.J. Boudreau & Associates (consulting) since 2000 | | | 151 | | | Former Trustee, BofA Funds Series Trust (11 funds) | |
Pamela G. Carlton
901 S. Marquette Ave.
Minneapolis, MN 55402
1954 | | Board member since 7/07 for RiverSource Funds and since 6/11 for Nations Funds | | President, Springboard — Partners in Cross Cultural Leadership (consulting company) since 2003 | | | 153 | | | None | |
William P. Carmichael
901 S. Marquette Ave.
Minneapolis, MN 55402
1943 | | Board member since 6/11 for RiverSource Funds and since 1999 for Nations Funds | | Retired | | | 151 | | | Director, Cobra Electronics Corporation (electronic equipment manufacturer); The Finish Line (athletic shoes and apparel) since July 2003; McMoRan Exploration Company (oil and gas exploration and development) since 2010; former Trustee, BofA Funds Series Trust (11 funds); former Director, Spectrum Brands, Inc. (consumer products); former Director, Simmons Company (bedding) | |
Patricia M. Flynn
901 S. Marquette Ave.
Minneapolis, MN 55402
1950 | | Board member since 11/04 for RiverSource Funds and since 6/11 for Nations Funds | | Trustee Professor of Economics and Management, Bentley University since 1976 | | | 153 | | | None | |
William A. Hawkins
901 S. Marquette Ave.
Minneapolis, MN 55402
1942 | | Board member since 6/11 for RiverSource Funds and since 1/05 for Nations Funds | | Managing Director, Overton Partners (financial consulting), since August 2010; President and Chief Executive Officer, California General Bank, N.A., January 2008-August 2010 | | | 151 | | | Trustee, BofA Funds Series Trust (11 funds) | |
Annual Report 2013
35
Columbia Large Cap Value Fund
Trustees and Officers (continued)
Independent Trustees (continued)
Name,
Address,
Year of Birth | | Position Held With
Funds and Length of
Service | | Principal Occupation
During Past Five Years | | Number of
Funds in the
Fund Family
Overseen by
Board Member | | Other Present or Past
Directorships/Trusteeships
(Within Past 5 Years) | |
R. Glenn Hilliard
901 S. Marquette Ave.
Minneapolis, MN 55402
1943 | | Board member since 6/11 for RiverSource Funds and since 1/05 for Nations Funds | | Chairman and Chief Executive Officer, Hilliard Group LLC (investing and consulting), since April 2003; Non-Executive Director & Chairman, CNO Financial Group, Inc. (insurance), September 2003-May 2011 | | | 151 | | | Chairman, BofA Fund Series Trust (11 funds); former Director, CNO Financial Group, Inc. (insurance) | |
Stephen R. Lewis, Jr.
901 S. Marquette Ave.
Minneapolis, MN 55402
1939 | | Chair of the Board for RiverSource Funds since 1/07, Board member for RiverSource Funds since 1/02 and since 6/11 for Nations Funds | | President Emeritus and Professor of Economics Emeritus, Carleton College since 2002 | | | 153 | | | Director, Valmont Industries, Inc. (manufacturer of irrigation systems) since 2002 | |
Catherine James Paglia
901 S. Marquette Ave.
Minneapolis, MN 55402
1952 | | Board member since 11/04 for RiverSource Funds and since 6/11 for Nations Funds | | Director, Enterprise Asset Management, Inc. (private real estate and asset management company) | | | 153 | | | Director, Valmont Industries, Inc. (manufacturer of irrigation systems) since 2012 | |
Leroy C. Richie
901 S. Marquette Ave.
Minneapolis, MN 55402
1941 | | Board member since 2000 for Legacy Seligman Funds, since 11/08 for RiverSource Funds and since 6/11 for Nations Funds | | Counsel, Lewis & Munday, P.C. (law firm) since 2004; former Vice President and General Counsel, Automotive Legal Affairs, Chrysler Corporation from 1983-1987 | | | 153 | | | Lead Outside Director, Digital Ally, Inc. (digital imaging) since September 2005; Director, Infinity, Inc. (oil and gas exploration and production) since 1994; Director, OGE Energy Corp. (energy and energy services) since November 2007 | |
Minor M. Shaw
901 S. Marquette Ave.
Minneapolis, MN 55402
1947 | | Board member since 6/11 for RiverSource Funds and since 2003 for Nations Funds | | President, Micco LLC (private investments) since 2011; President Micco Corp. since 1998 | | | 151 | | | Director, Piedmont Natural Gas; Director, BlueCross BlueShield of South Carolina since April 2008; Former Trustee, BofA Funds Series Trust (11 funds) | |
Alison Taunton-Rigby
901 S. Marquette Ave.
Minneapolis, MN 55402
1944 | | Board member since 11/02 for RiverSource Funds and since 6/11 for Nations Funds | | Chief Executive Officer and Director, RiboNovix, Inc. (biotechnology), 2003-2010 | | | 153 | | | Director, Healthways, Inc. (health and well-being improvement) since 2005; Director, ICI Mutual Insurance Company, RRG since 2011; Director, Abt Associates (government contractor) since 2001; Director, Boston Children's Hospital since 2002 | |
Annual Report 2013
36
Columbia Large Cap Value Fund
Trustees and Officers (continued)
Interested Trustee Not Affiliated With Investment Manager*
Name,
Address,
Year of Birth | | Position Held With
Funds and Length of
Service | | Principal Occupation
During Past Five Years | | Number of
Funds in the
Fund Family
Overseen by
Board Member | | Other Present or Past
Directorships/Trusteeships
(Within Past 5 Years) | |
Anthony M. Santomero
901 S. Marquette Ave.
Minneapolis, MN 55402
1946 | | Board member since 6/11 for RiverSource Funds and since 1/08 for Nations Funds | | Richard K. Mellon Professor Emeritus of Finance, The Wharton School, University of Pennsylvania, since 2002; Senior Advisor, McKinsey & Company (consulting), 2006-2008 | | | 151 | | | Director, Renaissance Reinsurance Ltd. since May 2008; Trustee, Penn Mutual Life Insurance Company since March 2008; Director, Citigroup since 2009; Director, Citibank, N.A. since 2009; former Trustee, BofA Funds Series Trust (11 funds) | |
*Dr. Santomero is not an affiliated person of the investment manager or Ameriprise Financial. However, he is currently deemed by the funds to be an "interested person" (as defined in the 1940 Act) of the funds because he serves as a Director of Citigroup, Inc. and Citibank N.A., companies that may directly or through subsidiaries and affiliates engage from time-to-time in brokerage execution, principal transactions and lending relationships with the funds or accounts advised/managed by the investment manager.
Interested Trustee Affiliated With Investment Manager*
Name,
Address,
Year of Birth | | Position Held With
Funds and Length of
Service | | Principal Occupation
During Past Five Years | | Number of
Funds in the
Fund Family
Overseen by
Board Member | | Other Present or Past
Directorships/Trusteeships
(Within Past 5 Years) | |
William F. Truscott
53600 Ameriprise
Financial Center
Minneapolis, MN 55474
1960 | | Board member since 11/01 for RiverSource Funds and since 6/11 for Nations Funds; Senior Vice President since 2002 for RiverSource Funds and 5/10 for Nations Funds | | President, Columbia Management Investment Advisers, LLC since February 2012, (previously President, Chairman of the Board and Chief Investment Officer, 2001-April 2010); Chief Executive Officer, Global Asset Management, Ameriprise Financial, Inc. since September 2012 (previously Chief Executive Officer, U.S. Asset Management & President, Annuities, May 2010-September 2012 and President — U.S. Asset Management and Chief Investment Officer, 2005-April 2010); Chief Executive Officer, Columbia Management Investment Distributors, Inc. since February 2012, (previously Chairman of the Board and Chief Executive Officer, 2006-April 2010); Chairman of the Board and Chief Executive Officer, RiverSource Distributors, Inc. since 2006; President and Chief Executive Officer, Ameriprise Certificate Company 2006-August 2012 | | | 210 | | | Chairman of the Board, Columbia Management Investment Advisers, LLC since May 2010; Director, Columbia Management Investment Distributors, Inc. since May 2010; Director, Ameriprise Certificate Company, 2006-January 2013 | |
*Interested person (as defined under the 1940 Act) by reason of being an officer, director, security holder and/or employee of the investment manager or Ameriprise Financial.
The SAI has additional information about the Fund's Board members and is available, without charge, upon request by calling 800.345.6611; contacting your financial intermediary; or visiting columbiamanagement.com.
Annual Report 2013
37
Columbia Large Cap Value Fund
Trustees and Officers (continued)
The Board has appointed officers who are responsible for day-to-day business decisions based on policies it has established. The officers serve at the pleasure of the Board. In addition to Mr. Truscott, who is Senior Vice President, the funds' other officers are:
Officers
Name,
Address,
Year of Birth | | Position Held With
Funds and Length of
Service | | Principal Occupation During Past Five Years | |
J. Kevin Connaughton
225 Franklin Street
Boston, MA 02110
1964 | | President and Principal Executive Officer since 5/10 for RiverSource Funds and 2009 for Nations Funds | | Senior Vice President and General Manager — Mutual Fund Products, Columbia Management Investment Advisers, LLC since May 2010; Managing Director of Columbia Management Advisors, LLC, December 2004-April 2010; Senior Vice President and Chief Financial Officer, Columbia Funds, June 2008-January 2009; Treasurer, Columbia Funds, October 2003-May 2008 | |
Amy K. Johnson
5228 Ameriprise Financial Center Minneapolis, MN 55474
1965 | | Vice President since 12/06 for RiverSource Funds and 5/10 for Nations Funds | | Senior Vice President and Chief Operating Officer, Columbia Management Investment Advisers, LLC since May 2010 (previously Chief Administrative Officer, 2009-April 2010 and Vice President — Asset Management and Trust Company Services, 2006-2009) | |
Michael G. Clarke
225 Franklin Street
Boston, MA 02110
1969 | | Treasurer since 1/11 and Chief Financial Officer since 4/11 for RiverSource Funds and Treasurer since 3/11 and Chief Financial Officer since 2009 for Nations Funds | | Vice President, Columbia Management Investment Advisers, LLC since May 2010; Managing Director of Fund Administration, Columbia Management Advisors, LLC, September 2004-April 2010; senior officer of Columbia Funds and affiliated funds since 2002 | |
Scott R. Plummer
5228 Ameriprise Financial Center Minneapolis, MN 55474
1959 | | Senior Vice President and Chief Legal Officer since 12/06 and Assistant Secretary since 6/11 for RiverSource Funds and Senior Vice President and Chief Legal Officer since 5/10 and Assistant Secretary since 6/11 for Nations Funds | | Senior Vice President, Chief Legal Officer and Assistant Secretary, Columbia Management Investment Advisers, LLC since June 2005; Vice President and Lead Chief Counsel — Asset Management, Ameriprise Financial, Inc. since May 2010 (previously Vice President and Chief Counsel — Asset Management, 2005-April 2010); Vice President, Chief Counsel and Assistant Secretary, Columbia Management Investment Distributors, Inc. since 2008; Vice President, General Counsel and Secretary, Ameriprise Certificate Company since 2005; Chief Counsel, RiverSource Distributors, Inc. since 2006 | |
Colin Moore
225 Franklin Street
Boston, MA 02110
1958 | | Senior Vice President since 5/10 for RiverSource Funds and Nations Funds | | Director and Chief Investment Officer, Columbia Management Investment Advisers, LLC since May 2010; Manager, Managing Director and Chief Investment Officer, Columbia Management Advisors, LLC, 2007-April 2010 | |
Thomas P. McGuire
225 Franklin Street
Boston, MA 02110
1972 | | Chief Compliance Officer since 3/12 | | Vice President — Asset Management Compliance, Columbia Management Investment Advisers, LLC since 2010; Chief Compliance Officer, Ameriprise Certificate Company since September 2010; Compliance Executive, Bank of America, 2005-2010 | |
Stephen T. Welsh
225 Franklin Street
Boston, MA 02110
1957 | | Vice President since 4/11 for RiverSource Funds and 2006 for Nations Funds | | President and Director, Columbia Management Investment Services Corp. since May 2010; President and Director, Columbia Management Services, Inc., July 2004- April 2010; Managing Director, Columbia Management Distributors, Inc., August 2007-April 2010 | |
Christopher O. Petersen
5228 Ameriprise Financial Center Minneapolis, MN 55474
1970 | | Vice President and Secretary since 4/11 for RiverSource Funds and 3/11 for Nations Funds | | Vice President and Chief Counsel, Ameriprise Financial, Inc. since January 2010 (formerly Vice President and Group Counsel or Counsel, April 2004-January 2010); Assistant Secretary of Legacy RiverSource Funds, January 2007-April 2011 and of the Nations Funds, May 2010-March 2011 | |
Annual Report 2013
38
Columbia Large Cap Value Fund
Trustees and Officers (continued)
Officers (continued)
Name,
Address,
Year of Birth | | Position Held With
Funds and Length of
Service | | Principal Occupation During Past Five Years | |
Paul D. Pearson
10468 Ameriprise Financial Center Minneapolis, MN 55474
1956 | | Vice President since 4/11 and Assistant Treasurer since 1999 for RiverSource Funds and Vice President and Assistant Treasurer since 6/11 for Nations Funds | | Vice President — Investment Accounting, Columbia Management Investment Advisers, LLC, since May 2010; Vice President — Managed Assets, Investment Accounting, Ameriprise Financial Corporation, February 1998-May 2010 | |
Joseph F. DiMaria
225 Franklin Street
Boston, MA 02110
1968 | | Vice President and Chief Accounting Officer since 4/11 and Vice President since 3/11 and Chief Accounting Officer since 2008 for Nations Funds | | Vice President, Mutual Fund Administration, Columbia Management Investment Advisers, LLC, since May 2010; Director of Fund Administration, Columbia Management Advisors, LLC, January 2006-April 2010 | |
Paul B. Goucher
100 Park Avenue
New York, NY 10017
1968 | | Vice President since 4/11 and Assistant Secretary since 11/08 for RiverSource Funds and 5/10 for Nations Funds | | Vice President and Lead Chief Counsel, Ameriprise Financial, Inc. since November 2008 and January 2013, respectively (formerly, Chief Counsel, January 2010-January 2013 and Group Counsel from November 2008- January 2010); Director, Managing Director and General Counsel, J. & W. Seligman & Co. Incorporated, July 2008-November 2008 (previously, Managing Director and Associate General Counsel, January 2005-July 2008) | |
Michael E. DeFao
225 Franklin Street
Boston, MA 02110
1968 | | Vice President since 4/11 and Assistant Secretary since 5/10 for RiverSource Funds and 2011 for Nations Funds | | Vice President and Chief Counsel, Ameriprise Financial, Inc. since May 2010; Associate General Counsel, Bank of America, June 2005-April 2010 | |
Annual Report 2013
39
Columbia Large Cap Value Fund
Shareholder Meeting Results
Special Meeting of Shareholders Held on February 27, 2013 (Unaudited)
Columbia Large Cap Value Fund
At a Joint Special Meeting of Shareholders held on February 27, 2013 (the "Meeting"), shareholders of the Fund approved an Agreement and Plan of Reorganization pursuant to which the Fund will transfer its assets to Columbia Equity Value Fund (the "Acquiring Fund") in exchange for shares of the Acquiring Fund and the assumption by the Acquiring Fund of the Fund's liabilities. The votes cast for or against as well as the number of abstentions and broker non-votes as to the proposal are set forth below. A vote is based on the total number of Fund shares outstanding as of the record date for the Meeting.
| Votes For | | Votes Against | | Abstentions | | Broker Non-Votes | |
| | 30,394,038 | | | | 597,640 | | | | 1,074,570 | | | | 0 | | |
Annual Report 2013
40
Columbia Large Cap Value Fund
Important Information About This Report
Each fund mails one shareholder report to each shareholder address. If you would like more than one report, please call shareholder services at 800.345.6611 and additional reports will be sent to you.
The policy of the Board is to vote the proxies of the companies in which each fund holds investments consistent with the procedures as stated in the Statement of Additional Information (SAI). You may obtain a copy of the SAI without charge by calling 800.345.6611; contacting your financial intermediary; visiting columbiamanagement.com; or searching the website of the Securities and Exchange Commission (SEC) at sec.gov. Information regarding how each fund voted proxies relating to portfolio securities is filed with the SEC by August 31 for the most recent 12-month period ending June 30 of that year, and is available without charge by visiting columbiamanagement.com; or searching the website of the SEC at sec.gov.
Each fund files a complete schedule of portfolio holdings with the SEC for the first and third quarters of each fiscal year on Form N-Q. Each fund's Form N-Q is available on the SEC's website at sec.gov and may be reviewed and copied at the SEC's Public Reference Room in Washington, D.C. Information on the operation of the Public Reference Room may be obtained by calling 800.SEC.0330. Each fund's complete schedule of portfolio holdings, as filed on Form N-Q, can also be obtained without charge, upon request, by calling 800.345.6611.
Annual Report 2013
41

Columbia Large Cap Value Fund
P.O. Box 8081
Boston, MA 02266-8081
columbiamanagement.com
This information is for use with concurrent or prior delivery of a fund prospectus. Please read and consider the investment objectives, risks, charges and expenses for any fund carefully before investing. For a prospectus which contains this and other important information about the Fund go to columbiamanagement.com. The Fund is distributed by Columbia Management Investment Distributors, Inc., member FINRA, and managed by Columbia Management Investment Advisers, LLC.
© 2013 Columbia Management Investment Advisers, LLC. All rights reserved.
ANN176_02_C01_(04/13)
Item 2. Code of Ethics.
(a) The registrant has adopted a code of ethics that applies to the registrant’s principal executive officer, principal financial officer, principal accounting officer or controller, or persons performing similar functions, regardless of whether these individuals are employed by the registrant or a third party.
(b) During the period covered by this report, there were not any amendments to a provision of the code of ethics adopted in 2(a) above.
(c) During the period covered by this report, there were no waivers, including any implicit waivers, from a provision of the code of ethics described in 2(a) above that relates to one or more of the items set forth in paragraph (b) of this item’s instructions.
Item 3. Audit Committee Financial Expert.
The registrant’s Board of Trustees has determined that Edward J. Boudreau, Pamela G. Carlton, William P. Carmichael, William A. Hawkins and Alison Taunton-Rigby, each of whom are members of the registrant’s Board of Trustees and Audit Committee, each qualify as an audit committee financial expert. Mr. Boudreau, Ms. Carlton, Mr. Carmichael, Mr. Hawkins and Ms. Taunton-Rigby are each independent trustees, as defined in paragraph (a)(2) of this item’s instructions.
Item 4. Principal Accountant Fees and Services.
Fee information below is disclosed for the eighteen series of the registrant whose report to stockholders are included in this annual filing. Fee information for fiscal year ended February 29, 2012 also includes fees for one series that merged during the period.
(a) Audit Fees. Aggregate Audit Fees billed by the principal accountant for professional services rendered during the fiscal years ended February 28, 2013 and February 29, 2012 are approximately as follows:
2013 | | 2012 | |
$ | 361,800 | | $ | 579,500 | |
| | | | | |
Audit Fees include amounts related to the audit of the registrant’s annual financial statements or services that are normally provided by the accountant in connection with statutory and regulatory filings or engagements for those fiscal years.
(b) Audit-Related Fees. Aggregate Audit-Related Fees billed to the registrant by the principal accountant for professional services rendered during the fiscal years ended February 28, 2013 and February 29, 2012 are approximately as follows:
2013 | | 2012 | |
$ | 9,700 | | $ | 132,500 | |
| | | | | |
Audit-Related Fees include amounts for assurance and related services by the principal accountant that are reasonably related to the performance of the audit of the registrant’s financial statements and are not reported in Audit Fees above. In both fiscal years 2013 and 2012, Audit-Related Fees consist of agreed-upon procedures performed for semi-annual shareholder reports and agreed- upon procedures related to fund mergers. Fiscal year 2012 also included Audit-Related Fees for agreed-upon procedures for fund accounting and custody conversions.
The fees for the fiscal years ended February 28, 2013 and February 29, 2012 shown below for audit-related services rendered to the registrant’s investment adviser and any entity controlling, controlled by, or under common control with the investment adviser that provides ongoing services to the registrant that were required to be pre-approved by the registrant’s Audit Committee are approximately as follows:
Fiscal year 2013 includes fees billed for the review and provision of consent in connection with fund mergers.
(c) Tax Fees. Aggregate Tax Fees billed by the principal accountant to the registrant for professional services rendered during the fiscal years ended February 28, 2013 and February 29, 2012 are approximately as follows:
2013 | | 2012 | |
$ | 86,900 | | $ | 103,800 | |
| | | | | |
Tax Fees include amounts for the review of annual tax returns, the review of required shareholder distribution calculations and typically include amounts for professional services by the principal accountant for tax compliance, tax advice and tax planning. In both fiscal years 2013 and 2012, Tax Fees also include agreed-upon procedures related to foreign tax filings. In fiscal year 2012, Tax Fees also include agreed-upon procedures related to fund mergers and the review of final tax returns.
During the fiscal years ended February 28, 2013 and February 29, 2012, there were no Tax Fees billed by the registrant’s principal accountant to the registrant’s investment adviser (not including any sub-adviser whose role is primarily portfolio management and is subcontracted with or overseen by another investment adviser) and any entity controlling, controlled by, or under common control with the adviser that provides
ongoing services to the registrant for an engagement that related directly to the operations and financial reporting of the registrant.
(d) All Other Fees. Aggregate All Other Fees billed by the principal accountant to the registrant for professional services rendered during the fiscal years ended February 28, 2013 and February 29, 2012 are approximately as follows:
All Other Fees include amounts for products and services provided by the principal accountant, other than the services reported in paragraphs (a) through (c) above.
Aggregate All Other Fees billed by the registrant’s principal accountant to the registrant’s investment adviser (not including any sub-adviser whose role is primarily portfolio management and is subcontracted with or overseen by another investment adviser) and any entity controlling, controlled by, or under common control with the adviser that provides ongoing services to the registrant for an engagement that related directly to the operations and financial reporting of the registrant during the fiscal years ended February 28, 2013 and February 29, 2012 are approximately as follows:
2013 | | 2012 | |
$ | 115,000 | | $ | 395,800 | |
| | | | | |
In both fiscal years 2013 and 2012, All Other Fees consist of fees billed for internal control examinations of the registrant’s transfer agent and investment advisor.
(e)(1) Audit Committee Pre-Approval Policies and Procedures
The registrant’s Audit Committee is required to pre-approve the engagement of the registrant’s independent accountants to provide audit and non-audit services to the registrant and non-audit services to its investment adviser (not including any sub-adviser whose role is primarily portfolio management and is subcontracted with or overseen by another investment adviser) or any entity controlling, controlled by or under common control with such investment adviser that provides ongoing services to the registrant (“Adviser Affiliates”), if the engagement relates directly to the operations and financial reporting of the registrant.
The Audit Committee has adopted a Policy for Engagement of Independent Accountants for Audit and Non-Audit Services (“Policy”). The Policy sets forth the understanding of the Audit Committee regarding the engagement of the registrant’s independent accountants to provide (i) audit and permissible audit-related, tax and other services to the registrant (collectively “Fund Services”); (ii) non-audit services to the registrant’s investment adviser (not including any sub-adviser whose role is primarily portfolio management and is subcontracted with or overseen by another investment adviser) and Adviser Affiliates, if the engagement relates directly to the operations or financial
reporting of a Fund (collectively “Fund-related Adviser Services”); and (iii) certain other audit and non-audit services to the registrant’s investment adviser (not including any sub-adviser whose role is primarily portfolio management and is subcontracted with or overseen by another investment adviser) and Adviser Affiliates. As set forth in this Fund Policy, a service will require specific pre-approval by the Audit Committee if it is to be provided by the Fund’s independent auditor; provided, however, that pre-approval of non-audit services to the Fund, the Adviser or Control Affiliates may be waived if certain de minimis requirements set forth in the SEC’s rules are met.
Under the Policy, the Audit Committee may delegate pre-approval authority to any pre-designated member or members who are Independent Trustees/Directors. The member(s) to whom such authority is delegated must report, for informational purposes only, any pre-approval decisions to the Audit Committee at its next regular meeting. The Audit Committee’s responsibilities with respect to the pre-approval of services performed by the independent accountants may not be delegated to management.
On an annual basis, at a regularly scheduled Audit Committee meeting, the Fund’s Treasurer or other Fund Officer shall submit to the Audit Committee a schedule of the types of Fund Services and Fund-related Adviser Services that are subject to specific pre-approval.
This schedule will provide a description of each type of service that is subject to specific pre-approval, along with total projected fees for each service. The pre-approval will generally cover a one-year period. The Audit Committee will review and approve the types of services and the projected fees for the next one-year period and may add to, or subtract from, the list of pre-approved services from time to time, based on subsequent determinations. This specific approval acknowledges that the Audit Committee is in agreement with the types of services that the independent accountants will be permitted to perform.
The Fund’s Treasurer or other Fund Officer shall report to the Audit Committee at each of its regular meetings regarding all Fund Services or Fund-related Adviser Services initiated since the last such report was rendered, including a general description of the services with forecasted fees for the annual period, proposed changes requiring specific pre-approval and a description of services provided by the independent auditor with actual fees during the current reporting period.
*****
(e)(2) 100% of the services performed for items (b) through (d) above during 2013 and 2012 were pre-approved by the registrant’s Audit Committee.
(f) Not applicable.
(g) The aggregate non-audit fees billed by the registrant’s accountant for services rendered to the registrant, and rendered to the registrant’s investment adviser (not including any sub-adviser whose role is primarily portfolio management and is
subcontracted with or overseen by another investment adviser), and any entity controlling, controlled by, or under common control with the adviser that provides ongoing services to the registrant for the fiscal years ended February 28, 2013 and February 29, 2012 are approximately as follows:
2013 | | 2012 | |
$ | 215,900 | | $ | 632,100 | |
| | | | | |
(h) The registrant’s Audit Committee of the Board of Directors has considered whether the provision of non-audit services that were rendered to the registrant’s adviser (not including any sub-adviser whose role is primarily portfolio management and is subcontracted with or overseen by another investment adviser), and any entity controlling, controlled by, or under common control with the investment adviser that provides ongoing services to the registrant that were not pre-approved pursuant to paragraph (c)(7)(ii) of Rule 2-01 of Regulation S-X, is compatible with maintaining the principal accountant’s independence.
Item 5. Audit Committee of Listed Registrants.
Not applicable.
Item 6. Investments
(a) The registrant’s “Schedule I – Investments in securities of unaffiliated issuers” (as set forth in 17 CFR 210.12-12) is included in Item 1 of this Form N-CSR.
(b) Not applicable.
Item 7. Disclosure of Proxy Voting Policies and Procedures for Closed-End Management Investment Companies.
Not applicable.
Item 8. Portfolio Managers of Closed-End Management Investment Companies.
Not applicable.
Item 9. Purchases of Equity Securities by Closed-End Management Investment Company and Affiliated Purchasers.
Not applicable.
Item 10. Submission of Matters to a Vote of Security Holders.
There were no material changes to the procedures by which shareholders may recommend nominees to the registrant’s board of directors.
Item 11. Controls and Procedures.
(a) The registrant’s principal executive officer and principal financial officers, based on their evaluation of the registrant’s disclosure controls and procedures as of a date within 90 days of the filing of this report, have concluded that such controls and procedures are adequately designed to ensure that material information required to be disclosed by the registrant in Form N-CSR is accumulated and communicated to the registrant’s management, including the principal executive officer and principal financial officer, or persons performing similar functions, as appropriate to allow timely decisions regarding required disclosure.
(b) There was no change in the registrant’s internal control over financial reporting that occurred during the registrant’s second fiscal quarter of the period covered by this report that has materially affected, or is reasonably likely to materially affect, the registrant’s internal control over financial reporting.
Item 12. Exhibits.
(a)(1) Code of ethics required to be disclosed under Item 2 of Form N-CSR attached hereto as Exhibit 99.CODE ETH.
(a)(2) Certifications pursuant to Rule 30a-2(a) under the Investment Company Act of 1940 (17 CFR 270.30a-2(a)) attached hereto as Exhibit 99.CERT.
(a)(3) Not applicable.
(b) Certification pursuant to Rule 30a-2(b) under the Investment Company Act of 1940 (17 CFR 270.30a-2(b)) attached hereto as Exhibit 99.906CERT.
SIGNATURES
Pursuant to the requirements of the Securities Exchange Act of 1934 and the Investment Company Act of 1940, the registrant has duly caused this report to be signed on its behalf by the undersigned, thereunto duly authorized.
(registrant) | | Columbia Funds Series Trust | |
| | | |
| | | |
By (Signature and Title) | | /s/ J. Kevin Connaughton | |
| | J. Kevin Connaughton, President and Principal Executive Officer | |
| | | |
| | | |
Date | | April 22, 2013 | |
| | | |
| | | |
Pursuant to the requirements of the Securities Exchange Act of 1934 and the Investment Company Act of 1940, this report has been signed below by the following persons on behalf of the registrant and in the capacities and on the dates indicated. |
| | | |
| | | |
By (Signature and Title) | | /s/ J. Kevin Connaughton | |
| | J. Kevin Connaughton, President and Principal Executive Officer | |
| | | |
| | | |
Date | | April 22, 2013 | |
| | | |
| | | |
By (Signature and Title) | | /s/ Michael G. Clarke | |
| | Michael G. Clarke, Treasurer and Chief Financial Officer | |
| | | |
| | | |
Date | | April 22, 2013 | |
| | | | | |