UNITED STATES
SECURITIES AND EXCHANGE COMMISSION
Washington, D.C. 20549
FORM N-CSR
CERTIFIED SHAREHOLDER REPORT OF REGISTERED
MANAGEMENT INVESTMENT COMPANIES
Investment Company Act file number | 811-09645 |
|
Columbia Funds Series Trust |
(Exact name of registrant as specified in charter) |
|
225 Franklin Street, Boston, Massachusetts | | 02110 |
(Address of principal executive offices) | | (Zip code) |
|
Scott R. Plummer 5228 Ameriprise Financial Center Minneapolis, MN 55474 |
(Name and address of agent for service) |
|
Registrant’s telephone number, including area code: | 1-612-671-1947 | |
|
Date of fiscal year end: | April 30 | |
|
Date of reporting period: | April 30, 2013 | |
| | | | | | | | |
Form N-CSR is to be used by management investment companies to file reports with the Commission not later than 10 days after the transmission to stockholders of any report that is required to be transmitted to stockholders under Rule 30e-1 under the Investment Company Act of 1940 (17 CFR 270.30e-1). The Commission may use the information provided on Form N-CSR in its regulatory, disclosure review, inspection, and policymaking roles.
A registrant is required to disclose the information specified by Form N-CSR, and the Commission will make this information public. A registrant is not required to respond to the collection of information contained in Form N-CSR unless the Form displays a currently valid Office of Management and Budget (“OMB”) control number. Please direct comments concerning the accuracy of the information collection burden estimate and any suggestions for reducing the burden to Secretary, Securities and Exchange Commission, 450 Fifth Street, NW, Washington, DC 20549-0609. The OMB has reviewed this collection of information under the clearance requirements of 44 U.S.C. § 3507.
Item 1. Reports to Stockholders.
Annual Report
April 30, 2013

Columbia Georgia Intermediate Municipal Bond Fund
Not FDIC insured • No bank guarantee • May lose value
Columbia Georgia Intermediate Municipal Bond Fund
 Dear Shareholders,
U.S. equities had a strong first quarter
Similar to 2012, equities once again were the best performing asset class in the first quarter of 2013. The S&P 500 Index reached an all-time closing high on the last trading day of the quarter and pushed through its October 2007 peak. Although global equities have performed well year-to-date, there is significant performance divergence among regions. In local currency terms, Japanese equities were the best performing developed market globally, and U.S. stocks outperformed most other global equity markets. European equities rose in the first quarter but trailed U.S. stocks and had a turbulent March, as investors were reminded of instability in the eurozone with news of a banking crisis in Cyprus.
Although all 10 sectors of the S&P 500 Index delivered positive returns, this was a rally led by defensive stocks such as those in health care, consumer staples and utilities. Materials and technology stocks were the weakest sectors.
High yield leads fixed income; most sectors flat to down
The fixed-income markets lagged equities with modest, single-digit returns coming from municipals and high-yield sectors in the United States. Most government and investment-grade credit sectors were roughly flat to down for the first quarter of 2013. Emerging market bonds were the biggest disappointment with single-digit losses.
Columbia Management to begin delivering summary prospectuses
Each Columbia fund is required to update its prospectus on an annual basis. Beginning with June 2013 prospectus updates, shareholders of Columbia retail mutual funds will start to receive a summary prospectus, rather than the full length (statutory) mutual fund prospectus they have received in the past.
Each fund's summary prospectus will include the following key information:
> Investment objective
> Fee and expense table
> Portfolio turnover rate information
> Principal investment strategies, principal risks and performance information
> Management information
> Purchase and sale information
> Tax information
> Financial intermediary compensation information
Each fund's statutory prospectus will contain additional information about the fund and its risks. Both the statutory and summary prospectus will be updated each year, and will be available at columbiamanagement.com. Shareholders may request a printed version of a statutory prospectus at no cost by calling 800.345.6611 or sending an email to serviceinquiries@columbiamanagement.com.
Stay on track with Columbia Management
Backed by more than 100 years of experience, Columbia Management is one of the nation's largest asset managers. At the heart of our success — and, most importantly, that of our investors — are highly talented industry professionals, brought together by a unique way of working. We are dedicated to helping you take advantage of today's opportunities and anticipate tomorrow's. We stay abreast of the latest investment trends and ideas, using our collective insight to evaluate events and transform them into solutions you can use.
Visit columbiamanagement.com for:
> The Columbia Management Perspectives blog, featuring timely posts by our investment teams
> Detailed up-to-date fund performance and portfolio information
> Economic analysis and market commentary
> Quarterly fund commentaries
> Columbia Management Investor, our award-winning quarterly newsletter for shareholders
Thank you for your continued support of the Columbia Funds. We look forward to serving your investment needs for many years to come.
Best Regards,

J. Kevin Connaughton
President, Columbia Funds
The S&P 500 Index, an unmanaged index, measures the performance of 500 large-capitalization U.S. stocks and is frequently used as a general measure of market performance. Indices are not available for investment, are not professionally managed and do not reflect sales charges, fees, brokerage commissions, taxes or other expenses of investing.
Investors should consider the investment objectives, risks, charges and expenses of a mutual fund carefully before investing. For a free prospectus, which contains this and other important information about a fund, visit columbiamanagement.com. The prospectus should be read carefully before investing.
Columbia Funds are distributed by Columbia Management Investment Distributors, Inc., member FINRA, and managed by Columbia Management Investment Advisers, LLC.
© 2013 Columbia Management Investment Advisers, LLC. All rights reserved.
Columbia Georgia Intermediate Municipal Bond Fund
Performance Overview | | | 2 | | |
Manager Discussion of Fund Performance | | | 4 | | |
Understanding Your Fund's Expenses | | | 6 | | |
Portfolio of Investments | | | 7 | | |
Statement of Assets and Liabilities | | | 12 | | |
Statement of Operations | | | 14 | | |
Statement of Changes in Net Assets | | | 15 | | |
Financial Highlights | | | 17 | | |
Notes to Financial Statements | | | 22 | | |
Report of Independent Registered
Public Accounting Firm | | | 27 | | |
Federal Income Tax Information | | | 28 | | |
Trustees and Officers | | | 29 | | |
Approval of Investment Management Services Agreement | | | 34 | | |
Important Information About This Report | | | 37 | | |
Fund Investment Manager
Columbia Management Investment
Advisers, LLC
225 Franklin Street
Boston, MA 02110
Fund Distributor
Columbia Management Investment
Distributors, Inc.
225 Franklin Street
Boston, MA 02110
Fund Transfer Agent
Columbia Management Investment
Services Corp.
P.O. Box 8081
Boston, MA 02266-8081
For more information about any of the funds, please visit columbiamanagement.com or call 800.345.6611. Customer Service Representatives are available to answer your questions Monday through Friday from 8 a.m. to 8 p.m. Eastern time.
The views expressed in this report reflect the current views of the respective parties. These views are not guarantees of future performance and involve certain risks, uncertainties and assumptions that are difficult to predict, so actual outcomes and results may differ significantly from the views expressed. These views are subject to change at any time based upon economic, market or other conditions and the respective parties disclaim any responsibility to update such views. These views may not be relied on as investment advice and, because investment decisions for a Columbia Fund are based on numerous factors, may not be relied on as an indication of trading intent on behalf of any particular Columbia Fund. References to specific securities should not be construed as a recommendation or investment advice.
Annual Report 2013
Columbia Georgia Intermediate Municipal Bond Fund
Performance Summary
> Columbia Georgia Intermediate Municipal Bond Fund (the Fund) Class A shares returned 3.16% excluding sales charges for the 12-month period that ended April 30, 2013.
> The Fund underperformed its benchmark, the Barclays 3-15 Year Blend Municipal Bond Index, which returned 4.35% during the same 12-month period.
> The Fund's maturity positioning generally accounted for its shortfall relative to the benchmark.
Average Annual Total Returns (%) (for period ended April 30, 2013)
| | Inception | | 1 Year | | 5 Years | | 10 Years | |
Class A | | 05/04/92 | | | | | | | |
Excluding sales charges | | | | | 3.16 | | | | 4.80 | | | | 3.77 | | |
Including sales charges | | | | | -0.23 | | | | 4.10 | | | | 3.43 | | |
Class B | | 06/07/93 | | | | | | | |
Excluding sales charges | | | | | 2.48 | | | | 4.01 | | | | 3.00 | | |
Including sales charges | | | | | -0.52 | | | | 4.01 | | | | 3.00 | | |
Class C | | 06/17/92 | | | | | | | |
Excluding sales charges | | | | | 2.48 | | | | 4.03 | | | | 3.01 | | |
Including sales charges | | | | | 1.48 | | | | 4.03 | | | | 3.01 | | |
Class R4* | | 03/19/13 | | | 3.42 | | | | 5.05 | | | | 4.03 | | |
Class Z | | 03/01/92 | | | 3.51 | | | | 5.07 | | | | 4.04 | | |
Barclays 3-15 Year Blend Municipal Bond Index | | | | | 4.35 | | | | 5.91 | | | | 4.85 | | |
Returns for Class A are shown with and without the maximum initial sales charge of 3.25%. Returns for Class B are shown with and without the applicable contingent deferred sales charge (CDSC) of 3.00% in the first year, declining to 1.00% in the fourth year and eliminated thereafter. Returns for Class C are shown with and without the 1.00% CDSC for the first year only. The Fund's other classes are not subject to sales charges and have limited eligibility. Please see the Fund's prospectuses for details. Performance for different share classes will vary based on differences in sales charges and fees associated with each class. All results shown assume reinvestment of distributions during the period. Returns do not reflect the deduction of taxes that a shareholder may pay on Fund distributions or on the redemption of Fund shares. Performance results reflect the effect of any fee waivers or reimbursements of Fund expenses by Columbia Management Investment Advisers, LLC and/or any of its affiliates. Absent these fee waivers or expense reimbursement arrangements, performance results would have been lower.
The performance information shown represents past performance and is not a guarantee of future results. The investment return and principal value of your investment will fluctuate so that your shares, when redeemed, may be worth more or less than their original cost. Current performance may be lower or higher than the performance information shown. You may obtain performance information current to the most recent month-end by contacting your financial intermediary, visiting columbiamanagement.com or calling 800.345.6611.
*The returns shown for periods prior to the share class inception date (including returns for the Life of the Fund, if shown, which are since Fund inception) include the returns of the Fund's oldest share class. These returns are adjusted to reflect any higher class-related operating expenses of the newer share classes, as applicable. Please visit columbiamanagement.com/mutual-funds/appended-performance for more information.
The Barclays 3-15 Year Blend Municipal Bond Index is an unmanaged index that tracks the performance of municipal bonds issued after December 31, 1990, with remaining maturities between 2 and 17 years and at least $7 million in principal amount outstanding.
Indices are not available for investment, are not professionally managed and do not reflect sales charges, fees, brokerage commissions, taxes or other expenses of investing. Securities in the Fund may not match those in an index.
Annual Report 2013
2
Columbia Georgia Intermediate Municipal Bond Fund
Performance Overview (continued)
Performance of a Hypothetical $10,000 Investment (May 1, 2003 – April 30, 2013)
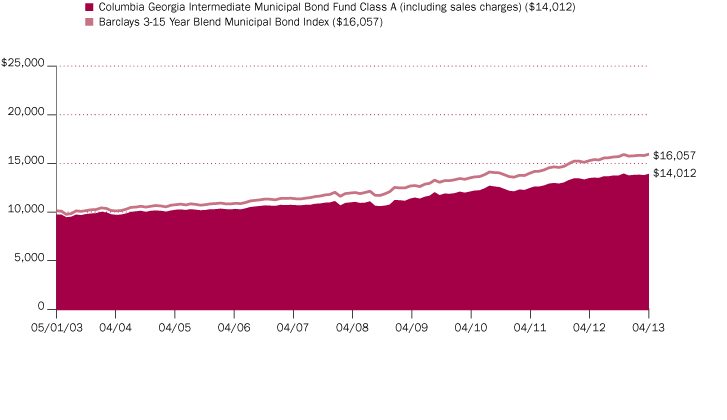
The chart above shows the change in value of a hypothetical $10,000 investment in Class A shares of Columbia Georgia Intermediate Municipal Bond Fund during the stated time period, and does not reflect the deduction of taxes that a shareholder may pay on Fund distributions or on the redemption of Fund shares.
Annual Report 2013
3
Columbia Georgia Intermediate Municipal Bond Fund
Manager Discussion of Fund Performance
For the 12-month period that ended April 30, 2013, the Fund's Class A shares returned 3.16% excluding sales charges. The Fund's benchmark, the Barclays 3-15 Year Blend Municipal Bond Index, returned 4.35% for the same 12-month period. The Fund's maturity positioning generally accounted for its shortfall relative to the index. The Fund had more exposure to the shortest maturities in the intermediate range and slightly less exposure in the 12- to 17-year range, which were the period's best performers.
U.S. Economy: Growth in the Slow Lane
Europe's general economic woes, a financial crisis in Cyprus and U.S. struggles to avoid a fiscal cliff of tax increases and various spending cuts (commonly referred to as the sequester) weighed on the global economy throughout the 12-month period ended April 30, 2013. Late in the period, the sequester clouded consumer confidence in the United States, even though it has had little material impact on the economy to date. However, a decrease in the U.S. unemployment rate early in 2013, steady manufacturing activity and a rebound in the housing market are encouraging signs that growth has broadened in recent months. Pent-up demand, low mortgage rates and an improving labor market have lifted home sales. Even so, there has been no real improvement in the overall pace of economic growth since the current cycle of recovery began in 2009. Household income growth is practically nonexistent, and household spending has come under pressure after the expiration of the payroll tax cut. Against this backdrop, U.S. investors bid prices higher on stocks and other volatile assets as central banks continued to pour liquidity into key markets.
Municipal Market Generates Solid Returns
The U.S. municipal bond market delivered modest, but solid, returns for the 12-month period. Yields fell across all maturities, rallying strongly after the November presidential election. The market sold off in December, but the retreat was short lived, as weaker economic numbers early in 2013 sent fixed-income investors back to the relative safety of the municipal market. At year end, municipal yields were eight, 18 and 25 basis points lower for five, 10 and 15-year maturities compared to one year ago. Higher quality bonds generally underperformed lower quality bonds. Pre-refunded bonds, which are higher quality and generally shorter in maturity, were the weakest sector among municipals. A pre-refunded bond is created when an issuer refinances existing debt at a lower rate. The proceeds from the lower-yielding issue are invested in U.S. Treasury securities and used to repay the original bond at its original call date. Hospital bonds were generally the strongest performers. Local general obligation bonds outperformed state general obligation bonds by a small margin. For the second consecutive year, rating agencies issued more downgrades than upgrades in the overall municipal market, as a lackluster economy continued to pressure issuers.
Maturity Positioning, Security Selection Hampered Returns
The Fund generated positive returns for the 12-month period. However, it lagged its benchmark because it had more exposure than the index to the very short end of the yield curve and less exposure to the 12- to 17-year segment of the curve,
Portfolio Management
Brian McGreevy
Quality Breakdown (%)
(at April 30, 2013) | |
AAA rating | | | 8.6 | | |
AA rating | | | 49.4 | | |
A rating | | | 31.6 | | |
BBB rating | | | 9.2 | | |
Non rated | | | 1.2 | | |
Total | | | 100.0 | | |
Percentages indicated are based upon total fixed income securities (excluding Money Market Funds).
Bond ratings apply to the underlying holdings of the Fund and not the Fund itself and are divided into categories ranging from AAA (highest) to D (lowest), and are subject to change. The ratings shown are determined by using the middle rating of Moody's, S&P, and Fitch after dropping the highest and lowest available ratings. When a rating from only two agencies is available, the lower rating is used. When a rating from only one agency is available, that rating is used. When a bond is not rated by any of these agencies, it is designated as Not rated. Credit ratings are subjective opinions and not statements of fact.
Annual Report 2013
4
Columbia Georgia Intermediate Municipal Bond Fund
Manager Discussion of Fund Performance (continued)
which did the best for the period. By contrast, an overweight in the eight- to 12-year segment was positive for performance.
Security selection was also a slight drag on returns. The Fund's ratings profile was similar to the index, with slightly less weight in the very highest-rated credits — a plus, since higher quality underperformed for the period. However, the Fund's A rated holdings did not generate returns that were as good as those generated by the index for that same category. The Fund's general obligation bonds, which are generally of higher quality, lagged over the period. Hospital and water and sewer bonds were the Fund's strongest performers, with returns in excess of the benchmark return.
During the period, we added exposure to the longer end of the yield curve, purchasing state general obligation bonds, bonds backed by several colleges and local issues in the 12- to 17-year maturity range.
Job Growth Drives Georgia Recovery
Hiring has picked up across a range of industries in Georgia, with particular strength in consumer services, which is tied to rising hopes for a real recovery in the housing market. The leisure/hospitality and professional/business services industries have actually surpassed their prerecession employment peaks, and transportation and financial services are once again contributing to growth. Job growth is expected to slow as spending cuts that are the result of sequestration will hurt Georgia more than most other states. Yet, in our view, the many drivers of growth in the state offer strong support for Georgia to become an above-average performer economically over the longer term.
Looking Ahead
In this environment, we will expect to continue to emphasize the quality, sector and maturity profile of the Fund versus its benchmarks, and we expect to seek out issues rated A and BBB across sectors that mature in 10-14 years, while maintaining a dollar-weighted average portfolio maturity of between three and ten years, as we believe they are currently attractive. With a seasoned staff of credit professionals, we believe we are well positioned to discover value opportunities that offer incremental yield and appropriate fundamentals among Georgia municipal bonds.
Annual Report 2013
5
Columbia Georgia Intermediate Municipal Bond Fund
Understanding Your Fund's Expenses
(Unaudited)
As an investor, you incur two types of costs. There are transaction costs, which generally include sales charges on purchases and may include redemption fees. There are also ongoing costs, which generally include management fees, distribution and service (Rule 12b-1) fees, and other fund expenses. The following information is intended to help you understand your ongoing costs (in dollars) of investing in the Fund and to help you compare these costs with the ongoing costs of investing in other mutual funds.
Analyzing Your Fund's Expenses
To illustrate these ongoing costs, we have provided examples and calculated the expenses paid by investors in each share class of the Fund during the period. The actual and hypothetical information in the table is based on an initial investment of $1,000 at the beginning of the period indicated and held for the entire period. Expense information is calculated two ways and each method provides you with different information. The amount listed in the "Actual" column is calculated using the Fund's actual operating expenses and total return for the period. You may use the Actual information, together with the amount invested, to estimate the expenses that you paid over the period. Simply divide your account value by $1,000 (for example, an $8,600 account value divided by $1,000 = 8.6), then multiply the results by the expenses paid during the period under the Actual column. The amount listed in the "Hypothetical" column assumes a 5% annual rate of return before expenses (which is not the Fund's actual return) and then applies the Fund's actual expense ratio for the period to the hypothetical return. You should not use the hypothetical account values and expenses to estimate either your actual account balance at the end of the period or the expenses you paid during the period. See "Compare With Other Funds" below for details on how to use the hypothetical data.
Compare With Other Funds
Since all mutual funds are required to include the same hypothetical calculations about expenses in shareholder reports, you can use this information to compare the ongoing cost of investing in the Fund with other funds. To do so, compare the hypothetical example with the 5% hypothetical examples that appear in the shareholder reports of other funds. As you compare hypothetical examples of other funds, it is important to note that hypothetical examples are meant to highlight the ongoing costs of investing in a fund only and do not reflect any transaction costs, such as sales charges, or redemption or exchange fees. Therefore, the hypothetical calculations are useful in comparing ongoing costs only, and will not help you determine the relative total costs of owning different funds. If transaction costs were included in these calculations, your costs would be higher.
November 1, 2012 – April 30, 2013
| | Account Value at the Beginning
of the Period ($) | | Account Value at the End of the
Period ($) | | Expenses Paid During the
Period ($) | | Fund's Annualized
Expense Ratio (%) | |
| | Actual | | Hypothetical | | Actual | | Hypothetical | | Actual | | Hypothetical | | Actual | |
Class A | | | 1,000.00 | | | | 1,000.00 | | | | 1,010.80 | | | | 1,020.78 | | | | 4.04 | | | | 4.06 | | | | 0.81 | | |
Class B | | | 1,000.00 | | | | 1,000.00 | | | | 1,007.90 | | | | 1,017.06 | | | | 7.77 | | | | 7.80 | | | | 1.56 | | |
Class C | | | 1,000.00 | | | | 1,000.00 | | | | 1,007.90 | | | | 1,017.06 | | | | 7.77 | | | | 7.80 | | | | 1.56 | | |
Class R4 | | | 1,000.00 | | | | 1,000.00 | | | | 1,010.70 | * | | | 1,022.17 | | | | 0.60 | * | | | 2.66 | | | | 0.53 | * | |
Class Z | | | 1,000.00 | | | | 1,000.00 | | | | 1,013.00 | | | | 1,022.02 | | | | 2.80 | | | | 2.81 | | | | 0.56 | | |
*For the period March 19, 2013 through April 30, 2013. Class R4 shares commenced operations on March 19, 2013.
Expenses paid during the period are equal to the annualized expense ratio for each class as indicated above, multiplied by the average account value over the period and then multiplied by the number of days in the Fund's most recent fiscal half year and divided by 365.
Expenses do not include fees and expenses incurred indirectly by the Fund from the underlying funds in which the Fund may invest (also referred to as "acquired funds"), including affiliated and non-affiliated pooled investment vehicles (including mutual funds and exchange-traded funds).
Had Columbia Management Investment Advisers, LLC and/or certain of its affiliates not waived/reimbursed certain fees and expenses, account value at the end of the period would have been reduced.
Annual Report 2013
6
Columbia Georgia Intermediate Municipal Bond Fund
Portfolio of Investments
April 30, 2013
(Percentages represent value of investments compared to net assets)
Municipal Bonds 98.2%
Issue
Description | | Coupon
Rate | | Principal
Amount ($) | | Value ($) | |
Airport 1.8% | |
City of Atlanta Department of Aviation
Refunding Revenue Bonds
Series 2010C
01/01/25 | | | 5.000 | % | | | 1,500,000 | | | | 1,759,050 | | |
Forest Products 1.1% | |
Richmond County Development Authority
Revenue Bonds
International Paper Co. Project
Series 2001A
03/01/15 | | | 5.150 | % | | | 1,000,000 | | | | 1,071,880 | | |
Higher Education 10.9% | |
Athens Housing Authority
Refunding Revenue Bonds
UGAREF East
Series 2010
12/01/16 | | | 4.000 | % | | | 250,000 | | | | 276,902 | | |
UGAREF East Campus Housing
Series 2011
12/01/25 | | | 5.000 | % | | | 1,000,000 | | | | 1,181,350 | | |
Bleckley County & Dodge County Joint Development Authority
Revenue Bonds
Middle Georgia College
Series 2008
07/01/21 | | | 5.000 | % | | | 1,260,000 | | | | 1,404,723 | | |
Bulloch County Development Authority
Refunding Revenue Bonds
Georgia Southern University Housing Foundation
Series 2012 (AGM)
08/01/27 | | | 5.000 | % | | | 1,000,000 | | | | 1,150,760 | | |
Revenue Bonds
Georgia Southern University Housing Foundation Four
Series 2008 (AGM)
07/01/20 | | | 5.250 | % | | | 1,000,000 | | | | 1,190,840 | | |
Carrollton Payroll Development Authority
Refunding Revenue Bonds
Anticipation Certificates - UWG Campus Center
Series 2012 (AGM)
08/01/25 | | | 5.000 | % | | | 1,225,000 | | | | 1,435,296 | | |
DeKalb Newton & Gwinnett Counties Joint Development Authority
Revenue Bonds
GGC Foundation LLC Project
Series 2009
07/01/24 | | | 5.500 | % | | | 2,500,000 | | | | 2,900,650 | | |
South Regional Joint Development Authority
Revenue Bonds
VSU Auxiliary Services-Student
Series 2008A
08/01/23 | | | 5.000 | % | | | 1,125,000 | | | | 1,270,384 | | |
Total | | | | | | | 10,810,905 | | |
Municipal Bonds (continued)
Issue
Description | | Coupon
Rate | | Principal
Amount ($) | | Value ($) | |
Hospital 8.1% | |
Cobb County Kennestone Hospital Authority
Refunding Revenue Bonds
Anticipation Certificates
Series 2012
04/01/29 | | | 5.000 | % | | | 1,500,000 | | | | 1,761,330 | | |
Revenue Bonds
Certificates
Series 2005B (AMBAC)
04/01/16 | | | 4.000 | % | | | 1,110,000 | | | | 1,208,080 | | |
DeKalb Private Hospital Authority
Revenue Bonds
Children's Healthcare
Series 2009
11/15/17 | | | 5.000 | % | | | 320,000 | | | | 375,411 | | |
Fayette County Hospital Authority
Revenue Bonds
Fayette Community Hospital
Series 2009A
06/15/23 | | | 5.250 | % | | | 2,000,000 | | | | 2,381,900 | | |
Gwinnett County Hospital Authority
Revenue Bonds
Gwinnet Hospital System
Series 2007A (AGM)
07/01/23 | | | 5.000 | % | | | 2,000,000 | | | | 2,268,860 | | |
Total | | | | | | | 7,995,581 | | |
Joint Power Authority 4.1% | |
Municipal Electric Authority of Georgia
Revenue Bonds
Project One
Subordinated Series 2008A
01/01/21 | | | 5.250 | % | | | 1,395,000 | | | | 1,737,166 | | |
Subordinated Series 2008D
01/01/23 | | | 6.000 | % | | | 1,000,000 | | | | 1,221,400 | | |
Series 1992B (NPFGC)
01/01/16 | | | 6.375 | % | | | 1,000,000 | | | | 1,108,410 | | |
Total | | | | | | | 4,066,976 | | |
Local Appropriation 7.5% | |
Atlanta Public Safety & Judicial Facilities Authority
Revenue Bonds
Public Safety Facility Project
Series 2006 (AGM)
12/01/17 | | | 5.000 | % | | | 1,310,000 | | | | 1,496,112 | | |
Clayton County Development Authority
Refunding Revenue Bonds
Tuff Archives LLC
Series 2012
07/01/24 | | | 5.000 | % | | | 1,295,000 | | | | 1,561,148 | | |
The accompanying Notes to Financial Statements are an integral part of this statement.
Annual Report 2013
7
Columbia Georgia Intermediate Municipal Bond Fund
Portfolio of Investments (continued)
April 30, 2013
Municipal Bonds (continued)
Issue
Description | | Coupon
Rate | | Principal
Amount ($) | | Value ($) | |
Fulton County Facilities Corp.
Certificate of Participation
Fulton County Public Purpose Project
Series 2009
11/01/17 | | | 5.000 | % | | | 1,000,000 | | | | 1,159,000 | | |
Winder-Barrow Industrial Building Authority
Refunding Revenue Bonds
City of Winder Project
Series 2012 (AGM)
12/01/24 | | | 5.000 | % | | | 2,650,000 | | | | 3,182,624 | | |
Total | | | | | | | 7,398,884 | | |
Local General Obligation 19.0% | |
Atlanta Solid Waste Management Authority
Refunding Revenue Bonds
Series 2008 (AGM)
12/01/17 | | | 5.000 | % | | | 795,000 | | | | 943,864 | | |
Barrow County School District
Unrefunded Unlimited General Obligation Bonds
Series 2006
02/01/14 | | | 5.000 | % | | | 335,000 | | | | 346,939 | | |
Cherokee County Board of Education
Unlimited General Obligation Bonds
Series 2009A
08/01/22 | | | 5.000 | % | | | 2,000,000 | | | | 2,384,660 | | |
City of Atlanta
Unlimited General Obligation Public Improvement Bonds
Series 2004B (NPFGC)
12/01/18 | | | 5.000 | % | | | 1,000,000 | | | | 1,068,140 | | |
City of Calhoun
Unlimited General Obligation Bonds
School
Series 2012
09/01/29 | | | 4.000 | % | | | 1,500,000 | | | | 1,626,390 | | |
College Park Business & Industrial Development Authority
Refunding Revenue Bonds
Civic Center Project
Series 2005 (AMBAC)
09/01/19 | | | 5.250 | % | | | 2,000,000 | | | | 2,266,300 | | |
Douglas County School District
Unlimited General Obligation Bonds
Series 2007 (AGM)
04/01/21 | | | 5.000 | % | | | 2,000,000 | | | | 2,308,880 | | |
Gwinnett County School District
Unlimited General Obligation Refunding Bonds
Series 2010
02/01/24 | | | 5.000 | % | | | 1,500,000 | | | | 1,958,475 | | |
Habersham County School District
Refunding Unlimited General Obligation Bonds
Series 2013
04/01/27 | | | 5.000 | % | | | 1,500,000 | | | | 1,827,255 | | |
Municipal Bonds (continued)
Issue
Description | | Coupon
Rate | | Principal
Amount ($) | | Value ($) | |
Savannah-Chatham County School District
Unlimited General Obligation Refunding Bonds
Series 2002 (AGM)
08/01/14 | | | 5.250 | % | | | 1,000,000 | | | | 1,062,500 | | |
Series 2004 (AGM)
08/01/19 | | | 5.250 | % | | | 2,000,000 | | | | 2,492,880 | | |
Thomas County School District
Unlimited General Obligation Bonds
Sales Tax
Series 2012
03/01/18 | | | 5.000 | % | | | 500,000 | | | | 592,815 | | |
Total | | | | | | | 18,879,098 | | |
Multi-Family 5.8% | |
Cobb County Development Authority
Revenue Bonds
KSU Village Real Estate
Series 2007A (AMBAC)
07/15/27 | | | 5.250 | % | | | 2,250,000 | | | | 2,347,988 | | |
Kennesaw State University-Housing
Series 2004A (NPFGC)
07/15/19 | | | 5.250 | % | | | 2,000,000 | | | | 2,103,220 | | |
Lawrenceville Housing Authority
Revenue Bonds
Housing-Knollwood Park Apartments Project
Series 1997 (FNMA) AMT(a)(b)
12/01/29 | | | 6.250 | % | | | 445,000 | | | | 455,328 | | |
Richmond County Development Authority
Refunding Revenue Bonds
ASU Jaguar Student Housing
Series 2012 (AGM)
02/01/27 | | | 5.000 | % | | | 750,000 | | | | 862,860 | | |
Total | | | | | | | 5,769,396 | | |
Municipal Power 3.5% | |
City of Griffin
Refunding Revenue Bonds
Series 2012 (AGM)
01/01/22 | | | 4.000 | % | | | 1,500,000 | | | | 1,695,570 | | |
Guam Power Authority
Refunding Revenue Bonds
Series 2012A (AGM)(c)
10/01/24 | | | 5.000 | % | | | 220,000 | | | | 265,540 | | |
Puerto Rico Electric Power Authority
Refunding Revenue Bonds
Series 2002JJ (XLCA)(c)
07/01/16 | | | 5.375 | % | | | 1,405,000 | | | | 1,504,235 | | |
Total | | | | | | | 3,465,345 | | |
The accompanying Notes to Financial Statements are an integral part of this statement.
Annual Report 2013
8
Columbia Georgia Intermediate Municipal Bond Fund
Portfolio of Investments (continued)
April 30, 2013
Municipal Bonds (continued)
Issue
Description | | Coupon
Rate | | Principal
Amount ($) | | Value ($) | |
Prepaid Gas 0.3% | |
Main Street Natural Gas, Inc.
Revenue Bonds
Series 2007A
09/15/19 | | | 5.250 | % | | | 295,000 | | | | 342,206 | | |
Refunded/Escrowed 5.6% | |
County of Fulton Water & Sewerage
Revenue Bonds
Series 2004 (NPFGC/FGIC)
01/01/30 | | | 5.000 | % | | | 1,500,000 | | | | 1,547,625 | | |
Gwinnett County School District
Prerefunded 02/01/18 Unlimited General Obligation Bonds
Series 2008
02/01/22 | | | 5.000 | % | | | 1,000,000 | | | | 1,196,450 | | |
State of Georgia
Prerefunded 12/01/17 Unlimited General Obligation Bonds
Series 2007G
12/01/20 | | | 5.000 | % | | | 1,000,000 | | | | 1,195,680 | | |
Walton County School District
Prerefunded 08/01/15 Unlimited General Obligation Bonds
Series 2005A (NPFGC)
08/01/22 | | | 5.000 | % | | | 1,500,000 | | | | 1,652,130 | | |
Total | | | | | | | 5,591,885 | | |
Special Non Property Tax 6.5% | |
Cobb-Marietta Coliseum & Exhibit Hall Authority
Refunding Revenue Bonds
Series 2005 (NPFGC)
10/01/19 | | | 5.250 | % | | | 2,430,000 | | | | 2,980,249 | | |
Metropolitan Atlanta Rapid Transit Authority
Refunding Revenue Bonds
Series 1992N (NPFGC/BNY)
07/01/18 | | | 6.250 | % | | | 1,770,000 | | | | 2,008,578 | | |
Territory of Guam
Revenue Bonds
Series 2011A(c)
01/01/31 | | | 5.000 | % | | | 300,000 | | | | 336,483 | | |
Virgin Islands Public Finance Authority
Refunding Revenue Bonds
Gross Receipts Taxes
Series 2012A(c)
10/01/22 | | | 4.000 | % | | | 1,000,000 | | | | 1,076,120 | | |
Total | | | | | | | 6,401,430 | | |
Special Property Tax 1.7% | |
City of Atlanta
Refunding Tax Allocation Bonds
Atlanta Station Project
Series 2007 (AGM)
12/01/20 | | | 5.250 | % | | | 1,545,000 | | | | 1,720,466 | | |
Municipal Bonds (continued)
Issue
Description | | Coupon
Rate | | Principal
Amount ($) | | Value ($) | |
State General Obligation 4.1% | |
State of Georgia
Unlimited General Obligation Bonds
Series 2009D
05/01/23 | | | 5.000 | % | | | 2,000,000 | | | | 2,406,360 | | |
Series 2012A
07/01/31 | | | 4.000 | % | | | 1,500,000 | | | | 1,663,845 | | |
Total | | | | | | | 4,070,205 | | |
Transportation 3.5% | |
Georgia State Road & Tollway Authority
Revenue Bonds
Federal Highway Grant
BAN Series 2006 (NPFGC)
06/01/16 | | | 5.000 | % | | | 2,000,000 | | | | 2,263,740 | | |
BAN Series 2009A
06/01/21 | | | 5.000 | % | | | 1,000,000 | | | | 1,195,890 | | |
Total | | | | | | | 3,459,630 | | |
Water & Sewer 14.7% | |
Augusta Water & Sewerage
Refunding Revenue Bonds
Series 2007 (AGM)
10/01/21 | | | 5.000 | % | | | 1,000,000 | | | | 1,178,080 | | |
10/01/22 | | | 5.000 | % | | | 2,000,000 | | | | 2,349,520 | | |
City of Atlanta Water & Wastewater
Revenue Bonds
Series 2009B (AGM)
11/01/17 | | | 5.000 | % | | | 2,000,000 | | | | 2,343,800 | | |
County of DeKalb
Refunding Revenue Bond
Water & Sewerage
Series 2006B
10/01/21 | | | 5.250 | % | | | 2,000,000 | | | | 2,523,420 | | |
Jackson County Water & Sewer Authority
Revenue Bonds
Series 2006A (XLCA)
09/01/16 | | | 5.000 | % | | | 1,030,000 | | | | 1,131,661 | | |
Upper Oconee Basin Water Authority
Refunding Revenue Bonds
Series 2005 (NPFGC)
07/01/17 | | | 5.000 | % | | | 1,140,000 | | | | 1,328,305 | | |
07/01/22 | | | 5.000 | % | | | 1,855,000 | | | | 2,031,930 | | |
Walton County Water & Sewer Authority
Revenue Bonds
Hard Labor Creek Project
Series 2008 (AGM)
02/01/25 | | | 5.000 | % | | | 1,495,000 | | | | 1,726,815 | | |
Total | | | | | | | 14,613,531 | | |
Total Municipal Bonds
(Cost: $89,323,177) | | | | | | | 97,416,468 | | |
The accompanying Notes to Financial Statements are an integral part of this statement.
Annual Report 2013
9
Columbia Georgia Intermediate Municipal Bond Fund
Portfolio of Investments (continued)
April 30, 2013
Money Market Funds 1.0%
| | | Shares | | Value ($) | |
JPMorgan Tax-Free Money Market
Fund, 0.000%(d) | | | 1,002,793 | | | | 1,002,793 | | |
Total Money Market Funds
(Cost: $1,002,793) | | | | | 1,002,793 | | |
Total Investments
(Cost: $90,325,970) | | | | | 98,419,261 | | |
Other Assets & Liabilities, Net | | | | | 770,700 | | |
Net Assets | | | | | 99,189,961 | | |
Notes to Portfolio of Investments
(a) Income from this security may be subject to alternative minimum tax.
(b) Variable rate security.
(c) Municipal obligations include debt obligations issued by or on behalf of territories, possessions, or sovereign nations within the territorial boundaries of the United States. At April 30, 2013, the value of these securities amounted to $3,182,378 or 3.21% of net assets.
(d) The rate shown is the seven-day current annualized yield at April 30, 2013.
Abbreviation Legend
AGM Assured Guaranty Municipal Corporation
AMBAC Ambac Assurance Corporation
AMT Alternative Minimum Tax
BAN Bond Anticipation Note
BNY Bank of New York
FGIC Financial Guaranty Insurance Company
FNMA Federal National Mortgage Association
NPFGC National Public Finance Guarantee Corporation
XLCA XL Capital Assurance
Fair Value Measurements
Generally accepted accounting principles (GAAP) require disclosure regarding the inputs and valuation techniques used to measure fair value and any changes in valuation inputs or techniques. In addition, investments shall be disclosed by major category.
The Fund categorizes its fair value measurements according to a three-level hierarchy that maximizes the use of observable inputs and minimizes the use of unobservable inputs by prioritizing that the most observable input be used when available. Observable inputs are those that market participants would use in pricing an investment based on market data obtained from sources independent of the reporting entity. Unobservable inputs are those that reflect the Fund's assumptions about the information market participants would use in pricing an investment. An investment's level within the fair value hierarchy is based on the lowest level of any input that is deemed significant to the asset or liability's fair value measurement. The input levels are not necessarily an indication of the risk or liquidity associated with investments at that level. For example, certain U.S. government securities are generally high quality and liquid, however, they are reflected as Level 2 because the inputs used to determine fair value may not always be quoted prices in an active market.
Fair value inputs are summarized in the three broad levels listed below:
> Level 1 — Valuations based on quoted prices for investments in active markets that the Fund has the ability to access at the measurement date (including NAV for open-end mutual funds). Valuation adjustments are not applied to Level 1 investments.
> Level 2 — Valuations based on other significant observable inputs (including quoted prices for similar securities, interest rates, prepayment speeds, credit risks, etc.).
> Level 3 — Valuations based on significant unobservable inputs (including the Fund's own assumptions and judgment in determining the fair value of investments).
The accompanying Notes to Financial Statements are an integral part of this statement.
Annual Report 2013
10
Columbia Georgia Intermediate Municipal Bond Fund
Portfolio of Investments (continued)
April 30, 2013
Fair Value Measurements (continued)
Inputs that are used in determining fair value of an investment may include price information, credit data, volatility statistics, and other factors. These inputs can be either observable or unobservable. The availability of observable inputs can vary between investments, and is affected by various factors such as the type of investment, and the volume and level of activity for that investment or similar investments in the marketplace. The inputs will be considered by the Investment Manager, along with any other relevant factors in the calculation of an investment's fair value. The Fund uses prices and inputs that are current as of the measurement date, which may include periods of market dislocations. During these periods, the availability of prices and inputs may be reduced for many investments. This condition could cause an investment to be reclassified between the various levels within the hierarchy.
Investments falling into the Level 3 category are primarily supported by quoted prices from brokers and dealers participating in the market for those investments. However, these may be classified as Level 3 investments due to lack of market transparency and corroboration to support these quoted prices. Additionally, valuation models may be used as the pricing source for any remaining investments classified as Level 3. These models may rely on one or more significant unobservable inputs and/or significant assumptions by the Investment Manager. Inputs used in valuations may include, but are not limited to, financial statement analysis, capital account balances, discount rates and estimated cash flows, and comparable company data.
Under the direction of the Fund's Board of Trustees (the Board), the Investment Manager's Valuation Committee (the Committee) is responsible for carrying out the valuation procedures approved by the Board. The Committee consists of voting and non-voting members from various groups within the Investment Manager's organization, including operations and accounting, trading and investments, compliance, risk management and legal.
The Committee meets at least monthly to review and approve valuation matters, which may include a description of specific valuation determinations, data regarding pricing information received from approved pricing vendors and brokers and the results of Board-approved valuation control policies and procedures (the Policies). The Policies address, among other things, instances when market quotations are readily available, including recommendations of third party pricing vendors and a determination of appropriate pricing methodologies; events that require specific valuation determinations and assessment of fair value techniques; securities with a potential for stale pricing, including those that are illiquid, restricted, or in default; and the effectiveness of third-party pricing vendors, including periodic reviews of vendors. The Committee meets more frequently, as needed, to discuss additional valuation matters, which may include the need to review back-testing results, review time-sensitive information or approve related valuation actions. The Committee reports to the Board, with members of the Committee meeting with the Board at each of its regularly scheduled meetings to discuss valuation matters and actions during the period, similar to those described earlier.
For investments categorized as Level 3, the Committee monitors information similar to that described above, which may include: (i) data specific to the issuer or comparable issuers, (ii) general market or specific sector news and (iii) quoted prices and specific or similar security transactions. The Committee considers this data and any changes from prior periods in order to assess the reasonableness of observable and unobservable inputs, any assumptions or internal models used to value those securities and changes in fair value. This data is also used to corroborate, when available, information received from approved pricing vendors and brokers. Various factors impact the frequency of monitoring this information (which may occur as often as daily). However, the Committee may determine that changes to inputs, assumptions and models are not required as a result of the monitoring procedures performed.
The following table is a summary of the inputs used to value the Fund's investments at April 30, 2013:
Description | | Level 1
Quoted Prices in Active
Markets for Identical
Assets ($) | | Level 2
Other Significant
Observable Inputs ($) | | Level 3
Significant
Unobservable Inputs ($) | | Total ($) | |
Bonds | |
Municipal Bonds | | | — | | | | 97,416,468 | | | | — | | | | 97,416,468 | | |
Total Bonds | | | — | | | | 97,416,468 | | | | — | | | | 97,416,468 | | |
Other | |
Money Market Funds | | | 1,002,793 | | | | — | | | | — | | | | 1,002,793 | | |
Total Other | | | 1,002,793 | | | | — | | | | — | | | | 1,002,793 | | |
Total | | | 1,002,793 | | | | 97,416,468 | | | | — | | | | 98,419,261 | | |
See the Portfolio of Investments for all investment classifications not indicated in the table.
The Fund's assets assigned to the Level 2 input category are generally valued using the market approach, in which a security's value is determined through reference to prices and information from market transactions for similar or identical assets.
There were no transfers of financial assets between Levels 1 and 2 during the period.
The accompanying Notes to Financial Statements are an integral part of this statement.
Annual Report 2013
11
Columbia Georgia Intermediate Municipal Bond Fund
Statement of Assets and Liabilities
April 30, 2013
Assets | |
Investments, at value | |
(identified cost $90,325,970) | | $ | 98,419,261 | | |
Receivable for: | |
Capital shares sold | | | 67,767 | | |
Interest | | | 1,214,816 | | |
Expense reimbursement due from Investment Manager | | | 435 | | |
Prepaid expenses | | | 685 | | |
Total assets | | | 99,702,964 | | |
Liabilities | |
Payable for: | |
Capital shares purchased | | | 134,982 | | |
Dividend distributions to shareholders | | | 239,715 | | |
Investment management fees | | | 1,087 | | |
Distribution and/or service fees | | | 271 | | |
Transfer agent fees | | | 16,894 | | |
Administration fees | | | 190 | | |
Compensation of board members | | | 90,333 | | |
Other expenses | | | 29,531 | | |
Total liabilities | | | 513,003 | | |
Net assets applicable to outstanding capital stock | | $ | 99,189,961 | | |
Represented by | |
Paid-in capital | | $ | 90,411,100 | | |
Undistributed net investment income | | | 165,802 | | |
Accumulated net realized gain | | | 519,768 | | |
Unrealized appreciation (depreciation) on: | |
Investments | | | 8,093,291 | | |
Total — representing net assets applicable to outstanding capital stock | | $ | 99,189,961 | | |
The accompanying Notes to Financial Statements are an integral part of this statement.
Annual Report 2013
12
Columbia Georgia Intermediate Municipal Bond Fund
Statement of Assets and Liabilities (continued)
April 30, 2013
Class A | |
Net assets | | $ | 21,516,592 | | |
Shares outstanding | | | 1,918,890 | | |
Net asset value per share | | $ | 11.21 | | |
Maximum offering price per share(a) | | $ | 11.59 | | |
Class B | |
Net assets | | $ | 216,118 | | |
Shares outstanding | | | 19,260 | | |
Net asset value per share | | $ | 11.22 | | |
Class C | |
Net assets | | $ | 4,300,807 | | |
Shares outstanding | | | 383,364 | | |
Net asset value per share | | $ | 11.22 | | |
Class R4 | |
Net assets | | $ | 2,525 | | |
Shares outstanding | | | 225 | | |
Net asset value per share(b) | | $ | 11.20 | | |
Class Z | |
Net assets | | $ | 73,153,919 | | |
Shares outstanding | | | 6,522,620 | | |
Net asset value per share | | $ | 11.22 | | |
(a) The maximum offering price per share is calculated by dividing the net asset value by 1.0 minus the maximum sales charge of 3.25%.
(b) Net asset value per share rounds to this amount due to fractional shares outstanding.
The accompanying Notes to Financial Statements are an integral part of this statement.
Annual Report 2013
13
Columbia Georgia Intermediate Municipal Bond Fund
Statement of Operations
Year Ended April 30, 2013
Net investment income | |
Income: | |
Dividends | | $ | 192 | | |
Interest | | | 3,714,307 | | |
Total income | | | 3,714,499 | | |
Expenses: | |
Investment management fees | | | 414,216 | | |
Distribution and/or service fees | |
Class A | | | 51,886 | | |
Class B | | | 2,626 | | |
Class C | | | 42,779 | | |
Transfer agent fees | |
Class A | | | 40,362 | | |
Class B | | | 510 | | |
Class C | | | 8,317 | | |
Class Z | | | 152,155 | | |
Administration fees | | | 72,488 | | |
Compensation of board members | | | 23,453 | | |
Custodian fees | | | 2,176 | | |
Printing and postage fees | | | 46,634 | | |
Registration fees | | | 690 | | |
Professional fees | | | 34,818 | | |
Other | | | 9,617 | | |
Total expenses | | | 902,727 | | |
Fees waived or expenses reimbursed by Investment Manager and its affiliates | | | (226,902 | ) | |
Total net expenses | | | 675,825 | | |
Net investment income | | | 3,038,674 | | |
Realized and unrealized gain (loss) — net | |
Net realized gain (loss) on: | |
Investments | | | 617,336 | | |
Net realized gain | | | 617,336 | | |
Net change in unrealized appreciation (depreciation) on: | |
Investments | | | (210,967 | ) | |
Net change in unrealized appreciation (depreciation) | | | (210,967 | ) | |
Net realized and unrealized gain | | | 406,369 | | |
Net increase in net assets resulting from operations | | $ | 3,445,043 | | |
The accompanying Notes to Financial Statements are an integral part of this statement.
Annual Report 2013
14
Columbia Georgia Intermediate Municipal Bond Fund
Statement of Changes in Net Assets
| | | Year Ended
April 30,
2013(a) | | Year Ended
April 30,
2012(b) | | Year Ended
March 31,
2012 | |
Operations | |
Net investment income | | $ | 3,038,674 | | | $ | 270,367 | | | $ | 3,218,869 | | |
Net realized gain | | | 617,336 | | | | 1,328 | | | | 89,867 | | |
Net change in unrealized appreciation (depreciation) | | | (210,967 | ) | | | 812,629 | | | | 5,603,483 | | |
Net increase in net assets resulting from operations | | | 3,445,043 | | | | 1,084,324 | | | | 8,912,219 | | |
Distributions to shareholders | |
Net investment income | |
Class A | | | (576,263 | ) | | | (47,105 | ) | | | (581,420 | ) | |
Class B | | | (5,354 | ) | | | (660 | ) | | | (9,810 | ) | |
Class C | | | (86,232 | ) | | | (7,119 | ) | | | (80,774 | ) | |
Class R4 | | | (9 | ) | | | — | | | | — | | |
Class Z | | | (2,370,817 | ) | | | (206,766 | ) | | | (2,560,819 | ) | |
Net realized gains | |
Class A | | | (16,344 | ) | | | — | | | | — | | |
Class B | | | (190 | ) | | | — | | | | — | | |
Class C | | | (3,430 | ) | | | — | | | | — | | |
Class Z | | | (62,446 | ) | | | — | | | | — | | |
Total distributions to shareholders | | | (3,121,085 | ) | | | (261,650 | ) | | | (3,232,823 | ) | |
Increase (decrease) in net assets from capital stock activity | | | (5,196,092 | ) | | | (129,978 | ) | | | (11,131,127 | ) | |
Total increase (decrease) in net assets | | | (4,872,134 | ) | | | 692,696 | | | | (5,451,731 | ) | |
Net assets at beginning of year | | | 104,062,095 | | | | 103,369,399 | | | | 108,821,130 | | |
Net assets at end of year | | $ | 99,189,961 | | | $ | 104,062,095 | | | $ | 103,369,399 | | |
Undistributed net investment income | | $ | 165,802 | | | $ | 165,803 | | | $ | 157,086 | | |
(a) Class R4 shares are for the period from March 19, 2013 (commencement of operations) to April 30, 2013.
(b) For the period from April 1, 2012 to April 30, 2012. During the period, the Fund's fiscal year end was changed from March 31 to April 30.
The accompanying Notes to Financial Statements are an integral part of this statement.
Annual Report 2013
15
Columbia Georgia Intermediate Municipal Bond Fund
Statement of Changes in Net Assets (continued)
| | | Year Ended April 30,
2013(a) | | Year Ended April 30,
2012(b) | | Year Ended March 31,
2012 | |
| | | Shares | | Dollars ($) | | Shares | | Dollars ($) | | Shares | | Dollars ($) | |
Capital stock activity | |
Class A shares | |
Subscriptions(c) | | | 309,194 | | | | 3,462,505 | | | | 21,093 | | | | 235,451 | | | | 192,801 | | | | 2,103,521 | | |
Distributions reinvested | | | 39,862 | | | | 447,356 | | | | 2,857 | | | | 31,937 | | | | 31,915 | | | | 349,426 | | |
Redemptions | | | (207,091 | ) | | | (2,324,482 | ) | | | (11,268 | ) | | | (125,579 | ) | | | (331,602 | ) | | | (3,581,870 | ) | |
Net increase (decrease) | | | 141,965 | | | | 1,585,379 | | | | 12,682 | | | | 141,809 | | | | (106,886 | ) | | | (1,128,923 | ) | |
Class B shares | |
Subscriptions | | | 164 | | | | 1,846 | | | | 14 | | | | 154 | | | | 256 | | | | 2,783 | | |
Distributions reinvested | | | 284 | | | | 3,188 | | | | 42 | | | | 466 | | | | 494 | | | | 5,410 | | |
Redemptions(c) | | | (14,501 | ) | | | (162,758 | ) | | | (29 | ) | | | (318 | ) | | | (17,757 | ) | | | (193,559 | ) | |
Net increase (decrease) | | | (14,053 | ) | | | (157,724 | ) | | | 27 | | | | 302 | | | | (17,007 | ) | | | (185,366 | ) | |
Class C shares | |
Subscriptions | | | 127,657 | | | | 1,430,778 | | | | 202 | | | | 2,272 | | | | 87,482 | | | | 965,912 | | |
Distributions reinvested | | | 6,054 | | | | 67,973 | | | | 474 | | | | 5,294 | | | | 4,844 | | | | 53,110 | | |
Redemptions | | | (100,765 | ) | | | (1,127,857 | ) | | | (16,748 | ) | | | (186,566 | ) | | | (44,600 | ) | | | (487,616 | ) | |
Net increase (decrease) | | | 32,946 | | | | 370,894 | | | | (16,072 | ) | | | (179,000 | ) | | | 47,726 | | | | 531,406 | | |
Class R4 shares | |
Subscriptions | | | 224 | | | | 2,500 | | | | — | | | | — | | | | — | | | | — | | |
Distributions reinvested | | | 1 | | | | 6 | | | | — | | | | — | | | | — | | | | — | | |
Net increase | | | 225 | | | | 2,506 | | | | — | | | | — | | | | — | | | | — | | |
Class Z shares | |
Subscriptions | | | 778,048 | | | | 8,731,054 | | | | 29,958 | | | | 334,239 | | | | 834,015 | | | | 9,196,772 | | |
Distributions reinvested | | | 12,415 | | | | 139,348 | | | | 631 | | | | 7,056 | | | | 6,602 | | | | 72,210 | | |
Redemptions | | | (1,415,307 | ) | | | (15,867,549 | ) | | | (39,111 | ) | | | (434,384 | ) | | | (1,811,102 | ) | | | (19,617,226 | ) | |
Net decrease | | | (624,844 | ) | | | (6,997,147 | ) | | | (8,522 | ) | | | (93,089 | ) | | | (970,485 | ) | | | (10,348,244 | ) | |
Total net decrease | | | (463,761 | ) | | | (5,196,092 | ) | | | (11,885 | ) | | | (129,978 | ) | | | (1,046,652 | ) | | | (11,131,127 | ) | |
(a) Class R4 shares are for the period from March 19, 2013 (commencement of operations) to April 30, 2013.
(b) For the period from April 1, 2012 to April 30, 2012. During the period, the Fund's fiscal year end was changed from March 31 to April 30.
(c) Includes conversions of Class B shares to Class A shares, if any.
The accompanying Notes to Financial Statements are an integral part of this statement.
Annual Report 2013
16
Columbia Georgia Intermediate Municipal Bond Fund
The following tables are intended to help you understand the Fund's financial performance. Certain information reflects financial results for a single share of a class held for the periods shown. Per share net investment income (loss) amounts are calculated based on average shares outstanding during the period. Total return assumes reinvestment of all dividends and distributions, if any. Total return does not reflect payment of sales charges, if any, and is not annualized for periods of less than one year.
| | | Year Ended April 30, | | Year Ended March 31, | |
Class A | | 2013 | | 2012(a) | | 2012 | | 2011 | | 2010 | | 2009 | |
Per share data | |
Net asset value, beginning of period | | $ | 11.18 | | | $ | 11.09 | | | $ | 10.50 | | | $ | 10.58 | | | $ | 10.18 | | | $ | 10.35 | | |
Income from investment operations: | |
Net investment income | | | 0.31 | | | | 0.03 | | | | 0.33 | | | | 0.33 | | | | 0.34 | | | | 0.37 | | |
Net realized and unrealized gain (loss) | | | 0.04 | | | | 0.09 | | | | 0.59 | | | | (0.08 | ) | | | 0.40 | | | | (0.17 | ) | |
Total from investment operations | | | 0.35 | | | | 0.12 | | | | 0.92 | | | | 0.25 | | | | 0.74 | | | | 0.20 | | |
Less distributions to shareholders: | |
Net investment income | | | (0.31 | ) | | | (0.03 | ) | | | (0.33 | ) | | | (0.33 | ) | | | (0.34 | ) | | | (0.37 | ) | |
Net realized gains | | | (0.01 | ) | | | — | | | | — | | | | — | | | | — | | | | — | | |
Total distributions to shareholders | | | (0.32 | ) | | | (0.03 | ) | | | (0.33 | ) | | | (0.33 | ) | | | (0.34 | ) | | | (0.37 | ) | |
Net asset value, end of period | | $ | 11.21 | | | $ | 11.18 | | | $ | 11.09 | | | $ | 10.50 | | | $ | 10.58 | | | $ | 10.18 | | |
Total return | | | 3.16 | % | | | 1.05 | % | | | 8.85 | % | | | 2.35 | % | | | 7.31 | % | | | 2.04 | % | |
Ratios to average net assets(b)(c) | |
Total gross expenses | | | 1.03 | % | | | 1.02 | %(d) | | | 1.04 | % | | | 0.99 | % | | | 0.95 | % | | | 0.92 | % | |
Total net expenses(e) | | | 0.81 | % | | | 0.80 | %(d) | | | 0.80 | %(f) | | | 0.80 | %(f) | | | 0.78 | %(f) | | | 0.75 | %(f) | |
Net investment income | | | 2.77 | % | | | 2.92 | %(d) | | | 2.99 | % | | | 3.09 | % | | | 3.20 | % | | | 3.67 | % | |
Supplemental data | |
Net assets, end of period (in thousands) | | $ | 21,517 | | | $ | 19,861 | | | $ | 19,563 | | | $ | 19,641 | | | $ | 19,433 | | | $ | 14,801 | | |
Portfolio turnover | | | 16 | % | | | 0 | % | | | 11 | % | | | 11 | % | | | 22 | % | | | 22 | % | |
Notes to Financial Highlights
(a) For the period from April 1, 2012 to April 30, 2012. During the period, the Fund's fiscal year end was changed from March 31 to April 30.
(b) In addition to the fees and expenses which the Fund bears directly, the Fund indirectly bears a pro rata share of the fees and expenses of the acquired funds in which it invests. Such indirect expenses are not included in the reported expense ratios.
(c) Certain line items from prior years have been reclassified to conform to the current presentation.
(d) Annualized.
(e) Total net expenses include the impact of certain waivers/reimbursements made by the Investment Manager and certain of its affiliates, if applicable.
(f) The benefits derived from expense reductions had an impact of less than 0.01%.
The accompanying Notes to Financial Statements are an integral part of this statement.
Annual Report 2013
17
Columbia Georgia Intermediate Municipal Bond Fund
Financial Highlights (continued)
| | | Year Ended April 30, | | Year Ended March 31, | |
Class B | | 2013 | | 2012(a) | | 2012 | | 2011 | | 2010 | | 2009 | |
Per share data | |
Net asset value, beginning of period | | $ | 11.18 | | | $ | 11.10 | | | $ | 10.50 | | | $ | 10.58 | | | $ | 10.19 | | | $ | 10.35 | | |
Income from investment operations: | |
Net investment income | | | 0.23 | | | | 0.02 | | | | 0.24 | | | | 0.25 | | | | 0.26 | | | | 0.30 | | |
Net realized and unrealized gain (loss) | | | 0.05 | | | | 0.08 | | | | 0.60 | | | | (0.08 | ) | | | 0.39 | | | | (0.16 | ) | |
Total from investment operations | | | 0.28 | | | | 0.10 | | | | 0.84 | | | | 0.17 | | | | 0.65 | | | | 0.14 | | |
Less distributions to shareholders: | |
Net investment income | | | (0.23 | ) | | | (0.02 | ) | | | (0.24 | ) | | | (0.25 | ) | | | (0.26 | ) | | | (0.30 | ) | |
Net realized gains | | | (0.01 | ) | | | — | | | | — | | | | — | | | | — | | | | — | | |
Total distributions to shareholders | | | (0.24 | ) | | | (0.02 | ) | | | (0.24 | ) | | | (0.25 | ) | | | (0.26 | ) | | | (0.30 | ) | |
Net asset value, end of period | | $ | 11.22 | | | $ | 11.18 | | | $ | 11.10 | | | $ | 10.50 | | | $ | 10.58 | | | $ | 10.19 | | |
Total return | | | 2.48 | % | | | 0.90 | % | | | 8.10 | % | | | 1.59 | % | | | 6.41 | % | | | 1.38 | % | |
Ratios to average net assets(b)(c) | |
Total gross expenses | | | 1.78 | % | | | 1.77 | %(d) | | | 1.81 | % | | | 1.74 | % | | | 1.70 | % | | | 1.67 | % | |
Total net expenses(e) | | | 1.56 | % | | | 1.55 | %(d) | | | 1.55 | %(f) | | | 1.55 | %(f) | | | 1.53 | %(f) | | | 1.50 | %(f) | |
Net investment income | | | 2.04 | % | | | 2.17 | %(d) | | | 2.25 | % | | | 2.33 | % | | | 2.47 | % | | | 2.92 | % | |
Supplemental data | |
Net assets, end of period (in thousands) | | $ | 216 | | | $ | 373 | | | $ | 369 | | | $ | 528 | | | $ | 886 | | | $ | 1,266 | | |
Portfolio turnover | | | 16 | % | | | 0 | % | | | 11 | % | | | 11 | % | | | 22 | % | | | 22 | % | |
Notes to Financial Highlights
(a) For the period from April 1, 2012 to April 30, 2012. During the period, the Fund's fiscal year end was changed from March 31 to April 30.
(b) In addition to the fees and expenses which the Fund bears directly, the Fund indirectly bears a pro rata share of the fees and expenses of the acquired funds in which it invests. Such indirect expenses are not included in the reported expense ratios.
(c) Certain line items from prior years have been reclassified to conform to the current presentation.
(d) Annualized.
(e) Total net expenses include the impact of certain waivers/reimbursements made by the Investment Manager and certain of its affiliates, if applicable.
(f) The benefits derived from expense reductions had an impact of less than 0.01%.
The accompanying Notes to Financial Statements are an integral part of this statement.
Annual Report 2013
18
Columbia Georgia Intermediate Municipal Bond Fund
Financial Highlights (continued)
| | | Year Ended April 30, | | Year Ended March 31, | |
Class C | | 2013 | | 2012(a) | | 2012 | | 2011 | | 2010 | | 2009 | |
Per share data | |
Net asset value, beginning of period | | $ | 11.18 | | | $ | 11.09 | | | $ | 10.50 | | | $ | 10.58 | | | $ | 10.18 | | | $ | 10.35 | | |
Income from investment operations: | |
Net investment income | | | 0.23 | | | | 0.02 | | | | 0.24 | | | | 0.25 | | | | 0.26 | | | | 0.30 | | |
Net realized and unrealized gain (loss) | | | 0.04 | | | | 0.09 | | | | 0.59 | | | | (0.08 | ) | | | 0.40 | | | | (0.17 | ) | |
Total from investment operations | | | 0.27 | | | | 0.11 | | | | 0.83 | | | | 0.17 | | | | 0.66 | | | | 0.13 | | |
Less distributions to shareholders: | |
Net investment income | | | (0.22 | ) | | | (0.02 | ) | | | (0.24 | ) | | | (0.25 | ) | | | (0.26 | ) | | | (0.30 | ) | |
Net realized gains | | | (0.01 | ) | | | — | | | | — | | | | — | | | | — | | | | — | | |
Total distributions to shareholders | | | (0.23 | ) | | | (0.02 | ) | | | (0.24 | ) | | | (0.25 | ) | | | (0.26 | ) | | | (0.30 | ) | |
Net asset value, end of period | | $ | 11.22 | | | $ | 11.18 | | | $ | 11.09 | | | $ | 10.50 | | | $ | 10.58 | | | $ | 10.18 | | |
Total return | | | 2.48 | % | | | 0.99 | % | | | 8.00 | % | | | 1.59 | % | | | 6.51 | % | | | 1.28 | % | |
Ratios to average net assets(b)(c) | |
Total gross expenses | | | 1.78 | % | | | 1.77 | %(d) | | | 1.78 | % | | | 1.74 | % | | | 1.70 | % | | | 1.67 | % | |
Total net expenses(e) | | | 1.56 | % | | | 1.55 | %(d) | | | 1.55 | %(f) | | | 1.55 | %(f) | | | 1.53 | %(f) | | | 1.50 | %(f) | |
Net investment income | | | 2.02 | % | | | 2.17 | %(d) | | | 2.23 | % | | | 2.34 | % | | | 2.42 | % | | | 2.92 | % | |
Supplemental data | |
Net assets, end of period (in thousands) | | $ | 4,301 | | | $ | 3,919 | | | $ | 4,066 | | | $ | 3,347 | | | $ | 3,567 | | | $ | 2,100 | | |
Portfolio turnover | | | 16 | % | | | 0 | % | | | 11 | % | | | 11 | % | | | 22 | % | | | 22 | % | |
Notes to Financial Highlights
(a) For the period from April 1, 2012 to April 30, 2012. During the period, the Fund's fiscal year end was changed from March 31 to April 30.
(b) In addition to the fees and expenses which the Fund bears directly, the Fund indirectly bears a pro rata share of the fees and expenses of the acquired funds in which it invests. Such indirect expenses are not included in the reported expense ratios.
(c) Certain line items from prior years have been reclassified to conform to the current presentation.
(d) Annualized.
(e) Total net expenses include the impact of certain waivers/reimbursements made by the Investment Manager and certain of its affiliates, if applicable.
(f) The benefits derived from expense reductions had an impact of less than 0.01%.
The accompanying Notes to Financial Statements are an integral part of this statement.
Annual Report 2013
19
Columbia Georgia Intermediate Municipal Bond Fund
Financial Highlights (continued)
Class R4 | | Year Ended
April 30,
2013(a) | |
Per share data | |
Net asset value, beginning of period | | $ | 11.12 | | |
Income from investment operations: | |
Net investment income | | | 0.04 | | |
Net realized and unrealized gain | | | 0.08 | | |
Total from investment operations | | | 0.12 | | |
Less distributions to shareholders: | |
Net investment income | | | (0.04 | ) | |
Total distributions to shareholders | | | (0.04 | ) | |
Net asset value, end of period | | $ | 11.20 | | |
Total return | | | 1.07 | % | |
Ratios to average net assets(b) | |
Total gross expenses | | | 0.72 | %(c) | |
Total net expenses(d) | | | 0.53 | %(c) | |
Net investment income | | | 3.12 | %(c) | |
Supplemental data | |
Net assets, end of period (in thousands) | | $ | 3 | | |
Portfolio turnover | | | 16 | % | |
Notes to Financial Highlights
(a) For the period from March 19, 2013 (commencement of operations) to April 30, 2013.
(b) In addition to the fees and expenses which the Fund bears directly, the Fund indirectly bears a pro rata share of the fees and expenses of the acquired funds in which it invests. Such indirect expenses are not included in the reported expense ratios.
(c) Annualized.
(d) Total net expenses include the impact of certain waivers/reimbursements made by the Investment Manager and certain of its affiliates, if applicable.
The accompanying Notes to Financial Statements are an integral part of this statement.
Annual Report 2013
20
Columbia Georgia Intermediate Municipal Bond Fund
Financial Highlights (continued)
| | | Year Ended April 30, | | Year Ended March 31, | |
Class Z | | 2013 | | 2012(a) | | 2012 | | 2011 | | 2010 | | 2009 | |
Per share data | |
Net asset value, beginning of period | | $ | 11.18 | | | $ | 11.09 | | | $ | 10.50 | | | $ | 10.58 | | | $ | 10.18 | | | $ | 10.35 | | |
Income from investment operations: | |
Net investment income | | | 0.34 | | | | 0.03 | | | | 0.35 | | | | 0.36 | | | | 0.36 | | | | 0.40 | | |
Net realized and unrealized gain (loss) | | | 0.05 | | | | 0.09 | | | | 0.59 | | | | (0.08 | ) | | | 0.40 | | | | (0.17 | ) | |
Total from investment operations | | | 0.39 | | | | 0.12 | | | | 0.94 | | | | 0.28 | | | | 0.76 | | | | 0.23 | | |
Less distributions to shareholders: | |
Net investment income | | | (0.34 | ) | | | (0.03 | ) | | | (0.35 | ) | | | (0.36 | ) | | | (0.36 | ) | | | (0.40 | ) | |
Net realized gains | | | (0.01 | ) | | | — | | | | — | | | | — | | | | — | | | | — | | |
Total distributions to shareholders | | | (0.35 | ) | | | (0.03 | ) | | | (0.35 | ) | | | (0.36 | ) | | | (0.36 | ) | | | (0.40 | ) | |
Net asset value, end of period | | $ | 11.22 | | | $ | 11.18 | | | $ | 11.09 | | | $ | 10.50 | | | $ | 10.58 | | | $ | 10.18 | | |
Total return | | | 3.51 | % | | | 1.07 | % | | | 9.08 | % | | | 2.61 | % | | | 7.58 | % | | | 2.30 | % | |
Ratios to average net assets(b)(c) | |
Total gross expenses | | | 0.78 | % | | | 0.77 | %(d) | | | 0.79 | % | | | 0.74 | % | | | 0.70 | % | | | 0.67 | % | |
Total net expenses(e) | | | 0.56 | % | | | 0.55 | %(d) | | | 0.55 | %(f) | | | 0.55 | %(f) | | | 0.53 | %(f) | | | 0.50 | %(f) | |
Net investment income | | | 3.02 | % | | | 3.17 | %(d) | | | 3.24 | % | | | 3.34 | % | | | 3.46 | % | | | 3.92 | % | |
Supplemental data | |
Net assets, end of period (in thousands) | | $ | 73,154 | | | $ | 79,910 | | | $ | 79,371 | | | $ | 85,305 | | | $ | 110,040 | | | $ | 110,408 | | |
Portfolio turnover | | | 16 | % | | | 0 | % | | | 11 | % | | | 11 | % | | | 22 | % | | | 22 | % | |
Notes to Financial Highlights
(a) For the period from April 1, 2012 to April 30, 2012. During the period, the Fund's fiscal year end was changed from March 31 to April 30.
(b) In addition to the fees and expenses which the Fund bears directly, the Fund indirectly bears a pro rata share of the fees and expenses of the acquired funds in which it invests. Such indirect expenses are not included in the reported expense ratios.
(c) Certain line items from prior years have been reclassified to conform to the current presentation.
(d) Annualized.
(e) Total net expenses include the impact of certain waivers/reimbursements made by the Investment Manager and certain of its affiliates, if applicable.
(f) The benefits derived from expense reductions had an impact of less than 0.01%.
The accompanying Notes to Financial Statements are an integral part of this statement.
Annual Report 2013
21
Columbia Georgia Intermediate Municipal Bond Fund
Notes to Financial Statements
April 30, 2013
Note 1. Organization
Columbia Georgia Intermediate Municipal Bond Fund (the Fund), a series of Columbia Funds Series Trust (the Trust), is a diversified fund. The Trust is registered under the Investment Company Act of 1940, as amended (the 1940 Act), as an open-end management investment company organized as a Delaware statutory trust.
Fund Shares
The Trust may issue an unlimited number of shares (without par value). The Fund offers Class A, Class B, Class C, Class R4 and Class Z shares. All share classes have identical voting, dividend and liquidation rights. Each share class has its own expense structure and sales charges, as applicable.
Class A shares are subject to a maximum front-end sales charge of 3.25% based on the initial investment amount. Class A shares purchased without an initial sales charge in accounts aggregating $1 million to $50 million at the time of purchase are subject to a contingent deferred sales charge (CDSC) if the shares are sold within 18 months of purchase, charged as follows: 1.00% CDSC if redeemed within 12 months of purchase, and 0.50% CDSC if redeemed more than 12, but less than 18, months after purchase.
Class B shares may be subject to a maximum CDSC of 3.00% based upon the holding period after purchase. Class B shares will generally convert to Class A shares eight years after purchase. The Fund no longer accepts investments by new or existing investors in the Fund's Class B shares, except in connection with the reinvestment of any dividend and/or capital gain distributions in Class B shares of the Fund and exchanges by existing Class B shareholders of certain other funds within the Columbia Family of Funds.
Class C shares are subject to a 1.00% CDSC on shares redeemed within one year of purchase.
Class R4 shares are not subject to sales charges and are generally available only to omnibus retirement plans and certain other eligible investors. Class R4 shares commenced operations on March 19, 2013.
Class Z shares are not subject to sales charges, and are only available to certain investors.
Note 2. Summary of Significant Accounting Policies
Use of Estimates
The preparation of financial statements in accordance with U.S. generally accepted accounting principles (GAAP) requires management to make certain estimates and
assumptions that affect the reported amounts of assets and liabilities, the disclosure of contingent assets and liabilities at the date of the financial statements and the reported amounts of revenue and expenses during the reporting period. Actual results could differ from those estimates.
The following is a summary of significant accounting policies consistently followed by the Fund in the preparation of its financial statements.
Security Valuation
Debt securities generally are valued by pricing services approved by the Board of Trustees (the Board) based upon market transactions for normal, institutional-size trading units of similar securities. The services may use various pricing techniques which take into account appropriate factors such as yield, quality, coupon rate, maturity, type of issue, trading characteristics and other data, as well as broker quotes. Debt securities for which quotations are readily available may also be valued based upon an over-the-counter or exchange bid quotation.
Investments in other open-end investment companies, including money market funds, are valued at net asset value.
Short-term securities purchased within 60 days to maturity are valued at amortized cost, which approximates market value. The value of short-term securities originally purchased with maturities greater than 60 days is determined based on an amortized value to par upon reaching 60 days to maturity. Short-term securities maturing in more than 60 days from the valuation date are valued at the market price or approximate market value based on current interest rates.
Investments for which market quotations are not readily available, or that have quotations which management believes are not reliable, are valued at fair value as determined in good faith under consistently applied procedures established by and under the general supervision of the Board. If a security or class of securities (such as foreign securities) is valued at fair value, such value is likely to be different from the last quoted market price for the security.
The determination of fair value often requires significant judgment. To determine fair value, management may use assumptions including but not limited to future cash flows and estimated risk premiums. Multiple inputs from various sources may be used to determine fair value.
Security Transactions
Security transactions are accounted for on the trade date. Cost is determined and gains (losses) are based upon the specific identification method for both financial statement and federal income tax purposes.
Annual Report 2013
22
Columbia Georgia Intermediate Municipal Bond Fund
Notes to Financial Statements (continued)
April 30, 2013
Income Recognition
Interest income is recorded on an accrual basis. Market premiums and discounts, including original issue discounts, are amortized and accreted, respectively, over the expected life of the security on all debt securities, unless otherwise noted.
Dividend income is recorded on the ex-dividend date.
Expenses
General expenses of the Trust are allocated to the Fund and other funds of the Trust based upon relative net assets or other expense allocation methodologies determined by the nature of the expense. Expenses directly attributable to the Fund are charged to the Fund. Expenses directly attributable to a specific class of shares are charged to that share class.
Determination of Class Net Asset Value
All income, expenses (other than class-specific expenses, which are charged to that share class, as shown in the Statement of Operations) and realized and unrealized gains (losses) are allocated to each class of the Fund on a daily basis, based on the relative net assets of each class, for purposes of determining the net asset value of each class.
Federal Income Tax Status
The Fund intends to qualify each year as a regulated investment company under Subchapter M of the Internal Revenue Code, as amended, and will distribute substantially all of its tax exempt and taxable income (including net short-term capital gains), if any, for its tax year, and as such will not be subject to federal income taxes. In addition, the Fund intends to distribute in each calendar year substantially all of its net investment income, capital gains and certain other amounts, if any, such that the Fund should not be subject to federal excise tax. Therefore, no federal income or excise tax provision is recorded.
Distributions to Shareholders
Distributions from net investment income, if any, are declared daily and paid monthly. Net realized capital gains, if any, are distributed at least annually. Income distributions and capital gain distributions are determined in accordance with federal income tax regulations, which may differ from GAAP.
Guarantees and Indemnifications
Under the Trust's organizational documents and, in some cases, by contract, its officers and trustees are indemnified against certain liabilities arising out of the performance of their duties to the Trust or its funds. In addition, certain of the Fund's contracts with its service providers contain general indemnification clauses. The Fund's maximum exposure under these arrangements is unknown since the amount of any future claims that may be made against the Fund cannot be
determined, and the Fund has no historical basis for predicting the likelihood of any such claims.
Recent Accounting Pronouncement
Disclosures about Offsetting Assets and Liabilities
In December 2011, the Financial Accounting Standards Board (FASB) issued Accounting Standards Update (ASU) No. 2011-11, Disclosures about Offsetting Assets and Liabilities and in January 2013, ASU No. 2013-1, Clarifying the Scope of Disclosures about Offsetting Assets and Liabilities (collectively, the ASUs). Specifically, the ASUs require an entity to disclose both gross and net information for derivatives and other financial instruments that are subject to a master netting arrangement or similar agreement. The ASUs require disclosure of collateral received in connection with the master netting agreements or similar agreements. The disclosure requirements are effective for interim and annual periods beginning on or after January 1, 2013. At this time, management is evaluating the implications of this guidance and the impact it will have on the financial statement amounts and footnote disclosures, if any.
Note 3. Fees and Compensation Paid to Affiliates
Investment Management Fees
Under an Investment Management Services Agreement, Columbia Management Investment Advisers, LLC (the Investment Manager), a wholly-owned subsidiary of Ameriprise Financial, Inc. (Ameriprise Financial), determines which securities will be purchased, held or sold. The investment management fee is an annual fee that is equal to a percentage of the Fund's average daily net assets that declines from 0.40% to 0.27% as the Fund's net assets increase. The effective investment management fee rate for the year ended April 30, 2013 was 0.40% of the Fund's average daily net assets.
Administration Fees
Under an Administrative Services Agreement, the Investment Manager also serves as the Fund Administrator. The Fund pays the Fund Administrator an annual fee for administration and accounting services equal to a percentage of the Fund's average daily net assets that declines from 0.07% to 0.04% as the Fund's net assets increase. The effective administration fee rate for the year ended April 30, 2013 was 0.07% of the Fund's average daily net assets.
Other Expenses
Other expenses are for, among other things, certain expenses of the Fund or the Board, including: Fund boardroom and office expense, employee compensation, employee health and retirement benefits, and certain other expenses. Payment of these Fund and Board expenses is facilitated by a company providing limited administrative services to the Fund and the
Annual Report 2013
23
Columbia Georgia Intermediate Municipal Bond Fund
Notes to Financial Statements (continued)
April 30, 2013
Board. For the year ended April 30, 2013, other expenses paid to this company were $1,403.
Compensation of Board Members
Board members are compensated for their services to the Fund as disclosed in the Statement of Operations. Under a Deferred Compensation Plan (the Plan), the Board members who are not "interested persons" of the Fund, as defined under the 1940 Act, may elect to defer payment of up to 100% of their compensation. Deferred amounts are treated as though equivalent dollar amounts had been invested in shares of certain funds managed by the Investment Manager. The Fund's liability for these amounts is adjusted for market value changes and remains in the Fund until distributed in accordance with the Plan.
Transfer Agent Fees
Under a Transfer and Dividend Disbursing Agent Agreement, Columbia Management Investment Services Corp. (the Transfer Agent), an affiliate of the Investment Manager and a wholly-owned subsidiary of Ameriprise Financial, is responsible for providing transfer agency services to the Fund. The Transfer Agent has contracted with Boston Financial Data Services (BFDS) to serve as sub-transfer agent.
The Transfer Agent receives monthly account-based service fees based on the number of open accounts and also receives sub-transfer agency fees based on a percentage of the average aggregate value of the Fund's shares maintained in omnibus accounts (other than omnibus accounts for which American Enterprise Investment Services Inc. is the broker of record or accounts where the beneficial shareholder is a customer of Ameriprise Financial Services, Inc., which are paid a per account fee). The Transfer Agent pays the fees of BFDS for services as sub-transfer agent and is not entitled to reimbursement for such fees from the Fund (with the exception of out-of-pocket fees).
The Transfer Agent also receives compensation from fees for various shareholder services and reimbursements for certain out-of-pocket fees.
For the year ended April 30, 2013, the Fund's effective transfer agent fee rates as a percentage of average daily net assets of each class were as follows:
Class A | | | 0.19 | % | |
Class B | | | 0.19 | | |
Class C | | | 0.19 | | |
Class R4* | | | 0.10 | | |
Class Z | | | 0.19 | | |
*Annualized
An annual minimum account balance fee of $20 may apply to certain accounts with a value below the Fund's initial minimum investment requirements to reduce the impact of small accounts on transfer agent fees. These minimum account balance fees are recorded as part of expense reductions in the Statement of Operations. For the year ended April 30, 2013, no minimum account balance fees were charged by the Fund.
Distribution and Service Fees
The Fund has an agreement with Columbia Management Investment Distributors, Inc. (the Distributor), an affiliate of the Investment Manager and a wholly-owned subsidiary of Ameriprise Financial, for distribution and shareholder services. Pursuant to Rule 12b-1 under the 1940 Act, the Board has approved, and the Fund has adopted, distribution and shareholder service plans (the Plans) which set the distribution and service fees for the Fund. These fees are calculated daily and are intended to compensate the Distributor and/or eligible selling and/or servicing agents for selling shares of the Fund and providing services to investors.
The Plans require the payment of a monthly combined distribution and service fee to the Distributor at the maximum annual rate of 0.25% of the average daily net assets attributable to Class A shares of the Fund. The Plans also require the payment of a monthly service fee at the maximum annual rate of 0.25% of the average daily net assets attributable to Class B and Class C shares of the Fund and the payment of a monthly distribution fee at the maximum annual rate of 0.75% of the average daily net assets attributable to Class B and Class C shares of the Fund.
Sales Charges
Sales charges, including front-end charges and CDSCs, received by the Distributor for distributing Fund shares were $15,905 for Class A, $4 for Class B and $2,160 for Class C shares for the year ended April 30, 2013.
Expenses Waived/Reimbursed by the Investment Manager and its Affiliates
The Investment Manager and certain of its affiliates have contractually agreed to waive fees and/or reimburse expenses (excluding certain fees and expenses described below) for the periods disclosed below, unless sooner terminated at the sole discretion of the Board, so that the Fund's net operating expenses, after giving effect to fees waived/expenses reimbursed and any balance credits and/or overdraft charges
Annual Report 2013
24
Columbia Georgia Intermediate Municipal Bond Fund
Notes to Financial Statements (continued)
April 30, 2013
from the Fund's custodian, do not exceed the following annual rates as a percentage of the class' average daily net assets:
| | | August 1, 2012
through
August 31, 2013 | | Prior to
August 1, 2012 | |
Class A | | | 0.81 | % | | | 0.80 | % | |
Class B | | | 1.56 | | | | 1.55 | | |
Class C | | | 1.56 | | | | 1.55 | | |
Class R4 | | | 0.56 | * | | | — | | |
Class Z | | | 0.56 | | | | 0.55 | | |
*Annual rate is contractual from March 19, 2013 (the commencement of operations of Class R4 shares) through February 28, 2014.
Under the agreement governing these fee waivers and/or expense reimbursement arrangements, the following fees and expenses are excluded from the waiver/reimbursement commitment, and therefore will be paid by the Fund, if applicable: taxes (including foreign transaction taxes), expenses associated with investments in affiliated and non-affiliated pooled investment vehicles (including mutual funds and exchange traded funds), transaction costs and brokerage commissions, costs related to any securities lending program, dividend expenses associated with securities sold short, inverse floater program fees and expenses, transaction charges and interest on borrowed money, interest, extraordinary expenses and any other expenses the exclusion of which is specifically approved by the Board. This agreement may be modified or amended only with approval from all parties.
Note 4. Federal Tax Information
The timing and character of income and capital gain distributions are determined in accordance with income tax regulations, which may differ from GAAP because of temporary or permanent book to tax differences.
At April 30, 2013, these differences are primarily due to differing treatment for Trustees' deferred compensation and distributions. To the extent these differences are permanent, reclassifications are made among the components of the Fund's net assets in the Statement of Assets and Liabilities. Temporary differences do not require reclassifications.
The Fund did not have any permanent differences; therefore, no reclassifications were made to the Statement of Assets and Liabilities.
The tax character of distributions paid during the periods indicated was as follows:
| | | Year Ended
April 30,
2013 | | Period Ended
April 30,
2012 | | Year Ended
March 31,
2012 | |
Ordinary income | | $ | — | | | $ | — | | | $ | 125 | | |
Long-term capital gains | | | 82,410 | | | | — | | | | — | | |
Tax-exempt income | | | 3,038,675 | | | | 261,650 | | | | 3,232,698 | | |
Total | | $ | 3,121,085 | | | $ | 261,650 | | | $ | 3,232,823 | | |
Short-term capital gain distributions, if any, are considered ordinary income distributions for tax purposes.
At April 30, 2013, the components of distributable earnings on a tax basis were as follows:
Undistributed tax-exempt income | | $ | 495,812 | | |
Undistributed ordinary income | | | 8,960 | | |
Undistributed accumulated long-term capital gains | | | 510,808 | | |
Unrealized appreciation | | | 8,093,291 | | |
At April 30, 2013, the cost of investments for federal income tax purposes was $90,325,970 and the aggregate gross unrealized appreciation and depreciation based on that cost was:
Unrealized appreciation | | $ | 8,141,233 | | |
Unrealized depreciation | | | (47,942 | ) | |
Net unrealized appreciation | | | 8,093,291 | | |
Management of the Fund has concluded that there are no significant uncertain tax positions that would require recognition in the financial statements. However, management's conclusion may be subject to review and adjustment at a later date based on factors including, but not limited to, new tax laws, regulations, and administrative interpretations (including relevant court decisions). Generally, the Fund's federal tax returns for the prior three fiscal years remain subject to examination by the Internal Revenue Service.
Note 5. Portfolio Information
The cost of purchases and proceeds from sales of securities, excluding short-term obligations, aggregated to $16,090,173 and $20,304,612, respectively, for the year ended April 30, 2013.
Note 6. Shareholder Concentration
At April 30, 2013, one unaffiliated shareholder account owned 74.0% of the outstanding shares of the Fund. The Fund has no knowledge about whether any portion of those shares was owned beneficially by such account. Subscription and redemption activity by concentrated accounts may have a significant effect on the operations of the Fund.
Annual Report 2013
25
Columbia Georgia Intermediate Municipal Bond Fund
Notes to Financial Statements (continued)
April 30, 2013
Note 7. Line of Credit
The Fund has entered into a revolving credit facility with a syndicate of banks led by JPMorgan Chase Bank N.A. whereby the Fund may borrow for the temporary funding of shareholder redemptions or for other temporary or emergency purposes. The credit facility agreement, as amended, which is a collective agreement between the Fund and certain other funds managed by the Investment Manager, severally and not jointly, permits collective borrowings up to $500 million. Interest is charged to each participating fund based on its borrowings at a rate equal to the higher of (i) the overnight federal funds rate plus 1.00% or (ii) the one-month LIBOR rate plus 1.00%. Each borrowing under the credit facility matures no later than 60 days after the date of borrowing. The Fund also pays a commitment fee equal to its pro rata share of the amount of the credit facility at a rate of 0.08% per annum.
The Fund had no borrowings during the year ended April 30, 2013.
Note 8. Significant Risks
Geographic Concentration Risk
Because state-specific tax-exempt funds invest primarily in the municipal securities issued by the state and political sub-divisions of the state, the Fund will be particularly affected by political and economic conditions and developments in the state in which it invests. The Fund may, therefore, have a greater risk than that of a municipal bond fund which is more geographically diversified. The value of the municipal securities owned by the Fund also may be adversely affected by future changes in federal or state income tax laws.
Note 9. Subsequent Events
Management has evaluated the events and transactions that have occurred through the date the financial statements were issued and noted no items requiring adjustment of the financial statements or additional disclosure.
Note 10. Information Regarding Pending and Settled Legal Proceedings
In December 2005, without admitting or denying the allegations, American Express Financial Corporation (AEFC, which is now known as Ameriprise Financial, Inc. (Ameriprise Financial)) entered into settlement agreements with the Securities and Exchange Commission (SEC) and Minnesota Department of Commerce (MDOC) related to market timing activities. As a result, AEFC was censured and ordered to cease and desist from committing or causing any violations of certain provisions of the Investment Advisers Act of 1940, the Investment Company Act of 1940, and various Minnesota laws.
AEFC agreed to pay disgorgement of $10 million and civil money penalties of $7 million. AEFC also agreed to retain an independent distribution consultant to assist in developing a plan for distribution of all disgorgement and civil penalties ordered by the SEC in accordance with various undertakings detailed at www.sec.gov/litigation/admin/ia-2451.pdf. Ameriprise Financial and its affiliates have cooperated with the SEC and the MDOC in these legal proceedings, and have made regular reports to the funds' Boards of Trustees.
Ameriprise Financial and certain of its affiliates have historically been involved in a number of legal, arbitration and regulatory proceedings, including routine litigation, class actions, and governmental actions, concerning matters arising in connection with the conduct of their business activities. Ameriprise Financial believes that the Funds are not currently the subject of, and that neither Ameriprise Financial nor any of its affiliates are the subject of, any pending legal, arbitration or regulatory proceedings that are likely to have a material adverse effect on the Funds or the ability of Ameriprise Financial or its affiliates to perform under their contracts with the Funds. Ameriprise Financial is required to make 10-Q, 10-K and, as necessary, 8-K filings with the Securities and Exchange Commission on legal and regulatory matters that relate to Ameriprise Financial and its affiliates. Copies of these filings may be obtained by accessing the SEC website at www.sec.gov.
There can be no assurance that these matters, or the adverse publicity associated with them, will not result in increased fund redemptions, reduced sale of fund shares or other adverse consequences to the Funds. Further, although we believe proceedings are not likely to have a material adverse effect on the Funds or the ability of Ameriprise Financial or its affiliates to perform under their contracts with the Funds, these proceedings are subject to uncertainties and, as such, we are unable to estimate the possible loss or range of loss that may result. An adverse outcome in one or more of these proceedings could result in adverse judgments, settlements, fines, penalties or other relief that could have a material adverse effect on the consolidated financial condition or results of operations of Ameriprise Financial.
Annual Report 2013
26
Columbia Georgia Intermediate Municipal Bond Fund
Report of Independent Registered Public Accounting Firm
To the Trustees of Columbia Funds Series Trust and the Shareholders of Columbia Georgia Intermediate Municipal Bond Fund
In our opinion, the accompanying statement of assets and liabilities, including the portfolio of investments, and the related statements of operations and of changes in net assets and the financial highlights present fairly, in all material respects, the financial position of Columbia Georgia Intermediate Municipal Bond Fund (the "Fund") (a series of Columbia Funds Series Trust) at April 30, 2013, the results of its operations, the changes in its net assets and the financial highlights for the periods indicated, in conformity with accounting principles generally accepted in the United States of America. These financial statements and financial highlights (hereafter referred to as "financial statements") are the responsibility of the Fund's management. Our responsibility is to express an opinion on these financial statements based on our audits. We conducted our audits of these financial statements in accordance with the standards of the Public Company Accounting Oversight Board (United States). Those standards require that we plan and perform the audit to obtain reasonable assurance about whether the financial statements are free of material misstatement. An audit includes examining, on a test basis, evidence supporting the amounts and disclosures in the financial statements, assessing the accounting principles used and significant estimates made by management, and evaluating the overall financial statement presentation. We believe that our audits, which included confirmation of securities at April 30, 2013 by correspondence with the custodian provide a reasonable basis for our opinion.
PricewaterhouseCoopers LLP
Minneapolis, Minnesota
June 21, 2013
Annual Report 2013
27
Columbia Georgia Intermediate Municipal Bond Fund
Federal Income Tax Information
(Unaudited)
The Fund hereby designates the following tax attributes for the fiscal year ended April 30, 2013. Shareholders will be notified in early 2014 of amounts for use in preparing 2013 income tax returns.
Tax Designations:
Capital Gain Dividend | | $ | 622,879 | | |
| Exempt-Interest Dividends | | | 100.00 | % | |
Capital Gain Dividend. The Fund designates as a capital gain dividend the amount reflected above, or if subsequently determined to be different, the net capital gain of such fiscal period. The Fund also designates as capital gain dividends, to the extent necessary to fully distribute such capital gains, earnings and profits distributed to shareholders on the redemption of shares.
Exempt-Interest Dividends. The percentage of net investment income dividends paid during the fiscal year that qualifies as exempt-interest dividends for federal income tax purposes.
Annual Report 2013
28
Columbia Georgia Intermediate Municipal Bond Fund
Shareholders elect the Board that oversees the funds' operations. The Board appoints officers who are responsible for day-to-day business decisions based on policies set by the Board. The following table provides basic biographical information about the funds' Board members, including their principal occupations during the past five years, although specific titles for individuals may have varied over the period. Under current Board policy, members may serve until the next Board meeting after he or she reaches the mandatory retirement age established by the Board, or the fifteenth anniversary of the first Board meeting they attended as a member of the Board.
Mr. Edward J. Boudreau, Jr., Mr. William P. Carmichael, Mr. William A. Hawkins, Mr. R. Glenn Hilliard, Ms. Minor M. Shaw and Dr. Anthony M. Santomero, were members of the Legacy Columbia Nations funds' Board ("Nations Funds"), which includes Columbia Funds Series Trust, Columbia Funds Variable Insurance Trust I and Columbia Funds Master Investment Trust, LLC and began service on the Board for the Legacy RiverSource funds ("RiverSource Funds") effective June 1, 2011.
Independent Trustees
Name,
Address,
Year of Birth | | Position Held With
Funds and Length of
Service | | Principal Occupation
During Past Five Years | | Number of
Funds in the
Fund Family
Overseen by
Board Member | | Other Present or Past
Directorships/Trusteeships
(Within Past 5 Years)
| |
Kathleen Blatz
901 S. Marquette Ave.
Minneapolis, MN 55402
1954 | | Board member since 1/06 for RiverSource Funds and since 6/11 for Nations Funds | | Attorney; Chief Justice, Minnesota Supreme Court, 1998-2006 | | | 132 | | | Director, BlueCross BlueShield of Minnesota since 2009 | |
Edward J. Boudreau, Jr.
901 S. Marquette Ave.
Minneapolis, MN 55402
1944 | | Board member since 6/11 for RiverSource Funds and since 1/05 for Nations Funds | | Managing Director, E.J. Boudreau & Associates (consulting) since 2000 | | | 130 | | | Former Trustee, BofA Funds Series Trust (11 funds) | |
Pamela G. Carlton
901 S. Marquette Ave.
Minneapolis, MN 55402
1954 | | Board member since 7/07 for RiverSource Funds and since 6/11 for Nations Funds | | President, Springboard — Partners in Cross Cultural Leadership (consulting company) since 2003 | | | 132 | | | None | |
William P. Carmichael
901 S. Marquette Ave.
Minneapolis, MN 55402
1943 | | Board member since 6/11 for RiverSource Funds and since 1999 for Nations Funds | | Retired | | | 130 | | | Director, Cobra Electronics
Corporation (electronic equipment manufacturer); The Finish Line (athletic shoes and apparel) since July 2003; McMoRan Exploration Company (oil and gas exploration and development) since 2010; former Trustee, BofA Funds Series Trust (11 funds); former Director, Spectrum Brands, Inc. (consumer products); former Director, Simmons Company (bedding) | |
Patricia M. Flynn
901 S. Marquette Ave.
Minneapolis, MN 55402
1950 | | Board member since 11/04 for RiverSource Funds and since 6/11 for Nations Funds | | Trustee Professor of Economics and Management, Bentley University since 1976 | | | 132 | | | None | |
William A. Hawkins
901 S. Marquette Ave.
Minneapolis, MN 55402
1942 | | Board member since 6/11 for RiverSource Funds and since 1/05 for Nations Funds | | Managing Director, Overton Partners (financial consulting), since August 2010; President and Chief Executive Officer, California General Bank, N.A., January 2008-August 2010 | | | 130 | | | Trustee, BofA Funds Series Trust (11 funds) | |
Annual Report 2013
29
Columbia Georgia Intermediate Municipal Bond Fund
Trustees and Officers (continued)
Independent Trustees (continued)
Name,
Address,
Year of Birth | | Position Held With
Funds and Length of
Service | | Principal Occupation
During Past Five Years | | Number of
Funds in the
Fund Family
Overseen by
Board Member | | Other Present or Past
Directorships/Trusteeships
(Within Past 5 Years)
| |
R. Glenn Hilliard
901 S. Marquette Ave.
Minneapolis, MN 55402
1943 | | Board member since 6/11 for RiverSource Funds and since 1/05 for Nations Funds | | Chairman and Chief Executive Officer, Hilliard Group LLC (investing and consulting), since April 2003; Non-Executive Director & Chairman, CNO Financial Group, Inc. (insurance), September 2003-May 2011 | | | 130 | | | Chairman, BofA Fund Series Trust (11 funds); former Director, CNO Financial Group, Inc. (insurance) | |
Stephen R. Lewis, Jr.
901 S. Marquette Ave.
Minneapolis, MN 55402
1939 | | Chair of the Board for RiverSource Funds since 1/07, Board member for RiverSource Funds since 1/02 and since 6/11 for Nations Funds | | President Emeritus and Professor of Economics Emeritus, Carleton College since 2002 | | | 132 | | | Director, Valmont Industries, Inc. (manufacturer of irrigation systems) since 2002 | |
Catherine James Paglia
901 S. Marquette Ave.
Minneapolis, MN 55402
1952 | | Board member since 11/04 for RiverSource Funds and since 6/11 for Nations Funds | | Director, Enterprise Asset Management, Inc. (private real estate and asset management company) | | | 132 | | | Director, Valmont Industries, Inc. (manufacturer of irrigation systems) since 2012 | |
Leroy C. Richie
901 S. Marquette Ave.
Minneapolis, MN 55402
1941 | | Board member since 2000 for Legacy Seligman Funds, since 11/08 for RiverSource Funds and since 6/11 for Nations Funds | | Counsel, Lewis & Munday, P.C. (law firm) since 2004; former Vice President and General Counsel, Automotive Legal Affairs, Chrysler Corporation from 1983-1987 | | | 132 | | | Lead Outside Director, Digital Ally, Inc. (digital imaging) since September 2005; Director, Infinity, Inc. (oil and gas exploration and production) since 1994; Director, OGE Energy Corp. (energy and energy services) since November 2007 | |
Minor M. Shaw
901 S. Marquette Ave.
Minneapolis, MN 55402
1947 | | Board member since 6/11 for RiverSource Funds and since 2003 for Nations Funds | | President, Micco LLC (private investments) since 2011; President, Micco Corp. since 1998 | | | 130 | | | Director, Piedmont Natural Gas; Director, BlueCross BlueShield of South Carolina since April 2008; Former Trustee, BofA Funds Series Trust (11 funds) | |
Alison Taunton-Rigby
901 S. Marquette Ave.
Minneapolis, MN 55402
1944 | | Board member since 11/02 for RiverSource Funds and since 6/11 for Nations Funds | | Chief Executive Officer and Director, RiboNovix, Inc. (biotechnology), 2003-2010 | | | 132 | | | Director, Healthways, Inc. (health and well-being improvement) since 2005; Director, ICI Mutual Insurance Company, RRG since 2011; Director, Abt Associates (government contractor) since 2001; Director, Boston Children's Hospital since 2002 | |
Annual Report 2013
30
Columbia Georgia Intermediate Municipal Bond Fund
Trustees and Officers (continued)
Interested Trustee Not Affiliated With Investment Manager*
Name,
Address,
Year of Birth | | Position Held With
Funds and Length of
Service | | Principal Occupation
During Past Five Years | | Number of
Funds in the
Fund Family
Overseen by
Board Member | | Other Present or Past
Directorships/Trusteeships
(Within Past 5 Years)
| |
Anthony M. Santomero
901 S. Marquette Ave.
Minneapolis, MN 55402
1946 | | Board member since 6/11 for RiverSource Funds and since 1/08 for Nations Funds | | Richard K. Mellon Professor Emeritus of Finance, The Wharton School, University of Pennsylvania, since 2002; Senior Advisor, McKinsey & Company (consulting), 2006-2008 | | | 130 | | | Director, Renaissance Reinsurance Ltd. since May 2008; Trustee, Penn Mutual Life Insurance Company since March 2008; Director, Citigroup since 2009; Director, Citibank, N.A. since 2009; former Trustee, BofA Funds Series Trust (11 funds) | |
*Dr. Santomero is not an affiliated person of the investment manager or Ameriprise Financial. However, he is currently deemed by the funds to be an "interested person" (as defined in the 1940 Act) of the funds because he serves as a Director of Citigroup, Inc. and Citibank N.A., companies that may directly or through subsidiaries and affiliates engage from time-to-time in brokerage execution, principal transactions and lending relationships with the funds or accounts advised/managed by the investment manager.
Interested Trustee Affiliated With Investment Manager*
Name,
Address,
Year of Birth | | Position Held With
Funds and Length of
Service | | Principal Occupation
During Past Five Years | | Number of
Funds in the
Fund Family
Overseen by
Board Member | | Other Present or Past
Directorships/Trusteeships
(Within Past 5 Years) | |
William F. Truscott
53600 Ameriprise
Financial Center
Minneapolis, MN 55474
1960 | | Board member since 11/01 for RiverSource Funds and since 6/11 for Nations Funds; Senior Vice President since 2002 for RiverSource Funds and 5/10 for Nations Funds | | President, Columbia Management Investment Advisers, LLC since February 2012, (previously President, Chairman of the Board and Chief Investment Officer, 2001-April 2010); Chief Executive Officer, Global Asset Management, Ameriprise Financial, Inc. since September 2012 (previously Chief Executive Officer, U.S. Asset Management & President, Annuities, May 2010-September 2012 and President — U.S. Asset Management and Chief Investment Officer, 2005-April 2010); Chief Executive Officer, Columbia Management Investment Distributors, Inc. since February 2012, (previously Chairman of the Board and Chief Executive Officer, 2006-April 2010); Chairman of the Board and Chief Executive Officer, RiverSource Distributors, Inc. since 2006; President and Chief Executive Officer, Ameriprise Certificate Company 2006-August 2012 | | | 184 | | | Chairman of the Board, Columbia Management Investment Advisers, LLC since May 2010; Director, Columbia Management Investment Distributors, Inc. since May 2010; Director, Ameriprise Certificate Company, 2006-January 2013 | |
*Interested person (as defined under the 1940 Act) by reason of being an officer, director, security holder and/or employee of the investment manager or Ameriprise Financial.
The SAI has additional information about the Fund's Board members and is available, without charge, upon request by calling 800.345.6611; contacting your financial intermediary; or visiting columbiamanagement.com.
Annual Report 2013
31
Columbia Georgia Intermediate Municipal Bond Fund
Trustees and Officers (continued)
The Board has appointed officers who are responsible for day-to-day business decisions based on policies it has established. The officers serve at the pleasure of the Board. In addition to Mr. Truscott, who is Senior Vice President, the funds' other officers are:
Officers
Name,
Address,
Year of Birth | | Position Held With
Funds and Length of
Service | | Principal Occupation During Past Five Years | |
J. Kevin Connaughton
225 Franklin Street
Boston, MA 02110
1964 | | President and Principal Executive Officer since 5/10 for RiverSource Funds and 2009 for Nations Funds | | Senior Vice President and General Manager — Mutual Fund Products, Columbia Management Investment Advisers, LLC since May 2010; Managing Director of Columbia Management Advisors, LLC, December 2004-April 2010; Senior Vice President and Chief Financial Officer, Columbia Funds, June 2008-January 2009; Treasurer, Columbia Funds, October 2003-May 2008 | |
Amy K. Johnson
5228 Ameriprise
Financial Center Minneapolis, MN 55474
1965 | | Vice President since 12/06 for RiverSource Funds and 5/10 for Nations Funds | | Senior Vice President and Chief Operating Officer, Columbia Management Investment Advisers, LLC since May 2010 (previously Chief Administrative Officer, 2009-April 2010 and Vice President — Asset Management and Trust Company Services, 2006-2009) | |
Michael G. Clarke
225 Franklin Street
Boston, MA 02110
1969 | | Treasurer since 1/11 and Chief Financial Officer since 4/11 for RiverSource Funds and Treasurer since 3/11 and Chief Financial Officer since 2009 for Nations Funds | | Vice President, Columbia Management Investment Advisers, LLC since May 2010; Managing Director of Fund Administration, Columbia Management Advisors, LLC, September 2004-April 2010; senior officer of Columbia Funds and affiliated funds since 2002 | |
Scott R. Plummer
5228 Ameriprise
Financial Center
Minneapolis, MN 55474
1959 | | Senior Vice President and Chief Legal Officer since 12/06 and Assistant Secretary since 6/11 for RiverSource Funds and Senior Vice President and Chief Legal Officer since 5/10 and Assistant Secretary since 6/11 for Nations Funds | | Senior Vice President, Chief Legal Officer and Assistant Secretary, Columbia Management Investment Advisers, LLC since June 2005; Vice President and Lead Chief Counsel — Asset Management, Ameriprise Financial, Inc. since May 2010 (previously Vice President and Chief Counsel — Asset Management, 2005-April 2010); Vice President, Chief Counsel and Assistant Secretary, Columbia Management Investment Distributors, Inc. since 2008; Vice President, General Counsel and Secretary, Ameriprise Certificate Company since 2005; Chief Counsel, RiverSource Distributors, Inc. since 2006 | |
Colin Moore
225 Franklin Street
Boston, MA 02110
1958 | | Senior Vice President since 5/10 for RiverSource Funds and Nations Funds | | Director and Chief Investment Officer, Columbia Management Investment Advisers, LLC since May 2010; Manager, Managing Director and Chief Investment Officer, Columbia Management Advisors, LLC, 2007-April 2010 | |
Thomas P. McGuire
225 Franklin Street
Boston, MA 02110
1972 | | Chief Compliance Officer since 3/12 | | Vice President — Asset Management Compliance, Columbia Management Investment Advisers, LLC since 2010; Chief Compliance Officer, Ameriprise Certificate Company since September 2010; Compliance Executive, Bank of America, 2005-2010 | |
Stephen T. Welsh
225 Franklin Street
Boston, MA 02110
1957 | | Vice President since 4/11 for RiverSource Funds and 2006 for Nations Funds | | President and Director, Columbia Management Investment Services Corp. since May 2010; President and Director, Columbia Management Services, Inc., July 2004-April 2010; Managing Director, Columbia Management Distributors, Inc., August 2007-April 2010 | |
Christopher O. Petersen
5228 Ameriprise
Financial Center
Minneapolis, MN 55474
1970 | | Vice President and Secretary since 4/11 for RiverSource Funds and 3/11 for Nations Funds | | Vice President and Chief Counsel, Ameriprise Financial, Inc. since January 2010 (formerly Vice President and Group Counsel or Counsel, April 2004-January 2010); Assistant Secretary of Legacy RiverSource Funds, January 2007-April 2011 and of the Nations Funds, May 2010-March 2011 | |
Annual Report 2013
32
Columbia Georgia Intermediate Municipal Bond Fund
Trustees and Officers (continued)
Officers (continued)
Name,
Address,
Year of Birth | | Position Held With
Funds and Length of
Service | | Principal Occupation During Past Five Years | |
Paul D. Pearson
10468 Ameriprise
Financial Center
Minneapolis, MN 55474
1956 | | Vice President since 4/11 and Assistant Treasurer since 1999 for RiverSource Funds and Vice President and Assistant Treasurer since 6/11 for Nations Funds | | Vice President — Investment Accounting, Columbia Management Investment Advisers, LLC, since May 2010; Vice President — Managed Assets, Investment Accounting, Ameriprise Financial Corporation, February 1998-May 2010 | |
Joseph F. DiMaria
225 Franklin Street
Boston, MA 02110
1968 | | Vice President and Chief Accounting Officer since 4/11 and Vice President since 3/11 and Chief Accounting Officer since 2008 for Nations Funds | | Vice President, Mutual Fund Administration, Columbia Management Investment Advisers, LLC, since May 2010; Director of Fund Administration, Columbia Management Advisors, LLC, January 2006-April 2010 | |
Paul B. Goucher
100 Park Avenue
New York, NY 10017
1968 | | Vice President since 4/11 and Assistant Secretary since 11/08 for RiverSource Funds and 5/10 for Nations Funds | | Vice President and Lead Chief Counsel, Ameriprise Financial, Inc. since November 2008 and January 2013, respectively (formerly, Chief Counsel, January 2010-January 2013 and Group Counsel from November 2008-January 2010); Director, Managing Director and General Counsel, J. & W. Seligman & Co. Incorporated, July 2008-November 2008 (previously, Managing Director and Associate General Counsel, January 2005-July 2008) | |
Michael E. DeFao
225 Franklin Street
Boston, MA 02110
1968 | | Vice President since 4/11 and Assistant Secretary since 5/10 for RiverSource Funds and 2011 for Nations Funds | | Vice President and Chief Counsel, Ameriprise Financial, Inc. since May 2010; Associate General Counsel, Bank of America, June 2005-April 2010 | |
Annual Report 2013
33
Columbia Georgia Intermediate Municipal Bond Fund
Approval of Investment Management Services
Agreement
Columbia Management Investment Advisers, LLC (Columbia Management or the Investment Manager), a wholly-owned subsidiary of Ameriprise Financial, Inc. (Ameriprise Financial), serves as the investment manager to Columbia Georgia Intermediate Municipal Bond Fund (the Fund). Under an investment management services agreement (the IMS Agreement), Columbia Management provides investment advice and other services to the Fund and other funds distributed by Columbia Management Investment Distributors, Inc. (collectively, the Funds).
On an annual basis, the Fund's Board of Trustees (the Board), including the independent Board members (the Independent Trustees), considers renewal of the IMS Agreement. Columbia Management prepared detailed reports for the Board and its Contracts Committee in January, March and April 2013, including reports based on analyses of data provided by an independent organization and a comprehensive response to each item of information requested by independent legal counsel to the Independent Trustees (Independent Legal Counsel) in a letter to the Investment Manager, to assist the Board in making this determination. All of the materials presented in January, March and April were first supplied in draft form to designated representatives of the Independent Trustees, i.e., Independent Legal Counsel, the Chair of the Board and the Chair of the Contracts Committee, and the final materials (including proposed additional breakpoints in IMS fees for certain Funds) were revised to reflect discussion and subsequent requests made by the Contracts Committee. In addition, throughout the year, the Board (or its committees) regularly meets with portfolio management teams and senior management personnel, and reviews information prepared by Columbia Management addressing the services Columbia Management provides and Fund performance. Further, the Board retained an independent consulting firm (the Independent Consultant) to assist the Independent Trustees in their review of IMS fees, expense caps and Ameriprise Financial's profitability. The Board also accords particular weight to the work, deliberations and conclusions of the Contracts Committee, the Investment Review Committee and the Compliance Committee in determining whether to continue the IMS Agreement.
The Board, at its April 15-17, 2013 in-person Board meeting (the April Meeting), considered the renewal of the IMS Agreement for an additional one-year term. At the April Meeting, Independent Legal Counsel reviewed with the Independent Trustees various factors relevant to the Board's consideration of advisory agreements and the Board's legal responsibilities related to such consideration. Following an analysis and discussion of the factors identified below, the Board, including all of the Independent Trustees, approved the renewal of the IMS Agreement.
Nature, Extent and Quality of Services Provided by Columbia Management
The Independent Trustees analyzed various reports and presentations they had received detailing the services performed by Columbia Management, as well as its expertise, resources and capabilities. The Independent Trustees specifically considered many developments during the past year concerning the services provided by Columbia Management, including, in particular, the recent globalization initiative, which fosters increased worldwide investment support of global products, continued investment in upgrading technology (such as the implementation of new systems and hardware), the hiring of a Chief Interest Rate Strategist as part of Columbia Management's fixed income team and the addition of Columbia Management investment personnel to the Asset Allocation, Quantitative and Technology teams. The Independent Trustees noted the information they received concerning Columbia Management's ability to retain its key portfolio management personnel. In this regard, the Independent Trustees took into account their comprehensive discussions with Columbia Management's Chief Investment Officer (the CIO), observing the organizational depth of Columbia Management and the capabilities of its investment personnel. The Independent Trustees also recalled the information the CIO provided them identifying the strengths and areas for enhancement of each Columbia Management investment team, as well as the discussion with the CIO regarding the investment personnel talent being infused to enhance support for certain Funds. The Independent Trustees also observed the materials demonstrating the strength and depth of Columbia Management's equity and fixed income research departments.
In connection with the Board's evaluation of the overall package of services provided by Columbia Management, the Board also considered the quality of administrative services provided to the Fund by Columbia Management, recalling the information it received highlighting significant achievements in 2012 in the performance of administrative services (such as strong accounting performance measures, refined derivatives processing and enhancements to the electronic communications under the affiliated and unaffiliated service provider oversight program). In evaluating the quality of services provided under the IMS Agreement and the Fund's Administrative Service Agreement, the Independent Trustees also took into account the organization and strength of the Fund's and its service providers' compliance programs. In
Annual Report 2013
34
Columbia Georgia Intermediate Municipal Bond Fund
Approval of Investment Management Services
Agreement (continued)
addition, the Board also reviewed the financial condition of Columbia Management (and its affiliates) and each entity's ability to carry out its responsibilities under the IMS Agreement and the Fund's other services agreements with affiliates of Ameriprise Financial, observing the financial strength of Ameriprise Financial, with its solid balance sheet. The Board also discussed the acceptability of the terms of the IMS Agreement (including the relatively broad scope of services required to be performed by Columbia Management). The Board concluded that the services being performed under the IMS Agreement were of a reasonably high quality.
Based on the foregoing, and based on other information received (both oral and written, including the information on investment performance referenced below) and other considerations, the Board concluded that Columbia Management and its affiliates were in a position to continue to provide a high quality and level of services to the Fund.
Investment Performance
For purposes of evaluating the nature, extent and quality of services provided under the IMS Agreement, the Board carefully reviewed the investment performance of the Fund. In this regard, the Board considered detailed reports providing the results of analyses performed by an independent organization showing, for various periods, the performance of the Fund, the performance of a benchmark index, the percentage ranking of the Fund among its comparison group and the net assets of the Fund. The Board observed the Fund's underperformance for certain periods, noting that appropriate steps had been taken or are contemplated to help improve the Fund's performance.
Comparative Fees, Costs of Services Provided and the Profits Realized By Columbia Management and its Affiliates from their Relationships with the Fund
The Board reviewed comparative fees and the costs of services to be provided under the IMS Agreement. The Board members considered detailed comparative information set forth in an annual report on fees and expenses, including, among other things, data (based on analyses conducted by an independent organization) showing a comparison of the Fund's expenses with median expenses paid by funds in its comparative peer universe, as well as data showing the Fund's contribution to Columbia Management's profitability.
The Board accorded particular weight to the notion that the level of fees should reflect a rational pricing model applied consistently across the various product lines in the Fund family, while assuring that the overall fees for each Fund (with few defined exceptions) are generally in line with the "pricing philosophy" (i.e., that the total expense ratio of the Fund is no higher than the median expense ratio of funds in the same comparison universe of the Fund).
In this connection, the Board also considered the Independent Consultant's report that concluded that: (i) the Funds' standardized investment management fee rates, particularly in the context of the current competitive fee landscape, were within a reasonable range; and (ii) the Funds' expense cap philosophy of assuring that each Fund's total expense ratio is not above its peer universe median ratio is reasonable. The Board took into account that the Fund's total expense ratio (after considering proposed expense caps/waivers) approximated the peer universe's median expense ratio. Based on its review, the Board concluded that the Fund's management fee was fair and reasonable in light of the extent and quality of services that the Fund receives.
The Board also considered the expected profitability of Columbia Management and its affiliates in connection with Columbia Management providing investment management services to the Fund. In this regard, the Board referred to a detailed profitability report, discussing the profitability to Columbia Management and Ameriprise Financial from managing, operating and distributing the Funds. In this regard, the Board observed that 2012 profitability approximates 2011 profitability and that, as was the case in 2011, 2012 profitability remained generally in line with (and, in many cases, lower than) the reported profitability of other asset management firms. Further, the Board considered the Independent Consultant's report that concluded that Columbia Management's profitability, particularly in comparison to industry competitors, was reasonable and not excessive. It also took into account the indirect economic benefits flowing to Columbia Management or its affiliates in connection with managing or distributing the Funds, such as the enhanced ability to offer various other financial products to Ameriprise Financial customers, soft dollar benefits and overall reputational advantages. The Board noted that the fees paid by the Funds should permit the Investment Manager to offer competitive compensation to its personnel, make necessary investments in its business and earn an appropriate profit. The Board concluded that profitability levels were reasonable.
Annual Report 2013
35
Columbia Georgia Intermediate Municipal Bond Fund
Approval of Investment Management Services
Agreement (continued)
Economies of Scale to be Realized
The Board also considered the economies of scale that might be realized by Columbia Management as the Fund grows and took note of the extent to which Fund shareholders might also benefit from such growth. In this regard, the Independent Trustees took into account that IMS fees decline as Fund assets exceed various breakpoints, all of which have not been surpassed.
Based on the foregoing, the Board, including all of the Independent Trustees, concluded that the investment management service fees were fair and reasonable in light of the extent and quality of services provided. In reaching this conclusion, no single factor was determinative. On April 17, 2013, the Board, including all of the Independent Trustees, approved the renewal of the IMS Agreement.
Annual Report 2013
36
Columbia Georgia Intermediate Municipal Bond Fund
Important Information About This Report
Each fund mails one shareholder report to each shareholder address. If you would like more than one report, please call shareholder services at 800.345.6611 and additional reports will be sent to you.
The policy of the Board is to vote the proxies of the companies in which each fund holds investments consistent with the procedures as stated in the Statement of Additional Information (SAI). You may obtain a copy of the SAI without charge by calling 800.345.6611; contacting your financial intermediary; visiting columbiamanagement.com; or searching the website of the Securities and Exchange Commission (SEC) at sec.gov. Information regarding how each fund voted proxies relating to portfolio securities is filed with the SEC by August 31 for the most recent 12-month period ending June 30 of that year, and is available without charge by visiting columbiamanagement.com; or searching the website of the SEC at sec.gov.
Each fund files a complete schedule of portfolio holdings with the SEC for the first and third quarters of each fiscal year on Form N-Q. Each fund's Form N-Q is available on the SEC's website at sec.gov and may be reviewed and copied at the SEC's Public Reference Room in Washington, D.C. Information on the operation of the Public Reference Room may be obtained by calling 800.SEC.0330. Each fund's complete schedule of portfolio holdings, as filed on Form N-Q, can also be obtained without charge, upon request, by calling 800.345.6611.
Annual Report 2013
37

Columbia Georgia Intermediate Municipal Bond Fund
P.O. Box 8081
Boston, MA 02266-8081
columbiamanagement.com
This information is for use with concurrent or prior delivery of a fund prospectus. Please read and consider the investment objectives, risks, charges and expenses for any fund carefully before investing. For a prospectus which contains this and other important information about the Fund go to columbiamanagement.com. The Fund is distributed by Columbia Management Investment Distributors, Inc., member FINRA, and managed by Columbia Management Investment Advisers, LLC.
© 2013 Columbia Management Investment Advisers, LLC. All rights reserved.
ANN152_04_C01_(06/13)
Annual Report
April 30, 2013

Columbia Maryland Intermediate Municipal Bond Fund
Not FDIC insured • No bank guarantee • May lose value
Columbia Maryland Intermediate Municipal Bond Fund
 Dear Shareholders,
U.S. equities had a strong first quarter
Similar to 2012, equities once again were the best performing asset class in the first quarter of 2013. The S&P 500 Index reached an all-time closing high on the last trading day of the quarter and pushed through its October 2007 peak. Although global equities have performed well year-to-date, there is significant performance divergence among regions. In local currency terms, Japanese equities were the best performing developed market globally, and U.S. stocks outperformed most other global equity markets. European equities rose in the first quarter but trailed U.S. stocks and had a turbulent March, as investors were reminded of instability in the eurozone with news of a banking crisis in Cyprus.
Although all 10 sectors of the S&P 500 Index delivered positive returns, this was a rally led by defensive stocks such as those in health care, consumer staples and utilities. Materials and technology stocks were the weakest sectors.
High yield leads fixed income; most sectors flat to down
The fixed-income markets lagged equities with modest, single-digit returns coming from municipals and high-yield sectors in the United States. Most government and investment-grade credit sectors were roughly flat to down for the first quarter of 2013. Emerging market bonds were the biggest disappointment with single-digit losses.
Columbia Management to begin delivering summary prospectuses
Each Columbia fund is required to update its prospectus on an annual basis. Beginning with June 2013 prospectus updates, shareholders of Columbia retail mutual funds will start to receive a summary prospectus, rather than the full length (statutory) mutual fund prospectus they have received in the past.
Each fund's summary prospectus will include the following key information:
> Investment objective
> Fee and expense table
> Portfolio turnover rate information
> Principal investment strategies, principal risks and performance information
> Management information
> Purchase and sale information
> Tax information
> Financial intermediary compensation information
Each fund's statutory prospectus will contain additional information about the fund and its risks. Both the statutory and summary prospectus will be updated each year, and will be available at columbiamanagement.com. Shareholders may request a printed version of a statutory prospectus at no cost by calling 800.345.6611 or sending an email to serviceinquiries@columbiamanagement.com.
Stay on track with Columbia Management
Backed by more than 100 years of experience, Columbia Management is one of the nation's largest asset managers. At the heart of our success — and, most importantly, that of our investors — are highly talented industry professionals, brought together by a unique way of working. We are dedicated to helping you take advantage of today's opportunities and anticipate tomorrow's. We stay abreast of the latest investment trends and ideas, using our collective insight to evaluate events and transform them into solutions you can use.
Visit columbiamanagement.com for:
> The Columbia Management Perspectives blog, featuring timely posts by our investment teams
> Detailed up-to-date fund performance and portfolio information
> Economic analysis and market commentary
> Quarterly fund commentaries
> Columbia Management Investor, our award-winning quarterly newsletter for shareholders
Thank you for your continued support of the Columbia Funds. We look forward to serving your investment needs for many years to come.
Best Regards,

J. Kevin Connaughton
President, Columbia Funds
The S&P 500 Index, an unmanaged index, measures the performance of 500 large-capitalization U.S. stocks and is frequently used as a general measure of market performance. Indices are not available for investment, are not professionally managed and do not reflect sales charges, fees, brokerage commissions, taxes or other expenses of investing.
Investors should consider the investment objectives, risks, charges and expenses of a mutual fund carefully before investing. For a free prospectus, which contains this and other important information about a fund, visit columbiamanagement.com. The prospectus should be read carefully before investing.
Columbia Funds are distributed by Columbia Management Investment Distributors, Inc., member FINRA, and managed by Columbia Management Investment Advisers, LLC.
© 2013 Columbia Management Investment Advisers, LLC. All rights reserved.
Columbia Maryland Intermediate Municipal Bond Fund
Performance Overview | | | 2 | | |
Manager Discussion of Fund Performance | | | 4 | | |
Understanding Your Fund's Expenses | | | 6 | | |
Portfolio of Investments | | | 7 | | |
Statement of Assets and Liabilities | | | 13 | | |
Statement of Operations | | | 15 | | |
Statement of Changes in Net Assets | | | 16 | | |
Financial Highlights | | | 18 | | |
Notes to Financial Statements | | | 23 | | |
Report of Independent Registered
Public Accounting Firm | | | 29 | | |
Federal Income Tax Information | | | 30 | | |
Trustees and Officers | | | 31 | | |
Approval of Investment Management Services Agreement | | | 36 | | |
Important Information About This Report | | | 41 | | |
Fund Investment Manager
Columbia Management Investment
Advisers, LLC
225 Franklin Street
Boston, MA 02110
Fund Distributor
Columbia Management Investment
Distributors, Inc.
225 Franklin Street
Boston, MA 02110
Fund Transfer Agent
Columbia Management Investment
Services Corp.
P.O. Box 8081
Boston, MA 02266-8081
For more information about any of the funds, please visit columbiamanagement.com or call 800.345.6611. Customer Service Representatives are available to answer your questions Monday through Friday from 8 a.m. to 8 p.m. Eastern time.
The views expressed in this report reflect the current views of the respective parties. These views are not guarantees of future performance and involve certain risks, uncertainties and assumptions that are difficult to predict, so actual outcomes and results may differ significantly from the views expressed. These views are subject to change at any time based upon economic, market or other conditions and the respective parties disclaim any responsibility to update such views. These views may not be relied on as investment advice and, because investment decisions for a Columbia Fund are based on numerous factors, may not be relied on as an indication of trading intent on behalf of any particular Columbia Fund. References to specific securities should not be construed as a recommendation or investment advice.
Columbia Maryland Intermediate Municipal Bond Fund
Performance Summary
> Columbia Maryland Intermediate Municipal Bond Fund (the Fund) Class A shares returned 3.58% excluding sales charges for the 12-month period that ended April 30, 2013.
> The Fund lagged its benchmark, the Barclays 3-15 Year Blend Municipal Bond Index, which returned 4.35% for the same 12-month period.
> The Fund's concentration in higher quality securities detracted from return, as lower-rated names performed the best during the period.
Average Annual Total Returns (%) (for period ended April 30, 2013)
| | Inception | | 1 Year | | 5 Years | | 10 Years | |
Class A | | 09/01/90 | | | | | | | |
Excluding sales charges | | | | | 3.58 | | | | 4.54 | | | | 3.37 | | |
Including sales charges | | | | | 0.23 | | | | 3.86 | | | | 3.02 | | |
Class B | | 06/08/93 | | | | | | | |
Excluding sales charges | | | | | 2.81 | | | | 3.76 | | | | 2.61 | | |
Including sales charges | | | | | -0.19 | | | | 3.76 | | | | 2.61 | | |
Class C | | 06/17/92 | | | | | | | |
Excluding sales charges | | | | | 2.81 | | | | 3.76 | | | | 2.59 | | |
Including sales charges | | | | | 1.81 | | | | 3.76 | | | | 2.59 | | |
Class R4* | | 03/19/13 | | | 3.60 | | | | 4.55 | | | | 3.37 | | |
Class Z | | 09/01/90 | | | 3.84 | | | | 4.80 | | | | 3.62 | | |
Barclays 3-15 Year Blend Municipal Bond Index | | | | | 4.35 | | | | 5.91 | | | | 4.85 | | |
Returns for Class A are shown with and without the maximum initial sales charge of 3.25%. Returns for Class B are shown with and without the applicable contingent deferred sales charge (CDSC) of 3.00% in the first year, declining to 1.00% in the fourth year and eliminated thereafter. Returns for Class C are shown with and without the 1.00% CDSC for the first year only. The Fund's other classes are not subject to sales charges and have limited eligibility. Please see the Fund's prospectuses for details. Performance for different share classes will vary based on differences in sales charges and fees associated with each class. All results shown assume reinvestment of distributions during the period. Returns do not reflect the deduction of taxes that a shareholder may pay on Fund distributions or on the redemption of Fund shares. Performance results reflect the effect of any fee waivers or reimbursements of Fund expenses by Columbia Management Investment Advisers, LLC and/or any of its affiliates. Absent these fee waivers or expense reimbursement arrangements, performance results would have been lower.
The performance information shown represents past performance and is not a guarantee of future results. The investment return and principal value of your investment will fluctuate so that your shares, when redeemed, may be worth more or less than their original cost. Current performance may be lower or higher than the performance information shown. You may obtain performance information current to the most recent month-end by contacting your financial intermediary, visiting columbiamanagement.com or calling 800.345.6611.
*The returns shown for periods prior to the share class inception date (including returns for the Life of the Fund, if shown, which are since Fund inception) include the returns of the Fund's oldest share class. Since the Fund launched more than one share class at its inception, Class A shares were used. These returns are adjusted to reflect any higher class-related operating expenses of the newer share classes, as applicable. Please visit columbiamanagement.com/mutual-funds/appended-performance for more information.
The Barclays 3-15 Year Blend Municipal Bond Index is an unmanaged index that tracks the performance of municipal bonds issued after December 31, 1990, with remaining maturities between 2 and 17 years and at least $7 million in principal amount outstanding.
Indices are not available for investment, are not professionally managed and do not reflect sales charges, fees, brokerage commissions, taxes or other expenses of investing. Securities in the Fund may not match those in an index.
Annual Report 2013
2
Columbia Maryland Intermediate Municipal Bond Fund
Performance Overview (continued)
Performance of a Hypothetical $10,000 Investment (May 1, 2003 – April 30, 2013)
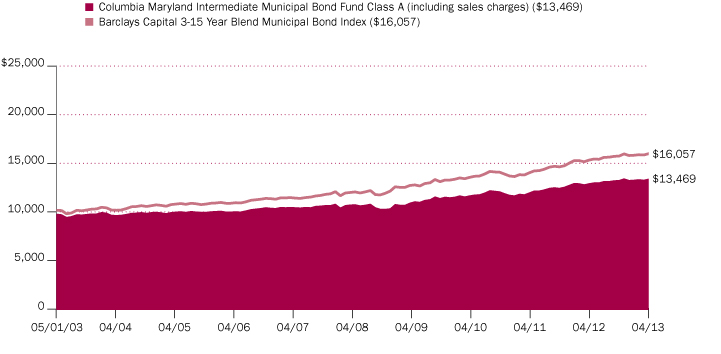
The chart above shows the change in value of a hypothetical $10,000 investment in Class A shares of Columbia Maryland Intermediate Municipal Bond Fund during the stated time period, and does not reflect the deduction of taxes that a shareholder may pay on Fund distributions or on the redemption of Fund shares.
Annual Report 2013
3
Columbia Maryland Intermediate Municipal Bond Fund
Manager Discussion of Fund Performance
For the 12-month period that ended April 30, 2013, the Fund's Class A shares returned 3.58% excluding sales charges. The Barclays 3-15 Year Blend Municipal Bond Index, which is national in scope, gained 4.35%. The Fund's higher quality positioning than the benchmark detracted from results. Maryland bonds are generally of higher quality than many other states, which limited our ability to compete with the index return in a period that favored lower-rated issues. Higher rate securities offer lower yields and less return potential as the yield spread tightens between higher and lower rated bonds, which it did during the period.
U.S. Economy: Growth in the Slow Lane
Europe's general economic woes, a financial crisis in Cyprus and U.S. struggles to avoid a fiscal cliff of tax increases and various spending cuts (commonly referred to as the sequester) weighed on the global economy throughout the 12-month period ended April 30, 2013. Late in the period, the sequester clouded consumer confidence in the United States, even though it has had little material impact on the economy to date. However, a decrease in the U.S. unemployment rate early in 2013, steady manufacturing activity and a rebound in the housing market are encouraging signs that growth has broadened in recent months. Pent-up demand, low mortgage rates and an improving labor market have lifted home sales. Even so, there has been no real improvement in the overall pace of economic growth since the current cycle of recovery began in 2009. Household income growth is practically nonexistent, and household spending has come under pressure after the expiration of the payroll tax cut. Against this backdrop, U.S. investors bid prices higher on stocks and other volatile assets as central banks continued to pour liquidity into key markets.
Municipal Market Generates Solid Returns
The U.S. municipal bond market delivered modest, but solid, returns for the 12-month period. Yields fell across all maturities, rallying strongly after the November 2012 presidential election. The market sold off in December, but the retreat was short lived, as weaker economic numbers early in 2013 sent fixed-income investors back to the relative safety of the municipal market. At year end, municipal yields were eight, 18 and 25 basis points lower for five-, 10- and 15-year maturities compared to one year ago. Higher quality bonds generally underperformed lower quality bonds. Pre-refunded bonds, which are higher quality and generally shorter in maturity, were the weakest sector among municipals. A pre-refunded bond is created when an issuer refinances existing debt at a lower rate. The proceeds from the lower-yielding issue are invested in U.S. Treasury securities and used to repay the original bond at its original call date. Hospital bonds were generally the strongest performers. Local general obligation bonds outperformed state general obligation bonds by a small margin. For the second consecutive year, rating agencies issued more downgrades than upgrades in the overall municipal market, as a lackluster economy continued to pressure issuers.
High Quality Orientation Hampered Returns
The Fund delivered a solid return for the 12-month period, but it lagged the index because it had more exposure to higher quality names, especially state and local general obligation bonds, which yielded significantly less than the yield on the benchmark index. To help compensate for the lack of yield available from
Portfolio Management
Brian McGreevy
Quality Breakdown (%)
(at April 30, 2013) | |
AAA rating | | | 11.9 | | |
AA rating | | | 48.8 | | |
A rating | | | 18.8 | | |
BBB rating | | | 17.1 | | |
Non-investment grade | | | 2.2 | | |
Non rated | | | 1.2 | | |
Total | | | 100.0 | | |
Percentages indicated are based upon total fixed income securities (excluding Money Market Funds).
Bond ratings apply to the underlying holdings of the Fund and not the Fund itself and are divided into categories ranging from AAA (highest) to D (lowest), and are subject to change. The ratings shown are determined by using the middle rating of Moody's, S&P, and Fitch after dropping the highest and lowest available ratings. When a rating from only two agencies is available, the lower rating is used. When a rating from only one agency is available, that rating is used. When a bond is not rated by any of these agencies, it is designated as Not rated. Credit ratings are subjective opinions and not statements of fact.
Annual Report 2013
4
Columbia Maryland Intermediate Municipal Bond Fund
Manager Discussion of Fund Performance (continued)
Maryland municipal bonds, we managed the Fund's duration a little longer than the index. Duration is a measure of interest rate sensitivity and when yields decline, as they did during this 12-month period, a longer duration adds to return. The Fund had less exposure to the three- to five-year range and more exposure to the 10-year portion of the yield curve — a line that charts municipal bond yields for securities of comparable quality across a range of maturities from short to long. Although the Fund had less exposure than the index to bonds in the 14- to 17-year range, the securities it held in that range generated returns that exceeded their counterparts in the index.
The Fund also benefited from positions in BBB rated bonds, which accounted for approximately 17% of the portfolio and generated returns higher than their counterparts in the index. We added to the Fund's exposure to BBB rated bonds over the period with the purchase of Industrial Development Revenue bonds and student housing bonds. We also added exposure out beyond 10 years in hospital and college issues. We decreased the Fund's exposure to short maturities and short-term callable bonds to fund these purchases. (A callable bond is one that the issuer may redeem prior to its maturity date.)
Maryland's Job Growth Vulnerable to the Sequester
Recent job growth has helped the Maryland economy regain some momentum after it lost some ground in 2012. An expanding workforce has driven Maryland's unemployment rate down to 6.6% — lower than the national average. Unfortunately, the state is now vulnerable to spending cuts that could hurt its defense industry and health science centers. However, this austerity is not expected to derail Maryland's recovery, as increased federal funding under the Affordable Care Act should soften the blow. Maryland's housing market has been slow to recover as it continues to deal with a wave of foreclosures, which are likely to drive prices slightly lower before they begin to turn around — perhaps later this year. Over the longer term, we believe that Maryland will continue to benefit from its highly educated workforce and proximity to Washington D.C.
Looking Ahead
In this environment, we will expect to continue to emphasize the quality, sector and maturity profile of the Fund versus its benchmarks, and we expect to seek out issues rated A and BBB across sectors that mature in 10-14 years, while maintaining a dollar-weighted average portfolio maturity of between three and ten years, as we believe they are currently attractive. With a seasoned staff of credit professionals, we believe we are well positioned to discover value opportunities that offer incremental yield and appropriate fundamentals among Maryland municipal bonds.
Annual Report 2013
5
Columbia Maryland Intermediate Municipal Bond Fund
Understanding Your Fund's Expenses
(Unaudited)
As an investor, you incur two types of costs. There are transaction costs, which generally include sales charges on purchases and may include redemption fees. There are also ongoing costs, which generally include management fees, distribution and service (Rule 12b-1) fees, and other fund expenses. The following information is intended to help you understand your ongoing costs (in dollars) of investing in the Fund and to help you compare these costs with the ongoing costs of investing in other mutual funds.
Analyzing Your Fund's Expenses
To illustrate these ongoing costs, we have provided examples and calculated the expenses paid by investors in each share class of the Fund during the period. The actual and hypothetical information in the table is based on an initial investment of $1,000 at the beginning of the period indicated and held for the entire period. Expense information is calculated two ways and each method provides you with different information. The amount listed in the "Actual" column is calculated using the Fund's actual operating expenses and total return for the period. You may use the Actual information, together with the amount invested, to estimate the expenses that you paid over the period. Simply divide your account value by $1,000 (for example, an $8,600 account value divided by $1,000 = 8.6), then multiply the results by the expenses paid during the period under the Actual column. The amount listed in the "Hypothetical" column assumes a 5% annual rate of return before expenses (which is not the Fund's actual return) and then applies the Fund's actual expense ratio for the period to the hypothetical return. You should not use the hypothetical account values and expenses to estimate either your actual account balance at the end of the period or the expenses you paid during the period. See "Compare With Other Funds" below for details on how to use the hypothetical data.
Compare With Other Funds
Since all mutual funds are required to include the same hypothetical calculations about expenses in shareholder reports, you can use this information to compare the ongoing cost of investing in the Fund with other funds. To do so, compare the hypothetical example with the 5% hypothetical examples that appear in the shareholder reports of other funds. As you compare hypothetical examples of other funds, it is important to note that hypothetical examples are meant to highlight the ongoing costs of investing in a fund only and do not reflect any transaction costs, such as sales charges, or redemption or exchange fees. Therefore, the hypothetical calculations are useful in comparing ongoing costs only, and will not help you determine the relative total costs of owning different funds. If transaction costs were included in these calculations, your costs would be higher.
November 1, 2012 – April 30, 2013
| | Account Value at the Beginning
of the Period ($) | | Account Value at the End of the
Period ($) | | Expenses Paid During the
Period ($) | | Fund's Annualized
Expense Ratio (%) | |
| | Actual | | Hypothetical | | Actual | | Hypothetical | | Actual | | Hypothetical | | Actual | |
Class A | | | 1,000.00 | | | | 1,000.00 | | | | 1,011.50 | | | | 1,020.78 | | | | 4.04 | | | | 4.06 | | | | 0.81 | | |
Class B | | | 1,000.00 | | | | 1,000.00 | | | | 1,007.70 | | | | 1,017.06 | | | | 7.77 | | | | 7.80 | | | | 1.56 | | |
Class C | | | 1,000.00 | | | | 1,000.00 | | | | 1,007.70 | | | | 1,017.06 | | | | 7.77 | | | | 7.80 | | | | 1.56 | | |
Class R4 | | | 1,000.00 | | | | 1,000.00 | | | | 1,010.60 | * | | | 1,022.07 | | | | 0.62 | * | | | 2.76 | | | | 0.55 | * | |
Class Z | | | 1,000.00 | | | | 1,000.00 | | | | 1,012.70 | | | | 1,022.02 | | | | 2.79 | | | | 2.81 | | | | 0.56 | | |
*For the period March 19, 2013 through April 30, 2013. Class R4 shares commenced operations on March 19, 2013.
Expenses paid during the period are equal to the annualized expense ratio for each class as indicated above, multiplied by the average account value over the period and then multiplied by the number of days in the Fund's most recent fiscal half year and divided by 365.
Expenses do not include fees and expenses incurred indirectly by the Fund from the underlying funds in which the Fund may invest (also referred to as "acquired funds"), including affiliated and non-affiliated pooled investment vehicles (including mutual funds and exchange-traded funds).
Had Columbia Management Investment Advisers, LLC and/or certain of its affiliates not waived/reimbursed certain fees and expenses, account value at the end of the period would have been reduced.
Annual Report 2013
6
Columbia Maryland Intermediate Municipal Bond Fund
Portfolio of Investments
April 30, 2013
(Percentages represent value of investments compared to net assets)
Municipal Bonds 97.3%
Issue
Description | | Coupon
Rate | | Principal
Amount ($) | | Value ($) | |
Disposal 0.9% | |
Maryland Environmental Service
Revenue Bonds
Mid Shore II Regional Landfill
Series 2011
11/01/24 | | | 5.000 | % | | | 1,030,000 | | | | 1,220,499 | | |
Higher Education 10.2% | |
City of Westminster
Revenue Bonds
McDaniel College, Inc.
Series 2006
11/01/17 | | | 5.000 | % | | | 575,000 | | | | 631,028 | | |
Maryland Health & Higher Educational Facilities Authority
Revenue Bonds
Goucher College
Series 2012A
07/01/26 | | | 5.000 | % | | | 1,215,000 | | | | 1,422,838 | | |
Johns Hopkins University
Series 2008A
07/01/18 | | | 5.000 | % | | | 1,750,000 | | | | 2,109,660 | | |
Johns Hopkins University Project
Series 2012A
07/01/29 | | | 5.000 | % | | | 3,000,000 | | | | 3,589,350 | | |
Maryland Institute College of Art
Series 2012
06/01/29 | | | 5.000 | % | | | 1,500,000 | | | | 1,697,475 | | |
Notre Dame of Maryland University
Series 2012
10/01/32 | | | 5.000 | % | | | 1,000,000 | | | | 1,095,900 | | |
Maryland Industrial Development Financing Authority
Refunding Revenue Bonds
American Center for Physics Facility
Series 2001
12/15/15 | | | 5.250 | % | | | 1,000,000 | | | | 1,004,180 | | |
Morgan State University
Refunding Revenue Bonds
Series 2012
07/01/30 | | | 5.000 | % | | | 150,000 | | | | 175,593 | | |
University System of Maryland
Revenue Bonds
Series 2006A
10/01/15 | | | 5.000 | % | | | 2,000,000 | | | | 2,222,300 | | |
Total | | | | | | | 13,948,324 | | |
Hospital 11.9% | |
Maryland Health & Higher Educational Facilities Authority
Revenue Bonds
Carroll Hospital
Series 2012A
07/01/26 | | | 5.000 | % | | | 1,210,000 | | | | 1,383,925 | | |
07/01/27 | | | 5.000 | % | | | 1,000,000 | | | | 1,138,610 | | |
Municipal Bonds (continued)
Issue
Description | | Coupon
Rate | | Principal
Amount ($) | | Value ($) | |
Carroll Hospital Center
Series 2006
07/01/26 | | | 4.500 | % | | | 1,000,000 | | | | 1,045,000 | | |
FHA Insured Mortgage-Western Health
Series 2006 | |
07/01/13 | | | 5.000 | % | | | 1,280,000 | | | | 1,289,280 | | |
01/01/20 | | | 5.000 | % | | | 1,450,000 | | | | 1,622,101 | | |
Frederick Memorial Hospital
Series 2012-A | |
07/01/26 | | | 5.000 | % | | | 1,000,000 | | | | 1,145,450 | | |
Johns Hopkins Health System
Series 2012
07/01/28 | | | 5.000 | % | | | 1,000,000 | | | | 1,191,950 | | |
MedStar Health
Series 2011
08/15/22 | | | 5.000 | % | | | 1,620,000 | | | | 1,923,232 | | |
Series 2013A
08/15/27 | | | 5.000 | % | | | 1,000,000 | | | | 1,167,970 | | |
Peninsula Regional Medical Center
Series 2006
07/01/26 | | | 5.000 | % | | | 2,000,000 | | | | 2,209,720 | | |
Maryland Health & Higher Educational Facilities Authority(a)
Revenue Bonds
Johns Hopkins Health System
Series 2008
05/15/48 | | | 5.000 | % | | | 2,000,000 | | | | 2,174,360 | | |
Total | | | | | | | 16,291,598 | | |
Hotels 1.0% | |
City of Baltimore
Senior Revenue Bonds
Series 2006A (XLCA)
09/01/17 | | | 5.250 | % | | | 1,300,000 | | | | 1,385,761 | | |
Investor Owned 2.3% | |
Maryland Economic Development Corp.
Refunding Revenue Bonds
Potomac
Series 2009
09/01/22 | | | 6.200 | % | | | 2,500,000 | | | | 3,092,500 | | |
Local Appropriation 5.9% | |
City of Baltimore
Refunding Certificate of Participation
Series 2010A
10/01/17 | | | 5.000 | % | | | 1,500,000 | | | | 1,747,605 | | |
Refunding Unlimited General Obligation Bonds
Consolidated Public Improvement
Series 2013-B
10/15/23 | | | 5.000 | % | | | 1,000,000 | | | | 1,259,010 | | |
County of Baltimore
Certificate of Participation
Series 2012
10/01/20 | | | 5.000 | % | | | 1,500,000 | | | | 1,856,910 | | |
10/01/22 | | | 5.000 | % | | | 2,000,000 | | | | 2,505,440 | | |
The accompanying Notes to Financial Statements are an integral part of this statement.
Annual Report 2013
7
Columbia Maryland Intermediate Municipal Bond Fund
Portfolio of Investments (continued)
April 30, 2013
Municipal Bonds (continued)
Issue
Description | | Coupon
Rate | | Principal
Amount ($) | | Value ($) | |
Howard County Housing Commission
Revenue Bonds
Roger Carter Recreation Center Project
Series 2011
06/01/26 | | | 5.000 | % | | | 585,000 | | | | 681,759 | | |
Total | | | | | | | 8,050,724 | | |
Local General Obligation 15.1% | |
City of Baltimore
Unlimited General Obligation Bonds
Consolidated Public Improvement
Series 2008A (AGM)
10/15/22 | | | 5.000 | % | | | 2,000,000 | | | | 2,368,140 | | |
County of Anne Arundel
General Obligation Limited Notes
Consolidated General Improvement
Series 2006
03/01/18 | | | 5.000 | % | | | 3,300,000 | | | | 3,699,300 | | |
Limited General Obligation Refunding Bonds
Consolidated General Improvement
Series 2006
03/01/15 | | | 5.000 | % | | | 2,000,000 | | | | 2,171,220 | | |
County of Baltimore
Unlimited General Obligation Bonds
Consolidated Public Improvement
Series 2008
02/01/18 | | | 5.000 | % | | | 1,000,000 | | | | 1,199,000 | | |
County of Frederick
Unlimited General Obligation Refunding Bonds
Public Facilities
Series 2005
08/01/14 | | | 5.000 | % | | | 1,500,000 | | | | 1,588,380 | | |
Series 2006
11/01/18 | | | 5.250 | % | | | 2,005,000 | | | | 2,470,180 | | |
11/01/21 | | | 5.250 | % | | | 2,500,000 | | | | 3,239,550 | | |
County of Montgomery
Unlimited General Obligation Refunding Bonds
Consolidated Public Improvement
Series 2005A
07/01/16 | | | 5.000 | % | | | 1,250,000 | | | | 1,428,775 | | |
County of Prince George's
Limited General Obligation Refunding & Public
Improvement Bonds
Series 2011B
09/15/20 | | | 5.000 | % | | | 2,000,000 | | | | 2,535,960 | | |
Total | | | | | | | 20,700,505 | | |
Multi-Family 6.1% | |
Howard County Housing Commission
Revenue Bonds
Series 2012-A(a)
07/01/34 | | | 1.440 | % | | | 1,000,000 | | | | 1,000,000 | | |
Municipal Bonds (continued)
Issue
Description | | Coupon
Rate | | Principal
Amount ($) | | Value ($) | |
Maryland Economic Development Corp.
Refunding Revenue Bonds
Morgan State University Project
Senior Series 2012
07/01/20 | | | 4.000 | % | | | 550,000 | | | | 594,638 | | |
07/01/21 | | | 4.000 | % | | | 550,000 | | | | 590,821 | | |
University of Maryland-Baltimore County Project
Series 2006 (XLCA)
07/01/20 | | | 5.000 | % | | | 600,000 | | | | 637,590 | | |
University of Maryland-College Park Projects
Series 2006 (AGCP)
06/01/17 | | | 5.000 | % | | | 1,000,000 | | | | 1,093,590 | | |
06/01/19 | | | 5.000 | % | | | 1,000,000 | | | | 1,080,910 | | |
Revenue Bonds
Salisbury University Project
Series 2012
06/01/27 | | | 5.000 | % | | | 1,100,000 | | | | 1,212,134 | | |
Senior Revenue Bonds
Towson University Project
Series 2007A
07/01/24 | | | 5.250 | % | | | 1,185,000 | | | | 1,290,169 | | |
Towson University Project
Series 2012
07/01/27 | | | 5.000 | % | | | 700,000 | | | | 793,464 | | |
Total | | | | | | | 8,293,316 | | |
Municipal Power 0.9% | |
Guam Power Authority
Refunding Revenue Bonds
Series 2012A (AGM)(b)
10/01/24 | | | 5.000 | % | | | 220,000 | | | | 265,540 | | |
Puerto Rico Electric Power Authority
Refunding Revenue Bonds
Series 2010ZZ(b)
07/01/25 | | | 5.250 | % | | | 1,000,000 | | | | 1,030,630 | | |
Total | | | | | | | 1,296,170 | | |
Other Bond Issue 2.9% | |
County of Montgomery
Revenue Bonds
Department of Liquor Control
Series 2009A
04/01/22 | | | 5.000 | % | | | 2,055,000 | | | | 2,441,422 | | |
Maryland Community Development Administration
Revenue Bonds
Capital Fund Securitization
Series 2003 (AGM)
07/01/21 | | | 4.400 | % | | | 1,500,000 | | | | 1,505,625 | | |
Total | | | | | | | 3,947,047 | | |
Other Industrial Development Bond 1.2% | |
Maryland Economic Development Corp.
Refunding Revenue Bonds
CNX Marine Terminals, Inc.
Series 2010
09/01/25 | | | 5.750 | % | | | 1,425,000 | | | | 1,591,226 | | |
The accompanying Notes to Financial Statements are an integral part of this statement.
Annual Report 2013
8
Columbia Maryland Intermediate Municipal Bond Fund
Portfolio of Investments (continued)
April 30, 2013
Municipal Bonds (continued)
Issue
Description | | Coupon
Rate | | Principal
Amount ($) | | Value ($) | |
Pool/Bond Bank 0.9% | |
Maryland Water Quality Financing Administration
Revolving Loan Fund
Revenue Bonds
Series 2008A
03/01/23 | | | 5.000 | % | | | 1,000,000 | | | | 1,177,190 | | |
Refunded/Escrowed 4.0% | |
City of Baltimore
Revenue Bonds
Water Project
Series 1994A Escrowed to Maturity (FGIC)
07/01/24 | | | 5.000 | % | | | 1,400,000 | | | | 1,784,706 | | |
County of Baltimore
Prerefunded 09/01/16 Revenue Bonds
Catholic Health Initiatives
Series 2006A
09/01/26 | | | 5.000 | % | | | 1,500,000 | | | | 1,703,940 | | |
Revenue Bonds
Catholic Health Initiatives
Series 2006A Escrowed to Maturity
09/01/16 | | | 5.000 | % | | | 1,000,000 | | | | 1,145,340 | | |
Maryland Health & Higher Educational Facilities Authority
Revenue Bonds
College of Notre Dame
Series 1998 Escrowed to Maturity (NPFGC)
10/01/14 | | | 4.600 | % | | | 510,000 | | | | 539,085 | | |
Maryland State Transportation Authority
Revenue Bonds
Series 1978 Escrowed to Maturity
07/01/16 | | | 6.800 | % | | | 305,000 | | | | 336,803 | | |
Total | | | | | | | 5,509,874 | | |
Retirement Communities 4.1% | |
City of Gaithersburg
Refunding Revenue Bonds
Asbury Obligation
Series 2009B
01/01/23 | | | 6.000 | % | | | 1,250,000 | | | | 1,420,850 | | |
County of Baltimore
Revenue Bonds
Oak Crest Village Incorporate Facility
Series 2007A
01/01/22 | | | 5.000 | % | | | 1,045,000 | | | | 1,114,440 | | |
01/01/27 | | | 5.000 | % | | | 2,000,000 | | | | 2,091,140 | | |
Maryland Health & Higher Educational Facilities Authority
Revenue Bonds
King Farm Presbyterian Community
Series 2007A
01/01/27 | | | 5.250 | % | | | 1,000,000 | | | | 1,001,580 | | |
Total | | | | | | | 5,628,010 | | |
Municipal Bonds (continued)
Issue
Description | | Coupon
Rate | | Principal
Amount ($) | | Value ($) | |
Single Family 1.2% | |
Maryland Community Development Administration
Revenue Bonds
Residential
Series 2010B
09/01/30 | | | 5.125 | % | | | 1,500,000 | | | | 1,658,505 | | |
Special Non Property Tax 5.0% | |
Maryland State Department of Transportation
Revenue Bonds
Series 2008
02/15/22 | | | 5.000 | % | | | 3,125,000 | | | | 3,650,531 | | |
Series 2009
06/15/21 | | | 4.000 | % | | | 1,495,000 | | | | 1,716,365 | | |
Territory of Guam
Revenue Bonds
Series 2011A(b)
01/01/31 | | | 5.000 | % | | | 350,000 | | | | 392,563 | | |
Virgin Islands Public Finance Authority
Revenue Bonds
Matching Fund Loan-Senior Lien
Series 2010A(b)
10/01/17 | | | 5.000 | % | | | 1,000,000 | | | | 1,118,850 | | |
Total | | | | | | | 6,878,309 | | |
Special Property Tax 2.7% | |
Anne Arundel County Consolidated District
Special Tax Refunding Bonds
Villages of Dorchester & Farmington
Series 2013
07/01/23 | | | 5.000 | % | | | 225,000 | | | | 273,879 | | |
07/01/24 | | | 5.000 | % | | | 500,000 | | | | 603,385 | | |
County of Frederick
Special Tax Bonds
Urbana Community Development Authority
Series 2010A
07/01/25 | | | 5.000 | % | | | 2,500,000 | | | | 2,868,950 | | |
Total | | | | | | | 3,746,214 | | |
State Appropriated 2.8% | |
Maryland Economic Development Corp.
Refunding Revenue Bonds
Department of Transportation Headquarters
Series 2010
06/01/22 | | | 4.500 | % | | | 2,675,000 | | | | 3,285,462 | | |
New Jersey Transportation Trust Fund Authority
Revenue Bonds
Transportation System
Series 2006A
12/15/19 | | | 5.250 | % | | | 500,000 | | | | 615,925 | | |
Total | | | | | | | 3,901,387 | | |
The accompanying Notes to Financial Statements are an integral part of this statement.
Annual Report 2013
9
Columbia Maryland Intermediate Municipal Bond Fund
Portfolio of Investments (continued)
April 30, 2013
Municipal Bonds (continued)
Issue
Description | | Coupon
Rate | | Principal
Amount ($) | | Value ($) | |
State General Obligation 5.2% | |
State of Maryland
Unlimited General Obligation Bonds
1st Series 2011B
03/15/18 | | | 5.000 | % | | | 1,500,000 | | | | 1,804,755 | | |
State & Local Facilities
1st Series 2009C
03/01/21 | | | 5.000 | % | | | 1,500,000 | | | | 1,796,820 | | |
State & Local Facilities-Capital Improvement
1st Series 2003A
03/01/17 | | | 5.250 | % | | | 3,000,000 | | | | 3,533,280 | | |
Total | | | | | | | 7,134,855 | | |
Transportation 2.6% | |
Washington Metropolitan Area Transit Authority
Revenue Bonds
Transit
Series 2009
07/01/23 | | | 5.250 | % | | | 3,000,000 | | | | 3,565,110 | | |
Turnpike/Bridge/Toll Road 2.6% | |
Maryland State Transportation Authority
Revenue Bonds
Series 2009A
07/01/22 | | | 5.000 | % | | | 3,000,000 | | | | 3,617,430 | | |
Water & Sewer 7.8% | |
City of Baltimore
Revenue Bonds
Wastewater Projects
Series 2006C (AMBAC)
07/01/18 | | | 5.000 | % | | | 1,125,000 | | | | 1,276,988 | | |
Series 2007D (AMBAC)
07/01/19 | | | 5.000 | % | | | 1,250,000 | | | | 1,453,737 | | |
Series 2008A (AGM)
07/01/21 | | | 5.000 | % | | | 1,250,000 | | | | 1,481,250 | | |
Municipal Bonds (continued)
Issue
Description | | Coupon
Rate | | Principal
Amount ($) | | Value ($) | |
County of Montgomery
Revenue Bonds
Series 2012A
04/01/29 | | | 5.000 | % | | | 1,000,000 | | | | 1,160,680 | | |
Maryland Water Quality Financing Administration
Revolving Loan Fund
Revenue Bonds
Series 2008
03/01/21 | | | 5.000 | % | | | 2,500,000 | | | | 2,937,825 | | |
Washington Suburban Sanitary Commission
Unlimited General Obligation Refunding & Public
Improvement Bonds
Series 2009
06/01/21 | | | 4.000 | % | | | 2,000,000 | | | | 2,316,500 | | |
Total | | | | | | | 10,626,980 | | |
Total Municipal Bonds
(Cost: $122,451,818) | | | | | | | 133,261,534 | | |
Money Market Funds 1.0%
| | | Shares | | Value ($) | |
JPMorgan Tax-Free Money Market Fund,
0.000%(c) | | | 1,365,811 | | | | 1,365,811 | | |
Total Money Market Funds
(Cost: $1,365,811) | | | | | 1,365,811 | | |
Total Investments
(Cost: $123,817,629) | | | | | 134,627,345 | | |
Other Assets & Liabilities, Net | | | | | 2,306,013 | | |
Net Assets | | | | | 136,933,358 | | |
Notes to Portfolio of Investments
(a) Variable rate security.
(b) Municipal obligations include debt obligations issued by or on behalf of territories, possessions, or sovereign nations within the territorial boundaries of the United States. At April 30, 2013, the value of these securities amounted to $2,807,583 or 2.05% of net assets.
(c) The rate shown is the seven-day current annualized yield at April 30, 2013.
Abbreviation Legend
AGCP Assured Guaranty Corporation
AGM Assured Guaranty Municipal Corporation
AMBAC Ambac Assurance Corporation
FGIC Financial Guaranty Insurance Company
FHA Federal Housing Authority
NPFGC National Public Finance Guarantee Corporation
XLCA XL Capital Assurance
The accompanying Notes to Financial Statements are an integral part of this statement.
Annual Report 2013
10
Columbia Maryland Intermediate Municipal Bond Fund
Portfolio of Investments (continued)
April 30, 2013
Fair Value Measurements
Generally accepted accounting principles (GAAP) require disclosure regarding the inputs and valuation techniques used to measure fair value and any changes in valuation inputs or techniques. In addition, investments shall be disclosed by major category.
The Fund categorizes its fair value measurements according to a three-level hierarchy that maximizes the use of observable inputs and minimizes the use of unobservable inputs by prioritizing that the most observable input be used when available. Observable inputs are those that market participants would use in pricing an investment based on market data obtained from sources independent of the reporting entity. Unobservable inputs are those that reflect the Fund's assumptions about the information market participants would use in pricing an investment. An investment's level within the fair value hierarchy is based on the lowest level of any input that is deemed significant to the asset or liability's fair value measurement. The input levels are not necessarily an indication of the risk or liquidity associated with investments at that level. For example, certain U.S. government securities are generally high quality and liquid, however, they are reflected as Level 2 because the inputs used to determine fair value may not always be quoted prices in an active market.
Fair value inputs are summarized in the three broad levels listed below:
> Level 1 — Valuations based on quoted prices for investments in active markets that the Fund has the ability to access at the measurement date (including NAV for open-end mutual funds). Valuation adjustments are not applied to Level 1 investments.
> Level 2 — Valuations based on other significant observable inputs (including quoted prices for similar securities, interest rates, prepayment speeds, credit risks, etc.).
> Level 3 — Valuations based on significant unobservable inputs (including the Fund's own assumptions and judgment in determining the fair value of investments).
Inputs that are used in determining fair value of an investment may include price information, credit data, volatility statistics, and other factors. These inputs can be either observable or unobservable. The availability of observable inputs can vary between investments, and is affected by various factors such as the type of investment, and the volume and level of activity for that investment or similar investments in the marketplace. The inputs will be considered by the Investment Manager, along with any other relevant factors in the calculation of an investment's fair value. The Fund uses prices and inputs that are current as of the measurement date, which may include periods of market dislocations. During these periods, the availability of prices and inputs may be reduced for many investments. This condition could cause an investment to be reclassified between the various levels within the hierarchy.
Investments falling into the Level 3 category are primarily supported by quoted prices from brokers and dealers participating in the market for those investments. However, these may be classified as Level 3 investments due to lack of market transparency and corroboration to support these quoted prices. Additionally, valuation models may be used as the pricing source for any remaining investments classified as Level 3. These models may rely on one or more significant unobservable inputs and/or significant assumptions by the Investment Manager. Inputs used in valuations may include, but are not limited to, financial statement analysis, capital account balances, discount rates and estimated cash flows, and comparable company data.
Under the direction of the Fund's Board of Trustees (the Board), the Investment Manager's Valuation Committee (the Committee) is responsible for carrying out the valuation procedures approved by the Board. The Committee consists of voting and non-voting members from various groups within the Investment Manager's organization, including operations and accounting, trading and investments, compliance, risk management and legal.
The Committee meets at least monthly to review and approve valuation matters, which may include a description of specific valuation determinations, data regarding pricing information received from approved pricing vendors and brokers and the results of Board-approved valuation control policies and procedures (the Policies). The Policies address, among other things, instances when market quotations are readily available, including recommendations of third party pricing vendors and a determination of appropriate pricing methodologies; events that require specific valuation determinations and assessment of fair value techniques; securities with a potential for stale pricing, including those that are illiquid, restricted, or in default; and the effectiveness of third-party pricing vendors, including periodic reviews of vendors. The Committee meets more frequently, as needed, to discuss additional valuation matters, which may include the need to review back-testing results, review time-sensitive information or approve related valuation actions. The Committee reports to the Board, with members of the Committee meeting with the Board at each of its regularly scheduled meetings to discuss valuation matters and actions during the period, similar to those described earlier.
For investments categorized as Level 3, the Committee monitors information similar to that described above, which may include: (i) data specific to the issuer or comparable issuers, (ii) general market or specific sector news and (iii) quoted prices and specific or similar security transactions. The Committee considers this data and any changes from prior periods in order to assess the reasonableness of observable and unobservable inputs, any assumptions or internal models used to value those securities and changes in fair value. This data is also used to corroborate, when available, information received from approved pricing vendors and brokers. Various factors impact the frequency of monitoring this information (which may occur as often as daily). However, the Committee may determine that changes to inputs, assumptions and models are not required as a result of the monitoring procedures performed.
The accompanying Notes to Financial Statements are an integral part of this statement.
Annual Report 2013
11
Columbia Maryland Intermediate Municipal Bond Fund
Portfolio of Investments (continued)
April 30, 2013
Fair Value Measurements (continued)
The following table is a summary of the inputs used to value the Fund's investments at April 30, 2013:
Description | | Level 1
Quoted Prices in Active
Markets for Identical
Assets ($) | | Level 2
Other Significant
Observable Inputs ($) | | Level 3
Significant
Unobservable Inputs ($) | | Total ($) | |
Bonds | |
Municipal Bonds | | | — | | | | 133,261,534 | | | | — | | | | 133,261,534 | | |
Total Bonds | | | — | | | | 133,261,534 | | | | — | | | | 133,261,534 | | |
Other | |
Money Market Funds | | | 1,365,811 | | | | — | | | | — | | | | 1,365,811 | | |
Total Other | | | 1,365,811 | | | | — | | | | — | | | | 1,365,811 | | |
Total | | | 1,365,811 | | | | 133,261,534 | | | | — | | | | 134,627,345 | | |
See the Portfolio of Investments for all investment classifications not indicated in the table.
The Fund's assets assigned to the Level 2 input category are generally valued using the market approach, in which a security's value is determined through reference to prices and information from market transactions for similar or identical assets.
There were no transfers of financial assets between Levels 1 and 2 during the period.
The accompanying Notes to Financial Statements are an integral part of this statement.
Annual Report 2013
12
Columbia Maryland Intermediate Municipal Bond Fund
Statement of Assets and Liabilities
April 30, 2013
Assets | |
Investments, at value | |
(identified cost $123,817,629) | | $ | 134,627,345 | | |
Receivable for: | |
Investments sold | | | 1,207,338 | | |
Capital shares sold | | | 68,088 | | |
Interest | | | 1,540,725 | | |
Expense reimbursement due from Investment Manager | | | 659 | | |
Prepaid expenses | | | 730 | | |
Total assets | | | 137,444,885 | | |
Liabilities | |
Payable for: | |
Capital shares purchased | | | 36,679 | | |
Dividend distributions to shareholders | | | 325,499 | | |
Investment management fees | | | 1,499 | | |
Distribution and/or service fees | | | 246 | | |
Transfer agent fees | | | 23,975 | | |
Administration fees | | | 262 | | |
Compensation of board members | | | 91,990 | | |
Other expenses | | | 31,377 | | |
Total liabilities | | | 511,527 | | |
Net assets applicable to outstanding capital stock | | $ | 136,933,358 | | |
Represented by | |
Paid-in capital | | $ | 128,480,724 | | |
Undistributed net investment income | | | 238,451 | | |
Accumulated net realized loss | | | (2,595,533 | ) | |
Unrealized appreciation (depreciation) on: | | | |
Investments | | | 10,809,716 | | |
Total — representing net assets applicable to outstanding capital stock | | $ | 136,933,358 | | |
The accompanying Notes to Financial Statements are an integral part of this statement.
Annual Report 2013
13
Columbia Maryland Intermediate Municipal Bond Fund
Statement of Assets and Liabilities (continued)
April 30, 2013
Class A | |
Net assets | | $ | 23,767,344 | | |
Shares outstanding | | | 2,133,264 | | |
Net asset value per share | | $ | 11.14 | | |
Maximum offering price per share(a) | | $ | 11.51 | | |
Class B | |
Net assets | | $ | 119,271 | | |
Shares outstanding | | | 10,696 | | |
Net asset value per share | | $ | 11.15 | | |
Class C | |
Net assets | | $ | 2,938,827 | | |
Shares outstanding | | | 263,728 | | |
Net asset value per share | | $ | 11.14 | | |
Class R4 | |
Net assets | | $ | 2,523 | | |
Shares outstanding | | | 227 | | |
Net asset value per share(b) | | $ | 11.14 | | |
Class Z | |
Net assets | | $ | 110,105,393 | | |
Shares outstanding | | | 9,880,632 | | |
Net asset value per share | | $ | 11.14 | | |
(a) The maximum offering price per share is calculated by dividing the net asset value by 1.0 minus the maximum sales charge of 3.25%.
(b) Net asset value per share rounds to this amount due to fractional shares outstanding.
The accompanying Notes to Financial Statements are an integral part of this statement.
Annual Report 2013
14
Columbia Maryland Intermediate Municipal Bond Fund
Statement of Operations
Year Ended April 30, 2013
Net investment income | |
Income: | |
Dividends | | $ | 752 | | |
Interest | | | 5,001,337 | | |
Total income | | | 5,002,089 | | |
Expenses: | | | |
Investment management fees | | | 567,167 | | |
Distribution and/or service fees | | | |
Class A | | | 59,684 | | |
Class B | | | 1,430 | | |
Class C | | | 28,451 | | |
Transfer agent fees | | | |
Class A | | | 48,120 | | |
Class B | | | 288 | | |
Class C | | | 5,739 | | |
Class R4(a) | | | 1 | | |
Class Z | | | 231,538 | | |
Administration fees | | | 99,254 | | |
Compensation of board members | | | 23,092 | | |
Custodian fees | | | 2,405 | | |
Printing and postage fees | | | 48,324 | | |
Registration fees | | | 1,367 | | |
Professional fees | | | 37,277 | | |
Other | | | 10,065 | | |
Total expenses | | | 1,164,202 | | |
Fees waived or expenses reimbursed by Investment Manager and its affiliates | | | (282,544 | ) | |
Expense reductions | | | (40 | ) | |
Total net expenses | | | 881,618 | | |
Net investment income | | | 4,120,471 | | |
Realized and unrealized gain (loss) — net | |
Net realized gain (loss) on: | | | |
Investments | | | 807,967 | | |
Net realized gain | | | 807,967 | | |
Net change in unrealized appreciation (depreciation) on: | | | |
Investments | | | 290,144 | | |
Net change in unrealized appreciation (depreciation) | | | 290,144 | | |
Net realized and unrealized gain | | | 1,098,111 | | |
Net increase in net assets resulting from operations | | $ | 5,218,582 | | |
(a) For the period from March 19, 2013 (commencement of operations) to April 30, 2013.
The accompanying Notes to Financial Statements are an integral part of this statement.
Annual Report 2013
15
Columbia Maryland Intermediate Municipal Bond Fund
Statement of Changes in Net Assets
| | | Year Ended
April 30,
2013(a) | | Year Ended
April 30,
2012(b) | | Year Ended
March 31,
2012 | |
Operations | |
Net investment income | | $ | 4,120,471 | | | $ | 350,283 | | | $ | 4,304,409 | | |
Net realized gain | | | 807,967 | | | | 34,081 | | | | 75,004 | | |
Net change in unrealized appreciation (depreciation) | | | 290,144 | | | | 1,052,417 | | | | 6,645,176 | | |
Net increase in net assets resulting from operations | | | 5,218,582 | | | | 1,436,781 | | | | 11,024,589 | | |
Distributions to shareholders | |
Net investment income | |
Class A | | | (649,382 | ) | | | (57,180 | ) | | | (739,657 | ) | |
Class B | | | (2,810 | ) | | | (280 | ) | | | (5,541 | ) | |
Class C | | | (55,899 | ) | | | (4,781 | ) | | | (73,733 | ) | |
Class R4 | | | (8 | ) | | | — | | | | — | | |
Class Z | | | (3,412,373 | ) | | | (276,675 | ) | | | (3,486,613 | ) | |
Total distributions to shareholders | | | (4,120,472 | ) | | | (338,916 | ) | | | (4,305,544 | ) | |
Increase (decrease) in net assets from capital stock activity | | | (2,058,975 | ) | | | (395,709 | ) | | | (87,900 | ) | |
Total increase (decrease) in net assets | | | (960,865 | ) | | | 702,156 | | | | 6,631,145 | | |
Net assets at beginning of year | | | 137,894,223 | | | | 137,192,067 | | | | 130,560,922 | | |
Net assets at end of year | | $ | 136,933,358 | | | $ | 137,894,223 | | | $ | 137,192,067 | | |
Undistributed net investment income | | $ | 238,451 | | | $ | 175,757 | | | $ | 164,390 | | |
(a) Class R4 shares are for the period from March 19, 2013 (commencement of operations) to April 30, 2013.
(b) For the period from April 1, 2012 to April 30, 2012. During the period, the Fund's fiscal year end was changed from March 31 to April 30.
The accompanying Notes to Financial Statements are an integral part of this statement.
Annual Report 2013
16
Columbia Maryland Intermediate Municipal Bond Fund
Statement of Changes in Net Assets (continued)
| | | Year Ended April 30,
2013(a) | | Year Ended April 30,
2012(b) | | Year Ended March 31,
2012 | |
| | | Shares | | Dollars ($) | | Shares | | Dollars ($) | | Shares | | Dollars ($) | |
Capital stock activity | |
Class A shares | |
Subscriptions(c) | | | 152,890 | | | | 1,699,702 | | | | 4,381 | | | | 48,387 | | | | 199,208 | | | | 2,151,822 | | |
Distributions reinvested | | | 15,799 | | | | 175,887 | | | | 1,269 | | | | 14,018 | | | | 15,538 | | | | 168,507 | | |
Redemptions | | | (278,163 | ) | | | (3,087,446 | ) | | | (16,995 | ) | | | (186,859 | ) | | | (213,412 | ) | | | (2,287,445 | ) | |
Net increase (decrease) | | | (109,474 | ) | | | (1,211,857 | ) | | | (11,345 | ) | | | (124,454 | ) | | | 1,334 | | | | 32,884 | | |
Class B shares | |
Subscriptions | | | 91 | | | | 1,011 | | | | 10 | | | | 111 | | | | 187 | | | | 2,013 | | |
Distributions reinvested | | | 158 | | | | 1,761 | | | | 15 | | | | 169 | | | | 200 | | | | 2,170 | | |
Redemptions(c) | | | (4,547 | ) | | | (50,615 | ) | | | (2 | ) | | | (29 | ) | | | (20,987 | ) | | | (225,328 | ) | |
Net increase (decrease) | | | (4,298 | ) | | | (47,843 | ) | | | 23 | | | | 251 | | | | (20,600 | ) | | | (221,145 | ) | |
Class C shares | |
Subscriptions | | | 65,891 | | | | 734,385 | | | | 9,739 | | | | 107,311 | | | | 48,269 | | | | 526,024 | | |
Distributions reinvested | | | 4,386 | | | | 48,835 | | | | 259 | | | | 2,859 | | | | 4,298 | | | | 46,512 | | |
Redemptions | | | (61,867 | ) | | | (687,787 | ) | | | (13,569 | ) | | | (149,080 | ) | | | (149,498 | ) | | | (1,616,516 | ) | |
Net increase (decrease) | | | 8,410 | | | | 95,433 | | | | (3,571 | ) | | | (38,910 | ) | | | (96,931 | ) | | | (1,043,980 | ) | |
Class R4 shares | |
Subscriptions | | | 226 | | | | 2,500 | | | | — | | | | — | | | | — | | | | — | | |
Distributions reinvested | | | 1 | | | | 6 | | | | — | | | | — | | | | — | | | | — | | |
Net increase | | | 227 | | | | 2,506 | | | | — | | | | — | | | | — | | | | — | | |
Class Z shares | |
Subscriptions | | | 1,552,156 | | | | 17,291,699 | | | | 75,448 | | | | 831,559 | | | | 1,522,571 | | | | 16,591,299 | | |
Distributions reinvested | | | 14,787 | | | | 164,665 | | | | 1,118 | | | | 12,350 | | | | 12,260 | | | | 132,978 | | |
Redemptions | | | (1,650,796 | ) | | | (18,353,578 | ) | | | (97,838 | ) | | | (1,076,505 | ) | | | (1,442,848 | ) | | | (15,579,936 | ) | |
Net increase (decrease) | | | (83,853 | ) | | | (897,214 | ) | | | (21,272 | ) | | | (232,596 | ) | | | 91,983 | | | | 1,144,341 | | |
Total net decrease | | | (188,988 | ) | | | (2,058,975 | ) | | | (36,165 | ) | | | (395,709 | ) | | | (24,214 | ) | | | (87,900 | ) | |
(a) Class R4 shares are for the period from March 19, 2013 (commencement of operations) to April 30, 2013.
(b) For the period from April 1, 2012 to April 30, 2012. During the period, the Fund's fiscal year end was changed from March 31 to April 30.
(c) Includes conversions of Class B shares to Class A shares, if any.
The accompanying Notes to Financial Statements are an integral part of this statement.
Annual Report 2013
17
Columbia Maryland Intermediate Municipal Bond Fund
The following tables are intended to help you understand the Fund's financial performance. Certain information reflects financial results for a single share of a class held for the periods shown. Per share net investment income (loss) amounts are calculated based on average shares outstanding during the period. Total return assumes reinvestment of all dividends and distributions, if any. Total return does not reflect payment of sales charges, if any, and is not annualized for periods of less than one year.
| | | Year Ended April 30, | | Year Ended March 31, | |
Class A | | 2013 | | 2012(a) | | 2012 | | 2011 | | 2010 | | 2009 | |
Per share data | |
Net asset value, beginning of period | | $ | 11.05 | | | $ | 10.96 | | | $ | 10.41 | | | $ | 10.53 | | | $ | 10.08 | | | $ | 10.44 | | |
Income from investment operations: | |
Net investment income | | | 0.30 | | | | 0.03 | | | | 0.33 | | | | 0.34 | | | | 0.34 | | | | 0.38 | | |
Net realized and unrealized gain (loss) | | | 0.09 | | | | 0.09 | | | | 0.55 | | | | (0.12 | ) | | | 0.45 | | | | (0.36 | ) | |
Total from investment operations | | | 0.39 | | | | 0.12 | | | | 0.88 | | | | 0.22 | | | | 0.79 | | | | 0.02 | | |
Less distributions to shareholders: | |
Net investment income | | | (0.30 | ) | | | (0.03 | ) | | | (0.33 | ) | | | (0.34 | ) | | | (0.34 | ) | | | (0.38 | ) | |
Total distributions to shareholders | | | (0.30 | ) | | | (0.03 | ) | | | (0.33 | ) | | | (0.34 | ) | | | (0.34 | ) | | | (0.38 | ) | |
Net asset value, end of period | | $ | 11.14 | | | $ | 11.05 | | | $ | 10.96 | | | $ | 10.41 | | | $ | 10.53 | | | $ | 10.08 | | |
Total return | | | 3.58 | % | | | 1.05 | % | | | 8.55 | % | | | 2.05 | % | | | 7.93 | % | | | 0.26 | % | |
Ratios to average net assets(b) | |
Total gross expenses | | | 1.01 | % | | | 1.05 | %(c) | | | 1.03 | % | | | 0.97 | % | | | 0.94 | % | | | 0.90 | % | |
Total net expenses(d) | | | 0.81 | %(e) | | | 0.80 | %(c) | | | 0.80 | %(e) | | | 0.80 | %(e) | | | 0.79 | %(e) | | | 0.75 | %(e) | |
Net investment income | | | 2.72 | % | | | 2.83 | %(c) | | | 3.07 | % | | | 3.18 | % | | | 3.26 | % | | | 3.76 | % | |
Supplemental data | |
Net assets, end of period (in thousands) | | $ | 23,767 | | | $ | 24,781 | | | $ | 24,708 | | | $ | 23,454 | | | $ | 27,423 | | | $ | 23,530 | | |
Portfolio turnover | | | 15 | % | | | 1 | % | | | 7 | % | | | 11 | % | | | 23 | % | | | 11 | % | |
Notes to Financial Highlights
(a) For the period from April 1, 2012 to April 30, 2012. During the period, the Fund's fiscal year end was changed from March 31 to April 30.
(b) In addition to the fees and expenses which the Fund bears directly, the Fund indirectly bears a pro rata share of the fees and expenses of the acquired funds in which it invests. Such indirect expenses are not included in the reported expense ratios.
(c) Annualized.
(d) Total net expenses include the impact of certain waivers/reimbursements made by the Investment Manager and certain of its affiliates, if applicable.
(e) The benefits derived from expense reductions had an impact of less than 0.01%.
The accompanying Notes to Financial Statements are an integral part of this statement.
Annual Report 2013
18
Columbia Maryland Intermediate Municipal Bond Fund
Financial Highlights (continued)
| | | Year Ended April 30, | | Year Ended March 31, | |
Class B | | 2013 | | 2012(a) | | 2012 | | 2011 | | 2010 | | 2009 | |
Per share data | |
Net asset value, beginning of period | | $ | 11.06 | | | $ | 10.97 | | | $ | 10.42 | | | $ | 10.54 | | | $ | 10.09 | | | $ | 10.45 | | |
Income from investment operations: | |
Net investment income | | | 0.22 | | | | 0.02 | | | | 0.25 | | | | 0.26 | | | | 0.27 | | | | 0.31 | | |
Net realized and unrealized gain (loss) | | | 0.09 | | | | 0.09 | | | | 0.55 | | | | (0.12 | ) | | | 0.45 | | | | (0.36 | ) | |
Total from investment operations | | | 0.31 | | | | 0.11 | | | | 0.80 | | | | 0.14 | | | | 0.72 | | | | (0.05 | ) | |
Less distributions to shareholders: | |
Net investment income | | | (0.22 | ) | | | (0.02 | ) | | | (0.25 | ) | | | (0.26 | ) | | | (0.27 | ) | | | (0.31 | ) | |
Total distributions to shareholders | | | (0.22 | ) | | | (0.02 | ) | | | (0.25 | ) | | | (0.26 | ) | | | (0.27 | ) | | | (0.31 | ) | |
Net asset value, end of period | | $ | 11.15 | | | $ | 11.06 | | | $ | 10.97 | | | $ | 10.42 | | | $ | 10.54 | | | $ | 10.09 | | |
Total return | | | 2.81 | % | | | 0.99 | % | | | 7.73 | % | | | 1.30 | % | | | 7.13 | % | | | (0.48 | %) | |
Ratios to average net assets(b) | |
Total gross expenses | | | 1.75 | % | | | 1.80 | %(c) | | | 1.81 | % | | | 1.72 | % | | | 1.69 | % | | | 1.65 | % | |
Total net expenses(d) | | | 1.56 | %(e) | | | 1.55 | %(c) | | | 1.55 | %(e) | | | 1.55 | %(e) | | | 1.54 | %(e) | | | 1.50 | %(e) | |
Net investment income | | | 1.96 | % | | | 2.08 | %(c) | | | 2.34 | % | | | 2.43 | % | | | 2.56 | % | | | 3.01 | % | |
Supplemental data | |
Net assets, end of period (in thousands) | | $ | 119 | | | $ | 166 | | | $ | 164 | | | $ | 371 | | | $ | 929 | | | $ | 2,220 | | |
Portfolio turnover | | | 15 | % | | | 1 | % | | | 7 | % | | | 11 | % | | | 23 | % | | | 11 | % | |
Notes to Financial Highlights
(a) For the period from April 1, 2012 to April 30, 2012. During the period, the Fund's fiscal year end was changed from March 31 to April 30.
(b) In addition to the fees and expenses which the Fund bears directly, the Fund indirectly bears a pro rata share of the fees and expenses of the acquired funds in which it invests. Such indirect expenses are not included in the reported expense ratios.
(c) Annualized.
(d) Total net expenses include the impact of certain waivers/reimbursements made by the Investment Manager and certain of its affiliates, if applicable.
(e) The benefits derived from expense reductions had an impact of less than 0.01%.
The accompanying Notes to Financial Statements are an integral part of this statement.
Annual Report 2013
19
Columbia Maryland Intermediate Municipal Bond Fund
Financial Highlights (continued)
| | | Year Ended April 30, | | Year Ended March 31, | |
Class C | | 2013 | | 2012(a) | | 2012 | | 2011 | | 2010 | | 2009 | |
Per share data | |
Net asset value, beginning of period | | $ | 11.05 | | | $ | 10.96 | | | $ | 10.41 | | | $ | 10.53 | | | $ | 10.08 | | | $ | 10.44 | | |
Income from investment operations: | |
Net investment income | | | 0.22 | | | | 0.02 | | | | 0.25 | | | | 0.26 | | | | 0.26 | | | | 0.31 | | |
Net realized and unrealized gain (loss) | | | 0.09 | | | | 0.09 | | | | 0.55 | | | | (0.12 | ) | | | 0.45 | | | | (0.36 | ) | |
Total from investment operations | | | 0.31 | | | | 0.11 | | | | 0.80 | | | | 0.14 | | | | 0.71 | | | | (0.05 | ) | |
Less distributions to shareholders: | |
Net investment income | | | (0.22 | ) | | | (0.02 | ) | | | (0.25 | ) | | | (0.26 | ) | | | (0.26 | ) | | | (0.31 | ) | |
Total distributions to shareholders | | | (0.22 | ) | | | (0.02 | ) | | | (0.25 | ) | | | (0.26 | ) | | | (0.26 | ) | | | (0.31 | ) | |
Net asset value, end of period | | $ | 11.14 | | | $ | 11.05 | | | $ | 10.96 | | | $ | 10.41 | | | $ | 10.53 | | | $ | 10.08 | | |
Total return | | | 2.81 | % | | | 0.99 | % | | | 7.74 | % | | | 1.29 | % | | | 7.12 | % | | | (0.49 | %) | |
Ratios to average net assets(b) | |
Total gross expenses | | | 1.76 | % | | | 1.80 | %(c) | | | 1.78 | % | | | 1.72 | % | | | 1.69 | % | | | 1.65 | % | |
Total net expenses(d) | | | 1.56 | %(e) | | | 1.55 | %(c) | | | 1.55 | %(e) | | | 1.55 | %(e) | | | 1.54 | %(e) | | | 1.50 | %(e) | |
Net investment income | | | 1.96 | % | | | 2.09 | %(c) | | | 2.33 | % | | | 2.42 | % | | | 2.49 | % | | | 3.02 | % | |
Supplemental data | |
Net assets, end of period (in thousands) | | $ | 2,939 | | | $ | 2,822 | | | $ | 2,838 | | | $ | 3,705 | | | $ | 3,269 | | | $ | 2,143 | | |
Portfolio turnover | | | 15 | % | | | 1 | % | | | 7 | % | | | 11 | % | | | 23 | % | | | 11 | % | |
Notes to Financial Highlights
(a) For the period from April 1, 2012 to April 30, 2012. During the period, the Fund's fiscal year end was changed from March 31 to April 30.
(b) In addition to the fees and expenses which the Fund bears directly, the Fund indirectly bears a pro rata share of the fees and expenses of the acquired funds in which it invests. Such indirect expenses are not included in the reported expense ratios.
(c) Annualized.
(d) Total net expenses include the impact of certain waivers/reimbursements made by the Investment Manager and certain of its affiliates, if applicable.
(e) The benefits derived from expense reductions had an impact of less than 0.01%.
The accompanying Notes to Financial Statements are an integral part of this statement.
Annual Report 2013
20
Columbia Maryland Intermediate Municipal Bond Fund
Financial Highlights (continued)
Class R4 | | Year Ended
April 30,
2013(a) | |
Per share data | |
Net asset value, beginning of period | | $ | 11.06 | | |
Income from investment operations: | |
Net investment income | | | 0.04 | | |
Net realized and unrealized gain | | | 0.08 | | |
Total from investment operations | | | 0.12 | | |
Less distributions to shareholders: | |
Net investment income | | | (0.04 | ) | |
Total distributions to shareholders | | | (0.04 | ) | |
Net asset value, end of period | | $ | 11.14 | | |
Total return | | | 1.06 | % | |
Ratios to average net assets(b) | |
Total gross expenses | | | 0.71 | %(c) | |
Total net expenses(d) | | | 0.55 | %(c) | |
Net investment income | | | 2.97 | %(c) | |
Supplemental data | |
Net assets, end of period (in thousands) | | $ | 3 | | |
Portfolio turnover | | | 15 | % | |
Notes to Financial Highlights
(a) For the period from March 19, 2013 (commencement of operations) to April 30, 2013.
(b) In addition to the fees and expenses which the Fund bears directly, the Fund indirectly bears a pro rata share of the fees and expenses of the acquired funds in which it invests. Such indirect expenses are not included in the reported expense ratios.
(c) Annualized.
(d) Total net expenses include the impact of certain waivers/reimbursements made by the Investment Manager and certain of its affiliates, if applicable.
The accompanying Notes to Financial Statements are an integral part of this statement.
Annual Report 2013
21
Columbia Maryland Intermediate Municipal Bond Fund
Financial Highlights (continued)
| | | Year Ended April 30, | | Year Ended March 31, | |
Class Z | | 2013 | | 2012(a) | | 2012 | | 2011 | | 2010 | | 2009 | |
Per share data | |
Net asset value, beginning of period | | $ | 11.05 | | | $ | 10.96 | | | $ | 10.41 | | | $ | 10.53 | | | $ | 10.09 | | | $ | 10.44 | | |
Income from investment operations: | |
Net investment income | | | 0.33 | | | | 0.03 | | | | 0.36 | | | | 0.36 | | | | 0.37 | | | | 0.41 | | |
Net realized and unrealized gain (loss) | | | 0.09 | | | | 0.09 | | | | 0.55 | | | | (0.11 | ) | | | 0.44 | | | | (0.35 | ) | |
Total from investment operations | | | 0.42 | | | | 0.12 | | | | 0.91 | | | | 0.25 | | | | 0.81 | | | | 0.06 | | |
Less distributions to shareholders: | |
Net investment income | | | (0.33 | ) | | | (0.03 | ) | | | (0.36 | ) | | | (0.37 | ) | | | (0.37 | ) | | | (0.41 | ) | |
Total distributions to shareholders | | | (0.33 | ) | | | (0.03 | ) | | | (0.36 | ) | | | (0.37 | ) | | | (0.37 | ) | | | (0.41 | ) | |
Net asset value, end of period | | $ | 11.14 | | | $ | 11.05 | | | $ | 10.96 | | | $ | 10.41 | | | $ | 10.53 | | | $ | 10.09 | | |
Total return | | | 3.84 | % | | | 1.07 | % | | | 8.82 | % | | | 2.31 | % | | | 8.09 | % | | | 0.61 | % | |
Ratios to average net assets(b) | |
Total gross expenses | | | 0.76 | % | | | 0.80 | %(c) | | | 0.77 | % | | | 0.72 | % | | | 0.69 | % | | | 0.65 | % | |
Total net expenses(d) | | | 0.56 | %(e) | | | 0.55 | %(c) | | | 0.55 | %(e) | | | 0.55 | %(e) | | | 0.54 | %(e) | | | 0.50 | %(e) | |
Net investment income | | | 2.96 | % | | | 3.07 | %(c) | | | 3.31 | % | | | 3.43 | % | | | 3.52 | % | | | 4.01 | % | |
Supplemental data | |
Net assets, end of period (in thousands) | | $ | 110,105 | | | $ | 110,126 | | | $ | 109,482 | | | $ | 103,031 | | | $ | 131,234 | | | $ | 126,661 | | |
Portfolio turnover | | | 15 | % | | | 1 | % | | | 7 | % | | | 11 | % | | | 23 | % | | | 11 | % | |
Notes to Financial Highlights
(a) For the period from April 1, 2012 to April 30, 2012. During the period, the Fund's fiscal year end was changed from March 31 to April 30.
(b) In addition to the fees and expenses which the Fund bears directly, the Fund indirectly bears a pro rata share of the fees and expenses of the acquired funds in which it invests. Such indirect expenses are not included in the reported expense ratios.
(c) Annualized.
(d) Total net expenses include the impact of certain waivers/reimbursements made by the Investment Manager and certain of its affiliates, if applicable.
(e) The benefits derived from expense reductions had an impact of less than 0.01%.
The accompanying Notes to Financial Statements are an integral part of this statement.
Annual Report 2013
22
Columbia Maryland Intermediate Municipal Bond Fund
Notes to Financial Statements
April 30, 2013
Note 1. Organization
Columbia Maryland Intermediate Municipal Bond Fund (the Fund), a series of Columbia Funds Series Trust (the Trust), is a non-diversified fund. The Trust is registered under the Investment Company Act of 1940, as amended (the 1940 Act), as an open-end management investment company organized as a Delaware statutory trust.
Fund Shares
The Trust may issue an unlimited number of shares (without par value). The Fund offers Class A, Class B, Class C, Class R4 and Class Z shares. All share classes have identical voting, dividend and liquidation rights. Each share class has its own expense structure and sales charges, as applicable.
Class A shares are subject to a maximum front-end sales charge of 3.25% based on the initial investment amount. Class A shares purchased without an initial sales charge in accounts aggregating $1 million to $50 million at the time of purchase are subject to a contingent deferred sales charge (CDSC) if the shares are sold within 18 months of purchase, charged as follows: 1.00% CDSC if redeemed within 12 months of purchase, and 0.50% CDSC if redeemed more than 12, but less than 18, months after purchase.
Class B shares may be subject to a maximum CDSC of 3.00% based upon the holding period after purchase. Class B shares will generally convert to Class A shares eight years after purchase. The Fund no longer accepts investments by new or existing investors in the Fund's Class B shares, except in connection with the reinvestment of any dividend and/or capital gain distributions in Class B shares of the Fund and exchanges by existing Class B shareholders of certain other funds within the Columbia Family of Funds.
Class C shares are subject to a 1.00% CDSC on shares redeemed within one year of purchase.
Class R4 shares are not subject to sales charges and are generally available only to omnibus retirement plans and certain other eligible investors. Class R4 shares commenced operations on March 19, 2013.
Class Z shares are not subject to sales charges, and are available only to certain investors.
Note 2. Summary of Significant Accounting Policies
Use of Estimates
The preparation of financial statements in accordance with U.S. generally accepted accounting principles (GAAP) requires management to make certain estimates and
assumptions that affect the reported amounts of assets and liabilities, the disclosure of contingent assets and liabilities at the date of the financial statements and the reported amounts of revenue and expenses during the reporting period. Actual results could differ from those estimates.
The following is a summary of significant accounting policies consistently followed by the Fund in the preparation of its financial statements.
Security Valuation
Debt securities generally are valued by pricing services approved by the Board of Trustees (the Board) based upon market transactions for normal, institutional-size trading units of similar securities. The services may use various pricing techniques which take into account appropriate factors such as yield, quality, coupon rate, maturity, type of issue, trading characteristics and other data, as well as broker quotes. Debt securities for which quotations are readily available may also be valued based upon an over-the-counter or exchange bid quotation.
Investments in other open-end investment companies, including money market funds, are valued at net asset value.
Investments for which market quotations are not readily available, or that have quotations which management believes are not reliable, are valued at fair value as determined in good faith under consistently applied procedures established by and under the general supervision of the Board. If a security or class of securities (such as foreign securities) is valued at fair value, such value is likely to be different from the last quoted market price for the security.
The determination of fair value often requires significant judgment. To determine fair value, management may use assumptions including but not limited to future cash flows and estimated risk premiums. Multiple inputs from various sources may be used to determine fair value.
Security Transactions
Security transactions are accounted for on the trade date. Cost is determined and gains (losses) are based upon the specific identification method for both financial statement and federal income tax purposes.
Income Recognition
Interest income is recorded on an accrual basis. Market premiums and discounts, including original issue discounts, are amortized and accreted, respectively, over the expected life of the security on all debt securities, unless otherwise noted.
Dividend income is recorded on the ex-dividend date.
Annual Report 2013
23
Columbia Maryland Intermediate Municipal Bond Fund
Notes to Financial Statements (continued)
April 30, 2013
Expenses
General expenses of the Trust are allocated to the Fund and other funds of the Trust based upon relative net assets or other expense allocation methodologies determined by the nature of the expense. Expenses directly attributable to the Fund are charged to the Fund. Expenses directly attributable to a specific class of shares are charged to that share class.
Determination of Class Net Asset Value
All income, expenses (other than class-specific expenses, which are charged to that share class, as shown in the Statement of Operations) and realized and unrealized gains (losses) are allocated to each class of the Fund on a daily basis, based on the relative net assets of each class, for purposes of determining the net asset value of each class.
Federal Income Tax Status
The Fund intends to qualify each year as a regulated investment company under Subchapter M of the Internal Revenue Code, as amended, and will distribute substantially all of its tax exempt and taxable income (including net short-term capital gains), if any, for its tax year, and as such will not be subject to federal income taxes. In addition, the Fund intends to distribute in each calendar year substantially all of its net investment income, capital gains and certain other amounts, if any, such that the Fund should not be subject to federal excise tax. Therefore, no federal income or excise tax provision is recorded.
Distributions to Shareholders
Distributions from net investment income, if any, are declared daily and paid monthly. Net realized capital gains, if any, are distributed at least annually. Income distributions and capital gain distributions are determined in accordance with federal income tax regulations, which may differ from GAAP.
Guarantees and Indemnifications
Under the Trust's organizational documents and, in some cases, by contract, its officers and trustees are indemnified against certain liabilities arising out of the performance of their duties to the Trust or its funds. In addition, certain of the Fund's contracts with its service providers contain general indemnification clauses. The Fund's maximum exposure under these arrangements is unknown since the amount of any future claims that may be made against the Fund cannot be determined, and the Fund has no historical basis for predicting the likelihood of any such claims.
Recent Accounting Pronouncement
Disclosures about Offsetting Assets and Liabilities
In December 2011, the Financial Accounting Standards Board (FASB) issued Accounting Standards Update
(ASU) No. 2011-11, Disclosures about Offsetting Assets and Liabilities and in January 2013, ASU No. 2013-1, Clarifying the Scope of Disclosures about Offsetting Assets and Liabilities (collectively, the ASUs). Specifically, the ASUs require an entity to disclose both gross and net information for derivatives and other financial instruments that are subject to a master netting arrangement or similar agreement. The ASUs require disclosure of collateral received in connection with the master netting agreements or similar agreements. The disclosure requirements are effective for interim and annual periods beginning on or after January 1, 2013. At this time, management is evaluating the implications of this guidance and the impact it will have on the financial statement amounts and footnote disclosures, if any.
Note 3. Fees and Compensation Paid to Affiliates
Investment Management Fees
Under an Investment Management Services Agreement, Columbia Management Investment Advisers, LLC (the Investment Manager), a wholly-owned subsidiary of Ameriprise Financial, Inc. (Ameriprise Financial), determines which securities will be purchased, held or sold. The investment management fee is an annual fee that is equal to a percentage of the Fund's average daily net assets that declines from 0.40% to 0.27% as the Fund's net assets increase. The effective investment management fee rate for the year ended April 30, 2013 was 0.40% of the Fund's average daily net assets.
Administration Fees
Under an Administrative Services Agreement, the Investment Manager also serves as the Fund Administrator. The Fund pays the Fund Administrator an annual fee for administration and accounting services equal to a percentage of the Fund's average daily net assets that declines from 0.07% to 0.04% as the Fund's net assets increase. The effective administration fee rate for the year ended April 30, 2013 was 0.07% of the Fund's average daily net assets.
Other Expenses
Other expenses are for, among other things, certain expenses of the Fund or the Board, including: Fund boardroom and office expense, employee compensation, employee health and retirement benefits, and certain other expenses. Payment of these Fund and Board expenses is facilitated by a company providing limited administrative services to the Fund and the Board. For the year ended April 30, 2013, other expenses paid to this company were $1,498.
Annual Report 2013
24
Columbia Maryland Intermediate Municipal Bond Fund
Notes to Financial Statements (continued)
April 30, 2013
Compensation of Board Members
Board members are compensated for their services to the Fund as disclosed in the Statement of Operations. Under a Deferred Compensation Plan (the Plan), the Board members who are not "interested persons" of the Fund, as defined under the 1940 Act, may elect to defer payment of up to 100% of their compensation. Deferred amounts are treated as though equivalent dollar amounts had been invested in shares of certain funds managed by the Investment Manager. The Fund's liability for these amounts is adjusted for market value changes and remains in the Fund until distributed in accordance with the Plan.
Transfer Agent Fees
Under a Transfer and Dividend Disbursing Agent Agreement, Columbia Management Investment Services Corp. (the Transfer Agent), an affiliate of the Investment Manager and a wholly-owned subsidiary of Ameriprise Financial, is responsible for providing transfer agency services to the Fund. The Transfer Agent has contracted with Boston Financial Data Services (BFDS) to serve as sub-transfer agent.
The Transfer Agent receives monthly account-based service fees based on the number of open accounts and also receives sub-transfer agency fees based on a percentage of the average aggregate value of the Fund's shares maintained in omnibus accounts (other than omnibus accounts for which American Enterprise Investment Services Inc. is the broker of record or accounts where the beneficial shareholder is a customer of Ameriprise Financial Services, Inc., which are paid a per account fee). The Transfer Agent pays the fees of BFDS for services as sub-transfer agent and is not entitled to reimbursement for such fees from the Fund (with the exception of out-of-pocket fees).
The Transfer Agent also receives compensation from fees for various shareholder services and reimbursements for certain out-of-pocket fees.
For the year ended April 30, 2013, the Fund's effective transfer agent fee rates as a percentage of average daily net assets of each class were as follows:
Class A | | | 0.20 | % | |
Class B | | | 0.20 | | |
Class C | | | 0.20 | | |
Class R4* | | | 0.21 | | |
Class Z | | | 0.20 | | |
*Annualized.
An annual minimum account balance fee of $20 may apply to certain accounts with a value below the Fund's initial
minimum investment requirements to reduce the impact of small accounts on transfer agent fees. These minimum account balance fees are recorded as part of expense reductions in the Statement of Operations. For the year ended April 30, 2013, these minimum account balance fees reduced total expenses by $40.
Distribution and Service Fees
The Fund has an agreement with Columbia Management Investment Distributors, Inc. (the Distributor), an affiliate of the Investment Manager and a wholly-owned subsidiary of Ameriprise Financial, for distribution and shareholder services. Pursuant to Rule 12b-1 under the 1940 Act, the Board has approved, and the Fund has adopted, distribution and shareholder service plans (the Plans) which set the distribution and service fees for the Fund. These fees are calculated daily and are intended to compensate the Distributor and/or eligible selling and/or servicing agents for selling shares of the Fund and providing services to investors.
The Plans require the payment of a monthly combined distribution and service fee to the Distributor at the maximum annual rate of 0.25% of the average daily net assets attributable to Class A shares of the Fund. The Plans also require the payment of a monthly service fee at the maximum annual rate of 0.25% of the average daily net assets attributable to Class B and Class C shares of the Fund and the payment of a monthly distribution fee at the maximum annual rate of 0.75% of the average daily net assets attributable to Class B and Class C shares of the Fund.
Sales Charges
Sales charges, including front-end charges and CDSCs, received by the Distributor for distributing Fund shares were $20,355 for Class A and $500 for Class C shares for the year ended April 30, 2013.
Expenses Waived/Reimbursed by the Investment Manager and its Affiliates
The Investment Manager and certain of its affiliates have contractually agreed to waive fees and/or reimburse expenses (excluding certain fees and expenses described below) for the periods disclosed below, unless sooner terminated at the sole discretion of the Board, so that the Fund's net operating expenses, after giving effect to fees waived/expenses reimbursed and any balance credits and/or overdraft charges
Annual Report 2013
25
Columbia Maryland Intermediate Municipal Bond Fund
Notes to Financial Statements (continued)
April 30, 2013
from the Fund's custodian, do not exceed the following annual rates as a percentage of the class' average daily net assets:
| | | August 1, 2012
through
August 31, 2013 | | Prior to
August 1, 2012 | |
Class A | | | 0.81 | % | | | 0.80 | % | |
Class B | | | 1.56 | | | | 1.55 | | |
Class C | | | 1.56 | | | | 1.55 | | |
Class R4 | | | 0.56 | * | | | — | | |
Class Z | | | 0.56 | | | | 0.55 | | |
*Annual rate is contractual from March 19, 2013 (the commencement of operations of Class R4 shares) through February 28, 2014.
Under the agreement governing these fee waivers and/or expense reimbursement arrangements, the following fees and expenses are excluded from the waiver/reimbursement commitment, and therefore will be paid by the Fund, if applicable: taxes (including foreign transaction taxes), expenses associated with investments in affiliated and non-affiliated pooled investment vehicles (including mutual funds and exchange traded funds), transaction costs and brokerage commissions, costs related to any securities lending program, dividend expenses associated with securities sold short, inverse floater program fees and expenses, transaction charges and interest on borrowed money, interest, extraordinary expenses and any other expenses the exclusion of which is specifically approved by the Board. This agreement may be modified or amended only with approval from all parties.
Note 4. Federal Tax Information
The timing and character of income and capital gain distributions are determined in accordance with income tax regulations, which may differ from GAAP because of temporary or permanent book to tax differences.
At April 30, 2013, these differences are primarily due to differing treatment for capital loss carryforwards, principal and/or interest of fixed income securities, distributions and Trustees' deferred compensation. To the extent these differences are permanent, reclassifications are made among the components of the Fund's net assets in the Statement of Assets and Liabilities. Temporary differences do not require reclassifications. In the Statement of Assets and Liabilities the following reclassifications were made:
Undistributed net investment income | | $ | 62,695 | | |
Accumulated net realized loss | | | 93,461 | | |
Paid-in capital | | | (156,156 | ) | |
Net investment income and net realized gains (losses), as disclosed in the Statement of Operations, and net assets were not affected by this reclassification.
The tax character of distributions paid during the periods indicated was as follows:
| | Year Ended
April 30,
2013 | | Period Ended
April 30,
2012 | | Year Ended
March 31,
2012 | |
Tax-exempt income | | $ | 3,961,933 | | | $ | 338,031 | | | $ | 4,285,655 | | |
Ordinary income | | | 158,539 | | | | 885 | | | | 19,889 | | |
Total | | $ | 4,120,472 | | | $ | 338,916 | | | $ | 4,305,544 | | |
Short-term capital gain distributions, if any, are considered ordinary income distributions for tax purposes.
At April 30, 2013, the components of distributable earnings on a tax basis were as follows:
Undistributed tax-exempt income | | $ | 606,954 | | |
Accumulated realized loss | | | (2,595,533 | ) | |
Unrealized appreciation | | | 10,858,664 | | |
At April 30, 2013, the cost of investments for federal income tax purposes was $123,768,681 and the aggregate gross unrealized appreciation and depreciation based on that cost was:
Unrealized appreciation | | $ | 10,868,041 | | |
Unrealized depreciation | | | (9,377 | ) | |
Net unrealized appreciation | | $ | 10,858,664 | | |
The following capital loss carryforward, determined at April 30, 2013, may be available to reduce taxable income arising from future net realized gains on investments, if any, to the extent permitted by the Internal Revenue Code:
Year of Expiration | | Amount ($) | |
2014 | | | 271,557 | | |
2016 | | | 511 | | |
2017 | | | 2,323,465 | | |
Total | | | 2,595,533 | | |
For the year ended April 30, 2013, $745,272 of capital loss carryforward was utilized and $156,156 expired unused.
Management of the Fund has concluded that there are no significant uncertain tax positions that would require recognition in the financial statements. However, management's conclusion may be subject to review and adjustment at a later date based on factors including, but not limited to, new tax laws, regulations, and administrative interpretations (including relevant court decisions). Generally, the Fund's federal tax returns for the prior three fiscal years remain subject to examination by the Internal Revenue Service.
Annual Report 2013
26
Columbia Maryland Intermediate Municipal Bond Fund
Notes to Financial Statements (continued)
April 30, 2013
Note 5. Portfolio Information
The cost of purchases and proceeds from sales of securities, excluding short-term obligations, aggregated to $26,628,371 and $20,429,370, respectively, for the year ended April 30, 2013.
Note 6. Shareholder Concentration
At April 30, 2013, one unaffiliated shareholder account owned 87.6% of the outstanding shares of the Fund. The Fund has no knowledge about whether any portion of those shares was owned beneficially by such account. Subscription and redemption activity by concentrated accounts may have a significant effect on the operations of the Fund.
Note 7. Line of Credit
The Fund has entered into a revolving credit facility with a syndicate of banks led by JPMorgan Chase Bank N.A. whereby the Fund may borrow for the temporary funding of shareholder redemptions or for other temporary or emergency purposes. The credit facility agreement, as amended, which is a collective agreement between the Fund and certain other funds managed by the Investment Manager, severally and not jointly, permits collective borrowings up to $500 million. Interest is charged to each participating fund based on its borrowings at a rate equal to the higher of (i) the overnight federal funds rate plus 1.00% or (ii) the one-month LIBOR rate plus 1.00%. Each borrowing under the credit facility matures no later than 60 days after the date of borrowing. The Fund also pays a commitment fee equal to its pro rata share of the amount of the credit facility at a rate of 0.08% per annum.
The Fund had no borrowings during the year ended April 30, 2013.
Note 8. Significant Risks
Geographic Concentration Risk
Because state-specific tax-exempt funds invest primarily in the municipal securities issued by the state and political sub-divisions of the state, the Fund will be particularly affected by political and economic conditions and developments in the state in which it invests. The Fund may, therefore, have a greater risk than that of a municipal bond fund which is more geographically diversified. The value of the municipal securities owned by the Fund also may be adversely affected by future changes in federal or state income tax laws.
Non-Diversification Risk
A non-diversified fund is permitted to invest a greater percentage of its total assets in fewer issuers than a diversified fund. The Fund may, therefore, have a greater risk of loss from a few issuers than a similar fund that invests more broadly.
Note 9. Subsequent Events
Management has evaluated the events and transactions that have occurred through the date the financial statements were issued and noted no items requiring adjustment of the financial statements or additional disclosure.
Note 10. Information Regarding Pending and Settled Legal Proceedings
In December 2005, without admitting or denying the allegations, American Express Financial Corporation (AEFC, which is now known as Ameriprise Financial, Inc. (Ameriprise Financial)) entered into settlement agreements with the Securities and Exchange Commission (SEC) and Minnesota Department of Commerce (MDOC) related to market timing activities. As a result, AEFC was censured and ordered to cease and desist from committing or causing any violations of certain provisions of the Investment Advisers Act of 1940, the Investment Company Act of 1940, and various Minnesota laws. AEFC agreed to pay disgorgement of $10 million and civil money penalties of $7 million. AEFC also agreed to retain an independent distribution consultant to assist in developing a plan for distribution of all disgorgement and civil penalties ordered by the SEC in accordance with various undertakings detailed at www.sec.gov/litigation/admin/ia-2451.pdf. Ameriprise Financial and its affiliates have cooperated with the SEC and the MDOC in these legal proceedings, and have made regular reports to the funds' Boards of Trustees.
Ameriprise Financial and certain of its affiliates have historically been involved in a number of legal, arbitration and regulatory proceedings, including routine litigation, class actions, and governmental actions, concerning matters arising in connection with the conduct of their business activities. Ameriprise Financial believes that the Funds are not currently the subject of, and that neither Ameriprise Financial nor any of its affiliates are the subject of, any pending legal, arbitration or regulatory proceedings that are likely to have a material adverse effect on the Funds or the ability of Ameriprise Financial or its affiliates to perform under their contracts with the Funds. Ameriprise Financial is required to make 10-Q,
Annual Report 2013
27
Columbia Maryland Intermediate Municipal Bond Fund
Notes to Financial Statements (continued)
April 30, 2013
10-K and, as necessary, 8-K filings with the Securities and Exchange Commission on legal and regulatory matters that relate to Ameriprise Financial and its affiliates. Copies of these filings may be obtained by accessing the SEC website at www.sec.gov.
There can be no assurance that these matters, or the adverse publicity associated with them, will not result in increased fund redemptions, reduced sale of fund shares or other adverse consequences to the Funds. Further, although we believe proceedings are not likely to have a material adverse effect on the Funds or the ability of Ameriprise Financial or its affiliates to perform under their contracts with the Funds, these proceedings are subject to uncertainties and, as such, we are unable to estimate the possible loss or range of loss that may result. An adverse outcome in one or more of these proceedings could result in adverse judgments, settlements, fines, penalties or other relief that could have a material adverse effect on the consolidated financial condition or results of operations of Ameriprise Financial.
Annual Report 2013
28
Columbia Maryland Intermediate Municipal Bond Fund
Report of Independent Registered Public Accounting Firm
To the Trustees of Columbia Funds Series Trust and the Shareholders of Columbia Maryland Intermediate Municipal Bond Fund
In our opinion, the accompanying statement of assets and liabilities, including the portfolio of investments, and the related statements of operations and of changes in net assets and the financial highlights present fairly, in all material respects, the financial position of Columbia Maryland Intermediate Municipal Bond Fund (the "Fund") (a series of Columbia Funds Series Trust) at April 30, 2013, the results of its operations, the changes in its net assets and the financial highlights for the periods indicated, in conformity with accounting principles generally accepted in the United States of America. These financial statements and financial highlights (hereafter referred to as "financial statements") are the responsibility of the Fund's management. Our responsibility is to express an opinion on these financial statements based on our audits. We conducted our audits of these financial statements in accordance with the standards of the Public Company Accounting Oversight Board (United States). Those standards require that we plan and perform the audit to obtain reasonable assurance about whether the financial statements are free of material misstatement. An audit includes examining, on a test basis, evidence supporting the amounts and disclosures in the financial statements, assessing the accounting principles used and significant estimates made by management, and evaluating the overall financial statement presentation. We believe that our audits, which included confirmation of securities at April 30, 2013 by correspondence with the custodian, provide a reasonable basis for our opinion.
PricewaterhouseCoopers LLP
Minneapolis, Minnesota
June 21, 2013
Annual Report 2013
29
Columbia Maryland Intermediate Municipal Bond Fund
Federal Income Tax Information
(Unaudited)
The Fund hereby designates the following tax attributes for the fiscal year ended April 30, 2013. Shareholders will be notified in early 2014 of amounts for use in preparing 2013 income tax returns.
Tax Designations:
| Exempt-Interest Dividends | | | 96.16 | % | |
Exempt-Interest Dividends. The percentage of net investment income dividends paid during the fiscal year that qualifies as exempt-interest dividends for federal income tax purposes.
Annual Report 2013
30
Columbia Maryland Intermediate Municipal Bond Fund
Shareholders elect the Board that oversees the funds' operations. The Board appoints officers who are responsible for day-to-day business decisions based on policies set by the Board. The following table provides basic biographical information about the funds' Board members, including their principal occupations during the past five years, although specific titles for individuals may have varied over the period. Under current Board policy, members may serve until the next Board meeting after he or she reaches the mandatory retirement age established by the Board, or the fifteenth anniversary of the first Board meeting they attended as a member of the Board.
Mr. Edward J. Boudreau, Jr., Mr. William P. Carmichael, Mr. William A. Hawkins, Mr. R. Glenn Hilliard, Ms. Minor M. Shaw and Dr. Anthony M. Santomero, were members of the Legacy Columbia Nations funds' Board ("Nations Funds"), which includes Columbia Funds Series Trust, Columbia Funds Variable Insurance Trust I and Columbia Funds Master Investment Trust, LLC and began service on the Board for the Legacy RiverSource funds ("RiverSource Funds") effective June 1, 2011.
Independent Trustees
Name,
Address,
Year of Birth | | Position Held With
Funds and Length of
Service | | Principal Occupation
During Past Five Years | | Number of
Funds in the
Fund Family
Overseen by
Board Member | | Other Present or Past
Directorships/Trusteeships
(Within Past 5 Years)
| |
Kathleen Blatz
901 S. Marquette Ave.
Minneapolis, MN 55402
1954 | | Board member since 1/06 for RiverSource Funds and since 6/11 for Nations Funds | | Attorney; Chief Justice, Minnesota Supreme Court, 1998-2006 | | | 132 | | | Director, BlueCross BlueShield of Minnesota since 2009 | |
Edward J. Boudreau, Jr.
901 S. Marquette Ave.
Minneapolis, MN 55402
1944 | | Board member since 6/11 for RiverSource Funds and since 1/05 for Nations Funds | | Managing Director, E.J. Boudreau & Associates (consulting) since 2000 | | | 130 | | | Former Trustee, BofA Funds Series Trust (11 funds) | |
Pamela G. Carlton
901 S. Marquette Ave.
Minneapolis, MN 55402
1954 | | Board member since 7/07 for RiverSource Funds and since 6/11 for Nations Funds | | President, Springboard — Partners in Cross Cultural Leadership (consulting company) since 2003 | | | 132 | | | None | |
William P. Carmichael
901 S. Marquette Ave.
Minneapolis, MN 55402
1943 | | Board member since 6/11 for RiverSource Funds and since 1999 for Nations Funds | | Retired | | | 130 | | | Director, Cobra Electronics
Corporation (electronic equipment manufacturer); The Finish Line (athletic shoes and apparel) since July 2003; McMoRan Exploration Company (oil and gas exploration and development) since 2010; former Trustee, BofA Funds Series Trust (11 funds); former Director, Spectrum Brands, Inc. (consumer products); former Director, Simmons Company (bedding) | |
Patricia M. Flynn
901 S. Marquette Ave.
Minneapolis, MN 55402
1950 | | Board member since 11/04 for RiverSource Funds and since 6/11 for Nations Funds | | Trustee Professor of Economics and Management, Bentley University since 1976 | | | 132 | | | None | |
William A. Hawkins
901 S. Marquette Ave.
Minneapolis, MN 55402
1942 | | Board member since 6/11 for RiverSource Funds and since 1/05 for Nations Funds | | Managing Director, Overton Partners (financial consulting), since August 2010; President and Chief Executive Officer, California General Bank, N.A., January 2008-August 2010 | | | 130 | | | Trustee, BofA Funds Series Trust (11 funds) | |
Annual Report 2013
31
Columbia Maryland Intermediate Municipal Bond Fund
Trustees and Officers (continued)
Independent Trustees (continued)
Name,
Address,
Year of Birth | | Position Held With
Funds and Length of
Service | | Principal Occupation
During Past Five Years | | Number of
Funds in the
Fund Family
Overseen by
Board Member | | Other Present or Past
Directorships/Trusteeships
(Within Past 5 Years)
| |
R. Glenn Hilliard
901 S. Marquette Ave.
Minneapolis, MN 55402
1943 | | Board member since 6/11 for RiverSource Funds and since 1/05 for Nations Funds | | Chairman and Chief Executive Officer, Hilliard Group LLC (investing and consulting), since April 2003; Non-Executive Director & Chairman, CNO Financial Group, Inc. (insurance), September 2003-May 2011 | | | 130 | | | Chairman, BofA Fund Series Trust (11 funds); former Director, CNO Financial Group, Inc. (insurance) | |
Stephen R. Lewis, Jr.
901 S. Marquette Ave.
Minneapolis, MN 55402
1939 | | Chair of the Board for RiverSource Funds since 1/07, Board member for RiverSource Funds since 1/02 and since 6/11 for Nations Funds | | President Emeritus and Professor of Economics Emeritus, Carleton College since 2002 | | | 132 | | | Director, Valmont Industries, Inc. (manufacturer of irrigation systems) since 2002 | |
Catherine James Paglia
901 S. Marquette Ave.
Minneapolis, MN 55402
1952 | | Board member since 11/04 for RiverSource Funds and since 6/11 for Nations Funds | | Director, Enterprise Asset Management, Inc. (private real estate and asset management company) | | | 132 | | | Director, Valmont Industries, Inc. (manufacturer of irrigation systems) since 2012 | |
Leroy C. Richie
901 S. Marquette Ave.
Minneapolis, MN 55402
1941 | | Board member since 2000 for Legacy Seligman Funds, since 11/08 for RiverSource Funds and since 6/11 for Nations Funds | | Counsel, Lewis & Munday, P.C. (law firm) since 2004; former Vice President and General Counsel, Automotive Legal Affairs, Chrysler Corporation from 1983-1987 | | | 132 | | | Lead Outside Director, Digital Ally, Inc. (digital imaging) since September 2005; Director, Infinity, Inc. (oil and gas exploration and production) since 1994; Director, OGE Energy Corp. (energy and energy services) since November 2007 | |
Minor M. Shaw
901 S. Marquette Ave.
Minneapolis, MN 55402
1947 | | Board member since 6/11 for RiverSource Funds and since 2003 for Nations Funds | | President, Micco LLC (private investments) since 2011; President, Micco Corp. since 1998 | | | 130 | | | Director, Piedmont Natural Gas; Director, BlueCross BlueShield of South Carolina since April 2008; Former Trustee, BofA Funds Series Trust (11 funds) | |
Alison Taunton-Rigby
901 S. Marquette Ave.
Minneapolis, MN 55402
1944 | | Board member since 11/02 for RiverSource Funds and since 6/11 for Nations Funds | | Chief Executive Officer and Director, RiboNovix, Inc. (biotechnology), 2003-2010 | | | 132 | | | Director, Healthways, Inc. (health and well-being improvement) since 2005; Director, ICI Mutual Insurance Company, RRG since 2011; Director, Abt Associates (government contractor) since 2001; Director, Boston Children's Hospital since 2002 | |
Annual Report 2013
32
Columbia Maryland Intermediate Municipal Bond Fund
Trustees and Officers (continued)
Interested Trustee Not Affiliated With Investment Manager*
Name,
Address,
Year of Birth | | Position Held With
Funds and Length of
Service | | Principal Occupation
During Past Five Years | | Number of
Funds in the
Fund Family
Overseen by
Board Member | | Other Present or Past
Directorships/Trusteeships
(Within Past 5 Years)
| |
Anthony M. Santomero
901 S. Marquette Ave.
Minneapolis, MN 55402
1946 | | Board member since 6/11 for RiverSource Funds and since 1/08 for Nations Funds | | Richard K. Mellon Professor Emeritus of Finance, The Wharton School, University of Pennsylvania, since 2002; Senior Advisor, McKinsey & Company (consulting), 2006-2008 | | | 130 | | | Director, Renaissance Reinsurance Ltd. since May 2008; Trustee, Penn Mutual Life Insurance Company since March 2008; Director, Citigroup since 2009; Director, Citibank, N.A. since 2009; former Trustee, BofA Funds Series Trust (11 funds) | |
*Dr. Santomero is not an affiliated person of the investment manager or Ameriprise Financial. However, he is currently deemed by the funds to be an "interested person" (as defined in the 1940 Act) of the funds because he serves as a Director of Citigroup, Inc. and Citibank N.A., companies that may directly or through subsidiaries and affiliates engage from time-to-time in brokerage execution, principal transactions and lending relationships with the funds or accounts advised/managed by the investment manager.
Interested Trustee Affiliated With Investment Manager*
Name,
Address,
Year of Birth | | Position Held With
Funds and Length of
Service | | Principal Occupation
During Past Five Years | | Number of
Funds in the
Fund Family
Overseen by
Board Member | | Other Present or Past
Directorships/Trusteeships
(Within Past 5 Years) | |
William F. Truscott
53600 Ameriprise
Financial Center
Minneapolis, MN 55474
1960 | | Board member since 11/01 for RiverSource Funds and since 6/11 for Nations Funds; Senior Vice President since 2002 for RiverSource Funds and 5/10 for Nations Funds | | President, Columbia Management Investment Advisers, LLC since February 2012, (previously President, Chairman of the Board and Chief Investment Officer, 2001-April 2010); Chief Executive Officer, Global Asset Management, Ameriprise Financial, Inc. since September 2012 (previously Chief Executive Officer, U.S. Asset Management & President, Annuities, May 2010-September 2012 and President — U.S. Asset Management and Chief Investment Officer, 2005-April 2010); Chief Executive Officer, Columbia Management Investment Distributors, Inc. since February 2012, (previously Chairman of the Board and Chief Executive Officer, 2006-April 2010); Chairman of the Board and Chief Executive Officer, RiverSource Distributors, Inc. since 2006; President and Chief Executive Officer, Ameriprise Certificate Company 2006-August 2012 | | | 184 | | | Chairman of the Board, Columbia Management Investment Advisers, LLC since May 2010; Director, Columbia Management Investment Distributors, Inc. since May 2010; Director, Ameriprise Certificate Company, 2006-January 2013 | |
*Interested person (as defined under the 1940 Act) by reason of being an officer, director, security holder and/or employee of the investment manager or Ameriprise Financial.
The SAI has additional information about the Fund's Board members and is available, without charge, upon request by calling 800.345.6611; contacting your financial intermediary; or visiting columbiamanagement.com.
Annual Report 2013
33
Columbia Maryland Intermediate Municipal Bond Fund
Trustees and Officers (continued)
The Board has appointed officers who are responsible for day-to-day business decisions based on policies it has established. The officers serve at the pleasure of the Board. In addition to Mr. Truscott, who is Senior Vice President, the funds' other officers are:
Officers
Name,
Address,
Year of Birth | | Position Held With
Funds and Length of
Service | | Principal Occupation During Past Five Years | |
J. Kevin Connaughton
225 Franklin Street
Boston, MA 02110
1964 | | President and Principal Executive Officer since 5/10 for RiverSource Funds and 2009 for Nations Funds | | Senior Vice President and General Manager — Mutual Fund Products, Columbia Management Investment Advisers, LLC since May 2010; Managing Director of Columbia Management Advisors, LLC, December 2004-April 2010; Senior Vice President and Chief Financial Officer, Columbia Funds, June 2008-January 2009; Treasurer, Columbia Funds, October 2003-May 2008 | |
Amy K. Johnson
5228 Ameriprise
Financial Center Minneapolis, MN 55474
1965 | | Vice President since 12/06 for RiverSource Funds and 5/10 for Nations Funds | | Senior Vice President and Chief Operating Officer, Columbia Management Investment Advisers, LLC since May 2010 (previously Chief Administrative Officer, 2009-April 2010 and Vice President — Asset Management and Trust Company Services, 2006-2009) | |
Michael G. Clarke
225 Franklin Street
Boston, MA 02110
1969 | | Treasurer since 1/11 and Chief Financial Officer since 4/11 for RiverSource Funds and Treasurer since 3/11 and Chief Financial Officer since 2009 for Nations Funds | | Vice President, Columbia Management Investment Advisers, LLC since May 2010; Managing Director of Fund Administration, Columbia Management Advisors, LLC, September 2004-April 2010; senior officer of Columbia Funds and affiliated funds since 2002 | |
Scott R. Plummer
5228 Ameriprise
Financial Center
Minneapolis, MN 55474
1959 | | Senior Vice President and Chief Legal Officer since 12/06 and Assistant Secretary since 6/11 for RiverSource Funds and Senior Vice President and Chief Legal Officer since 5/10 and Assistant Secretary since 6/11 for Nations Funds | | Senior Vice President, Chief Legal Officer and Assistant Secretary, Columbia Management Investment Advisers, LLC since June 2005; Vice President and Lead Chief Counsel — Asset Management, Ameriprise Financial, Inc. since May 2010 (previously Vice President and Chief Counsel — Asset Management, 2005-April 2010); Vice President, Chief Counsel and Assistant Secretary, Columbia Management Investment Distributors, Inc. since 2008; Vice President, General Counsel and Secretary, Ameriprise Certificate Company since 2005; Chief Counsel, RiverSource Distributors, Inc. since 2006 | |
Colin Moore
225 Franklin Street
Boston, MA 02110
1958 | | Senior Vice President since 5/10 for RiverSource Funds and Nations Funds | | Director and Chief Investment Officer, Columbia Management Investment Advisers, LLC since May 2010; Manager, Managing Director and Chief Investment Officer, Columbia Management Advisors, LLC, 2007-April 2010 | |
Thomas P. McGuire
225 Franklin Street
Boston, MA 02110
1972 | | Chief Compliance Officer since 3/12 | | Vice President — Asset Management Compliance, Columbia Management Investment Advisers, LLC since 2010; Chief Compliance Officer, Ameriprise Certificate Company since September 2010; Compliance Executive, Bank of America, 2005-2010 | |
Stephen T. Welsh
225 Franklin Street
Boston, MA 02110
1957 | | Vice President since 4/11 for RiverSource Funds and 2006 for Nations Funds | | President and Director, Columbia Management Investment Services Corp. since May 2010; President and Director, Columbia Management Services, Inc., July 2004-April 2010; Managing Director, Columbia Management Distributors, Inc., August 2007-April 2010 | |
Christopher O. Petersen
5228 Ameriprise
Financial Center
Minneapolis, MN 55474
1970 | | Vice President and Secretary since 4/11 for RiverSource Funds and 3/11 for Nations Funds | | Vice President and Chief Counsel, Ameriprise Financial, Inc. since January 2010 (formerly Vice President and Group Counsel or Counsel, April 2004-January 2010); Assistant Secretary of Legacy RiverSource Funds, January 2007-April 2011 and of the Nations Funds, May 2010-March 2011 | |
Annual Report 2013
34
Columbia Maryland Intermediate Municipal Bond Fund
Trustees and Officers (continued)
Officers (continued)
Name,
Address,
Year of Birth | | Position Held With
Funds and Length of
Service | | Principal Occupation During Past Five Years | |
Paul D. Pearson
10468 Ameriprise
Financial Center
Minneapolis, MN 55474
1956 | | Vice President since 4/11 and Assistant Treasurer since 1999 for RiverSource Funds and Vice President and Assistant Treasurer since 6/11 for Nations Funds | | Vice President — Investment Accounting, Columbia Management Investment Advisers, LLC, since May 2010; Vice President — Managed Assets, Investment Accounting, Ameriprise Financial Corporation, February 1998-May 2010 | |
Joseph F. DiMaria
225 Franklin Street
Boston, MA 02110
1968 | | Vice President and Chief Accounting Officer since 4/11 and Vice President since 3/11 and Chief Accounting Officer since 2008 for Nations Funds | | Vice President, Mutual Fund Administration, Columbia Management Investment Advisers, LLC, since May 2010; Director of Fund Administration, Columbia Management Advisors, LLC, January 2006-April 2010 | |
Paul B. Goucher
100 Park Avenue
New York, NY 10017
1968 | | Vice President since 4/11 and Assistant Secretary since 11/08 for RiverSource Funds and 5/10 for Nations Funds | | Vice President and Lead Chief Counsel, Ameriprise Financial, Inc. since November 2008 and January 2013, respectively (formerly, Chief Counsel, January 2010-January 2013 and Group Counsel from November 2008-January 2010); Director, Managing Director and General Counsel, J. & W. Seligman & Co. Incorporated, July 2008- November 2008 (previously, Managing Director and Associate General Counsel, January 2005-July 2008) | |
Michael E. DeFao
225 Franklin Street
Boston, MA 02110
1968 | | Vice President since 4/11 and Assistant Secretary since 5/10 for RiverSource Funds and 2011 for Nations Funds | | Vice President and Chief Counsel, Ameriprise Financial, Inc. since May 2010; Associate General Counsel, Bank of America, June 2005-April 2010 | |
Annual Report 2013
35
Columbia Maryland Intermediate Municipal Bond Fund
Approval of Investment Management Services
Agreement
Columbia Management Investment Advisers, LLC (Columbia Management or the Investment Manager), a wholly-owned subsidiary of Ameriprise Financial, Inc. (Ameriprise Financial), serves as the investment manager to Columbia Maryland Intermediate Municipal Bond Fund (the Fund). Under an investment management services agreement (the IMS Agreement), Columbia Management provides investment advice and other services to the Fund and other funds distributed by Columbia Management Investment Distributors, Inc. (collectively, the Funds).
On an annual basis, the Fund's Board of Trustees (the Board), including the independent Board members (the Independent Trustees), considers renewal of the IMS Agreement. Columbia Management prepared detailed reports for the Board and its Contracts Committee in January, March and April 2013, including reports based on analyses of data provided by an independent organization and a comprehensive response to each item of information requested by independent legal counsel to the Independent Trustees (Independent Legal Counsel) in a letter to the Investment Manager, to assist the Board in making this determination. All of the materials presented in January, March and April were first supplied in draft form to designated representatives of the Independent Trustees, i.e., Independent Legal Counsel, the Chair of the Board and the Chair of the Contracts Committee, and the final materials (including proposed additional breakpoints in IMS fees for certain Funds) were revised to reflect discussion and subsequent requests made by the Contracts Committee. In addition, throughout the year, the Board (or its committees) regularly meets with portfolio management teams and senior management personnel, and reviews information prepared by Columbia Management addressing the services Columbia Management provides and Fund performance. Further, the Board retained an independent consulting firm (the Independent Consultant) to assist the Independent Trustees in their review of IMS fees, expense caps and Ameriprise Financial's profitability. The Board also accords particular weight to the work, deliberations and conclusions of the Contracts Committee, the Investment Review Committee and the Compliance Committee in determining whether to continue the IMS Agreement.
The Board, at its April 15-17, 2013 in-person Board meeting (the April Meeting), considered the renewal of the IMS Agreement for an additional one-year term. At the April Meeting, Independent Legal Counsel reviewed with the Independent Trustees various factors relevant to the Board's consideration of advisory agreements and the Board's legal responsibilities related to such consideration. Following an analysis and discussion of the factors identified below, the Board, including all of the Independent Trustees, approved the renewal of the IMS Agreement.
Nature, Extent and Quality of Services Provided by Columbia Management
The Independent Trustees analyzed various reports and presentations they had received detailing the services performed by Columbia Management, as well as its expertise, resources and capabilities. The Independent Trustees specifically considered many developments during the past year concerning the services provided by Columbia Management, including, in particular, the recent globalization initiative, which fosters increased worldwide investment support of global products, continued investment in upgrading technology (such as the implementation of new systems and hardware), the hiring of a Chief Interest Rate Strategist as part of Columbia Management's fixed income team and the addition of Columbia Management investment personnel to the Asset Allocation, Quantitative and Technology teams. The Independent Trustees noted the information they received concerning Columbia Management's ability to retain its key portfolio management personnel. In this regard, the Independent Trustees took into account their comprehensive discussions with Columbia Management's Chief Investment Officer (the CIO), observing the organizational depth of Columbia Management and the capabilities of its investment personnel. The Independent Trustees also recalled the information the CIO provided them identifying the strengths and areas for enhancement of each Columbia Management investment team, as well as the discussion with the CIO regarding the investment personnel talent being infused to enhance support for certain Funds. The Independent Trustees also observed the materials demonstrating the strength and depth of Columbia Management's equity and fixed income research departments.
In connection with the Board's evaluation of the overall package of services provided by Columbia Management, the Board also considered the quality of administrative services provided to the Fund by Columbia Management, recalling the information it received highlighting significant achievements in 2012 in the performance of administrative services (such as strong accounting performance measures, refined derivatives processing and enhancements to the electronic communications under the affiliated and unaffiliated service provider oversight program). In evaluating the quality of services provided under the IMS Agreement and the Fund's Administrative Service Agreement, the Independent Trustees also took into account the organization and strength of the Fund's and its service providers' compliance programs. In
Annual Report 2013
36
Columbia Maryland Intermediate Municipal Bond Fund
Approval of Investment Management Services
Agreement (continued)
addition, the Board also reviewed the financial condition of Columbia Management (and its affiliates) and each entity's ability to carry out its responsibilities under the IMS Agreement and the Fund's other services agreements with affiliates of Ameriprise Financial, observing the financial strength of Ameriprise Financial, with its solid balance sheet. The Board also discussed the acceptability of the terms of the IMS Agreement (including the relatively broad scope of services required to be performed by Columbia Management). The Board concluded that the services being performed under the IMS Agreement were of a reasonably high quality.
Based on the foregoing, and based on other information received (both oral and written, including the information on investment performance referenced below) and other considerations, the Board concluded that Columbia Management and its affiliates were in a position to continue to provide a high quality and level of services to the Fund.
Investment Performance
For purposes of evaluating the nature, extent and quality of services provided under the IMS Agreement, the Board carefully reviewed the investment performance of the Fund. In this regard, the Board considered detailed reports providing the results of analyses performed by an independent organization showing, for various periods, the performance of the Fund, the performance of a benchmark index, the percentage ranking of the Fund among its comparison group and the net assets of the Fund. The Board observed that the Fund's investment performance was appropriate in light of the particular management style involved and the particular market environment. The Board observed that appropriate steps had been taken or are contemplated to help improve the Fund's performance.
Comparative Fees, Costs of Services Provided and the Profits Realized By Columbia Management and its Affiliates from their Relationships with the Fund
The Board reviewed comparative fees and the costs of services to be provided under the IMS Agreement. The Board members considered detailed comparative information set forth in an annual report on fees and expenses, including, among other things, data (based on analyses conducted by an independent organization) showing a comparison of the Fund's expenses with median expenses paid by funds in its comparative peer universe, as well as data showing the Fund's contribution to Columbia Management's profitability.
The Board accorded particular weight to the notion that the level of fees should reflect a rational pricing model applied consistently across the various product lines in the Fund family, while assuring that the overall fees for each Fund (with few defined exceptions) are generally in line with the "pricing philosophy" (i.e., that the total expense ratio of the Fund is no higher than the median expense ratio of funds in the same comparison universe of the Fund).
In this connection, the Board also considered the Independent Consultant's report that concluded that: (i) the Funds' standardized investment management fee rates, particularly in the context of the current competitive fee landscape, were within a reasonable range; and (ii) the Funds' expense cap philosophy of assuring that each Fund's total expense ratio is not above its peer universe median ratio is reasonable. The Board took into account that the Fund's total expense ratio (after considering proposed expense caps/waivers) approximated the peer universe's median expense ratio. Based on its review, the Board concluded that the Fund's management fee was fair and reasonable in light of the extent and quality of services that the Fund receives.
The Board also considered the expected profitability of Columbia Management and its affiliates in connection with Columbia Management providing investment management services to the Fund. In this regard, the Board referred to a detailed profitability report, discussing the profitability to Columbia Management and Ameriprise Financial from managing, operating and distributing the Funds. In this regard, the Board observed that 2012 profitability approximates 2011 profitability and that, as was the case in 2011, 2012 profitability remained generally in line with (and, in many cases, lower than) the reported profitability of other asset management firms. Further, the Board considered the Independent Consultant's report that concluded that Columbia Management's profitability, particularly in comparison to industry competitors, was reasonable and not excessive. It also took into account the indirect economic benefits flowing to Columbia Management or its affiliates in connection with managing or distributing the Funds, such as the enhanced ability to offer various other financial products to Ameriprise Financial customers, soft dollar benefits and overall reputational advantages. The Board noted that the fees paid by the Funds should permit the Investment Manager to offer competitive compensation
Annual Report 2013
37
Columbia Maryland Intermediate Municipal Bond Fund
Approval of Investment Management Services
Agreement (continued)
to its personnel, make necessary investments in its business and earn an appropriate profit. The Board concluded that profitability levels were reasonable.
Economies of Scale to be Realized
The Board also considered the economies of scale that might be realized by Columbia Management as the Fund grows and took note of the extent to which Fund shareholders might also benefit from such growth. In this regard, the Independent Trustees took into account that IMS fees decline as Fund assets exceed various breakpoints, all of which have not been surpassed.
Based on the foregoing, the Board, including all of the Independent Trustees, concluded that the investment management service fees were fair and reasonable in light of the extent and quality of services provided. In reaching this conclusion, no single factor was determinative. On April 17, 2013, the Board, including all of the Independent Trustees, approved the renewal of the IMS Agreement.
Annual Report 2013
38
This page intentionally left blank.
Annual Report 2013
39
This page intentionally left blank.
Annual Report 2013
40
Columbia Maryland Intermediate Municipal Bond Fund
Important Information About This Report
Each fund mails one shareholder report to each shareholder address. If you would like more than one report, please call shareholder services at 800.345.6611 and additional reports will be sent to you.
The policy of the Board is to vote the proxies of the companies in which each fund holds investments consistent with the procedures as stated in the Statement of Additional Information (SAI). You may obtain a copy of the SAI without charge by calling 800.345.6611; contacting your financial intermediary; visiting columbiamanagement.com; or searching the website of the Securities and Exchange Commission (SEC) at sec.gov. Information regarding how each fund voted proxies relating to portfolio securities is filed with the SEC by August 31 for the most recent 12-month period ending June 30 of that year, and is available without charge by visiting columbiamanagement.com; or searching the website of the SEC at sec.gov.
Each fund files a complete schedule of portfolio holdings with the SEC for the first and third quarters of each fiscal year on Form N-Q. Each fund's Form N-Q is available on the SEC's website at sec.gov and may be reviewed and copied at the SEC's Public Reference Room in Washington, D.C. Information on the operation of the Public Reference Room may be obtained by calling 800.SEC.0330. Each fund's complete schedule of portfolio holdings, as filed on Form N-Q, can also be obtained without charge, upon request, by calling 800.345.6611.
Annual Report 2013
41

Columbia Maryland Intermediate Municipal Bond Fund
P.O. Box 8081
Boston, MA 02266-8081
columbiamanagement.com
This information is for use with concurrent or prior delivery of a fund prospectus. Please read and consider the investment objectives, risks, charges and expenses for any fund carefully before investing. For a prospectus which contains this and other important information about the Fund go to columbiamanagement.com. The Fund is distributed by Columbia Management Investment Distributors, Inc., member FINRA, and managed by Columbia Management Investment Advisers, LLC.
© 2013 Columbia Management Investment Advisers, LLC. All rights reserved.
ANN190_04_C01_(06/13)
Annual Report
April 30, 2013

Columbia North Carolina Intermediate Municipal Bond Fund
Not FDIC insured • No bank guarantee • May lose value
Columbia North Carolina Intermediate Municipal Bond Fund
 Dear Shareholders,
U.S. equities had a strong first quarter
Similar to 2012, equities once again were the best performing asset class in the first quarter of 2013. The S&P 500 Index reached an all-time closing high on the last trading day of the quarter and pushed through its October 2007 peak. Although global equities have performed well year-to-date, there is significant performance divergence among regions. In local currency terms, Japanese equities were the best performing developed market globally, and U.S. stocks outperformed most other global equity markets. European equities rose in the first quarter but trailed U.S. stocks and had a turbulent March, as investors were reminded of instability in the eurozone with news of a banking crisis in Cyprus.
Although all 10 sectors of the S&P 500 Index delivered positive returns, this was a rally led by defensive stocks such as those in health care, consumer staples and utilities. Materials and technology stocks were the weakest sectors.
High yield leads fixed income; most sectors flat to down
The fixed-income markets lagged equities with modest, single-digit returns coming from municipals and high-yield sectors in the United States. Most government and investment-grade credit sectors were roughly flat to down for the first quarter of 2013. Emerging market bonds were the biggest disappointment with single-digit losses.
Columbia Management to begin delivering summary prospectuses
Each Columbia fund is required to update its prospectus on an annual basis. Beginning with June 2013 prospectus updates, shareholders of Columbia retail mutual funds will start to receive a summary prospectus, rather than the full length (statutory) mutual fund prospectus they have received in the past.
Each fund's summary prospectus will include the following key information:
> Investment objective
> Fee and expense table
> Portfolio turnover rate information
> Principal investment strategies, principal risks and performance information
> Management information
> Purchase and sale information
> Tax information
> Financial intermediary compensation information
Each fund's statutory prospectus will contain additional information about the fund and its risks. Both the statutory and summary prospectus will be updated each year, and will be available at columbiamanagement.com. Shareholders may request a printed version of a statutory prospectus at no cost by calling 800.345.6611 or sending an email to serviceinquiries@columbiamanagement.com.
Stay on track with Columbia Management
Backed by more than 100 years of experience, Columbia Management is one of the nation's largest asset managers. At the heart of our success — and, most importantly, that of our investors — are highly talented industry professionals, brought together by a unique way of working. We are dedicated to helping you take advantage of today's opportunities and anticipate tomorrow's. We stay abreast of the latest investment trends and ideas, using our collective insight to evaluate events and transform them into solutions you can use.
Visit columbiamanagement.com for:
> The Columbia Management Perspectives blog, featuring timely posts by our investment teams
> Detailed up-to-date fund performance and portfolio information
> Economic analysis and market commentary
> Quarterly fund commentaries
> Columbia Management Investor, our award-winning quarterly newsletter for shareholders
Thank you for your continued support of the Columbia Funds. We look forward to serving your investment needs for many years to come.
Best Regards,

J. Kevin Connaughton
President, Columbia Funds
The S&P 500 Index, an unmanaged index, measures the performance of 500 large-capitalization U.S. stocks and is frequently used as a general measure of market performance. Indices are not available for investment, are not professionally managed and do not reflect sales charges, fees, brokerage commissions, taxes or other expenses of investing.
Investors should consider the investment objectives, risks, charges and expenses of a mutual fund carefully before investing. For a free prospectus, which contains this and other important information about a fund, visit columbiamanagement.com. The prospectus should be read carefully before investing.
Columbia Funds are distributed by Columbia Management Investment Distributors, Inc., member FINRA, and managed by Columbia Management Investment Advisers, LLC.
© 2013 Columbia Management Investment Advisers, LLC. All rights reserved.
Columbia North Carolina Intermediate Municipal Bond Fund
Performance Overview | | | 2 | | |
Manager Discussion of Fund Performance | | | 4 | | |
Understanding Your Fund's Expenses | | | 6 | | |
Portfolio of Investments | | | 7 | | |
Statement of Assets and Liabilities | | | 13 | | |
Statement of Operations | | | 15 | | |
Statement of Changes in Net Assets | | | 16 | | |
Financial Highlights | | | 18 | | |
Notes to Financial Statements | | | 23 | | |
Report of Independent Registered
Public Accounting Firm | | | 28 | | |
Federal Income Tax Information | | | 29 | | |
Trustees and Officers | | | 30 | | |
Approval of Investment Management Services Agreement | | | 35 | | |
Important Information About This Report | | | 41 | | |
Fund Investment Manager
Columbia Management Investment
Advisers, LLC
225 Franklin Street
Boston, MA 02110
Fund Distributor
Columbia Management Investment
Distributors, Inc.
225 Franklin Street
Boston, MA 02110
Fund Transfer Agent
Columbia Management Investment
Services Corp.
P.O. Box 8081
Boston, MA 02266-8081
For more information about any of the funds, please visit columbiamanagement.com or call 800.345.6611. Customer Service Representatives are available to answer your questions Monday through Friday from 8 a.m. to 8 p.m. Eastern time.
The views expressed in this report reflect the current views of the respective parties. These views are not guarantees of future performance and involve certain risks, uncertainties and assumptions that are difficult to predict, so actual outcomes and results may differ significantly from the views expressed. These views are subject to change at any time based upon economic, market or other conditions and the respective parties disclaim any responsibility to update such views. These views may not be relied on as investment advice and, because investment decisions for a Columbia Fund are based on numerous factors, may not be relied on as an indication of trading intent on behalf of any particular Columbia Fund. References to specific securities should not be construed as a recommendation or investment advice.
Annual Report 2013
Columbia North Carolina Intermediate Municipal Bond Fund
Performance Summary
> Columbia North Carolina Intermediate Municipal Bond Fund (the Fund) Class A shares returned 3.57% excluding sales charges for the 12-month period that ended April 30, 2013.
> The Fund underperformed its benchmark, the Barclays 3-15 Year Blend Municipal Bond Index, which returned 4.35% for the same 12-month period.
> The Fund's modest shortfall relative to the index was the result of slightly less exposure to longer intermediate-term bonds, which were the period's best performers, and a slightly higher quality orientation.
Average Annual Total Returns (%) (for period ended April 30, 2013)
| | Inception | | 1 Year | | 5 Years | | 10 Years | |
Class A | | 12/14/92 | | | | | | | |
Excluding sales charges | | | | | 3.57 | | | | 4.71 | | | | 3.61 | | |
Including sales charges | | | | | 0.24 | | | | 4.02 | | | | 3.26 | | |
Class B | | 06/07/93 | | | | | | | |
Excluding sales charges | | | | | 2.80 | | | | 3.90 | | | | 2.82 | | |
Including sales charges | | | | | -0.20 | | | | 3.90 | | | | 2.82 | | |
Class C | | 12/16/92 | | | | | | | |
Excluding sales charges | | | | | 2.89 | | | | 3.93 | | | | 2.83 | | |
Including sales charges | | | | | 1.89 | | | | 3.93 | | | | 2.83 | | |
Class R4* | | 03/19/13 | | | 3.83 | | | | 4.97 | | | | 3.86 | | |
Class Z | | 12/11/92 | | | 3.83 | | | | 4.97 | | | | 3.86 | | |
Barclays 3-15 Year Blend Municipal Bond Index | | | | | 4.35 | | | | 5.91 | | | | 4.85 | | |
Returns for Class A are shown with and without the maximum initial sales charge of 3.25%. Returns for Class B are shown with and without the applicable contingent deferred sales charge (CDSC) of 3.00% in the first year, declining to 1.00% in the fourth year and eliminated thereafter. Returns for Class C are shown with and without the 1.00% CDSC for the first year only. The Fund's other classes are not subject to sales charges and have limited eligibility. Please see the Fund's prospectuses for details. Performance for different share classes will vary based on differences in sales charges and fees associated with each class. All results shown assume reinvestment of distributions during the period. Returns do not reflect the deduction of taxes that a shareholder may pay on Fund distributions or on the redemption of Fund shares. Performance results reflect the effect of any fee waivers or reimbursements of Fund expenses by Columbia Management Investment Advisers, LLC and/or any of its affiliates. Absent these fee waivers or expense reimbursement arrangements, performance results would have been lower.
The performance information shown represents past performance and is not a guarantee of future results. The investment return and principal value of your investment will fluctuate so that your shares, when redeemed, may be worth more or less than their original cost. Current performance may be lower or higher than the performance information shown. You may obtain performance information current to the most recent month-end by contacting your financial intermediary, visiting columbiamanagement.com or calling 800.345.6611.
*The returns shown for periods prior to the share class inception date (including returns for the Life of the Fund, if shown, which are since Fund inception) include the returns of the Fund's oldest share class. These returns are adjusted to reflect any higher class-related operating expenses of the newer share classes, as applicable. Please visit columbiamanagement.com/mutual-funds/appended-performance for more information.
The Barclays 3-15 Year Blend Municipal Bond Index is an unmanaged index that tracks the performance of municipal bonds issued after December 31, 1990, with remaining maturities between 2 and 17 years and at least $7 million in principal amount outstanding.
Indices are not available for investment, are not professionally managed and do not reflect sales charges, fees, brokerage commissions, taxes or other expenses of investing. Securities in the Fund may not match those in an index.
Annual Report 2013
2
Columbia North Carolina Intermediate Municipal Bond Fund
Performance Overview (continued)
Performance of a Hypothetical $10,000 Investment (May 1, 2003 – April 30, 2013)

The chart above shows the change in value of a hypothetical $10,000 investment in Class A shares of Columbia North Carolina Intermediate Municipal Bond Fund during the stated time period, and does not reflect the deduction of taxes that a shareholder may pay on Fund distributions or on the redemption of Fund shares.
Annual Report 2013
3
Columbia North Carolina Intermediate Municipal Bond Fund
Manager Discussion of Fund Performance
For the 12-month period that ended April 30, 2013, the Fund's Class A shares returned 3.57% excluding sales charges. The Fund underperformed its benchmark, the Barclays 3-15 Year Blend Municipal Bond Index, which returned 4.35% for the same 12-month period. The Fund's modest shortfall relative to the index can be accounted for by its slightly lower exposure to longer intermediate-term bonds, which were the period's best performers, and a slightly higher quality orientation, which is driven by the overall high quality of bonds issued within the state.
U.S. Economy: Growth in the Slow Lane
Europe's general economic woes, a financial crisis in Cyprus and U.S. struggles to avoid a fiscal cliff of tax increases and various spending cuts (commonly referred to as the sequester) weighed on the global economy throughout the 12-month period ended April 30, 2013. Late in the period, the sequester clouded consumer confidence in the United States, even though it has had little material impact on the economy to date. However, a decrease in the U.S. unemployment rate early in 2013, steady manufacturing activity and a rebound in the housing market are encouraging signs that growth has broadened in recent months. Pent-up demand, low mortgage rates and an improving labor market have lifted home sales. Even so, there has been no real improvement in the overall pace of economic growth since the current cycle of recovery began in 2009. Household income growth is practically nonexistent, and household spending has come under pressure after the expiration of the payroll tax cut. Against this backdrop, U.S. investors bid prices higher on stocks and other volatile assets as central banks continued to pour liquidity into key markets.
Municipal Market Generates Solid Returns
The U.S. municipal bond market delivered modest, but solid, returns for the 12-month period. Yields fell across all maturities, rallying strongly after the November presidential election. The market sold off in December, but the retreat was short lived, as weaker economic numbers early in 2013 sent fixed-income investors back to the relative safety of the municipal market. At year end, municipal yields were eight, 18 and 25 basis points lower for five-, 10- and 15-year maturities compared to one year ago. Higher quality bonds generally underperformed lower quality bonds. Pre-refunded bonds, which are higher quality and generally shorter in maturity, were the weakest sector among municipals. A pre-refunded bond is created when an issuer refinances existing debt at a lower rate. The proceeds from the lower-yielding issue are invested in U.S. Treasury securities and used to repay the original bond at its original call date. Hospital bonds were generally the strongest performers. Local general obligation bonds outperformed state general obligation bonds by a small margin. For the second consecutive year, rating agencies issued more downgrades than upgrades in the overall municipal market, as a lackluster economy continued to pressure issuers.
Quality Orientation, Maturity Positioning Drove Results
The Fund's maturity positioning was generally in line with the index, with slightly more exposure to bonds with maturities between five and eight years and slightly less exposure to 12- to 17-year maturities, the best performing segment for the period. The Fund's call structure was generally longer than the index, which was positive for performance. (A bond's "call date" is the date on which it can be
Portfolio Management
Brian McGreevy
Quality Breakdown (%)
(at April 30, 2013) | |
AAA rating | | | 14.5 | | |
AA rating | | | 48.5 | | |
A rating | | | 24.0 | | |
BBB rating | | | 8.3 | | |
Non rated | | | 4.7 | | |
Total | | | 100.0 | | |
Percentages indicated are based upon total fixed income securities (excluding Money Market Funds).
Bond ratings apply to the underlying holdings of the Fund and not the Fund itself and are divided into categories ranging from AAA (highest) to D (lowest), and are subject to change. The ratings shown are determined by using the middle rating of Moody's, S&P, and Fitch after dropping the highest and lowest available ratings. When a rating from only two agencies is available, the lower rating is used. When a rating from only one agency is available, that rating is used. When a bond is not rated by any of these agencies, it is designated as Not rated. Credit ratings are subjective opinions and not statements of fact.
Annual Report 2013
4
Columbia North Carolina Intermediate Municipal Bond Fund
Manager Discussion of Fund Performance (continued)
redeemed before maturity.) However, its quality orientation, which reflects the overall higher quality of North Carolina bonds and lack of availability of lower-quality A and AA rated bonds, limited results as higher quality bonds underperformed for the period. The A rated bonds in the Fund also gave up some ground because they were shorter in duration, a measure of interest rate senstivitiy. As yields declined, these shorter duration securities underperformed. By contrast, the Fund's hospital, water and sewer and electric revenue bonds generated returns that were in line with or higher than the index return.
During the period, we focused purchases in the 12- to 17-year maturity range, including general obligation hospital bonds rated A and AA and decreased exposure to bonds with very short maturities and bonds with shorter call dates. We also added exposure to non-rated bonds with an investment in a retirement community that we felt offered attractive yields for its risk profile. We continued to decrease exposure to Puerto Rico bonds, which aided performance, as Puerto Rico was by far the weakest state index over the 12-month period. The rating agencies have placed Puerto Rico in the lowest investment-grade category, and we view many of the issuers as still having substantial risks and not offering value for its credit profile. There is a strong interrelationship among several of the larger issuers, and negative news on one often affects them all.
North Carolina Recovery Gains Momentum
A strong labor market has put North Carolina's economy on firmer footing as it continues to recover from recession. Even though the state's unemployment rate at 9.5% is above the U.S. average, it reflects an increase in the number of job seekers. Both private service and manufacturing jobs have contributed to the uptick in hiring. A strong financial services presence in the state is also expected to benefit job expansion, especially in the state's major metropolitan areas. Favorable demographics also figure into the state's improving prospects. In 2012, North Carolina was the 15th fastest growing state in the nation, which should give homebuilding the boost it needs to once again contribute to the state's economic growth. We believe factors are generally favorable for the state's municipal credit profile.
Looking Ahead
In this environment, we will expect to continue to emphasize the quality, sector and maturity profile of the Fund versus its benchmarks, and we expect to seek out issues rated A and BBB across sectors that mature in 10-14 years, while maintaining a dollar-weighted average portfolio maturity of between three and ten years, as we believe they are currently attractive. With a seasoned staff of credit professionals, we believe we are well positioned to discover value opportunities that offer incremental yield and appropriate fundamentals among North Carolina municipal bonds.
Annual Report 2013
5
Columbia North Carolina Intermediate Municipal Bond Fund
Understanding Your Fund's Expenses
(Unaudited)
As an investor, you incur two types of costs. There are transaction costs, which generally include sales charges on purchases and may include redemption fees. There are also ongoing costs, which generally include management fees, distribution and service (Rule 12b-1) fees, and other fund expenses. The following information is intended to help you understand your ongoing costs (in dollars) of investing in the Fund and to help you compare these costs with the ongoing costs of investing in other mutual funds.
Analyzing Your Fund's Expenses
To illustrate these ongoing costs, we have provided examples and calculated the expenses paid by investors in each share class of the Fund during the period. The actual and hypothetical information in the table is based on an initial investment of $1,000 at the beginning of the period indicated and held for the entire period. Expense information is calculated two ways and each method provides you with different information. The amount listed in the "Actual" column is calculated using the Fund's actual operating expenses and total return for the period. You may use the Actual information, together with the amount invested, to estimate the expenses that you paid over the period. Simply divide your account value by $1,000 (for example, an $8,600 account value divided by $1,000 = 8.6), then multiply the results by the expenses paid during the period under the Actual column. The amount listed in the "Hypothetical" column assumes a 5% annual rate of return before expenses (which is not the Fund's actual return) and then applies the Fund's actual expense ratio for the period to the hypothetical return. You should not use the hypothetical account values and expenses to estimate either your actual account balance at the end of the period or the expenses you paid during the period. See "Compare With Other Funds" below for details on how to use the hypothetical data.
Compare With Other Funds
Since all mutual funds are required to include the same hypothetical calculations about expenses in shareholder reports, you can use this information to compare the ongoing cost of investing in the Fund with other funds. To do so, compare the hypothetical example with the 5% hypothetical examples that appear in the shareholder reports of other funds. As you compare hypothetical examples of other funds, it is important to note that hypothetical examples are meant to highlight the ongoing costs of investing in a fund only and do not reflect any transaction costs, such as sales charges, or redemption or exchange fees. Therefore, the hypothetical calculations are useful in comparing ongoing costs only, and will not help you determine the relative total costs of owning different funds. If transaction costs were included in these calculations, your costs would be higher.
November 1, 2012 – April 30, 2013
| | Account Value at the Beginning
of the Period ($) | | Account Value at the End of the
Period ($) | | Expenses Paid During the
Period ($) | | Fund's Annualized
Expense Ratio (%) | |
| | Actual | | Hypothetical | | Actual | | Hypothetical | | Actual | | Hypothetical | | Actual | |
Class A | | | 1,000.00 | | | | 1,000.00 | | | | 1,011.90 | | | | 1,020.78 | | | | 4.04 | | | | 4.06 | | | | 0.81 | | |
Class B | | | 1,000.00 | | | | 1,000.00 | | | | 1,007.30 | | | | 1,017.06 | | | | 7.76 | | | | 7.80 | | | | 1.56 | | |
Class C | | | 1,000.00 | | | | 1,000.00 | | | | 1,008.20 | | | | 1,017.06 | | | | 7.77 | | | | 7.80 | | | | 1.56 | | |
Class R4 | | | 1,000.00 | | | | 1,000.00 | | | | 1,010.70 | * | | | 1,022.22 | | | | 0.59 | * | | | 2.61 | | | | 0.52 | * | |
Class Z | | | 1,000.00 | | | | 1,000.00 | | | | 1,012.30 | | | | 1,022.02 | | | | 2.79 | | | | 2.81 | | | | 0.56 | | |
*For the period March 19, 2013 through April 30, 2013. Class R4 shares commenced operations on March 19, 2013.
Expenses paid during the period are equal to the annualized expense ratio for each class as indicated above, multiplied by the average account value over the period and then multiplied by the number of days in the Fund's most recent fiscal half year and divided by 365.
Expenses do not include fees and expenses incurred indirectly by the Fund from the underlying funds in which the Fund may invest (also referred to as "acquired funds"), including affiliated and non-affiliated pooled investment vehicles (including mutual funds and exchange-traded funds).
Had Columbia Management Investment Advisers, LLC and/or certain of its affiliates not waived/reimbursed certain fees and expenses, account value at the end of the period would have been reduced.
Annual Report 2013
6
Columbia North Carolina Intermediate Municipal Bond Fund
Portfolio of Investments
April 30, 2013
(Percentages represent value of investments compared to net assets)
Municipal Bonds 96.8%
Issue
Description | | Coupon
Rate | | Principal
Amount ($) | | Value ($) | |
Airport 1.7% | |
Raleigh Durham Airport Authority
Refunding Revenue Bonds
Series 2010A
05/01/23 | | | 5.000 | % | | | 3,000,000 | | | | 3,599,190 | | |
Higher Education 6.6% | |
Appalachian State University
Refunding Revenue Bonds
Series 2005 (NPFGC)
07/15/21 | | | 5.000 | % | | | 790,000 | | | | 859,512 | | |
North Carolina Capital Facilities Finance Agency
Revenue Bonds
Johnson & Wales University Project
Series 2003A (XLCA)
04/01/21 | | | 5.250 | % | | | 1,000,000 | | | | 1,002,180 | | |
Meredith College
Series 2008
06/01/31 | | | 6.000 | % | | | 1,000,000 | | | | 1,136,470 | | |
Wake Forest University
Series 2009
01/01/26 | | | 5.000 | % | | | 1,000,000 | | | | 1,191,320 | | |
University of North Carolina System
Revenue Bonds
Asheville/Wilmington
Series 2010C
10/01/16 | | | 5.000 | % | | | 3,000,000 | | | | 3,435,090 | | |
General Trust Indenture
Series 2009B
10/01/17 | | | 4.250 | % | | | 1,000,000 | | | | 1,137,020 | | |
Series 2008A
10/01/22 | | | 5.000 | % | | | 2,000,000 | | | | 2,359,180 | | |
University of North Carolina at Charlotte
Revenue Bonds
Series 2012A
2/23/2012
04/01/21 | | | 4.000 | % | | | 2,370,000 | | | | 2,788,661 | | |
Total | | | | | | | 13,909,433 | | |
Hospital 11.7% | |
Albemarle Hospital Authority
Refunding Revenue Bonds
Series 2007
10/01/21 | | | 5.250 | % | | | 2,000,000 | | | | 2,127,360 | | |
10/01/27 | | | 5.250 | % | | | 1,000,000 | | | | 1,034,780 | | |
Charlotte-Mecklenburg Hospital Authority
Refunding Revenue Bonds
Carolinas Health Care System Group
Series 2007A (AGM)
01/15/20 | | | 5.000 | % | | | 1,550,000 | | | | 1,760,335 | | |
Carolinas HealthCare System Group
Series 2008A
01/15/24 | | | 5.250 | % | | | 2,000,000 | | | | 2,272,280 | | |
Municipal Bonds (continued)
Issue
Description | | Coupon
Rate | | Principal
Amount ($) | | Value ($) | |
Series 2009A
01/15/21 | | | 5.000 | % | | | 1,000,000 | | | | 1,178,680 | | |
North Carolina Medical Care Commission
Refunding Revenue Bonds
North Carolina Baptist Hospital
Series 2010
06/01/17 | | | 5.000 | % | | | 1,500,000 | | | | 1,752,435 | | |
Southeastern Regional Medical Center
Series 2012
06/01/26 | | | 5.000 | % | | | 1,000,000 | | | | 1,150,570 | | |
Vidant Health
Series 2012A
06/01/25 | | | 5.000 | % | | | 1,500,000 | | | | 1,714,140 | | |
Wake Forest Baptist Obligation
Series 2012
12/01/24 | | | 5.000 | % | | | 1,650,000 | | | | 2,013,941 | | |
Revenue Bonds
Moses Cone Health System
Series 2011
10/01/20 | | | 5.000 | % | | | 3,215,000 | | | | 3,937,732 | | |
Wilson Medical Center
Series 2007
11/01/19 | | | 5.000 | % | | | 3,385,000 | | | | 3,831,617 | | |
North Carolina Medical Care Commission(a)
Refunding Revenue Bonds
Novant Health Obligation Group
Series 2013
11/01/24 | | | 5.000 | % | | | 530,000 | | | | 630,583 | | |
Northern Hospital District of Surry County
Revenue Bonds
Series 2008
10/01/24 | | | 5.750 | % | | | 1,000,000 | | | | 1,080,770 | | |
Total | | | | | | | 24,485,223 | | |
Joint Power Authority 7.8% | |
North Carolina Eastern Municipal Power Agency
Refunding Revenue Bonds
Series 1993B (NPFGC)
01/01/22 | | | 6.000 | % | | | 1,000,000 | | | | 1,286,550 | | |
Series 1993B (NPFGC/FGIC)
01/01/22 | | | 6.000 | % | | | 3,000,000 | | | | 3,900,720 | | |
Series 2005A (AMBAC)
01/01/20 | | | 5.250 | % | | | 2,000,000 | | | | 2,234,000 | | |
Series 2008A (AGM)
01/01/19 | | | 5.250 | % | | | 1,500,000 | | | | 1,770,555 | | |
Revenue Bonds
Series 2009B
01/01/26 | | | 5.000 | % | | | 1,500,000 | | | | 1,702,965 | | |
North Carolina Municipal Power Agency No. 1
Refunding Revenue Bonds
Series 2008A
01/01/17 | | | 5.250 | % | | | 1,185,000 | | | | 1,377,171 | | |
01/01/20 | | | 5.250 | % | | | 2,000,000 | | | | 2,333,020 | | |
The accompanying Notes to Financial Statements are an integral part of this statement.
Annual Report 2013
7
Columbia North Carolina Intermediate Municipal Bond Fund
Portfolio of Investments (continued)
April 30, 2013
Municipal Bonds (continued)
Issue
Description | | Coupon
Rate | | Principal
Amount ($) | | Value ($) | |
Revenue Bonds
Series 2009A
01/01/25 | | | 5.000 | % | | | 1,500,000 | | | | 1,716,645 | | |
Total | | | | | | | 16,321,626 | | |
Local Appropriation 23.7% | |
City of Greenville
Certificate of Participation
Public Facilities & Equipment Project
Series 2004 (AMBAC)
06/01/22 | | | 5.250 | % | | | 2,180,000 | | | | 2,293,404 | | |
City of Wilmington
Refunding Certificate of Participation
Series 2006A
06/01/17 | | | 5.000 | % | | | 1,005,000 | | | | 1,136,052 | | |
County of Beaufort
Limited General Obligation Bonds
Series 2012
06/01/25 | | | 5.000 | % | | | 1,045,000 | | | | 1,248,033 | | |
06/01/26 | | | 5.000 | % | | | 1,000,000 | | | | 1,186,120 | | |
County of Buncombe
Revenue Bonds
Series 2012
06/01/28 | | | 5.000 | % | | | 1,500,000 | | | | 1,796,340 | | |
06/01/29 | | | 5.000 | % | | | 1,500,000 | | | | 1,785,615 | | |
County of Burke
Certificate of Participation
Series 2006B (AMBAC)
04/01/18 | | | 5.000 | % | | | 1,425,000 | | | | 1,564,479 | | |
County of Cabarrus
Certificate of Participation
Installment Financing Contract
Series 2008C
06/01/22 | | | 5.000 | % | | | 1,545,000 | | | | 1,813,737 | | |
County of Catawba
Revenue Bonds
Series 2011
10/01/22 | | | 5.000 | % | | | 400,000 | | | | 490,208 | | |
County of Chatham
Certificate of Participation
Series 2006 (AMBAC)
06/01/20 | | | 5.000 | % | | | 1,065,000 | | | | 1,197,380 | | |
County of Craven
Certificate of Participation
Series 2007 (NPFGC)
06/01/18 | | | 5.000 | % | | | 2,825,000 | | | | 3,314,007 | | |
06/01/19 | | | 5.000 | % | | | 1,825,000 | | | | 2,140,907 | | |
County of Cumberland
Refunding Certificate of Participation
Improvement Projects
Series 2009-B1
12/01/21 | | | 5.000 | % | | | 2,775,000 | | | | 3,372,652 | | |
Municipal Bonds (continued)
Issue
Description | | Coupon
Rate | | Principal
Amount ($) | | Value ($) | |
County of Dare
Refunding Revenue Bonds
Series 2012D
06/01/26 | | | 5.000 | % | | | 1,000,000 | | | | 1,186,120 | | |
06/01/27 | | | 5.000 | % | | | 700,000 | | | | 823,494 | | |
County of Gaston
Refunding Certificate of Participation
Series 2005 (NPFGC)
12/01/15 | | | 5.000 | % | | | 1,350,000 | | | | 1,494,464 | | |
County of Harnett
Certificate of Participation
Series 2009
06/01/22 | | | 5.000 | % | | | 1,880,000 | | | | 2,187,136 | | |
County of Henderson
Certificate of Participation
Series 2006A (AMBAC)
06/01/16 | | | 5.000 | % | | | 1,060,000 | | | | 1,193,157 | | |
County of Iredell
Certificate of Participation
Iredell County School Project
Series 2006 (AMBAC)
06/01/20 | | | 5.000 | % | | | 1,690,000 | | | | 1,906,134 | | |
County of Mecklenburg
Certificate of Participation
Series 2009A
02/01/23 | | | 5.000 | % | | | 1,000,000 | | | | 1,162,910 | | |
County of Moore
Revenue Bonds
Series 2010
06/01/24 | | | 5.000 | % | | | 1,635,000 | | | | 1,925,523 | | |
County of New Hanover
Refunding Certificate of Participation
Series 2005B (AMBAC)
09/01/18 | | | 5.000 | % | | | 1,755,000 | | | | 2,112,441 | | |
County of Onslow
Revenue Bonds
Series 2012-A
06/01/28 | | | 4.000 | % | | | 2,140,000 | | | | 2,335,724 | | |
County of Randolph
Refunding Certificate of Participation
Series 2004 (AGM)
06/01/14 | | | 5.000 | % | | | 1,000,000 | | | | 1,047,720 | | |
County of Sampson
Certificate of Participation
Series 2006 (AGM)
06/01/16 | | | 5.000 | % | | | 1,000,000 | | | | 1,131,100 | | |
County of Union
Refunding Revenue Bonds
Series 2012
12/01/24 | | | 5.000 | % | | | 1,715,000 | | | | 2,172,408 | | |
The accompanying Notes to Financial Statements are an integral part of this statement.
Annual Report 2013
8
Columbia North Carolina Intermediate Municipal Bond Fund
Portfolio of Investments (continued)
April 30, 2013
Municipal Bonds (continued)
Issue
Description | | Coupon
Rate | | Principal
Amount ($) | | Value ($) | |
Jacksonville Public Facilities Corp.
Limited Obligation Revenue Bonds
Series 2012
04/01/26 | | | 5.000 | % | | | 1,075,000 | | | | 1,270,274 | | |
Orange County Public Facilities Co.
Revenue Bonds
Series 2012
10/01/24 | | | 5.000 | % | | | 1,325,000 | | | | 1,620,435 | | |
Watauga Public Facilities Corp.
Revenue Bonds
Series 2012A
06/01/28 | | | 4.000 | % | | | 2,500,000 | | | | 2,650,475 | | |
Total | | | | | | | 49,558,449 | | |
Local General Obligation 8.2% | |
County of Brunswick
Unlimited General Obligation Refunding Bonds
Series 2012
02/01/21 | | | 5.000 | % | | | 2,370,000 | | | | 2,970,605 | | |
County of Cabarrus
Unlimited General Obligation Bonds
Public Improvement
Series 2006
03/01/15 | | | 5.000 | % | | | 1,000,000 | | | | 1,084,070 | | |
03/01/16 | | | 5.000 | % | | | 1,000,000 | | | | 1,125,660 | | |
County of Iredell
Unlimited General Obligation Bonds
School
Series 2006
02/01/19 | | | 5.000 | % | | | 2,420,000 | | | | 2,699,849 | | |
County of Mecklenburg
Unlimited General Obligation Refunding Bonds
Series 2009A
08/01/19 | | | 5.000 | % | | | 1,000,000 | | | | 1,243,000 | | |
County of New Hanover
Unlimited General Obligation Refunding Bonds
Series 2009
12/01/17 | | | 5.000 | % | | | 1,170,000 | | | | 1,399,589 | | |
County of Orange
Unlimited General Obligation Refunding Bonds
Series 2005B
04/01/16 | | | 5.250 | % | | | 1,000,000 | | | | 1,092,340 | | |
County of Stanly
Unlimited General Obligation Refunding Bonds
Series 2010
02/01/18 | | | 4.000 | % | | | 1,500,000 | | | | 1,723,770 | | |
County of Wake
Unrefunded Unlimited General Obligation Public Improvement Bonds
Series 2009
03/01/20 | | | 5.000 | % | | | 3,065,000 | | | | 3,749,292 | | |
Total | | | | | | | 17,088,175 | | |
Municipal Bonds (continued)
Issue
Description | | Coupon
Rate | | Principal
Amount ($) | | Value ($) | |
Municipal Power 0.8% | |
Greenville Utilities Commission
Revenue Bonds
Series 2008A (AGM)
11/01/18 | | | 5.000 | % | | | 1,040,000 | | | | 1,252,482 | | |
Guam Power Authority
Refunding Revenue Bonds
Series 2012A (AGM)(b)
10/01/24 | | | 5.000 | % | | | 420,000 | | | | 506,940 | | |
Total | | | | | | | 1,759,422 | | |
Other Bond Issue 1.3% | |
Durham County Industrial Facilities & Pollution Control Financing Authority
Revenue Bonds
Research Triangle Institute
Series 2010
02/01/17 | | | 4.000 | % | | | 1,440,000 | | | | 1,594,901 | | |
02/01/18 | | | 4.000 | % | | | 1,000,000 | | | | 1,127,230 | | |
Total | | | | | | | 2,722,131 | | |
Ports 1.1% | |
North Carolina Ports Authority
Revenue Bonds
Senior Lien
Series 2010B
02/01/25 | | | 5.000 | % | | | 2,000,000 | | | | 2,288,320 | | |
Refunded/Escrowed 9.1% | |
Appalachian State University
Prerefunded 07/15/15 Revenue Bonds
Series 2005 (NPFGC)
07/15/21 | | | 5.000 | % | | | 695,000 | | | | 764,827 | | |
County of Dare
Prerefunded 06/01/15 Certificate of Participation
Series 2005 (NPFGC/FGIC)
06/01/20 | | | 5.000 | % | | | 3,005,000 | | | | 3,290,866 | | |
County of Orange
Prerefunded 04/01/15 Unlimited General Obligation Bonds
Public Improvement
Series 2005A
04/01/22 | | | 5.000 | % | | | 2,000,000 | | | | 2,177,960 | | |
County of Wake
Prerefunded 03/01/19 Unlimited General Obligation Bonds
Public Improvement
Series 2009
03/01/20 | | | 5.000 | % | | | 935,000 | | | | 1,150,508 | | |
Revenue Bonds
Series 1993 Escrowed to Maturity (NPFGC)
10/01/26 | | | 5.125 | % | | | 3,065,000 | | | | 3,752,418 | | |
The accompanying Notes to Financial Statements are an integral part of this statement.
Annual Report 2013
9
Columbia North Carolina Intermediate Municipal Bond Fund
Portfolio of Investments (continued)
April 30, 2013
Municipal Bonds (continued)
Issue
Description | | Coupon
Rate | | Principal
Amount ($) | | Value ($) | |
North Carolina Eastern Municipal Power Agency
Prerefunded 01/01/22 Revenue Bonds
Series 1988A
01/01/26 | | | 6.000 | % | | | 1,000,000 | | | | 1,351,940 | | |
Revenue Bonds
Series 1986A Escrowed to Maturity
01/01/17 | | | 5.000 | % | | | 2,165,000 | | | | 2,426,272 | | |
Puerto Rico Highway & Transportation Authority
Refunding Revenue Bonds
Series 2003AA Escrowed to Maturity (NPFGC)(b)
07/01/18 | | | 5.500 | % | | | 3,360,000 | | | | 4,168,752 | | |
Total | | | | | | | 19,083,543 | | |
Retirement Communities 1.3% | |
North Carolina Medical Care Commission
Refunding Revenue Bonds
1st Mortgage United Methodist
Series 2013A
10/01/33 | | | 5.000 | % | | | 1,595,000 | | | | 1,671,528 | | |
1st Mortgage-Givens Estates
Series 2007
07/01/16 | | | 5.000 | % | | | 1,000,000 | | | | 1,092,630 | | |
Total | | | | | | | 2,764,158 | | |
Single Family 1.5% | |
North Carolina Housing Finance Agency
Revenue Bonds
Series 2011-2
07/01/25 | | | 4.000 | % | | | 2,000,000 | | | | 2,142,400 | | |
North Carolina Housing Finance Agency(c)
Revenue Bonds
Series 2007-30-A AMT
07/01/23 | | | 5.000 | % | | | 880,000 | | | | 933,768 | | |
Total | | | | | | | 3,076,168 | | |
Special Non Property Tax 2.4% | |
City of Charlotte Storm Water
Revenue Bonds
Series 2006
06/01/17 | | | 5.000 | % | | | 1,120,000 | | | | 1,270,461 | | |
Puerto Rico Infrastructure Financing Authority
Refunding Revenue Bonds
Series 2005C (FGIC)(b)
07/01/20 | | | 5.500 | % | | | 1,200,000 | | | | 1,281,492 | | |
Territory of Guam
Revenue Bonds
Series 2011A(b)
01/01/31 | | | 5.000 | % | | | 500,000 | | | | 560,805 | | |
Virgin Islands Public Finance Authority
Revenue Bonds
Matching Fund Loan-Senior Lien
Series 2010A(b)
10/01/20 | | | 5.000 | % | | | 1,560,000 | | | | 1,814,841 | | |
Total | | | | | | | 4,927,599 | | |
Municipal Bonds (continued)
Issue
Description | | Coupon
Rate | | Principal
Amount ($) | | Value ($) | |
State Appropriated 1.4% | |
North Carolina Infrastructure Finance Corp.
Certificate of Participation
Capital Improvement
Series 2007A (AGM)
05/01/24 | | | 5.000 | % | | | 2,570,000 | | | | 2,978,707 | | |
Water & Sewer 18.2% | |
Cape Fear Public Utility Authority
Revenue Bonds
Series 2008
08/01/20 | | | 5.000 | % | | | 1,000,000 | | | | 1,202,630 | | |
City of Charlotte
Revenue Bonds
Series 2009B
07/01/25 | | | 5.000 | % | | | 5,835,000 | | | | 7,109,714 | | |
Water & Sewer System
Series 2008
07/01/23 | | | 5.000 | % | | | 3,000,000 | | | | 3,589,890 | | |
City of Concord
Refunding Revenue Bonds
Series 2008B
12/01/19 | | | 5.000 | % | | | 1,500,000 | | | | 1,836,735 | | |
City of Gastonia
Refunding Revenue Bonds
Combined Utilities System
Series 2009
05/01/17 | | | 4.000 | % | | | 1,205,000 | | | | 1,359,674 | | |
City of Greensboro
Refunding Revenue Bonds
Series 2006
06/01/17 | | | 5.250 | % | | | 2,000,000 | | | | 2,365,940 | | |
06/01/22 | | | 5.250 | % | | | 1,200,000 | | | | 1,569,036 | | |
06/01/23 | | | 5.250 | % | | | 2,000,000 | | | | 2,646,100 | | |
City of High Point
Revenue Bonds
Series 2008 (AGM)
11/01/24 | | | 5.000 | % | | | 1,000,000 | | | | 1,199,880 | | |
11/01/25 | | | 5.000 | % | | | 1,000,000 | | | | 1,196,940 | | |
City of Raleigh
Revenue Bonds
Series 2006A
03/01/16 | | | 5.000 | % | | | 1,500,000 | | | | 1,689,840 | | |
Series 2011
03/01/27 | | | 5.000 | % | | | 800,000 | | | | 962,848 | | |
City of Thomasville
Refunding Revenue Bonds
Series 2012
05/01/24 | | | 4.000 | % | | | 500,000 | | | | 563,710 | | |
05/01/26 | | | 4.000 | % | | | 860,000 | | | | 949,070 | | |
City of Winston-Salem
Refunding Revenue Bonds
Series 2007A
06/01/19 | | | 5.000 | % | | | 3,000,000 | | | | 3,485,700 | | |
The accompanying Notes to Financial Statements are an integral part of this statement.
Annual Report 2013
10
Columbia North Carolina Intermediate Municipal Bond Fund
Portfolio of Investments (continued)
April 30, 2013
Municipal Bonds (continued)
Issue
Description | | Coupon
Rate | | Principal
Amount ($) | | Value ($) | |
Revenue Bonds
Series 2009
06/01/23 | | | 5.000 | % | | | 1,000,000 | | | | 1,215,550 | | |
County of Brunswick
Revenue Bonds
Series 2008A
04/01/20 | | | 5.000 | % | | | 1,915,000 | | | | 2,259,164 | | |
04/01/22 | | | 5.000 | % | | | 1,390,000 | | | | 1,628,927 | | |
County of Union
Refunding Revenue Bonds
Enterprise System
Series 2011A
12/01/19 | | | 4.000 | % | | | 500,000 | | | | 588,105 | | |
12/01/20 | | | 4.000 | % | | | 600,000 | | | | 712,086 | | |
Total | | | | | | | 38,131,539 | | |
Total Municipal Bonds
(Cost: $183,969,325) | | | | | | | 202,693,683 | | |
Money Market Funds 2.4%
| |
Shares | |
Value ($) | |
JPMorgan Tax-Free Money Market Fund,
0.000%(d) | | | 5,126,974 | | | | 5,126,974 | | |
Total Money Market Funds
(Cost: $5,126,974) | | | | | 5,126,974 | | |
Total Investments
(Cost: $189,096,299) | | | | | 207,820,657 | | |
Other Assets & Liabilities, Net | | | | | 1,689,443 | | |
Net Assets | | | | | 209,510,100 | | |
Notes to Portfolio of Investments
(a) Represents a security purchased on a when-issued or delayed delivery basis.
(b) Municipal obligations include debt obligations issued by or on behalf of territories, possessions, or sovereign nations within the territorial boundaries of the United States. At April 30, 2013, the value of these securities amounted to $8,332,830 or 3.98% of net assets.
(c) Income from this security may be subject to alternative minimum tax.
(d) The rate shown is the seven-day current annualized yield at April 30, 2013.
Abbreviation Legend
AGM Assured Guaranty Municipal Corporation
AMBAC Ambac Assurance Corporation
AMT Alternative Minimum Tax
FGIC Financial Guaranty Insurance Company
NPFGC National Public Finance Guarantee Corporation
XLCA XL Capital Assurance
Fair Value Measurements
Generally accepted accounting principles (GAAP) require disclosure regarding the inputs and valuation techniques used to measure fair value and any changes in valuation inputs or techniques. In addition, investments shall be disclosed by major category.
The Fund categorizes its fair value measurements according to a three-level hierarchy that maximizes the use of observable inputs and minimizes the use of unobservable inputs by prioritizing that the most observable input be used when available. Observable inputs are those that market participants would use in pricing an investment based on market data obtained from sources independent of the reporting entity. Unobservable inputs are those that reflect the Fund's assumptions about the information market participants would use in pricing an investment. An investment's level within the fair value hierarchy is based on the lowest level of any input that is deemed significant to the asset or liability's fair value measurement. The input levels are not necessarily an indication of the risk or liquidity associated with investments at that level. For example, certain U.S. government securities are generally high quality and liquid, however, they are reflected as Level 2 because the inputs used to determine fair value may not always be quoted prices in an active market.
Fair value inputs are summarized in the three broad levels listed below:
> Level 1 — Valuations based on quoted prices for investments in active markets that the Fund has the ability to access at the measurement date (including NAV for open-end mutual funds). Valuation adjustments are not applied to Level 1 investments.
The accompanying Notes to Financial Statements are an integral part of this statement.
Annual Report 2013
11
Columbia North Carolina Intermediate Municipal Bond Fund
Portfolio of Investments (continued)
April 30, 2013
Fair Value Measurements (continued)
> Level 2 — Valuations based on other significant observable inputs (including quoted prices for similar securities, interest rates, prepayment speeds, credit risks, etc.).
> Level 3 — Valuations based on significant unobservable inputs (including the Fund's own assumptions and judgment in determining the fair value of investments).
Inputs that are used in determining fair value of an investment may include price information, credit data, volatility statistics, and other factors. These inputs can be either observable or unobservable. The availability of observable inputs can vary between investments, and is affected by various factors such as the type of investment, and the volume and level of activity for that investment or similar investments in the marketplace. The inputs will be considered by the Investment Manager, along with any other relevant factors in the calculation of an investment's fair value. The Fund uses prices and inputs that are current as of the measurement date, which may include periods of market dislocations. During these periods, the availability of prices and inputs may be reduced for many investments. This condition could cause an investment to be reclassified between the various levels within the hierarchy.
Investments falling into the Level 3 category are primarily supported by quoted prices from brokers and dealers participating in the market for those investments. However, these may be classified as Level 3 investments due to lack of market transparency and corroboration to support these quoted prices. Additionally, valuation models may be used as the pricing source for any remaining investments classified as Level 3. These models may rely on one or more significant unobservable inputs and/or significant assumptions by the Investment Manager. Inputs used in valuations may include, but are not limited to, financial statement analysis, capital account balances, discount rates and estimated cash flows, and comparable company data.
Under the direction of the Fund's Board of Trustees (the Board), the Investment Manager's Valuation Committee (the Committee) is responsible for carrying out the valuation procedures approved by the Board. The Committee consists of voting and non-voting members from various groups within the Investment Manager's organization, including operations and accounting, trading and investments, compliance, risk management and legal.
The Committee meets at least monthly to review and approve valuation matters, which may include a description of specific valuation determinations, data regarding pricing information received from approved pricing vendors and brokers and the results of Board-approved valuation control policies and procedures (the Policies). The Policies address, among other things, instances when market quotations are readily available, including recommendations of third party pricing vendors and a determination of appropriate pricing methodologies; events that require specific valuation determinations and assessment of fair value techniques; securities with a potential for stale pricing, including those that are illiquid, restricted, or in default; and the effectiveness of third-party pricing vendors, including periodic reviews of vendors. The Committee meets more frequently, as needed, to discuss additional valuation matters, which may include the need to review back-testing results, review time-sensitive information or approve related valuation actions. The Committee reports to the Board, with members of the Committee meeting with the Board at each of its regularly scheduled meetings to discuss valuation matters and actions during the period, similar to those described earlier.
For investments categorized as Level 3, the Committee monitors information similar to that described above, which may include: (i) data specific to the issuer or comparable issuers, (ii) general market or specific sector news and (iii) quoted prices and specific or similar security transactions. The Committee considers this data and any changes from prior periods in order to assess the reasonableness of observable and unobservable inputs, any assumptions or internal models used to value those securities and changes in fair value. This data is also used to corroborate, when available, information received from approved pricing vendors and brokers. Various factors impact the frequency of monitoring this information (which may occur as often as daily). However, the Committee may determine that changes to inputs, assumptions and models are not required as a result of the monitoring procedures performed.
The following table is a summary of the inputs used to value the Fund's investments at April 30, 2013:
Description | | Level 1
Quoted Prices in Active
Markets for Identical
Assets ($) | |
Level 2
Other Significant
Observable Inputs ($) | |
Level 3
Significant
Unobservable Inputs ($) | |
Total ($) | |
Bonds | |
Municipal Bonds | | | — | | | | 202,693,683 | | | | — | | | | 202,693,683 | | |
Total Bonds | | | — | | | | 202,693,683 | | | | — | | | | 202,693,683 | | |
Other | |
Money Market Funds | | | 5,126,974 | | | | — | | | | — | | | | 5,126,974 | | |
Total Other | | | 5,126,974 | | | | — | | | | — | | | | 5,126,974 | | |
Total | | | 5,126,974 | | | | 202,693,683 | | | | — | | | | 207,820,657 | | |
See the Portfolio of Investments for all investment classifications not indicated in the table.
The Fund's assets assigned to the Level 2 input category are generally valued using the market approach, in which a security's value is determined through reference to prices and information from market transactions for similar or identical assets.
There were no transfers of financial assets between Levels 1 and 2 during the period.
The accompanying Notes to Financial Statements are an integral part of this statement.
Annual Report 2013
12
Columbia North Carolina Intermediate Municipal Bond Fund
Statement of Assets and Liabilities
April 30, 2013
Assets | |
Investments, at value | |
(identified cost $189,096,299) | | $ | 207,820,657 | | |
Receivable for: | |
Capital shares sold | | | 485,232 | | |
Interest | | | 2,659,862 | | |
Expense reimbursement due from Investment Manager | | | 670 | | |
Prepaid expenses | | | 827 | | |
Total assets | | | 210,967,248 | | |
Liabilities | |
Payable for: | |
Investments purchased on a delayed delivery basis | | | 629,433 | | |
Capital shares purchased | | | 181,539 | | |
Dividend distributions to shareholders | | | 484,395 | | |
Investment management fees | | | 2,293 | | |
Distribution and/or service fees | | | 477 | | |
Transfer agent fees | | | 35,352 | | |
Administration fees | | | 401 | | |
Compensation of board members | | | 91,525 | | |
Other expenses | | | 31,733 | | |
Total liabilities | | | 1,457,148 | | |
Net assets applicable to outstanding capital stock | | $ | 209,510,100 | | |
Represented by | |
Paid-in capital | | $ | 192,725,549 | | |
Undistributed net investment income | | | 737,031 | | |
Accumulated net realized loss | | | (2,676,838 | ) | |
Unrealized appreciation (depreciation) on: | |
Investments | | | 18,724,358 | | |
Total — representing net assets applicable to outstanding capital stock | | $ | 209,510,100 | | |
The accompanying Notes to Financial Statements are an integral part of this statement.
Annual Report 2013
13
Columbia North Carolina Intermediate Municipal Bond Fund
Statement of Assets and Liabilities (continued)
April 30, 2013
Class A | |
Net assets | | $ | 34,851,893 | | |
Shares outstanding | | | 3,185,076 | | |
Net asset value per share | | $ | 10.94 | | |
Maximum offering price per share(a) | | $ | 11.31 | | |
Class B | |
Net assets | | $ | 139,389 | | |
Shares outstanding | | | 12,736 | | |
Net asset value per share | | $ | 10.94 | | |
Class C | |
Net assets | | $ | 8,682,828 | | |
Shares outstanding | | | 793,717 | | |
Net asset value per share | | $ | 10.94 | | |
Class R4 | |
Net assets | | $ | 2,524 | | |
Shares outstanding | | | 231 | | |
Net asset value per share | | $ | 10.93 | | |
Class Z | |
Net assets | | $ | 165,833,466 | | |
Shares outstanding | | | 15,168,475 | | |
Net asset value per share | | $ | 10.93 | | |
(a) The maximum offering price per share is calculated by dividing the net asset value by 1.0 minus the maximum sales charge of 3.25%.
The accompanying Notes to Financial Statements are an integral part of this statement.
Annual Report 2013
14
Columbia North Carolina Intermediate Municipal Bond Fund
Statement of Operations
Year Ended April 30, 2013
Net investment income | |
Income: | |
Dividends | | $ | 399 | | |
Interest | | | 7,468,623 | | |
Total income | | | 7,469,022 | | |
Expenses: | |
Investment management fees | | | 878,335 | | |
Distribution and/or service fees | |
Class A | | | 86,308 | | |
Class B | | | 1,521 | | |
Class C | | | 84,985 | | |
Transfer agent fees | |
Class A | | | 67,997 | | |
Class B | | | 300 | | |
Class C | | | 16,736 | | |
Class Z | | | 347,515 | | |
Administration fees | | | 153,709 | | |
Compensation of board members | | | 24,831 | | |
Custodian fees | | | 3,129 | | |
Printing and postage fees | | | 48,217 | | |
Registration fees | | | 1,879 | | |
Professional fees | | | 38,249 | | |
Other | | | 11,170 | | |
Total expenses | | | 1,764,881 | | |
Fees waived or expenses reimbursed by Investment Manager and its affiliates | | | (370,983 | ) | |
Total net expenses | | | 1,393,898 | | |
Net investment income | | | 6,075,124 | | |
Realized and unrealized gain (loss) — net | |
Net realized gain (loss) on: | |
Investments | | | 684,349 | | |
Net realized gain | | | 684,349 | | |
Net change in unrealized appreciation (depreciation) on: | |
Investments | | | 1,382,384 | | |
Net change in unrealized appreciation (depreciation) | | | 1,382,384 | | |
Net realized and unrealized gain | | | 2,066,733 | | |
Net increase in net assets resulting from operations | | $ | 8,141,857 | | |
The accompanying Notes to Financial Statements are an integral part of this statement.
Annual Report 2013
15
Columbia North Carolina Intermediate Municipal Bond Fund
Statement of Changes in Net Assets
| | | Year Ended
April 30,
2013(a) | | Year Ended
April 30,
2012(b) | | Year Ended
March 31,
2012 | |
Operations | |
Net investment income | | $ | 6,075,124 | | | $ | 526,698 | | | $ | 6,109,342 | | |
Net realized gain | | | 684,349 | | | | 5,021 | | | | 187,006 | | |
Net change in unrealized appreciation (depreciation) | | | 1,382,384 | | | | 1,922,174 | | | | 11,583,225 | | |
Net increase in net assets resulting from operations | | | 8,141,857 | | | | 2,453,893 | | | | 17,879,573 | | |
Distributions to shareholders | |
Net investment income | |
Class A | | | (896,426 | ) | | | (72,299 | ) | | | (888,222 | ) | |
Class B | | | (2,812 | ) | | | (286 | ) | | | (6,424 | ) | |
Class C | | | (156,689 | ) | | | (12,742 | ) | | | (135,648 | ) | |
Class R4 | | | (8 | ) | | | — | | | | — | | |
Class Z | | | (5,019,201 | ) | | | (424,445 | ) | | | (5,095,405 | ) | |
Total distributions to shareholders | | | (6,075,136 | ) | | | (509,772 | ) | | | (6,125,699 | ) | |
Increase (decrease) in net assets from capital stock activity | | | (12,989,822 | ) | | | (1,071,193 | ) | | | 9,824,155 | | |
Total increase (decrease) in net assets | | | (10,923,101 | ) | | | 872,928 | | | | 21,578,029 | | |
Net assets at beginning of year | | | 220,433,201 | | | | 219,560,273 | | | | 197,982,244 | | |
Net assets at end of year | | $ | 209,510,100 | | | $ | 220,433,201 | | | $ | 219,560,273 | | |
Undistributed net investment income | | $ | 737,031 | | | $ | 737,043 | | | $ | 720,117 | | |
(a) Class R4 shares are for the period from March 19, 2013 (commencement of operations) to April 30, 2013.
(b) For the period from April 1, 2012 to April 30, 2012. During the period, the Fund's fiscal year end was changed from March 31 to April 30.
The accompanying Notes to Financial Statements are an integral part of this statement.
Annual Report 2013
16
Columbia North Carolina Intermediate Municipal Bond Fund
Statement of Changes in Net Assets (continued)
| | | Year Ended April 30,
2013(a) | | Year Ended April 30,
2012(b) | | Year Ended March 31,
2012 | |
| | | Shares | | Dollars ($) | | Shares | | Dollars ($) | | Shares | | Dollars ($) | |
Capital stock activity | |
Class A shares | |
Subscriptions(c) | | | 415,472 | | | | 4,535,493 | | | | 31,546 | | | | 340,406 | | | | 600,962 | | | | 6,350,373 | | |
Distributions reinvested | | | 60,476 | | | | 660,647 | | | | 4,337 | | | | 47,012 | | | | 51,185 | | | | 542,078 | | |
Redemptions | | | (391,487 | ) | | | (4,267,494 | ) | | | (13,035 | ) | | | (140,645 | ) | | | (706,718 | ) | | | (7,424,714 | ) | |
Net increase (decrease) | | | 84,461 | | | | 928,646 | | | | 22,848 | | | | 246,773 | | | | (54,571 | ) | | | (532,263 | ) | |
Class B shares | |
Subscriptions | | | 30 | | | | 327 | | | | 2 | | | | 27 | | | | 3,067 | | | | 32,564 | | |
Distributions reinvested | | | 203 | | | | 2,217 | | | | 21 | | | | 223 | | | | 263 | | | | 2,777 | | |
Redemptions(c) | | | (4,533 | ) | | | (49,446 | ) | | | — | | | | — | | | | (41,001 | ) | | | (429,726 | ) | |
Net increase (decrease) | | | (4,300 | ) | | | (46,902 | ) | | | 23 | | | | 250 | | | | (37,671 | ) | | | (394,385 | ) | |
Class C shares | |
Subscriptions | | | 162,353 | | | | 1,776,448 | | | | 11,996 | | | | 129,238 | | | | 267,163 | | | | 2,818,144 | | |
Distributions reinvested | | | 10,917 | | | | 119,250 | | | | 753 | | | | 8,152 | | | | 7,413 | | | | 78,601 | | |
Redemptions | | | (138,462 | ) | | | (1,513,574 | ) | | | (9,192 | ) | | | (99,458 | ) | | | (39,495 | ) | | | (414,412 | ) | |
Net increase | | | 34,808 | | | | 382,124 | | | | 3,557 | | | | 37,932 | | | | 235,081 | | | | 2,482,333 | | |
Class R4 shares | |
Subscriptions | | | 230 | | | | 2,500 | | | | — | | | | — | | | | — | | | | — | | |
Distributions reinvested | | | 1 | | | | 6 | | | | — | | | | — | | | | — | | | | — | | |
Net increase | | | 231 | | | | 2,506 | | | | — | | | | — | | | | — | | | | — | | |
Class Z shares | |
Subscriptions | | | 2,478,489 | | | | 27,074,501 | | | | 164,125 | | | | 1,769,928 | | | | 3,167,604 | | | | 33,571,858 | | |
Distributions reinvested | | | 50,366 | | | | 549,746 | | | | 3,476 | | | | 37,640 | | | | 36,972 | | | | 391,733 | | |
Redemptions | | | (3,838,774 | ) | | | (41,880,443 | ) | | | (292,786 | ) | | | (3,163,716 | ) | | | (2,449,003 | ) | | | (25,695,121 | ) | |
Net increase (decrease) | | | (1,309,919 | ) | | | (14,256,196 | ) | | | (125,185 | ) | | | (1,356,148 | ) | | | 755,573 | | | | 8,268,470 | | |
Total net increase (decrease) | | | (1,194,719 | ) | | | (12,989,822 | ) | | | (98,757 | ) | | | (1,071,193 | ) | | | 898,412 | | | | 9,824,155 | | |
(a) Class R4 shares are for the period from March 19, 2013 (commencement of operations) to April 30, 2013.
(b) For the period from April 1, 2012 to April 30, 2012. During the period, the Fund's fiscal year end was changed from March 31 to April 30.
(c) Includes conversions of Class B shares to Class A shares, if any.
The accompanying Notes to Financial Statements are an integral part of this statement.
Annual Report 2013
17
Columbia North Carolina Intermediate Municipal Bond Fund
The following tables are intended to help you understand the Fund's financial performance. Certain information reflects financial results for a single share of a class held for the periods shown. Per share net investment income (loss) amounts are calculated based on average shares outstanding during the period. Total return assumes reinvestment of all dividends and distributions, if any. Total return does not reflect payment of sales charges, if any, and is not annualized for periods of less than one year.
| | | Year Ended April 30, | | Year Ended March 31, | |
Class A | | 2013 | | 2012(a) | | 2012 | | 2011 | | 2010 | | 2009 | |
Per share data | |
Net asset value, beginning of period | | $ | 10.84 | | | $ | 10.74 | | | $ | 10.13 | | | $ | 10.17 | | | $ | 9.79 | | | $ | 10.08 | | |
Income from investment operations: | |
Net investment income | | | 0.28 | | | | 0.02 | | | | 0.30 | | | | 0.31 | | | | 0.33 | | | | 0.37 | | |
Net realized and unrealized gain (loss) | | | 0.10 | | | | 0.10 | | | | 0.61 | | | | (0.04 | ) | | | 0.38 | | | | (0.29 | ) | |
Total from investment operations | | | 0.38 | | | | 0.12 | | | | 0.91 | | | | 0.27 | | | | 0.71 | | | | 0.08 | | |
Less distributions to shareholders: | |
Net investment income | | | (0.28 | ) | | | (0.02 | ) | | | (0.30 | ) | | | (0.31 | ) | | | (0.33 | ) | | | (0.37 | ) | |
Total distributions to shareholders | | | (0.28 | ) | | | (0.02 | ) | | | (0.30 | ) | | | (0.31 | ) | | | (0.33 | ) | | | (0.37 | ) | |
Net asset value, end of period | | $ | 10.94 | | | $ | 10.84 | | | $ | 10.74 | | | $ | 10.13 | | | $ | 10.17 | | | $ | 9.79 | | |
Total return | | | 3.57 | % | | | 1.15 | % | | | 9.02 | % | | | 2.61 | % | | | 7.34 | % | | | 0.87 | % | |
Ratios to average net assets(b) | |
Total gross expenses | | | 0.97 | % | | | 0.96 | %(c) | | | 1.00 | % | | | 0.94 | % | | | 0.91 | % | | | 0.89 | % | |
Total net expenses(d) | | | 0.80 | % | | | 0.79 | %(c) | | | 0.79 | % | | | 0.80 | %(e) | | | 0.78 | %(e) | | | 0.75 | %(e) | |
Net investment income | | | 2.59 | % | | | 2.65 | %(c) | | | 2.80 | % | | | 2.97 | % | | | 3.27 | % | | | 3.79 | % | |
Supplemental data | |
Net assets, end of period (in thousands) | | $ | 34,852 | | | $ | 33,601 | | | $ | 33,061 | | | $ | 31,731 | | | $ | 33,307 | | | $ | 23,236 | | |
Portfolio turnover | | | 10 | % | | | 1 | % | | | 4 | % | | | 16 | % | | | 15 | % | | | 20 | % | |
Notes to Financial Highlights
(a) For the period from April 1, 2012 to April 30, 2012. During the period, the Fund's fiscal year end was changed from March 31 to April 30.
(b) In addition to the fees and expenses which the Fund bears directly, the Fund indirectly bears a pro rata share of the fees and expenses of the acquired funds in which it invests. Such indirect expenses are not included in the reported expense ratios.
(c) Annualized.
(d) Total net expenses include the impact of certain waivers/reimbursements made by the Investment Manager and certain of its affiliates, if applicable.
(e) The benefits derived from expense reductions had an impact of less than 0.01%.
The accompanying Notes to Financial Statements are an integral part of this statement.
Annual Report 2013
18
Columbia North Carolina Intermediate Municipal Bond Fund
Financial Highlights (continued)
| | | Year Ended April 30, | | Year Ended March 31, | |
Class B | | 2013 | | 2012(a) | | 2012 | | 2011 | | 2010 | | 2009 | |
Per share data | |
Net asset value, beginning of period | | $ | 10.84 | | | $ | 10.74 | | | $ | 10.13 | | | $ | 10.17 | | | $ | 9.79 | | | $ | 10.08 | | |
Income from investment operations: | |
Net investment income | | | 0.20 | | | | 0.02 | | | | 0.22 | | | | 0.23 | | | | 0.26 | | | | 0.30 | | |
Net realized and unrealized gain (loss) | | | 0.10 | | | | 0.10 | | | | 0.59 | | | | (0.04 | ) | | | 0.38 | | | | (0.29 | ) | |
Total from investment operations | | | 0.30 | | | | 0.12 | | | | 0.81 | | | | 0.19 | | | | 0.64 | | | | 0.01 | | |
Less distributions to shareholders: | |
Net investment income | | | (0.20 | ) | | | (0.02 | ) | | | (0.20 | ) | | | (0.23 | ) | | | (0.26 | ) | | | (0.30 | ) | |
Total distributions to shareholders | | | (0.20 | ) | | | (0.02 | ) | | | (0.20 | ) | | | (0.23 | ) | | | (0.26 | ) | | | (0.30 | ) | |
Net asset value, end of period | | $ | 10.94 | | | $ | 10.84 | | | $ | 10.74 | | | $ | 10.13 | | | $ | 10.17 | | | $ | 9.79 | | |
Total return | | | 2.80 | % | | | 1.09 | % | | | 8.07 | % | | | 1.85 | % | | | 6.55 | % | | | 0.13 | % | |
Ratios to average net assets(b) | |
Total gross expenses | | | 1.72 | % | | | 1.71 | %(c) | | | 1.82 | % | | | 1.69 | % | | | 1.66 | % | | | 1.64 | % | |
Total net expenses(d) | | | 1.55 | % | | | 1.54 | %(c) | | | 1.55 | % | | | 1.55 | %(e) | | | 1.53 | %(e) | | | 1.50 | %(e) | |
Net investment income | | | 1.85 | % | | | 1.90 | %(c) | | | 2.08 | % | | | 2.22 | % | | | 2.56 | % | | | 3.04 | % | |
Supplemental data | |
Net assets, end of period (in thousands) | | $ | 139 | | | $ | 185 | | | $ | 183 | | | $ | 554 | | | $ | 1,260 | | | $ | 1,920 | | |
Portfolio turnover | | | 10 | % | | | 1 | % | | | 4 | % | | | 16 | % | | | 15 | % | | | 20 | % | |
Notes to Financial Highlights
(a) For the period from April 1, 2012 to April 30, 2012. During the period, the Fund's fiscal year end was changed from March 31 to April 30.
(b) In addition to the fees and expenses which the Fund bears directly, the Fund indirectly bears a pro rata share of the fees and expenses of the acquired funds in which it invests. Such indirect expenses are not included in the reported expense ratios.
(c) Annualized.
(d) Total net expenses include the impact of certain waivers/reimbursements made by the Investment Manager and certain of its affiliates, if applicable.
(e) The benefits derived from expense reductions had an impact of less than 0.01%.
The accompanying Notes to Financial Statements are an integral part of this statement.
Annual Report 2013
19
Columbia North Carolina Intermediate Municipal Bond Fund
Financial Highlights (continued)
| | | Year Ended April 30, | | Year Ended March 31, | |
Class C | | 2013 | | 2012(a) | | 2012 | | 2011 | | 2010 | | 2009 | |
Per share data | |
Net asset value, beginning of period | | $ | 10.83 | | | $ | 10.74 | | | $ | 10.13 | | | $ | 10.17 | | | $ | 9.79 | | | $ | 10.08 | | |
Income from investment operations: | |
Net investment income | | | 0.20 | | | | 0.02 | | | | 0.21 | | | | 0.23 | | | | 0.26 | | | | 0.30 | | |
Net realized and unrealized gain (loss) | | | 0.11 | | | | 0.09 | | | | 0.62 | | | | (0.04 | ) | | | 0.38 | | | | (0.29 | ) | |
Total from investment operations | | | 0.31 | | | | 0.11 | | | | 0.83 | | | | 0.19 | | | | 0.64 | | | | 0.01 | | |
Less distributions to shareholders: | |
Net investment income | | | (0.20 | ) | | | (0.02 | ) | | | (0.22 | ) | | | (0.23 | ) | | | (0.26 | ) | | | (0.30 | ) | |
Total distributions to shareholders | | | (0.20 | ) | | | (0.02 | ) | | | (0.22 | ) | | | (0.23 | ) | | | (0.26 | ) | | | (0.30 | ) | |
Net asset value, end of period | | $ | 10.94 | | | $ | 10.83 | | | $ | 10.74 | | | $ | 10.13 | | | $ | 10.17 | | | $ | 9.79 | | |
Total return | | | 2.89 | % | | | 0.99 | % | | | 8.23 | % | | | 1.84 | % | | | 6.55 | % | | | 0.12 | % | |
Ratios to average net assets(b) | |
Total gross expenses | | | 1.72 | % | | | 1.71 | %(c) | | | 1.74 | % | | | 1.69 | % | | | 1.66 | % | | | 1.64 | % | |
Total net expenses(d) | | | 1.55 | % | | | 1.54 | %(c) | | | 1.54 | % | | | 1.55 | %(e) | | | 1.53 | %(e) | | | 1.50 | %(e) | |
Net investment income | | | 1.84 | % | | | 1.90 | %(c) | | | 2.03 | % | | | 2.22 | % | | | 2.54 | % | | | 3.04 | % | |
Supplemental data | |
Net assets, end of period (in thousands) | | $ | 8,683 | | | $ | 8,222 | | | $ | 8,112 | | | $ | 5,270 | | | $ | 3,797 | | | $ | 3,672 | | |
Portfolio turnover | | | 10 | % | | | 1 | % | | | 4 | % | | | 16 | % | | | 15 | % | | | 20 | % | |
Notes to Financial Highlights
(a) For the period from April 1, 2012 to April 30, 2012. During the period, the Fund's fiscal year end was changed from March 31 to April 30.
(b) In addition to the fees and expenses which the Fund bears directly, the Fund indirectly bears a pro rata share of the fees and expenses of the acquired funds in which it invests. Such indirect expenses are not included in the reported expense ratios.
(c) Annualized.
(d) Total net expenses include the impact of certain waivers/reimbursements made by the Investment Manager and certain of its affiliates, if applicable.
(e) The benefits derived from expense reductions had an impact of less than 0.01%.
The accompanying Notes to Financial Statements are an integral part of this statement.
Annual Report 2013
20
Columbia North Carolina Intermediate Municipal Bond Fund
Financial Highlights (continued)
Class R4 | | Year Ended
April 30,
2013(a) | |
Per share data | |
Net asset value, beginning of period | | $ | 10.85 | | |
Income from investment operations: | |
Net investment income | | | 0.04 | | |
Net realized and unrealized gain | | | 0.08 | | |
Total from investment operations | | | 0.12 | | |
Less distributions to shareholders: | |
Net investment income | | | (0.04 | ) | |
Total distributions to shareholders | | | (0.04 | ) | |
Net asset value, end of period | | $ | 10.93 | | |
Total return | | | 1.07 | % | |
Ratios to average net assets(b) | |
Total gross expenses | | | 0.60 | %(c) | |
Total net expenses(d) | | | 0.52 | %(c) | |
Net investment income | | | 2.98 | %(c) | |
Supplemental data | |
Net assets, end of period (in thousands) | | $ | 3 | | |
Portfolio turnover | | | 10 | % | |
Notes to Financial Highlights
(a) For the period from March 19, 2013 (commencement of operations) to April 30, 2013.
(b) In addition to the fees and expenses which the Fund bears directly, the Fund indirectly bears a pro rata share of the fees and expenses of the acquired funds in which it invests. Such indirect expenses are not included in the reported expense ratios.
(c) Annualized.
(d) Total net expenses include the impact of certain waivers/reimbursements made by the Investment Manager and certain of its affiliates, if applicable.
The accompanying Notes to Financial Statements are an integral part of this statement.
Annual Report 2013
21
Columbia North Carolina Intermediate Municipal Bond Fund
Financial Highlights (continued)
| | | Year Ended April 30, | | Year Ended March 31, | |
Class Z | | 2013 | | 2012(a) | | 2012 | | 2011 | | 2010 | | 2009 | |
Per share data | |
Net asset value, beginning of period | | $ | 10.83 | | | $ | 10.73 | | | $ | 10.12 | | | $ | 10.17 | | | $ | 9.79 | | | $ | 10.07 | | |
Income from investment operations: | |
Net investment income | | | 0.31 | | | | 0.03 | | | | 0.32 | | | | 0.33 | | | | 0.36 | | | | 0.40 | | |
Net realized and unrealized gain (loss) | | | 0.10 | | | | 0.10 | | | | 0.61 | | | | (0.05 | ) | | | 0.38 | | | | (0.28 | ) | |
Total from investment operations | | | 0.41 | | | | 0.13 | | | | 0.93 | | | | 0.28 | | | | 0.74 | | | | 0.12 | | |
Less distributions to shareholders: | |
Net investment income | | | (0.31 | ) | | | (0.03 | ) | | | (0.32 | ) | | | (0.33 | ) | | | (0.36 | ) | | | (0.40 | ) | |
Total distributions to shareholders | | | (0.31 | ) | | | (0.03 | ) | | | (0.32 | ) | | | (0.33 | ) | | | (0.36 | ) | | | (0.40 | ) | |
Net asset value, end of period | | $ | 10.93 | | | $ | 10.83 | | | $ | 10.73 | | | $ | 10.12 | | | $ | 10.17 | | | $ | 9.79 | | |
Total return | | | 3.83 | % | | | 1.17 | % | | | 9.30 | % | | | 2.76 | % | | | 7.61 | % | | | 1.22 | % | |
Ratios to average net assets(b) | |
Total gross expenses | | | 0.72 | % | | | 0.71 | %(c) | | | 0.74 | % | | | 0.69 | % | | | 0.66 | % | | | 0.64 | % | |
Total net expenses(d) | | | 0.55 | % | | | 0.54 | %(c) | | | 0.54 | % | | | 0.55 | %(e) | | | 0.53 | %(e) | | | 0.50 | %(e) | |
Net investment income | | | 2.84 | % | | | 2.90 | %(c) | | | 3.05 | % | | | 3.22 | % | | | 3.54 | % | | | 4.03 | % | |
Supplemental data | |
Net assets, end of period (in thousands) | | $ | 165,833 | | | $ | 178,425 | | | $ | 178,204 | | | $ | 160,427 | | | $ | 172,795 | | | $ | 163,885 | | |
Portfolio turnover | | | 10 | % | | | 1 | % | | | 4 | % | | | 16 | % | | | 15 | % | | | 20 | % | |
Notes to Financial Highlights
(a) For the period from April 1, 2012 to April 30, 2012. During the period, the Fund's fiscal year end was changed from March 31 to April 30.
(b) In addition to the fees and expenses which the Fund bears directly, the Fund indirectly bears a pro rata share of the fees and expenses of the acquired funds in which it invests. Such indirect expenses are not included in the reported expense ratios.
(c) Annualized.
(d) Total net expenses include the impact of certain waivers/reimbursements made by the Investment Manager and certain of its affiliates, if applicable.
(e) The benefits derived from expense reductions had an impact of less than 0.01%.
The accompanying Notes to Financial Statements are an integral part of this statement.
Annual Report 2013
22
Columbia North Carolina Intermediate Municipal Bond Fund
Notes to Financial Statements
April 30, 2013
Note 1. Organization
Columbia North Carolina Intermediate Municipal Bond Fund (the Fund), a series of Columbia Funds Series Trust (the Trust), is a diversified fund. The Trust is registered under the Investment Company Act of 1940, as amended (the 1940 Act), as an open-end management investment company organized as a Delaware statutory trust.
Fund Shares
The Trust may issue an unlimited number of shares (without par value). The Fund offers Class A, Class B, Class C, Class R4 and Class Z shares. All share classes have identical voting, dividend and liquidation rights. Each share class has its own expense structure and sales charges, as applicable.
Class A shares are subject to a maximum front-end sales charge of 3.25% based on the initial investment amount. Class A shares purchased without an initial sales charge in accounts aggregating $1 million to $50 million at the time of purchase are subject to a contingent deferred sales charge (CDSC) if the shares are sold within 18 months of purchase, charged as follows: 1.00% CDSC if redeemed within 12 months of purchase, and 0.50% CDSC if redeemed more than 12, but less than 18, months after purchase.
Class B shares may be subject to a maximum CDSC of 3.00% based upon the holding period after purchase. Class B shares will generally convert to Class A shares eight years after purchase. The Fund no longer accepts investments by new or existing investors in the Fund's Class B shares, except in connection with the reinvestment of any dividend and/or capital gain distributions in Class B shares of the Fund and exchanges by existing Class B shareholders of certain other funds within the Columbia Family of Funds.
Class C shares are subject to a 1.00% CDSC on shares redeemed within one year of purchase.
Class R4 shares are not subject to sales charges and are generally available only to omnibus retirement plans and certain other eligible investors. Class R4 shares commenced operations on March 19, 2013.
Class Z shares are not subject to sales charges, and are available only to certain investors.
Note 2. Summary of Significant Accounting Policies
Use of Estimates
The preparation of financial statements in accordance with U.S. generally accepted accounting principles (GAAP) requires management to make certain estimates and assumptions that affect the reported amounts of assets and liabilities, the disclosure of contingent assets and liabilities at the date of the financial statements and the reported amounts
of revenue and expenses during the reporting period. Actual results could differ from those estimates.
The following is a summary of significant accounting policies consistently followed by the Fund in the preparation of its financial statements.
Security Valuation
Debt securities generally are valued by pricing services approved by the Board of Trustees (the Board) based upon market transactions for normal, institutional-size trading units of similar securities. The services may use various pricing techniques which take into account appropriate factors such as yield, quality, coupon rate, maturity, type of issue, trading characteristics and other data, as well as broker quotes. Debt securities for which quotations are readily available may also be valued based upon an over-the-counter or exchange bid quotation.
Investments in other open-end investment companies, including money market funds, are valued at net asset value.
Investments for which market quotations are not readily available, or that have quotations which management believes are not reliable, are valued at fair value as determined in good faith under consistently applied procedures established by and under the general supervision of the Board. If a security or class of securities (such as foreign securities) is valued at fair value, such value is likely to be different from the last quoted market price for the security.
The determination of fair value often requires significant judgment. To determine fair value, management may use assumptions including but not limited to future cash flows and estimated risk premiums. Multiple inputs from various sources may be used to determine fair value.
Delayed Delivery Securities
The Fund may trade securities on other than normal settlement terms, including securities purchased or sold on a "when-issued" basis. This may increase the risk if the other party to the transaction fails to deliver and causes the Fund to subsequently invest at less advantageous prices. The Fund designates cash or liquid securities in an amount equal to the delayed delivery commitment.
Security Transactions
Security transactions are accounted for on the trade date. Cost is determined and gains (losses) are based upon the specific identification method for both financial statement and federal income tax purposes.
Income Recognition
Interest income is recorded on an accrual basis. Market premiums and discounts, including original issue discounts, are amortized and accreted, respectively, over the expected life of the security on all debt securities, unless otherwise noted.
Annual Report 2013
23
Columbia North Carolina Intermediate Municipal Bond Fund
Notes to Financial Statements (continued)
April 30, 2013
Dividend income is recorded on the ex-dividend date.
Expenses
General expenses of the Trust are allocated to the Fund and other funds of the Trust based upon relative net assets or other expense allocation methodologies determined by the nature of the expense. Expenses directly attributable to the Fund are charged to the Fund. Expenses directly attributable to a specific class of shares are charged to that share class.
Determination of Class Net Asset Value
All income, expenses (other than class-specific expenses, which are charged to that share class, as shown in the Statement of Operations) and realized and unrealized gains (losses) are allocated to each class of the Fund on a daily basis, based on the relative net assets of each class, for purposes of determining the net asset value of each class.
Federal Income Tax Status
The Fund intends to qualify each year as a regulated investment company under Subchapter M of the Internal Revenue Code, as amended, and will distribute substantially all of its tax exempt and taxable income (including net short-term capital gains), if any, for its tax year, and as such will not be subject to federal income taxes. In addition, the Fund intends to distribute in each calendar year substantially all of its net investment income, capital gains and certain other amounts, if any, such that the Fund should not be subject to federal excise tax. Therefore, no federal income or excise tax provision is recorded.
Distributions to Shareholders
Distributions from net investment income, if any, are declared daily and paid monthly. Net realized capital gains, if any, are distributed at least annually. Income distributions and capital gain distributions are determined in accordance with federal income tax regulations, which may differ from GAAP.
Guarantees and Indemnifications
Under the Trust's organizational documents and, in some cases, by contract, its officers and trustees are indemnified against certain liabilities arising out of the performance of their duties to the Trust or its funds. In addition, certain of the Fund's contracts with its service providers contain general indemnification clauses. The Fund's maximum exposure under these arrangements is unknown since the amount of any future claims that may be made against the Fund cannot be determined, and the Fund has no historical basis for predicting the likelihood of any such claims.
Recent Accounting Pronouncement
Disclosures about Offsetting Assets and Liabilities
In December 2011, the Financial Accounting Standards Board (FASB) issued Accounting Standards Update
(ASU) No. 2011-11, Disclosures about Offsetting Assets and Liabilities and in January 2013, ASU No. 2013-1, Clarifying the Scope of Disclosures about Offsetting Assets and Liabilities (collectively, the ASUs). Specifically, the ASUs require an entity to disclose both gross and net information for derivatives and other financial instruments that are subject to a master netting arrangement or similar agreement. The ASUs require disclosure of collateral received in connection with the master netting agreements or similar agreements. The disclosure requirements are effective for interim and annual periods beginning on or after January 1, 2013. At this time, management is evaluating the implications of this guidance and the impact it will have on the financial statement amounts and footnote disclosures, if any.
Note 3. Fees and Compensation Paid to Affiliates
Investment Management Fees
Under an Investment Management Services Agreement, Columbia Management Investment Advisers, LLC (the Investment Manager), a wholly-owned subsidiary of Ameriprise Financial, Inc. (Ameriprise Financial), determines which securities will be purchased, held or sold. The investment management fee is an annual fee that is equal to a percentage of the Fund's average daily net assets that declines from 0.40% to 0.27% as the Fund's net assets increase. The effective investment management fee rate for the year ended April 30, 2013 was 0.40% of the Fund's average daily net assets.
Administration Fees
Under an Administrative Services Agreement, the Investment Manager also serves as the Fund Administrator. The Fund pays the Fund Administrator an annual fee for administration and accounting services equal to a percentage of the Fund's average daily net assets that declines from 0.07% to 0.04% as the Fund's net assets increase. The effective administration fee rate for the year ended April 30, 2013 was 0.07% of the Fund's average daily net assets.
Other Expenses
Other expenses are for, among other things, certain expenses of the Fund or the Board, including: Fund boardroom and office expense, employee compensation, employee health and retirement benefits, and certain other expenses. Payment of these Fund and Board expenses is facilitated by a company providing limited administrative services to the Fund and the Board. For the year ended April 30, 2013, other expenses paid to this company were $1,697.
Compensation of Board Members
Board members are compensated for their services to the Fund as disclosed in the Statement of Operations. Under a Deferred
Annual Report 2013
24
Columbia North Carolina Intermediate Municipal Bond Fund
Notes to Financial Statements (continued)
April 30, 2013
Compensation Plan (the Plan), the Board members who are not "interested persons" of the Fund, as defined under the 1940 Act, may elect to defer payment of up to 100% of their compensation. Deferred amounts are treated as though equivalent dollar amounts had been invested in shares of certain funds managed by the Investment Manager. The Fund's liability for these amounts is adjusted for market value changes and remains in the Fund until distributed in accordance with the Plan.
Transfer Agent Fees
Under a Transfer and Dividend Disbursing Agent Agreement, Columbia Management Investment Services Corp. (the Transfer Agent), an affiliate of the Investment Manager and a wholly-owned subsidiary of Ameriprise Financial, is responsible for providing transfer agency services to the Fund. The Transfer Agent has contracted with Boston Financial Data Services (BFDS) to serve as sub-transfer agent.
The Transfer Agent receives monthly account-based service fees based on the number of open accounts and also receives sub-transfer agency fees based on a percentage of the average aggregate value of the Fund's shares maintained in omnibus accounts (other than omnibus accounts for which American Enterprise Investment Services Inc. is the broker of record or accounts where the beneficial shareholder is a customer of Ameriprise Financial Services, Inc., which are paid a per account fee). The Transfer Agent pays the fees of BFDS for services as sub-transfer agent and is not entitled to reimbursement for such fees from the Fund (with the exception of out-of-pocket fees).
The Transfer Agent also receives compensation from fees for various shareholder services and reimbursements for certain out-of-pocket fees.
For the year ended April 30, 2013, the Fund's effective transfer agent fee rates as a percentage of average daily net assets of each class were as follows:
Class A | | | 0.20 | % | |
Class B | | | 0.20 | | |
Class C | | | 0.20 | | |
Class R4* | | | 0.10 | | |
Class Z | | | 0.20 | | |
*Annualized
An annual minimum account balance fee of $20 may apply to certain accounts with a value below the Fund's initial minimum investment requirements to reduce the impact of small accounts on transfer agent fees. These minimum account balance fees are recorded as part of expense reductions in the Statement of Operations. For the year ended April 30, 2013, no minimum account balance fees were charged by the Fund.
Distribution and Service Fees
The Fund has an agreement with Columbia Management Investment Distributors, Inc. (the Distributor), an affiliate of the Investment Manager and a wholly-owned subsidiary of Ameriprise Financial, for distribution and shareholder services. Pursuant to Rule 12b-1 under the 1940 Act, the Board has approved, and the Fund has adopted, distribution and shareholder service plans (the Plans) which set the distribution and service fees for the Fund. These fees are calculated daily and are intended to compensate the Distributor and/or eligible selling and/or servicing agents for selling shares of the Fund and providing services to investors.
The Plans require the payment of a monthly combined distribution and service fee to the Distributor at the maximum annual rate of 0.25% of the average daily net assets attributable to Class A shares of the Fund. The Plans also require the payment of a monthly service fee at the maximum annual rate of 0.25% of the average daily net assets attributable to Class B and Class C shares of the Fund and the payment of a monthly distribution fee at the maximum annual rate of 0.75% of the average daily net assets attributable to Class B and Class C shares of the Fund.
Sales Charges
Sales charges, including front-end charges and CDSCs, received by the Distributor for distributing Fund shares were $29,452 for Class A and $1,021 for Class C shares for the year ended April 30, 2013.
Expenses Waived/Reimbursed by the Investment Manager and its Affiliates
The Investment Manager and certain of its affiliates have contractually agreed to waive fees and/or reimburse expenses (excluding certain fees and expenses described below) for the periods disclosed below, unless sooner terminated at the sole discretion of the Board, so that the Fund's net operating expenses, after giving effect to fees waived/expenses reimbursed and any balance credits and/or overdraft charges from the Fund's custodian, do not exceed the following annual rates as a percentage of the class' average daily net assets:
| | | August 1, 2012
through
August 31, 2013 | | Prior to
August 1, 2012 | |
Class A | | | 0.81 | % | | | 0.79 | % | |
Class B | | | 1.56 | | | | 1.54 | | |
Class C | | | 1.56 | | | | 1.54 | | |
Class R4 | | | 0.56 | * | | | — | | |
Class Z | | | 0.56 | | | | 0.54 | | |
*Annual rate is contractual from March 19, 2013 (the commencement of operations of Class R4 shares) through February 28, 2014.
Annual Report 2013
25
Columbia North Carolina Intermediate Municipal Bond Fund
Notes to Financial Statements (continued)
April 30, 2013
Under the agreement governing these fee waivers and/or expense reimbursement arrangements, the following fees and expenses are excluded from the waiver/reimbursement commitment, and therefore will be paid by the Fund, if applicable: taxes (including foreign transaction taxes), expenses associated with investments in affiliated and non-affiliated pooled investment vehicles (including mutual funds and exchange traded funds), transaction costs and brokerage commissions, costs related to any securities lending program, dividend expenses associated with securities sold short, inverse floater program fees and expenses, transaction charges and interest on borrowed money, interest, extraordinary expenses and any other expenses the exclusion of which is specifically approved by the Board. This agreement may be modified or amended only with approval from all parties.
Note 4. Federal Tax Information
The timing and character of income and capital gain distributions are determined in accordance with income tax regulations, which may differ from GAAP because of temporary or permanent book to tax differences.
At April 30, 2013, these differences are primarily due to differing treatment for tax straddles, capital loss carryforwards and Trustees' deferred compensation. To the extent these differences are permanent, reclassifications are made among the components of the Fund's net assets in the Statement of Assets and Liabilities. Temporary differences do not require reclassifications.
The Fund did not have any permanent differences; therefore, no reclassifications were made to the Statement of Assets and Liabilities.
The tax character of distributions paid during the periods indicated was as follows:
| | Year Ended
April 30,
2013 | | Period Ended
April 30,
2012 | | Year Ended
March 31,
2012 | |
Ordinary income | | $ | 15,423 | | | $ | 1,416 | | | $ | 14,625 | | |
Tax-exempt income | | | 6,059,713 | | | | 508,356 | | | | 6,111,074 | | |
Total | | $ | 6,075,136 | | | $ | 509,772 | | | $ | 6,125,699 | | |
Short-term capital gain distributions, if any, are considered ordinary income distributions for tax purposes.
At April 30, 2013, the components of distributable earnings on a tax basis were as follows:
Undistributed tax-exempt income | | $ | 1,287,127 | | |
Accumulated realized loss | | | (2,649,648 | ) | |
Unrealized appreciation | | | 18,750,110 | | |
At April 30, 2013, the cost of investments for federal income tax purposes was $189,070,547 and the aggregate gross
unrealized appreciation and depreciation based on that cost was:
Unrealized appreciation | | $ | 18,767,963 | | |
Unrealized depreciation | | | (17,853 | ) | |
Net unrealized appreciation | | $ | 18,750,110 | | |
The following capital loss carryforward, determined at April 30, 2013, may be available to reduce taxable income arising from future net realized gains on investments, if any, to the extent permitted by the Internal Revenue Code:
Year of Expiration | | Amount | |
2017 | | $ | 2,649,648 | | |
For the year ended April 30, 2013, $684,349 of capital loss carryforward was utilized.
Management of the Fund has concluded that there are no significant uncertain tax positions that would require recognition in the financial statements. However, management's conclusion may be subject to review and adjustment at a later date based on factors including, but not limited to, new tax laws, regulations, and administrative interpretations (including relevant court decisions). Generally, the Fund's federal tax returns for the prior three fiscal years remain subject to examination by the Internal Revenue Service.
Note 5. Portfolio Information
The cost of purchases and proceeds from sales of securities, excluding short-term obligations, aggregated to $21,005,079 and $34,449,564, respectively, for the year ended April 30, 2013.
Note 6. Shareholder Concentration
At April 30, 2013, one unaffiliated shareholder account owned 72.9% of the outstanding shares of the Fund. The Fund has no knowledge about whether any portion of those shares was owned beneficially by such account. Subscription and redemption activity by concentrated accounts may have a significant effect on the operations of the Fund.
Note 7. Line of Credit
The Fund has entered into a revolving credit facility with a syndicate of banks led by JPMorgan Chase Bank N.A. whereby the Fund may borrow for the temporary funding of shareholder redemptions or for other temporary or emergency purposes. The credit facility agreement, as amended, which is a collective agreement between the Fund and certain other funds managed by the Investment Manager, severally and not jointly, permits collective borrowings up to $500 million. Interest is charged to each participating fund based on its borrowings at a rate equal to the higher of (i) the overnight federal funds rate plus 1.00% or (ii) the one-month LIBOR
Annual Report 2013
26
Columbia North Carolina Intermediate Municipal Bond Fund
Notes to Financial Statements (continued)
April 30, 2013
rate plus 1.00%. Each borrowing under the credit facility matures no later than 60 days after the date of borrowing. The Fund also pays a commitment fee equal to its pro rata share of the amount of the credit facility at a rate of 0.08% per annum.
The Fund had no borrowings during the year ended April 30, 2013.
Note 8. Significant Risks
Geographic Concentration Risk
Because state-specific tax-exempt funds invest primarily in the municipal securities issued by the state and political sub-divisions of the state, the Fund will be particularly affected by political and economic conditions and developments in the state in which it invests. The Fund may, therefore, have a greater risk than that of a municipal bond fund which is more geographically diversified. The value of the municipal securities owned by the Fund also may be adversely affected by future changes in federal or state income tax laws.
Note 9. Subsequent Events
Management has evaluated the events and transactions that have occurred through the date the financial statements were issued and noted no items requiring adjustment of the financial statements or additional disclosure.
Note 10. Information Regarding Pending and Settled Legal Proceedings
In December 2005, without admitting or denying the allegations, American Express Financial Corporation (AEFC, which is now known as Ameriprise Financial, Inc. (Ameriprise Financial)) entered into settlement agreements with the Securities and Exchange Commission (SEC) and Minnesota Department of Commerce (MDOC) related to market timing activities. As a result, AEFC was censured and ordered to cease and desist from committing or causing any violations of certain provisions of the Investment Advisers Act of 1940, the Investment Company Act of 1940, and various Minnesota laws. AEFC agreed to pay disgorgement of $10 million and civil money penalties of $7 million. AEFC also agreed to retain an independent distribution consultant to assist in developing a plan for distribution of all disgorgement and civil penalties ordered by the SEC in accordance with various undertakings detailed at www.sec.gov/litigation/admin/ia-2451.pdf. Ameriprise Financial and its affiliates have cooperated with the SEC and the MDOC in these legal proceedings, and have made regular reports to the funds' Boards of Trustees.
Ameriprise Financial and certain of its affiliates have historically been involved in a number of legal, arbitration and regulatory proceedings, including routine litigation, class actions, and governmental actions, concerning matters arising in connection with the conduct of their business activities.
Ameriprise Financial believes that the Funds are not currently the subject of, and that neither Ameriprise Financial nor any of its affiliates are the subject of, any pending legal, arbitration or regulatory proceedings that are likely to have a material adverse effect on the Funds or the ability of Ameriprise Financial or its affiliates to perform under their contracts with the Funds. Ameriprise Financial is required to make 10-Q, 10-K and, as necessary, 8-K filings with the Securities and Exchange Commission on legal and regulatory matters that relate to Ameriprise Financial and its affiliates. Copies of these filings may be obtained by accessing the SEC website at www.sec.gov.
There can be no assurance that these matters, or the adverse publicity associated with them, will not result in increased fund redemptions, reduced sale of fund shares or other adverse consequences to the Funds. Further, although we believe proceedings are not likely to have a material adverse effect on the Funds or the ability of Ameriprise Financial or its affiliates to perform under their contracts with the Funds, these proceedings are subject to uncertainties and, as such, we are unable to estimate the possible loss or range of loss that may result. An adverse outcome in one or more of these proceedings could result in adverse judgments, settlements, fines, penalties or other relief that could have a material adverse effect on the consolidated financial condition or results of operations of Ameriprise Financial.
Annual Report 2013
27
Columbia North Carolina Intermediate Municipal Bond Fund
Report of Independent Registered Public Accounting Firm
To the Trustees of Columbia Funds Series Trust and the Shareholders of
Columbia North Carolina Intermediate Municipal Bond Fund
In our opinion, the accompanying statement of assets and liabilities, including the portfolio of investments, and the related statements of operations and of changes in net assets and the financial highlights present fairly, in all material respects, the financial position of Columbia North Carolina Intermediate Municipal Bond Fund (the "Fund") (a series of Columbia Funds Series Trust) at April 30, 2013, the results of its operations, the changes in its net assets and the financial highlights for the periods indicated, in conformity with accounting principles generally accepted in the United States of America. These financial statements and financial highlights (hereafter referred to as "financial statements") are the responsibility of the Fund's management. Our responsibility is to express an opinion on these financial statements based on our audits. We conducted our audits of these financial statements in accordance with the standards of the Public Company Accounting Oversight Board (United States). Those standards require that we plan and perform the audit to obtain reasonable assurance about whether the financial statements are free of material misstatement. An audit includes examining, on a test basis, evidence supporting the amounts and disclosures in the financial statements, assessing the accounting principles used and significant estimates made by management, and evaluating the overall financial statement presentation. We believe that our audits, which included confirmation of securities at April 30, 2013 by correspondence with the custodian and brokers, provide a reasonable basis for our opinion.
PricewaterhouseCoopers LLP
Minneapolis, Minnesota
June 21, 2013
Annual Report 2013
28
Columbia North Carolina Intermediate Municipal Bond Fund
Federal Income Tax Information
(Unaudited)
The Fund hereby designates the following tax attributes for the fiscal year ended April 30, 2013. Shareholders will be notified in early 2014 of amounts for use in preparing 2013 income tax returns.
Tax Designations:
| Exempt-Interest Dividends | | | 99.75 | % | |
Exempt-Interest Dividends. The percentage of net investment income dividends paid during the fiscal year that qualifies as exempt-interest dividends for federal income tax purposes.
Annual Report 2013
29
Columbia North Carolina Intermediate Municipal Bond Fund
Shareholders elect the Board that oversees the funds' operations. The Board appoints officers who are responsible for day-to-day business decisions based on policies set by the Board. The following table provides basic biographical information about the funds' Board members, including their principal occupations during the past five years, although specific titles for individuals may have varied over the period. Under current Board policy, members may serve until the next Board meeting after he or she reaches the mandatory retirement age established by the Board, or the fifteenth anniversary of the first Board meeting they attended as a member of the Board.
Mr. Edward J. Boudreau, Jr., Mr. William P. Carmichael, Mr. William A. Hawkins, Mr. R. Glenn Hilliard, Ms. Minor M. Shaw and Dr. Anthony M. Santomero, were members of the Legacy Columbia Nations funds' Board ("Nations Funds"), which includes Columbia Funds Series Trust, Columbia Funds Variable Insurance Trust I and Columbia Funds Master Investment Trust, LLC and began service on the Board for the Legacy RiverSource funds ("RiverSource Funds") effective June 1, 2011.
Independent Trustees
Name,
Address,
Year of Birth | | Position Held With
Funds and Length of
Service | | Principal Occupation
During Past Five Years | | Number of
Funds in the
Fund Family
Overseen by
Board Member | | Other Present or Past
Directorships/Trusteeships
(Within Past 5 Years)
| |
Kathleen Blatz
901 S. Marquette Ave.
Minneapolis, MN 55402
1954 | | Board member since 1/06 for RiverSource Funds and since 6/11 for Nations Funds | | Attorney; Chief Justice, Minnesota Supreme Court, 1998-2006 | | | 132 | | | Director, BlueCross BlueShield of Minnesota since 2009 | |
Edward J. Boudreau, Jr.
901 S. Marquette Ave.
Minneapolis, MN 55402
1944 | | Board member since 6/11 for RiverSource Funds and since 1/05 for Nations Funds | | Managing Director, E.J. Boudreau & Associates (consulting) since 2000 | | | 130 | | | Former Trustee, BofA Funds Series Trust (11 funds) | |
Pamela G. Carlton
901 S. Marquette Ave.
Minneapolis, MN 55402
1954 | | Board member since 7/07 for RiverSource Funds and since 6/11 for Nations Funds | | President, Springboard — Partners in Cross Cultural Leadership (consulting company) since 2003 | | | 132 | | | None | |
William P. Carmichael
901 S. Marquette Ave.
Minneapolis, MN 55402
1943 | | Board member since 6/11 for RiverSource Funds and since 1999 for Nations Funds | | Retired | | | 130 | | | Director, Cobra Electronics
Corporation (electronic equipment manufacturer); The Finish Line (athletic shoes and apparel) since July 2003; McMoRan Exploration Company (oil and gas exploration and development) since 2010; former Trustee, BofA Funds Series Trust (11 funds); former Director, Spectrum Brands, Inc. (consumer products); former Director, Simmons Company (bedding) | |
Patricia M. Flynn
901 S. Marquette Ave.
Minneapolis, MN 55402
1950 | | Board member since 11/04 for RiverSource Funds and since 6/11 for Nations Funds | | Trustee Professor of Economics and Management, Bentley University since 1976 | | | 132 | | | None | |
William A. Hawkins
901 S. Marquette Ave.
Minneapolis, MN 55402
1942 | | Board member since 6/11 for RiverSource Funds and since 1/05 for Nations Funds | | Managing Director, Overton Partners (financial consulting), since August 2010; President and Chief Executive Officer, California General Bank, N.A., January 2008-August 2010 | | | 130 | | | Trustee, BofA Funds Series Trust (11 funds) | |
Annual Report 2013
30
Columbia North Carolina Intermediate Municipal Bond Fund
Trustees and Officers (continued)
Independent Trustees (continued)
Name,
Address,
Year of Birth | | Position Held With
Funds and Length of
Service | | Principal Occupation
During Past Five Years | | Number of
Funds in the
Fund Family
Overseen by
Board Member | | Other Present or Past
Directorships/Trusteeships
(Within Past 5 Years)
| |
R. Glenn Hilliard
901 S. Marquette Ave.
Minneapolis, MN 55402
1943 | | Board member since 6/11 for RiverSource Funds and since 1/05 for Nations Funds | | Chairman and Chief Executive Officer, Hilliard Group LLC (investing and consulting), since April 2003; Non-Executive Director & Chairman, CNO Financial Group, Inc. (insurance), September 2003-May 2011 | | | 130 | | | Chairman, BofA Fund Series Trust (11 funds); former Director, CNO Financial Group, Inc. (insurance) | |
Stephen R. Lewis, Jr.
901 S. Marquette Ave.
Minneapolis, MN 55402
1939 | | Chair of the Board for RiverSource Funds since 1/07, Board member for RiverSource Funds since 1/02 and since 6/11 for Nations Funds | | President Emeritus and Professor of Economics Emeritus, Carleton College since 2002 | | | 132 | | | Director, Valmont Industries, Inc. (manufacturer of irrigation systems) since 2002 | |
Catherine James Paglia
901 S. Marquette Ave.
Minneapolis, MN 55402
1952 | | Board member since 11/04 for RiverSource Funds and since 6/11 for Nations Funds | | Director, Enterprise Asset Management, Inc. (private real estate and asset management company) | | | 132 | | | Director, Valmont Industries, Inc. (manufacturer of irrigation systems) since 2012 | |
Leroy C. Richie
901 S. Marquette Ave.
Minneapolis, MN 55402
1941 | | Board member since 2000 for Legacy Seligman Funds, since 11/08 for RiverSource Funds and since 6/11 for Nations Funds | | Counsel, Lewis & Munday, P.C. (law firm) since 2004; former Vice President and General Counsel, Automotive Legal Affairs, Chrysler Corporation from 1983-1987 | | | 132 | | | Lead Outside Director, Digital Ally, Inc. (digital imaging) since September 2005; Director, Infinity, Inc. (oil and gas exploration and production) since 1994; Director, OGE Energy Corp. (energy and energy services) since November 2007 | |
Minor M. Shaw
901 S. Marquette Ave.
Minneapolis, MN 55402
1947 | | Board member since 6/11 for RiverSource Funds and since 2003 for Nations Funds | | President, Micco LLC (private investments) since 2011; President, Micco Corp. since 1998 | | | 130 | | | Director, Piedmont Natural Gas; Director, BlueCross BlueShield of South Carolina since April 2008; Former Trustee, BofA Funds Series Trust (11 funds) | |
Alison Taunton-Rigby
901 S. Marquette Ave.
Minneapolis, MN 55402
1944 | | Board member since 11/02 for RiverSource Funds and since 6/11 for Nations Funds | | Chief Executive Officer and Director, RiboNovix, Inc. (biotechnology), 2003-2010 | | | 132 | | | Director, Healthways, Inc. (health and well-being improvement) since 2005; Director, ICI Mutual Insurance Company, RRG since 2011; Director, Abt Associates (government contractor) since 2001; Director, Boston Children's Hospital since 2002 | |
Annual Report 2013
31
Columbia North Carolina Intermediate Municipal Bond Fund
Trustees and Officers (continued)
Interested Trustee Not Affiliated With Investment Manager*
Name,
Address,
Year of Birth | | Position Held With
Funds and Length of
Service | | Principal Occupation
During Past Five Years | | Number of
Funds in the
Fund Family
Overseen by
Board Member | | Other Present or Past
Directorships/Trusteeships
(Within Past 5 Years)
| |
Anthony M. Santomero
901 S. Marquette Ave.
Minneapolis, MN 55402
1946 | | Board member since 6/11 for RiverSource Funds and since 1/08 for Nations Funds | | Richard K. Mellon Professor Emeritus of Finance, The Wharton School, University of Pennsylvania, since 2002; Senior Advisor, McKinsey & Company (consulting), 2006-2008 | | | 130 | | | Director, Renaissance Reinsurance Ltd. since May 2008; Trustee, Penn Mutual Life Insurance Company since March 2008; Director, Citigroup since 2009; Director, Citibank, N.A. since 2009; former Trustee, BofA Funds Series Trust (11 funds) | |
*Dr. Santomero is not an affiliated person of the investment manager or Ameriprise Financial. However, he is currently deemed by the funds to be an "interested person" (as defined in the 1940 Act) of the funds because he serves as a Director of Citigroup, Inc. and Citibank N.A., companies that may directly or through subsidiaries and affiliates engage from time-to-time in brokerage execution, principal transactions and lending relationships with the funds or accounts advised/managed by the investment manager.
Interested Trustee Affiliated With Investment Manager*
Name,
Address,
Year of Birth | | Position Held With
Funds and Length of
Service | | Principal Occupation
During Past Five Years | | Number of
Funds in the
Fund Family
Overseen by
Board Member | | Other Present or Past
Directorships/Trusteeships
(Within Past 5 Years) | |
William F. Truscott
53600 Ameriprise
Financial Center
Minneapolis, MN 55474
1960 | | Board member since 11/01 for RiverSource Funds and since 6/11 for Nations Funds; Senior Vice President since 2002 for RiverSource Funds and 5/10 for Nations Funds | | President, Columbia Management Investment Advisers, LLC since February 2012, (previously President, Chairman of the Board and Chief Investment Officer, 2001-April 2010); Chief Executive Officer, Global Asset Management, Ameriprise Financial, Inc. since September 2012 (previously Chief Executive Officer, U.S. Asset Management & President, Annuities, May 2010-September 2012 and President — U.S. Asset Management and Chief Investment Officer, 2005-April 2010); Chief Executive Officer, Columbia Management Investment Distributors, Inc. since February 2012, (previously Chairman of the Board and Chief Executive Officer, 2006-April 2010); Chairman of the Board and Chief Executive Officer, RiverSource Distributors, Inc. since 2006; President and Chief Executive Officer, Ameriprise Certificate Company 2006-August 2012 | | | 184 | | | Chairman of the Board, Columbia Management Investment Advisers, LLC since May 2010; Director, Columbia Management Investment Distributors, Inc. since May 2010; Director, Ameriprise Certificate Company, 2006-January 2013 | |
*Interested person (as defined under the 1940 Act) by reason of being an officer, director, security holder and/or employee of the investment manager or Ameriprise Financial.
The SAI has additional information about the Fund's Board members and is available, without charge, upon request by calling 800.345.6611; contacting your financial intermediary; or visiting columbiamanagement.com.
Annual Report 2013
32
Columbia North Carolina Intermediate Municipal Bond Fund
Trustees and Officers (continued)
The Board has appointed officers who are responsible for day-to-day business decisions based on policies it has established. The officers serve at the pleasure of the Board. In addition to Mr. Truscott, who is Senior Vice President, the funds' other officers are:
Officers
Name,
Address,
Year of Birth | | Position Held With
Funds and Length of
Service | | Principal Occupation During Past Five Years | |
J. Kevin Connaughton
225 Franklin Street
Boston, MA 02110
1964 | | President and Principal Executive Officer since 5/10 for RiverSource Funds and 2009 for Nations Funds | | Senior Vice President and General Manager — Mutual Fund Products, Columbia Management Investment Advisers, LLC since May 2010; Managing Director of Columbia Management Advisors, LLC, December 2004-April 2010; Senior Vice President and Chief Financial Officer, Columbia Funds, June 2008-January 2009; Treasurer, Columbia Funds, October 2003-May 2008 | |
Amy K. Johnson
5228 Ameriprise
Financial Center Minneapolis, MN 55474
1965 | | Vice President since 12/06 for RiverSource Funds and 5/10 for Nations Funds | | Senior Vice President and Chief Operating Officer, Columbia Management Investment Advisers, LLC since May 2010 (previously Chief Administrative Officer, 2009-April 2010 and Vice President — Asset Management and Trust Company Services, 2006-2009) | |
Michael G. Clarke
225 Franklin Street
Boston, MA 02110
1969 | | Treasurer since 1/11 and Chief Financial Officer since 4/11 for RiverSource Funds and Treasurer since 3/11 and Chief Financial Officer since 2009 for Nations Funds | | Vice President, Columbia Management Investment Advisers, LLC since May 2010; Managing Director of Fund Administration, Columbia Management Advisors, LLC, September 2004-April 2010; senior officer of Columbia Funds and affiliated funds since 2002 | |
Scott R. Plummer
5228 Ameriprise
Financial Center
Minneapolis, MN 55474
1959 | | Senior Vice President and Chief Legal Officer since 12/06 and Assistant Secretary since 6/11 for RiverSource Funds and Senior Vice President and Chief Legal Officer since 5/10 and Assistant Secretary since 6/11 for Nations Funds | | Senior Vice President, Chief Legal Officer and Assistant Secretary, Columbia Management Investment Advisers, LLC since June 2005; Vice President and Lead Chief Counsel — Asset Management, Ameriprise Financial, Inc. since May 2010 (previously Vice President and Chief Counsel — Asset Management, 2005-April 2010); Vice President, Chief Counsel and Assistant Secretary, Columbia Management Investment Distributors, Inc. since 2008; Vice President, General Counsel and Secretary, Ameriprise Certificate Company since 2005; Chief Counsel, RiverSource Distributors, Inc. since 2006 | |
Colin Moore
225 Franklin Street
Boston, MA 02110
1958 | | Senior Vice President since 5/10 for RiverSource Funds and Nations Funds | | Director and Chief Investment Officer, Columbia Management Investment Advisers, LLC since May 2010; Manager, Managing Director and Chief Investment Officer, Columbia Management Advisors, LLC, 2007-April 2010 | |
Thomas P. McGuire
225 Franklin Street
Boston, MA 02110
1972 | | Chief Compliance Officer since 3/12 | | Vice President — Asset Management Compliance, Columbia Management Investment Advisers, LLC since 2010; Chief Compliance Officer, Ameriprise Certificate Company since September 2010; Compliance Executive, Bank of America, 2005-2010 | |
Stephen T. Welsh
225 Franklin Street
Boston, MA 02110
1957 | | Vice President since 4/11 for RiverSource Funds and 2006 for Nations Funds | | President and Director, Columbia Management Investment Services Corp. since May 2010; President and Director, Columbia Management Services, Inc., July 2004-April 2010; Managing Director, Columbia Management Distributors, Inc., August 2007-April 2010 | |
Christopher O. Petersen
5228 Ameriprise
Financial Center
Minneapolis, MN 55474
1970 | | Vice President and Secretary since 4/11 for RiverSource Funds and 3/11 for Nations Funds | | Vice President and Chief Counsel, Ameriprise Financial, Inc. since January 2010 (formerly Vice President and Group Counsel or Counsel, April 2004-January 2010); Assistant Secretary of Legacy RiverSource Funds, January 2007-April 2011 and of the Nations Funds, May 2010-March 2011 | |
Annual Report 2013
33
Columbia North Carolina Intermediate Municipal Bond Fund
Trustees and Officers (continued)
Officers (continued)
Name,
Address,
Year of Birth | | Position Held With
Funds and Length of
Service | | Principal Occupation During Past Five Years | |
Paul D. Pearson
10468 Ameriprise
Financial Center
Minneapolis, MN 55474
1956 | | Vice President since 4/11 and Assistant Treasurer since 1999 for RiverSource Funds and Vice President and Assistant Treasurer since 6/11 for Nations Funds | | Vice President — Investment Accounting, Columbia Management Investment Advisers, LLC, since May 2010; Vice President — Managed Assets, Investment Accounting, Ameriprise Financial Corporation, February 1998-May 2010 | |
Joseph F. DiMaria
225 Franklin Street
Boston, MA 02110
1968 | | Vice President and Chief Accounting Officer since 4/11 and Vice President since 3/11 and Chief Accounting Officer since 2008 for Nations Funds | | Vice President, Mutual Fund Administration, Columbia Management Investment Advisers, LLC, since May 2010; Director of Fund Administration, Columbia Management Advisors, LLC, January 2006-April 2010 | |
Paul B. Goucher
100 Park Avenue
New York, NY 10017
1968 | | Vice President since 4/11 and Assistant Secretary since 11/08 for RiverSource Funds and 5/10 for Nations Funds | | Vice President and Lead Chief Counsel, Ameriprise Financial, Inc. since November 2008 and January 2013, respectively (formerly, Chief Counsel, January 2010-January 2013 and Group Counsel from November 2008-January 2010); Director, Managing Director and General Counsel, J. & W. Seligman & Co. Incorporated, July 2008- November 2008 (previously, Managing Director and Associate General Counsel, January 2005-July 2008) | |
Michael E. DeFao
225 Franklin Street
Boston, MA 02110
1968 | | Vice President since 4/11 and Assistant Secretary since 5/10 for RiverSource Funds and 2011 for Nations Funds | | Vice President and Chief Counsel, Ameriprise Financial, Inc. since May 2010; Associate General Counsel, Bank of America, June 2005-April 2010 | |
Annual Report 2013
34
Columbia North Carolina Intermediate Municipal Bond Fund
Approval of Investment Management Services Agreement
Columbia Management Investment Advisers, LLC (Columbia Management or the Investment Manager), a wholly-owned subsidiary of Ameriprise Financial, Inc. (Ameriprise Financial), serves as the investment manager to Columbia North Carolina Intermediate Municipal Bond Fund (the Fund). Under an investment management services agreement (the IMS Agreement), Columbia Management provides investment advice and other services to the Fund and other funds distributed by Columbia Management Investment Distributors, Inc. (collectively, the Funds).
On an annual basis, the Fund's Board of Trustees (the Board), including the independent Board members (the Independent Trustees), considers renewal of the IMS Agreement. Columbia Management prepared detailed reports for the Board and its Contracts Committee in January, March and April 2013, including reports based on analyses of data provided by an independent organization and a comprehensive response to each item of information requested by independent legal counsel to the Independent Trustees (Independent Legal Counsel) in a letter to the Investment Manager, to assist the Board in making this determination. All of the materials presented in January, March and April were first supplied in draft form to designated representatives of the Independent Trustees, i.e., Independent Legal Counsel, the Chair of the Board and the Chair of the Contracts Committee, and the final materials (including proposed additional breakpoints in IMS fees for certain Funds) were revised to reflect discussion and subsequent requests made by the Contracts Committee. In addition, throughout the year, the Board (or its committees) regularly meets with portfolio management teams and senior management personnel, and reviews information prepared by Columbia Management addressing the services Columbia Management provides and Fund performance. Further, the Board retained an independent consulting firm (the Independent Consultant) to assist the Independent Trustees in their review of IMS fees, expense caps and Ameriprise Financial's profitability. The Board also accords particular weight to the work, deliberations and conclusions of the Contracts Committee, the Investment Review Committee and the Compliance Committee in determining whether to continue the IMS Agreement.
The Board, at its April 15-17, 2013 in-person Board meeting (the April Meeting), considered the renewal of the IMS Agreement for an additional one-year term. At the April Meeting, Independent Legal Counsel reviewed with the Independent Trustees various factors relevant to the Board's consideration of advisory agreements and the Board's legal responsibilities related to such consideration. Following an analysis and discussion of the factors identified below, the Board, including all of the Independent Trustees, approved the renewal of the IMS Agreement.
Nature, Extent and Quality of Services Provided by Columbia Management
The Independent Trustees analyzed various reports and presentations they had received detailing the services performed by Columbia Management, as well as its expertise, resources and capabilities. The Independent Trustees specifically considered many developments during the past year concerning the services provided by Columbia Management, including, in particular, the recent globalization initiative, which fosters increased worldwide investment support of global products, continued investment in upgrading technology (such as the implementation of new systems and hardware), the hiring of a Chief Interest Rate Strategist as part of Columbia Management's fixed income team and the addition of Columbia Management investment personnel to the Asset Allocation, Quantitative and Technology teams. The Independent Trustees noted the information they received concerning Columbia Management's ability to retain its key portfolio management personnel. In this regard, the Independent Trustees took into account their comprehensive discussions with Columbia Management's Chief Investment Officer (the CIO), observing the organizational depth of Columbia Management and the capabilities of its investment personnel. The Independent Trustees also recalled the information the CIO provided them identifying the strengths and areas for enhancement of each Columbia Management investment team, as well as the discussion with the CIO regarding the investment personnel talent being infused to enhance support for certain Funds. The Independent Trustees also observed the materials demonstrating the strength and depth of Columbia Management's equity and fixed income research departments.
In connection with the Board's evaluation of the overall package of services provided by Columbia Management, the Board also considered the quality of administrative services provided to the Fund by Columbia Management, recalling the information it received highlighting significant achievements in 2012 in the performance of administrative services (such as strong accounting performance measures, refined derivatives processing and enhancements to the electronic communications under the affiliated and unaffiliated service provider oversight program). In evaluating the quality of services provided under the IMS Agreement and the Fund's Administrative Service Agreement, the Independent Trustees also took into account the organization and strength of the Fund's and its service providers' compliance programs. In
Annual Report 2013
35
Columbia North Carolina Intermediate Municipal Bond Fund
Approval of Investment Management Services
Agreement (continued)
addition, the Board also reviewed the financial condition of Columbia Management (and its affiliates) and each entity's ability to carry out its responsibilities under the IMS Agreement and the Fund's other services agreements with affiliates of Ameriprise Financial, observing the financial strength of Ameriprise Financial, with its solid balance sheet. The Board also discussed the acceptability of the terms of the IMS Agreement (including the relatively broad scope of services required to be performed by Columbia Management). The Board concluded that the services being performed under the IMS Agreement were of a reasonably high quality.
Based on the foregoing, and based on other information received (both oral and written, including the information on investment performance referenced below) and other considerations, the Board concluded that Columbia Management and its affiliates were in a position to continue to provide a high quality and level of services to the Fund.
Investment Performance
For purposes of evaluating the nature, extent and quality of services provided under the IMS Agreement, the Board carefully reviewed the investment performance of the Fund. In this regard, the Board considered detailed reports providing the results of analyses performed by an independent organization showing, for various periods, the performance of the Fund, the performance of a benchmark index, the percentage ranking of the Fund among its comparison group and the net assets of the Fund. The Board observed that the Fund's investment performance was appropriate in light of the particular management style involved and the particular market environment.
Comparative Fees, Costs of Services Provided and the Profits Realized by Columbia Management and its Affiliates from their Relationships with the Fund
The Board reviewed comparative fees and the costs of services to be provided under the IMS Agreement. The Board members considered detailed comparative information set forth in an annual report on fees and expenses, including, among other things, data (based on analyses conducted by an independent organization) showing a comparison of the Fund's expenses with median expenses paid by funds in its comparative peer universe, as well as data showing the Fund's contribution to Columbia Management's profitability.
The Board accorded particular weight to the notion that the level of fees should reflect a rational pricing model applied consistently across the various product lines in the Fund family, while assuring that the overall fees for each Fund (with few defined exceptions) are generally in line with the "pricing philosophy" (i.e., that the total expense ratio of the Fund is no higher than the median expense ratio of funds in the same comparison universe of the Fund). In this connection, the Board also considered the Independent Consultant's report that concluded that: (i) the Funds' standardized investment management fee rates, particularly in the context of the current competitive fee landscape, were within a reasonable range; and (ii) the Funds' expense cap philosophy of assuring that each Fund's total expense ratio is not above its peer universe median ratio is reasonable. The Board took into account that the Fund's total expense ratio (after considering proposed expense caps/waivers) approximated the peer universe's median expense ratio. Based on its review, the Board concluded that the Fund's management fee was fair and reasonable in light of the extent and quality of services that the Fund receives.
The Board also considered the expected profitability of Columbia Management and its affiliates in connection with Columbia Management providing investment management services to the Fund. In this regard, the Board referred to a detailed profitability report, discussing the profitability to Columbia Management and Ameriprise Financial from managing, operating and distributing the Funds. In this regard, the Board observed that 2012 profitability approximates 2011 profitability and that, as was the case in 2011, 2012 profitability remained generally in line with (and, in many cases, lower than) the reported profitability of other asset management firms. Further, the Board considered the Independent Consultant's report that concluded that Columbia Management's profitability, particularly in comparison to industry competitors, was reasonable and not excessive. It also took into account the indirect economic benefits flowing to Columbia Management or its affiliates in connection with managing or distributing the Funds, such as the enhanced ability to offer various other financial products to Ameriprise Financial customers, soft dollar benefits and overall reputational advantages. The Board noted that the fees paid by the Funds should permit the Investment Manager to offer competitive compensation to its personnel, make necessary investments in its business and earn an appropriate profit. The Board concluded that profitability levels were reasonable.
Annual Report 2013
36
Columbia North Carolina Intermediate Municipal Bond Fund
Approval of Investment Management Services
Agreement (continued)
Economies of Scale to be Realized
The Board also considered the economies of scale that might be realized by Columbia Management as the Fund grows and took note of the extent to which Fund shareholders might also benefit from such growth. In this regard, the Independent Trustees took into account that IMS fees decline as Fund assets exceed various breakpoints, all of which have not been surpassed.
Based on the foregoing, the Board, including all of the Independent Trustees, concluded that the investment management service fees were fair and reasonable in light of the extent and quality of services provided. In reaching this conclusion, no single factor was determinative. On April 17, 2013, the Board, including all of the Independent Trustees, approved the renewal of the IMS Agreement.
Annual Report 2013
37
This page intentionally left blank.
Annual Report 2013
38
This page intentionally left blank.
Annual Report 2013
39
This page intentionally left blank.
Annual Report 2013
40
Columbia North Carolina Intermediate Municipal Bond Fund
Important Information About This Report
Each fund mails one shareholder report to each shareholder address. If you would like more than one report, please call shareholder services at 800.345.6611 and additional reports will be sent to you.
The policy of the Board is to vote the proxies of the companies in which each fund holds investments consistent with the procedures as stated in the Statement of Additional Information (SAI). You may obtain a copy of the SAI without charge by calling 800.345.6611; contacting your financial intermediary; visiting columbiamanagement.com; or searching the website of the Securities and Exchange Commission (SEC) at sec.gov. Information regarding how each fund voted proxies relating to portfolio securities is filed with the SEC by August 31 for the most recent 12-month period ending June 30 of that year, and is available without charge by visiting columbiamanagement.com; or searching the website of the SEC at sec.gov.
Each fund files a complete schedule of portfolio holdings with the SEC for the first and third quarters of each fiscal year on Form N-Q. Each fund's Form N-Q is available on the SEC's website at sec.gov and may be reviewed and copied at the SEC's Public Reference Room in Washington, D.C. Information on the operation of the Public Reference Room may be obtained by calling 800.SEC.0330. Each fund's complete schedule of portfolio holdings, as filed on Form N-Q, can also be obtained without charge, upon request, by calling 800.345.6611.
Annual Report 2013
41

Columbia North Carolina Intermediate Municipal Bond Fund
P.O. Box 8081
Boston, MA 02266-8081
columbiamanagement.com
This information is for use with concurrent or prior delivery of a fund prospectus. Please read and consider the investment objectives, risks, charges and expenses for any fund carefully before investing. For a prospectus which contains this and other important information about the Fund go to columbiamanagement.com. The Fund is distributed by Columbia Management Investment Distributors, Inc., member FINRA, and managed by Columbia Management Investment Advisers, LLC.
© 2013 Columbia Management Investment Advisers, LLC. All rights reserved.
ANN206_04_C01_(06/13)
Annual Report
April 30, 2013

Columbia Short Term Municipal Bond Fund
Not FDIC insured • No bank guarantee • May lose value
Columbia Short Term Municipal Bond Fund
 Dear Shareholders,
U.S. equities had a strong first quarter
Similar to 2012, equities once again were the best performing asset class in the first quarter of 2013. The S&P 500 Index reached an all-time closing high on the last trading day of the quarter and pushed through its October 2007 peak. Although global equities have performed well year-to-date, there is significant performance divergence among regions. In local currency terms, Japanese equities were the best performing developed market globally, and U.S. stocks outperformed most other global equity markets. European equities rose in the first quarter but trailed U.S. stocks and had a turbulent March, as investors were reminded of instability in the eurozone with news of a banking crisis in Cyprus.
Although all 10 sectors of the S&P 500 Index delivered positive returns, this was a rally led by defensive stocks such as those in health care, consumer staples and utilities. Materials and technology stocks were the weakest sectors.
High yield leads fixed income; most sectors flat to down
The fixed-income markets lagged equities with modest, single-digit returns coming from municipals and high-yield sectors in the United States. Most government and investment-grade credit sectors were roughly flat to down for the first quarter of 2013. Emerging market bonds were the biggest disappointment with single-digit losses.
Columbia Management to begin delivering summary prospectuses
Each Columbia fund is required to update its prospectus on an annual basis. Beginning with June 2013 prospectus updates, shareholders of Columbia retail mutual funds will start to receive a summary prospectus, rather than the full length (statutory) mutual fund prospectus they have received in the past.
Each fund's summary prospectus will include the following key information:
> Investment objective
> Fee and expense table
> Portfolio turnover rate information
> Principal investment strategies, principal risks and performance information
> Management information
> Purchase and sale information
> Tax information
> Financial intermediary compensation information
Each fund's statutory prospectus will contain additional information about the fund and its risks. Both the statutory and summary prospectus will be updated each year, and will be available at columbiamanagement.com. Shareholders may request a printed version of a statutory prospectus at no cost by calling 800.345.6611 or sending an email to serviceinquiries@columbiamanagement.com.
Stay on track with Columbia Management
Backed by more than 100 years of experience, Columbia Management is one of the nation's largest asset managers. At the heart of our success — and, most importantly, that of our investors — are highly talented industry professionals, brought together by a unique way of working. We are dedicated to helping you take advantage of today's opportunities and anticipate tomorrow's. We stay abreast of the latest investment trends and ideas, using our collective insight to evaluate events and transform them into solutions you can use.
Visit columbiamanagement.com for:
> The Columbia Management Perspectives blog, featuring timely posts by our investment teams
> Detailed up-to-date fund performance and portfolio information
> Economic analysis and market commentary
> Quarterly fund commentaries
> Columbia Management Investor, our award-winning quarterly newsletter for shareholders
Thank you for your continued support of the Columbia Funds. We look forward to serving your investment needs for many years to come.
Best Regards,

J. Kevin Connaughton
President, Columbia Funds
The S&P 500 Index, an unmanaged index, measures the performance of 500 large-capitalization U.S. stocks and is frequently used as a general measure of market performance. Indices are not available for investment, are not professionally managed and do not reflect sales charges, fees, brokerage commissions, taxes or other expenses of investing.
Investors should consider the investment objectives, risks, charges and expenses of a mutual fund carefully before investing. For a free prospectus, which contains this and other important information about a fund, visit columbiamanagement.com. The prospectus should be read carefully before investing.
Columbia Funds are distributed by Columbia Management Investment Distributors, Inc., member FINRA, and managed by Columbia Management Investment Advisers, LLC.
© 2013 Columbia Management Investment Advisers, LLC. All rights reserved.
Columbia Short Term Municipal Bond Fund
Performance Overview | | | 2 | | |
Manager Discussion of Fund Performance | | | 4 | | |
Understanding Your Fund's Expenses | | | 6 | | |
Portfolio of Investments | | | 7 | | |
Statement of Assets and Liabilities | | | 24 | | |
Statement of Operations | | | 26 | | |
Statement of Changes in Net Assets | | | 27 | | |
Financial Highlights | | | 29 | | |
Notes to Financial Statements | | | 35 | | |
Report of Independent Registered
Public Accounting Firm | | | 41 | | |
Federal Income Tax Information | | | 42 | | |
Trustees and Officers | | | 43 | | |
Approval of Investment Management Services Agreement | | | 48 | | |
Important Information About This Report | | | 53 | | |
Fund Investment Manager
Columbia Management Investment
Advisers, LLC
225 Franklin Street
Boston, MA 02110
Fund Distributor
Columbia Management Investment
Distributors, Inc.
225 Franklin Street
Boston, MA 02110
Fund Transfer Agent
Columbia Management Investment
Services Corp.
P.O. Box 8081
Boston, MA 02266-8081
For more information about any of the funds, please visit columbiamanagement.com or call 800.345.6611. Customer Service Representatives are available to answer your questions Monday through Friday from 8 a.m. to 8 p.m. Eastern time.
The views expressed in this report reflect the current views of the respective parties. These views are not guarantees of future performance and involve certain risks, uncertainties and assumptions that are difficult to predict, so actual outcomes and results may differ significantly from the views expressed. These views are subject to change at any time based upon economic, market or other conditions and the respective parties disclaim any responsibility to update such views. These views may not be relied on as investment advice and, because investment decisions for a Columbia Fund are based on numerous factors, may not be relied on as an indication of trading intent on behalf of any particular Columbia Fund. References to specific securities should not be construed as a recommendation or investment advice.
Columbia Short Term Municipal Bond Fund
Performance Summary
> Columbia Short Term Municipal Bond Fund (the Fund) Class A shares returned 0.96% excluding sales charges for the 12-month period that ended April 30, 2013.
> The Fund slightly underperformed its benchmark, the Barclays 1-3 Year Municipal Bond Index, which returned 1.02% for the same 12-month period.
> Overweights in bonds with maturities of three or more years and A rated bonds aided relative performance, while an overweight in bonds with maturities of one year or less detracted from results.
Average Annual Total Returns (%) (for period ended April 30, 2013)
| | Inception | | 1 Year | | 5 Years | | 10 Years | |
Class A | | 11/02/93 | | | | | | | |
Excluding sales charges | | | | | 0.96 | | | | 2.12 | | | | 2.22 | | |
Including sales charges | | | | | -0.08 | | | | 1.92 | | | | 2.12 | | |
Class B | | 10/12/93 | | | 0.20 | | | | 1.36 | | | | 1.46 | | |
Class C | | 05/19/94 | | | | | | | |
Excluding sales charges | | | | | 0.20 | | | | 1.36 | | | | 1.46 | | |
Including sales charges | | | | | -0.79 | | | | 1.36 | | | | 1.46 | | |
Class R4* | | 03/19/13 | | | 1.21 | | | | 2.38 | | | | 2.48 | | |
Class R5* | | 11/08/12 | | | 1.25 | | | | 2.38 | | | | 2.48 | | |
Class Z | | 10/07/93 | | | 1.21 | | | | 2.38 | | | | 2.48 | | |
Barclays 1-3 Year Municipal Bond Index | | | | | 1.02 | | | | 2.47 | | | | 2.58 | | |
Returns for Class A are shown with and without the maximum initial sales charge of 1.00%. Returns for Class C are shown with and without the 1.00% contingent deferred sales charge (CDSC) for the first year only. The Fund's other classes are not subject to sales charges and have limited eligibility. Please see the Fund's prospectuses for details. Performance for different share classes will vary based on differences in sales charges and fees associated with each class. All results shown assume reinvestment of distributions during the period. Returns do not reflect the deduction of taxes that a shareholder may pay on Fund distributions or on the redemption of Fund shares. Performance results reflect the effect of any fee waivers or reimbursements of Fund expenses by Columbia Management Investment Advisers, LLC and/or any of its affiliates. Absent these fee waivers or expense reimbursement arrangements, performance results would have been lower.
The performance information shown represents past performance and is not a guarantee of future results. The investment return and principal value of your investment will fluctuate so that your shares, when redeemed, may be worth more or less than their original cost. Current performance may be lower or higher than the performance information shown. You may obtain performance information current to the most recent month-end by contacting your financial intermediary, visiting columbiamanagement.com or calling 800.345.6611.
*The returns shown for periods prior to the share class inception date (including returns for the Life of the Fund, if shown, which are since Fund inception) include the returns of the Fund's oldest share class. These returns are adjusted to reflect any higher class-related operating expenses of the newer share classes, as applicable. Please visit columbiamanagement.com/mutual-funds/appended-performance for more information.
The Barclays 1-3 Year Municipal Bond Index, which consists of a broad selection of investment grade general obligation and revenue bonds of maturities ranging from one year to three years.
Indices are not available for investment, are not professionally managed and do not reflect sales charges, fees, brokerage commissions, taxes or other expenses of investing. Securities in the Fund may not match those in an index.
Annual Report 2013
2
Columbia Short Term Municipal Bond Fund
Performance Overview (continued)
Performance of a Hypothetical $10,000 Investment (May 1, 2003 – April 30, 2013)
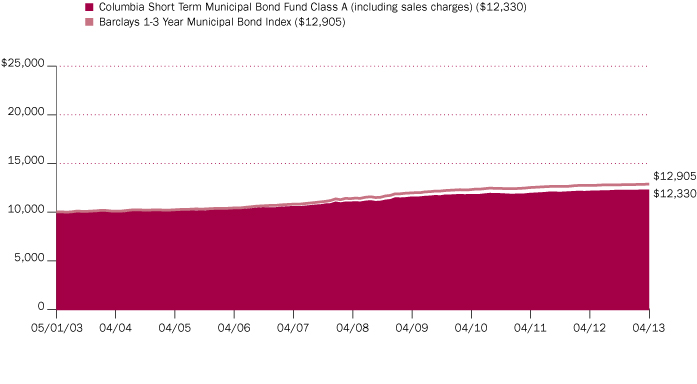
The chart above shows the change in value of a hypothetical $10,000 investment in Class A shares of Columbia Short Term Municipal Bond Fund during the stated time period, and does not reflect the deduction of taxes that a shareholder may pay on Fund distributions or on the redemption of Fund shares.
Annual Report 2013
3
Columbia Short Term Municipal Bond Fund
Manager Discussion of Fund Performance
For the 12-month period that ended April 30, 2013, the Fund's Class A shares returned 0.96% excluding sales charges, compared to 1.02% for the Barclays 1-3 Year Municipal Bond Index. Overweights in bonds with maturities of three or more years and A rated securities helped relative performance, while an overweight in bonds with maturities of one year or less detracted from results.
U.S. Economy: Growth in the Slow Lane
Europe's sovereign debt problems, a financial crisis in Cyprus and U.S. struggles to avoid a fiscal cliff of tax increases and federal spending cuts weighed on the global economy during the past year. In an effort to bolster economic growth, central banks worldwide lowered interest rates and initiated bond buyback programs. U.S. investors, in particular, were encouraged to see a decrease in the U.S. unemployment rate early in 2013, steady manufacturing activity and a rebound in the housing market. Late in the period, across-the-board federal budget cuts (commonly referred to as the sequester) began to weigh on consumer confidence, but had little immediate impact on the economy.
Strong Demand for Municipal Bonds
Municipal bonds benefited from strong investor demand, fueled in part by the expectation of higher personal income tax rates, virtually zero net new supply (issuance less bond maturities and refundings) and inflows into municipal bond mutual funds. Municipal bonds, which offer investors a compelling after-tax yield advantage over U.S. Treasury bonds, attracted investors despite interest rates near historical lows. Rising state tax collections that helped bolster state and credit outlooks, also helped the sector. As demand surged, the supply of tax-exempt securities remained constrained, with much of the new issuance focusing on the refunding of existing bonds at lower prevailing interest rates. Yields fell across nearly all maturities, with little change in one-year yields and the biggest decline coming from longer-term issues. Over the 12-month reporting period, longer term bonds handily beat the total return of shorter term issues. Lower quality, higher yielding securities outpaced higher quality bonds, as the credit outlook improved.
Gains from Maturity and Credit Positioning
The Fund benefited from a barbell maturity structure, with overweights in bonds that had maturities of one year or less and in issues with four- and five-year maturities, while maintaining a dollar-weighted average portfolio maturity of 4.7 years. The overweight in longer maturity, higher yielding issues aided relative performance, outweighing weaker performance from an overweight at the short end. Performance also received a boost from lower quality investment grade opportunities, which were identified by our dedicated municipal credit research team and allowed the Fund to maintain a competitive level of tax-exempt income. A material overweight in A rated (lower quality) bonds and a sizable underweight in AAA rated (higher quality) bonds also aided relative performance, as credit spreads — the difference in the yields between higher and lower quality bonds — tightened. Purchases of A and BBB rated bonds during the year further contributed to relative outperformance. Strong security selection in the AA rated segment and in the transportation, state general obligation and electric sectors more than offset modest disappointments in the health care and leasing groups. Over the period, the Fund's barbell structure became less pronounced, as we
Portfolio Management
Catherine Stienstra
Top Ten States (%)
(at April 30, 2013) | |
New York | | | 13.7 | | |
California | | | 11.9 | | |
Illinois | | | 9.6 | | |
Florida | | | 8.2 | | |
Massachusetts | | | 5.6 | | |
Texas | | | 4.9 | | |
New Jersey | | | 4.5 | | |
Washington | | | 3.6 | | |
Georgia | | | 3.1 | | |
Michigan | | | 3.0 | | |
Percentages indicated are based upon total investments (excluding Money Market Funds).
Quality Breakdown (%)
(at April 30, 2013) | |
AAA rating | | | 6.0 | | |
AA rating | | | 34.3 | | |
A rating | | | 49.2 | | |
BBB rating | | | 5.7 | | |
Not rated | | | 4.8 | | |
Total | | | 100.0 | | |
Percentages indicated are based upon total fixed income securities (excluding Money Market Funds).
Bond ratings apply to the underlying holdings of the Fund and not the Fund itself and are divided into categories ranging from AAA (highest) to D (lowest), and are subject to change. The ratings shown are determined by using the middle rating of Moody's, S&P, and Fitch after dropping the highest and lowest available ratings. When a rating from only two agencies is available, the lower rating is used. When a rating from only one agency is available, that rating is used. When a bond is not rated by any of these agencies, it is designated as Not rated. Credit ratings are subjective opinions and not statements of fact.
Annual Report 2013
4
Columbia Short Term Municipal Bond Fund
Manager Discussion of Fund Performance (continued)
added to short-term holdings and trimmed exposure to four- to five-year maturities which have the potential to pressure the Fund in a rising interest-rate environment. As a result, the Fund's duration (a measure of price sensitivity to interest-rate changes) drifted lower but remained modestly longer than its benchmark.
Looking Ahead
At present, we think tax reform issues — including the potential elimination of the tax-exemption on municipal bonds — are not likely to be resolved in 2013. We remain cautiously optimistic about near-term prospects for the municipal bond sector. We expect municipal bonds to benefit from continued strong demand, fueled by a pickup in maturities, calls and coupon payments over the summer and by higher tax rates. We believe supply is also likely to remain constrained. In managing the Fund, we seek to keep volatility low. For that reason, we currently plan to maintain a barbell structure, with the short end providing liquidity and flexibility for when interest rates do rise and the long end offering the potential for additional income. However, while we anticipate maintaining a barbell structure, we expect it will be less pronounced in the coming months. Going forward, we plan to continue building the portfolio one security at a time, relying heavily on the strength of our in-house municipal credit research team to help us evaluate the risk and return potential of each issue.
Annual Report 2013
5
Columbia Short Term Municipal Bond Fund
Understanding Your Fund's Expenses
(Unaudited)
As an investor, you incur two types of costs. There are transaction costs, which generally include sales charges on purchases and may include redemption fees. There are also ongoing costs, which generally include management fees, distribution and service (Rule 12b-1) fees, and other fund expenses. The following information is intended to help you understand your ongoing costs (in dollars) of investing in the Fund and to help you compare these costs with the ongoing costs of investing in other mutual funds.
Analyzing Your Fund's Expenses
To illustrate these ongoing costs, we have provided examples and calculated the expenses paid by investors in each share class of the Fund during the period. The actual and hypothetical information in the table is based on an initial investment of $1,000 at the beginning of the period indicated and held for the entire period. Expense information is calculated two ways and each method provides you with different information. The amount listed in the "Actual" column is calculated using the Fund's actual operating expenses and total return for the period. You may use the Actual information, together with the amount invested, to estimate the expenses that you paid over the period. Simply divide your account value by $1,000 (for example, an $8,600 account value divided by $1,000 = 8.6), then multiply the results by the expenses paid during the period under the Actual column. The amount listed in the "Hypothetical" column assumes a 5% annual rate of return before expenses (which is not the Fund's actual return) and then applies the Fund's actual expense ratio for the period to the hypothetical return. You should not use the hypothetical account values and expenses to estimate either your actual account balance at the end of the period or the expenses you paid during the period. See "Compare With Other Funds" below for details on how to use the hypothetical data.
Compare With Other Funds
Since all mutual funds are required to include the same hypothetical calculations about expenses in shareholder reports, you can use this information to compare the ongoing cost of investing in the Fund with other funds. To do so, compare the hypothetical example with the 5% hypothetical examples that appear in the shareholder reports of other funds. As you compare hypothetical examples of other funds, it is important to note that hypothetical examples are meant to highlight the ongoing costs of investing in a fund only and do not reflect any transaction costs, such as sales charges, or redemption or exchange fees. Therefore, the hypothetical calculations are useful in comparing ongoing costs only, and will not help you determine the relative total costs of owning different funds. If transaction costs were included in these calculations, your costs would be higher.
November 1, 2012 – April 30, 2013
| | Account Value at the Beginning
of the Period ($) | | Account Value at the End of the
Period ($) | | Expenses Paid During the
Period ($) | | Fund's Annualized
Expense Ratio (%) | |
| | Actual | | Hypothetical | | Actual | | Hypothetical | | Actual | | Hypothetical | | Actual | |
Class A | | | 1,000.00 | | | | 1,000.00 | | | | 1,004.00 | | | | 1,021.17 | | | | 3.63 | | | | 3.66 | | | | 0.73 | | |
Class B | | | 1,000.00 | | | | 1,000.00 | | | | 1,000.30 | | | | 1,017.46 | | | | 7.34 | | | | 7.40 | | | | 1.48 | | |
Class C | | | 1,000.00 | | | | 1,000.00 | | | | 1,000.30 | | | | 1,017.46 | | | | 7.34 | | | | 7.40 | | | | 1.48 | | |
Class R4 | | | 1,000.00 | | | | 1,000.00 | | | | 1,001.40 | * | | | 1,022.41 | | | | 0.54 | * | | | 2.41 | | | | 0.48 | * | |
Class R5 | | | 1,000.00 | | | | 1,000.00 | | | | 1,005.40 | ** | | | 1,022.86 | | | | 1.84 | ** | | | 1.96 | | | | 0.39 | ** | |
Class Z | | | 1,000.00 | | | | 1,000.00 | | | | 1,005.20 | | | | 1,022.41 | | | | 2.39 | | | | 2.41 | | | | 0.48 | | |
*For the period March 19, 2013 through April 30, 2013. Class R4 shares commenced operations on March 19, 2013.
**For the period November 8, 2012 through April 30, 2013. Class R5 shares commenced operations on November 8, 2012.
Expenses paid during the period are equal to the annualized expense ratio for each class as indicated above, multiplied by the average account value over the period and then multiplied by the number of days in the Fund's most recent fiscal half year and divided by 365.
Expenses do not include fees and expenses incurred indirectly by the Fund from the underlying funds in which the Fund may invest (also referred to as "acquired funds"), including affiliated and non-affiliated pooled investment vehicles (including mutual funds and exchange-traded funds).
Had Columbia Management Investment Advisers, LLC and/or certain of its affiliates not waived/reimbursed certain fees and expenses, account value at the end of the period would have been reduced.
Annual Report 2013
6
Columbia Short Term Municipal Bond Fund
Portfolio of Investments
April 30, 2013
(Percentages represent value of investments compared to net assets)
Municipal Bonds 89.5%
Issue
Description | | Coupon
Rate | | Principal
Amount ($) | | Value ($) | |
Alabama 1.4% | |
Alabama 21st Century Authority
Revenue Bonds
Series 2012A
06/01/18 | | | 5.000 | % | | | 1,250,000 | | | | 1,472,425 | | |
Alabama Public School & College Authority
Refunding Revenue Bonds
Pool
Series 2012A
03/01/17 | | | 5.000 | % | | | 4,560,000 | | | | 5,295,300 | | |
03/01/18 | | | 5.000 | % | | | 7,510,000 | | | | 8,939,228 | | |
Series 2009A
05/01/14 | | | 5.000 | % | | | 9,000,000 | | | | 9,428,220 | | |
Auburn University
Revenue Bonds
Series 2012A
06/01/16 | | | 5.000 | % | | | 3,000,000 | | | | 3,407,460 | | |
Total | | | | | | | 28,542,633 | | |
Alaska 0.6% | |
Alaska Industrial Development & Export Authority
Refunding Revenue Bonds
Revolving Fund
Series 2010A
04/01/16 | | | 5.000 | % | | | 2,500,000 | | | | 2,807,200 | | |
City of Valdez
Refunding Revenue Bonds
BP Pipelines, Inc. Project
Series 2003
01/01/16 | | | 5.000 | % | | | 9,200,000 | | | | 10,187,436 | | |
Total | | | | | | | 12,994,636 | | |
Arizona 1.4% | |
Arizona School Facilities Board
Certificate of Participation
Series 2005A-1 (FGIC/NPFGC)
09/01/14 | | | 5.000 | % | | | 10,000,000 | | | | 10,625,700 | | |
Series 2008
09/01/13 | | | 5.500 | % | | | 8,000,000 | | | | 8,142,480 | | |
County of Pima Sewer System Revenue
Revenue Bonds
Series 2012-A
07/01/14 | | | 3.000 | % | | | 1,000,000 | | | | 1,031,020 | | |
Series 2012-A
07/01/15 | | | 4.000 | % | | | 375,000 | | | | 403,455 | | |
Series 2012-A
07/01/16 | | | 3.000 | % | | | 450,000 | | | | 483,192 | | |
Series 2012-A
07/01/16 | | | 4.000 | % | | | 500,000 | | | | 552,875 | | |
County of Pima
Refunding Revenue Bonds
Sewer System
Series 2011A
07/01/13 | | | 5.000 | % | | | 1,250,000 | | | | 1,260,162 | | |
Municipal Bonds (continued)
Issue
Description | | Coupon
Rate | | Principal
Amount ($) | | Value ($) | |
State of Arizona
Certificate of Participation
Department Administration
Series 2010A (AGM)
10/01/15 | | | 5.000 | % | | | 5,000,000 | | | | 5,506,950 | | |
Refunding Certificate of Participation
Department Administration
Series 2013-B
10/01/14 | | | 3.000 | % | | | 350,000 | | | | 362,257 | | |
10/01/15 | | | 4.000 | % | | | 200,000 | | | | 215,492 | | |
10/01/16 | | | 5.000 | % | | | 175,000 | | | | 198,156 | | |
Total | | | | | | | 28,781,739 | | |
California 10.2% | |
California Health Facilities Financing Authority
Refunding Revenue Bonds
St. Joseph Health System
Series 2009C
07/01/34 | | | 5.000 | % | | | 12,000,000 | | | | 12,743,040 | | |
Revenue Bonds
City of Hope Obligation Group
Series 2012-A
11/15/14 | | | 5.000 | % | | | 500,000 | | | | 534,690 | | |
California Pollution Control Financing Authority
Refunding Revenue Bonds
BP West Coast Products LLC
Series 2009
12/01/46 | | | 2.600 | % | | | 5,000,000 | | | | 5,141,500 | | |
South Dakota Gas and Electric
Series 1996A (NPFGC)
06/01/14 | | | 5.900 | % | | | 4,500,000 | | | | 4,775,220 | | |
California State Public Works Board
Refunding Revenue Bonds
Department of Corrections
Series 2012I
06/01/15 | | | 5.000 | % | | | 2,080,000 | | | | 2,273,378 | | |
Richmond Laboratory Project
Series 2012J
11/01/14 | | | 3.000 | % | | | 1,445,000 | | | | 1,502,193 | | |
11/01/15 | | | 4.000 | % | | | 2,035,000 | | | | 2,208,179 | | |
Revenue Bonds
Various Capital Projects
Series 2011A
10/01/16 | | | 4.000 | % | | | 2,000,000 | | | | 2,217,040 | | |
Subordinated Series 2010A-1
03/01/15 | | | 5.000 | % | | | 3,000,000 | | | | 3,248,580 | | |
03/01/16 | | | 5.000 | % | | | 1,325,000 | | | | 1,482,927 | | |
California Statewide Communities Development Authority
Revenue Bonds
Proposition 1A Receivables Program
Series 2009
06/15/13 | | | 5.000 | % | | | 20,945,000 | | | | 21,071,672 | | |
City of Los Angeles Department of Airports(a)
Refunding Revenue Bonds
Ontario International
Series 2006A (NPFGC) AMT
05/15/14 | | | 4.750 | % | | | 3,410,000 | | | | 3,559,324 | | |
The accompanying Notes to Financial Statements are an integral part of this statement.
Annual Report 2013
7
Columbia Short Term Municipal Bond Fund
Portfolio of Investments (continued)
April 30, 2013
Municipal Bonds (continued)
Issue
Description | | Coupon
Rate | | Principal
Amount ($) | | Value ($) | |
Revenue Bonds
Senior International Private Activity
Series 2012 AMT
05/15/16 | | | 4.000 | % | | | 2,000,000 | | | | 2,195,360 | | |
City of San Jose Airport Revenue
Revenue Bonds
Series 2007-A AMBAC AMT(a)
03/01/17 | | | 5.000 | % | | | 5,415,000 | | | | 6,181,331 | | |
City of San Jose
Revenue Bonds
Series 2007A (AMBAC) AMT(a)
03/01/15 | | | 5.000 | % | | | 3,180,000 | | | | 3,429,948 | | |
County of Sacramento
Revenue Bonds
GNMA Mortgage
Series 1998A Escrowed to Maturity AMT(a)
07/01/16 | | | 8.000 | % | | | 12,810,000 | | | | 15,501,765 | | |
Los Angeles Department of Water & Power
Revenue Bonds
Power System
Series 2012C
01/01/16 | | | 5.000 | % | | | 10,000,000 | | | | 11,106,400 | | |
M-S-R Public Power Agency
Revenue Bonds
Subordinated Lien
Series 2011O
07/01/14 | | | 4.000 | % | | | 2,300,000 | | | | 2,398,164 | | |
Northern California Power Agency
Revenue Bonds
Series 2010A
07/01/15 | | | 4.000 | % | | | 1,355,000 | | | | 1,457,817 | | |
Port of Oakland
Refunding Revenue Bonds
Intermediate Lien
Series 2007B (NPFCG)
11/01/16 | | | 5.000 | % | | | 8,160,000 | | | | 9,410,275 | | |
Port of Oakland(a)
Refunding Revenue Bonds
Intermediate Lien
Series 2007A (NPFGC) AMT
11/01/13 | | | 5.000 | % | | | 5,610,000 | | | | 5,744,752 | | |
State of California
Prerefunded 07/01/14 Unlimited General Obligation Bonds
Series 2004A
07/01/15 | | | 5.000 | % | | | 1,170,000 | | | | 1,234,432 | | |
Unlimited General Obligation Bonds
Series 2010
11/01/13 | | | 4.000 | % | | | 1,650,000 | | | | 1,681,697 | | |
11/01/14 | | | 4.000 | % | | | 1,250,000 | | | | 1,319,938 | | |
Various Purpose
Series 2005
03/01/15 | | | 5.000 | % | | | 4,000,000 | | | | 4,337,840 | | |
Municipal Bonds (continued)
Issue
Description | | Coupon
Rate | | Principal
Amount ($) | | Value ($) | |
Series 2006
03/01/14 | | | 5.000 | % | | | 4,000,000 | | | | 4,159,840 | | |
Series 2011
10/01/16 | | | 5.000 | % | | | 20,000,000 | | | | 22,928,000 | | |
Series 2012
09/01/15 | | | 5.000 | % | | | 5,000,000 | | | | 5,526,350 | | |
Unlimited General Obligation Refunding Bonds
Series 2004
12/01/15 | | | 5.000 | % | | | 2,200,000 | | | | 2,313,344 | | |
Series 2007
11/01/14 | | | 5.000 | % | | | 7,530,000 | | | | 8,064,178 | | |
Series 2009B
07/01/23 | | | 5.000 | % | | | 19,250,000 | | | | 20,284,302 | | |
Series 2012
02/01/15 | | | 5.000 | % | | | 15,885,000 | | | | 17,170,096 | | |
Unrefunded Unlimited General Obligation Bonds
Series 2004A
07/01/15 | | | 5.000 | % | | | 1,690,000 | | | | 1,785,316 | | |
Total | | | | | | | 208,988,888 | | |
Colorado 1.9% | |
City & County of Denver Airport System(a)
Revenue Bonds
Series 2011A AMT
11/15/15 | | | 5.000 | % | | | 1,500,000 | | | | 1,663,920 | | |
Series 2011B AMT
11/15/15 | | | 5.000 | % | | | 8,000,000 | | | | 8,874,240 | | |
System
Series 2012A AMT
11/15/14 | | | 4.000 | % | | | 500,000 | | | | 527,895 | | |
11/15/15 | | | 4.000 | % | | | 500,000 | | | | 542,055 | | |
City of Colorado Springs Utilities System
Refunding Revenue Bonds
Series 2011A
11/15/14 | | | 4.000 | % | | | 5,380,000 | | | | 5,682,948 | | |
Colorado Health Facilities Authority
Unrefunded Revenue bonds
Catholic Health Initiatives
Series 2008-D
10/01/38 | | | 5.250 | % | | | 1,940,000 | | | | 1,991,332 | | |
Colorado Health Facilities Authority(b)
Prerefunded 11/12//13 Revenue Bonds
Catholic Health Initiatives
Series 2008
10/01/38 | | | 5.250 | % | | | 245,000 | | | | 251,520 | | |
Prerefunded 11/12/13 Revenue Bonds
Catholic Health Initiatives
Series 2008D2
10/01/38 | | | 5.250 | % | | | 315,000 | | | | 323,382 | | |
Denver Urban Renewal Authority
Tax Allocation Bonds
Stapleton
Senior Series 2013A-1
12/01/14 | | | 5.000 | % | | | 2,500,000 | | | | 2,674,975 | | |
12/01/15 | | | 5.000 | % | | | 1,670,000 | | | | 1,851,429 | | |
The accompanying Notes to Financial Statements are an integral part of this statement.
Annual Report 2013
8
Columbia Short Term Municipal Bond Fund
Portfolio of Investments (continued)
April 30, 2013
Municipal Bonds (continued)
Issue
Description | | Coupon
Rate | | Principal
Amount ($) | | Value ($) | |
Denver Wastewater Management Division Department of
Public Works
Revenue Bonds
Series 2012
11/01/14 | | | 5.000 | % | | | 2,440,000 | | | | 2,612,581 | | |
E-470 Public Highway Authority
Revenue Bonds
Senior Capital Appreciation
Series 1997B (NPFGC)(c)
09/01/16 | | | 0.000 | % | | | 4,460,000 | | | | 4,118,319 | | |
Regional Transportation District
Certificate of Participation
Series 2010A
06/01/15 | | | 5.000 | % | | | 1,420,000 | | | | 1,548,538 | | |
06/01/16 | | | 5.000 | % | | | 2,010,000 | | | | 2,264,024 | | |
Regional Transportation District(d)
Certificate of Participation
Series 2013A
06/01/16 | | | 5.000 | % | | | 3,045,000 | | | | 3,429,827 | | |
Total | | | | | | | 38,356,985 | | |
Connecticut 2.1% | |
City of Bridgeport
Unlimited General Obligation Refunding Bonds
Series 2012B
08/15/15 | | | 4.000 | % | | | 2,500,000 | | | | 2,672,600 | | |
08/15/17 | | | 5.000 | % | | | 5,000,000 | | | | 5,736,000 | | |
Connecticut Housing Finance Authority
Revenue Bonds
Subordinated Series 2012D-1
11/15/14 | | | 0.850 | % | | | 3,215,000 | | | | 3,231,493 | | |
11/15/15 | | | 1.200 | % | | | 3,710,000 | | | | 3,750,550 | | |
Connecticut State Development Authority
Refunding Revenue Bonds
Connecticut Light & Power Co.
Series 2011
09/01/28 | | | 1.250 | % | | | 6,000,000 | | | | 6,019,800 | | |
Connecticut State Development Authority(a)
Revenue Bonds
Connecticut Light & Power
Series 1996A AMT
05/01/31 | | | 1.550 | % | | | 10,000,000 | | | | 10,082,400 | | |
State of Connecticut
Unlimited General Obligation Bonds
Series 2011A(b)
05/15/15 | | | 0.690 | % | | | 11,265,000 | | | | 11,275,815 | | |
Total | | | | | | | 42,768,658 | | |
Delaware 0.5% | |
University of Delaware
Revenue Bonds
Series 2009A(b)
11/01/37 | | | 0.850 | % | | | 9,500,000 | | | | 9,504,750 | | |
Municipal Bonds (continued)
Issue
Description | | Coupon
Rate | | Principal
Amount ($) | | Value ($) | |
District of Columbia 0.3% | |
District of Columbia
Certificate of Participation
Series 2006 (NPFGC/FGIC)
01/01/17 | | | 5.250 | % | | | 5,925,000 | | | | 6,598,258 | | |
Florida 8.1% | |
Citizens Property Insurance Corp.
Revenue Bonds
High Risk
Senior Secured Series 2010A-1
06/01/15 | | | 5.000 | % | | | 13,750,000 | | | | 14,964,537 | | |
High Risk Senior Secured
Series 2010-A-1 AGM
06/01/15 | | | 5.000 | % | | | 6,155,000 | | | | 6,725,569 | | |
Senior Secured
Series 2012A-1
06/01/17 | | | 5.000 | % | | | 15,000,000 | | | | 17,307,450 | | |
Citizens Property Insurance Corp.(b)
Revenue Bonds
High Risk
Series 2010A3
06/01/13 | | | 1.940 | % | | | 10,000,000 | | | | 10,013,324 | | |
City of Jacksonville
Refunding Revenue Bonds
Series 2012-C
10/01/14 | | | 5.000 | % | | | 1,250,000 | | | | 1,332,600 | | |
Series 2012-C
10/01/15 | | | 5.000 | % | | | 1,000,000 | | | | 1,108,080 | | |
Better Jacksonville
Series 2012
10/01/17 | | | 5.000 | % | | | 2,000,000 | | | | 2,343,340 | | |
Revenue Bonds
Series 2010A-1
10/01/16 | | | 5.000 | % | | | 5,000,000 | | | | 5,735,700 | | |
City of Tampa
Revenue Bonds
Baycare Health Systems
Series 2010
11/15/16 | | | 5.000 | % | | | 2,000,000 | | | | 2,281,620 | | |
County of Hillsborough Solid Waste & Resource Recovery
Revenue Bonds
Series 2006A (AMBAC) AMT(a)
09/01/14 | | | 5.000 | % | | | 3,025,000 | | | | 3,205,169 | | |
County of Miami-Dade
Revenue Bonds
Miami International Airport
Series 2007C (AGM) AMT(a)
10/01/13 | | | 5.000 | % | | | 3,500,000 | | | | 3,569,650 | | |
Florida Department of Environmental Protection
Refunding Revenue Bonds
Florida Forever
Series 2011B
07/01/15 | | | 5.000 | % | | | 15,335,000 | | | | 16,829,089 | | |
The accompanying Notes to Financial Statements are an integral part of this statement.
Annual Report 2013
9
Columbia Short Term Municipal Bond Fund
Portfolio of Investments (continued)
April 30, 2013
Municipal Bonds (continued)
Issue
Description | | Coupon
Rate | | Principal
Amount ($) | | Value ($) | |
Series 2012A
07/01/16 | | | 4.000 | % | | | 13,915,000 | | | | 15,363,412 | | |
07/01/17 | | | 4.000 | % | | | 14,470,000 | | | | 16,298,574 | | |
Florida Housing Finance Corp.
Revenue Bonds
Homeowner Mortgage Special Program
Series 2010A (GNMA/FNMA/FHLMC)
07/01/28 | | | 5.000 | % | | | 2,845,000 | | | | 3,047,564 | | |
Florida Hurricane Catastrophe Fund Finance Corp.
Revenue Bonds
Series 2010-A
07/01/15 | | | 5.000 | % | | | 10,000,000 | | | | 10,984,600 | | |
Florida Municipal Loan Council
Revenue Bonds
9B Design-Build Finance Project
Series 2012
08/15/16 | | | 1.750 | % | | | 9,250,000 | | | | 9,358,595 | | |
Florida Ports Financing Commission
Refunding Revenue Bonds
State Transportation Fund
Series 2011B AMT(a)
06/01/14 | | | 5.000 | % | | | 2,000,000 | | | | 2,097,760 | | |
Orange County Health Facilities Authority
Revenue Bonds
Hospital-Orlando Health, Inc.
Series 2009
10/01/14 | | | 5.000 | % | | | 2,000,000 | | | | 2,115,940 | | |
St. Johns River Power Park
Refunding Revenue Bonds
Issue 2
Series 2011-23
10/01/17 | | | 5.000 | % | | | 3,000,000 | | | | 3,534,930 | | |
State of Florida
Unlimited General Obligation Refunding Bonds
Capital Outlay
Series 2009D
06/01/14 | | | 5.000 | % | | | 16,460,000 | | | | 17,316,085 | | |
Total | | | | | | | 165,533,588 | | |
Georgia 3.0% | |
Burke County Development Authority
Revenue Bonds
Georgia Power Co. Plant Vogtle Project
Series 1994-9T
10/01/32 | | | 1.200 | % | | | 7,500,000 | | | | 7,553,625 | | |
Series 1995-4T
10/01/32 | | | 1.200 | % | | | 2,000,000 | | | | 2,011,720 | | |
Series 2012
11/01/48 | | | 1.550 | % | | | 5,000,000 | | | | 5,051,200 | | |
12/01/49 | | | 1.750 | % | | | 3,000,000 | | | | 3,091,290 | | |
12/01/49 | | | 1.750 | % | | | 8,000,000 | | | | 8,204,480 | | |
City of Atlanta Department of Aviation
Refunding Revenue Bonds
Series 2003D (FGIC/NPFGC) AMT(a)
01/01/15 | | | 5.250 | % | | | 5,000,000 | | | | 5,156,100 | | |
Municipal Bonds (continued)
Issue
Description | | Coupon
Rate | | Principal
Amount ($) | | Value ($) | |
Floyd County Development Authority
Revenue Bonds
Georgia Power Company Plant Hammond Project
Series 2012
07/01/22 | | | 0.850 | % | | | 4,750,000 | | | | 4,777,597 | | |
Gwinnett County School District
Unlimited General Obligation Bonds
Sales Tax
Series 2012A
10/01/16 | | | 4.000 | % | | | 9,500,000 | | | | 10,618,910 | | |
Municipal Electric Authority of Georgia
Prerefunded 01/01/14 Revenue Bonds
Series 1998Y (AGM)
01/01/17 | | | 6.500 | % | | | 100,000 | | | | 104,191 | | |
Revenue Bonds
Combined Cycle Project
Series 2012A
11/01/14 | | | 4.000 | % | | | 1,000,000 | | | | 1,053,930 | | |
11/01/15 | | | 4.000 | % | | | 3,045,000 | | | | 3,304,282 | | |
Unrefunded Revenue Bonds
Series 1998Y (AGM)
01/01/17 | | | 6.500 | % | | | 6,200,000 | | | | 6,845,234 | | |
Public Gas Partners, Inc.
Revenue Bonds
Series 2009A
10/01/14 | | | 5.000 | % | | | 3,630,000 | | | | 3,852,592 | | |
Total | | | | | | | 61,625,151 | | |
Hawaii 0.4% | |
State of Hawaii Airports System
Refunding Revenue Bonds
Series 2010B AMT(a)
07/01/15 | | | 5.000 | % | | | 7,000,000 | | | | 7,659,680 | | |
Idaho 0.3% | |
Idaho Housing & Finance Association
Revenue Bonds
Series 2011
08/15/13 | | | 4.000 | % | | | 5,525,000 | | | | 5,585,775 | | |
Illinois 9.5% | |
Chicago Board of Education
Unlimited General Obligation Refunding Bonds
Series 2010F
12/01/15 | | | 5.000 | % | | | 2,000,000 | | | | 2,221,060 | | |
Chicago Board of Education(c)
Unlimited General Obligation Bonds
Capital Appreciation-Chicago School Reform
Series 1997A (AMBAC)
12/01/14 | | | 0.000 | % | | | 7,085,000 | | | | 6,997,288 | | |
Chicago Public Building Commission
Refunding Revenue Bonds
Chicago School Reform
Series 1999B (NPFGC/FGIC)
12/01/15 | | | 5.250 | % | | | 3,165,000 | | | | 3,505,934 | | |
The accompanying Notes to Financial Statements are an integral part of this statement.
Annual Report 2013
10
Columbia Short Term Municipal Bond Fund
Portfolio of Investments (continued)
April 30, 2013
Municipal Bonds (continued)
Issue
Description | | Coupon
Rate | | Principal
Amount ($) | | Value ($) | |
Chicago Transit Authority
Revenue Bonds
Federal Transportation Administration Section 5307 Funds
Series 2006 (AMBAC)
06/01/15 | | | 5.000 | % | | | 2,615,000 | | | | 2,831,313 | | |
City of Chicago Midway Airport
Refunding Revenue Bonds
2nd Lien
Series 2004B (AMBAC)
01/01/18 | | | 5.000 | % | | | 5,120,000 | | | | 5,459,917 | | |
Revenue Bonds
2nd Lien
Series 2010B
01/01/34 | | | 5.000 | % | | | 5,500,000 | | | | 5,873,670 | | |
City of Chicago O'Hare International Airport(a)
Refunding Revenue Bonds
General-Senior Lien
Series 2012A AMT
01/01/17 | | | 5.000 | % | | | 8,000,000 | | | | 9,168,720 | | |
Passenger Facility Charge
Series 2012B AMT
01/01/17 | | | 5.000 | % | | | 13,125,000 | | | | 15,042,431 | | |
County of Cook
Unlimited General Obligation Bonds
Capital Equipment
Series 2009D
11/15/14 | | | 5.000 | % | | | 3,000,000 | | | | 3,203,340 | | |
Illinois Finance Authority
Prerefunded 07/01/13 Revenue Bonds
Art Institute of Chicago
Series 2010B
07/01/15 | | | 4.000 | % | | | 13,850,000 | | | | 13,938,778 | | |
Revenue Bonds
Art Institute of Chicago
Series 2010A
03/01/15 | | | 5.000 | % | | | 3,200,000 | | | | 3,453,056 | | |
Series 2012A
03/01/14 | | | 4.000 | % | | | 1,000,000 | | | | 1,030,250 | | |
03/01/15 | | | 5.000 | % | | | 1,000,000 | | | | 1,081,890 | | |
Ascension Health
Series 2012E
11/15/42 | | | 5.000 | % | | | 2,750,000 | | | | 2,993,430 | | |
Northwestern Memorial Hospital
Series 2009A
08/15/13 | | | 5.000 | % | | | 3,500,000 | | | | 3,547,740 | | |
University of Chicago
Series 1998
07/01/25 | | | 3.375 | % | | | 5,650,000 | | | | 5,782,888 | | |
Railsplitter Tobacco Settlement Authority
Revenue Bonds
Series 2010
06/01/15 | | | 5.000 | % | | | 3,615,000 | | | | 3,905,140 | | |
06/01/16 | | | 5.000 | % | | | 8,280,000 | | | | 9,229,964 | | |
Municipal Bonds (continued)
Issue
Description | | Coupon
Rate | | Principal
Amount ($) | | Value ($) | |
Regional Transportation Authority
Revenue Bonds
Series 2006A (NPFGC)
07/01/18 | | | 5.000 | % | | | 4,970,000 | | | | 5,611,329 | | |
State of Illinois
Revenue Bonds
Series 2012B
06/15/17 | | | 5.000 | % | | | 9,000,000 | | | | 10,398,690 | | |
Unlimited General Obligation Refunding Bonds
Series 2002 XLCA
08/01/15 | | | 5.500 | % | | | 7,825,000 | | | | 8,604,135 | | |
Series 2006
01/01/16 | | | 5.000 | % | | | 4,655,000 | | | | 5,119,569 | | |
Series 2010
01/01/14 | | | 5.000 | % | | | 19,590,000 | | | | 20,151,449 | | |
01/01/16 | | | 5.000 | % | | | 10,000,000 | | | | 10,998,000 | | |
Series 2010 (AGM)
01/01/16 | | | 5.000 | % | | | 4,250,000 | | | | 4,680,058 | | |
Series 2010 Escrowed to Maturity
01/01/14 | | | 5.000 | % | | | 6,045,000 | | | | 6,235,659 | | |
Series 2012
08/01/16 | | | 5.000 | % | | | 20,000,000 | | | | 22,348,400 | | |
Total | | | | | | | 193,414,098 | | |
Indiana 2.2% | |
City of Whiting
Revenue Bonds
BP Products North America, Inc.
Series 2008
06/01/44 | | | 2.800 | % | | | 13,250,000 | | | | 13,604,835 | | |
Indiana Finance Authority
Refunding Revenue Bonds
Series 2008-A-1
11/01/16 | | | 5.000 | % | | | 2,665,000 | | | | 3,051,665 | | |
Revenue Bonds
2nd Lien-CWA
Series 2011C
10/01/16 | | | 3.000 | % | | | 10,000,000 | | | | 10,666,300 | | |
Indiana Finance Authority(b)
Revenue Bonds
Republic Services, Inc. Project
Series 2010B
05/01/28 | | | 0.400 | % | | | 18,000,000 | | | | 18,000,000 | | |
Total | | | | | | | 45,322,800 | | |
Iowa 1.7% | |
Iowa Finance Authority
Revenue Bonds
Genesis Health System
Series 2010
07/01/15 | | | 5.000 | % | | | 1,075,000 | | | | 1,175,566 | | |
07/01/16 | | | 5.000 | % | | | 1,150,000 | | | | 1,294,291 | | |
The accompanying Notes to Financial Statements are an integral part of this statement.
Annual Report 2013
11
Columbia Short Term Municipal Bond Fund
Portfolio of Investments (continued)
April 30, 2013
Municipal Bonds (continued)
Issue
Description | | Coupon
Rate | | Principal
Amount ($) | | Value ($) | |
Iowa Student Loan Liquidity Corp.
Revenue Bonds
Series 2009-1
12/01/14 | | | 3.750 | % | | | 5,050,000 | | | | 5,228,063 | | |
12/01/14 | | | 5.000 | % | | | 5,475,000 | | | | 5,779,355 | | |
Iowa Student Loan Liquidity Corp.(a)
Revenue Bonds
Senior Series 2011A-1 AMT
12/01/15 | | | 3.500 | % | | | 20,300,000 | | | | 21,405,335 | | |
Total | | | | | | | 34,882,610 | | |
Kentucky 0.1% | |
Kentucky Economic Development Finance Authority
Revenue Bonds
Catholic Health
Series 2009B
05/01/39 | | | 5.000 | % | | | 2,000,000 | | | | 2,132,140 | | |
Louisiana 2.4% | |
Louisiana Local Government Environmental Facilities & Community Development Authority
Revenue Bonds
LCTCS Facilities Corp. Project
Series 2009A
10/01/14 | | | 4.000 | % | | | 1,545,000 | | | | 1,617,213 | | |
Louisiana Office Facilities Corp.
Refunding Revenue Bonds
State Capitol
Series 2010A
05/01/16 | | | 5.000 | % | | | 4,505,000 | | | | 5,047,222 | | |
Louisiana Offshore Terminal Authority
Revenue Bonds
Loop LLC Project
Series 2010B-1(b)
10/01/40 | | | 1.875 | % | | | 3,500,000 | | | | 3,521,910 | | |
Louisiana Public Facilities Authority
Revenue Bonds
Entergy Gulf States Louisiana
Series 2010B
11/01/15 | | | 2.875 | % | | | 2,750,000 | | | | 2,842,180 | | |
Orleans Parish Parishwide School District
Unlimited General Obligation Refunding Bonds
Series 2010 (AGM)
09/01/15 | | | 4.000 | % | | | 8,240,000 | | | | 8,813,257 | | |
09/01/16 | | | 5.000 | % | | | 3,785,000 | | | | 4,252,107 | | |
Regional Transit Authority
Revenue Bonds
Sales Tax
Series 2010 (AGM)
12/01/15 | | | 4.000 | % | | | 1,150,000 | | | | 1,243,069 | | |
12/01/16 | | | 4.000 | % | | | 1,000,000 | | | | 1,105,750 | | |
Municipal Bonds (continued)
Issue
Description | | Coupon
Rate | | Principal
Amount ($) | | Value ($) | |
State of Louisiana Gasoline & Fuels Tax
Revenue Bonds
2nd Lien
Series 2010A-1(b)
05/01/43 | | | 0.940 | % | | | 21,250,000 | | | | 21,253,825 | | |
Total | | | | | | | 49,696,533 | | |
Maine 0.4% | |
Maine Health & Higher Educational Facilities Authority
Revenue Bonds
Escrowed to Maturity
Series 2010-B
07/01/15 | | | 5.000 | % | | | 50,000 | | | | 54,894 | | |
07/01/16 | | | 4.000 | % | | | 50,000 | | | | 55,329 | | |
Unrefunded Revenue Bonds
Series 2010-B
07/01/15 | | | 5.000 | % | | | 3,405,000 | | | | 3,702,325 | | |
Series 2010-B
07/01/16 | | | 4.000 | % | | | 3,505,000 | | | | 3,812,704 | | |
Total | | | | | | | 7,625,252 | | |
Massachusetts 3.9% | |
Commonwealth of Massachusetts(b)
Unlimited General Obligation Bonds
Series 2010A
02/01/14 | | | 0.720 | % | | | 5,050,000 | | | | 5,056,716 | | |
Unlimited General Obligation Refunding Bonds
Series 2011A
02/01/14 | | | 0.670 | % | | | 6,680,000 | | | | 6,680,000 | | |
02/01/15 | | | 0.850 | % | | | 2,000,000 | | | | 2,000,000 | | |
Massachusetts Development Finance Agency
Revenue Bonds
Boston Medical Center
Series 2012C
07/01/15 | | | 5.000 | % | | | 2,000,000 | | | | 2,152,840 | | |
07/01/16 | | | 5.000 | % | | | 1,600,000 | | | | 1,770,048 | | |
Boston University
Series 2009V-2
10/01/14 | | | 2.875 | % | | | 4,975,000 | | | | 5,148,379 | | |
Tufts University
Series 2011-P
02/15/36 | | | 3.000 | % | | | 3,700,000 | | | | 3,943,016 | | |
Massachusetts Development Finance Agency(b)
Revenue Bonds
Partners Healthcare
Series 2011K-3
07/01/38 | | | 0.840 | % | | | 8,430,000 | | | | 8,430,000 | | |
Williams College
Series 2011N
07/01/41 | | | 0.690 | % | | | 11,250,000 | | | | 11,263,275 | | |
Massachusetts Educational Financing Authority
Revenue Bonds
Series 2009I
01/01/16 | | | 5.250 | % | | | 12,500,000 | | | | 13,711,500 | | |
The accompanying Notes to Financial Statements are an integral part of this statement.
Annual Report 2013
12
Columbia Short Term Municipal Bond Fund
Portfolio of Investments (continued)
April 30, 2013
Municipal Bonds (continued)
Issue
Description | | Coupon
Rate | | Principal
Amount ($) | | Value ($) | |
Massachusetts Housing Finance Agency
Revenue Bonds
Construction Loan Notes
Series 2012A
11/01/13 | | | 0.800 | % | | | 1,800,000 | | | | 1,800,576 | | |
Revenue Notes
Construction Loan Notes
Series 2012-F
12/01/14 | | | 0.650 | % | | | 2,760,000 | | | | 2,762,815 | | |
Massachusetts Municipal Wholesale Electric Co.
Revenue Bonds
Project 6
Series 2012A
07/01/15 | | | 5.000 | % | | | 1,500,000 | | | | 1,644,435 | | |
Massachusetts Port Authority(a)
Refunding Revenue Bonds
Series 2010E AMT
07/01/14 | | | 5.000 | % | | | 5,000,000 | | | | 5,250,500 | | |
07/01/15 | | | 5.000 | % | | | 4,000,000 | | | | 4,346,080 | | |
University of Massachusetts Building Authority
Refunding Revenue Bonds
Senior Series 2005-2 (AMBAC)
11/01/15 | | | 5.000 | % | | | 3,000,000 | | | | 3,325,530 | | |
Total | | | | | | | 79,285,710 | | |
Michigan 3.0% | |
City of Detroit Sewage Disposal System
Refunding Revenue Bonds
Senior Lien
Series 2012A
07/01/15 | | | 5.000 | % | | | 1,505,000 | | | | 1,614,654 | | |
07/01/17 | | | 5.000 | % | | | 1,500,000 | | | | 1,678,830 | | |
Detroit City School District
Unlimited General Obligation Refunding Bonds
Improvement School Building & Site
Series 2012A (Qualified School Board Loan Fund)
05/01/14 | | | 4.000 | % | | | 1,700,000 | | | | 1,756,729 | | |
Michigan Finance Authority
Revenue Bonds
Unemployment Obligation Assessment
Series 2012
07/01/15 | | | 5.000 | % | | | 20,000,000 | | | | 22,044,800 | | |
Michigan State Hospital Finance Authority
Revenue Bonds
Ascension Health Care Group
Series 1999
11/15/33 | | | 0.900 | % | | | 5,000,000 | | | | 5,041,750 | | |
Ascension Health Senior Care Group
Series 2010
11/15/15 | | | 5.000 | % | | | 2,000,000 | | | | 2,224,460 | | |
Michigan Strategic Fund
Refunding Revenue Bonds
Dow Chemical
Series 2003B-1
06/01/14 | | | 6.250 | % | | | 12,000,000 | | | | 12,698,520 | | |
Municipal Bonds (continued)
Issue
Description | | Coupon
Rate | | Principal
Amount ($) | | Value ($) | |
Wayne County Airport Authority
Refunding Revenue Bonds
Detroit Metro Airport
Series 2010C
12/01/14 | | | 5.000 | % | | | 12,805,000 | | | | 13,700,710 | | |
Total | | | | | | | 60,760,453 | | |
Minnesota 0.9% | |
Minneapolis-St. Paul Metropolitan Airports Commission(a)
Refunding Revenue Bonds
Senior Series 2009B AMT
01/01/14 | | | 5.000 | % | | | 2,055,000 | | | | 2,120,246 | | |
Subordinated Series 2010D AMT
01/01/16 | | | 5.000 | % | | | 5,160,000 | | | | 5,663,513 | | |
State of Minnesota
Refunding Revenue Bonds
Appropriation
Series 2012-B
03/01/16 | | | 4.000 | % | | | 9,820,000 | | | | 10,786,681 | | |
Total | | | | | | | 18,570,440 | | |
Mississippi 0.2% | |
Mississippi Development Bank
Revenue Bonds
Marshall County Industrial Development Authority
Series 2012
01/01/14 | | | 4.000 | % | | | 1,845,000 | | | | 1,889,981 | | |
01/01/15 | | | 4.000 | % | | | 375,000 | | | | 396,919 | | |
01/01/16 | | | 4.000 | % | | | 1,500,000 | | | | 1,628,595 | | |
Total | | | | | | | 3,915,495 | | |
Missouri 0.8% | |
Bi-State Development Agency of the Missouri-Illinois
Metropolitan District
Revenue Bonds
Metrolink Cross County Project
Series 2002B (AGM)
10/01/15 | | | 5.250 | % | | | 10,500,000 | | | | 10,720,710 | | |
Missouri State Board of Public Buildings
Refunding Revenue Bonds
Series 2011A
10/01/16 | | | 3.000 | % | | | 6,195,000 | | | | 6,679,945 | | |
Total | | | | | | | 17,400,655 | | |
Nevada 0.7% | |
City of Reno
Revenue Bonds
Renown Regional Medical Center Project
Series 2007A
06/01/13 | | | 5.000 | % | | | 500,000 | | | | 501,781 | | |
The accompanying Notes to Financial Statements are an integral part of this statement.
Annual Report 2013
13
Columbia Short Term Municipal Bond Fund
Portfolio of Investments (continued)
April 30, 2013
Municipal Bonds (continued)
Issue
Description | | Coupon
Rate | | Principal
Amount ($) | | Value ($) | |
Las Vegas Convention & Visitors Authority
Refunding Revenue Bonds
Series 2005 (AMBAC)
07/01/17 | | | 5.000 | % | | | 13,380,000 | | | | 14,518,103 | | |
Total | | | | | | | 15,019,884 | | |
New Jersey 4.1% | |
City of Newark
Refunding Unlimited General Obligation Bonds
Qualified General Improvement
Series 2013-A
07/15/15 | | | 5.000 | % | | | 2,000,000 | | | | 2,192,800 | | |
07/15/16 | | | 5.000 | % | | | 5,845,000 | | | | 6,614,903 | | |
City of Trenton
Unlimited General Obligation Refunding Bonds
Series 2013
07/15/15 | | | 3.000 | % | | | 1,000,000 | | | | 1,053,240 | | |
07/15/16 | | | 4.000 | % | | | 1,100,000 | | | | 1,209,098 | | |
County of Union
Unlimited General Obligation Bonds
Series 2012B
03/01/15 | | | 3.000 | % | | | 4,060,000 | | | | 4,250,130 | | |
03/01/16 | | | 3.000 | % | | | 4,080,000 | | | | 4,352,177 | | |
03/01/17 | | | 3.000 | % | | | 4,085,000 | | | | 4,425,526 | | |
New Brunswick Parking Authority
Refunding Revenue Bonds
City Guaranteed Parking
Series 2012
09/01/13 | | | 2.000 | % | | | 1,150,000 | | | | 1,156,348 | | |
09/01/15 | | | 3.000 | % | | | 1,500,000 | | | | 1,575,855 | | |
New Jersey Building Authority
Refunding Revenue Bonds
Series 2007B
06/15/13 | | | 5.000 | % | | | 8,205,000 | | | | 8,254,375 | | |
New Jersey Economic Development Authority
Refunding Revenue Bonds
School Facilities Construction
Series 2010DD-1
12/15/17 | | | 5.000 | % | | | 4,435,000 | | | | 5,240,440 | | |
Transportation Project Sublease
Series 2008A
05/01/17 | | | 5.000 | % | | | 11,345,000 | | | | 13,173,133 | | |
Revenue Bonds
School Facilities Construction
Series 2009-Z
12/15/14 | | | 5.000 | % | | | 12,800,000 | | | | 13,762,176 | | |
New Jersey State Turnpike Authority
Revenue Bonds
Series 2013D(c)(d)
01/01/22 | | | 0.000 | % | | | 4,000,000 | | | | 4,000,760 | | |
New Jersey Transportation Trust Fund Authority
Revenue Bonds
Transportation Program
Series 2012-AA
06/15/14 | | | 4.000 | % | | | 3,000,000 | | | | 3,123,990 | | |
Municipal Bonds (continued)
Issue
Description | | Coupon
Rate | | Principal
Amount ($) | | Value ($) | |
Unrefunded Revenue Bonds
Transportation System
Series 1999
06/15/16 | | | 5.750 | % | | | 4,860,000 | | | | 5,605,816 | | |
State of New Jersey
Certificate of Participation
Equipment Lease Purchase
Series 2004A
06/15/15 | | | 5.000 | % | | | 3,000,000 | | | | 3,144,630 | | |
Total | | | | | | | 83,135,397 | | |
New Mexico 0.8% | |
Incorporated County of Los Alamos
Revenue Bonds
Series 2004A (AGM)
07/01/15 | | | 5.000 | % | | | 2,555,000 | | | | 2,572,451 | | |
New Mexico Educational Assistance Foundation
Revenue Bonds
Educational Loan
Senior Series 2009C AMT(a)
09/01/14 | | | 3.900 | % | | | 4,890,000 | | | | 5,077,238 | | |
State of New Mexico
Revenue Bonds
Series 2009A
07/01/14 | | | 5.000 | % | | | 7,895,000 | | | | 8,336,488 | | |
Total | | | | | | | 15,986,177 | | |
New York 9.1% | |
Babylon Industrial Development Agency
Revenue Bonds
Covanta Babylon
Series 2009A
01/01/14 | | | 5.000 | % | | | 2,000,000 | | | | 2,057,180 | | |
Buffalo & Fort Erie Public Bridge Authority
Refunding Revenue Bonds
Series 2005(b)
01/01/25 | | | 2.625 | % | | | 9,255,000 | | | | 9,411,965 | | |
City of New York
Unlimited General Obligation Bonds
Series 2004H-A
03/01/15 | | | 5.000 | % | | | 6,500,000 | | | | 7,046,000 | | |
Series 2005G
08/01/18 | | | 5.000 | % | | | 3,650,000 | | | | 4,083,802 | | |
Series 2005J (FGIC)
03/01/16 | | | 5.000 | % | | | 8,000,000 | | | | 8,668,400 | | |
Series 2005O
06/01/14 | | | 5.000 | % | | | 4,250,000 | | | | 4,468,747 | | |
Series 2009E
08/01/15 | | | 5.000 | % | | | 3,500,000 | | | | 3,857,210 | | |
Subordinated Series 1996-J2
02/15/15 | | | 5.000 | % | | | 5,870,000 | | | | 6,351,575 | | |
City of Rochester
Limited General Obligation Bonds
Series 2012-I
08/15/14 | | | 2.000 | % | | | 2,400,000 | | | | 2,453,280 | | |
The accompanying Notes to Financial Statements are an integral part of this statement.
Annual Report 2013
14
Columbia Short Term Municipal Bond Fund
Portfolio of Investments (continued)
April 30, 2013
Municipal Bonds (continued)
Issue
Description | | Coupon
Rate | | Principal
Amount ($) | | Value ($) | |
City of Yonkers
Refunding Limited General Obligation Bonds
Series 2012-A
07/01/15 | | | 4.000 | % | | | 1,250,000 | | | | 1,328,325 | | |
County of Monroe
Limited General Obligation Refunding Bonds
Series 2012
03/01/15 | | | 5.000 | % | | | 1,000,000 | | | | 1,078,340 | | |
County of Rockland
General Obligation Limited Notes
BAN Series 2012B
06/06/13 | | | 4.000 | % | | | 1,250,000 | | | | 1,251,403 | | |
Erie County Industrial Development Agency (The)
Revenue Bonds
Series 2012
05/01/15 | | | 5.000 | % | | | 2,000,000 | | | | 2,182,100 | | |
05/01/17 | | | 5.000 | % | | | 3,000,000 | | | | 3,486,000 | | |
Long Island Power Authority
Revenue Bonds
Series 2003B
06/01/13 | | | 5.250 | % | | | 4,250,000 | | | | 4,268,349 | | |
Series 2010A
05/01/14 | | | 4.000 | % | | | 4,015,000 | | | | 4,158,014 | | |
Metropolitan Transportation Authority
Revenue Bonds
Series 2003B (NPFGC/FGIC)
11/15/16 | | | 5.250 | % | | | 4,500,000 | | | | 4,617,540 | | |
Series 2012E
11/15/16 | | | 4.000 | % | | | 1,000,000 | | | | 1,113,150 | | |
11/15/17 | | | 5.000 | % | | | 1,000,000 | | | | 1,177,480 | | |
Subordinated Series 2012B-2
11/01/16 | | | 5.000 | % | | | 8,085,000 | | | | 9,315,699 | | |
New York City Health & Hospital Corp.
Revenue Bonds
Health System
Series 2010A
02/15/15 | | | 5.000 | % | | | 4,500,000 | | | | 4,858,605 | | |
New York City Transitional Finance Authority
Revenue Bonds
Future Tax Secured
Subordinated Series 2009C-1
08/01/14 | | | 5.000 | % | | | 6,795,000 | | | | 7,198,283 | | |
New York State Dormitory Authority
Refunding Revenue Bonds
Department of Health
Series 2004 (NPFGC/FGIC)
07/01/14 | | | 5.000 | % | | | 3,660,000 | | | | 3,851,345 | | |
Revenue Bonds
Mount Sinai School of Medicine
Series 2010A
07/01/15 | | | 5.000 | % | | | 1,000,000 | | | | 1,086,530 | | |
07/01/16 | | | 5.000 | % | | | 2,645,000 | | | | 2,959,252 | | |
Municipal Bonds (continued)
Issue
Description | | Coupon
Rate | | Principal
Amount ($) | | Value ($) | |
Municipal Facilities Health-Lease NYC
Series 2008-1
01/15/14 | | | 5.000 | % | | | 6,300,000 | | | | 6,510,168 | | |
New York State Housing Finance Agency
Refunding Revenue Bonds
Consolidated
Series 2011A
09/15/13 | | | 5.000 | % | | | 5,000,000 | | | | 5,089,200 | | |
Revenue Bonds
Affordable Housing
Series 2012-E
11/01/16 | | | 1.100 | % | | | 2,100,000 | | | | 2,101,785 | | |
New York State Thruway Authority
Revenue Bonds
General Revenue
Series 2012I
01/01/17 | | | 5.000 | % | | | 1,000,000 | | | | 1,150,390 | | |
Local Highway & Bridge
Series 2012A
04/01/15 | | | 4.000 | % | | | 10,000,000 | | | | 10,684,700 | | |
Port Authority of New York & New Jersey
Revenue Bonds
Consolidated 131st
Series 2003 (CIFG/TCRS) AMT(a)
12/15/16 | | | 5.000 | % | | | 10,000,000 | | | | 10,158,600 | | |
Suffolk County Water Authority
Revenue Bonds
BAN Series 2013-B
01/15/15 | | | 3.000 | % | | | 5,000,000 | | | | 5,227,000 | | |
Tobacco Settlement Financing Corp.
Asset-Backed Revenue Bonds
Series 2011B
06/01/14 | | | 5.000 | % | | | 7,950,000 | | | | 8,360,697 | | |
06/01/16 | | | 5.000 | % | | | 20,000,000 | | | | 22,676,200 | | |
Triborough Bridge & Tunnel Authority
Refunding Revenue Bonds
Series 2012-B
11/15/17 | | | 5.000 | % | | | 3,325,000 | | | | 3,959,743 | | |
United Nations Development Corp.
Refunding Revenue Bonds
Series 2009A
07/01/13 | | | 4.500 | % | | | 2,200,000 | | | | 2,215,972 | | |
07/01/14 | | | 5.000 | % | | | 2,000,000 | | | | 2,107,460 | | |
Utica School District
Unlimited General Obligation Refunding Bonds
Series 2013
07/01/14 | | | 2.000 | % | | | 1,000,000 | | | | 1,015,880 | | |
07/01/15 | | | 2.000 | % | | | 1,000,000 | | | | 1,019,570 | | |
07/01/16 | | | 3.000 | % | | | 1,000,000 | | | | 1,046,730 | | |
Total | | | | | | | 185,652,669 | | |
The accompanying Notes to Financial Statements are an integral part of this statement.
Annual Report 2013
15
Columbia Short Term Municipal Bond Fund
Portfolio of Investments (continued)
April 30, 2013
Municipal Bonds (continued)
Issue
Description | | Coupon
Rate | | Principal
Amount ($) | | Value ($) | |
North Carolina 1.3% | |
North Carolina Eastern Municipal Power Agency
Refunding Revenue Bonds
Series 2012D
01/01/16 | | | 5.000 | % | | | 5,875,000 | | | | 6,555,149 | | |
State of North Carolina
Refunding Revenue Bonds
Series 2011B
11/01/16 | | | 5.000 | % | | | 17,555,000 | | | | 20,248,112 | | |
Total | | | | | | | 26,803,261 | | |
North Dakota 1.1% | |
County of McLean
Revenue Bonds
Great River Energy
Series 2010C AMT(a)
07/01/38 | | | 3.500 | % | | | 22,000,000 | | | | 22,779,900 | | |
Ohio 2.2% | |
City of Cleveland
Refunding Limited General Obligation Bonds
Series 2012-A
12/01/14 | | | 2.000 | % | | | 865,000 | | | | 884,480 | | |
County of Franklin
Refunding Revenue Bonds
Ohiohealth Corp.
Series 2003C (NPFGC)
05/15/15 | | | 5.250 | % | | | 3,420,000 | | | | 3,427,148 | | |
05/15/16 | | | 5.250 | % | | | 4,090,000 | | | | 4,098,548 | | |
Ohio Air Quality Development Authority
Refunding Revenue Bonds
Ohio Power Co.
Series 2010A
06/01/41 | | | 3.250 | % | | | 6,150,000 | | | | 6,277,612 | | |
Ohio Air Quality Development Authority(a)(b)
Refunding Revenue Bonds
Ohio Power Co. Galvin
Series 2010A AMT
12/01/27 | | | 2.875 | % | | | 3,130,000 | | | | 3,183,836 | | |
Ohio Housing Finance Agency
Revenue Bonds
Series 2010-1
11/01/28 | | | 5.000 | % | | | 3,045,000 | | | | 3,294,020 | | |
State of Ohio
Unlimited General Obligation Refunding Bonds
Common Schools
Series 2009C
09/15/14 | | | 5.000 | % | | | 15,000,000 | | | | 15,969,900 | | |
State of Ohio(b)
Refunding Revenue Bonds
Republic Services, Inc. Project
Series 2010
11/01/35 | | | 0.400 | % | | | 7,650,000 | | | | 7,650,000 | | |
Total | | | | | | | 44,785,544 | | |
Municipal Bonds (continued)
Issue
Description | | Coupon
Rate | | Principal
Amount ($) | | Value ($) | |
Oklahoma 0.5% | |
Oklahoma County Finance Authority
Revenue Bonds
Midwest City—Delaware City Public Schools
Series 2012
03/01/14 | | | 2.000 | % | | | 1,750,000 | | | | 1,772,838 | | |
03/01/15 | | | 2.000 | % | | | 1,500,000 | | | | 1,536,075 | | |
Oklahoma County Independent School District No 89
Oklahoma City
Refunding Unlimited General Obligation Bonds
Series 2012
02/01/15 | | | 2.000 | % | | | 2,000,000 | | | | 2,055,880 | | |
Tulsa County Industrial Authority
Revenue Bonds
Broken Arrow Public School
Series 2012
09/01/17 | | | 3.500 | % | | | 1,850,000 | | | | 2,018,035 | | |
Jenks Public Schools
Series 2009
09/01/13 | | | 4.000 | % | | | 1,000,000 | | | | 1,012,560 | | |
09/01/14 | | | 5.500 | % | | | 1,280,000 | | | | 1,367,130 | | |
Total | | | | | | | 9,762,518 | | |
Oregon 0.2% | |
Oregon Health & Science University
Revenue Bonds
Series 2012A
07/01/14 | | | 4.000 | % | | | 1,000,000 | | | | 1,039,860 | | |
Oregon State Department of Administrative Services
Certificate of Participation
Series 2009A
05/01/14 | | | 5.000 | % | | | 3,125,000 | | | | 3,274,000 | | |
Total | | | | | | | 4,313,860 | | |
Pennsylvania 1.7% | |
Bucks County Industrial Development Authority
Revenue Bonds
Various Waste Management, Inc. Projects
Series 2002 AMT(a)
12/01/22 | | | 0.875 | % | | | 8,250,000 | | | | 8,252,805 | | |
Monroeville Finance Authority
Revenue Bonds
Series 2012
02/15/18 | | | 4.000 | % | | | 1,250,000 | | | | 1,415,225 | | |
Pennsylvania Higher Educational Facilities Authority
Revenue Bonds
University of Pittsburgh Medical Center
Series 2010E
05/15/15 | | | 5.000 | % | | | 4,250,000 | | | | 4,641,255 | | |
Pennsylvania Housing Finance Agency(a)
Revenue Bonds
Series 2012-114A AMT
04/01/14 | | | 0.800 | % | | | 1,000,000 | | | | 1,001,330 | | |
The accompanying Notes to Financial Statements are an integral part of this statement.
Annual Report 2013
16
Columbia Short Term Municipal Bond Fund
Portfolio of Investments (continued)
April 30, 2013
Municipal Bonds (continued)
Issue
Description | | Coupon
Rate | | Principal
Amount ($) | | Value ($) | |
Series 2012-114A AMT
04/01/15 | | | 1.050 | % | | | 320,000 | | | | 321,337 | | |
Pennsylvania Industrial Development Authority
Refunding Revenue Bonds
Economic Development
Series 2012
07/01/15 | | | 5.000 | % | | | 2,000,000 | | | | 2,182,120 | | |
Pennsylvania Turnpike Commission(b)
Revenue Bonds
Series 2011B
06/01/14 | | | 0.840 | % | | | 3,000,000 | | | | 3,008,370 | | |
Series 2011D
12/01/13 | | | 0.540 | % | | | 7,000,000 | | | | 7,000,000 | | |
Southeastern Pennsylvania Transportation Authority
Revenue Bonds
Capital Grant Receipts
Series 2011
06/01/13 | | | 3.000 | % | | | 750,000 | | | | 751,645 | | |
06/01/13 | | | 5.000 | % | | | 800,000 | | | | 803,152 | | |
06/01/14 | | | 3.000 | % | | | 1,000,000 | | | | 1,025,820 | | |
06/01/14 | | | 5.000 | % | | | 430,000 | | | | 450,399 | | |
State Public School Building Authority
Revenue Bonds
School District of Philadelphia
Series 2012
04/01/14 | | | 5.000 | % | | | 1,000,000 | | | | 1,042,290 | | |
04/01/15 | | | 5.000 | % | | | 1,500,000 | | | | 1,625,550 | | |
04/01/16 | | | 5.000 | % | | | 2,000,000 | | | | 2,240,820 | | |
Total | | | | | | | 35,762,118 | | |
Rhode Island 0.3% | |
Rhode Island Convention Center Authority
Refunding Revenue Bonds
Series 2003A (AGM)
05/15/16 | | | 5.000 | % | | | 5,610,000 | | | | 5,620,827 | | |
South Carolina 1.1% | |
South Carolina State Public Service Authority
Revenue Bonds
Santee Cooper
Series 2006-A NPFGC
01/01/16 | | | 5.000 | % | | | 4,295,000 | | | | 4,805,633 | | |
Series 2009E
01/01/14 | | | 5.000 | % | | | 1,500,000 | | | | 1,548,135 | | |
01/01/15 | | | 5.000 | % | | | 8,225,000 | | | | 8,861,039 | | |
South Carolina Transportation Infrastructure Bank
Refunding Revenue Bonds
Series 2012A
10/01/15 | | | 4.000 | % | | | 6,000,000 | | | | 6,511,560 | | |
Total | | | | | | | 21,726,367 | | |
Municipal Bonds (continued)
Issue
Description | | Coupon
Rate | | Principal
Amount ($) | | Value ($) | |
South Dakota 0.1% | |
South Dakota Health & Educational Facilities Authority
Revenue Bonds
Regional Health
Series 2011
09/01/14 | | | 5.000 | % | | | 1,470,000 | | | | 1,562,184 | | |
Tennessee 0.6% | |
Knox County Health Educational & Housing Facilities Board
Refunding Revenue Bonds
Fort Sanders Alliance
Series 1993
01/01/14 | | | 5.750 | % | | | 2,000,000 | | | | 2,072,000 | | |
Series 1993 (NPFGC)
01/01/15 | | | 5.250 | % | | | 4,550,000 | | | | 4,901,670 | | |
Memphis-Shelby County Airport Authority(a)
Refunding Revenue Bonds
Series 2010B AMT
07/01/15 | | | 4.000 | % | | | 2,060,000 | | | | 2,209,803 | | |
07/01/16 | | | 5.000 | % | | | 1,000,000 | | | | 1,132,860 | | |
Metropolitan Government of Nashville & Davidson County
Water & Sewer
Refunding Revenue Bonds
Subordinated Lien
Series 2012
07/01/16 | | | 5.000 | % | | | 1,250,000 | | | | 1,420,925 | | |
Total | | | | | | | 11,737,258 | | |
Texas 4.9% | |
Central Texas Regional Mobility Authority(d)
Refunding Revenue Bonds
Senior Lien
Series 2013A
01/01/15 | | | 4.000 | % | | | 750,000 | | | | 787,275 | | |
01/01/17 | | | 5.000 | % | | | 925,000 | | | | 1,043,326 | | |
City Public Service Board of San Antonio
Refunding Revenue Bonds
Systems
Series 2011
02/01/16 | | | 5.000 | % | | | 4,000,000 | | | | 4,493,200 | | |
City of Houston Airport System
Refunding Revenue Bonds
Subordinated Lien
Series 2011A AMT(a)
07/01/14 | | | 5.000 | % | | | 5,000,000 | | | | 5,272,300 | | |
City of Houston Utility System(b)
Refunding Revenue Bonds
Combined First Lien-SIFMA
Series 2012
05/15/34 | | | 0.790 | % | | | 6,000,000 | | | | 6,061,560 | | |
SIFMA Index
Series 2012
05/15/34 | | | 0.740 | % | | | 3,500,000 | | | | 3,505,040 | | |
The accompanying Notes to Financial Statements are an integral part of this statement.
Annual Report 2013
17
Columbia Short Term Municipal Bond Fund
Portfolio of Investments (continued)
April 30, 2013
Municipal Bonds (continued)
Issue
Description | | Coupon
Rate | | Principal
Amount ($) | | Value ($) | |
City of Houston
Limited General Obligation Refunding Bonds
Series 2011A
03/01/16 | | | 5.000 | % | | | 11,470,000 | | | | 12,897,442 | | |
City of Lubbock
Limited General Obligation Bonds
Waterworks
Series 2011
02/15/15 | | | 5.000 | % | | | 1,250,000 | | | | 1,351,550 | | |
Clear Creek Independent School District
Unlimited General Obligation Refunding Bonds
Series 2012A (Permanent School Fund Guarantee)
02/15/15 | | | 4.000 | % | | | 5,225,000 | | | | 5,568,230 | | |
02/15/16 | | | 5.000 | % | | | 5,130,000 | | | | 5,777,201 | | |
Comal Independent School District
Refunding Unlimited General Obligation Bonds
Series 2012-A (Permanent School Fund Guarantee)
02/01/15 | | | 4.000 | % | | | 1,000,000 | | | | 1,064,320 | | |
Gulf Coast Waste Disposal Authority
Revenue Bonds
BP Products North America
Series 2007
01/01/42 | | | 2.300 | % | | | 2,950,000 | | | | 2,969,205 | | |
Houston Independent School District
Limited General Obligation Refunding Bonds
Limited Tax
Series 2012 (Permanent School Fund Guarantee)
06/01/30 | | | 2.500 | % | | | 7,500,000 | | | | 7,783,275 | | |
Lower Colorado River Authority
Refunding Revenue Bonds
Series 2010
05/15/14 | | | 5.000 | % | | | 2,190,000 | | | | 2,297,463 | | |
Series 2010 Escrowed to Maturity
05/15/14 | | | 5.000 | % | | | 5,000 | | | | 5,241 | | |
05/15/14 | | | 5.000 | % | | | 5,000 | | | | 5,245 | | |
05/15/15 | | | 5.000 | % | | | 5,000 | | | | 5,467 | | |
05/15/15 | | | 5.000 | % | | | 10,000 | | | | 10,934 | | |
Revenue Bonds
Series 2010 Escrowed to Maturity
05/15/14 | | | 5.000 | % | | | 30,000 | | | | 31,446 | | |
Unrefunded Revenue Bonds
Series 2010
05/15/16 | | | 5.000 | % | | | 6,320,000 | | | | 7,148,552 | | |
Series 2010
05/15/15 | | | 5.000 | % | | | 7,125,000 | | | | 7,782,495 | | |
North East Independent School District
Unlimited General Obligation Refunding Bonds
School Building
Series 2012 (Permanent School Fund Guarantee)
08/01/16 | | | 5.000 | % | | | 5,000,000 | | | | 5,728,500 | | |
08/01/17 | | | 5.000 | % | | | 4,920,000 | | | | 5,813,964 | | |
Municipal Bonds (continued)
Issue
Description | | Coupon
Rate | | Principal
Amount ($) | | Value ($) | |
Sam Rayburn Municipal Power Agency
Refunding Revenue Bonds
Series 2012
10/01/15 | | | 5.000 | % | | | 610,000 | | | | 668,255 | | |
10/01/16 | | | 5.000 | % | | | 1,925,000 | | | | 2,171,400 | | |
10/01/17 | | | 5.000 | % | | | 2,865,000 | | | | 3,292,200 | | |
State of Texas
Unlimited General Obligation Refunding Bonds
College Student Loan
Series 2010 AMT(a)
08/01/15 | | | 5.000 | % | | | 5,775,000 | | | | 6,357,755 | | |
Total | | | | | | | 99,892,841 | | |
Utah 0.9% | |
City of Riverton
Revenue Bonds
IHC Health Services, Inc.
Series 2009
08/15/13 | | | 5.000 | % | | | 1,400,000 | | | | 1,419,306 | | |
Intermountain Power Agency
Refunding Revenue Bonds
Series 2009A
07/01/13 | | | 5.000 | % | | | 10,000,000 | | | | 10,082,200 | | |
State of Utah
Unlimited General Obligation Bonds
Series 2009C
07/01/14 | | | 5.000 | % | | | 2,500,000 | | | | 2,639,800 | | |
Utah Associated Municipal Power Systems
Refunding Revenue Bonds
Payson Power Project
Series 2012
04/01/16 | | | 4.000 | % | | | 4,690,000 | | | | 5,102,673 | | |
Total | | | | | | | 19,243,979 | | |
Virginia 0.3% | |
Peninsula Ports Authority
Refunding Revenue Bonds
Dominion Term Association Project
Series 2003(b)
10/01/33 | | | 2.375 | % | | | 3,335,000 | | | | 3,417,274 | | |
York County Economic Development Authority
Refunding Revenue Bonds
Virginia Electric & Power
Series 2009A
05/01/33 | | | 4.050 | % | | | 3,500,000 | | | | 3,604,230 | | |
Total | | | | | | | 7,021,504 | | |
Washington 3.5% | |
City of Seattle Municipal Light & Power
Prerefunded 08/01/14 Revenue Bonds
Series 2004 (AGM)
08/01/15 | | | 5.000 | % | | | 835,000 | | | | 883,781 | | |
The accompanying Notes to Financial Statements are an integral part of this statement.
Annual Report 2013
18
Columbia Short Term Municipal Bond Fund
Portfolio of Investments (continued)
April 30, 2013
Municipal Bonds (continued)
Issue
Description | | Coupon
Rate | | Principal
Amount ($) | | Value ($) | |
Unrefunded Revenue Bonds
Series 2004 (AGM)
08/01/15 | | | 5.000 | % | | | 5,165,000 | | | | 5,474,125 | | |
Clark County Public Utility District No. 1
Refunding Revenue Bonds
Series 2010
01/01/15 | | | 5.000 | % | | | 2,900,000 | | | | 3,119,182 | | |
Energy Northwest
Refunding Revenue Bonds
Project 1
Series 2012B
07/01/17 | | | 5.000 | % | | | 40,220,000 | | | | 47,278,208 | | |
FYI Properties
Revenue Bonds
Washington State Disposal Project
Series 2009
06/01/13 | | | 5.000 | % | | | 2,400,000 | | | | 2,409,657 | | |
Port of Seattle
Refunding Revenue Bonds
Series 2010B AMT(a)
12/01/15 | | | 5.000 | % | | | 5,500,000 | | | | 6,110,775 | | |
Snohomish County School District No. 15 Edmonds
Unlimited General Obligation Refunding Bonds
Series 2012
12/01/17 | | | 4.000 | % | | | 2,000,000 | | | | 2,285,660 | | |
State of Washington
Certificate of Participation
State and Local Agencies
Series 2012
07/01/16 | | | 4.000 | % | | | 3,500,000 | | | | 3,874,780 | | |
Washington State Housing Finance Commission
Revenue Bonds
Series 2010A (GNMA/FNMA/FHLMC)
10/01/28 | | | 4.700 | % | | | 1,060,000 | | | | 1,135,991 | | |
Total | | | | | | | 72,572,159 | | |
West Virginia 0.8% | |
County of Mason
Revenue Bonds
Appalachian Power Co.
Series 2003L(b)
10/01/22 | | | 2.000 | % | | | 8,750,000 | | | | 8,886,675 | | |
West Virginia Economic Development Authority
Revenue Bonds
Appalachian Power Co.-Amos Project
Series 2011A AMT(a)
01/01/41 | | | 2.250 | % | | | 3,750,000 | | | | 3,824,063 | | |
West Virginia University
Revenue Bonds
West Virginia University Projects
Series 2011C(b)
10/01/41 | | | 0.840 | % | | | 4,000,000 | | | | 4,003,280 | | |
Total | | | | | | | 16,714,018 | | |
Municipal Bonds (continued)
Issue
Description | | Coupon
Rate | | Principal
Amount ($) | | Value ($) | |
Wisconsin —% | |
University of Wisconsin Hospitals & Clinics Authority
Revenue Bonds
Series 2013A
04/01/14 | | | 3.000 | % | | | 455,000 | | | | 466,294 | | |
04/01/15 | | | 4.000 | % | | | 160,000 | | | | 170,747 | | |
04/01/16 | | | 4.000 | % | | | 185,000 | | | | 202,668 | | |
Total | | | | | | | 839,709 | | |
Total Municipal Bonds
(Cost: $1,799,132,207) | | | | | | | 1,830,879,101 | | |
Floating Rate Notes 0.2%
Issue
Description | | Effective
Yield | | Amount
Payable at
Maturity ($) | | Value ($) | |
New York 0.2% | |
New York State Environmental Facilities Corp.
Refunding Revenue Bonds
Waste Management, Inc.
VRDN Series 2012 AMT(a)(e)
05/01/30 | | | 0.550 | % | | | 3,250,000 | | | | 3,250,000 | | |
Total Floating Rate Notes
(Cost: $3,250,000) | | | | | | | 3,250,000 | | |
Municipal Short Term 9.0%
Issue
Description | | Coupon
Rate | | Principal
Amount ($) | | Value ($) | |
California 1.5% | |
Charter Oak Unified School District
Unlimited General Obligation Bonds
BAN Series 2012
10/01/15 | | | 5.000 | % | | | 4,600,000 | | | | 5,041,002 | | |
Los Angeles County Schools
Revenue Notes
Pooled
Series 2013C-3
12/31/13 | | | 2.000 | % | | | 1,000,000 | | | | 1,011,300 | | |
Series 2013C-4
01/31/14 | | | 2.000 | % | | | 9,000,000 | | | | 9,096,210 | | |
Monterey Peninsula Unified School District
Unlimited General Obligation Bonds
BAN Series 2012
11/01/15 | | | 2.500 | % | | | 1,700,000 | | | | 1,764,702 | | |
The accompanying Notes to Financial Statements are an integral part of this statement.
Annual Report 2013
19
Columbia Short Term Municipal Bond Fund
Portfolio of Investments (continued)
April 30, 2013
Municipal Short Term (continued)
Issue
Description | | Coupon
Rate | | Principal
Amount ($) | | Value ($) | |
Sulphur Springs Union School District
Unlimited General Obligation Notes
BAN Series 2013
01/01/15 | | | 3.000 | % | | | 2,750,000 | | | | 2,861,788 | | |
Val Verde Unified School District
Unlimited General Obligation Notes
Tax & Revenue Anticipation Note
Series 2012
10/01/13 | | | 2.000 | % | | | 10,550,000 | | | | 10,622,267 | | |
Total | | | | | | | 30,397,269 | | |
Connecticut 0.1% | |
Town of East Haven
Unlimited General Obligation Notes
BAN Series 2012
07/31/13 | | | 2.000 | % | | | 2,625,000 | | | | 2,632,849 | | |
Kentucky 0.7% | |
Louisville & Jefferson County Metropolitan Sewer District
Revenue Notes
Subordinated Series 2012-A BAN
12/04/13 | | | 2.000 | % | | | 15,000,000 | | | | 15,134,250 | | |
Louisiana 0.2% | |
Louisiana Public Facilities Authority
Revenue Bonds
Louisiana Pellets, Inc. Project
Series 2013A AMT(a)
08/01/14 | | | 9.750 | % | | | 3,890,000 | | | | 3,890,506 | | |
Massachusetts 1.6% | |
City of Lawrence
Limited General Obligation Notes
State Qualified
BAN Series 2013
03/01/14 | | | 1.000 | % | | | 6,000,000 | | | | 6,024,780 | | |
City of Methuen
General Obligation Limited Notes
BAN Series 2012
08/09/13 | | | 1.250 | % | | | 12,500,000 | | | | 12,528,125 | | |
Pioneer Valley Transit Authority
Revenue Notes
RAN Series 2012
07/26/13 | | | 1.500 | % | | | 15,000,000 | | | | 15,031,500 | | |
Total | | | | | | | 33,584,405 | | |
New Jersey 0.4% | |
City of Newark
Unlimited General Obligation Notes
BAN Series 2012B
06/28/13 | | | 2.500 | % | | | 3,000,000 | | | | 3,003,772 | | |
Municipal Short Term (continued)
Issue
Description | | Coupon
Rate | | Principal
Amount ($) | | Value ($) | |
Hudson County Improvement Authority
Revenue Notes
BAN Series 2012
08/07/13 | | | 1.500 | % | | | 5,000,000 | | | | 5,013,550 | | |
Total | | | | | | | 8,017,322 | | |
New York 4.3% | |
City of Geneva
General Obligation Limited Notes
BAN Series 2013
02/06/14 | | | 1.500 | % | | | 13,165,000 | | | | 13,258,471 | | |
County of Nassau
Limited General Obligation Notes
TAN Series 2012-B
09/30/13 | | | 2.000 | % | | | 20,000,000 | | | | 20,128,200 | | |
County of Rockland
Limited General Obligation Notes
BAN Series 2013A
04/09/14 | | | 2.000 | % | | | 2,295,000 | | | | 2,300,026 | | |
TAN Series 2013
03/14/14 | | | 2.250 | % | | | 7,500,000 | | | | 7,552,350 | | |
County of Suffolk
Limited General Obligation Notes
TAN Series 2012
08/14/13 | | | 2.000 | % | | | 5,000,000 | | | | 5,022,950 | | |
RAN Series 2013
03/27/14 | | | 2.000 | % | | | 2,300,000 | | | | 2,329,532 | | |
Town of Oyster Bay
General Obligation Unlimited Notes
BAN Series 2012B
08/09/13 | | | 3.000 | % | | | 15,000,000 | | | | 15,098,400 | | |
Limited General Obligation Notes
BAN Series 2013A
03/07/14 | | | 1.500 | % | | | 10,000,000 | | | | 10,081,900 | | |
Town of Poughkeepsie
Limited General Obligation Notes
BAN Series 2013A
03/14/14 | | | 2.000 | % | | | 9,047,978 | | | | 9,135,019 | | |
Wyandanch Union Free School District
Unlimited General Obligation Notes
TAN Series 2012
06/28/13 | | | 3.250 | % | | | 2,375,000 | | | | 2,376,953 | | |
Total | | | | | | | 87,283,801 | | |
Virginia 0.2% | |
City of Norfolk
Unlimited General Obligation Bonds
BAN Series 2011A
01/01/14 | | | 3.000 | % | | | 3,250,000 | | | | 3,278,047 | | |
Total Municipal Short Term
(Cost: $184,125,527) | | | | | | | 184,218,449 | | |
The accompanying Notes to Financial Statements are an integral part of this statement.
Annual Report 2013
20
Columbia Short Term Municipal Bond Fund
Portfolio of Investments (continued)
April 30, 2013
Money Market Funds 0.8%
| | | Shares | | Value ($) | |
JPMorgan Tax-Free Money Market Fund,
0.000%(f) | | | 15,903,346 | | | | 15,903,346 | | |
Total Money Market Funds
(Cost: $15,903,346) | | | | | 15,903,346 | | |
Total Investments
(Cost: $2,002,411,080) | | | | | 2,034,250,896 | | |
Other Assets & Liabilities, Net | | | | | 10,514,684 | | |
Net Assets | | | | | 2,044,765,580 | | |
Notes to Portfolio of Investments
(a) Income from this security may be subject to alternative minimum tax.
(b) Variable rate security.
(c) Zero coupon bond.
(d) Represents a security purchased on a when-issued or delayed delivery basis.
(e) Interest rate varies to reflect current market conditions; rate shown is the effective rate on April 30, 2013.
(f) The rate shown is the seven-day current annualized yield at April 30, 2013.
Abbreviation Legend
AGM Assured Guaranty Municipal Corporation
AMBAC Ambac Assurance Corporation
AMT Alternative Minimum Tax
BAN Bond Anticipation Note
CIFG IXIS Financial Guaranty
FGIC Financial Guaranty Insurance Company
FHLMC Federal Home Loan Mortgage Corporation
FNMA Federal National Mortgage Association
GNMA Government National Mortgage Association
NPFGC National Public Finance Guarantee Corporation
RAN Revenue Anticipation Note
TAN Tax Anticipation Note
TCRS Transferable Custodial Receipts
VRDN Variable Rate Demand Note
XLCA XL Capital Assurance
The accompanying Notes to Financial Statements are an integral part of this statement.
Annual Report 2013
21
Columbia Short Term Municipal Bond Fund
Portfolio of Investments (continued)
April 30, 2013
Fair Value Measurements
Generally accepted accounting principles (GAAP) require disclosure regarding the inputs and valuation techniques used to measure fair value and any changes in valuation inputs or techniques. In addition, investments shall be disclosed by major category.
The Fund categorizes its fair value measurements according to a three-level hierarchy that maximizes the use of observable inputs and minimizes the use of unobservable inputs by prioritizing that the most observable input be used when available. Observable inputs are those that market participants would use in pricing an investment based on market data obtained from sources independent of the reporting entity. Unobservable inputs are those that reflect the Fund's assumptions about the information market participants would use in pricing an investment. An investment's level within the fair value hierarchy is based on the lowest level of any input that is deemed significant to the asset or liability's fair value measurement. The input levels are not necessarily an indication of the risk or liquidity associated with investments at that level. For example, certain U.S. government securities are generally high quality and liquid, however, they are reflected as Level 2 because the inputs used to determine fair value may not always be quoted prices in an active market.
Fair value inputs are summarized in the three broad levels listed below:
> Level 1 — Valuations based on quoted prices for investments in active markets that the Fund has the ability to access at the measurement date (including NAV for open-end mutual funds). Valuation adjustments are not applied to Level 1 investments.
> Level 2 — Valuations based on other significant observable inputs (including quoted prices for similar securities, interest rates, prepayment speeds, credit risks, etc.).
> Level 3 — Valuations based on significant unobservable inputs (including the Fund's own assumptions and judgment in determining the fair value of investments).
Inputs that are used in determining fair value of an investment may include price information, credit data, volatility statistics, and other factors. These inputs can be either observable or unobservable. The availability of observable inputs can vary between investments, and is affected by various factors such as the type of investment, and the volume and level of activity for that investment or similar investments in the marketplace. The inputs will be considered by the Investment Manager, along with any other relevant factors in the calculation of an investment's fair value. The Fund uses prices and inputs that are current as of the measurement date, which may include periods of market dislocations. During these periods, the availability of prices and inputs may be reduced for many investments. This condition could cause an investment to be reclassified between the various levels within the hierarchy.
Investments falling into the Level 3 category are primarily supported by quoted prices from brokers and dealers participating in the market for those investments. However, these may be classified as Level 3 investments due to lack of market transparency and corroboration to support these quoted prices. Additionally, valuation models may be used as the pricing source for any remaining investments classified as Level 3. These models may rely on one or more significant unobservable inputs and/or significant assumptions by the Investment Manager. Inputs used in valuations may include, but are not limited to, financial statement analysis, capital account balances, discount rates and estimated cash flows, and comparable company data.
Under the direction of the Fund's Board of Trustees (the Board), the Investment Manager's Valuation Committee (the Committee) is responsible for carrying out the valuation procedures approved by the Board. The Committee consists of voting and non-voting members from various groups within the Investment Manager's organization, including operations and accounting, trading and investments, compliance, risk management and legal.
The Committee meets at least monthly to review and approve valuation matters, which may include a description of specific valuation determinations, data regarding pricing information received from approved pricing vendors and brokers and the results of Board-approved valuation control policies and procedures (the Policies). The Policies address, among other things, instances when market quotations are readily available, including recommendations of third party pricing vendors and a determination of appropriate pricing methodologies; events that require specific valuation determinations and assessment of fair value techniques; securities with a potential for stale pricing, including those that are illiquid, restricted, or in default; and the effectiveness of third-party pricing vendors, including periodic reviews of vendors. The Committee meets more frequently, as needed, to discuss additional valuation matters, which may include the need to review back-testing results, review time-sensitive information or approve related valuation actions. The Committee reports to the Board, with members of the Committee meeting with the Board at each of its regularly scheduled meetings to discuss valuation matters and actions during the period, similar to those described earlier.
For investments categorized as Level 3, the Committee monitors information similar to that described above, which may include: (i) data specific to the issuer or comparable issuers, (ii) general market or specific sector news and (iii) quoted prices and specific or similar security transactions. The Committee considers this data and any changes from prior periods in order to assess the reasonableness of observable and unobservable inputs, any assumptions or internal models used to value those securities and changes in fair value. This data is also used to corroborate, when available, information received from approved pricing vendors and brokers. Various factors impact the frequency of monitoring this information (which may occur as often as daily). However, the Committee may determine that changes to inputs, assumptions and models are not required as a result of the monitoring procedures performed.
The accompanying Notes to Financial Statements are an integral part of this statement.
Annual Report 2013
22
Columbia Short Term Municipal Bond Fund
Portfolio of Investments (continued)
April 30, 2013
Fair Value Measurements (continued)
The following table is a summary of the inputs used to value the Fund's investments at April 30, 2013:
Description | | Level 1
Quoted Prices in Active
Markets for Identical
Assets ($) | | Level 2
Other Significant
Observable Inputs ($) | | Level 3
Significant
Unobservable Inputs ($) | | Total ($) | |
Bonds | |
Municipal Bonds | | | — | | | | 1,830,879,101 | | | | — | | | | 1,830,879,101 | | |
Total Bonds | | | — | | | | 1,830,879,101 | | | | — | | | | 1,830,879,101 | | |
Short-Term Securities | |
Floating Rate Notes | | | — | | | | 3,250,000 | | | | — | | | | 3,250,000 | | |
Municipal Short Term | | | — | | | | 184,218,449 | | | | — | | | | 184,218,449 | | |
Total Short-Term Securities | | | — | | | | 187,468,449 | | | | — | | | | 187,468,449 | | |
Other | |
Money Market Funds | | | 15,903,346 | | | | — | | | | — | | | | 15,903,346 | | |
Total Other | | | 15,903,346 | | | | — | | | | — | | | | 15,903,346 | | |
Total | | | 15,903,346 | | | | 2,018,347,550 | | | | — | | | | 2,034,250,896 | | |
See the Portfolio of Investments for all investment classifications not indicated in the table.
The Fund's assets assigned to the Level 2 input category are generally valued using the market approach, in which a security's value is determined through reference to prices and information from market transactions for similar or identical assets.
There were no transfers of financial assets between Levels 1 and 2 during the period.
The accompanying Notes to Financial Statements are an integral part of this statement.
Annual Report 2013
23
Columbia Short Term Municipal Bond Fund
Statement of Assets and Liabilities
April 30, 2013
Assets | |
Investments, at value | |
(identified cost $2,002,411,080) | | $ | 2,034,250,896 | | |
Receivable for: | |
Investments sold | | | 292,124 | | |
Capital shares sold | | | 4,328,627 | | |
Interest | | | 23,774,225 | | |
Expense reimbursement due from Investment Manager | | | 9,506 | | |
Prepaid expenses | | | 3,301 | | |
Total assets | | | 2,062,658,679 | | |
Liabilities | |
Payable for: | |
Investments purchased | | | 529,343 | | |
Investments purchased on a delayed delivery basis | | | 8,720,000 | | |
Capital shares purchased | | | 5,992,941 | | |
Dividend distributions to shareholders | | | 2,113,126 | | |
Investment management fees | | | 20,041 | | |
Distribution and/or service fees | | | 2,034 | | |
Transfer agent fees | | | 372,087 | | |
Administration fees | | | 3,571 | | |
Compensation of board members | | | 101,364 | | |
Other expenses | | | 38,592 | | |
Total liabilities | | | 17,893,099 | | |
Net assets applicable to outstanding capital stock | | $ | 2,044,765,580 | | |
Represented by | |
Paid-in capital | | $ | 2,017,486,475 | | |
Undistributed net investment income | | | 2,260,574 | | |
Accumulated net realized loss | | | (6,821,285 | ) | |
Unrealized appreciation (depreciation) on: | |
Investments | | | 31,839,816 | | |
Total — representing net assets applicable to outstanding capital stock | | $ | 2,044,765,580 | | |
The accompanying Notes to Financial Statements are an integral part of this statement.
Annual Report 2013
24
Columbia Short Term Municipal Bond Fund
Statement of Assets and Liabilities (continued)
April 30, 2013
Class A | |
Net assets | | $ | 185,204,511 | | |
Shares outstanding | | | 17,573,143 | | |
Net asset value per share | | $ | 10.54 | | |
Maximum offering price per share(a) | | $ | 10.65 | | |
Class B | |
Net assets | | $ | 169,097 | | |
Shares outstanding | | | 16,047 | | |
Net asset value per share | | $ | 10.54 | | |
Class C | |
Net assets | | $ | 27,729,767 | | |
Shares outstanding | | | 2,630,795 | | |
Net asset value per share | | $ | 10.54 | | |
Class R4 | |
Net assets | | $ | 2,044,380 | | |
Shares outstanding | | | 194,051 | | |
Net asset value per share | | $ | 10.54 | | |
Class R5 | |
Net assets | | $ | 522,262 | | |
Shares outstanding | | | 49,573 | | |
Net asset value per share | | $ | 10.54 | | |
Class Z | |
Net assets | | $ | 1,829,095,563 | | |
Shares outstanding | | | 173,534,714 | | |
Net asset value per share | | $ | 10.54 | | |
(a) The maximum offering price per share is calculated by dividing the net asset value by 1.0 minus the maximum sales charge of 1.00%.
The accompanying Notes to Financial Statements are an integral part of this statement.
Annual Report 2013
25
Columbia Short Term Municipal Bond Fund
Statement of Operations
Year Ended April 30, 2013
Net investment income | |
Income: | | | |
Dividends | | $ | 5,977 | | |
Interest | | | 38,364,532 | | |
Total income | | | 38,370,509 | | |
Expenses: | | | |
Investment management fees | | | 7,690,029 | | |
Distribution and/or service fees | | | |
Class A | | | 497,741 | | |
Class B | | | 1,720 | | |
Class C | | | 309,981 | | |
Transfer agent fees | | | |
Class A | | | 402,995 | | |
Class B | | | 348 | | |
Class C | | | 62,707 | | |
Class R4(a) | | | 245 | | |
Class R5(b) | | | 15 | | |
Class Z | | | 3,895,137 | | |
Administration fees | | | 1,367,486 | | |
Compensation of board members | | | 67,084 | | |
Custodian fees | | | 17,404 | | |
Printing and postage fees | | | 45,881 | | |
Registration fees | | | 126,403 | | |
Professional fees | | | 60,820 | | |
Other | | | 47,079 | | |
Total expenses | | | 14,593,075 | | |
Fees waived or expenses reimbursed by Investment Manager and its affiliates | | | (3,478,062 | ) | |
Expense reductions | | | (40 | ) | |
Total net expenses | | | 11,114,973 | | |
Net investment income | | | 27,255,536 | | |
Realized and unrealized gain (loss) — net | |
Net realized gain (loss) on: | | | |
Investments | | | 146,954 | | |
Net realized gain | | | 146,954 | | |
Net change in unrealized appreciation (depreciation) on: | | | |
Investments | | | (2,229,981 | ) | |
Net change in unrealized appreciation (depreciation) | | | (2,229,981 | ) | |
Net realized and unrealized loss | | | (2,083,027 | ) | |
Net increase in net assets resulting from operations | | $ | 25,172,509 | | |
(a) Class R4 shares are for the period from March 19, 2013 (commencement of operations) to April 30, 2013.
(b) Class R5 shares are for the period from November 8, 2012 (commencement of operations) to April 30, 2013.
The accompanying Notes to Financial Statements are an integral part of this statement.
Annual Report 2013
26
Columbia Short Term Municipal Bond Fund
Statement of Changes in Net Assets
| | | Year Ended
April 30,
2013(a)(b) | | Year Ended
April 30,
2012(c) | | Year Ended
March 31,
2012 | |
Operations | |
Net investment income | | $ | 27,255,536 | | | $ | 2,640,195 | | | $ | 35,721,601 | | |
Net realized gain (loss) | | | 146,954 | | | | (11,682 | ) | | | (1,801,444 | ) | |
Net change in unrealized appreciation (depreciation) | | | (2,229,981 | ) | | | 2,238,474 | | | | 11,922,226 | | |
Net increase in net assets resulting from operations | | | 25,172,509 | | | | 4,866,987 | | | | 45,842,383 | | |
Distributions to shareholders | |
Net investment income | |
Class A | | | (2,100,109 | ) | | | (194,430 | ) | | | (3,524,028 | ) | |
Class B | | | (515 | ) | | | (72 | ) | | | (1,810 | ) | |
Class C | | | (94,141 | ) | | | (9,812 | ) | | | (250,567 | ) | |
Class R4 | | | (1,404 | ) | | | — | | | | — | | |
Class R5 | | | (413 | ) | | | — | | | | — | | |
Class Z | | | (25,058,954 | ) | | | (2,254,316 | ) | | | (29,939,616 | ) | |
Total distributions to shareholders | | | (27,255,536 | ) | | | (2,458,630 | ) | | | (33,716,021 | ) | |
Increase (decrease) in net assets from capital stock activity | | | (182,740,710 | ) | | | (62,952,744 | ) | | | 252,510,236 | | |
Total increase (decrease) in net assets | | | (184,823,737 | ) | | | (60,544,387 | ) | | | 264,636,598 | | |
Net assets at beginning of year | | | 2,229,589,317 | | | | 2,290,133,704 | | | | 2,025,497,106 | | |
Net assets at end of year | | $ | 2,044,765,580 | | | $ | 2,229,589,317 | | | $ | 2,290,133,704 | | |
Undistributed net investment income | | $ | 2,260,574 | | | $ | 2,260,575 | | | $ | 2,079,010 | | |
(a) Class R4 is for the period from March 19, 2013 (commencement of operations) to April 30, 2013.
(b) Class R5 is for the period from November 8, 2012 (commencement of operations) to April 30, 2013.
(c) For the period from April 1, 2012 to April 30, 2012. During the period, the Fund's fiscal year end was changed from March 31 to April 30.
The accompanying Notes to Financial Statements are an integral part of this statement.
Annual Report 2013
27
Columbia Short Term Municipal Bond Fund
Statement of Changes in Net Assets (continued)
| | | Year Ended April 30,
2013(a)(b) | | Year Ended April 30,
2012(c) | | Year Ended March 31,
2012 | |
| | | Shares | | Dollars ($) | | Shares | | Dollars ($) | | Shares | | Dollars ($) | |
Capital stock activity | |
Class A shares | |
Subscriptions(d) | | | 7,185,088 | | | | 75,770,635 | | | | 269,278 | | | | 2,840,093 | | | | 8,925,474 | | | | 93,980,005 | | |
Distributions reinvested | | | 121,189 | | | | 1,278,372 | | | | 10,937 | | | | 115,383 | | | | 174,619 | | | | 1,838,867 | | |
Redemptions | | | (9,596,930 | ) | | | (101,206,875 | ) | | | (940,513 | ) | | | (9,920,995 | ) | | | (15,409,435 | ) | | | (162,226,110 | ) | |
Net decrease | | | (2,290,653 | ) | | | (24,157,868 | ) | | | (660,298 | ) | | | (6,965,519 | ) | | | (6,309,342 | ) | | | (66,407,238 | ) | |
Class B shares | |
Subscriptions | | | 34 | | | | 357 | | | | 5 | | | | 47 | | | | 132 | | | | 1,382 | | |
Distributions reinvested | | | 12 | | | | 128 | | | | 2 | | | | 23 | | | | 33 | | | | 351 | | |
Redemptions(d) | | | (7,049 | ) | | | (74,443 | ) | | | (1 | ) | | | (4 | ) | | | (8,166 | ) | | | (85,778 | ) | |
Net increase (decrease) | | | (7,003 | ) | | | (73,958 | ) | | | 6 | | | | 66 | | | | (8,001 | ) | | | (84,045 | ) | |
Class C shares | |
Subscriptions | | | 618,807 | | | | 6,528,590 | | | | 20,684 | | | | 218,200 | | | | 1,095,839 | | | | 11,547,931 | | |
Distributions reinvested | | | 4,619 | | | | 48,730 | | | | 454 | | | | 4,785 | | | | 10,084 | | | | 106,197 | | |
Redemptions | | | (1,115,754 | ) | | | (11,767,697 | ) | | | (45,522 | ) | | | (480,184 | ) | | | (1,835,168 | ) | | | (19,319,495 | ) | |
Net decrease | | | (492,328 | ) | | | (5,190,377 | ) | | | (24,384 | ) | | | (257,199 | ) | | | (729,245 | ) | | | (7,665,367 | ) | |
Class R4 shares | |
Subscriptions | | | 203,406 | | | | 2,143,894 | | | | — | | | | — | | | | — | | | | — | | |
Distributions reinvested | | | 133 | | | | 1,403 | | | | — | | | | — | | | | — | | | | — | | |
Redemptions | | | (9,488 | ) | | | (100,000 | ) | | | — | | | | — | | | | — | | | | — | | |
Net increase | | | 194,051 | | | | 2,045,297 | | | | — | | | | — | | | | — | | | | — | | |
Class R5 shares | |
Subscriptions | | | 49,535 | | | | 522,106 | | | | — | | | | — | | | | — | | | | — | | |
Distributions reinvested | | | 38 | | | | 400 | | | | — | | | | — | | | | — | | | | — | | |
Net increase | | | 49,573 | | | | 522,506 | | | | — | | | | — | | | | — | | | | — | | |
Class Z shares | |
Subscriptions | | | 85,292,001 | | | | 899,518,380 | | | | 5,696,721 | | | | 60,083,242 | | | | 93,088,122 | | | | 981,100,039 | | |
Distributions reinvested | | | 262,420 | | | | 2,768,141 | | | | 19,188 | | | | 202,439 | | | | 251,888 | | | | 2,652,894 | | |
Redemptions | | | (100,330,775 | ) | | | (1,058,172,831 | ) | | | (10,997,796 | ) | | | (116,015,773 | ) | | | (62,405,797 | ) | | | (657,086,047 | ) | |
Net increase (decrease) | | | (14,776,354 | ) | | | (155,886,310 | ) | | | (5,281,887 | ) | | | (55,730,092 | ) | | | 30,934,213 | | | | 326,666,886 | | |
Total net increase (decrease) | | | (17,322,714 | ) | | | (182,740,710 | ) | | | (5,966,563 | ) | | | (62,952,744 | ) | | | 23,887,625 | | | | 252,510,236 | | |
(a) Class R4 is for the period from March 19, 2013 (commencement of operations) to April 30, 2013.
(b) Class R5 is for the period from November 8, 2012 (commencement of operations) to April 30, 2013.
(c) For the period from April 1, 2012 to April 30, 2012. During the period, the Fund's fiscal year end was changed from March 31 to April 30.
(d) Includes conversions of Class B shares to Class A shares, if any.
The accompanying Notes to Financial Statements are an integral part of this statement.
Annual Report 2013
28
Columbia Short Term Municipal Bond Fund
The following tables are intended to help you understand the Fund's financial performance. Certain information reflects financial results for a single share of a class held for the periods shown. Per share net investment income (loss) amounts are calculated based on average shares outstanding during the period. Total return assumes reinvestment of all dividends and distributions, if any. Total return does not reflect payment of sales charges, if any, and is not annualized for periods of less than one year.
| | | Year Ended April 30, | | Year Ended March 31, | |
Class A | | 2013 | | 2012(a) | | 2012 | | 2011 | | 2010 | | 2009 | |
Per share data | |
Net asset value, beginning of period | | $ | 10.55 | | | $ | 10.54 | | | $ | 10.47 | | | $ | 10.55 | | | $ | 10.46 | | | $ | 10.32 | | |
Income from investment operations: | |
Net investment income | | | 0.11 | | | | 0.01 | | | | 0.16 | | | | 0.16 | | | | 0.17 | | | | 0.27 | | |
Net realized and unrealized gain (loss) | | | (0.01 | ) | | | 0.01 | | | | 0.06 | | | | (0.08 | ) | | | 0.09 | | | | 0.15 | | |
Total from investment operations | | | 0.10 | | | | 0.02 | | | | 0.22 | | | | 0.08 | | | | 0.26 | | | | 0.42 | | |
Less distributions to shareholders: | |
Net investment income | | | (0.11 | ) | | | (0.01 | ) | | | (0.15 | ) | | | (0.16 | ) | | | (0.17 | ) | | | (0.28 | ) | |
Total distributions to shareholders | | | (0.11 | ) | | | (0.01 | ) | | | (0.15 | ) | | | (0.16 | ) | | | (0.17 | ) | | | (0.28 | ) | |
Proceeds from regulatory settlements | | | — | | | | — | | | | — | | | | — | | | | 0.00 | (b) | | | — | | |
Net asset value, end of period | | $ | 10.54 | | | $ | 10.55 | | | $ | 10.54 | | | $ | 10.47 | | | $ | 10.55 | | | $ | 10.46 | | |
Total return | | | 0.96 | % | | | 0.19 | % | | | 2.12 | % | | | 0.75 | % | | | 2.53 | % | | | 4.14 | % | |
Ratios to average net assets(c)(d) | |
Total gross expenses | | | 0.89 | % | | | 0.88 | %(e) | | | 0.90 | % | | | 0.78 | %(f) | | | 0.73 | %(f) | | | 0.72 | %(f) | |
Total net expenses(g) | | | 0.73 | %(h) | | | 0.72 | %(e) | | | 0.73 | %(h) | | | 0.75 | %(f)(h) | | | 0.72 | %(f)(h) | | | 0.65 | %(f)(h) | |
Net investment income | | | 1.05 | % | | | 1.17 | %(e) | | | 1.54 | % | | | 1.50 | % | | | 1.57 | % | | | 2.60 | % | |
Supplemental data | |
Net assets, end of period (in thousands) | | $ | 185,205 | | | $ | 209,557 | | | $ | 216,298 | | | $ | 281,009 | | | $ | 485,404 | | | $ | 209,539 | | |
Portfolio turnover | | | 37 | % | | | 2 | % | | | 39 | % | | | 38 | % | | | 62 | % | | | 94 | % | |
Notes to Financial Highlights
(a) For the period from April 1, 2012 to April 30, 2012. During the period, the Fund's fiscal year end was changed from March 31 to April 30.
(b) Rounds to zero.
(c) In addition to the fees and expenses which the Fund bears directly, the Fund indirectly bears a pro rata share of the fees and expenses of the acquired funds in which it invests. Such indirect expenses are not included in the reported expense ratios.
(d) Certain line items from prior years have been reclassified to conform to the current presentation.
(e) Annualized.
(f) Includes interest expense which rounds to less than 0.01%.
(g) Total net expenses include the impact of certain waivers/reimbursements made by the Investment Manager and certain of its affiliates, if applicable.
(h) The benefits derived from expense reductions had an impact of less than 0.01%.
The accompanying Notes to Financial Statements are an integral part of this statement.
Annual Report 2013
29
Columbia Short Term Municipal Bond Fund
Financial Highlights (continued)
| | | Year Ended April 30, | | Year Ended March 31, | |
Class B | | 2013 | | 2012(a) | | 2012 | | 2011 | | 2010 | | 2009 | |
Per share data | |
Net asset value, beginning of period | | $ | 10.55 | | | $ | 10.54 | | | $ | 10.47 | | | $ | 10.55 | | | $ | 10.46 | | | $ | 10.32 | | |
Income from investment operations: | |
Net investment income | | | 0.03 | | | | 0.00 | (b) | | | 0.08 | | | | 0.08 | | | | 0.10 | | | | 0.20 | | |
Net realized and unrealized gain (loss) | | | (0.01 | ) | | | 0.01 | | | | 0.06 | | | | (0.08 | ) | | | 0.08 | | | | 0.14 | | |
Total from investment operations | | | 0.02 | | | | 0.01 | | | | 0.14 | | | | — | | | | 0.18 | | | | 0.34 | | |
Less distributions to shareholders: | |
Net investment income | | | (0.03 | ) | | | (0.00 | )(b) | | | (0.07 | ) | | | (0.08 | ) | | | (0.09 | ) | | | (0.20 | ) | |
Total distributions to shareholders | | | (0.03 | ) | | | (0.00 | )(b) | | | (0.07 | ) | | | (0.08 | ) | | | (0.09 | ) | | | (0.20 | ) | |
Proceeds from regulatory settlements | | | — | | | | — | | | | — | | | | — | | | | 0.00 | (b) | | | — | | |
Net asset value, end of period | | $ | 10.54 | | | $ | 10.55 | | | $ | 10.54 | | | $ | 10.47 | | | $ | 10.55 | | | $ | 10.46 | | |
Total return | | | 0.20 | % | | | 0.12 | % | | | 1.35 | % | | | 0.00 | %(b) | | | 1.77 | % | | | 3.37 | % | |
Ratios to average net assets(c)(d) | |
Total gross expenses | | | 1.64 | % | | | 1.63 | %(e) | | | 1.63 | % | | | 1.53 | %(f) | | | 1.48 | %(f) | | | 1.47 | %(f) | |
Total net expenses(g) | | | 1.48 | % | | | 1.47 | %(e) | | | 1.48 | %(h) | | | 1.50 | %(f)(h) | | | 1.47 | %(f)(h) | | | 1.40 | %(f)(h) | |
Net investment income | | | 0.30 | % | | | 0.41 | %(e) | | | 0.79 | % | | | 0.76 | % | | | 0.91 | % | | | 1.98 | % | |
Supplemental data | |
Net assets, end of period (in thousands) | | $ | 169 | | | $ | 243 | | | $ | 243 | | | $ | 325 | | | $ | 331 | | | $ | 458 | | |
Portfolio turnover | | | 37 | % | | | 2 | % | | | 39 | % | | | 38 | % | | | 62 | % | | | 94 | % | |
Notes to Financial Highlights
(a) For the period from April 1, 2012 to April 30, 2012. During the period, the Fund's fiscal year end was changed from March 31 to April 30.
(b) Rounds to zero.
(c) In addition to the fees and expenses which the Fund bears directly, the Fund indirectly bears a pro rata share of the fees and expenses of the acquired funds in which it invests. Such indirect expenses are not included in the reported expense ratios.
(d) Certain line items from prior years have been reclassified to conform to the current presentation.
(e) Annualized.
(f) Includes interest expense which rounds to less than 0.01%.
(g) Total net expenses include the impact of certain waivers/reimbursements made by the Investment Manager and certain of its affiliates, if applicable.
(h) The benefits derived from expense reductions had an impact of less than 0.01%.
The accompanying Notes to Financial Statements are an integral part of this statement.
Annual Report 2013
30
Columbia Short Term Municipal Bond Fund
Financial Highlights (continued)
| | | Year Ended April 30, | | Year Ended March 31, | |
Class C | | 2013 | | 2012(a) | | 2012 | | 2011 | | 2010 | | 2009 | |
Per share data | |
Net asset value, beginning of period | | $ | 10.55 | | | $ | 10.54 | | | $ | 10.47 | | | $ | 10.55 | | | $ | 10.46 | | | $ | 10.32 | | |
Income from investment operations: | |
Net investment income | | | 0.03 | | | | 0.00 | (b) | | | 0.08 | | | | 0.08 | | | | 0.09 | | | | 0.20 | | |
Net realized and unrealized gain (loss) | | | (0.01 | ) | | | 0.01 | | | | 0.06 | | | | (0.08 | ) | | | 0.09 | | | | 0.14 | | |
Total from investment operations | | | 0.02 | | | | 0.01 | | | | 0.14 | | | | — | | | | 0.18 | | | | 0.34 | | |
Less distributions to shareholders: | |
Net investment income | | | (0.03 | ) | | | (0.00 | )(b) | | | (0.07 | ) | | | (0.08 | ) | | | (0.09 | ) | | | (0.20 | ) | |
Total distributions to shareholders | | | (0.03 | ) | | | (0.00 | )(b) | | | (0.07 | ) | | | (0.08 | ) | | | (0.09 | ) | | | (0.20 | ) | |
Proceeds from regulatory settlements | | | — | | | | — | | | | — | | | | — | | | | 0.00 | (b) | | | — | | |
Net asset value, end of period | | $ | 10.54 | | | $ | 10.55 | | | $ | 10.54 | | | $ | 10.47 | | | $ | 10.55 | | | $ | 10.46 | | |
Total return | | | 0.20 | % | | | 0.12 | % | | | 1.35 | % | | | 0.00 | %(b) | | | 1.76 | % | | | 3.37 | % | |
Ratios to average net assets(c)(d) | |
Total gross expenses | | | 1.64 | % | | | 1.63 | %(e) | | | 1.64 | % | | | 1.53 | %(f) | | | 1.48 | %(f) | | | 1.47 | %(f) | |
Total net expenses(g) | | | 1.48 | %(h) | | | 1.47 | %(e) | | | 1.48 | %(h) | | | 1.50 | %(f)(h) | | | 1.47 | %(f)(h) | | | 1.40 | %(f)(h) | |
Net investment income | | | 0.30 | % | | | 0.42 | %(e) | | | 0.79 | % | | | 0.75 | % | | | 0.84 | % | | | 1.92 | % | |
Supplemental data | |
Net assets, end of period (in thousands) | | $ | 27,730 | | | $ | 32,953 | | | $ | 33,176 | | | $ | 40,603 | | | $ | 58,529 | | | $ | 32,750 | | |
Portfolio turnover | | | 37 | % | | | 2 | % | | | 39 | % | | | 38 | % | | | 62 | % | | | 94 | % | |
Notes to Financial Highlights
(a) For the period from April 1, 2012 to April 30, 2012. During the period, the Fund's fiscal year end was changed from March 31 to April 30.
(b) Rounds to zero.
(c) In addition to the fees and expenses which the Fund bears directly, the Fund indirectly bears a pro rata share of the fees and expenses of the acquired funds in which it invests. Such indirect expenses are not included in the reported expense ratios.
(d) Certain line items from prior years have been reclassified to conform to the current presentation.
(e) Annualized.
(f) Includes interest expense which rounds to less than 0.01%.
(g) Total net expenses include the impact of certain waivers/reimbursements made by the Investment Manager and certain of its affiliates, if applicable.
(h) The benefits derived from expense reductions had an impact of less than 0.01%.
The accompanying Notes to Financial Statements are an integral part of this statement.
Annual Report 2013
31
Columbia Short Term Municipal Bond Fund
Financial Highlights (continued)
Class R4 | | Year Ended
April 30,
2013(a) | |
Per share data | |
Net asset value, beginning of period | | $ | 10.54 | | |
Income from investment operations: | |
Net investment income | | | 0.02 | | |
Net realized and unrealized loss | | | (0.01 | ) | |
Total from investment operations | | | 0.01 | | |
Less distributions to shareholders: | |
Net investment income | | | (0.01 | ) | |
Total distributions to shareholders | | | (0.01 | ) | |
Net asset value, end of period | | $ | 10.54 | | |
Total return | | | 0.14 | % | |
Ratios to average net assets(b) | |
Total gross expenses | | | 0.66 | %(c) | |
Total net expenses(d) | | | 0.48 | %(c) | |
Net investment income | | | 1.32 | %(c) | |
Supplemental data | |
Net assets, end of period (in thousands) | | $ | 2,044 | | |
Portfolio turnover | | | 37 | % | |
Notes to Financial Highlights
(a) For the period from March 19, 2013 (commencement of operations) to April 30, 2013.
(b) In addition to the fees and expenses which the Fund bears directly, the Fund indirectly bears a pro rata share of the fees and expenses of the acquired funds in which it invests. Such indirect expenses are not included in the reported expense ratios.
(c) Annualized.
(d) Total net expenses include the impact of certain waivers/reimbursements made by the Investment Manager and certain of its affiliates, if applicable.
The accompanying Notes to Financial Statements are an integral part of this statement.
Annual Report 2013
32
Columbia Short Term Municipal Bond Fund
Financial Highlights (continued)
Class R5 | | Year Ended
April 30,
2013(a) | |
Per share data | |
Net asset value, beginning of period | | $ | 10.55 | | |
Income from investment operations: | |
Net investment income | | | 0.07 | | |
Net realized and unrealized loss | | | (0.01 | ) | |
Total from investment operations | | | 0.06 | | |
Less distributions to shareholders: | |
Net investment income | | | (0.07 | ) | |
Total distributions to shareholders | | | (0.07 | ) | |
Net asset value, end of period | | $ | 10.54 | | |
Total return | | | 0.54 | % | |
Ratios to average net assets(b) | |
Total gross expenses | | | 0.48 | %(c) | |
Total net expenses(d) | | | 0.39 | %(c) | |
Net investment income | | | 1.40 | %(c) | |
Supplemental data | |
Net assets, end of period (in thousands) | | $ | 522 | | |
Portfolio turnover | | | 37 | % | |
Notes to Financial Highlights
(a) For the period from November 8, 2012 (commencement of operations) to April 30, 2013.
(b) In addition to the fees and expenses which the Fund bears directly, the Fund indirectly bears a pro rata share of the fees and expenses of the acquired funds in which it invests. Such indirect expenses are not included in the reported expense ratios.
(c) Annualized.
(d) Total net expenses include the impact of certain waivers/reimbursements made by the Investment Manager and certain of its affiliates, if applicable.
The accompanying Notes to Financial Statements are an integral part of this statement.
Annual Report 2013
33
Columbia Short Term Municipal Bond Fund
Financial Highlights (continued)
| | | Year Ended April 30, | | Year Ended March 31, | |
Class Z | | 2013 | | 2012(a) | | 2012 | | 2011 | | 2010 | | 2009 | |
Per share data | |
Net asset value, beginning of period | | $ | 10.55 | | | $ | 10.54 | | | $ | 10.47 | | | $ | 10.55 | | | $ | 10.46 | | | $ | 10.32 | | |
Income from investment operations: | |
Net investment income | | | 0.14 | | | | 0.01 | | | | 0.19 | | | | 0.18 | | | | 0.19 | | | | 0.30 | | |
Net realized and unrealized gain (loss) | | | (0.01 | ) | | | 0.01 | | | | 0.06 | | | | (0.07 | ) | | | 0.10 | | | | 0.15 | | |
Total from investment operations | | | 0.13 | | | | 0.02 | | | | 0.25 | | | | 0.11 | | | | 0.29 | | | | 0.45 | | |
Less distributions to shareholders: | |
Net investment income | | | (0.14 | ) | | | (0.01 | ) | | | (0.18 | ) | | | (0.19 | ) | | | (0.20 | ) | | | (0.31 | ) | |
Total distributions to shareholders | | | (0.14 | ) | | | (0.01 | ) | | | (0.18 | ) | | | (0.19 | ) | | | (0.20 | ) | | | (0.31 | ) | |
Proceeds from regulatory settlements | | | — | | | | — | | | | — | | | | — | | | | 0.00 | (b) | | | — | | |
Net asset value, end of period | | $ | 10.54 | | | $ | 10.55 | | | $ | 10.54 | | | $ | 10.47 | | | $ | 10.55 | | | $ | 10.46 | | |
Total return | | | 1.21 | % | | | 0.21 | % | | | 2.37 | % | | | 1.00 | % | | | 2.79 | % | | | 4.41 | % | |
Ratios to average net assets(c)(d) | |
Total gross expenses | | | 0.64 | % | | | 0.63 | %(e) | | | 0.63 | % | | | 0.53 | %(f) | | | 0.48 | %(f) | | | 0.47 | %(f) | |
Total net expenses(g) | | | 0.48 | %(h) | | | 0.47 | %(e) | | | 0.48 | %(h) | | | 0.50 | %(f)(h) | | | 0.47 | %(f)(h) | | | 0.40 | %(f)(h) | |
Net investment income | | | 1.30 | % | | | 1.41 | %(e) | | | 1.77 | % | | | 1.75 | % | | | 1.83 | % | | | 2.94 | % | |
Supplemental data | |
Net assets, end of period (in thousands) | | $ | 1,829,096 | | | $ | 1,986,836 | | | $ | 2,040,417 | | | $ | 1,703,560 | | | $ | 2,020,837 | | | $ | 1,044,788 | | |
Portfolio turnover | | | 37 | % | | | 2 | % | | | 39 | % | | | 38 | % | | | 62 | % | | | 94 | % | |
Notes to Financial Highlights
(a) For the period from April 1, 2012 to April 30, 2012. During the period, the Fund's fiscal year end was changed from March 31 to April 30.
(b) Rounds to zero.
(c) In addition to the fees and expenses which the Fund bears directly, the Fund indirectly bears a pro rata share of the fees and expenses of the acquired funds in which it invests. Such indirect expenses are not included in the reported expense ratios.
(d) Certain line items from prior years have been reclassified to conform to the current presentation.
(e) Annualized.
(f) Includes interest expense which rounds to less than 0.01%.
(g) Total net expenses include the impact of certain waivers/reimbursements made by the Investment Manager and certain of its affiliates, if applicable.
(h) The benefits derived from expense reductions had an impact of less than 0.01%.
The accompanying Notes to Financial Statements are an integral part of this statement.
Annual Report 2013
34
Columbia Short Term Municipal Bond Fund
Notes to Financial Statements
April 30, 2013
Note 1. Organization
Columbia Short Term Municipal Bond Fund (the Fund), a series of Columbia Funds Series Trust (the Trust), is a diversified fund. The Trust is registered under the Investment Company Act of 1940, as amended (the 1940 Act), as an open-end management investment company organized as a Delaware statutory trust.
Fund Shares
The Trust may issue an unlimited number of shares (without par value). The Fund offers Class A, Class B, Class C, Class R4, Class R5 and Class Z shares. All share classes have identical voting, dividend and liquidation rights. Each share class has its own expense structure and sales charges, as applicable.
Class A shares are subject to a maximum front-end sales charge of 1.00% based on the initial investment amount. Class A shares purchased without an initial sales charge in accounts aggregating $1 million to $50 million at the time of purchase are subject to a contingent deferred sales charge (CDSC) if the shares are sold within 18 months of purchase, charged as follows: 1.00% CDSC if redeemed within 12 months of purchase, and 0.50% CDSC if redeemed more than 12, but less than 18, months after purchase.
Class B shares are not subject to sales charges and will generally convert to Class A shares eight years after purchase. The Fund no longer accepts investments by new or existing investors in the Fund's Class B shares, except in connection with the reinvestment of any dividend and/or capital gain distributions in Class B shares of the Fund and exchanges by existing Class B shareholders of certain other funds within the Columbia Family of Funds.
Class C shares are subject to a 1.00% CDSC on shares redeemed within one year of purchase.
Class R4 shares are not subject to sales charges and are generally available only to omnibus retirement plans and certain other eligible investors. Class R4 shares commenced operations on March 19, 2013.
Class R5 shares are not subject to sales charges and are generally available only to investors purchasing through authorized investment professionals and omnibus retirement plans. Class R5 shares commenced operations on November 8, 2012.
Class Z shares are not subject to sales charges, and are available only to certain investors.
Note 2. Summary of Significant Accounting Policies
Use of Estimates
The preparation of financial statements in accordance with U.S. generally accepted accounting principles (GAAP) requires management to make certain estimates and assumptions that affect the reported amounts of assets and liabilities, the disclosure of contingent assets and liabilities at the date of the financial statements and the reported amounts of revenue and expenses during the reporting period. Actual results could differ from those estimates.
The following is a summary of significant accounting policies consistently followed by the Fund in the preparation of its financial statements.
Security Valuation
Debt securities generally are valued by pricing services approved by the Board of Trustees (the Board) based upon market transactions for normal, institutional-size trading units of similar securities. The services may use various pricing techniques which take into account appropriate factors such as yield, quality, coupon rate, maturity, type of issue, trading characteristics and other data, as well as broker quotes. Debt securities for which quotations are readily available may also be valued based upon an over-the-counter or exchange bid quotation.
Investments in other open-end investment companies, including money market funds, are valued at net asset value.
Short-term securities purchased within 60 days to maturity are valued at amortized cost, which approximates market value. The value of short-term securities originally purchased with maturities greater than 60 days is determined based on an amortized value to par upon reaching 60 days to maturity. Short-term securities maturing in more than 60 days from the valuation date are valued at the market price or approximate market value based on current interest rates.
Investments for which market quotations are not readily available, or that have quotations which management believes are not reliable, are valued at fair value as determined in good faith under consistently applied procedures established by and under the general supervision of the Board. If a security or class of securities (such as foreign securities) is valued at fair value, such value is likely to be different from the last quoted market price for the security.
The determination of fair value often requires significant judgment. To determine fair value, management may use assumptions including but not limited to future cash flows and estimated risk premiums. Multiple inputs from various sources may be used to determine fair value.
Annual Report 2013
35
Columbia Short Term Municipal Bond Fund
Notes to Financial Statements (continued)
April 30, 2013
Delayed Delivery Securities
The Fund may trade securities on other than normal settlement terms, including securities purchased or sold on a "when-issued" basis. This may increase the risk if the other party to the transaction fails to deliver and causes the Fund to subsequently invest at less advantageous prices. The Fund designates cash or liquid securities in an amount equal to the delayed delivery commitment.
Security Transactions
Security transactions are accounted for on the trade date. Cost is determined and gains (losses) are based upon the specific identification method for both financial statement and federal income tax purposes.
Income Recognition
Interest income is recorded on an accrual basis. Market premiums and discounts, including original issue discounts, are amortized and accreted, respectively, over the expected life of the security on all debt securities, unless otherwise noted.
Dividend income is recorded on the ex-dividend date.
Expenses
General expenses of the Trust are allocated to the Fund and other funds of the Trust based upon relative net assets or other expense allocation methodologies determined by the nature of the expense. Expenses directly attributable to the Fund are charged to the Fund. Expenses directly attributable to a specific class of shares are charged to that share class.
Determination of Class Net Asset Value
All income, expenses (other than class-specific expenses, which are charged to that share class, as shown in the Statement of Operations) and realized and unrealized gains (losses) are allocated to each class of the Fund on a daily basis, based on the relative net assets of each class, for purposes of determining the net asset value of each class.
Federal Income Tax Status
The Fund intends to qualify each year as a regulated investment company under Subchapter M of the Internal Revenue Code, as amended, and will distribute substantially all of its tax exempt and taxable income (including net short-term capital gains), if any, for its tax year, and as such will not be subject to federal income taxes. In addition, the Fund intends to distribute in each calendar year substantially all of its net investment income, capital gains and certain other amounts, if any, such that the Fund should not be subject to federal excise tax. Therefore, no federal income or excise tax provision is recorded.
Distributions to Shareholders
Distributions from net investment income, if any, are declared daily and paid monthly. Net realized capital gains, if any, are distributed at least annually. Income distributions and capital gain distributions are determined in accordance with federal income tax regulations, which may differ from GAAP.
Guarantees and Indemnifications
Under the Trust's organizational documents and, in some cases, by contract, its officers and trustees are indemnified against certain liabilities arising out of the performance of their duties to the Trust or its funds. In addition, certain of the Fund's contracts with its service providers contain general indemnification clauses. The Fund's maximum exposure under these arrangements is unknown since the amount of any future claims that may be made against the Fund cannot be determined, and the Fund has no historical basis for predicting the likelihood of any such claims.
Recent Accounting Pronouncement
Disclosures about Offsetting Assets and Liabilities
In December 2011, the Financial Accounting Standards Board (FASB) issued Accounting Standards Update (ASU) No. 2011-11, Disclosures about Offsetting Assets and Liabilities and in January 2013, ASU No. 2013-1, Clarifying the Scope of Disclosures about Offsetting Assets and Liabilities (collectively, the ASUs). Specifically, the ASUs require an entity to disclose both gross and net information for derivatives and other financial instruments that are subject to a master netting arrangement or similar agreement. The ASUs require disclosure of collateral received in connection with the master netting agreements or similar agreements. The disclosure requirements are effective for interim and annual periods beginning on or after January 1, 2013. At this time, management is evaluating the implications of this guidance and the impact it will have on the financial statement amounts and footnote disclosures, if any.
Note 3. Fees and Compensation Paid to Affiliates
Investment Management Fees
Under an Investment Management Services Agreement, Columbia Management Investment Advisers, LLC (the Investment Manager), a wholly-owned subsidiary of Ameriprise Financial, Inc. (Ameriprise Financial), determines which securities will be purchased, held or sold. The investment management fee is an annual fee that is equal to a percentage of the Fund's average daily net assets that declines from 0.36% to 0.24% as the Fund's net assets increase. The
Annual Report 2013
36
Columbia Short Term Municipal Bond Fund
Notes to Financial Statements (continued)
April 30, 2013
effective investment management fee rate for the year ended April 30, 2013 was 0.36% of the Fund's average daily net assets.
Administration Fees
Under an Administrative Services Agreement, the Investment Manager also serves as the Fund Administrator. The Fund pays the Fund Administrator an annual fee for administration and accounting services equal to a percentage of the Fund's average daily net assets that declines from 0.07% to 0.04% as the Fund's net assets increase. The effective administration fee rate for the year ended April 30, 2013 was 0.06% of the Fund's average daily net assets.
Other Expenses
Other expenses are for, among other things, certain expenses of the Fund or the Board, including: Fund boardroom and office expense, employee compensation, employee health and retirement benefits, and certain other expenses. Payment of these Fund and Board expenses is facilitated by a company providing limited administrative services to the Fund and the Board. For the year ended April 30, 2013, other expenses paid to this company were $6,645.
Compensation of Board Members
Board members are compensated for their services to the Fund as disclosed in the Statement of Operations. Under a Deferred Compensation Plan (the Plan), the Board members who are not "interested persons" of the Fund, as defined under the 1940 Act, may elect to defer payment of up to 100% of their compensation. Deferred amounts are treated as though equivalent dollar amounts had been invested in shares of certain funds managed by the Investment Manager. The Fund's liability for these amounts is adjusted for market value changes and remains in the Fund until distributed in accordance with the Plan.
Transfer Agent Fees
Under a Transfer and Dividend Disbursing Agent Agreement, Columbia Management Investment Services Corp. (the Transfer Agent), an affiliate of the Investment Manager and a wholly-owned subsidiary of Ameriprise Financial, is responsible for providing transfer agency services to the Fund. The Transfer Agent has contracted with Boston Financial Data Services (BFDS) to serve as sub-transfer agent.
The Transfer Agent receives monthly account-based service fees based on the number of open accounts and also receives sub-transfer agency fees based on a percentage of the average aggregate value of the Fund's shares maintained in omnibus accounts (other than omnibus accounts for which American Enterprise Investment Services Inc. is the broker of record or
accounts where the beneficial shareholder is a customer of Ameriprise Financial Services, Inc., which are paid a per account fee). The Transfer Agent pays the fees of BFDS for services as sub-transfer agent and is not entitled to reimbursement for such fees from the Fund (with the exception of out-of-pocket fees).
The Transfer Agent also receives compensation from fees for various shareholder services and reimbursements for certain out-of-pocket fees. Total transfer agent fees for Class R5 shares are subject to an annual limitation of not more than 0.05% of the average daily net assets attributable to Class R5 shares.
For the year ended April 30, 2013, the Fund's effective transfer agent fee rates as a percentage of average daily net assets of each class were as follows:
Class A | | | 0.20 | % | |
Class B | | | 0.20 | | |
Class C | | | 0.20 | | |
Class R4* | | | 0.23 | | |
Class R5* | | | 0.05 | | |
Class Z | | | 0.20 | | |
*Annualized
An annual minimum account balance fee of $20 may apply to certain accounts with a value below the Fund's initial minimum investment requirements to reduce the impact of small accounts on transfer agent fees. These minimum account balance fees are recorded as part of expense reductions in the Statement of Operations. For the year ended April 30, 2013, these minimum account balance fees reduced total expenses by $40.
Distribution and Service Fees
The Fund has an agreement with Columbia Management Investment Distributors, Inc. (the Distributor), an affiliate of the Investment Manager and a wholly-owned subsidiary of Ameriprise Financial, for distribution and shareholder services. Pursuant to Rule 12b-1 under the 1940 Act, the Board has approved, and the Fund has adopted, distribution and shareholder service plans (the Plans) which set the distribution and service fees for the Fund. These fees are calculated daily and are intended to compensate the Distributor and/or eligible selling and/or servicing agents for selling shares of the Fund and providing services to investors.
The Plans require the payment of a monthly combined distribution and service fee to the Distributor at the maximum annual rate of 0.25% of the average daily net assets attributable to Class A shares of the Fund. The Plans also require the payment of a monthly service fee at the maximum annual rate of 0.25% of the average daily net assets attributable
Annual Report 2013
37
Columbia Short Term Municipal Bond Fund
Notes to Financial Statements (continued)
April 30, 2013
to Class B and Class C shares of the Fund and the payment of a monthly distribution fee at the maximum annual rate of 0.75% of the average daily net assets attributable to Class B and Class C shares of the Fund.
Sales Charges
Sales charges, including front-end charges and CDSCs, received by the Distributor for distributing Fund shares were $45,362 for Class A, and $3,362 for Class C shares for the year ended April 30, 2013.
Expenses Waived/Reimbursed by the Investment Manager and its Affiliates
The Investment Manager and certain of its affiliates have contractually agreed to waive fees and/or reimburse expenses (excluding certain fees and expenses described below) for the periods disclosed below, unless sooner terminated at the sole discretion of the Board, so that the Fund's net operating expenses, after giving effect to fees waived/expenses reimbursed and any balance credits and/or overdraft charges from the Fund's custodian, do not exceed the following annual rates as a percentage of the class' average daily net assets:
| | | August 1, 2012
through
August 31, 2013 | | Prior to
August 1, 2012 | |
Class A | | | 0.73 | % | | | 0.72 | % | |
Class B | | | 1.48 | | | | 1.47 | | |
Class C | | | 1.48 | | | | 1.47 | | |
Class R4 | | | 0.48 | * | | | — | | |
Class R5 | | | 0.39 | ** | | | — | | |
Class Z | | | 0.48 | | | | 0.47 | | |
*Annual rate is contractual from March 19, 2013 (the commencement of operations of Class R4 shares) through February 28, 2014.
**Annual rate is contractual from November 8, 2012 (the commencement of operations of Class R5 shares) through November 8, 2013.
Under the agreement governing these fee waivers and/or expense reimbursement arrangements, the following fees and expenses are excluded from the waiver/reimbursement commitment, and therefore will be paid by the Fund, if applicable: taxes (including foreign transaction taxes), expenses associated with investments in affiliated and non-affiliated pooled investment vehicles (including mutual funds and exchange traded funds), transaction costs and brokerage commissions, costs related to any securities lending program, dividend expenses associated with securities sold short, inverse floater program fees and expenses, transaction charges and interest on borrowed money, interest, extraordinary expenses and any other expenses the exclusion of which is specifically approved by the Board. This agreement may be modified or amended only with approval from all parties.
Note 4. Federal Tax Information
The timing and character of income and capital gain distributions are determined in accordance with income tax regulations, which may differ from GAAP because of temporary or permanent book to tax differences.
At April 30, 2013, these differences are primarily due to differing treatment for capital loss carryforwards, deferral/reversal of wash sales losses, Trustees' deferred compensation, distributions and post-October capital losses. To the extent these differences are permanent, reclassifications are made among the components of the Fund's net assets in the Statement of Assets and Liabilities. Temporary differences do not require reclassifications. In the Statement of Assets and Liabilities the following reclassifications were made:
Undistributed net investment income | | $ | (1 | ) | |
Accumulated net realized loss | | | 3,786,209 | | |
Paid-in capital | | | (3,786,208 | ) | |
Net investment income and net realized gains (losses), as disclosed in the Statement of Operations, and net assets were not affected by this reclassification.
The tax character of distributions paid during the periods indicated was as follows:
| | | Year Ended
April 30,
2013 | | Period Ended
April 30,
2012 | | Year Ended
March 31,
2012 | |
Ordinary income | | $ | — | | | $ | — | | | $ | 282 | | |
Long-term capital gains | | | — | | | | — | | | | — | | |
Tax-exempt income | | | 27,255,536 | | | | 2,458,629 | | | | 33,715,739 | | |
Total | | $ | 27,255,536 | | | $ | 2,458,629 | | | $ | 33,716,021 | | |
Short-term capital gain distributions, if any, are considered ordinary income distributions for tax purposes.
At April 30, 2013, the components of distributable earnings on a tax basis were as follows:
Undistributed tax-exempt income | | $ | 4,474,367 | | |
Accumulated realized loss | | | (6,541,035 | ) | |
Unrealized appreciation | | | 31,559,566 | | |
At April 30, 2013, the cost of investments for federal income tax purposes was $2,002,691,330 and the aggregate gross unrealized appreciation and depreciation based on that cost was:
Unrealized appreciation | | $ | 32,079,187 | | |
Unrealized depreciation | | | (519,621 | ) | |
Net unrealized appreciation | | | 31,559,566 | | |
The following capital loss carryforward, determined at April 30, 2013, may be available to reduce taxable income
Annual Report 2013
38
Columbia Short Term Municipal Bond Fund
Notes to Financial Statements (continued)
April 30, 2013
arising from future net realized gains on investments, if any, to the extent permitted by the Internal Revenue Code:
Year of Expiration | | Amount | |
2014 | | $ | 3,090,745 | | |
2015 | | | 1,181,270 | | |
2018 | | | 602,849 | | |
Unlimited long-term | | | 1,632,785 | | |
Total | | $ | 6,507,649 | | |
Unlimited capital loss carryforwards are required to be utilized prior to any capital losses which carry an expiration date. As a result of this ordering rule, capital loss carryforwards which carry an expiration date may be more likely to expire unused.
For the year ended April 30, 2013, $180,341 of capital loss carryforward was utilized and $3,786,208 expired unused.
Under current tax rules, regulated investment companies can elect to treat certain late-year ordinary losses incurred and post-October capital losses (capital losses realized after October 31) as arising on the first day of the following taxable year. As of April 30, 2013, the Fund will elect to treat post-October capital losses of $33,386 as arising on May 1, 2013.
Management of the Fund has concluded that there are no significant uncertain tax positions that would require recognition in the financial statements. However, management's conclusion may be subject to review and adjustment at a later date based on factors including, but not limited to, new tax laws, regulations, and administrative interpretations (including relevant court decisions). Generally, the Fund's federal tax returns for the prior three fiscal years remain subject to examination by the Internal Revenue Service.
Note 5. Portfolio Information
The cost of purchases and proceeds from sales of securities, excluding short-term obligations, aggregated to $711,688,960 and $726,767,496, respectively, for the year ended April 30, 2013.
Note 6. Shareholder Concentration
At April 30, 2013, one unaffiliated shareholder account owned 83.7% of the outstanding shares of the Fund. The Fund has no knowledge about whether any portion of those shares was owned beneficially by such account. Subscription and redemption activity by concentrated accounts may have a significant effect on the operations of the Fund.
Note 7. Line of Credit
The Fund has entered into a revolving credit facility with a syndicate of banks led by JPMorgan Chase Bank N.A.
whereby the Fund may borrow for the temporary funding of shareholder redemptions or for other temporary or emergency purposes. The credit facility agreement, as amended, which is a collective agreement between the Fund and certain other funds managed by the Investment Manager, severally and not jointly, permits collective borrowings up to $500 million. Interest is charged to each participating fund based on its borrowings at a rate equal to the higher of (i) the overnight federal funds rate plus 1.00% or (ii) the one-month LIBOR rate plus 1.00%. Each borrowing under the credit facility matures no later than 60 days after the date of borrowing. The Fund also pays a commitment fee equal to its pro rata share of the amount of the credit facility at a rate of 0.08% per annum.
The Fund had no borrowings during the year ended April 30, 2013.
Note 8. Subsequent Events
Management has evaluated the events and transactions that have occurred through the date the financial statements were issued and noted no items requiring adjustment of the financial statements or additional disclosure.
Note 9. Information Regarding Pending and Settled Legal Proceedings
In December 2005, without admitting or denying the allegations, American Express Financial Corporation (AEFC, which is now known as Ameriprise Financial, Inc. (Ameriprise Financial)) entered into settlement agreements with the Securities and Exchange Commission (SEC) and Minnesota Department of Commerce (MDOC) related to market timing activities. As a result, AEFC was censured and ordered to cease and desist from committing or causing any violations of certain provisions of the Investment Advisers Act of 1940, the Investment Company Act of 1940, and various Minnesota laws. AEFC agreed to pay disgorgement of $10 million and civil money penalties of $7 million. AEFC also agreed to retain an independent distribution consultant to assist in developing a plan for distribution of all disgorgement and civil penalties ordered by the SEC in accordance with various undertakings detailed at www.sec.gov/litigation/admin/ia-2451.pdf. Ameriprise Financial and its affiliates have cooperated with the SEC and the MDOC in these legal proceedings, and have made regular reports to the funds' Boards of Trustees.
Ameriprise Financial and certain of its affiliates have historically been involved in a number of legal, arbitration and regulatory proceedings, including routine litigation, class actions, and governmental actions, concerning matters arising in connection with the conduct of their business activities. Ameriprise Financial believes that the Funds are not currently the subject of, and that neither Ameriprise Financial nor any of its affiliates are the subject of, any pending legal, arbitration or
Annual Report 2013
39
Columbia Short Term Municipal Bond Fund
Notes to Financial Statements (continued)
April 30, 2013
regulatory proceedings that are likely to have a material adverse effect on the Funds or the ability of Ameriprise Financial or its affiliates to perform under their contracts with the Funds. Ameriprise Financial is required to make 10-Q, 10-K and, as necessary, 8-K filings with the Securities and Exchange Commission on legal and regulatory matters that relate to Ameriprise Financial and its affiliates. Copies of these filings may be obtained by accessing the SEC website at www.sec.gov.
There can be no assurance that these matters, or the adverse publicity associated with them, will not result in increased fund redemptions, reduced sale of fund shares or other adverse consequences to the Funds. Further, although we believe proceedings are not likely to have a material adverse effect on the Funds or the ability of Ameriprise Financial or its affiliates to perform under their contracts with the Funds, these proceedings are subject to uncertainties and, as such, we are unable to estimate the possible loss or range of loss that may result. An adverse outcome in one or more of these proceedings could result in adverse judgments, settlements, fines, penalties or other relief that could have a material adverse effect on the consolidated financial condition or results of operations of Ameriprise Financial.
Annual Report 2013
40
Columbia Short Term Municipal Bond Fund
Report of Independent Registered Public Accounting Firm
To the Trustees of Columbia Funds Series Trust and the Shareholders of Columbia Short Term Municipal Bond Fund
In our opinion, the accompanying statement of assets and liabilities, including the portfolio of investments, and the related statements of operations and of changes in net assets and the financial highlights present fairly, in all material respects, the financial position of Columbia Short Term Municipal Bond Fund (the "Fund") (a series of Columbia Funds Series Trust) at April 30, 2013, the results of its operations, the changes in its net assets and the financial highlights for the periods indicated, in conformity with accounting principles generally accepted in the United States of America. These financial statements and financial highlights (hereafter referred to as "financial statements") are the responsibility of the Fund's management. Our responsibility is to express an opinion on these financial statements based on our audits. We conducted our audits of these financial statements in accordance with the standards of the Public Company Accounting Oversight Board (United States). Those standards require that we plan and perform the audit to obtain reasonable assurance about whether the financial statements are free of material misstatement. An audit includes examining, on a test basis, evidence supporting the amounts and disclosures in the financial statements, assessing the accounting principles used and significant estimates made by management, and evaluating the overall financial statement presentation. We believe that our audits, which included confirmation of securities at April 30, 2013 by correspondence with the custodian and brokers, provide a reasonable basis for our opinion.
PricewaterhouseCoopers LLP
Minneapolis, Minnesota
June 21, 2013
Annual Report 2013
41
Columbia Short Term Municipal Bond Fund
Federal Income Tax Information
(Unaudited)
The Fund hereby designates the following tax attributes for the fiscal year ended April 30, 2013. Shareholders will be notified in early 2014 of amounts for use in preparing 2013 income tax returns
Tax Designations:
| Exempt-Interest Dividends | | | 100.00 | % | |
Exempt-Interest Dividends. The percentage of net investment income dividends paid during the fiscal year that qualifies as exempt-interest dividends for federal income tax purposes.
Annual Report 2013
42
Columbia Short Term Municipal Bond Fund
Shareholders elect the Board that oversees the funds' operations. The Board appoints officers who are responsible for day-to-day business decisions based on policies set by the Board. The following table provides basic biographical information about the funds' Board members, including their principal occupations during the past five years, although specific titles for individuals may have varied over the period. Under current Board policy, members may serve until the next Board meeting after he or she reaches the mandatory retirement age established by the Board, or the fifteenth anniversary of the first Board meeting they attended as a member of the Board.
Mr. Edward J. Boudreau, Jr., Mr. William P. Carmichael, Mr. William A. Hawkins, Mr. R. Glenn Hilliard, Ms. Minor M. Shaw and Dr. Anthony M. Santomero, were members of the Legacy Columbia Nations funds' Board ("Nations Funds"), which includes Columbia Funds Series Trust, Columbia Funds Variable Insurance Trust I and Columbia Funds Master Investment Trust, LLC and began service on the Board for the Legacy RiverSource funds ("RiverSource Funds") effective June 1, 2011.
Independent Trustees
Name,
Address,
Year of Birth | | Position Held With
Funds and Length of
Service | | Principal Occupation
During Past Five Years | | Number of
Funds in the
Fund Family
Overseen by
Board Member | | Other Present or Past
Directorships/Trusteeships
(Within Past 5 Years)
| |
Kathleen Blatz
901 S. Marquette Ave.
Minneapolis, MN 55402
1954 | | Board member since 1/06 for RiverSource Funds and since 6/11 for Nations Funds | | Attorney; Chief Justice, Minnesota Supreme Court, 1998-2006 | | | 132 | | | Director, BlueCross BlueShield of Minnesota since 2009 | |
Edward J. Boudreau, Jr.
901 S. Marquette Ave.
Minneapolis, MN 55402
1944 | | Board member since 6/11 for RiverSource Funds and since 1/05 for Nations Funds | | Managing Director, E.J. Boudreau & Associates (consulting) since 2000 | | | 130 | | | Former Trustee, BofA Funds Series Trust (11 funds) | |
Pamela G. Carlton
901 S. Marquette Ave.
Minneapolis, MN 55402
1954 | | Board member since 7/07 for RiverSource Funds and since 6/11 for Nations Funds | | President, Springboard — Partners in Cross Cultural Leadership (consulting company) since 2003 | | | 132 | | | None | |
William P. Carmichael
901 S. Marquette Ave.
Minneapolis, MN 55402
1943 | | Board member since 6/11 for RiverSource Funds and since 1999 for Nations Funds | | Retired | | | 130 | | | Director, Cobra Electronics
Corporation (electronic equipment manufacturer); The Finish Line (athletic shoes and apparel) since July 2003; McMoRan Exploration Company (oil and gas exploration and development) since 2010; former Trustee, BofA Funds Series Trust (11 funds); former Director, Spectrum Brands, Inc. (consumer products); former Director, Simmons Company (bedding) | |
Patricia M. Flynn
901 S. Marquette Ave.
Minneapolis, MN 55402
1950 | | Board member since 11/04 for RiverSource Funds and since 6/11 for Nations Funds | | Trustee Professor of Economics and Management, Bentley University since 1976 | | | 132 | | | None | |
William A. Hawkins
901 S. Marquette Ave.
Minneapolis, MN 55402
1942 | | Board member since 6/11 for RiverSource Funds and since 1/05 for Nations Funds | | Managing Director, Overton Partners (financial consulting), since August 2010; President and Chief Executive Officer, California General Bank, N.A., January 2008-August 2010 | | | 130 | | | Trustee, BofA Funds Series Trust (11 funds) | |
Annual Report 2013
43
Columbia Short Term Municipal Bond Fund
Trustees and Officers (continued)
Independent Trustees (continued)
Name,
Address,
Year of Birth | | Position Held With
Funds and Length of
Service | | Principal Occupation
During Past Five Years | | Number of
Funds in the
Fund Family
Overseen by
Board Member | | Other Present or Past
Directorships/Trusteeships
(Within Past 5 Years)
| |
R. Glenn Hilliard
901 S. Marquette Ave.
Minneapolis, MN 55402
1943 | | Board member since 6/11 for RiverSource Funds and since 1/05 for Nations Funds | | Chairman and Chief Executive Officer, Hilliard Group LLC (investing and consulting), since April 2003; Non-Executive Director & Chairman, CNO Financial Group, Inc. (insurance), September 2003-May 2011 | | | 130 | | | Chairman, BofA Fund Series Trust (11 funds); former Director, CNO Financial Group, Inc. (insurance) | |
Stephen R. Lewis, Jr.
901 S. Marquette Ave.
Minneapolis, MN 55402
1939 | | Chair of the Board for RiverSource Funds since 1/07, Board member for RiverSource Funds since 1/02 and since 6/11 for Nations Funds | | President Emeritus and Professor of Economics Emeritus, Carleton College since 2002 | | | 132 | | | Director, Valmont Industries, Inc. (irrigation systems manufacturer) since 2002 | |
Catherine James Paglia
901 S. Marquette Ave.
Minneapolis, MN 55402
1952 | | Board member since 11/04 for RiverSource Funds and since 6/11 for Nations Funds | | Director, Enterprise Asset Management, Inc. (private real estate and asset management company) | | | 132 | | | Director, Valmont Industries, Inc. (irrigation systems manufacturer) since 2012 | |
Leroy C. Richie
901 S. Marquette Ave.
Minneapolis, MN 55402
1941 | | Board member since 2000 for Legacy Seligman Funds, since 11/08 for RiverSource Funds and since 6/11 for Nations Funds | | Counsel, Lewis & Munday, P.C. (law firm) since 2004; former Vice President and General Counsel, Automotive Legal Affairs, Chrysler Corporation from 1983-1987 | | | 132 | | | Lead Outside Director, Digital Ally, Inc. (digital imaging) since September 2005; Director, Infinity, Inc. (oil and gas exploration and production) since 1994; Director, OGE Energy Corp. (energy and energy services) since November 2007 | |
Minor M. Shaw
901 S. Marquette Ave.
Minneapolis, MN 55402
1947 | | Board member since 6/11 for RiverSource Funds and since 2003 for Nations Funds | | President, Micco LLC (private investments) since 2011; President, Micco Corp. since 1998 | | | 130 | | | Director, Piedmont Natural Gas; Director, BlueCross BlueShield of South Carolina since April 2008; Former Trustee, BofA Funds Series Trust (11 funds) | |
Alison Taunton-Rigby
901 S. Marquette Ave.
Minneapolis, MN 55402
1944 | | Board member since 11/02 for RiverSource Funds and since 6/11 for Nations Funds | | Chief Executive Officer and Director, RiboNovix, Inc. (biotechnology), 2003-2010 | | | 132 | | | Director, Healthways, Inc. (health and well-being improvement) since 2005; Director, ICI Mutual Insurance Company, RRG since 2011; Director, Abt Associates (government contractor) since 2001; Director, Boston Children's Hospital since 2002 | |
Annual Report 2013
44
Columbia Short Term Municipal Bond Fund
Trustees and Officers (continued)
Interested Trustee Not Affiliated With Investment Manager*
Name,
Address,
Year of Birth | | Position Held With
Funds and Length of
Service | | Principal Occupation
During Past Five Years | | Number of
Funds in the
Fund Family
Overseen by
Board Member | | Other Present or Past
Directorships/Trusteeships
(Within Past 5 Years)
| |
Anthony M. Santomero
901 S. Marquette Ave.
Minneapolis, MN 55402
1946 | | Board member since 6/11 for RiverSource Funds and since 1/08 for Nations Funds | | Richard K. Mellon Professor Emeritus of Finance, The Wharton School, University of Pennsylvania, since 2002; Senior Advisor, McKinsey & Company (consulting), 2006-2008 | | | 130 | | | Director, Renaissance Reinsurance Ltd. since May 2008; Trustee, Penn Mutual Life Insurance Company since March 2008; Director, Citigroup, Inc. since 2009; Director, Citibank, N.A. since 2009; former Trustee, BofA Funds Series Trust (11 funds) | |
*Dr. Santomero is not an affiliated person of the investment manager or Ameriprise Financial. However, he is currently deemed by the funds to be an "interested person" (as defined in the 1940 Act) of the funds because he serves as a Director of Citigroup, Inc. and Citibank N.A., companies that may directly or through subsidiaries and affiliates engage from time-to-time in brokerage execution, principal transactions and lending relationships with the funds or accounts advised/managed by the investment manager.
Interested Trustee Affiliated With Investment Manager*
Name,
Address,
Year of Birth | | Position Held With
Funds and Length of
Service | | Principal Occupation
During Past Five Years | | Number of
Funds in the
Fund Family
Overseen by
Board Member | | Other Present or Past
Directorships/Trusteeships
(Within Past 5 Years) | |
William F. Truscott
53600 Ameriprise
Financial Center
Minneapolis, MN 55474
1960 | | Board member since 11/01 for RiverSource Funds and since 6/11 for Nations Funds; Senior Vice President since 2002 for RiverSource Funds and 5/10 for Nations Funds | | President, Columbia Management Investment Advisers, LLC since February 2012, (previously President, Chairman of the Board and Chief Investment Officer, 2001-April 2010); Chief Executive Officer, Global Asset Management, Ameriprise Financial, Inc. since September 2012 (previously Chief Executive Officer, U.S. Asset Management & President, Annuities, May 2010-September 2012 and President — U.S. Asset Management and Chief Investment Officer, 2005-April 2010); Chief Executive Officer, Columbia Management Investment Distributors, Inc. since February 2012, (previously Chairman of the Board and Chief Executive Officer, 2006-April 2010); Chairman of the Board and Chief Executive Officer, RiverSource Distributors, Inc. since 2006; President and Chief Executive Officer, Ameriprise Certificate Company 2006-August 2012 | | | 184 | | | Chairman of the Board, Columbia Management Investment Advisers, LLC since May 2010; Director, Columbia Management Investment Distributors, Inc. since May 2010; Director, Ameriprise Certificate Company, 2006-January 2013 | |
*Interested person (as defined under the 1940 Act) by reason of being an officer, director, security holder and/or employee of the investment manager or Ameriprise Financial.
The SAI has additional information about the Fund's Board members and is available, without charge, upon request by calling 800.345.6611; contacting your financial intermediary; or visiting columbiamanagement.com.
Annual Report 2013
45
Columbia Short Term Municipal Bond Fund
Trustees and Officers (continued)
The Board has appointed officers who are responsible for day-to-day business decisions based on policies it has established. The officers serve at the pleasure of the Board. In addition to Mr. Truscott, who is Senior Vice President, the funds' other officers are:
Officers
Name,
Address,
Year of Birth | | Position Held With
Funds and Length of
Service | | Principal Occupation During Past Five Years | |
J. Kevin Connaughton
225 Franklin Street
Boston, MA 02110
1964 | | President and Principal Executive Officer since 5/10 for RiverSource Funds and 2009 for Nations Funds | | Senior Vice President and General Manager — Mutual Fund Products, Columbia Management Investment Advisers, LLC since May 2010; President, Columbia Funds since 2009 and RiverSource Funds since May 2010; Managing Director of Columbia Management Advisors, LLC, December 2004-April 2010; Senior Vice President and Chief Financial Officer, Columbia Funds, June 2008-January 2009; Treasurer, Columbia Funds, October 2003-May 2008; and senior officer of various other affiliated funds since 2000 | |
Amy K. Johnson
5228 Ameriprise
Financial Center Minneapolis, MN 55474
1965 | | Vice President since 12/06 for RiverSource Funds and 5/10 for Nations Funds | | Senior Vice President and Chief Operating Officer, Columbia Management Investment Advisers, LLC since May 2010 (previously Chief Administrative Officer, 2009-April 2010 and Vice President — Asset Management and Trust Company Services, 2006-2009) | |
Michael G. Clarke
225 Franklin Street
Boston, MA 02110
1969 | | Treasurer since 1/11 and Chief Financial Officer since 4/11 for RiverSource Funds and Treasurer since 3/11 and Chief Financial Officer since 2009 for Nations Funds | | Vice President, Columbia Management Investment Advisers, LLC since May 2010; Managing Director of Fund Administration, Columbia Management Advisors, LLC, September 2004-April 2010; senior officer of Columbia Funds and affiliated funds since 2002 | |
Scott R. Plummer
5228 Ameriprise
Financial Center
Minneapolis, MN 55474
1959 | | Senior Vice President and Chief Legal Officer since 12/06 and Assistant Secretary since 6/11 for RiverSource Funds and Senior Vice President and Chief Legal Officer since 5/10 and Assistant Secretary since 6/11 for Nations Funds | | Senior Vice President, Chief Legal Officer and Assistant Secretary, Columbia Management Investment Advisers, LLC since June 2005; Vice President and Lead Chief Counsel — Asset Management, Ameriprise Financial, Inc. since May 2010 (previously Vice President and Chief Counsel — Asset Management, 2005-April 2010); Vice President, Chief Counsel and Assistant Secretary, Columbia Management Investment Distributors, Inc. since 2008; Vice President, General Counsel and Secretary, Ameriprise Certificate Company since 2005; Chief Counsel, RiverSource Distributors, Inc. since 2006; senior officer of Columbia Funds and affiliated funds since 2010 | |
Colin Moore
225 Franklin Street
Boston, MA 02110
1958 | | Senior Vice President since 5/10 for RiverSource Funds and Nations Funds | | Director and Chief Investment Officer, Columbia Management Investment Advisers, LLC since May 2010; Global Manager, Managing Director and Chief Investment Officer, Columbia Management Advisors, LLC, 2007-April 2010 | |
Thomas P. McGuire
225 Franklin Street
Boston, MA 02110
1972 | | Chief Compliance Officer since 3/12 | | Vice President — Asset Management Compliance, Columbia Management Investment Advisers, LLC since 2010; Chief Compliance Officer, Ameriprise Certificate Company since September 2010; Compliance Executive, Bank of America, 2005-2010 | |
Stephen T. Welsh
225 Franklin Street
Boston, MA 02110
1957 | | Vice President since 4/11 for RiverSource Funds and 2006 for Nations Funds | | President and Director, Columbia Management Investment Services Corp. since May 2010; President and Director, Columbia Management Services, Inc., July 2004-April 2010; Managing Director, Columbia Management Distributors, Inc., August 2007-April 2010 | |
Christopher O. Petersen
5228 Ameriprise
Financial Center
Minneapolis, MN 55474
1970 | | Vice President and Secretary since 4/11 for RiverSource Funds and 3/11 for Nations Funds | | Vice President and Chief Counsel, Ameriprise Financial, Inc. since January 2010 (formerly Vice President and Group Counsel or Counsel, April 2004-January 2010); Assistant Secretary of Legacy RiverSource Funds, January 2007-April 2011 and of the Nations Funds, May 2010-March 2011 | |
Annual Report 2013
46
Columbia Short Term Municipal Bond Fund
Trustees and Officers (continued)
Officers (continued)
Name,
Address,
Year of Birth | | Position Held With
Funds and Length of
Service | | Principal Occupation During Past Five Years | |
Paul D. Pearson
10468 Ameriprise
Financial Center
Minneapolis, MN 55474
1956 | | Vice President since 4/11 and Assistant Treasurer since 1999 for RiverSource Funds and Vice President and Assistant Treasurer since 6/11 for Nations Funds | | Vice President — Investment Accounting, Columbia Management Investment Advisers, LLC, since May 2010; Vice President — Managed Assets, Investment Accounting, Ameriprise Financial Inc., February 1998-May 2010 | |
Joseph F. DiMaria
225 Franklin Street
Boston, MA 02110
1968 | | Vice President and Chief Accounting Officer since 4/11 and Vice President since 3/11 and Chief Accounting Officer since 2008 for Nations Funds | | Vice President, Mutual Fund Administration, Columbia Management Investment Advisers, LLC, since May 2010; Director of Fund Administration, Columbia Management Advisors, LLC, January 2006-April 2010 | |
Paul B. Goucher
100 Park Avenue
New York, NY 10017
1968 | | Vice President since 4/11 and Assistant Secretary since 11/08 for RiverSource Funds and 5/10 for Nations Funds | | Vice President and Lead Chief Counsel, Ameriprise Financial, Inc. since November 2008 and January 2013, respectively (formerly, Chief Counsel, January 2010-January 2013 and Group Counsel from November 2008-January 2010); Director, Managing Director and General Counsel, J. & W. Seligman & Co. Incorporated, July 2008-November 2008 (previously, Managing Director and Associate General Counsel, January 2005-July 2008) | |
Michael E. DeFao
225 Franklin Street
Boston, MA 02110
1968 | | Vice President since 4/11 and Assistant Secretary since 5/10 for RiverSource Funds and 2011 for Nations Funds | | Vice President and Chief Counsel, Ameriprise Financial, Inc. since May 2010; Associate General Counsel, Bank of America, June 2005-April 2010 | |
Annual Report 2013
47
Columbia Short Term Municipal Bond Fund
Approval of Investment Management Services Agreement
Columbia Management Investment Advisers, LLC (Columbia Management or the Investment Manager), a wholly-owned subsidiary of Ameriprise Financial, Inc. (Ameriprise Financial), serves as the investment manager to Columbia Short Term Municipal Bond Fund (the Fund). Under an investment management services agreement (the IMS Agreement), Columbia Management provides investment advice and other services to the Fund and other funds distributed by Columbia Management Investment Distributors, Inc. (collectively, the Funds).
On an annual basis, the Fund's Board of Trustees (the Board), including the independent Board members (the Independent Trustees), considers renewal of the IMS Agreement. Columbia Management prepared detailed reports for the Board and its Contracts Committee in January, March and April 2013, including reports based on analyses of data provided by an independent organization and a comprehensive response to each item of information requested by independent legal counsel to the Independent Trustees (Independent Legal Counsel) in a letter to the Investment Manager, to assist the Board in making this determination. All of the materials presented in January, March and April were first supplied in draft form to designated representatives of the Independent Trustees, i.e., Independent Legal Counsel, the Chair of the Board and the Chair of the Contracts Committee, and the final materials (including proposed additional breakpoints in IMS fees for certain Funds) were revised to reflect discussion and subsequent requests made by the Contracts Committee. In addition, throughout the year, the Board (or its committees) regularly meets with portfolio management teams and senior management personnel, and reviews information prepared by Columbia Management addressing the services Columbia Management provides and Fund performance. Further, the Board retained an independent consulting firm (the Independent Consultant) to assist the Independent Trustees in their review of IMS fees, expense caps and Ameriprise Financial's profitability. The Board also accords particular weight to the work, deliberations and conclusions of the Contracts Committee, the Investment Review Committee and the Compliance Committee in determining whether to continue the IMS Agreement.
The Board, at its April 15-17, 2013 in-person Board meeting (the April Meeting), considered the renewal of the IMS Agreement for an additional one-year term. At the April Meeting, Independent Legal Counsel reviewed with the Independent Trustees various factors relevant to the Board's consideration of advisory agreements and the Board's legal responsibilities related to such consideration. Following an analysis and discussion of the factors identified below, the Board, including all of the Independent Trustees, approved the renewal of the IMS Agreement.
Nature, Extent and Quality of Services Provided by Columbia Management
The Independent Trustees analyzed various reports and presentations they had received detailing the services performed by Columbia Management, as well as its expertise, resources and capabilities. The Independent Trustees specifically considered many developments during the past year concerning the services provided by Columbia Management, including, in particular, the recent globalization initiative, which fosters increased worldwide investment support of global products, continued investment in upgrading technology (such as the implementation of new systems and hardware), the hiring of a Chief Interest Rate Strategist as part of Columbia Management's fixed income team and the addition of Columbia Management investment personnel to the Asset Allocation, Quantitative and Technology teams. The Independent Trustees noted the information they received concerning Columbia Management's ability to retain its key portfolio management personnel. In this regard, the Independent Trustees took into account their comprehensive discussions with Columbia Management's Chief Investment Officer (the CIO), observing the organizational depth of Columbia Management and the capabilities of its investment personnel. The Independent Trustees also recalled the information the CIO provided them identifying the strengths and areas for enhancement of each Columbia Management investment team, as well as the discussion with the CIO regarding the investment personnel talent being infused to enhance support for certain Funds. The Independent Trustees also observed the materials demonstrating the strength and depth of Columbia Management's equity and fixed income research departments.
In connection with the Board's evaluation of the overall package of services provided by Columbia Management, the Board also considered the quality of administrative services provided to the Fund by Columbia Management, recalling the information it received highlighting significant achievements in 2012 in the performance of administrative services (such as strong accounting performance measures, refined derivatives processing and enhancements to the electronic communications under the affiliated and unaffiliated service provider oversight program). In evaluating the quality of services provided under the IMS Agreement and the Fund's Administrative Service Agreement, the Independent Trustees also took into account the organization and strength of the Fund's and its service providers' compliance programs. In
Annual Report 2013
48
Columbia Short Term Municipal Bond Fund
Approval of Investment Management Services Agreement (continued)
addition, the Board also reviewed the financial condition of Columbia Management (and its affiliates) and each entity's ability to carry out its responsibilities under the IMS Agreement and the Fund's other services agreements with affiliates of Ameriprise Financial, observing the financial strength of Ameriprise Financial, with its solid balance sheet. The Board also discussed the acceptability of the terms of the IMS Agreement (including the relatively broad scope of services required to be performed by Columbia Management). The Board concluded that the services being performed under the IMS Agreement were of a reasonably high quality.
Based on the foregoing, and based on other information received (both oral and written, including the information on investment performance referenced below) and other considerations, the Board concluded that Columbia Management and its affiliates were in a position to continue to provide a high quality and level of services to the Fund.
Investment Performance
For purposes of evaluating the nature, extent and quality of services provided under the IMS Agreement, the Board carefully reviewed the investment performance of the Fund. In this regard, the Board considered detailed reports providing the results of analyses performed by an independent organization showing, for various periods, the performance of the Fund, the performance of a benchmark index, the percentage ranking of the Fund among its comparison group and the net assets of the Fund. The Board observed that the Fund's investment performance was appropriate in light of the particular management style involved and the particular market environment. The Board observed that appropriate steps (such as changes to the portfolio management team) had been taken to help improve the Fund's performance.
Comparative Fees, Costs of Services Provided and the Profits Realized By Columbia Management and its Affiliates from their Relationships with the Fund
The Board reviewed comparative fees and the costs of services to be provided under the IMS Agreement. The Board members considered detailed comparative information set forth in an annual report on fees and expenses, including, among other things, data (based on analyses conducted by an independent organization) showing a comparison of the Fund's expenses with median expenses paid by funds in its comparative peer universe, as well as data showing the Fund's contribution to Columbia Management's profitability. The Board reviewed the fees charged to comparable institutional or other accounts/vehicles managed by Columbia Management and discussed differences in how the products are managed and operated, noting no unreasonable differences in the levels of contractual fees.
The Board accorded particular weight to the notion that the level of fees should reflect a rational pricing model applied consistently across the various product lines in the Fund family, while assuring that the overall fees for each Fund (with few defined exceptions) are generally in line with the "pricing philosophy" (i.e., that the total expense ratio of the Fund is no higher than the median expense ratio of funds in the same comparison universe of the Fund). In this connection, the Board also considered the Independent Consultant's report that concluded that: (i) the Funds' standardized investment management fee rates, particularly in the context of the current competitive fee landscape, were within a reasonable range; and (ii) the Funds' expense cap philosophy of assuring that each Fund's total expense ratio is not above its peer universe median ratio is reasonable. The Board took into account that the Fund's total expense ratio (after considering proposed expense caps/waivers) approximated the peer universe's median expense ratio. Based on its review, the Board concluded that the Fund's management fee was fair and reasonable in light of the extent and quality of services that the Fund receives.
The Board also considered the expected profitability of Columbia Management and its affiliates in connection with Columbia Management providing investment management services to the Fund. In this regard, the Board referred to a detailed profitability report, discussing the profitability to Columbia Management and Ameriprise Financial from managing, operating and distributing the Funds. In this regard, the Board observed that 2012 profitability approximates 2011 profitability and that, as was the case in 2011, 2012 profitability remained generally in line with (and, in many cases, lower than) the reported profitability of other asset management firms. Further, the Board considered the Independent Consultant's report that concluded that Columbia Management's profitability, particularly in comparison to industry competitors, was reasonable and not excessive. It also took into account the indirect economic benefits flowing to Columbia Management or its affiliates in connection with managing or distributing the Funds, such as the enhanced ability to offer various other financial products to Ameriprise Financial customers, soft dollar benefits and overall reputational advantages. The Board noted that the fees paid by the Funds should permit the Investment Manager to offer competitive compensation
Annual Report 2013
49
Columbia Short Term Municipal Bond Fund
Approval of Investment Management Services Agreement (continued)
to its personnel, make necessary investments in its business and earn an appropriate profit. The Board concluded that profitability levels were reasonable.
Economies of Scale to be Realized
The Board also considered the economies of scale that might be realized by Columbia Management as the Fund grows and took note of the extent to which Fund shareholders might also benefit from such growth. In this regard, the Independent Trustees took into account that IMS fees decline as Fund assets exceed various breakpoints, all of which have not been surpassed.
Based on the foregoing, the Board, including all of the Independent Trustees, concluded that the investment management service fees were fair and reasonable in light of the extent and quality of services provided. In reaching this conclusion, no single factor was determinative. On April 17, 2013, the Board, including all of the Independent Trustees, approved the renewal of the IMS Agreement.
Annual Report 2013
50
This page intentionally left blank.
Annual Report 2013
51
This page intentionally left blank.
Annual Report 2013
52
Columbia Short Term Municipal Bond Fund
Important Information About This Report
Each fund mails one shareholder report to each shareholder address. If you would like more than one report, please call shareholder services at 800.345.6611 and additional reports will be sent to you.
The policy of the Board is to vote the proxies of the companies in which each fund holds investments consistent with the procedures as stated in the Statement of Additional Information (SAI). You may obtain a copy of the SAI without charge by calling 800.345.6611; contacting your financial intermediary; visiting columbiamanagement.com; or searching the website of the Securities and Exchange Commission (SEC) at sec.gov. Information regarding how each fund voted proxies relating to portfolio securities is filed with the SEC by August 31 for the most recent 12-month period ending June 30 of that year, and is available without charge by visiting columbiamanagement.com; or searching the website of the SEC at sec.gov.
Each fund files a complete schedule of portfolio holdings with the SEC for the first and third quarters of each fiscal year on Form N-Q. Each fund's Form N-Q is available on the SEC's website at sec.gov and may be reviewed and copied at the SEC's Public Reference Room in Washington, D.C. Information on the operation of the Public Reference Room may be obtained by calling 800.SEC.0330. Each fund's complete schedule of portfolio holdings, as filed on Form N-Q, can also be obtained without charge, upon request, by calling 800.345.6611.
Annual Report 2013
53

Columbia Short Term Municipal Bond Fund
P.O. Box 8081
Boston, MA 02266-8081
columbiamanagement.com
This information is for use with concurrent or prior delivery of a fund prospectus. Please read and consider the investment objectives, risks, charges and expenses for any fund carefully before investing. For a prospectus which contains this and other important information about the Fund go to columbiamanagement.com. The Fund is distributed by Columbia Management Investment Distributors, Inc., member FINRA, and managed by Columbia Management Investment Advisers, LLC.
© 2013 Columbia Management Investment Advisers, LLC. All rights reserved.
ANN223_04_C01_(06/13)
Annual Report
April 30, 2013

Columbia South Carolina Intermediate Municipal Bond Fund
Not FDIC insured • No bank guarantee • May lose value
Columbia South Carolina Intermediate Municipal Bond Fund
 Dear Shareholders,
U.S. equities had a strong first quarter
Similar to 2012, equities once again were the best performing asset class in the first quarter of 2013. The S&P 500 Index reached an all-time closing high on the last trading day of the quarter and pushed through its October 2007 peak. Although global equities have performed well year-to-date, there is significant performance divergence among regions. In local currency terms, Japanese equities were the best performing developed market globally, and U.S. stocks outperformed most other global equity markets. European equities rose in the first quarter but trailed U.S. stocks and had a turbulent March, as investors were reminded of instability in the eurozone with news of a banking crisis in Cyprus.
Although all 10 sectors of the S&P 500 Index delivered positive returns, this was a rally led by defensive stocks such as those in health care, consumer staples and utilities. Materials and technology stocks were the weakest sectors.
High yield leads fixed income; most sectors flat to down
The fixed-income markets lagged equities with modest, single-digit returns coming from municipals and high-yield sectors in the United States. Most government and investment-grade credit sectors were roughly flat to down for the first quarter of 2013. Emerging market bonds were the biggest disappointment with single-digit losses.
Columbia Management to begin delivering summary prospectuses
Each Columbia fund is required to update its prospectus on an annual basis. Beginning with June 2013 prospectus updates, shareholders of Columbia retail mutual funds will start to receive a summary prospectus, rather than the full length (statutory) mutual fund prospectus they have received in the past.
Each fund's summary prospectus will include the following key information:
> Investment objective
> Fee and expense table
> Portfolio turnover rate information
> Principal investment strategies, principal risks and performance information
> Management information
> Purchase and sale information
> Tax information
> Financial intermediary compensation information
Each fund's statutory prospectus will contain additional information about the fund and its risks. Both the statutory and summary prospectus will be updated each year, and will be available at columbiamanagement.com. Shareholders may request a printed version of a statutory prospectus at no cost by calling 800.345.6611 or sending an email to serviceinquiries@columbiamanagement.com.
Stay on track with Columbia Management
Backed by more than 100 years of experience, Columbia Management is one of the nation's largest asset managers. At the heart of our success — and, most importantly, that of our investors — are highly talented industry professionals, brought together by a unique way of working. We are dedicated to helping you take advantage of today's opportunities and anticipate tomorrow's. We stay abreast of the latest investment trends and ideas, using our collective insight to evaluate events and transform them into solutions you can use.
Visit columbiamanagement.com for:
> The Columbia Management Perspectives blog, featuring timely posts by our investment teams
> Detailed up-to-date fund performance and portfolio information
> Economic analysis and market commentary
> Quarterly fund commentaries
> Columbia Management Investor, our award-winning quarterly newsletter for shareholders
Thank you for your continued support of the Columbia Funds. We look forward to serving your investment needs for many years to come.
Best Regards,

J. Kevin Connaughton
President, Columbia Funds
The S&P 500 Index, an unmanaged index, measures the performance of 500 large-capitalization U.S. stocks and is frequently used as a general measure of market performance. Indices are not available for investment, are not professionally managed and do not reflect sales charges, fees, brokerage commissions, taxes or other expenses of investing.
Investors should consider the investment objectives, risks, charges and expenses of a mutual fund carefully before investing. For a free prospectus, which contains this and other important information about a fund, visit columbiamanagement.com. The prospectus should be read carefully before investing.
Columbia Funds are distributed by Columbia Management Investment Distributors, Inc., member FINRA, and managed by Columbia Management Investment Advisers, LLC.
© 2013 Columbia Management Investment Advisers, LLC. All rights reserved.
Columbia South Carolina Intermediate Municipal Bond Fund
Performance Overview | | | 2 | | |
Manager Discussion of Fund Performance | | | 4 | | |
Understanding Your Fund's Expenses | | | 6 | | |
Portfolio of Investments | | | 7 | | |
Statement of Assets and Liabilities | | | 13 | | |
Statement of Operations | | | 15 | | |
Statement of Changes in Net Assets | | | 16 | | |
Financial Highlights | | | 18 | | |
Notes to Financial Statements | | | 23 | | |
Report of Independent Registered
Public Accounting Firm | | | 28 | | |
Federal Income Tax Information | | | 29 | | |
Trustees and Officers | | | 30 | | |
Approval of Investment Management Services Agreement | | | 35 | | |
Important Information About This Report | | | 41 | | |
Fund Investment Manager
Columbia Management Investment
Advisers, LLC
225 Franklin Street
Boston, MA 02110
Fund Distributor
Columbia Management Investment
Distributors, Inc.
225 Franklin Street
Boston, MA 02110
Fund Transfer Agent
Columbia Management Investment
Services Corp.
P.O. Box 8081
Boston, MA 02266-8081
For more information about any of the funds, please visit columbiamanagement.com or call 800.345.6611. Customer Service Representatives are available to answer your questions Monday through Friday from 8 a.m. to 8 p.m. Eastern time.
The views expressed in this report reflect the current views of the respective parties. These views are not guarantees of future performance and involve certain risks, uncertainties and assumptions that are difficult to predict, so actual outcomes and results may differ significantly from the views expressed. These views are subject to change at any time based upon economic, market or other conditions and the respective parties disclaim any responsibility to update such views. These views may not be relied on as investment advice and, because investment decisions for a Columbia Fund are based on numerous factors, may not be relied on as an indication of trading intent on behalf of any particular Columbia Fund. References to specific securities should not be construed as a recommendation or investment advice.
Annual Report 2013
Columbia South Carolina Intermediate Municipal Bond Fund
Performance Summary
> Columbia South Carolina Intermediate Municipal Bond Fund (the Fund) Class A shares returned 4.28% excluding sales charges for the 12-month period that ended April 30, 2013.
> The Fund's benchmark, the Barclays 3-15 Year Blend Municipal Bond Index, returned 4.35% for the same 12-month period.
> The Fund performed in line with the index, aided by its duration and quality positioning.
Average Annual Total Returns (%) (for period ended April 30, 2013)
| | Inception | | 1 Year | | 5 Years | | 10 Years | |
Class A | | 05/05/92 | | | | | | | |
Excluding sales charges | | | | | 4.28 | | | | 5.04 | | | | 3.99 | | |
Including sales charges | | | | | 0.90 | | | | 4.35 | | | | 3.64 | | |
Class B | | 06/08/93 | | | | | | | |
Excluding sales charges | | | | | 3.41 | | | | 4.25 | | | | 3.21 | | |
Including sales charges | | | | | 0.41 | | | | 4.25 | | | | 3.21 | | |
Class C | | 06/17/92 | | | | | | | |
Excluding sales charges | | | | | 3.41 | | | | 4.24 | | | | 3.21 | | |
Including sales charges | | | | | 2.41 | | | | 4.24 | | | | 3.21 | | |
Class R4* | | 03/19/13 | | | 4.44 | | | | 5.28 | | | | 4.24 | | |
Class Z | | 01/06/92 | | | 4.45 | | | | 5.28 | | | | 4.24 | | |
Barclays 3-15 Year Blend Municipal Bond Index | | | | | 4.35 | | | | 5.91 | | | | 4.85 | | |
Returns for Class A are shown with and without the maximum initial sales charge of 3.25%. Returns for Class B are shown with and without the applicable contingent deferred sales charge (CDSC) of 3.00% in the first year, declining to 1.00% in the fourth year and eliminated thereafter. Returns for Class C are shown with and without the 1.00% CDSC for the first year only. The Fund's other classes are not subject to sales charges and have limited eligibility. Please see the Fund's prospectus for details. Performance for different share classes will vary based on differences in sales charges and fees associated with each class. All results shown assume reinvestment of distributions during the period. Returns do not reflect the deduction of taxes that a shareholder may pay on Fund distributions or on the redemption of Fund shares. Performance results reflect the effect of any fee waivers or reimbursements of Fund expenses by Columbia Management Investment Advisers, LLC and/or any of its affiliates. Absent these fee waivers or expense reimbursement arrangements, performance results would have been lower.
The performance information shown represents past performance and is not a guarantee of future results. The investment return and principal value of your investment will fluctuate so that your shares, when redeemed, may be worth more or less than their original cost. Current performance may be lower or higher than the performance information shown. You may obtain performance information current to the most recent month-end by contacting your financial intermediary, visiting columbiamanagement.com or calling 800.345.6611.
*The returns shown for periods prior to the share class inception date (including returns for the Life of the Fund, if shown, which are since Fund inception) include the returns of the Fund's oldest share class. These returns are adjusted to reflect any higher class-related operating expenses of the newer share classes, as applicable. Please visit columbiamanagement.com/mutual-funds/appended-performance for more information.
The Barclays 3-15 Year Blend Municipal Bond Index is an unmanaged index that tracks the performance of municipal bonds issued after December 31, 1990, with remaining maturities between 2 and 17 years and at least $7 million in principal amount outstanding.
Indices are not available for investment, are not professionally managed and do not reflect sales charges, fees, brokerage commissions, taxes or other expenses of investing. Securities in the Fund may not match those in an index.
Annual Report 2013
2
Columbia South Carolina Intermediate Municipal Bond Fund
Performance Overview (continued)
Performance of a Hypothetical $10,000 Investment (May 1, 2003 – April 30, 2013)

The chart above shows the change in value of a hypothetical $10,000 investment in Class A shares of Columbia South Carolina Intermediate Municipal Bond Fund during the stated time period, and does not reflect the deduction of taxes that a shareholder may pay on Fund distributions or on the redemption of Fund shares.
Annual Report 2013
3
Columbia South Carolina Intermediate Municipal Bond Fund
Manager Discussion of Fund Performance
For the 12-month period that ended April 30, 2013, the Fund's Class A shares returned 4.28% excluding sales charge. The Fund's benchmark, the Barclays 3-15 Year Blend Municipal Bond Index, returned 4.35% for the same 12-month period. The Fund performed in line with the index, aided by its duration, a measure of interest rate sensitivity, and quality positioning.
U.S. Economy: Growth in the Slow Lane
Europe's general economic woes, a financial crisis in Cyprus and U.S. struggles to avoid a fiscal cliff of tax increases and various spending cuts (commonly referred to as the sequester) weighed on the global economy throughout the 12-month period ended April 30, 2013. Late in the period, the sequester clouded consumer confidence in the United States, even though it has had little material impact on the economy to date. However, a decrease in the U.S. unemployment rate early in 2013, steady manufacturing activity and a rebound in the housing market are encouraging signs that growth has broadened in recent months. Pent-up demand, low mortgage rates and an improving labor market have lifted home sales. Even so, there has been no real improvement in the overall pace of economic growth since the current cycle of recovery began in 2009. Household income growth is practically nonexistent, and household spending has come under pressure after the expiration of the payroll tax cut. Against this backdrop, U.S. investors bid prices higher on stocks and other volatile assets as central banks continued to pour liquidity into key markets.
Municipal Market Generates Solid Returns
The U.S. municipal bond market delivered modest, but solid, returns for the 12-month period. Yields fell across all maturities, rallying strongly after the November presidential election. The market sold off in December, but the retreat was short lived, as weaker economic numbers early in 2013 sent fixed-income investors back to the relative safety of the municipal market. At year end, municipal yields were eight, 18 and 25 basis points lower for five-, 10- and 15-year maturities compared to one year ago. Higher quality bonds generally underperformed lower quality bonds. Pre-refunded bonds, which are higher quality and generally shorter in maturity, were the weakest sector among municipals. A pre-refunded bond is created when an issuer refinances existing debt at a lower rate. The proceeds from the lower-yielding issue are invested in U.S. Treasury securities and used to repay the original bond at its original call date. Hospital bonds were generally the strongest performers. Local general obligation bonds outperformed state general obligation bonds by a small margin. For the second consecutive year, rating agencies issued more downgrades than upgrades in the overall municipal market, as a lackluster economy continued to pressure issuers.
Duration And Quality Positioning Aided Returns
The Fund's duration was longer than the index. As yields came down, the Fund's longer duration aided performance. An underweight in the three- to six-year range and an overweight in 10-year securities were positives for the Fund. In addition, the Fund was significantly underweight relative to the index in the two highest Standard & Poor's rating categories — AAA and AA1, which lagged lower-rated investment grade securities over the year. The Fund's electric revenue and hospital bonds were the top contributors to total returns. Electric revenue bonds accounted for more than 11% of the Fund's assets while hospitals were
Portfolio Management
Brian McGreevy
Quality Breakdown (%)
(at April 30, 2013) | |
AAA rating | | | 4.8 | | |
AA rating | | | 41.9 | | |
A rating | | | 43.4 | | |
BBB rating | | | 6.9 | | |
Not rated | | | 3.0 | | |
Total | | | 100.0 | | |
Percentages indicated are based upon total fixed income securities (excluding Money Market Funds).
Bond ratings apply to the underlying holdings of the Fund and not the Fund itself and are divided into categories ranging from AAA (highest) to D (lowest), and are subject to change. The ratings shown are determined by using the middle rating of Moody's, S&P, and Fitch after dropping the highest and lowest available ratings. When a rating from only two agencies is available, the lower rating is used. When a rating from only one agency is available, that rating is used. When a bond is not rated by any of these agencies, it is designated as Not rated. Credit ratings are subjective opinions and not statements of fact.
Annual Report 2013
4
Columbia South Carolina Intermediate Municipal Bond Fund
Manager Discussion of Fund Performance (continued)
more than 18%. Both sectors generated returns that were higher than their counterparts within the index — and outperformed the overall index return for the year.
Pre-refunded bonds were a slight drag on results, as were local general obligation bonds (GOs) and a very small position in Puerto Rico bonds, which we reduced over the period. The Fund's local GOs were shorter in maturity and higher in quality than their counterparts in the index. However, the Fund was underweight relative to the index in local GOs, which helped offset the negative impact on performance.
During the period, we added exposure to bonds with longer maturities, including bonds in the hospital, electric utilities and water and sewer sectors. The majority of purchases were rated A or low AA, which we felt added the best value at the time. Additionally, the Fund's exposure to very short maturities and bonds with shorter call dates was decreased. (A bond's call date is the date on which it can be redeemed before maturity.)
Broad-Based Job Gains Reinvigorate South Carolina's Economy
South Carolina's economic recovery has benefited from job gains, especially from tourism. Unemployment has fallen and the state's efforts to boost growth within high-tech companies have been rewarded by Google's announcement that it will invest in a new data center in the Charleston area. However, shrinking professional/business services payrolls and the proliferation of low-paying service jobs will likely limit income gains for the state. Manufacturing job growth has flattened, but the industry is becoming more technology oriented. Over the longer term, we believe lower business costs and unionization rates have the potential to continue to attract jobs and business, enabling South Carolina's economy to continue to recover — potentially providing a favorable environment for municipal bonds.
Looking Ahead
In this environment, we will expect to continue to emphasize the quality, sector and maturity profile of the Fund versus its benchmarks. We expect to seek out issues rated A and BBB across sectors that mature in 10-14 years, while maintaining a dollar-weighted average portfolio maturity of between three and 10 years, as we believe they are currently attractive. With a seasoned staff of credit professionals, we believe we are well positioned to discover value opportunities that offer incremental yield and appropriate fundamentals in South Carolina's municipal market.
Annual Report 2013
5
Columbia South Carolina Intermediate Municipal Bond Fund
Understanding Your Fund's Expenses
(Unaudited)
As an investor, you incur two types of costs. There are transaction costs, which generally include sales charges on purchases and may include redemption fees. There are also ongoing costs, which generally include management fees, distribution and service (Rule 12b-1) fees, and other fund expenses. The following information is intended to help you understand your ongoing costs (in dollars) of investing in the Fund and to help you compare these costs with the ongoing costs of investing in other mutual funds.
Analyzing Your Fund's Expenses
To illustrate these ongoing costs, we have provided examples and calculated the expenses paid by investors in each share class of the Fund during the period. The actual and hypothetical information in the table is based on an initial investment of $1,000 at the beginning of the period indicated and held for the entire period. Expense information is calculated two ways and each method provides you with different information. The amount listed in the "Actual" column is calculated using the Fund's actual operating expenses and total return for the period. You may use the Actual information, together with the amount invested, to estimate the expenses that you paid over the period. Simply divide your account value by $1,000 (for example, an $8,600 account value divided by $1,000 = 8.6), then multiply the results by the expenses paid during the period under the Actual column. The amount listed in the "Hypothetical" column assumes a 5% annual rate of return before expenses (which is not the Fund's actual return) and then applies the Fund's actual expense ratio for the period to the hypothetical return. You should not use the hypothetical account values and expenses to estimate either your actual account balance at the end of the period or the expenses you paid during the period. See "Compare With Other Funds" below for details on how to use the hypothetical data.
Compare With Other Funds
Since all mutual funds are required to include the same hypothetical calculations about expenses in shareholder reports, you can use this information to compare the ongoing cost of investing in the Fund with other funds. To do so, compare the hypothetical example with the 5% hypothetical examples that appear in the shareholder reports of other funds. As you compare hypothetical examples of other funds, it is important to note that hypothetical examples are meant to highlight the ongoing costs of investing in a fund only and do not reflect any transaction costs, such as sales charges, or redemption or exchange fees. Therefore, the hypothetical calculations are useful in comparing ongoing costs only, and will not help you determine the relative total costs of owning different funds. If transaction costs were included in these calculations, your costs would be higher.
November 1, 2012 – April 30, 2013
| | Account Value at the Beginning
of the Period ($) | | Account Value at the End of the
Period ($) | | Expenses Paid During the
Period ($) | | Fund's Annualized
Expense Ratio (%) | |
| | Actual | | Hypothetical | | Actual | | Hypothetical | | Actual | | Hypothetical | | Actual | |
Class A | | | 1,000.00 | | | | 1,000.00 | | | | 1,016.70 | | | | 1,020.78 | | | | 4.05 | | | | 4.06 | | | | 0.81 | | |
Class B | | | 1,000.00 | | | | 1,000.00 | | | | 1,012.00 | | | | 1,017.06 | | | | 7.78 | | | | 7.80 | | | | 1.56 | | |
Class C | | | 1,000.00 | | | | 1,000.00 | | | | 1,012.00 | | | | 1,017.06 | | | | 7.78 | | | | 7.80 | | | | 1.56 | | |
Class R4 | | | 1,000.00 | | | | 1,000.00 | | | | 1,010.90 | * | | | 1,022.17 | | | | 0.60 | * | | | 2.66 | | | | 0.53 | * | |
Class Z | | | 1,000.00 | | | | 1,000.00 | | | | 1,017.00 | | | | 1,022.02 | | | | 2.80 | | | | 2.81 | | | | 0.56 | | |
* For the period March 19, 2013 through April 30, 2013. Class R4 shares commenced operations on March 19, 2013.
Expenses paid during the period are equal to the annualized expense ratio for each class as indicated above, multiplied by the average account value over the period and then multiplied by the number of days in the Fund's most recent fiscal half year and divided by 365.
Expenses do not include fees and expenses incurred indirectly by the Fund from the underlying funds in which the Fund may invest (also referred to as "acquired funds"), including affiliated and non-affiliated pooled investment vehicles (including mutual funds and exchange-traded funds).
Had Columbia Management Investment Advisers, LLC and/or certain of its affiliates not waived/reimbursed certain fees and expenses, account value at the end of the period would have been reduced.
Annual Report 2013
6
Columbia South Carolina Intermediate Municipal Bond Fund
Portfolio of Investments
April 30, 2013
(Percentages represent value of investments compared to net assets)
Municipal Bonds 98.1%
Issue
Description | | Coupon
Rate | | Principal
Amount ($) | | Value ($) | |
Airport 1.7% | |
County of Horry
Revenue Bonds
Series 2010A
07/01/18 | | | 5.000 | % | | | 1,315,000 | | | | 1,522,520 | | |
07/01/20 | | | 5.000 | % | | | 1,150,000 | | | | 1,368,776 | | |
Total | | | | | | | 2,891,296 | | |
Forest Products 0.3% | |
County of Georgetown
Revenue Bonds
International Paper Co. Project
Series 1997A AMT(a)
10/01/21 | | | 5.700 | % | | | 500,000 | | | | 500,635 | | |
Higher Education 6.0% | |
College of Charleston
Refunding Revenue Bonds
Series 2012A
04/01/24 | | | 4.000 | % | | | 1,300,000 | | | | 1,472,523 | | |
04/01/26 | | | 4.000 | % | | | 1,390,000 | | | | 1,548,112 | | |
Florence-Darlington Commission for Technical Education
Revenue Bonds
Series 2005A (NPFGC)
03/01/18 | | | 5.000 | % | | | 1,725,000 | | | | 1,847,820 | | |
03/01/20 | | | 5.000 | % | | | 1,905,000 | | | | 2,040,636 | | |
University of South Carolina
Revenue Bonds
Moore School of Business Project
Series 2012
05/01/26 | | | 5.000 | % | | | 1,500,000 | | | | 1,809,150 | | |
Series 2008A (AGM)
06/01/21 | | | 5.000 | % | | | 1,060,000 | | | | 1,247,228 | | |
Total | | | | | | | 9,965,469 | | |
Hospital 17.7% | |
County of Charleston
Revenue Bonds
Care Alliance Health Services
Series 1999A (AGM)
08/15/15 | | | 5.125 | % | | | 4,000,000 | | | | 4,387,000 | | |
County of Greenwood
Refunding Revenue Bonds
Self Regional Healthcare
Series 2012B
10/01/27 | | | 5.000 | % | | | 1,750,000 | | | | 1,996,348 | | |
10/01/31 | | | 5.000 | % | | | 2,000,000 | | | | 2,284,040 | | |
Greenville Hospital System Board
Refunding Revenue Bonds
Series 2008A
05/01/21 | | | 5.250 | % | | | 2,750,000 | | | | 3,149,052 | | |
Series 2012
05/01/28 | | | 5.000 | % | | | 2,000,000 | | | | 2,308,420 | | |
Municipal Bonds (continued)
Issue
Description | | Coupon
Rate | | Principal
Amount ($) | | Value ($) | |
Lexington County Health Services District, Inc.
Refunding Revenue Bonds
Series 2007
11/01/17 | | | 5.000 | % | | | 1,230,000 | | | | 1,436,628 | | |
11/01/18 | | | 5.000 | % | | | 1,000,000 | | | | 1,168,870 | | |
South Carolina Jobs-Economic Development Authority
Refunding Revenue Bonds
Anmed Health Project
Series 2010
02/01/17 | | | 5.000 | % | | | 1,000,000 | | | | 1,137,660 | | |
Palmetto Health
Series 2005A (AGM)
08/01/21 | | | 5.250 | % | | | 3,000,000 | | | | 3,428,220 | | |
Revenue Bonds
Bon Secours Health System, Inc.
Series 2013
11/01/20 | | | 5.000 | % | | | 2,000,000 | | | | 2,435,760 | | |
Kershaw County Medical Center Project
Series 2008
09/15/25 | | | 5.500 | % | | | 1,925,000 | | | | 2,115,613 | | |
South Carolina Electric & Gas Co. Project
Series 2013
02/01/28 | | | 4.000 | % | | | 2,000,000 | | | | 2,141,720 | | |
Spartanburg County Regional Health Services District
Revenue Bonds
Series 2008A
04/15/19 | | | 5.000 | % | | | 1,225,000 | | | | 1,425,949 | | |
Total | | | | | | | 29,415,280 | | |
Investor Owned 1.3% | |
County of Oconee
Refunding Revenue Bonds
Duke Power Co. Project
Series 2009
02/01/17 | | | 3.600 | % | | | 2,000,000 | | | | 2,167,840 | | |
Joint Power Authority 6.5% | |
City of Easley
Refunding Revenue Bonds
Series 2011 (AGM)
12/01/28 | | | 5.000 | % | | | 1,000,000 | | | | 1,138,860 | | |
Piedmont Municipal Power Agency
Refunding Revenue Bonds
Series 2008A-3 (AGM)
01/01/17 | | | 5.000 | % | | | 2,000,000 | | | | 2,286,720 | | |
01/01/18 | | | 5.000 | % | | | 3,050,000 | | | | 3,577,772 | | |
South Carolina State Public Service Authority
Refunding Revenue Bonds
Series 2009A
01/01/28 | | | 5.000 | % | | | 2,000,000 | | | | 2,335,200 | | |
Revenue Bonds
Series 2009B
01/01/24 | | | 5.000 | % | | | 1,250,000 | | | | 1,474,988 | | |
Total | | | | | | | 10,813,540 | | |
The accompanying Notes to Financial Statements are an integral part of this statement.
Annual Report 2013
7
Columbia South Carolina Intermediate Municipal Bond Fund
Portfolio of Investments (continued)
April 30, 2013
Municipal Bonds (continued)
Issue
Description | | Coupon
Rate | | Principal
Amount ($) | | Value ($) | |
Local Appropriation 22.7% | |
Berkeley County School District
Revenue Bonds
Securing Assets for Education
Series 2006
12/01/20 | | | 5.000 | % | | | 1,000,000 | | | | 1,146,650 | | |
12/01/21 | | | 5.000 | % | | | 2,000,000 | | | | 2,289,480 | | |
12/01/22 | | | 5.000 | % | | | 3,545,000 | | | | 4,049,985 | | |
Charleston Educational Excellence Finance Corp.
Revenue Bonds
Charleston County School District Project
Series 2006
12/01/19 | | | 5.000 | % | | | 2,000,000 | | | | 2,294,820 | | |
Charleston Educational Excellence Finance Corp.(b)
Refunding Revenue Bonds
Charleston County Schools
Series 2013
12/01/27 | | | 5.000 | % | | | 2,000,000 | | | | 2,405,040 | | |
City of North Charleston
Revenue Bonds
Series 2012
06/01/29 | | | 5.000 | % | | | 2,280,000 | | | | 2,650,090 | | |
County of Charleston
Refunding Certificate of Participation
Charleston Public Facilities Corp.
Series 2005 (NPFGC)
06/01/17 | | | 5.125 | % | | | 1,470,000 | | | | 1,608,547 | | |
Fort Mill School Facilities Corp.
Revenue Bonds
Series 2006
12/01/17 | | | 5.000 | % | | | 2,900,000 | | | | 3,256,642 | | |
Greenville County School District
Refunding Revenue Bonds
Building Equity Sooner
Series 2012
12/01/22 | | | 5.000 | % | | | 2,000,000 | | | | 2,495,440 | | |
Building Equity Sooner Tomorrow
Series 2006
12/01/27 | | | 5.000 | % | | | 1,300,000 | | | | 1,454,427 | | |
Revenue Bonds
Building Equity Sooner Tomorrow
Series 2006 (AGM)
12/01/15 | | | 5.000 | % | | | 500,000 | | | | 557,165 | | |
Hilton Head Island Public Facilities Corp.
Certificate of Participation
Beach Preservation Fee Pledge
Series 2006 (NPFGC)
08/01/14 | | | 5.000 | % | | | 1,600,000 | | | | 1,692,320 | | |
Newberry Investing in Children's Education
Revenue Bonds
Newberry County School District Project
Series 2005
12/01/15 | | | 5.250 | % | | | 1,265,000 | | | | 1,394,663 | | |
Municipal Bonds (continued)
Issue
Description | | Coupon
Rate | | Principal
Amount ($) | | Value ($) | |
Scago Educational Facilities Corp. for Pickens School District
Revenue Bonds
Pickens County Project
Series 2006 (AGM)
12/01/23 | | | 5.000 | % | | | 5,000,000 | | | | 5,633,000 | | |
12/01/24 | | | 5.000 | % | | | 2,000,000 | | | | 2,247,200 | | |
Sumter Two School Facilities, Inc.
Refunding Revenue Bonds
Sumter County School District No. 2
Series 2007
12/01/17 | | | 5.000 | % | | | 1,000,000 | | | | 1,161,810 | | |
Town of Hilton Head Island
Revenue Bonds
Series 2011A
06/01/23 | | | 5.000 | % | | | 555,000 | | | | 668,020 | | |
06/01/24 | | | 5.000 | % | | | 580,000 | | | | 693,007 | | |
Total | | | | | | | 37,698,306 | | |
Local General Obligation 6.4% | |
Anderson County School District No. 4
Unlimited General Obligation Bonds
Series 2006 (AGM)
03/01/19 | | | 5.250 | % | | | 1,115,000 | | | | 1,255,378 | | |
County of Charleston
Unlimited General Obligation Bonds
Improvement
Series 2009A
08/01/23 | | | 5.000 | % | | | 2,000,000 | | | | 2,431,420 | | |
08/01/24 | | | 5.000 | % | | | 2,000,000 | | | | 2,415,440 | | |
Spartanburg County School District No. 7
Unlimited General Obligation Bonds
Series 2001
03/01/18 | | | 5.000 | % | | | 2,000,000 | | | | 2,307,440 | | |
03/01/21 | | | 5.000 | % | | | 1,940,000 | | | | 2,227,683 | | |
Total | | | | | | | 10,637,361 | | |
Municipal Power 2.0% | |
City of Rock Hill
Refunding Revenue Bonds
Combined Utility System
Series 2012A (AGM)
01/01/23 | | | 5.000 | % | | | 1,560,000 | | | | 1,908,520 | | |
Guam Power Authority
Refunding Revenue Bonds
Series 2012A (AGM)(c)
10/01/24 | | | 5.000 | % | | | 315,000 | | | | 380,205 | | |
Town of Winnsboro Combined Utility System
Refunding Revenue Bonds
Series 1999 (NPFGC)
08/15/13 | | | 5.250 | % | | | 1,020,000 | | | | 1,033,780 | | |
Total | | | | | | | 3,322,505 | | |
The accompanying Notes to Financial Statements are an integral part of this statement.
Annual Report 2013
8
Columbia South Carolina Intermediate Municipal Bond Fund
Portfolio of Investments (continued)
April 30, 2013
Municipal Bonds (continued)
Issue
Description | | Coupon
Rate | | Principal
Amount ($) | | Value ($) | |
Ports 1.1% | |
South Carolina State Ports Authority
Revenue Bonds
Series 2010
07/01/16 | | | 5.000 | % | | | 500,000 | | | | 565,000 | | |
07/01/23 | | | 5.250 | % | | | 1,000,000 | | | | 1,193,210 | | |
Total | | | | | | | 1,758,210 | | |
Refunded/Escrowed 4.5% | |
City of Columbia
Prerefunded 02/01/15 Revenue Bonds
Waterworks & Sewer System
Series 2005 (AGM)
02/01/23 | | | 5.000 | % | | | 1,000,000 | | | | 1,080,720 | | |
02/01/27 | | | 5.000 | % | | | 1,500,000 | | | | 1,621,080 | | |
Greenville County School District
Prerefunded 12/01/13 Revenue Bonds
Building Equity Sooner Tomorrow
Series 2003
12/01/16 | | | 5.250 | % | | | 1,500,000 | | | | 1,544,100 | | |
Puerto Rico Highway & Transportation Authority
Refunding Revenue Bonds
Series 2003AA Escrowed to Maturity (NPFGC)(c)
07/01/18 | | | 5.500 | % | | | 1,050,000 | | | | 1,302,735 | | |
Town of Lexington Waterworks & Sewer System
Prerefunded 10/01/14 Revenue Bonds
Series 1997
04/01/19 | | | 5.450 | % | | | 1,825,000 | | | | 1,919,699 | | |
Total | | | | | | | 7,468,334 | | |
Resource Recovery 1.4% | |
Three Rivers Solid Waste Authority(d)
Revenue Bonds
Capital Appreciation-Landfill Gas Project
Series 2007
10/01/24 | | | 0.000 | % | | | 1,835,000 | | | | 1,231,579 | | |
10/01/25 | | | 0.000 | % | | | 1,835,000 | | | | 1,171,317 | | |
Total | | | | | | | 2,402,896 | | |
Retirement Communities 2.5% | |
South Carolina Jobs-Economic Development Authority
Refunding Revenue Bonds
1st Mortgage-Episcopal Church
Series 2007
04/01/15 | | | 5.000 | % | | | 525,000 | | | | 554,458 | | |
04/01/16 | | | 5.000 | % | | | 600,000 | | | | 649,632 | | |
1st Mortgage-Lutheran Homes
Series 2007
05/01/16 | | | 5.000 | % | | | 1,245,000 | | | | 1,309,043 | | |
05/01/21 | | | 5.375 | % | | | 1,650,000 | | | | 1,736,889 | | |
Total | | | | | | | 4,250,022 | | |
Municipal Bonds (continued)
Issue
Description | | Coupon
Rate | | Principal
Amount ($) | | Value ($) | |
Single Family 0.5% | |
South Carolina State Housing Finance & Development Authority
Revenue Bonds
Series 2010-1 (GNMA/FNMA/FHLMC)
01/01/28 | | | 5.000 | % | | | 755,000 | | | | 820,451 | | |
Special Non Property Tax 3.2% | |
City of Greenville
Improvement Refunding Bonds
Series 2011 (AGM)
04/01/21 | | | 5.000 | % | | | 1,290,000 | | | | 1,571,633 | | |
Puerto Rico Infrastructure Financing Authority
Refunding Revenue Bonds
Series 2005C (FGIC)(c)
07/01/20 | | | 5.500 | % | | | 1,200,000 | | | | 1,281,492 | | |
Territory of Guam
Revenue Bonds
Series 2011A(c)
01/01/31 | | | 5.000 | % | | | 400,000 | | | | 448,644 | | |
Virgin Islands Public Finance Authority(c)
Refunding Revenue Bonds
Gross Receipts Taxes
Series 2012A
10/01/22 | | | 4.000 | % | | | 800,000 | | | | 860,896 | | |
Revenue Bonds
Senior Lien-Matching Fund Loan Note
Series 2010A
10/01/25 | | | 5.000 | % | | | 1,060,000 | | | | 1,205,336 | | |
Total | | | | | | | 5,368,001 | | |
State General Obligation 1.3% | |
State of South Carolina
Unlimited General Obligation Bonds
State Economic Development
Series 2010B
04/01/23 | | | 5.000 | % | | | 1,775,000 | | | | 2,172,724 | | |
Student Loan 1.5% | |
South Carolina State Education Assistance Authority
Revenue Bonds
Student Loan
Series 2009I
10/01/24 | | | 5.000 | % | | | 2,210,000 | | | | 2,438,116 | | |
Transportation 3.7% | |
South Carolina Transportation Infrastructure Bank
Refunding Revenue Bonds
Series 2005A (AMBAC)
10/01/20 | | | 5.250 | % | | | 4,880,000 | | | | 6,099,073 | | |
The accompanying Notes to Financial Statements are an integral part of this statement.
Annual Report 2013
9
Columbia South Carolina Intermediate Municipal Bond Fund
Portfolio of Investments (continued)
April 30, 2013
Municipal Bonds (continued)
Issue
Description | | Coupon
Rate | | Principal
Amount ($) | | Value ($) | |
Water & Sewer 13.8% | |
Anderson Regional Joint Water System
Refunding Revenue Bonds
Series 2012
07/15/28 | | | 5.000 | % | | | 2,000,000 | | | | 2,392,560 | | |
Beaufort-Jasper Water & Sewer Authority
Improvement Refunding Revenue Bonds
Series 2006 (AGM)
03/01/23 | | | 5.000 | % | | | 1,500,000 | | | | 1,736,835 | | |
03/01/25 | | | 4.750 | % | | | 3,000,000 | | | | 3,424,800 | | |
City of Charleston
Refunding Revenue Bonds
Waterworks & Sewer System
Series 2009A
01/01/21 | | | 5.000 | % | | | 2,500,000 | | | | 2,997,900 | | |
City of Columbia
Refunding Revenue Bonds
Waterworks & Sewer System
Series 2011A
02/01/27 | | | 5.000 | % | | | 2,435,000 | | | | 2,901,059 | | |
Series 2012
02/01/23 | | | 4.000 | % | | | 1,360,000 | | | | 1,586,073 | | |
County of Berkeley Water & Sewer
Refunding Revenue Bonds
Series 2008A (AGM)
06/01/21 | | | 5.000 | % | | | 1,000,000 | | | | 1,182,560 | | |
Renewable Water Resources
Refunding Revenue Bonds
Series 2012
01/01/25 | | | 5.000 | % | | | 1,940,000 | | | | 2,358,012 | | |
Municipal Bonds (continued)
Issue
Description | | Coupon
Rate | | Principal
Amount ($) | | Value ($) | |
Series 2005B (AGM)
03/01/19 | | | 5.250 | % | | | 1,000,000 | | | | 1,231,230 | | |
Series 2010A
01/01/20 | | | 5.000 | % | | | 1,500,000 | | | | 1,840,530 | | |
Series 2012
01/01/24 | | | 5.000 | % | | | 1,000,000 | | | | 1,227,840 | | |
Total | | | | | | | 22,879,399 | | |
Total Municipal Bonds
(Cost: $149,206,769) | | | | | | | 163,069,458 | | |
Money Market Funds 2.4%
| | | Shares | | Value ($) | |
JPMorgan Tax-Free Money Market Fund,
0.000%(e) | | | 3,969,087 | | | | 3,969,087 | | |
Total Money Market Funds
(Cost: $3,969,087) | | | | | 3,969,087 | | |
Total Investments
(Cost: $153,175,856) | | | | | 167,038,545 | | |
Other Assets & Liabilities, Net | | | | | (907,784 | ) | |
Net Assets | | | | | 166,130,761 | | |
Notes to Portfolio of Investments
(a) Income from this security may be subject to alternative minimum tax.
(b) Represents a security purchased on a when-issued or delayed delivery basis.
(c) Municipal obligations include debt obligations issued by or on behalf of territories, possessions, or sovereign nations within the territorial boundaries of the United States. At April 30, 2013, the value of these securities amounted to $5,479,308 or 3.30% of net assets.
(d) Zero coupon bond.
(e) The rate shown is the seven-day current annualized yield at April 30, 2013.
Abbreviation Legend
AGM Assured Guaranty Municipal Corporation
AMBAC Ambac Assurance Corporation
AMT Alternative Minimum Tax
FGIC Financial Guaranty Insurance Company
FHLMC Federal Home Loan Mortgage Corporation
FNMA Federal National Mortgage Association
GNMA Government National Mortgage Association
NPFGC National Public Finance Guarantee Corporation
The accompanying Notes to Financial Statements are an integral part of this statement.
Annual Report 2013
10
Columbia South Carolina Intermediate Municipal Bond Fund
Portfolio of Investments (continued)
April 30, 2013
Fair Value Measurements
Generally accepted accounting principles (GAAP) require disclosure regarding the inputs and valuation techniques used to measure fair value and any changes in valuation inputs or techniques. In addition, investments shall be disclosed by major category.
The Fund categorizes its fair value measurements according to a three-level hierarchy that maximizes the use of observable inputs and minimizes the use of unobservable inputs by prioritizing that the most observable input be used when available. Observable inputs are those that market participants would use in pricing an investment based on market data obtained from sources independent of the reporting entity. Unobservable inputs are those that reflect the Fund's assumptions about the information market participants would use in pricing an investment. An investment's level within the fair value hierarchy is based on the lowest level of any input that is deemed significant to the asset or liability's fair value measurement. The input levels are not necessarily an indication of the risk or liquidity associated with investments at that level. For example, certain U.S. government securities are generally high quality and liquid, however, they are reflected as Level 2 because the inputs used to determine fair value may not always be quoted prices in an active market.
Fair value inputs are summarized in the three broad levels listed below:
> Level 1 — Valuations based on quoted prices for investments in active markets that the Fund has the ability to access at the measurement date (including NAV for open-end mutual funds). Valuation adjustments are not applied to Level 1 investments.
> Level 2 — Valuations based on other significant observable inputs (including quoted prices for similar securities, interest rates, prepayment speeds, credit risks, etc.).
> Level 3 — Valuations based on significant unobservable inputs (including the Fund's own assumptions and judgment in determining the fair value of investments).
Inputs that are used in determining fair value of an investment may include price information, credit data, volatility statistics, and other factors. These inputs can be either observable or unobservable. The availability of observable inputs can vary between investments, and is affected by various factors such as the type of investment, and the volume and level of activity for that investment or similar investments in the marketplace. The inputs will be considered by the Investment Manager, along with any other relevant factors in the calculation of an investment's fair value. The Fund uses prices and inputs that are current as of the measurement date, which may include periods of market dislocations. During these periods, the availability of prices and inputs may be reduced for many investments. This condition could cause an investment to be reclassified between the various levels within the hierarchy.
Investments falling into the Level 3 category are primarily supported by quoted prices from brokers and dealers participating in the market for those investments. However, these may be classified as Level 3 investments due to lack of market transparency and corroboration to support these quoted prices. Additionally, valuation models may be used as the pricing source for any remaining investments classified as Level 3. These models may rely on one or more significant unobservable inputs and/or significant assumptions by the Investment Manager. Inputs used in valuations may include, but are not limited to, financial statement analysis, capital account balances, discount rates and estimated cash flows, and comparable company data.
Under the direction of the Fund's Board of Trustees (the Board), the Investment Manager's Valuation Committee (the Committee) is responsible for carrying out the valuation procedures approved by the Board. The Committee consists of voting and non-voting members from various groups within the Investment Manager's organization, including operations and accounting, trading and investments, compliance, risk management and legal.
The Committee meets at least monthly to review and approve valuation matters, which may include a description of specific valuation determinations, data regarding pricing information received from approved pricing vendors and brokers and the results of Board-approved valuation control policies and procedures (the Policies). The Policies address, among other things, instances when market quotations are readily available, including recommendations of third party pricing vendors and a determination of appropriate pricing methodologies; events that require specific valuation determinations and assessment of fair value techniques; securities with a potential for stale pricing, including those that are illiquid, restricted, or in default; and the effectiveness of third-party pricing vendors, including periodic reviews of vendors. The Committee meets more frequently, as needed, to discuss additional valuation matters, which may include the need to review back-testing results, review time-sensitive information or approve related valuation actions. The Committee reports to the Board, with members of the Committee meeting with the Board at each of its regularly scheduled meetings to discuss valuation matters and actions during the period, similar to those described earlier.
For investments categorized as Level 3, the Committee monitors information similar to that described above, which may include: (i) data specific to the issuer or comparable issuers, (ii) general market or specific sector news and (iii) quoted prices and specific or similar security transactions. The Committee considers this data and any changes from prior periods in order to assess the reasonableness of observable and unobservable inputs, any assumptions or internal models used to value those securities and changes in fair value. This data is also used to corroborate, when available, information received from approved pricing vendors and brokers. Various factors impact the frequency of monitoring this information (which may occur as often as daily). However, the Committee may determine that changes to inputs, assumptions and models are not required as a result of the monitoring procedures performed.
The accompanying Notes to Financial Statements are an integral part of this statement.
Annual Report 2013
11
Columbia South Carolina Intermediate Municipal Bond Fund
Portfolio of Investments (continued)
April 30, 2013
Fair Value Measurements (continued)
The following table is a summary of the inputs used to value the Fund's investments at April 30, 2013:
Description | | Level 1
Quoted Prices in Active
Markets for Identical
Assets ($) | |
Level 2
Other Significant
Observable Inputs ($) | |
Level 3
Significant
Unobservable Inputs ($) | |
Total ($) | |
Bonds | |
Municipal Bonds | | | — | | | | 163,069,458 | | | | — | | | | 163,069,458 | | |
Total Bonds | | | — | | | | 163,069,458 | | | | — | | | | 163,069,458 | | |
Other | |
Money Market Funds | | | 3,969,087 | | | | — | | | | — | | | | 3,969,087 | | |
Total Other | | | 3,969,087 | | | | — | | | | — | | | | 3,969,087 | | |
Total | | | 3,969,087 | | | | 163,069,458 | | | | — | | | | 167,038,545 | | |
See the Portfolio of Investments for all investment classifications not indicated in the table.
The Fund's assets assigned to the Level 2 input category are generally valued using the market approach, in which a security's value is determined through reference to prices and information from market transactions for similar or identical assets.
There were no transfers of financial assets between Levels 1 and 2 during the period.
The accompanying Notes to Financial Statements are an integral part of this statement.
Annual Report 2013
12
Columbia South Carolina Intermediate Municipal Bond Fund
Statement of Assets and Liabilities
April 30, 2013
Assets | |
Investments, at value | |
(identified cost $153,175,856) | | $ | 167,038,545 | | |
Receivable for: | |
Capital shares sold | | | 297,004 | | |
Interest | | | 1,982,258 | | |
Expense reimbursement due from Investment Manager | | | 506 | | |
Prepaid expenses | | | 766 | | |
Total assets | | | 169,319,079 | | |
Liabilities | |
Payable for: | |
Investments purchased on a delayed delivery basis | | | 2,365,700 | | |
Capital shares purchased | | | 262,227 | | |
Dividend distributions to shareholders | | | 403,493 | | |
Investment management fees | | | 1,819 | | |
Distribution and/or service fees | | | 622 | | |
Transfer agent fees | | | 29,287 | | |
Administration fees | | | 318 | | |
Compensation of board members | | | 91,383 | | |
Other expenses | | | 33,469 | | |
Total liabilities | | | 3,188,318 | | |
Net assets applicable to outstanding capital stock | | $ | 166,130,761 | | |
Represented by | |
Paid-in capital | | $ | 151,110,582 | | |
Undistributed net investment income | | | 1,101,330 | | |
Accumulated net realized gain | | | 56,160 | | |
Unrealized appreciation (depreciation) on: | |
Investments | | | 13,862,689 | | |
Total — representing net assets applicable to outstanding capital stock | | $ | 166,130,761 | | |
The accompanying Notes to Financial Statements are an integral part of this statement.
Annual Report 2013
13
Columbia South Carolina Intermediate Municipal Bond Fund
Statement of Assets and Liabilities (continued)
April 30, 2013
Class A | |
Net assets | | $ | 27,742,559 | | |
Shares outstanding | | | 2,548,496 | | |
Net asset value per share | | $ | 10.89 | | |
Maximum offering price per share(a) | | $ | 11.26 | | |
Class B | |
Net assets | | $ | 112,865 | | |
Shares outstanding | | | 10,362 | | |
Net asset value per share | | $ | 10.89 | | |
Class C | |
Net assets | | $ | 15,694,339 | | |
Shares outstanding | | | 1,440,800 | | |
Net asset value per share | | $ | 10.89 | | |
Class R4 | |
Net assets | | $ | 2,525 | | |
Shares outstanding | | | 232 | | |
Net asset value per share | | $ | 10.88 | | |
Class Z | |
Net assets | | $ | 122,578,473 | | |
Shares outstanding | | | 11,254,681 | | |
Net asset value per share | | $ | 10.89 | | |
(a) The maximum offering price per share is calculated by dividing the net asset value by 1.0 minus the maximum sales charge of 3.25%.
The accompanying Notes to Financial Statements are an integral part of this statement.
Annual Report 2013
14
Columbia South Carolina Intermediate Municipal Bond Fund
Statement of Operations
Year Ended April 30, 2013
Net investment income | |
Income: | |
Dividends | | $ | 773 | | |
Interest | | | 6,092,647 | | |
Total income | | | 6,093,420 | | |
Expenses: | |
Investment management fees | | | 673,220 | | |
Distribution and/or service fees | |
Class A | | | 65,580 | | |
Class B | | | 1,309 | | |
Class C | | | 148,035 | | |
Transfer agent fees | |
Class A | | | 50,265 | | |
Class B | | | 251 | | |
Class C | | | 28,384 | | |
Class Z | | | 243,668 | | |
Administration fees | | | 117,813 | | |
Compensation of board members | | | 24,034 | | |
Custodian fees | | | 2,510 | | |
Printing and postage fees | | | 41,162 | | |
Registration fees | | | 922 | | |
Professional fees | | | 28,166 | | |
Other | | | 9,159 | | |
Total expenses | | | 1,434,478 | | |
Fees waived or expenses reimbursed by Investment Manager and its affiliates | | | (283,518 | ) | |
Expense reductions | | | (20 | ) | |
Total net expenses | | | 1,150,940 | | |
Net investment income | | | 4,942,480 | | |
Realized and unrealized gain (loss) — net | |
Net realized gain (loss) on: | |
Investments | | | 812,308 | | |
Net realized gain | | | 812,308 | | |
Net change in unrealized appreciation (depreciation) on: | |
Investments | | | 1,393,274 | | |
Net change in unrealized appreciation (depreciation) | | | 1,393,274 | | |
Net realized and unrealized gain | | | 2,205,582 | | |
Net increase in net assets resulting from operations | | $ | 7,148,062 | | |
The accompanying Notes to Financial Statements are an integral part of this statement.
Annual Report 2013
15
Columbia South Carolina Intermediate Municipal Bond Fund
Statement of Changes in Net Assets
| | | Year Ended
April 30,
2013(a) | | Year Ended
April 30,
2012(b) | | Year Ended
March 31,
2012 | |
Operations | |
Net investment income | | $ | 4,942,480 | | | $ | 447,527 | | | $ | 5,266,305 | | |
Net realized gain | | | 812,308 | | | | — | | | | 109,317 | | |
Net change in unrealized appreciation (depreciation) | | | 1,393,274 | | | | 1,524,322 | | | | 8,441,009 | | |
Net increase in net assets resulting from operations | | | 7,148,062 | | | | 1,971,849 | | | | 13,816,631 | | |
Distributions to shareholders | |
Net investment income | |
Class A | | | (737,871 | ) | | | (59,883 | ) | | | (672,366 | ) | |
Class B | | | (2,718 | ) | | | (278 | ) | | | (4,556 | ) | |
Class C | | | (305,366 | ) | | | (24,319 | ) | | | (286,015 | ) | |
Class R4 | | | (9 | ) | | | — | | | | — | | |
Class Z | | | (3,896,516 | ) | | | (348,810 | ) | | | (4,335,919 | ) | |
Total distributions to shareholders | | | (4,942,480 | ) | | | (433,290 | ) | | | (5,298,856 | ) | |
Increase (decrease) in net assets from capital stock activity | | | (10,205,179 | ) | | | 2,934,218 | | | | 5,247,959 | | |
Total increase (decrease) in net assets | | | (7,999,597 | ) | | | 4,472,777 | | | | 13,765,734 | | |
Net assets at beginning of year | | | 174,130,358 | | | | 169,657,581 | | | | 155,891,847 | | |
Net assets at end of year | | $ | 166,130,761 | | | $ | 174,130,358 | | | $ | 169,657,581 | | |
Undistributed net investment income | | $ | 1,101,330 | | | $ | 1,101,374 | | | $ | 1,087,137 | | |
(a) Class R4 shares are for the period from March 19, 2013 (commencement of operations) to April 30, 2013.
(b) For the period from April 1, 2012 to April 30, 2012. During the period, the Fund's fiscal year end was changed from March 31 to April 30.
The accompanying Notes to Financial Statements are an integral part of this statement.
Annual Report 2013
16
Columbia South Carolina Intermediate Municipal Bond Fund
Statement of Changes in Net Assets (continued)
| | | Year Ended April 30,
2013(a) | | Year Ended April 30,
2012(b) | | Year Ended March 31,
2012 | |
| | | Shares | | Dollars ($) | | Shares | | Dollars ($) | | Shares | | Dollars ($) | |
Capital stock activity | |
Class A shares | |
Subscriptions(c) | | | 786,533 | | | | 8,520,729 | | | | 57,198 | | | | 611,384 | | | | 705,043 | | | | 7,433,042 | | |
Distributions reinvested | | | 46,687 | | | | 506,413 | | | | 3,359 | | | | 36,073 | | | | 33,351 | | | | 351,090 | | |
Redemptions | | | (585,105 | ) | | | (6,335,753 | ) | | | (85,211 | ) | | | (912,345 | ) | | | (250,572 | ) | | | (2,639,648 | ) | |
Net increase (decrease) | | | 248,115 | | | | 2,691,389 | | | | (24,654 | ) | | | (264,888 | ) | | | 487,822 | | | | 5,144,484 | | |
Class B shares | |
Subscriptions | | | 1 | | | | 6 | | | | — | | | | — | | | | 38 | | | | 400 | | |
Distributions reinvested | | | 227 | | | | 2,458 | | | | 24 | | | | 255 | | | | 342 | | | | 3,588 | | |
Redemptions(c) | | | (4,307 | ) | | | (46,718 | ) | | | (13 | ) | | | (133 | ) | | | (10,371 | ) | | | (107,905 | ) | |
Net increase (decrease) | | | (4,079 | ) | | | (44,254 | ) | | | 11 | | | | 122 | | | | (9,991 | ) | | | (103,917 | ) | |
Class C shares | |
Subscriptions | | | 358,502 | | | | 3,890,750 | | | | 78,311 | | | | 839,222 | | | | 452,974 | | | | 4,754,965 | | |
Distributions reinvested | | | 16,204 | | | | 175,855 | | | | 1,258 | | | | 13,519 | | | | 13,353 | | | | 140,594 | | |
Redemptions | | | (240,470 | ) | | | (2,610,818 | ) | | | (2,279 | ) | | | (24,431 | ) | | | (231,851 | ) | | | (2,440,406 | ) | |
Net increase | | | 134,236 | | | | 1,455,787 | | | | 77,290 | | | | 828,310 | | | | 234,476 | | | | 2,455,153 | | |
Class R4 shares | |
Subscriptions | | | 231 | | | | 2,500 | | | | — | | | | — | | | | — | | | | — | | |
Distributions reinvested | | | 1 | | | | 6 | | | | — | | | | — | | | | — | | | | — | | |
Net increase | | | 232 | | | | 2,506 | | | | — | | | | — | | | | — | | | | — | | |
Class Z shares | |
Subscriptions | | | 3,873,321 | | | | 41,933,570 | | | | 259,079 | | | | 2,778,174 | | | | 2,593,620 | | | | 27,444,929 | | |
Distributions reinvested | | | 40,129 | | | | 435,394 | | | | 2,912 | | | | 31,303 | | | | 34,037 | | | | 357,402 | | |
Redemptions | | | (5,243,476 | ) | | | (56,679,571 | ) | | | (40,910 | ) | | | (438,803 | ) | | | (2,872,432 | ) | | | (30,050,092 | ) | |
Net increase (decrease) | | | (1,330,026 | ) | | | (14,310,607 | ) | | | 221,081 | | | | 2,370,674 | | | | (244,775 | ) | | | (2,247,761 | ) | |
Total net increase (decrease) | | | (951,522 | ) | | | (10,205,179 | ) | | | 273,728 | | | | 2,934,218 | | | | 467,532 | | | | 5,247,959 | | |
(a) Class R4 shares are for the period from March 19, 2013 (commencement of operations) to April 30, 2013.
(b) For the period from April 1, 2012 to April 30, 2012. During the period, the Fund's fiscal year end was changed from March 31 to April 30.
(c) Includes conversions of Class B shares to Class A shares, if any.
The accompanying Notes to Financial Statements are an integral part of this statement.
Annual Report 2013
17
Columbia South Carolina Intermediate Municipal Bond Fund
The following tables are intended to help you understand the Fund's financial performance. Certain information reflects financial results for a single share of a class held for the periods shown. Per share net investment income (loss) amounts are calculated based on average shares outstanding during the period. Total return assumes reinvestment of all dividends and distributions, if any. Total return does not reflect payment of sales charges, if any, and is not annualized for periods of less than one year.
| | | Year Ended April 30, | | Year Ended March 31, | |
Class A | | 2013 | | 2012(a) | | 2012 | | 2011 | | 2010 | | 2009 | |
Per share data | |
Net asset value, beginning of period | | $ | 10.74 | | | $ | 10.64 | | | $ | 10.08 | | | $ | 10.17 | | | $ | 9.84 | | | $ | 10.01 | | |
Income from investment operations: | |
Net investment income | | | 0.30 | | | | 0.03 | | | | 0.33 | | | | 0.35 | | | | 0.34 | | | | 0.37 | | |
Net realized and unrealized gain (loss) | | | 0.15 | | | | 0.10 | | | | 0.56 | | | | (0.09 | ) | | | 0.33 | | | | (0.17 | ) | |
Total from investment operations | | | 0.45 | | | | 0.13 | | | | 0.89 | | | | 0.26 | | | | 0.67 | | | | 0.20 | | |
Less distributions to shareholders: | |
Net investment income | | | (0.30 | ) | | | (0.03 | ) | | | (0.33 | ) | | | (0.35 | ) | | | (0.34 | ) | | | (0.37 | ) | |
Total distributions to shareholders | | | (0.30 | ) | | | (0.03 | ) | | | (0.33 | ) | | | (0.35 | ) | | | (0.34 | ) | | | (0.37 | ) | |
Net asset value, end of period | | $ | 10.89 | | | $ | 10.74 | | | $ | 10.64 | | | $ | 10.08 | | | $ | 10.17 | | | $ | 9.84 | | |
Total return | | | 4.28 | % | | | 1.18 | % | | | 8.97 | % | | | 2.54 | % | | | 6.91 | % | | | 2.09 | % | |
Ratios to average net assets(b) | |
Total gross expenses | | | 0.97 | % | | | 0.99 | %(c) | | | 1.04 | % | | | 0.95 | % | | | 0.91 | % | | | 0.88 | % | |
Total net expenses(d) | | | 0.81 | %(e) | | | 0.79 | %(c) | | | 0.79 | %(e) | | | 0.80 | %(e) | | | 0.78 | %(e) | | | 0.75 | %(e) | |
Net investment income | | | 2.81 | % | | | 2.95 | %(c) | | | 3.16 | % | | | 3.41 | % | | | 3.39 | % | | | 3.76 | % | |
Supplemental data | |
Net assets, end of period (in thousands) | | $ | 27,743 | | | $ | 24,707 | | | $ | 24,748 | | | $ | 18,513 | | | $ | 24,126 | | | $ | 23,865 | | |
Portfolio turnover | | | 14 | % | | | 0 | % | | | 9 | % | | | 15 | % | | | 16 | % | | | 21 | % | |
Notes to Financial Highlights
(a) For the period from April 1, 2012 to April 30, 2012. During the period, the Fund's fiscal year end was changed from March 31 to April 30.
(b) In addition to the fees and expenses which the Fund bears directly, the Fund indirectly bears a pro rata share of the fees and expenses of the acquired funds in which it invests. Such indirect expenses are not included in the reported expense ratios.
(c) Annualized.
(d) Total net expenses include the impact of certain waivers/reimbursements made by the Investment Manager and certain of its affiliates, if applicable.
(e) The benefits derived from expense reductions had an impact of less than 0.01%.
The accompanying Notes to Financial Statements are an integral part of this statement.
Annual Report 2013
18
Columbia South Carolina Intermediate Municipal Bond Fund
Financial Highlights (continued)
| | | Year Ended April 30, | | Year Ended March 31, | |
Class B | | 2013 | | 2012(a) | | 2012 | | 2011 | | 2010 | | 2009 | |
Per share data | |
Net asset value, beginning of period | | $ | 10.75 | | | $ | 10.65 | | | $ | 10.08 | | | $ | 10.18 | | | $ | 9.85 | | | $ | 10.01 | | |
Income from investment operations: | |
Net investment income | | | 0.22 | | | | 0.02 | | | | 0.25 | | | | 0.27 | | | | 0.27 | | | | 0.30 | | |
Net realized and unrealized gain (loss) | | | 0.14 | | | | 0.10 | | | | 0.58 | | | | (0.09 | ) | | | 0.33 | | | | (0.16 | ) | |
Total from investment operations | | | 0.36 | | | | 0.12 | | | | 0.83 | | | | 0.18 | | | | 0.60 | | | | 0.14 | | |
Less distributions to shareholders: | |
Net investment income | | | (0.22 | ) | | | (0.02 | ) | | | (0.26 | ) | | | (0.28 | ) | | | (0.27 | ) | | | (0.30 | ) | |
Total distributions to shareholders | | | (0.22 | ) | | | (0.02 | ) | | | (0.26 | ) | | | (0.28 | ) | | | (0.27 | ) | | | (0.30 | ) | |
Net asset value, end of period | | $ | 10.89 | | | $ | 10.75 | | | $ | 10.65 | | | $ | 10.08 | | | $ | 10.18 | | | $ | 9.85 | | |
Total return | | | 3.41 | % | | | 1.12 | % | | | 8.25 | % | | | 1.70 | % | | | 6.12 | % | | | 1.43 | % | |
Ratios to average net assets(b) | |
Total gross expenses | | | 1.72 | % | | | 1.74 | %(c) | | | 1.84 | % | | | 1.70 | % | | | 1.66 | % | | | 1.63 | % | |
Total net expenses(d) | | | 1.55 | %(e) | | | 1.54 | %(c) | | | 1.54 | %(e) | | | 1.55 | %(e) | | | 1.53 | %(e) | | | 1.50 | %(e) | |
Net investment income | | | 2.07 | % | | | 2.20 | %(c) | | | 2.43 | % | | | 2.65 | % | | | 2.64 | % | | | 3.03 | % | |
Supplemental data | |
Net assets, end of period (in thousands) | | $ | 113 | | | $ | 155 | | | $ | 154 | | | $ | 246 | | | $ | 1,175 | | | $ | 1,978 | | |
Portfolio turnover | | | 14 | % | | | 0 | % | | | 9 | % | | | 15 | % | | | 16 | % | | | 21 | % | |
Notes to Financial Highlights
(a) For the period from April 1, 2012 to April 30, 2012. During the period, the Fund's fiscal year end was changed from March 31 to April 30.
(b) In addition to the fees and expenses which the Fund bears directly, the Fund indirectly bears a pro rata share of the fees and expenses of the acquired funds in which it invests. Such indirect expenses are not included in the reported expense ratios.
(c) Annualized.
(d) Total net expenses include the impact of certain waivers/reimbursements made by the Investment Manager and certain of its affiliates, if applicable.
(e) The benefits derived from expense reductions had an impact of less than 0.01%.
The accompanying Notes to Financial Statements are an integral part of this statement.
Annual Report 2013
19
Columbia South Carolina Intermediate Municipal Bond Fund
Financial Highlights (continued)
| | | Year Ended April 30, | | Year Ended March 31, | |
Class C | | 2013 | | 2012(a) | | 2012 | | 2011 | | 2010 | | 2009 | |
Per share data | |
Net asset value, beginning of period | | $ | 10.75 | | | $ | 10.65 | | | $ | 10.08 | | | $ | 10.18 | | | $ | 9.85 | | | $ | 10.01 | | |
Income from investment operations: | |
Net investment income | | | 0.22 | | | | 0.02 | | | | 0.25 | | | | 0.27 | | | | 0.27 | | | | 0.30 | | |
Net realized and unrealized gain (loss) | | | 0.14 | | | | 0.10 | | | | 0.58 | | | | (0.10 | ) | | | 0.33 | | | | (0.16 | ) | |
Total from investment operations | | | 0.36 | | | | 0.12 | | | | 0.83 | | | | 0.17 | | | | 0.60 | | | | 0.14 | | |
Less distributions to shareholders: | |
Net investment income | | | (0.22 | ) | | | (0.02 | ) | | | (0.26 | ) | | | (0.27 | ) | | | (0.27 | ) | | | (0.30 | ) | |
Total distributions to shareholders | | | (0.22 | ) | | | (0.02 | ) | | | (0.26 | ) | | | (0.27 | ) | | | (0.27 | ) | | | (0.30 | ) | |
Net asset value, end of period | | $ | 10.89 | | | $ | 10.75 | | | $ | 10.65 | | | $ | 10.08 | | | $ | 10.18 | | | $ | 9.85 | | |
Total return | | | 3.41 | % | | | 1.12 | % | | | 8.27 | % | | | 1.68 | % | | | 6.11 | % | | | 1.43 | % | |
Ratios to average net assets(b) | |
Total gross expenses | | | 1.72 | % | | | 1.73 | %(c) | | | 1.78 | % | | | 1.70 | % | | | 1.66 | % | | | 1.63 | % | |
Total net expenses(d) | | | 1.55 | %(e) | | | 1.54 | %(c) | | | 1.54 | %(e) | | | 1.55 | %(e) | | | 1.53 | %(e) | | | 1.50 | %(e) | |
Net investment income | | | 2.06 | % | | | 2.19 | %(c) | | | 2.41 | % | | | 2.65 | % | | | 2.63 | % | | | 3.02 | % | |
Supplemental data | |
Net assets, end of period (in thousands) | | $ | 15,694 | | | $ | 14,041 | | | $ | 13,093 | | | $ | 10,031 | | | $ | 9,300 | | | $ | 6,146 | | |
Portfolio turnover | | | 14 | % | | | 0 | % | | | 9 | % | | | 15 | % | | | 16 | % | | | 21 | % | |
Notes to Financial Highlights
(a) For the period from April 1, 2012 to April 30, 2012. During the period, the Fund's fiscal year end was changed from March 31 to April 30.
(b) In addition to the fees and expenses which the Fund bears directly, the Fund indirectly bears a pro rata share of the fees and expenses of the acquired funds in which it invests. Such indirect expenses are not included in the reported expense ratios.
(c) Annualized.
(d) Total net expenses include the impact of certain waivers/reimbursements made by the Investment Manager and certain of its affiliates, if applicable.
(e) The benefits derived from expense reductions had an impact of less than 0.01%.
The accompanying Notes to Financial Statements are an integral part of this statement.
Annual Report 2013
20
Columbia South Carolina Intermediate Municipal Bond Fund
Financial Highlights (continued)
Class R4 | | Year Ended
April 30,
2013(a) | |
Per share data | |
Net asset value, beginning of period | | $ | 10.80 | | |
Income from investment operations: | |
Net investment income | | | 0.04 | | |
Net realized and unrealized gain | | | 0.08 | | |
Total from investment operations | | | 0.12 | | |
Less distributions to shareholders: | |
Net investment income | | | (0.04 | ) | |
Total distributions to shareholders | | | (0.04 | ) | |
Net asset value, end of period | | $ | 10.88 | | |
Total return | | | 1.09 | % | |
Ratios to average net assets(b) | |
Total gross expenses | | | 0.58 | %(c) | |
Total net expenses(d) | | | 0.53 | %(c) | |
Net investment income | | | 3.12 | %(c) | |
Supplemental data | |
Net assets, end of period (in thousands) | | $ | 3 | | |
Portfolio turnover | | | 14 | % | |
Notes to Financial Highlights
(a) For the period from March 19, 2013 (commencement of operations) to April 30, 2013.
(b) In addition to the fees and expenses which the Fund bears directly, the Fund indirectly bears a pro rata share of the fees and expenses of the acquired funds in which it invests. Such indirect expenses are not included in the reported expense ratios.
(c) Annualized.
(d) Total net expenses include the impact of certain waivers/reimbursements made by the Investment Manager and certain of its affiliates, if applicable.
The accompanying Notes to Financial Statements are an integral part of this statement.
Annual Report 2013
21
Columbia South Carolina Intermediate Municipal Bond Fund
Financial Highlights (continued)
| | | Year Ended April 30, | | Year Ended March 31, | |
Class Z | | 2013 | | 2012(a) | | 2012 | | 2011 | | 2010 | | 2009 | |
Per share data | |
Net asset value, beginning of period | | $ | 10.75 | | | $ | 10.65 | | | $ | 10.08 | | | $ | 10.18 | | | $ | 9.84 | | | $ | 10.01 | | |
Income from investment operations: | |
Net investment income | | | 0.33 | | | | 0.03 | | | | 0.36 | | | | 0.38 | | | | 0.37 | | | | 0.40 | | |
Net realized and unrealized gain (loss) | | | 0.14 | | | | 0.10 | | | | 0.57 | | | | (0.10 | ) | | | 0.34 | | | | (0.17 | ) | |
Total from investment operations | | | 0.47 | | | | 0.13 | | | | 0.93 | | | | 0.28 | | | | 0.71 | | | | 0.23 | | |
Less distributions to shareholders: | |
Net investment income | | | (0.33 | ) | | | (0.03 | ) | | | (0.36 | ) | | | (0.38 | ) | | | (0.37 | ) | | | (0.40 | ) | |
Total distributions to shareholders | | | (0.33 | ) | | | (0.03 | ) | | | (0.36 | ) | | | (0.38 | ) | | | (0.37 | ) | | | (0.40 | ) | |
Net asset value, end of period | | $ | 10.89 | | | $ | 10.75 | | | $ | 10.65 | | | $ | 10.08 | | | $ | 10.18 | | | $ | 9.84 | | |
Total return | | | 4.45 | % | | | 1.20 | % | | | 9.33 | % | | | 2.70 | % | | | 7.28 | % | | | 2.34 | % | |
Ratios to average net assets(b) | |
Total gross expenses | | | 0.72 | % | | | 0.73 | %(c) | | | 0.78 | % | | | 0.70 | % | | | 0.66 | % | | | 0.63 | % | |
Total net expenses(d) | | | 0.55 | %(e) | | | 0.54 | %(c) | | | 0.54 | %(e) | | | 0.55 | %(e) | | | 0.53 | %(e) | | | 0.50 | %(e) | |
Net investment income | | | 3.06 | % | | | 3.20 | %(c) | | | 3.42 | % | | | 3.65 | % | | | 3.64 | % | | | 4.03 | % | |
Supplemental data | |
Net assets, end of period (in thousands) | | $ | 122,578 | | | $ | 135,227 | | | $ | 131,663 | | | $ | 127,101 | | | $ | 150,971 | | | $ | 172,604 | | |
Portfolio turnover | | | 14 | % | | | 0 | % | | | 9 | % | | | 15 | % | | | 16 | % | | | 21 | % | |
Notes to Financial Highlights
(a) For the period from April 1, 2012 to April 30, 2012. During the period, the Fund's fiscal year end was changed from March 31 to April 30.
(b) In addition to the fees and expenses which the Fund bears directly, the Fund indirectly bears a pro rata share of the fees and expenses of the acquired funds in which it invests. Such indirect expenses are not included in the reported expense ratios.
(c) Annualized.
(d) Total net expenses include the impact of certain waivers/reimbursements made by the Investment Manager and certain of its affiliates, if applicable.
(e) The benefits derived from expense reductions had an impact of less than 0.01%.
The accompanying Notes to Financial Statements are an integral part of this statement.
Annual Report 2013
22
Columbia South Carolina Intermediate Municipal Bond Fund
Notes to Financial Statements
April 30, 2013
Note 1. Organization
Columbia South Carolina Intermediate Municipal Bond Fund (the Fund), a series of Columbia Funds Series Trust (the Trust), is a diversified fund. The Trust is registered under the Investment Company Act of 1940, as amended (the 1940 Act), as an open-end management investment company organized as a Delaware statutory trust.
Fund Shares
The Trust may issue an unlimited number of shares (without par value). The Fund offers Class A, Class B, Class C, Class R4 and Class Z shares. All share classes have identical voting, dividend and liquidation rights. Each share class has its own expense structure and sales charges, as applicable.
Class A shares are subject to a maximum front-end sales charge of 3.25% based on the initial investment amount. Class A shares purchased without an initial sales charge in accounts aggregating $1 million to $50 million at the time of purchase are subject to a contingent deferred sales charge (CDSC) if the shares are sold within 18 months of purchase, charged as follows: 1.00% CDSC if redeemed within 12 months of purchase, and 0.50% CDSC if redeemed more than 12, but less than 18, months after purchase.
Class B shares may be subject to a maximum CDSC of 3.00% based upon the holding period after purchase. Class B shares will generally convert to Class A shares eight years after purchase. The Fund no longer accepts investments by new or existing investors in the Fund's Class B shares, except in connection with the reinvestment of any dividend and/or capital gain distributions in Class B shares of the Fund and exchanges by existing Class B shareholders of certain other funds within the Columbia Family of Funds.
Class C shares are subject to a 1.00% CDSC on shares redeemed within one year of purchase.
Class R4 shares are not subject to sales charges and are generally available only to omnibus retirement plans and certain other eligible investors. Class R4 shares commenced operations on March 19, 2013.
Class Z shares are not subject to sales charges, and are only available to certain investors.
Note 2. Summary of Significant Accounting Policies
Use of Estimates
The preparation of financial statements in accordance with U.S. generally accepted accounting principles (GAAP) requires management to make certain estimates and assumptions that affect the reported amounts of assets and liabilities, the disclosure of contingent assets and liabilities at the date of the financial statements and the reported amounts
of revenue and expenses during the reporting period. Actual results could differ from those estimates.
The following is a summary of significant accounting policies consistently followed by the Fund in the preparation of its financial statements.
Security Valuation
Debt securities generally are valued by pricing services approved by the Board of Trustees (the Board) based upon market transactions for normal, institutional-size trading units of similar securities. The services may use various pricing techniques which take into account appropriate factors such as yield, quality, coupon rate, maturity, type of issue, trading characteristics and other data, as well as broker quotes. Debt securities for which quotations are readily available may also be valued based upon an over-the-counter or exchange bid quotation.
Investments in other open-end investment companies, including money market funds, are valued at net asset value.
Investments for which market quotations are not readily available, or that have quotations which management believes are not reliable, are valued at fair value as determined in good faith under consistently applied procedures established by and under the general supervision of the Board. If a security or class of securities (such as foreign securities) is valued at fair value, such value is likely to be different from the last quoted market price for the security.
The determination of fair value often requires significant judgment. To determine fair value, management may use assumptions including but not limited to future cash flows and estimated risk premiums. Multiple inputs from various sources may be used to determine fair value.
Delayed Delivery Securities
The Fund may trade securities on other than normal settlement terms, including securities purchased or sold on a "when-issued" basis. This may increase the risk if the other party to the transaction fails to deliver and causes the Fund to subsequently invest at less advantageous prices. The Fund designates cash or liquid securities in an amount equal to the delayed delivery commitment.
Security Transactions
Security transactions are accounted for on the trade date. Cost is determined and gains (losses) are based upon the specific identification method for both financial statement and federal income tax purposes.
Income Recognition
Interest income is recorded on an accrual basis. Market premiums and discounts, including original issue discounts,
Annual Report 2013
23
Columbia South Carolina Intermediate Municipal Bond Fund
Notes to Financial Statements (continued)
April 30, 2013
are amortized and accreted, respectively, over the expected life of the security on all debt securities, unless otherwise noted.
Dividend income is recorded on the ex-dividend date.
Expenses
General expenses of the Trust are allocated to the Fund and other funds of the Trust based upon relative net assets or other expense allocation methodologies determined by the nature of the expense. Expenses directly attributable to the Fund are charged to the Fund. Expenses directly attributable to a specific class of shares are charged to that share class.
Determination of Class Net Asset Value
All income, expenses (other than class-specific expenses, which are charged to that share class, as shown in the Statement of Operations) and realized and unrealized gains (losses) are allocated to each class of the Fund on a daily basis, based on the relative net assets of each class, for purposes of determining the net asset value of each class.
Federal Income Tax Status
The Fund intends to qualify each year as a regulated investment company under Subchapter M of the Internal Revenue Code, as amended, and will distribute substantially all of its tax exempt and taxable income (including net short-term capital gains), if any, for its tax year, and as such will not be subject to federal income taxes. In addition, the Fund intends to distribute in each calendar year substantially all of its net investment income, capital gains and certain other amounts, if any, such that the Fund should not be subject to federal excise tax. Therefore, no federal income or excise tax provision is recorded.
Distributions to Shareholders
Distributions from net investment income, if any, are declared daily and paid monthly. Net realized capital gains, if any, are distributed at least annually. Income distributions and capital gain distributions are determined in accordance with federal income tax regulations, which may differ from GAAP.
Guarantees and Indemnifications
Under the Trust's organizational documents and, in some cases, by contract, its officers and trustees are indemnified against certain liabilities arising out of the performance of their duties to the Trust or its funds. In addition, certain of the Fund's contracts with its service providers contain general indemnification clauses. The Fund's maximum exposure under these arrangements is unknown since the amount of any future claims that may be made against the Fund cannot be determined, and the Fund has no historical basis for predicting the likelihood of any such claims.
Recent Accounting Pronouncement
Disclosures about Offsetting Assets and Liabilities
In December 2011, the Financial Accounting Standards Board (FASB) issued Accounting Standards Update (ASU) No. 2011-11, Disclosures about Offsetting Assets and Liabilities and in January 2013, ASU No. 2013-1, Clarifying the Scope of Disclosures about Offsetting Assets and Liabilities (collectively, the ASUs). Specifically, the ASUs require an entity to disclose both gross and net information for derivatives and other financial instruments that are subject to a master netting arrangement or similar agreement. The ASUs require disclosure of collateral received in connection with the master netting agreements or similar agreements. The disclosure requirements are effective for interim and annual periods beginning on or after January 1, 2013. At this time, management is evaluating the implications of this guidance and the impact it will have on the financial statement amounts and footnote disclosures, if any.
Note 3. Fees and Compensation Paid to Affiliates
Investment Management Fees
Under an Investment Management Services Agreement, Columbia Management Investment Advisers, LLC (the Investment Manager), a wholly-owned subsidiary of Ameriprise Financial, Inc. (Ameriprise Financial), determines which securities will be purchased, held or sold. The investment management fee is an annual fee that is equal to a percentage of the Fund's average daily net assets that declines from 0.40% to 0.27% as the Fund's net assets increase. The effective investment management fee rate for the year ended April 30, 2013 was 0.40% of the Fund's average daily net assets.
Administration Fees
Under an Administrative Services Agreement, the Investment Manager also serves as the Fund Administrator. The Fund pays the Fund Administrator an annual fee for administration and accounting services equal to a percentage of the Fund's average daily net assets that declines from 0.07% to 0.04% as the Fund's net assets increase. The effective administration fee rate for the year ended April 30, 2013 was 0.07% of the Fund's average daily net assets.
Other Expenses
Other expenses are for, among other things, certain expenses of the Fund or the Board, including: Fund boardroom and office expense, employee compensation, employee health and retirement benefits, and certain other expenses. Payment of these Fund and Board expenses is facilitated by a company providing limited administrative services to the Fund and the Board. For the year ended April 30, 2013, other expenses paid to this company were $1,568.
Annual Report 2013
24
Columbia South Carolina Intermediate Municipal Bond Fund
Notes to Financial Statements (continued)
April 30, 2013
Compensation of Board Members
Board members are compensated for their services to the Fund as disclosed in the Statement of Operations. Under a Deferred Compensation Plan (the Plan), the Board members who are not "interested persons" of the Fund, as defined under the 1940 Act, may elect to defer payment of up to 100% of their compensation. Deferred amounts are treated as though equivalent dollar amounts had been invested in shares of certain funds managed by the Investment Manager. The Fund's liability for these amounts is adjusted for market value changes and remains in the Fund until distributed in accordance with the Plan.
Transfer Agent Fees
Under a Transfer and Dividend Disbursing Agent Agreement, Columbia Management Investment Services Corp. (the Transfer Agent), an affiliate of the Investment Manager and a wholly-owned subsidiary of Ameriprise Financial, is responsible for providing transfer agency services to the Fund. The Transfer Agent has contracted with Boston Financial Data Services (BFDS) to serve as sub-transfer agent.
The Transfer Agent receives monthly account-based service fees based on the number of open accounts and also receives sub-transfer agency fees based on a percentage of the average aggregate value of the Fund's shares maintained in omnibus accounts (other than omnibus accounts for which American Enterprise Investment Services Inc. is the broker of record or accounts where the beneficial shareholder is a customer of Ameriprise Financial Services, Inc., which are paid a per account fee). The Transfer Agent pays the fees of BFDS for services as sub-transfer agent and is not entitled to reimbursement for such fees from the Fund (with the exception of out-of-pocket fees).
The Transfer Agent also receives compensation from fees for various shareholder services and reimbursements for certain out-of-pocket fees.
For the year ended April 30, 2013, the Fund's effective transfer agent fee rates as a percentage of average daily net assets of each class were as follows:
Class A | | | 0.19 | % | |
Class B | | | 0.19 | | |
Class C | | | 0.19 | | |
Class R4* | | | 0.10 | | |
Class Z | | | 0.19 | | |
*Annualized.
An annual minimum account balance fee of $20 may apply to certain accounts with a value below the Fund's initial minimum investment requirements to reduce the impact of small accounts on transfer agent fees. These minimum account balance fees are recorded as part of expense reductions in the Statement of Operations. For the year ended April 30, 2013, these minimum account balance fees reduced total expenses by $20.
Distribution and Service Fees
The Fund has an agreement with Columbia Management Investment Distributors, Inc. (the Distributor), an affiliate of the Investment Manager and a wholly-owned subsidiary of Ameriprise Financial, for distribution and shareholder services. Pursuant to Rule 12b-1 under the 1940 Act, the Board has approved, and the Fund has adopted, distribution and shareholder service plans (the Plans) which set the distribution and service fees for the Fund. These fees are calculated daily and are intended to compensate the Distributor and/or eligible selling and/or servicing agents for selling shares of the Fund and providing services to investors.
The Plans require the payment of a monthly combined distribution and service fee to the Distributor at the maximum annual rate of 0.25% of the average daily net assets attributable to Class A shares of the Fund. The Plans also require the payment of a monthly service fee at the maximum annual rate of 0.25% of the average daily net assets attributable to Class B and Class C shares of the Fund and the payment of a monthly distribution fee at the maximum annual rate of 0.75% of the average daily net assets attributable to Class B and Class C shares of the Fund.
Sales Charges
Sales charges, including front-end charges and CDSCs, received by the Distributor for distributing Fund shares were $100,567 for Class A and $1,625 for Class C shares for the year ended April 30, 2013.
Expenses Waived/Reimbursed by the Investment Manager and its Affiliates
The Investment Manager and certain of its affiliates have contractually agreed to waive fees and/or reimburse expenses (excluding certain fees and expenses described below) for the periods disclosed below, unless sooner terminated at the sole discretion of the Board, so that the Fund's net operating expenses, after giving effect to fees waived/expenses reimbursed and any balance credits and/or overdraft charges
Annual Report 2013
25
Columbia South Carolina Intermediate Municipal Bond Fund
Notes to Financial Statements (continued)
April 30, 2013
from the Fund's custodian, do not exceed the following annual rates as a percentage of the class' average daily net assets:
| | | August 1, 2012
through
August 31, 2013 | | Prior to
August 1, 2012 | |
Class A | | | 0.81 | % | | | 0.79 | % | |
Class B | | | 1.56 | | | | 1.54 | | |
Class C | | | 1.56 | | | | 1.54 | | |
Class R4 | | | 0.56 | * | | | — | | |
Class Z | | | 0.56 | | | | 0.54 | | |
*Annual rate is contractual from March 19, 2013 (the commencement of operations of Class R4 shares) through February 28, 2014.
Under the agreement governing these fee waivers and/or expense reimbursement arrangements, the following fees and expenses are excluded from the waiver/reimbursement commitment, and therefore will be paid by the Fund, if applicable: taxes (including foreign transaction taxes), expenses associated with investments in affiliated and non-affiliated pooled investment vehicles (including mutual funds and exchange traded funds), transaction costs and brokerage commissions, costs related to any securities lending program, dividend expenses associated with securities sold short, inverse floater program fees and expenses, transaction charges and interest on borrowed money, interest, extraordinary expenses and any other expenses the exclusion of which is specifically approved by the Board. This agreement may be modified or amended only with approval from all parties.
Note 4. Federal Tax Information
The timing and character of income and capital gain distributions are determined in accordance with income tax regulations, which may differ from GAAP because of temporary or permanent book to tax differences.
At April 30, 2013, these differences are primarily due to differing treatment for capital loss carryforwards and Trustees' deferred compensation. To the extent these differences are permanent, reclassifications are made among the components of the Fund's net assets in the Statement of Assets and Liabilities. Temporary differences do not require reclassifications. In the Statement of Assets and Liabilities the following reclassifications were made:
Undistributed net investment income | | $ | (44 | ) | |
Accumulated net realized gain | | | 44 | | |
Net investment income and net realized gains (losses), as disclosed in the Statement of Operations, and net assets were not affected by this reclassification.
The tax character of distributions paid during the periods indicated was as follows:
| | Year Ended
April 30,
2013 | | Period Ended
April 30,
2012 | | Year Ended
March 31,
2012 | |
Ordinary income | | $ | 14,440 | | | $ | 1,513 | | | $ | 195,420 | | |
Tax-exempt income | | | 4,928,040 | | | | 431,777 | | | | 5,103,436 | | |
Total | | $ | 4,942,480 | | | $ | 433,290 | | | $ | 5,298,856 | | |
Short-term capital gain distributions, if any, are considered ordinary income distributions for tax purposes.
At April 30, 2013, the components of distributable earnings on a tax basis were as follows:
Undistributed tax-exempt income | | $ | 1,595,697 | | |
Undistributed accumulated long-term gain | | | 56,158 | | |
Unrealized appreciation | | | 13,863,149 | | |
At April 30, 2013, the cost of investments for federal income tax purposes was $153,175,396 and the aggregate gross unrealized appreciation and depreciation based on that cost was:
Unrealized appreciation | | $ | 13,916,312 | | |
Unrealized depreciation | | | (53,163 | ) | |
Net unrealized appreciation | | $ | 13,863,149 | | |
Unlimited capital loss carryforwards are required to be utilized prior to any capital losses which carry an expiration date. As a result of this ordering rule, capital loss carryforwards which carry an expiration date may be more likely to expire unused.
For the year ended April 30, 2013, $756,192 of capital loss carryforward was utilized.
Management of the Fund has concluded that there are no significant uncertain tax positions that would require recognition in the financial statements. However, management's conclusion may be subject to review and adjustment at a later date based on factors including, but not limited to, new tax laws, regulations, and administrative interpretations (including relevant court decisions). Generally, the Fund's federal tax returns for the prior three fiscal years remain subject to examination by the Internal Revenue Service.
Note 5. Portfolio Information
The cost of purchases and proceeds from sales of securities, excluding short-term obligations, aggregated to $22,860,128 and $27,543,556, respectively, for the year ended April 30, 2013.
Annual Report 2013
26
Columbia South Carolina Intermediate Municipal Bond Fund
Notes to Financial Statements (continued)
April 30, 2013
Note 6. Shareholder Concentration
At April 30, 2013, one unaffiliated shareholder account owned 71.8% of the outstanding shares of the Fund. The Fund has no knowledge about whether any portion of those shares was owned beneficially by such account. Subscription and redemption activity by concentrated accounts may have a significant effect on the operations of the Fund.
Note 7. Line of Credit
The Fund has entered into a revolving credit facility with a syndicate of banks led by JPMorgan Chase Bank N.A. whereby the Fund may borrow for the temporary funding of shareholder redemptions or for other temporary or emergency purposes. The credit facility agreement, as amended, which is a collective agreement between the Fund and certain other funds managed by the Investment Manager, severally and not jointly, permits collective borrowings up to $500 million. Interest is charged to each participating fund based on its borrowings at a rate equal to the higher of (i) the overnight federal funds rate plus 1.00% or (ii) the one-month LIBOR rate plus 1.00%. Each borrowing under the credit facility matures no later than 60 days after the date of borrowing. The Fund also pays a commitment fee equal to its pro rata share of the amount of the credit facility at a rate of 0.08% per annum.
The Fund had no borrowings during the year ended April 30, 2013.
Note 8. Significant Risks
Geographic Concentration Risk
Because state-specific tax-exempt funds invest primarily in the municipal securities issued by the state and political sub-divisions of the state, the Fund will be particularly affected by political and economic conditions and developments in the state in which it invests. The Fund may, therefore, have a greater risk than that of a municipal bond fund which is more geographically diversified. The value of the municipal securities owned by the Fund also may be adversely affected by future changes in federal or state income tax laws.
Note 9. Subsequent Events
Management has evaluated the events and transactions that have occurred through the date the financial statements were issued and noted no items requiring adjustment of the financial statements or additional disclosure.
Note 10. Information Regarding Pending and Settled Legal Proceedings
In December 2005, without admitting or denying the allegations, American Express Financial Corporation (AEFC, which is now known as Ameriprise Financial, Inc. (Ameriprise
Financial)) entered into settlement agreements with the Securities and Exchange Commission (SEC) and Minnesota Department of Commerce (MDOC) related to market timing activities. As a result, AEFC was censured and ordered to cease and desist from committing or causing any violations of certain provisions of the Investment Advisers Act of 1940, the Investment Company Act of 1940, and various Minnesota laws. AEFC agreed to pay disgorgement of $10 million and civil money penalties of $7 million. AEFC also agreed to retain an independent distribution consultant to assist in developing a plan for distribution of all disgorgement and civil penalties ordered by the SEC in accordance with various undertakings detailed at www.sec.gov/litigation/admin/ia-2451.pdf. Ameriprise Financial and its affiliates have cooperated with the SEC and the MDOC in these legal proceedings, and have made regular reports to the funds' Boards of Trustees.
Ameriprise Financial and certain of its affiliates have historically been involved in a number of legal, arbitration and regulatory proceedings, including routine litigation, class actions, and governmental actions, concerning matters arising in connection with the conduct of their business activities. Ameriprise Financial believes that the Funds are not currently the subject of, and that neither Ameriprise Financial nor any of its affiliates are the subject of, any pending legal, arbitration or regulatory proceedings that are likely to have a material adverse effect on the Funds or the ability of Ameriprise Financial or its affiliates to perform under their contracts with the Funds. Ameriprise Financial is required to make 10-Q, 10-K and, as necessary, 8-K filings with the Securities and Exchange Commission on legal and regulatory matters that relate to Ameriprise Financial and its affiliates. Copies of these filings may be obtained by accessing the SEC website at www.sec.gov.
There can be no assurance that these matters, or the adverse publicity associated with them, will not result in increased fund redemptions, reduced sale of fund shares or other adverse consequences to the Funds. Further, although we believe proceedings are not likely to have a material adverse effect on the Funds or the ability of Ameriprise Financial or its affiliates to perform under their contracts with the Funds, these proceedings are subject to uncertainties and, as such, we are unable to estimate the possible loss or range of loss that may result. An adverse outcome in one or more of these proceedings could result in adverse judgments, settlements, fines, penalties or other relief that could have a material adverse effect on the consolidated financial condition or results of operations of Ameriprise Financial.
Annual Report 2013
27
Columbia South Carolina Intermediate Municipal Bond Fund
Report of Independent Registered Public Accounting Firm
To the Trustees of Columbia Funds Series Trust and the Shareholders of
Columbia South Carolina Intermediate Municipal Bond Fund
In our opinion, the accompanying statement of assets and liabilities, including the portfolio of investments, and the related statements of operations and of changes in net assets and the financial highlights present fairly, in all material respects, the financial position of Columbia South Carolina Intermediate Municipal Bond Fund (the "Fund") (a series of Columbia Funds Series Trust) at April 30, 2013, the results of its operations, the changes in its net assets and the financial highlights for the periods indicated, in conformity with accounting principles generally accepted in the United States of America. These financial statements and financial highlights (hereafter referred to as "financial statements") are the responsibility of the Fund's management. Our responsibility is to express an opinion on these financial statements based on our audits. We conducted our audits of these financial statements in accordance with the standards of the Public Company Accounting Oversight Board (United States). Those standards require that we plan and perform the audit to obtain reasonable assurance about whether the financial statements are free of material misstatement. An audit includes examining, on a test basis, evidence supporting the amounts and disclosures in the financial statements, assessing the accounting principles used and significant estimates made by management, and evaluating the overall financial statement presentation. We believe that our audits, which included confirmation of securities at April 30, 2013 by correspondence with the custodian and brokers, provide a reasonable basis for our opinion.
PricewaterhouseCoopers LLP
Minneapolis, Minnesota
June 21, 2013
Annual Report 2013
28
Columbia South Carolina Intermediate Municipal Bond Fund
Federal Income Tax Information
(Unaudited)
The Fund hereby designates the following tax attributes for the fiscal year ended April 30, 2013. Shareholders will be notified in early 2014 of amounts for use in preparing 2013 income tax returns
Tax Designations:
Capital Gain Dividend | | $ | 58,966 | | |
| Exempt-Interest Dividends | | | 99.71 | % | |
Capital Gain Dividend. The Fund designates as a capital gain dividend the amount reflected above, or if subsequently determined to be different, the net capital gain of such fiscal period. The Fund also designates as capital gain dividends, to the extent necessary to fully distribute such capital gains, earnings and profits distributed to shareholders on the redemption of shares.
Exempt-Interest Dividends. The percentage of net investment income dividends paid during the fiscal year that qualifies as exempt-interest dividends for federal income tax purposes.
Annual Report 2013
29
Columbia South Carolina Intermediate Municipal Bond Fund
Shareholders elect the Board that oversees the funds' operations. The Board appoints officers who are responsible for day-to-day business decisions based on policies set by the Board. The following table provides basic biographical information about the funds' Board members, including their principal occupations during the past five years, although specific titles for individuals may have varied over the period. Under current Board policy, members may serve until the next Board meeting after he or she reaches the mandatory retirement age established by the Board, or the fifteenth anniversary of the first Board meeting they attended as a member of the Board.
Mr. Edward J. Boudreau, Jr., Mr. William P. Carmichael, Mr. William A. Hawkins, Mr. R. Glenn Hilliard, Ms. Minor M. Shaw and Dr. Anthony M. Santomero, were members of the Legacy Columbia Nations funds' Board ("Nations Funds"), which includes Columbia Funds Series Trust, Columbia Funds Variable Insurance Trust I and Columbia Funds Master Investment Trust, LLC and began service on the Board for the Legacy RiverSource funds ("RiverSource Funds") effective June 1, 2011.
Independent Trustees
Name,
Address,
Year of Birth | | Position Held With
Funds and Length of
Service | | Principal Occupation
During Past Five Years | | Number of
Funds in the
Fund Family
Overseen by
Board Member | | Other Present or Past
Directorships/Trusteeships
(Within Past 5 Years)
| |
Kathleen Blatz
901 S. Marquette Ave.
Minneapolis, MN 55402
1954 | | Board member since 1/06 for RiverSource Funds and since 6/11 for Nations Funds | | Attorney; Chief Justice, Minnesota Supreme Court, 1998-2006 | | | 132 | | | Director, BlueCross BlueShield of Minnesota since 2009 | |
Edward J. Boudreau, Jr.
901 S. Marquette Ave.
Minneapolis, MN 55402
1944 | | Board member since 6/11 for RiverSource Funds and since 1/05 for Nations Funds | | Managing Director, E.J. Boudreau & Associates (consulting) since 2000 | | | 130 | | | Former Trustee, BofA Funds Series Trust (11 funds) | |
Pamela G. Carlton
901 S. Marquette Ave.
Minneapolis, MN 55402
1954 | | Board member since 7/07 for RiverSource Funds and since 6/11 for Nations Funds | | President, Springboard — Partners in Cross Cultural Leadership (consulting company) since 2003 | | | 132 | | | None | |
William P. Carmichael
901 S. Marquette Ave.
Minneapolis, MN 55402
1943 | | Board member since 6/11 for RiverSource Funds and since 1999 for Nations Funds | | Retired | | | 130 | | | Director, Cobra Electronics
Corporation (electronic equipment manufacturer); The Finish Line (athletic shoes and apparel) since July 2003; McMoRan Exploration Company (oil and gas exploration and development) since 2010; former Trustee, BofA Funds Series Trust (11 funds); former Director, Spectrum Brands, Inc. (consumer products); former Director, Simmons Company (bedding) | |
Patricia M. Flynn
901 S. Marquette Ave.
Minneapolis, MN 55402
1950 | | Board member since 11/04 for RiverSource Funds and since 6/11 for Nations Funds | | Trustee Professor of Economics and Management, Bentley University since 1976 | | | 132 | | | None | |
William A. Hawkins
901 S. Marquette Ave.
Minneapolis, MN 55402
1942 | | Board member since 6/11 for RiverSource Funds and since 1/05 for Nations Funds | | Managing Director, Overton Partners (financial consulting), since August 2010; President and Chief Executive Officer, California General Bank, N.A., January 2008-August 2010 | | | 130 | | | Trustee, BofA Funds Series Trust (11 funds) | |
Annual Report 2013
30
Columbia South Carolina Intermediate Municipal Bond Fund
Trustees and Officers (continued)
Independent Trustees (continued)
Name,
Address,
Year of Birth | | Position Held With
Funds and Length of
Service | | Principal Occupation
During Past Five Years | | Number of
Funds in the
Fund Family
Overseen by
Board Member | | Other Present or Past
Directorships/Trusteeships
(Within Past 5 Years)
| |
R. Glenn Hilliard
901 S. Marquette Ave.
Minneapolis, MN 55402
1943 | | Board member since 6/11 for RiverSource Funds and since 1/05 for Nations Funds | | Chairman and Chief Executive Officer, Hilliard Group LLC (investing and consulting), since April 2003; Non-Executive Director & Chairman, CNO Financial Group, Inc. (insurance), September 2003-May 2011 | | | 130 | | | Chairman, BofA Fund Series Trust (11 funds); former Director, CNO Financial Group, Inc. (insurance) | |
Stephen R. Lewis, Jr.
901 S. Marquette Ave.
Minneapolis, MN 55402
1939 | | Chair of the Board for RiverSource Funds since 1/07, Board member for RiverSource Funds since 1/02 and since 6/11 for Nations Funds | | President Emeritus and Professor of Economics Emeritus, Carleton College since 2002 | | | 132 | | | Director, Valmont Industries, Inc. (manufacturer of irrigation systems) since 2002 | |
Catherine James Paglia
901 S. Marquette Ave.
Minneapolis, MN 55402
1952 | | Board member since 11/04 for RiverSource Funds and since 6/11 for Nations Funds | | Director, Enterprise Asset Management, Inc. (private real estate and asset management company) | | | 132 | | | Director, Valmont Industries, Inc. (manufacturer of irrigation systems) since 2012 | |
Leroy C. Richie
901 S. Marquette Ave.
Minneapolis, MN 55402
1941 | | Board member since 2000 for Legacy Seligman Funds, since 11/08 for RiverSource Funds and since 6/11 for Nations Funds | | Counsel, Lewis & Munday, P.C. (law firm) since 2004; former Vice President and General Counsel, Automotive Legal Affairs, Chrysler Corporation from 1983-1987 | | | 132 | | | Lead Outside Director, Digital Ally, Inc. (digital imaging) since September 2005; Director, Infinity, Inc. (oil and gas exploration and production) since 1994; Director, OGE Energy Corp. (energy and energy services) since November 2007 | |
Minor M. Shaw
901 S. Marquette Ave.
Minneapolis, MN 55402
1947 | | Board member since 6/11 for RiverSource Funds and since 2003 for Nations Funds | | President, Micco LLC (private investments) since 2011; President, Micco Corp. since 1998 | | | 130 | | | Director, Piedmont Natural Gas; Director, BlueCross BlueShield of South Carolina since April 2008; Former Trustee, BofA Funds Series Trust (11 funds) | |
Alison Taunton-Rigby
901 S. Marquette Ave.
Minneapolis, MN 55402
1944 | | Board member since 11/02 for RiverSource Funds and since 6/11 for Nations Funds | | Chief Executive Officer and Director, RiboNovix, Inc. (biotechnology), 2003-2010 | | | 132 | | | Director, Healthways, Inc. (health and well-being improvement) since 2005; Director, ICI Mutual Insurance Company, RRG since 2011; Director, Abt Associates (government contractor) since 2001; Director, Boston Children's Hospital since 2002 | |
Annual Report 2013
31
Columbia South Carolina Intermediate Municipal Bond Fund
Trustees and Officers (continued)
Interested Trustee Not Affiliated With Investment Manager*
Name,
Address,
Year of Birth | | Position Held With
Funds and Length of
Service | | Principal Occupation
During Past Five Years | | Number of
Funds in the
Fund Family
Overseen by
Board Member | | Other Present or Past
Directorships/Trusteeships
(Within Past 5 Years)
| |
Anthony M. Santomero
901 S. Marquette Ave.
Minneapolis, MN 55402
1946 | | Board member since 6/11 for RiverSource Funds and since 1/08 for Nations Funds | | Richard K. Mellon Professor Emeritus of Finance, The Wharton School, University of Pennsylvania, since 2002; Senior Advisor, McKinsey & Company (consulting), 2006-2008 | | | 130 | | | Director, Renaissance Reinsurance Ltd. since May 2008; Trustee, Penn Mutual Life Insurance Company since March 2008; Director, Citigroup since 2009; Director, Citibank, N.A. since 2009; former Trustee, BofA Funds Series Trust (11 funds) | |
*Dr. Santomero is not an affiliated person of the investment manager or Ameriprise Financial. However, he is currently deemed by the funds to be an "interested person" (as defined in the 1940 Act) of the funds because he serves as a Director of Citigroup, Inc. and Citibank N.A., companies that may directly or through subsidiaries and affiliates engage from time-to-time in brokerage execution, principal transactions and lending relationships with the funds or accounts advised/managed by the investment manager.
Interested Trustee Affiliated With Investment Manager*
Name,
Address,
Year of Birth | | Position Held With
Funds and Length of
Service | | Principal Occupation
During Past Five Years | | Number of
Funds in the
Fund Family
Overseen by
Board Member | | Other Present or Past
Directorships/Trusteeships
(Within Past 5 Years) | |
William F. Truscott
53600 Ameriprise
Financial Center
Minneapolis, MN 55474
1960 | | Board member since 11/01 for RiverSource Funds and since 6/11 for Nations Funds; Senior Vice President since 2002 for RiverSource Funds and 5/10 for Nations Funds | | President, Columbia Management Investment Advisers, LLC since February 2012, (previously President, Chairman of the Board and Chief Investment Officer, 2001-April 2010); Chief Executive Officer, Global Asset Management, Ameriprise Financial, Inc. since September 2012 (previously Chief Executive Officer, U.S. Asset Management & President, Annuities, May 2010-September 2012 and President — U.S. Asset Management and Chief Investment Officer, 2005-April 2010); Chief Executive Officer, Columbia Management Investment Distributors, Inc. since February 2012, (previously Chairman of the Board and Chief Executive Officer, 2006-April 2010); Chairman of the Board and Chief Executive Officer, RiverSource Distributors, Inc. since 2006; President and Chief Executive Officer, Ameriprise Certificate Company 2006-August 2012 | | | 184 | | | Chairman of the Board, Columbia Management Investment Advisers, LLC since May 2010; Director, Columbia Management Investment Distributors, Inc. since May 2010; Director, Ameriprise Certificate Company, 2006-January 2013 | |
*Interested person (as defined under the 1940 Act) by reason of being an officer, director, security holder and/or employee of the investment manager or Ameriprise Financial.
The SAI has additional information about the Fund's Board members and is available, without charge, upon request by calling 800.345.6611; contacting your financial intermediary; or visiting columbiamanagement.com.
Annual Report 2013
32
Columbia South Carolina Intermediate Municipal Bond Fund
Trustees and Officers (continued)
The Board has appointed officers who are responsible for day-to-day business decisions based on policies it has established. The officers serve at the pleasure of the Board. In addition to Mr. Truscott, who is Senior Vice President, the funds' other officers are:
Officers
Name,
Address,
Year of Birth | | Position Held With
Funds and Length of
Service | | Principal Occupation During Past Five Years | |
J. Kevin Connaughton
225 Franklin Street
Boston, MA 02110
1964 | | President and Principal Executive Officer since 5/10 for RiverSource Funds and 2009 for Nations Funds | | Senior Vice President and General Manager — Mutual Fund Products, Columbia Management Investment Advisers, LLC since May 2010; Managing Director of Columbia Management Advisors, LLC, December 2004-April 2010; Senior Vice President and Chief Financial Officer, Columbia Funds, June 2008-January 2009; Treasurer, Columbia Funds, October 2003-May 2008 | |
Amy K. Johnson
5228 Ameriprise
Financial Center Minneapolis, MN 55474
1965 | | Vice President since 12/06 for RiverSource Funds and 5/10 for Nations Funds | | Senior Vice President and Chief Operating Officer, Columbia Management Investment Advisers, LLC since May 2010 (previously Chief Administrative Officer, 2009-April 2010 and Vice President — Asset Management and Trust Company Services, 2006-2009) | |
Michael G. Clarke
225 Franklin Street
Boston, MA 02110
1969 | | Treasurer since 1/11 and Chief Financial Officer since 4/11 for RiverSource Funds and Treasurer since 3/11 and Chief Financial Officer since 2009 for Nations Funds | | Vice President, Columbia Management Investment Advisers, LLC since May 2010; Managing Director of Fund Administration, Columbia Management Advisors, LLC, September 2004-April 2010; senior officer of Columbia Funds and affiliated funds since 2002 | |
Scott R. Plummer
5228 Ameriprise
Financial Center
Minneapolis, MN 55474
1959 | | Senior Vice President and Chief Legal Officer since 12/06 and Assistant Secretary since 6/11 for RiverSource Funds and Senior Vice President and Chief Legal Officer since 5/10 and Assistant Secretary since 6/11 for Nations Funds | | Senior Vice President, Chief Legal Officer and Assistant Secretary, Columbia Management Investment Advisers, LLC since June 2005; Vice President and Lead Chief Counsel — Asset Management, Ameriprise Financial, Inc. since May 2010 (previously Vice President and Chief Counsel — Asset Management, 2005-April 2010); Vice President, Chief Counsel and Assistant Secretary, Columbia Management Investment Distributors, Inc. since 2008; Vice President, General Counsel and Secretary, Ameriprise Certificate Company since 2005; Chief Counsel, RiverSource Distributors, Inc. since 2006 | |
Colin Moore
225 Franklin Street
Boston, MA 02110
1958 | | Senior Vice President since 5/10 for RiverSource Funds and Nations Funds | | Director and Chief Investment Officer, Columbia Management Investment Advisers, LLC since May 2010; Manager, Managing Director and Chief Investment Officer, Columbia Management Advisors, LLC, 2007-April 2010 | |
Thomas P. McGuire
225 Franklin Street
Boston, MA 02110
1972 | | Chief Compliance Officer since 3/12 | | Vice President — Asset Management Compliance, Columbia Management Investment Advisers, LLC since 2010; Chief Compliance Officer, Ameriprise Certificate Company since September 2010; Compliance Executive, Bank of America, 2005-2010 | |
Stephen T. Welsh
225 Franklin Street
Boston, MA 02110
1957 | | Vice President since 4/11 for RiverSource Funds and 2006 for Nations Funds | | President and Director, Columbia Management Investment Services Corp. since May 2010; President and Director, Columbia Management Services, Inc., July 2004-April 2010; Managing Director, Columbia Management Distributors, Inc., August 2007-April 2010 | |
Christopher O. Petersen
5228 Ameriprise
Financial Center
Minneapolis, MN 55474
1970 | | Vice President and Secretary since 4/11 for RiverSource Funds and 3/11 for Nations Funds | | Vice President and Chief Counsel, Ameriprise Financial, Inc. since January 2010 (formerly Vice President and Group Counsel or Counsel, April 2004-January 2010); Assistant Secretary of Legacy RiverSource Funds, January 2007-April 2011 and of the Nations Funds, May 2010-March 2011 | |
Annual Report 2013
33
Columbia South Carolina Intermediate Municipal Bond Fund
Trustees and Officers (continued)
Officers (continued)
Name,
Address,
Year of Birth | | Position Held With
Funds and Length of
Service | | Principal Occupation During Past Five Years | |
Paul D. Pearson
10468 Ameriprise
Financial Center
Minneapolis, MN 55474
1956 | | Vice President since 4/11 and Assistant Treasurer since 1999 for RiverSource Funds and Vice President and Assistant Treasurer since 6/11 for Nations Funds | | Vice President — Investment Accounting, Columbia Management Investment Advisers, LLC, since May 2010; Vice President — Managed Assets, Investment Accounting, Ameriprise Financial Corporation, February 1998-May 2010 | |
Joseph F. DiMaria
225 Franklin Street
Boston, MA 02110
1968 | | Vice President and Chief Accounting Officer since 4/11 and Vice President since 3/11 and Chief Accounting Officer since 2008 for Nations Funds | | Vice President, Mutual Fund Administration, Columbia Management Investment Advisers, LLC, since May 2010; Director of Fund Administration, Columbia Management Advisors, LLC, January 2006-April 2010 | |
Paul B. Goucher
100 Park Avenue
New York, NY 10017
1968 | | Vice President since 4/11 and Assistant Secretary since 11/08 for RiverSource Funds and 5/10 for Nations Funds | | Vice President and Lead Chief Counsel, Ameriprise Financial, Inc. since November 2008 and January 2013, respectively (formerly, Chief Counsel, January 2010-January 2013 and Group Counsel from November 2008-January 2010); Director, Managing Director and General Counsel, J. & W. Seligman & Co. Incorporated, July 2008- November 2008 (previously, Managing Director and Associate General Counsel, January 2005-July 2008) | |
Michael E. DeFao
225 Franklin Street
Boston, MA 02110
1968 | | Vice President since 4/11 and Assistant Secretary since 5/10 for RiverSource Funds and 2011 for Nations Funds | | Vice President and Chief Counsel, Ameriprise Financial, Inc. since May 2010; Associate General Counsel, Bank of America, June 2005-April 2010 | |
Annual Report 2013
34
Columbia South Carolina Intermediate Municipal Bond Fund
Approval of Investment Management Services Agreement
Columbia Management Investment Advisers, LLC (Columbia Management or the Investment Manager), a wholly-owned subsidiary of Ameriprise Financial, Inc. (Ameriprise Financial), serves as the investment manager to Columbia South Carolina Intermediate Municipal Bond Fund (the Fund). Under an investment management services agreement (the IMS Agreement), Columbia Management provides investment advice and other services to the Fund and other funds distributed by Columbia Management Investment Distributors, Inc. (collectively, the Funds).
On an annual basis, the Fund's Board of Trustees (the Board), including the independent Board members (the Independent Trustees), considers renewal of the IMS Agreement. Columbia Management prepared detailed reports for the Board and its Contracts Committee in January, March and April 2013, including reports based on analyses of data provided by an independent organization and a comprehensive response to each item of information requested by independent legal counsel to the Independent Trustees (Independent Legal Counsel) in a letter to the Investment Manager, to assist the Board in making this determination. All of the materials presented in January, March and April were first supplied in draft form to designated representatives of the Independent Trustees, i.e., Independent Legal Counsel, the Chair of the Board and the Chair of the Contracts Committee, and the final materials (including proposed additional breakpoints in IMS fees for certain Funds) were revised to reflect discussion and subsequent requests made by the Contracts Committee. In addition, throughout the year, the Board (or its committees) regularly meets with portfolio management teams and senior management personnel, and reviews information prepared by Columbia Management addressing the services Columbia Management provides and Fund performance. Further, the Board retained an independent consulting firm (the Independent Consultant) to assist the Independent Trustees in their review of IMS fees, expense caps and Ameriprise Financial's profitability. The Board also accords particular weight to the work, deliberations and conclusions of the Contracts Committee, the Investment Review Committee and the Compliance Committee in determining whether to continue the IMS Agreement.
The Board, at its April 15-17, 2013 in-person Board meeting (the April Meeting), considered the renewal of the IMS Agreement for an additional one-year term. At the April Meeting, Independent Legal Counsel reviewed with the Independent Trustees various factors relevant to the Board's consideration of advisory agreements and the Board's legal responsibilities related to such consideration. Following an analysis and discussion of the factors identified below, the Board, including all of the Independent Trustees, approved the renewal of the IMS Agreement.
Nature, Extent and Quality of Services Provided by Columbia Management
The Independent Trustees analyzed various reports and presentations they had received detailing the services performed by Columbia Management, as well as its expertise, resources and capabilities. The Independent Trustees specifically considered many developments during the past year concerning the services provided by Columbia Management, including, in particular, the recent globalization initiative, which fosters increased worldwide investment support of global products, continued investment in upgrading technology (such as the implementation of new systems and hardware), the hiring of a Chief Interest Rate Strategist as part of Columbia Management's fixed income team and the addition of Columbia Management investment personnel to the Asset Allocation, Quantitative and Technology teams. The Independent Trustees noted the information they received concerning Columbia Management's ability to retain its key portfolio management personnel. In this regard, the Independent Trustees took into account their comprehensive discussions with Columbia Management's Chief Investment Officer (the CIO), observing the organizational depth of Columbia Management and the capabilities of its investment personnel. The Independent Trustees also recalled the information the CIO provided them identifying the strengths and areas for enhancement of each Columbia Management investment team, as well as the discussion with the CIO regarding the investment personnel talent being infused to enhance support for certain Funds. The Independent Trustees also observed the materials demonstrating the strength and depth of Columbia Management's equity and fixed income research departments.
In connection with the Board's evaluation of the overall package of services provided by Columbia Management, the Board also considered the quality of administrative services provided to the Fund by Columbia Management, recalling the information it received highlighting significant achievements in 2012 in the performance of administrative services (such as strong accounting performance measures, refined derivatives processing and enhancements to the electronic communications under the affiliated and unaffiliated service provider oversight program). In evaluating the quality of services provided under the IMS Agreement and the Fund's Administrative Service Agreement, the Independent Trustees
Annual Report 2013
35
Columbia South Carolina Intermediate Municipal Bond Fund
Approval of Investment Management Services Agreement (continued)
also took into account the organization and strength of the Fund's and its service providers' compliance programs. In addition, the Board also reviewed the financial condition of Columbia Management (and its affiliates) and each entity's ability to carry out its responsibilities under the IMS Agreement and the Fund's other services agreements with affiliates of Ameriprise Financial, observing the financial strength of Ameriprise Financial, with its solid balance sheet. The Board also discussed the acceptability of the terms of the IMS Agreement (including the relatively broad scope of services required to be performed by Columbia Management). The Board concluded that the services being performed under the IMS Agreement were of a reasonably high quality.
Based on the foregoing, and based on other information received (both oral and written, including the information on investment performance referenced below) and other considerations, the Board concluded that Columbia Management and its affiliates were in a position to continue to provide a high quality and level of services to the Fund.
Investment Performance
For purposes of evaluating the nature, extent and quality of services provided under the IMS Agreement, the Board carefully reviewed the investment performance of the Fund. In this regard, the Board considered detailed reports providing the results of analyses performed by an independent organization showing, for various periods, the performance of the Fund, the performance of a benchmark index, the percentage ranking of the Fund among its comparison group and the net assets of the Fund. The Board observed that the Fund's investment performance met expectations.
Comparative Fees, Costs of Services Provided and the Profits Realized by Columbia Management and its Affiliates from their Relationships with the Fund
The Board reviewed comparative fees and the costs of services to be provided under the IMS Agreement. The Board members considered detailed comparative information set forth in an annual report on fees and expenses, including, among other things, data (based on analyses conducted by an independent organization) showing a comparison of the Fund's expenses with median expenses paid by funds in its comparative peer universe, as well as data showing the Fund's contribution to Columbia Management's profitability.
The Board accorded particular weight to the notion that the level of fees should reflect a rational pricing model applied consistently across the various product lines in the Fund family, while assuring that the overall fees for each Fund (with few defined exceptions) are generally in line with the "pricing philosophy" (i.e., that the total expense ratio of the Fund is no higher than the median expense ratio of funds in the same comparison universe of the Fund). In this connection, the Board also considered the Independent Consultant's report that concluded that: (i) the Funds' standardized investment management fee rates, particularly in the context of the current competitive fee landscape, were within a reasonable range; and (ii) the Funds' expense cap philosophy of assuring that each Fund's total expense ratio is not above its peer universe median ratio is reasonable. The Board took into account that the Fund's total expense ratio (after considering proposed expense caps/waivers) approximated the peer universe's median expense ratio. Based on its review, the Board concluded that the Fund's management fee was fair and reasonable in light of the extent and quality of services that the Fund receives.
The Board also considered the expected profitability of Columbia Management and its affiliates in connection with Columbia Management providing investment management services to the Fund. In this regard, the Board referred to a detailed profitability report, discussing the profitability to Columbia Management and Ameriprise Financial from managing, operating and distributing the Funds. In this regard, the Board observed that 2012 profitability approximates 2011 profitability and that, as was the case in 2011, 2012 profitability remained generally in line with (and, in many cases, lower than) the reported profitability of other asset management firms. Further, the Board considered the Independent Consultant's report that concluded that Columbia Management's profitability, particularly in comparison to industry competitors, was reasonable and not excessive. It also took into account the indirect economic benefits flowing to Columbia Management or its affiliates in connection with managing or distributing the Funds, such as the enhanced ability to offer various other financial products to Ameriprise Financial customers, soft dollar benefits and overall reputational advantages. The Board noted that the fees paid by the Funds should permit the Investment Manager to offer competitive compensation to its personnel, make necessary investments in its business and earn an appropriate profit. The Board concluded that profitability levels were reasonable.
Annual Report 2013
36
Columbia South Carolina Intermediate Municipal Bond Fund
Approval of Investment Management Services Agreement (continued)
Economies of Scale to be Realized
The Board also considered the economies of scale that might be realized by Columbia Management as the Fund grows and took note of the extent to which Fund shareholders might also benefit from such growth. In this regard, the Independent Trustees took into account that IMS fees decline as Fund assets exceed various breakpoints, all of which have not been surpassed.
Based on the foregoing, the Board, including all of the Independent Trustees, concluded that the investment management service fees were fair and reasonable in light of the extent and quality of services provided. In reaching this conclusion, no single factor was determinative. On April 17, 2013, the Board, including all of the Independent Trustees, approved the renewal of the IMS Agreement.
Annual Report 2013
37
This page intentionally left blank.
Annual Report 2013
38
This page intentionally left blank.
Annual Report 2013
39
This page intentionally left blank.
Annual Report 2013
40
Columbia South Carolina Intermediate Municipal Bond Fund
Important Information About This Report
Each fund mails one shareholder report to each shareholder address. If you would like more than one report, please call shareholder services at 800.345.6611 and additional reports will be sent to you.
The policy of the Board is to vote the proxies of the companies in which each fund holds investments consistent with the procedures as stated in the Statement of Additional Information (SAI). You may obtain a copy of the SAI without charge by calling 800.345.6611; contacting your financial intermediary; visiting columbiamanagement.com; or searching the website of the Securities and Exchange Commission (SEC) at sec.gov. Information regarding how each fund voted proxies relating to portfolio securities is filed with the SEC by August 31 for the most recent 12-month period ending June 30 of that year, and is available without charge by visiting columbiamanagement.com; or searching the website of the SEC at sec.gov.
Each fund files a complete schedule of portfolio holdings with the SEC for the first and third quarters of each fiscal year on Form N-Q. Each fund's Form N-Q is available on the SEC's website at sec.gov and may be reviewed and copied at the SEC's Public Reference Room in Washington, D.C. Information on the operation of the Public Reference Room may be obtained by calling 800.SEC.0330. Each fund's complete schedule of portfolio holdings, as filed on Form N-Q, can also be obtained without charge, upon request, by calling 800.345.6611.
Annual Report 2013
41

Columbia South Carolina Intermediate Municipal Bond Fund
P.O. Box 8081
Boston, MA 02266-8081
columbiamanagement.com
This information is for use with concurrent or prior delivery of a fund prospectus. Please read and consider the investment objectives, risks, charges and expenses for any fund carefully before investing. For a prospectus which contains this and other important information about the Fund go to columbiamanagement.com. The Fund is distributed by Columbia Management Investment Distributors, Inc., member FINRA, and managed by Columbia Management Investment Advisers, LLC.
© 2013 Columbia Management Investment Advisers, LLC. All rights reserved.
ANN231_04_C01_(06/13)
Annual Report
April 30, 2013

Columbia Virginia Intermediate Municipal Bond Fund
Not FDIC insured • No bank guarantee • May lose value
Columbia Virginia Intermediate Municipal Bond Fund
 Dear Shareholders,
U.S. equities had a strong first quarter
Similar to 2012, equities once again were the best performing asset class in the first quarter of 2013. The S&P 500 Index reached an all-time closing high on the last trading day of the quarter and pushed through its October 2007 peak. Although global equities have performed well year-to-date, there is significant performance divergence among regions. In local currency terms, Japanese equities were the best performing developed market globally, and U.S. stocks outperformed most other global equity markets. European equities rose in the first quarter but trailed U.S. stocks and had a turbulent March, as investors were reminded of instability in the eurozone with news of a banking crisis in Cyprus.
Although all 10 sectors of the S&P 500 Index delivered positive returns, this was a rally led by defensive stocks such as those in health care, consumer staples and utilities. Materials and technology stocks were the weakest sectors.
High yield leads fixed income; most sectors flat to down
The fixed-income markets lagged equities with modest, single-digit returns coming from municipals and high-yield sectors in the United States. Most government and investment-grade credit sectors were roughly flat to down for the first quarter of 2013. Emerging market bonds were the biggest disappointment with single-digit losses.
Columbia Management to begin delivering summary prospectuses
Each Columbia fund is required to update its prospectus on an annual basis. Beginning with June 2013 prospectus updates, shareholders of Columbia retail mutual funds will start to receive a summary prospectus, rather than the full length (statutory) mutual fund prospectus they have received in the past.
Each fund's summary prospectus will include the following key information:
> Investment objective
> Fee and expense table
> Portfolio turnover rate information
> Principal investment strategies, principal risks and performance information
> Management information
> Purchase and sale information
> Tax information
> Financial intermediary compensation information
Each fund's statutory prospectus will contain additional information about the fund and its risks. Both the statutory and summary prospectus will be updated each year, and will be available at columbiamanagement.com. Shareholders may request a printed version of a statutory prospectus at no cost by calling 800.345.6611 or sending an email to serviceinquiries@columbiamanagement.com.
Stay on track with Columbia Management
Backed by more than 100 years of experience, Columbia Management is one of the nation's largest asset managers. At the heart of our success — and, most importantly, that of our investors — are highly talented industry professionals, brought together by a unique way of working. We are dedicated to helping you take advantage of today's opportunities and anticipate tomorrow's. We stay abreast of the latest investment trends and ideas, using our collective insight to evaluate events and transform them into solutions you can use.
Visit columbiamanagement.com for:
> The Columbia Management Perspectives blog, featuring timely posts by our investment teams
> Detailed up-to-date fund performance and portfolio information
> Economic analysis and market commentary
> Quarterly fund commentaries
> Columbia Management Investor, our award-winning quarterly newsletter for shareholders
Thank you for your continued support of the Columbia Funds. We look forward to serving your investment needs for many years to come.
Best Regards,

J. Kevin Connaughton
President, Columbia Funds
The S&P 500 Index, an unmanaged index, measures the performance of 500 large-capitalization U.S. stocks and is frequently used as a general measure of market performance. Indices are not available for investment, are not professionally managed and do not reflect sales charges, fees, brokerage commissions, taxes or other expenses of investing.
Investors should consider the investment objectives, risks, charges and expenses of a mutual fund carefully before investing. For a free prospectus, which contains this and other important information about a fund, visit columbiamanagement.com. The prospectus should be read carefully before investing.
Columbia Funds are distributed by Columbia Management Investment Distributors, Inc., member FINRA, and managed by Columbia Management Investment Advisers, LLC.
© 2013 Columbia Management Investment Advisers, LLC. All rights reserved.
Columbia Virginia Intermediate Municipal Bond Fund
Performance Overview | | | 2 | | |
Manager Discussion of Fund Performance | | | 4 | | |
Understanding Your Fund's Expenses | | | 6 | | |
Portfolio of Investments | | | 7 | | |
Statement of Assets and Liabilities | | | 15 | | |
Statement of Operations | | | 17 | | |
Statement of Changes in Net Assets | | | 18 | | |
Financial Highlights | | | 20 | | |
Notes to Financial Statements | | | 25 | | |
Report of Independent Registered
Public Accounting Firm | | | 30 | | |
Federal Income Tax Information | | | 31 | | |
Trustees and Officers | | | 32 | | |
Approval of Investment Management Services Agreement | | | 37 | | |
Important Information About This Report | | | 41 | | |
Fund Investment Manager
Columbia Management Investment
Advisers, LLC
225 Franklin Street
Boston, MA 02110
Fund Distributor
Columbia Management Investment
Distributors, Inc.
225 Franklin Street
Boston, MA 02110
Fund Transfer Agent
Columbia Management Investment
Services Corp.
P.O. Box 8081
Boston, MA 02266-8081
For more information about any of the funds, please visit columbiamanagement.com or call 800.345.6611. Customer Service Representatives are available to answer your questions Monday through Friday from 8 a.m. to 8 p.m. Eastern time.
The views expressed in this report reflect the current views of the respective parties. These views are not guarantees of future performance and involve certain risks, uncertainties and assumptions that are difficult to predict, so actual outcomes and results may differ significantly from the views expressed. These views are subject to change at any time based upon economic, market or other conditions and the respective parties disclaim any responsibility to update such views. These views may not be relied on as investment advice and, because investment decisions for a Columbia Fund are based on numerous factors, may not be relied on as an indication of trading intent on behalf of any particular Columbia Fund. References to specific securities should not be construed as a recommendation or investment advice.
Columbia Virginia Intermediate Municipal Bond Fund
Performance Summary
> Columbia Virginia Intermediate Municipal Bond Fund (the Fund) Class A shares returned 3.49% excluding sales charges for the 12-month period that ended April 30, 2013.
> The Fund underperformed its benchmark, the Barclays 3-15 Year Blend Municipal Bond Index, which returned 4.35% for the same 12-month period.
> The Fund had more exposure than the index to bonds in the two highest quality categories. This hampered performance as lower quality securities were the best performers during the fiscal year.
Average Annual Total Returns (%) (for period ended April 30, 2013)
| | Inception | | 1 Year | | 5 Years | | 10 Years | |
Class A | | 12/05/89 | | | | | | | |
Excluding sales charges | | | | | 3.49 | | | | 4.82 | | | | 3.78 | | |
Including sales charges | | | | | 0.09 | | | | 4.12 | | | | 3.44 | | |
Class B | | 06/07/93 | | | | | | | |
Excluding sales charges | | | | | 2.62 | | | | 4.02 | | | | 3.01 | | |
Including sales charges | | | | | -0.38 | | | | 4.02 | | | | 3.01 | | |
Class C | | 06/17/92 | | | | | | | |
Excluding sales charges | | | | | 2.63 | | | | 4.04 | | | | 3.01 | | |
Including sales charges | | | | | 1.63 | | | | 4.04 | | | | 3.01 | | |
Class R4* | | 03/19/13 | | | 3.66 | | | | 5.06 | | | | 4.03 | | |
Class Z | | 09/20/89 | | | 3.75 | | | | 5.08 | | | | 4.04 | | |
Barclays 3-15 Year Blend Municipal Bond Index | | | | | 4.35 | | | | 5.91 | | | | 4.85 | | |
Returns for Class A are shown with and without the maximum initial sales charge of 3.25%. Returns for Class B are shown with and without the applicable contingent deferred sales charge (CDSC) of 3.00% in the first year, declining to 1.00% in the fourth year and eliminated thereafter. Returns for Class C are shown with and without the 1.00% CDSC for the first year only. The Fund's other classes are not subject to sales charges and have limited eligibility. Please see the Fund's prospectuses for details. Performance for different share classes will vary based on differences in sales charges and fees associated with each class. All results shown assume reinvestment of distributions during the period. Returns do not reflect the deduction of taxes that a shareholder may pay on Fund distributions or on the redemption of Fund shares. Performance results reflect the effect of any fee waivers or reimbursements of Fund expenses by Columbia Management Investment Advisers, LLC and/or any of its affiliates. Absent these fee waivers or expense reimbursement arrangements, performance results would have been lower.
The performance information shown represents past performance and is not a guarantee of future results. The investment return and principal value of your investment will fluctuate so that your shares, when redeemed, may be worth more or less than their original cost. Current performance may be lower or higher than the performance information shown. You may obtain performance information current to the most recent month-end by contacting your financial intermediary, visiting columbiamanagement.com or calling 800.345.6611.
*The returns shown for periods prior to the share class inception date (including returns for the Life of the Fund, if shown, which are since Fund inception) include the returns of the Fund's oldest share class. These returns are adjusted to reflect any higher class-related operating expenses of the newer share classes, as applicable. Please visit columbiamanagement.com/mutual-funds/appended-performance for more information.
The Barclays 3-15 Year Blend Municipal Bond Index is an unmanaged index that tracks the performance of municipal bonds issued after December 31, 1990, with remaining maturities between 2 and 17 years and at least $7 million in principal amount outstanding.
Indices are not available for investment, are not professionally managed and do not reflect sales charges, fees, brokerage commissions, taxes or other expenses of investing. Securities in the Fund may not match those in an index.
Annual Report 2013
2
Columbia Virginia Intermediate Municipal Bond Fund
Performance Overview (continued)
Performance of a Hypothetical $10,000 Investment (May 1, 2003 – April 30, 2013)
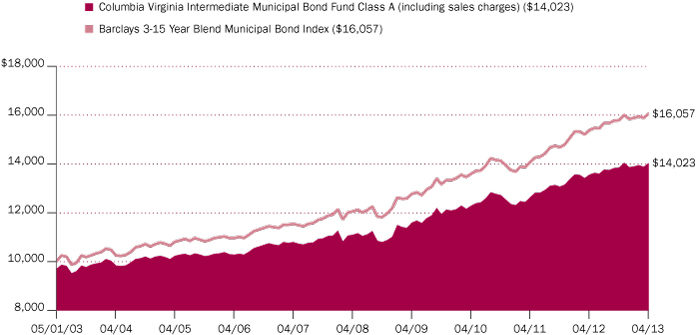
The chart above shows the change in value of a hypothetical $10,000 investment in Class A shares of Columbia Virginia Intermediate Municipal Bond Fund during the stated time period, and does not reflect the deduction of taxes that a shareholder may pay on Fund distributions or on the redemption of Fund shares.
Annual Report 2013
3
Columbia Virginia Intermediate Municipal Bond Fund
Manager Discussion of Fund Performance
For the 12-month period that ended April 30, 2013, the Fund's Class A shares returned 3.49% excluding sales charges. The Fund underperformed its benchmark, the Barclays 3-15 Year Blend Municipal Bond Index, which returned 4.35% for the same 12-month period. The Fund had more exposure than the index to bonds in the two highest quality categories. This hampered performance, as lower quality securities were the best performers during the fiscal year.
U.S. Economy: Growth in the Slow Lane
Europe's general economic woes, a financial crisis in Cyprus and U.S. struggles to avoid a fiscal cliff of tax increases and various spending cuts (commonly referred to as the sequester) weighed on the global economy throughout the 12-month period ended April 30, 2013. Late in the period, the sequester clouded consumer confidence in the United States, even though it has had little material impact on the economy to date. However, a decrease in the U.S. unemployment rate early in 2013, steady manufacturing activity and a rebound in the housing market are encouraging signs that growth has broadened in recent months. Pent-up demand, low mortgage rates and an improving labor market have lifted home sales. Even so, there has been no real improvement in the overall pace of economic growth since the current cycle of recovery began in 2009. Household income growth is practically nonexistent, and household spending has come under pressure after the expiration of the payroll tax cut. Against this backdrop, U.S. investors bid prices higher on stocks and other volatile assets as central banks continued to pour liquidity into key markets.
Municipal Market Generates Solid Returns
The U.S. municipal bond market delivered modest, but solid, returns for the 12-month period. Yields fell across all maturities, rallying strongly after the November presidential election. The market sold off in December, but the retreat was short lived, as weaker economic numbers early in 2013 sent fixed-income investors back to the relative safety of the municipal market. At year end, municipal yields were eight, 18 and 25 basis points lower for five-, 10- and 15-year maturities compared to one year ago. Higher quality bonds generally underperformed lower quality bonds. Pre-refunded bonds, which are higher quality and generally shorter in maturity, were the weakest sector among municipals. A pre-refunded bond is created when an issuer refinances existing debt at a lower rate. Hospital bonds were generally the strongest performers. Local general obligation bonds outperformed state general obligation bonds by a small margin. For the second consecutive year, rating agencies issued more downgrades than upgrades in the overall municipal market, as a lackluster economy continued to pressure issuers.
Higher Quality Orientation Limited Results
Faced with a limited supply of municipal bonds in Virginia, we took steps where we could to bolster the Fund's return. We extended the Fund's average maturity and duration, a measure of interest rate sensitivity, early in the period in an attempt to generate additional yield. Exposure to BBB-rated bonds aided returns, but the combined effect was not enough to offset the impact of the Fund's allocation to the very highest rated bonds, which underperformed during the period. Local general obligation bonds (GOs), which are mostly rated AA or better, were a drag on performance. They account for over 20% of the Fund's
Portfolio Management
Brian McGreevy
Annual Report 2013
4
Columbia Virginia Intermediate Municipal Bond Fund
Manager Discussion of Fund Performance (continued)
assets. We did well to limit exposure to Virginia state GOs, which are rated AAA and trade with very little, if any, extra yield.
Hospital and transportation issues were the strongest performers for the Fund. Several transportation issues are toll roads or airports and carry lower ratings, which added to income as well as to returns. Special tax bonds that were longer than average in duration also added to performance.
During the period, we decreased the Fund's exposure to bonds in the zero to three-year maturity range and added bonds that were 10 years or longer, including several toll road issues, a few local GOs and several hospital issues. In addition, we were able to increase the Fund's exposure to non-rated issuers which added yield and, in our view, represented good value. We also added BBB rated bonds from the U.S. Virgin Islands, which are also tax exempt in Virginia. We believed these bonds offered better relative value than Puerto Rico issues, to which we have reduced exposure because of ongoing weakness within the area. Puerto Rico was by far the weakest state index over the 12-month period.
Sequester a Drag on Expansion in Virginia
The Virginia economy is expanding, albeit at a below-average pace as federal austerity weighs on growth and sequestration cuts will have a significant impact on the Commonwealth's defense industry, concentrated in Northern Virginia and Virginia Beach, and procurement spending. However, an investment in transportation maintenance and construction are expected to have a positive impact on the economy over the longer term. The increased spending on transportation is expected to be fully offset by higher tax revenues; reduced congestion is another positive result of this effort. Despite its dependence on the federal government, Virginia benefits from being a desirable place to do business, which is a positive factor for job growth.
Looking Ahead
In this environment, we expect to emphasize the quality, sector and maturity profile of the Fund versus its benchmarks, and we expect to seek out issues rated A and BBB across sectors that mature in 10-14 years as, in our opinion, they are currently attractive. With a seasoned staff of credit professionals, we believe we are currently well positioned to discover value opportunities that offer incremental yield and appropriate fundamentals among Virginia municipal bonds.
Quality Breakdown (%)
(at April 30, 2013) | |
AAA rating | | | 16.4 | | |
AA rating | | | 53.0 | | |
A rating | | | 14.9 | | |
BBB rating | | | 12.1 | | |
Not rated | | | 3.6 | | |
Total | | | 100.0 | | |
Percentages indicated are based upon total fixed income securities (excluding Money Market Funds).
Bond ratings apply to the underlying holdings of the Fund and not the Fund itself and are divided into categories ranging from AAA (highest) to D (lowest), and are subject to change. The ratings shown are determined by using the middle rating of Moody's, S&P, and Fitch after dropping the highest and lowest available ratings. When a rating from only two agencies is available, the lower rating is used. When a rating from only one agency is available, that rating is used. When a bond is not rated by any of these agencies, it is designated as Not rated. Credit ratings are subjective opinions and not statements of fact.
Annual Report 2013
5
Columbia Virginia Intermediate Municipal Bond Fund
Understanding Your Fund's Expenses
(Unaudited)
As an investor, you incur two types of costs. There are transaction costs, which generally include sales charges on purchases and may include redemption fees. There are also ongoing costs, which generally include management fees, distribution and service (Rule 12b-1) fees, and other fund expenses. The following information is intended to help you understand your ongoing costs (in dollars) of investing in the Fund and to help you compare these costs with the ongoing costs of investing in other mutual funds.
Analyzing Your Fund's Expenses
To illustrate these ongoing costs, we have provided examples and calculated the expenses paid by investors in each share class of the Fund during the period. The actual and hypothetical information in the table is based on an initial investment of $1,000 at the beginning of the period indicated and held for the entire period. Expense information is calculated two ways and each method provides you with different information. The amount listed in the "Actual" column is calculated using the Fund's actual operating expenses and total return for the period. You may use the Actual information, together with the amount invested, to estimate the expenses that you paid over the period. Simply divide your account value by $1,000 (for example, an $8,600 account value divided by $1,000 = 8.6), then multiply the results by the expenses paid during the period under the Actual column. The amount listed in the "Hypothetical" column assumes a 5% annual rate of return before expenses (which is not the Fund's actual return) and then applies the Fund's actual expense ratio for the period to the hypothetical return. You should not use the hypothetical account values and expenses to estimate either your actual account balance at the end of the period or the expenses you paid during the period. See "Compare With Other Funds" below for details on how to use the hypothetical data.
Compare With Other Funds
Since all mutual funds are required to include the same hypothetical calculations about expenses in shareholder reports, you can use this information to compare the ongoing cost of investing in the Fund with other funds. To do so, compare the hypothetical example with the 5% hypothetical examples that appear in the shareholder reports of other funds. As you compare hypothetical examples of other funds, it is important to note that hypothetical examples are meant to highlight the ongoing costs of investing in a fund only and do not reflect any transaction costs, such as sales charges, or redemption or exchange fees. Therefore, the hypothetical calculations are useful in comparing ongoing costs only, and will not help you determine the relative total costs of owning different funds. If transaction costs were included in these calculations, your costs would be higher.
November 1, 2012 – April 30, 2013
| | Account Value at the Beginning
of the Period ($) | | Account Value at the End of the
Period ($) | | Expenses Paid During the
Period ($) | | Fund's Annualized
Expense Ratio (%) | |
| | Actual | | Hypothetical | | Actual | | Hypothetical | | Actual | | Hypothetical | | Actual | |
Class A | | | 1,000.00 | | | | 1,000.00 | | | | 1,013.00 | | | | 1,020.78 | | | | 4.04 | | | | 4.06 | | | | 0.81 | | |
Class B | | | 1,000.00 | | | | 1,000.00 | | | | 1,009.20 | | | | 1,017.06 | | | | 7.77 | | | | 7.80 | | | | 1.56 | | |
Class C | | | 1,000.00 | | | | 1,000.00 | | | | 1,009.20 | | | | 1,017.06 | | | | 7.77 | | | | 7.80 | | | | 1.56 | | |
Class R4 | | | 1,000.00 | | | | 1,000.00 | | | | 1,011.20 | * | | | 1,022.22 | | | | 0.59 | * | | | 2.61 | | | | 0.52 | * | |
Class Z | | | 1,000.00 | | | | 1,000.00 | | | | 1,014.20 | | | | 1,022.02 | | | | 2.80 | | | | 2.81 | | | | 0.56 | | |
*For the period March 19, 2013 through April 30, 2013. Class R4 shares commenced operations on March 19, 2013.
Expenses paid during the period are equal to the annualized expense ratio for each class as indicated above, multiplied by the average account value over the period and then multiplied by the number of days in the Fund's most recent fiscal half year and divided by 365.
Expenses do not include fees and expenses incurred indirectly by the Fund from the underlying funds in which the Fund may invest (also referred to as "acquired funds"), including affiliated and non-affiliated pooled investment vehicles (including mutual funds and exchange-traded funds).
Had Columbia Management Investment Advisers, LLC and/or certain of its affiliates not waived/reimbursed certain fees and expenses, account value at the end of the period would have been reduced.
Annual Report 2013
6
Columbia Virginia Intermediate Municipal Bond Fund
Portfolio of Investments
April 30, 2013
(Percentages represent value of investments compared to net assets)
Municipal Bonds 97.9%
Issue
Description | | Coupon
Rate | | Principal
Amount ($) | | Value ($) | |
Airport 4.2% | |
Metropolitan Washington Airports Authority
Refunding Revenue Bonds
Series 2010F-1
10/01/21 | | | 5.000 | % | | | 1,000,000 | | | | 1,241,450 | | |
Revenue Bonds
Series 2009B
10/01/21 | | | 5.000 | % | | | 3,000,000 | | | | 3,630,450 | | |
Series 2009C
10/01/23 | | | 5.000 | % | | | 3,000,000 | | | | 3,545,640 | | |
Series 2010A
10/01/23 | | | 5.000 | % | | | 2,475,000 | | | | 3,008,808 | | |
10/01/27 | | | 5.000 | % | | | 1,515,000 | | | | 1,795,154 | | |
Norfolk Airport Authority
Refunding Revenue Bonds
Series 2011 (AGM)
07/01/24 | | | 5.000 | % | | | 1,000,000 | | | | 1,162,400 | | |
Total | | | | | | | 14,383,902 | | |
Higher Education 5.2% | |
Amherst Industrial Development Authority
Refunding Revenue Bonds
Educational Facilities Sweet Briar Institute
Series 2006
09/01/26 | | | 5.000 | % | | | 1,000,000 | | | | 1,052,920 | | |
Lexington Industrial Development Authority
Revenue Bonds
VMI Development Board, Inc. Project
Series 2006A(a)
12/01/20 | | | 5.000 | % | | | 1,400,000 | | | | 1,767,626 | | |
Virginia College Building Authority
Refunding Revenue Bonds
University of Richmond Project
Series 2011A
03/01/22 | | | 5.000 | % | | | 1,245,000 | | | | 1,548,357 | | |
Series 2011B
03/01/21 | | | 5.000 | % | | | 2,250,000 | | | | 2,822,040 | | |
Revenue Bonds
Liberty University Projects
Series 2010
03/01/19 | | | 5.000 | % | | | 1,000,000 | | | | 1,212,550 | | |
03/01/22 | | | 5.000 | % | | | 1,455,000 | | | | 1,729,544 | | |
03/01/23 | | | 5.000 | % | | | 2,000,000 | | | | 2,344,840 | | |
Roanoke College
Series 2007
04/01/23 | | | 5.000 | % | | | 1,000,000 | | | | 1,142,820 | | |
Washington & Lee University Project
Series 1998 (NPFGC)
01/01/26 | | | 5.250 | % | | | 3,115,000 | | | | 3,975,238 | | |
Total | | | | | | | 17,595,935 | | |
Municipal Bonds (continued)
Issue
Description | | Coupon
Rate | | Principal
Amount ($) | | Value ($) | |
Hospital 9.3% | |
Augusta County Industrial Development Authority
Refunding Revenue Bonds
Augusta Health Care, Inc.
Series 2003
09/01/19 | | | 5.250 | % | | | 905,000 | | | | 1,089,140 | | |
Chesapeake Hospital Authority
Refunding Revenue Bonds
Chesapeake General Hospital
Series 2004A
07/01/18 | | | 5.250 | % | | | 1,500,000 | | | | 1,597,515 | | |
Fairfax County Industrial Development Authority
Refunding Revenue Bonds
Inova Health System Project
Series 1993
08/15/19 | | | 5.250 | % | | | 1,000,000 | | | | 1,178,280 | | |
Series 1993I (NPFGC)
08/15/19 | | | 5.250 | % | | | 1,000,000 | | | | 1,147,880 | | |
Revenue Bonds
Health Care-Inova Health System
Series 2012-D
05/15/29 | | | 4.000 | % | | | 2,500,000 | | | | 2,676,200 | | |
Inova Health System
Series 2009C
05/15/25 | | | 5.000 | % | | | 1,000,000 | | | | 1,144,960 | | |
Fredericksburg Economic Development Authority
Refunding Revenue Bonds
MediCorp Health Systems Obligation
Series 2007
06/15/18 | | | 5.250 | % | | | 1,000,000 | | | | 1,158,890 | | |
06/15/20 | | | 5.250 | % | | | 6,495,000 | | | | 7,820,500 | | |
Norfolk Economic Development Authority
Refunding Revenue Bonds
Sentara Healthcare
Series 2012B
11/01/27 | | | 5.000 | % | | | 1,735,000 | | | | 2,057,381 | | |
Prince William County Industrial Development Authority
Refunding Revenue Bonds
Novant Health Obligation Group
Series 2013B(b)
11/01/25 | | | 5.000 | % | | | 1,000,000 | | | | 1,181,830 | | |
Roanoke Economic Development Authority
Refunding Revenue Bonds
Carolina Clinic Obligation
Series 2010
07/01/25 | | | 5.000 | % | | | 3,500,000 | | | | 3,960,460 | | |
Revenue Bonds
Carilion Clinic Obligation Group
Series 2012
07/01/22 | | | 5.000 | % | | | 2,000,000 | | | | 2,401,980 | | |
07/01/23 | | | 5.000 | % | | | 1,000,000 | | | | 1,191,060 | | |
The accompanying Notes to Financial Statements are an integral part of this statement.
Annual Report 2013
7
Columbia Virginia Intermediate Municipal Bond Fund
Portfolio of Investments (continued)
April 30, 2013
Municipal Bonds (continued)
Issue
Description | | Coupon
Rate | | Principal
Amount ($) | | Value ($) | |
Virginia Small Business Financing Authority
Refunding Revenue Bonds
Sentara Healthcare
Series 2010
11/01/16 | | | 4.000 | % | | | 1,000,000 | | | | 1,109,080 | | |
Revenue Bonds
Wellmont Health System Project
Series 2007A
09/01/22 | | | 5.125 | % | | | 710,000 | | | | 769,086 | | |
Winchester Industrial Development Authority
Revenue Bonds
Valley Health System
Series 2007
01/01/26 | | | 5.000 | % | | | 1,250,000 | | | | 1,383,875 | | |
Total | | | | | | | 31,868,117 | | |
Investor Owned 1.1% | |
Chesterfield County Economic Development Authority
Refunding Revenue Bonds
Virginia Electric & Power
Series 2009A
05/01/23 | | | 5.000 | % | | | 2,000,000 | | | | 2,325,960 | | |
York County Economic Development Authority
Refunding Revenue Bonds
Virginia Electric & Power
Series 2009A(a)
05/01/33 | | | 4.050 | % | | | 1,300,000 | | | | 1,338,714 | | |
Total | | | | | | | 3,664,674 | | |
Local Appropriation 7.1% | |
Appomattox County Economic Development Authority
Refunding Revenue Bonds
Series 2010
05/01/22 | | | 5.000 | % | | | 1,490,000 | | | | 1,772,564 | | |
Arlington County Industrial Development Authority
Revenue Bonds
Virginia Capital Project
Series 2004
08/01/17 | | | 5.000 | % | | | 1,205,000 | | | | 1,276,023 | | |
08/01/18 | | | 5.000 | % | | | 1,205,000 | | | | 1,275,709 | | |
Bedford County Economic Development Authority
Revenue Bonds
Public Facilities Project
Series 2006 (NPFGC)
05/01/15 | | | 5.000 | % | | | 1,230,000 | | | | 1,334,759 | | |
Fairfax County Economic Development Authority
Revenue Bonds
Government Center Properties
Series 2003F (AMBAC)
05/15/15 | | | 5.000 | % | | | 5,000,000 | | | | 5,454,650 | | |
School Board Center Administration Building Project I
Series 2005A
04/01/19 | | | 5.000 | % | | | 1,380,000 | | | | 1,498,487 | | |
Municipal Bonds (continued)
Issue
Description | | Coupon
Rate | | Principal
Amount ($) | | Value ($) | |
Six Public Facilities Projects
Series 2010
04/01/24 | | | 4.000 | % | | | 1,340,000 | | | | 1,479,239 | | |
Henrico County Economic Development Authority
Refunding Revenue Bonds
Series 2009B
08/01/21 | | | 4.500 | % | | | 1,770,000 | | | | 2,092,423 | | |
James City County Economic Development Authority
Revenue Bonds
Public Facilities Projects
Series 2006 (AGM)
06/15/23 | | | 5.000 | % | | | 2,000,000 | | | | 2,316,800 | | |
Montgomery County Industrial Development Authority
Revenue Bonds
Public Projects
Series 2008
02/01/29 | | | 5.000 | % | | | 1,000,000 | | | | 1,097,690 | | |
New Kent County Economic Development Authority
Revenue Bonds
School & Governmental Projects
Series 2006 (AGM)
02/01/15 | | | 5.000 | % | | | 1,000,000 | | | | 1,077,350 | | |
02/01/21 | | | 5.000 | % | | | 2,075,000 | | | | 2,366,870 | | |
Prince William County Industrial Development Authority
Refunding Revenue Bonds
ATCC Project
Series 2005
02/01/17 | | | 5.250 | % | | | 1,115,000 | | | | 1,303,914 | | |
Total | | | | | | | 24,346,478 | | |
Local General Obligation 20.2% | |
City of Colonial Heights
Unlimited General Obligation Refunding & Public
Improvement Bonds
Series 2012
06/01/21 | | | 4.000 | % | | | 1,025,000 | | | | 1,214,461 | | |
City of Hampton
Limited General Obligation Refunding & Public
Improvement Bonds
Series 2010A
01/15/19 | | | 4.000 | % | | | 2,000,000 | | | | 2,337,380 | | |
City of Lynchburg
Unlimited General Obligation Public Improvement Bonds
Series 2009A
08/01/20 | | | 5.000 | % | | | 525,000 | | | | 646,123 | | |
08/01/21 | | | 5.000 | % | | | 530,000 | | | | 644,491 | | |
City of Manassas Park
Unlimited General Obligation Refunding Bonds
Series 2008 (AGM)
01/01/22 | | | 5.000 | % | | | 1,205,000 | | | | 1,397,438 | | |
The accompanying Notes to Financial Statements are an integral part of this statement.
Annual Report 2013
8
Columbia Virginia Intermediate Municipal Bond Fund
Portfolio of Investments (continued)
April 30, 2013
Municipal Bonds (continued)
Issue
Description | | Coupon
Rate | | Principal
Amount ($) | | Value ($) | |
City of Newport News
Unlimited General Obligation Improvement Bonds
Series 2011A
07/01/23 | | | 5.000 | % | | | 1,380,000 | | | | 1,670,600 | | |
Unlimited General Obligation Refunding Bonds
Improvement-Water
Series 2007B
07/01/20 | | | 5.250 | % | | | 2,000,000 | | | | 2,542,260 | | |
Series 2006B
02/01/18 | | | 5.250 | % | | | 3,030,000 | | | | 3,647,817 | | |
City of Norfolk
Unlimited General Obligation Bonds
Capital Improvement
Series 2012C
10/01/28 | | | 5.000 | % | | | 3,000,000 | | | | 3,535,770 | | |
Unlimited General Obligation Refunding Bonds
Capital Improvement
Series 2005 (NPFGC)
03/01/15 | | | 5.000 | % | | | 4,000,000 | | | | 4,339,600 | | |
City of Portsmouth
Unlimited General Obligation Refunding Bonds
Public Utilities
Series 2012A
07/15/21 | | | 5.000 | % | | | 3,000,000 | | | | 3,782,910 | | |
Series 2003 (AGM)
07/01/17 | | | 5.000 | % | | | 2,035,000 | | | | 2,146,559 | | |
07/01/19 | | | 5.000 | % | | | 1,895,000 | | | | 1,998,429 | | |
Series 2006A (NPFGC)
07/01/16 | | | 5.000 | % | | | 660,000 | | | | 751,476 | | |
City of Richmond
Unlimited General Obligation Bonds
Public Improvement
Series 2012A
03/01/29 | | | 5.000 | % | | | 4,510,000 | | | | 5,363,382 | | |
Unlimited General Obligation Public Improvement Bonds
Series 2010D
07/15/22 | | | 5.000 | % | | | 575,000 | | | | 714,639 | | |
07/15/24 | | | 5.000 | % | | | 1,000,000 | | | | 1,238,990 | | |
Unlimited General Obligation Refunding Public
Improvement Bonds
Series 2005A (AGM)
07/15/15 | | | 5.000 | % | | | 5,340,000 | | | | 5,880,355 | | |
City of Virginia Beach
Unlimited General Obligation Refunding & Public
Improvement Bonds
Series 2004B
05/01/17 | | | 5.000 | % | | | 1,000,000 | | | | 1,151,050 | | |
County of Arlington
Unlimited General Obligation Bonds
Series 2012C
08/15/27 | | | 4.000 | % | | | 3,000,000 | | | | 3,376,350 | | |
Unlimited General Obligation Refunding Bonds
Public Improvement
Series 2006
08/01/17 | | | 5.000 | % | | | 2,400,000 | | | | 2,742,144 | | |
Municipal Bonds (continued)
Issue
Description | | Coupon
Rate | | Principal
Amount ($) | | Value ($) | |
Series 2012A
08/01/22 | | | 5.000 | % | | | 3,000,000 | | | | 3,882,930 | | |
County of Fairfax
Unlimited General Obligation Refunding Bonds
Public Improvement
Series 2011A
04/01/24 | | | 4.000 | % | | | 2,000,000 | | | | 2,313,400 | | |
County of Fauquier
Unlimited General Obligation Refunding Bonds
School
Series 2012
07/15/21 | | | 4.000 | % | | | 1,000,000 | | | | 1,186,020 | | |
County of Pittsylvania
Unlimited General Obligation Bonds
Series 2008B
02/01/23 | | | 5.500 | % | | | 1,030,000 | | | | 1,224,526 | | |
County of Prince William
Unlimited General Obligation Refunding & Public
Improvements Bonds
Series 2012A
08/01/21 | | | 4.000 | % | | | 2,815,000 | | | | 3,385,572 | | |
County of Smyth
Unlimited General Obligation Bonds
Public Improvement
Series 2011A
11/01/31 | | | 5.000 | % | | | 4,000,000 | | | | 4,635,520 | | |
Town of Leesburg
Unlimited General Obligation Refunding Bonds
Series 2006B
09/15/17 | | | 5.000 | % | | | 1,145,000 | | | | 1,352,165 | | |
Total | | | | | | | 69,102,357 | | |
Other Bond Issue 2.1% | |
City of Norfolk
Refunding Revenue Bonds
Series 2005A (NPFGC)
02/01/21 | | | 5.000 | % | | | 5,170,000 | | | | 5,373,646 | | |
Virginia Beach Development Authority
Revenue Bonds
Series 2010C
08/01/23 | | | 5.000 | % | | | 1,380,000 | | | | 1,661,451 | | |
Total | | | | | | | 7,035,097 | | |
Other Industrial Development Bond 0.6% | |
Peninsula Ports Authority
Refunding Revenue Bonds
Dominion Term Association Project
Series 2003(a)
10/01/33 | | | 2.375 | % | | | 2,000,000 | | | | 2,049,340 | | |
The accompanying Notes to Financial Statements are an integral part of this statement.
Annual Report 2013
9
Columbia Virginia Intermediate Municipal Bond Fund
Portfolio of Investments (continued)
April 30, 2013
Municipal Bonds (continued)
Issue
Description | | Coupon
Rate | | Principal
Amount ($) | | Value ($) | |
Pool/Bond Bank 15.6% | |
Virginia Public School Authority
Refunding Revenue Bonds
School Financing
Series 2004C
08/01/16 | | | 5.000 | % | | | 7,425,000 | | | | 8,491,230 | | |
Series 2009C
08/01/25 | | | 4.000 | % | | | 2,560,000 | | | | 2,816,230 | | |
Virginia Resources Authority
Refunding Revenue Bonds
Revolving Fund
Series 2011A
08/01/24 | | | 5.000 | % | | | 1,395,000 | | | | 1,713,674 | | |
Subordinated State Revolving Fund
Series 2005
10/01/19 | | | 5.500 | % | | | 5,180,000 | | | | 6,599,942 | | |
10/01/20 | | | 5.500 | % | | | 3,500,000 | | | | 4,547,935 | | |
10/01/21 | | | 5.500 | % | | | 6,475,000 | | | | 8,513,330 | | |
Revenue Bonds
Pooled Financing
Series 2009B
11/01/18 | | | 4.000 | % | | | 4,000,000 | | | | 4,665,000 | | |
Pooled Moral Obligation
Series 2009B
11/01/18 | | | 4.000 | % | | | 1,000,000 | | | | 1,159,250 | | |
State Moral Obligation - Virginia Pooled
Series 2012
11/01/22 | | | 4.000 | % | | | 2,040,000 | | | | 2,412,769 | | |
11/01/25 | | | 5.000 | % | | | 2,795,000 | | | | 3,453,782 | | |
State Revolving Fund
Series 2009
10/01/17 | | | 5.000 | % | | | 1,380,000 | | | | 1,638,446 | | |
Subordinated State Revolving Fund
Series 2008
10/01/29 | | | 5.000 | % | | | 5,000,000 | | | | 5,795,250 | | |
Unrefunded Revenue Bonds
Senior Series 2005-VA
11/01/18 | | | 5.000 | % | | | 540,000 | | | | 601,268 | | |
Subordinated Series 2003-VA
11/01/19 | | | 5.000 | % | | | 865,000 | | | | 885,388 | | |
Total | | | | | | | 53,293,494 | | |
Ports 0.4% | |
Virginia Port Authority
Revenue Bonds
Series 2003 (NPFGC) AMT(c)
07/01/15 | | | 5.125 | % | | | 1,430,000 | | | | 1,455,783 | | |
Refunded/Escrowed 5.8% | |
City of Hampton
Prerefunded 04/01/15 Unlimited General Obligation
Public Improvement Bonds
Series 2005A (NPFGC/FGIC)
04/01/18 | | | 5.000 | % | | | 1,500,000 | | | | 1,633,470 | | |
Municipal Bonds (continued)
Issue
Description | | Coupon
Rate | | Principal
Amount ($) | | Value ($) | |
City of Portsmouth
Unlimited General Obligation Bonds
Series 2006 Escrowed to Maturity (NPFGC)
07/01/16 | | | 5.000 | % | | | 340,000 | | | | 387,933 | | |
County of Arlington
Prerefunded 08/01/16 Unlimited General Obligation
Public Improvement Bonds
Series 2006
08/01/17 | | | 5.000 | % | | | 1,600,000 | | | | 1,831,264 | | |
County of Henrico
Prerefunded 12/01/18 Unlimited General Obligation
Public Improvement Bonds
Series 2008A
12/01/21 | | | 5.000 | % | | | 1,000,000 | | | | 1,232,120 | | |
County of Prince William
Certificate of Participation
Prince William County Facilities
Series 2006A (AMBAC)
09/01/17 | | | 5.000 | % | | | 800,000 | | | | 918,472 | | |
09/01/21 | | | 5.000 | % | | | 1,625,000 | | | | 1,865,646 | | |
Fairfax County Economic Development Authority
Prerefunded 01/15/15 Revenue Bonds
Fairfax Public Improvement Projects
Series 2005
01/15/24 | | | 5.000 | % | | | 2,315,000 | | | | 2,496,427 | | |
Newport News Economic Development Authority
Prerefunded 01/15/16 Revenue Bonds
Series 2005A
01/15/23 | | | 5.250 | % | | | 1,510,000 | | | | 1,704,277 | | |
Richmond Metropolitan Authority
Refunding Revenue Bonds
Series 1998 Escrowed to Maturity (NPFGC/FGIC)
07/15/17 | | | 5.250 | % | | | 530,000 | | | | 592,625 | | |
Tobacco Settlement Financing Corp.
Prerefunded 06/01/15 Asset-Backed Revenue Bonds
Series 2005
06/01/26 | | | 5.500 | % | | | 2,000,000 | | | | 2,125,660 | | |
Virginia Beach Development Authority
Prerefunded 05/01/15 Revenue Bonds
Series 2005A
05/01/21 | | | 5.000 | % | | | 4,000,000 | | | | 4,370,880 | | |
Virginia Resources Authority
Prerefunded 11/01/13 Revenue Bonds
Subordinated Series 2003-VA
11/01/19 | | | 5.000 | % | | | 125,000 | | | | 127,947 | | |
11/01/19 | | | 5.000 | % | | | 110,000 | | | | 112,594 | | |
Prerefunded 11/01/15 Revenue Bonds
Senior Series 2005-VA
11/01/18 | | | 5.000 | % | | | 490,000 | | | | 545,380 | | |
Total | | | | | | | 19,944,695 | | |
The accompanying Notes to Financial Statements are an integral part of this statement.
Annual Report 2013
10
Columbia Virginia Intermediate Municipal Bond Fund
Portfolio of Investments (continued)
April 30, 2013
Municipal Bonds (continued)
Issue
Description | | Coupon
Rate | | Principal
Amount ($) | | Value ($) | |
Retirement Communities 2.7% | |
Albermarle County Economic Development Authority
Revenue Bonds
Westminster-Canterbury of the Blue Ridge
Series 2012
01/01/32 | | | 4.625 | % | | | 2,000,000 | | | | 2,011,520 | | |
Fairfax County Economic Development Authority
Refunding Revenue Bonds
Retirement-Greenspring
Series 2006A
10/01/26 | | | 4.750 | % | | | 2,000,000 | | | | 2,107,560 | | |
Revenue Bonds
Goodwin House, Inc.
Series 2007
10/01/22 | | | 5.000 | % | | | 2,500,000 | | | | 2,741,800 | | |
Hanover County Economic Development Authority
Revenue Bonds
Covenant Woods
Series 2012-A
07/01/22 | | | 4.000 | % | | | 1,320,000 | | | | 1,306,945 | | |
Henrico County Economic Development Authority
Refunding Revenue Bonds
Westminster Canterbury Corp.
Series 2006
10/01/21 | | | 5.000 | % | | | 1,000,000 | | | | 1,026,810 | | |
Total | | | | | | | 9,194,635 | | |
Special Non Property Tax 6.2% | |
Greater Richmond Convention Center Authority
Refunding Revenue Bonds
Series 2005 (NPFGC)
06/15/15 | | | 5.000 | % | | | 2,480,000 | | | | 2,686,510 | | |
06/15/18 | | | 5.000 | % | | | 3,800,000 | | | | 4,084,316 | | |
06/15/25 | | | 5.000 | % | | | 3,000,000 | | | | 3,260,520 | | |
Puerto Rico Infrastructure Financing Authority
Refunding Revenue Bonds
Series 2005C (FGIC)(d)
07/01/19 | | | 5.500 | % | | | 2,500,000 | | | | 2,682,625 | | |
Reynolds Crossing Community Development Authority
Special Assessment Bonds
Reynolds Crossing Project
Series 2007
03/01/21 | | | 5.100 | % | | | 554,000 | | | | 563,712 | | |
Shops at White Oak Village Community Development
Authority (The)
Special Assessment Bonds
Series 2007
03/01/17 | | | 5.300 | % | | | 1,677,000 | | | | 1,796,838 | | |
Territory of Guam
Revenue Bonds
Series 2011A(d)
01/01/31 | | | 5.000 | % | | | 850,000 | | | | 953,369 | | |
Municipal Bonds (continued)
Issue
Description | | Coupon
Rate | | Principal
Amount ($) | | Value ($) | |
Virgin Islands Public Finance Authority(d)
Revenue Bonds
Matching Fund Loan Notes
Series 2012-A
10/01/32 | | | 5.000 | % | | | 2,210,000 | | | | 2,470,227 | | |
Senior Lien-Matching Fund Loan Note
Series 2010A
10/01/25 | | | 5.000 | % | | | 2,450,000 | | | | 2,785,919 | | |
Total | | | | | | | 21,284,036 | | |
Special Property Tax 4.1% | |
Dullles Town Center Community Development Authority
Refunding Special Assessment Bonds
Dulles Town Center Project
Series 2012
03/01/23 | | | 4.000 | % | | | 1,000,000 | | | | 982,390 | | |
Fairfax County Economic Development Authority
Special Tax Bonds
Silver Line Phase I Project
Series 2011
04/01/19 | | | 5.000 | % | | | 4,315,000 | | | | 5,246,565 | | |
04/01/26 | | | 5.000 | % | | | 4,185,000 | | | | 4,893,730 | | |
Marquis Community Development Authority of
York County(e)(f)
Tax Allocation Bonds
Series 2007C
09/01/41 | | | 0.000 | % | | | 3,164,000 | | | | 362,658 | | |
Marquis Community Development Authority of
York County(f)
Tax Allocation Bonds
Series 2007B
09/01/41 | | | 5.625 | % | | | 2,084,000 | | | | 1,888,854 | | |
Virginia Gateway Community Development Authority
Refunding Special Assessment Bonds
Series 2012
03/01/25 | | | 5.000 | % | | | 690,000 | | | | 732,456 | | |
Total | | | | | | | 14,106,653 | | |
State Appropriated 3.2% | |
Virginia Public Building Authority
Revenue Bonds
Public Facility
Series 2006B
08/01/26 | | | 4.500 | % | | | 2,000,000 | | | | 2,134,380 | | |
Series 2006A
08/01/15 | | | 5.000 | % | | | 4,775,000 | | | | 5,270,884 | | |
Virginia Public School Authority
Refunding Revenue Bonds
School Financing 1997
Series 2012
08/01/26 | | | 4.000 | % | | | 3,000,000 | | | | 3,371,790 | | |
Total | | | | | | | 10,777,054 | | |
The accompanying Notes to Financial Statements are an integral part of this statement.
Annual Report 2013
11
Columbia Virginia Intermediate Municipal Bond Fund
Portfolio of Investments (continued)
April 30, 2013
Municipal Bonds (continued)
Issue
Description | | Coupon
Rate | | Principal
Amount ($) | | Value ($) | |
State General Obligation 0.3% | |
Puerto Rico Public Buildings Authority
Revenue Bonds
Government Facilities
Series 2007N(d)
07/01/24 | | | 5.500 | % | | | 1,000,000 | | | | 1,019,480 | | |
Turnpike/Bridge/Toll Road 4.0% | |
Chesapeake Bay Bridge & Tunnel District
Refunding Revenue Bonds
General Resolution
Series 1998 (NPFGC)
07/01/25 | | | 5.500 | % | | | 4,000,000 | | | | 4,752,120 | | |
City of Chesapeake Expressway Toll Road
Revenue Bonds
Transportation System
Senior Series 2012A
07/15/25 | | | 4.000 | % | | | 2,100,000 | | | | 2,242,191 | | |
07/15/26 | | | 4.000 | % | | | 1,400,000 | | | | 1,473,122 | | |
07/15/27 | | | 5.000 | % | | | 1,000,000 | | | | 1,126,320 | | |
Metropolitan Washington Airports Authority
Revenue Bonds
Capital Appreciation-2nd Senior Lien
Series 2009B (AGM)(e)
10/01/23 | | | 0.000 | % | | | 5,000,000 | | | | 3,375,150 | | |
Richmond Metropolitan Authority
Refunding Revenue Bonds
Series 1998 (NPFGC/FGIC)
07/15/17 | | | 5.250 | % | | | 470,000 | | | | 503,257 | | |
Total | | | | | | | 13,472,160 | | |
Water & Sewer 5.8% | |
City of Newport News
Revenue Bonds
Series 2007 (AGM)
06/01/19 | | | 5.000 | % | | | 1,035,000 | | | | 1,197,609 | | |
City of Norfolk Water
Refunding Revenue Bonds
Series 2012
11/01/19 | | | 5.000 | % | | | 1,000,000 | | | | 1,238,180 | | |
City of Richmond
Revenue Bonds
Series 2007 (AGM)
01/15/21 | | | 4.500 | % | | | 1,000,000 | | | | 1,122,280 | | |
Municipal Bonds (continued)
Issue
Description | | Coupon
Rate | | Principal
Amount ($) | | Value ($) | |
County of Spotsylvania
Revenue Bonds
Series 2007 (AGM)
06/01/19 | | | 5.000 | % | | | 1,030,000 | | | | 1,200,362 | | |
Fairfax County Water Authority
Refunding Revenue Bonds
Subordinated Series 2005B
04/01/19 | | | 5.250 | % | | | 1,835,000 | | | | 2,292,979 | | |
Hampton Roads Sanitation District
Revenue Bonds
Series 2008
04/01/22 | | | 5.000 | % | | | 1,000,000 | | | | 1,182,870 | | |
04/01/24 | | | 5.000 | % | | | 3,000,000 | | | | 3,517,230 | | |
Series 2011
11/01/24 | | | 5.000 | % | | | 1,750,000 | | | | 2,103,885 | | |
11/01/25 | | | 5.000 | % | | | 1,380,000 | | | | 1,647,665 | | |
Upper Occoquan Sewage Authority
Refunding Revenue Bonds
Series 2005 (AGM)
07/01/21 | | | 5.000 | % | | | 2,640,000 | | | | 2,897,215 | | |
Revenue Bonds
Series 1995A (NPFGC)
07/01/20 | | | 5.150 | % | | | 1,295,000 | | | | 1,552,938 | | |
Total | | | | | | | 19,953,213 | | |
Total Municipal Bonds
(Cost: $307,997,869) | | | | | | | 334,547,103 | | |
Money Market Funds 1.6%
| | | Shares | | Value ($) | |
JPMorgan Tax-Free Money Market Fund,
0.000%(g) | | | 5,491,797 | | | | 5,491,797 | | |
Total Money Market Funds
(Cost: $5,491,797) | | | | | 5,491,797 | | |
Total Investments
(Cost: $313,489,666) | | | | | 340,038,900 | | |
Other Assets & Liabilities, Net | | | | | 1,741,143 | | |
Net Assets | | | | | 341,780,043 | | |
Notes to Portfolio of Investments
(a) Variable rate security.
(b) Represents a security purchased on a when-issued or delayed delivery basis.
(c) Income from this security may be subject to alternative minimum tax.
(d) Municipal obligations include debt obligations issued by or on behalf of territories, possessions, or sovereign nations within the territorial boundaries of the United States. At April 30, 2013, the value of these securities amounted to $9,911,620 or 2.90% of net assets.
The accompanying Notes to Financial Statements are an integral part of this statement.
Annual Report 2013
12
Columbia Virginia Intermediate Municipal Bond Fund
Portfolio of Investments (continued)
April 30, 2013
Notes to Portfolio of Investments (continued)
(e) Zero coupon bond.
(f) Identifies issues considered to be illiquid as to their marketability. The aggregate value of such securities at April 30, 2013 was $2,251,512, representing 0.66% of net assets. Information concerning such security holdings at April 30, 2013 is as follows:
Security Description | | Acquisition Dates | | Cost ($) | |
Marquis Community Development Authority of York County
Tax Allocation Bonds
Series 2007B
5.625% 09/01/41 | | 11/30/07 | | | 2,084,000 | | |
Marquis Community Development Authority of York County
Tax Allocation Bonds
Series 2007C
0.000% 09/01/41 | | 11/30/07 | | | 801,098 | | |
(g) The rate shown is the seven-day current annualized yield at April 30, 2013.
Abbreviation Legend
AGM Assured Guaranty Municipal Corporation
AMBAC Ambac Assurance Corporation
AMT Alternative Minimum Tax
FGIC Financial Guaranty Insurance Company
NPFGC National Public Finance Guarantee Corporation
Fair Value Measurements
Generally accepted accounting principles (GAAP) require disclosure regarding the inputs and valuation techniques used to measure fair value and any changes in valuation inputs or techniques. In addition, investments shall be disclosed by major category.
The Fund categorizes its fair value measurements according to a three-level hierarchy that maximizes the use of observable inputs and minimizes the use of unobservable inputs by prioritizing that the most observable input be used when available. Observable inputs are those that market participants would use in pricing an investment based on market data obtained from sources independent of the reporting entity. Unobservable inputs are those that reflect the Fund's assumptions about the information market participants would use in pricing an investment. An investment's level within the fair value hierarchy is based on the lowest level of any input that is deemed significant to the asset or liability's fair value measurement. The input levels are not necessarily an indication of the risk or liquidity associated with investments at that level. For example, certain U.S. government securities are generally high quality and liquid, however, they are reflected as Level 2 because the inputs used to determine fair value may not always be quoted prices in an active market.
Fair value inputs are summarized in the three broad levels listed below:
> Level 1 — Valuations based on quoted prices for investments in active markets that the Fund has the ability to access at the measurement date (including NAV for open-end mutual funds). Valuation adjustments are not applied to Level 1 investments.
> Level 2 — Valuations based on other significant observable inputs (including quoted prices for similar securities, interest rates, prepayment speeds, credit risks, etc.).
> Level 3 — Valuations based on significant unobservable inputs (including the Fund's own assumptions and judgment in determining the fair value of investments).
Inputs that are used in determining fair value of an investment may include price information, credit data, volatility statistics, and other factors. These inputs can be either observable or unobservable. The availability of observable inputs can vary between investments, and is affected by various factors such as the type of investment, and the volume and level of activity for that investment or similar investments in the marketplace. The inputs will be considered by the Investment Manager, along with any other relevant factors in the calculation of an investment's fair value. The Fund uses prices and inputs that are current as of the measurement date, which may include periods of market dislocations. During these periods, the availability of prices and inputs may be reduced for many investments. This condition could cause an investment to be reclassified between the various levels within the hierarchy.
The accompanying Notes to Financial Statements are an integral part of this statement.
Annual Report 2013
13
Columbia Virginia Intermediate Municipal Bond Fund
Portfolio of Investments (continued)
April 30, 2013
Fair Value Measurements (continued)
Investments falling into the Level 3 category are primarily supported by quoted prices from brokers and dealers participating in the market for those investments. However, these may be classified as Level 3 investments due to lack of market transparency and corroboration to support these quoted prices. Additionally, valuation models may be used as the pricing source for any remaining investments classified as Level 3. These models may rely on one or more significant unobservable inputs and/or significant assumptions by the Investment Manager. Inputs used in valuations may include, but are not limited to, financial statement analysis, capital account balances, discount rates and estimated cash flows, and comparable company data.
Under the direction of the Fund's Board of Trustees (the Board), the Investment Manager's Valuation Committee (the Committee) is responsible for carrying out the valuation procedures approved by the Board. The Committee consists of voting and non-voting members from various groups within the Investment Manager's organization, including operations and accounting, trading and investments, compliance, risk management and legal.
The Committee meets at least monthly to review and approve valuation matters, which may include a description of specific valuation determinations, data regarding pricing information received from approved pricing vendors and brokers and the results of Board-approved valuation control policies and procedures (the Policies). The Policies address, among other things, instances when market quotations are readily available, including recommendations of third party pricing vendors and a determination of appropriate pricing methodologies; events that require specific valuation determinations and assessment of fair value techniques; securities with a potential for stale pricing, including those that are illiquid, restricted, or in default; and the effectiveness of third-party pricing vendors, including periodic reviews of vendors. The Committee meets more frequently, as needed, to discuss additional valuation matters, which may include the need to review back-testing results, review time-sensitive information or approve related valuation actions. The Committee reports to the Board, with members of the Committee meeting with the Board at each of its regularly scheduled meetings to discuss valuation matters and actions during the period, similar to those described earlier.
For investments categorized as Level 3, the Committee monitors information similar to that described above, which may include: (i) data specific to the issuer or comparable issuers, (ii) general market or specific sector news and (iii) quoted prices and specific or similar security transactions. The Committee considers this data and any changes from prior periods in order to assess the reasonableness of observable and unobservable inputs, any assumptions or internal models used to value those securities and changes in fair value. This data is also used to corroborate, when available, information received from approved pricing vendors and brokers. Various factors impact the frequency of monitoring this information (which may occur as often as daily). However, the Committee may determine that changes to inputs, assumptions and models are not required as a result of the monitoring procedures performed.
The following table is a summary of the inputs used to value the Fund's investments at April 30, 2013:
Description | | Level 1
Quoted Prices in Active
Markets for Identical
Assets ($) | | Level 2
Other Significant
Observable Inputs ($) | | Level 3
Significant
Unobservable Inputs ($) | | Total ($) | |
Bonds | |
Municipal Bonds | | | — | | | | 334,547,103 | | | | — | | | | 334,547,103 | | |
Total Bonds | | | — | | | | 334,547,103 | | | | — | | | | 334,547,103 | | |
Other | |
Money Market Funds | | | 5,491,797 | | | | — | | | | — | | | | 5,491,797 | | |
Total Other | | | 5,491,797 | | | | — | | | | — | | | | 5,491,797 | | |
Total | | | 5,491,797 | | | | 334,547,103 | | | | — | | | | 340,038,900 | | |
See the Portfolio of Investments for all investment classifications not indicated in the table.
The Fund's assets assigned to the Level 2 input category are generally valued using the market approach, in which a security's value is determined through reference to prices and information from market transactions for similar or identical assets.
There were no transfers of financial assets between Levels 1 and 2 during the period.
The accompanying Notes to Financial Statements are an integral part of this statement.
Annual Report 2013
14
Columbia Virginia Intermediate Municipal Bond Fund
Statement of Assets and Liabilities
April 30, 2013
Assets | |
Investments, at value | |
(identified cost $313,489,666) | | $ | 340,038,900 | | |
Receivable for: | |
Capital shares sold | | | 296,153 | | |
Interest | | | 3,663,785 | | |
Expense reimbursement due from Investment Manager | | | 1,037 | | |
Prepaid expenses | | | 1,003 | | |
Total assets | | | 344,000,878 | | |
Liabilities | |
Payable for: | |
Investments purchased on a delayed delivery basis | | | 1,176,640 | | |
Capital shares purchased | | | 44,308 | | |
Dividend distributions to shareholders | | | 806,377 | | |
Investment management fees | | | 3,741 | | |
Distribution and/or service fees | | | 530 | | |
Transfer agent fees | | | 57,867 | | |
Administration fees | | | 642 | | |
Compensation of board members | | | 97,505 | | |
Other expenses | | | 33,225 | | |
Total liabilities | | | 2,220,835 | | |
Net assets applicable to outstanding capital stock | | $ | 341,780,043 | | |
Represented by | |
Paid-in capital | | $ | 312,879,576 | | |
Undistributed net investment income | | | 851,335 | | |
Accumulated net realized gain | | | 1,499,898 | | |
Unrealized appreciation (depreciation) on: | |
Investments | | | 26,549,234 | | |
Total — representing net assets applicable to outstanding capital stock | | $ | 341,780,043 | | |
The accompanying Notes to Financial Statements are an integral part of this statement.
Annual Report 2013
15
Columbia Virginia Intermediate Municipal Bond Fund
Statement of Assets and Liabilities (continued)
April 30, 2013
Class A | |
Net assets | | $ | 55,003,221 | | |
Shares outstanding | | | 4,767,453 | | |
Net asset value per share | | $ | 11.54 | | |
Maximum offering price per share(a) | | $ | 11.93 | | |
Class B | |
Net assets | | $ | 47,364 | | |
Shares outstanding | | | 4,104 | | |
Net asset value per share | | $ | 11.54 | | |
Class C | |
Net assets | | $ | 5,601,074 | | |
Shares outstanding | | | 485,293 | | |
Net asset value per share | | $ | 11.54 | | |
Class R4 | |
Net assets | | $ | 2,527 | | |
Shares outstanding | | | 219 | | |
Net asset value per share(b) | | $ | 11.52 | | |
Class Z | |
Net assets | | $ | 281,125,857 | | |
Shares outstanding | | | 24,369,379 | | |
Net asset value per share | | $ | 11.54 | | |
(a) The maximum offering price per share is calculated by dividing the net asset value by 1.0 minus the maximum sales charge of 3.25%.
(b) Net asset value per share rounds to this amount due to fractional shares outstanding.
The accompanying Notes to Financial Statements are an integral part of this statement.
Annual Report 2013
16
Columbia Virginia Intermediate Municipal Bond Fund
Statement of Operations
Year Ended April 30, 2013
Net investment income | |
Income: | |
Dividends | | $ | 772 | | |
Interest | | | 12,449,102 | | |
Total income | | | 12,449,874 | | |
Expenses: | |
Investment management fees | | | 1,426,979 | | |
Distribution and/or service fees | |
Class A | | | 135,828 | | |
Class B | | | 1,183 | | |
Class C | | | 51,861 | | |
Transfer agent fees | |
Class A | | | 106,408 | | |
Class B | | | 231 | | |
Class C | | | 10,152 | | |
Class Z | | | 582,104 | | |
Administration fees | | | 244,361 | | |
Compensation of board members | | | 32,616 | | |
Custodian fees | | | 2,578 | | |
Printing and postage fees | | | 47,761 | | |
Registration fees | | | 2,236 | | |
Professional fees | | | 36,804 | | |
Other | | | 14,693 | | |
Total expenses | | | 2,695,795 | | |
Fees waived or expenses reimbursed by Investment Manager and its affiliates | | | (523,516 | ) | |
Expense reductions | | | (20 | ) | |
Total net expenses | | | 2,172,259 | | |
Net investment income | | | 10,277,615 | | |
Realized and unrealized gain (loss) — net | |
Net realized gain (loss) on: | |
Investments | | | 2,271,676 | | |
Net realized gain | | | 2,271,676 | | |
Net change in unrealized appreciation (depreciation) on: | |
Investments | | | 231,117 | | |
Net change in unrealized appreciation (depreciation) | | | 231,117 | | |
Net realized and unrealized gain | | | 2,502,793 | | |
Net increase in net assets resulting from operations | | $ | 12,780,408 | | |
The accompanying Notes to Financial Statements are an integral part of this statement.
Annual Report 2013
17
Columbia Virginia Intermediate Municipal Bond Fund
Statement of Changes in Net Assets
| | | Year Ended
April 30,
2013(a) | | Year Ended
April 30,
2012(b) | | Year Ended
March 31,
2012 | |
Operations | |
Net investment income | | $ | 10,277,615 | | | $ | 1,004,428 | | | $ | 10,403,034 | | |
Net realized gain (loss) | | | 2,271,676 | | | | — | | | | (20,059 | ) | |
Net change in unrealized appreciation (depreciation) | | | 231,117 | | | | 3,046,948 | | | | 14,966,600 | | |
Net increase in net assets resulting from operations | | | 12,780,408 | | | | 4,051,376 | | | | 25,349,575 | | |
Distributions to shareholders | |
Net investment income | |
Class A | | | (1,458,897 | ) | | | (141,925 | ) | | | (1,520,549 | ) | |
Class B | | | (2,282 | ) | | | (350 | ) | | | (5,614 | ) | |
Class C | | | (100,032 | ) | | | (9,518 | ) | | | (88,821 | ) | |
Class R4 | | | (8 | ) | | | — | | | | — | | |
Class Z | | | (8,716,396 | ) | | | (872,679 | ) | | | (8,772,472 | ) | |
Net realized gains | |
Class A | | | (81,116 | ) | | | — | | | | — | | |
Class B | | | (174 | ) | | | — | | | | — | | |
Class C | | | (7,808 | ) | | | — | | | | — | | |
Class Z | | | (446,678 | ) | | | — | | | | — | | |
Total distributions to shareholders | | | (10,813,391 | ) | | | (1,024,472 | ) | | | (10,387,456 | ) | |
Increase (decrease) in net assets from capital stock activity | | | (27,903,080 | ) | | | (171,900 | ) | | | 30,261,636 | | |
Total increase (decrease) in net assets | | | (25,936,063 | ) | | | 2,855,004 | | | | 45,223,755 | | |
Net assets at beginning of year | | | 367,716,106 | | | | 364,861,102 | | | | 319,637,347 | | |
Net assets at end of year | | $ | 341,780,043 | | | $ | 367,716,106 | | | $ | 364,861,102 | | |
Undistributed net investment income | | $ | 851,335 | | | $ | 851,335 | | | $ | 871,379 | | |
(a) Class R4 shares are for the period from March 19, 2013 (commencement of operations) to April 30, 2013.
(b) For the period from April 1, 2012 to April 30, 2012. During the period, the Fund's fiscal year end was changed from March 31 to April 30.
The accompanying Notes to Financial Statements are an integral part of this statement.
Annual Report 2013
18
Columbia Virginia Intermediate Municipal Bond Fund
Statement of Changes in Net Assets (continued)
| | | Year Ended April 30,
2013(a) | | Year Ended April 30,
2012(b) | | Year Ended March 31,
2012 | |
| | | Shares | | Dollars ($) | | Shares | | Dollars ($) | | Shares | | Dollars ($) | |
Capital stock activity | |
Class A shares | |
Subscriptions(c) | | | 536,097 | | | | 6,175,085 | | | | 20,083 | | | | 230,314 | | | | 608,725 | | | | 6,864,588 | | |
Distributions reinvested | | | 54,993 | | | | 634,599 | | | | 4,702 | | | | 53,927 | | | | 41,031 | | | | 463,382 | | |
Redemptions | | | (531,974 | ) | | | (6,125,809 | ) | | | (41,825 | ) | | | (479,313 | ) | | | (640,513 | ) | | | (7,186,141 | ) | |
Net increase (decrease) | | | 59,116 | | | | 683,875 | | | | (17,040 | ) | | | (195,072 | ) | | | 9,243 | | | | 141,829 | | |
Class B shares | |
Subscriptions | | | 119 | | | | 1,376 | | | | 16 | | | | 192 | | | | 972 | | | | 11,017 | | |
Distributions reinvested | | | 89 | | | | 1,027 | | | | 15 | | | | 168 | | | | 193 | | | | 2,167 | | |
Redemptions(c) | | | (10,159 | ) | | | (116,758 | ) | | | (1,945 | ) | | | (22,251 | ) | | | (21,295 | ) | | | (237,861 | ) | |
Net decrease | | | (9,951 | ) | | | (114,355 | ) | | | (1,914 | ) | | | (21,891 | ) | | | (20,130 | ) | | | (224,677 | ) | |
Class C shares | |
Subscriptions | | | 117,832 | | | | 1,361,039 | | | | 1,650 | | | | 18,912 | | | | 150,587 | | | | 1,694,920 | | |
Distributions reinvested | | | 6,125 | | | | 70,724 | | | | 512 | | | | 5,874 | | | | 4,378 | | | | 49,457 | | |
Redemptions | | | (47,576 | ) | | | (549,358 | ) | | | (9,510 | ) | | | (108,742 | ) | | | (65,097 | ) | | | (729,025 | ) | |
Net increase (decrease) | | | 76,381 | | | | 882,405 | | | | (7,348 | ) | | | (83,956 | ) | | | 89,868 | | | | 1,015,352 | | |
Class R4 shares | |
Subscriptions | | | 218 | | | | 2,500 | | | | — | | | | — | | | | — | | | | — | | |
Distributions reinvested | | | 1 | | | | 6 | | | | — | | | | — | | | | — | | | | — | | |
Net increase | | | 219 | | | | 2,506 | | | | — | | | | — | | | | — | | | | — | | |
Class Z shares | |
Subscriptions | | | 2,244,008 | | | | 25,865,539 | | | | 276,412 | | | | 3,163,736 | | | | 6,577,650 | | | | 74,757,766 | | |
Distributions reinvested | | | 46,836 | | | | 540,498 | | | | 2,694 | | | | 30,902 | | | | 29,608 | | | | 333,621 | | |
Redemptions | | | (4,839,666 | ) | | | (55,763,548 | ) | | | (267,887 | ) | | | (3,065,619 | ) | | | (4,068,933 | ) | | | (45,762,255 | ) | |
Net increase (decrease) | | | (2,548,822 | ) | | | (29,357,511 | ) | | | 11,219 | | | | 129,019 | | | | 2,538,325 | | | | 29,329,132 | | |
Total net increase (decrease) | | | (2,423,057 | ) | | | (27,903,080 | ) | | | (15,083 | ) | | | (171,900 | ) | | | 2,617,306 | | | | 30,261,636 | | |
(a) Class R4 shares are for the period from March 19, 2013 (commencement of operations) to April 30, 2013.
(b) For the period from April 1, 2012 to April 30, 2012. During the period, the Fund's fiscal year end was changed from March 31 to April 30.
(c) Includes conversions of Class B shares to Class A shares, if any.
The accompanying Notes to Financial Statements are an integral part of this statement.
Annual Report 2013
19
Columbia Virginia Intermediate Municipal Bond Fund
The following tables are intended to help you understand the Fund's financial performance. Certain information reflects financial results for a single share of a class held for the periods shown. Per share net investment income (loss) amounts are calculated based on average shares outstanding during the period. Total return assumes reinvestment of all dividends and distributions, if any. Total return does not reflect payment of sales charges, if any, and is not annualized for periods of less than one year.
| | | Year Ended April 30, | | Year Ended March 31, | |
Class A | | 2013 | | 2012(a) | | 2012 | | 2011 | | 2010 | | 2009 | |
Per share data | |
Net asset value, beginning of period | | $ | 11.47 | | | $ | 11.38 | | | $ | 10.86 | | | $ | 10.94 | | | $ | 10.57 | | | $ | 10.65 | | |
Income from investment operations: | |
Net investment income | | | 0.31 | | | | 0.03 | | | | 0.33 | | | | 0.34 | | | | 0.35 | | | | 0.37 | | |
Net realized and unrealized gain (loss) | | | 0.09 | | | | 0.09 | | | | 0.52 | | | | (0.08 | ) | | | 0.37 | | | | (0.08 | ) | |
Total from investment operations | | | 0.40 | | | | 0.12 | | | | 0.85 | | | | 0.26 | | | | 0.72 | | | | 0.29 | | |
Less distributions to shareholders: | |
Net investment income | | | (0.31 | ) | | | (0.03 | ) | | | (0.33 | ) | | | (0.34 | ) | | | (0.35 | ) | | | (0.37 | ) | |
Net realized gains | | | (0.02 | ) | | | — | | | | — | | | | — | | | | — | | | | — | | |
Total distributions to shareholders | | | (0.33 | ) | | | (0.03 | ) | | | (0.33 | ) | | | (0.34 | ) | | | (0.35 | ) | | | (0.37 | ) | |
Net asset value, end of period | | $ | 11.54 | | | $ | 11.47 | | | $ | 11.38 | | | $ | 10.86 | | | $ | 10.94 | | | $ | 10.57 | | |
Total return | | | 3.49 | % | | | 1.06 | % | | | 7.87 | % | | | 2.40 | % | | | 6.83 | % | | | 2.83 | % | |
Ratios to average net assets(b) | |
Total gross expenses | | | 0.95 | % | | | 0.94 | %(c) | | | 0.98 | % | | | 0.92 | % | | | 0.87 | % | | | 0.86 | % | |
Total net expenses(d) | | | 0.80 | %(e) | | | 0.79 | %(c) | | | 0.79 | %(e) | | | 0.80 | %(e) | | | 0.78 | %(e) | | | 0.75 | %(e) | |
Net investment income | | | 2.68 | % | | | 3.04 | %(c) | | | 2.92 | % | | | 3.11 | % | | | 3.17 | % | | | 3.54 | % | |
Supplemental data | |
Net assets, end of period (in thousands) | | $ | 55,003 | | | $ | 54,025 | | | $ | 53,775 | | | $ | 51,196 | | | $ | 51,857 | | | $ | 47,970 | | |
Portfolio turnover | | | 11 | % | | | 0 | % | | | 8 | % | | | 14 | % | | | 12 | % | | | 12 | % | |
Notes to Financial Highlights
(a) For the period from April 1, 2012 to April 30, 2012. During the period, the Fund's fiscal year end was changed from March 31 to April 30.
(b) In addition to the fees and expenses which the Fund bears directly, the Fund indirectly bears a pro rata share of the fees and expenses of the acquired funds in which it invests. Such indirect expenses are not included in the reported expense ratios.
(c) Annualized.
(d) Total net expenses include the impact of certain waivers/reimbursements made by the Investment Manager and certain of its affiliates, if applicable.
(e) The benefits derived from expense reductions had an impact of less than 0.01%.
The accompanying Notes to Financial Statements are an integral part of this statement.
Annual Report 2013
20
Columbia Virginia Intermediate Municipal Bond Fund
Financial Highlights (continued)
| | | Year Ended April 30, | | Year Ended March 31, | |
Class B | | 2013 | | 2012(a) | | 2012 | | 2011 | | 2010 | | 2009 | |
Per share data | |
Net asset value, beginning of period | | $ | 11.48 | | | $ | 11.38 | | | $ | 10.86 | | | $ | 10.95 | | | $ | 10.57 | | | $ | 10.65 | | |
Income from investment operations: | |
Net investment income | | | 0.22 | | | | 0.02 | | | | 0.25 | | | | 0.26 | | | | 0.27 | | | | 0.29 | | |
Net realized and unrealized gain (loss) | | | 0.08 | | | | 0.10 | | | | 0.51 | | | | (0.09 | ) | | | 0.37 | | | | (0.08 | ) | |
Total from investment operations | | | 0.30 | | | | 0.12 | | | | 0.76 | | | | 0.17 | | | | 0.64 | | | | 0.21 | | |
Less distributions to shareholders: | |
Net investment income | | | (0.22 | ) | | | (0.02 | ) | | | (0.24 | ) | | | (0.26 | ) | | | (0.26 | ) | | | (0.29 | ) | |
Net realized gains | | | (0.02 | ) | | | — | | | | — | | | | — | | | | — | | | | — | | |
Total distributions to shareholders | | | (0.24 | ) | | | (0.02 | ) | | | (0.24 | ) | | | (0.26 | ) | | | (0.26 | ) | | | (0.29 | ) | |
Net asset value, end of period | | $ | 11.54 | | | $ | 11.48 | | | $ | 11.38 | | | $ | 10.86 | | | $ | 10.95 | | | $ | 10.57 | | |
Total return | | | 2.62 | % | | | 1.08 | % | | | 7.06 | % | | | 1.55 | % | | | 6.14 | % | | | 2.07 | % | |
Ratios to average net assets(b) | |
Total gross expenses | | | 1.70 | % | | | 1.69 | %(c) | | | 1.81 | % | | | 1.67 | % | | | 1.62 | % | | | 1.61 | % | |
Total net expenses(d) | | | 1.55 | %(e) | | | 1.54 | %(c) | | | 1.54 | %(e) | | | 1.55 | %(e) | | | 1.53 | %(e) | | | 1.50 | %(e) | |
Net investment income | | | 1.92 | % | | | 2.29 | %(c) | | | 2.19 | % | | | 2.34 | % | | | 2.44 | % | | | 2.80 | % | |
Supplemental data | |
Net assets, end of period (in thousands) | | $ | 47 | | | $ | 161 | | | $ | 182 | | | $ | 392 | | | $ | 1,575 | | | $ | 2,220 | | |
Portfolio turnover | | | 11 | % | | | 0 | % | | | 8 | % | | | 14 | % | | | 12 | % | | | 12 | % | |
Notes to Financial Highlights
(a) For the period from April 1, 2012 to April 30, 2012. During the period, the Fund's fiscal year end was changed from March 31 to April 30.
(b) In addition to the fees and expenses which the Fund bears directly, the Fund indirectly bears a pro rata share of the fees and expenses of the acquired funds in which it invests. Such indirect expenses are not included in the reported expense ratios.
(c) Annualized.
(d) Total net expenses include the impact of certain waivers/reimbursements made by the Investment Manager and certain of its affiliates, if applicable.
(e) The benefits derived from expense reductions had an impact of less than 0.01%.
The accompanying Notes to Financial Statements are an integral part of this statement.
Annual Report 2013
21
Columbia Virginia Intermediate Municipal Bond Fund
Financial Highlights (continued)
| | | Year Ended April 30, | | Year Ended March 31, | |
Class C | | 2013 | | 2012(a) | | 2012 | | 2011 | | 2010 | | 2009 | |
Per share data | |
Net asset value, beginning of period | | $ | 11.48 | | | $ | 11.38 | | | $ | 10.86 | | | $ | 10.95 | | | $ | 10.57 | | | $ | 10.65 | | |
Income from investment operations: | |
Net investment income | | | 0.22 | | | | 0.02 | | | | 0.24 | | | | 0.26 | | | | 0.26 | | | | 0.29 | | |
Net realized and unrealized gain (loss) | | | 0.08 | | | | 0.10 | | | | 0.52 | | | | (0.09 | ) | | | 0.38 | | | | (0.08 | ) | |
Total from investment operations | | | 0.30 | | | | 0.12 | | | | 0.76 | | | | 0.17 | | | | 0.64 | | | | 0.21 | | |
Less distributions to shareholders: | |
Net investment income | | | (0.22 | ) | | | (0.02 | ) | | | (0.24 | ) | | | (0.26 | ) | | | (0.26 | ) | | | (0.29 | ) | |
Net realized gains | | | (0.02 | ) | | | — | | | | — | | | | — | | | | — | | | | — | | |
Total distributions to shareholders | | | (0.24 | ) | | | (0.02 | ) | | | (0.24 | ) | | | (0.26 | ) | | | (0.26 | ) | | | (0.29 | ) | |
Net asset value, end of period | | $ | 11.54 | | | $ | 11.48 | | | $ | 11.38 | | | $ | 10.86 | | | $ | 10.95 | | | $ | 10.57 | | |
Total return | | | 2.63 | % | | | 1.08 | % | | | 7.06 | % | | | 1.54 | % | | | 6.13 | % | | | 2.07 | % | |
Ratios to average net assets(b) | |
Total gross expenses | | | 1.70 | % | | | 1.70 | %(c) | | | 1.73 | % | | | 1.67 | % | | | 1.62 | % | | | 1.61 | % | |
Total net expenses(d) | | | 1.55 | %(e) | | | 1.54 | %(c) | | | 1.54 | %(e) | | | 1.55 | %(e) | | | 1.53 | %(e) | | | 1.50 | %(e) | |
Net investment income | | | 1.93 | % | | | 2.29 | %(c) | | | 2.15 | % | | | 2.35 | % | | | 2.41 | % | | | 2.79 | % | |
Supplemental data | |
Net assets, end of period (in thousands) | | $ | 5,601 | | | $ | 4,694 | | | $ | 4,739 | | | $ | 3,544 | | | $ | 2,499 | | | $ | 1,898 | | |
Portfolio turnover | | | 11 | % | | | 0 | % | | | 8 | % | | | 14 | % | | | 12 | % | | | 12 | % | |
Notes to Financial Highlights
(a) For the period from April 1, 2012 to April 30, 2012. During the period, the Fund's fiscal year end was changed from March 31 to April 30.
(b) In addition to the fees and expenses which the Fund bears directly, the Fund indirectly bears a pro rata share of the fees and expenses of the acquired funds in which it invests. Such indirect expenses are not included in the reported expense ratios.
(c) Annualized.
(d) Total net expenses include the impact of certain waivers/reimbursements made by the Investment Manager and certain of its affiliates, if applicable.
(e) The benefits derived from expense reductions had an impact of less than 0.01%.
The accompanying Notes to Financial Statements are an integral part of this statement.
Annual Report 2013
22
Columbia Virginia Intermediate Municipal Bond Fund
Financial Highlights (continued)
Class R4 | | Year Ended
April 30,
2013(a) | |
Per share data | |
Net asset value, beginning of period | | $ | 11.43 | | |
Income from investment operations: | |
Net investment income | | | 0.04 | | |
Net realized and unrealized gain | | | 0.09 | | |
Total from investment operations | | | 0.13 | | |
Less distributions to shareholders: | |
Net investment income | | | (0.04 | ) | |
Total distributions to shareholders | | | (0.04 | ) | |
Net asset value, end of period | | $ | 11.52 | | |
Total return | | | 1.12 | % | |
Ratios to average net assets(b) | |
Total gross expenses | | | 0.56 | %(c) | |
Total net expenses(d) | | | 0.52 | %(c) | |
Net investment income | | | 2.98 | %(c) | |
Supplemental data | |
Net assets, end of period (in thousands) | | $ | 3 | | |
Portfolio turnover | | | 11 | % | |
Notes to Financial Highlights
(a) For the period from March 19, 2013 (commencement of operations) to April 30, 2013.
(b) In addition to the fees and expenses which the Fund bears directly, the Fund indirectly bears a pro rata share of the fees and expenses of the acquired funds in which it invests. Such indirect expenses are not included in the reported expense ratios.
(c) Annualized.
(d) Total net expenses include the impact of certain waivers/reimbursements made by the Investment Manager and certain of its affiliates, if applicable.
The accompanying Notes to Financial Statements are an integral part of this statement.
Annual Report 2013
23
Columbia Virginia Intermediate Municipal Bond Fund
Financial Highlights (continued)
| | | Year Ended April 30, | | Year Ended March 31, | |
Class Z | | 2013 | | 2012(a) | | 2012 | | 2011 | | 2010 | | 2009 | |
Per share data | |
Net asset value, beginning of period | | $ | 11.47 | | | $ | 11.38 | | | $ | 10.85 | | | $ | 10.94 | | | $ | 10.57 | | | $ | 10.65 | | |
Income from investment operations: | |
Net investment income | | | 0.34 | | | | 0.03 | | | | 0.35 | | | | 0.37 | | | | 0.37 | | | | 0.40 | | |
Net realized and unrealized gain (loss) | | | 0.08 | | | | 0.09 | | | | 0.53 | | | | (0.09 | ) | | | 0.37 | | | | (0.08 | ) | |
Total from investment operations | | | 0.42 | | | | 0.12 | | | | 0.88 | | | | 0.28 | | | | 0.74 | | | | 0.32 | | |
Less distributions to shareholders: | |
Net investment income | | | (0.33 | ) | | | (0.03 | ) | | | (0.35 | ) | | | (0.37 | ) | | | (0.37 | ) | | | (0.40 | ) | |
Net realized gains | | | (0.02 | ) | | | — | | | | — | | | | — | | | | — | | | | — | | |
Total distributions to shareholders | | | (0.35 | ) | | | (0.03 | ) | | | (0.35 | ) | | | (0.37 | ) | | | (0.37 | ) | | | (0.40 | ) | |
Net asset value, end of period | | $ | 11.54 | | | $ | 11.47 | | | $ | 11.38 | | | $ | 10.85 | | | $ | 10.94 | | | $ | 10.57 | | |
Total return | | | 3.75 | % | | | 1.08 | % | | | 8.23 | % | | | 2.56 | % | | | 7.10 | % | | | 3.09 | % | |
Ratios to average net assets(b) | |
Total gross expenses | | | 0.70 | % | | | 0.69 | %(c) | | | 0.73 | % | | | 0.67 | % | | | 0.62 | % | | | 0.61 | % | |
Total net expenses(d) | | | 0.55 | %(e) | | | 0.54 | %(c) | | | 0.54 | %(e) | | | 0.55 | %(e) | | | 0.53 | %(e) | | | 0.50 | %(e) | |
Net investment income | | | 2.93 | % | | | 3.29 | %(c) | | | 3.16 | % | | | 3.36 | % | | | 3.42 | % | | | 3.80 | % | |
Supplemental data | |
Net assets, end of period (in thousands) | | $ | 281,126 | | | $ | 308,836 | | | $ | 306,166 | | | $ | 264,505 | | | $ | 278,479 | | | $ | 267,576 | | |
Portfolio turnover | | | 11 | % | | | 0 | % | | | 8 | % | | | 14 | % | | | 12 | % | | | 12 | % | |
Notes to Financial Highlights
(a) For the period from April 1, 2012 to April 30, 2012. During the period, the Fund's fiscal year end was changed from March 31 to April 30.
(b) In addition to the fees and expenses which the Fund bears directly, the Fund indirectly bears a pro rata share of the fees and expenses of the acquired funds in which it invests. Such indirect expenses are not included in the reported expense ratios.
(c) Annualized.
(d) Total net expenses include the impact of certain waivers/reimbursements made by the Investment Manager and certain of its affiliates, if applicable.
(e) The benefits derived from expense reductions had an impact of less than 0.01%.
The accompanying Notes to Financial Statements are an integral part of this statement.
Annual Report 2013
24
Columbia Virginia Intermediate Municipal Bond Fund
Notes to Financial Statements
April 30, 2013
Note 1. Organization
Columbia Virginia Intermediate Municipal Bond Fund (the Fund), a series of Columbia Funds Series Trust (the Trust), is a diversified fund. The Trust is registered under the Investment Company Act of 1940, as amended (the 1940 Act), as an open-end management investment company organized as a Delaware statutory trust.
Fund Shares
The Trust may issue an unlimited number of shares (without par value). The Fund offers Class A, Class B, Class C, Class R4 and Class Z shares. All share classes have identical voting, dividend and liquidation rights. Each share class has its own expense structure and sales charges, as applicable.
Class A shares are subject to a maximum front-end sales charge of 3.25% based on the initial investment amount. Class A shares purchased without an initial sales charge in accounts aggregating $1 million to $50 million at the time of purchase are subject to a contingent deferred sales charge (CDSC) if the shares are sold within 18 months of purchase, charged as follows: 1.00% CDSC if redeemed within 12 months of purchase, and 0.50% CDSC if redeemed more than 12, but less than 18, months after purchase.
Class B shares may be subject to a maximum CDSC of 3.00% based upon the holding period after purchase. Class B shares will generally convert to Class A shares eight years after purchase. The Fund no longer accepts investments by new or existing investors in the Fund's Class B shares, except in connection with the reinvestment of any dividend and/or capital gain distributions in Class B shares of the Fund and exchanges by existing Class B shareholders of certain other funds within the Columbia Family of Funds.
Class C shares are subject to a 1.00% CDSC on shares redeemed within one year of purchase.
Class R4 shares are not subject to sales charges and are generally available only to omnibus retirement plans and certain other eligible investors. Class R4 shares commenced operations on March 19, 2013.
Class Z shares are not subject to sales charges, and are available only to certain investors.
Note 2. Summary of Significant Accounting Policies
Use of Estimates
The preparation of financial statements in accordance with U.S. generally accepted accounting principles (GAAP) requires management to make certain estimates and assumptions that affect the reported amounts of assets and liabilities, the disclosure of contingent assets and liabilities at
the date of the financial statements and the reported amounts of revenue and expenses during the reporting period. Actual results could differ from those estimates.
The following is a summary of significant accounting policies consistently followed by the Fund in the preparation of its financial statements.
Security Valuation
Debt securities generally are valued by pricing services approved by the Board of Trustees (the Board) based upon market transactions for normal, institutional-size trading units of similar securities. The services may use various pricing techniques which take into account appropriate factors such as yield, quality, coupon rate, maturity, type of issue, trading characteristics and other data, as well as broker quotes. Debt securities for which quotations are readily available may also be valued based upon an over-the-counter or exchange bid quotation.
Investments in other open-end investment companies, including money market funds, are valued at net asset value.
Investments for which market quotations are not readily available, or that have quotations which management believes are not reliable, are valued at fair value as determined in good faith under consistently applied procedures established by and under the general supervision of the Board. If a security or class of securities (such as foreign securities) is valued at fair value, such value is likely to be different from the last quoted market price for the security.
The determination of fair value often requires significant judgment. To determine fair value, management may use assumptions including but not limited to future cash flows and estimated risk premiums. Multiple inputs from various sources may be used to determine fair value.
Delayed Delivery Securities
The Fund may trade securities on other than normal settlement terms, including securities purchased or sold on a "when-issued" basis. This may increase the risk if the other party to the transaction fails to deliver and causes the Fund to subsequently invest at less advantageous prices. The Fund designates cash or liquid securities in an amount equal to the delayed delivery commitment.
Security Transactions
Security transactions are accounted for on the trade date. Cost is determined and gains (losses) are based upon the specific identification method for both financial statement and federal income tax purposes.
Income Recognition
Interest income is recorded on an accrual basis. Market premiums and discounts, including original issue discounts,
Annual Report 2013
25
Columbia Virginia Intermediate Municipal Bond Fund
Notes to Financial Statements (continued)
April 30, 2013
are amortized and accreted, respectively, over the expected life of the security on all debt securities, unless otherwise noted.
Dividend income is recorded on the ex-dividend date.
Expenses
General expenses of the Trust are allocated to the Fund and other funds of the Trust based upon relative net assets or other expense allocation methodologies determined by the nature of the expense. Expenses directly attributable to the Fund are charged to the Fund. Expenses directly attributable to a specific class of shares are charged to that share class.
Determination of Class Net Asset Value
All income, expenses (other than class-specific expenses, which are charged to that share class, as shown in the Statement of Operations) and realized and unrealized gains (losses) are allocated to each class of the Fund on a daily basis, based on the relative net assets of each class, for purposes of determining the net asset value of each class.
Federal Income Tax Status
The Fund intends to qualify each year as a regulated investment company under Subchapter M of the Internal Revenue Code, as amended, and will distribute substantially all of its tax exempt and taxable income (including net short-term capital gains), if any, for its tax year, and as such will not be subject to federal income taxes. In addition, the Fund intends to distribute in each calendar year substantially all of its net investment income, capital gains and certain other amounts, if any, such that the Fund should not be subject to federal excise tax. Therefore, no federal income or excise tax provision is recorded.
Distributions to Shareholders
Distributions from net investment income, if any, are declared daily and paid monthly. Net realized capital gains, if any, are distributed at least annually. Income distributions and capital gain distributions are determined in accordance with federal income tax regulations, which may differ from GAAP.
Guarantees and Indemnifications
Under the Trust's organizational documents and, in some cases, by contract, its officers and trustees are indemnified against certain liabilities arising out of the performance of their duties to the Trust or its funds. In addition, certain of the Fund's contracts with its service providers contain general indemnification clauses. The Fund's maximum exposure under these arrangements is unknown since the amount of any future claims that may be made against the Fund cannot be determined, and the Fund has no historical basis for predicting the likelihood of any such claims.
Recent Accounting Pronouncement
Disclosures about Offsetting Assets and Liabilities
In December 2011, the Financial Accounting Standards Board (FASB) issued Accounting Standards Update (ASU) No. 2011-11, Disclosures about Offsetting Assets and Liabilities and in January 2013, ASU No. 2013-1, Clarifying the Scope of Disclosures about Offsetting Assets and Liabilities (collectively, the ASUs). Specifically, the ASUs require an entity to disclose both gross and net information for derivatives and other financial instruments that are subject to a master netting arrangement or similar agreement. The ASUs require disclosure of collateral received in connection with the master netting agreements or similar agreements. The disclosure requirements are effective for interim and annual periods beginning on or after January 1, 2013. At this time, management is evaluating the implications of this guidance and the impact it will have on the financial statement amounts and footnote disclosures, if any.
Note 3. Fees and Compensation Paid to Affiliates
Investment Management Fees
Under an Investment Management Services Agreement, Columbia Management Investment Advisers, LLC (the Investment Manager), a wholly-owned subsidiary of Ameriprise Financial, Inc. (Ameriprise Financial), determines which securities will be purchased, held or sold. The investment management fee is an annual fee that is equal to a percentage of the Fund's average daily net assets that declines from 0.40% to 0.27% as the Fund's net assets increase. The effective investment management fee rate for the year ended April 30, 2013 was 0.40% of the Fund's average daily net assets.
Administration Fees
Under an Administrative Services Agreement, the Investment Manager also serves as the Fund Administrator. The Fund pays the Fund Administrator an annual fee for administration and accounting services equal to a percentage of the Fund's average daily net assets that declines from 0.07% to 0.04% as the Fund's net assets increase. The effective administration fee rate for the year ended April 30, 2013 was 0.07% of the Fund's average daily net assets.
Other Expenses
Other expenses are for, among other things, certain expenses of the Fund or the Board, including: Fund boardroom and office expense, employee compensation, employee health and retirement benefits, and certain other expenses. Payment of these Fund and Board expenses is facilitated by a company providing limited administrative services to the Fund and the
Annual Report 2013
26
Columbia Virginia Intermediate Municipal Bond Fund
Notes to Financial Statements (continued)
April 30, 2013
Board. For the year ended April 30, 2013, other expenses paid to this company were $2,048.
Compensation of Board Members
Board members are compensated for their services to the Fund as disclosed in the Statement of Operations. Under a Deferred Compensation Plan (the Plan), the Board members who are not "interested persons" of the Fund, as defined under the 1940 Act, may elect to defer payment of up to 100% of their compensation. Deferred amounts are treated as though equivalent dollar amounts had been invested in shares of certain funds managed by the Investment Manager. The Fund's liability for these amounts is adjusted for market value changes and remains in the Fund until distributed in accordance with the Plan.
Transfer Agent Fees
Under a Transfer and Dividend Disbursing Agent Agreement, Columbia Management Investment Services Corp. (the Transfer Agent), an affiliate of the Investment Manager and a wholly-owned subsidiary of Ameriprise Financial, is responsible for providing transfer agency services to the Fund. The Transfer Agent has contracted with Boston Financial Data Services (BFDS) to serve as sub-transfer agent.
The Transfer Agent receives monthly account-based service fees based on the number of open accounts and also receives sub-transfer agency fees based on a percentage of the average aggregate value of the Fund's shares maintained in omnibus accounts (other than omnibus accounts for which American Enterprise Investment Services Inc. is the broker of record or accounts where the beneficial shareholder is a customer of Ameriprise Financial Services, Inc., which are paid a per account fee). The Transfer Agent pays the fees of BFDS for services as sub-transfer agent and is not entitled to reimbursement for such fees from the Fund (with the exception of out-of-pocket fees).
The Transfer Agent also receives compensation from fees for various shareholder services and reimbursements for certain out-of-pocket fees.
For the year ended April 30, 2013, the Fund's effective transfer agent fee rates as a percentage of average daily net assets of each class were as follows:
Class A | | | 0.20 | % | |
Class B | | | 0.20 | | |
Class C | | | 0.20 | | |
Class R4* | | | 0.10 | | |
Class Z | | | 0.20 | | |
*Annualized.
An annual minimum account balance fee of $20 may apply to certain accounts with a value below the Fund's initial minimum investment requirements to reduce the impact of small accounts on transfer agent fees. These minimum account balance fees are recorded as part of expense reductions in the Statement of Operations. For the year ended April 30, 2013, these minimum account balance fees reduced total expenses by $20.
Distribution and Service Fees
The Fund has an agreement with Columbia Management Investment Distributors, Inc. (the Distributor), an affiliate of the Investment Manager and a wholly-owned subsidiary of Ameriprise Financial, for distribution and shareholder services. Pursuant to Rule 12b-1 under the 1940 Act, the Board has approved, and the Fund has adopted, distribution and shareholder service plans (the Plans) which set the distribution and service fees for the Fund. These fees are calculated daily and are intended to compensate the Distributor and/or eligible selling and/or servicing agents for selling shares of the Fund and providing services to investors.
The Plans require the payment of a monthly combined distribution and service fee to the Distributor at the maximum annual rate of 0.25% of the average daily net assets attributable to Class A shares of the Fund. The Plans also require the payment of a monthly service fee at the maximum annual rate of 0.25% of the average daily net assets attributable to Class B and Class C shares of the Fund and the payment of a monthly distribution fee at the maximum annual rate of 0.75% of the average daily net assets attributable to Class B and Class C shares of the Fund.
Sales Charges
Sales charges, including front-end charges and CDSCs, received by the Distributor for distributing Fund shares were $23,248 for Class A and $121 for Class B shares for the year ended April 30, 2013.
Expenses Waived/Reimbursed by the Investment Manager and its Affiliates
The Investment Manager and certain of its affiliates have contractually agreed to waive fees and/or reimburse expenses (excluding certain fees and expenses described below) for the periods disclosed below, unless sooner terminated at the sole discretion of the Board, so that the Fund's net operating expenses, after giving effect to fees waived/expenses reimbursed and any balance credits and/or overdraft charges
Annual Report 2013
27
Columbia Virginia Intermediate Municipal Bond Fund
Notes to Financial Statements (continued)
April 30, 2013
from the Fund's custodian, do not exceed the following annual rates as a percentage of the class' average daily net assets:
| | | August 1, 2012
through
August 31, 2013 | | Prior to
August 1, 2012 | |
Class A | | | 0.81 | % | | | 0.79 | % | |
Class B | | | 1.56 | | | | 1.54 | | |
Class C | | | 1.56 | | | | 1.54 | | |
Class R4 | | | 0.56 | * | | | — | | |
Class Z | | | 0.56 | | | | 0.54 | | |
*Annual rate is contractual from March 19, 2013 (the commencement of operations of Class R4 shares) through February 28, 2014.
Under the agreement governing these fee waivers and/or expense reimbursement arrangements, the following fees and expenses are excluded from the waiver/reimbursement commitment, and therefore will be paid by the Fund, if applicable: taxes (including foreign transaction taxes), expenses associated with investments in affiliated and non-affiliated pooled investment vehicles (including mutual funds and exchange traded funds), transaction costs and brokerage commissions, costs related to any securities lending program, dividend expenses associated with securities sold short, inverse floater program fees and expenses, transaction charges and interest on borrowed money, interest, extraordinary expenses and any other expenses the exclusion of which is specifically approved by the Board. This agreement may be modified or amended only with approval from all parties.
Note 4. Federal Tax Information
The timing and character of income and capital gain distributions are determined in accordance with income tax regulations, which may differ from GAAP because of temporary or permanent book to tax differences.
At April 30, 2013, these differences are primarily due to differing treatment for capital loss carryforwards and Trustees' deferred compensation. To the extent these differences are permanent, reclassifications are made among the components of the Fund's net assets in the Statement of Assets and Liabilities. Temporary differences do not require reclassifications.
The Fund did not have any permanent differences; therefore, no reclassifications were made to the Statement of Assets and Liabilities.
The tax character of distributions paid during the periods indicated was as follows:
| | | Year Ended
April 30, 2013 | | Period Ended
April 30, 2012 | | Year Ended
March 31, 2012 | |
Ordinary income | | $ | 43,799 | | | $ | 86,305 | | | $ | 57,001 | | |
Tax-exempt income | | | 10,233,816 | | | | 938,167 | | | | 10,330,455 | | |
Long-term capital
gains | | | 535,776 | | | | — | | | | — | | |
Total | | $ | 10,813,391 | | | $ | 1,024,472 | | | $ | 10,387,456 | | |
Short-term capital gain distributions, if any, are considered ordinary income distributions for tax purposes.
At April 30, 2013, the components of distributable earnings on a tax basis were as follows:
Undistributed tax-exempt income | | $ | 1,755,102 | | |
Undistributed accumulated long-term gain | | | 1,499,898 | | |
Unrealized appreciation | | | 26,549,234 | | |
At April 30, 2013, the cost of investments for federal income tax purposes was $313,489,666 and the aggregate gross unrealized appreciation and depreciation based on that cost was:
Unrealized appreciation | | $ | 27,249,245 | | |
Unrealized depreciation | | | (700,011 | ) | |
Net unrealized appreciation | | | 26,549,234 | | |
For the year ended April 30, 2013, $236,002 of capital loss carryforward was utilized.
Management of the Fund has concluded that there are no significant uncertain tax positions that would require recognition in the financial statements. However, management's conclusion may be subject to review and adjustment at a later date based on factors including, but not limited to, new tax laws, regulations, and administrative interpretations (including relevant court decisions). Generally, the Fund's federal tax returns for the prior three fiscal years remain subject to examination by the Internal Revenue Service.
Note 5. Portfolio Information
The cost of purchases and proceeds from sales of securities, excluding short-term obligations, aggregated to $39,678,070 and $58,599,221, respectively, for the year ended April 30, 2013.
Annual Report 2013
28
Columbia Virginia Intermediate Municipal Bond Fund
Notes to Financial Statements (continued)
April 30, 2013
Note 6. Shareholder Concentration
At April 30, 2013, one unaffiliated shareholder account owned 85.1% of the outstanding shares of the Fund. The Fund has no knowledge about whether any portion of those shares was owned beneficially by such account. Subscription and redemption activity by concentrated accounts may have a significant effect on the operations of the Fund.
Note 7. Line of Credit
The Fund has entered into a revolving credit facility with a syndicate of banks led by JPMorgan Chase Bank N.A. whereby the Fund may borrow for the temporary funding of shareholder redemptions or for other temporary or emergency purposes. The credit facility agreement, as amended, which is a collective agreement between the Fund and certain other funds managed by the Investment Manager, severally and not jointly, permits collective borrowings up to $500 million. Interest is charged to each participating fund based on its borrowings at a rate equal to the higher of (i) the overnight federal funds rate plus 1.00% or (ii) the one-month LIBOR rate plus 1.00%. Each borrowing under the credit facility matures no later than 60 days after the date of borrowing. The Fund also pays a commitment fee equal to its pro rata share of the amount of the credit facility at a rate of 0.08% per annum.
The Fund had no borrowings during the year ended April 30, 2013.
Note 8. Significant Risks
Geographic Concentration Risk
Because state-specific tax-exempt funds invest primarily in the municipal securities issued by the state and political sub-divisions of the state, the Fund will be particularly affected by political and economic conditions and developments in the state in which it invests. The Fund may, therefore, have a greater risk than that of a municipal bond fund which is more geographically diversified. The value of the municipal securities owned by the Fund also may be adversely affected by future changes in federal or state income tax laws.
Note 9. Subsequent Events
Management has evaluated the events and transactions that have occurred through the date the financial statements were issued and noted no items requiring adjustment of the financial statements or additional disclosure.
Note 10. Information Regarding Pending and Settled Legal Proceedings
In December 2005, without admitting or denying the allegations, American Express Financial Corporation (AEFC,
which is now known as Ameriprise Financial, Inc. (Ameriprise Financial)) entered into settlement agreements with the Securities and Exchange Commission (SEC) and Minnesota Department of Commerce (MDOC) related to market timing activities. As a result, AEFC was censured and ordered to cease and desist from committing or causing any violations of certain provisions of the Investment Advisers Act of 1940, the Investment Company Act of 1940, and various Minnesota laws. AEFC agreed to pay disgorgement of $10 million and civil money penalties of $7 million. AEFC also agreed to retain an independent distribution consultant to assist in developing a plan for distribution of all disgorgement and civil penalties ordered by the SEC in accordance with various undertakings detailed at www.sec.gov/litigation/admin/ia-2451.pdf. Ameriprise Financial and its affiliates have cooperated with the SEC and the MDOC in these legal proceedings, and have made regular reports to the funds' Boards of Trustees.
Ameriprise Financial and certain of its affiliates have historically been involved in a number of legal, arbitration and regulatory proceedings, including routine litigation, class actions, and governmental actions, concerning matters arising in connection with the conduct of their business activities. Ameriprise Financial believes that the Funds are not currently the subject of, and that neither Ameriprise Financial nor any of its affiliates are the subject of, any pending legal, arbitration or regulatory proceedings that are likely to have a material adverse effect on the Funds or the ability of Ameriprise Financial or its affiliates to perform under their contracts with the Funds. Ameriprise Financial is required to make 10-Q, 10-K and, as necessary, 8-K filings with the Securities and Exchange Commission on legal and regulatory matters that relate to Ameriprise Financial and its affiliates. Copies of these filings may be obtained by accessing the SEC website at www.sec.gov.
There can be no assurance that these matters, or the adverse publicity associated with them, will not result in increased fund redemptions, reduced sale of fund shares or other adverse consequences to the Funds. Further, although we believe proceedings are not likely to have a material adverse effect on the Funds or the ability of Ameriprise Financial or its affiliates to perform under their contracts with the Funds, these proceedings are subject to uncertainties and, as such, we are unable to estimate the possible loss or range of loss that may result. An adverse outcome in one or more of these proceedings could result in adverse judgments, settlements, fines, penalties or other relief that could have a material adverse effect on the consolidated financial condition or results of operations of Ameriprise Financial.
Annual Report 2013
29
Columbia Virginia Intermediate Municipal Bond Fund
Report of Independent Registered Public Accounting Firm
To the Trustees of Columbia Funds Series Trust and the Shareholders of
Columbia Virginia Intermediate Municipal Bond Fund
In our opinion, the accompanying statement of assets and liabilities, including the portfolio of investments, and the related statements of operations and of changes in net assets and the financial highlights present fairly, in all material respects, the financial position of Columbia Virginia Intermediate Municipal Bond Fund (the "Fund") (a series of Columbia Funds Series Trust) at April 30, 2013, the results of its operations, the changes in its net assets and the financial highlights for the periods indicated, in conformity with accounting principles generally accepted in the United States of America. These financial statements and financial highlights (hereafter referred to as "financial statements") are the responsibility of the Fund's management. Our responsibility is to express an opinion on these financial statements based on our audits. We conducted our audits of these financial statements in accordance with the standards of the Public Company Accounting Oversight Board (United States). Those standards require that we plan and perform the audit to obtain reasonable assurance about whether the financial statements are free of material misstatement. An audit includes examining, on a test basis, evidence supporting the amounts and disclosures in the financial statements, assessing the accounting principles used and significant estimates made by management, and evaluating the overall financial statement presentation. We believe that our audits, which included confirmation of securities at April 30, 2013 by correspondence with the custodian and brokers, provide a reasonable basis for our opinion.
PricewaterhouseCoopers LLP
Minneapolis, Minnesota
June 21, 2013
Annual Report 2013
30
Columbia Virginia Intermediate Municipal Bond Fund
Federal Income Tax Information
(Unaudited)
The Fund hereby designates the following tax attributes for the fiscal year ended April 30, 2013. Shareholders will be notified in early 2014 of amounts for use in preparing 2013 income tax returns
Tax Designations:
Capital Gain Dividend | | $ | 2,137,458 | | |
| Exempt-Interest Dividends | | | 99.58 | % | |
Capital Gain Dividend. The Fund designates as a capital gain dividend the amount reflected above, or if subsequently determined to be different, the net capital gain of such fiscal period. The Fund also designates as capital gain dividends, to the extent necessary to fully distribute such capital gains, earnings and profits distributed to shareholders on the redemption of shares.
Exempt-Interest Dividends. The percentage of net investment income dividends paid during the fiscal year that qualifies as exempt-interest dividends for federal income tax purposes.
Annual Report 2013
31
Columbia Virginia Intermediate Municipal Bond Fund
Shareholders elect the Board that oversees the funds' operations. The Board appoints officers who are responsible for day-to-day business decisions based on policies set by the Board. The following table provides basic biographical information about the funds' Board members, including their principal occupations during the past five years, although specific titles for individuals may have varied over the period. Under current Board policy, members may serve until the next Board meeting after he or she reaches the mandatory retirement age established by the Board, or the fifteenth anniversary of the first Board meeting they attended as a member of the Board.
Mr. Edward J. Boudreau, Jr., Mr. William P. Carmichael, Mr. William A. Hawkins, Mr. R. Glenn Hilliard, Ms. Minor M. Shaw and Dr. Anthony M. Santomero, were members of the Legacy Columbia Nations funds' Board ("Nations Funds"), which includes Columbia Funds Series Trust, Columbia Funds Variable Insurance Trust I and Columbia Funds Master Investment Trust, LLC and began service on the Board for the Legacy RiverSource funds ("RiverSource Funds") effective June 1, 2011.
Independent Trustees
Name,
Address,
Year of Birth | | Position Held With
Funds and Length of
Service | | Principal Occupation
During Past Five Years | | Number of
Funds in the
Fund Family
Overseen by
Board Member | | Other Present or Past
Directorships/Trusteeships
(Within Past 5 Years)
| |
Kathleen Blatz
901 S. Marquette Ave.
Minneapolis, MN 55402
1954 | | Board member since 1/06 for RiverSource Funds and since 6/11 for Nations Funds | | Attorney; Chief Justice, Minnesota Supreme Court, 1998-2006 | | | 132 | | | Director, BlueCross BlueShield of Minnesota since 2009 | |
Edward J. Boudreau, Jr.
901 S. Marquette Ave.
Minneapolis, MN 55402
1944 | | Board member since 6/11 for RiverSource Funds and since 1/05 for Nations Funds | | Managing Director, E.J. Boudreau & Associates (consulting) since 2000 | | | 130 | | | Former Trustee, BofA Funds Series Trust (11 funds) | |
Pamela G. Carlton
901 S. Marquette Ave.
Minneapolis, MN 55402
1954 | | Board member since 7/07 for RiverSource Funds and since 6/11 for Nations Funds | | President, Springboard — Partners in Cross Cultural Leadership (consulting company) since 2003 | | | 132 | | | None | |
William P. Carmichael
901 S. Marquette Ave.
Minneapolis, MN 55402
1943 | | Board member since 6/11 for RiverSource Funds and since 1999 for Nations Funds | | Retired | | | 130 | | | Director, Cobra Electronics
Corporation (electronic equipment manufacturer); The Finish Line (athletic shoes and apparel) since July 2003; McMoRan Exploration Company (oil and gas exploration and development) since 2010; former Trustee, BofA Funds Series Trust (11 funds); former Director, Spectrum Brands, Inc. (consumer products); former Director, Simmons Company (bedding) | |
Patricia M. Flynn
901 S. Marquette Ave.
Minneapolis, MN 55402
1950 | | Board member since 11/04 for RiverSource Funds and since 6/11 for Nations Funds | | Trustee Professor of Economics and Management, Bentley University since 1976 | | | 132 | | | None | |
William A. Hawkins
901 S. Marquette Ave.
Minneapolis, MN 55402
1942 | | Board member since 6/11 for RiverSource Funds and since 1/05 for Nations Funds | | Managing Director, Overton Partners (financial consulting), since August 2010; President and Chief Executive Officer, California General Bank, N.A., January 2008-August 2010 | | | 130 | | | Trustee, BofA Funds Series Trust (11 funds) | |
Annual Report 2013
32
Columbia Virginia Intermediate Municipal Bond Fund
Trustees and Officers (continued)
Independent Trustees (continued)
Name,
Address,
Year of Birth | | Position Held With
Funds and Length of
Service | | Principal Occupation
During Past Five Years | | Number of
Funds in the
Fund Family
Overseen by
Board Member | | Other Present or Past
Directorships/Trusteeships
(Within Past 5 Years)
| |
R. Glenn Hilliard
901 S. Marquette Ave.
Minneapolis, MN 55402
1943 | | Board member since 6/11 for RiverSource Funds and since 1/05 for Nations Funds | | Chairman and Chief Executive Officer, Hilliard Group LLC (investing and consulting), since April 2003; Non-Executive Director & Chairman, CNO Financial Group, Inc. (insurance), September 2003-May 2011 | | | 130 | | | Chairman, BofA Fund Series Trust (11 funds); former Director, CNO Financial Group, Inc. (insurance) | |
Stephen R. Lewis, Jr.
901 S. Marquette Ave.
Minneapolis, MN 55402
1939 | | Chair of the Board for RiverSource Funds since 1/07, Board member for RiverSource Funds since 1/02 and since 6/11 for Nations Funds | | President Emeritus and Professor of Economics Emeritus, Carleton College since 2002 | | | 132 | | | Director, Valmont Industries, Inc. (irrigation systems manufacturer) since 2002 | |
Catherine James Paglia
901 S. Marquette Ave.
Minneapolis, MN 55402
1952 | | Board member since 11/04 for RiverSource Funds and since 6/11 for Nations Funds | | Director, Enterprise Asset Management, Inc. (private real estate and asset management company) | | | 132 | | | Director, Valmont Industries, Inc. (irrigation systems manufacturer) since 2012 | |
Leroy C. Richie
901 S. Marquette Ave.
Minneapolis, MN 55402
1941 | | Board member since 2000 for Legacy Seligman Funds, since 11/08 for RiverSource Funds and since 6/11 for Nations Funds | | Counsel, Lewis & Munday, P.C. (law firm) since 2004; former Vice President and General Counsel, Automotive Legal Affairs, Chrysler Corporation from 1983-1987 | | | 132 | | | Lead Outside Director, Digital Ally, Inc. (digital imaging) since September 2005; Director, Infinity, Inc. (oil and gas exploration and production) since 1994; Director, OGE Energy Corp. (energy and energy services) since November 2007 | |
Minor M. Shaw
901 S. Marquette Ave.
Minneapolis, MN 55402
1947 | | Board member since 6/11 for RiverSource Funds and since 2003 for Nations Funds | | President, Micco LLC (private investments) since 2011; President, Micco Corp. since 1998 | | | 130 | | | Director, Piedmont Natural Gas; Director, BlueCross BlueShield of South Carolina since April 2008; Former Trustee, BofA Funds Series Trust (11 funds) | |
Alison Taunton-Rigby
901 S. Marquette Ave.
Minneapolis, MN 55402
1944 | | Board member since 11/02 for RiverSource Funds and since 6/11 for Nations Funds | | Chief Executive Officer and Director, RiboNovix, Inc. (biotechnology), 2003-2010 | | | 132 | | | Director, Healthways, Inc. (health and well-being improvement) since 2005; Director, ICI Mutual Insurance Company, RRG since 2011; Director, Abt Associates (government contractor) since 2001; Director, Boston Children's Hospital since 2002 | |
Annual Report 2013
33
Columbia Virginia Intermediate Municipal Bond Fund
Trustees and Officers (continued)
Interested Trustee Not Affiliated With Investment Manager*
Name,
Address,
Year of Birth | | Position Held With
Funds and Length of
Service | | Principal Occupation
During Past Five Years | | Number of
Funds in the
Fund Family
Overseen by
Board Member | | Other Present or Past
Directorships/Trusteeships
(Within Past 5 Years)
| |
Anthony M. Santomero
901 S. Marquette Ave.
Minneapolis, MN 55402
1946 | | Board member since 6/11 for RiverSource Funds and since 1/08 for Nations Funds | | Richard K. Mellon Professor Emeritus of Finance, The Wharton School, University of Pennsylvania, since 2002; Senior Advisor, McKinsey & Company (consulting), 2006-2008 | | | 130 | | | Director, Renaissance Reinsurance Ltd. since May 2008; Trustee, Penn Mutual Life Insurance Company since March 2008; Director, Citigroup, Inc. since 2009; Director, Citibank, N.A. since 2009; former Trustee, BofA Funds Series Trust (11 funds) | |
*Dr. Santomero is not an affiliated person of the investment manager or Ameriprise Financial. However, he is currently deemed by the funds to be an "interested person" (as defined in the 1940 Act) of the funds because he serves as a Director of Citigroup, Inc. and Citibank N.A., companies that may directly or through subsidiaries and affiliates engage from time-to-time in brokerage execution, principal transactions and lending relationships with the funds or accounts advised/managed by the investment manager.
Interested Trustee Affiliated With Investment Manager*
Name,
Address,
Year of Birth | | Position Held With
Funds and Length of
Service | | Principal Occupation
During Past Five Years | | Number of
Funds in the
Fund Family
Overseen by
Board Member | | Other Present or Past
Directorships/Trusteeships
(Within Past 5 Years) | |
William F. Truscott
53600 Ameriprise
Financial Center
Minneapolis, MN 55474
1960 | | Board member since 11/01 for RiverSource Funds and since 6/11 for Nations Funds; Senior Vice President since 2002 for RiverSource Funds and 5/10 for Nations Funds | | President, Columbia Management Investment Advisers, LLC since February 2012, (previously President, Chairman of the Board and Chief Investment Officer, 2001-April 2010); Chief Executive Officer, Global Asset Management, Ameriprise Financial, Inc. since September 2012 (previously Chief Executive Officer, U.S. Asset Management & President, Annuities, May 2010-September 2012 and President — U.S. Asset Management and Chief Investment Officer, 2005-April 2010); Chief Executive Officer, Columbia Management Investment Distributors, Inc. since February 2012, (previously Chairman of the Board and Chief Executive Officer, 2006-April 2010); Chairman of the Board and Chief Executive Officer, RiverSource Distributors, Inc. since 2006; President and Chief Executive Officer, Ameriprise Certificate Company 2006-August 2012 | | | 184 | | | Chairman of the Board, Columbia Management Investment Advisers, LLC since May 2010; Director, Columbia Management Investment Distributors, Inc. since May 2010; Director, Ameriprise Certificate Company, 2006-January 2013 | |
*Interested person (as defined under the 1940 Act) by reason of being an officer, director, security holder and/or employee of the investment manager or Ameriprise Financial.
The SAI has additional information about the Fund's Board members and is available, without charge, upon request by calling 800.345.6611; contacting your financial intermediary; or visiting columbiamanagement.com.
Annual Report 2013
34
Columbia Virginia Intermediate Municipal Bond Fund
Trustees and Officers (continued)
The Board has appointed officers who are responsible for day-to-day business decisions based on policies it has established. The officers serve at the pleasure of the Board. In addition to Mr. Truscott, who is Senior Vice President, the funds' other officers are:
Officers
Name,
Address,
Year of Birth | | Position Held With
Funds and Length of
Service | | Principal Occupation During Past Five Years | |
J. Kevin Connaughton
225 Franklin Street
Boston, MA 02110
1964 | | President and Principal Executive Officer since 5/10 for RiverSource Funds and 2009 for Nations Funds | | Senior Vice President and General Manager — Mutual Fund Products, Columbia Management Investment Advisers, LLC since May 2010; President, Columbia Funds since 2009 and RiverSource Funds since May 2010; Managing Director of Columbia Management Advisors, LLC, December 2004-April 2010; Senior Vice President and Chief Financial Officer, Columbia Funds, June 2008-January 2009; Treasurer, Columbia Funds, October 2003-May 2008; and senior officer of various other affiliated funds since 2000 | |
Amy K. Johnson
5228 Ameriprise
Financial Center Minneapolis, MN 55474
1965 | | Vice President since 12/06 for RiverSource Funds and 5/10 for Nations Funds | | Senior Vice President and Chief Operating Officer, Columbia Management Investment Advisers, LLC since May 2010 (previously Chief Administrative Officer, 2009-April 2010 and Vice President — Asset Management and Trust Company Services, 2006-2009) | |
Michael G. Clarke
225 Franklin Street
Boston, MA 02110
1969 | | Treasurer since 1/11 and Chief Financial Officer since 4/11 for RiverSource Funds and Treasurer since 3/11 and Chief Financial Officer since 2009 for Nations Funds | | Vice President, Columbia Management Investment Advisers, LLC since May 2010; Managing Director of Fund Administration, Columbia Management Advisors, LLC, September 2004-April 2010; senior officer of Columbia Funds and affiliated funds since 2002 | |
Scott R. Plummer
5228 Ameriprise
Financial Center
Minneapolis, MN 55474
1959 | | Senior Vice President and Chief Legal Officer since 12/06 and Assistant Secretary since 6/11 for RiverSource Funds and Senior Vice President and Chief Legal Officer since 5/10 and Assistant Secretary since 6/11 for Nations Funds | | Senior Vice President, Chief Legal Officer and Assistant Secretary, Columbia Management Investment Advisers, LLC since June 2005; Vice President and Lead Chief Counsel — Asset Management, Ameriprise Financial, Inc. since May 2010 (previously Vice President and Chief Counsel — Asset Management, 2005-April 2010); Vice President, Chief Counsel and Assistant Secretary, Columbia Management Investment Distributors, Inc. since 2008; Vice President, General Counsel and Secretary, Ameriprise Certificate Company since 2005; Chief Counsel, RiverSource Distributors, Inc. since 2006; senior officer of Columbia Funds and affiliated funds since 2016 | |
Colin Moore
225 Franklin Street
Boston, MA 02110
1958 | | Senior Vice President since 5/10 for RiverSource Funds and Nations Funds | | Director and Chief Investment Officer, Columbia Management Investment Advisers, LLC since May 2010; Global Manager, Managing Director and Chief Investment Officer, Columbia Management Advisors, LLC, 2007-April 2010 | |
Thomas P. McGuire
225 Franklin Street
Boston, MA 02110
1972 | | Chief Compliance Officer since 3/12 | | Vice President — Asset Management Compliance, Columbia Management Investment Advisers, LLC since 2010; Chief Compliance Officer, Ameriprise Certificate Company since September 2010; Compliance Executive, Bank of America, 2005-2010 | |
Stephen T. Welsh
225 Franklin Street
Boston, MA 02110
1957 | | Vice President since 4/11 for RiverSource Funds and 2006 for Nations Funds | | President and Director, Columbia Management Investment Services Corp. since May 2010; President and Director, Columbia Management Services, Inc., July 2004-April 2010; Managing Director, Columbia Management Distributors, Inc., August 2007-April 2010 | |
Christopher O. Petersen
5228 Ameriprise
Financial Center
Minneapolis, MN 55474
1970 | | Vice President and Secretary since 4/11 for RiverSource Funds and 3/11 for Nations Funds | | Vice President and Chief Counsel, Ameriprise Financial, Inc. since January 2010 (formerly Vice President and Group Counsel or Counsel, April 2004-January 2010); Assistant Secretary of Legacy RiverSource Funds, January 2007-April 2011 and of the Nations Funds, May 2010-March 2011 | |
Annual Report 2013
35
Columbia Virginia Intermediate Municipal Bond Fund
Trustees and Officers (continued)
Officers (continued)
Name,
Address,
Year of Birth | | Position Held With
Funds and Length of
Service | | Principal Occupation During Past Five Years | |
Paul D. Pearson
10468 Ameriprise
Financial Center
Minneapolis, MN 55474
1956 | | Vice President since 4/11 and Assistant Treasurer since 1999 for RiverSource Funds and Vice President and Assistant Treasurer since 6/11 for Nations Funds | | Vice President — Investment Accounting, Columbia Management Investment Advisers, LLC, since May 2010; Vice President — Managed Assets, Investment Accounting, Ameriprise Financial Inc., February 1998-May 2010 | |
Joseph F. DiMaria
225 Franklin Street
Boston, MA 02110
1968 | | Vice President and Chief Accounting Officer since 4/11 and Vice President since 3/11 and Chief Accounting Officer since 2008 for Nations Funds | | Vice President, Mutual Fund Administration, Columbia Management Investment Advisers, LLC, since May 2010; Director of Fund Administration, Columbia Management Advisors, LLC, January 2006-April 2010 | |
Paul B. Goucher
100 Park Avenue
New York, NY 10017
1968 | | Vice President since 4/11 and Assistant Secretary since 11/08 for RiverSource Funds and 5/10 for Nations Funds | | Vice President and Lead Chief Counsel, Ameriprise Financial, Inc. since November 2008 and January 2013, respectively (formerly, Chief Counsel, January 2010-January 2013 and Group Counsel from November 2008-January 2010); Director, Managing Director and General Counsel, J. & W. Seligman & Co. Incorporated, July 2008-November 2008 (previously, Managing Director and Associate General Counsel, January 2005-July 2008) | |
Michael E. DeFao
225 Franklin Street
Boston, MA 02110
1968 | | Vice President since 4/11 and Assistant Secretary since 5/10 for RiverSource Funds and 2011 for Nations Funds | | Vice President and Chief Counsel, Ameriprise Financial, Inc. since May 2010; Associate General Counsel, Bank of America, June 2005-April 2010 | |
Annual Report 2013
36
Columbia Virginia Intermediate Municipal Bond Fund
Approval of Investment Management Services
Agreement
Columbia Management Investment Advisers, LLC (Columbia Management or the Investment Manager), a wholly-owned subsidiary of Ameriprise Financial, Inc. (Ameriprise Financial), serves as the investment manager to Columbia Virginia Intermediate Municipal Bond Fund (the Fund). Under an investment management services agreement (the IMS Agreement), Columbia Management provides investment advice and other services to the Fund and other funds distributed by Columbia Management Investment Distributors, Inc. (collectively, the Funds).
On an annual basis, the Fund's Board of Trustees (the Board), including the independent Board members (the Independent Trustees), considers renewal of the IMS Agreement. Columbia Management prepared detailed reports for the Board and its Contracts Committee in January, March and April 2013, including reports based on analyses of data provided by an independent organization and a comprehensive response to each item of information requested by independent legal counsel to the Independent Trustees (Independent Legal Counsel) in a letter to the Investment Manager, to assist the Board in making this determination. All of the materials presented in January, March and April were first supplied in draft form to designated representatives of the Independent Trustees, i.e., Independent Legal Counsel, the Chair of the Board and the Chair of the Contracts Committee, and the final materials (including proposed additional breakpoints in IMS fees for certain Funds) were revised to reflect discussion and subsequent requests made by the Contracts Committee. In addition, throughout the year, the Board (or its committees) regularly meets with portfolio management teams and senior management personnel, and reviews information prepared by Columbia Management addressing the services Columbia Management provides and Fund performance. Further, the Board retained an independent consulting firm (the Independent Consultant) to assist the Independent Trustees in their review of IMS fees, expense caps and Ameriprise Financial's profitability. The Board also accords particular weight to the work, deliberations and conclusions of the Contracts Committee, the Investment Review Committee and the Compliance Committee in determining whether to continue the IMS Agreement.
The Board, at its April 15-17, 2013 in-person Board meeting (the April Meeting), considered the renewal of the IMS Agreement for an additional one-year term. At the April Meeting, Independent Legal Counsel reviewed with the Independent Trustees various factors relevant to the Board's consideration of advisory agreements and the Board's legal responsibilities related to such consideration. Following an analysis and discussion of the factors identified below, the Board, including all of the Independent Trustees, approved the renewal of the IMS Agreement.
Nature, Extent and Quality of Services Provided by Columbia Management
The Independent Trustees analyzed various reports and presentations they had received detailing the services performed by Columbia Management, as well as its expertise, resources and capabilities. The Independent Trustees specifically considered many developments during the past year concerning the services provided by Columbia Management, including, in particular, the recent globalization initiative, which fosters increased worldwide investment support of global products, continued investment in upgrading technology (such as the implementation of new systems and hardware), the hiring of a Chief Interest Rate Strategist as part of Columbia Management's fixed income team and the addition of Columbia Management investment personnel to the Asset Allocation, Quantitative and Technology teams. The Independent Trustees noted the information they received concerning Columbia Management's ability to retain its key portfolio management personnel. In this regard, the Independent Trustees took into account their comprehensive discussions with Columbia Management's Chief Investment Officer (the CIO), observing the organizational depth of Columbia Management and the capabilities of its investment personnel. The Independent Trustees also recalled the information the CIO provided them identifying the strengths and areas for enhancement of each Columbia Management investment team, as well as the discussion with the CIO regarding the investment personnel talent being infused to enhance support for certain Funds. The Independent Trustees also observed the materials demonstrating the strength and depth of Columbia Management's equity and fixed income research departments.
In connection with the Board's evaluation of the overall package of services provided by Columbia Management, the Board also considered the quality of administrative services provided to the Fund by Columbia Management, recalling the information it received highlighting significant achievements in 2012 in the performance of administrative services (such as strong accounting performance measures, refined derivatives processing and enhancements to the electronic communications under the affiliated and unaffiliated service provider oversight program). In evaluating the quality of services provided under the IMS Agreement and the Fund's Administrative Service Agreement, the Independent Trustees also took into account the organization and strength of the Fund's and its service providers' compliance programs. In
Annual Report 2013
37
Columbia Virginia Intermediate Municipal Bond Fund
Approval of Investment Management Services
Agreement (continued)
addition, the Board also reviewed the financial condition of Columbia Management (and its affiliates) and each entity's ability to carry out its responsibilities under the IMS Agreement and the Fund's other services agreements with affiliates of Ameriprise Financial, observing the financial strength of Ameriprise Financial, with its solid balance sheet. The Board also discussed the acceptability of the terms of the IMS Agreement (including the relatively broad scope of services required to be performed by Columbia Management). The Board concluded that the services being performed under the IMS Agreement were of a reasonably high quality.
Based on the foregoing, and based on other information received (both oral and written, including the information on investment performance referenced below) and other considerations, the Board concluded that Columbia Management and its affiliates were in a position to continue to provide a high quality and level of services to the Fund.
Investment Performance
For purposes of evaluating the nature, extent and quality of services provided under the IMS Agreement, the Board carefully reviewed the investment performance of the Fund. In this regard, the Board considered detailed reports providing the results of analyses performed by an independent organization showing, for various periods, the performance of the Fund, the performance of a benchmark index, the percentage ranking of the Fund among its comparison group and the net assets of the Fund. The Board observed that the Fund's investment performance was appropriate in light of the particular management style involved and the particular market environment.
Comparative Fees, Costs of Services Provided and the Profits Realized by Columbia Management and its Affiliates from their Relationships with the Fund
The Board reviewed comparative fees and the costs of services to be provided under the IMS Agreement. The Board members considered detailed comparative information set forth in an annual report on fees and expenses, including, among other things, data (based on analyses conducted by an independent organization) showing a comparison of the Fund's expenses with median expenses paid by funds in its comparative peer universe, as well as data showing the Fund's contribution to Columbia Management's profitability.
The Board accorded particular weight to the notion that the level of fees should reflect a rational pricing model applied consistently across the various product lines in the Fund family, while assuring that the overall fees for each Fund (with few defined exceptions) are generally in line with the "pricing philosophy" (i.e., that the total expense ratio of the Fund is no higher than the median expense ratio of funds in the same comparison universe of the Fund). In this connection, the Board also considered the Independent Consultant's report that concluded that: (i) the Funds' standardized investment management fee rates, particularly in the context of the current competitive fee landscape, were within a reasonable range; and (ii) the Funds' expense cap philosophy of assuring that each Fund's total expense ratio is not above its peer universe median ratio is reasonable. The Board took into account that the Fund's total expense ratio (after considering proposed expense caps/waivers) approximated the peer universe's median expense ratio. Based on its review, the Board concluded that the Fund's management fee was fair and reasonable in light of the extent and quality of services that the Fund receives.
The Board also considered the expected profitability of Columbia Management and its affiliates in connection with Columbia Management providing investment management services to the Fund. In this regard, the Board referred to a detailed profitability report, discussing the profitability to Columbia Management and Ameriprise Financial from managing, operating and distributing the Funds. In this regard, the Board observed that 2012 profitability approximates 2011 profitability and that, as was the case in 2011, 2012 profitability remained generally in line with (and, in many cases, lower than) the reported profitability of other asset management firms. Further, the Board considered the Independent Consultant's report that concluded that Columbia Management's profitability, particularly in comparison to industry competitors, was reasonable and not excessive. It also took into account the indirect economic benefits flowing to Columbia Management or its affiliates in connection with managing or distributing the Funds, such as the enhanced ability to offer various other financial products to Ameriprise Financial customers, soft dollar benefits and overall reputational advantages. The Board noted that the fees paid by the Funds should permit the Investment Manager to offer competitive compensation to its personnel, make necessary investments in its business and earn an appropriate profit. The Board concluded that profitability levels were reasonable.
Annual Report 2013
38
Columbia Virginia Intermediate Municipal Bond Fund
Approval of Investment Management Services
Agreement (continued)
Economies of Scale to be Realized
The Board also considered the economies of scale that might be realized by Columbia Management as the Fund grows and took note of the extent to which Fund shareholders might also benefit from such growth. In this regard, the Independent Trustees took into account that IMS fees decline as Fund assets exceed various breakpoints, all of which have not been surpassed.
Based on the foregoing, the Board, including all of the Independent Trustees, concluded that the investment management service fees were fair and reasonable in light of the extent and quality of services provided. In reaching this conclusion, no single factor was determinative. On April 17, 2013, the Board, including all of the Independent Trustees, approved the renewal of the IMS Agreement.
Annual Report 2013
39
This page intentionally left blank.
Annual Report 2013
40
Columbia Virginia Intermediate Municipal Bond Fund
Important Information About This Report
Each fund mails one shareholder report to each shareholder address. If you would like more than one report, please call shareholder services at 800.345.6611 and additional reports will be sent to you.
The policy of the Board is to vote the proxies of the companies in which each fund holds investments consistent with the procedures as stated in the Statement of Additional Information (SAI). You may obtain a copy of the SAI without charge by calling 800.345.6611; contacting your financial intermediary; visiting columbiamanagement.com; or searching the website of the Securities and Exchange Commission (SEC) at sec.gov. Information regarding how each fund voted proxies relating to portfolio securities is filed with the SEC by August 31 for the most recent 12-month period ending June 30 of that year, and is available without charge by visiting columbiamanagement.com; or searching the website of the SEC at sec.gov.
Each fund files a complete schedule of portfolio holdings with the SEC for the first and third quarters of each fiscal year on Form N-Q. Each fund's Form N-Q is available on the SEC's website at sec.gov and may be reviewed and copied at the SEC's Public Reference Room in Washington, D.C. Information on the operation of the Public Reference Room may be obtained by calling 800.SEC.0330. Each fund's complete schedule of portfolio holdings, as filed on Form N-Q, can also be obtained without charge, upon request, by calling 800.345.6611.
Annual Report 2013
41

Columbia Virginia Intermediate Municipal Bond Fund
P.O. Box 8081
Boston, MA 02266-8081
columbiamanagement.com
This information is for use with concurrent or prior delivery of a fund prospectus. Please read and consider the investment objectives, risks, charges and expenses for any fund carefully before investing. For a prospectus which contains this and other important information about the Fund go to columbiamanagement.com. The Fund is distributed by Columbia Management Investment Distributors, Inc., member FINRA, and managed by Columbia Management Investment Advisers, LLC.
© 2013 Columbia Management Investment Advisers, LLC. All rights reserved.
ANN239_04_C01_(06/13)
Annual Report
April 30, 2013

Columbia California Intermediate Municipal Bond Fund
Not FDIC insured • No bank guarantee • May lose value
Columbia California Intermediate Municipal Bond Fund
 Dear Shareholders,
U.S. equities had a strong first quarter
Similar to 2012, equities once again were the best performing asset class in the first quarter of 2013. The S&P 500 Index reached an all-time closing high on the last trading day of the quarter and pushed through its October 2007 peak. Although global equities have performed well year-to-date, there is significant performance divergence among regions. In local currency terms, Japanese equities were the best performing developed market globally, and U.S. stocks outperformed most other global equity markets. European equities rose in the first quarter but trailed U.S. stocks and had a turbulent March, as investors were reminded of instability in the eurozone with news of a banking crisis in Cyprus.
Although all 10 sectors of the S&P 500 Index delivered positive returns, this was a rally led by defensive stocks such as those in health care, consumer staples and utilities. Materials and technology stocks were the weakest sectors.
High yield leads fixed income; most sectors flat to down
The fixed-income markets lagged equities with modest, single-digit returns coming from municipals and high-yield sectors in the United States. Most government and investment-grade credit sectors were roughly flat to down for the first quarter of 2013. Emerging market bonds were the biggest disappointment with single-digit losses.
Columbia Management to begin delivering summary prospectuses
Each Columbia fund is required to update its prospectus on an annual basis. Beginning with June 2013 prospectus updates, shareholders of Columbia retail mutual funds will start to receive a summary prospectus, rather than the full length (statutory) mutual fund prospectus they have received in the past.
Each fund's summary prospectus will include the following key information:
> Investment objective
> Fee and expense table
> Portfolio turnover rate information
> Principal investment strategies, principal risks and performance information
> Management information
> Purchase and sale information
> Tax information
> Financial intermediary compensation information
Each fund's statutory prospectus will contain additional information about the fund and its risks. Both the statutory and summary prospectus will be updated each year, and will be available at columbiamanagement.com. Shareholders may request a printed version of a statutory prospectus at no cost by calling 800.345.6611 or sending an email to serviceinquiries@columbiamanagement.com.
Stay on track with Columbia Management
Backed by more than 100 years of experience, Columbia Management is one of the nation's largest asset managers. At the heart of our success — and, most importantly, that of our investors — are highly talented industry professionals, brought together by a unique way of working. We are dedicated to helping you take advantage of today's opportunities and anticipate tomorrow's. We stay abreast of the latest investment trends and ideas, using our collective insight to evaluate events and transform them into solutions you can use.
Visit columbiamanagement.com for:
> The Columbia Management Perspectives blog, featuring timely posts by our investment teams
> Detailed up-to-date fund performance and portfolio information
> Economic analysis and market commentary
> Quarterly fund commentaries
> Columbia Management Investor, our award-winning quarterly newsletter for shareholders
Thank you for your continued support of the Columbia Funds. We look forward to serving your investment needs for many years to come.
Best Regards,

J. Kevin Connaughton
President, Columbia Funds
The S&P 500 Index, an unmanaged index, measures the performance of 500 large-capitalization U.S. stocks and is frequently used as a general measure of market performance. Indices are not available for investment, are not professionally managed and do not reflect sales charges, fees, brokerage commissions, taxes or other expenses of investing.
Investors should consider the investment objectives, risks, charges and expenses of a mutual fund carefully before investing. For a free prospectus, which contains this and other important information about a fund, visit columbiamanagement.com. The prospectus should be read carefully before investing.
Columbia Funds are distributed by Columbia Management Investment Distributors, Inc., member FINRA, and managed by Columbia Management Investment Advisers, LLC.
© 2013 Columbia Management Investment Advisers, LLC. All rights reserved.
Columbia California Intermediate Municipal Bond Fund
Performance Overview | | | 2 | | |
Manager Discussion of Fund Performance | | | 4 | | |
Understanding Your Fund's Expenses | | | 6 | | |
Portfolio of Investments | | | 7 | | |
Statement of Assets and Liabilities | | | 16 | | |
Statement of Operations | | | 18 | | |
Statement of Changes in Net Assets | | | 19 | | |
Financial Highlights | | | 21 | | |
Notes to Financial Statements | | | 27 | | |
Report of Independent Registered
Public Accounting Firm | | | 33 | | |
Federal Income Tax Information | | | 34 | | |
Trustees and Officers | | | 35 | | |
Approval of Investment Management Services Agreement | | | 40 | | |
Important Information About This Report | | | 45 | | |
Fund Investment Manager
Columbia Management Investment
Advisers, LLC
225 Franklin Street
Boston, MA 02110
Fund Distributor
Columbia Management Investment
Distributors, Inc.
225 Franklin Street
Boston, MA 02110
Fund Transfer Agent
Columbia Management Investment
Services Corp.
P.O. Box 8081
Boston, MA 02266-8081
For more information about any of the funds, please visit columbiamanagement.com or call 800.345.6611. Customer Service Representatives are available to answer your questions Monday through Friday from 8 a.m. to 8 p.m. Eastern time.
The views expressed in this report reflect the current views of the respective parties. These views are not guarantees of future performance and involve certain risks, uncertainties and assumptions that are difficult to predict, so actual outcomes and results may differ significantly from the views expressed. These views are subject to change at any time based upon economic, market or other conditions and the respective parties disclaim any responsibility to update such views. These views may not be relied on as investment advice and, because investment decisions for a Columbia Fund are based on numerous factors, may not be relied on as an indication of trading intent on behalf of any particular Columbia Fund. References to specific securities should not be construed as a recommendation or investment advice.
Columbia California Intermediate Municipal Bond Fund
Performance Summary
> Columbia California Intermediate Municipal Bond Fund (the Fund) Class A shares returned 5.12% excluding sales charges for the 12-month period that ended April 30, 2013.
> The Fund outperformed its primary benchmark, the Barclays 3-15 Year Blend Municipal Bond Index as well as the Barclays California 3-15 Year Blend Municipal Bond Index, which returned 4.35% and 5.01%, respectively, for the same 12-month period.
> The Fund's emphasis on longer-intermediate maturities and overweight positions in A and BBB rated bonds gave it a performance advantage over its benchmarks.
Average Annual Total Returns (%) (for period ended April 30, 2013)
| | | | 1 Year | | 5 Years | | 10 Years | |
Class A | | 09/09/02 | | | | | | | |
Excluding sales charges | | | | | 5.12 | | | | 5.68 | | | | 4.15 | | |
Including sales charges | | | | | 1.72 | | | | 4.98 | | | | 3.81 | | |
Class B | | 08/29/02 | | | | | | | |
Excluding sales charges | | | | | 4.34 | | | | 4.90 | | | | 3.38 | | |
Including sales charges | | | | | 1.34 | | | | 4.90 | | | | 3.38 | | |
Class C | | 09/11/02 | | | | | | | |
Excluding sales charges | | | | | 4.24 | | | | 4.87 | | | | 3.37 | | |
Including sales charges | | | | | 3.24 | | | | 4.87 | | | | 3.37 | | |
Class R4* | | 03/19/13 | | | 5.29 | | | | 5.91 | | | | 4.41 | | |
Class R5* | | 11/08/12 | | | 5.43 | | | | 5.94 | | | | 4.42 | | |
Class Z | | 08/19/02 | | | 5.29 | | | | 5.91 | | | | 4.41 | | |
Barclays 3-15 Year Blend Municipal Bond Index | | | | | 4.35 | | | | 5.91 | | | | 4.85 | | |
Barclays California 3-15 Year Blend Municipal Bond Index | | | | | 5.01 | | | | 6.16 | | | | 5.00 | | |
Returns for Class A are shown with and without the maximum initial sales charge of 3.25%. Returns for Class B are shown with and without the applicable contingent deferred sales charge (CDSC) of 3.00% in the first year, declining to 1.00% in the fourth year and eliminated thereafter. Returns for Class C are shown with and without the 1.00% CDSC for the first year only. The Fund's other classes are not subject to sales charges and have limited eligibility. Please see the Fund's prospectuses for details. Performance for different share classes will vary based on differences in sales charges and fees associated with each class. All results shown assume reinvestment of distributions during the period. Returns do not reflect the deduction of taxes that a shareholder may pay on Fund distributions or on the redemption of Fund shares. Performance results reflect the effect of any fee waivers or reimbursements of Fund expenses by Columbia Management Investment Advisers, LLC and/or any of its affiliates. Absent these fee waivers or expense reimbursement arrangements, performance results would have been lower.
The performance information shown represents past performance and is not a guarantee of future results. The investment return and principal value of your investment will fluctuate so that your shares, when redeemed, may be worth more or less than their original cost. Current performance may be lower or higher than the performance information shown. You may obtain performance information current to the most recent month-end by contacting your financial intermediary, visiting columbiamanagement.com or calling 800.345.6611.
*The returns shown for periods prior to the share class inception date (including returns for the Life of the Fund, if shown, which are since Fund inception) include the returns of the Fund's oldest share class. These returns are adjusted to reflect any higher class-related operating expenses of the newer share classes, as applicable. Please visit columbiamanagement.com/mutual-funds/appended-performance for more information.
The Barclays 3-15 Year Blend Municipal Bond Index is an unmanaged index that tracks the performance of municipal bonds issued after December 31, 1990, with remaining maturities between 2 and 17 years and at least $7 million in principal amount outstanding.
The Barclays California 3-15 Year Blend Municipal Bond Index tracks investment grade bonds issued from the state of California and its municipalities.
Indices are not available for investment, are not professionally managed and do not reflect sales charges, fees, brokerage commissions, taxes or other expenses of investing. Securities in the Fund may not match those in an index.
Annual Report 2013
2
Columbia California Intermediate Municipal Bond Fund
Performance Overview (continued)
Performance of a Hypothetical $10,000 Investment (May 1, 2003 – April 30, 2013)
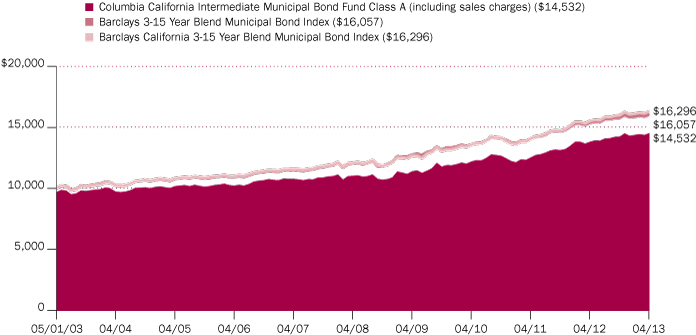
The chart above shows the change in value of a hypothetical $10,000 investment in Class A shares of Columbia California Intermediate Municipal Bond Fund during the stated time period, and does not reflect the deduction of taxes that a shareholder may pay on Fund distributions or on the redemption of Fund shares.
Annual Report 2013
3
Columbia California Intermediate Municipal Bond Fund
Manager Discussion of Fund Performance
For the 12-month period that ended April 30, 2013, the Fund's Class A shares returned 5.12% excluding sales charges. The Fund's primary benchmark, the Barclays 3-15 Year Blend Municipal Bond Index, returned 4.35% and the Fund's secondary benchmark, the Barclays California 3-15 Year Blend Municipal Bond Index, returned 5.01% for the same 12-month period in an environment that favored the lower quality investment-grade segment of the municipal market, the Fund's allocation to A and BBB rated securities was higher than the allocation in its California benchmark, which benefited performance. Exposure to bonds with maturities between eight and 12 years was also greater than the California index — and another plus for the Fund. Together, these two factors helped the Fund produce a higher yield — and a higher return — than either index.
U.S. Economy: Growth in the Slow Lane
Europe's general economic woes, a financial crisis in Cyprus and U.S. struggles to avoid a fiscal cliff of tax increases and various spending cuts (commonly referred to as the sequester) weighed on the global economy throughout the 12-month period ended April 30, 2013. Late in the period, the sequester clouded consumer confidence in the United States, even though it has had little material impact on the economy to date. However, a decrease in the U.S. unemployment rate early in 2013, steady manufacturing activity and a rebound in the housing market are encouraging signs that growth has broadened in recent months. Pent-up demand, low mortgage rates and an improving labor market have lifted home sales. Even so, there has been no real improvement in the overall pace of economic growth since the current cycle of recovery began in 2009. Household income growth is practically nonexistent, and household spending has come under pressure after the expiration of the payroll tax cut. Against this backdrop, U.S. investors bid prices higher on stocks and other volatile assets as central banks continued to pour liquidity into key markets.
Municipal Market Generates Solid Returns
Against this backdrop, the U.S. municipal bond market delivered modest, but solid, returns for the 12-month period. Yields fell across the curve — a line that charts municipal bond yields for securities of comparable quality across a range of maturities from short to long, rallying strongly after the November 2012 presidential election. The market sold off in December, but the retreat was short lived, as weaker economic numbers early in 2013 sent fixed-income investors back to the relative safety of the municipal market. At year end, municipal yields were eight, 18 and 25 basis points lower for five, 10 and 15-year maturities compared to one year ago. Higher quality bonds generally underperformed lower quality bonds. Pre-refunded bonds, which are higher quality and generally shorter in maturity, were the weakest sector among municipals. A pre-refunded bond is created when an issuer refinances existing debt at a lower rate. The proceeds from the lower-yielding issue are invested in U.S. Treasury securities and used to repay the original bond on its original call date. Hospital bonds were generally the strongest performers. Local general obligation bonds outperformed state general obligation bonds by a small margin. For the second consecutive year, rating agencies issued more downgrades than upgrades in the overall municipal market, as a lackluster economy continued to pressure issuers.
Portfolio Management
Brian McGreevy
Paul Fuchs, CFA
Quality Breakdown (%)
(at April 30, 2013) | |
AAA rating | | | 0.2 | | |
AA rating | | | 27.9 | | |
A rating | | | 55.9 | | |
BBB rating | | | 12.1 | | |
Non-investment grade | | | 1.0 | | |
Not rated | | | 2.9 | | |
Total | | | 100.0 | | |
Percentages indicated are based upon total fixed income securities (excluding Money Market Funds).
Bond ratings apply to the underlying holdings of the Fund and not the Fund itself and are divided into categories ranging from AAA (highest) to D (lowest), and are subject to change. The ratings shown are determined by using the middle rating of Moody's, S&P, and Fitch after dropping the highest and lowest available ratings. When a rating from only two agencies is available, the lower rating is used. When a rating from only one agency is available, that rating is used. When a bond is not rated by any of these agencies, it is designated as Not rated. Credit ratings are subjective opinions and not statements of fact.
Annual Report 2013
4
Columbia California Intermediate Municipal Bond Fund
Manager Discussion of Fund Performance (continued)
Lower Quality, Longer-Intermediate Maturities Aided Results
Bonds with maturities longer than 17 years and those rated A and lower were the Fund's best performers for the period. State and local general obligation bonds and transportation-related issues also benefited results. Holdings in these sectors tended to have longer maturities than their index counterparts, which helped them outperform as longer-term yields declined during the period. Bonds maturing in two years or less were the period's worst performers as they offered almost no yield at all. Because short-term rates remain low, we reduced holdings in this maturity range and expect to continue to limit the Fund's assets invested in it.
California's Recovery Broadens
Despite weakness in technology manufacturing, an increase in business costs from new environmental regulations and the impact of declining property values and pension obligations on local governments, California's economy appears to be on the mend on all fronts. Consumer spending and tourism are contributing to job gains. The housing market is improving as foreclosures decline and limited inventory drives prices higher. Tax hikes on higher income residents have helped improve the state's fiscal outlook while sequestration has the potential to weigh on California's defense industry, which is a near-term concern. Longer term, however, California's world-class educational institutions, ample foreign trade and new opportunities in distribution for major Internet companies continue to support its prospects for growth.
In this environment, we expect to continue emphasizing the quality, sector and maturity profile of the Fund versus its benchmarks. We expect to seek out issues rated A and BBB across sectors that mature in 10-14 years, while maintaining a dollar-weighted average portfolio maturity of between three and ten years, as we believe they are currently attractive. We believe the overall demand for California municipal bonds should continue to grow because of the state's high tax environment. With a seasoned staff of credit professionals, we believe we are well positioned to discover value opportunities that offer incremental yield and appropriate fundamentals in California's municipal market.
Annual Report 2013
5
Columbia California Intermediate Municipal Bond Fund
Understanding Your Fund's Expenses
(Unaudited)
As an investor, you incur two types of costs. There are transaction costs, which generally include sales charges on purchases and may include redemption fees. There are also ongoing costs, which generally include management fees, distribution and service (Rule 12b-1) fees, and other fund expenses. The following information is intended to help you understand your ongoing costs (in dollars) of investing in the Fund and to help you compare these costs with the ongoing costs of investing in other mutual funds.
Analyzing Your Fund's Expenses
To illustrate these ongoing costs, we have provided examples and calculated the expenses paid by investors in each share class of the Fund during the period. The actual and hypothetical information in the table is based on an initial investment of $1,000 at the beginning of the period indicated and held for the entire period. Expense information is calculated two ways and each method provides you with different information. The amount listed in the "Actual" column is calculated using the Fund's actual operating expenses and total return for the period. You may use the Actual information, together with the amount invested, to estimate the expenses that you paid over the period. Simply divide your account value by $1,000 (for example, an $8,600 account value divided by $1,000 = 8.6), then multiply the results by the expenses paid during the period under the Actual column. The amount listed in the "Hypothetical" column assumes a 5% annual rate of return before expenses (which is not the Fund's actual return) and then applies the Fund's actual expense ratio for the period to the hypothetical return. You should not use the hypothetical account values and expenses to estimate either your actual account balance at the end of the period or the expenses you paid during the period. See "Compare With Other Funds" below for details on how to use the hypothetical data.
Compare With Other Funds
Since all mutual funds are required to include the same hypothetical calculations about expenses in shareholder reports, you can use this information to compare the ongoing cost of investing in the Fund with other funds. To do so, compare the hypothetical example with the 5% hypothetical examples that appear in the shareholder reports of other funds. As you compare hypothetical examples of other funds, it is important to note that hypothetical examples are meant to highlight the ongoing costs of investing in a fund only and do not reflect any transaction costs, such as sales charges, or redemption or exchange fees. Therefore, the hypothetical calculations are useful in comparing ongoing costs only, and will not help you determine the relative total costs of owning different funds. If transaction costs were included in these calculations, your costs would be higher.
November 1, 2012 – April 30, 2013
| | Account Value at the Beginning
of the Period ($) | | Account Value at the End of the
Period ($) | | Expenses Paid During the
Period ($) | | Fund's Annualized
Expense Ratio (%) | |
| | Actual | | Hypothetical | | Actual | | Hypothetical | | Actual | | Hypothetical | | Actual | |
Class A | | | 1,000.00 | | | | 1,000.00 | | | | 1,020.50 | | | | 1,021.17 | | | | 3.66 | | | | 3.66 | | | | 0.73 | | |
Class B | | | 1,000.00 | | | | 1,000.00 | | | | 1,016.70 | | | | 1,017.46 | | | | 7.40 | | | | 7.40 | | | | 1.48 | | |
Class C | | | 1,000.00 | | | | 1,000.00 | | | | 1,016.70 | | | | 1,017.46 | | | | 7.40 | | | | 7.40 | | | | 1.48 | | |
Class R4 | | | 1,000.00 | | | | 1,000.00 | | | | 1,013.20 | * | | | 1,022.61 | | | | 0.50 | * | | | 2.21 | | | | 0.44 | * | |
Class R5 | | | 1,000.00 | | | | 1,000.00 | | | | 1,015.70 | ** | | | 1,022.86 | | | | 1.85 | ** | | | 1.96 | | | | 0.39 | ** | |
Class Z | | | 1,000.00 | | | | 1,000.00 | | | | 1,021.80 | | | | 1,022.41 | | | | 2.41 | | | | 2.41 | | | | 0.48 | | |
*For the period March 19, 2013 through April 30, 2013. Class R4 shares commenced operations on March 19, 2013.
**For the period November 8, 2012 through April 30, 2013. Class R5 shares commenced operations on November 8, 2012.
Expenses paid during the period are equal to the annualized expense ratio for each class as indicated above, multiplied by the average account value over the period and then multiplied by the number of days in the Fund's most recent fiscal half year and divided by 365.
Expenses do not include fees and expenses incurred indirectly by the Fund from the underlying funds in which the Fund may invest (also referred to as "acquired funds"), including affiliated and non-affiliated pooled investment vehicles (including mutual funds and exchange-traded funds).
Had Columbia Management Investment Advisers, LLC and/or certain of its affiliates not waived/reimbursed certain fees and expenses, account value at the end of the period would have been reduced.
Annual Report 2013
6
Columbia California Intermediate Municipal Bond Fund
Portfolio of Investments
April 30, 2013
(Percentages represent value of investments compared to net assets)
Municipal Bonds 97.9%
Issue
Description | | Coupon
Rate | | Principal
Amount ($) | | Value ($) | |
Airport 3.1% | |
City of San Jose
Revenue Bonds
Series 2007B (AMBAC)
03/01/22 | | | 5.000 | % | | | 1,000,000 | | | | 1,102,460 | | |
County of Orange
Revenue Bonds
Series 2009A
07/01/25 | | | 5.250 | % | | | 1,500,000 | | | | 1,744,680 | | |
County of Sacramento
Revenue Bonds
Senior Series 2008 (AGM)
07/01/23 | | | 5.000 | % | | | 1,000,000 | | | | 1,165,390 | | |
San Diego County Regional Airport Authority
Revenue Bonds
Subordinated Series 2010A
07/01/24 | | | 5.000 | % | | | 1,000,000 | | | | 1,177,140 | | |
San Francisco City & County Airports Commission
Refunding Revenue Bonds
2nd Series 2009C (AGM)
05/01/18 | | | 5.000 | % | | | 1,825,000 | | | | 2,187,974 | | |
Revenue Bonds
Series 2011G
05/01/26 | | | 5.250 | % | | | 2,000,000 | | | | 2,412,260 | | |
Total | | | | | | | 9,789,904 | | |
Higher Education 6.0% | |
California Educational Facilities Authority
Revenue Bonds
California Lutheran University
Series 2008
10/01/21 | | | 5.250 | % | | | 1,500,000 | | | | 1,694,430 | | |
Pitzer College
Series 2005A
04/01/25 | | | 5.000 | % | | | 1,270,000 | | | | 1,350,048 | | |
Series 2009
04/01/19 | | | 5.000 | % | | | 1,610,000 | | | | 1,900,798 | | |
University Southern California
Series 2009C
10/01/24 | | | 5.250 | % | | | 3,000,000 | | | | 3,992,760 | | |
California Municipal Finance Authority
Revenue Bonds
Biola University
Series 2013
10/01/24 | | | 5.000 | % | | | 505,000 | | | | 594,415 | | |
10/01/28 | | | 5.000 | % | | | 840,000 | | | | 957,861 | | |
California State Public Works Board
Refunding Revenue Bonds
California State University
Series 2006A (NPFGC/FGIC)
10/01/16 | | | 5.000 | % | | | 1,000,000 | | | | 1,141,470 | | |
Municipal Bonds (continued)
Issue
Description | | Coupon
Rate | | Principal
Amount ($) | | Value ($) | |
Revenue Bonds
University California Institute Project
Series 2005C
04/01/16 | | | 5.000 | % | | | 1,000,000 | | | | 1,086,910 | | |
Various University of California Projects
Series 2005D
05/01/15 | | | 5.000 | % | | | 1,000,000 | | | | 1,091,260 | | |
California State University
Revenue Bonds
Systemwide
Series 2009A
11/01/22 | | | 5.250 | % | | | 2,500,000 | | | | 2,980,800 | | |
California Statewide Communities Development Authority
Revenue Bonds
Lancer Plaza Project
Series 2013(a)
11/01/23 | | | 5.125 | % | | | 1,000,000 | | | | 1,000,400 | | |
University of California
Revenue Bonds
Series 2009O
05/15/20 | | | 5.000 | % | | | 1,000,000 | | | | 1,218,260 | | |
Total | | | | | | | 19,009,412 | | |
Hospital 7.5% | |
ABAG Finance Authority for Nonprofit Corps.
Revenue Bonds
Sharp Healthcare
Series 2011A
08/01/24 | | | 5.250 | % | | | 2,750,000 | | | | 3,270,217 | | |
California Health Facilities Financing Authority
Refunding Revenue Bonds
Sutter Health
Series 2011D
08/15/26 | | | 5.000 | % | | | 2,250,000 | | | | 2,665,800 | | |
Revenue Bonds
Adventist Health System/West
Series 2013-A
03/01/28 | | | 4.000 | % | | | 2,000,000 | | | | 2,106,380 | | |
Catholic Healthcare West
Series 2009A
07/01/29 | | | 6.000 | % | | | 1,250,000 | | | | 1,515,363 | | |
Series 2009E
07/01/25 | | | 5.625 | % | | | 1,500,000 | | | | 1,758,915 | | |
Children's Hospital of Orange County
Series 2009A
11/01/21 | | | 6.000 | % | | | 2,000,000 | | | | 2,505,840 | | |
City of Hope Obligation Group
Series 2012-A
11/15/21 | | | 5.000 | % | | | 600,000 | | | | 742,950 | | |
California Statewide Communities Development Authority
Revenue Bonds
Health Facility Adventist Health System West
Series 2005A
03/01/17 | | | 5.000 | % | | | 1,000,000 | | | | 1,073,380 | | |
The accompanying Notes to Financial Statements are an integral part of this statement.
Annual Report 2013
7
Columbia California Intermediate Municipal Bond Fund
Portfolio of Investments (continued)
April 30, 2013
Municipal Bonds (continued)
Issue
Description | | Coupon
Rate | | Principal
Amount ($) | | Value ($) | |
John Muir Health
Series 2006A
08/15/17 | | | 5.000 | % | | | 3,000,000 | | | | 3,401,430 | | |
Kaiser Permanente
Series 2009A
04/01/19 | | | 5.000 | % | | | 2,000,000 | | | | 2,419,040 | | |
Sutter Health
Series 2011A
08/15/26 | | | 5.500 | % | | | 1,000,000 | | | | 1,199,820 | | |
City of Newport Beach
Revenue Bonds
Hoag Memorial Hospital Presbyterian
Series 2011
12/01/30 | | | 5.875 | % | | | 1,000,000 | | | | 1,250,540 | | |
Total | | | | | | | 23,909,675 | | |
Independent Power 3.1% | |
Kings River Conservation District
Certificate of Participation
Peaking Project
Series 2004
05/01/14 | | | 5.000 | % | | | 3,135,000 | | | | 3,269,586 | | |
Sacramento Municipal Utility District
Revenue Bonds
Cosumnes Project
Series 2006 (NPFGC)
07/01/15 | | | 5.000 | % | | | 1,000,000 | | | | 1,083,150 | | |
07/01/29 | | | 5.125 | % | | | 2,000,000 | | | | 2,197,120 | | |
Sacramento Power Authority
Refunding Revenue Bonds
Series 2005 (AMBAC)
07/01/15 | | | 5.250 | % | | | 3,000,000 | | | | 3,281,430 | | |
Total | | | | | | | 9,831,286 | | |
Joint Power Authority 5.8% | |
California Infrastructure & Economic Development Bank
Revenue Bonds
California Independent System Operator
Series 2009A
02/01/22 | | | 5.250 | % | | | 1,900,000 | | | | 2,040,733 | | |
M-S-R Public Power Agency
Revenue Bonds
Subordinated Lien
Series 2008L (AGM)
07/01/21 | | | 5.000 | % | | | 2,500,000 | | | | 2,917,400 | | |
Northern California Power Agency
Refunding Revenue Bonds
Hydroelectric Project No. 1
Series 2008C (AGM)
07/01/22 | | | 5.000 | % | | | 3,000,000 | | | | 3,509,130 | | |
Municipal Bonds (continued)
Issue
Description | | Coupon
Rate | | Principal
Amount ($) | | Value ($) | |
Sacramento Municipal Utility District
Refunding Revenue Bonds
Series 2013B(a)
08/15/26 | | | 5.000 | % | | | 1,000,000 | | | | 1,216,220 | | |
Southern California Public Power Authority
Refunding Revenue Bonds
Sanitary Power Project
Series 2005A (AGM)
01/01/18 | | | 5.000 | % | | | 2,000,000 | | | | 2,151,160 | | |
Series 2008A
07/01/22 | | | 5.000 | % | | | 2,000,000 | | | | 2,347,020 | | |
Revenue Bonds
Series 1989
07/01/13 | | | 6.750 | % | | | 3,000,000 | | | | 3,031,380 | | |
Southern Transmission Project
Series 2008
07/01/27 | | | 6.000 | % | | | 1,000,000 | | | | 1,200,670 | | |
Total | | | | | | | 18,413,713 | | |
Local Appropriation 7.1% | |
City & County of San Francisco
Certificate of Participation
Multiple Capital Improvement Projects
Series 2009B
04/01/24 | | | 5.000 | % | | | 1,495,000 | | | | 1,734,903 | | |
City of Vista
Certificate of Participation
Community Projects
Series 2007 (NPFGC)
05/01/21 | | | 4.750 | % | | | 750,000 | | | | 809,257 | | |
County of Monterey
Certificate of Participation
Refinancing Project
Series 2009 (AGM)
08/01/17 | | | 5.000 | % | | | 1,000,000 | | | | 1,146,630 | | |
Los Angeles Community Redevelopment Agency
Revenue Bonds
VT Manchester Social Services Project
Series 2005 (AMBAC)
09/01/15 | | | 5.000 | % | | | 1,095,000 | | | | 1,195,422 | | |
Los Angeles Municipal Improvement Corp.
Refunding Revenue Bonds
Special Tax-Police Emergency
Series 2002G (NPFGC/FGIC)
09/01/13 | | | 5.250 | % | | | 1,500,000 | | | | 1,525,275 | | |
Oakland Joint Powers Financing Authority
Refunding Revenue Bonds
Oakland Administration Buildings
Series 2008B (AGM)
08/01/22 | | | 5.000 | % | | | 2,000,000 | | | | 2,289,120 | | |
The accompanying Notes to Financial Statements are an integral part of this statement.
Annual Report 2013
8
Columbia California Intermediate Municipal Bond Fund
Portfolio of Investments (continued)
April 30, 2013
Municipal Bonds (continued)
Issue
Description | | Coupon
Rate | | Principal
Amount ($) | | Value ($) | |
Pasadena Public Financing Authority
Revenue Bonds
Rose Bowl Renovation
Series 2010A
03/01/26 | | | 5.000 | % | | | 2,500,000 | | | | 2,910,625 | | |
Pico Rivera Public Financing Authority
Revenue Bonds
Series 2009
09/01/26 | | | 5.250 | % | | | 1,085,000 | | | | 1,235,609 | | |
Richmond Joint Powers Financing Authority
Refunding Revenue Bonds
Lease-Civic Center Project
Series 2009 (AGM)
08/01/17 | | | 5.000 | % | | | 1,570,000 | | | | 1,786,676 | | |
Riverside Public Financing Authority
Refunding Revenue Bonds
Series 2012-A
11/01/28 | | | 5.000 | % | | | 1,155,000 | | | | 1,273,411 | | |
San Mateo Joint Powers Financing Authority
Refunding Revenue Bonds
Youth Services Campus
Series 2008A
07/15/20 | | | 5.000 | % | | | 435,000 | | | | 505,748 | | |
07/15/28 | | | 5.250 | % | | | 2,275,000 | | | | 2,625,919 | | |
Santa Clara County Financing Authority
Refunding Revenue Bonds
Multiple Facilities Projects
Series 2010N
05/15/17 | | | 5.000 | % | | | 1,000,000 | | | | 1,146,160 | | |
Ventura County Public Financing Authority
Revenue Bonds
Series 2013A
11/01/29 | | | 5.000 | % | | | 1,000,000 | | | | 1,156,250 | | |
11/01/30 | | | 5.000 | % | | | 1,200,000 | | | | 1,381,092 | | |
Total | | | | | | | 22,722,097 | | |
Local General Obligation 14.8% | |
Burbank Unified School District
Unlimited General Obligation Bonds
Capital Appreciation
Series 1998B (NPFGC/FGIC)(b)
08/01/14 | | | 0.000 | % | | | 3,000,000 | | | | 2,977,200 | | |
City & County of San Francisco
Unlimited General Obligation Bonds
Earthquake Safety
Series 2010E
06/15/27 | | | 5.000 | % | | | 3,380,000 | | | | 3,958,453 | | |
City of Los Angeles
Unlimited General Obligation Bonds
Series 2011A
09/01/25 | | | 5.000 | % | | | 3,000,000 | | | | 3,629,700 | | |
Municipal Bonds (continued)
Issue
Description | | Coupon
Rate | | Principal
Amount ($) | | Value ($) | |
Compton Community College District
Unlimited General Obligation Refunding Bonds
Series 2012
07/01/22 | | | 5.000 | % | | | 2,095,000 | | | | 2,428,692 | | |
Compton Unified School District(b)
Unlimited General Obligation Bonds
Election of 2002 - Capital Appreciation
Series 2006C (AMBAC)
06/01/23 | | | 0.000 | % | | | 2,025,000 | | | | 1,335,852 | | |
06/01/24 | | | 0.000 | % | | | 1,925,000 | | | | 1,204,742 | | |
Culver City School Facilities Financing Authority
Revenue Bonds
Unified School District
Series 2005 (AGM)
08/01/23 | | | 5.500 | % | | | 1,490,000 | | | | 1,965,951 | | |
East Bay Municipal Utility District
Unlimited General Obligation Refunding Bonds
Wastewater System
Series 2003F (AMBAC)
04/01/15 | | | 5.000 | % | | | 1,000,000 | | | | 1,020,100 | | |
East Side Union High School District
Unlimited General Obligation Refunding Bonds
2012 Crossover
Series 2006 (AGM)
09/01/20 | | | 5.250 | % | | | 1,280,000 | | | | 1,575,885 | | |
Long Beach Community College District
Unlimited General Obligation Bonds
2008 Election
Series 2012-B
08/01/23 | | | 5.000 | % | | | 700,000 | | | | 879,095 | | |
Los Alamitos Unified School District
Unlimited General Obligation Bonds
School Facilities Improvement
BAN Series 2011(b)
09/01/16 | | | 0.000 | % | | | 2,000,000 | | | | 1,933,220 | | |
Los Angeles Unified School District
Unlimited General Obligation Bonds
Election of 2004
Series 2006G (AMBAC)
07/01/20 | | | 5.000 | % | | | 1,000,000 | | | | 1,132,070 | | |
Palomar Community College District
Unlimited General Obligation Bonds
Capital Appreciation-Election of 2006
Series 2010B(b)
08/01/22 | | | 0.000 | % | | | 2,140,000 | | | | 1,617,262 | | |
Rancho Santiago Community College District
Unlimited General Obligation Refunding Bonds
Series 2005 (AGM)
09/01/19 | | | 5.250 | % | | | 1,000,000 | | | | 1,254,690 | | |
The accompanying Notes to Financial Statements are an integral part of this statement.
Annual Report 2013
9
Columbia California Intermediate Municipal Bond Fund
Portfolio of Investments (continued)
April 30, 2013
Municipal Bonds (continued)
Issue
Description | | Coupon
Rate | | Principal
Amount ($) | | Value ($) | |
Rancho Santiago Community College District(b)
Unlimited General Obligation Bonds
Capital Appreciation-Election of 2002
Series 2006C (AGM)
09/01/31 | | | 0.000 | % | | | 3,785,000 | | | | 1,697,951 | | |
Rescue Union School District
Unlimited General Obligation Bonds
Capital Appreciation-Election of 1998
Series 2005 (NPFGC)(b)
09/01/26 | | | 0.000 | % | | | 1,100,000 | | | | 646,382 | | |
Riverside Public Financing Authority
Refunding Revenue Bonds
Series 2012-A
11/01/27 | | | 5.000 | % | | | 2,145,000 | | | | 2,380,006 | | |
San Mateo County Community College District
Unlimited General Obligation Bonds
Capital Appreciation-Election of 2005
Series 2006A (NPFGC)(b)
09/01/15 | | | 0.000 | % | | | 1,000,000 | | | | 986,710 | | |
San Mateo Foster City School District
Revenue Bonds
Series 2005 (AGM)
08/15/19 | | | 5.500 | % | | | 2,000,000 | | | | 2,534,060 | | |
Saugus Union School District
Unlimited General Obligation Refunding Bonds
Series 2006 (NPFGC/FGIC)
08/01/21 | | | 5.250 | % | | | 2,375,000 | | | | 2,955,046 | | |
Simi Valley School Financing Authority
Refunding Revenue Bonds
Simi Valley Unified School District
Series 2007
08/01/18 | | | 5.000 | % | | | 1,045,000 | | | | 1,254,878 | | |
West Contra Costa Unified School District
Unlimited General Obligation Refunding Bonds
Series 2011 (AGM)
08/01/23 | | | 5.250 | % | | | 3,000,000 | | | | 3,605,070 | | |
Series 2012
08/01/27 | | | 5.000 | % | | | 2,365,000 | | | | 2,725,662 | | |
William S. Hart Union High School District
Unlimited General Obligation Bonds
2008 Election
Series 2013C
08/01/27 | | | 4.000 | % | | | 1,500,000 | | | | 1,639,815 | | |
Total | | | | | | | 47,338,492 | | |
Multi-Family 1.2% | |
California Statewide Communities Development Authority
Refunding Revenue Bonds
University of California Irvine East Campus Apartments
Series 2012
05/15/19 | | | 5.000 | % | | | 1,000,000 | | | | 1,171,780 | | |
05/15/20 | | | 5.000 | % | | | 750,000 | | | | 883,162 | | |
Municipal Bonds (continued)
Issue
Description | | Coupon
Rate | | Principal
Amount ($) | | Value ($) | |
Revenue Bonds
CHF-Irvine LLC-UCI East Campus
Series 2008
05/15/17 | | | 5.000 | % | | | 1,500,000 | | | | 1,700,085 | | |
Total | | | | | | | 3,755,027 | | |
Municipal Power 8.4% | |
Anaheim Public Financing Authority
Revenue Bonds
Distribution System Electric
Series 1999 (AMBAC)
10/01/13 | | | 5.000 | % | | | 1,500,000 | | | | 1,527,270 | | |
California State Department of Water Resources
Revenue Bonds
Series 2005G-11
05/01/18 | | | 5.000 | % | | | 2,000,000 | | | | 2,405,020 | | |
City of Riverside Electric
Revenue Bonds
Series 2008D (AGM)
10/01/23 | | | 5.000 | % | | | 1,000,000 | | | | 1,157,380 | | |
City of Santa Clara
Refunding Revenue Bonds
Series 2011A
07/01/29 | | | 5.375 | % | | | 1,000,000 | | | | 1,180,430 | | |
City of Vernon Electric System
Revenue Bonds
Series 2009A
08/01/21 | | | 5.125 | % | | | 2,000,000 | | | | 2,284,760 | | |
Colton Public Financing Authority
Refunding Revenue Bonds
Series 2012-A
04/01/28 | | | 5.000 | % | | | 1,735,000 | | | | 1,978,507 | | |
Imperial Irrigation District
Refunding Revenue Bonds
Systems
Series 2008
11/01/21 | | | 5.250 | % | | | 2,500,000 | | | | 2,961,175 | | |
Series 2011D
11/01/22 | | | 5.000 | % | | | 2,860,000 | | | | 3,475,815 | | |
11/01/23 | | | 5.000 | % | | | 1,040,000 | | | | 1,252,462 | | |
Los Angeles Department of Water & Power
Revenue Bonds
Power System
Series 2009B
07/01/23 | | | 5.250 | % | | | 2,000,000 | | | | 2,426,520 | | |
Subordinated Series 2007A-1 (AMBAC)
07/01/19 | | | 5.000 | % | | | 1,000,000 | | | | 1,177,340 | | |
Sacramento Municipal Utility District
Revenue Bonds
Series 2008U (AGM)
08/15/21 | | | 5.000 | % | | | 1,500,000 | | | | 1,770,195 | | |
The accompanying Notes to Financial Statements are an integral part of this statement.
Annual Report 2013
10
Columbia California Intermediate Municipal Bond Fund
Portfolio of Investments (continued)
April 30, 2013
Municipal Bonds (continued)
Issue
Description | | Coupon
Rate | | Principal
Amount ($) | | Value ($) | |
Tuolumne Wind Project Authority
Revenue Bonds
Tuolumne Co. Project
Series 2009
01/01/22 | | | 5.000 | % | | | 1,000,000 | | | | 1,173,480 | | |
Walnut Energy Center Authority
Revenue Bonds
Series 2004A (AMBAC)
01/01/16 | | | 5.000 | % | | | 2,055,000 | | | | 2,120,246 | | |
Total | | | | | | | 26,890,600 | | |
Oil & Gas 0.6% | |
California Pollution Control Financing Authority
Refunding Revenue Bonds
BP West Coast Products LLC
Series 2009(c)
12/01/46 | | | 2.600 | % | | | 2,000,000 | | | | 2,056,600 | | |
Other Bond Issue 0.8% | |
Long Beach Bond Finance Authority
Refunding Revenue Bonds
Aquarium of the Pacific
Series 2012
11/01/27 | | | 5.000 | % | | | 2,210,000 | | | | 2,565,324 | | |
Ports 1.2% | |
Los Angeles Harbor Department
Revenue Bonds
Series 2009A
08/01/23 | | | 5.250 | % | | | 2,000,000 | | | | 2,430,520 | | |
Port of Oakland
Refunding Revenue Bonds
Intermediate Lien
Series 2007B (NPFGC)
11/01/29 | | | 5.000 | % | | | 1,165,000 | | | | 1,256,348 | | |
Total | | | | | | | 3,686,868 | | |
Prepaid Gas 0.8% | |
M-S-R Energy Authority
Revenue Bonds
Series 2009B
11/01/29 | | | 6.125 | % | | | 2,000,000 | | | | 2,537,880 | | |
Refunded/Escrowed 1.4% | |
Bay Area Toll Authority
Prerefunded 04/01/16 Revenue Bonds
San Francisco Bay Area
Series 2006F (FHLMC/FNMA)
04/01/22 | | | 5.000 | % | | | 1,100,000 | | | | 1,243,286 | | |
Municipal Bonds (continued)
Issue
Description | | Coupon
Rate | | Principal
Amount ($) | | Value ($) | |
California Health Facilities Financing Authority
Revenue Bonds
Insured Episcopal Home
Series 2010B Escrowed to Maturity
02/01/19 | | | 5.100 | % | | | 730,000 | | | | 828,389 | | |
Orange County Water District
Prerefunded 08/15/13 Certificate of Participation
Series 2003B (NPFGC)
08/15/17 | | | 5.375 | % | | | 650,000 | | | | 659,809 | | |
San Ramon Valley Unified School District
Prerefunded 08/01/14 Unlimited General Obligation Bonds
Election of 2002
Series 2004 (AGM)
08/01/16 | | | 5.250 | % | | | 1,800,000 | | | | 1,911,042 | | |
Total | | | | | | | 4,642,526 | | |
Retirement Communities 2.4% | |
ABAG Finance Authority for Nonprofit Corps.
Refunding Revenue Bonds
Episcopal Senior Communities
Series 2011
07/01/24 | | | 5.375 | % | | | 2,795,000 | | | | 3,210,449 | | |
Revenue Bonds
Casa de Las Campanas, Inc.
Series 2010
09/01/15 | | | 4.000 | % | | | 1,500,000 | | | | 1,597,635 | | |
California Health Facilities Financing Authority
Revenue Bonds
Insured California Nevada-Methodist
Series 2006
07/01/26 | | | 5.000 | % | | | 1,000,000 | | | | 1,097,370 | | |
California Statewide Communities Development Authority
Refunding Revenue Bonds
Episcopal Communities and Services
Series 2012
05/15/27 | | | 5.000 | % | | | 1,520,000 | | | | 1,714,560 | | |
Total | | | | | | | 7,620,014 | | |
Special Non Property Tax 2.0% | |
State of California
Unlimited General Obligation Bonds
Series 2004A (FGIC/NPFGC)
07/01/14 | | | 5.250 | % | | | 1,000,000 | | | | 1,057,860 | | |
Unlimited General Obligation Refunding Bonds
Series 2009A
07/01/18 | | | 5.000 | % | | | 3,000,000 | | | | 3,607,350 | | |
Virgin Islands Public Finance Authority
Revenue Bonds
Matching Fund Loan-Senior Lien
Series 2010A(d)
10/01/20 | | | 5.000 | % | | | 1,490,000 | | | | 1,733,406 | | |
Total | | | | | | | 6,398,616 | | |
The accompanying Notes to Financial Statements are an integral part of this statement.
Annual Report 2013
11
Columbia California Intermediate Municipal Bond Fund
Portfolio of Investments (continued)
April 30, 2013
Municipal Bonds (continued)
Issue
Description | | Coupon
Rate | | Principal
Amount ($) | | Value ($) | |
Special Property Tax 6.1% | |
Chino Public Financing Authority
Refunding Special Tax Bonds
Series 2012
09/01/23 | | | 5.000 | % | | | 1,070,000 | | | | 1,162,181 | | |
County of El Dorado
Refunding Special Tax Bonds
Community Facilities District No. 92-1
Series 2012
09/01/26 | | | 5.000 | % | | | 630,000 | | | | 710,564 | | |
09/01/27 | | | 5.000 | % | | | 805,000 | | | | 896,802 | | |
Culver City Redevelopment Finance Authority
Refunding Tax Allocation Bonds
Series 1993 (AMBAC)
11/01/14 | | | 5.500 | % | | | 740,000 | | | | 757,057 | | |
Fontana Public Finance Authority
Tax Allocation Bonds
Subordinated Lien-North Fontana Redevelopment
Series 2005A (AMBAC)
10/01/20 | | | 5.000 | % | | | 1,515,000 | | | | 1,637,882 | | |
Inglewood Redevelopment Agency
Refunding Tax Allocation Bonds
Merged Redevelopment Project
Series 1998A (AMBAC)
05/01/17 | | | 5.250 | % | | | 1,425,000 | | | | 1,567,101 | | |
Long Beach Bond Finance Authority
Tax Allocation Bonds
Industrial Redevelopment Project Areas
Series 2002B (AMBAC)
11/01/19 | | | 5.500 | % | | | 1,070,000 | | | | 1,232,298 | | |
Oakland Redevelopment Agency
Refunding Senior Tax Allocation Bonds
Central District Redevelopment
Series 1992 (AMBAC)
02/01/14 | | | 5.500 | % | | | 685,000 | | | | 699,597 | | |
Poway Unified School District
Special Tax Bonds
Community Facilities District No. 6-4S Ranch
Series 2012
09/01/28 | | | 5.000 | % | | | 1,785,000 | | | | 2,061,175 | | |
09/01/29 | | | 5.000 | % | | | 1,205,000 | | | | 1,381,954 | | |
Redwood City Redevelopment Agency
Tax Allocation Bonds
Redevelopment Project Area No. 2
Series 2003A (AMBAC)
07/15/13 | | | 5.250 | % | | | 1,000,000 | | | | 1,007,240 | | |
San Francisco City & County Redevelopment Agency
Tax Allocation Bonds
San Francisco Redevelopment Projects
Series 2009B
08/01/18 | | | 5.000 | % | | | 1,255,000 | | | | 1,404,458 | | |
Santa Clara Redevelopment Agency
Tax Allocation Bonds
Capital Appreciation-Bayshore North Project
Series 2011(b)
06/01/14 | | | 0.000 | % | | | 1,005,000 | | | | 987,061 | | |
Municipal Bonds (continued)
Issue
Description | | Coupon
Rate | | Principal
Amount ($) | | Value ($) | |
Sulphur Springs Union School District
Refunding Special Tax Bonds
Community Facilities District No. 2002-1-SE
Series 2012
09/01/28 | | | 5.000 | % | | | 1,050,000 | | | | 1,158,623 | | |
09/01/29 | | | 5.000 | % | | | 1,180,000 | | | | 1,287,451 | | |
Tustin Community Redevelopment Agency
Tax Allocation Bonds
MCAS-Tustin Redevelopment Project Area
Series 2010
09/01/25 | | | 5.000 | % | | | 1,250,000 | | | | 1,383,437 | | |
Total | | | | | | | 19,334,881 | | |
State Appropriated 5.4% | |
Bay Area Infrastructure Financing Authority
Revenue Bonds
State Payment Acceleration Notes
Series 2006 (FGIC/NPFGC)
08/01/17 | | | 5.000 | % | | | 2,000,000 | | | | 2,105,080 | | |
Series 2006 (XLCA)
08/01/17 | | | 5.000 | % | | | 2,000,000 | | | | 2,021,780 | | |
California State Public Works Board
Refunding Revenue Bonds
Various Capital Projects
Series 2012G
11/01/28 | | | 5.000 | % | | | 3,000,000 | | | | 3,433,740 | | |
Revenue Bonds
Department General Services
Series 2006A
04/01/28 | | | 5.000 | % | | | 1,000,000 | | | | 1,062,110 | | |
Department of General Services-Butterfeld State
Series 2005A
06/01/15 | | | 5.000 | % | | | 1,200,000 | | | | 1,311,564 | | |
Various Capital Projects
Series 2011A
10/01/20 | | | 5.000 | % | | | 2,000,000 | | | | 2,451,940 | | |
Subordinated Series 2009I-1
11/01/17 | | | 5.000 | % | | | 2,000,000 | | | | 2,352,960 | | |
Subordinated Series 2010A-1
03/01/22 | | | 5.250 | % | | | 2,000,000 | | | | 2,437,680 | | |
Total | | | | | | | 17,176,854 | | |
State General Obligation 9.2% | |
Commonwealth of Puerto Rico
Unlimited General Obligation Refunding Public
Improvement Bonds
Series 2007A (FGIC)(d)
07/01/21 | | | 5.500 | % | | | 1,500,000 | | | | 1,580,565 | | |
State of California
Refunding Unlimited General Obligation Bonds
Various Purpose
Series 2012
09/01/27 | | | 4.000 | % | | | 5,600,000 | | | | 6,073,424 | | |
Unlimited General Obligation Bonds
Series 2010
11/01/24 | | | 5.000 | % | | | 5,000,000 | | | | 6,050,550 | | |
The accompanying Notes to Financial Statements are an integral part of this statement.
Annual Report 2013
12
Columbia California Intermediate Municipal Bond Fund
Portfolio of Investments (continued)
April 30, 2013
Municipal Bonds (continued)
Issue
Description | | Coupon
Rate | | Principal
Amount ($) | | Value ($) | |
Various Purpose
Series 2007
12/01/26 | | | 5.000 | % | | | 2,000,000 | | | | 2,259,180 | | |
Series 2009
04/01/26 | | | 5.625 | % | | | 2,000,000 | | | | 2,411,180 | | |
10/01/29 | | | 5.250 | % | | | 1,500,000 | | | | 1,757,775 | | |
Series 2011
10/01/19 | | | 5.000 | % | | | 4,000,000 | | | | 4,887,280 | | |
Unlimited General Obligation Refunding Bonds
Series 2007
08/01/18 | | | 5.000 | % | | | 3,750,000 | | | | 4,325,325 | | |
Total | | | | | | | 29,345,279 | | |
Tobacco 0.4% | |
Golden State Tobacco Securitization Corp.
Asset-Backed Revenue Bonds
Series 2005A (AMBAC)
06/01/14 | | | 5.000 | % | | | 1,250,000 | | | | 1,312,525 | | |
Transportation 2.4% | |
Alameda Corridor Transportation Authority
Refunding Revenue Bonds
Senior Lien
Series 2013-A
10/01/23 | | | 5.000 | % | | | 2,160,000 | | | | 2,690,755 | | |
Series 2013A
10/01/24 | | | 5.000 | % | | | 3,500,000 | | | | 4,320,785 | | |
Sacramento Regional Transit District
Revenue Bonds
Farebox
Series 2012
03/01/21 | | | 5.000 | % | | | 500,000 | | | | 596,120 | | |
Total | | | | | | | 7,607,660 | | |
Turnpike/Bridge/Toll Road 0.6% | |
Orange County Transportation Authority
Refunding Revenue Bonds
91 Express Lanes
Series 2003A (AMBAC)
08/15/19 | | | 5.000 | % | | | 2,000,000 | | | | 2,023,920 | | |
Water & Sewer 7.6% | |
City of Fresno Sewer System
Revenue Bonds
Series 2008A
09/01/23 | | | 5.000 | % | | | 1,000,000 | | | | 1,184,150 | | |
City of Los Angeles Wastewater System
Refunding Revenue Bonds
Series 2009A
06/01/25 | | | 5.750 | % | | | 2,000,000 | | | | 2,455,480 | | |
Municipal Bonds (continued)
Issue
Description | | Coupon
Rate | | Principal
Amount ($) | | Value ($) | |
Clovis Public Financing Authority
Revenue Bonds
Series 2007 (AMBAC)
08/01/21 | | | 5.000 | % | | | 1,000,000 | | | | 1,098,050 | | |
Kern County Water Agency Improvement District No. 4
Certificate of Participation
Series 2008A
05/01/22 | | | 5.000 | % | | | 2,020,000 | | | | 2,319,627 | | |
Oxnard Financing Authority
Revenue Bonds
Project
Series 2006
06/01/31 | | | 5.000 | % | | | 4,315,000 | | | | 4,597,632 | | |
Redwood Trunk Sewer & Headworks
Series 2004A (NPFGC/FGIC)
06/01/29 | | | 5.000 | % | | | 2,000,000 | | | | 2,041,520 | | |
Sacramento County Sanitation Districts Financing Authority
Revenue Bonds
County Sanitation District 1
Series 2005 (NPFGC)
08/01/22 | | | 5.000 | % | | | 1,500,000 | | | | 1,656,135 | | |
Sacramento Regional County Sanitation
Series 2006 (NPFGC/FGIC)
12/01/17 | | | 5.000 | % | | | 1,000,000 | | | | 1,136,010 | | |
San Diego Public Facilities Financing Authority
Refunding Revenue Bonds
Senior Series 2009B
05/15/25 | | | 5.250 | % | | | 1,500,000 | | | | 1,800,870 | | |
Series 2010A
08/01/24 | | | 5.000 | % | | | 2,000,000 | | | | 2,422,920 | | |
Semitropic Improvement District
Refunding Revenue Bonds
Series 2012-A
12/01/23 | | | 5.000 | % | | | 2,850,000 | | | | 3,460,470 | | |
Total | | | | | | | 24,172,864 | | |
Total Municipal Bonds
(Cost: $285,055,157) | | | | | | | 312,142,017 | | |
Money Market Funds 1.8%
| | | Shares | | Value ($) | |
JPMorgan Tax-Free Money Market Fund,
0.000%(e) | | | 5,688,036 | | | | 5,688,036 | | |
Total Money Market Funds
(Cost: $5,688,036) | | | | | 5,688,036 | | |
Total Investments
(Cost: $290,743,193) | | | | | 317,830,053 | | |
Other Assets & Liabilities, Net | | | | | 897,948 | | |
Net Assets | | | | | 318,728,001 | | |
The accompanying Notes to Financial Statements are an integral part of this statement.
Annual Report 2013
13
Columbia California Intermediate Municipal Bond Fund
Portfolio of Investments (continued)
April 30, 2013
Notes to Portfolio of Investments
(a) Represents a security purchased on a when-issued or delayed delivery basis.
(b) Zero coupon bond.
(c) Variable rate security.
(d) Municipal obligations include debt obligations issued by or on behalf of territories, possessions, or sovereign nations within the territorial boundaries of the United States. At April 30, 2013, the value of these securities amounted to $3,313,971 or 1.04% of net assets.
(e) The rate shown is the seven-day current annualized yield at April 30, 2013.
Abbreviation Legend
AGM Assured Guaranty Municipal Corporation
AMBAC Ambac Assurance Corporation
BAN Bond Anticipation Note
FGIC Financial Guaranty Insurance Company
FHLMC Federal Home Loan Mortgage Corporation
FNMA Federal National Mortgage Association
NPFGC National Public Finance Guarantee Corporation
XLCA XL Capital Assurance
Fair Value Measurements
Generally accepted accounting principles (GAAP) require disclosure regarding the inputs and valuation techniques used to measure fair value and any changes in valuation inputs or techniques. In addition, investments shall be disclosed by major category.
The Fund categorizes its fair value measurements according to a three-level hierarchy that maximizes the use of observable inputs and minimizes the use of unobservable inputs by prioritizing that the most observable input be used when available. Observable inputs are those that market participants would use in pricing an investment based on market data obtained from sources independent of the reporting entity. Unobservable inputs are those that reflect the Fund's assumptions about the information market participants would use in pricing an investment. An investment's level within the fair value hierarchy is based on the lowest level of any input that is deemed significant to the asset or liability's fair value measurement. The input levels are not necessarily an indication of the risk or liquidity associated with investments at that level. For example, certain U.S. government securities are generally high quality and liquid, however, they are reflected as Level 2 because the inputs used to determine fair value may not always be quoted prices in an active market.
Fair value inputs are summarized in the three broad levels listed below:
> Level 1 — Valuations based on quoted prices for investments in active markets that the Fund has the ability to access at the measurement date (including NAV for open-end mutual funds). Valuation adjustments are not applied to Level 1 investments.
> Level 2 — Valuations based on other significant observable inputs (including quoted prices for similar securities, interest rates, prepayment speeds, credit risks, etc.).
> Level 3 — Valuations based on significant unobservable inputs (including the Fund's own assumptions and judgment in determining the fair value of investments).
Inputs that are used in determining fair value of an investment may include price information, credit data, volatility statistics, and other factors. These inputs can be either observable or unobservable. The availability of observable inputs can vary between investments, and is affected by various factors such as the type of investment, and the volume and level of activity for that investment or similar investments in the marketplace. The inputs will be considered by the Investment Manager, along with any other relevant factors in the calculation of an investment's fair value. The Fund uses prices and inputs that are current as of the measurement date, which may include periods of market dislocations. During these periods, the availability of prices and inputs may be reduced for many investments. This condition could cause an investment to be reclassified between the various levels within the hierarchy.
Investments falling into the Level 3 category are primarily supported by quoted prices from brokers and dealers participating in the market for those investments. However, these may be classified as Level 3 investments due to lack of market transparency and corroboration to support these quoted prices. Additionally, valuation models may be used as the pricing source for any remaining investments classified as Level 3. These models may rely on one or more significant unobservable inputs and/or significant assumptions by the Investment Manager. Inputs used in valuations may include, but are not limited to, financial statement analysis, capital account balances, discount rates and estimated cash flows, and comparable company data.
The accompanying Notes to Financial Statements are an integral part of this statement.
Annual Report 2013
14
Columbia California Intermediate Municipal Bond Fund
Portfolio of Investments (continued)
April 30, 2013
Fair Value Measurements (continued)
Under the direction of the Fund's Board of Trustees (the Board), the Investment Manager's Valuation Committee (the Committee) is responsible for carrying out the valuation procedures approved by the Board. The Committee consists of voting and non-voting members from various groups within the Investment Manager's organization, including operations and accounting, trading and investments, compliance, risk management and legal.
The Committee meets at least monthly to review and approve valuation matters, which may include a description of specific valuation determinations, data regarding pricing information received from approved pricing vendors and brokers and the results of Board-approved valuation control policies and procedures (the Policies). The Policies address, among other things, instances when market quotations are readily available, including recommendations of third party pricing vendors and a determination of appropriate pricing methodologies; events that require specific valuation determinations and assessment of fair value techniques; securities with a potential for stale pricing, including those that are illiquid, restricted, or in default; and the effectiveness of third-party pricing vendors, including periodic reviews of vendors. The Committee meets more frequently, as needed, to discuss additional valuation matters, which may include the need to review back-testing results, review time-sensitive information or approve related valuation actions. The Committee reports to the Board, with members of the Committee meeting with the Board at each of its regularly scheduled meetings to discuss valuation matters and actions during the period, similar to those described earlier.
For investments categorized as Level 3, the Committee monitors information similar to that described above, which may include: (i) data specific to the issuer or comparable issuers, (ii) general market or specific sector news and (iii) quoted prices and specific or similar security transactions. The Committee considers this data and any changes from prior periods in order to assess the reasonableness of observable and unobservable inputs, any assumptions or internal models used to value those securities and changes in fair value. This data is also used to corroborate, when available, information received from approved pricing vendors and brokers. Various factors impact the frequency of monitoring this information (which may occur as often as daily). However, the Committee may determine that changes to inputs, assumptions and models are not required as a result of the monitoring procedures performed.
The following table is a summary of the inputs used to value the Fund's investments at April 30, 2013:
Description | | Level 1
Quoted Prices in Active
Markets for Identical
Assets ($) | | Level 2
Other Significant
Observable Inputs ($) | | Level 3
Significant
Unobservable Inputs ($) | | Total ($) | |
Bonds | |
Municipal Bonds | | | — | | | | 312,142,017 | | | | — | | | | 312,142,017 | | |
Total Bonds | | | — | | | | 312,142,017 | | | | — | | | | 312,142,017 | | |
Other | |
Money Market Funds | | | 5,688,036 | | | | — | | | | — | | | | 5,688,036 | | |
Total Other | | | 5,688,036 | | | | — | | | | — | | | | 5,688,036 | | |
Total | | | 5,688,036 | | | | 312,142,017 | | | | — | | | | 317,830,053 | | |
See the Portfolio of Investments for all investment classifications not indicated in the table.
The Fund's assets assigned to the Level 2 input category are generally valued using the market approach, in which a security's value is determined through reference to prices and information from market transactions for similar or identical assets.
There were no transfers of financial assets between Levels 1 and 2 during the period.
The accompanying Notes to Financial Statements are an integral part of this statement.
Annual Report 2013
15
Columbia California Intermediate Municipal Bond Fund
Statement of Assets and Liabilities
April 30, 2013
Assets | |
Investments, at value (identified cost $290,743,193) | | $ | 317,830,053 | | |
Receivable for: | |
Capital shares sold | | | 393,187 | | |
Interest | | | 3,836,930 | | |
Expense reimbursement due from Investment Manager | | | 1,982 | | |
Prepaid expenses | | | 901 | | |
Total assets | | | 322,063,053 | | |
Liabilities | |
Payable for: | |
Investments purchased on a delayed delivery basis | | | 2,210,519 | | |
Capital shares purchased | | | 157,402 | | |
Dividend distributions to shareholders | | | 822,067 | | |
Investment management fees | | | 3,487 | | |
Distribution and/or service fees | | | 418 | | |
Transfer agent fees | | | 55,181 | | |
Administration fees | | | 601 | | |
Compensation of board members | | | 57,169 | | |
Other expenses | | | 28,208 | | |
Total liabilities | | | 3,335,052 | | |
Net assets applicable to outstanding capital stock | | $ | 318,728,001 | | |
Represented by | |
Paid-in capital | | $ | 291,870,389 | | |
Excess of distributions over net investment income | | | (65,425 | ) | |
Accumulated net realized loss | | | (163,823 | ) | |
Unrealized appreciation (depreciation) on: | |
Investments | | | 27,086,860 | | |
Total — representing net assets applicable to outstanding capital stock | | $ | 318,728,001 | | |
The accompanying Notes to Financial Statements are an integral part of this statement.
Annual Report 2013
16
Columbia California Intermediate Municipal Bond Fund
Statement of Assets and Liabilities (continued)
April 30, 2013
Class A | |
Net assets | | $ | 29,397,604 | | |
Shares outstanding | | | 2,752,954 | | |
Net asset value per share | | $ | 10.68 | | |
Maximum offering price per share(a) | | $ | 11.04 | | |
Class B | |
Net assets | | $ | 19,525 | | |
Shares outstanding | | | 1,828 | | |
Net asset value per share | | $ | 10.68 | | |
Class C | |
Net assets | | $ | 8,004,404 | | |
Shares outstanding | | | 750,044 | | |
Net asset value per share | | $ | 10.67 | | |
Class R4 | |
Net assets | | $ | 2,530 | | |
Shares outstanding | | | 238 | | |
Net asset value per share(b) | | $ | 10.64 | | |
Class R5 | |
Net assets | | $ | 2,506 | | |
Shares outstanding | | | 236 | | |
Net asset value per share(b) | | $ | 10.63 | | |
Class Z | |
Net assets | | $ | 281,301,432 | | |
Shares outstanding | | | 26,404,605 | | |
Net asset value per share | | $ | 10.65 | | |
(a) The maximum offering price per share is calculated by dividing the net asset value by 1.0 minus the maximum sales charge of 3.25%.
(b) Net asset value per share rounds to this amount due to fractional shares outstanding.
The accompanying Notes to Financial Statements are an integral part of this statement.
Annual Report 2013
17
Columbia California Intermediate Municipal Bond Fund
Statement of Operations
Year Ended April 30, 2013
Net investment income | |
Income: | |
Dividends | | $ | 577 | | |
Interest | | | 11,123,041 | | |
Total income | | | 11,123,618 | | |
Expenses: | |
Investment management fees | | | 1,185,451 | | |
Distribution and/or service fees | |
Class A | | | 61,225 | | |
Class B | | | 137 | | |
Class C | | | 60,521 | | |
Transfer agent fees | |
Class A | | | 48,416 | | |
Class B | | | 27 | | |
Class C | | | 11,976 | | |
Class R5(a) | | | 1 | | |
Class Z | | | 524,912 | | |
Administration fees | | | 205,113 | | |
Compensation of board members | | | 22,457 | | |
Custodian fees | | | 3,402 | | |
Printing and postage fees | | | 53,388 | | |
Registration fees | | | 3,528 | | |
Professional fees | | | 36,950 | | |
Other | | | 13,221 | | |
Total expenses | | | 2,230,725 | | |
Fees waived or expenses reimbursed by Investment Manager and its affiliates | | | (683,493 | ) | |
Expense reductions | | | (60 | ) | |
Total net expenses | | | 1,547,172 | | |
Net investment income | | | 9,576,446 | | |
Realized and unrealized gain (loss) — net | |
Net realized gain (loss) on: | |
Investments | | | 130,925 | | |
Net realized gain | | | 130,925 | | |
Net change in unrealized appreciation (depreciation) on: | |
Investments | | | 5,447,610 | | |
Net change in unrealized appreciation (depreciation) | | | 5,447,610 | | |
Net realized and unrealized gain | | | 5,578,535 | | |
Net increase in net assets resulting from operations | | $ | 15,154,981 | | |
(a) For the period from November 8, 2012 (commencement of operations) to April 30, 2013.
The accompanying Notes to Financial Statements are an integral part of this statement.
Annual Report 2013
18
Columbia California Intermediate Municipal Bond Fund
Statement of Changes in Net Assets
| | | Year Ended
April 30,
2013(a)(b) | | Year Ended
April 30,
2012(c) | | Year Ended
March 31,
2012 | |
Operations | |
Net investment income | | $ | 9,576,446 | | | $ | 781,493 | | | $ | 8,330,999 | | |
Net realized gain | | | 130,925 | | | | 8,800 | | | | 119,391 | | |
Net change in unrealized appreciation (depreciation) | | | 5,447,610 | | | | 2,567,551 | | | | 17,385,205 | | |
Net increase in net assets resulting from operations | | | 15,154,981 | | | | 3,357,844 | | | | 25,835,595 | | |
Distributions to shareholders | |
Net investment income | |
Class A | | | (739,053 | ) | | | (49,341 | ) | | | (413,298 | ) | |
Class B | | | (311 | ) | | | (5 | ) | | | (582 | ) | |
Class C | | | (136,370 | ) | | | (8,181 | ) | | | (72,180 | ) | |
Class R4 | | | (9 | ) | | | — | | | | — | | |
Class R5 | | | (39 | ) | | | — | | | | — | | |
Class Z | | | (8,700,664 | ) | | | (699,024 | ) | | | (7,875,410 | ) | |
Total distributions to shareholders | | | (9,576,446 | ) | | | (756,551 | ) | | | (8,361,470 | ) | |
Increase (decrease) in net assets from capital stock activity | | | 33,602,163 | | | | 1,215,658 | | | | 27,876,297 | | |
Total increase in net assets | | | 39,180,698 | | | | 3,816,951 | | | | 45,350,422 | | |
Net assets at beginning of year | | | 279,547,303 | | | | 275,730,352 | | | | 230,379,930 | | |
Net assets at end of year | | $ | 318,728,001 | | | $ | 279,547,303 | | | $ | 275,730,352 | | |
Excess of distributions over net investment income | | $ | (65,425 | ) | | $ | (40,656 | ) | | $ | (65,598 | ) | |
(a) Class R4 shares are for the period from March 19, 2013 (commencement of operations) to April 30, 2013.
(b) Class R5 shares are for the period from November 8, 2012 (commencement of operations) to April 30, 2013.
(c) For the period from April 1, 2012 to April 30, 2012. During the period, the Fund's fiscal year end was changed from March 31 to April 30.
The accompanying Notes to Financial Statements are an integral part of this statement.
Annual Report 2013
19
Columbia California Intermediate Municipal Bond Fund
Statement of Changes in Net Assets (continued)
| | | Year Ended April 30,
2013(a)(b) | | Year Ended April 30,
2012(c) | | Year Ended March 31,
2012 | |
| | | Shares | | Dollars ($) | | Shares | | Dollars ($) | | Shares | | Dollars ($) | |
Capital stock activity | |
Class A shares | |
Subscriptions(d) | | | 2,152,204 | | | | 22,901,982 | | | | 139,914 | | | | 1,459,811 | | | | 1,119,886 | | | | 11,498,514 | | |
Distributions reinvested | | | 49,555 | | | | 525,977 | | | | 3,174 | | | | 33,227 | | | | 22,921 | | | | 233,754 | | |
Redemptions | | | (1,375,792 | ) | | | (14,598,606 | ) | | | (33,866 | ) | | | (353,564 | ) | | | (528,950 | ) | | | (5,341,071 | ) | |
Net increase | | | 825,967 | | | | 8,829,353 | | | | 109,222 | | | | 1,139,474 | | | | 613,857 | | | | 6,391,197 | | |
Class B shares | |
Subscriptions | | | 1,581 | | | | 16,726 | | | | — | | | | — | | | | 258 | | | | 2,711 | | |
Distributions reinvested | | | 1 | | | | 5 | | | | 1 | | | | 5 | | | | 12 | | | | 125 | | |
Redemptions(d) | | | — | | | | — | | | | — | | | | — | | | | (14,998 | ) | | | (148,715 | ) | |
Net increase (decrease) | | | 1,582 | | | | 16,731 | | | | 1 | | | | 5 | | | | (14,728 | ) | | | (145,879 | ) | |
Class C shares | |
Subscriptions | | | 371,838 | | | | 3,939,604 | | | | 17,548 | | | | 183,578 | | | | 285,632 | | | | 2,887,432 | | |
Distributions reinvested | | | 4,547 | | | | 48,259 | | | | 237 | | | | 2,481 | | | | 2,131 | | | | 21,747 | | |
Redemptions | | | (45,191 | ) | | | (481,299 | ) | | | (6,190 | ) | | | (64,660 | ) | | | (46,327 | ) | | | (471,261 | ) | |
Net increase | | | 331,194 | | | | 3,506,564 | | | | 11,595 | | | | 121,399 | | | | 241,436 | | | | 2,437,918 | | |
Class R4 shares | |
Subscriptions | | | 237 | | | | 2,500 | | | | — | | | | — | | | | — | | | | — | | |
Distributions reinvested | | | 1 | | | | 7 | | | | — | | | | — | | | | — | | | | — | | |
Net increase | | | 238 | | | | 2,507 | | | | — | | | | — | | | | — | | | | — | | |
Class R5 shares | |
Subscriptions | | | 235 | | | | 2,500 | | | | — | | | | — | | | | — | | | | — | | |
Distributions reinvested | | | 1 | | | | 7 | | | | — | | | | — | | | | — | | | | — | | |
Net increase | | | 236 | | | | 2,507 | | | | — | | | | — | | | | — | | | | — | | |
Class Z shares | |
Subscriptions | | | 7,435,604 | | | | 78,699,497 | | | | 556,413 | | | | 5,800,182 | | | | 5,959,439 | | | | 60,535,019 | | |
Distributions reinvested | | | 117,521 | | | | 1,244,577 | | | | 7,914 | | | | 82,696 | | | | 74,771 | | | | 759,777 | | |
Redemptions | | | (5,551,453 | ) | | | (58,699,573 | ) | | | (568,473 | ) | | | (5,928,098 | ) | | | (4,174,507 | ) | | | (42,101,735 | ) | |
Net increase (decrease) | | | 2,001,672 | | | | 21,244,501 | | | | (4,146 | ) | | | (45,220 | ) | | | 1,859,703 | | | | 19,193,061 | | |
Total net increase | | | 3,160,889 | | | | 33,602,163 | | | | 116,672 | | | | 1,215,658 | | | | 2,700,268 | | | | 27,876,297 | | |
(a) Class R4 shares are for the period from March 19, 2013 (commencement of operations) to April 30, 2013.
(b) Class R5 shares are for the period from November 8, 2012 (commencement of operations) to April 30, 2013.
(c) For the period from April 1, 2012 to April 30, 2012. During the period, the Fund's fiscal year end was changed from March 31 to April 30.
(d) Includes conversions of Class B shares to Class A shares, if any.
The accompanying Notes to Financial Statements are an integral part of this statement.
Annual Report 2013
20
Columbia California Intermediate Municipal Bond Fund
The following tables are intended to help you understand the Fund's financial performance. Certain information reflects financial results for a single share of a class held for the periods shown. Per share net investment income (loss) amounts are calculated based on average shares outstanding during the period. Total return assumes reinvestment of all dividends and distributions, if any. Total return does not reflect payment of sales charges, if any, and is not annualized for periods of less than one year.
| | | Year Ended April 30, | | Year Ended March 31, | |
Class A | | 2013 | | 2012(a) | | 2012 | | 2011 | | 2010 | | 2009 | |
Per share data | |
Net asset value, beginning of period | | $ | 10.47 | | | $ | 10.37 | | | $ | 9.65 | | | $ | 9.72 | | | $ | 9.34 | | | $ | 9.50 | | |
Income from investment operations: | |
Net investment income | | | 0.32 | | | | 0.03 | | | | 0.32 | | | | 0.31 | | | | 0.32 | | | | 0.31 | | |
Net realized and unrealized gain (loss) | | | 0.21 | | | | 0.10 | | | | 0.72 | | | | (0.07 | ) | | | 0.39 | | | | (0.16 | ) | |
Total from investment operations | | | 0.53 | | | | 0.13 | | | | 1.04 | | | | 0.24 | | | | 0.71 | | | | 0.15 | | |
Less distributions to shareholders: | |
Net investment income | | | (0.32 | ) | | | (0.03 | ) | | | (0.32 | ) | | | (0.31 | ) | | | (0.32 | ) | | | (0.31 | ) | |
Net realized gains | | | — | | | | — | | | | — | | | | — | | | | (0.01 | ) | | | — | | |
Total distributions to shareholders | | | (0.32 | ) | | | (0.03 | ) | | | (0.32 | ) | | | (0.31 | ) | | | (0.33 | ) | | | (0.31 | ) | |
Net asset value, end of period | | $ | 10.68 | | | $ | 10.47 | | | $ | 10.37 | | | $ | 9.65 | | | $ | 9.72 | | | $ | 9.34 | | |
Total return | | | 5.12 | % | | | 1.22 | % | | | 10.87 | % | | | 2.48 | % | | | 7.65 | % | | | 1.65 | % | |
Ratios to average net assets(b)(c) | |
Total gross expenses | | | 0.96 | % | | | 1.00 | %(d) | | | 1.00 | % | | | 0.94 | % | | | 0.90 | % | | | 0.88 | % | |
Total net expenses(e) | | | 0.73 | %(f) | | | 0.73 | %(d) | | | 0.74 | %(f) | | | 0.80 | %(f) | | | 0.79 | %(f) | | | 0.75 | %(f) | |
Net investment income | | | 3.01 | % | | | 3.11 | %(d) | | | 3.13 | % | | | 3.14 | % | | | 3.34 | % | | | 3.33 | % | |
Supplemental data | |
Net assets, end of period (in thousands) | | $ | 29,398 | | | $ | 20,180 | | | $ | 18,858 | | | $ | 11,613 | | | $ | 14,059 | | | $ | 18,463 | | |
Portfolio turnover | | | 8 | % | | | 0 | % | | | 9 | % | | | 26 | % | | | 25 | % | | | 19 | % | |
Notes to Financial Highlights
(a) For the period from April 1, 2012 to April 30, 2012. During the period, the Fund's fiscal year end was changed from March 31 to April 30.
(b) In addition to the fees and expenses which the Fund bears directly, the Fund indirectly bears a pro rata share of the fees and expenses of the acquired funds in which it invests. Such indirect expenses are not included in the reported expense ratios.
(c) Certain line items from prior years have been reclassified to conform to the current presentation.
(d) Annualized.
(e) Total net expenses include the impact of certain waivers/reimbursements made by the Investment Manager and certain of its affiliates, if applicable.
(f) The benefits derived from expense reductions had an impact of less than 0.01%.
The accompanying Notes to Financial Statements are an integral part of this statement.
Annual Report 2013
21
Columbia California Intermediate Municipal Bond Fund
Financial Highlights (continued)
| | | Year Ended April 30, | | Year Ended March 31, | |
Class B | | 2013 | | 2012(a) | | 2012 | | 2011 | | 2010 | | 2009 | |
Per share data | |
Net asset value, beginning of period | | $ | 10.47 | | | $ | 10.37 | | | $ | 9.64 | | | $ | 9.71 | | | $ | 9.34 | | | $ | 9.49 | | |
Income from investment operations: | |
Net investment income | | | 0.24 | | | | 0.02 | | | | 0.25 | | | | 0.24 | | | | 0.25 | | | | 0.24 | | |
Net realized and unrealized gain (loss) | | | 0.21 | | | | 0.10 | | | | 0.71 | | | | (0.07 | ) | | | 0.37 | | | | (0.15 | ) | |
Total from investment operations | | | 0.45 | | | | 0.12 | | | | 0.96 | | | | 0.17 | | | | 0.62 | | | | 0.09 | | |
Less distributions to shareholders: | |
Net investment income | | | (0.24 | ) | | | (0.02 | ) | | | (0.23 | ) | | | (0.24 | ) | | | (0.24 | ) | | | (0.24 | ) | |
Net realized gains | | | — | | | | — | | | | — | | | | — | | | | (0.01 | ) | | | — | | |
Total distributions to shareholders | | | (0.24 | ) | | | (0.02 | ) | | | (0.23 | ) | | | (0.24 | ) | | | (0.25 | ) | | | (0.24 | ) | |
Net asset value, end of period | | $ | 10.68 | | | $ | 10.47 | | | $ | 10.37 | | | $ | 9.64 | | | $ | 9.71 | | | $ | 9.34 | | |
Total return | | | 4.34 | % | | | 1.16 | % | | | 10.04 | % | | | 1.72 | % | | | 6.74 | % | | | 1.00 | % | |
Ratios to average net assets(b)(c) | |
Total gross expenses | | | 1.70 | % | | | 1.78 | %(d) | | | 1.96 | % | | | 1.69 | % | | | 1.65 | % | | | 1.63 | % | |
Total net expenses(e) | | | 1.48 | % | | | 1.48 | %(d) | | | 1.56 | %(f) | | | 1.55 | %(f) | | | 1.54 | %(f) | | | 1.50 | %(f) | |
Net investment income | | | 2.26 | % | | | 2.38 | %(d) | | | 2.53 | % | | | 2.41 | % | | | 2.58 | % | | | 2.58 | % | |
Supplemental data | |
Net assets, end of period (in thousands) | | $ | 20 | | | $ | 3 | | | $ | 3 | | | $ | 144 | | | $ | 218 | | | $ | 348 | | |
Portfolio turnover | | | 8 | % | | | 0 | % | | | 9 | % | | | 26 | % | | | 25 | % | | | 19 | % | |
Notes to Financial Highlights
(a) For the period from April 1, 2012 to April 30, 2012. During the period, the Fund's fiscal year end was changed from March 31 to April 30.
(b) In addition to the fees and expenses which the Fund bears directly, the Fund indirectly bears a pro rata share of the fees and expenses of the acquired funds in which it invests. Such indirect expenses are not included in the reported expense ratios.
(c) Certain line items from prior years have been reclassified to conform to the current presentation.
(d) Annualized.
(e) Total net expenses include the impact of certain waivers/reimbursements made by the Investment Manager and certain of its affiliates, if applicable.
(f) The benefits derived from expense reductions had an impact of less than 0.01%.
The accompanying Notes to Financial Statements are an integral part of this statement.
Annual Report 2013
22
Columbia California Intermediate Municipal Bond Fund
Financial Highlights (continued)
| | | Year Ended April 30, | | Year Ended March 31, | |
Class C | | 2013 | | 2012(a) | | 2012 | | 2011 | | 2010 | | 2009 | |
Per share data | |
Net asset value, beginning of period | | $ | 10.47 | | | $ | 10.37 | | | $ | 9.64 | | | $ | 9.72 | | | $ | 9.35 | | | $ | 9.50 | | |
Income from investment operations: | |
Net investment income | | | 0.24 | | | | 0.02 | | | | 0.24 | | | | 0.24 | | | | 0.25 | | | | 0.24 | | |
Net realized and unrealized gain (loss) | | | 0.20 | | | | 0.10 | | | | 0.73 | | | | (0.08 | ) | | | 0.37 | | | | (0.15 | ) | |
Total from investment operations | | | 0.44 | | | | 0.12 | | | | 0.97 | | | | 0.16 | | | | 0.62 | | | | 0.09 | | |
Less distributions to shareholders: | |
Net investment income | | | (0.24 | ) | | | (0.02 | ) | | | (0.24 | ) | | | (0.24 | ) | | | (0.24 | ) | | | (0.24 | ) | |
Net realized gains | | | — | | | | — | | | | — | | | | — | | | | (0.01 | ) | | | — | | |
Total distributions to shareholders | | | (0.24 | ) | | | (0.02 | ) | | | (0.24 | ) | | | (0.24 | ) | | | (0.25 | ) | | | (0.24 | ) | |
Net asset value, end of period | | $ | 10.67 | | | $ | 10.47 | | | $ | 10.37 | | | $ | 9.64 | | | $ | 9.72 | | | $ | 9.35 | | |
Total return | | | 4.24 | % | | | 1.16 | % | | | 10.15 | % | | | 1.61 | % | | | 6.74 | % | | | 1.00 | % | |
Ratios to average net assets(b)(c) | |
Total gross expenses | | | 1.71 | % | | | 1.75 | %(d) | | | 1.73 | % | | | 1.69 | % | | | 1.65 | % | | | 1.63 | % | |
Total net expenses(e) | | | 1.48 | %(f) | | | 1.48 | %(d) | | | 1.49 | %(f) | | | 1.55 | %(f) | | | 1.54 | %(f) | | | 1.50 | %(f) | |
Net investment income | | | 2.25 | % | | | 2.36 | %(d) | | | 2.38 | % | | | 2.42 | % | | | 2.55 | % | | | 2.58 | % | |
Supplemental data | |
Net assets, end of period (in thousands) | | $ | 8,004 | | | $ | 4,384 | | | $ | 4,223 | | | $ | 1,599 | | | $ | 1,875 | | | $ | 1,061 | | |
Portfolio turnover | | | 8 | % | | | 0 | % | | | 9 | % | | | 26 | % | | | 25 | % | | | 19 | % | |
Notes to Financial Highlights
(a) For the period from April 1, 2012 to April 30, 2012. During the period, the Fund's fiscal year end was changed from March 31 to April 30.
(b) In addition to the fees and expenses which the Fund bears directly, the Fund indirectly bears a pro rata share of the fees and expenses of the acquired funds in which it invests. Such indirect expenses are not included in the reported expense ratios.
(c) Certain line items from prior years have been reclassified to conform to the current presentation.
(d) Annualized.
(e) Total net expenses include the impact of certain waivers/reimbursements made by the Investment Manager and certain of its affiliates, if applicable.
(f) The benefits derived from expense reductions had an impact of less than 0.01%.
The accompanying Notes to Financial Statements are an integral part of this statement.
Annual Report 2013
23
Columbia California Intermediate Municipal Bond Fund
Financial Highlights (continued)
Class R4 | | Year Ended
April 30,
2013(a) | |
Per share data | |
Net asset value, beginning of period | | $ | 10.54 | | |
Income from investment operations: | |
Net investment income | | | 0.04 | | |
Net realized and unrealized gain | | | 0.10 | | |
Total from investment operations | | | 0.14 | | |
Less distributions to shareholders: | |
Net investment income | | | (0.04 | ) | |
Total distributions to shareholders | | | (0.04 | ) | |
Net asset value, end of period | | $ | 10.64 | | |
Total return | | | 1.32 | % | |
Ratios to average net assets(b) | |
Total gross expenses | | | 0.56 | %(c) | |
Total net expenses(d) | | | 0.44 | %(c) | |
Net investment income | | | 3.27 | %(c) | |
Supplemental data | |
Net assets, end of period (in thousands) | | $ | 3 | | |
Portfolio turnover | | | 8 | % | |
Notes to Financial Highlights
(a) For the period from March 19, 2013 (commencement of operations) to April 30, 2013.
(b) In addition to the fees and expenses which the Fund bears directly, the Fund indirectly bears a pro rata share of the fees and expenses of the acquired funds in which it invests. Such indirect expenses are not included in the reported expense ratios.
(c) Annualized.
(d) Total net expenses include the impact of certain waivers/reimbursements made by the Investment Manager and certain of its affiliates, if applicable.
The accompanying Notes to Financial Statements are an integral part of this statement.
Annual Report 2013
24
Columbia California Intermediate Municipal Bond Fund
Financial Highlights (continued)
Class R5 | | Year Ended
April 30,
2013(a) | |
Per share data | |
Net asset value, beginning of period | | $ | 10.63 | | |
Income from investment operations: | |
Net investment income | | | 0.16 | | |
Net realized and unrealized gain | | | 0.01 | | |
Total from investment operations | | | 0.17 | | |
Less distributions to shareholders: | |
Net investment income | | | (0.17 | ) | |
Total distributions to shareholders | | | (0.17 | ) | |
Net asset value, end of period | | $ | 10.63 | | |
Total return | | | 1.57 | % | |
Ratios to average net assets(b) | |
Total gross expenses | | | 0.50 | %(c) | |
Total net expenses(d) | | | 0.39 | %(c) | |
Net investment income | | | 3.28 | %(c) | |
Supplemental data | |
Net assets, end of period (in thousands) | | $ | 3 | | |
Portfolio turnover | | | 8 | % | |
Notes to Financial Highlights
(a) For the period from November 8, 2012 (commencement of operations) to April 30, 2013.
(b) In addition to the fees and expenses which the Fund bears directly, the Fund indirectly bears a pro rata share of the fees and expenses of the acquired funds in which it invests. Such indirect expenses are not included in the reported expense ratios.
(c) Annualized.
(d) Total net expenses include the impact of certain waivers/reimbursements made by the Investment Manager and certain of its affiliates, if applicable.
The accompanying Notes to Financial Statements are an integral part of this statement.
Annual Report 2013
25
Columbia California Intermediate Municipal Bond Fund
Financial Highlights (continued)
| | | Year Ended April 30, | | Year Ended March 31, | |
Class Z | | 2013 | | 2012(a) | | 2012 | | 2011 | | 2010 | | 2009 | |
Per share data | |
Net asset value, beginning of period | | $ | 10.45 | | | $ | 10.35 | | | $ | 9.63 | | | $ | 9.70 | | | $ | 9.33 | | | $ | 9.48 | | |
Income from investment operations: | |
Net investment income | | | 0.35 | | | | 0.03 | | | | 0.34 | | | | 0.34 | | | | 0.34 | | | | 0.34 | | |
Net realized and unrealized gain (loss) | | | 0.20 | | | | 0.10 | | | | 0.72 | | | | (0.07 | ) | | | 0.38 | | | | (0.15 | ) | |
Total from investment operations | | | 0.55 | | | | 0.13 | | | | 1.06 | | | | 0.27 | | | | 0.72 | | | | 0.19 | | |
Less distributions to shareholders: | |
Net investment income | | | (0.35 | ) | | | (0.03 | ) | | | (0.34 | ) | | | (0.34 | ) | | | (0.34 | ) | | | (0.34 | ) | |
Net realized gains | | | — | | | | — | | | | — | | | | — | | | | (0.01 | ) | | | — | | |
Total distributions to shareholders | | | (0.35 | ) | | | (0.03 | ) | | | (0.34 | ) | | | (0.34 | ) | | | (0.35 | ) | | | (0.34 | ) | |
Net asset value, end of period | | $ | 10.65 | | | $ | 10.45 | | | $ | 10.35 | | | $ | 9.63 | | | $ | 9.70 | | | $ | 9.33 | | |
Total return | | | 5.29 | % | | | 1.24 | % | | | 11.16 | % | | | 2.74 | % | | | 7.82 | % | | | 2.02 | % | |
Ratios to average net assets(b)(c) | |
Total gross expenses | | | 0.71 | % | | | 0.75 | %(d) | | | 0.74 | % | | | 0.69 | % | | | 0.65 | % | | | 0.63 | % | |
Total net expenses(e) | | | 0.48 | %(f) | | | 0.48 | %(d) | | | 0.50 | %(f) | | | 0.55 | %(f) | | | 0.54 | %(f) | | | 0.50 | %(f) | |
Net investment income | | | 3.27 | % | | | 3.35 | %(d) | | | 3.39 | % | | | 3.43 | % | | | 3.56 | % | | | 3.58 | % | |
Supplemental data | |
Net assets, end of period (in thousands) | | $ | 281,301 | | | $ | 254,981 | | | $ | 252,647 | | | $ | 217,024 | | | $ | 211,046 | | | $ | 187,844 | | |
Portfolio turnover | | | 8 | % | | | 0 | % | | | 9 | % | | | 26 | % | | | 25 | % | | | 19 | % | |
Notes to Financial Highlights
(a) For the period from April 1, 2012 to April 30, 2012. During the period, the Fund's fiscal year end was changed from March 31 to April 30.
(b) In addition to the fees and expenses which the Fund bears directly, the Fund indirectly bears a pro rata share of the fees and expenses of the acquired funds in which it invests. Such indirect expenses are not included in the reported expense ratios.
(c) Certain line items from prior years have been reclassified to conform to the current presentation.
(d) Annualized.
(e) Total net expenses include the impact of certain waivers/reimbursements made by the Investment Manager and certain of its affiliates, if applicable.
(f) The benefits derived from expense reductions had an impact of less than 0.01%.
The accompanying Notes to Financial Statements are an integral part of this statement.
Annual Report 2013
26
Columbia California Intermediate Municipal Bond Fund
Notes to Financial Statements
April 30, 2013
Note 1. Organization
Columbia California Intermediate Municipal Bond Fund (the Fund), a series of Columbia Funds Series Trust (the Trust), is a diversified fund. The Trust is registered under the Investment Company Act of 1940, as amended (the 1940 Act), as an open-end management investment company organized as a Delaware statutory trust.
Fund Shares
The Trust may issue an unlimited number of shares (without par value). The Fund offers Class A, Class B, Class C, Class R4, Class R5 and Class Z shares. All share classes have identical voting, dividend and liquidation rights. Each share class has its own expense structure and sales charges, as applicable.
Class A shares are subject to a maximum front-end sales charge of 3.25% based on the initial investment amount. Class A shares purchased without an initial sales charge in accounts aggregating $1 million to $50 million at the time of purchase are subject to a contingent deferred sales charge (CDSC) if the shares are sold within 18 months of purchase, charged as follows: 1.00% CDSC if redeemed within 12 months of purchase, and 0.50% CDSC if redeemed more than 12, but less than 18, months after purchase.
Class B shares may be subject to a maximum CDSC of 3.00% based upon the holding period after purchase. Class B shares will generally convert to Class A shares eight years after purchase. The Fund no longer accepts investments by new or existing investors in the Fund's Class B shares, except in connection with the reinvestment of any dividend and/or capital gain distributions in Class B shares of the Fund and exchanges by existing Class B shareholders of certain other funds within the Columbia Family of Funds.
Class C shares are subject to a 1.00% CDSC on shares redeemed within one year of purchase.
Class R4 shares are not subject to sales charges and are generally available only to omnibus retirement plans and certain other eligible investors. Class R4 shares commenced operations on March 19, 2013.
Class R5 shares are not subject to sales charges and are generally available only to investors purchasing through authorized investment professionals and omnibus retirement plans. Class R5 shares commenced operations on November 8, 2012.
Class Z shares are not subject to sales charges, and are available only to certain investors.
Note 2. Summary of Significant Accounting Policies
Use of Estimates
The preparation of financial statements in accordance with U.S. generally accepted accounting principles (GAAP) requires management to make certain estimates and assumptions that affect the reported amounts of assets and liabilities, the disclosure of contingent assets and liabilities at the date of the financial statements and the reported amounts of revenue and expenses during the reporting period. Actual results could differ from those estimates.
The following is a summary of significant accounting policies consistently followed by the Fund in the preparation of its financial statements.
Security Valuation
Debt securities generally are valued by pricing services approved by the Board of Trustees (the Board) based upon market transactions for normal, institutional-size trading units of similar securities. The services may use various pricing techniques which take into account appropriate factors such as yield, quality, coupon rate, maturity, type of issue, trading characteristics and other data, as well as broker quotes. Debt securities for which quotations are readily available may also be valued based upon an over-the-counter or exchange bid quotation.
Investments in other open-end investment companies, including money market funds, are valued at net asset value.
Investments for which market quotations are not readily available, or that have quotations which management believes are not reliable, are valued at fair value as determined in good faith under consistently applied procedures established by and under the general supervision of the Board. If a security or class of securities (such as foreign securities) is valued at fair value, such value is likely to be different from the last quoted market price for the security.
The determination of fair value often requires significant judgment. To determine fair value, management may use assumptions including but not limited to future cash flows and estimated risk premiums. Multiple inputs from various sources may be used to determine fair value.
Security Transactions
Security transactions are accounted for on the trade date. Cost is determined and gains (losses) are based upon the specific identification method for both financial statement and federal income tax purposes.
Annual Report 2013
27
Columbia California Intermediate Municipal Bond Fund
Notes to Financial Statements (continued)
April 30, 2013
Income Recognition
Interest income is recorded on an accrual basis. Market premiums and discounts, including original issue discounts, are amortized and accreted, respectively, over the expected life of the security on all debt securities, unless otherwise noted.
Dividend income is recorded on the ex-dividend date.
Expenses
General expenses of the Trust are allocated to the Fund and other funds of the Trust based upon relative net assets or other expense allocation methodologies determined by the nature of the expense. Expenses directly attributable to the Fund are charged to the Fund. Expenses directly attributable to a specific class of shares are charged to that share class.
Determination of Class Net Asset Value
All income, expenses (other than class-specific expenses, which are charged to that share class, as shown in the Statement of Operations) and realized and unrealized gains (losses) are allocated to each class of the Fund on a daily basis, based on the relative net assets of each class, for purposes of determining the net asset value of each class.
Federal Income Tax Status
The Fund intends to qualify each year as a regulated investment company under Subchapter M of the Internal Revenue Code, as amended, and will distribute substantially all of its tax exempt and taxable income (including net short-term capital gains), if any, for its tax year, and as such will not be subject to federal income taxes. In addition, the Fund intends to distribute in each calendar year substantially all of its net investment income, capital gains and certain other amounts, if any, such that the Fund should not be subject to federal excise tax. Therefore, no federal income or excise tax provision is recorded.
Distributions to Shareholders
Distributions from net investment income, if any, are declared daily and paid monthly. Net realized capital gains, if any, are distributed at least annually. Income distributions and capital gain distributions are determined in accordance with federal income tax regulations, which may differ from GAAP.
Guarantees and Indemnifications
Under the Trust's organizational documents and, in some cases, by contract, its officers and trustees are indemnified against certain liabilities arising out of the performance of their duties to the Trust or its funds. In addition, certain of the Fund's contracts with its service providers contain general indemnification clauses. The Fund's maximum exposure under these arrangements is unknown since the amount of any future claims that may be made against the Fund cannot be
determined, and the Fund has no historical basis for predicting the likelihood of any such claims.
Recent Accounting Pronouncement
Disclosures about Offsetting Assets and Liabilities
In December 2011, the Financial Accounting Standards Board (FASB) issued Accounting Standards Update (ASU) No. 2011-11, Disclosures about Offsetting Assets and Liabilities and in January 2013, ASU No. 2013-1, Clarifying the Scope of Disclosures about Offsetting Assets and Liabilities (collectively, the ASUs). Specifically, the ASUs require an entity to disclose both gross and net information for derivatives and other financial instruments that are subject to a master netting arrangement or similar agreement. The ASUs require disclosure of collateral received in connection with the master netting agreements or similar agreements. The disclosure requirements are effective for interim and annual periods beginning on or after January 1, 2013. At this time, management is evaluating the implications of this guidance and the impact it will have on the financial statement amounts and footnote disclosures, if any.
Note 3. Fees and Compensation Paid to Affiliates
Investment Management Fees
Under an Investment Management Services Agreement, Columbia Management Investment Advisers, LLC (the Investment Manager), a wholly-owned subsidiary of Ameriprise Financial, Inc. (Ameriprise Financial), determines which securities will be purchased, held or sold. The investment management fee is an annual fee that is equal to a percentage of the Fund's average daily net assets that declines from 0.40% to 0.27% as the Fund's net assets increase. The effective investment management fee rate for the year ended April 30, 2013 was 0.40% of the Fund's average daily net assets.
Administration Fees
Under an Administrative Services Agreement, the Investment Manager also serves as the Fund Administrator. The Fund pays the Fund Administrator an annual fee for administration and accounting services equal to a percentage of the Fund's average daily net assets that declines from 0.07% to 0.04% as the Fund's net assets increase. The effective administration fee rate for the year ended April 30, 2013 was 0.07% of the Fund's average daily net assets.
Other Expenses
Other expenses are for, among other things, certain expenses of the Fund or the Board, including: Fund boardroom and office expense, employee compensation, employee health and
Annual Report 2013
28
Columbia California Intermediate Municipal Bond Fund
Notes to Financial Statements (continued)
April 30, 2013
retirement benefits, and certain other expenses. Payment of these Fund and Board expenses is facilitated by a company providing limited administrative services to the Fund and the Board. For the year ended April 30, 2013, other expenses paid to this company were $1,876.
Compensation of Board Members
Board members are compensated for their services to the Fund as disclosed in the Statement of Operations. Under a Deferred Compensation Plan (the Plan), the Board members who are not "interested persons" of the Fund, as defined under the 1940 Act, may elect to defer payment of up to 100% of their compensation. Deferred amounts are treated as though equivalent dollar amounts had been invested in shares of certain funds managed by the Investment Manager. The Fund's liability for these amounts is adjusted for market value changes and remains in the Fund until distributed in accordance with the Plan.
Transfer Agent Fees
Under a Transfer and Dividend Disbursing Agent Agreement, Columbia Management Investment Services Corp. (the Transfer Agent), an affiliate of the Investment Manager and a wholly-owned subsidiary of Ameriprise Financial, is responsible for providing transfer agency services to the Fund. The Transfer Agent has contracted with Boston Financial Data Services (BFDS) to serve as sub-transfer agent.
The Transfer Agent receives monthly account-based service fees based on the number of open accounts and also receives sub-transfer agency fees based on a percentage of the average aggregate value of the Fund's shares maintained in omnibus account (other than omnibus accounts for which American Enterprise Investment Services Inc. is the broker of record or accounts where the beneficial shareholder is a customer of Ameriprise Financial Services, Inc., which are paid a per account fee). The Transfer Agent pays the fees of BFDS for services as sub-transfer agent and is not entitled to reimbursement for such fees from the Fund (with the exception of out-of-pocket fees).
The Transfer Agent also receives compensation from fees for various shareholder services and reimbursements for certain out-of-pocket fees. Total transfer agent fees for Class R5 shares are subject to an annual limitation of not more than 0.05% of the average daily net assets attributable to Class R5 shares.
For the year ended April 30, 2013, the Fund's effective transfer agent fee rates as a percentage of average daily net assets of each class were as follows:
Class A | | | 0.20 | % | |
Class B | | | 0.19 | | |
Class C | | | 0.20 | | |
Class R4* | | | 0.10 | | |
Class R5* | | | 0.05 | | |
Class Z | | | 0.20 | | |
*Annualized
An annual minimum account balance fee of $20 may apply to certain accounts with a value below the Fund's initial minimum investment requirements to reduce the impact of small accounts on transfer agent fees. These minimum account balance fees are recorded as part of expense reductions in the Statement of Operations. For the year ended April 30, 2013, these minimum account balance fees reduced total expenses by $60.
Distribution and Service Fees
The Fund has an agreement with Columbia Management Investment Distributors, Inc. (the Distributor), an affiliate of the Investment Manager and a wholly-owned subsidiary of Ameriprise Financial, for distribution and shareholder services. Pursuant to Rule 12b-1 under the 1940 Act, the Board has approved, and the Fund has adopted, distribution and shareholder service plans (the Plans) which set the distribution and service fees for the Fund. These fees are calculated daily and are intended to compensate the Distributor and/or eligible selling and/or servicing agents for selling shares of the Fund and providing services to investors.
The Plans require the payment of a monthly combined distribution and service fee to the Distributor at the maximum annual rate of 0.25% of the average daily net assets attributable to Class A shares of the Fund. The Plans also require the payment of a monthly service fee at the maximum annual rate of 0.25% of the average daily net assets attributable to Class B and Class C shares of the Fund and the payment of a monthly distribution fee at the maximum annual rate of 0.75% of the average daily net assets attributable to Class B and Class C shares of the Fund.
Sales Charges
Sales charges, including front-end charges and CDSCs, received by the Distributor for distributing Fund shares were $57,376 for Class A and $1,175 for Class C shares for the year ended April 30, 2013.
Annual Report 2013
29
Columbia California Intermediate Municipal Bond Fund
Notes to Financial Statements (continued)
April 30, 2013
Expenses Waived/Reimbursed by the Investment Manager and its Affiliates
The Investment Manager and certain of its affiliates have contractually agreed to waive fees and/or reimburse expenses (excluding certain fees and expenses described below) for the period disclosed below, unless sooner terminated at the sole discretion of the Board, so that the Fund's net operating expenses, after giving effect to fees waived/expenses reimbursed and any balance credits and/or overdraft charges from the Fund's custodian, do not exceed the following annual rates as a percentage of the class' average daily net assets:
| | | Fee Rates Contractual
through
August 31, 2013 | |
Class A | | | 0.73 | % | |
Class B | | | 1.48 | | |
Class C | | | 1.48 | | |
Class R4 | | | 0.48 | * | |
Class R5 | | | 0.39 | ** | |
Class Z | | | 0.48 | | |
*Annual rate is contractual from March 19, 2013 (the commencement of operations of Class R4 shares) through February 28, 2014.
**Annual rate is contractual from November 8, 2012 (the commencement of operations of Class R5 shares) through November 8, 2013.
Under the agreement governing these fee waivers and/or expense reimbursement arrangements, the following fees and expenses are excluded from the waiver/reimbursement commitment, and therefore will be paid by the Fund, if applicable: taxes (including foreign transaction taxes), expenses associated with investments in affiliated and non-affiliated pooled investment vehicles (including mutual funds and exchange traded funds), transaction costs and brokerage commissions, costs related to any securities lending program, dividend expenses associated with securities sold short, inverse floater program fees and expenses, transaction charges and interest on borrowed money, interest, extraordinary expenses and any other expenses the exclusion of which is specifically approved by the Board. This agreement may be modified or amended only with approval from all parties.
Note 4. Federal Tax Information
The timing and character of income and capital gain distributions are determined in accordance with income tax regulations, which may differ from GAAP because of temporary or permanent book to tax differences.
At April 30, 2013, these differences are primarily due to differing treatment for capital loss carryforwards, Trustees' deferred compensation, investments in partnerships and post-October
capital losses. To the extent these differences are permanent, reclassifications are made among the components of the Fund's net assets in the Statement of Assets and Liabilities. Temporary differences do not require reclassifications. In the Statement of Assets and Liabilities the following reclassifications were made:
Excess of distributions over
net investment income | | $ | (24,769 | ) | |
Paid-in capital | | | 24,769 | | |
Net investment income and net realized gains (losses), as disclosed in the Statement of Operations, and net assets were not affected by this reclassification.
The tax character of distributions paid during the periods indicated was as follows:
| | | Year Ended
April 30, 2013 | | Period Ended
April 30, 2012 | | Year Ended
March 31, 2012 | |
Ordinary income | | $ | 18,179 | | | $ | 1,506 | | | $ | 10,853 | | |
Tax-exempt income | | $ | 9,558,267 | | | | 755,045 | | | | 8,350,617 | | |
Total | | $ | 9,576,446 | | | $ | 756,551 | | | $ | 8,361,470 | | |
Short-term capital gain distributions, if any, are considered ordinary income distributions for tax purposes.
At April 30, 2013, the components of distributable earnings on a tax basis were as follows:
Undistributed tax-exempt income | | $ | 827,409 | | |
Accumulated realized loss | | | (163,823 | ) | |
Unrealized appreciation | | | 27,086,860 | | |
At April 30, 2013, the cost of investments for federal income tax purposes was $290,743,193 and the aggregate gross unrealized appreciation and depreciation based on that cost was:
Unrealized appreciation | | $ | 27,352,522 | | |
Unrealized depreciation | | | (265,662 | ) | |
Net unrealized appreciation | | $ | 27,086,860 | | |
The following capital loss carryforward, determined at April 30, 2013, may be available to reduce taxable income arising from future net realized gains on investments, if any, to the extent permitted by the Internal Revenue Code:
Year of Expiration | | Amount | |
2017 | | $ | 10,109 | | |
Total | | $ | 10,109 | | |
For the year ended April 30, 2013, $297,785 of capital loss carryforward was utilized.
Under current tax rules, regulated investment companies can elect to treat certain late-year ordinary losses incurred and post-October capital losses (capital losses realized after
Annual Report 2013
30
Columbia California Intermediate Municipal Bond Fund
Notes to Financial Statements (continued)
April 30, 2013
October 31) as arising on the first day of the following taxable year. As of April 30, 2013, the Fund will elect to treat post-October capital losses of $153,714 as arising on May 1, 2013.
Management of the Fund has concluded that there are no significant uncertain tax positions that would require recognition in the financial statements. However, management's conclusion may be subject to review and adjustment at a later date based on factors including, but not limited to, new tax laws, regulations, and administrative interpretations (including relevant court decisions). Generally, the Fund's federal tax returns for the prior three fiscal years remain subject to examination by the Internal Revenue Service.
Note 5. Portfolio Information
The cost of purchases and proceeds from sales of securities, excluding short-term obligations, aggregated to $56,437,618 and $22,369,472, respectively, for the year ended April 30, 2013.
Note 6. Shareholder Concentration
At April 30, 2013, one unaffiliated shareholder account owned 77.6% of the outstanding shares of the Fund. The Fund has no knowledge about whether any portion of those shares was owned beneficially by such account. Subscription and redemption activity by concentrated accounts may have a significant effect on the operations of the Fund.
Note 7. Line of Credit
The Fund has entered into a revolving credit facility with a syndicate of banks led by JPMorgan Chase Bank N.A. whereby the Fund may borrow for the temporary funding of shareholder redemptions or for other temporary or emergency purposes. The credit facility agreement, as amended, which is a collective agreement between the Fund and certain other funds managed by the Investment Manager, severally and not jointly, permits collective borrowings up to $500 million. Interest is charged to each participating fund based on its borrowings at a rate equal to the higher of (i) the overnight federal funds rate plus 1.00% or (ii) the one-month LIBOR rate plus 1.00%. Each borrowing under the credit facility matures no later than 60 days after the date of borrowing. The Fund also pays a commitment fee equal to its pro rata share of the amount of the credit facility at a rate of 0.08% per annum.
The Fund had no borrowings during the year ended April 30, 2013.
Note 8. Significant Risks
Geographic Concentration Risk
Because state-specific tax-exempt funds invest primarily in the municipal securities issued by the state and political sub-divisions of the state, the Fund will be particularly affected by political and economic conditions and developments in the state in which it invests. The Fund may, therefore, have a greater risk than that of a municipal bond fund which is more geographically diversified. The value of the municipal securities owned by the Fund also may be adversely affected by future changes in federal or state income tax laws.
Note 9. Subsequent Events
Management has evaluated the events and transactions that have occurred through the date the financial statements were issued and noted no items requiring adjustment of the financial statements or additional disclosure.
Note 10. Information Regarding Pending and Settled Legal Proceedings
In December 2005, without admitting or denying the allegations, American Express Financial Corporation (AEFC, which is now known as Ameriprise Financial, Inc. (Ameriprise Financial)) entered into settlement agreements with the Securities and Exchange Commission (SEC) and Minnesota Department of Commerce (MDOC) related to market timing activities. As a result, AEFC was censured and ordered to cease and desist from committing or causing any violations of certain provisions of the Investment Advisers Act of 1940, the Investment Company Act of 1940, and various Minnesota laws. AEFC agreed to pay disgorgement of $10 million and civil money penalties of $7 million. AEFC also agreed to retain an independent distribution consultant to assist in developing a plan for distribution of all disgorgement and civil penalties ordered by the SEC in accordance with various undertakings detailed at www.sec.gov/litigation/admin/ia-2451.pdf. Ameriprise Financial and its affiliates have cooperated with the SEC and the MDOC in these legal proceedings, and have made regular reports to the funds' Boards of Trustees.
Ameriprise Financial and certain of its affiliates have historically been involved in a number of legal, arbitration and regulatory proceedings, including routine litigation, class actions, and governmental actions, concerning matters arising in connection with the conduct of their business activities. Ameriprise Financial believes that the Funds are not currently the subject of, and that neither Ameriprise Financial nor any of its affiliates are the subject of, any pending legal, arbitration or regulatory proceedings that are likely to have a material adverse effect on the Funds or the ability of Ameriprise Financial or its
Annual Report 2013
31
Columbia California Intermediate Municipal Bond Fund
Notes to Financial Statements (continued)
April 30, 2013
affiliates to perform under their contracts with the Funds. Ameriprise Financial is required to make 10-Q, 10-K and, as necessary, 8-K filings with the Securities and Exchange Commission on legal and regulatory matters that relate to Ameriprise Financial and its affiliates. Copies of these filings may be obtained by accessing the SEC website at www.sec.gov.
There can be no assurance that these matters, or the adverse publicity associated with them, will not result in increased fund redemptions, reduced sale of fund shares or other adverse consequences to the Funds. Further, although we believe proceedings are not likely to have a material adverse effect on the Funds or the ability of Ameriprise Financial or its affiliates to perform under their contracts with the Funds, these proceedings are subject to uncertainties and, as such, we are unable to estimate the possible loss or range of loss that may result. An adverse outcome in one or more of these proceedings could result in adverse judgments, settlements, fines, penalties or other relief that could have a material adverse effect on the consolidated financial condition or results of operations of Ameriprise Financial.
Annual Report 2013
32
Columbia California Intermediate Municipal Bond Fund
Report of Independent Registered Public Accounting Firm
To the Trustees of Columbia Funds Series Trust and the Shareholders of
Columbia California Intermediate Municipal Bond Fund
In our opinion, the accompanying statement of assets and liabilities, including the portfolio of investments, and the related statements of operations and of changes in net assets and the financial highlights present fairly, in all material respects, the financial position of Columbia California Intermediate Municipal Bond Fund (the "Fund") (a series of Columbia Funds Series Trust) at April 30, 2013, the results of its operations, the changes in its net assets and the financial highlights for the periods indicated, in conformity with accounting principles generally accepted in the United States of America. These financial statements and financial highlights (hereafter referred to as "financial statements") are the responsibility of the Fund's management. Our responsibility is to express an opinion on these financial statements based on our audits. We conducted our audits of these financial statements in accordance with the standards of the Public Company Accounting Oversight Board (United States). Those standards require that we plan and perform the audit to obtain reasonable assurance about whether the financial statements are free of material misstatement. An audit includes examining, on a test basis, evidence supporting the amounts and disclosures in the financial statements, assessing the accounting principles used and significant estimates made by management, and evaluating the overall financial statement presentation. We believe that our audits, which included confirmation of securities at April 30, 2013 by correspondence with the custodian and brokers, provide a reasonable basis for our opinion.
PricewaterhouseCoopers LLP
Minneapolis, Minnesota
June 21, 2013
Annual Report 2013
33
Columbia California Intermediate Municipal Bond Fund
Federal Income Tax Information
(Unaudited)
The Fund hereby designates the following tax attributes for the fiscal year ended April 30, 2013. Shareholders will be notified in early 2014 of amounts for use in preparing 2013 income tax returns
Tax Designations:
| Exempt-Interest Dividends | | | 99.81 | % | |
Exempt-Interest Dividends. The percentage of net investment income dividends paid during the fiscal year that qualifies as exempt-interest dividends for federal income tax purposes.
Annual Report 2013
34
Columbia California Intermediate Municipal Bond Fund
Shareholders elect the Board that oversees the funds' operations. The Board appoints officers who are responsible for day-to-day business decisions based on policies set by the Board. The following table provides basic biographical information about the funds' Board members, including their principal occupations during the past five years, although specific titles for individuals may have varied over the period. Under current Board policy, members may serve until the next Board meeting after he or she reaches the mandatory retirement age established by the Board, or the fifteenth anniversary of the first Board meeting they attended as a member of the Board.
Mr. Edward J. Boudreau, Jr., Mr. William P. Carmichael, Mr. William A. Hawkins, Mr. R. Glenn Hilliard, Ms. Minor M. Shaw and Dr. Anthony M. Santomero, were members of the Legacy Columbia Nations funds' Board ("Nations Funds"), which includes Columbia Funds Series Trust, Columbia Funds Variable Insurance Trust I and Columbia Funds Master Investment Trust, LLC and began service on the Board for the Legacy RiverSource funds ("RiverSource Funds") effective June 1, 2011.
Independent Trustees
Name,
Address,
Year of Birth | | Position Held With
Funds and Length of
Service | | Principal Occupation
During Past Five Years | | Number of
Funds in the
Fund Family
Overseen by
Board Member | | Other Present or Past
Directorships/Trusteeships
(Within Past 5 Years)
| |
Kathleen Blatz
901 S. Marquette Ave.
Minneapolis, MN 55402
1954 | | Board member since 1/06 for RiverSource Funds and since 6/11 for Nations Funds | | Attorney; Chief Justice, Minnesota Supreme Court, 1998-2006 | | | 132 | | | Director, BlueCross BlueShield of Minnesota since 2009 | |
Edward J. Boudreau, Jr.
901 S. Marquette Ave.
Minneapolis, MN 55402
1944 | | Board member since 6/11 for RiverSource Funds and since 1/05 for Nations Funds | | Managing Director, E.J. Boudreau & Associates (consulting) since 2000 | | | 130 | | | Former Trustee, BofA Funds Series Trust (11 funds) | |
Pamela G. Carlton
901 S. Marquette Ave.
Minneapolis, MN 55402
1954 | | Board member since 7/07 for RiverSource Funds and since 6/11 for Nations Funds | | President, Springboard — Partners in Cross Cultural Leadership (consulting company) since 2003 | | | 132 | | | None | |
William P. Carmichael
901 S. Marquette Ave.
Minneapolis, MN 55402
1943 | | Board member since 6/11 for RiverSource Funds and since 1999 for Nations Funds | | Retired | | | 130 | | | Director, Cobra Electronics
Corporation (electronic equipment manufacturer); The Finish Line (athletic shoes and apparel) since July 2003; McMoRan Exploration Company (oil and gas exploration and development) since 2010; former Trustee, BofA Funds Series Trust (11 funds); former Director, Spectrum Brands, Inc. (consumer products); former Director, Simmons Company (bedding) | |
Patricia M. Flynn
901 S. Marquette Ave.
Minneapolis, MN 55402
1950 | | Board member since 11/04 for RiverSource Funds and since 6/11 for Nations Funds | | Trustee Professor of Economics and Management, Bentley University since 1976 | | | 132 | | | None | |
William A. Hawkins
901 S. Marquette Ave.
Minneapolis, MN 55402
1942 | | Board member since 6/11 for RiverSource Funds and since 1/05 for Nations Funds | | Managing Director, Overton Partners (financial consulting), since August 2010; President and Chief Executive Officer, California General Bank, N.A., January 2008-August 2010 | | | 130 | | | Trustee, BofA Funds Series Trust (11 funds) | |
Annual Report 2013
35
Columbia California Intermediate Municipal Bond Fund
Trustees and Officers (continued)
Independent Trustees (continued)
Name,
Address,
Year of Birth | | Position Held With
Funds and Length of
Service | | Principal Occupation
During Past Five Years | | Number of
Funds in the
Fund Family
Overseen by
Board Member | | Other Present or Past
Directorships/Trusteeships
(Within Past 5 Years)
| |
R. Glenn Hilliard
901 S. Marquette Ave.
Minneapolis, MN 55402
1943 | | Board member since 6/11 for RiverSource Funds and since 1/05 for Nations Funds | | Chairman and Chief Executive Officer, Hilliard Group LLC (investing and consulting), since April 2003; Non-Executive Director & Chairman, CNO Financial Group, Inc. (insurance), September 2003-May 2011 | | | 130 | | | Chairman, BofA Fund Series Trust (11 funds); former Director, CNO Financial Group, Inc. (insurance) | |
Stephen R. Lewis, Jr.
901 S. Marquette Ave.
Minneapolis, MN 55402
1939 | | Chair of the Board for RiverSource Funds since 1/07, Board member for RiverSource Funds since 1/02 and since 6/11 for Nations Funds | | President Emeritus and Professor of Economics Emeritus, Carleton College since 2002 | | | 132 | | | Director, Valmont Industries, Inc. (manufacturer of irrigation systems) since 2002 | |
Catherine James Paglia
901 S. Marquette Ave.
Minneapolis, MN 55402
1952 | | Board member since 11/04 for RiverSource Funds and since 6/11 for Nations Funds | | Director, Enterprise Asset Management, Inc. (private real estate and asset management company) | | | 132 | | | Director, Valmont Industries, Inc. (manufacturer of irrigation systems) since 2012 | |
Leroy C. Richie
901 S. Marquette Ave.
Minneapolis, MN 55402
1941 | | Board member since 2000 for Legacy Seligman Funds, since 11/08 for RiverSource Funds and since 6/11 for Nations Funds | | Counsel, Lewis & Munday, P.C. (law firm) since 2004; former Vice President and General Counsel, Automotive Legal Affairs, Chrysler Corporation from 1983-1987 | | | 132 | | | Lead Outside Director, Digital Ally, Inc. (digital imaging) since September 2005; Director, Infinity, Inc. (oil and gas exploration and production) since 1994; Director, OGE Energy Corp. (energy and energy services) since November 2007 | |
Minor M. Shaw
901 S. Marquette Ave.
Minneapolis, MN 55402
1947 | | Board member since 6/11 for RiverSource Funds and since 2003 for Nations Funds | | President, Micco LLC (private investments) since 2011; President, Micco Corp. since 1998 | | | 130 | | | Director, Piedmont Natural Gas; Director, BlueCross BlueShield of South Carolina since April 2008; Former Trustee, BofA Funds Series Trust (11 funds) | |
Alison Taunton-Rigby
901 S. Marquette Ave.
Minneapolis, MN 55402
1944 | | Board member since 11/02 for RiverSource Funds and since 6/11 for Nations Funds | | Chief Executive Officer and Director, RiboNovix, Inc. (biotechnology), 2003-2010 | | | 132 | | | Director, Healthways, Inc. (health and well-being improvement) since 2005; Director, ICI Mutual Insurance Company, RRG since 2011; Director, Abt Associates (government contractor) since 2001; Director, Boston Children's Hospital since 2002 | |
Annual Report 2013
36
Columbia California Intermediate Municipal Bond Fund
Trustees and Officers (continued)
Interested Trustee Not Affiliated With Investment Manager*
Name,
Address,
Year of Birth | | Position Held With
Funds and Length of
Service | | Principal Occupation
During Past Five Years | | Number of
Funds in the
Fund Family
Overseen by
Board Member | | Other Present or Past
Directorships/Trusteeships
(Within Past 5 Years)
| |
Anthony M. Santomero
901 S. Marquette Ave.
Minneapolis, MN 55402
1946 | | Board member since 6/11 for RiverSource Funds and since 1/08 for Nations Funds | | Richard K. Mellon Professor Emeritus of Finance, The Wharton School, University of Pennsylvania, since 2002; Senior Advisor, McKinsey & Company (consulting), 2006-2008 | | | 130 | | | Director, Renaissance Reinsurance Ltd. since May 2008; Trustee, Penn Mutual Life Insurance Company since March 2008; Director, Citigroup since 2009; Director, Citibank, N.A. since 2009; former Trustee, BofA Funds Series Trust (11 funds) | |
*Dr. Santomero is not an affiliated person of the investment manager or Ameriprise Financial. However, he is currently deemed by the funds to be an "interested person" (as defined in the 1940 Act) of the funds because he serves as a Director of Citigroup, Inc. and Citibank N.A., companies that may directly or through subsidiaries and affiliates engage from time-to-time in brokerage execution, principal transactions and lending relationships with the funds or accounts advised/managed by the investment manager.
Interested Trustee Affiliated With Investment Manager*
Name,
Address,
Year of Birth | | Position Held With
Funds and Length of
Service | | Principal Occupation
During Past Five Years | | Number of
Funds in the
Fund Family
Overseen by
Board Member | | Other Present or Past
Directorships/Trusteeships
(Within Past 5 Years) | |
William F. Truscott
53600 Ameriprise
Financial Center
Minneapolis, MN 55474
1960 | | Board member since 11/01 for RiverSource Funds and since 6/11 for Nations Funds; Senior Vice President since 2002 for RiverSource Funds and 5/10 for Nations Funds | | President, Columbia Management Investment Advisers, LLC since February 2012, (previously President, Chairman of the Board and Chief Investment Officer, 2001-April 2010); Chief Executive Officer, Global Asset Management, Ameriprise Financial, Inc. since September 2012 (previously Chief Executive Officer, U.S. Asset Management & President, Annuities, May 2010-September 2012 and President — U.S. Asset Management and Chief Investment Officer, 2005-April 2010); Chief Executive Officer, Columbia Management Investment Distributors, Inc. since February 2012, (previously Chairman of the Board and Chief Executive Officer, 2006-April 2010); Chairman of the Board and Chief Executive Officer, RiverSource Distributors, Inc. since 2006; President and Chief Executive Officer, Ameriprise Certificate Company 2006-August 2012 | | | 184 | | | Chairman of the Board, Columbia Management Investment Advisers, LLC since May 2010; Director, Columbia Management Investment Distributors, Inc. since May 2010; Director, Ameriprise Certificate Company, 2006-January 2013 | |
*Interested person (as defined under the 1940 Act) by reason of being an officer, director, security holder and/or employee of the investment manager or Ameriprise Financial.
The SAI has additional information about the Fund's Board members and is available, without charge, upon request by calling 800.345.6611; contacting your financial intermediary; or visiting columbiamanagement.com.
Annual Report 2013
37
Columbia California Intermediate Municipal Bond Fund
Trustees and Officers (continued)
The Board has appointed officers who are responsible for day-to-day business decisions based on policies it has established. The officers serve at the pleasure of the Board. In addition to Mr. Truscott, who is Senior Vice President, the funds' other officers are:
Officers
Name,
Address,
Year of Birth | | Position Held With
Funds and Length of
Service | | Principal Occupation During Past Five Years | |
J. Kevin Connaughton
225 Franklin Street
Boston, MA 02110
1964 | | President and Principal Executive Officer since 5/10 for RiverSource Funds and 2009 for Nations Funds | | Senior Vice President and General Manager — Mutual Fund Products, Columbia Management Investment Advisers, LLC since May 2010; Managing Director of Columbia Management Advisors, LLC, December 2004-April 2010; Senior Vice President and Chief Financial Officer, Columbia Funds, June 2008-January 2009; Treasurer, Columbia Funds, October 2003-May 2008 | |
Amy K. Johnson
5228 Ameriprise
Financial Center Minneapolis, MN 55474
1965 | | Vice President since 12/06 for RiverSource Funds and 5/10 for Nations Funds | | Senior Vice President and Chief Operating Officer, Columbia Management Investment Advisers, LLC since May 2010 (previously Chief Administrative Officer, 2009-April 2010 and Vice President — Asset Management and Trust Company Services, 2006-2009) | |
Michael G. Clarke
225 Franklin Street
Boston, MA 02110
1969 | | Treasurer since 1/11 and Chief Financial Officer since 4/11 for RiverSource Funds and Treasurer since 3/11 and Chief Financial Officer since 2009 for Nations Funds | | Vice President, Columbia Management Investment Advisers, LLC since May 2010; Managing Director of Fund Administration, Columbia Management Advisors, LLC, September 2004-April 2010; senior officer of Columbia Funds and affiliated funds since 2002 | |
Scott R. Plummer
5228 Ameriprise
Financial Center
Minneapolis, MN 55474
1959 | | Senior Vice President and Chief Legal Officer since 12/06 and Assistant Secretary since 6/11 for RiverSource Funds and Senior Vice President and Chief Legal Officer since 5/10 and Assistant Secretary since 6/11 for Nations Funds | | Senior Vice President, Chief Legal Officer and Assistant Secretary, Columbia Management Investment Advisers, LLC since June 2005; Vice President and Lead Chief Counsel — Asset Management, Ameriprise Financial, Inc. since May 2010 (previously Vice President and Chief Counsel — Asset Management, 2005-April 2010); Vice President, Chief Counsel and Assistant Secretary, Columbia Management Investment Distributors, Inc. since 2008; Vice President, General Counsel and Secretary, Ameriprise Certificate Company since 2005; Chief Counsel, RiverSource Distributors, Inc. since 2006 | |
Colin Moore
225 Franklin Street
Boston, MA 02110
1958 | | Senior Vice President since 5/10 for RiverSource Funds and Nations Funds | | Director and Chief Investment Officer, Columbia Management Investment Advisers, LLC since May 2010; Manager, Managing Director and Chief Investment Officer, Columbia Management Advisors, LLC, 2007-April 2010 | |
Thomas P. McGuire
225 Franklin Street
Boston, MA 02110
1972 | | Chief Compliance Officer since 3/12 | | Vice President — Asset Management Compliance, Columbia Management Investment Advisers, LLC since 2010; Chief Compliance Officer, Ameriprise Certificate Company since September 2010; Compliance Executive, Bank of America, 2005-2010 | |
Stephen T. Welsh
225 Franklin Street
Boston, MA 02110
1957 | | Vice President since 4/11 for RiverSource Funds and 2006 for Nations Funds | | President and Director, Columbia Management Investment Services Corp. since May 2010; President and Director, Columbia Management Services, Inc., July 2004-April 2010; Managing Director, Columbia Management Distributors, Inc., August 2007-April 2010 | |
Christopher O. Petersen
5228 Ameriprise
Financial Center
Minneapolis, MN 55474
1970 | | Vice President and Secretary since 4/11 for RiverSource Funds and 3/11 for Nations Funds | | Vice President and Chief Counsel, Ameriprise Financial, Inc. since January 2010 (formerly Vice President and Group Counsel or Counsel, April 2004-January 2010); Assistant Secretary of Legacy RiverSource Funds, January 2007-April 2011 and of the Nations Funds, May 2010-March 2011 | |
Annual Report 2013
38
Columbia California Intermediate Municipal Bond Fund
Trustees and Officers (continued)
Officers (continued)
Name,
Address,
Year of Birth | | Position Held With
Funds and Length of
Service | | Principal Occupation During Past Five Years | |
Paul D. Pearson
10468 Ameriprise
Financial Center
Minneapolis, MN 55474
1956 | | Vice President since 4/11 and Assistant Treasurer since 1999 for RiverSource Funds and Vice President and Assistant Treasurer since 6/11 for Nations Funds | | Vice President — Investment Accounting, Columbia Management Investment Advisers, LLC, since May 2010; Vice President — Managed Assets, Investment Accounting, Ameriprise Financial Corporation, February 1998-May 2010 | |
Joseph F. DiMaria
225 Franklin Street
Boston, MA 02110
1968 | | Vice President and Chief Accounting Officer since 4/11 and Vice President since 3/11 and Chief Accounting Officer since 2008 for Nations Funds | | Vice President, Mutual Fund Administration, Columbia Management Investment Advisers, LLC, since May 2010; Director of Fund Administration, Columbia Management Advisors, LLC, January 2006-April 2010 | |
Paul B. Goucher
100 Park Avenue
New York, NY 10017
1968 | | Vice President since 4/11 and Assistant Secretary since 11/08 for RiverSource Funds and 5/10 for Nations Funds | | Vice President and Lead Chief Counsel, Ameriprise Financial, Inc. since November 2008 and January 2013, respectively (formerly, Chief Counsel, January 2010-January 2013 and Group Counsel from November 2008-January 2010); Director, Managing Director and General Counsel, J. & W. Seligman & Co. Incorporated, July 2008-November 2008 (previously, Managing Director and Associate General Counsel, January 2005-July 2008) | |
Michael E. DeFao
225 Franklin Street
Boston, MA 02110
1968 | | Vice President since 4/11 and Assistant Secretary since 5/10 for RiverSource Funds and 2011 for Nations Funds | | Vice President and Chief Counsel, Ameriprise Financial, Inc. since May 2010; Associate General Counsel, Bank of America, June 2005-April 2010 | |
Annual Report 2013
39
Columbia California Intermediate Municipal Bond Fund
Approval of Investment Management Services Agreement
Columbia Management Investment Advisers, LLC (Columbia Management or the Investment Manager), a wholly-owned subsidiary of Ameriprise Financial, Inc. (Ameriprise Financial), serves as the investment manager to Columbia California Intermediate Municipal Bond Fund (the Fund). Under an investment management services agreement (the IMS Agreement), Columbia Management provides investment advice and other services to the Fund and other funds distributed by Columbia Management Investment Distributors, Inc. (collectively, the Funds).
On an annual basis, the Fund's Board of Trustees (the Board), including the independent Board members (the Independent Trustees), considers renewal of the IMS Agreement. Columbia Management prepared detailed reports for the Board and its Contracts Committee in January, March and April 2013, including reports based on analyses of data provided by an independent organization and a comprehensive response to each item of information requested by independent legal counsel to the Independent Trustees (Independent Legal Counsel) in a letter to the Investment Manager, to assist the Board in making this determination. All of the materials presented in January, March and April were first supplied in draft form to designated representatives of the Independent Trustees, i.e., Independent Legal Counsel, the Chair of the Board and the Chair of the Contracts Committee, and the final materials (including proposed additional breakpoints in IMS fees for certain Funds) were revised to reflect discussion and subsequent requests made by the Contracts Committee. In addition, throughout the year, the Board (or its committees) regularly meets with portfolio management teams and senior management personnel, and reviews information prepared by Columbia Management addressing the services Columbia Management provides and Fund performance. Further, the Board retained an independent consulting firm (the Independent Consultant) to assist the Independent Trustees in their review of IMS fees, expense caps and Ameriprise Financial's profitability. The Board also accords particular weight to the work, deliberations and conclusions of the Contracts Committee, the Investment Review Committee and the Compliance Committee in determining whether to continue the IMS Agreement.
The Board, at its April 15-17, 2013 in-person Board meeting (the April Meeting), considered the renewal of the IMS Agreement for an additional one-year term. At the April Meeting, Independent Legal Counsel reviewed with the Independent Trustees various factors relevant to the Board's consideration of advisory agreements and the Board's legal responsibilities related to such consideration. Following an analysis and discussion of the factors identified below, the Board, including all of the Independent Trustees, approved the renewal of the IMS Agreement.
Nature, Extent and Quality of Services Provided by Columbia Management
The Independent Trustees analyzed various reports and presentations they had received detailing the services performed by Columbia Management, as well as its expertise, resources and capabilities. The Independent Trustees specifically considered many developments during the past year concerning the services provided by Columbia Management, including, in particular, the recent globalization initiative, which fosters increased worldwide investment support of global products, continued investment in upgrading technology (such as the implementation of new systems and hardware), the hiring of a Chief Interest Rate Strategist as part of Columbia Management's fixed income team and the addition of Columbia Management investment personnel to the Asset Allocation, Quantitative and Technology teams. The Independent Trustees noted the information they received concerning Columbia Management's ability to retain its key portfolio management personnel. In this regard, the Independent Trustees took into account their comprehensive discussions with Columbia Management's Chief Investment Officer (the CIO), observing the organizational depth of Columbia Management and the capabilities of its investment personnel. The Independent Trustees also recalled the information the CIO provided them identifying the strengths and areas for enhancement of each Columbia Management investment team, as well as the discussion with the CIO regarding the investment personnel talent being infused to enhance support for certain Funds. The Independent Trustees also observed the materials demonstrating the strength and depth of Columbia Management's equity and fixed income research departments.
In connection with the Board's evaluation of the overall package of services provided by Columbia Management, the Board also considered the quality of administrative services provided to the Fund by Columbia Management, recalling the information it received highlighting significant achievements in 2012 in the performance of administrative services (such as strong accounting performance measures, refined derivatives processing and enhancements to the electronic communications under the affiliated and unaffiliated service provider oversight program). In evaluating the quality of services provided under the IMS Agreement and the Fund's Administrative Service Agreement, the Independent Trustees also took into account the organization and strength of the Fund's and its service providers' compliance programs. In
Annual Report 2013
40
Columbia California Intermediate Municipal Bond Fund
Approval of Investment Management Services Agreement (continued)
addition, the Board also reviewed the financial condition of Columbia Management (and its affiliates) and each entity's ability to carry out its responsibilities under the IMS Agreement and the Fund's other services agreements with affiliates of Ameriprise Financial, observing the financial strength of Ameriprise Financial, with its solid balance sheet. The Board also discussed the acceptability of the terms of the IMS Agreement (including the relatively broad scope of services required to be performed by Columbia Management). The Board concluded that the services being performed under the IMS Agreement were of a reasonably high quality.
Based on the foregoing, and based on other information received (both oral and written, including the information on investment performance referenced below) and other considerations, the Board concluded that Columbia Management and its affiliates were in a position to continue to provide a high quality and level of services to the Fund.
For purposes of evaluating the nature, extent Investment Performance and quality of services provided under the IMS Agreement, the Board carefully reviewed the investment performance of the Fund. In this regard, the Board considered detailed reports providing the results of analyses performed by an independent organization showing, for various periods, the performance of the Fund, the performance of a benchmark index, the percentage ranking of the Fund among its comparison group and the net assets of the Fund. The Board observed that the Fund's investment performance met expectations.
Comparative Fees, Costs of Services Provided and the Profits Realized By Columbia Management and its Affiliates from their Relationships with the Fund
The Board reviewed comparative fees and the costs of services to be provided under the IMS Agreement. The Board members considered detailed comparative information set forth in an annual report on fees and expenses, including, among other things, data (based on analyses conducted by an independent organization) showing a comparison of the Fund's expenses with median expenses paid by funds in its comparative peer universe, as well as data showing the Fund's contribution to Columbia Management's profitability.
The Board accorded particular weight to the notion that the level of fees should reflect a rational pricing model applied consistently across the various product lines in the Fund family, while assuring that the overall fees for each Fund (with few defined exceptions) are generally in line with the "pricing philosophy" (i.e., that the total expense ratio of the Fund is no higher than the median expense ratio of funds in the same comparison universe of the Fund).
In this connection, the Board also considered the Independent Consultant's report that concluded that: (i) the Funds' standardized investment management fee rates, particularly in the context of the current competitive fee landscape, were within a reasonable range; and (ii) the Funds' expense cap philosophy of assuring that each Fund's total expense ratio is not above its peer universe median ratio is reasonable. The Board took into account that the Fund's total expense ratio (after considering proposed expense caps/waivers) approximated the peer universe's median expense ratio. Based on its review, the Board concluded that the Fund's management fee was fair and reasonable in light of the extent and quality of services that the Fund receives.
The Board also considered the expected profitability of Columbia Management and its affiliates in connection with Columbia Management providing investment management services to the Fund. In this regard, the Board referred to a detailed profitability report, discussing the profitability to Columbia Management and Ameriprise Financial from managing, operating and distributing the Funds. In this regard, the Board observed that 2012 profitability approximates 2011 profitability and that, as was the case in 2011, 2012 profitability remained generally in line with (and, in many cases, lower than) the reported profitability of other asset management firms. Further, the Board considered the Independent Consultant's report that concluded that Columbia Management's profitability, particularly in comparison to industry competitors, was reasonable and not excessive. It also took into account the indirect economic benefits flowing to Columbia Management or its affiliates in connection with managing or distributing the Funds, such as the enhanced ability to offer various other financial products to Ameriprise Financial customers, soft dollar benefits and overall reputational advantages. The Board noted that the fees paid by the Funds should permit the Investment Manager to offer competitive compensation to its personnel, make necessary investments in its business and earn an appropriate profit. The Board concluded that profitability levels were reasonable.
Annual Report 2013
41
Columbia California Intermediate Municipal Bond Fund
Approval of Investment Management Services Agreement (continued)
Economies of Scale to be Realize
The Board also considered the economies of scale that might be realized by Columbia Management as the Fund grows and took note of the extent to which Fund shareholders might also benefit from such growth. In this regard, the Independent Trustees took into account that IMS fees decline as Fund assets exceed various breakpoints, all of which have not been surpassed.
Based on the foregoing, the Board, including all of the Independent Trustees, concluded that the investment management service fees were fair and reasonable in light of the extent and quality of services provided. In reaching this conclusion, no single factor was determinative. On April 17, 2013, the Board, including all of the Independent Trustees, approved the renewal of the IMS Agreement.
Annual Report 2013
42
This page intentionally left blank.
Annual Report 2013
43
This page intentionally left blank.
Annual Report 2013
44
Columbia California Intermediate Municipal Bond Fund
Important Information About This Report
Each fund mails one shareholder report to each shareholder address. If you would like more than one report, please call shareholder services at 800.345.6611 and additional reports will be sent to you.
The policy of the Board is to vote the proxies of the companies in which each fund holds investments consistent with the procedures as stated in the Statement of Additional Information (SAI). You may obtain a copy of the SAI without charge by calling 800.345.6611; contacting your financial intermediary; visiting columbiamanagement.com; or searching the website of the Securities and Exchange Commission (SEC) at sec.gov. Information regarding how each fund voted proxies relating to portfolio securities is filed with the SEC by August 31 for the most recent 12-month period ending June 30 of that year, and is available without charge by visiting columbiamanagement.com; or searching the website of the SEC at sec.gov.
Each fund files a complete schedule of portfolio holdings with the SEC for the first and third quarters of each fiscal year on Form N-Q. Each fund's Form N-Q is available on the SEC's website at sec.gov and may be reviewed and copied at the SEC's Public Reference Room in Washington, D.C. Information on the operation of the Public Reference Room may be obtained by calling 800.SEC.0330. Each fund's complete schedule of portfolio holdings, as filed on Form N-Q, can also be obtained without charge, upon request, by calling 800.345.6611.
Annual Report 2013
45

Columbia California Intermediate Municipal Bond Fund
P.O. Box 8081
Boston, MA 02266-8081
columbiamanagement.com
This information is for use with concurrent or prior delivery of a fund prospectus. Please read and consider the investment objectives, risks, charges and expenses for any fund carefully before investing. For a prospectus which contains this and other important information about the Fund go to columbiamanagement.com. The Fund is distributed by Columbia Management Investment Distributors, Inc., member FINRA, and managed by Columbia Management Investment Advisers, LLC.
© 2013 Columbia Management Investment Advisers, LLC. All rights reserved.
ANN122_04_C01_(06/13)
Item 2. Code of Ethics.
(a) The registrant has adopted a code of ethics that applies to the registrant’s principal executive officer, principal financial officer, principal accounting officer or controller, or persons performing similar functions, regardless of whether these individuals are employed by the registrant or a third party.
(b) During the period covered by this report, there were not any amendments to a provision of the code of ethics adopted in 2(a) above.
(c) During the period covered by this report, there were no waivers, including any implicit waivers, from a provision of the code of ethics described in 2(a) above that relates to one or more of the items set forth in paragraph (b) of this item’s instructions.
Item 3. Audit Committee Financial Expert.
The registrant’s Board of Trustees has determined that Edward J. Boudreau, Pamela G. Carlton, William P. Carmichael, William A. Hawkins and Alison Taunton-Rigby, each of whom are members of the registrant’s Board of Trustees and Audit Committee, each qualify as an audit committee financial expert. Mr. Boudreau, Ms. Carlton, Mr. Carmichael, Mr. Hawkins and Ms. Taunton-Rigby are each independent trustees, as defined in paragraph (a)(2) of this item’s instructions.
Item 4. Principal Accountant Fees and Services.
Fee information below is disclosed for the seven series of the registrant whose reports to stockholders are included in this annual filing. The fees presented for 2013 also include two series that liquidated during the period. The series changed its fiscal year end from March 31 to April 30, effective April 30, 2012. The fees presented for 2012 represent the one month period ended April 30, 2012 and the fiscal year ended March 31, 2012.
(a) Audit Fees. Aggregate Audit Fees billed by the principal accountant for professional services rendered during the fiscal year ended April 30, 2013, the one month period ended April 30, 2012 and the fiscal year ended March 31, 2012 are approximately as follows:
April 30, 2013 | | One month period ended
April 30, 2012 | | March 31, 2012 | |
$ | 154,000 | | $ | 63,800 | | $ | 284,400 | |
| | | | | | | | |
Audit Fees include amounts related to the audit of the registrant’s annual financial statements or services that are normally provided by the accountant in connection with statutory and regulatory filings or engagements for those fiscal years.
(b) Audit-Related Fees. Aggregate Audit-Related Fees billed to the registrant by the principal accountant for professional services rendered during the fiscal year ended April 30, 2013, the one month period ended April 30, 2012 and the fiscal year ended March 31, 2012 are approximately as follows:
April 30, 2013 | | One month period
ended April 30, 2012 | | March 31, 2012 | |
$ | 2,800 | | $ | 0 | | $ | 59,800 | |
| | | | | | | | |
Audit-Related Fees include amounts for assurance and related services by the principal accountant that are reasonably related to the performance of the audit of the registrant’s financial statements and are not reported in Audit Fees above. In both fiscal years 2013 and 2012, Audit-Related Fees consist of agreed-upon procedures performed for semi-annual shareholder reports. Fiscal year 2012 also includes Audit-Related Fees for agreed-upon procedures for fund accounting and custody conversions.
During the fiscal year ended April 20, 2013, the one month period ended April 30, 2012 and the fiscal year ended March 31, 2012, there were no Audit-Related Fees billed by the registrant’s principal accountant to the registrant’s investment adviser (not including any sub-adviser whose role is primarily portfolio management and is subcontracted with or overseen by another investment adviser) and any entity controlling, controlled by, or under common control with the adviser that provides ongoing services to the registrant for an engagement that related directly to the operations and financial reporting of the registrant.
(c) Tax Fees. Aggregate Tax Fees billed by the principal accountant to the registrant for professional services rendered during the fiscal year ended April 30, 2013, the one month period ended April 30, 2012 and the fiscal year ended March 31, 2012 are approximately as follows:
April 30, 2013 | | One month period
ended April 30, 2012 | | March 31, 2012 | |
$ | 72,400 | | $ | 0 | | $ | 43,000 | |
| | | | | | | | |
Tax Fees include amounts for the review of annual tax returns, the review of required shareholder distribution calculations and typically include amounts for professional services by the principal accountant for tax compliance, tax advice and tax planning. In
fiscal year 2013, Tax Fees also include agreed-upon procedures related to fund liquidations and the review of final tax returns.
During the fiscal year ended April 20, 2013, the one month period ended April 30, 2012 and the fiscal year ended March 31, 2012, there were no Tax Fees billed by the registrant’s principal accountant to the registrant’s investment adviser (not including any sub-adviser whose role is primarily portfolio management and is subcontracted with or overseen by another investment adviser) and any entity controlling, controlled by, or under common control with the adviser that provides ongoing services to the registrant for an engagement that related directly to the operations and financial reporting of the registrant.
(d) All Other Fees. Aggregate All Other Fees billed by the principal accountant to the registrant for professional services rendered during the fiscal year ended April 30, 2013, the one month period ended April 30, 2012 and the fiscal year ended March 31, 2012 are approximately as follows:
April 30, 2013 | | One month period
ended April 30, 2012 | | March 31, 2012 | |
$ | 0 | | $ | 0 | | $ | 0 | |
| | | | | | | | |
All Other Fees include amounts for products and services provided by the principal accountant, other than the services reported in paragraphs (a) through (c) above.
Aggregate All Other Fees billed by the registrant’s principal accountant to the registrant’s investment adviser (not including any sub-adviser whose role is primarily portfolio management and is subcontracted with or overseen by another investment adviser) and any entity controlling, controlled by, or under common control with the adviser that provides ongoing services to the registrant for an engagement that related directly to the operations and financial reporting of the registrant during the fiscal year ended April 30, 2013, the one month period ended April 30, 2012 and the fiscal year ended March 31, 2012 are approximately as follows:
April 30, 2013 | | One month period
ended April 30, 2012 | | March 31, 2012 | |
$ | 115,000 | | $ | 0 | | $ | 395,800 | |
| | | | | | | | |
In both fiscal years 2013 and 2012, All Other Fees consist of fees billed for internal control examinations of the registrant’s transfer agent and investment advisor.
(e)(1) Audit Committee Pre-Approval Policies and Procedures
The registrant’s Audit Committee is required to pre-approve the engagement of the registrant’s independent accountants to provide audit and non-audit services to the registrant and non-audit services to its investment adviser (not including any sub-adviser whose role is primarily portfolio management and is subcontracted with or overseen by
another investment adviser) or any entity controlling, controlled by or under common control with such investment adviser that provides ongoing services to the registrant (“Adviser Affiliates”), if the engagement relates directly to the operations and financial reporting of the registrant.
The Audit Committee has adopted a Policy for Engagement of Independent Accountants for Audit and Non-Audit Services (“Policy”). The Policy sets forth the understanding of the Audit Committee regarding the engagement of the registrant’s independent accountants to provide (i) audit and permissible audit-related, tax and other services to the registrant (collectively “Fund Services”); (ii) non-audit services to the registrant’s investment adviser (not including any sub-adviser whose role is primarily portfolio management and is subcontracted with or overseen by another investment adviser) and Adviser Affiliates, if the engagement relates directly to the operations or financial reporting of a Fund (collectively “Fund-related Adviser Services”); and (iii) certain other audit and non-audit services to the registrant’s investment adviser (not including any sub-adviser whose role is primarily portfolio management and is subcontracted with or overseen by another investment adviser) and Adviser Affiliates. As set forth in this Fund Policy, a service will require specific pre-approval by the Audit Committee if it is to be provided by the Fund’s independent auditor; provided, however, that pre-approval of non-audit services to the Fund, the Adviser or Control Affiliates may be waived if certain de minimis requirements set forth in the SEC’s rules are met.
Under the Policy, the Audit Committee may delegate pre-approval authority to any pre-designated member or members who are Independent Trustees/Directors. The member(s) to whom such authority is delegated must report, for informational purposes only, any pre-approval decisions to the Audit Committee at its next regular meeting. The Audit Committee’s responsibilities with respect to the pre-approval of services performed by the independent accountants may not be delegated to management.
On an annual basis, at a regularly scheduled Audit Committee meeting, the Fund’s Treasurer or other Fund Officer shall submit to the Audit Committee a schedule of the types of Fund Services and Fund-related Adviser Services that are subject to specific pre-approval.
This schedule will provide a description of each type of service that is subject to specific pre-approval, along with total projected fees for each service. The pre-approval will generally cover a one-year period. The Audit Committee will review and approve the types of services and the projected fees for the next one-year period and may add to, or subtract from, the list of pre-approved services from time to time, based on subsequent determinations. This specific approval acknowledges that the Audit Committee is in agreement with the types of services that the independent accountants will be permitted to perform.
The Fund’s Treasurer or other Fund Officer shall report to the Audit Committee at each of its regular meetings regarding all Fund Services or Fund-related Adviser Services initiated since the last such report was rendered, including a general description of the services with forecasted fees for the annual period, proposed changes requiring specific
pre-approval and a description of services provided by the independent auditor with actual fees during the current reporting period.
*****
(e)(2) 100% of the services performed for items (b) through (d) above during 2013 and 2012 were pre-approved by the registrant’s Audit Committee.
(f) Not applicable.
(g) The aggregate non-audit fees billed by the registrant’s accountant for services rendered to the registrant, and rendered to the registrant’s investment adviser (not including any sub-adviser whose role is primarily portfolio management and is subcontracted with or overseen by another investment adviser), and any entity controlling, controlled by, or under common control with the adviser that provides ongoing services to the registrant for the fiscal year ended April 30, 2013, the one month period ended April 30, 2012 and the fiscal year ended March 31, 2012 are approximately as follows:
April 30, 2013 | | One month period
ended April 30, 2012 | | March 31, 2012 | |
$ | 190,200 | | $ | 0 | | $ | 498,600 | |
| | | | | | | | |
(h) The registrant’s Audit Committee of the Board of Directors has considered whether the provision of non-audit services that were rendered to the registrant’s adviser (not including any sub-adviser whose role is primarily portfolio management and is subcontracted with or overseen by another investment adviser), and any entity controlling, controlled by, or under common control with the investment adviser that provides ongoing services to the registrant that were not pre-approved pursuant to paragraph (c)(7)(ii) of Rule 2-01 of Regulation S-X, is compatible with maintaining the principal accountant’s independence.
Item 5. Audit Committee of Listed Registrants.
Not applicable.
Item 6. Investments
(a) The registrant’s “Schedule I — Investments in securities of unaffiliated issuers” (as set forth in 17 CFR 210.12-12) is included in Item 1 of this Form N-CSR.
(b) Not applicable.
Item 7. Disclosure of Proxy Voting Policies and Procedures for Closed-End Management Investment Companies.
Not applicable.
Item 8. Portfolio Managers of Closed-End Management Investment Companies.
Not applicable.
Item 9. Purchases of Equity Securities by Closed-End Management Investment Company and Affiliated Purchasers.
Not applicable.
Item 10. Submission of Matters to a Vote of Security Holders.
There were no material changes to the procedures by which shareholders may recommend nominees to the registrant’s board of directors.
Item 11. Controls and Procedures.
(a) The registrant’s principal executive officer and principal financial officers, based on their evaluation of the registrant’s disclosure controls and procedures as of a date within 90 days of the filing of this report, have concluded that such controls and procedures are adequately designed to ensure that material information required to be disclosed by the registrant in Form N-CSR is accumulated and communicated to the registrant’s management, including the principal executive officer and principal financial officer, or persons performing similar functions, as appropriate to allow timely decisions regarding required disclosure.
(b) There was no change in the registrant’s internal control over financial reporting that occurred during the registrant’s second fiscal quarter of the period covered by this report that has materially affected, or is reasonably likely to materially affect, the registrant’s internal control over financial reporting.
Item 12. Exhibits.
(a)(1) Code of ethics required to be disclosed under Item 2 of Form N-CSR attached hereto as Exhibit 99.CODE ETH.
(a)(2) Certifications pursuant to Rule 30a-2(a) under the Investment Company Act of 1940 (17 CFR 270.30a-2(a)) attached hereto as Exhibit 99.CERT.
(a)(3) Not applicable.
(b) Certification pursuant to Rule 30a-2(b) under the Investment Company Act of 1940 (17 CFR 270.30a-2(b)) attached hereto as Exhibit 99.906CERT.
SIGNATURES
Pursuant to the requirements of the Securities Exchange Act of 1934 and the Investment Company Act of 1940, the registrant has duly caused this report to be signed on its behalf by the undersigned, thereunto duly authorized.
(registrant) | | Columbia Funds Series Trust | |
| | |
By (Signature and Title) | /s/ J. Kevin Connaughton | |
| J. Kevin Connaughton, President and Principal Executive Officer | |
| | |
Date | | June 21, 2013 | |
| | | | |
Pursuant to the requirements of the Securities Exchange Act of 1934 and the Investment Company Act of 1940, this report has been signed below by the following persons on behalf of the registrant and in the capacities and on the dates indicated.
By (Signature and Title) | /s/ J. Kevin Connaughton | |
| J. Kevin Connaughton, President and Principal Executive Officer | |
| | |
Date | | June 21, 2013 | |
| | |
By (Signature and Title) | /s/ Michael G. Clarke | |
| Michael G. Clarke, Treasurer and Chief Financial Officer | |
| | |
Date | | June 21, 2013 | |