UNITED STATES
SECURITIES AND EXCHANGE COMMISSION
Washington, D.C. 20549
FORM N-CSR
CERTIFIED SHAREHOLDER REPORT OF REGISTERED
MANAGEMENT INVESTMENT COMPANIES
Investment Company Act file number | 811-09645 |
|
Columbia Funds Series Trust |
(Exact name of registrant as specified in charter) |
|
225 Franklin Street, Boston, Massachusetts | | 02110 |
(Address of principal executive offices) | | (Zip code) |
|
Scott R. Plummer 5228 Ameriprise Financial Center Minneapolis, MN 55474 |
(Name and address of agent for service) |
|
Registrant’s telephone number, including area code: | 1-612-671-1947 | |
|
Date of fiscal year end: | January 31 | |
|
Date of reporting period: | January 31, 2013 | |
| | | | | | | | |
Form N-CSR is to be used by management investment companies to file reports with the Commission not later than 10 days after the transmission to stockholders of any report that is required to be transmitted to stockholders under Rule 30e-1 under the Investment Company Act of 1940 (17 CFR 270.30e-1). The Commission may use the information provided on Form N-CSR in its regulatory, disclosure review, inspection, and policymaking roles.
A registrant is required to disclose the information specified by Form N-CSR, and the Commission will make this information public. A registrant is not required to respond to the collection of information contained in Form N-CSR unless the Form displays a currently valid Office of Management and Budget (“OMB”) control number. Please direct comments concerning the accuracy of the information collection burden estimate and any suggestions for reducing the burden to Secretary, Securities and Exchange Commission, 450 Fifth Street, NW, Washington, DC 20549-0609. The OMB has reviewed this collection of information under the clearance requirements of 44 U.S.C. § 3507.
Item 1. Reports to Stockholders.
Annual Report
January 31, 2013

Columbia LifeGoal® Growth Portfolio
Not FDIC insured • No bank guarantee • May lose value
Columbia LifeGoal® Growth Portfolio
 Dear Shareholders,
U.S. stocks flat, foreign markets strong in 2012 finale
After a strong third quarter, U.S. stock market averages treaded water as 2012 came to a close. However, they ended the year up strongly, as first and third quarter gains more than offset second and fourth quarter weakness. Typically a strong quarter for domestic small- and mid-cap issues, the fourth quarter of 2012 indeed proved to be another year-end positive for small-cap stocks. For the full calendar year 2012, the S&P 500 Index rose 16.00%.
Stock markets outside the United States generated some of the best returns for the fourth quarter, as optimism rebounded, thanks to the September actions of the European Central Bank in support of the euro and an improving outlook from China. Both developed and emerging foreign markets topped U.S. stocks by a solid margin.
Corporate and emerging markets led fixed income
Fixed-income investors took their cue from the equity markets and continued to favor the highest risk sectors through the end of 2012. Global fixed-income returns posted mixed results in the final quarter of the year. Gains were the highest for corporate high-yield and emerging market bonds. Although investors remained cautious ahead of the year-end budget negotiations, better economic data and a further improvement in the European sovereign debt crisis supported riskier assets and depressed government bond prices. In December, the Federal Reserve announced its intention to continue to purchase both Treasury and mortgage-backed securities and said that it would seek to keep short-term interest rates unchanged until the unemployment rate reaches 6.5%, or inflation turned noticeably higher.
Stay on track with Columbia Management
Backed by more than 100 years of experience, Columbia Management is one of the nation's largest asset managers. At the heart of our success — and, most importantly, that of our investors — are highly talented industry professionals, brought together by a unique way of working. We are dedicated to helping you take advantage of today's opportunities and anticipate tomorrow's. We stay abreast of the latest investment trends and ideas, using our collective insight to evaluate events and transform them into solutions you can use.
Visit columbiamanagement.com for:
> The Columbia Management Perspectives blog, featuring timely posts by our investment teams
> Detailed up-to-date fund performance and portfolio information
> Economic analysis and market commentary
> Quarterly fund commentaries
> Columbia Management Investor, our award-winning quarterly newsletter for shareholders
Thank you for your continued support of the Columbia Funds. We look forward to serving your investment needs for many years to come.
Best Regards,

J. Kevin Connaughton
President, Columbia Funds
The S&P 500 Index, an unmanaged index, measures the performance of 500 widely held, large-capitalization U.S. stocks and is frequently used as a general measure of market performance. Indices are not available for investment, are not professionally managed and do not reflect sales charges, fees, brokerage commissions, taxes or other expenses of investing.
Investors should consider the investment objectives, risks, charges and expenses of a mutual fund carefully before investing. For a free prospectus, which contains this and other important information about a fund, visit columbiamanagement.com. The prospectus should be read carefully before investing.
Columbia Funds are distributed by Columbia Management Investment Distributors, Inc., member FINRA, and managed by Columbia Management Investment Advisers, LLC.
© 2013 Columbia Management Investment Advisers, LLC. All rights reserved.
Columbia LifeGoal® Growth Portfolio
Performance Overview | | | 2 | | |
Manager Discussion of Portfolio Performance | | | 4 | | |
Understanding Your Portfolio's Expenses | | | 6 | | |
Portfolio of Investments | | | 8 | | |
Statement of Assets and Liabilities | | | 13 | | |
Statement of Operations | | | 15 | | |
Statement of Changes in Net Assets | | | 16 | | |
Financial Highlights | | | 19 | | |
Notes to Financial Statements | | | 27 | | |
Report of Independent Registered
Public Accounting Firm | | | 33 | | |
Federal Income Tax Information | | | 34 | | |
Trustees and Officers | | | 35 | | |
Important Information About This Report | | | 41 | | |
Portfolio Investment Manager
Columbia Management Investment
Advisers, LLC
225 Franklin Street
Boston, MA 02110
Portfolio Distributor
Columbia Management Investment
Distributors, Inc.
225 Franklin Street
Boston, MA 02110
Portfolio Transfer Agent
Columbia Management Investment
Services Corp.
P.O. Box 8081
Boston, MA 02266-8081
For more information about any of the funds, please visit columbiamanagement.com or call 800.345.6611. Customer Service Representatives are available to answer your questions Monday through Friday from 8 a.m. to 8 p.m. Eastern time.
The views expressed in this report reflect the current views of the respective parties. These views are not guarantees of future performance and involve certain risks, uncertainties and assumptions that are difficult to predict, so actual outcomes and results may differ significantly from the views expressed. These views are subject to change at any time based upon economic, market or other conditions and the respective parties disclaim any responsibility to update such views. These views may not be relied on as investment advice and, because investment decisions for a Columbia Fund are based on numerous factors, may not be relied on as an indication of trading intent on behalf of any particular Columbia Fund. References to specific securities should not be construed as a recommendation or investment advice.
Columbia LifeGoal® Growth Portfolio
Performance Summary
> Columbia LifeGoal® Growth Portfolio (the Portfolio) Class A shares returned 13.81% excluding sales charges for the 12-month period ended January 31, 2013.
> The Portfolio underperformed its benchmark, the S&P 500 Index, which returned 16.78% during the same 12-month period.
> We attribute the Portfolio's underperformance primarily to an underweighting to international developed market equities and to the underperformance of several underlying U.S. equity funds.
Average Annual Total Returns (%) (for period ended January 31, 2013)
| | Inception | | 1 Year | | 5 Years | | 10 Years | |
Class A | | 10/15/96 | | | | | | | |
Excluding sales charges | | | | | 13.81 | | | | 3.73 | | | | 9.30 | | |
Including sales charges | | | | | 7.24 | | | | 2.51 | | | | 8.65 | | |
Class B | | 08/12/97 | | | | | | | |
Excluding sales charges | | | | | 12.93 | | | | 2.96 | | | | 8.48 | | |
Including sales charges | | | | | 7.93 | | | | 2.63 | | | | 8.48 | | |
Class C | | 10/15/96 | | | | | | | |
Excluding sales charges | | | | | 12.95 | | | | 2.96 | | | | 8.48 | | |
Including sales charges | | | | | 11.95 | | | | 2.96 | | | | 8.48 | | |
Class K (formerly Class R4)* | | 03/07/11 | | | 13.93 | | | | 3.77 | | | | 9.32 | | |
Class R* | | 01/23/06 | | | 13.49 | | | | 3.47 | | | | 9.02 | | |
Class R4* | | 11/08/12 | | | 13.93 | | | | 3.75 | | | | 9.31 | | |
Class R5* | | 11/08/12 | | | 13.97 | | | | 3.76 | | | | 9.31 | | |
Class Z | | 10/15/96 | | | 14.09 | | | | 4.00 | | | | 9.58 | | |
S&P 500 Index | | | | | 16.78 | | | | 3.97 | | | | 7.93 | | |
Returns for Class A are shown with and without the maximum initial sales charge of 5.75%. Returns for Class B are shown with and without the applicable contingent deferred sales charge (CDSC) of 5.00% in the first year, declining to 1.00% in the sixth year and eliminated thereafter. Returns for Class C are shown with and without the 1.00% CDSC for the first year only. The Portfolio's other classes are not subject to sales charges and have limited eligibility. Please see the Portfolio's prospectuses for details. Performance for different share classes will vary based on differences in sales charges and fees associated with each class. All results shown assume reinvestment of distributions during the period. Returns do not reflect the deduction of taxes that a shareholder may pay on Portfolio distributions or on the redemption of Portfolio shares. Performance results reflect the effect of any fee waivers or reimbursements of Portfolio expenses by Columbia Management Investment Advisers, LLC and/or any of its affiliates. Absent these fee waivers or expense reimbursement arrangements, performance results would have been lower.
The performance information shown represents past performance and is not a guarantee of future results. The investment return and principal value of your investment will fluctuate so that your shares, when redeemed, may be worth more or less than their original cost. Current performance may be lower or higher than the performance information shown. You may obtain performance information current to the most recent month-end by contacting your financial intermediary, visiting columbiamanagement.com or calling 800.345.6611.
*The returns shown for periods prior to the share class inception date (including returns for the Life of the Portfolio, if shown, which are since Portfolio inception) include the returns of the Portfolio's oldest share class. Since the Portfolio launched more than one share class at its inception, Class A shares were used. These returns are adjusted to reflect any higher class-related operating expenses of the newer share classes, as applicable. Please visit columbiamanagement.com/mutual-funds/appended-performance for more information.
The S&P 500 Index, an unmanaged index, measures the performance of 500 widely held, large-capitalization U.S. stocks and is frequently used as a general measure of market performance.
Indices are not available for investment, are not professionally managed and do not reflect sales charges, fees, brokerage commissions, taxes or other expenses of investing. Securities in the Portfolio may not match those in an index.
Annual Report 2013
2
Columbia LifeGoal® Growth Portfolio
Performance Overview (continued)
Performance of a Hypothetical $10,000 Investment (February 1, 2003 – January 31, 2013)
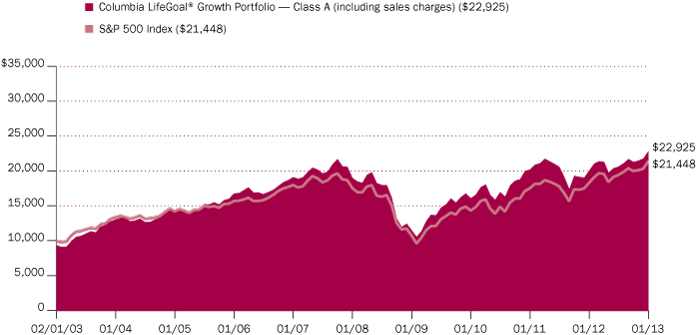
The chart above shows the change in value of a hypothetical $10,000 investment in Class A shares of Columbia LifeGoal® Growth Portfolio during the stated time period, and does not reflect the deduction of taxes that a shareholder may pay on Portfolio distributions or on the redemption of Portfolio shares.
Annual Report 2013
3
Columbia LifeGoal® Growth Portfolio
Manager Discussion of Portfolio Performance
For the 12-month period that ended January 31, 2013, the Portfolio's Class A shares returned 13.81% excluding sales charges. The Portfolio underperformed its benchmark, the S&P 500 Index, which returned 16.78% during the period. We attribute the Portfolio's underperformance primarily to the underperformance of several underlying U.S. equity funds.
Equity Markets Advanced Despite Market Gyrations
A rally in equity markets spanned the annual period, however it was not without a healthy dose of skepticism and market gyrations along the way. From the beginning of the annual period in February 2012 through early April 2012, global equity prices advanced at a brisk pace. Then, from early April 2012 through early June 2012, the equity markets corrected significantly. Concerns had surfaced around political negotiations in Washington D.C., and worries heightened about the pace of economic growth in Europe and China and geopolitical turmoil in the Middle East. In the U.S., economic data lost momentum as a disappointing series of payroll reports, sentiment indicators, Institute for Supply Management (ISM) manufacturing figures and inflation all exhibited cautionary readings.
From early June 2012 through the remainder of the annual period ended January 31, 2013, riskier assets performed strongly. U.S. equities enjoyed double-digit gains. The strong performance by riskier assets during these months was driven by several factors but included the European Central Bank's indication that it would do "whatever it takes" to preserve the currency union; the resolution of the U.S. presidential elections; improved U.S. housing, export and consumer spending data; seemingly stabilized economic growth in China; and anticipation of policies to be implemented by Japan's newly-elected prime minister Shinzo Abe. Further, stronger global economic growth overall, a cheaper U.S. dollar and a continued decline in borrowing costs contributed to a more favorable outlook for corporate profitability in the U.S.
Underlying Fund Performance Detracted from Relative Results
Areas that detracted from the Portfolio's relative results during the annual period included underlying funds in the mid-cap growth and small-cap segments of the U.S. equity market, as well as the Portfolio's exposure to commodities via Columbia Energy and Natural Resources Fund, which in general produced a nearly flat return. While the Portfolio's exposure to convertible securities and alternative investments via Columbia Convertible Securities Fund and Columbia Flexible Capital and Income Fund aided results on an absolute basis with double-digit gains from both for the fiscal year , both underperformed the Portfolio's benchmark and detracted from the Portfolio's overall relative return. Underlying funds that outperformed the Portfolio's benchmark during the period, contributing to relative results, included dividend-focused Columbia Dividend Opportunity Fund, and U.S. large-cap equity funds Columbia Contrarian Core Fund, Columbia Large Cap Core Fund and Columbia Large Cap Growth Fund.
Various Factors Drove Portfolio Changes
Changes within the Portfolio can be driven by active trading, by directing allocations to select market segments or by market appreciation or depreciation within a given market segment. In a world defined by low macroeconomic growth and extraordinary monetary policy stimulus across the developed world,
Portfolio Management
Colin Moore, AIIMR
Anwiti Bahugana, Ph.D.
Robert McConnaughey
Melda Mergen, CFA, CAIA
Marie Schofield, CFA
Beth Vanney, CFA
Portfolio Breakdown (%)
(at January 31, 2013) | |
Equity Funds | | | 87.7 | | |
Dividend Income | | | 30.2 | | |
International | | | 9.0 | | |
U.S. Large Cap | | | 41.5 | | |
U.S. Mid Cap | | | 5.0 | | |
U.S. Small Cap | | | 2.0 | | |
Fixed-Income Funds | | | 6.4 | | |
Convertible | | | 6.4 | | |
Alternative Investments | | | 5.9 | | |
Total | | | 100.0 | | |
Percentages indicated are based upon total investments.
Annual Report 2013
4
Columbia LifeGoal® Growth Portfolio
Manager Discussion of Portfolio Performance (continued)
we currently believe that the market's voracious hunger for yield may continue and secular growth may remain scarce and thus, in high demand. Therefore, we continue to believe in a balance between steady income generation and market-share gaining growers, all wrapped with a focus on the sustainability of those attributes. The Portfolio's allocation to international developed market equities increased, as we added a new dividend-focused global equity strategy to the Portfolio's available underlying funds during the annual period. The Portfolio's exposures to commodities and convertible/flexible capital strategies, via underlying funds, also increased during the annual period. The Portfolio's weightings in U.S. mid-cap and large-cap equities decreased, and we eliminated completely the Portfolio's allocation to underlying funds implementing absolute return strategies.
Looking Ahead
Global equities posted strong gains to start calendar year 2013, with the S&P 500 Index rallying to a new cyclical high. Indeed, as of January 31, 2013, the S&P 500 Index stood just shy of its all-time peak hit in 2007. With macroeconomic fears subsiding over the last few months of the annual period, the new concern amongst many on Wall Street was that excessive investor complacency may be growing. Whether or not complacency is creeping into investors' psyche or not is, of course, open for debate. However, we do currently expect the upcoming year to be marked by global economic growth that proves to be a little better than seen in 2012, despite the drag from potential fiscal policy and debt issues in the U.S., Japan and the Eurozone. At present, China's re-acceleration of economic growth is expected to help both fiscal policy and debt issues arithmetically and is also likely, in our view, to have a disproportionate impact on investor confidence through much of the world. At the end of the fiscal year, equity risk premiums were significantly elevated versus long-term averages and dividends exceeded corporate bond yields for some firms. We believe this indicates that many investors are currently seeking income over capital gains, and we currently expect this search for yield to continue. Amidst this environment, we believe investors should focus on risk-adjusted returns and emphasize risk diversification. Investors should be advised, however, that diversification does not assure a profit or guarantee against a loss.
Annual Report 2013
5
Columbia LifeGoal® Growth Portfolio
Understanding Your Portfolio's Expenses
(Unaudited)
As an investor, you incur two types of costs. There are transaction costs, which generally include sales charges on purchases and may include redemption fees. There are also ongoing costs, which generally include management fees, distribution and service (Rule 12b-1) fees, and other portfolio expenses. The following information is intended to help you understand your ongoing costs (in dollars) of investing in the Portfolio and to help you compare these costs with the ongoing costs of investing in other mutual funds.
Analyzing Your Portfolio's Expenses
To illustrate these ongoing costs, we have provided examples and calculated the expenses paid by investors in each share class of the Portfolio during the period. The actual and hypothetical information in the table is based on an initial investment of $1,000 at the beginning of the period indicated and held for the entire period. Expense information is calculated two ways and each method provides you with different information. The amount listed in the "Actual" column is calculated using the Portfolio's actual operating expenses and total return for the period. You may use the Actual information, together with the amount invested, to estimate the expenses that you paid over the period. Simply divide your account value by $1,000 (for example, an $8,600 account value divided by $1,000 = 8.6), then multiply the results by the expenses paid during the period under the Actual column. The amount listed in the "Hypothetical" column assumes a 5% annual rate of return before expenses (which is not the Portfolio's actual return) and then applies the Portfolio's actual expense ratio for the period to the hypothetical return. You should not use the hypothetical account values and expenses to estimate either your actual account balance at the end of the period or the expenses you paid during the period. See "Compare With Other Funds" below for details on how to use the hypothetical data.
In addition to the ongoing expenses which the Portfolio bears directly, the Portfolio's shareholders indirectly bear the Portfolio's allocable share of the costs and expenses of each underlying fund in which the Portfolio invests. You can also estimate the effective expenses paid during the period, which includes the indirect fees associated with investing in the underlying funds, by using the amounts listed in the effective expenses paid during the period column.
Compare With Other Funds
Since all mutual funds are required to include the same hypothetical calculations about expenses in shareholder reports, you can use this information to compare the ongoing cost of investing in the Portfolio with other funds. To do so, compare the hypothetical example with the 5% hypothetical examples that appear in the shareholder reports of other funds. As you compare hypothetical examples of other funds, it is important to note that hypothetical examples are meant to highlight the ongoing costs of investing in a fund only and do not reflect any transaction costs, such as sales charges, or redemption or exchange fees. Therefore, the hypothetical calculations are useful in comparing ongoing costs only, and will not help you determine the relative total costs of owning different funds. If transaction costs were included in these calculations, your costs would be higher.
Annual Report 2013
6
Columbia LifeGoal® Growth Portfolio
Understanding Your Portfolio's Expenses (continued)
(Unaudited)
August 1, 2012 – January 31, 2013
| | Account Value at the
Beginning of the
Period ($) | | Account Value at
the End of the
Period ($) | | Expenses Paid During
the Period ($) | | Portfolio's
Annualized
Expense
Ratio (%) | | Effective Expenses
Paid During the
Period ($) | | Portfolio's
Effective
Annualized
Expense
Ratio (%) | |
| | Actual | | Hypothetical | | Actual | | Hypothetical | | Actual | | Hypothetical | | Actual | | Actual | | Hypothetical | | Actual | |
Class A | | | 1,000.00 | | | | 1,000.00 | | | | 1,106.00 | | | | 1,022.57 | | | | 2.70 | | | | 2.59 | | | | 0.51 | | | | 6.83 | | | | 6.56 | | | | 1.29 | | |
Class B | | | 1,000.00 | | | | 1,000.00 | | | | 1,101.80 | | | | 1,018.80 | | | | 6.66 | | | | 6.39 | | | | 1.26 | | | | 10.78 | | | | 10.35 | | | | 2.04 | | |
Class C | | | 1,000.00 | | | | 1,000.00 | | | | 1,101.70 | | | | 1,018.80 | | | | 6.66 | | | | 6.39 | | | | 1.26 | | | | 10.78 | | | | 10.35 | | | | 2.04 | | |
Class K
(formerly
Class R4) | | | 1,000.00 | | | | 1,000.00 | | | | 1,106.30 | | | | 1,023.23 | | | | 2.01 | | | | 1.93 | | | | 0.38 | | | | 6.14 | | | | 5.90 | | | | 1.16 | | |
Class R | | | 1,000.00 | | | | 1,000.00 | | | | 1,104.80 | | | | 1,021.32 | | | | 4.02 | | | | 3.86 | | | | 0.76 | | | | 8.15 | | | | 7.82 | | | | 1.54 | | |
Class R4 | | | 1,000.00 | | | | 1,000.00 | | | | 1,095.00 | * | | | 1,023.78 | | | | 0.64 | * | | | 1.37 | | | | 0.27 | * | | | 2.49 | * | | | 5.34 | | | | 1.05 | * | |
Cllass R5 | | | 1,000.00 | | | | 1,000.00 | | | | 1,095.40 | * | | | 1,024.38 | | | | 0.36 | * | | | 0.76 | | | | 0.15 | * | | | 2.21 | * | | | 4.73 | | | | 0.93 | * | |
Class Z | | | 1,000.00 | | | | 1,000.00 | | | | 1,107.90 | | | | 1,023.83 | | | | 1.38 | | | | 1.32 | | | | 0.26 | | | | 5.51 | | | | 5.29 | | | | 1.04 | | |
*For the period November 8, 2012 through January 31, 2013. Class R4 and Class R5 shares commenced operations on November 8, 2012.
Expenses paid during the period are equal to the Portfolio's annualized expense ratio for each class as indicated above, multiplied by the average account value over the period and then multiplied by the number of days in the Portfolio's most recent fiscal half year and divided by 366.
Effective expenses paid during the period and the Portfolio's effective annualized expense ratio include expenses borne directly to the class plus the Portfolio's pro rata portion of the ongoing expenses charged by the underlying funds using the expense ratio of each class of the underlying funds as of the underlying fund's most recent shareholder report.
Had Columbia Management Investment Advisers, LLC and/or certain of its affiliates not waived/reimbursed certain fees and expenses, account value at the end of the period would have been reduced.
Annual Report 2013
7
Columbia LifeGoal® Growth Portfolio
Portfolio of Investments
January 31, 2013
(Percentages represent value of investments compared to net assets)
Equity Funds 87.7%
| | | Shares | | Value ($) | |
Dividend Income 30.2% | |
Columbia Dividend Income Fund,
Class I Shares(a) | | | 5,859,219 | | | | 90,935,076 | | |
Columbia Dividend Opportunity Fund,
Class I Shares(a) | | | 8,249,653 | | | | 75,896,808 | | |
Columbia Global Dividend Opportunity
Fund, Class I Shares(a) | | | 3,133,728 | | | | 60,762,989 | | |
Total | | | | | 227,594,873 | | |
International 9.0% | |
Columbia Emerging Markets Fund,
Class I Shares(a) | | | 3,625,508 | | | | 37,959,074 | | |
Columbia Pacific/Asia Fund,
Class I Shares(a) | | | 3,487,712 | | | | 30,238,461 | | |
Total | | | | | 68,197,535 | | |
U.S. Large Cap 41.5% | |
Columbia Contrarian Core Fund,
Class I Shares(a) | | | 2,648,577 | | | | 45,476,073 | | |
Columbia Energy and Natural
Resources Fund, Class I Shares(a) | | | 2,095,257 | | | | 44,796,600 | | |
Columbia Large Cap Core Fund,
Class I Shares(a) | | | 2,524,729 | | | | 37,896,173 | | |
Columbia Large Cap Growth Fund,
Class I Shares(a) | | | 2,350,432 | | | | 68,068,513 | | |
Columbia Large Core Quantitative
Fund, Class I Shares(a) | | | 2,230,037 | | | | 15,052,749 | | |
Columbia Large Growth Quantitative
Fund, Class I Shares(a) | | | 4,193,229 | | | | 33,713,559 | | |
Columbia Select Large Cap Growth
Fund, Class I Shares(a)(b) | | | 4,576,975 | | | | 68,059,623 | | |
Total | | | | | 313,063,290 | | |
Equity Funds (continued)
| | | Shares | | Value ($) | |
U.S. Mid Cap 5.0% | |
Columbia Mid Cap Growth Fund,
Class I Shares(a)(b) | | | 1,346,803 | | | | 37,858,625 | | |
U.S. Small Cap 2.0% | |
Columbia Small Cap Growth Fund I,
Class I Shares(a)(b) | | | 517,140 | | | | 15,147,039 | | |
Total Equity Funds
(Cost: $580,629,432) | | | | | 661,861,362 | | |
Fixed-Income Funds 6.5% | |
Convertible 6.5% | |
Columbia Convertible Securities Fund,
Class I Shares(a) | | | 3,092,673 | | | | 48,647,743 | | |
Total Fixed-Income Funds
(Cost: $43,184,380) | | | | | 48,647,743 | | |
Alternative Investments 5.9% | |
Columbia Flexible Capital Income Fund,
Class I Shares(a) | | | 3,907,809 | | | | 44,470,867 | | |
Total Alternative Investments
(Cost: $41,951,026) | | | | | 44,470,867 | | |
Total Investments
(Cost: $665,764,838) | | | | | 754,979,972 | | |
Other Assets and Liabilities | | | | | (410,406 | ) | |
Net Assets | | | | | 754,569,566 | | |
Notes to Portfolio of Investments
(a) As defined in the Investment Company Act of 1940, an affiliated company is one in which the Portfolio owns 5% or more of its outstanding voting securities, or a company which is under common ownership or control with the Portfolio. Holdings and transactions in these affiliated companies during the year ended January 31, 2013, are as follows:
Issuer | | Beginning
Cost ($) | | Purchase
Cost ($) | | Proceeds
From Sales ($) | | Realized
Gain/Loss ($) | | Ending
Cost ($) | | Capital Gain
Distributions ($) | | Dividends
or Interest
Income ($) | | Value ($) | |
Columbia
Absolute
Return
Enhanced
Multi-Strategy
Fund, Class I
Shares | | | 7,229,901 | | | | — | | | | (7,325,718 | ) | | | 95,817 | | | | — | | | | — | | | | — | | | | — | | |
The accompanying Notes to Financial Statements are an integral part of this statement.
Annual Report 2013
8
Columbia LifeGoal® Growth Portfolio
Portfolio of Investments (continued)
January 31, 2013
Notes to Portfolio of Investments (continued)
Issuer | | Beginning
Cost ($) | | Purchase
Cost ($) | | Proceeds
From Sales ($) | | Realized
Gain/Loss ($) | | Ending
Cost ($) | | Capital Gain
Distributions ($) | | Dividends
or Interest
Income ($) | | Value ($) | |
Columbia
Contrarian
Core Fund,
Class I
Shares | | | 35,246,259 | | | | 643,438 | | | | (10,347,239 | ) | | | 5,138,953 | | | | 30,681,411 | | | | 50,467 | | | | 521,618 | | | | 45,476,073 | | |
Columbia
Convertible
Securities
Fund, Class I
Shares | | | 43,201,148 | | | | 3,730,670 | | | | (3,613,777 | ) | | | (133,662 | ) | | | 43,184,379 | | | | — | | | | 1,500,080 | | | | 48,647,743 | | |
Columbia
Dividend
Income Fund,
Class I Shares | | | 86,803,004 | | | | 2,758,467 | | | | (13,488,922 | ) | | | 974,669 | | | | 77,047,218 | | | | — | | | | 2,497,639 | | | | 90,935,076 | | |
Columbia
Dividend
Opportunity
Fund, Class I
Shares | | | 84,351,144 | | | | 3,885,256 | | | | (29,719,556 | ) | | | 5,625,554 | | | | 64,142,398 | | | | — | | | | 3,728,358 | | | | 75,896,808 | | |
Columbia
Emerging
Markets Fund,
Class I Shares | | | 47,990,510 | | | | 17,520,450 | | | | (28,447,842 | ) | | | (841,529 | ) | | | 36,221,589 | | | | 2,037,751 | | | | 223,206 | | | | 37,959,074 | | |
Columbia
Energy and
Natural
Resources
Fund, Class I
Shares | | | 23,139,402 | | | | 22,109,479 | | | | (1,323,744 | ) | | | 15,808 | | | | 43,940,945 | | | | — | | | | 338,871 | | | | 44,796,600 | | |
Columbia
Flexible
Capital Income
Fund, Class I
Shares | | | — | | | | 46,978,739 | | | | (5,094,682 | ) | | | 66,969 | | | | 41,951,026 | | | | 188,480 | | | | 1,558,991 | | | | 44,470,867 | | |
Columbia
Global
Dividend
Opportunity
Fund, Class I
Shares | | | — | | | | 63,454,010 | | | | (2,216,521 | ) | | | (81,225 | ) | | | 61,156,264 | | | | 3,859,640 | | | | 883,508 | | | | 60,762,989 | | |
Columbia
Large Cap
Core Fund,
Class I Shares | | | 31,183,416 | | | | 9,123,699 | | | | (6,674,483 | ) | | | 321,471 | | | | 33,954,103 | | | | 1,260,343 | | | | 464,511 | | | | 37,896,173 | | |
Columbia
Large Cap
Growth Fund,
Class I Shares | | | 64,279,014 | | | | 548,419 | | | | (14,356,994 | ) | | | (1,452,962 | ) | | | 49,017,477 | | | | — | | | | 433,156 | | | | 68,068,513 | | |
Columbia
Large Core
Quantitative
Fund, Class I
Shares | | | 20,027,990 | | | | 291,104 | | | | (11,396,021 | ) | | | 3,866,368 | | | | 12,789,441 | | | | — | | | | 265,518 | | | | 15,052,749 | | |
The accompanying Notes to Financial Statements are an integral part of this statement.
Annual Report 2013
9
Columbia LifeGoal® Growth Portfolio
Portfolio of Investments (continued)
January 31, 2013
Notes to Portfolio of Investments (continued)
Issuer | | Beginning
Cost ($) | | Purchase
Cost ($) | | Proceeds
From Sales ($) | | Realized
Gain/Loss ($) | | Ending
Cost ($) | | Capital Gain
Distributions ($) | | Dividends
or Interest
Income ($) | | Value ($) | |
Columbia
Large Growth
Quantitative
Fund, Class I
Shares | | | 28,663,917 | | | | 15,296,710 | | | | (12,625,545 | ) | | | 744,785 | | | | 32,079,867 | | | | 2,843,866 | | | | 620,937 | | | | 33,713,559 | | |
Columbia
Large Value
Quantitative
Fund, Class I
Shares | | | 15,898,827 | | | | — | | | | (15,942,988 | ) | | | 44,161 | | | | — | | | | — | | | | — | | | | — | | |
Columbia
Mid Cap
Growth Fund,
Class I Shares | | | 40,777,448 | | | | 1,130,689 | | | | (4,544,822 | ) | | | (154,534 | ) | | | 37,208,781 | | | | 1,037,066 | | | | — | | | | 37,858,625 | | |
Columbia
Mid Cap Value
Fund, Class I
Shares | | | 8,674,007 | | | | 38,008 | | | | (8,244,012 | ) | | | (468,003 | ) | | | — | | | | — | | | | 38,008 | | | | — | | |
Columbia
Mid Cap Value
Opportunity
Fund, Class I
Shares | | | 5,767,332 | | | | — | | | | (8,596,943 | ) | | | 2,829,611 | | | | — | | | | — | | | | — | | | | — | | |
Columbia
Pacific/Asia
Fund, Class I
Shares | | | 70,378,348 | | | | 921,104 | | | | (44,191,684 | ) | | | (831,442 | ) | | | 26,276,326 | | | | — | | | | 840,098 | | | | 30,238,461 | | |
Columbia
Select Large
Cap Growth
Fund, Class I
Shares | | | 82,680,397 | | | | 6,442,030 | | | | (33,278,369 | ) | | | 4,853,322 | | | | 60,697,380 | | | | — | | | | — | | | | 68,059,623 | | |
Columbia
Select
Large-Cap
Value Fund,
Class I Shares | | | 15,752,455 | | | | — | | | | (16,153,323 | ) | | | 400,868 | | | | — | | | | — | | | | — | | | | — | | |
Columbia
Short-Term
Cash Fund | | | — | | | | 1,345,514 | | | | (1,345,514 | ) | | | — | | | | — | | | | — | | | | 86 | | | | — | | |
Columbia
Small Cap
Growth Fund I,
Class I Shares | | | 16,642,187 | | | | 1,466,936 | | | | (2,246,765 | ) | | | (446,125 | ) | | | 15,416,233 | | | | 1,430,659 | | | | — | | | | 15,147,039 | | |
Total | | | 728,686,706 | | | | 197,684,722 | | | | (281,175,464 | ) | | | 20,568,874 | | | | 665,764,838 | | | | 12,708,272 | | | | 13,914,585 | | | | 754,979,972 | | |
(b) Non-income producing.
The accompanying Notes to Financial Statements are an integral part of this statement.
Annual Report 2013
10
Columbia LifeGoal® Growth Portfolio
Portfolio of Investments (continued)
January 31, 2013
Fair Value Measurements
Generally accepted accounting principles (GAAP) require disclosure regarding the inputs and valuation techniques used to measure fair value and any changes in valuation inputs or techniques. In addition, investments shall be disclosed by major category.
The Portfolio categorizes its fair value measurements according to a three-level hierarchy that maximizes the use of observable inputs and minimizes the use of unobservable inputs by prioritizing that the most observable input be used when available. Observable inputs are those that market participants would use in pricing an investment based on market data obtained from sources independent of the reporting entity. Unobservable inputs are those that reflect the Portfolio's assumptions about the information market participants would use in pricing an investment. An investment's level within the fair value hierarchy is based on the lowest level of any input that is deemed significant to the asset or liability's fair value measurement. The input levels are not necessarily an indication of the risk or liquidity associated with investments at that level. For example, certain U.S. government securities are generally high quality and liquid, however, they are reflected as Level 2 because the inputs used to determine fair value may not always be quoted prices in an active market.
Fair value inputs are summarized in the three broad levels listed below:
> Level 1 — Valuations based on quoted prices for investments in active markets that the Portfolio has the ability to access at the measurement date (including NAV for open-end mutual funds). Valuation adjustments are not applied to Level 1 investments.
> Level 2 — Valuations based on other significant observable inputs (including quoted prices for similar securities, interest rates, prepayment speeds, credit risks, etc.).
> Level 3 — Valuations based on significant unobservable inputs (including the Portfolio's own assumptions and judgment in determining the fair value of investments).
Inputs that are used in determining fair value of an investment may include price information, credit data, volatility statistics, and other factors. These inputs can be either observable or unobservable. The availability of observable inputs can vary between investments, and is affected by various factors such as the type of investment, and the volume and level of activity for that investment or similar investments in the marketplace. The inputs will be considered by the Investment Manager, along with any other relevant factors in the calculation of an investment's fair value. The Portfolio uses prices and inputs that are current as of the measurement date, which may include periods of market dislocations. During these periods, the availability of prices and inputs may be reduced for many investments. This condition could cause an investment to be reclassified between the various levels within the hierarchy.
Investments falling into the Level 3 category are primarily supported by quoted prices from brokers and dealers participating in the market for those investments. However, these may be classified as Level 3 investments due to lack of market transparency and corroboration to support these quoted prices. Additionally, valuation models may be used as the pricing source for any remaining investments classified as Level 3. These models rely on one or more significant unobservable inputs and/or significant assumptions by the Investment Manager. Inputs used in valuations may include, but are not limited to, financial statement analysis, capital account balances, discount rates and estimated cash flows, and comparable company data.
Under the direction of the Portfolio's Board of Trustees (the Board), the Investment Manager's Valuation Committee (the Committee) is responsible for carrying out the valuation procedures approved by the Board. The Committee consists of voting and non-voting members from various groups within the Investment Manager's organization, including operations and accounting, trading and investments, compliance, risk management and legal.
The Committee meets at least monthly to review and approve valuation matters, which may include a description of specific valuation determinations, data regarding pricing information received from approved pricing vendors and brokers and the results of Board-approved valuation control policies and procedures (the Policies). The Policies address, among other things, instances when market quotations are readily available, including recommendations of third party pricing vendors and a determination of appropriate pricing methodologies; events that require specific valuation determinations and assessment of fair value techniques; securities with a potential for stale pricing, including those that are illiquid, restricted, or in default; and the effectiveness of third-party pricing vendors, including periodic reviews of vendors. The Committee meets more frequently, as needed, to discuss additional valuation matters, which may include the need to review back-testing results, review time-sensitive information or approve related valuation actions. The Committee reports to the Board, with members of the Committee meeting with the Board at each of its regularly scheduled meetings to discuss valuation matters and actions during the period, similar to those described earlier.
For investments categorized as Level 3, the Committee monitors information similar to that described above, which may include: (i) data specific to the issuer or comparable issuers, (ii) general market or specific sector news and (iii) quoted prices and specific or similar security transactions. The Committee considers this data and any changes from prior periods in order to assess the reasonableness of observable and unobservable inputs, any assumptions or internal models used to value those securities and changes in fair value. This data is also used to corroborate, when available, information received from approved pricing vendors and brokers. Various factors impact the frequency of monitoring this information (which may occur as often as daily). However, the Committee may determine that changes to inputs, assumptions and models are not required as a result of the monitoring procedures performed.
The accompanying Notes to Financial Statements are an integral part of this statement.
Annual Report 2013
11
Columbia LifeGoal® Growth Portfolio
Portfolio of Investments (continued)
January 31, 2013
Fair Value Measurements (continued)
The following table is a summary of the inputs used to value the Portfolio's investments at January 31, 2013:
Description | | Level 1
Quoted Prices in Active
Markets for Identical
Assets ($) | | Level 2
Other Significant
Observable Inputs ($) | | Level 3
Significant
Unobservable Inputs ($) | | Total ($) | |
Mutual Funds | |
Equity Funds | | | 661,861,362 | | | | — | | | | — | | | | 661,861,362 | | |
Fixed-Income Funds | | | 48,647,743 | | | | — | | | | — | | | | 48,647,743 | | |
Alternative Investments | | | 44,470,867 | | | | — | | | | — | | | | 44,470,867 | | |
Total Mutual Funds | | | 754,979,972 | | | | — | | | | — | | | | 754,979,972 | | |
Total | | | 754,979,972 | | | | — | | | | — | | | | 754,979,972 | | |
See the Portfolio of Investments for all investment classifications not indicated in the table.
There were no transfers of financial assets between Levels 1 and 2 during the period.
The accompanying Notes to Financial Statements are an integral part of this statement.
Annual Report 2013
12
Columbia LifeGoal® Growth Portfolio
Statement of Assets and Liabilities
January 31, 2013
Assets | |
Investments, at value | |
Affiliated issuers (identified cost $665,764,838) | | $ | 754,979,972 | | |
Receivable for: | |
Investments sold | | | 129,623 | | |
Capital shares sold | | | 334,319 | | |
Expense reimbursement due from Investment Manager | | | 1,913 | | |
Prepaid expenses | | | 1,398 | | |
Total assets | | | 755,447,225 | | |
Liabilities | |
Payable for: | |
Investments purchased | | | 1,700 | | |
Capital shares purchased | | | 639,925 | | |
Distribution and/or service fees | | | 7,920 | | |
Transfer agent fees | | | 108,987 | | |
Administration fees | | | 414 | | |
Plan administration fees | | | 2 | | |
Compensation of board members | | | 4,616 | | |
Other expenses | | | 114,095 | | |
Total liabilities | | | 877,659 | | |
Net assets applicable to outstanding capital stock | | $ | 754,569,566 | | |
Represented by | |
Paid-in capital | | $ | 759,092,593 | | |
Undistributed net investment income | | | 73,946 | | |
Accumulated net realized loss | | | (93,812,107 | ) | |
Unrealized appreciation (depreciation) on: | |
Investments — affiliated issuers | | | 89,215,134 | | |
Total — representing net assets applicable to outstanding capital stock | | $ | 754,569,566 | | |
The accompanying Notes to Financial Statements are an integral part of this statement.
Annual Report 2013
13
Columbia LifeGoal® Growth Portfolio
Statement of Assets and Liabilities (continued)
January 31, 2013
Class A | |
Net assets | | $ | 552,395,481 | | |
Shares outstanding | | | 42,616,031 | | |
Net asset value per share | | $ | 12.96 | | |
Maximum offering price per share(a) | | $ | 13.75 | | |
Class B | |
Net assets | | $ | 59,438,039 | | |
Shares outstanding | | | 5,039,368 | | |
Net asset value per share | | $ | 11.79 | | |
Class C | |
Net assets | | $ | 89,630,065 | | |
Shares outstanding | | | 7,664,439 | | |
Net asset value per share | | $ | 11.69 | | |
Class K(b) | |
Net assets | | $ | 135,499 | | |
Shares outstanding | | | 10,273 | | |
Net asset value per share | | $ | 13.19 | | |
Class R | |
Net assets | | $ | 3,312,417 | | |
Shares outstanding | | | 258,117 | | |
Net asset value per share | | $ | 12.83 | | |
Class R4 | |
Net assets | | $ | 2,716 | | |
Shares outstanding | | | 203 | | |
Net asset value per share | | $ | 13.35 | (c) | |
Class R5 | |
Net assets | | $ | 2,715 | | |
Shares outstanding | | | 203 | | |
Net asset value per share | | $ | 13.35 | (c) | |
Class Z | |
Net assets | | $ | 49,652,634 | | |
Shares outstanding | | | 3,762,457 | | |
Net asset value per share | | $ | 13.20 | | |
(a) The maximum offering price per share is calculated by dividing the net asset value by 1.0 minus the maximum sales charge of 5.75%.
(b) Effective October 25, 2012, Class R4 shares were renamed Class K shares.
(c) Net asset value per share rounds to this amount due to fractional shares outstanding.
The accompanying Notes to Financial Statements are an integral part of this statement.
Annual Report 2013
14
Columbia LifeGoal® Growth Portfolio
Statement of Operations
Year Ended January 31, 2013
| | | Year Ended
January 31, 2013 | |
Net investment income | |
Income: | |
Dividends — affiliated issuers | | $ | 13,914,585 | | |
Total income | | | 13,914,585 | | |
Expenses: | |
Investment management fees | | | 976 | | |
Distribution and/or service fees | |
Class A | | | 1,346,261 | | |
Class B | | | 696,385 | | |
Class C | | | 887,876 | | |
Class R | | | 16,889 | | |
Transfer agent fees | |
Class A | | | 1,082,982 | | |
Class B | | | 139,161 | | |
Class C | | | 178,471 | | |
Class K(a) | | | 120 | | |
Class R | | | 6,812 | | |
Class R4(b) | | | 2 | | |
Class Z | | | 100,360 | | |
Administration fees | | | 150,091 | | |
Plan administration fees | |
Class K(a) | | | 629 | | |
Compensation of board members | | | 9,219 | | |
Custodian fees | | | 12,602 | | |
Printing and postage fees | | | 203,291 | | |
Registration fees | | | 178,937 | | |
Professional fees | | | 27,852 | | |
Other | | | 11,954 | | |
Total expenses | | | 5,050,870 | | |
Fees waived or expenses reimbursed by Investment Manager and its affiliates | | | (376,520 | ) | |
Expense reductions | | | (1,780 | ) | |
Total net expenses | | | 4,672,570 | | |
Net investment income | | | 9,242,015 | | |
Realized and unrealized gain (loss) — net | |
Net realized gain (loss) on: | |
Investments — affiliated issuers | | | 20,568,874 | | |
Capital gain distributions from underlying affiliated funds | | | 12,708,272 | | |
Net realized gain | | | 33,277,146 | | |
Net change in unrealized appreciation (depreciation) on: | |
Investments — affiliated issuers | | | 53,388,924 | | |
Net change in unrealized appreciation (depreciation) | | | 53,388,924 | | |
Net realized and unrealized gain | | | 86,666,070 | | |
Net increase in net assets resulting from operations | | $ | 95,908,085 | | |
(a) Effective October 25, 2012, Class R4 shares were renamed Class K shares.
(b) For the period from November 8, 2012 (commencement of operations) to January 31, 2013.
The accompanying Notes to Financial Statements are an integral part of this statement.
Annual Report 2013
15
Columbia LifeGoal® Growth Portfolio
Statement of Changes in Net Assets
| | | Year Ended
January 31, 2013(a) | | Year Ended
January 31, 2012(b) | | Year Ended
March 31, 2011(c) | |
Operations | |
Net investment income | | $ | 9,242,015 | | | $ | 4,169,952 | | | $ | 1,712,789 | | |
Net realized gain | | | 33,277,146 | | | | 50,303,717 | | | | 3,920,664 | | |
Net change in unrealized appreciation (depreciation) | | | 53,388,924 | | | | (94,655,707 | ) | | | 59,201,605 | | |
Net increase (decrease) in net assets resulting from operations | | | 95,908,085 | | | | (40,182,038 | ) | | | 64,835,058 | | |
Distributions to shareholders | |
Net investment income | |
Class A | | | (9,524,054 | ) | | | (2,173,604 | ) | | | (1,169,632 | ) | |
Class B | | | (784,343 | ) | | | (177,537 | ) | | | (135,848 | ) | |
Class C | | | (1,029,061 | ) | | | (176,339 | ) | | | (124,109 | ) | |
Class K(d) | | | (4,495 | ) | | | (1,115 | ) | | | (8 | ) | |
Class R | | | (52,818 | ) | | | (8,385 | ) | | | (6,818 | ) | |
Class R4 | | | (21 | ) | | | — | | | | — | | |
Class R5 | | | (22 | ) | | | — | | | | — | | |
Class Z | | | (997,211 | ) | | | (247,376 | ) | | | (398,565 | ) | |
Total distributions to shareholders | | | (12,392,025 | ) | | | (2,784,356 | ) | | | (1,834,980 | ) | |
Increase (decrease) in net assets from capital stock activity | | | (92,576,813 | ) | | | 403,972,483 | | | | (52,207,149 | ) | |
Total increase (decrease) in net assets | | | (9,060,753 | ) | | | 361,006,089 | | | | 10,792,929 | | |
Net assets at beginning of year | | | 763,630,319 | | | | 402,624,230 | | | | 391,831,301 | | |
Net assets at end of year | | $ | 754,569,566 | | | $ | 763,630,319 | | | $ | 402,624,230 | | |
Undistributed net investment income | | $ | 73,946 | | | $ | 3,062,675 | | | $ | 180,416 | | |
(a) Class R4 and Class R5 shares are for the period from November 8, 2012 (commencement of operations) to January 31, 2013.
(b) For the period from April 1, 2011 to January 31, 2012. During the period, the Portfolio's fiscal year end was changed from March 31 to January 31.
(c) Class K shares are for the period from March 7, 2011 (commencement of operations) to March 31, 2011.
(d) Effective October 25, 2012, Class R4 shares were renamed Class K shares.
The accompanying Notes to Financial Statements are an integral part of this statement.
Annual Report 2013
16
Columbia LifeGoal® Growth Portfolio
Statement of Changes in Net Assets (continued)
| | | Year Ended January 31,
2013(a) | | Year Ended January 31,
2012(b) | | Year Ended March 31,
2011(c) | |
| | | Shares | | Dollars ($) | | Shares | | Dollars ($) | | Shares | | Dollars ($) | |
Capital stock activity | |
Class A shares | |
Subscriptions(d) | | | 4,863,471 | | | | 58,763,329 | | | | 4,679,165 | | | | 53,694,808 | | | | 2,942,148 | | | | 32,004,906 | | |
Fund merger | | | — | | | | — | | | | 33,362,333 | | | | 402,184,297 | | | | — | | | | — | | |
Distributions reinvested | | | 610,165 | | | | 7,464,003 | | | | 161,873 | | | | 1,676,786 | | | | 60,451 | | | | 628,610 | | |
Redemptions | | | (9,382,818 | ) | | | (113,680,407 | ) | | | (8,122,929 | ) | | | (91,558,649 | ) | | | (3,866,896 | ) | | | (41,412,779 | ) | |
Net increase (decrease) | | | (3,909,182 | ) | | | (47,453,075 | ) | | | 30,080,442 | | | | 365,997,242 | | | | (864,297 | ) | | | (8,779,263 | ) | |
Class B shares | |
Subscriptions | | | 76,918 | | | | 850,701 | | | | 83,022 | | | | 864,754 | | | | 68,216 | | | | 691,508 | | |
Fund merger | | | — | | | | — | | | | 4,532,209 | | | | 49,947,366 | | | | — | | | | — | | |
Distributions reinvested | | | 44,949 | | | | 503,172 | | | | 10,592 | | | | 99,350 | | | | 5,672 | | | | 55,098 | | |
Redemptions(d) | | | (2,934,794 | ) | | | (32,181,984 | ) | | | (3,413,589 | ) | | | (36,069,046 | ) | | | (3,111,479 | ) | | | (30,764,657 | ) | |
Net increase (decrease) | | | (2,812,927 | ) | | | (30,828,111 | ) | | | 1,212,234 | | | | 14,842,424 | | | | (3,037,591 | ) | | | (30,018,051 | ) | |
Class C shares | |
Subscriptions | | | 847,762 | | | | 9,269,004 | | | | 1,002,164 | | | | 10,205,133 | | | | 716,653 | | | | 7,079,074 | | |
Fund merger | | | — | | | | — | | | | 2,788,845 | | | | 30,466,023 | | | | — | | | | — | | |
Distributions reinvested | | | 62,834 | | | | 697,710 | | | | 11,800 | | | | 109,741 | | | | 6,456 | | | | 65,447 | | |
Redemptions | | | (1,853,238 | ) | | | (20,259,200 | ) | | | (1,534,752 | ) | | | (15,728,714 | ) | | | (1,636,359 | ) | | | (15,900,649 | ) | |
Net increase (decrease) | | | (942,642 | ) | | | (10,292,486 | ) | | | 2,268,057 | | | | 25,052,183 | | | | (913,250 | ) | | | (8,756,128 | ) | |
Class K shares(e) | |
Subscriptions | | | — | | | | — | | | | 265 | | | | 3,333 | | | | 204 | | | | 2,500 | | |
Fund merger | | | — | | | | — | | | | 23,841 | | | | 292,223 | | | | — | | | | — | | |
Distributions reinvested | | | 342 | | | | 4,256 | | | | 101 | | | | 1,066 | | | | — | | | | — | | |
Redemptions | | | (13,763 | ) | | | (174,820 | ) | | | (717 | ) | | | (8,180 | ) | | | — | | | | — | | |
Net increase (decrease) | | | (13,421 | ) | | | (170,564 | ) | | | 23,490 | | | | 288,442 | | | | 204 | | | | 2,500 | | |
Class R shares | |
Subscriptions | | | 85,252 | | | | 1,023,468 | | | | 209,990 | | | | 2,494,421 | | | | 59,234 | | | | 614,043 | | |
Distributions reinvested | | | 3,860 | | | | 46,854 | | | | 732 | | | | 7,452 | | | | 634 | | | | 6,814 | | |
Redemptions | | | (103,124 | ) | | | (1,259,478 | ) | | | (59,051 | ) | | | (683,349 | ) | | | (94,211 | ) | | | (1,066,410 | ) | |
Net increase (decrease) | | | (14,012 | ) | | | (189,156 | ) | | | 151,671 | | | | 1,818,524 | | | | (34,343 | ) | | | (445,553 | ) | |
Class R4 shares | |
Subscriptions | | | 203 | | | | 2,500 | | | | — | | | | — | | | | — | | | | — | | |
Net increase | | | 203 | | | | 2,500 | | | | — | | | | — | | | | — | | | | — | | |
Class R5 shares | |
Subscriptions | | | 203 | | | | 2,500 | | | | — | | | | — | | | | — | | | | — | | |
Net increase | | | 203 | | | | 2,500 | | | | — | | | | — | | | | — | | | | — | | |
The accompanying Notes to Financial Statements are an integral part of this statement.
Annual Report 2013
17
Columbia LifeGoal® Growth Portfolio
Statement of Changes in Net Assets (continued)
| | | Year Ended January 31,
2013(a) | | Year Ended January 31,
2012(b) | | Year Ended March 31,
2011(c) | |
| | | Shares | | Dollars ($) | | Shares | | Dollars ($) | | Shares | | Dollars ($) | |
Capital stock activity (continued) | |
Class Z shares | |
Subscriptions | | | 1,215,190 | | | | 15,030,587 | | | | 692,051 | | | | 8,123,766 | | | | 1,269,960 | | | | 14,082,120 | | |
Distributions reinvested | | | 25,301 | | | | 314,972 | | | | 5,507 | | | | 58,785 | | | | 8,249 | | | | 90,214 | | |
Redemptions | | | (1,526,783 | ) | | | (18,993,980 | ) | | | (1,055,990 | ) | | | (12,208,883 | ) | | | (1,792,037 | ) | | | (18,382,988 | ) | |
Net decrease | | | (286,292 | ) | | | (3,648,421 | ) | | | (358,432 | ) | | | (4,026,332 | ) | | | (513,828 | ) | | | (4,210,654 | ) | |
Total net increase (decrease) | | | (7,978,070 | ) | | | (92,576,813 | ) | | | 33,377,462 | | | | 403,972,483 | | | | (5,363,105 | ) | | | (52,207,149 | ) | |
(a) Class R4 and Class R5 shares are for the period from November 8, 2012 (commencement of operations) to January 31, 2013.
(b) For the period from April 1, 2011 to January 31, 2012. During the period, the Portfolio's fiscal year end was changed from March 31 to January 31.
(c) Class K shares are for the period from March 7, 2011 (commencement of operations) to March 31, 2011.
(d) Includes conversions of Class B shares to Class A shares, if any.
(e) Effective October 25, 2012, Class R4 shares were renamed Class K shares.
The accompanying Notes to Financial Statements are an integral part of this statement.
Annual Report 2013
18
Columbia LifeGoal® Growth Portfolio
The following tables are intended to help you understand the Portfolio's financial performance. Certain information reflects financial results for a single share of a class held for the periods shown. Per share net investment income (loss) amounts are calculated based on average shares outstanding during the period. Total return assumes reinvestment of all dividends and distributions, if any. Total return does not reflect payment of sales charges, if any, and is not annualized for periods of less than one year.
| | | Year Ended January 31, | | Year Ended March 31, | |
Class A | | 2013 | | 2012(a) | | 2011 | | 2010 | | 2009 | | 2008 | |
Per share data | |
Net asset value, beginning of period | | $ | 11.59 | | | $ | 12.25 | | | $ | 10.33 | | | $ | 6.68 | | | $ | 13.24 | | | $ | 14.69 | | |
Income from investment operations: | |
Net investment income | | | 0.17 | | | | 0.09 | | | | 0.08 | | | | 0.05 | | | | 0.06 | | | | 0.05 | | |
Net realized and unrealized gain (loss) | | | 1.42 | | | | (0.71 | ) | | | 1.91 | | | | 3.62 | | | | (4.12 | ) | | | (0.59 | ) | |
Total from investment operations | | | 1.59 | | | | (0.62 | ) | | | 1.99 | | | | 3.67 | | | | (4.06 | ) | | | (0.54 | ) | |
Less distributions to shareholders: | |
Net investment income | | | (0.22 | ) | | | (0.04 | ) | | | (0.07 | ) | | | (0.02 | ) | | | (0.03 | ) | | | (0.05 | ) | |
Net realized gains | | | — | | | | — | | | | — | | | | — | | | | (2.46 | ) | | | (0.86 | ) | |
Tax return of capital | | | — | | | | — | | | | — | | | | — | | | | (0.01 | ) | | | — | | |
Total distributions to shareholders | | | (0.22 | ) | | | (0.04 | ) | | | (0.07 | ) | | | (0.02 | ) | | | (2.50 | ) | | | (0.91 | ) | |
Proceeds from regulatory settlements | | | — | | | | — | | | | — | | | | 0.00 | (b) | | | — | | | | — | | |
Net asset value, end of period | | $ | 12.96 | | | $ | 11.59 | | | $ | 12.25 | | | $ | 10.33 | | | $ | 6.68 | | | $ | 13.24 | | |
Total return | | | 13.81 | % | | | (4.98 | %) | | | 19.35 | % | | | 55.04 | % | | | (37.62 | %) | | | (4.31 | %) | |
Ratios to average net assets(c) | |
Total gross expenses | | | 0.53 | % | | | 0.52 | %(d) | | | 0.51 | % | | | 0.50 | % | | | 0.50 | % | | | 0.50 | % | |
Total net expenses(e) | | | 0.48 | %(f) | | | 0.45 | %(d)(f) | | | 0.51 | % | | | 0.50 | % | | | 0.50 | %(f) | | | 0.50 | %(f) | |
Net investment income | | | 1.38 | % | | | 0.93 | %(d) | | | 0.72 | % | | | 0.54 | % | | | 0.68 | % | | | 0.31 | % | |
Supplemental data | |
Net assets, end of period (in thousands) | | $ | 552,395 | | | $ | 539,370 | | | $ | 201,437 | | | $ | 178,769 | | | $ | 116,169 | | | $ | 210,861 | | |
Portfolio turnover | | | 26 | % | | | 86 | % | | | 36 | % | | | 19 | % | | | 45 | % | | | 21 | % | |
Notes to Financial Highlights
(a) For the period from April 1, 2011 to January 31, 2012. During the period, the Portfolio's fiscal year end was changed from March 31 to January 31.
(b) Rounds to zero.
(c) In addition to the fees and expenses which the Portfolio bears directly, the Portfolio indirectly bears a pro rata share of the fees and expenses of the acquired funds in which it invests. Such indirect expenses are not included in the reported expense ratios.
(d) Annualized.
(e) Total net expenses include the impact of certain waivers/reimbursements made by the Investment Manager and certain of its affiliates, if applicable.
(f) The benefits derived from expense reductions had an impact of less than 0.01%.
The accompanying Notes to Financial Statements are an integral part of this statement.
Annual Report 2013
19
Columbia LifeGoal® Growth Portfolio
Financial Highlights (continued)
| | | Year Ended January 31, | | Year Ended March 31, | |
Class B | | 2013 | | 2012(a) | | 2011 | | 2010 | | 2009 | | 2008 | |
Per share data | |
Net asset value, beginning of period | | $ | 10.56 | | | $ | 11.21 | | | $ | 9.48 | | | $ | 6.17 | | | $ | 12.46 | | | $ | 13.93 | | |
Income from investment operations: | |
Net investment income (loss) | | | 0.06 | | | | 0.00 | (b) | | | 0.00 | (b) | | | (0.02 | ) | | | (0.01 | ) | | | (0.06 | ) | |
Net realized and unrealized gain (loss) | | | 1.30 | | | | (0.63 | ) | | | 1.75 | | | | 3.34 | | | | (3.80 | ) | | | (0.55 | ) | |
Total from investment operations | | | 1.36 | | | | (0.63 | ) | | | 1.75 | | | | 3.32 | | | | (3.81 | ) | | | (0.61 | ) | |
Less distributions to shareholders: | |
Net investment income | | | (0.13 | ) | | | (0.02 | ) | | | (0.02 | ) | | | (0.01 | ) | | | (0.01 | ) | | | — | | |
Net realized gains | | | — | | | | — | | | | — | | | | — | | | | (2.46 | ) | | | (0.86 | ) | |
Tax return of capital | | | — | | | | — | | | | — | | | | — | | | | (0.01 | ) | | | — | | |
Total distributions to shareholders | | | (0.13 | ) | | | (0.02 | ) | | | (0.02 | ) | | | (0.01 | ) | | | (2.48 | ) | | | (0.86 | ) | |
Proceeds from regulatory settlements | | | — | | | | — | | | | — | | | | 0.00 | (b) | | | — | | | | — | | |
Net asset value, end of period | | $ | 11.79 | | | $ | 10.56 | | | $ | 11.21 | | | $ | 9.48 | | | $ | 6.17 | | | $ | 12.46 | | |
Total return | | | 12.93 | % | | | (5.60 | %) | | | 18.46 | % | | | 53.78 | % | | | (37.99 | %) | | | (5.08 | %) | |
Ratios to average net assets(c) | |
Total gross expenses | | | 1.28 | % | | | 1.27 | %(d) | | | 1.26 | % | | | 1.25 | % | | | 1.25 | % | | | 1.25 | % | |
Total net expenses(e) | | | 1.23 | %(f) | | | 1.20 | %(d)(f) | | | 1.26 | % | | | 1.25 | % | | | 1.25 | %(f) | | | 1.25 | %(f) | |
Net investment income (loss) | | | 0.55 | % | | | 0.06 | %(d) | | | (0.05 | %) | | | (0.21 | %) | | | (0.09 | %) | | | (0.46 | %) | |
Supplemental data | |
Net assets, end of period (in thousands) | | $ | 59,438 | | | $ | 82,941 | | | $ | 74,403 | | | $ | 91,699 | | | $ | 74,197 | | | $ | 150,705 | | |
Portfolio turnover | | | 26 | % | | | 86 | % | | | 36 | % | | | 19 | % | | | 45 | % | | | 21 | % | |
Notes to Financial Highlights
(a) For the period from April 1, 2011 to January 31, 2012. During the period, the Portfolio's fiscal year end was changed from March 31 to January 31.
(b) Rounds to zero.
(c) In addition to the fees and expenses which the Portfolio bears directly, the Portfolio indirectly bears a pro rata share of the fees and expenses of the acquired funds in which it invests. Such indirect expenses are not included in the reported expense ratios.
(d) Annualized.
(e) Total net expenses include the impact of certain waivers/reimbursements made by the Investment Manager and certain of its affiliates, if applicable.
(f) The benefits derived from expense reductions had an impact of less than 0.01%.
The accompanying Notes to Financial Statements are an integral part of this statement.
Annual Report 2013
20
Columbia LifeGoal® Growth Portfolio
Financial Highlights (continued)
| | | Year Ended January 31, | | Year Ended March 31, | |
Class C | | 2013 | | 2012(a) | | 2011 | | 2010 | | 2009 | | 2008 | |
Per share data | |
Net asset value, beginning of period | | $ | 10.47 | | | $ | 11.11 | | | $ | 9.40 | | | $ | 6.12 | | | $ | 12.38 | | | $ | 13.85 | | |
Income from investment operations: | |
Net investment income (loss) | | | 0.07 | | | | 0.00 | (b) | | | (0.00 | )(b) | | | (0.02 | ) | | | (0.01 | ) | | | (0.06 | ) | |
Net realized and unrealized gain (loss) | | | 1.28 | | | | (0.62 | ) | | | 1.73 | | | | 3.31 | | | | (3.77 | ) | | | (0.55 | ) | |
Total from investment operations | | | 1.35 | | | | (0.62 | ) | | | 1.73 | | | | 3.29 | | | | (3.78 | ) | | | (0.61 | ) | |
Less distributions to shareholders: | |
Net investment income | | | (0.13 | ) | | | (0.02 | ) | | | (0.02 | ) | | | (0.01 | ) | | | (0.01 | ) | | | — | | |
Net realized gains | | | — | | | | — | | | | — | | | | — | | | | (2.46 | ) | | | (0.86 | ) | |
Tax return of capital | | | — | | | | — | | | | — | | | | — | | | | (0.01 | ) | | | — | | |
Total distributions to shareholders | | | (0.13 | ) | | | (0.02 | ) | | | (0.02 | ) | | | (0.01 | ) | | | (2.48 | ) | | | (0.86 | ) | |
Proceeds from regulatory settlements | | | — | | | | — | | | | — | | | | 0.00 | (b) | | | — | | | | — | | |
Net asset value, end of period | | $ | 11.69 | | | $ | 10.47 | | | $ | 11.11 | | | $ | 9.40 | | | $ | 6.12 | | | $ | 12.38 | | |
Total return | | | 12.95 | % | | | (5.56 | %) | | | 18.41 | % | | | 53.73 | % | | | (37.99 | %) | | | (5.11 | %) | |
Ratios to average net assets(c) | |
Total gross expenses | | | 1.28 | % | | | 1.27 | %(d) | | | 1.26 | % | | | 1.25 | % | | | 1.25 | % | | | 1.25 | % | |
Total net expenses(e) | | | 1.23 | %(f) | | | 1.20 | %(d)(f) | | | 1.26 | % | | | 1.25 | % | | | 1.25 | %(f) | | | 1.25 | %(f) | |
Net investment income (loss) | | | 0.62 | % | | | 0.06 | %(d) | | | (0.04 | %) | | | (0.21 | %) | | | (0.09 | %) | | | (0.41 | %) | |
Supplemental data | |
Net assets, end of period (in thousands) | | $ | 89,630 | | | $ | 90,148 | | | $ | 70,437 | | | $ | 68,150 | | | $ | 50,343 | | | $ | 98,889 | | |
Portfolio turnover | | | 26 | % | | | 86 | % | | | 36 | % | | | 19 | % | | | 45 | % | | | 21 | % | |
Notes to Financial Highlights
(a) For the period from April 1, 2011 to January 31, 2012. During the period, the Portfolio's fiscal year end was changed from March 31 to January 31.
(b) Rounds to zero.
(c) In addition to the fees and expenses which the Portfolio bears directly, the Portfolio indirectly bears a pro rata share of the fees and expenses of the acquired funds in which it invests. Such indirect expenses are not included in the reported expense ratios.
(d) Annualized.
(e) Total net expenses include the impact of certain waivers/reimbursements made by the Investment Manager and certain of its affiliates, if applicable.
(f) The benefits derived from expense reductions had an impact of less than 0.01%.
The accompanying Notes to Financial Statements are an integral part of this statement.
Annual Report 2013
21
Columbia LifeGoal® Growth Portfolio
Financial Highlights (continued)
| | | Year Ended January 31, | | Year Ended
March 31, | |
Class K(a) | | 2013 | | 2012(b) | | 2011(c) | |
Per share data | |
Net asset value, beginning of period | | $ | 11.79 | | | $ | 12.45 | | | $ | 12.27 | | |
Income from investment operations: | |
Net investment income | | | 0.17 | | | | 0.11 | | | | 0.01 | | |
Net realized and unrealized gain (loss) | | | 1.46 | | | | (0.72 | ) | | | 0.21 | | |
Total from investment operations | | | 1.63 | | | | (0.61 | ) | | | 0.22 | | |
Less distributions to shareholders: | |
Net investment income | | | (0.23 | ) | | | (0.05 | ) | | | (0.04 | ) | |
Total distributions to shareholders | | | (0.23 | ) | | | (0.05 | ) | | | (0.04 | ) | |
Net asset value, end of period | | $ | 13.19 | | | $ | 11.79 | | | $ | 12.45 | | |
Total return | | | 13.93 | % | | | (4.88 | %) | | | 1.77 | % | |
Ratios to average net assets(d) | |
Total gross expenses | | | 0.38 | % | | | 0.37 | %(e) | | | 0.51 | %(e) | |
Total net expenses(f) | | | 0.38 | % | | | 0.37 | %(e) | | | 0.51 | %(e) | |
Net investment income | | | 1.42 | % | | | 1.15 | %(e) | | | 0.68 | %(e) | |
Supplemental data | |
Net assets, end of period (in thousands) | | $ | 135 | | | $ | 279 | | | $ | 3 | | |
Portfolio turnover | | | 26 | % | | | 86 | % | | | 36 | % | |
Notes to Financial Highlights
(a) Effective October 25, 2012, Class R4 shares were renamed Class K shares.
(b) For the period from April 1, 2011 to January 31, 2012. During the period, the Portfolio's fiscal year end was changed from March 31 to January 31.
(c) For the period from March 7, 2011 (commencement of operations) to March 31, 2011.
(d) In addition to the fees and expenses which the Portfolio bears directly, the Portfolio indirectly bears a pro rata share of the fees and expenses of the acquired funds in which it invests. Such indirect expenses are not included in the reported expense ratios.
(e) Annualized.
(f) Total net expenses include the impact of certain waivers/reimbursements made by the Investment Manager and certain of its affiliates, if applicable.
The accompanying Notes to Financial Statements are an integral part of this statement.
Annual Report 2013
22
Columbia LifeGoal® Growth Portfolio
Financial Highlights (continued)
| | | Year Ended January 31, | | Year Ended March 31, | |
Class R | | 2013 | | 2012(a) | | 2011 | | 2010 | | 2009 | | 2008 | |
Per share data | |
Net asset value, beginning of period | | $ | 11.48 | | | $ | 12.14 | | | $ | 10.25 | | | $ | 6.64 | | | $ | 13.19 | | | $ | 14.67 | | |
Income from investment operations: | |
Net investment income | | | 0.14 | | | | 0.05 | | | | 0.06 | | | | 0.03 | | | | 0.04 | | | | 0.02 | | |
Net realized and unrealized gain (loss) | | | 1.40 | | | | (0.68 | ) | | | 1.88 | | | | 3.60 | | | | (4.10 | ) | | | (0.60 | ) | |
Total from investment operations | | | 1.54 | | | | (0.63 | ) | | | 1.94 | | | | 3.63 | | | | (4.06 | ) | | | (0.58 | ) | |
Less distributions to shareholders: | |
Net investment income | | | (0.19 | ) | | | (0.03 | ) | | | (0.05 | ) | | | (0.02 | ) | | | (0.02 | ) | | | (0.04 | ) | |
Net realized gains | | | — | | | | — | | | | — | | | | — | | | | (2.46 | ) | | | (0.86 | ) | |
Tax return of capital | | | — | | | | — | | | | — | | | | — | | | | (0.01 | ) | | | — | | |
Total distributions to shareholders | | | (0.19 | ) | | | (0.03 | ) | | | (0.05 | ) | | | (0.02 | ) | | | (2.49 | ) | | | (0.90 | ) | |
Proceeds from regulatory settlements | | | — | | | | — | | | | — | | | | 0.00 | (b) | | | — | | | | — | | |
Net asset value, end of period | | $ | 12.83 | | | $ | 11.48 | | | $ | 12.14 | | | $ | 10.25 | | | $ | 6.64 | | | $ | 13.19 | | |
Total return | | | 13.49 | % | | | (5.12 | %) | | | 18.99 | % | | | 54.68 | % | | | (37.76 | %) | | | (4.65 | %) | |
Ratios to average net assets(c) | |
Total gross expenses | | | 0.78 | % | | | 0.77 | %(d) | | | 0.76 | % | | | 0.75 | % | | | 0.75 | % | | | 0.75 | % | |
Total net expenses(e) | | | 0.73 | %(f) | | | 0.70 | %(d)(f) | | | 0.76 | % | | | 0.75 | % | | | 0.75 | %(f) | | | 0.75 | %(f) | |
Net investment income | | | 1.18 | % | | | 0.54 | %(d) | | | 0.54 | % | | | 0.29 | % | | | 0.45 | % | | | 0.12 | % | |
Supplemental data | |
Net assets, end of period (in thousands) | | $ | 3,312 | | | $ | 3,124 | | | $ | 1,463 | | | $ | 1,586 | | | $ | 831 | | | $ | 1,206 | | |
Portfolio turnover | | | 26 | % | | | 86 | % | | | 36 | % | | | 19 | % | | | 45 | % | | | 21 | % | |
Notes to Financial Highlights
(a) For the period from April 1, 2011 to January 31, 2012. During the period, the Portfolio's fiscal year end was changed from March 31 to January 31.
(b) Rounds to zero.
(c) In addition to the fees and expenses which the Portfolio bears directly, the Portfolio indirectly bears a pro rata share of the fees and expenses of the acquired funds in which it invests. Such indirect expenses are not included in the reported expense ratios.
(d) Annualized.
(e) Total net expenses include the impact of certain waivers/reimbursements made by the Investment Manager and certain of its affiliates, if applicable.
(f) The benefits derived from expense reductions had an impact of less than 0.01%.
The accompanying Notes to Financial Statements are an integral part of this statement.
Annual Report 2013
23
Columbia LifeGoal® Growth Portfolio
Financial Highlights (continued)
Class R4 | | Year Ended
January 31,
2013(a) | |
Per share data | |
Net asset value, beginning of period | | $ | 12.29 | | |
Income from investment operations: | |
Net investment income | | | 0.11 | | |
Net realized and unrealized gain | | | 1.05 | | |
Total from investment operations | | | 1.16 | | |
Less distributions to shareholders: | |
Net investment income | | | (0.10 | ) | |
Total distributions to shareholders | | | (0.10 | ) | |
Net asset value, end of period | | $ | 13.35 | | |
Total return | | | 9.50 | % | |
Ratios to average net assets(b) | |
Total gross expenses | | | 0.37 | %(c) | |
Total net expenses(d) | | | 0.27 | %(c) | |
Net investment income | | | 3.94 | %(c) | |
Supplemental data | |
Net assets, end of period (in thousands) | | $ | 3 | | |
Portfolio turnover | | | 26 | % | |
Notes to Financial Highlights
(a) For the period from November 8, 2012 (commencement of operations) to January 31, 2013.
(b) In addition to the fees and expenses which the Portfolio bears directly, the Portfolio indirectly bears a pro rata share of the fees and expenses of the acquired funds in which it invests. Such indirect expenses are not included in the reported expense ratios.
(c) Annualized.
(d) Total net expenses include the impact of certain waivers/reimbursements made by the Investment Manager and certain of its affiliates, if applicable.
The accompanying Notes to Financial Statements are an integral part of this statement.
Annual Report 2013
24
Columbia LifeGoal® Growth Portfolio
Financial Highlights (continued)
Class R5 | | Year Ended
January 31,
2013(a) | |
Per share data | |
Net asset value, beginning of period | | $ | 12.29 | | |
Income from investment operations: | |
Net investment income | | | 0.12 | | |
Net realized and unrealized gain | | | 1.05 | | |
Total from investment operations | | | 1.17 | | |
Less distributions to shareholders: | |
Net investment income | | | (0.11 | ) | |
Total distributions to shareholders | | | (0.11 | ) | |
Net asset value, end of period | | $ | 13.35 | | |
Total return | | | 9.54 | % | |
Ratios to average net assets(b) | |
Total gross expenses | | | 0.15 | %(c) | |
Total net expenses(d) | | | 0.15 | %(c) | |
Net investment income | | | 4.08 | %(c) | |
Supplemental data | |
Net assets, end of period (in thousands) | | $ | 3 | | |
Portfolio turnover | | | 26 | % | |
Notes to Financial Highlights
(a) For the period from November 8, 2012 (commencement of operations) to January 31, 2013.
(b) In addition to the fees and expenses which the Portfolio bears directly, the Portfolio indirectly bears a pro rata share of the fees and expenses of the acquired funds in which it invests. Such indirect expenses are not included in the reported expense ratios.
(c) Annualized.
(d) Total net expenses include the impact of certain waivers/reimbursements made by the Investment Manager and certain of its affiliates, if applicable.
The accompanying Notes to Financial Statements are an integral part of this statement.
Annual Report 2013
25
Columbia LifeGoal® Growth Portfolio
Financial Highlights (continued)
| | | Year Ended January 31, | | Year Ended March 31, | |
Class Z | | 2013 | | 2012(a) | | 2011 | | 2010 | | 2009 | | 2008 | |
Per share data | |
Net asset value, beginning of period | | $ | 11.80 | | | $ | 12.45 | | | $ | 10.49 | | | $ | 6.78 | | | $ | 13.37 | | | $ | 14.80 | | |
Income from investment operations: | |
Net investment income | | | 0.20 | | | | 0.09 | | | | 0.11 | | | | 0.07 | | | | 0.09 | | | | 0.16 | | |
Net realized and unrealized gain (loss) | | | 1.45 | | | | (0.68 | ) | | | 1.94 | | | | 3.66 | | | | (4.17 | ) | | | (0.66 | ) | |
Total from investment operations | | | 1.65 | | | | (0.59 | ) | | | 2.05 | | | | 3.73 | | | | (4.08 | ) | | | (0.50 | ) | |
Less distributions to shareholders: | |
Net investment income | | | (0.25 | ) | | | (0.06 | ) | | | (0.09 | ) | | | (0.02 | ) | | | (0.04 | ) | | | (0.07 | ) | |
Net realized gains | | | — | | | | — | | | | — | | | | — | | | | (2.46 | ) | | | (0.86 | ) | |
Tax return of capital | | | — | | | | — | | | | — | | | | — | | | | (0.01 | ) | | | — | | |
Total distributions to shareholders | | | (0.25 | ) | | | (0.06 | ) | | | (0.09 | ) | | | (0.02 | ) | | | (2.51 | ) | | | (0.93 | ) | |
Proceeds from regulatory settlements | | | — | | | | — | | | | — | | | | 0.00 | (b) | | | — | | | | — | | |
Net asset value, end of period | | $ | 13.20 | | | $ | 11.80 | | | $ | 12.45 | | | $ | 10.49 | | | $ | 6.78 | | | $ | 13.37 | | |
Total return | | | 14.09 | % | | | (4.71 | %) | | | 19.64 | % | | | 55.20 | % | | | (37.38 | %) | | | (4.02 | %) | |
Ratios to average net assets(c) | |
Total gross expenses | | | 0.28 | % | | | 0.26 | %(d) | | | 0.26 | % | | | 0.25 | % | | | 0.25 | % | | | 0.25 | % | |
Total net expenses(e) | | | 0.23 | %(f) | | | 0.20 | %(d)(f) | | | 0.26 | % | | | 0.25 | % | | | 0.25 | %(f) | | | 0.25 | %(f) | |
Net investment income | | | 1.64 | % | | | 0.96 | %(d) | | | 0.97 | % | | | 0.78 | % | | | 0.90 | % | | | 1.07 | % | |
Supplemental data | |
Net assets, end of period (in thousands) | | $ | 49,653 | | | $ | 47,768 | | | $ | 54,882 | | | $ | 51,627 | | | $ | 29,467 | | | $ | 55,202 | | |
Portfolio turnover | | | 26 | % | | | 86 | % | | | 36 | % | | | 19 | % | | | 45 | % | | | 21 | % | |
Notes to Financial Highlights
(a) For the period from April 1, 2011 to January 31, 2012. During the period, the Portfolio's fiscal year end was changed from March 31 to January 31.
(b) Rounds to zero.
(c) In addition to the fees and expenses which the Portfolio bears directly, the Portfolio indirectly bears a pro rata share of the fees and expenses of the acquired funds in which it invests. Such indirect expenses are not included in the reported expense ratios.
(d) Annualized.
(e) Total net expenses include the impact of certain waivers/reimbursements made by the Investment Manager and certain of its affiliates, if applicable.
(f) The benefits derived from expense reductions had an impact of less than 0.01%.
The accompanying Notes to Financial Statements are an integral part of this statement.
Annual Report 2013
26
Columbia LifeGoal® Growth Portfolio
Notes to Financial Statements
January 31, 2013
Note 1. Organization
Columbia LifeGoal® Growth Portfolio (the Portfolio), a series of Columbia Funds Series Trust (the Trust), is a diversified portfolio. The Trust is registered under the Investment Company Act of 1940, as amended (the 1940 Act), as an open-end management investment company organized as a Delaware statutory trust.
The Portfolio is a "fund-of-funds" and invests in a combination of underlying affiliated funds* for which Columbia Management Investment Advisers, LLC (Columbia Management), a wholly-owned subsidiary of Ameriprise Financial, Inc. (Ameriprise Financial), or an affiliate acts as investment manager or principal underwriter. The Portfolio may also invest in unaffiliated underlying funds, exchange traded funds, equity and fixed income securities (including treasury inflation protected securities) and derivative instruments. Columbia Management is the Investment Manager for the underlying affiliated funds.
*For information on the goals, investment strategies and risks of the underlying funds please refer to the Portfolio's most recent prospectus and the prospectuses of the underlying funds.
Portfolio Shares
The Trust may issue an unlimited number of shares (without par value). The Portfolio offers Class A, Class B, Class C, Class K, Class R, Class R4, Class R5 and Class Z shares. All share classes have identical voting, dividend and liquidation rights. Each share class has its own expense structure and sales charges, as applicable.
Class A shares are subject to a maximum front-end sales charge of 5.75% based on the initial investment amount. Class A shares purchased without an initial sales charge in accounts aggregating $1 million to $50 million at the time of purchase are subject to a contingent deferred sales charge (CDSC) if the shares are sold within 18 months of purchase, charged as follows: 1.00% CDSC if redeemed within 12 months of purchase, and 0.50% CDSC if redeemed more than 12, but less than 18, months after purchase.
Class B shares may be subject to a maximum CDSC of 5.00% based upon the holding period after purchase. Class B shares will generally convert to Class A shares eight years after purchase. The Portfolio no longer accepts investments by new or existing investors in the Portfolio's Class B shares, except in connection with the reinvestment of any dividend and/or capital gain distributions in Class B shares of the Portfolio and exchanges by existing Class B shareholders of certain other funds within the Columbia Family of Funds.
Class C shares are subject to a 1.00% CDSC on shares redeemed within one year of purchase.
Class K shares (formerly Class R4 shares) are not subject to sales charges; however, this share class is closed to new investors. Effective October 25, 2012, Class R4 shares were renamed Class K shares.
Class R shares are not subject to sales charges and are only available to qualifying institutional investors.
Class R4 shares are not subject to sales charges and are only available to investors purchasing through authorized investment professionals. Class R4 shares commenced operations on November 8, 2012.
Class R5 shares are not subject to sales charges and are only available to investors purchasing through authorized investment professionals. Class R5 shares commenced operations on November 8, 2012.
Class Z shares are not subject to sales charges, and are only available to certain investors.
Note 2. Summary of Significant Accounting Policies
Use of Estimates
The preparation of financial statements in accordance with U.S. generally accepted accounting principles (GAAP) requires management to make certain estimates and assumptions that affect the reported amounts of assets and liabilities, the disclosure of contingent assets and liabilities at the date of the financial statements and the reported amounts of revenue and expenses during the reporting period. Actual results could differ from those estimates.
The following is a summary of significant accounting policies consistently followed by the Portfolio in the preparation of its financial statements.
Security Valuation
Investments in the underlying funds are valued at the net asset value of each class of the respective underlying fund determined as of the close of the New York Stock Exchange on the valuation date.
The determination of fair value often requires significant judgment. To determine fair value, management may use assumptions including but not limited to future cash flows and estimated risk premiums. Multiple inputs from various sources may be used to determine fair value.
Security Transactions
Security transactions are accounted for on the trade date. Cost is determined and gains (losses) are based upon the specific identification method for both financial statement and federal income tax purposes.
Annual Report 2013
27
Columbia LifeGoal® Growth Portfolio
Notes to Financial Statements (continued)
January 31, 2013
Income Recognition
Income and capital gain distributions from the underlying funds, if any, are recorded on the ex-dividend date.
Expenses
General expenses of the Trust are allocated to the Portfolio and other series of the Trust based upon relative net assets or other expense allocation methodologies determined by the nature of the expense. Expenses directly attributable to the Portfolio are charged to the Portfolio. Expenses directly attributable to a specific class of shares are charged to that share class.
Determination of Class Net Asset Value
All income, expenses (other than class-specific expenses, which are charged to that share class, as shown in the Statement of Operations) and realized and unrealized gains (losses) are allocated to each class of the Portfolio on a daily basis, based on the relative net assets of each class, for purposes of determining the net asset value of each class.
Federal Income Tax Status
The Portfolio intends to qualify each year as a regulated investment company under Subchapter M of the Internal Revenue Code, as amended, and will distribute substantially all of its taxable income (including net short-term capital gains), if any, for its tax year, and as such will not be subject to federal income taxes. In addition, the Portfolio intends to distribute in each calendar year substantially all of its net investment income, capital gains and certain other amounts, if any, such that the Portfolio should not be subject to federal excise tax. Therefore, no federal income or excise tax provision is recorded.
Distributions to Shareholders
Distributions from net investment income, if any, are declared and paid each calendar quarter. Net realized capital gains, if any, are distributed at least annually. Income distributions and capital gain distributions are determined in accordance with federal income tax regulations, which may differ from GAAP.
Guarantees and Indemnifications
Under the Trust's organizational documents and, in some cases, by contract, its officers and trustees are indemnified against certain liabilities arising out of the performance of their duties to the Trust or its portfolios. In addition, certain of the Portfolio's contracts with its service providers contain general indemnification clauses. The Portfolio's maximum exposure under these arrangements is unknown since the amount of any future claims that may be made against the Portfolio cannot be
determined, and the Portfolio has no historical basis for predicting the likelihood of any such claims.
Recent Accounting Pronouncement
Disclosures about Offsetting Assets and Liabilities
In December 2011, the Financial Accounting Standards Board (FASB) issued Accounting Standards Update (ASU) No. 2011-11, Disclosures about Offsetting Assets and Liabilities. The objective of the FASB is to enhance current disclosure requirements on offsetting of certain assets and liabilities and to enable financial statement users to compare financial statements prepared under GAAP and International Financial Reporting Standards.
Specifically, ASU No. 2011-11 requires an entity to disclose both gross and net information for derivatives and other financial instruments that are subject to a master netting arrangement or similar agreement. The standard requires disclosure of collateral received in connection with the master netting agreements or similar agreements. The effective date of ASU No. 2011-11 is for interim and annual periods beginning on or after January 1, 2013. At this time, management is evaluating the implications of this guidance and the impact it will have on the financial statement amounts and footnote disclosures, if any.
Note 3. Fees and Compensation Paid to Affiliates
Investment Management Fees
Under an Investment Management Services Agreement, the Investment Manager determines which securities will be purchased, held or sold. The investment management fee is an annual fee that is a blend of (i) 0.00% on assets invested in funds that pay an investment advisory fee to the Investment Manager, (ii) 0.10% on assets invested in non-exchange traded third-party advised mutual funds and (iii) 0.55% on assets invested in all other securities, including other funds advised by the Investment Manager that do not pay an investment advisory fee, ETF's, derivatives and individual securities.
The effective investment management fee rate for the year ended January 31, 2013, was 0.00% of the Portfolio's average daily net assets.
In addition to the fees and expenses which the Portfolio bears directly, the Portfolio indirectly bears a pro rata share of the fees and expenses of the underlying funds (also referred to as "acquired funds") in which the Portfolio invests. Because the underlying funds have varied expense and fee levels and the Portfolio may own different proportions of underlying funds at different times, the amount of fees and expenses incurred indirectly by the Portfolio will vary.
Annual Report 2013
28
Columbia LifeGoal® Growth Portfolio
Notes to Financial Statements (continued)
January 31, 2013
Administration Fees
Under an Administrative Services Agreement, the Investment Manager also serves as the Portfolio Administrator. The Portfolio pays the Portfolio Administrator an annual fee for administration and accounting services equal to 0.02% of the Portfolio's average daily net assets.
Other Expenses
Other expenses are for, among other things, certain expenses of the Portfolio or the Board of Trustees (the Board), including: Portfolio boardroom and office expense, employee compensation, employee health and retirement benefits, and certain other expenses. Payment of these Portfolio and Board expenses is facilitated by a company providing limited administrative services to the Portfolio and the Board. For the year ended January 31, 2013, other expenses paid to this company were $1,208.
Compensation of Board Members
Board members are compensated for their services to the Portfolio as disclosed in the Statement of Operations. Under a Deferred Compensation Plan (the Plan), the Board members who are not "interested persons" of the Portfolio, as defined under the 1940 Act, may elect to defer payment of up to 100% of their compensation. Deferred amounts are treated as though equivalent dollar amounts had been invested in shares of certain funds managed by the Investment Manager. The Portfolio's liability for these amounts is adjusted for market value changes and remains in the Portfolio until distributed in accordance with the Plan.
Transfer Agent Fees
Under a Transfer and Dividend Disbursing Agent Agreement, Columbia Management Investment Services Corp. (the Transfer Agent), an affiliate of the Investment Manager and a wholly-owned subsidiary of Ameriprise Financial, is responsible for providing transfer agency services to the Portfolio. The Transfer Agent has contracted with Boston Financial Data Services (BFDS) to serve as sub-transfer agent.
The Transfer Agent receives monthly account-based service fees based on the number of open accounts and is reimbursed by the Portfolio for the fees and expenses the Transfer Agent pays to financial intermediaries that maintain omnibus accounts with the Portfolio that is a percentage of the average aggregate value of the Portfolio's shares maintained in each such omnibus account (other than omnibus accounts for which American Enterprise Investment Services Inc. is the broker of record or accounts where the beneficial shareholder is a customer of Ameriprise Financial Services, Inc., which are paid a per account fee). The Transfer Agent pays the fees of BFDS for services as sub-transfer agent and is not entitled to
reimbursement for such fees from the Portfolio (with the exception of out-of-pocket fees).
The Transfer Agent also receives compensation from fees for various shareholder services and reimbursements for certain out-of-pocket fees. Total transfer agent fees for Class K and Class R5 shares are subject to an annual limitation of not more than 0.05% of the average daily net assets attributable to each share class.
For the year ended January 31, 2013, the Portfolio's effective transfer agent fee rates as a percentage of average daily net assets of each class were as follows:
Class A | | | 0.20 | % | |
Class B | | | 0.20 | | |
Class C | | | 0.20 | | |
Class K | | | 0.05 | | |
Class R | | | 0.20 | | |
Class R4 | | | 0.25 | | |
Class R5 | | | 0.03 | | |
Class Z | | | 0.20 | | |
An annual minimum account balance fee of $20 may apply to certain accounts with a value below the Portfolio's initial minimum investment requirements to reduce the impact of small accounts on transfer agent fees. These minimum account balance fees are recorded as part of expense reductions in the Statement of Operations. For the year ended January 31, 2013, these minimum account balance fees reduced total expenses by $1,780.
Plan Administration Fees
Under a Plan Administration Services Agreement with the Transfer Agent, the Portfolio pays an annual fee at a rate of 0.25% of the Portfolio's average daily net assets attributable to Class K shares for the provision of various administrative, recordkeeping, communication and educational services.
Distribution and Service Fees
The Portfolio has an agreement with Columbia Management Investment Distributors, Inc. (the Distributor), an affiliate of the Investment Manager and a wholly-owned subsidiary of Ameriprise Financial, for distribution and shareholder services. Pursuant to Rule 12b-1 under the 1940 Act, the Board has approved, and the Portfolio has adopted, distribution and shareholder service plans (the Plans) which set the distribution and service fees for the Portfolio. These fees are calculated daily and are intended to compensate the Distributor and/or eligible selling and/or servicing agents for selling shares of the Portfolio and providing services to investors.
Annual Report 2013
29
Columbia LifeGoal® Growth Portfolio
Notes to Financial Statements (continued)
January 31, 2013
The Plans require the payment of a monthly combined distribution and service fee to the Distributor at the maximum annual rate of 0.25% of the average daily net assets attributable to Class A shares of the Portfolio. The Plans also require the payment of a monthly service fee at the maximum annual rate of 0.25% of the average daily net assets attributable to Class B and Class C shares of the Portfolio and the payment of a monthly distribution fee at the maximum annual rates of 0.75%, 0.75% and 0.50% of the average daily net assets attributable to Class B, Class C and Class R shares of the Portfolio, respectively.
Sales Charges
Sales charges, including front-end charges and CDSCs, received by the Distributor for distributing Portfolio shares were $868,292 for Class A, $42,926 for Class B and $5,982 for Class C shares for the year ended January 31, 2013.
Expenses Waived/Reimbursed by the Investment Manager and its Affiliates
Effective August 1, 2012, the Investment Manager and certain of its affiliates have contractually agreed to waive fees and/or reimburse expenses (excluding certain fees and expenses described below), through May 31, 2013, unless sooner terminated at the sole discretion of the Board, so that the Portfolio's net operating expenses, after giving effect to fees waived/expenses reimbursed and any balance credits and/or overdraft charges from the Portfolio's custodian, do not exceed the following annual rates as a percentage of the class' average daily net assets:
Class A | | | 0.51 | % | |
Class B | | | 1.26 | | |
Class C | | | 1.26 | | |
Class K | | | 0.40 | | |
Class R | | | 0.76 | | |
Class R4* | | | 0.26 | | |
Class R5* | | | 0.15 | | |
Class Z | | | 0.26 | | |
*Annual rate is contractual from November 8, 2012 (the commencement of operations of each share class) through November 8, 2013.
Prior to August 1, 2012, the Investment Manager and certain of its affiliates contractually agreed to waive fees and/or reimburse expenses (excluding certain fees and expenses described below), so that the Portfolio's net operating expenses, after giving effect to fees waived/expenses reimbursed and any balance credits and/or overdraft charges from the Portfolio's
custodian, did not exceed the following annual rates as a percentage of the class' average daily net assets:
Class A | | | 0.45 | % | |
Class B | | | 1.20 | | |
Class C | | | 1.20 | | |
Class K | | | 0.39 | | |
Class R | | | 0.70 | | |
Class Z | | | 0.20 | | |
Under the agreement governing these fee waivers and/or expense reimbursement arrangements, the following fees and expenses are excluded from the waiver/reimbursement commitment, and therefore will be paid by the Portfolio, if applicable: taxes (including foreign transaction taxes), expenses associated with investments in affiliated and non-affiliated pooled investment vehicles (including mutual funds and exchange traded funds), transaction costs and brokerage commissions, costs related to any securities lending program, dividend expenses associated with securities sold short, inverse floater program fees and expenses, transaction charges and interest on borrowed money, interest, the Portfolio's investment management fee, extraordinary expenses and any other expenses the exclusion of which is specifically approved by the Board. This agreement may be modified or amended only with approval from all parties.
Note 4. Federal Tax Information
The timing and character of income and capital gain distributions are determined in accordance with income tax regulations, which may differ from GAAP because of temporary or permanent book to tax differences.
At January 31, 2013, these differences are primarily due to differing treatment for capital loss carryforwards, deferral/reversal of wash sale losses, Trustees' deferred compensation, post-October capital losses, and re-characterization of distributions from investments. To the extent these differences are permanent, reclassifications are made among the components of the Portfolio's net assets in the Statement of Assets and Liabilities. Temporary differences do not require reclassifications. In the Statement of Assets and Liabilities the following reclassifications were made:
Undistributed net investment income | | $ | 161,281 | | |
Accumulated net realized loss | | | (161,281 | ) | |
Net investment income and net realized gains (losses), as disclosed in the Statement of Operations, and net assets were not affected by this reclassification.
Annual Report 2013
30
Columbia LifeGoal® Growth Portfolio
Notes to Financial Statements (continued)
January 31, 2013
The tax character of distributions paid during the years indicated was as follows:
Year Ended January 31, | | 2013 | | 2012 | | 2011 | |
Ordinary income | | $ | 12,392,025 | | | $ | 2,784,356 | | | $ | 1,834,980 | | |
Short-term capital gain distributions, if any, are considered ordinary income distributions for tax purposes.
At January 31, 2013, the components of distributable earnings on a tax basis were as follows:
Undistributed ordinary income | | $ | 78,483 | | |
Accumulated realized loss | | | (83,072,939 | ) | |
Unrealized appreciation | | | 78,475,965 | | |
At January 31, 2013, the cost of investments for federal income tax purposes was $676,504,007 and the aggregate gross unrealized appreciation and depreciation based on that cost was:
Unrealized appreciation | | $ | 79,138,433 | | |
Unrealized depreciation | | | (662,468 | ) | |
Net unrealized appreciation | | $ | 78,475,965 | | |
The following capital loss carryforward, determined at January 31, 2013, may be available to reduce taxable income arising from future net realized gains on investments, if any, to the extent permitted by the Internal Revenue Code:
Year of Expiration | | Amount ($) | |
2016 | | | 902,133 | | |
2017 | | | 32,644,275 | | |
2018 | | | 47,841,948 | | |
2019 | | | 1,684,583 | | |
Total | | | 83,072,939 | | |
For the year ended January 31, 2013, $29,166,112 of capital loss carryforward was utilized.
Management of the Portfolio has concluded that there are no significant uncertain tax positions that would require recognition in the financial statements. However, management's conclusion may be subject to review and adjustment at a later date based on factors including, but not limited to, new tax laws, regulations, and administrative interpretations (including relevant court decisions). Generally, the Portfolio's federal tax returns for the prior three fiscal years remain subject to examination by the Internal Revenue Service.
Note 5. Portfolio Information
The cost of purchases and proceeds from sales of securities, excluding short-term obligations, aggregated to $196,339,208 and $279,829,950, respectively, for the year ended January 31, 2013.
Note 6. Shareholder Concentration
At January 31, 2013, two unaffiliated shareholder accounts owned an aggregate of 39.5% of the outstanding shares of the Portfolio. The Portfolio has no knowledge about whether any portion of those shares was owned beneficially by such accounts. Subscription and redemption activity by concentrated accounts may have a significant effect on the operations of the Portfolio.
Note 7. Line of Credit
The Portfolio has entered into a revolving credit facility with a syndicate of banks led by JPMorgan Chase Bank N.A. whereby the Portfolio may borrow for the temporary funding of shareholder redemptions or for other temporary or emergency purposes. The credit facility agreement, as amended, which is a collective agreement between the Portfolio and certain other funds managed by the Investment Manager, severally and not jointly, permits collective borrowings up to $500 million. Interest is charged to each participating fund based on its borrowings at a rate equal to the higher of (i) the overnight federal funds rate plus 1.00% or (ii) the one-month LIBOR rate plus 1.00%. Each borrowing under the credit facility matures no later than 60 days after the date of borrowing.
The Portfolio had no borrowings during the year ended January 31, 2013.
Note 8. Fund Merger
At the close of business on June 3, 2011, the Portfolio acquired the assets and assumed the identified liabilities of Columbia Portfolio Builder Total Equity Fund, a series of RiverSource Market Advantage Series, Inc. The reorganization was completed after shareholders approved the plan on February 15, 2011. The purpose of the transaction was to combine two funds managed by the Investment Manager with comparable investment objectives and strategies.
The aggregate net assets of the Portfolio immediately before the acquisition were $389,808,690 and the combined net assets immediately after the acquisition were $872,698,599.
The merger was accomplished by a tax-free exchange of 46,780,747 shares of Columbia Portfolio Builder Total Equity Fund valued at $482,889,909 (including $48,740,099 of unrealized appreciation).
In exchange for Columbia Portfolio Builder Total Equity Fund shares, the Portfolio issued the following number of shares:
| | Shares | |
Class A | | | 33,362,333 | | |
Class B | | | 4,532,209 | | |
Class C | | | 2,788,845 | | |
Class R4 | | | 23,841 | | |
Annual Report 2013
31
Columbia LifeGoal® Growth Portfolio
Notes to Financial Statements (continued)
January 31, 2013
For financial reporting purposes, net assets received and shares issued by the Portfolio were recorded at fair value; however, Columbia Portfolio Builder Total Equity Fund's cost of investments was carried forward.
The financial statements reflect the operations of the Portfolio for the period prior to the merger and the combined fund for the period subsequent to the merger. Because the combined investment portfolios have been managed as a single integrated portfolio since the merger was completed, it is not practicable to separate the amounts of revenue and earnings of Columbia Portfolio Builder Total Equity Fund that have been included in the combined Portfolio's Statement of Operations since the merger was completed.
Note 9. Subsequent Events
Management has evaluated the events and transactions that have occurred through the date the financial statements were issued and noted no items requiring adjustment of the financial statements or additional disclosure.
Note 10. Information Regarding Pending and Settled Legal Proceedings
In December 2005, without admitting or denying the allegations, American Express Financial Corporation (AEFC, which is now known as Ameriprise Financial, Inc. (Ameriprise Financial)) entered into settlement agreements with the Securities and Exchange Commission (SEC) and Minnesota Department of Commerce (MDOC) related to market timing activities. As a result, AEFC was censured and ordered to cease and desist from committing or causing any violations of certain provisions of the Investment Advisers Act of 1940, the Investment Company Act of 1940, and various Minnesota laws. AEFC agreed to pay disgorgement of $10 million and civil money penalties of $7 million. AEFC also agreed to retain an independent distribution consultant to assist in developing a plan for distribution of all disgorgement and civil penalties
ordered by the SEC in accordance with various undertakings detailed at www.sec.gov/litigation/admin/ia-2451.pdf. Ameriprise Financial and its affiliates have cooperated with the SEC and the MDOC in these legal proceedings, and have made regular reports to the funds' Boards of Trustees.
Ameriprise Financial and certain of its affiliates have historically been involved in a number of legal, arbitration and regulatory proceedings, including routine litigation, class actions, and governmental actions, concerning matters arising in connection with the conduct of their business activities. Ameriprise Financial believes that the Funds are not currently the subject of, and that neither Ameriprise Financial nor any of its affiliates are the subject of, any pending legal, arbitration or regulatory proceedings that are likely to have a material adverse effect on the Funds or the ability of Ameriprise Financial or its affiliates to perform under their contracts with the Funds. Ameriprise Financial is required to make 10-Q, 10-K and, as necessary, 8-K filings with the Securities and Exchange Commission on legal and regulatory matters that relate to Ameriprise Financial and its affiliates. Copies of these filings may be obtained by accessing the SEC website at www.sec.gov.
There can be no assurance that these matters, or the adverse publicity associated with them, will not result in increased fund redemptions, reduced sale of fund shares or other adverse consequences to the Funds. Further, although we believe proceedings are not likely to have a material adverse effect on the Funds or the ability of Ameriprise Financial or its affiliates to perform under their contracts with the Funds, these proceedings are subject to uncertainties and, as such, we are unable to estimate the possible loss or range of loss that may result. An adverse outcome in one or more of these proceedings could result in adverse judgments, settlements, fines, penalties or other relief that could have a material adverse effect on the consolidated financial condition or results of operations of Ameriprise Financial.
Annual Report 2013
32
Columbia LifeGoal® Growth Portfolio
Report of Independent Registered Public Accounting Firm
To the Trustees of Columbia Funds Series Trust and the Shareholders of
Columbia LifeGoal® Growth Portfolio
In our opinion, the accompanying statement of assets and liabilities, including the portfolio of investments, and the related statements of operations and of changes in net assets and the financial highlights present fairly, in all material respects, the financial position of Columbia LifeGoal® Growth Portfolio (the "Portfolio") (a series of Columbia Funds Series Trust) at January 31, 2013, the results of its operations for the year then ended, the changes in its net assets for each of the two years in the period then ended and the financial highlights for each of the periods indicated, in conformity with accounting principles generally accepted in the United States of America. These financial statements and financial highlights (hereafter referred to as "financial statements") are the responsibility of the Portfolio's management. Our responsibility is to express an opinion on these financial statements based on our audits. We conducted our audits of these financial statements in accordance with the standards of the Public Company Accounting Oversight Board (United States). Those standards require that we plan and perform the audit to obtain reasonable assurance about whether the financial statements are free of material misstatement. An audit includes examining, on a test basis, evidence supporting the amounts and disclosures in the financial statements, assessing the accounting principles used and significant estimates made by management, and evaluating the overall financial statement presentation. We believe that our audits, which included confirmation of securities at January 31, 2013 by correspondence with the transfer agent, provide a reasonable basis for our opinion.
PricewaterhouseCoopers LLP
Minneapolis, Minnesota
March 22, 2013
Annual Report 2013
33
Columbia LifeGoal® Growth Portfolio
Federal Income Tax Information
(Unaudited)
The Portfolio hereby designates the following tax attributes for the fiscal year ended January 31, 2013. Shareholders will be notified in early 2014 of the amounts for use in preparing 2013 income tax returns.
Tax Designations:
| Qualified Dividend Income | | | 90.32 | % | |
| Dividends Received Deduction | | | 71.84 | % | |
Foreign Taxes Paid | | $ | 163,156 | | |
Foreign Source Income | | $ | 1,032,689 | | |
Qualified Dividend Income. For taxable, non-corporate shareholders, the percentage of ordinary income dividends paid during the fiscal year that represents qualified dividend income subject to reduced tax rates under the Jobs and Growth Tax Relief Reconciliation Act of 2003.
Dividends Received Deduction. The percentage of ordinary income dividends paid during the fiscal year that qualifies for the corporate dividends received deduction.
Foreign Taxes. The Portfolio makes the election to pass through to shareholders the foreign taxes paid. These taxes, and the corresponding foreign source income, are provided.
Annual Report 2013
34
Columbia LifeGoal® Growth Portfolio
Shareholders elect the Board that oversees the funds' operations. The Board appoints officers who are responsible for day-to-day business decisions based on policies set by the Board. The following table provides basic biographical information about the funds' Board members, including their principal occupations during the past five years, although specific titles for individuals may have varied over the period. Under current Board policy, members may serve until the next Board meeting after he or she reaches the mandatory retirement age established by the Board, or the fifteenth anniversary of the first Board meeting they attended as a member of the Board.
Mr. Edward J. Boudreau, Jr., Mr. William P. Carmichael, Mr. William A. Hawkins, Mr. R. Glenn Hilliard, Ms. Minor M. Shaw and Dr. Anthony M. Santomero, were members of the Legacy Columbia Nations funds' Board ("Nations Funds"), which includes Columbia Funds Series Trust, Columbia Funds Variable Insurance Trust I and Columbia Funds Master Investment Trust, LLC and began service on the Board for the Legacy RiverSource funds ("RiverSource Funds") effective June 1, 2011.
Independent Trustees
Name,
Address,
Year of Birth | | Position Held With
Funds and Length of
Service | | Principal Occupation
During Past Five Years | | Number of
Funds in the
Fund Family
Overseen by
Board Member | | Other Present or Past
Directorships/Trusteeships
(Within Past 5 Years) | |
Kathleen Blatz
901 S. Marquette Ave.
Minneapolis, MN 55402
1954 | | Board member since 1/06 for RiverSource Funds and since 6/11 for Nations Funds | | Attorney; Chief Justice, Minnesota Supreme Court, 1998-2006 | | | 152 | | | Director, BlueCross BlueShield of Minnesota since 2009 | |
Edward J. Boudreau, Jr.
901 S. Marquette Ave.
Minneapolis, MN 55402
1944 | | Board member since 6/11 for RiverSource Funds and since 1/05 for Nations Funds | | Managing Director, E.J. Boudreau & Associates (consulting) since 2000 | | | 145 | | | Former Trustee, BofA Funds Series Trust (11 funds) | |
Pamela G. Carlton
901 S. Marquette Ave.
Minneapolis, MN 55402
1954 | | Board member since 7/07 for RiverSource Funds and since 6/11 for Nations Funds | | President, Springboard — Partners in Cross Cultural Leadership (consulting company) since 2003 | | | 152 | | | None | |
William P. Carmichael
901 S. Marquette Ave.
Minneapolis, MN 55402
1943 | | Board member since 6/11 for RiverSource Funds and since 1999 for Nations Funds | | Retired | | | 145 | | | Director, Cobra Electronics Corporation (electronic equipment manufacturer); The Finish Line (athletic shoes and apparel) since July 2003; McMoRan Exploration Company (oil and gas exploration and development) since 2010; former Trustee, BofA Funds Series Trust (11 funds); former Director, Spectrum Brands, Inc. (consumer products); former Director, Simmons Company (bedding) | |
Patricia M. Flynn
901 S. Marquette Ave.
Minneapolis, MN 55402
1950 | | Board member since 11/04 for RiverSource Funds and since 6/11 for Nations Funds | | Trustee Professor of Economics and Management, Bentley University since 1976 | | | 152 | | | None | |
William A. Hawkins
901 S. Marquette Ave.
Minneapolis, MN 55402
1942 | | Board member since 6/11 for RiverSource Funds and since 1/05 for Nations Funds | | Managing Director, Overton Partners (financial consulting), since August 2010; President and Chief Executive Officer, California General Bank, N.A., January 2008-August 2010. | | | 145 | | | Trustee, BofA Funds Series Trust (11 funds) | |
Annual Report 2013
35
Columbia LifeGoal® Growth Portfolio
Trustees and Officers (continued)
Independent Trustees (continued)
Name,
Address,
Year of Birth | | Position Held With
Funds and Length of
Service | | Principal Occupation
During Past Five Years | | Number of
Funds in the
Fund Family
Overseen by
Board Member | | Other Present or Past
Directorships/Trusteeships
(Within Past 5 Years) | |
R. Glenn Hilliard
901 S. Marquette Ave.
Minneapolis, MN 55402
1943 | | Board member since 6/11 for RiverSource Funds and since 1/05 for Nations Funds | | Chairman and Chief Executive Officer, Hilliard Group LLC (investing and consulting), since April 2003; Non-Executive Director & Chairman, CNO Financial Group, Inc. (insurance), September 2003-May 2011 | | | 145 | | | Chairman, BofA Fund Series Trust (11 funds); former Director, CNO Financial Group, Inc. (insurance) | |
Stephen R. Lewis, Jr.
901 S. Marquette Ave.
Minneapolis, MN 55402
1939 | | Chair of the Board for RiverSource Funds since 1/07, Board member for RiverSource Funds since 1/02 and since 6/11 for Nations Funds | | President Emeritus and Professor of Economics Emeritus, Carleton College since 2002 | | | 152 | | | Director, Valmont Industries, Inc. (manufacturer of irrigation systems) since 2002 | |
Catherine James Paglia
901 S. Marquette Ave.
Minneapolis, MN 55402
1952 | | Board member since 11/04 for RiverSource Funds and since 6/11 for Nations Funds | | Director, Enterprise Asset Management, Inc. (private real estate and asset management company) | | | 152 | | | Director, Valmont Industries, Inc. (manufacturer of irrigation systems) since 2012 | |
Leroy C. Richie
901 S. Marquette Ave.
Minneapolis, MN 55402
1941 | | Board member since 2000 for Legacy Seligman Funds, since 11/08 for RiverSource Funds and since 6/11 for Nations Funds | | Counsel, Lewis & Munday, P.C. (law firm) since 2004; former Vice President and General Counsel, Automotive Legal Affairs, Chrysler Corporation from 1983-1997 | | | 152 | | | Lead Outside Director, Digital Ally, Inc. (digital imaging) since September 2005; Director, Infinity, Inc. (oil and gas exploration and production) since 1994; Director, OGE Energy Corp. (energy and energy services) since November 2007 | |
Minor M. Shaw
901 S. Marquette Ave.
Minneapolis, MN 55402
1947 | | Board member since 6/11 for RiverSource Funds and since 2003 for Nations Funds | | President, Micco LLC (private investments) since 2011; President, Micco Corp. since 1998 | | | 145 | | | Director, Piedmont Natural Gas; Director, BlueCross BlueShield of South Carolina since April 2008; Former Trustee, BofA Funds Series Trust (11 funds) | |
Alison Taunton-Rigby
901 S. Marquette Ave.
Minneapolis, MN 55402
1944 | | Board member since 11/02 for RiverSource Funds and since 6/11 for Nations Funds | | Chief Executive Officer and Director, RiboNovix, Inc., 2003-2010 (biotechnology) | | | 152 | | | Director, Healthways, Inc. (health and well-being improvement) since 2005; Director, ICI Mutual Insurance Company, RRG since 2011; Director, Abt Associates (government contractor) since 2001; Director, Boston Children's Hospital since 2002 | |
Annual Report 2013
36
Columbia LifeGoal® Growth Portfolio
Trustees and Officers (continued)
Interested Trustee Not Affiliated With Investment Manager*
Name,
Address,
Year of Birth | | Position Held With
Funds and Length of
Service | | Principal Occupation
During Past Five Years | | Number of
Funds in the
Fund Family
Overseen by
Board Member | | Other Present or Past
Directorships/Trusteeships
(Within Past 5 Years) | |
Anthony M. Santomero
901 S. Marquette Ave.
Minneapolis, MN 55402
1946 | | Board member since 6/11 for RiverSource Funds and since 1/08 for Nations Funds | | Richard K. Mellon Professor Emeritus of Finance, The Wharton School, University of Pennsylvania, since 2002; Senior Advisor, McKinsey & Company (consulting), 2006-2008 | | | 145 | | | Director, Renaissance Reinsurance Ltd. since May 2008; Trustee, Penn Mutual Life Insurance Company since March 2008; Director, Citigroup since 2009; Director, Citibank, N.A. since 2009; former Trustee, BofA Funds Series Trust (11 funds) | |
*Dr. Santomero is not an affiliated person of the investment manager or Ameriprise Financial. However, he is currently deemed by the funds to be an "interested person" (as defined in the 1940 Act) of the funds because he serves as a Director of Citigroup, Inc. and Citibank N.A., companies that may directly or through subsidiaries and affiliates engage from time-to-time in brokerage execution, principal transactions and lending relationships with the funds or accounts advised/managed by the investment manager.
Interested Trustee Affiliated With Investment Manager*
Name,
Address,
Year of Birth | | Position Held With
Funds and Length of
Service | | Principal Occupation
During Past Five Years | | Number of
Funds in the
Fund Family
Overseen by
Board Member | | Other Present or Past
Directorships/Trusteeships
(Within Past 5 Years) | |
William F. Truscott
53600 Ameriprise
Financial Center
Minneapolis, MN 55474
1960 | | Board member since 11/01 for RiverSource Funds and since 6/11 for Nations Funds; Senior Vice President since 2002 for RiverSource Funds and 5/10 for Nations Funds | | President, Columbia Management Investment Advisers, LLC since February 2012, (previously President, Chairman of the Board and Chief Investment Officer, 2001-April 2010); Chief Executive Officer, Global Asset Management, Ameriprise Financial, Inc. since September 2012 (previously Chief Executive Officer, U.S. Asset Management & President, Annuities, May 2010-September 2012 and President — U.S. Asset Management and Chief Investment Officer, 2005-April 2010); Chief Executive Officer, Columbia Management Investment Distributors, Inc. since February 2012, (previously Chairman of the Board and Chief Executive Officer, 2006-April 2010); Chairman of the Board and Chief Executive Officer, RiverSource Distributors, Inc. since 2006; President and Chief Executive Officer, Ameriprise Certificate Company 2006-August 2012. | | | 204 | | | Chairman of the Board, Columbia Management Investment Advisers, LLC since May 2010; Director, Columbia Management Investment Distributors, Inc. since May 2010; Director, Ameriprise Certificate Company, 2006-January 2013 | |
*Interested person (as defined under the 1940 Act) by reason of being an officer, director, security holder and/or employee of the investment manager or Ameriprise Financial.
The SAI has additional information about the Portfolio's Board members and is available, without charge, upon request by calling 800.345.6611; contacting your financial intermediary; or visiting columbiamanagement.com.
Annual Report 2013
37
Columbia LifeGoal® Growth Portfolio
Trustees and Officers (continued)
The Board has appointed officers who are responsible for day-to-day business decisions based on policies it has established. The officers serve at the pleasure of the Board. In addition to Mr. Truscott, who is Senior Vice President, the funds' other officers are:
Officers
Name,
Address,
Year of Birth | | Position Held With
Funds and Length of
Service | | Principal Occupation During Past Five Years | |
J. Kevin Connaughton
225 Franklin Street
Boston, MA 02110
1964 | | President and Principal Executive Officer since 5/10 for RiverSource Funds and 2009 for Nations Funds | | Senior Vice President and General Manager — Mutual Fund Products, Columbia Management Investment Advisers, LLC since May 2010; Managing Director of Columbia Management Advisors, LLC, December 2004-April 2010; Senior Vice President and Chief Financial Officer, Columbia Funds, June 2008-January 2009; Treasurer, Columbia Funds, October 2003-May 2008 | |
Amy K. Johnson
5228 Ameriprise Financial Center Minneapolis, MN 55474
1965 | | Vice President since 12/06 for RiverSource Funds and 5/10 for Nations Funds | | Senior Vice President and Chief Operating Officer, Columbia Management Investment Advisers, LLC since May 2010 (previously Chief Administrative Officer, 2009-April 2010 and Vice President — Asset Management and Trust Company Services, 2006-2009) | |
Michael G. Clarke
225 Franklin Street
Boston, MA 02110
1969 | | Treasurer since 1/11 and Chief Financial Officer since 4/11 RiverSource Funds and Treasurer since 3/11 and Chief Financial Officer since 2009 for Nations Funds | | Vice President, Columbia Management Investment Advisers, LLC since May 2010; Managing Director of Fund Administration, Columbia Management Advisors, LLC, September 2004-April 2010; senior officer of Columbia Funds and affiliated funds since 2002 | |
Scott R. Plummer
5228 Ameriprise Financial Center Minneapolis, MN 55474
1959 | | Senior Vice President and Chief Legal Officer since 12/06 and Assistant Secretary since 6/11 for RiverSource Funds and Senior Vice President and Chief Legal Officer since 5/10 and Assistant Secretary since 6/11 for Nations Funds | | Senior Vice President, Chief Legal Officer and Assistant Secretary, Columbia Management Investment Advisers, LLC since June 2005; Vice President and Lead Chief Counsel — Asset Management, Ameriprise Financial, Inc. since May 2010 (previously Vice President and Chief Counsel — Asset Management, 2005-April 2010); Vice President, Chief Counsel and Assistant Secretary, Columbia Management Investment Distributors, Inc. since 2008; Vice President, General Counsel and Secretary, Ameriprise Certificate Company since 2005; Chief Counsel, RiverSource Distributors, Inc. since 2006 | |
Colin Moore
225 Franklin Street
Boston, MA 02110
1958 | | Senior Vice President since 5/10 for RiverSource Funds and Nations Funds | | Director and Chief Investment Officer, Columbia Management Investment Advisers, LLC since May 2010; Manager, Managing Director and Chief Investment Officer, Columbia Management Advisors, LLC, 2007-April 2010 | |
Thomas P. McGuire
225 Franklin Street
Boston, MA 02110
1972 | | Chief Compliance Officer since 3/12 | | Vice President — Asset Management Compliance, Columbia Management Investment Advisers, LLC since 2010; Chief Compliance Officer, Ameriprise Certificate Company since September 2010; Compliance Executive, Bank of America, 2005-2010 | |
Stephen T. Welsh
225 Franklin Street
Boston, MA 02110
1957 | | Vice President since 4/11 for RiverSource Funds and 2006 for Nations Funds | | President and Director, Columbia Management Investment Services Corp. since May 2010; President and Director, Columbia Management Services, Inc., July 2004- April 2010; Managing Director, Columbia Management Distributors, Inc., August 2007-April 2010 | |
Christopher O. Petersen
5228 Ameriprise Financial Center Minneapolis, MN 55474
1970 | | Vice President and Secretary since 4/11 for RiverSource Funds and 3/11 for Nations Funds | | Vice President and Chief Counsel, Ameriprise Financial, Inc. since January 2010 (formerly Vice President and Group Counsel or Counsel, April 2004-January 2010); Assistant Secretary of Legacy RiverSource Funds, January 2007-April 2011 and of the Nations Funds, May 2010-March 2011 | |
Annual Report 2013
38
Columbia LifeGoal® Growth Portfolio
Trustees and Officers (continued)
Officers (continued)
Name,
Address,
Year of Birth | | Position Held With
Funds and Length of
Service | | Principal Occupation During Past Five Years | |
Paul D. Pearson
10468 Ameriprise Financial Center Minneapolis, MN 55474
1956 | | Vice President since 4/11 and Assistant Treasurer since 1999 for RiverSource Funds and Vice President and Assistant Treasurer since 6/11 for Nations Funds | | Vice President — Investment Accounting, Columbia Management Investment Advisers, LLC, since May 2010; Vice President — Managed Assets, Investment Accounting, Ameriprise Financial Corporation, February 1998-May 2010 | |
Joseph F. DiMaria
225 Franklin Street
Boston, MA 02110
1968 | | Vice President and Chief Accounting Officer since 4/11 and Vice President since 3/11 and Chief Accounting Officer since 2008 for Nations Funds | | Vice President, Mutual Fund Administration, Columbia Management Investment Advisers, LLC, since May 2010; Director of Fund Administration, Columbia Management Advisors, LLC, January 2006-April 2010 | |
Paul B. Goucher
100 Park Avenue
New York, NY 10017
1968 | | Vice President since 4/11 and Assistant Secretary since 11/08 for RiverSource Funds and 5/10 for Nations Funds | | Vice President and Lead Chief Counsel, Ameriprise Financial, Inc. since November 2008 and January 2013, respectively (formerly, Chief Counsel, January 2010-January 2013 and Group Counsel from November 2008- January 2010); Director, Managing Director and General Counsel, J. & W. Seligman & Co. Incorporated, July 2008-November 2008 (previously, Managing Director and Associate General Counsel, January 2005-July 2008) | |
Michael E. DeFao
225 Franklin Street
Boston, MA 02110
1968 | | Vice President since 4/11 and Assistant Secretary since 5/10 for RiverSource Funds and 2011 for Nations Funds | | Vice President and Chief Counsel, Ameriprise Financial, Inc. since May 2010; Associate General Counsel, Bank of America, June 2005-April 2010 | |
Annual Report 2013
39
This page intentionally left blank.
Annual Report 2013
40
Columbia LifeGoal® Growth Portfolio
Important Information About This Report
Each fund mails one shareholder report to each shareholder address. If you would like more than one report, please call shareholder services at 800.345.6611 and additional reports will be sent to you.
The policy of the Board is to vote the proxies of the companies in which each fund holds investments consistent with the procedures as stated in the Statement of Additional Information (SAI). You may obtain a copy of the SAI without charge by calling 800.345.6611; contacting your financial intermediary; visiting columbiamanagement.com; or searching the website of the Securities and Exchange Commission (SEC) at sec.gov. Information regarding how each fund voted proxies relating to portfolio securities is filed with the SEC by August 31 for the most recent 12-month period ending June 30 of that year, and is available without charge by visiting columbiamanagement.com; or searching the website of the SEC at sec.gov.
Each fund files a complete schedule of portfolio holdings with the SEC for the first and third quarters of each fiscal year on Form N-Q. Each fund's Form N-Q is available on the SEC's website at sec.gov and may be reviewed and copied at the SEC's Public Reference Room in Washington, D.C. Information on the operation of the Public Reference Room may be obtained by calling 800.SEC.0330. Each fund's complete schedule of portfolio holdings, as filed on Form N-Q, can also be obtained without charge, upon request, by calling 800.345.6611.
Annual Report 2013
41

Columbia LifeGoal® Growth Portfolio
P.O. Box 8081
Boston, MA 02266-8081
columbiamanagement.com
This information is for use with concurrent or prior delivery of a fund prospectus. Please read and consider the investment objectives, risks, charges and expenses for any fund carefully before investing. For a prospectus which contains this and other important information about the Fund go to columbiamanagement.com. The Fund is distributed by Columbia Management Investment Distributors, Inc., member FINRA, and managed by Columbia Management Investment Advisers, LLC.
© 2013 Columbia Management Investment Advisers, LLC. All rights reserved.
ANN181_01_C01_(03/13)
Annual Report
January 31, 2013

Columbia Masters International Equity Portfolio
Not FDIC insured • No bank guarantee • May lose value
Columbia Masters International Equity Portfolio
 Dear Shareholders,
U.S. stocks flat, foreign markets strong in 2012 finale
After a strong third quarter, U.S. stock market averages treaded water as 2012 came to a close. However, they ended the year up strongly, as first and third quarter gains more than offset second and fourth quarter weakness. Typically a strong quarter for domestic small- and mid-cap issues, the fourth quarter of 2012 indeed proved to be another year-end positive for small-cap stocks. For the full calendar year 2012, the S&P 500 Index rose 16.00%.
Stock markets outside the United States generated some of the best returns for the fourth quarter, as optimism rebounded, thanks to the September actions of the European Central Bank in support of the euro and an improving outlook from China. Both developed and emerging foreign markets topped U.S. stocks by a solid margin.
Corporate and emerging markets led fixed income
Fixed-income investors took their cue from the equity markets and continued to favor the highest risk sectors through the end of 2012. Global fixed-income returns posted mixed results in the final quarter of the year. Gains were the highest for corporate high-yield and emerging market bonds. Although investors remained cautious ahead of the year-end budget negotiations, better economic data and a further improvement in the European sovereign debt crisis supported riskier assets and depressed government bond prices. In December, the Federal Reserve announced its intention to continue to purchase both Treasury and mortgage-backed securities and said that it would seek to keep short-term interest rates unchanged until the unemployment rate reaches 6.5%, or inflation turned noticeably higher.
Stay on track with Columbia Management
Backed by more than 100 years of experience, Columbia Management is one of the nation's largest asset managers. At the heart of our success — and, most importantly, that of our investors — are highly talented industry professionals, brought together by a unique way of working. We are dedicated to helping you take advantage of today's opportunities and anticipate tomorrow's. We stay abreast of the latest investment trends and ideas, using our collective insight to evaluate events and transform them into solutions you can use.
Visit columbiamanagement.com for:
> The Columbia Management Perspectives blog, featuring timely posts by our investment teams
> Detailed up-to-date fund performance and portfolio information
> Economic analysis and market commentary
> Quarterly fund commentaries
> Columbia Management Investor, our award-winning quarterly newsletter for shareholders
Thank you for your continued support of the Columbia Funds. We look forward to serving your investment needs for many years to come.
Best Regards,

J. Kevin Connaughton
President, Columbia Funds
The S&P 500 Index, an unmanaged index, measures the performance of 500 widely held, large-capitalization U.S. stocks and is frequently used as a general measure of market performance. Indices are not available for investment, are not professionally managed and do not reflect sales charges, fees, brokerage commissions, taxes or other expenses of investing.
Investors should consider the investment objectives, risks, charges and expenses of a mutual fund carefully before investing. For a free prospectus, which contains this and other important information about a fund, visit columbiamanagement.com. The prospectus should be read carefully before investing.
Columbia Funds are distributed by Columbia Management Investment Distributors, Inc., member FINRA, and managed by Columbia Management Investment Advisers, LLC.
© 2013 Columbia Management Investment Advisers, LLC. All rights reserved.
Columbia Masters International Equity Portfolio
Performance Overview | | | 2 | | |
Manager Discussion of Portfolio Performance | | | 4 | | |
Understanding Your Portfolio's Expenses | | | 5 | | |
Portfolio of Investments | | | 6 | | |
Statement of Assets and Liabilities | | | 11 | | |
Statement of Operations | | | 13 | | |
Statement of Changes in Net Assets | | | 14 | | |
Financial Highlights | | | 16 | | |
Notes to Financial Statements | | | 21 | | |
Report of Independent Registered
Public Accounting Firm | | | 28 | | |
Federal Income Tax Information | | | 29 | | |
Trustees and Officers | | | 30 | | |
Important Information About This Report | | | 37 | | |
Portfolio Investment Manager
Columbia Management Investment
Advisers, LLC
225 Franklin Street
Boston, MA 02110
Portfolio Distributor
Columbia Management Investment
Distributors, Inc.
225 Franklin Street
Boston, MA 02110
Portfolio Transfer Agent
Columbia Management Investment
Services Corp.
P.O. Box 8081
Boston, MA 02266-8081
For more information about any of the funds, please visit columbiamanagement.com or call 800.345.6611. Customer Service Representatives are available to answer your questions Monday through Friday from 8 a.m. to 8 p.m. Eastern time.
The views expressed in this report reflect the current views of the respective parties. These views are not guarantees of future performance and involve certain risks, uncertainties and assumptions that are difficult to predict, so actual outcomes and results may differ significantly from the views expressed. These views are subject to change at any time based upon economic, market or other conditions and the respective parties disclaim any responsibility to update such views. These views may not be relied on as investment advice and, because investment decisions for a Columbia Fund are based on numerous factors, may not be relied on as an indication of trading intent on behalf of any particular Columbia Fund. References to specific securities should not be construed as a recommendation or investment advice.
Columbia Masters International Equity Portfolio
Performance Summary
> Columbia Masters International Equity Portfolio (the Portfolio) Class A shares returned 15.40% excluding sales charges for the 12-month period that ended January 31, 2013.
> The Portfolio's benchmark, the MSCI EAFE Index (Net), returned 17.25% during the same 12-month period.
> In a period of generally strong returns from stock markets across the world, the Portfolio's exposure to emerging markets somewhat restrained returns relative to its benchmark.
Average Annual Total Returns (%) (for period ended January 31, 2013)
| | Inception | | 1 Year | | 5 Years | | Life | |
Class A | | 02/15/06 | | | | | | | | | | | | | |
Excluding sales charges | | | | | | | 15.40 | | | | -1.42 | | | | 1.99 | | |
Including sales charges | | | | | | | 8.77 | | | | -2.57 | | | | 1.13 | | |
Class B | | 02/15/06 | | | | | | | | | | | | | |
Excluding sales charges | | | | | | | 14.67 | | | | -2.16 | | | | 1.25 | | |
Including sales charges | | | | | | | 9.67 | | | | -2.51 | | | | 1.25 | | |
Class C | | 02/15/06 | | | | | | | | | | | | | |
Excluding sales charges | | | | | | | 14.54 | | | | -2.16 | | | | 1.24 | | |
Including sales charges | | | | | | | 13.54 | | | | -2.16 | | | | 1.24 | | |
Class R | | 02/15/06 | | | 15.17 | | | | -1.70 | | | | 1.72 | | |
Class Z | | 02/15/06 | | | 15.80 | | | | -1.17 | | | | 2.25 | | |
MSCI EAFE Index (Net) | | | | | | | 17.25 | | | | -0.79 | | | | 2.42 | | |
Returns for Class A are shown with and without the maximum initial sales charge of 5.75%. Returns for Class B are shown with and without the applicable contingent deferred sales charge (CDSC) of 5.00% in the first year, declining to 1.00% in the sixth year and eliminated thereafter. Returns for Class C are shown with and without the 1.00% CDSC for the first year only. The Portfolio's other classes are not subject to sales charges and have limited eligibility. Please see the Portfolio's prospectus for details. Performance for different share classes will vary based on differences in sales charges and fees associated with each class. All results shown assume reinvestment of distributions during the period. Returns do not reflect the deduction of taxes that a shareholder may pay on Fund distributions or on the redemption of Fund shares. Performance results reflect the effect of any fee waivers or reimbursements of Fund expenses by Columbia Management Investment Advisers, LLC and/or any of its affiliates. Absent these fee waivers or expense reimbursement arrangements, performance results would have been lower.
The performance information shown represents past performance and is not a guarantee of future results. The investment return and principal value of your investment will fluctuate so that your shares, when redeemed, may be worth more or less than their original cost. Current performance may be lower or higher than the performance information shown. You may obtain performance information current to the most recent month-end by contacting your financial intermediary, visiting columbiamanagement.com or calling 800.345.6611.
The MSCI EAFE (Europe, Australasia, Far East) Index (Net) is a free float-adjusted market capitalization index that is designed to measure the equity market performance of developed markets, excluding the U.S. and Canada. The index is compiled from a composite of securities markets of Europe, Australasia and the Far East and is widely recognized by investors in foreign markets as the measurement index for portfolios of non-North American securities.
Indices are not available for investment, are not professionally managed and do not reflect sales charges, fees, brokerage commissions, taxes or other expenses of investing. Securities in the Portfolio may not match those in an index.
Annual Report 2013
2
Columbia Masters International Equity Portfolio
Performance Overview (continued)
Performance of a Hypothetical $10,000 Investment (February 15, 2006 – January 31, 2013)
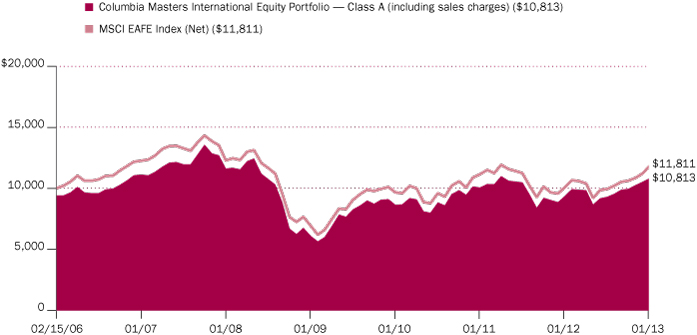
The chart above shows the change in value of a hypothetical $10,000 investment in Class A shares of Columbia Masters International Equity Portfolio during the stated time period, and does not reflect the deduction of taxes that a shareholder may pay on Portfolio distributions or on the redemption of Portfolio shares.
Annual Report 2013
3
Columbia Masters International Equity Portfolio
Manager Discussion of Portfolio Performance
For the 12-month period that ended January 31, 2013, the Portfolio's Class A shares returned 15.40% without sales charge. The Portfolio's benchmark, the MSCI EAFE Index (Net), returned 17.25% over the same period. The Portfolio invests in fixed allocations to four Columbia Funds: Columbia Acorn International, Columbia Emerging Markets Fund, Columbia Pacific/Asia Fund and Columbia European Equity Fund. Solid performance from the Portfolio's underlying funds helped bolster returns. Exposure to emerging markets accounted for the modest shortfall relative to the benchmark.
Investors Shrug Off Weak Global Growth
Although economic growth was weak to fair across the globe, investors chose to look beyond the numbers and bid stock prices significantly higher, buoyed by favorable central bank action in key markets. The U.S. economy expanded at a pace of just 1.5% over the past year, while much of Europe headed toward recession. The United Kingdom avoided recession — but only barely so — and Japan's economy slipped into negative territory for the fifth time in 15 years. Major emerging market economies forged ahead, although mostly at a slower pace. Investors remained concerned about slowing growth in China, but China's stock market ended the 12-month period with solid double-digit gains, as did most major international stock market indices. Emerging markets were the exception, with the MSCI Emerging Markets Index (Net) returning just 7.64%.
Underlying Funds Aided Returns
All four Columbia Funds in the Portfolio performed better than their individual benchmarks. Columbia European Equity Fund, which accounts for 60% of the Portfolio's assets, sustained a modest advantage over its benchmark, the MSCI Europe Index (Net). Columbia Acorn International Fund outperformed the S&P Global Ex-U.S. $500 million — $5 billion Index and performed in line with the MSCI EAFE Index (Net). Columbia Pacific/Asia Fund's return was slightly better than its benchmark, the MSCI All Country Asia Pacific Index (Net.) Columbia Emerging Markets Fund significantly outperformed the MSCI Emerging Markets Index (Net). However, emerging stock markets generally underperformed other regions and the Portfolio's exposure to emerging markets generally accounted for its modest shortfall relative to its EAFE benchmark. Emerging markets are not included in the index.
Looking Ahead
Our expectations for the global economy are somewhat better for 2013 than they were for the year behind us. We expect the United States, Japan and Europe to continue to struggle with problems that are more structural than cyclical in nature, including demographic shifts and, in Europe and the United States, colossal indebtedness. What's more, the upside for these regions appears limited, as we believe growth prospects remain low and lapses into recession are still a lingering concern. By contrast, we believe that emerging markets remain attractive, with upside potential that is quite exciting. We continue to believe that the Portfolio's diversified mix of well-managed Columbia Funds can help tap opportunity and balance risk over the long term.
Portfolio Management
Colin Moore, AIIMR
Fred Copper, CFA
Morningstar Style BoxTM

The Morningstar Style BoxTM is based on a fund's portfolio holdings. For equity funds, the vertical axis shows the market capitalization of the stocks owned, and the horizontal axis shows investment style (value, blend, or growth). Information shown is based on the most recent data provided by Morningstar.
© 2013 Morningstar, Inc. All rights reserved. The Morningstar information contained herein: (1) is proprietary to Morningstar and/or its content providers; (2) may not be copied or distributed; and (3) is not warranted to be accurate, complete or timely. Neither Morningstar nor its content providers are responsible for any damages or losses arising from any use of this information.
Portfolio Breakdown (%)
(at January 31, 2013) | |
Equity Funds | | | 99.0 | | |
International | | | 99.0 | | |
Money Market Funds | | | 1.0 | | |
Total | | | 100.0 | | |
Percentages are based on total investments.
Annual Report 2013
4
Columbia Masters International Equity Portfolio
Understanding Your Portfolio's Expenses
(Unaudited)
As an investor, you incur two types of costs. There are transaction costs, which generally include sales charges on purchases and may include redemption fees. There are also ongoing costs, which generally include management fees, distribution and service (Rule 12b-1) fees, and other portfolio expenses. The following information is intended to help you understand your ongoing costs (in dollars) of investing in the Portfolio and to help you compare these costs with the ongoing costs of investing in other mutual funds.
Analyzing Your Portfolio's Expenses
To illustrate these ongoing costs, we have provided examples and calculated the expenses paid by investors in each share class of the Portfolio during the period. The actual and hypothetical information in the table is based on an initial investment of $1,000 at the beginning of the period indicated and held for the entire period. Expense information is calculated two ways and each method provides you with different information. The amount listed in the "Actual" column is calculated using the Portfolio's actual operating expenses and total return for the period. You may use the Actual information, together with the amount invested, to estimate the expenses that you paid over the period. Simply divide your account value by $1,000 (for example, an $8,600 account value divided by $1,000 = 8.6), then multiply the results by the expenses paid during the period under the Actual column. The amount listed in the "Hypothetical" column assumes a 5% annual rate of return before expenses (which is not the Portfolio's actual return) and then applies the Portfolio's actual expense ratio for the period to the hypothetical return. You should not use the hypothetical account values and expenses to estimate either your actual account balance at the end of the period or the expenses you paid during the period. See "Compare With Other Funds" below for details on how to use the hypothetical data.
In addition to the ongoing expenses which the Portfolio bears directly, the Portfolio's shareholders indirectly bear the Portfolio's allocable share of the costs and expenses of each underlying fund in which the Portfolio invests. You can also estimate the effective expenses paid during the period, which includes the indirect fees associated with investing in the underlying funds, by using the amounts listed in the effective expenses paid during the period column.
Compare With Other Funds
Since all mutual funds are required to include the same hypothetical calculations about expenses in shareholder reports, you can use this information to compare the ongoing cost of investing in the Portfolio with other funds. To do so, compare the hypothetical example with the 5% hypothetical examples that appear in the shareholder reports of other funds. As you compare hypothetical examples of other funds, it is important to note that hypothetical examples are meant to highlight the ongoing costs of investing in a fund only and do not reflect any transaction costs, such as sales charges, or redemption or exchange fees. Therefore, the hypothetical calculations are useful in comparing ongoing costs only, and will not help you determine the relative total costs of owning different funds. If transaction costs were included in these calculations, your costs would be higher.
August 1, 2012 – January 31, 2013
| | Account Value at the
Beginning of the
Period ($) | | Account Value at
the End of the
Period ($) | | Expenses Paid During
the Period ($) | | Portfolio's
Annualized
Expense
Ratio (%) | | Effective Expenses
Paid During the
Period ($) | | Portfolio's
Effective
Annualized
Expense
Ratio (%) | |
| | Actual | | Hypothetical | | Actual | | Hypothetical | | Actual | | Hypothetical | | Actual | | Actual | | Hypothetical | | Actual | |
Class A | | | 1,000.00 | | | | 1,000.00 | | | | 1,163.30 | | | | 1,023.88 | | | | 1.36 | | | | 1.27 | | | | 0.25 | | | | 6.96 | | | | 6.51 | | | | 1.28 | | |
Class B | | | 1,000.00 | | | | 1,000.00 | | | | 1,159.70 | | | | 1,020.11 | | | | 5.43 | | | | 5.08 | | | | 1.00 | | | | 11.02 | | | | 10.31 | | | | 2.03 | | |
Class C | | | 1,000.00 | | | | 1,000.00 | | | | 1,158.40 | | | | 1,020.11 | | | | 5.43 | | | | 5.08 | | | | 1.00 | | | | 11.01 | | | | 10.31 | | | | 2.03 | | |
Class R | | | 1,000.00 | | | | 1,000.00 | | | | 1,161.30 | | | | 1,022.62 | | | | 2.72 | | | | 2.54 | | | | 0.50 | | | | 8.31 | | | | 7.78 | | | | 1.53 | | |
Class Z | | | 1,000.00 | | | | 1,000.00 | | | | 1,165.60 | | | | 1,025.14 | | | | — | | | | — | | | | 0.00 | | | | 5.61 | | | | 5.24 | | | | 1.03 | | |
Expenses paid during the period are equal to the Portfolio's annualized expense ratio for each class as indicated above, multiplied by the average account value over the period and then multiplied by the number of days in the Portfolio's most recent fiscal half year and divided by 366.
Effective expenses paid during the period and the Portfolio's effective annualized expense ratio include expenses borne directly to the class plus the Portfolio's pro rata portion of the ongoing expenses charged by the underlying funds using the expense ratio of each class of the underlying funds as of the underlying fund's most recent shareholder report.
Had Columbia Management Investment Advisers, LLC and/or certain of its affiliates not waived/reimbursed certain fees and expenses, account value at the end of the period would have been reduced.
Annual Report 2013
5
Columbia Masters International Equity Portfolio
Portfolio of Investments
January 31, 2013
(Percentages represent value of investments compared to net assets)
Equity Funds 99.3%
| | | Shares | | Value ($) | |
International 99.3% | |
Columbia Acorn International,
Class I Shares(a) | | | 57,668 | | | | 2,445,129 | | |
Columbia Emerging Markets Fund,
Class I Shares(a) | | | 460,749 | | | | 4,824,040 | | |
Columbia European Equity Fund,
Class I Shares(a) | | | 4,528,819 | | | | 29,256,169 | | |
Columbia Pacific/Asia Fund,
Class I Shares(a) | | | 1,411,680 | | | | 12,239,267 | | |
Total | | | | | 48,764,605 | | |
Total Equity Funds
(Cost: $45,170,944) | | | | | 48,764,605 | | |
Money Market Funds 1.0%
| | | Shares | | Value ($) | |
Columbia Short-Term Cash Fund,
0.132%(a)(b) | | | 494,965 | | | | 494,965 | | |
Total Money Market Funds
(Cost: $494,965) | | | 494,965 | | |
Total Investments
(Cost: $45,665,909) | | | 49,259,570 | | |
Other Assets and Liabilities | | | (163,451 | ) | |
Net Assets | | | 49,096,119 | | |
Investments in Derivatives
Futures Contracts Outstanding at January 31, 2013
At January 31, 2013, $18,000 was held in a margin deposit account as collateral to cover initial margin requirements on open futures contracts.
Contract Description | | Number of
Contracts
Long (Short) | | Notional
Market
Value ($) | | Expiration
Date | | Unrealized
Appreciation ($) | | Unrealized
Depreciation ($) | |
E-Mini MCSI EAFE Index | | | 6 | | | | 504,420 | | | March 2013 | | | 30,928 | | | | — | | |
Forward Foreign Currency Exchange Contracts Open at January 31, 2013
Counterparty | | Exchange Date | | Currency to
be Delivered | | Currency to
be Received | | Unrealized
Appreciation ($) | | Unrealized
Depreciation ($) | |
HSBC Securities (USA), Inc.
| | February 15, 2013
| | | 4,542,000
(EUR) | | | | 6,013,435
(USD) | | | | —
| | | | (154,062
| ) | |
Goldman, Sachs & Co.
| | February 15, 2013
| | | 1,529,000
(GBP) | | | | 2,488,075
(USD) | | | | 63,220
| | | | —
| | |
Goldman, Sachs & Co.
| | February 15, 2013
| | | 812,000
(GBP) | | | | 1,282,299
(USD) | | | | —
| | | | (5,459
| ) | |
Deutsche Bank
| | February 15, 2013
| | | 15,637,000
(SEK) | | | | 2,403,567
(USD) | | | | —
| | | | (55,367
| ) | |
Morgan Stanley
| | February 15, 2013
| | | 6,151,600
(USD) | | | | 5,909,000
(AUD) | | | | 5,493
| | | | —
| | |
UBS Securities
| | February 15, 2013
| | | 92,845
(USD) | | | | 93,000
(CAD) | | | | 377
| | | | —
| | |
Barclays Bank PLC
| | February 15, 2013
| | | 1,237,021
(USD) | | | | 1,220,000
(CAD) | | | | —
| | | | (14,115
| ) | |
UBS Securities
| | February 15, 2013
| | | 2,432,710
(USD) | | | | 2,396,000
(CAD) | | | | —
| | | | (31,002
| ) | |
Citigroup Global Markets Inc.
| | February 15, 2013
| | | 2,461,343
(USD) | | | | 2,963,000
(NZD) | | | | 23,512
| | | | —
| | |
J.P. Morgan Securities, Inc.
| | March 14, 2013
| | | 498,000
(CHF) | | | | 538,117
(USD) | | | | —
| | | | (9,316
| ) | |
The accompanying Notes to Financial Statements are an integral part of this statement.
Annual Report 2013
6
Columbia Masters International Equity Portfolio
Portfolio of Investments (continued)
January 31, 2013
Forward Foreign Currency Exchange Contracts Open at January 31, 2013 (continued)
Counterparty | | Exchange Date | | Currency to
be Delivered | | Currency to
be Received | | Unrealized
Appreciation ($) | | Unrealized
Depreciation ($) | |
J.P. Morgan Securities, Inc.
| | March 14, 2013
| | | 1,369,000
(DKK) | | | | 244,855
(USD) | | | | —
| | | | (4,385
| ) | |
J.P. Morgan Securities, Inc.
| | March 14, 2013
| | | 594,000
(EUR) | | | | 792,931
(USD) | | | | —
| | | | (13,770
| ) | |
J.P. Morgan Securities, Inc.
| | March 14, 2013
| | | 4,263,422,000
(IDR) | | | | 429,997
(USD) | | | | —
| | | | (6,019
| ) | |
J.P. Morgan Securities, Inc.
| | March 14, 2013
| | | 2,071,819,000
(KRW) | | | | 1,955,100
(USD) | | | | 56,644
| | | | —
| | |
J.P. Morgan Securities, Inc.
| | March 14, 2013
| | | 3,722,000
(MXN) | | | | 294,374
(USD) | | | | 2,724
| | | | —
| | |
J.P. Morgan Securities, Inc.
| | March 14, 2013
| | | 886,000
(MYR) | | | | 293,523
(USD) | | | | 9,093
| | | | —
| | |
J.P. Morgan Securities, Inc.
| | March 14, 2013
| | | 19,776,000
(PHP) | | | | 488,055
(USD) | | | | 1,986
| | | | —
| | |
J.P. Morgan Securities, Inc.
| | March 14, 2013
| | | 14,589,000
(THB) | | | | 487,845
(USD) | | | | —
| | | | (281
| ) | |
J.P. Morgan Securities, Inc.
| | March 14, 2013
| | | 36,682,000
(TWD) | | | | 1,268,396
(USD) | | | | 25,766
| | | | —
| | |
J.P. Morgan Securities, Inc.
| | March 14, 2013
| | | 2,194,876
(USD) | | | | 2,090,000
(AUD) | | | | —
| | | | (21,397
| ) | |
J.P. Morgan Securities, Inc.
| | March 14, 2013
| | | 1,952,867
(USD) | | | | 1,221,000
(GBP) | | | | —
| | | | (16,750
| ) | |
J.P. Morgan Securities, Inc.
| | March 14, 2013
| | | 4,834,879
(USD) | | | | 432,156,000
(JPY) | | | | —
| | | | (107,889
| ) | |
J.P. Morgan Securities, Inc.
| | March 14, 2013
| | | 735,992
(USD) | | | | 4,776,000
(SEK) | | | | 14,617
| | | | —
| | |
J.P. Morgan Securities, Inc.
| | March 14, 2013
| | | 286,075
(USD) | | | | 351,000
(SGD) | | | | —
| | | | (2,485
| ) | |
Total | | | | | | | | | 203,432 | | | | (442,297 | ) | |
Notes to Portfolio of Investments
(a) As defined in the Investment Company Act of 1940, an affiliated company is one in which the Portfolio owns 5% or more of its outstanding voting securities, or a company which is under common ownership or control with the Portfolio. Holdings and transactions in these affiliated companies during the year ended January 31, 2013, are as follows:
Issuer | | Beginning
Cost ($) | | Purchase
Cost ($) | | Proceeds
From
Sales ($) | | Realized
Gain/Loss ($) | | Ending
Cost ($) | | Capital Gain
Distributions ($) | | Dividend
Income ($) | | Value ($) | |
Columbia Acorn
International,
Class I Shares | | | 1,925,337 | | | | 127,272 | | | | (1,317,740 | ) | | | 501,150 | | | | 1,236,019 | | | | — | | | | 54,265 | | | | 2,445,129 | | |
Columbia
Emerging
Markets Fund,
Class I Shares | | | 7,572,173 | | | | 511,825 | | | | (2,579,655 | ) | | | (462,882 | ) | | | 5,041,461 | | | | 236,575 | | | | 28,339 | | | | 4,824,040 | | |
Columbia
European Equity
Fund, Class I
Shares | | | 42,235,125 | | | | 1,613,802 | | | | (16,477,334 | ) | | | (602,082 | ) | | | 26,769,511 | | | | 116,724 | | | | 578,658 | | | | 29,256,169 | | |
The accompanying Notes to Financial Statements are an integral part of this statement.
Annual Report 2013
7
Columbia Masters International Equity Portfolio
Portfolio of Investments (continued)
January 31, 2013
Notes to Portfolio of Investments (continued)
Issuer | | Beginning
Cost ($) | | Purchase
Cost ($) | | Proceeds
From
Sales ($) | | Realized
Gain/Loss ($) | | Ending
Cost ($) | | Capital Gain
Distributions ($) | | Dividend
Income ($) | | Value ($) | |
Columbia
Pacific/Asia
Fund, Class I
Shares | | | 17,968,287 | | | | 862,674 | | | | (6,117,331 | ) | | | (589,677 | ) | | | 12,123,953 | | | | — | | | | 307,692 | | | | 12,239,267 | | |
Columbia
Short-Term
Cash Fund | | | 7 | | | | 2,750,687 | | | | (2,255,729 | ) | | | — | | | | 494,965 | | | | — | | | | 995 | | | | 494,965 | | |
Total | | | 69,700,929 | | | | 5,866,260 | | | | (28,747,789 | ) | | | (1,153,491 | ) | | | 45,665,909 | | | | 353,299 | | | | 969,949 | | | | 49,259,570 | | |
(b) The rate shown is the seven-day current annualized yield at January 31, 2013.
Currency Legend
AUD Australian Dollar
CAD Canadian Dollar
CHF Swiss Franc
DKK Danish Krone
EUR Euro
GBP British Pound
IDR Indonesian Rupiah
JPY Japanese Yen
KRW Korean Won
MXN Mexican Peso
MYR Malaysia Ringgits
NZD New Zealand Dollar
PHP Philippine Peso
SEK Swedish Krona
SGD Singapore Dollar
THB Thailand Baht
TWD Taiwan Dollar
USD US Dollar
Fair Value Measurements
Generally accepted accounting principles (GAAP) require disclosure regarding the inputs and valuation techniques used to measure fair value and any changes in valuation inputs or techniques. In addition, investments shall be disclosed by major category.
The Portfolio categorizes its fair value measurements according to a three-level hierarchy that maximizes the use of observable inputs and minimizes the use of unobservable inputs by prioritizing that the most observable input be used when available. Observable inputs are those that market participants would use in pricing an investment based on market data obtained from sources independent of the reporting entity. Unobservable inputs are those that reflect the Portfolio's assumptions about the information market participants would use in pricing an investment. An investment's level within the fair value hierarchy is based on the lowest level of any input that is deemed significant to the asset or liability's fair value measurement. The input levels are not necessarily an indication of the risk or liquidity associated with investments at that level. For example, certain U.S. government securities are generally high quality and liquid, however, they are reflected as Level 2 because the inputs used to determine fair value may not always be quoted prices in an active market.
The accompanying Notes to Financial Statements are an integral part of this statement.
Annual Report 2013
8
Columbia Masters International Equity Portfolio
Portfolio of Investments (continued)
January 31, 2013
Fair Value Measurements (continued)
Fair value inputs are summarized in the three broad levels listed below:
> Level 1 — Valuations based on quoted prices for investments in active markets that the Portfolio has the ability to access at the measurement date (including NAV for open-end mutual funds). Valuation adjustments are not applied to Level 1 investments.
> Level 2 — Valuations based on other significant observable inputs (including quoted prices for similar securities, interest rates, prepayment speeds, credit risks, etc.).
> Level 3 — Valuations based on significant unobservable inputs (including the Portfolio's own assumptions and judgment in determining the fair value of investments).
Inputs that are used in determining fair value of an investment may include price information, credit data, volatility statistics, and other factors. These inputs can be either observable or unobservable. The availability of observable inputs can vary between investments, and is affected by various factors such as the type of investment, and the volume and level of activity for that investment or similar investments in the marketplace. The inputs will be considered by the Investment Manager, along with any other relevant factors in the calculation of an investment's fair value. The Portfolio uses prices and inputs that are current as of the measurement date, which may include periods of market dislocations. During these periods, the availability of prices and inputs may be reduced for many investments. This condition could cause an investment to be reclassified between the various levels within the hierarchy.
Investments falling into the Level 3 category are primarily supported by quoted prices from brokers and dealers participating in the market for those investments. However, these may be classified as Level 3 investments due to lack of market transparency and corroboration to support these quoted prices. Additionally, valuation models may be used as the pricing source for any remaining investments classified as Level 3. These models rely on one or more significant unobservable inputs and/or significant assumptions by the Investment Manager. Inputs used in valuations may include, but are not limited to, financial statement analysis, capital account balances, discount rates and estimated cash flows, and comparable company data.
Under the direction of the Portfolio's Board of Trustees (the Board), the Investment Manager's Valuation Committee (the Committee) is responsible for carrying out the valuation procedures approved by the Board. The Committee consists of voting and non-voting members from various groups within the Investment Manager's organization, including operations and accounting, trading and investments, compliance, risk management and legal.
The Committee meets at least monthly to review and approve valuation matters, which may include a description of specific valuation determinations, data regarding pricing information received from approved pricing vendors and brokers and the results of Board-approved valuation control policies and procedures (the Policies). The Policies address, among other things, instances when market quotations are readily available, including recommendations of third party pricing vendors and a determination of appropriate pricing methodologies; events that require specific valuation determinations and assessment of fair value techniques; securities with a potential for stale pricing, including those that are illiquid, restricted, or in default; and the effectiveness of third-party pricing vendors, including periodic reviews of vendors. The Committee meets more frequently, as needed, to discuss additional valuation matters, which may include the need to review back-testing results, review time-sensitive information or approve related valuation actions. The Committee reports to the Board, with members of the Committee meeting with the Board at each of its regularly scheduled meetings to discuss valuation matters and actions during the period, similar to those described earlier.
For investments categorized as Level 3, the Committee monitors information similar to that described above, which may include: (i) data specific to the issuer or comparable issuers, (ii) general market or specific sector news and (iii) quoted prices and specific or similar security transactions. The Committee considers this data and any changes from prior periods in order to assess the reasonableness of observable and unobservable inputs, any assumptions or internal models used to value those securities and changes in fair value. This data is also used to corroborate, when available, information received from approved pricing vendors and brokers. Various factors impact the frequency of monitoring this information (which may occur as often as daily). However, the Committee may determine that changes to inputs, assumptions and models are not required as a result of the monitoring procedures performed.
The following table is a summary of the inputs used to value the Portfolio's investments at January 31, 2013:
Description | | Level 1
Quoted Prices in Active
Markets for Identical
Assets ($) | | Level 2
Other Significant
Observable Inputs ($) | | Level 3
Significant
Unobservable Inputs ($) | | Total ($) | |
Mutual Funds | |
Equity Funds | | | 48,764,605 | | | | — | | | | — | | | | 48,764,605 | | |
Money Market Funds | | | 494,965 | | | | — | | | | — | | | | 494,965 | | |
Total Mutual Funds | | | 49,259,570 | | | | — | | | | — | | | | 49,259,570 | | |
The accompanying Notes to Financial Statements are an integral part of this statement.
Annual Report 2013
9
Columbia Masters International Equity Portfolio
Portfolio of Investments (continued)
January 31, 2013
Fair Value Measurements (continued)
Description | | Level 1
Quoted Prices in Active
Markets for Identical
Assets ($) | | Level 2
Other Significant
Observable Inputs ($) | | Level 3
Significant
Unobservable Inputs ($) | | Total ($) | |
Derivatives | |
Assets | |
Futures Contracts | | | 30,928 | | | | — | | | | — | | | | 30,928 | | |
Forward Foreign Currency
Exchange Contracts | | | — | | | | 203,432 | | | | — | | | | 203,432 | | |
Liabilities | |
Forward Foreign Currency
Exchange Contracts | | | — | | | | (442,297 | ) | | | — | | | | (442,297 | ) | |
Total | | | 49,290,498 | | | | (238,865 | ) | | | — | | | | 49,051,633 | | |
See the Portfolio of Investments for all investment classifications not indicated in the table.
There were no transfers of financial assets between Levels 1 and 2 during the period.
Derivative instruments are valued at unrealized appreciation (depreciation).
The accompanying Notes to Financial Statements are an integral part of this statement.
Annual Report 2013
10
Columbia Masters International Equity Portfolio
Statement of Assets and Liabilities
January 31, 2013
Assets | |
Investments in affiliated funds, at value | |
(identified cost $45,665,909) | | $ | 49,259,570 | | |
Margin deposits on futures contracts | | | 18,000 | | |
Unrealized appreciation on forward foreign currency exchange contracts | | | 203,432 | | |
Receivable for: | |
Investments sold | | | 204,824 | | |
Capital shares sold | | | 159,701 | | |
Dividends from affiliated funds | | | 87 | | |
Expense reimbursement due from Investment Manager | | | 331 | | |
Prepaid expenses | | | 1,398 | | |
Total assets | | | 49,847,343 | | |
Liabilities | |
Unrealized depreciation on forward foreign currency exchange contracts | | | 442,297 | | |
Payable for: | |
Investments purchased | | | 156,627 | | |
Capital shares purchased | | | 41,496 | | |
Variation margin on futures contracts | | | 2,220 | | |
Distribution and/or service fees | | | 297 | | |
Transfer agent fees | | | 9,057 | | |
Administration fees | | | 27 | | |
Compensation of board members | | | 45,114 | | |
Other expenses | | | 54,089 | | |
Total liabilities | | | 751,224 | | |
Net assets applicable to outstanding capital stock | | $ | 49,096,119 | | |
Represented by | |
Paid-in capital | | $ | 138,866,860 | | |
Excess of distributions over net investment income | | | (540,787 | ) | |
Accumulated net realized loss | | | (92,615,678 | ) | |
Unrealized appreciation (depreciation) on: | |
Affiliated investments | | | 3,593,661 | | |
Forward foreign currency exchange contracts | | | (238,865 | ) | |
Futures contracts | | | 30,928 | | |
Total — representing net assets applicable to outstanding capital stock | | $ | 49,096,119 | | |
The accompanying Notes to Financial Statements are an integral part of this statement.
Annual Report 2013
11
Columbia Masters International Equity Portfolio
Statement of Assets and Liabilities (continued)
January 31, 2013
Class A | |
Net assets | | $ | 19,543,307 | | |
Shares outstanding | | | 2,183,935 | | |
Net asset value per share | | $ | 8.95 | | |
Maximum offering price per share(a) | | $ | 9.50 | | |
Class B | |
Net assets | | $ | 1,618,810 | | |
Shares outstanding | | | 181,307 | | |
Net asset value per share | | $ | 8.93 | | |
Class C | |
Net assets | | $ | 4,286,417 | | |
Shares outstanding | | | 480,662 | | |
Net asset value per share | | $ | 8.92 | | |
Class R | |
Net assets | | $ | 88,535 | | |
Shares outstanding | | | 9,913 | | |
Net asset value per share | | $ | 8.93 | | |
Class Z | |
Net assets | | $ | 23,559,050 | | |
Shares outstanding | | | 2,630,781 | | |
Net asset value per share | | $ | 8.96 | | |
(a) The maximum offering price per share is calculated by dividing the net asset value by 1.0 minus the maximum sales charge of 5.75%.
The accompanying Notes to Financial Statements are an integral part of this statement.
Annual Report 2013
12
Columbia Masters International Equity Portfolio
Statement of Operations
Year Ended January 31, 2013
Net investment income | |
Income: | |
Dividends — affiliated issuers | | $ | 969,949 | | |
Total income | | | 969,949 | | |
Expenses: | |
Distribution and/or service fees | |
Class A | | | 54,564 | | |
Class B | | | 17,208 | | |
Class C | | | 47,453 | | |
Class R | | | 324 | | |
Transfer agent fees | |
Class A | | | 37,631 | | |
Class B | | | 2,967 | | |
Class C | | | 8,196 | | |
Class R | | | 107 | | |
Class Z | | | 44,834 | | |
Administration fees | | | 10,846 | | |
Compensation of board members | | | 13,425 | | |
Custodian fees | | | 9,408 | | |
Printing and postage fees | | | 35,901 | | |
Registration fees | | | 75,019 | | |
Professional fees | | | 554 | | |
Other | | | 7,823 | | |
Total expenses | | | 366,260 | | |
Fees waived or expenses reimbursed by Investment Manager and its affiliates | | | (246,708 | ) | |
Expense reductions | | | (61 | ) | |
Total net expenses | | | 119,491 | | |
Net investment income | | | 850,458 | | |
Realized and unrealized gain (loss) — net | |
Net realized gain (loss) on: | |
Investments — affiliated issuers | | | (1,153,491 | ) | |
Capital gain distributions from underlying affiliated funds | | | 353,299 | | |
Foreign currency translations | | | 10,376 | | |
Forward foreign currency exchange contracts | | | (1,105,584 | ) | |
Futures contracts | | | 74,333 | | |
Net realized loss | | | (1,821,067 | ) | |
Net change in unrealized appreciation (depreciation) on: | |
Investments — affiliated issuers | | | 8,319,394 | | |
Forward foreign currency exchange contracts | | | (90,442 | ) | |
Futures contracts | | | 30,928 | | |
Net change in unrealized appreciation (depreciation) | | | 8,259,880 | | |
Net realized and unrealized gain | | | 6,438,813 | | |
Net increase in net assets resulting from operations | | $ | 7,289,271 | | |
The accompanying Notes to Financial Statements are an integral part of this statement.
Annual Report 2013
13
Columbia Masters International Equity Portfolio
Statement of Changes in Net Assets
| | | Year Ended
January 31,
2013 | | Year Ended
January 31,
2012(a) | | Year Ended
March 31,
2011 | |
Operations | |
Net investment income | | $ | 850,458 | | | $ | 741,819 | | | $ | 2,123,145 | | |
Net realized loss | | | (1,821,067 | ) | | | (530,406 | ) | | | (32,550,340 | ) | |
Net change in unrealized appreciation (depreciation) | | | 8,259,880 | | | | (9,448,487 | ) | | | 42,289,227 | | |
Net increase (decrease) in net assets resulting from operations | | | 7,289,271 | | | | (9,237,074 | ) | | | 11,862,032 | | |
Distributions to shareholders | |
Net investment income | |
Class A | | | (295,343 | ) | | | (330,929 | ) | | | (2,202,252 | ) | |
Class B | | | (14,577 | ) | | | (13,728 | ) | | | (124,341 | ) | |
Class C | | | (41,210 | ) | | | (37,257 | ) | | | (338,096 | ) | |
Class R | | | (751 | ) | | | (369 | ) | | | (1,323 | ) | |
Class Z | | | (396,344 | ) | | | (487,342 | ) | | | (3,064,636 | ) | |
Total distributions to shareholders | | | (748,225 | ) | | | (869,625 | ) | | | (5,730,648 | ) | |
Increase (decrease) in net assets from capital stock activity | | | (22,263,571 | ) | | | (33,477,580 | ) | | | (34,562,344 | ) | |
Total decrease in net assets | | | (15,722,525 | ) | | | (43,584,279 | ) | | | (28,430,960 | ) | |
Net assets at beginning of year | | | 64,818,644 | | | | 108,402,923 | | | | 136,833,883 | | |
Net assets at end of year | | $ | 49,096,119 | | | $ | 64,818,644 | | | $ | 108,402,923 | | |
Undistributed (excess of distributions over) net investment income | | $ | (540,787 | ) | | $ | 450,752 | | | $ | — | | |
(a) For the period from April 1, 2011 to January 31, 2012. During the period, the Portfolio's fiscal year end was changed from March 31 to January 31.
The accompanying Notes to Financial Statements are an integral part of this statement.
Annual Report 2013
14
Columbia Masters International Equity Portfolio
Statement of Changes in Net Assets (continued)
| | | Year Ended January 31,
2013 | | Year Ended January 31,
2012(a) | | Year Ended March 31,
2011 | |
| | | Shares | | Dollars ($) | | Shares | | Dollars ($) | | Shares | | Dollars ($) | |
Capital stock activity | |
Class A shares | |
Subscriptions(b) | | | 156,533 | | | | 1,274,090 | | | | 239,852 | | | | 1,967,901 | | | | 262,902 | | | | 2,132,786 | | |
Distributions reinvested | | | 32,054 | | | | 246,830 | | | | 31,876 | | | | 235,242 | | | | 223,830 | | | | 1,698,913 | | |
Redemptions | | | (1,191,691 | ) | | | (9,681,460 | ) | | | (1,782,769 | ) | | | (14,476,248 | ) | | | (2,218,381 | ) | | | (17,966,365 | ) | |
Net decrease | | | (1,003,104 | ) | | | (8,160,540 | ) | | | (1,511,041 | ) | | | (12,273,105 | ) | | | (1,731,649 | ) | | | (14,134,666 | ) | |
Class B shares | |
Subscriptions | | | 2,510 | | | | 20,186 | | | | 3,611 | | | | 31,983 | | | | 8,062 | | | | 64,000 | | |
Distributions reinvested | | | 1,093 | | | | 7,978 | | | | 953 | | | | 7,033 | | | | 12,356 | | | | 92,087 | | |
Redemptions(b) | | | (80,142 | ) | | | (647,392 | ) | | | (104,870 | ) | | | (855,978 | ) | | | (144,060 | ) | | | (1,173,513 | ) | |
Net decrease | | | (76,539 | ) | | | (619,228 | ) | | | (100,306 | ) | | | (816,962 | ) | | | (123,642 | ) | | | (1,017,426 | ) | |
Class C shares | |
Subscriptions | | | 17,574 | | | | 142,381 | | | | 11,959 | | | | 96,428 | | | | 53,320 | | | | 427,667 | | |
Distributions reinvested | | | 4,012 | | | | 29,246 | | | | 3,291 | | | | 24,258 | | | | 32,952 | | | | 249,551 | | |
Redemptions | | | (239,284 | ) | | | (1,911,043 | ) | | | (342,370 | ) | | | (2,893,474 | ) | | | (343,277 | ) | | | (2,768,247 | ) | |
Net decrease | | | (217,698 | ) | | | (1,739,416 | ) | | | (327,120 | ) | | | (2,772,788 | ) | | | (257,005 | ) | | | (2,091,029 | ) | |
Class R shares | |
Subscriptions | | | 4,077 | | | | 32,700 | | | | 4,508 | | | | 34,553 | | | | 1,589 | | | | 13,173 | | |
Distributions reinvested | | | 80 | | | | 610 | | | | 48 | | | | 351 | | | | 99 | | | | 740 | | |
Redemptions | | | (508 | ) | | | (4,262 | ) | | | (525 | ) | | | (1,227 | ) | | | (3,279 | ) | | | (26,273 | ) | |
Net increase (decrease) | | | 3,649 | | | | 29,048 | | | | 4,031 | | | | 33,677 | | | | (1,591 | ) | | | (12,360 | ) | |
Class Z shares | |
Subscriptions | | | 113,071 | | | | 964,880 | | | | 145,916 | | | | 1,220,541 | | | | 616,761 | | | | 5,026,829 | | |
Distributions reinvested | | | 5,874 | | | | 46,151 | | | | 5,503 | | | | 40,616 | | | | 22,151 | | | | 167,907 | | |
Redemptions | | | (1,578,043 | ) | | | (12,784,466 | ) | | | (2,325,700 | ) | | | (18,909,559 | ) | | | (2,764,352 | ) | | | (22,501,599 | ) | |
Net decrease | | | (1,459,098 | ) | | | (11,773,435 | ) | | | (2,174,281 | ) | | | (17,648,402 | ) | | | (2,125,440 | ) | | | (17,306,863 | ) | |
Total net decrease | | | (2,752,790 | ) | | | (22,263,571 | ) | | | (4,108,717 | ) | | | (33,477,580 | ) | | | (4,239,327 | ) | | | (34,562,344 | ) | |
(a) For the period from April 1, 2011 to January 31, 2012. During the period, the Portfolio's fiscal year end was changed from March 31 to January 31.
(b) Includes conversions of Class B shares to Class A shares, if any.
The accompanying Notes to Financial Statements are an integral part of this statement.
Annual Report 2013
15
Columbia Masters International Equity Portfolio
The following tables are intended to help you understand the Portfolio's financial performance. Certain information reflects financial results for a single share of a class held for the periods shown. Per share net investment income (loss) amounts are calculated based on average shares outstanding during the period. Total return assumes reinvestment of all dividends and distributions, if any. Total return does not reflect payment of sales charges, if any, and is not annualized for periods of less than one year.
| | | Year Ended January 31, | | Year Ended March 31, | |
Class A | | 2013 | | 2012(a) | | 2011 | | 2010 | | 2009 | | 2008 | |
Per share data | |
Net asset value, beginning of period | | $ | 7.87 | | | $ | 8.78 | | | $ | 8.24 | | | $ | 5.49 | | | $ | 11.14 | | | $ | 11.69 | | |
Income from investment operations: | |
Net investment income | | | 0.13 | | | | 0.07 | | | | 0.15 | | | | 0.27 | | | | 0.05 | | | | 0.17 | | |
Net realized and unrealized gain (loss) | | | 1.06 | | | | (0.88 | ) | | | 0.78 | | | | 2.64 | | | | (5.14 | ) | | | 0.11 | | |
Total from investment operations | | | 1.19 | | | | (0.81 | ) | | | 0.93 | | | | 2.91 | | | | (5.09 | ) | | | 0.28 | | |
Less distributions to shareholders: | |
Net investment income | | | (0.11 | ) | | | (0.10 | ) | | | (0.39 | ) | | | (0.16 | ) | | | — | | | | (0.13 | ) | |
Net realized gains | | | — | | | | — | | | | — | | | | — | | | | (0.56 | ) | | | (0.70 | ) | |
Total distributions to shareholders | | | (0.11 | ) | | | (0.10 | ) | | | (0.39 | ) | | | (0.16 | ) | | | (0.56 | ) | | | (0.83 | ) | |
Redemption fees: | |
Redemption fees added to paid-in capital | | | — | | | | — | | | | — | | | | (0.00 | )(b) | | | (0.00 | )(b) | | | (0.00 | )(b) | |
Net asset value, end of period | | $ | 8.95 | | | $ | 7.87 | | | $ | 8.78 | | | $ | 8.24 | | | $ | 5.49 | | | $ | 11.14 | | |
Total return | | | 15.40 | % | | | (9.18 | %) | | | 12.08 | % | | | 53.33 | % | | | (48.03 | %) | | | 1.76 | % | |
Ratios to average net assets(c) | |
Total gross expenses | | | 0.70 | % | | | 0.76 | %(d) | | | 0.65 | % | | | 0.53 | % | | | 0.51 | % | | | 0.47 | % | |
Total net expenses(e) | | | 0.25 | %(f) | | | 0.25 | %(d)(f) | | | 0.25 | %(f) | | | 0.25 | %(f) | | | 0.25 | %(f) | | | 0.25 | %(f) | |
Net investment income | | | 1.56 | % | | | 1.01 | %(d) | | | 1.80 | % | | | 3.50 | % | | | 0.56 | % | | | 1.39 | % | |
Supplemental data | |
Net assets, end of period (in thousands) | | $ | 19,543 | | | $ | 25,069 | | | $ | 41,237 | | | $ | 53,013 | | | $ | 44,548 | | | $ | 119,670 | | |
Portfolio turnover | | | 6 | % | | | 3 | % | | | 95 | % | | | 2 | % | | | 20 | % | | | 3 | % | |
Notes to Financial Highlights
(a) For the period from April 1, 2011 to January 31, 2012. During the period, the Portfolio's fiscal year end was changed from March 31 to January 31.
(b) Rounds to zero.
(c) In addition to the fees and expenses which the Portfolio bears directly, the Portfolio indirectly bears a pro rata share of the fees and expenses of the acquired funds in which it invests. Such indirect expenses are not included in the reported expense ratios.
(d) Annualized.
(e) Total net expenses include the impact of certain waivers/reimbursements made by the Investment Manager and certain of its affiliates, if applicable.
(f) The benefits derived from expense reductions had an impact of less than 0.01%.
The accompanying Notes to Financial Statements are an integral part of this statement.
Annual Report 2013
16
Columbia Masters International Equity Portfolio
Financial Highlights (continued)
| | | Year Ended January 31, | | Year Ended March 31, | |
Class B | | 2013 | | 2012(a) | | 2011 | | 2010 | | 2009 | | 2008 | |
Per share data | |
Net asset value, beginning of period | | $ | 7.86 | | | $ | 8.78 | | | $ | 8.20 | | | $ | 5.43 | | | $ | 11.09 | | | $ | 11.66 | | |
Income from investment operations: | |
Net investment income (loss) | | | 0.07 | | | | 0.02 | | | | 0.08 | | | | 0.21 | | | | (0.01 | ) | | | 0.07 | | |
Net realized and unrealized gain (loss) | | | 1.07 | | | | (0.89 | ) | | | 0.79 | | | | 2.62 | | | | (5.09 | ) | | | 0.12 | | |
Total from investment operations | | | 1.14 | | | | (0.87 | ) | | | 0.87 | | | | 2.83 | | | | (5.10 | ) | | | 0.19 | | |
Less distributions to shareholders: | |
Net investment income | | | (0.07 | ) | | | (0.05 | ) | | | (0.29 | ) | | | (0.06 | ) | | | — | | | | (0.06 | ) | |
Net realized gains | | | — | | | | — | | | | — | | | | — | | | | (0.56 | ) | | | (0.70 | ) | |
Total distributions to shareholders | | | (0.07 | ) | | | (0.05 | ) | | | (0.29 | ) | | | (0.06 | ) | | | (0.56 | ) | | | (0.76 | ) | |
Redemption fees: | |
Redemption fees added to paid-in capital | | | — | | | | — | | | | — | | | | (0.00 | )(b) | | | (0.00 | )(b) | | | (0.00 | )(b) | |
Net asset value, end of period | | $ | 8.93 | | | $ | 7.86 | | | $ | 8.78 | | | $ | 8.20 | | | $ | 5.43 | | | $ | 11.09 | | |
Total return | | | 14.67 | % | | | (9.86 | %) | | | 11.18 | % | | | 52.13 | % | | | (48.35 | %) | | | 1.03 | % | |
Ratios to average net assets(c) | |
Total gross expenses | | | 1.45 | % | | | 1.51 | %(d) | | | 1.40 | % | | | 1.28 | % | | | 1.26 | % | | | 1.22 | % | |
Total net expenses(e) | | | 1.00 | %(f) | | | 1.00 | %(d)(f) | | | 1.00 | %(f) | | | 1.00 | %(f) | | | 1.00 | %(f) | | | 1.00 | %(f) | |
Net investment income (loss) | | | 0.86 | % | | | 0.26 | %(d) | | | 1.05 | % | | | 2.73 | % | | | (0.18 | %) | | | 0.55 | % | |
Supplemental data | |
Net assets, end of period (in thousands) | | $ | 1,619 | | | $ | 2,028 | | | $ | 3,143 | | | $ | 3,950 | | | $ | 3,043 | | | $ | 7,490 | | |
Portfolio turnover | | | 6 | % | | | 3 | % | | | 95 | % | | | 2 | % | | | 20 | % | | | 3 | % | |
Notes to Financial Highlights
(a) For the period from April 1, 2011 to January 31, 2012. During the period, the Portfolio's fiscal year end was changed from March 31 to January 31.
(b) Rounds to zero.
(c) In addition to the fees and expenses which the Portfolio bears directly, the Portfolio indirectly bears a pro rata share of the fees and expenses of the acquired funds in which it invests. Such indirect expenses are not included in the reported expense ratios.
(d) Annualized.
(e) Total net expenses include the impact of certain waivers/reimbursements made by the Investment Manager and certain of its affiliates, if applicable.
(f) The benefits derived from expense reductions had an impact of less than 0.01%.
The accompanying Notes to Financial Statements are an integral part of this statement.
Annual Report 2013
17
Columbia Masters International Equity Portfolio
Financial Highlights (continued)
| | | Year Ended January 31, | | Year Ended March 31, | |
Class C | | 2013 | | 2012(a) | | 2011 | | 2010 | | 2009 | | 2008 | |
Per share data | |
Net asset value, beginning of period | | $ | 7.86 | | | $ | 8.77 | | | $ | 8.19 | | | $ | 5.42 | | | $ | 11.08 | | | $ | 11.66 | | |
Income from investment operations: | |
Net investment income (loss) | | | 0.07 | | | | 0.02 | | | | 0.09 | | | | 0.21 | | | | (0.02 | ) | | | 0.07 | | |
Net realized and unrealized gain (loss) | | | 1.06 | | | | (0.88 | ) | | | 0.78 | | | | 2.62 | | | | (5.08 | ) | | | 0.11 | | |
Total from investment operations | | | 1.13 | | | | (0.86 | ) | | | 0.87 | | | | 2.83 | | | | (5.10 | ) | | | 0.18 | | |
Less distributions to shareholders: | |
Net investment income | | | (0.07 | ) | | | (0.05 | ) | | | (0.29 | ) | | | (0.06 | ) | | | — | | | | (0.06 | ) | |
Net realized gains | | | — | | | | — | | | | — | | | | — | | | | (0.56 | ) | | | (0.70 | ) | |
Total distributions to shareholders | | | (0.07 | ) | | | (0.05 | ) | | | (0.29 | ) | | | (0.06 | ) | | | (0.56 | ) | | | (0.76 | ) | |
Redemption fees: | |
Redemption fees added to paid-in capital | | | — | | | | — | | | | — | | | | (0.00 | )(b) | | | (0.00 | )(b) | | | (0.00 | )(b) | |
Net asset value, end of period | | $ | 8.92 | | | $ | 7.86 | | | $ | 8.77 | | | $ | 8.19 | | | $ | 5.42 | | | $ | 11.08 | | |
Total return | | | 14.54 | % | | | (9.75 | %) | | | 11.19 | % | | | 52.22 | % | | | (48.39 | %) | | | 0.94 | % | |
Ratios to average net assets(c) | |
Total gross expenses | | | 1.46 | % | | | 1.51 | %(d) | | | 1.40 | % | | | 1.28 | % | | | 1.26 | % | | | 1.22 | % | |
Total net expenses(e) | | | 1.00 | %(f) | | | 1.00 | %(d)(f) | | | 1.00 | %(f) | | | 1.00 | %(f) | | | 1.00 | %(f) | | | 1.00 | %(f) | |
Net investment income (loss) | | | 0.81 | % | | | 0.25 | %(d) | | | 1.05 | % | | | 2.77 | % | | | (0.19 | %) | | | 0.60 | % | |
Supplemental data | |
Net assets, end of period (in thousands) | | $ | 4,286 | | | $ | 5,486 | | | $ | 8,990 | | | $ | 10,506 | | | $ | 9,087 | | | $ | 27,656 | | |
Portfolio turnover | | | 6 | % | | | 3 | % | | | 95 | % | | | 2 | % | | | 20 | % | | | 3 | % | |
Notes to Financial Highlights
(a) For the period from April 1, 2011 to January 31, 2012. During the period, the Portfolio's fiscal year end was changed from March 31 to January 31.
(b) Rounds to zero.
(c) In addition to the fees and expenses which the Portfolio bears directly, the Portfolio indirectly bears a pro rata share of the fees and expenses of the acquired funds in which it invests. Such indirect expenses are not included in the reported expense ratios.
(d) Annualized.
(e) Total net expenses include the impact of certain waivers/reimbursements made by the Investment Manager and certain of its affiliates, if applicable.
(f) The benefits derived from expense reductions had an impact of less than 0.01%.
The accompanying Notes to Financial Statements are an integral part of this statement.
Annual Report 2013
18
Columbia Masters International Equity Portfolio
Financial Highlights (continued)
| | | Year Ended January 31, | | Year Ended March 31, | |
Class R | | 2013 | | 2012(a) | | 2011 | | 2010 | | 2009 | | 2008 | |
Per share data | |
Net asset value, beginning of period | | $ | 7.85 | | | $ | 8.76 | | | $ | 8.22 | | | $ | 5.47 | | | $ | 11.12 | | | $ | 11.68 | | |
Income from investment operations: | |
Net investment income | | | 0.16 | | | | 0.07 | | | | 0.14 | | | | 0.28 | | | | 0.02 | | | | 0.15 | | |
Net realized and unrealized gain (loss) | | | 1.01 | | | | (0.90 | ) | | | 0.76 | | | | 2.59 | | | | (5.11 | ) | | | 0.09 | | |
Total from investment operations | | | 1.17 | | | | (0.83 | ) | | | 0.90 | | | | 2.87 | | | | (5.09 | ) | | | 0.24 | | |
Less distributions to shareholders: | |
Net investment income | | | (0.09 | ) | | | (0.08 | ) | | | (0.36 | ) | | | (0.12 | ) | | | — | | | | (0.10 | ) | |
Net realized gains | | | — | | | | — | | | | — | | | | — | | | | (0.56 | ) | | | (0.70 | ) | |
Total distributions to shareholders | | | (0.09 | ) | | | (0.08 | ) | | | (0.36 | ) | | | (0.12 | ) | | | (0.56 | ) | | | (0.80 | ) | |
Redemption fees: | |
Redemption fees added to paid-in capital | | | — | | | | — | | | | — | | | | (0.00 | )(b) | | | (0.00 | )(b) | | | (0.00 | )(b) | |
Net asset value, end of period | | $ | 8.93 | | | $ | 7.85 | | | $ | 8.76 | | | $ | 8.22 | | | $ | 5.47 | | | $ | 11.12 | | |
Total return | | | 15.17 | % | | | (9.36 | %) | | | 11.62 | % | | | 52.81 | % | | | (48.12 | %) | | | 1.48 | % | |
Ratios to average net assets(c) | |
Total gross expenses | | | 0.93 | % | | | 1.01 | %(d) | | | 0.90 | % | | | 0.78 | % | | | 0.76 | % | | | 0.72 | % | |
Total net expenses(e) | | | 0.50 | %(f) | | | 0.50 | %(d)(f) | | | 0.50 | %(f) | | | 0.50 | %(f) | | | 0.50 | %(f) | | | 0.50 | %(f) | |
Net investment income | | | 1.93 | % | | | 0.98 | %(d) | | | 1.75 | % | | | 3.78 | % | | | 0.26 | % | | | 1.22 | % | |
Supplemental data | |
Net assets, end of period (in thousands) | | $ | 89 | | | $ | 49 | | | $ | 20 | | | $ | 31 | | | $ | 26 | | | $ | 44 | | |
Portfolio turnover | | | 6 | % | | | 3 | % | | | 95 | % | | | 2 | % | | | 20 | % | | | 3 | % | |
Notes to Financial Highlights
(a) For the period from April 1, 2011 to January 31, 2012. During the period, the Portfolio's fiscal year end was changed from March 31 to January 31.
(b) Rounds to zero.
(c) In addition to the fees and expenses which the Portfolio bears directly, the Portfolio indirectly bears a pro rata share of the fees and expenses of the acquired funds in which it invests. Such indirect expenses are not included in the reported expense ratios.
(d) Annualized.
(e) Total net expenses include the impact of certain waivers/reimbursements made by the Investment Manager and certain of its affiliates, if applicable.
(f) The benefits derived from expense reductions had an impact of less than 0.01%.
The accompanying Notes to Financial Statements are an integral part of this statement.
Annual Report 2013
19
Columbia Masters International Equity Portfolio
Financial Highlights (continued)
| | | Year Ended January 31, | | Year Ended March 31, | |
Class Z | | 2013 | | 2012(a) | | 2011 | | 2010 | | 2009 | | 2008 | |
Per share data | |
Net asset value, beginning of period | | $ | 7.87 | | | $ | 8.78 | | | $ | 8.26 | | | $ | 5.52 | | | $ | 11.16 | | | $ | 11.70 | | |
Income from investment operations: | |
Net investment income | | | 0.14 | | | | 0.09 | | | | 0.17 | | | | 0.29 | | | | 0.07 | | | | 0.23 | | |
Net realized and unrealized gain (loss) | | | 1.08 | | | | (0.89 | ) | | | 0.78 | | | | 2.64 | | | | (5.15 | ) | | | 0.08 | | |
Total from investment operations | | | 1.22 | | | | (0.80 | ) | | | 0.95 | | | | 2.93 | | | | (5.08 | ) | | | 0.31 | | |
Less distributions to shareholders: | |
Net investment income | | | (0.13 | ) | | | (0.11 | ) | | | (0.43 | ) | | | (0.19 | ) | | | — | | | | (0.15 | ) | |
Net realized gains | | | — | | | | — | | | | — | | | | — | | | | (0.56 | ) | | | (0.70 | ) | |
Total distributions to shareholders | | | (0.13 | ) | | | (0.11 | ) | | | (0.43 | ) | | | (0.19 | ) | | | (0.56 | ) | | | (0.85 | ) | |
Redemption fees: | |
Redemption fees added to paid-in capital | | | — | | | | — | | | | — | | | | (0.00 | )(b) | | | (0.00 | )(b) | | | (0.00 | )(b) | |
Net asset value, end of period | | $ | 8.96 | | | $ | 7.87 | | | $ | 8.78 | | | $ | 8.26 | | | $ | 5.52 | | | $ | 11.16 | | |
Total return | | | 15.80 | % | | | (8.99 | %) | | | 12.28 | % | | | 53.58 | % | | | (47.84 | %) | | | 2.03 | % | |
Ratios to average net assets(c) | |
Total gross expenses | | | 0.46 | % | | | 0.51 | %(d) | | | 0.40 | % | | | 0.28 | % | | | 0.26 | % | | | 0.22 | % | |
Total net expenses(e) | | | 0.00 | %(f) | | | 0.00 | %(d)(f) | | | 0.00 | %(f) | | | 0.00 | %(f) | | | 0.00 | %(f) | | | 0.00 | %(f) | |
Net investment income | | | 1.76 | % | | | 1.23 | %(d) | | | 2.04 | % | | | 3.77 | % | | | 0.83 | % | | | 1.89 | % | |
Supplemental data | |
Net assets, end of period (in thousands) | | $ | 23,559 | | | $ | 32,187 | | | $ | 55,013 | | | $ | 69,334 | | | $ | 58,268 | | | $ | 89,568 | | |
Portfolio turnover | | | 6 | % | | | 3 | % | | | 95 | % | | | 2 | % | | | 20 | % | | | 3 | % | |
Notes to Financial Highlights
(a) For the period from April 1, 2011 to January 31, 2012. During the period, the Portfolio's fiscal year end was changed from March 31 to January 31.
(b) Rounds to zero.
(c) In addition to the fees and expenses which the Portfolio bears directly, the Portfolio indirectly bears a pro rata share of the fees and expenses of the acquired funds in which it invests. Such indirect expenses are not included in the reported expense ratios.
(d) Annualized.
(e) Total net expenses include the impact of certain waivers/reimbursements made by the Investment Manager and certain of its affiliates, if applicable.
(f) The benefits derived from expense reductions had an impact of less than 0.01%.
The accompanying Notes to Financial Statements are an integral part of this statement.
Annual Report 2013
20
Columbia Masters International Equity Portfolio
Notes to Financial Statements
January 31, 2013
Note 1. Organization
Columbia Masters International Equity Portfolio (the Portfolio), a series of Columbia Funds Series Trust (the Trust), is a diversified portfolio. The Trust is registered under the Investment Company Act of 1940, as amended (the 1940 Act), as an open-end management investment company organized as a Delaware statutory trust.
The Portfolio is a "fund-of-funds" and invests in a combination of underlying affiliated funds* for which Columbia Management Investment Advisers, LLC (Columbia Management), a wholly-owned subsidiary of Ameriprise Financial, Inc. (Ameriprise Financial), or an affiliate acts as investment manager or principal underwriter. The Portfolio may also invest in derivative instruments. Columbia Management is the Investment Manager for the underlying affiliated funds.
*For information on the goals, investment strategies and risks of the underlying funds please refer to the Portfolio's most recent prospectus and the prospectuses of the underlying funds.
Portfolio Shares
The Trust may issue an unlimited number of shares (without par value). The Portfolio offers Class A, Class B, Class C, Class R and Class Z shares. All share classes have identical voting, dividend and liquidation rights. Each share class has its own expense structure and sales charges, as applicable.
Class A shares are subject to a maximum front-end sales charge of 5.75% based on the initial investment amount. Class A shares purchased without an initial sales charge in accounts aggregating $1 million to $50 million at the time of purchase are subject to a contingent deferred sales charge (CDSC) if the shares are sold within 18 months of purchase, charged as follows: 1.00% CDSC if redeemed within 12 months of purchase, and 0.50% CDSC if redeemed more than 12, but less than 18, months after purchase.
Class B shares may be subject to a maximum CDSC of 5.00% based upon the holding period after purchase. Class B shares will generally convert to Class A shares eight years after purchase. The Portfolio no longer accepts investments by new or existing investors in the Portfolio's Class B shares, except in connection with the reinvestment of any dividend and/or capital gain distributions in Class B shares of the Portfolio and exchanges by existing Class B shareholders of certain other funds within the Columbia Family of Funds.
Class C shares are subject to a 1.00% CDSC on shares redeemed within one year of purchase.
Class R shares are not subject to sales charges and are only available to qualifying institutional investors.
Class Z shares are not subject to sales charges, and are only available to certain investors.
Note 2. Summary of Significant Accounting Policies
Use of Estimates
The preparation of financial statements in accordance with U.S. generally accepted accounting principles (GAAP) requires management to make certain estimates and assumptions that affect the reported amounts of assets and liabilities, the disclosure of contingent assets and liabilities at the date of the financial statements and the reported amounts of revenue and expenses during the reporting period. Actual results could differ from those estimates.
The following is a summary of significant accounting policies consistently followed by the Portfolio in the preparation of its financial statements.
Security Valuation
Investments in the underlying funds are valued at the net asset value of each class of the respective underlying fund determined as of the close of the New York Stock Exchange on the valuation date.
Forward foreign currency exchange contracts are marked-to-market based upon foreign currency exchange rates provided by a pricing service.
Futures and options on futures contracts are valued based upon the settlement price established each day by the board of trade or exchange on which they are traded.
Derivative Instruments
The Portfolio invests in certain derivative instruments, as detailed below, to meet its investment objectives. Derivatives are instruments whose values depend on, or are derived from, in whole or in part, the value of one or more other assets, such as securities, currencies, commodities or indices. Derivative instruments may be used to maintain cash reserves while maintaining exposure to certain other assets, to offset anticipated declines in values of investments, to facilitate trading, to reduce transaction costs and to pursue higher investment returns. The Portfolio may also use derivative instruments to mitigate certain investment risks, such as foreign currency exchange rate risk, interest rate risk and credit risk. Derivatives may involve various risks, including the potential inability of the counterparty to fulfill its obligation under the terms of the contract, the potential for an illiquid secondary market and the potential for market movements which may expose the Portfolio to gains or losses in excess of the amount shown in the Statement of Assets and Liabilities.
Annual Report 2013
21
Columbia Masters International Equity Portfolio
Notes to Financial Statements (continued)
January 31, 2013
The Portfolio and any counterparty are required to maintain an agreement that requires the Portfolio and that counterparty to monitor (on a daily basis) the net fair value of all derivatives entered into pursuant to the agreement between the Portfolio and such counterparty. If the net fair value of such derivatives between the Portfolio and that counterparty exceeds a certain threshold (as defined in the agreement), the Portfolio or the counterparty (as the case may be) is required to post cash and/or securities as collateral. Fair values of derivatives presented in the financial statements are not netted with the fair value of other derivatives or with any collateral amounts posted by the Portfolio or any counterparty.
Forward Foreign Currency Exchange Contracts
Forward foreign currency exchange contracts are agreements between two parties to buy and sell a currency at a set price on a future date. These contracts are intended to be used to minimize the exposure to foreign exchange rate fluctuations during the period between the trade and settlement dates of the contract. The Portfolio utilized forward foreign currency exchange contracts to hedge the currency exposure associated with some or all of the Portfolio's securities, to shift investment exposure from one currency to another, and to shift U.S. dollar exposure to achieve a representative weighted mix of major currencies in its benchmark, and/or to recover an underweight country exposure in its portfolio.
The values of forward foreign currency exchange contracts fluctuate with changes in foreign currency exchange rates. The Portfolio will record a realized gain or loss when the forward foreign currency exchange contract is closed.
The use of forward foreign currency exchange contracts does not eliminate fluctuations in the prices of the Portfolio's portfolio securities. The risks of forward foreign currency exchange contracts include movement in the values of the foreign currencies relative to the U.S. dollar (or other foreign currencies) and the possibility that counterparties will not complete their contractual obligations, which may be in excess of the amount reflected, if any, in the Statement of Assets and Liabilities.
Futures Contracts
Futures contracts represent commitments for the future purchase or sale of an asset at a specified price on a specified date. The Portfolio bought and sold futures contracts to manage exposure to the securities market and maintain appropriate equity market exposure while keeping sufficient cash to accommodate daily redemptions. Upon entering into futures contracts, the Portfolio bears risks which may include interest rates, exchange rates or securities prices moving unexpectedly, in which case, the Portfolio may not achieve the anticipated benefits of the futures contracts and may realize a
loss. Additional risks include counterparty credit risk, the possibility of an illiquid market, and that a change in the value of the contract or option may not correlate with changes in the value of the underlying asset.
Upon entering into a futures contract, the Portfolio pledges cash or securities with the broker in an amount sufficient to meet the initial margin requirement. Subsequent payments (variation margin) are made or received by the Portfolio each day. The variation margin payments are equal to the daily change in the contract value and are recorded as variation margin receivable or payable and are offset in unrealized gains or losses. The Portfolio recognizes a realized gain or loss when the contract is closed or expires. Futures contracts involve, to varying degrees, risk of loss in excess of the variation margin disclosed in the Statement of Assets and Liabilities.
Effects of Derivative Transactions in the Financial Statements
The following tables are intended to provide additional information about the effect of derivatives on the financial statements of the Portfolio, including: the fair value of derivatives by risk category and the location of those fair values in the Statement of Assets and Liabilities; the impact of derivative transactions on the Portfolio's operations over the period including realized gains or losses and unrealized gains or losses. The derivative schedules following the Portfolio of Investments present additional information regarding derivative instruments outstanding at the end of the period, if any.
The following table is a summary of the fair value of derivative instruments at January 31, 2013:
| | Asset Derivatives | |
Risk Exposure
Category | | Statement of Assets and
Liabilities Location | |
Fair Value ($) | |
Equity contracts
| | Net assets — unrealized
appreciation on futures
contracts | | | 30,928 | * | |
Foreign exchange
contracts
| | Unrealized appreciation on
forward foreign currency
exchange contracts | | | 203,432 | | |
Total | | | | | | | 234,360 | | |
| | Liability Derivatives | |
Risk Exposure
Category | | Statement of Assets and
Liabilities Location | |
Fair Value ($) | |
Foreign exchange
contracts
| | Unrealized depreciation on
forward foreign currency
exchange contracts | | | 442,297 | | |
*Includes cumulative appreciation (depreciation) of futures contracts as reported in the Futures Contracts Outstanding table following the Portfolio of Investments. Only the current day's variation margin is reported in receivables or payables in the Statement of Assets and Liabilities.
Annual Report 2013
22
Columbia Masters International Equity Portfolio
Notes to Financial Statements (continued)
January 31, 2013
The effect of derivative instruments in the Statement of Operations for the year ended January 31, 2013:
Amount of Realized Gain (Loss) on Derivatives Recognized in Income | |
Risk
Exposure
Category | | Forward Foreign
Currency
Exchange
Contracts ($) | | Futures
Contracts
($) | | Total ($) | |
Equity contracts | | | — | | | | 74,333 | | | | 74,333 | | |
Foreign exchange
contracts | | | (1,105,584 | ) | | | — | | | | (1,105,584 | ) | |
Total | | | (1,105,584 | ) | | | 74,333 | | | | (1,031,251 | ) | |
Change in Unrealized Appreciation (Depreciation) on Derivatives Recognized in Income | |
Risk
Exposure
Category | | Forward Foreign
Currency
Exchange
Contracts ($) | | Futures
Contracts
($) | | Total ($) | |
Equity contracts | | | — | | | | 30,928 | | | | 30,928 | | |
Foreign exchange
contracts | | | (90,442 | ) | | | — | | | | (90,442 | ) | |
Total | | | (90,442 | ) | | | 30,928 | | | | (59,514 | ) | |
The following table is a summary of the volume of derivative instruments for the year ended January 31, 2013:
Derivative Instruments | | Contracts Opened | |
Forward foreign currency exchange contracts | | | 407 | | |
Futures contracts | | | 41 | | |
Security Transactions
Security transactions are accounted for on the trade date. Cost is determined and gains (losses) are based upon the specific identification method for both financial statement and federal income tax purposes.
Income Recognition
Income and capital gain distributions from the underlying funds, if any, are recorded on the ex-dividend date.
Expenses
General expenses of the Trust are allocated to the Portfolio and other funds of the Trust based upon relative net assets or other expense allocation methodologies determined by the nature of the expense. Expenses directly attributable to the Portfolio are charged to the Portfolio. Expenses directly attributable to a specific class of shares are charged to that share class.
Determination of Class Net Asset Value
All income, expenses (other than class-specific expenses, which are charged to that share class, as shown in the Statement of Operations) and realized and unrealized gains (losses) are allocated to each class of the Portfolio on a daily
basis, based on the relative net assets of each class, for purposes of determining the net asset value of each class.
Federal Income Tax Status
The Portfolio intends to qualify each year as a regulated investment company under Subchapter M of the Internal Revenue Code, as amended, and will distribute substantially all of its taxable income (including net short-term capital gains), if any, for its tax year, and as such will not be subject to federal income taxes. In addition, the Portfolio intends to distribute in each calendar year substantially all of its net investment income, capital gains and certain other amounts, if any, such that the Portfolio should not be subject to federal excise tax. Therefore, no federal income or excise tax provision is recorded.
Distributions to Shareholders
Distributions from net investment income, if any, are declared and paid semi-annually. Net realized capital gains, if any, are distributed at least annually. Income distributions and capital gain distributions are determined in accordance with federal income tax regulations, which may differ from GAAP.
Guarantees and Indemnifications
Under the Trust's organizational documents and, in some cases, by contract, its officers and trustees are indemnified against certain liabilities arising out of the performance of their duties to the Trust or its funds. In addition, certain of the Portfolio's contracts with its service providers contain general indemnification clauses. The Portfolio's maximum exposure under these arrangements is unknown since the amount of any future claims that may be made against the Portfolio cannot be determined, and the Portfolio has no historical basis for predicting the likelihood of any such claims.
Recent Accounting Pronouncement
Disclosures about Offsetting Assets and Liabilities
In December 2011, the Financial Accounting Standards Board (FASB) issued Accounting Standards Update (ASU) No. 2011-11, Disclosures about Offsetting Assets and Liabilities. The objective of the FASB is to enhance current disclosure requirements on offsetting of certain assets and liabilities and to enable financial statement users to compare financial statements prepared under GAAP and International Financial Reporting Standards.
Specifically, ASU No. 2011-11 requires an entity to disclose both gross and net information for derivatives and other financial instruments that are subject to a master netting arrangement or similar agreement. The standard requires disclosure of collateral received in connection with the master netting agreements or similar agreements. The effective date
Annual Report 2013
23
Columbia Masters International Equity Portfolio
Notes to Financial Statements (continued)
January 31, 2013
of ASU No. 2011-11 is for interim and annual periods beginning on or after January 1, 2013. At this time, management is evaluating the implications of this guidance and the impact it will have on the financial statement amounts and footnote disclosures, if any.
Note 3. Fees and Compensation Paid to Affiliates
Investment Management Fees
Under an Investment Management Services Agreement, the Investment Manager determines which securities will be purchased, held or sold. The Portfolio does not pay the Investment Manager a direct fee for these investment management services.
In addition to the fees and expenses which the Portfolio bears directly, the Portfolio indirectly bears a pro-rata share of the fees and expenses of the underlying funds in which the Portfolio invests. Because the underlying funds have varied expense and fee levels and the Portfolio may own different proportions of underlying funds at different times, the amount of fees and expenses incurred indirectly by the Portfolio will vary.
Administration Fees
Under an Administrative Services Agreement, the Investment Manager also serves as the Portfolio Administrator. The Portfolio pays the Portfolio Administrator an annual fee for administration and accounting services equal to 0.02% of the Portfolio's average daily net assets.
Other Expenses
Other expenses are for, among other things, certain expenses of the Portfolio or the Board of Trustees (the Board), including: Portfolio boardroom and office expense, employee compensation, employee health and retirement benefits, and certain other expenses. Payment of these Portfolio and Board expenses is facilitated by a company providing limited administrative services to the Portfolio and the Board. For the year ended January 31, 2013, other expenses paid to this company were $1,208.
Compensation of Board Members
Board members are compensated for their services to the Portfolio as set forth in the Statement of Operations. Under a Deferred Compensation Plan (the Plan), the Board members who are not "interested persons" of the Portfolio as defined under the 1940 Act may elect to defer payment of up to 100% of their compensation. Deferred amounts are treated as though equivalent dollar amounts had been invested in shares of the Portfolio or certain other funds managed by the Investment Manager. The Portfolio's liability for these amounts is
adjusted for market value changes and remains in the Portfolio until distributed in accordance with the Plan.
Transfer Agent Fees
Under a Transfer and Dividend Disbursing Agent Agreement, Columbia Management Investment Services Corp. (the Transfer Agent), an affiliate of the Investment Manager and a wholly-owned subsidiary of Ameriprise Financial, is responsible for providing transfer agency services to the Portfolio. The Transfer Agent has contracted with Boston Financial Data Services (BFDS) to serve as sub-transfer agent.
The Transfer Agent receives monthly account-based service fees based on the number of open accounts and is reimbursed by the Portfolio for the fees and expenses the Transfer Agent pays to financial intermediaries that maintain omnibus accounts with the Portfolio that is a percentage of the average aggregate value of the Portfolio's shares maintained in each such omnibus account (other than omnibus accounts for which American Enterprise Investment Services Inc. is the broker of record or accounts where the beneficial shareholder is a customer of Ameriprise Financial Services, Inc., which are paid a per account fee). The Transfer Agent pays the fees of BFDS for services as sub-transfer agent and is not entitled to reimbursement for such fees from the Portfolio (with the exception of out-of-pocket fees).
The Transfer Agent also receives compensation from fees for various shareholder services and reimbursements for certain out-of-pocket fees.
For the year ended January 31, 2013, the Portfolio's effective transfer agent fee rates as a percentage of average daily net assets of each class were as follows:
Class A | | | 0.17 | % | |
Class B | | | 0.17 | | |
Class C | | | 0.17 | | |
Class R | | | 0.17 | | |
Class Z | | | 0.17 | | |
An annual minimum account balance fee of $20 may apply to certain accounts with a value below the Portfolio's initial minimum investment requirements to reduce the impact of small accounts on transfer agent fees. These minimum account balance fees are recorded as part of expense reductions in the Statement of Operations. For the year ended January 31, 2013, these minimum account balance fees reduced total expenses by $61.
Distribution and Service Fees
The Portfolio has an agreement with Columbia Management Investment Distributors, Inc. (the Distributor), an affiliate of the Investment Manager and a wholly-owned subsidiary of Ameriprise Financial, for distribution and shareholder services.
Annual Report 2013
24
Columbia Masters International Equity Portfolio
Notes to Financial Statements (continued)
January 31, 2013
Pursuant to Rule 12b-1 under the 1940 Act, the Board has approved, and the Portfolio has adopted, distribution and shareholder service plans (the Plans) which set the distribution and service fees for the Portfolio. These fees are calculated daily and are intended to compensate the Distributor and/or eligible selling and/or servicing agents for selling shares of the Portfolio and providing services to investors.
The Plans require the payment of a monthly combined distribution and service fee to the Distributor at the maximum annual rate of 0.25% of the average daily net assets attributable to Class A shares of the Portfolio. The Plans also require the payment of a monthly service fee at the maximum annual rate of 0.25% of the average daily net assets attributable to Class B and Class C shares of the Portfolio and the payment of a monthly distribution fee at the maximum annual rates of 0.75%, 0.75% and 0.50% of the average daily net assets attributable to Class B, Class C and Class R shares, respectively.
Sales Charges
Sales charges, including front-end charges and CDSCs, received by the Distributor for distributing Portfolio shares were $11,993 for Class A, $1,998 for Class B and $54 for Class C shares for the year ended January 31, 2013.
Expenses Waived/Reimbursed by the Investment Manager and its Affiliates
The Investment Manager and certain of its affiliates have contractually agreed to waive fees and/or reimburse expenses (excluding certain fees and expenses described below), through May 31, 2013, unless sooner terminated at the sole discretion of the Board, so that the Portfolio's net operating expenses, after giving effect to fees waived/expenses reimbursed and any balance credits and/or overdraft charges from the Portfolio's custodian, do not exceed the following annual rates as a percentage of the class' average daily net assets:
Class A | | | 0.25 | % | |
Class B | | | 1.00 | | |
Class C | | | 1.00 | | |
Class R | | | 0.50 | | |
Class Z | | | 0.00 | | |
Under the agreement governing these fee waivers and/or expense reimbursement arrangements, the following fees and expenses are excluded from the waiver/reimbursement commitment, and therefore will be paid by the Portfolio, if applicable: taxes (including foreign transaction taxes), expenses associated with investments in affiliated and non-affiliated
pooled investment vehicles (including mutual funds and exchange traded funds), transaction costs and brokerage commissions, costs related to any securities lending program, dividend expenses associated with securities sold short, inverse floater program fees and expenses, transaction charges and interest on borrowed money, interest, extraordinary expenses and any other expenses the exclusion of which is specifically approved by the Board. This agreement may be modified or amended only with approval from all parties.
Note 4. Federal Tax Information
The timing and character of income and capital gain distributions are determined in accordance with income tax regulations, which may differ from GAAP because of temporary or permanent book to tax differences.
At January 31, 2013, these differences are primarily due to differing treatment for capital loss carryforwards, deferral/reversal of wash sales losses, Trustees' deferred compensation, foreign currency transactions, post-October capital losses, late-year ordinary losses, re-characterization of distributions from investments and derivative investments. To the extent these differences are permanent, reclassifications are made among the components of the Portfolio's net assets in the Statement of Assets and Liabilities. Temporary differences do not require reclassifications. In the Statement of Assets and Liabilities the following reclassifications were made:
Excess of distributions over net investment income | | $ | (1,093,772 | ) | |
Accumulated net realized loss | | | 1,093,771 | | |
Paid-in capital | | | 1 | | |
Net investment income and net realized gains (losses), as disclosed in the Statement of Operations, and net assets were not affected by this reclassification.
The tax character of distributions paid during the years indicated was as follows:
| | | Year Ended
January 31,
2013 | | Period Ended
January 31,
2012 | | Year Ended
March 31,
2011 | |
Ordinary income | | $ | 748,225 | | | $ | 869,625 | | | $ | 5,730,648 | | |
Short-term capital gain distributions, if any, are considered ordinary income distributions for tax purposes.
At January 31, 2013, the components of distributable earnings on a tax basis were as follows:
Accumulated realized loss | | $ | (91,524,054 | ) | |
Unrealized appreciation | | | 1,774,674 | | |
Annual Report 2013
25
Columbia Masters International Equity Portfolio
Notes to Financial Statements (continued)
January 31, 2013
At January 31, 2013, the cost of investments for federal income tax purposes was $47,484,896 and the aggregate gross unrealized appreciation and depreciation based on that cost was:
Unrealized appreciation | | $ | 2,136,818 | | |
Unrealized depreciation | | | (362,144 | ) | |
Net unrealized appreciation | | $ | 1,774,674 | | |
The following capital loss carryforward, determined at January 31, 2013, may be available to reduce taxable income arising from future net realized gains on investments, if any, to the extent permitted by the Internal Revenue Code:
Year of Expiration | | Amount | |
2017 | | $ | 4,980,942 | | |
2018 | | | 25,984,153 | | |
2019 | | | 19,955,661 | | |
Unlimited short-term | | | 1,509,134 | | |
Unlimited long-term | | | 38,335,873 | | |
Total | | $ | 90,765,763 | | |
Unlimited capital loss carryforwards are required to be utilized prior to any capital losses which carry an expiration date. As a result of this ordering rule, capital loss carryforwards which carry an expiration date may be more likely to expire unused.
Under current tax rules, regulated investment companies can elect to treat certain late-year ordinary losses incurred and post-October capital losses (capital losses realized after October 31) as arising on the first day of the following taxable year. As of January 31, 2013, the Portfolio will elect to treat late year ordinary losses of $758,291 as arising on February 1, 2013.
Management of the Portfolio has concluded that there are no significant uncertain tax positions that would require recognition in the financial statements. However, management's conclusion may be subject to review and adjustment at a later date based on factors including, but not limited to, new tax laws, regulations, and administrative interpretations (including relevant court decisions). Generally, the Portfolio's federal tax returns for the prior three fiscal years remain subject to examination by the Internal Revenue Service.
Note 5. Portfolio Information
The cost of purchases and proceeds from sales of securities, excluding short-term obligations, aggregated to $3,115,573 and $26,492,060, respectively, for the year ended January 31, 2013.
Note 6. Shareholder Concentration
At January 31, 2013, two unaffiliated shareholder accounts owned an aggregate of 78.3% of the outstanding shares of the Portfolio . The Portfolio has no knowledge about whether any portion of those shares was owned beneficially by such accounts. Subscription and redemption activity by concentrated accounts may have a significant effect on the operations of the Portfolio .
Note 7. Line of Credit
The Portfolio has entered into a revolving credit facility with a syndicate of banks led by JPMorgan Chase Bank N.A. whereby the Portfolio may borrow for the temporary funding of shareholder redemptions or for other temporary or emergency purposes. The credit facility agreement, as amended, which is a collective agreement between the Portfolio and certain other funds managed by the Investment Manager, severally and not jointly, permits collective borrowings up to $500 million. Interest is charged to each participating fund based on its borrowings at a rate equal to the higher of (i) the overnight federal funds rate plus 1.00% or (ii) the one-month LIBOR rate plus 1.00%. Each borrowing under the credit facility matures no later than 60 days after the date of borrowing. The Portfolio also pays a commitment fee equal to its pro rata share of the amount of the credit facility at a rate of 0.08% per annum.
The Portfolio had no borrowings during the year ended January 31, 2013.
Note 8. Subsequent Events
Management has evaluated the events and transactions that have occurred through the date the financial statements were issued and noted no items requiring adjustment of the financial statements or additional disclosure.
Note 9. Information Regarding Pending and Settled Legal Proceedings
In December 2005, without admitting or denying the allegations, American Express Financial Corporation (AEFC, which is now known as Ameriprise Financial, Inc. (Ameriprise Financial)) entered into settlement agreements with the Securities and Exchange Commission (SEC) and Minnesota Department of Commerce (MDOC) related to market timing activities. As a result, AEFC was censured and ordered to cease and desist from committing or causing any violations of certain provisions of the Investment Advisers Act of 1940, the Investment Company Act of 1940, and various Minnesota laws. AEFC agreed to pay disgorgement of $10 million and civil
Annual Report 2013
26
Columbia Masters International Equity Portfolio
Notes to Financial Statements (continued)
January 31, 2013
money penalties of $7 million. AEFC also agreed to retain an independent distribution consultant to assist in developing a plan for distribution of all disgorgement and civil penalties ordered by the SEC in accordance with various undertakings detailed at www.sec.gov/litigation/admin/ia-2451.pdf. Ameriprise Financial and its affiliates have cooperated with the SEC and the MDOC in these legal proceedings, and have made regular reports to the funds' Boards of Trustees.
Ameriprise Financial and certain of its affiliates have historically been involved in a number of legal, arbitration and regulatory proceedings, including routine litigation, class actions, and governmental actions, concerning matters arising in connection with the conduct of their business activities. Ameriprise Financial believes that the Funds are not currently the subject of, and that neither Ameriprise Financial nor any of its affiliates are the subject of, any pending legal, arbitration or regulatory proceedings that are likely to have a material adverse effect on the Funds or the ability of Ameriprise Financial or its affiliates to perform under their contracts with the Funds. Ameriprise Financial is required to make 10-Q, 10-K and, as necessary, 8-K filings with the Securities and Exchange Commission on legal and regulatory matters that relate to Ameriprise Financial and its affiliates. Copies of these filings may be obtained by accessing the SEC website at www.sec.gov.
There can be no assurance that these matters, or the adverse publicity associated with them, will not result in increased fund redemptions, reduced sale of fund shares or other adverse consequences to the Funds. Further, although we believe proceedings are not likely to have a material adverse effect on the Funds or the ability of Ameriprise Financial or its affiliates to perform under their contracts with the Funds, these proceedings are subject to uncertainties and, as such, we are unable to estimate the possible loss or range of loss that may result. An adverse outcome in one or more of these proceedings could result in adverse judgments, settlements, fines, penalties or other relief that could have a material adverse effect on the consolidated financial condition or results of operations of Ameriprise Financial.
Annual Report 2013
27
Columbia Masters International Equity Portfolio
Report of Independent Registered Public Accounting Firm
To the Trustees of Columbia Funds Series Trust and the Shareholders of
Columbia Masters International Equity Portfolio
In our opinion, the accompanying statement of assets and liabilities, including the portfolio of investments, and the related statements of operations and of changes in net assets and the financial highlights present fairly, in all material respects, the financial position of Columbia Masters International Equity Portfolio (the "Portfolio") (a series of Columbia Funds Series Trust) at January 31, 2013, the results of its operations for the year then ended, the changes in its net assets for each of the two years in the period then ended and the financial highlights for each of the periods indicated, in conformity with accounting principles generally accepted in the United States of America. These financial statements and financial highlights (hereafter referred to as "financial statements") are the responsibility of the Portfolio's management. Our responsibility is to express an opinion on these financial statements based on our audits. We conducted our audits of these financial statements in accordance with the standards of the Public Company Accounting Oversight Board (United States). Those standards require that we plan and perform the audit to obtain reasonable assurance about whether the financial statements are free of material misstatement. An audit includes examining, on a test basis, evidence supporting the amounts and disclosures in the financial statements, assessing the accounting principles used and significant estimates made by management, and evaluating the overall financial statement presentation. We believe that our audits, which included confirmation of securities at January 31, 2013 by correspondence with the custodian, transfer agent and broker, provide a reasonable basis for our opinion.
PricewaterhouseCoopers LLP
Minneapolis, Minnesota
March 22, 2013
Annual Report 2013
28
Columbia Masters International Equity Portfolio
Federal Income Tax Information
(Unaudited)
The Portfolio hereby designates the following tax attributes for the fiscal year ended January 31, 2013. Shareholders will be notified in early 2014 of the amounts for use in preparing 2013 income tax returns.
Tax Designations:
| Qualified Dividend Income | | | 100.00 | % | |
Dividends Received Deduction | | | 1.03 | % | |
Foreign Taxes Paid | | $ | 64,519 | | |
Foreign Source Income | | $ | 601,459 | | |
Qualified Dividend Income. For taxable, non-corporate shareholders, the percentage of ordinary income dividends paid during the fiscal year that represents qualified dividend income subject to reduced tax rates under the Jobs and Growth Tax Relief Reconciliation Act of 2003.
Dividends Received Deduction. The percentage of ordinary income dividends paid during the fiscal year that qualifies for the corporate dividends received deduction.
Foreign Taxes. The Portfolio makes the election to pass through to shareholders the foreign taxes paid. These taxes, and the corresponding foreign source income, are provided.
Annual Report 2013
29
Columbia Masters International Equity Portfolio
Shareholders elect the Board that oversees the Funds' operations. The Board appoints officers who are responsible for day-to-day business decisions based on policies set by the Board. The following table provides basic biographical information about the Funds' Board members, including their principal occupations during the past five years, although specific titles for individuals may have varied over the period. Under current Board policy, members may serve until the next Board meeting after he or she reaches the mandatory retirement age established by the Board, or the fifteenth anniversary of the first Board meeting they attended as a member of the Board.
Mr. Edward J. Boudreau, Jr., Mr. William P. Carmichael, Mr. William A. Hawkins, Mr. R. Glenn Hilliard, Ms. Minor M. Shaw and Dr. Anthony M. Santomero, were members of the Legacy Columbia Nations Funds' Board ("Nations Funds"), which includes Columbia Funds Series Trust, Columbia Funds Variable Insurance Trust I and Columbia Funds Master Investment Trust, LLC and began service on the Board for the Legacy RiverSource Funds ("RiverSource Funds") effective June 1, 2011.
Independent Trustees
Name,
Address,
Year of Birth | | Position Held With
Funds and Length of
Service | | Principal Occupation
During Past Five Years | | Number of
Funds in the
Fund Family
Overseen by
Board Member | | Other Present or Past
Directorships/Trusteeships
(Within Past 5 Years) | |
Kathleen Blatz
901 S. Marquette Ave.
Minneapolis, MN 55402
1954 | | Board member since 1/06 for RiverSource Funds and since 6/11 for Nations Funds | | Attorney; Chief Justice, Minnesota Supreme Court, 1998-2006 | | | 152 | | | Director, BlueCross BlueShield of Minnesota since 2009 | |
Edward J. Boudreau, Jr.
901 S. Marquette Ave.
Minneapolis, MN 55402
1944 | | Board member since 6/11 for RiverSource Funds and since 1/05 for Nations Funds | | Managing Director, E.J. Boudreau & Associates (consulting) since 2000 | | | 145 | | | Former Trustee, BofA Funds Series Trust (11 funds) | |
Pamela G. Carlton
901 S. Marquette Ave.
Minneapolis, MN 55402
1954 | | Board member since 7/07 for RiverSource Funds and since 6/11 for Nations Funds | | President, Springboard — Partners in Cross Cultural Leadership (consulting company) since 2003 | | | 152 | | | None | |
William P. Carmichael
901 S. Marquette Ave.
Minneapolis, MN 55402
1943 | | Board member since 6/11 for RiverSource Funds and since 1999 for Nations Funds | | Retired | | | 145 | | | Director, Cobra Electronics Corporation (electronic equipment manufacturer); The Finish Line (athletic shoes and apparel) since July 2003; McMoRan Exploration Company (oil and gas exploration and development) since 2010; former Trustee, BofA Funds Series Trust (11 funds); former Director, Spectrum Brands, Inc. (consumer products); former Director, Simmons Company (bedding) | |
Patricia M. Flynn
901 S. Marquette Ave.
Minneapolis, MN 55402
1950 | | Board member since 11/04 for RiverSource Funds and since 6/11 for Nations Funds | | Trustee Professor of Economics and Management, Bentley University since 1976 | | | 152 | | | None | |
William A. Hawkins
901 S. Marquette Ave.
Minneapolis, MN 55402
1942 | | Board member since 6/11 for RiverSource Funds and since 1/05 for Nations Funds | | Managing Director, Overton Partners (financial consulting), since August 2010; President and Chief Executive Officer, California General Bank, N.A., January 2008-August 2010. | | | 145 | | | Trustee, BofA Funds Series Trust (11 funds) | |
Annual Report 2013
30
Columbia Masters International Equity Portfolio
Trustees and Officers (continued)
Independent Trustees (continued)
Name,
Address,
Year of Birth | | Position Held With
Funds and Length of
Service | | Principal Occupation
During Past Five Years | | Number of
Funds in the
Fund Family
Overseen by
Board Member | | Other Present or Past
Directorships/Trusteeships
(Within Past 5 Years) | |
R. Glenn Hilliard
901 S. Marquette Ave.
Minneapolis, MN 55402
1943 | | Board member since 6/11 for RiverSource Funds and since 1/05 for Nations Funds | | Chairman and Chief Executive Officer, Hilliard Group LLC (investing and consulting), since April 2003; Non-Executive Director & Chairman, CNO Financial Group, Inc. (insurance), September 2003-May 2011 | | | 145 | | | Chairman, BofA Fund Series Trust (11 funds); former Director, CNO Financial Group, Inc. (insurance) | |
Stephen R. Lewis, Jr.
901 S. Marquette Ave.
Minneapolis, MN 55402
1939 | | Chair of the Board for RiverSource Funds since 1/07, Board member for RiverSource Funds since 1/02 and since 6/11 for Nations Funds | | President Emeritus and Professor of Economics Emeritus, Carleton College since 2002 | | | 152 | | | Director, Valmont Industries, Inc. (manufactures irrigation systems) since 2002 | |
Catherine James Paglia
901 S. Marquette Ave.
Minneapolis, MN 55402
1952 | | Board member since 11/04 for RiverSource Funds and since 6/11 for Nations Funds | | Director, Enterprise Asset Management, Inc. (private real estate and asset management company) | | | 152 | | | Director, Valmont Industries, Inc. (manufacturer of irrigation systems) since 2012 | |
Leroy C. Richie
901 S. Marquette Ave.
Minneapolis, MN 55402
1941 | | Board member since 2000 for Legacy Seligman Funds, since 11/08 for RiverSource Funds and since 6/11 for Nations Funds | | Counsel, Lewis & Munday, P.C. (law firm) since 2004; former Vice President and General Counsel, Automotive Legal Affairs, Chrysler Corporation, 1983-1997 | | | 152 | | | Lead Outside Director, Digital Ally, Inc. (digital imaging) since September 2005; Director, Infinity, Inc. (oil and gas exploration and production) since 1994; Director, OGE Energy Corp. (energy and energy services) since November 2007 | |
Minor M. Shaw
901 S. Marquette Ave.
Minneapolis, MN 55402
1947 | | Board member since 6/11 for RiverSource Funds and since 2003 for Nations Funds | | President, Micco LLC (private investments) since 2011; President, Micco Corp. since 1998 | | | 145 | | | Director, Piedmont Natural Gas; Director, BlueCross BlueShield of South Carolina since April 2008; Former Trustee, BofA Funds Series Trust (11 funds) | |
Alison Taunton-Rigby
901 S. Marquette Ave.
Minneapolis, MN 55402
1944 | | Board member since 11/02 for RiverSource Funds and since 6/11 for Nations Funds | | Chief Executive Officer and Director, RiboNovix, Inc., 2003-2010 (biotechnology) | | | 152 | | | Director, Healthways, Inc. (health and well-being improvement) since 2005; Director, ICI Mutual Insurance Company, RRG since 2011; Director, Abt Associates (government contractor) since 2001; Director, Boston Children's Hospital since 2002 | |
Annual Report 2013
31
Columbia Masters International Equity Portfolio
Trustees and Officers (continued)
Interested Trustee Not Affiliated With Investment Manager*
Name,
Address,
Year of Birth | | Position Held With
Funds and Length of
Service | | Principal Occupation
During Past Five Years | | Number of
Funds in the
Fund Family
Overseen by
Board Member | | Other Present or Past
Directorships/Trusteeships
(Within Past 5 Years) | |
Anthony M. Santomero
901 S. Marquette Ave.
Minneapolis, MN 55402
1946 | | Board member since 6/11 for RiverSource Funds and since 1/08 for Nations Funds | | Richard K. Mellon Professor Emeritus of Finance, The Wharton School, University of Pennsylvania, since 2002; Senior Advisor, McKinsey & Company (consulting), 2006-2008 | | | 145 | | | Director, Renaissance Reinsurance Ltd. since May 2008; Trustee, Penn Mutual Life Insurance Company since March 2008; Director, Citigroup since 2009; Director, Citibank, N.A. since 2009; former Trustee, BofA Funds Series Trust (11 funds) | |
*Dr. Santomero is not an affiliated person of the investment manager or Ameriprise Financial. However, he is currently deemed by the Funds to be an "interested person" (as defined in the 1940 Act) of the Funds because he serves as a Director of Citigroup, Inc. and Citibank N.A., companies that may directly or through subsidiaries and affiliates engage from time-to-time in brokerage execution, principal transactions and lending relationships with the Funds or accounts advised/managed by the investment manager.
Interested Trustee Affiliated With Investment Manager*
Name,
Address,
Year of Birth | | Position Held With
Funds and Length of
Service | | Principal Occupation
During Past Five Years | | Number of
Funds in the
Fund Family
Overseen by
Board Member | | Other Present or Past
Directorships/Trusteeships
(Within Past 5 Years) | |
William F. Truscott
53600 Ameriprise
Financial Center
Minneapolis, MN 55474
1960 | | Board member since 11/01 for RiverSource Funds and since 6/11 for Nations Funds; Senior Vice President since 2002 for RiverSource Funds and 5/10 for Nations Funds | | President, Columbia Management Investment Advisers, LLC since February 2012, (previously President, Chairman of the Board and Chief Investment Officer, 2001-April 2010); Chief Executive Officer, Global Asset Management, Ameriprise Financial, Inc. since September 2012 (previously Chief Executive Officer, U.S. Asset Management & President, Annuities, May 2010-September 2012 and President — U.S. Asset Management and Chief Investment Officer, 2005-April 2010); Chief Executive Officer, Columbia Management Investment Distributors, Inc. since February 2012, (previously Chairman of the Board and Chief Executive Officer, 2006-April 2010); Chairman of the Board and Chief Executive Officer, RiverSource Distributors, Inc. since 2006; President and Chief Executive Officer, Ameriprise Certificate Company 2006-August 2012 | | | 204 | | | Chairman of the Board, Columbia Management Investment Advisers, LLC since May 2010; Director, Columbia Management Investment Distributors, Inc. since May 2010; Director, Ameriprise Certificate Company, 2006-January 2013 | |
*Interested person (as defined under the 1940 Act) by reason of being an officer, director, security holder and/or employee of the investment manager or Ameriprise Financial.
The SAI has additional information about the Portfolio's Board members and is available, without charge, upon request by calling 800.345.6611; contacting your financial intermediary; or visiting columbiamanagement.com.
Annual Report 2013
32
Columbia Masters International Equity Portfolio
Trustees and Officers (continued)
The Board has appointed officers who are responsible for day-to-day business decisions based on policies it has established. The officers serve at the pleasure of the Board. In addition to Mr. Truscott, who is Senior Vice President, the Funds' other officers are:
Officers
Name,
Address,
Year of Birth | | Position Held With
Funds and Length of
Service | | Principal Occupation During Past Five Years | |
J. Kevin Connaughton
225 Franklin Street
Boston, MA 02110
1964 | | President and Principal Executive Officer since 5/10 for RiverSource Funds and 2009 for Nations Funds | | Senior Vice President and General Manager — Mutual Fund Products, Columbia Management Investment Advisers, LLC since May 2010; Managing Director of Columbia Management Advisors, LLC, December 2004-April 2010; Senior Vice President and Chief Financial Officer, Columbia Funds, June 2008-January 2009; Treasurer, Columbia Funds, October 2003-May 2008 | |
Amy K. Johnson
5228 Ameriprise Financial Center Minneapolis, MN 55474
1965 | | Vice President since 12/06 for RiverSource Funds and 5/10 for Nations Funds | | Senior Vice President and Chief Operating Officer, Columbia Management Investment Advisers, LLC since May 2010 (previously Chief Administrative Officer, 2009-April 2010 and Vice President — Asset Management and Trust Company Services, 2006-2009) | |
Michael G. Clarke
225 Franklin Street
Boston, MA 02110
1969 | | Treasurer since 1/11 and Chief Financial Officer since 4/11 RiverSource Funds and Treasurer since 3/11 and Chief Financial Officer since 2009 for Nations Funds | | Vice President, Columbia Management Investment Advisers, LLC since May 2010; Managing Director of Fund Administration, Columbia Management Advisors, LLC, September 2004-April 2010; senior officer of Columbia Funds and affiliated funds since 2002 | |
Scott R. Plummer
5228 Ameriprise Financial Center Minneapolis, MN 55474
1959 | | Senior Vice President and Chief Legal Officer since 12/06 and Assistant Secretary since 6/11 for RiverSource Funds and Senior Vice President and Chief Legal Officer since 5/10 and Assistant Secretary since 6/11 for Nations Funds | | Senior Vice President, Chief Legal Officer and Assistant Secretary, Columbia Management Investment Advisers, LLC since June 2005; Vice President and Lead Chief Counsel — Asset Management, Ameriprise Financial, Inc. since May 2010 (previously Vice President and Chief Counsel — Asset Management, 2005-April 2010); Vice President, Chief Counsel and Assistant Secretary, Columbia Management Investment Distributors, Inc. since 2008; Vice President, General Counsel and Secretary, Ameriprise Certificate Company since 2005; Chief Counsel, RiverSource Distributors, Inc. since 2006 | |
Colin Moore
225 Franklin Street
Boston, MA 02110
1958 | | Senior Vice President since 5/10 for RiverSource Funds and Nations Funds | | Director and Chief Investment Officer, Columbia Management Investment Advisers, LLC since May 2010; Manager, Managing Director and Chief Investment Officer, Columbia Management Advisors, LLC, 2007-April 2010 | |
Thomas P. McGuire
225 Franklin Street
Boston, MA 02110
1972 | | Chief Compliance Officer since 3/12 | | Vice President — Asset Management Compliance, Columbia Management Investment Advisers, LLC since 2010; Chief Compliance Officer, Ameriprise Certificate Company since September 2010; Compliance Executive, Bank of America, 2005-2010 | |
Stephen T. Welsh
225 Franklin Street
Boston, MA 02110
1957 | | Vice President since 4/11 for RiverSource Funds and 2006 for Nations Funds | | President and Director, Columbia Management Investment Services Corp. since May 2010; President and Director, Columbia Management Services, Inc., July 2004- April 2010; Managing Director, Columbia Management Distributors, Inc., August 2007-April 2010 | |
Christopher O. Petersen
5228 Ameriprise Financial Center Minneapolis, MN 55474
1970 | | Vice President and Secretary since 4/11 for RiverSource Funds and 3/11 for Nations Funds | | Vice President and Chief Counsel, Ameriprise Financial, Inc. since January 2010 (formerly Vice President and Group Counsel or Counsel, April 2004-January 2010); Assistant Secretary of Legacy RiverSource Funds, January 2007-April 2011 and of the Nations Funds, May 2010-March 2011 | |
Annual Report 2013
33
Columbia Masters International Equity Portfolio
Trustees and Officers (continued)
Officers (continued)
Name,
Address,
Year of Birth | | Position Held With
Funds and Length of
Service | | Principal Occupation During Past Five Years | |
Paul D. Pearson
10468 Ameriprise Financial Center Minneapolis, MN 55474
1956 | | Vice President since 4/11 and Assistant Treasurer since 1999 for RiverSource Funds and Vice President and Assistant Treasurer since 6/11 for Nations Funds | | Vice President — Investment Accounting, Columbia Management Investment Advisers, LLC, since May 2010; Vice President — Managed Assets, Investment Accounting, Ameriprise Financial Corporation, February 1998-May 2010 | |
Joseph F. DiMaria
225 Franklin Street
Boston, MA 02110
1968 | | Vice President and Chief Accounting Officer since 4/11 and Vice President since 3/11 and Chief Accounting Officer since 2008 for Nations Funds | | Vice President, Mutual Fund Administration, Columbia Management Investment Advisers, LLC, since May 2010; Director of Fund Administration, Columbia Management Advisors, LLC, January 2006-April 2010 | |
Paul B. Goucher
100 Park Avenue
New York, NY 10017
1968 | | Vice President since 4/11 and Assistant Secretary since 11/08 for RiverSource Funds and 5/10 for Nations Funds | | Vice President and Lead Chief Counsel, Ameriprise Financial, Inc. since November 2008 and January 2013, respectively (formerly, Chief Counsel, January 2010-January 2013 and Group Counsel from November 2008-January 2010); Director, Managing Director and General Counsel, J. & W. Seligman & Co. Incorporated, July 2008-November 2008 (previously, Managing Director and Associate General Counsel, January 2005-July 2008) | |
Michael E. DeFao
225 Franklin Street
Boston, MA 02110
1968 | | Vice President since 4/11 and Assistant Secretary since 5/10 for RiverSource Funds and 2011 for Nations Funds | | Vice President and Chief Counsel, Ameriprise Financial, Inc. since May 2010; Associate General Counsel, Bank of America, June 2005-April 2010 | |
Annual Report 2013
34
This page intentionally left blank.
Annual Report 2013
35
This page intentionally left blank.
Annual Report 2013
36
Columbia Masters International Equity Portfolio
Important Information About This Report
Each fund mails one shareholder report to each shareholder address. If you would like more than one report, please call shareholder services at 800.345.6611 and additional reports will be sent to you.
The policy of the Board is to vote the proxies of the companies in which each fund holds investments consistent with the procedures as stated in the Statement of Additional Information (SAI). You may obtain a copy of the SAI without charge by calling 800.345.6611; contacting your financial intermediary; visiting columbiamanagement.com; or searching the website of the Securities and Exchange Commission (SEC) at sec.gov. Information regarding how each fund voted proxies relating to portfolio securities is filed with the SEC by August 31 for the most recent 12-month period ending June 30 of that year, and is available without charge by visiting columbiamanagement.com; or searching the website of the SEC at sec.gov.
Each fund files a complete schedule of portfolio holdings with the SEC for the first and third quarters of each fiscal year on Form N-Q. Each fund's Form N-Q is available on the SEC's website at sec.gov and may be reviewed and copied at the SEC's Public Reference Room in Washington, D.C. Information on the operation of the Public Reference Room may be obtained by calling 800.SEC.0330. Each fund's complete schedule of portfolio holdings, as filed on Form N-Q, can also be obtained without charge, upon request, by calling 800.345.6611.
Annual Report 2013
37

Columbia Masters International Equity Portfolio
P.O. Box 8081
Boston, MA 02266-8081
columbiamanagement.com
This information is for use with concurrent or prior delivery of a fund prospectus. Please read and consider the investment objectives, risks, charges and expenses for any fund carefully before investing. For a prospectus which contains this and other important information about the Portfolio go to columbiamanagement.com. The Portfolio is distributed by Columbia Management Investment Distributors, Inc., member FINRA, and managed by Columbia Management Investment Advisers, LLC.
© 2013 Columbia Management Investment Advisers, LLC. All rights reserved.
ANN193_01_C01_(03/13)
Annual Report
January 31, 2013

Columbia LifeGoal® Income Portfolio
Not FDIC insured • No bank guarantee • May lose value
Columbia LifeGoal® Income Portfolio
 Dear Shareholders,
U.S. stocks flat, foreign markets strong in 2012 finale
After a strong third quarter, U.S. stock market averages treaded water as the year2012 came to a close. However, they ended the year up strongly, as first and third quarter gains more than offset second and fourth quarter weakness. Typically a strong quarter for domestic small- and mid-cap issues, the fourth quarter of 2012 indeed proved to be another year-end positive for small-cap stocks. For the full calendar year 2012, the S&P 500 Index rose 16.00%.
Stock markets outside the United States generated some of the best returns for the fourth quarter, as optimism rebounded, thanks to the September actions of the European Central Bank in support of the euro and an improving outlook from China. Both developed and emerging foreign markets topped U.S. stocks by a solid margin.
Corporate and emerging markets led fixed income
Fixed-income investors took their cue from the equity markets and continued to favor the highest risk sectors through the end of the year2012. Global fixed-income returns posted mixed results in the final quarter of the year. Gains were the highest for corporate high-yield and emerging market bonds. Although investors remained cautious ahead of the year-end budget negotiations, better economic data and a further improvement in the European sovereign debt crisis supported riskier assets and depressed government bond prices. In December, the Federal Reserve announced its intention to continue to purchase both Treasury and mortgage-backed securities and said that it would seek to keep short-term interest rates unchanged until the unemployment rate reaches 6.5%, or inflation turned noticeably higher.
Stay on track with Columbia Management
Backed by more than 100 years of experience, Columbia Management is one of the nation's largest asset managers. At the heart of our success — and, most importantly, that of our investors — are highly talented industry professionals, brought together by a unique way of working. We are dedicated to helping you take advantage of today's opportunities and anticipate tomorrow's. We stay abreast of the latest investment trends and ideas, using our collective insight to evaluate events and transform them into solutions you can use.
Visit columbiamanagement.com for:
> The Columbia Management Perspectives blog, featuring timely posts by our investment teams
> Detailed up-to-date fund performance and portfolio information
> Economic analysis and market commentary
> Quarterly fund commentaries
> Columbia Management Investor, our award-winning quarterly newsletter for shareholders
Thank you for your continued support of the Columbia Funds. We look forward to serving your investment needs for many years to come.
Best Regards,

J. Kevin Connaughton
President, Columbia Funds
The S&P 500 Index, an unmanaged index, measures the performance of 500 widely held, large-capitalization U.S. stocks and is frequently used as a general measure of market performance. Indices are not available for investment, are not professionally managed and do not reflect sales charges, fees, brokerage commissions, taxes or other expenses of investing.
Investors should consider the investment objectives, risks, charges and expenses of a mutual fund carefully before investing. For a free prospectus, which contains this and other important information about a fund, visit columbiamanagement.com. The prospectus should be read carefully before investing.
Columbia Funds are distributed by Columbia Management Investment Distributors, Inc., member FINRA, and managed by Columbia Management Investment Advisers, LLC.
© 2013 Columbia Management Investment Advisers, LLC. All rights reserved.
Columbia LifeGoal® Income Portfolio
Performance Overview | | | 2 | | |
Manager Discussion of Portfolio Performance | | | 4 | | |
Understanding Your Portfolio's Expenses | | | 6 | | |
Portfolio of Investments | | | 7 | | |
Statement of Assets and Liabilities | | | 11 | | |
Statement of Operations | | | 13 | | |
Statement of Changes in Net Assets | | | 14 | | |
Financial Highlights | | | 16 | | |
Notes to Financial Statements | | | 20 | | |
Report of Independent Registered
Public Accounting Firm | | | 26 | | |
Federal Income Tax Information | | | 27 | | |
Trustees and Officers | | | 28 | | |
Shareholder Meeting Results | | | 33 | | |
Important Information About This Report | | | 37 | | |
Portfolio Investment Manager
Columbia Management Investment
Advisers, LLC
225 Franklin Street
Boston, MA 02110
Portfolio Distributor
Columbia Management Investment
Distributors, Inc.
225 Franklin Street
Boston, MA 02110
Portfolio Transfer Agent
Columbia Management Investment
Services Corp.
P.O. Box 8081
Boston, MA 02266-8081
For more information about any of the funds, please visit columbiamanagement.com or call 800.345.6611. Customer Service Representatives are available to answer your questions Monday through Friday from 8 a.m. to 8 p.m. Eastern time.
The views expressed in this report reflect the current views of the respective parties. These views are not guarantees of future performance and involve certain risks, uncertainties and assumptions that are difficult to predict, so actual outcomes and results may differ significantly from the views expressed. These views are subject to change at any time based upon economic, market or other conditions and the respective parties disclaim any responsibility to update such views. These views may not be relied on as investment advice and, because investment decisions for a Columbia Fund are based on numerous factors, may not be relied on as an indication of trading intent on behalf of any particular Columbia Fund. References to specific securities should not be construed as a recommendation or investment advice.
Columbia LifeGoal® Income Portfolio
Performance Summary
> Columbia LifeGoal® Income Portfolio (the Portfolio) Class A shares returned 5.17% excluding sales charges for the 12-month period ended January 31, 2013.
> The Portfolio outperformed its benchmark, the Barclays U.S. Aggregate 1-3 Years Index, which returned 0.99% during the same 12-month period.
> The Portfolio also outperformed its Blended Index, which returned 3.47% for the same time frame.
> We attribute the Portfolio's strong relative performance to its effective fixed income sector positioning overall.
Average Annual Total Returns (%) (for period ended January 31, 2013)
| | Inception | | 1 Year | | 5 Years | | Life | |
Class A | | 09/04/03 | | | | | | | | | | | | | |
Excluding sales charges | | | | | | | 5.17 | | | | 5.00 | | | | 4.72 | | |
Including sales charges | | | | | | | 1.78 | | | | 4.30 | | | | 4.34 | | |
Class B | | 09/04/03 | | | | | | | |
Excluding sales charges | | | | | | | 4.40 | | | | 4.20 | | | | 3.92 | | |
Including sales charges | | | | | | | 1.40 | | | | 4.20 | | | | 3.92 | | |
Class C* | | 09/05/03 | | | | | | | |
Excluding sales charges | | | | | | | 4.40 | | | | 4.20 | | | | 3.93 | | |
Including sales charges | | | | | | | 3.40 | | | | 4.20 | | | | 3.93 | | |
Class Z | | 09/04/03 | | | 5.43 | | | | 5.28 | | | | 4.98 | | |
Barclays U.S. Aggregate 1-3 Years Index | | | | | | | 0.99 | | | | 2.72 | | | | 3.30 | | |
Blended Index | | | | | | | 3.47 | | | | 4.48 | | | | 4.59 | | |
Returns for Class A are shown with and without the maximum initial sales charge of 3.25%. Returns for Class B are shown with and without the applicable contingent deferred sales charge (CDSC) of 3.00% in the first year, declining to 1.00% in the sixth year and eliminated thereafter. Returns for Class C are shown with and without the 1.00% CDSC for the first year only. The Portfolio's other classes are not subject to sales charges and have limited eligibility. Please see the Portfolio's prospectuses for details. Performance for different share classes will vary based on differences in sales charges and fees associated with each class. All results shown assume reinvestment of distributions during the period. Returns do not reflect the deduction of taxes that a shareholder may pay on Portfolio distributions or on the redemption of Portfolio shares. Performance results reflect the effect of any fee waivers or reimbursements of Portfolio expenses by Columbia Management Investment Advisers, LLC and/or any of its affiliates. Absent these fee waivers or expense reimbursement arrangements, performance results would have been lower.
The performance information shown represents past performance and is not a guarantee of future results. The investment return and principal value of your investment will fluctuate so that your shares, when redeemed, may be worth more or less than their original cost. Current performance may be lower or higher than the performance information shown. You may obtain performance information current to the most recent month-end by contacting your financial intermediary, visiting columbiamanagement.com or calling 800.345.6611.
*The returns shown for periods prior to the share class inception date (including returns for the Life of the Portfolio, if shown, which are since Portfolio inception) include the returns of the Portfolio's oldest share class. Since the Portfolio launched more than one share class at its inception, Class A shares were used. These returns are adjusted to reflect any higher class-related operating expenses of the newer share classes, as applicable. Please visit columbiamanagement.com/mutual-funds/appended-performance for more information.
The Barclays U.S. Aggregate 1-3 Years Index is an index of publicly-issued investment-grade corporate, U.S. Treasury and government agency securities with remaining maturities of one to three years.
The Blended Index consists of 80% Barclays U.S. Aggregate 1-3 Years Index and 20% Barclays U.S. Corporate High Yield Bond Index.
Annual Report 2013
2
Columbia LifeGoal® Income Portfolio
Performance Overview (continued)
Performance of a Hypothetical $10,000 Investment (September 4, 2003 – January 31, 2013)
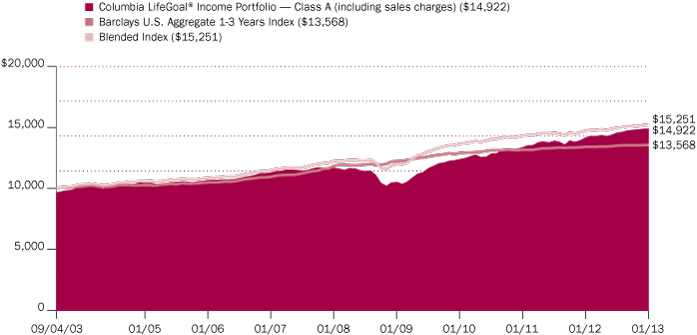
The chart above shows the change in value of a hypothetical $10,000 investment in Class A shares of Columbia LifeGoal® Income Portfolio during the stated time period, and does not reflect the deduction of taxes that a shareholder may pay on Portfolio distributions or on the redemption of Portfolio shares.
Annual Report 2013
3
Columbia LifeGoal® Income Portfolio
Manager Discussion of Portfolio Performance
At a Joint Special Meeting of Shareholders held on February 27, 2013, shareholders of Columbia LifeGoal Income Portfolio approved a proposal to merge the Portfolio with and into Columbia Capital Allocation Conservative Portfolio (formerly known as Columbia Portfolio Builder Conservative Fund). The reorganization is expected to occur on or about April 26, 2013.
For the 12-month period that ended January 31, 2013, the Portfolio's Class A shares returned 5.17% excluding sales charges. The Portfolio outperformed its benchmark, the Barclays U.S. Aggregate 1-3 Years Index, which returned 0.99% for the same 12-month period. The Portfolio also outperformed its Blended Index, comprised 80% of the Barclays U.S. Aggregate 1-3 Years Index and 20% of the Barclays U.S. Corporate High Yield Bond Index, which returned 3.47% for the same time period. We attribute the Portfolio's strong relative performance to its effective fixed income sector positioning overall.
Financial Markets Advanced Despite Market Gyrations
A rally in financial markets spanned the annual period, however it was not without a healthy dose of skepticism and market gyrations along the way. From the beginning of the annual period in February 2012 through early April 2012, global equity prices advanced at a brisk pace. Conversely, most core fixed income sectors lost ground during these months. Then, from early April 2012 through early June 2012, the equity markets corrected significantly. Concerns had surfaced around political negotiations in Washington, D.C., and worries heightened about the pace of economic growth in Europe and China and geopolitical turmoil in the Middle East. In the U.S., economic data lost momentum as a disappointing series of payroll reports, sentiment indicators, Institute for Supply Management (ISM) manufacturing figures and inflation all exhibited cautionary readings. Bond investors also turned more cautious, with most fixed income sectors posting single-digit gains and conservative U.S. Treasuries were among the strongest performers.
From early June 2012 through the remainder of the annual period ended January 31, 2013, riskier assets performed strongly. U.S. equities enjoyed double-digit gains. Bonds generated more mixed performance given improving investor sentiment. The Barclays U.S. Aggregate Bond Index, a broad measure for core bonds across the U.S. market, rose just less than 1% from the start of June 2012 through the end of January 2013. However, two areas that bucked the muted trend in the fixed income markets were U.S. high yield corporate bonds and emerging market bonds, which each posted gains of more than 12% from early June 2012 through the end of January 2013. The strong performance by riskier assets during these months was driven by several factors but included the European Central Bank's indication that it would do "whatever it takes" to preserve the currency union; the resolution of the U.S. presidential elections; improved U.S. housing, export and consumer spending data; seemingly stabilized economic growth in China; and anticipation of policies to be implemented by Japan's newly-elected prime minister Shinzo Abe. Further, stronger global economic growth overall, a cheaper U.S. dollar and a continued decline in borrowing costs contributed to a more favorable outlook for corporate profitability in the U.S.
Portfolio Management
Colin Moore, AIIMR
Anwiti Bahugana, Ph.D.
Melda Mergen, CFA, CAIA
Marie Schofield, CFA
Beth Vanney, CFA
Portfolio Breakdown (%)
(at January 31, 2013) | |
Alternative Investments | | | 6.0 | | |
Fixed-Income Funds | | | 83.5 | | |
Convertible | | | 5.0 | | |
Emerging Markets | | | 4.4 | | |
High Yield | | | 10.0 | | |
International | | | 4.5 | | |
Investment Grade | | | 59.6 | | |
Inflation-Indexed Bonds | | | 4.9 | | |
Money Market Funds | | | 5.6 | | |
Total | | | 100.0 | | |
Percentages indicated are based upon total investments.
Annual Report 2013
4
Columbia LifeGoal® Income Portfolio
Manager Discussion of Portfolio Performance (continued)
Effective Fixed Income Sector Positioning Boosted Results
Areas that contributed favorably to the Portfolio's relative returns during the annual period overall included investments in underlying funds focused on U.S. high yield corporate bonds, emerging market bonds and convertible, or hybrid, securities. The Portfolio's exposure to alternative assets, via underlying funds employing absolute return strategies, added value as well. There were no significant detractors from the Portfolio's relative results during the annual period.
Various Factors Drove Portfolio Changes
Changes within the Portfolio can be driven by active trading, by directing allocations to select market segments or by market appreciation or depreciation within a given market segment. During the annual period, the Portfolio's allocation to short-duration corporate bonds and to U.S. Treasury securities, via underlying funds, increased, while its weightings in mortgage-backed securities and investment grade corporate bonds broadly, via underlying funds, decreased.
Annual Report 2013
5
Columbia LifeGoal® Income Portfolio
Understanding Your Portfolio's Expenses
(Unaudited)
As an investor, you incur two types of costs. There are transaction costs, which generally include sales charges on purchases and may include redemption fees. There are also ongoing costs, which generally include management fees, distribution and service (Rule 12b-1) fees, and other portfolio expenses. The following information is intended to help you understand your ongoing costs (in dollars) of investing in the Portfolio and to help you compare these costs with the ongoing costs of investing in other mutual funds.
Analyzing Your Portfolio's Expenses
To illustrate these ongoing costs, we have provided examples and calculated the expenses paid by investors in each share class of the Portfolio during the period. The actual and hypothetical information in the table is based on an initial investment of $1,000 at the beginning of the period indicated and held for the entire period. Expense information is calculated two ways and each method provides you with different information. The amount listed in the "Actual" column is calculated using the Portfolio's actual operating expenses and total return for the period. You may use the Actual information, together with the amount invested, to estimate the expenses that you paid over the period. Simply divide your account value by $1,000 (for example, an $8,600 account value divided by $1,000 = 8.6), then multiply the results by the expenses paid during the period under the Actual column. The amount listed in the "Hypothetical" column assumes a 5% annual rate of return before expenses (which is not the Portfolio's actual return) and then applies the Portfolio's actual expense ratio for the period to the hypothetical return. You should not use the hypothetical account values and expenses to estimate either your actual account balance at the end of the period or the expenses you paid during the period. See "Compare With Other Funds" below for details on how to use the hypothetical data.
In addition to the ongoing expenses which the Portfolio bears directly, the Portfolio's shareholders indirectly bear the Portfolio's allocable share of the costs and expenses of each underlying fund in which the Portfolio invests. You can also estimate the effective expenses paid during the period, which includes the indirect fees associated with investing in the underlying funds, by using the amounts listed in the effective expenses paid during the period column.
Compare With Other Funds
Since all mutual funds are required to include the same hypothetical calculations about expenses in shareholder reports, you can use this information to compare the ongoing cost of investing in the Portfolio with other funds. To do so, compare the hypothetical example with the 5% hypothetical examples that appear in the shareholder reports of other funds. As you compare hypothetical examples of other funds, it is important to note that hypothetical examples are meant to highlight the ongoing costs of investing in a fund only and do not reflect any transaction costs, such as sales charges, or redemption or exchange fees. Therefore, the hypothetical calculations are useful in comparing ongoing costs only, and will not help you determine the relative total costs of owning different funds. If transaction costs were included in these calculations, your costs would be higher.
August 1, 2012 – January 31, 2013
| | Account Value at the
Beginning of the
Period ($) | | Account Value at
the End of the
Period ($) | | Expenses Paid During
the Period ($) | | Portfolio's
Annualized
Expense
Ratio (%) | | Effective Expenses
Paid During the
Period ($) | | Portfolio's
Effective
Annualized
Expense
Ratio (%) | |
| | Actual | | Hypothetical | | Actual | | Hypothetical | | Actual | | Hypothetical | | Actual | | Actual | | Hypothetical | | Actual | |
Class A | | | 1,000.00 | | | | 1,000.00 | | | | 1,022.60 | | | | 1,022.47 | | | | 2.69 | | | | 2.69 | | | | 0.53 | | | | 5.24 | | | | 5.24 | | | | 1.03 | | |
Class B | | | 1,000.00 | | | | 1,000.00 | | | | 1,018.80 | | | | 1,018.65 | | | | 6.55 | | | | 6.55 | | | | 1.29 | | | | 9.08 | | | | 9.08 | | | | 1.79 | | |
Class C | | | 1,000.00 | | | | 1,000.00 | | | | 1,018.80 | | | | 1,018.65 | | | | 6.55 | | | | 6.55 | | | | 1.29 | | | | 9.08 | | | | 9.08 | | | | 1.79 | | |
Class Z | | | 1,000.00 | | | | 1,000.00 | | | | 1,023.90 | | | | 1,023.73 | | | | 1.42 | | | | 1.42 | | | | 0.28 | | | | 3.97 | | | | 3.97 | | | | 0.78 | | |
Expenses paid during the period are equal to the Portfolio's annualized expense ratio for each class as indicated above, multiplied by the average account value over the period and then multiplied by the number of days in the Portfolio's most recent fiscal half year and divided by 366.
Effective expenses paid during the period and the Portfolio's effective annualized expense ratio include expenses borne directly to the class plus the Portfolio's pro rata portion of the ongoing expenses charged by the underlying funds using the expense ratio of each class of the underlying funds as of the underlying fund's most recent shareholder report.
Had Columbia Management Investment Advisers, LLC and/or certain of its affiliates not waived/reimbursed certain fees and expenses, account value at the end of the period would have been reduced.
Annual Report 2013
6
Columbia LifeGoal® Income Portfolio
Portfolio of Investments
January 31, 2013
(Percentages represent value of investments compared to net assets)
Fixed-Income Funds 84.0%
| | | Shares | | Value ($) | |
Convertible 5.0% | |
Columbia Convertible Securities Fund,
Class I Shares(a) | | | 80,803 | | | | 1,271,039 | | |
Emerging Markets 4.5% | |
Columbia Emerging Markets Bond Fund,
Class I Shares(a) | | | 89,887 | | | | 1,134,377 | | |
High Yield 10.0% | |
Columbia Income Opportunities Fund,
Class I Shares(a) | | | 252,926 | | | | 2,557,079 | | |
International 4.5% | |
Columbia International Bond Fund,
Class I Shares(a) | | | 98,725 | | | | 1,142,246 | | |
Investment Grade 60.0% | |
Columbia Corporate Income Fund,
Class I Shares(a) | | | 121,606 | | | | 1,271,995 | | |
Columbia Limited Duration Credit Fund,
Class I Shares(a) | | | 503,216 | | | | 5,087,520 | | |
Columbia Short Term Bond Fund,
Class I Shares(a) | | | 253,577 | | | | 2,535,770 | | |
Columbia U.S. Government Mortgage Fund,
Class I Shares(a) | | | 682,588 | | | | 3,822,491 | | |
Columbia U.S. Treasury Index Fund,
Class I Shares(a) | | | 222,707 | | | | 2,538,856 | | |
Total | | | | | 15,256,632 | | |
Total Fixed-Income Funds
(Cost: $19,857,093) | | | | | 21,361,373 | | |
Alternative Investments 6.0% | |
Columbia Absolute Return Currency
and Income Fund, Class I Shares(a) | | | 74,469 | | | | 760,323 | | |
Columbia Absolute Return Multi-Strategy
Fund, Class I Shares(a) | | | 75,949 | | | | 763,291 | | |
Total Alternative Investments
(Cost: $1,510,536) | | | | | 1,523,614 | | |
Inflation-Indexed Bonds 4.9%
Issuer | | Coupon
Rate | | Principal
Amount ($) | | Value ($) | |
U.S. Treasury Inflation-Indexed Bond
01/15/21 | | | 1.125 | % | | | 36,835 | | | | 43,108 | | |
04/15/29 | | | 3.875 | % | | | 140,043 | | | | 228,062 | | |
01/15/25 | | | 2.375 | % | | | 183,202 | | | | 244,690 | | |
02/15/40 | | | 2.125 | % | | | 63,909 | | | | 91,150 | | |
07/15/13 | | | 1.875 | % | | | 81,477 | | | | 83,246 | | |
01/15/14 | | | 2.000 | % | | | 99,677 | | | | 103,275 | | |
01/15/15 | | | 1.625 | % | | | 132,626 | | | | 141,910 | | |
01/15/16 | | | 2.000 | % | | | 92,795 | | | | 103,641 | | |
07/15/17 | | | 2.625 | % | | | 72,202 | | | | 86,851 | | |
01/15/19 | | | 2.125 | % | | | 107,229 | | | | 130,409 | | |
Total Inflation-Indexed Bonds
(Cost: $1,105,356) | | | | | | | 1,256,342 | | |
Money Market Funds 5.6% | |
| | | | | Shares | | Value ($) | |
BofA Cash Reserves, Capital
Class, 0.100%(b) | | 1,270,098 | | 1,270,098 | |
Columbia Short-Term Cash Fund,
0.132%(a)(b) | | 159,165 | | 159,165 | |
Total Money Market Funds
(Cost: $1,429,263) | | | | | | | 1,429,263 | | |
Total Investments
(Cost: $23,902,248) | | | | | | | 25,570,592 | | |
Other Assets and Liabilities | | | | | | | (130,539 | ) | |
Net Assets | | | | | | | 25,440,053 | | |
The accompanying Notes to Financial Statements are an integral part of this statement.
Annual Report 2013
7
Columbia LifeGoal® Income Portfolio
Portfolio of Investments (continued)
January 31, 2013
Notes to Portfolio of Investments
(a) As defined in the Investment Company Act of 1940, an affiliated company is one in which the Portfolio owns 5% or more of its outstanding voting securities, or a company which is under common ownership or control with the Portfolio. Holdings and transactions in these affiliated companies during the year ended January 31, 2013, are as follows:
Issuer | | Beginning
Cost ($) | | Purchase
Cost ($) | | Proceeds
From Sales ($) | | Realized
Gain/Loss ($) | | Ending
Cost ($) | | Capital Gain
Distributions ($) | | Dividends
or Interest
Income ($) | | Value ($) | |
Columbia Absolute
Return Currency
and Income Fund,
Class I Shares | | | 780,460 | | | | 148,596 | | | | (175,744 | ) | | | 554 | | | | 753,866 | | | | 18,188 | | | | — | | | | 760,323 | | |
Columbia
Absolute Return
Multi-Strategy Fund,
Class I Shares | | | 791,207 | | | | 140,860 | | | | (175,237 | ) | | | (160 | ) | | | 756,670 | | | | — | | | | 9,746 | | | | 763,291 | | |
Columbia
Convertible
Securities Fund,
Class I Shares | | | 969,212 | | | | 348,578 | | | | (504,421 | ) | | | 20,468 | | | | 833,837 | | | | — | | | | 46,351 | | | | 1,271,039 | | |
Columbia Corporate
Income Fund,
Class I Shares | | | 3,599,292 | | | | 241,473 | | | | (2,784,138 | ) | | | 123,102 | | | | 1,179,729 | | | | 27,201 | | | | 49,013 | | | | 1,271,995 | | |
Columbia Emerging
Markets Bond Fund,
Class I Shares | | | 1,044,901 | | | | 395,829 | | | | (440,372 | ) | | | 15,352 | | | | 1,015,710 | | | | 7,842 | | | | 67,513 | | | | 1,134,377 | | |
Columbia Income
Opportunities Fund,
Class I Shares | | | 2,205,712 | | | | 530,460 | | | | (796,619 | ) | | | 23,317 | | | | 1,962,870 | | | | — | | | | 157,888 | | | | 2,557,079 | | |
Columbia
International
Bond Fund,
Class I Shares | | | 1,178,689 | | | | 252,357 | | | | (335,600 | ) | | | 3,056 | | | | 1,098,502 | | | | — | | | | 23,843 | | | | 1,142,246 | | |
Columbia Limited
Duration Credit
Fund, Class I
Shares | | | 2,913,015 | | | | 3,294,944 | | | | (1,173,232 | ) | | | 5,178 | | | | 5,039,905 | | | | 83,152 | | | | 128,769 | | | | 5,087,520 | | |
Columbia Short
Term Bond Fund,
Class I Shares | | | 2,574,908 | | | | 423,024 | | | | (559,784 | ) | | | 2,224 | | | | 2,440,372 | | | | — | | | | 40,678 | | | | 2,535,770 | | |
Columbia
Short-Term Cash
Fund | | | 17,826 | | | | 221,870 | | | | (80,531 | ) | | | — | | | | 159,165 | | | | — | | | | 118 | | | | 159,165 | | |
Columbia
U.S. Government
Mortgage Fund,
Class I Shares | | | 2,950,620 | | | | 1,639,337 | | | | (910,799 | ) | | | 5,599 | | | | 3,684,757 | | | | 78,065 | | | | 130,561 | | | | 3,822,491 | | |
Columbia
U.S. Treasury
Index Fund,
Class I Shares | | | 124,693 | | | | 3,080,346 | | | | (599,296 | ) | | | (4,332 | ) | | | 2,601,411 | | | | 76,197 | | | | 37,797 | | | | 2,538,856 | | |
Mortgage- and
Asset-Backed
Portfolio | | | 3,497,244 | | | | — | | | | (3,637,126 | ) | | | 139,882 | | | | — | | | | — | | | | — | | | | — | | |
Total | | | 22,647,779 | | | | 10,717,674 | | | | (12,172,899 | ) | | | 334,240 | | | | 21,526,794 | | | | 290,645 | | | | 692,277 | | | | 23,044,152 | | |
The accompanying Notes to Financial Statements are an integral part of this statement.
Annual Report 2013
8
Columbia LifeGoal® Income Portfolio
Portfolio of Investments (continued)
January 31, 2013
(b) The rate shown is the seven-day current annualized yield at January 31, 2013.
Fair Value Measurements
Generally accepted accounting principles (GAAP) require disclosure regarding the inputs and valuation techniques used to measure fair value and any changes in valuation inputs or techniques. In addition, investments shall be disclosed by major category.
The Portfolio categorizes its fair value measurements according to a three-level hierarchy that maximizes the use of observable inputs and minimizes the use of unobservable inputs by prioritizing that the most observable input be used when available. Observable inputs are those that market participants would use in pricing an investment based on market data obtained from sources independent of the reporting entity. Unobservable inputs are those that reflect the Portfolio's assumptions about the information market participants would use in pricing an investment. An investment's level within the fair value hierarchy is based on the lowest level of any input that is deemed significant to the asset or liability's fair value measurement. The input levels are not necessarily an indication of the risk or liquidity associated with investments at that level. For example, certain U.S. government securities are generally high quality and liquid, however, they are reflected as Level 2 because the inputs used to determine fair value may not always be quoted prices in an active market.
Fair value inputs are summarized in the three broad levels listed below:
> Level 1 — Valuations based on quoted prices for investments in active markets that the Portfolio has the ability to access at the measurement date (including NAV for open-end mutual funds). Valuation adjustments are not applied to Level 1 investments.
> Level 2 — Valuations based on other significant observable inputs (including quoted prices for similar securities, interest rates, prepayment speeds, credit risks, etc.).
> Level 3 — Valuations based on significant unobservable inputs (including the Portfolio's own assumptions and judgment in determining the fair value of investments).
Inputs that are used in determining fair value of an investment may include price information, credit data, volatility statistics, and other factors. These inputs can be either observable or unobservable. The availability of observable inputs can vary between investments, and is affected by various factors such as the type of investment, and the volume and level of activity for that investment or similar investments in the marketplace. The inputs will be considered by the Investment Manager, along with any other relevant factors in the calculation of an investment's fair value. The Portfolio uses prices and inputs that are current as of the measurement date, which may include periods of market dislocations. During these periods, the availability of prices and inputs may be reduced for many investments. This condition could cause an investment to be reclassified between the various levels within the hierarchy.
Investments falling into the Level 3 category are primarily supported by quoted prices from brokers and dealers participating in the market for those investments. However, these may be classified as Level 3 investments due to lack of market transparency and corroboration to support these quoted prices. Additionally, valuation models may be used as the pricing source for any remaining investments classified as Level 3. These models rely on one or more significant unobservable inputs and/or significant assumptions by the Investment Manager. Inputs used in valuations may include, but are not limited to, financial statement analysis, capital account balances, discount rates and estimated cash flows, and comparable company data.
Under the direction of the Portfolio's Board of Trustees (the Board), the Investment Manager's Valuation Committee (the Committee) is responsible for carrying out the valuation procedures approved by the Board. The Committee consists of voting and non-voting members from various groups within the Investment Manager's organization, including operations and accounting, trading and investments, compliance, risk management and legal.
The Committee meets at least monthly to review and approve valuation matters, which may include a description of specific valuation determinations, data regarding pricing information received from approved pricing vendors and brokers and the results of Board-approved valuation control policies and procedures (the Policies). The Policies address, among other things, instances when market quotations are readily available, including recommendations of third party pricing vendors and a determination of appropriate pricing methodologies; events that require specific valuation determinations and assessment of fair value techniques; securities with a potential for stale pricing, including those that are illiquid, restricted, or in default; and the effectiveness of third-party pricing vendors, including periodic reviews of vendors. The Committee meets more frequently, as needed, to discuss additional valuation matters, which may include the need to review back-testing results, review time-sensitive information or approve related valuation actions. The Committee reports to the Board, with members of the Committee meeting with the Board at each of its regularly scheduled meetings to discuss valuation matters and actions during the period, similar to those described earlier.
For investments categorized as Level 3, the Committee monitors information similar to that described above, which may include: (i) data specific to the issuer or comparable issuers, (ii) general market or specific sector news and (iii) quoted prices and specific or similar security transactions. The Committee considers this data and any changes from prior periods in order to assess the reasonableness of observable and unobservable inputs, any assumptions or internal models used to value those securities and changes in fair value. This data is also used to corroborate, when available, information received from approved pricing vendors and brokers. Various factors impact the frequency of monitoring this information (which may occur as often as daily). However, the Committee may determine that changes to inputs, assumptions and models are not required as a result of the monitoring procedures performed.
The accompanying Notes to Financial Statements are an integral part of this statement.
Annual Report 2013
9
Columbia LifeGoal® Income Portfolio
Portfolio of Investments (continued)
January 31, 2013
Fair Value Measurements (continued)
The following table is a summary of the inputs used to value the Portfolio's investments at January 31, 2013:
Description | | Level 1
Quoted Prices in Active
Markets for Identical
Assets ($) | | Level 2
Other Significant
Observable Inputs ($) | | Level 3
Significant
Unobservable Inputs ($) | | Total ($) | |
Mutual Funds | |
Fixed-Income Funds | | | 21,361,373 | | | | — | | | | — | | | | 21,361,373 | | |
Alternative Investments | | | 1,523,614 | | | | — | | | | — | | | | 1,523,614 | | |
Money Market Funds | | | 1,429,263 | | | | — | | | | — | | | | 1,429,263 | | |
Total Mutual Funds | | | 24,314,250 | | | | — | | | | — | | | | 24,314,250 | | |
Bonds | |
Inflation-Indexed Bonds | | | — | | | | 1,256,342 | | | | — | | | | 1,256,342 | | |
Total Bonds | | | — | | | | 1,256,342 | | | | — | | | | 1,256,342 | | |
Total | | | 24,314,250 | | | | 1,256,342 | | | | — | | | | 25,570,592 | | |
See the Portfolio of Investments for all investment classifications not indicated in the table.
The Portfolio's assets assigned to the Level 2 input category are generally valued using the market approach, in which a security's value is determined through reference to prices and information from market transactions for similar or identical assets.
There were no transfers of financial assets between Levels 1 and 2 during the period.
The accompanying Notes to Financial Statements are an integral part of this statement.
Annual Report 2013
10
Columbia LifeGoal® Income Portfolio
Statement of Assets and Liabilities
January 31, 2013
Assets | |
Investments, at value | |
Unaffiliated issuers (identified cost $2,375,454) | | $ | 2,526,440 | | |
Affiliated issuers (identified cost $21,526,794) | | | 23,044,152 | | |
Total investments (identified cost $23,902,248) | | | 25,570,592 | | |
Receivable for: | |
Investments sold | | | 31,424 | | |
Capital shares sold | | | 61,650 | | |
Dividends | | | 36,793 | | |
Interest | | | 3,026 | | |
Prepaid expenses | | | 1,398 | | |
Other assets | | | 12,982 | | |
Total assets | | | 25,717,865 | | |
Liabilities | |
Payable for: | |
Investments purchased | | | 36,771 | | |
Capital shares purchased | | | 96,079 | | |
Investment management fees | | | 19 | | |
Distribution and/or service fees | | | 292 | | |
Transfer agent fees | | | 6,546 | | |
Administration fees | | | 14 | | |
Compensation of board members | | | 47,518 | | |
Expense reimbursement due to Investment Manager | | | 90,573 | | |
Total liabilities | | | 277,812 | | |
Net assets applicable to outstanding capital stock | | $ | 25,440,053 | | |
Represented by | |
Paid-in capital | | $ | 24,627,506 | | |
Excess of distributions over net investment income | | | (28,798 | ) | |
Accumulated net realized loss | | | (826,999 | ) | |
Unrealized appreciation (depreciation) on: | |
Investments — unaffiliated issuers | | | 150,986 | | |
Investments — affiliated issuers | | | 1,517,358 | | |
Total — representing net assets applicable to outstanding capital stock | | $ | 25,440,053 | | |
The accompanying Notes to Financial Statements are an integral part of this statement.
Annual Report 2013
11
Columbia LifeGoal® Income Portfolio
Statement of Assets and Liabilities (continued)
January 31, 2013
Class A | |
Net assets | | $ | 15,554,724 | | |
Shares outstanding | | | 1,454,821 | | |
Net asset value per share | | $ | 10.69 | | |
Maximum offering price per share(a) | | $ | 11.05 | | |
Class B | |
Net assets | | $ | 1,300,786 | | |
Shares outstanding | | | 121,927 | | |
Net asset value per share | | $ | 10.67 | | |
Class C | |
Net assets | | $ | 5,467,050 | | |
Shares outstanding | | | 512,865 | | |
Net asset value per share | | $ | 10.66 | | |
Class Z | |
Net assets | | $ | 3,117,493 | | |
Shares outstanding | | | 291,398 | | |
Net asset value per share | | $ | 10.70 | | |
(a) The maximum offering price is calculated by dividing the net asset value by 1.0 minus the maximum sales charge of 3.25%.
The accompanying Notes to Financial Statements are an integral part of this statement.
Annual Report 2013
12
Columbia LifeGoal® Income Portfolio
Statement of Operations
Year Ended January 31, 2013
Net investment income | |
Income: | |
Dividends — unaffiliated issuers | | $ | 2,283 | | |
Dividends — affiliated issuers | | | 692,277 | | |
Interest | | | 25,612 | | |
Total income | | | 720,172 | | |
Expenses: | |
Investment management fees | | | 6,817 | | |
Distribution and/or service fees | |
Class A | | | 41,504 | | |
Class B | | | 18,866 | | |
Class C | | | 55,118 | | |
Transfer agent fees | |
Class A | | | 31,777 | | |
Class B | | | 3,582 | | |
Class C | | | 10,539 | | |
Class Z | | | 6,055 | | |
Administration fees | | | 5,431 | | |
Compensation of board members | | | 13,650 | | |
Custodian fees | | | 10,278 | | |
Printing and postage fees | | | 27,941 | | |
Registration fees | | | 64,570 | | |
Professional fees | | | 17,745 | | |
Other | | | 10,067 | | |
Total expenses | | | 323,940 | | |
Fees waived or expenses reimbursed by Investment Manager and its affiliates | | | (131,072 | ) | |
Total net expenses | | | 192,868 | | |
Net investment income | | | 527,304 | | |
Realized and unrealized gain (loss) — net | |
Net realized gain (loss) on: | |
Investments — affiliated issuers | | | 334,240 | | |
Capital gain distributions from underlying affiliated funds | | | 290,645 | | |
Net realized gain | | | 624,885 | | |
Net change in unrealized appreciation (depreciation) on: | |
Investments — unaffiliated issuers | | | 21,750 | | |
Investments — affiliated issuers | | | 155,488 | | |
Net change in unrealized appreciation (depreciation) | | | 177,238 | | |
Net realized and unrealized gain | | | 802,123 | | |
Net increase in net assets resulting from operations | | $ | 1,329,427 | | |
The accompanying Notes to Financial Statements are an integral part of this statement.
Annual Report 2013
13
Columbia LifeGoal® Income Portfolio
Statement of Changes in Net Assets
| | | Year Ended
January 31,
2013 | | Year Ended
January 31,
2012(a) | | Year Ended
March 31,
2011 | |
Operations | |
Net investment income | | $ | 527,304 | | | $ | 590,005 | | | $ | 752,770 | | |
Net realized gain | | | 624,885 | | | | 801,810 | | | | 1,484,121 | | |
Net change in unrealized appreciation (depreciation) | | | 177,238 | | | | (284,613 | ) | | | (384,859 | ) | |
Net increase in net assets resulting from operations | | | 1,329,427 | | | | 1,107,202 | | | | 1,852,032 | | |
Distributions to shareholders | |
Net investment income | |
Class A | | | (467,586 | ) | | | (384,069 | ) | | | (392,912 | ) | |
Class B | | | (36,190 | ) | | | (82,017 | ) | | | (131,848 | ) | |
Class C | | | (115,096 | ) | | | (113,159 | ) | | | (110,683 | ) | |
Class Z | | | (97,912 | ) | | | (63,575 | ) | | | (110,974 | ) | |
Net realized gains | |
Class A | | | (53,020 | ) | | | — | | | | — | | |
Class B | | | (4,557 | ) | | | — | | | | — | | |
Class C | | | (18,026 | ) | | | — | | | | — | | |
Class Z | | | (10,521 | ) | | | — | | | | — | | |
Total distributions to shareholders | | | (802,908 | ) | | | (642,820 | ) | | | (746,417 | ) | |
Increase (decrease) in net assets from capital stock activity | | | (1,595,424 | ) | | | (802,053 | ) | | | (4,776,128 | ) | |
Total decrease in net assets | | | (1,068,905 | ) | | | (337,671 | ) | | | (3,670,513 | ) | |
Net assets at beginning of year | | | 26,508,958 | | | | 26,846,629 | | | | 30,517,142 | | |
Net assets at end of year | | $ | 25,440,053 | | | $ | 26,508,958 | | | $ | 26,846,629 | | |
Undistributed (excess of distributions over) net investment income | | $ | (28,798 | ) | | $ | (10,474 | ) | | $ | 34,279 | | |
(a) For the period from April 1, 2011 to January 31, 2012. During the period, the Portfolio's fiscal year end was changed from March 31 to January 31.
The accompanying Notes to Financial Statements are an integral part of this statement.
Annual Report 2013
14
Columbia LifeGoal® Income Portfolio
Statement of Changes in Net Assets (continued)
| | | Year Ended January 31,
2013 | | Year Ended January 31,
2012(a) | | Year Ended March 31,
2011 | |
| | | Shares | | Dollars ($) | | Shares | | Dollars ($) | | Shares | | Dollars ($) | |
Capital stock activity | |
Class A shares | |
Subscriptions(b) | | | 404,610 | | | | 4,291,625 | | | | 452,484 | | | | 4,687,854 | | | | 371,656 | | | | 3,740,809 | | |
Distributions reinvested | | | 27,174 | | | | 289,454 | | | | 18,917 | | | | 195,877 | | | | 24,375 | | | | 243,966 | | |
Redemptions | | | (476,988 | ) | | | (5,085,383 | ) | | | (253,477 | ) | | | (2,632,181 | ) | | | (465,982 | ) | | | (4,705,202 | ) | |
Net increase (decrease) | | | (45,204 | ) | | | (504,304 | ) | | | 217,924 | | | | 2,251,550 | | | | (69,951 | ) | | | (720,427 | ) | |
Class B shares | |
Subscriptions | | | 4,647 | | | | 49,238 | | | | 23,131 | | | | 238,641 | | | | 32,959 | | | | 327,934 | | |
Distributions reinvested | | | 1,655 | | | | 17,582 | | | | 2,123 | | | | 21,964 | | | | 6,838 | | | | 68,016 | | |
Redemptions(b) | | | (141,215 | ) | | | (1,497,339 | ) | | | (277,747 | ) | | | (2,873,945 | ) | | | (246,160 | ) | | | (2,471,808 | ) | |
Net decrease | | | (134,913 | ) | | | (1,430,519 | ) | | | (252,493 | ) | | | (2,613,340 | ) | | | (206,363 | ) | | | (2,075,858 | ) | |
Class C shares | |
Subscriptions | | | 72,920 | | | | 778,168 | | | | 129,828 | | | | 1,342,556 | | | | 148,916 | | | | 1,491,426 | | |
Distributions reinvested | | | 7,521 | | | | 79,894 | | | | 5,302 | | | | 54,730 | | | | 6,200 | | | | 61,918 | | |
Redemptions | | | (99,350 | ) | | | (1,056,588 | ) | | | (118,508 | ) | | | (1,223,947 | ) | | | (204,206 | ) | | | (2,043,283 | ) | |
Net increase (decrease) | | | (18,909 | ) | | | (198,526 | ) | | | 16,622 | | | | 173,339 | | | | (49,090 | ) | | | (489,939 | ) | |
Class Z shares | |
Subscriptions | | | 169,161 | | | | 1,802,511 | | | | 121,024 | | | | 1,261,821 | | | | 278,353 | | | | 2,786,284 | | |
Distributions reinvested | | | 6,254 | | | | 66,691 | | | | 2,321 | | | | 24,036 | | | | 3,017 | | | | 30,252 | | |
Redemptions | | | (124,241 | ) | | | (1,331,277 | ) | | | (183,451 | ) | | | (1,899,459 | ) | | | (432,823 | ) | | | (4,306,440 | ) | |
Net increase (decrease) | | | 51,174 | | | | 537,925 | | | | (60,106 | ) | | | (613,602 | ) | | | (151,453 | ) | | | (1,489,904 | ) | |
Total net decrease | | | (147,852 | ) | | | (1,595,424 | ) | | | (78,053 | ) | | | (802,053 | ) | | | (476,857 | ) | | | (4,776,128 | ) | |
(a) For the period from April 1, 2011 to January 31, 2012. During the period, the Portfolio's fiscal year end was changed from March 31 to January 31.
(b) Includes conversions of Class B shares to Class A shares, if any.
The accompanying Notes to Financial Statements are an integral part of this statement.
Annual Report 2013
15
Columbia LifeGoal® Income Portfolio
The following tables are intended to help you understand the Portfolio's financial performance. Certain information reflects financial results for a single share of a class held for the periods shown. Per share net investment income (loss) amounts are calculated based on average shares outstanding during the period. Total return assumes reinvestment of all dividends and distributions. Total return does not reflect payment of sales charges, if any, and is not annualized for periods of less than one year.
| | | Year Ended January 31, | | Year Ended March 31, | |
Class A | | 2013 | | 2012(a) | | 2011 | | 2010 | | 2009 | | 2008 | |
Per share data | |
Net asset value, beginning of period | | $ | 10.49 | | | $ | 10.31 | | | $ | 9.90 | | | $ | 8.58 | | | $ | 9.83 | | | $ | 10.22 | | |
Income from investment operations: | |
Net investment income | | | 0.23 | | | | 0.26 | | | | 0.29 | | | | 0.36 | | | | 0.38 | | | | 0.44 | | |
Net realized and unrealized gain (loss) | | | 0.31 | | | | 0.20 | | | | 0.41 | | | | 1.31 | | | | (1.19 | ) | | | (0.38 | ) | |
Total from investment operations | | | 0.54 | | | | 0.46 | | | | 0.70 | | | | 1.67 | | | | (0.81 | ) | | | 0.06 | | |
Less distributions to shareholders: | |
Net investment income | | | (0.30 | ) | | | (0.28 | ) | | | (0.29 | ) | | | (0.35 | ) | | | (0.40 | ) | | | (0.43 | ) | |
Net realized gains | | | (0.04 | ) | | | — | | | | — | | | | — | | | | (0.04 | ) | | | (0.02 | ) | |
Total distributions to shareholders | | | (0.34 | ) | | | (0.28 | ) | | | (0.29 | ) | | | (0.35 | ) | | | (0.44 | ) | | | (0.45 | ) | |
Net asset value, end of period | | $ | 10.69 | | | $ | 10.49 | | | $ | 10.31 | | | $ | 9.90 | | | $ | 8.58 | | | $ | 9.83 | | |
Total return | | | 5.17 | % | | | 4.56 | % | | | 7.21 | % | | | 19.77 | % | | | (8.37 | %) | | | 0.60 | % | |
Ratios to average net assets(b)(c) | |
Total gross expenses | | | 1.02 | % | | | 1.24 | %(d)(e) | | | 1.24 | % | | | 1.25 | % | | | 1.06 | % | | | 1.14 | % | |
Total net expenses(f) | | | 0.54 | % | | | 0.58 | %(d)(e) | | | 0.67 | % | | | 0.67 | % | | | 0.67 | % | | | 0.67 | %(g) | |
Net investment income | | | 2.12 | % | | | 3.00 | %(d) | | | 2.93 | % | | | 3.78 | % | | | 4.40 | % | | | 4.34 | % | |
Supplemental data | |
Net assets, end of period (in thousands) | | $ | 15,555 | | | $ | 15,736 | | | $ | 13,214 | | | $ | 13,390 | | | $ | 11,281 | | | $ | 13,941 | | |
Portfolio turnover | | | 40 | % | | | 66 | % | | | 109 | % | | | 35 | % | | | 51 | % | | | 24 | % | |
Notes to Financial Highlights
(a) For the period from April 1, 2011 to January 31, 2012. During the period, the Portfolio's fiscal year end was changed from March 31 to January 31.
(b) In addition to the fees and expenses which the Portfolio bears directly, the Portfolio indirectly bears a pro rata share of the fees and expenses of the acquired funds in which it invests. Such indirect expenses are not included in the reported expense ratios.
(c) Certain line items from prior years have been reclassified to conform to the current presentation.
(d) Annualized.
(e) Ratios include line of credit interest expense which rounds to less than 0.01%.
(f) Total net expenses include the impact of certain waivers/reimbursements made by the Investment Manager and certain of its affiliates, if applicable.
(g) The benefits derived from expense reductions had an impact of less than 0.01%.
The accompanying Notes to Financial Statements are an integral part of this statement.
Annual Report 2013
16
Columbia LifeGoal® Income Portfolio
Financial Highlights (continued)
| | | Year Ended January 31, | | Year Ended March 31, | |
Class B | | 2013 | | 2012(a) | | 2011 | | 2010 | | 2009 | | 2008 | |
Per share data | |
Net asset value, beginning of period | | $ | 10.47 | | | $ | 10.29 | | | $ | 9.89 | | | $ | 8.56 | | | $ | 9.82 | | | $ | 10.21 | | |
Income from investment operations: | |
Net investment income | | | 0.14 | | | | 0.19 | | | | 0.22 | | | | 0.28 | | | | 0.31 | | | | 0.36 | | |
Net realized and unrealized gain (loss) | | | 0.32 | | | | 0.21 | | | | 0.40 | | | | 1.33 | | | | (1.20 | ) | | | (0.37 | ) | |
Total from investment operations | | | 0.46 | | | | 0.40 | | | | 0.62 | | | | 1.61 | | | | (0.89 | ) | | | (0.01 | ) | |
Less distributions to shareholders: | |
Net investment income | | | (0.22 | ) | | | (0.22 | ) | | | (0.22 | ) | | | (0.28 | ) | | | (0.33 | ) | | | (0.36 | ) | |
Net realized gains | | | (0.04 | ) | | | — | | | | — | | | | — | | | | (0.04 | ) | | | (0.02 | ) | |
Total distributions to shareholders | | | (0.26 | ) | | | (0.22 | ) | | | (0.22 | ) | | | (0.28 | ) | | | (0.37 | ) | | | (0.38 | ) | |
Net asset value, end of period | | $ | 10.67 | | | $ | 10.47 | | | $ | 10.29 | | | $ | 9.89 | | | $ | 8.56 | | | $ | 9.82 | | |
Total return | | | 4.40 | % | | | 3.91 | % | | | 6.31 | % | | | 19.04 | % | | | (9.17 | %) | | | (0.15 | %) | |
Ratios to average net assets(b)(c) | |
Total gross expenses | | | 1.74 | % | | | 1.95 | %(d)(e) | | | 1.99 | % | | | 2.00 | % | | | 1.81 | % | | | 1.89 | % | |
Total net expenses(f) | | | 1.29 | % | | | 1.33 | %(d)(e) | | | 1.42 | % | | | 1.42 | % | | | 1.42 | % | | | 1.42 | %(g) | |
Net investment income | | | 1.35 | % | | | 2.24 | %(d) | | | 2.16 | % | | | 3.02 | % | | | 3.66 | % | | | 3.58 | % | |
Supplemental data | |
Net assets, end of period (in thousands) | | $ | 1,301 | | | $ | 2,690 | | | $ | 5,242 | | | $ | 7,079 | | | $ | 7,467 | | | $ | 8,849 | | |
Portfolio turnover | | | 40 | % | | | 66 | % | | | 109 | % | | | 35 | % | | | 51 | % | | | 24 | % | |
Notes to Financial Highlights
(a) For the period from April 1, 2011 to January 31, 2012. During the period, the Portfolio's fiscal year end was changed from March 31 to January 31.
(b) In addition to the fees and expenses which the Portfolio bears directly, the Portfolio indirectly bears a pro rata share of the fees and expenses of the acquired funds in which it invests. Such indirect expenses are not included in the reported expense ratios.
(c) Certain line items from prior years have been reclassified to conform to the current presentation.
(d) Annualized.
(e) Ratios include line of credit interest expense which rounds to less than 0.01%.
(f) Total net expenses include the impact of certain waivers/reimbursements made by the Investment Manager and certain of its affiliates, if applicable.
(g) The benefits derived from expense reductions had an impact of less than 0.01%.
The accompanying Notes to Financial Statements are an integral part of this statement.
Annual Report 2013
17
Columbia LifeGoal® Income Portfolio
Financial Highlights (continued)
| | | Year Ended January 31, | | Year Ended March 31, | |
Class C | | 2013 | | 2012(a) | | 2011 | | 2010 | | 2009 | | 2008 | |
Per share data | |
Net asset value, beginning of period | | $ | 10.46 | | | $ | 10.28 | | | $ | 9.88 | | | $ | 8.55 | | | $ | 9.81 | | | $ | 10.19 | | |
Income from investment operations: | |
Net investment income | | | 0.14 | | | | 0.20 | | | | 0.22 | | | | 0.28 | | | | 0.31 | | | | 0.36 | | |
Net realized and unrealized gain (loss) | | | 0.32 | | | | 0.20 | | | | 0.40 | | | | 1.33 | | | | (1.20 | ) | | | (0.36 | ) | |
Total from investment operations | | | 0.46 | | | | 0.40 | | | | 0.62 | | | | 1.61 | | | | (0.89 | ) | | | — | | |
Less distributions to shareholders: | |
Net investment income | | | (0.22 | ) | | | (0.22 | ) | | | (0.22 | ) | | | (0.28 | ) | | | (0.33 | ) | | | (0.36 | ) | |
Net realized gains | | | (0.04 | ) | | | — | | | | — | | | | — | | | | (0.04 | ) | | | (0.02 | ) | |
Total distributions to shareholders | | | (0.26 | ) | | | (0.22 | ) | | | (0.22 | ) | | | (0.28 | ) | | | (0.37 | ) | | | (0.38 | ) | |
Net asset value, end of period | | $ | 10.66 | | | $ | 10.46 | | | $ | 10.28 | | | $ | 9.88 | | | $ | 8.55 | | | $ | 9.81 | | |
Total return | | | 4.40 | % | | | 3.92 | % | | | 6.32 | % | | | 19.07 | % | | | (9.18 | %) | | | (0.05 | %) | |
Ratios to average net assets(b)(c) | |
Total gross expenses | | | 1.77 | % | | | 1.98 | %(d)(e) | | | 1.99 | % | | | 2.00 | % | | | 1.81 | % | | | 1.89 | % | |
Total net expenses(f) | | | 1.29 | % | | | 1.33 | %(d)(e) | | | 1.42 | % | | | 1.42 | % | | | 1.42 | % | | | 1.42 | %(g) | |
Net investment income | | | 1.37 | % | | | 2.26 | %(d) | | | 2.18 | % | | | 3.02 | % | | | 3.70 | % | | | 3.59 | % | |
Supplemental data | |
Net assets, end of period (in thousands) | | $ | 5,467 | | | $ | 5,562 | | | $ | 5,294 | | | $ | 5,573 | | | $ | 5,104 | | | $ | 4,932 | | |
Portfolio turnover | | | 40 | % | | | 66 | % | | | 109 | % | | | 35 | % | | | 51 | % | | | 24 | % | |
Notes to Financial Highlights
(a) For the period from April 1, 2011 to January 31, 2012. During the period, the Portfolio's fiscal year end was changed from March 31 to January 31.
(b) In addition to the fees and expenses which the Portfolio bears directly, the Portfolio indirectly bears a pro rata share of the fees and expenses of the acquired funds in which it invests. Such indirect expenses are not included in the reported expense ratios.
(c) Certain line items from prior years have been reclassified to conform to the current presentation.
(d) Annualized.
(e) Ratios include line of credit interest expense which rounds to less than 0.01%.
(f) Total net expenses include the impact of certain waivers/reimbursements made by the Investment Manager and certain of its affiliates, if applicable.
(g) The benefits derived from expense reductions had an impact of less than 0.01%.
The accompanying Notes to Financial Statements are an integral part of this statement.
Annual Report 2013
18
Columbia LifeGoal® Income Portfolio
Financial Highlights (continued)
| | | Year Ended January 31, | | Year Ended March 31, | |
Class Z | | 2013 | | 2012(a) | | 2011 | | 2010 | | 2009 | | 2008 | |
Per share data | |
Net asset value, beginning of period | | $ | 10.50 | | | $ | 10.31 | | | $ | 9.91 | | | $ | 8.57 | | | $ | 9.83 | | | $ | 10.22 | | |
Income from investment operations: | |
Net investment income | | | 0.25 | | | | 0.28 | | | | 0.32 | | | | 0.38 | | | | 0.42 | | | | 0.46 | | |
Net realized and unrealized gain (loss) | | | 0.31 | | | | 0.21 | | | | 0.40 | | | | 1.34 | | | | (1.21 | ) | | | (0.37 | ) | |
Total from investment operations | | | 0.56 | | | | 0.49 | | | | 0.72 | | | | 1.72 | | | | (0.79 | ) | | | 0.09 | | |
Less distributions to shareholders: | |
Net investment income | | | (0.32 | ) | | | (0.30 | ) | | | (0.32 | ) | | | (0.38 | ) | | | (0.43 | ) | | | (0.46 | ) | |
Net realized gains | | | (0.04 | ) | | | — | | | | — | | | | — | | | | (0.04 | ) | | | (0.02 | ) | |
Total distributions to shareholders | | | (0.36 | ) | | | (0.30 | ) | | | (0.32 | ) | | | (0.38 | ) | | | (0.47 | ) | | | (0.48 | ) | |
Net asset value, end of period | | $ | 10.70 | | | $ | 10.50 | | | $ | 10.31 | | | $ | 9.91 | | | $ | 8.57 | | | $ | 9.83 | | |
Total return | | | 5.43 | % | | | 4.88 | % | | | 7.37 | % | | | 20.33 | % | | | (8.25 | %) | | | 0.85 | % | |
Ratios to average net assets(b)(c) | |
Total gross expenses | | | 0.78 | % | | | 0.98 | %(d)(e) | | | 0.99 | % | | | 1.00 | % | | | 0.81 | % | | | 0.89 | % | |
Total net expenses(f) | | | 0.28 | % | | | 0.33 | %(d)(e) | | | 0.42 | % | | | 0.42 | % | | | 0.42 | % | | | 0.42 | %(g) | |
Net investment income | | | 2.37 | % | | | 3.24 | %(d) | | | 3.20 | % | | | 4.04 | % | | | 4.60 | % | | | 4.57 | % | |
Supplemental data | |
Net assets, end of period (in thousands) | | $ | 3,117 | | | $ | 2,521 | | | $ | 3,096 | | | $ | 4,475 | | | $ | 4,472 | | | $ | 5,813 | | |
Portfolio turnover | | | 40 | % | | | 66 | % | | | 109 | % | | | 35 | % | | | 51 | % | | | 24 | % | |
Notes to Financial Highlights
(a) For the period from April 1, 2011 to January 31, 2012. During the period, the Portfolio's fiscal year end was changed from March 31 to January 31.
(b) In addition to the fees and expenses which the Portfolio bears directly, the Portfolio indirectly bears a pro rata share of the fees and expenses of the acquired funds in which it invests. Such indirect expenses are not included in the reported expense ratios.
(c) Certain line items from prior years have been reclassified to conform to the current presentation.
(d) Annualized.
(e) Ratios include line of credit interest expense which rounds to less than 0.01%.
(f) Total net expenses include the impact of certain waivers/reimbursements made by the Investment Manager and certain of its affiliates, if applicable.
(g) The benefits derived from expense reductions had an impact of less than 0.01%.
The accompanying Notes to Financial Statements are an integral part of this statement.
Annual Report 2013
19
Columbia LifeGoal® Income Portfolio
Notes to Financial Statements
January 31, 2013
Note 1. Organization
Columbia LifeGoal® Income Portfolio (the Portfolio), a series of Columbia Funds Series Trust (the Trust), is a diversified portfolio. The Trust is registered under the Investment Company Act of 1940, as amended (the 1940 Act), as an open-end management investment company organized as a Delaware statutory trust.
The Portfolio is a "fund-of-funds" and invests in a combination of underlying affiliated funds* for which Columbia Management Investment Advisers, LLC (Columbia Management), a wholly-owned subsidiary of Ameriprise Financial, Inc. (Ameriprise Financial), or an affiliate acts as investment manager or principal underwriter. The Portfolio may also invest in unaffiliated underlying funds, exchange traded funds, equity and fixed income securities (including treasury inflation protected securities) and derivative instruments. Columbia Management is the Investment Manager for the underlying affiliated funds.
*For information on the goals, investment strategies and risks of the underlying funds please refer to the Portfolio's most recent prospectus and the prospectuses of the underlying funds.
Portfolio Shares
The Trust may issue an unlimited number of shares (without par value). The Portfolio offers Class A, Class B, Class C and Class Z shares. All share classes have identical voting, dividend and liquidation rights. Each share class has its own expense structure and sales charges, as applicable.
Class A shares are subject to a maximum front-end sales charge of 3.25% based on the initial investment amount. Class A shares purchased without an initial sales charge in accounts aggregating $1 million to $50 million at the time of purchase are subject to a contingent deferred sales charge (CDSC) if the shares are sold within 18 months of purchase, charged as follows: 1.00% CDSC if redeemed within 12 months of purchase, and 0.50% CDSC if redeemed more than 12, but less than 18, months after purchase.
Class B shares may be subject to a maximum CDSC of 3.00% based upon the holding period after purchase. Class B shares will generally convert to Class A shares eight years after purchase. The Portfolio no longer accepts investments by new or existing investors in the Portfolio's Class B shares, except in connection with the reinvestment of any dividend and/or capital gain distributions in Class B shares of the Portfolio and exchanges by existing Class B shareholders of certain other funds within the Columbia Family of Funds.
Class C shares are subject to a 1.00% CDSC on shares redeemed within one year of purchase.
Class Z shares are not subject to sales charges, and are only available to certain investors.
Note 2. Summary of Significant Accounting Policies
Use of Estimates
The preparation of financial statements in accordance with U.S. generally accepted accounting principles (GAAP) requires management to make certain estimates and assumptions that affect the reported amounts of assets and liabilities, the disclosure of contingent assets and liabilities at the date of the financial statements and the reported amounts of revenue and expenses during the reporting period. Actual results could differ from those estimates.
The following is a summary of significant accounting policies consistently followed by the Portfolio in the preparation of its financial statements.
Security Valuation
Investments in the underlying funds are valued at the net asset value of each class of the respective underlying fund determined as of the close of the New York Stock Exchange on the valuation date.
Debt securities generally are valued by pricing services approved by the Board of Trustees (the Board) based upon market transactions for normal, institutional-size trading units of similar securities. The services may use various pricing techniques which take into account appropriate factors such as yield, quality, coupon rate, maturity, type of issue, trading characteristics and other data, as well as broker quotes. Debt securities for which quotations are readily available may also be valued based upon an over-the-counter or exchange bid quotation.
Investments for which market quotations are not readily available, or that have quotations which management believes are not reliable, are valued at fair value as determined in good faith under consistently applied procedures established by and under the general supervision of the Board. If a security or class of securities (such as foreign securities) is valued at fair value, such value is likely to be different from the last quoted market price for the security.
The determination of fair value often requires significant judgment. To determine fair value, management may use assumptions including but not limited to future cash flows and estimated risk premiums. Multiple inputs from various sources may be used to determine fair value.
Annual Report 2013
20
Columbia LifeGoal® Income Portfolio
Notes to Financial Statements (continued)
January 31, 2013
Treasury Inflation Protected Securities
The Portfolio may invest in treasury inflation protected securities (TIPS). The principal amount of TIPS is adjusted periodically and is increased for inflation or decreased for deflation based on a monthly published index. Interest payments are based on the adjusted principal at the time the interest is paid. These adjustments are recorded as interest income in the Statement of Operations.
Security Transactions
Security transactions are accounted for on the trade date. Cost is determined and gains (losses) are based upon the specific identification method for both financial statement and federal income tax purposes.
Income Recognition
Income and capital gain distributions from the underlying funds, if any, are recorded on the ex-dividend date.
Interest income is recorded on an accrual basis. Market premiums and discounts, including original issue discounts, are amortized and accreted, respectively, over the expected life of the security on all debt securities, unless otherwise noted.
Expenses
General expenses of the Trust are allocated to the Portfolio and other series of the Trust based upon relative net assets or other expense allocation methodologies determined by the nature of the expense. Expenses directly attributable to the Portfolio are charged to the Portfolio. Expenses directly attributable to a specific class of shares are charged to that share class.
Determination of Class Net Asset Value
All income, expenses (other than class-specific expenses, which are charged to that share class, as shown in the Statement of Operations) and realized and unrealized gains (losses) are allocated to each class of the Portfolio on a daily basis, based on the relative net assets of each class, for purposes of determining the net asset value of each class.
Federal Income Tax Status
The Portfolio intends to qualify each year as a regulated investment company under Subchapter M of the Internal Revenue Code, as amended, and will distribute substantially all of its taxable income (including net short-term capital gains), if any, for its tax year, and as such will not be subject to federal income taxes. In addition, the Portfolio intends to distribute in each calendar year substantially all of its net investment income, capital gains and certain other amounts, if any, such that the Portfolio should not be subject to federal excise tax. Therefore, no federal income or excise tax provision is recorded.
Distributions to Shareholders
Distributions from net investment income, if any, are declared and paid monthly. Net realized capital gains, if any, are distributed at least annually. Income distributions and capital gain distributions are determined in accordance with federal income tax regulations, which may differ from GAAP.
Guarantees and Indemnifications
Under the Trust's organizational documents and, in some cases, by contract, its officers and trustees are indemnified against certain liabilities arising out of the performance of their duties to the Trust or its portfolios. In addition, certain of the Portfolio's contracts with its service providers contain general indemnification clauses. The Portfolio's maximum exposure under these arrangements is unknown since the amount of any future claims that may be made against the Portfolio cannot be determined, and the Portfolio has no historical basis for predicting the likelihood of any such claims.
Recent Accounting Pronouncement
Disclosures about Offsetting Assets and Liabilities
In December 2011, the Financial Accounting Standards Board (FASB) issued Accounting Standards Update (ASU) No. 2011-11, Disclosures about Offsetting Assets and Liabilities. The objective of the FASB is to enhance current disclosure requirements on offsetting of certain assets and liabilities and to enable financial statement users to compare financial statements prepared under GAAP and International Financial Reporting Standards.
Specifically, ASU No. 2011-11 requires an entity to disclose both gross and net information for derivatives and other financial instruments that are subject to a master netting arrangement or similar agreement. The standard requires disclosure of collateral received in connection with the master netting agreements or similar agreements. The effective date of ASU No. 2011-11 is for interim and annual periods beginning on or after January 1, 2013. At this time, management is evaluating the implications of this guidance and the impact it will have on the financial statement amounts and footnote disclosures, if any.
Note 3. Fees and Compensation Paid to Affiliates
Investment Management Fees
Under an Investment Management Services Agreement, the Investment Manager determines which securities will be purchased, held or sold. The investment management fee is an annual fee that is a blend of (i) 0.00% on assets invested in funds that pay an investment advisory fee to the Investment Manager, (ii) 0.10% on assets invested in non-exchange traded third-party advised mutual funds and (iii) 0.40% on assets
Annual Report 2013
21
Columbia LifeGoal® Income Portfolio
Notes to Financial Statements (continued)
January 31, 2013
invested in all other securities, including other funds advised by the Investment Manager that do not pay an investment advisory fee, ETFs, derivatives and individual securities.
The effective investment management fee rate for the year ended January 31, 2013, was 0.03% of the Portfolio's average daily net assets.
In addition to the fees and expenses which the Portfolio bears directly, the Portfolio indirectly bears a pro rata share of the fees and expenses of the underlying funds (also referred to as "acquired funds") in which the Portfolio invests. Because the underlying funds have varied expense and fee levels and the Portfolio may own different proportions of underlying funds at different times, the amount of fees and expenses incurred indirectly by the Portfolio will vary.
Administration Fees
Under an Administrative Services Agreement, the Investment Manager also serves as the Portfolio Administrator. The Portfolio pays the Portfolio Administrator an annual fee for administration and accounting services equal to 0.02% of the Portfolio's average daily net assets.
Other Expenses
Other expenses are for, among other things, certain expenses of the Portfolio or the Board, including: Portfolio boardroom and office expense, employee compensation, employee health and retirement benefits, and certain other expenses. Payment of these Portfolio and Board expenses is facilitated by a company providing limited administrative services to the Portfolio and the Board. For the year ended January 31, 2013, other expenses paid to this company were $1,208.
Compensation of Board Members
Board members are compensated for their services to the Portfolio as disclosed in the Statement of Operations. Under a Deferred Compensation Plan (the Plan), the Board members who are not "interested persons" of the Portfolio, as defined under the 1940 Act, may elect to defer payment of up to 100% of their compensation. Deferred amounts are treated as though equivalent dollar amounts had been invested in shares of certain funds managed by the Investment Manager. The Portfolio's liability for these amounts is adjusted for market value changes and remains in the Portfolio until distributed in accordance with the Plan.
Transfer Agent Fees
Under a Transfer and Dividend Disbursing Agent Agreement, Columbia Management Investment Services Corp. (the Transfer Agent), an affiliate of the Investment Manager and a wholly-owned subsidiary of Ameriprise Financial, is responsible for providing transfer agency services to the
Portfolio. The Transfer Agent has contracted with Boston Financial Data Services (BFDS) to serve as sub-transfer agent.
The Transfer Agent receives monthly account-based service fees based on the number of open accounts and is reimbursed by the Portfolio for the fees and expenses the Transfer Agent pays to financial intermediaries that maintain omnibus accounts with the Portfolio that is a percentage of the average aggregate value of the Portfolio's shares maintained in each such omnibus account (other than omnibus accounts for which American Enterprise Investment Services Inc. is the broker of record or accounts where the beneficial shareholder is a customer of Ameriprise Financial Services, Inc., which are paid a per account fee). The Transfer Agent pays the fees of BFDS for services as sub-transfer agent and is not entitled to reimbursement for such fees from the Portfolio (with the exception of out of pocket expenses).
The Transfer Agent also receives compensation from fees for various shareholder services and reimbursements for certain out-of-pocket fees.
For the year ended January 31, 2013, the Portfolio's effective transfer agent fee rates as a percentage of average daily net assets of each class were as follows:
Class A | | | 0.19 | % | |
Class B | | | 0.19 | | |
Class C | | | 0.19 | | |
Class Z | | | 0.19 | | |
An annual minimum account balance fee of $20 may apply to certain accounts with a value below the Portfolio's initial minimum investment requirements to reduce the impact of small accounts on transfer agent fees. These minimum account balance fees are recorded as part of expense reductions in the Statement of Operations. For the year ended January 31, 2013, no minimum account balance fees were charged by the Portfolio.
Distribution and Service Fees
The Portfolio has an agreement with Columbia Management Investment Distributors, Inc. (the Distributor), an affiliate of the Investment Manager and a wholly-owned subsidiary of Ameriprise Financial, for distribution and shareholder services. Pursuant to Rule 12b-1 under the 1940 Act, the Board of Trustees has approved, and the Portfolio has adopted, distribution and shareholder service plans (the Plans) which set the distribution and service fees for the Portfolio. These fees are calculated daily and are intended to compensate the Distributor and/or eligible selling and/or servicing agents for selling shares of the Portfolio and providing services to investors.
Annual Report 2013
22
Columbia LifeGoal® Income Portfolio
Notes to Financial Statements (continued)
January 31, 2013
The Plans require the payment of a monthly combined distribution and service fee to the Distributor at the maximum annual rate of 0.25% of the average daily net assets attributable to Class A shares of the Portfolio. The Plans also require the payment of a monthly service fee at the maximum annual rate of 0.25% of the average daily net assets attributable to Class B and Class C shares of the Portfolio and the payment of a monthly distribution fee at the maximum annual rate of 0.75% of the average daily net assets attributable to Class B and Class C shares of the Portfolio.
Sales Charges
Sales charges, including front-end charges and CDSCs, received by the Distributor for distributing Portfolio shares were $10,408 for Class A, $39 for Class B and $125 for Class C shares for the year ended January 31, 2013.
Expenses Waived/Reimbursed by the Investment Manager and its Affiliates
The Investment Manager and certain of its affiliates have contractually agreed to waive fees and/or reimburse expenses (excluding certain fees and expenses described below), through May 31, 2013, unless sooner terminated at the sole discretion of the Board, so that the Portfolio's net operating expenses, after giving effect to fees waived/expenses reimbursed and any balance credits and/or overdraft charges from the Portfolio's custodian, do not exceed the following annual rates as a percentage of the class' average daily net assets:
Class A | | | 0.51 | % | |
Class B | | | 1.26 | | |
Class C | | | 1.26 | | |
Class Z | | | 0.26 | | |
Under the agreement governing these fee waivers and/or expense reimbursement arrangements, the following fees and expenses are excluded from the waiver/reimbursement commitment, and therefore will be paid by the Portfolio, if applicable: taxes (including foreign transaction taxes), expenses associated with investments in affiliated and non-affiliated pooled investment vehicles (including mutual funds and exchange traded funds), transaction costs and brokerage commissions, costs related to any securities lending program, dividend expenses associated with securities sold short, inverse floater program fees and expenses, transaction charges and interest on borrowed money, interest, the Portfolio's investment management fee, extraordinary expenses and any other expenses the exclusion of which is specifically approved by the Board. This agreement may be modified or amended only with approval from all parties.
Note 4. Federal Tax Information
The timing and character of income and capital gain distributions are determined in accordance with income tax regulations, which may differ from GAAP because of temporary or permanent book to tax differences.
At January 31, 2013, these differences are primarily due to differing treatment for deferral/reversal of wash sales losses, Trustees' deferred compensation and re-characterization of distributions from investments. To the extent these differences are permanent, reclassifications are made among the components of the Portfolio's net assets in the Statement of Assets and Liabilities. Temporary differences do not require reclassifications. In the Statement of Assets and Liabilities the following reclassifications were made:
Excess of distributions over
net investment income | | $ | 171,156 | | |
Accumulated net realized loss | | | (171,156 | ) | |
Net investment income and net realized gains (losses), as disclosed in the Statement of Operations, and net assets were not affected by this reclassification.
The tax character of distributions paid during the years indicated was as follows:
Year Ended January 31, | | 2013 | | 2012 | |
Ordinary income | | $ | 716,784 | | | $ | 642,820 | | |
Long-term capital gains | | | 86,124 | | | | — | | |
Total | | $ | 802,908 | | | $ | 642,820 | | |
Short-term capital gain distributions, if any, are considered ordinary income distributions for tax purposes.
At January 31, 2013, the components of distributable earnings on a tax basis were as follows:
Undistributed ordinary income | | $ | 18,642 | | |
Undistributed accumulated long-term gain | | | 114,502 | | |
Unrealized appreciation | | | 726,843 | | |
At January 31, 2013, the cost of investments for federal income tax purposes was $24,843,749 and the aggregate gross unrealized appreciation and depreciation based on that cost was:
Unrealized appreciation | | $ | 789,397 | | |
Unrealized depreciation | | | (62,554 | ) | |
Net unrealized appreciation | | $ | 726,843 | | |
For the year ended January 31, 2013, $215,582 of capital loss carryforward was utilized.
Management of the Portfolio has concluded that there are no significant uncertain tax positions that would require
Annual Report 2013
23
Columbia LifeGoal® Income Portfolio
Notes to Financial Statements (continued)
January 31, 2013
recognition in the financial statements. However, management's conclusion may be subject to review and adjustment at a later date based on factors including, but not limited to, new tax laws, regulations, and administrative interpretations (including relevant court decisions). Generally, the Portfolio's federal tax returns for the prior three fiscal years remain subject to examination by the Internal Revenue Service.
Note 5. Portfolio Information
The cost of purchases and proceeds from sales of securities, excluding short-term obligations, aggregated to $10,705,064 and $12,542,170, respectively, for the year ended January 31, 2013, of which $0 and $80,532, respectively, were U.S. government securities.
Note 6. Shareholder Concentration
At January 31, 2013, two unaffiliated shareholder accounts owned an aggregate of 54.3% of the outstanding shares of the Portfolio. The Portfolio has no knowledge about whether any portion of those shares was owned beneficially by such accounts. Subscription and redemption activity by concentrated accounts may have a significant effect on the operations of the Portfolio.
Note 7. Line of Credit
The Portfolio has entered into a revolving credit facility with a syndicate of banks led by JPMorgan Chase Bank N.A. whereby the Portfolio may borrow for the temporary funding of shareholder redemptions or for other temporary or emergency purposes. The credit facility agreement, as amended, which is a collective agreement between the Portfolio and certain other funds managed by the Investment Manager, severally and not jointly, permits collective borrowings up to $500 million. Interest is charged to each participating fund based on its borrowings at a rate equal to the higher of (i) the overnight federal funds rate plus 1.00% or (ii) the one-month LIBOR rate plus 1.00%. Each borrowing under the credit facility matures no later than 60 days after the date of borrowing.
The Portfolio had no borrowings during the year ended January 31, 2013.
Note 8. Subsequent Events
Management has evaluated the events and transactions that have occurred through the date the financial statements were issued. Other than as noted below, there were no items requiring adjustment of the financial statements or additional disclosure.
On February 27, 2013, shareholders of the Portfolio approved a proposal to merge the Portfolio into Columbia Capital Allocation Conservative Portfolio (formerly known as Columbia Portfolio Builder Conservative Portfolio). The merger is expected to take place on or about April 26, 2013.
Note 9. Information Regarding Pending and Settled Legal Proceedings
In December 2005, without admitting or denying the allegations, American Express Financial Corporation (AEFC, which is now known as Ameriprise Financial, Inc. (Ameriprise Financial)) entered into settlement agreements with the Securities and Exchange Commission (SEC) and Minnesota Department of Commerce (MDOC) related to market timing activities. As a result, AEFC was censured and ordered to cease and desist from committing or causing any violations of certain provisions of the Investment Advisers Act of 1940, the Investment Company Act of 1940, and various Minnesota laws. AEFC agreed to pay disgorgement of $10 million and civil money penalties of $7 million. AEFC also agreed to retain an independent distribution consultant to assist in developing a plan for distribution of all disgorgement and civil penalties ordered by the SEC in accordance with various undertakings detailed at www.sec.gov/litigation/admin/ia-2451.pdf. Ameriprise Financial and its affiliates have cooperated with the SEC and the MDOC in these legal proceedings, and have made regular reports to the funds' Boards of Trustees.
Ameriprise Financial and certain of its affiliates have historically been involved in a number of legal, arbitration and regulatory proceedings, including routine litigation, class actions, and governmental actions, concerning matters arising in connection with the conduct of their business activities. Ameriprise Financial believes that the Funds are not currently the subject of, and that neither Ameriprise Financial nor any of its affiliates are the subject of, any pending legal, arbitration or regulatory proceedings that are likely to have a material adverse effect on the Funds or the ability of Ameriprise Financial or its affiliates to perform under their contracts with the Funds. Ameriprise Financial is required to make 10-Q, 10-K and, as necessary, 8-K filings with the Securities and Exchange Commission on legal and regulatory matters that relate to Ameriprise Financial and its affiliates. Copies of these filings may be obtained by accessing the SEC website at www.sec.gov.
There can be no assurance that these matters, or the adverse publicity associated with them, will not result in increased fund redemptions, reduced sale of fund shares or other adverse consequences to the Funds. Further, although we believe proceedings are not likely to have a material adverse effect on
Annual Report 2013
24
Columbia LifeGoal® Income Portfolio
Notes to Financial Statements (continued)
January 31, 2013
the Funds or the ability of Ameriprise Financial or its affiliates to perform under their contracts with the Funds, these proceedings are subject to uncertainties and, as such, we are unable to estimate the possible loss or range of loss that may result. An adverse outcome in one or more of these proceedings could result in adverse judgments, settlements, fines, penalties or other relief that could have a material adverse effect on the consolidated financial condition or results of operations of Ameriprise Financial.
Annual Report 2013
25
Columbia LifeGoal® Income Portfolio
Report of Independent Registered Public Accounting Firm
To the Trustees of Columbia Funds Series Trust and
the Shareholders of Columbia LifeGoal® Income Portfolio
In our opinion, the accompanying statement of assets and liabilities, including the portfolio of investments, and the related statements of operations and of changes in net assets and the financial highlights present fairly, in all material respects, the financial position of Columbia LifeGoal® Income Portfolio (the "Portfolio") (a series of Columbia Funds Series Trust) at January 31, 2013, the results of its operations for the year then ended, the changes in its net assets for each of the two years in the period then ended and the financial highlights for each of the periods indicated, in conformity with accounting principles generally accepted in the United States of America. These financial statements and financial highlights (hereafter referred to as "financial statements") are the responsibility of the Portfolio's management. Our responsibility is to express an opinion on these financial statements based on our audits. We conducted our audits of these financial statements in accordance with the standards of the Public Company Accounting Oversight Board (United States). Those standards require that we plan and perform the audit to obtain reasonable assurance about whether the financial statements are free of material misstatement. An audit includes examining, on a test basis, evidence supporting the amounts and disclosures in the financial statements, assessing the accounting principles used and significant estimates made by management, and evaluating the overall financial statement presentation. We believe that our audits, which included confirmation of securities at January 31, 2013 by correspondence with the transfer agent, provide a reasonable basis for our opinion.
PricewaterhouseCoopers LLP
Minneapolis, Minnesota
March 22, 2013
Annual Report 2013
26
Columbia LifeGoal® Income Portfolio
Federal Income Tax Information
(Unaudited)
The Portfolio hereby designates the following tax attributes for the fiscal year ended January 31, 2013. Shareholders will be notified in early 2014 of the amounts for use in preparing 2013 income tax returns.
Tax Designations:
| Qualified Dividend Income | | | 1.33 | % | |
| Dividends Received Deduction | | | 1.18 | % | |
Capital Gain Dividend | | $ | 210,657 | | |
Qualified Dividend Income. For taxable, non-corporate shareholders, the percentage of ordinary income dividends paid during the fiscal year that represents qualified dividend income subject to reduced tax rates under the Jobs and Growth Tax Relief Reconciliation Act of 2003.
Dividends Received Deduction. The percentage of ordinary income dividends paid during the fiscal year that qualifies for the corporate dividends received deduction.
Capital Gain Dividend. The Portfolio designates as a capital gain dividend the amount reflected above, or if subsequently determined to be different, the net capital gain of such fiscal period. The Portfolio also designates as capital gain dividends, to the extent necessary to fully distribute such capital gains, earnings and profits distributed to shareholders on the redemption of shares.
Annual Report 2013
27
Columbia LifeGoal® Income Portfolio
Shareholders elect the Board that oversees the funds' operations. The Board appoints officers who are responsible for day-to-day business decisions based on policies set by the Board. The following table provides basic biographical information about the funds' Board members, including their principal occupations during the past five years, although specific titles for individuals may have varied over the period. Under current Board policy, members may serve until the next Board meeting after he or she reaches the mandatory retirement age established by the Board, or the fifteenth anniversary of the first Board meeting they attended as a member of the Board.
Mr. Edward J. Boudreau, Jr., Mr. William P. Carmichael, Mr. William A. Hawkins, Mr. R. Glenn Hilliard, Ms. Minor M. Shaw and Dr. Anthony M. Santomero, were members of the Legacy Columbia Nations funds' Board ("Nations Funds"), which includes Columbia Funds Series Trust, Columbia Funds Variable Insurance Trust I and Columbia Funds Master Investment Trust, LLC and began service on the Board for the Legacy RiverSource funds ("RiverSource Funds") effective June 1, 2011.
Independent Trustees
Name,
Address,
Year of Birth | | Position Held With
Funds and Length of
Service | | Principal Occupation
During Past Five Years | | Number of
Funds in the
Fund Family
Overseen by
Board Member | | Other Present or Past
Directorships/Trusteeships
(Within Past 5 Years) | |
Kathleen Blatz
901 S. Marquette Ave.
Minneapolis, MN 55402
1954 | | Board member since 1/06 for RiverSource Funds and since 6/11 for Nations Funds | | Attorney; Chief Justice, Minnesota Supreme Court, 1998-2006 | | | 152 | | | Director, BlueCross BlueShield of Minnesota since 2009 | |
Edward J. Boudreau, Jr.
901 S. Marquette Ave.
Minneapolis, MN 55402
1944 | | Board member since 6/11 for RiverSource Funds and since 1/05 for Nations Funds | | Managing Director, E.J. Boudreau & Associates (consulting) since 2000 | | | 145 | | | Former Trustee, BofA Funds Series Trust (11 funds) | |
Pamela G. Carlton
901 S. Marquette Ave.
Minneapolis, MN 55402
1954 | | Board member since 7/07 for RiverSource Funds and since 6/11 for Nations Funds | | President, Springboard — Partners in Cross Cultural Leadership (consulting company) since 2003 | | | 152 | | | None | |
William P. Carmichael
901 S. Marquette Ave.
Minneapolis, MN 55402
1943 | | Board member since 6/11 for RiverSource Funds and since 1999 for Nations Funds | | Retired | | | 145 | | | Director, Cobra Electronics Corporation (electronic equipment manufacturer); The Finish Line (athletic shoes and apparel) since July 2003; McMoRan Exploration Company (oil and gas exploration and development) since 2010; former Trustee, BofA Funds Series Trust (11 funds); former Director, Spectrum Brands, Inc. (consumer products); former Director, Simmons Company (bedding) | |
Patricia M. Flynn
901 S. Marquette Ave.
Minneapolis, MN 55402
1950 | | Board member since 11/04 for RiverSource Funds and since 6/11 for Nations Funds | | Trustee Professor of Economics and Management, Bentley University since 1976 | | | 152 | | | None | |
William A. Hawkins
901 S. Marquette Ave.
Minneapolis, MN 55402
1942 | | Board member since 6/11 for RiverSource Funds and since 1/05 for Nations Funds | | Managing Director, Overton Partners (financial consulting), since August 2010; President and Chief Executive Officer, California General Bank, N.A., January 2008-August 2010. | | | 145 | | | Trustee, BofA Funds Series Trust (11 funds) | |
Annual Report 2013
28
Columbia LifeGoal® Income Portfolio
Trustees and Officers (continued)
Independent Trustees (continued)
Name,
Address,
Year of Birth | | Position Held With
Funds and Length of
Service | | Principal Occupation
During Past Five Years | | Number of
Funds in the
Fund Family
Overseen by
Board Member | | Other Present or Past
Directorships/Trusteeships
(Within Past 5 Years) | |
R. Glenn Hilliard
901 S. Marquette Ave.
Minneapolis, MN 55402
1943 | | Board member since 6/11 for RiverSource Funds and since 1/05 for Nations Funds | | Chairman and Chief Executive Officer, Hilliard Group LLC (investing and consulting), since April 2003; Non-Executive Director & Chairman, CNO Financial Group, Inc. (insurance), September 2003-May 2011 | | | 145 | | | Chairman, BofA Fund Series Trust (11 funds); former Director, CNO Financial Group, Inc. (insurance) | |
Stephen R. Lewis, Jr.
901 S. Marquette Ave.
Minneapolis, MN 55402
1939 | | Chair of the Board for RiverSource Funds since 1/07, Board member for RiverSource Funds since 1/02 and since 6/11 for Nations Funds | | President Emeritus and Professor of Economics Emeritus, Carleton College since 2002 | | | 152 | | | Director, Valmont Industries, Inc. (manufacturer of irrigation systems) since 2002 | |
Catherine James Paglia
901 S. Marquette Ave.
Minneapolis, MN 55402
1952 | | Board member since 11/04 for RiverSource Funds and since 6/11 for Nations Funds | | Director, Enterprise Asset Management, Inc. (private real estate and asset management company) | | | 152 | | | Director, Valmont Industries, Inc. (manufacturer of irrigation systems) since 2012 | |
Leroy C. Richie
901 S. Marquette Ave.
Minneapolis, MN 55402
1941 | | Board member since 2000 for Legacy Seligman Funds, since 11/08 for RiverSource Funds and since 6/11 for Nations Funds | | Counsel, Lewis & Munday, P.C. (law firm) since 2004; former Vice President and General Counsel, Automotive Legal Affairs, Chrysler Corporation from 1983-1987 | | | 152 | | | Lead Outside Director, Digital Ally, Inc. (digital imaging) since September 2005; Director, Infinity, Inc. (oil and gas exploration and production) since 1994; Director, OGE Energy Corp. (energy and energy services) since November 2007 | |
Minor M. Shaw
901 S. Marquette Ave.
Minneapolis, MN 55402
1947 | | Board member since 6/11 for RiverSource Funds and since 2003 for Nations Funds | | President, Micco LLC (private investments) since 2011; President Micco Corp. since 1998 | | | 145 | | | Director, Piedmont Natural Gas; Director, BlueCross BlueShield of South Carolina since April 2008; Former Trustee, BofA Funds Series Trust (11 funds) | |
Alison Taunton-Rigby
901 S. Marquette Ave.
Minneapolis, MN 55402
1944 | | Board member since 11/02 for RiverSource Funds and since 6/11 for Nations Funds | | Chief Executive Officer and Director, RiboNovix, Inc., 2003-2010 (biotechnology) | | | 152 | | | Director, Healthways, Inc. (health and well-being improvement) since 2005; Director, ICI Mutual Insurance Company, RRG since 2011; Director, Abt Associates (government contractor) since 2001; Director, Boston Children's Hospital since 2002 | |
Annual Report 2013
29
Columbia LifeGoal® Income Portfolio
Trustees and Officers (continued)
Interested Trustee Not Affiliated With Investment Manager*
Name,
Address,
Year of Birth | | Position Held With
Funds and Length of
Service | | Principal Occupation
During Past Five Years | | Number of
Funds in the
Fund Family
Overseen by
Board Member | | Other Present or Past
Directorships/Trusteeships
(Within Past 5 Years) | |
Anthony M. Santomero
901 S. Marquette Ave.
Minneapolis, MN 55402
1946 | | Board member since 6/11 for RiverSource Funds and since 1/08 for Nations Funds | | Richard K. Mellon Professor Emeritus of Finance, The Wharton School, University of Pennsylvania, since 2002; Senior Advisor, McKinsey & Company (consulting), 2006-2008 | | | 145 | | | Director, Renaissance Reinsurance Ltd. since May 2008; Trustee, Penn Mutual Life Insurance Company since March 2008; Director, Citigroup since 2009; Director, Citibank, N.A. since 2009; former Trustee, BofA Funds Series Trust (11 funds) | |
*Dr. Santomero is not an affiliated person of the investment manager or Ameriprise Financial. However, he is currently deemed by the funds to be an "interested person" (as defined in the 1940 Act) of the funds because he serves as a Director of Citigroup, Inc. and Citibank N.A., companies that may directly or through subsidiaries and affiliates engage from time-to-time in brokerage execution, principal transactions and lending relationships with the funds or accounts advised/managed by the investment manager.
Interested Trustee Affiliated With Investment Manager*
Name,
Address,
Year of Birth | | Position Held With
Funds and Length of
Service | | Principal Occupation
During Past Five Years | | Number of
Funds in the
Fund Family
Overseen by
Board Member | | Other Present or Past
Directorships/Trusteeships
(Within Past 5 Years) | |
William F. Truscott
53600 Ameriprise
Financial Center
Minneapolis, MN 55474
1960 | | Board member since 11/01 for RiverSource Funds and since 6/11 for Nations Funds; Senior Vice President since 2002 for RiverSource Funds and 5/10 for Nations Funds | | President, Columbia Management Investment Advisers, LLC since February 2012, (previously President, Chairman of the Board and Chief Investment Officer, 2001-April 2010); Chief Executive Officer, Global Asset Management, Ameriprise Financial, Inc. since September 2012 (previously Chief Executive Officer, U.S. Asset Management & President, Annuities, May 2010-September 2012 and President — U.S. Asset Management and Chief Investment Officer, 2005-April 2010); Chief Executive Officer, Columbia Management Investment Distributors, Inc. since February 2012, (previously Chairman of the Board and Chief Executive Officer, 2006-April 2010); Chairman of the Board and Chief Executive Officer, RiverSource Distributors, Inc. since 2006; President and Chief Executive Officer, Ameriprise Certificate Company 2006-August 2012. | | | 204 | | | Chairman of the Board, Columbia Management Investment Advisers, LLC since May 2010; Director, Columbia Management Investment Distributors, Inc. since May 2010; Director, Ameriprise Certificate Company, 2006-January 2013 | |
*Interested person (as defined under the 1940 Act) by reason of being an officer, director, security holder and/or employee of the investment manager or Ameriprise Financial.
The SAI has additional information about the Portfolio's Board members and is available, without charge, upon request by calling 800.345.6611; contacting your financial intermediary; or visiting columbiamanagement.com.
Annual Report 2013
30
Columbia LifeGoal® Income Portfolio
Trustees and Officers (continued)
The Board has appointed officers who are responsible for day-to-day business decisions based on policies it has established. The officers serve at the pleasure of the Board. In addition to Mr. Truscott, who is Senior Vice President, the funds' other officers are:
Officers
Name,
Address,
Year of Birth | | Position Held With
Funds and Length of
Service | | Principal Occupation During Past Five Years | |
J. Kevin Connaughton
225 Franklin Street
Boston, MA 02110
1964 | | President and Principal Executive Officer since 5/10 for RiverSource Funds and 2009 for Nations Funds | | Senior Vice President and General Manager — Mutual Fund Products, Columbia Management Investment Advisers, LLC since May 2010; Managing Director of Columbia Management Advisors, LLC, December 2004-April 2010; Senior Vice President and Chief Financial Officer, Columbia Funds, June 2008-January 2009; Treasurer, Columbia Funds, October 2003-May 2008 | |
Amy K. Johnson
5228 Ameriprise Financial Center Minneapolis, MN 55474
1965 | | Vice President since 12/06 for RiverSource Funds and 5/10 for Nations Funds | | Senior Vice President and Chief Operating Officer, Columbia Management Investment Advisers, LLC since May 2010 (previously Chief Administrative Officer, 2009-April 2010 and Vice President — Asset Management and Trust Company Services, 2006-2009) | |
Michael G. Clarke
225 Franklin Street
Boston, MA 02110
1969 | | Treasurer since 1/11 and Chief Financial Officer since 4/11 RiverSource Funds and Treasurer since 3/11 and Chief Financial Officer since 2009 for Nations Funds | | Vice President, Columbia Management Investment Advisers, LLC since May 2010; Managing Director of Fund Administration, Columbia Management Advisors, LLC, September 2004-April 2010; senior officer of Columbia Funds and affiliated funds since 2002 | |
Scott R. Plummer
5228 Ameriprise Financial Center Minneapolis, MN 55474
1959 | | Senior Vice President and Chief Legal Officer since 12/06 and Assistant Secretary since 6/11 for RiverSource Funds and Senior Vice President and Chief Legal Officer since 5/10 and Assistant Secretary since 6/11 for Nations Funds | | Senior Vice President, Chief Legal Officer and Assistant Secretary, Columbia Management Investment Advisers, LLC since June 2005; Vice President and Lead Chief Counsel — Asset Management, Ameriprise Financial, Inc. since May 2010 (previously Vice President and Chief Counsel — Asset Management, 2005-April 2010); Vice President, Chief Counsel and Assistant Secretary, Columbia Management Investment Distributors, Inc. since 2008; Vice President, General Counsel and Secretary, Ameriprise Certificate Company since 2005; Chief Counsel, RiverSource Distributors, Inc. since 2006 | |
Colin Moore
225 Franklin Street
Boston, MA 02110
1958 | | Senior Vice President since 5/10 for RiverSource Funds and Nations Funds | | Director and Chief Investment Officer, Columbia Management Investment Advisers, LLC since May 2010; Manager, Managing Director and Chief Investment Officer, Columbia Management Advisors, LLC, 2007-April 2010 | |
Thomas P. McGuire
225 Franklin Street
Boston, MA 02110
1972 | | Chief Compliance Officer since 3/12 | | Vice President — Asset Management Compliance, Columbia Management Investment Advisers, LLC since 2010; Chief Compliance Officer, Ameriprise Certificate Company since September 2010; Compliance Executive, Bank of America, 2005-2010 | |
Stephen T. Welsh
225 Franklin Street
Boston, MA 02110
1957 | | Vice President since 4/11 for RiverSource Funds and 2006 for Nations Funds | | President and Director, Columbia Management Investment Services Corp. since May 2010; President and Director, Columbia Management Services, Inc., July 2004- April 2010; Managing Director, Columbia Management Distributors, Inc., August 2007-April 2010 | |
Christopher O. Petersen
5228 Ameriprise Financial Center Minneapolis, MN 55474
1970 | | Vice President and Secretary since 4/11 for RiverSource Funds and 3/11 for Nations Funds | | Vice President and Chief Counsel, Ameriprise Financial, Inc. since January 2010 (formerly Vice President and Group Counsel or Counsel, April 2004-January 2010); Assistant Secretary of Legacy RiverSource Funds, January 2007-April 2011 and of the Nations Funds, May 2010-March 2011 | |
Annual Report 2013
31
Columbia LifeGoal® Income Portfolio
Trustees and Officers (continued)
Officers (continued)
Name,
Address,
Year of Birth | | Position Held With
Funds and Length of
Service | | Principal Occupation During Past Five Years | |
Paul D. Pearson
10468 Ameriprise Financial Center Minneapolis, MN 55474
1956 | | Vice President since 4/11 and Assistant Treasurer since 1999 for RiverSource Funds and Vice President and Assistant Treasurer since 6/11 for Nations Funds | | Vice President — Investment Accounting, Columbia Management Investment Advisers, LLC, since May 2010; Vice President — Managed Assets, Investment Accounting, Ameriprise Financial Corporation, February 1998-May 2010 | |
Joseph F. DiMaria
225 Franklin Street
Boston, MA 02110
1968 | | Vice President and Chief Accounting Officer since 4/11 and Vice President since 3/11 and Chief Accounting Officer since 2008 for Nations Funds | | Vice President, Mutual Fund Administration, Columbia Management Investment Advisers, LLC, since May 2010; Director of Fund Administration, Columbia Management Advisors, LLC, January 2006-April 2010 | |
Paul B. Goucher
100 Park Avenue
New York, NY 10017
1968 | | Vice President since 4/11 and Assistant Secretary since 11/08 for RiverSource Funds and 5/10 for Nations Funds | | Vice President and Lead Chief Counsel, Ameriprise Financial, Inc. since November 2008 and January 2013, respectively (formerly, Chief Counsel, January 2010-January 2013 and Group Counsel from November 2008- January 2010); Director, Managing Director and General Counsel, J. & W. Seligman & Co. Incorporated, July 2008-November 2008 (previously, Managing Director and Associate General Counsel, January 2005-July 2008) | |
Michael E. DeFao
225 Franklin Street
Boston, MA 02110
1968 | | Vice President since 4/11 and Assistant Secretary since 5/10 for RiverSource Funds and 2011 for Nations Funds | | Vice President and Chief Counsel, Ameriprise Financial, Inc. since May 2010; Associate General Counsel, Bank of America, June 2005-April 2010 | |
Annual Report 2013
32
Columbia LifeGoal® Income Portfolio
Shareholder Meeting Results
Special Meeting of Shareholders Held on February 27, 2013 (Unaudited)
Columbia LifeGoal® Income Portfolio
At a Joint Special Meeting of Shareholders held on February 27, 2013 (the "Meeting"), shareholders of the Portfolio approved an Agreement and Plan of Reorganization pursuant to which the Portfolio will transfer its assets to Columbia Capital Allocation Conservative Portfolio (the "Buying Portfolio") in exchange for shares of the Buying Portfolio and the assumption by the Buying Portfolio of the Portfolio's liabilities. The votes cast for or against as well as the number of abstentions and broker non-votes as to the proposal are set forth below. A vote is based on the total number of Portfolio shares outstanding as of the record date for the Meeting.
| | | Votes For | | Votes Against | | Abstentions | | Broker Non-Votes | |
| | | | | | 1,126,892 | | | | 42,700 | | | | 102,150 | | | | 0 | | |
Annual Report 2013
33
This page intentionally left blank.
Annual Report 2013
34
This page intentionally left blank.
Annual Report 2013
35
This page intentionally left blank.
Annual Report 2013
36
Columbia LifeGoal® Income Portfolio
Important Information About This Report
Each fund mails one shareholder report to each shareholder address. If you would like more than one report, please call shareholder services at 800.345.6611 and additional reports will be sent to you.
The policy of the Board is to vote the proxies of the companies in which each fund holds investments consistent with the procedures as stated in the Statement of Additional Information (SAI). You may obtain a copy of the SAI without charge by calling 800.345.6611; contacting your financial intermediary; visiting columbiamanagement.com; or searching the website of the Securities and Exchange Commission (SEC) at sec.gov. Information regarding how each fund voted proxies relating to portfolio securities is filed with the SEC by August 31 for the most recent 12-month period ending June 30 of that year, and is available without charge by visiting columbiamanagement.com; or searching the website of the SEC at sec.gov.
Each fund files a complete schedule of portfolio holdings with the SEC for the first and third quarters of each fiscal year on Form N-Q. Each fund's Form N-Q is available on the SEC's website at sec.gov and may be reviewed and copied at the SEC's Public Reference Room in Washington, D.C. Information on the operation of the Public Reference Room may be obtained by calling 800.SEC.0330. Each fund's complete schedule of portfolio holdings, as filed on Form N-Q, can also be obtained without charge, upon request, by calling 800.345.6611.
Annual Report 2013
37

Columbia LifeGoal® Income Portfolio
P.O. Box 8081
Boston, MA 02266-8081
columbiamanagement.com
This information is for use with concurrent or prior delivery of a fund prospectus. Please read and consider the investment objectives, risks, charges and expenses for any fund carefully before investing. For a prospectus which contains this and other important information about the Fund go to columbiamanagement.com. The Fund is distributed by Columbia Management Investment Distributors, Inc., member FINRA, and managed by Columbia Management Investment Advisers, LLC.
© 2013 Columbia Management Investment Advisers, LLC. All rights reserved.
ANN182_01_C01_(03/13)
Annual Report
January 31, 2013

Columbia Capital Allocation Portfolios
Columbia Capital Allocation Conservative Portfolio
(formerly, Columbia Portfolio Builder Conservative Fund)
Columbia Capital Allocation Moderate Conservative Portfolio
(formerly, Columbia LifeGoal® Income and Growth Portfolio)
Columbia Capital Allocation Moderate Portfolio
(formerly, Columbia Portfolio Builder Moderate Fund)
Columbia Capital Allocation Moderate Aggressive Portfolio
(formerly, Columbia LifeGoal® Balanced Growth Portfolio)
Columbia Capital Allocation Aggressive Portfolio
(formerly, Columbia Portfolio Builder Aggressive Fund)
Not FDIC insured • No bank guarantee • May lose value
Columbia Capital Allocation Portfolios
 Dear Shareholders,
U.S. stocks flat, foreign markets strong in 2012 finale
After a strong third quarter, U.S. stock market averages treaded water as 2012 came to a close. However, they ended the year up strongly, as first and third quarter gains more than offset second and fourth quarter weakness. Typically a strong quarter for domestic small- and mid-cap issues, the fourth quarter of 2012 indeed proved to be another year-end positive for small-cap stocks. For the full calendar year 2012, the S&P 500 Index rose 16.00%.
Stock markets outside the United States generated some of the best returns for the fourth quarter, as optimism rebounded, thanks to the September actions of the European Central Bank in support of the euro and an improving outlook from China. Both developed and emerging foreign markets topped U.S. stocks by a solid margin.
Corporate and emerging markets led fixed income
Fixed-income investors took their cue from the equity markets and continued to favor the highest risk sectors through the end of 2012. Global fixed-income returns posted mixed results in the final quarter of the year. Gains were the highest for corporate high-yield and emerging market bonds. Although investors remained cautious ahead of the year-end budget negotiations, better economic data and a further improvement in the European sovereign debt crisis supported riskier assets and depressed government bond prices. In December, the Federal Reserve announced its intention to continue to purchase both Treasury and mortgage-backed securities and said that it would seek to keep short-term interest rates unchanged until the unemployment rate reaches 6.5%, or inflation turned noticeably higher.
Stay on track with Columbia Management
Backed by more than 100 years of experience, Columbia Management is one of the nation's largest asset managers. At the heart of our success — and, most importantly, that of our investors — are highly talented industry professionals, brought together by a unique way of working. We are dedicated to helping you take advantage of today's opportunities and anticipate tomorrow's. We stay abreast of the latest investment trends and ideas, using our collective insight to evaluate events and transform them into solutions you can use.
Visit columbiamanagement.com for:
> The Columbia Management Perspectives blog, featuring timely posts by our investment teams
> Detailed up-to-date fund performance and portfolio information
> Economic analysis and market commentary
> Quarterly fund commentaries
> Columbia Management Investor, our award-winning quarterly newsletter for shareholders
Thank you for your continued support of the Columbia Funds. We look forward to serving your investment needs for many years to come.
Best Regards,

J. Kevin Connaughton
President, Columbia Funds
The S&P 500 Index, an unmanaged index, measures the performance of 500 widely held, large-capitalization U.S. stocks and is frequently used as a general measure of market performance. Indices are not available for investment, are not professionally managed and do not reflect sales charges, fees, brokerage commissions, taxes or other expenses of investing.
Investors should consider the investment objectives, risks, charges and expenses of a mutual fund carefully before investing. For a free prospectus, which contains this and other important information about a fund, visit columbiamanagement.com. The prospectus should be read carefully before investing.
Columbia Funds are distributed by Columbia Management Investment Distributors, Inc., member FINRA, and managed by Columbia Management Investment Advisers, LLC.
© 2013 Columbia Management Investment Advisers, LLC. All rights reserved.
Columbia Capital Allocation Portfolios
| Columbia Capital Allocation Conservative Portfolio | |
Performance Overview | | | 2 | | |
Portfolio Overview | | | 4 | | |
| Columbia Capital Allocation Moderate Conservative Portfolio | |
Performance Overview | | | 5 | | |
Portfolio Overview | | | 7 | | |
| Columbia Capital Allocation Moderate Portfolio | |
Performance Overview | | | 8 | | |
Portfolio Overview | | | 10 | | |
| Columbia Capital Allocation Moderate Aggressive Portfolio | |
Performance Overview | | | 11 | | |
Portfolio Overview | | | 13 | | |
| Columbia Capital Allocation Aggressive Portfolio | |
Performance Overview | | | 14 | | |
Portfolio Overview | | | 16 | | |
Manager Discussion of Fund Performance | | | 17 | | |
Understanding Your Fund's Expenses | | | 20 | | |
Portfolio of Investments | | | 23 | | |
Statements of Assets and Liabilities | | | 57 | | |
Statements of Operations | | | 61 | | |
Statements of Changes in Net Assets | | | 63 | | |
Financial Highlights | | | 73 | | |
Notes to Financial Statements | | | 106 | | |
Reports of Independent Registered
Public Accounting Firm | | | 118 | | |
Federal Tax Information | | | 119 | | |
Trustees and Officers | | | 120 | | |
Shareholder Meeting Results | | | 125 | | |
Important Information About This Report | | | 129 | | |
Fund Investment Manager
Columbia Management Investment
Advisers, LLC
225 Franklin Street
Boston, MA 02110
Fund Distributor
Columbia Management Investment
Distributors, Inc.
225 Franklin Street
Boston, MA 02110
Fund Transfer Agent
Columbia Management Investment
Services Corp.
P.O. Box 8081
Boston, MA 02266-8081
For more information about any of the funds, please visit columbiamanagement.com or call 800.345.6611. Customer Service Representatives are available to answer your questions Monday through Friday from 8 a.m. to 8 p.m. Eastern time.
The views expressed in this report reflect the current views of the respective parties. These views are not guarantees of future performance and involve certain risks, uncertainties and assumptions that are difficult to predict, so actual outcomes and results may differ significantly from the views expressed. These views are subject to change at any time based upon economic, market or other conditions and the respective parties disclaim any responsibility to update such views. These views may not be relied on as investment advice and, because investment decisions for a Columbia Fund are based on numerous factors, may not be relied on as an indication of trading intent on behalf of any particular Columbia Fund. References to specific securities should not be construed as a recommendation or investment advice.
Annual Report 2013
Columbia Capital Allocation Portfolios
Performance Overview
Columbia Capital Allocation Conservative Portfolio
Performance Summary
> Columbia Capital Allocation Conservative Portfolio (the Fund) Class A shares returned 7.62% excluding sales charges for the 12-month period ended January 31, 2013.
> The Fund's bond benchmark, the Barclays U.S. Aggregate Bond Index, returned 2.59% for the same time period.
> The Fund outperformed its Blended Index, which returned 5.26% for the same time period.
> The Fund's domestic equity benchmark, the Russell 3000 Index, returned 16.90% for the same 12 months.
> The Citigroup 3-Month U.S. Treasury Bill Index returned 0.08% for the same 12 months.
> The Fund's international equity benchmark, the MSCI EAFE Index (Gross), returned 17.83% for the 12-month period.
> We attribute the Fund's relative performance to mixed results from asset class allocation and underlying fund performance.
Average Annual Total Returns (%) (for period ended January 31, 2013)
| | | Inception | | 1 Year | | 5 Years | | Life | |
Class A | | 03/04/04 | | | | | | | | | | | | | |
Excluding sales charges | | | | | | | 7.62 | | | | 4.61 | | | | 4.77 | | |
Including sales charges | | | | | 2.55 | | | | 3.59 | | | | 4.20 | | |
Class B | | 03/04/04 | | | | | | | | | | | | | |
Excluding sales charges | | | | | | | 6.79 | | | | 3.83 | | | | 3.97 | | |
Including sales charges | | | | | 1.79 | | | | 3.49 | | | | 3.97 | | |
Class C | | 03/04/04 | | | | | | | | | | | | | |
Excluding sales charges | | | | | | | 6.75 | | | | 3.85 | | | | 3.99 | | |
Including sales charges | | | | | | | 5.75 | | | | 3.85 | | | | 3.99 | | |
Class K (formerly Class R4) | | 03/04/04 | | | 7.62 | | | | 4.77 | | | | 4.93 | | |
Class R* | | 09/27/10 | | | 7.39 | | | | 4.40 | | | | 4.56 | | |
Class Z* | | 09/27/10 | | | 7.91 | | | | 4.74 | | | | 4.84 | | |
Barclays U.S. Aggregate Bond Index | | | | | | | 2.59 | | | | 5.45 | | | | 5.07 | | |
Blended Index | | | | | | | 5.26 | | | | 4.81 | | | | 5.10 | ** | |
Russell 3000 Index | | | | | | | 16.90 | | | | 4.44 | | | | 5.52 | | |
Citigroup 3-Month U.S. Treasury Bill Index | | | | | | | 0.08 | | | | 0.39 | | | | 1.76 | ** | |
MSCI EAFE Index (Gross) | | | | | | | 17.83 | | | | -0.30 | | | | 5.96 | | |
Returns for Class A are shown with and without the maximum initial sales charge of 4.75%. Returns for Class B and are shown with and without the applicable contingent deferred sales charge (CDSC) of 5.00% in the first year, declining to 1.00% in the sixth year and eliminated thereafter. Returns for Class C are shown with and without the 1.00% CDSC for the first year only. The Fund's other classes are not subject to sales charges and have limited eligibility. Please see the Fund's prospectuses for details. Performance for different share classes will vary based on differences in sales charges and fees associated with each class. All results shown assume reinvestment of distributions during the period. Returns do not reflect the deduction of taxes that a shareholder may pay on Fund distributions or on the redemption of Fund shares. Performance results reflect the effect of any fee waivers or reimbursements of Fund expenses by Columbia Management Investment Advisers, LLC and/or any of its affiliates. Absent these fee waivers or expense reimbursement arrangements, performance results would have been lower.
The performance information shown represents past performance and is not a guarantee of future results. The investment return and principal value of your investment will fluctuate so that your shares, when redeemed, may be worth more or less than their original cost. Current performance may be lower or higher than the performance information shown. You may obtain performance information current to the most recent month-end by contacting your financial intermediary, visiting columbiamanagement.com or calling 800.345.6611.
* The returns shown for periods prior to the share class inception date (including returns for the Life of the Fund, if shown, which are since Fund inception) include the returns of the Fund's oldest share class. Since the Fund launched more than one share class at its inception, Class A shares were used. These returns are adjusted to reflect any higher class-related operating expenses of the newer share classes, as applicable. Please visit columbiamanagement.com/mutual-funds/appended-performance for more information.
** From February 29, 2004.
The Barclays U.S. Aggregate Bond Index is a broad-based benchmark that measures the investment grade, U.S. dollar-denominated, fixed-rate taxable bond market, including Treasuries, government-related and corporate securities, mortgage-backed securities (agency fixed-rate and hybrid adjustable-rate mortgage passthroughs), asset-backed securities, and commercial mortgage-backed securities.
The Blended Index consists of 70% Barclays U.S. Aggregate Bond Index, 14% Russell 3000 Index, 10% Citigroup 3-Month U.S. Treasury Bill Index and 6% MSCI EAFE Index (Gross). The Russell 3000 Index, the Citigroup 3-Month U.S. Treasury Bill Index and the MSCI EAFE Index (Gross) are shown in the table because they are separate components of the Blended Index.
The Russell 3000 Index, an unmanaged index, measures the performance of the 3,000 largest U.S. companies based on total market capitalization, which represents approximately 98% of the investable U.S. equity market.
The Citigroup 3-Month U.S. Treasury Bill Index, an unmanaged index, is representative of the performance of three-month Treasury bills.
The MSCI EAFE (Europe, Australasia, Far East) Index (Gross) is a free float-adjusted market capitalization index that is designed to measure the equity market performance of developed markets, excluding the US & Canada. The index is compiled from a composite of securities markets of Europe, Australasia and the Far East and is widely recognized by investors in foreign markets as the measurement index for portfolios of non-North American securities.
Indices are not available for investment, are not professionally managed and do not reflect sales charges, fees, brokerage commissions, taxes or other expenses of investing. Securities in the Fund may not match those in an index.
Annual Report 2013
2
Columbia Capital Allocation Portfolios
Performance Overview (continued)
Columbia Capital Allocation Conservative Portfolio
Performance of a Hypothetical $10,000 Investment (March 4, 2004 – January 31, 2013)
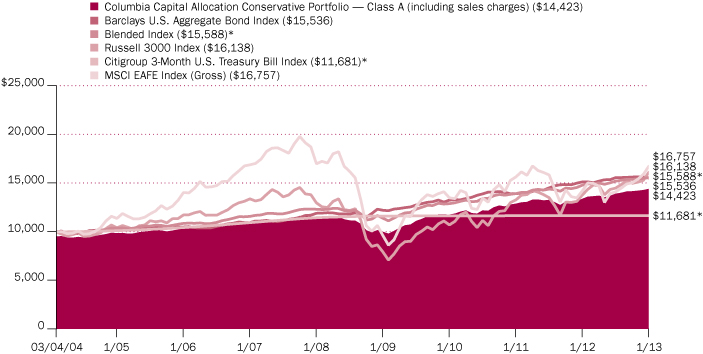
The chart above shows the change in value of a hypothetical $10,000 investment in Class A shares of Columbia Capital Allocation Conservative Portfolio during the stated time period, and does not reflect the deduction of taxes that a shareholder may pay on Fund distributions or on the redemption of Fund shares.
*From February 29, 2004.
Annual Report 2013
3
Columbia Capital Allocation Portfolios
Portfolio Overview
Columbia Capital Allocation Conservative Portfolio
(Unaudited)
Portfolio Breakdown (%)
(at January 31, 2013) | |
Alternative Investment Funds | | | 8.1 | | |
Equity Funds | | | 20.7 | | |
Dividend Income | | | 4.2 | | |
International | | | 4.4 | | |
U.S. Large Cap | | | 8.8 | | |
U.S. Mid Cap | | | 2.6 | | |
U.S. Small Cap | | | 0.7 | | |
Fixed-Income Funds | | | 68.6 | | |
Convertible | | | 1.0 | | |
Emerging Markets | | | 5.0 | | |
Inflation Proteceted Securities | | | 4.9 | | |
Investment Grade | | | 57.7 | | |
Money Market Funds | | | 2.6 | | |
Total | | | 100.0 | | |
Percentages indicated are based upon total investments. The Fund's portfolio composition is subject to change.
Annual Report 2013
4
Columbia Capital Allocation Portfolios
Performance Overview
Columbia Capital Allocation Moderate Conservative Portfolio
Performance Summary
> Columbia Capital Allocation Moderate Conservative Portfolio (the Fund) Class A shares returned 8.94% excluding sales charges for the 12-month period ended January 31, 2013.
> The Fund underperformed its equity benchmark, the S&P 500 Index, which returned 16.78% for the same 12 months.
> The Fund outperformed its fixed-income benchmark, the Barclays U.S. Aggregate Bond Index, which returned 2.59% for the same time period.
> We attribute the Fund's relative performance to mixed results from asset class allocation and underlying fund performance.
Average Annual Total Returns (%) (for period ended January 31, 2013)
| | | Inception | | 1 Year | | 5 Years | | 10 Years | |
Class A | | 10/15/96 | | | | | | | | | | | | | |
Excluding sales charges | | | | | | | 8.94 | | | | 5.64 | | | | 6.65 | | |
Including sales charges | | | | | | | 2.67 | | | | 4.40 | | | | 6.02 | | |
Class B | | 08/07/97 | | | | | | | | | | | | | |
Excluding sales charges | | | | | | | 8.17 | | | | 4.85 | | | | 5.86 | | |
Including sales charges | | | | | | | 3.17 | | | | 4.52 | | | | 5.86 | | |
Class C | | 10/15/96 | | | | | | | | | | | | | |
Excluding sales charges | | | | | | | 8.13 | | | | 4.85 | | | | 5.86 | | |
Including sales charges | | | | | | | 7.13 | | | | 4.85 | | | | 5.86 | | |
Class R* | | 01/23/06 | | | 8.76 | | | | 5.39 | | | | 6.39 | | |
Class R4* | | 11/08/12 | | | 8.95 | | | | 5.64 | | | | 6.65 | | |
Class R5* | | 11/08/12 | | | 8.98 | | | | 5.65 | | | | 6.65 | | |
Class Z | | 10/15/96 | | | 9.22 | | | | 5.91 | | | | 6.90 | | |
S&P 500 Index | | | | | | | 16.78 | | | | 3.97 | | | | 7.93 | | |
Barclays U.S. Aggregate Bond Index | | | | | | | 2.59 | | | | 5.45 | | | | 5.10 | | |
Returns for Class A are shown with and without the maximum initial sales charge of 5.75%. Returns for Class B and are shown with and without the applicable contingent deferred sales charge (CDSC) of 5.00% in the first year, declining to 1.00% in the sixth year and eliminated thereafter. Returns for Class C are shown with and without the 1.00% CDSC for the first year only. The Fund's other classes are not subject to sales charges and have limited eligibility. Please see the Fund's prospectuses for details. Performance for different share classes will vary based on differences in sales charges and fees associated with each class. All results shown assume reinvestment of distributions during the period. Returns do not reflect the deduction of taxes that a shareholder may pay on Fund distributions or on the redemption of Fund shares. Performance results reflect the effect of any fee waivers or reimbursements of Fund expenses by Columbia Management Investment Advisers, LLC and/or any of its affiliates. Absent these fee waivers or expense reimbursement arrangements, performance results would have been lower.
The performance information shown represents past performance and is not a guarantee of future results. The investment return and principal value of your investment will fluctuate so that your shares, when redeemed, may be worth more or less than their original cost. Current performance may be lower or higher than the performance information shown. You may obtain performance information current to the most recent month-end by contacting your financial intermediary, visiting columbiamanagement.com or calling 800.345.6611.
*The returns shown for periods prior to the share class inception date (including returns for the Life of the Fund, if shown, which are since Fund inception) include the returns of the Fund's oldest share class. Since the Fund launched more than one share class at its inception, Class A shares were used. These returns are adjusted to reflect any higher class-related operating expenses of the newer share classes, as applicable. Please visit columbiamanagement.com/mutual-funds/appended-performance for more information.
The S&P 500 Index, an unmanaged index, measures the performance of 500 widely held, large-capitalization U.S. stocks and is frequently used as a general measure of market performance.
The Barclays U.S. Aggregate Bond Index is a broad-based benchmark that measures the investment grade, U.S. dollar-denominated, fixed-rate taxable bond market, including Treasuries, government-related and corporate securities, mortgage-backed securities (agency fixed-rate and hybrid adjustable-rate mortgage passthroughs), asset-backed securities, and commercial mortgage-backed securities.
Indices are not available for investment, are not professionally managed and do not reflect sales charges, fees, brokerage commissions, taxes or other expenses of investing. Securities in the Fund may not match those in an index.
Annual Report 2013
5
Columbia Capital Allocation Portfolios
Performance Overview (continued)
Columbia Capital Allocation Moderate Conservative Portfolio
Performance of a Hypothetical $10,000 Investment (February 1, 2003 – January 31, 2013)
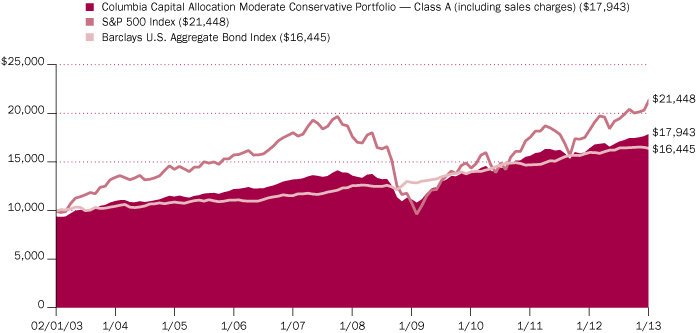
The chart above shows the change in value of a hypothetical $10,000 investment in Class A shares of Columbia Capital Allocation Moderate Conservative Portfolio during the stated time period, and does not reflect the deduction of taxes that a shareholder may pay on Fund distributions or on the redemption of Fund shares.
Annual Report 2013
6
Columbia Capital Allocation Portfolios
Portfolio Overview
Columbia Capital Allocation Moderate Conservative Portfolio
(Unaudited)
Portfolio Breakdown (%)
(at January 31, 2013) | |
Alternative Investment Funds | | | 4.9 | | |
Equity Funds | | | 29.8 | | |
Dividend Income | | | 5.9 | | |
International | | | 3.6 | | |
U.S. Large Cap | | | 14.9 | | |
U.S. Mid Cap | | | 4.2 | | |
U.S. Small Cap | | | 1.2 | | |
Fixed-Income Funds | | | 57.6 | | |
Convertible | | | 3.0 | | |
Emerging Markets | | | 3.5 | | |
High Yield | | | 8.5 | | |
International | | | 2.9 | | |
Investment Grade | | | 39.7 | | |
Inflation-Indexed Bonds | | | 4.3 | | |
Money Market Funds | | | 3.4 | | |
Total | | | 100.0 | | |
Percentages indicated are based upon total investments. The Fund's portfolio composition is subject to change.
Annual Report 2013
7
Columbia Capital Allocation Portfolios
Performance Overview
Columbia Capital Allocation Moderate Portfolio
Performance Summary
> Columbia Capital Allocation Moderate Portfolio (the Fund) Class A shares returned 10.87% excluding sales charges for the 12-month period ended January 31, 2013.
> The Fund's bond benchmark, the Barclays U.S. Aggregate Bond Index, returned 2.59% for the same time period.
> The Fund outperformed its Blended Index, which returned 9.94% for the same time period.
> The Fund's domestic equity benchmark, the Russell 3000 Index, returned 16.90% for the same 12 months.
> The Fund's international equity benchmark, the MSCI EAFE Index (Gross), returned 17.83% for the 12-month period.
> We attribute the Fund's relative performance to mixed results from asset class allocation and underlying fund performance.
Average Annual Total Returns (%) (for period ended January 31, 2013)
| | | Inception | | 1 Year | | 5 Years | | Life | |
Class A | | 03/04/04 | | | | | | | | | | | | | |
Excluding sales charges | | | | | | | 10.87 | | | | 4.87 | | | | 5.82 | | |
Including sales charges | | | | | | | 4.46 | | | | 3.63 | | | | 5.12 | | |
Class B | | 03/04/04 | | | | | | | | | | | | | |
Excluding sales charges | | | | | | | 9.99 | | | | 4.07 | | | | 5.01 | | |
Including sales charges | | | | | | | 4.99 | | | | 3.72 | | | | 5.01 | | |
Class C | | 03/04/04 | | | | | | | | | | | | | |
Excluding sales charges | | | | | | | 9.95 | | | | 4.09 | | | | 5.02 | | |
Including sales charges | | | | | | | 8.95 | | | | 4.09 | | | | 5.02 | | |
Class K (formerly Class R4) | | 03/04/04 | | | 10.94 | | | | 5.05 | | | | 6.03 | | |
Class R* | | 09/27/10 | | | 10.46 | | | | 4.59 | | | | 5.55 | | |
Class Z* | | 09/27/10 | | | 10.98 | | | | 4.97 | | | | 5.88 | | |
Barclays U.S. Aggregate Bond Index | | | | | | | 2.59 | | | | 5.45 | | | | 5.07 | | |
Blended Index | | | | | | | 9.94 | | | | 4.80 | | | | 5.76 | | |
Russell 3000 Index | | | | | | | 16.90 | | | | 4.44 | | | | 5.52 | | |
MSCI EAFE Index (Gross) | | | | | | | 17.83 | | | | -0.30 | | | | 5.96 | | |
Returns for Class A are shown with and without the maximum initial sales charge of 5.75%. Returns for Class B and are shown with and without the applicable contingent deferred sales charge (CDSC) of 5.00% in the first year, declining to 1.00% in the sixth year and eliminated thereafter. Returns for Class C are shown with and without the 1.00% CDSC for the first year only. The Fund's other classes are not subject to sales charges and have limited eligibility. Please see the Fund's prospectuses for details. Performance for different share classes will vary based on differences in sales charges and fees associated with each class. All results shown assume reinvestment of distributions during the period. Returns do not reflect the deduction of taxes that a shareholder may pay on Fund distributions or on the redemption of Fund shares. Performance results reflect the effect of any fee waivers or reimbursements of Fund expenses by Columbia Management Investment Advisers, LLC and/or any of its affiliates. Absent these fee waivers or expense reimbursement arrangements, performance results would have been lower.
The performance information shown represents past performance and is not a guarantee of future results. The investment return and principal value of your investment will fluctuate so that your shares, when redeemed, may be worth more or less than their original cost. Current performance may be lower or higher than the performance information shown. You may obtain performance information current to the most recent month-end by contacting your financial intermediary, visiting columbiamanagement.com or calling 800.345.6611.
*The returns shown for periods prior to the share class inception date (including returns for the Life of the Fund, if shown, which are since Fund inception) include the returns of the Fund's oldest share class. Since the Fund launched more than one share class at its inception, Class A shares were used. These returns are adjusted to reflect any higher class-related operating expenses of the newer share classes, as applicable. Please visit columbiamanagement.com/mutual-funds/appended-performance for more information.
The Barclays U.S. Aggregate Bond Index is a broad-based benchmark that measures the investment grade, U.S. dollar-denominated, fixed-rate taxable bond market, including Treasuries, government-related and corporate securities, mortgage-backed securities (agency fixed-rate and hybrid adjustable-rate mortgage passthroughs), asset-backed securities, and commercial mortgage-backed securities.
The Blended Index consists of 50% Barclays U.S. Aggregate Bond Index, 35% Russell 3000 Index and 15% MSCI EAFE Index (Gross). The Russell 3000 Index and the MSCI EAFE Index (Gross) are shown in the table because they are separate components of the Blended Index.
The Russell 3000 Index, an unmanaged index, measures the performance of the 3,000 largest U.S. companies based on total market capitalization, which represents approximately 98% of the investable U.S. equity market.
The MSCI EAFE (Europe, Australasia, Far East) Index (Gross) is a free float-adjusted market capitalization index that is designed to measure the equity market performance of developed markets, excluding the US & Canada. The index is compiled from a composite of securities markets of Europe, Australasia and the Far East and is widely recognized by investors in foreign markets as the measurement index for portfolios of non-North American securities.
Indices are not available for investment, are not professionally managed and do not reflect sales charges, fees, brokerage commissions, taxes or other expenses of investing. Securities in the Fund may not match those in an index.
Annual Report 2013
8
Columbia Capital Allocation Portfolios
Performance Overview (continued)
Columbia Capital Allocation Moderate Portfolio
Performance of a Hypothetical $10,000 Investment (March 4, 2004 – January 31, 2013)
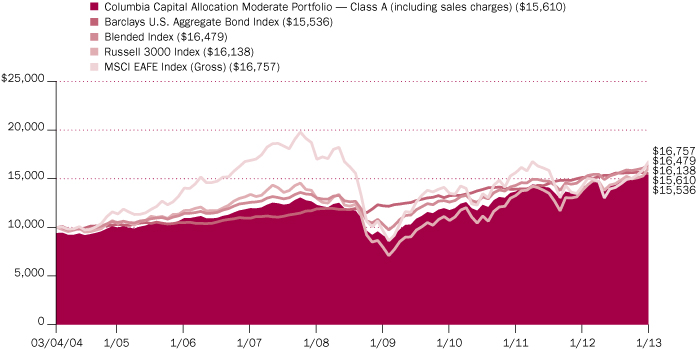
The chart above shows the change in value of a hypothetical $10,000 investment in Class A shares of Columbia Capital Allocation Moderate Portfolio during the stated time period, and does not reflect the deduction of taxes that a shareholder may pay on Fund distributions or on the redemption of Fund shares.
Annual Report 2013
9
Columbia Capital Allocation Portfolios
Portfolio Overview
Columbia Capital Allocation Moderate Portfolio
(Unaudited)
Portfolio Breakdown (%)
(at Jannuuary 31, 2013) | |
Alternative Investment Funds | | | 4.0 | | |
Equity Funds | | | 51.2 | | |
Dividend Income | | | 5.6 | | |
International | | | 13.4 | | |
U.S. Large Cap | | | 20.6 | | |
U.S. Mid Cap | | | 8.5 | | |
U.S. Small Cap | | | 3.1 | | |
Fixed-Income Funds | | | 44.5 | | |
Convertible | | | 2.6 | | |
Emerging Markets | | | 2.0 | | |
High Yield | | | 4.2 | | |
Inflation Proteceted Securities | | | 1.4 | | |
Investment Grade | | | 34.3 | | |
Money Market Funds | | | 0.3 | | |
Total | | | 100.0 | | |
Percentages indicated are based upon total investments. The Fund's portfolio composition is subject to change.
Annual Report 2013
10
Columbia Capital Allocation Portfolios
Performance Overview
Columbia Capital Allocation Moderate Aggressive Portfolio
Performance Summary
> Columbia Capital Allocation Moderate Aggressive Portfolio (the Fund) Class A shares returned 11.28% excluding sales charges for the 12-month period ended January 31, 2013.
> The Fund underperformed its equity benchmark, the S&P 500 Index, which returned 16.78% for the same 12 months.
> The Fund outperformed its fixed-income benchmark, the Barclays U.S. Aggregate Bond Index, which returned 2.59% for the same time period.
> We attribute the Fund's relative performance to mixed results from asset class allocation and underlying fund performance.
Average Annual Total Returns (%) (for period ended January 31, 2013)
| | | Inception | | 1 Year | | 5 Years | | 10 Years | |
Class A | | 10/15/96 | | | | | | | | | | | | | |
Excluding sales charges | | | | | | | 11.28 | | | | 5.35 | | | | 8.14 | | |
Including sales charges | | | | | | | 4.87 | | | | 4.10 | | | | 7.50 | | |
Class B | | 08/13/97 | | | | | | | | | | | | | |
Excluding sales charges | | | | | | | 10.45 | | | | 4.54 | | | | 7.32 | | |
Including sales charges | | | | | | | 5.45 | | | | 4.20 | | | | 7.32 | | |
Class C | | 10/15/96 | | | | | | | | | | | | | |
Excluding sales charges | | | | | | | 10.49 | | | | 4.55 | | | | 7.33 | | |
Including sales charges | | | | | | | 9.49 | | | | 4.55 | | | | 7.33 | | |
Class R* | | 01/23/06 | | | 11.01 | | | | 5.09 | | | | 7.87 | | |
Class R4* | | 11/08/12 | | | 11.33 | | | | 5.36 | | | | 8.15 | | |
Class R5* | | 11/08/12 | | | 11.37 | | | | 5.37 | | | | 8.15 | | |
Class T* | | 03/07/11 | | | | | | | | | | | | | |
Excluding sales charges | | | | | | | 11.23 | | | | 5.30 | | | | 8.09 | | |
Including sales charges | | | | | | | 4.83 | | | | 4.05 | | | | 7.45 | | |
Class Z | | 10/15/96 | | | 11.57 | | | | 5.60 | | | | 8.42 | | |
S&P 500 Index | | | | | | | 16.78 | | | | 3.97 | | | | 7.93 | | |
Barclays U.S. Aggregate Bond Index | | | | | | | 2.59 | | | | 5.45 | | | | 5.10 | | |
Returns for Class A and Class T are shown with and without the maximum initial sales charge of 5.75%. Returns for Class B and are shown with and without the applicable contingent deferred sales charge (CDSC) of 5.00% in the first year, declining to 1.00% in the sixth year and eliminated thereafter. Returns for Class C are shown with and without the 1.00% CDSC for the first year only. The Fund's other classes are not subject to sales charges and have limited eligibility. Please see the Fund's prospectuses for details. Performance for different share classes will vary based on differences in sales charges and fees associated with each class. All results shown assume reinvestment of distributions during the period. Returns do not reflect the deduction of taxes that a shareholder may pay on Fund distributions or on the redemption of Fund shares. Performance results reflect the effect of any fee waivers or reimbursements of Fund expenses by Columbia Management Investment Advisers, LLC and/or any of its affiliates. Absent these fee waivers or expense reimbursement arrangements, performance results would have been lower.
The performance information shown represents past performance and is not a guarantee of future results. The investment return and principal value of your investment will fluctuate so that your shares, when redeemed, may be worth more or less than their original cost. Current performance may be lower or higher than the performance information shown. You may obtain performance information current to the most recent month-end by contacting your financial intermediary, visiting columbiamanagement.com or calling 800.345.6611.
*The returns shown for periods prior to the share class inception date (including returns for the Life of the Fund, if shown, which are since Fund inception) include the returns of the Fund's oldest share class. Since the Fund launched more than one share class at its inception, Class A shares were used. These returns are adjusted to reflect any higher class-related operating expenses of the newer share classes, as applicable. Please visit columbiamanagement.com/mutual-funds/appended-performance for more information.
The S&P 500 Index, an unmanaged index, measures the performance of 500 widely held, large-capitalization U.S. stocks and is frequently used as a general measure of market performance.
The Barclays U.S. Aggregate Bond Index is a broad-based benchmark that measures the investment grade, U.S. dollar-denominated, fixed-rate taxable bond market, including Treasuries, government-related and corporate securities, mortgage-backed securities (agency fixed-rate and hybrid adjustable-rate mortgage passthroughs), asset-backed securities, and commercial mortgage-backed securities.
Indices are not available for investment, are not professionally managed and do not reflect sales charges, fees, brokerage commissions, taxes or other expenses of investing. Securities in the Fund may not match those in an index.
Annual Report 2013
11
Columbia Capital Allocation Portfolios
Performance Overview (continued)
Columbia Capital Allocation Moderate Aggressive Portfolio
Performance of a Hypothetical $10,000 Investment (February 1, 2003 – January 31, 2013)
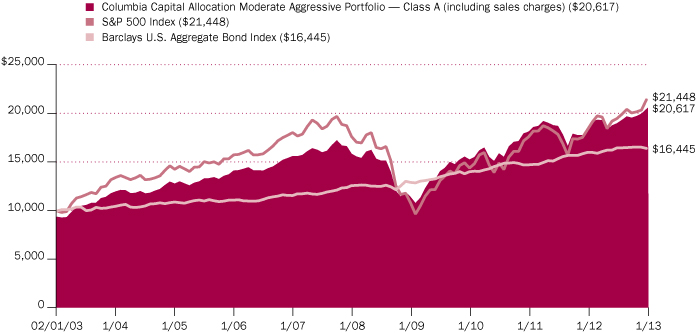
The chart above shows the change in value of a hypothetical $10,000 investment in Class A shares of Columbia Capital Allocation Moderate Aggressive Portfolio during the stated time period, and does not reflect the deduction of taxes that a shareholder may pay on Fund distributions or on the redemption of Fund shares.
Annual Report 2013
12
Columbia Capital Allocation Portfolios
Portfolio Overview
Columbia Capital Allocation Moderate Aggressive Portfolio
(Unaudited)
Portfolio Breakdown (%)
(at January 31, 2013) | |
Alternative Investment Funds | | | 6.1 | | |
Common Stocks | | | 0.0 | (a) | |
Equity Funds | | | 60.6 | | |
Dividend Income | | | 6.1 | | |
International | | | 12.0 | | |
U.S. Large Cap | | | 26.3 | | |
U.S. Mid Cap | | | 9.1 | | |
U.S. Small Cap | | | 7.1 | | |
Fixed-Income Funds | | | 28.8 | | |
Convertible | | | 2.0 | | |
Emerging Markets | | | 2.0 | | |
High Yield | | | 4.5 | | |
International | | | 1.9 | | |
Investment Grade | | | 18.4 | | |
Inflation-Indexed Bonds | | | 2.5 | | |
Money Market Funds | | | 2.0 | | |
Total | | | 100.0 | | |
Percentages indicated are based upon total investments. The Fund's portfolio composition is subject to change.
(a) Rounds to zero.
Annual Report 2013
13
Columbia Capital Allocation Portfolios
Performance Overview
Columbia Capital Allocation Aggressive Portfolio
Performance Summary
> Columbia Capital Allocation Aggressive Portfolio (the Fund) Class A shares returned 13.63% excluding sales charges for the 12-month period ended January 31, 2013.
> The Fund's domestic equity benchmark, the Russell 3000 Index, returned 16.90% for the same 12 months.
> The Fund underperformed its Blended Index, which returned 14.34% for the same time period.
> The Fund's international equity benchmark, the MSCI EAFE Index (Gross), returned 17.83% for the 12-month period.
> The Fund's bond benchmark, the Barclays U.S. Aggregate Bond Index, returned 2.59% for the same time period.
> We attribute the Fund's relative performance to mixed results from asset class allocation and underlying fund performance.
Average Annual Total Returns (%) (for period ended January 31, 2013)
| | | Inception | | 1 Year | | 5 Years | | Life | |
Class A | | 03/04/04 | | | | | | | | | | | | | |
Excluding sales charges | | | | | | | 13.63 | | | | 3.52 | | | | 5.44 | | |
Including sales charges | | | | | | | 7.11 | | | | 2.30 | | | | 4.75 | | |
Class B | | 03/04/04 | | | | | | | | | | | | | |
Excluding sales charges | | | | | | | 12.80 | | | | 2.74 | | | | 4.64 | | |
Including sales charges | | | | | | | 7.80 | | | | 2.38 | | | | 4.64 | | |
Class C | | 03/04/04 | | | | | | | | | | | | | |
Excluding sales charges | | | | | | | 12.86 | | | | 2.76 | | | | 4.63 | | |
Including sales charges | | | | | | | 11.86 | | | | 2.76 | | | | 4.63 | | |
Class K (formerly Class R4) | | 03/04/04 | | | 13.84 | | | | 3.75 | | | | 5.64 | | |
Class R* | | 09/27/10 | | | 13.38 | | | | 3.29 | | | | 5.22 | | |
Class Z* | | 09/27/10 | | | 13.87 | | | | 3.64 | | | | 5.52 | | |
Russell 3000 Index | | | | | | | 16.90 | | | | 4.44 | | | | 5.52 | | |
Blended Index | | | | | | | 14.34 | | | | 3.90 | | | | 5.83 | | |
MSCI EAFE Index (Gross) | | | | | | | 17.83 | | | | -0.30 | | | | 5.96 | | |
Barclays U.S. Aggregate Bond Index | | | | | | | 2.59 | | | | 5.45 | | | | 5.07 | | |
Returns for Class A are shown with and without the maximum initial sales charge of 5.75%. Returns for Class B and are shown with and without the applicable contingent deferred sales charge (CDSC) of 5.00% in the first year, declining to 1.00% in the sixth year and eliminated thereafter. Returns for Class C are shown with and without the 1.00% CDSC for the first year only. The Fund's other classes are not subject to sales charges and have limited eligibility. Please see the Fund's prospectuses for details. Performance for different share classes will vary based on differences in sales charges and fees associated with each class. All results shown assume reinvestment of distributions during the period. Returns do not reflect the deduction of taxes that a shareholder may pay on Fund distributions or on the redemption of Fund shares. Performance results reflect the effect of any fee waivers or reimbursements of Fund expenses by Columbia Management Investment Advisers, LLC and/or any of its affiliates. Absent these fee waivers or expense reimbursement arrangements, performance results would have been lower.
The performance information shown represents past performance and is not a guarantee of future results. The investment return and principal value of your investment will fluctuate so that your shares, when redeemed, may be worth more or less than their original cost. Current performance may be lower or higher than the performance information shown. You may obtain performance information current to the most recent month-end by contacting your financial intermediary, visiting columbiamanagement.com or calling 800.345.6611.
*The returns shown for periods prior to the share class inception date (including returns for the Life of the Fund, if shown, which are since Fund inception) include the returns of the Fund's oldest share class. Since the Fund launched more than one share class at its inception, Class A shares were used. These returns are adjusted to reflect any higher class-related operating expenses of the newer share classes, as applicable. Please visit columbiamanagement.com/mutual-funds/appended-performance for more information.
The Russell 3000 Index, an unmanaged index, measures the performance of the 3,000 largest U.S. companies based on total market capitalization, which represents approximately 98% of the investable U.S. equity market.
The Blended Index consists of 56% Russell 3000 Index, 24% MSCI EAFE Index (Gross) and 20% Barclays U.S. Aggregate Bond Index. The MSCI EAFE Index (Gross) and the Barclays U.S. Aggregate Bond Index are shown in the table because they are separate components of the Blended Index.
The MSCI EAFE (Europe, Australasia, Far East) Index (Gross) is a free float-adjusted market capitalization index that is designed to measure the equity market performance of developed markets, excluding the US & Canada. The index is compiled from a composite of securities markets of Europe, Australasia and the Far East and is widely recognized by investors in foreign markets as the measurement index for portfolios of non-North American securities.
The Barclays U.S. Aggregate Bond Index is a broad-based benchmark that measures the investment grade, U.S. dollar-denominated, fixed-rate taxable bond market, including Treasuries, government-related and corporate securities, mortgage-backed securities (agency fixed-rate and hybrid adjustable-rate mortgage passthroughs), asset-backed securities, and commercial mortgage-backed securities.
Indices are not available for investment, are not professionally managed and do not reflect sales charges, fees, brokerage commissions, taxes or other expenses of investing. Securities in the Fund may not match those in an index.
Annual Report 2013
14
Columbia Capital Allocation Portfolios
Performance Overview (continued)
Columbia Capital Allocation Aggressive Portfolio
Performance of a Hypothetical $10,000 Investment (March 4, 2004 – January 31, 2013)
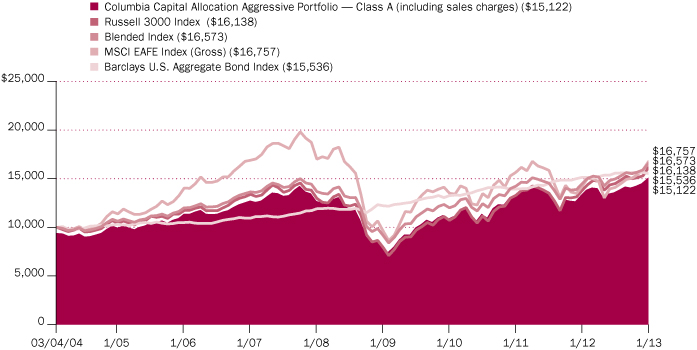
The chart above shows the change in value of a hypothetical $10,000 investment in Class A shares of Columbia Capital Allocation Aggressive Portfolio during the stated time period, and does not reflect the deduction of taxes that a shareholder may pay on Fund distributions or on the redemption of Fund shares.
Annual Report 2013
15
Columbia Capital Allocation Portfolios
Portfolio Overview
Columbia Capital Allocation Aggressive Portfolio
(Unaudited)
Portfolio Breakdown (%)
(at January 31, 2013) | |
Alternative Investment Funds | | | 3.3 | | |
Equity Funds | | | 82.3 | | |
Dividend Income | | | 5.3 | | |
International | | | 21.8 | | |
Real Estate | | | 1.9 | | |
U.S. Large Cap | | | 34.4 | | |
U.S. Mid Cap | | | 13.7 | | |
U.S. Small Cap | | | 5.2 | | |
Fixed-Income Funds | | | 13.5 | | |
High Yield | | | 3.2 | | |
Investment Grade | | | 10.3 | | |
Money Market Funds | | | 0.9 | | |
Total | | | 100.0 | | |
Percentages indicated are based upon total investments. The Fund's portfolio composition is subject to change.
Annual Report 2013
16
Columbia Capital Allocation Portfolios
Manager Discussion of Fund Performance
Effective December 14, 2012, Columbia Portfolio Builder Conservative Fund was renamed Columbia Capital Allocation Conservative Portfolio, Columbia LifeGoal® Income and Growth Portfolio was renamed Columbia Capital Allocation Moderate Conservative Portfolio, Columbia Portfolio Builder Moderate Fund was renamed Columbia Capital Allocation Moderate Portfolio, Columbia LifeGoal® Balanced Growth Portfolio was renamed Columbia Capital Allocation Moderate Aggressive Portfolio and Columbia Portfolio Builder Aggressive Fund was renamed Columbia Capital Allocation Aggressive Portfolio.
All Fund returns listed below are for Class A shares excluding sales charges for the 12-month period that ended January 31, 2013. We attribute the Funds' relative performance to mixed results from asset class allocation and underlying fund performance.
> Columbia Capital Allocation Conservative Portfolio (the Fund) returned 7.62%. The Fund outperformed its Blended Index, composed of 70% Barclays U.S. Aggregate Bond Index, 14% Russell 3000 Index, 10% Citigroup 3-Month U.S. Treasury Bill Index and 6% MSCI EAFE Index (Gross), which returned 5.26% for the 12-month period.
> Columbia Capital Allocation Moderate Conservative Portfolio (the Fund) returned 8.94%. The Fund underperformed the S&P 500 Index, which returned 16.78%, but outperformed the Barclays U.S. Aggregate Bond Index, which returned 2.59% for the 12-month period.
> Columbia Capital Allocation Moderate Portfolio (the Fund) returned 10.87%. The Fund outperformed its Blended Index, composed of 50% Barclays U.S. Aggregate Bond Index, 35% Russell 3000 Index and 15% MSCI EAFE Index (Gross), which returned 9.94% for the 12-month period.
> Columbia Capital Allocation Moderate Aggressive Portfolio (the Fund) returned 11.28%. The Fund underperformed the S&P 500 Index, which returned 16.78%, but outperformed the Barclays U.S. Aggregate Bond Index, which returned 2.59% for the 12-month period.
> Columbia Capital Allocation Aggressive Portfolio (the Fund) returned 13.63%. The Fund underperformed its Blended Index, composed of 56% Russell 3000 Index, 24% MSCI EAFE Index (Gross) and 20% Barclays U.S. Aggregate Bond Index, which returned 14.34% for the 12-month period.
During the same time frame, the Russell 3000 Index, which measures domestic equities, returned 16.90%; the Barclays U.S. Aggregate Bond Index, which measures the U.S. fixed income market, returned 2.59%; the MSCI EAFE Index (Gross), which measures international equities, returned 17.83%; and the Citigroup 3-Month U.S. Treasury Bill Index returned 0.08% for the 12-month period.
Financial Markets Advanced Despite Market Gyrations
A rally in financial markets spanned the annual period, however it was not without a healthy dose of skepticism and market gyrations along the way. From the beginning of the annual period in February 2012 through early April 2012, global equity prices advanced at a brisk pace. Conversely, most core fixed income sectors lost ground during these months. Then, from early April 2012 through early June 2012, the equity markets corrected significantly. Concerns had surfaced around political negotiations in Washington D.C., and worries heightened about the pace of economic growth in Europe and China and
Portfolio Management
Jeffrey Knight, CFA*
Anwiti Bahuguna, Ph.D.
Melda Mergen, CFA, CAIA
Marie Schofield, CFA
Beth Vanney, CFA
*Effective February 11, 2013, Mr. Knight joined the team responsible for the day-to-day portfolio management of the Fund as the Lead Portfolio Manager.
Annual Report 2013
17
Columbia Capital Allocation Portfolios
Manager Discussion of Fund Performance (continued)
geopolitical turmoil in the Middle East. In the U.S., economic data lost momentum as a disappointing series of payroll reports, sentiment indicators, the Institute for Supply Management manufacturing figures and inflation all exhibited cautionary readings. Bond investors also turned more cautious, with most fixed income sectors posting single-digit gains and conservative U.S. Treasuries among the strongest performers.
From early June 2012 through the remainder of the annual period ended January 31, 2013, riskier assets performed strongly. U.S. equities enjoyed double-digit gains. Bonds generated more mixed performance given improving investor sentiment. The Barclays U.S. Aggregate Bond Index, a broad measure for core bonds across the U.S. market, rose just less than 1% from the start of June 2012 through the end of January 2013. However, two areas that bucked the muted trend in the fixed income markets were U.S. high yield corporate bonds and emerging market bonds, which each posted gains of more than 12% from early June 2012 through the end of January 2013. The strong performance by riskier assets during these months was driven by several factors but included the European Central Bank's indication that it would do whatever it takes to preserve the currency union; the resolution of the U.S. presidential elections; improved U.S. housing, export and consumer spending data; seemingly stabilized economic growth in China; and anticipation of policies to be implemented by Japan's newly-elected prime minister Shinzo Abe. Further, stronger global economic growth overall, a cheaper U.S. dollar and a continued decline in borrowing costs contributed to a more favorable outlook for corporate profitability in the U.S.
Positioning and Underlying Fund Performance Generated Mixed Results
For each Fund, areas that contributed favorably to relative returns during the annual period overall included investments in underlying funds focused on emerging market equities, European developed market equities, U.S. large-cap equities, U.S. high yield corporate bonds, emerging market bonds and convertible, or hybrid, securities. The Funds' exposure to alternative assets, via underlying funds employing absolute return strategies, added value as well.
Areas that detracted from the Funds' relative results during the annual period included an underweight to international developed market equities, challenged relative performance in the mid-cap growth and small-cap segments of the U.S. equity market, and exposure to commodities, which in general produced nearly flat returns — all via investments in underlying funds.
Various Factors Drove Fund Changes
Asset class changes within the Funds can be driven by active trading, by directing allocations to select asset classes or by market appreciation or depreciation within a given asset class. In Columbia Capital Allocation Aggressive Portfolio, there were no significant changes made during the annual period, though its allocation to U.S. large-cap equities increased slightly and its exposure to alternative absolute return strategies decreased modestly. In Columbia Capital Allocation Moderate Aggressive Portfolio, its allocations to U.S. large-cap equities and to U.S. small-cap equities increased and its weighting in international developed market equities decreased. In Columbia Capital Allocation Moderate Portfolio, its exposure to emerging market equities
Annual Report 2013
18
Columbia Capital Allocation Portfolios
Manager Discussion of Fund Performance (continued)
increased, while its exposure to U.S. core bonds decreased. In Columbia Capital Allocation Moderate Conservative Portfolio, its weightings in U.S. large-cap equities and U.S. small-cap equities increased, and its allocation to international developed market equities decreased. In Columbia Capital Allocation Conservative Portfolio, its allocation to U.S. large-cap equities and to alternative absolute return strategies increased, while its exposure to convertible/flexible capital strategies decreased.
Looking Ahead
Global equities posted strong gains to start calendar year 2013, with the S&P 500 Index rallying to a new cyclical high. Indeed, as of January 31, 2013, the S&P 500 Index stood just shy of its all-time peak hit in 2007. With macroeconomic fears subsiding over the last few months of the annual period, the new concern amongst many on Wall Street was that excessive investor complacency may be growing. Whether or not complacency is creeping into investors' psyche or not is, of course, open for debate. However, we do expect the upcoming year to be marked by global economic growth that proves to be a little better than seen in 2012, despite the drag from potential fiscal policy and debt issues in the U.S., Japan and the Eurozone. China's re-acceleration of economic growth is expected to help both fiscal policy and debt issues arithmetically and is also likely, in our view, to have a disproportionate impact on investor confidence through much of the world.
Equity risk premiums were still significantly elevated versus long-term averages at the end of the annual period and dividends exceeded corporate bond yields for some firms. We believe this indicates that many investors are clearly seeking income over capital gains. We currently expect this search for yield by investors to continue. Amidst this environment, we feel investors should focus on risk-adjusted returns and emphasize risk diversification. Investors should be advised, however, that diversification does not assure a profit or guarantee against a loss.
Annual Report 2013
19
Columbia Capital Allocation Portfolios
Understanding Your Fund's Expenses
(Unaudited)
As an investor, you incur two types of costs. There are transaction costs, which generally include sales charges on purchases and may include redemption fees. There are also ongoing costs, which generally include management fees, distribution and service (Rule 12b-1) fees, and other Fund expenses. The following information is intended to help you understand your ongoing costs (in dollars) of investing in the Fund and to help you compare these costs with the ongoing costs of investing in other mutual funds.
Analyzing Your Fund's Expenses
To illustrate these ongoing costs, we have provided examples and calculated the expenses paid by investors in each share class of the Fund during the period. The actual and hypothetical information in the table is based on an initial investment of $1,000 at the beginning of the period indicated and held for the entire period. Expense information is calculated two ways and each method provides you with different information. The amount listed in the "Actual" column is calculated using the Fund's actual operating expenses and total return for the period. You may use the Actual information, together with the amount invested, to estimate the expenses that you paid over the period. Simply divide your account value by $1,000 (for example, an $8,600 account value divided by $1,000 = 8.6), then multiply the results by the expenses paid during the period under the Actual column. The amount listed in the "Hypothetical" column assumes a 5% annual rate of return before expenses (which is not the Fund's actual return) and then applies the Fund's actual expense ratio for the period to the hypothetical return. You should not use the hypothetical account values and expenses to estimate either your actual account balance at the end of the period or the expenses you paid during the period. See "Compare With Other Funds" below for details on how to use the hypothetical data.
In addition to the ongoing expenses which the Fund bears directly, the Fund's shareholders indirectly bear the Fund's allocable share of the costs and expenses of each underlying fund in which the Fund invests. You can also estimate the effective expenses paid during the period, which includes the indirect fees associated with investing in the underlying funds, by using the amounts listed in the effective expenses paid during the period column.
Compare With Other Funds
Since all mutual funds are required to include the same hypothetical calculations about expenses in shareholder reports, you can use this information to compare the ongoing cost of investing in the Fund with other funds. To do so, compare the hypothetical example with the 5% hypothetical examples that appear in the shareholder reports of other funds. As you compare hypothetical examples of other funds, it is important to note that hypothetical examples are meant to highlight the ongoing costs of investing in a fund only and do not reflect any transaction costs, such as sales charges, or redemption or exchange fees. Therefore, the hypothetical calculations are useful in comparing ongoing costs only, and will not help you determine the relative total costs of owning different funds. If transaction costs were included in these calculations, your costs would be higher.
Columbia Capital Allocation Conservative Portfolio
August 1, 2012 – January 31, 2013
| | Account Value at the
Beginning of the
Period ($) | | Account Value at
the End of the
Period ($) | | Expenses Paid During
the Period ($) | | Fund's
Annualized
Expense
Ratio (%) | | Effective Expenses
Paid During the
Period ($) | | Fund's
Effective
Annualized
Expense
Ratio (%) | |
| | Actual | | Hypothetical | | Actual | | Hypothetical | | Actual | | Hypothetical | | Actual | | Actual | | Hypothetical | | Actual | |
Class A | | | 1,000.00 | | | | 1,000.00 | | | | 1,035.60 | | | | 1,022.77 | | | | 2.40 | | | | 2.39 | | | | 0.47 | | | | 5.37 | | | | 5.34 | | | | 1.05 | | |
Class B | | | 1,000.00 | | | | 1,000.00 | | | | 1,032.50 | | | | 1,018.95 | | | | 6.28 | | | | 6.24 | | | | 1.23 | | | | 9.25 | | | | 9.19 | | | | 1.81 | | |
Class C | | | 1,000.00 | | | | 1,000.00 | | | | 1,031.90 | | | | 1,019.00 | | | | 6.23 | | | | 6.19 | | | | 1.22 | | | | 9.19 | | | | 9.14 | | | | 1.80 | | |
Class K
(formerly
Class R4) | | | 1,000.00 | | | | 1,000.00 | | | | 1,036.50 | | | | 1,023.23 | | | | 1.95 | | | | 1.93 | | | | 0.38 | | | | 4.91 | | | | 4.88 | | | | 0.96 | | |
Class R | | | 1,000.00 | | | | 1,000.00 | | | | 1,034.60 | | | | 1,021.57 | | | | 3.63 | | | | 3.61 | | | | 0.71 | | | | 6.60 | | | | 6.56 | | | | 1.29 | | |
Class Z | | | 1,000.00 | | | | 1,000.00 | | | | 1,037.80 | | | | 1,024.03 | | | | 1.13 | | | | 1.12 | | | | 0.22 | | | | 4.10 | | | | 4.07 | | | | 0.80 | | |
Expenses paid during the period are equal to the Fund's annualized expense ratio for each class as indicated above, multiplied by the average account value over the period and then multiplied by the number of days in the Fund's most recent fiscal half year and divided by 366.
Effective expenses paid during the period and the Fund's effective annualized expense ratio include expenses borne directly to the class plus the Fund's pro rata portion of the ongoing expenses charged by the underlying funds using the expense ratio of each class of the underlying funds as of the underlying fund's most recent shareholder report.
Annual Report 2013
20
Columbia Capital Allocation Portfolios
Understanding Your Fund's Expenses (continued)
(Unaudited)
Columbia Capital Allocation Moderate Conservative Portfolio
August 1, 2012 – January 31, 2013
| | Account Value at the
Beginning of the
Period ($) | | Account Value at
the End of the
Period ($) | | Expenses Paid During
the Period ($) | | Fund's
Annualized
Expense
Ratio (%) | | Effective Expenses
Paid During the
Period ($) | | Fund's
Effective
Annualized
Expense
Ratio (%) | |
| | Actual | | Hypothetical | | Actual | | Hypothetical | | Actual | | Hypothetical | | Actual | | Actual | | Hypothetical | | Actual | |
Class A | | | 1,000.00 | | | | 1,000.00 | | | | 1,046.20 | | | | 1,022.32 | | | | 2.88 | | | | 2.85 | | | | 0.56 | | | | 6.02 | | | | 5.95 | | | | 1.17 | | |
Class B | | | 1,000.00 | | | | 1,000.00 | | | | 1,042.40 | | | | 1,018.55 | | | | 6.73 | | | | 6.65 | | | | 1.31 | | | | 9.86 | | | | 9.74 | | | | 1.92 | | |
Class C | | | 1,000.00 | | | | 1,000.00 | | | | 1,041.80 | | | | 1,018.55 | | | | 6.72 | | | | 6.65 | | | | 1.31 | | | | 9.85 | | | | 9.74 | | | | 1.92 | | |
Class R | | | 1,000.00 | | | | 1,000.00 | | | | 1,044.80 | | | | 1,021.11 | | | | 4.11 | | | | 4.06 | | | | 0.80 | | | | 7.25 | | | | 7.16 | | | | 1.41 | | |
Class R4 | | | 1,000.00 | | | | 1,000.00 | | | | 1,031.10 | * | | | 1,023.28 | | | | 0.85 | * | | | 1.88 | | | | 0.37 | | | | 2.26 | * | | | 4.98 | | | | 0.98 | | |
Class R5 | | | 1,000.00 | | | | 1,000.00 | | | | 1,031.30 | * | | | 1,023.68 | | | | 0.67 | * | | | 1.48 | | | | 0.29 | | | | 2.07 | * | | | 4.58 | | | | 0.90 | | |
Class Z | | | 1,000.00 | | | | 1,000.00 | | | | 1,047.00 | | | | 1,023.58 | | | | 1.60 | | | | 1.58 | | | | 0.31 | | | | 4.73 | | | | 4.68 | | | | 0.92 | | |
Expenses paid during the period are equal to the Fund's annualized expense ratio for each class as indicated above, multiplied by the average account value over the period and then multiplied by the number of days in the Fund's most recent fiscal half year and divided by 366.
Effective expenses paid during the period and the Fund's effective annualized expense ratio include expenses borne directly to the class plus the Fund's pro rata portion of the ongoing expenses charged by the underlying funds using the expense ratio of each class of the underlying funds as of the underlying fund's most recent shareholder report.
Had Columbia Management Investment Advisers, LLC and/or certain of its affiliates not waived/reimbursed certain fees and expenses, account value at the end of the period would have been reduced.
*Classes R4 and R5 are for the period from November 8, 2012 (commencement of operations) through January 31, 2013.
Columbia Capital Allocation Moderate Portfolio
August 1, 2012 – January 31, 2013
| | Account Value at the
Beginning of the
Period ($) | | Account Value at
the End of the
Period ($) | | Expenses Paid During
the Period ($) | | Fund's
Annualized
Expense
Ratio (%) | | Effective Expenses
Paid During the
Period ($) | | Fund's
Effective
Annualized
Expense
Ratio (%) | |
| | Actual | | Hypothetical | | Actual | | Hypothetical | | Actual | | Hypothetical | | Actual | | Actual | | Hypothetical | | Actual | |
Class A | | | 1,000.00 | | | | 1,000.00 | | | | 1,075.40 | | | | 1,022.72 | | | | 2.50 | | | | 2.44 | | | | 0.48 | | | | 6.21 | | | | 6.05 | | | | 1.19 | | |
Class B | | | 1,000.00 | | | | 1,000.00 | | | | 1,070.80 | | | | 1,018.95 | | | | 6.40 | | | | 6.24 | | | | 1.23 | | | | 10.10 | | | | 9.85 | | | | 1.94 | | |
Class C | | | 1,000.00 | | | | 1,000.00 | | | | 1,070.20 | | | | 1,018.95 | | | | 6.40 | | | | 6.24 | | | | 1.23 | | | | 10.10 | | | | 9.85 | | | | 1.94 | | |
Class K
(formerly
Class R4) | | | 1,000.00 | | | | 1,000.00 | | | | 1,075.90 | | | | 1,023.33 | | | | 1.88 | | | | 1.83 | | | | 0.36 | | | | 5.58 | | | | 5.44 | | | | 1.07 | | |
Class R | | | 1,000.00 | | | | 1,000.00 | | | | 1,073.60 | | | | 1,021.47 | | | | 3.80 | | | | 3.71 | | | | 0.73 | | | | 7.51 | | | | 7.32 | | | | 1.44 | | |
Class Z | | | 1,000.00 | | | | 1,000.00 | | | | 1,076.00 | | | | 1,023.93 | | | | 1.25 | | | | 1.22 | | | | 0.24 | | | | 4.96 | | | | 4.83 | | | | 0.95 | | |
Expenses paid during the period are equal to the Fund's annualized expense ratio for each class as indicated above, multiplied by the average account value over the period and then multiplied by the number of days in the Fund's most recent fiscal half year and divided by 366.
Effective expenses paid during the period and the Fund's effective annualized expense ratio include expenses borne directly to the class plus the Fund's pro rata portion of the ongoing expenses charged by the underlying funds using the expense ratio of each class of the underlying funds as of the underlying fund's most recent shareholder report.
Annual Report 2013
21
Columbia Capital Allocation Portfolios
Understanding Your Fund's Expenses (continued)
(Unaudited)
Columbia Capital Allocation Moderate Aggressive Portfolio
August 1, 2012 – January 31, 2013
| | Account Value at the
Beginning of the
Period ($) | | Account Value at
the End of the
Period ($) | | Expenses Paid During
the Period ($) | | Fund's
Annualized
Expense
Ratio (%) | | Effective Expenses
Paid During the
Period ($) | | Fund's
Effective
Annualized
Expense
Ratio (%) | |
| | Actual | | Hypothetical | | Actual | | Hypothetical | | Actual | | Hypothetical | | Actual | | Actual | | Hypothetical | | Actual | |
Class A | | | 1,000.00 | | | | 1,000.00 | | | | 1,083.80 | | | | 1,022.42 | | | | 2.83 | | | | 2.75 | | | | 0.54 | | | | 6.65 | | | | 6.46 | | | | 1.27 | | |
Class B | | | 1,000.00 | | | | 1,000.00 | | | | 1,079.60 | | | | 1,018.65 | | | | 6.74 | | | | 6.55 | | | | 1.29 | | | | 10.56 | | | | 10.25 | | | | 2.02 | | |
Class C | | | 1,000.00 | | | | 1,000.00 | | | | 1,080.30 | | | | 1,018.65 | | | | 6.75 | | | | 6.55 | | | | 1.29 | | | | 10.56 | | | | 10.25 | | | | 2.02 | | |
Class R | | | 1,000.00 | | | | 1,000.00 | | | | 1,082.60 | | | | 1,021.17 | | | | 4.14 | | | | 4.01 | | | | 0.79 | | | | 7.96 | | | | 7.72 | | | | 1.52 | | |
Class R4 | | | 1,000.00 | | | | 1,000.00 | | | | 1,066.00 | * | | | 1,023.93 | | | | 0.56 | * | | | 1.22 | | | | 0.24 | | | | 2.27 | * | | | 4.93 | | | | 0.97 | | |
Class R5 | | | 1,000.00 | | | | 1,000.00 | | | | 1,066.40 | * | | | 1,024.53 | | | | 0.28 | * | | | 0.61 | | | | 0.12 | | | | 1.99 | * | | | 4.33 | | | | 0.85 | | |
Class T | | | 1,000.00 | | | | 1,000.00 | | | | 1,083.60 | | | | 1,022.17 | | | | 3.09 | | | | 3.00 | | | | 0.59 | | | | 6.91 | | | | 6.71 | | | | 1.32 | | |
Class Z | | | 1,000.00 | | | | 1,000.00 | | | | 1,085.30 | | | | 1,023.68 | | | | 1.52 | | | | 1.48 | | | | 0.29 | | | | 5.35 | | | | 5.19 | | | | 1.02 | | |
Expenses paid during the period are equal to the Fund's annualized expense ratio for each class as indicated above, multiplied by the average account value over the period and then multiplied by the number of days in the Fund's most recent fiscal half year and divided by 366.
Effective expenses paid during the period and the Fund's effective annualized expense ratio include expenses borne directly to the class plus the Fund's pro rata portion of the ongoing expenses charged by the underlying funds using the expense ratio of each class of the underlying funds as of the underlying fund's most recent shareholder report.
*Class R4 and Class R5 are for the period from November 8, 2012 through January 31, 2013.
Columbia Capital Allocation Aggressive Portfolio
August 1, 2012 – January 31, 2013
| | Account Value at the
Beginning of the
Period ($) | | Account Value at
the End of the
Period ($) | | Expenses Paid During
the Period ($) | | Fund's
Annualized
Expense
Ratio (%) | | Effective Expenses
Paid During the
Period ($) | | Fund's
Effective
Annualized
Expense
Ratio (%) | |
| | Actual | | Hypothetical | | Actual | | Hypothetical | | Actual | | Hypothetical | | Actual | | Actual | | Hypothetical | | Actual | |
Class A | | | 1,000.00 | | | | 1,000.00 | | | | 1,112.30 | | | | 1,022.47 | | | | 2.81 | | | | 2.69 | | | | 0.53 | | | | 7.11 | | | | 6.81 | | | | 1.34 | | |
Class B | | | 1,000.00 | | | | 1,000.00 | | | | 1,107.30 | | | | 1,018.65 | | | | 6.83 | | | | 6.55 | | | | 1.29 | | | | 11.12 | | | | 10.66 | | | | 2.10 | | |
Class C | | | 1,000.00 | | | | 1,000.00 | | | | 1,107.60 | | | | 1,018.70 | | | | 6.78 | | | | 6.50 | | | | 1.28 | | | | 11.07 | | | | 10.61 | | | | 2.09 | | |
Class K
(formerly
Class R4) | | | 1,000.00 | | | | 1,000.00 | | | | 1,112.30 | | | | 1,023.13 | | | | 2.12 | | | | 2.03 | | | | 0.40 | | | | 6.42 | | | | 6.15 | | | | 1.21 | | |
Class R | | | 1,000.00 | | | | 1,000.00 | | | | 1,110.80 | | | | 1,021.32 | | | | 4.03 | | | | 3.86 | | | | 0.76 | | | | 8.33 | | | | 7.98 | | | | 1.57 | | |
Class Z | | | 1,000.00 | | | | 1,000.00 | | | | 1,112.40 | | | | 1,023.78 | | | | 1.43 | | | | 1.37 | | | | 0.27 | | | | 5.73 | | | | 5.49 | | | | 1.08 | | |
Expenses paid during the period are equal to the Fund's annualized expense ratio for each class as indicated above, multiplied by the average account value over the period and then multiplied by the number of days in the Fund's most recent fiscal half year and divided by 366.
Effective expenses paid during the period and the Fund's effective annualized expense ratio include expenses borne directly to the class plus the Fund's pro rata portion of the ongoing expenses charged by the underlying funds using the expense ratio of each class of the underlying funds as of the underlying fund's most recent shareholder report.
Had Columbia Management Investment Advisers, LLC and/or certain of its affiliates not waived/reimbursed certain fees and expenses, account value at the end of the period would have been reduced.
Annual Report 2013
22
Columbia Capital Allocation Portfolios
Portfolio of Investments
Columbia Capital Allocation Conservative Portfolio
January 31, 2013
(Percentages represent value of investments compared to net assets)
Equity Funds 20.7%
| | | Shares | | Value ($) | |
Dividend Income 4.2% | |
Columbia Dividend Income Fund,
Class I Shares(a) | | | 473,766 | | | | 7,352,854 | | |
Columbia Dividend Opportunity Fund,
Class I Shares(a) | | | 805,168 | | | | 7,407,545 | | |
Total | | | | | 14,760,399 | | |
International 4.4% | |
Columbia Acorn International, Class I
Shares(a) | | | 12,705 | | | | 538,676 | | |
Columbia Emerging Markets Fund,
Class I Shares(a) | | | 270,855 | | | | 2,835,848 | | |
Columbia European Equity Fund, Class I
Shares(a) | | | 1,011,686 | | | | 6,535,495 | | |
Columbia Pacific/Asia Fund, Class I
Shares(a) | | | 622,258 | | | | 5,394,977 | | |
Total | | | | | 15,304,996 | | |
U.S. Large Cap 8.8% | |
Columbia Contrarian Core Fund, Class I
Shares(a) | | | 421,783 | | | | 7,242,021 | | |
Columbia Large Cap Core Fund, Class I
Shares(a) | | | 120,076 | | | | 1,802,333 | | |
Columbia Large Cap Growth Fund,
Class I Shares(a) | | | 155,354 | | | | 4,499,065 | | |
Columbia Large Core Quantitative Fund,
Class I Shares(a) | | | 1,320,116 | | | | 8,910,779 | | |
Columbia Large Growth Quantitative
Fund, Class I Shares(a) | | | 992,332 | | | | 7,978,350 | | |
Total | | | | | 30,432,548 | | |
U.S. Mid Cap 2.6% | |
Columbia Mid Cap Growth Fund, Class I
Shares(a)(b) | | | 160,401 | | | | 4,508,862 | | |
Columbia Mid Cap Value Fund, Class I
Shares(a) | | | 289,035 | | | | 4,578,320 | | |
Total | | | | | 9,087,182 | | |
U.S. Small Cap 0.7% | |
Columbia Small Cap Core Fund, Class I
Shares(a) | | | 138,536 | | | | 2,378,672 | | |
Total Equity Funds
(Cost: $62,839,128) | | | | | 71,963,797 | | |
Fixed-Income Funds 68.6%
| | | Shares | | Value ($) | |
Convertible 1.0% | |
Columbia Convertible Securities Fund,
Class I Shares(a) | | | 228,149 | | | | 3,588,787 | | |
Emerging Markets 5.0% | |
Columbia Emerging Markets Bond Fund,
Class I Shares(a) | | | 1,379,602 | | | | 17,410,576 | | |
Inflation Protected Securities 4.9% | |
Columbia Inflation Protected Securities
Fund, Class I Shares(a) | | | 1,653,076 | | | | 17,158,925 | | |
Investment Grade 57.7% | |
Columbia Corporate Income Fund,
Class I Shares(a) | | | 5,940,376 | | | | 62,136,330 | | |
Columbia Limited Duration Credit Fund,
Class I Shares(a) | | | 3,435,954 | | | | 34,737,499 | | |
Columbia U.S. Government Mortgage
Fund, Class I Shares(a) | | | 14,280,829 | | | | 79,972,641 | | |
Columbia U.S. Treasury Index Fund,
Class I Shares(a) | | | 2,112,175 | | | | 24,078,800 | | |
Total | | | | | 200,925,270 | | |
Total Fixed-Income Funds
(Cost: $231,613,386) | | | | | 239,083,558 | | |
Alternative Investment Funds 8.1%
Columbia Absolute Return Emerging
Markets Macro Fund, Class I Shares(a) | | | 497,780 | | | | 5,211,755 | | |
Columbia Absolute Return Enhanced
Multi-Strategy Fund, Class I Shares(a) | | | 787,127 | | | | 7,894,887 | | |
Columbia Absolute Return
Multi-Strategy Fund, Class I Shares(a) | | | 783,170 | | | | 7,870,856 | | |
Columbia Flexible Capital Income Fund,
Class I Shares(a) | | | 626,786 | | | | 7,132,822 | | |
Total Alternative Investment Funds
(Cost: $26,951,821) | | | | | 28,110,320 | | |
Money Market Funds 2.6%
Columbia Short-Term Cash Fund,
0.132%(a)(c) | | | 8,880,035 | | | | 8,880,035 | | |
Total Money Market Funds
(Cost: $8,880,035) | | | | | 8,880,035 | | |
Total Investments
(Cost: $330,284,370) | | | | | 348,037,710 | | |
Other Assets and Liabilities | | | | | 136,652 | | |
Net Assets | | | | | 348,174,362 | | |
The accompanying Notes to Financial Statements are an integral part of this statement.
Annual Report 2013
23
Columbia Capital Allocation Portfolios
Portfolio of Investments (continued)
Columbia Capital Allocation Conservative Portfolio
January 31, 2013
Investments in Derivatives
Futures Contracts Outstanding at January 31, 2013
At January 31, 2013, $82,300 was held in a margin deposit account as collateral to cover initial margin requirements on open futures contracts.
Contract Description | | Number of
Contracts
Long (Short) | | Notional
Market
Value ($) | | Expiration
Date | | Unrealized
Appreciation ($) | | Unrealized
Depreciation ($) | |
U.S. Treasury Long Bond, 20-year | | | 14 | | | | 2,008,562 | | | March 2013 | | | — | | | | (96,611 | ) | |
U.S. Treasury Note, 10-year | | | 43 | | | | 5,645,094 | | | March 2013 | | | — | | | | (97,187 | ) | |
Total | | | | | | | | | — | | | | (193,798 | ) | |
Notes to Portfolio of Investments
(a) As defined in the Investment Company Act of 1940, an affiliated company is one in which the Fund owns 5% or more of its outstanding voting securities, or a company which is under common ownership or control with the Fund. Holdings and transactions in these affiliated companies during the year ended January 31, 2013, are as follows:
Issuer | | Beginning
Cost ($) | | Purchase
Cost ($) | | Cost/
Proceeds
From Sales ($) | | Realized
Gain/Loss ($) | | Ending
Cost ($) | | Capital Gain
Distributions ($) | | Dividends
or Interest
Income ($) | | Value ($) | |
CMG Ultra-
Short Term
Bond Fund | | | 14,533,485 | | | | 268,352 | | | | (14,834,116 | ) | | | 32,279 | | | | — | | | | — | | | | 22,087 | | | | — | | |
Columbia
Absolute
Return
Emerging
Markets
Macro Fund,
Class I Shares | | | 3,996,344 | | | | 1,125,177 | | | | (101,427 | ) | | | 1,042 | | | | 5,021,136 | | | | — | | | | 52,040 | | | | 5,211,755 | | |
Columbia
Absolute
Return
Enhanced
Multi-Strategy
Fund, Class I
Shares | | | — | | | | 8,152,740 | | | | (272,841 | ) | | | 90 | | | | 7,879,989 | | | | — | | | | 210,367 | | | | 7,894,887 | | |
Columbia
Absolute
Return
Multi-Strategy
Fund, Class I
Shares | | | 6,108,714 | | | | 3,277,171 | | | | (1,583,251 | ) | | | 9,311 | | | | 7,811,945 | | | | — | | | | 94,139 | | | | 7,870,856 | | |
Columbia
Acorn
International,
Class I Shares | | | 504,501 | | | | 123,170 | | | | (131,998 | ) | | | (2,081 | ) | | | 493,592 | | | | — | | | | 11,216 | | | | 538,676 | | |
Columbia
Contrarian
Core Fund,
Class I Shares | | | 6,096,893 | | | | 856,755 | | | | (1,969,422 | ) | | | 723,644 | | | | 5,707,870 | | | | 8,174 | | | | 84,489 | | | | 7,242,021 | | |
Columbia
Convertible
Securities
Fund, Class I
Shares | | | 13,332,351 | | | | 624,025 | | | | (10,269,136 | ) | | | (412,142 | ) | | | 3,275,098 | | | | — | | | | 179,999 | | | | 3,588,787 | | |
The accompanying Notes to Financial Statements are an integral part of this statement.
Annual Report 2013
24
Columbia Capital Allocation Portfolios
Portfolio of Investments (continued)
Columbia Capital Allocation Conservative Portfolio
January 31, 2013
Notes to Portfolio of Investments (continued)
Issuer | | Beginning
Cost ($) | | Purchase
Cost ($) | | Cost/
Proceeds
From Sales ($) | | Realized
Gain/Loss ($) | | Ending
Cost ($) | | Capital Gain
Distributions ($) | | Dividends
or Interest
Income ($) | | Value ($) | |
Columbia
Corporate
Income Fund,
Class I Shares | | | 54,880,305 | | | | 7,402,080 | | | | (3,120,513 | ) | | | 102,068 | | | | 59,263,940 | | | | 1,236,290 | | | | 2,101,494 | | | | 62,136,330 | | |
Columbia
Dividend
Income Fund,
Class I Shares | | | 5,294,000 | | | | 1,851,201 | | | | (817,927 | ) | | | 68,600 | | | | 6,395,874 | | | | — | | | | 186,627 | | | | 7,352,854 | | |
Columbia
Dividend
Opportunity
Fund, Class I
Shares | | | 4,751,716 | | | | 1,987,125 | | | | (882,451 | ) | | | 367,809 | | | | 6,224,199 | | | | — | | | | 305,457 | | | | 7,407,545 | | |
Columbia
Emerging
Markets Bond
Fund, Class I
Shares | | | 15,170,380 | | | | 1,631,502 | | | | (1,483,862 | ) | | | 92,227 | | | | 15,410,247 | | | | 112,740 | | | | 909,044 | | | | 17,410,576 | | |
Columbia
Emerging
Markets Fund,
Class I Shares | | | 952,831 | | | | 1,940,954 | | | | (249,414 | ) | | | (15,315 | ) | | | 2,629,056 | | | | 113,713 | | | | 17,178 | | | | 2,835,848 | | |
Columbia
European
Equity Fund,
Class I Shares | | | 4,737,392 | | | | 2,657,364 | | | | (1,785,041 | ) | | | (110,618 | ) | | | 5,499,097 | | | | 26,598 | | | | 131,862 | | | | 6,535,495 | | |
Columbia
Flexible Capital
Income Fund,
Class I Shares | | | 6,150,343 | | | | 895,904 | | | | (892,928 | ) | | | 85,432 | | | | 6,238,751 | | | | 30,972 | | | | 264,040 | | | | 7,132,822 | | |
Columbia
Inflation
Protected
Securities
Fund, Class I
Shares | | | 14,227,858 | | | | 3,336,940 | | | | (749,646 | ) | | | 102,268 | | | | 16,917,420 | | | | 1,436,533 | | | | 345,324 | | | | 17,158,925 | | |
Columbia
Large Cap
Core Fund,
Class I Shares | | | 1,613,695 | | | | 303,635 | | | | (306,500 | ) | | | 15,480 | | | | 1,626,310 | | | | 61,513 | | | | 22,899 | | | | 1,802,333 | | |
Columbia
Large Cap
Growth Fund,
Class I Shares | | | 3,020,519 | | | | 630,714 | | | | (779,699 | ) | | | 291,752 | | | | 3,163,286 | | | | — | | | | 29,394 | | | | 4,499,065 | | |
Columbia
Large Core
Quantitative
Fund, Class I
Shares | | | 3,302,105 | | | | 5,114,372 | | | | (1,124,079 | ) | | | 480,954 | | | | 7,773,352 | | | | — | | | | 161,328 | | | | 8,910,779 | | |
The accompanying Notes to Financial Statements are an integral part of this statement.
Annual Report 2013
25
Columbia Capital Allocation Portfolios
Portfolio of Investments (continued)
Columbia Capital Allocation Conservative Portfolio
January 31, 2013
Notes to Portfolio of Investments (continued)
Issuer | | Beginning
Cost ($) | | Purchase
Cost ($) | | Cost/
Proceeds
From Sales ($) | | Realized
Gain/Loss ($) | | Ending
Cost ($) | | Capital Gain
Distributions ($) | | Dividends
or Interest
Income ($) | | Value ($) | |
Columbia
Large Growth
Quantitative
Fund, Class I
Shares | | | 5,081,091 | | | | 3,449,249 | | | | (971,922 | ) | | | 324,648 | | | | 7,883,066 | | | | 689,232 | | | | 150,489 | | | | 7,978,350 | | |
Columbia
Limited
Duration Credit
Fund, Class I
Shares | | | 32,345,723 | | | | 4,041,885 | | | | (3,647,640 | ) | | | 268,991 | | | | 33,008,959 | | | | 525,134 | | | | 776,516 | | | | 34,737,499 | | |
Columbia
Mid Cap
Growth Fund,
Class I Shares | | | 2,376,091 | | | | 2,422,223 | | | | (482,436 | ) | | | (15,486 | ) | | | 4,300,392 | | | | 126,108 | | | | — | | | | 4,508,862 | | |
Columbia
Mid Cap Value
Fund, Class I
Shares | | | 825,180 | | | | 3,741,932 | | | | (588,308 | ) | | | 22,986 | | | | 4,001,790 | | | | — | | | | 48,762 | | | | 4,578,320 | | |
Columbia
Mid Cap Value
Opportunity
Fund, Class I
Shares | | | 1,381,019 | | | | 868 | | | | (1,657,068 | ) | | | 275,181 | | | | — | | | | — | | | | — | | | | — | | |
Columbia
Money Market
Fund, Class I
Shares | | | 2 | | | | 53 | | | | (55 | ) | | | — | | | | — | | | | — | | | | — | | | | — | | |
Columbia
Pacific/Asia
Fund, Class I
Shares | | | 2,316,805 | | | | 3,084,473 | | | | (504,997 | ) | | | (24,406 | ) | | | 4,871,875 | | | | — | | | | 130,580 | | | | 5,394,977 | | |
Columbia
Short-Term
Cash Fund | | | 582,304 | | | | 16,225,726 | | | | (7,927,995 | ) | | | — | | | | 8,880,035 | | | | — | | | | 10,744 | | | | 8,880,035 | | |
Columbia
Small Cap
Core Fund,
Class I Shares | | | — | | | | 3,590,842 | | | | (1,304,206 | ) | | | (17,267 | ) | | | 2,269,369 | | | | 71,591 | | | | 19,537 | | | | 2,378,672 | | |
Columbia U.S.
Government
Mortgage Fund,
Class I Shares | | | 74,107,909 | | | | 10,122,284 | | | | (5,296,660 | ) | | | 100,967 | | | | 79,034,500 | | | | 1,518,739 | | | | 2,439,396 | | | | 79,972,641 | | |
Columbia U.S.
Treasury Index
Fund, Class I
Shares | | | 24,370,994 | | | | 3,837,113 | | | | (3,700,067 | ) | | | 195,182 | | | | 24,703,222 | | | | 640,927 | | | | 320,465 | | | | 24,078,800 | | |
Total | | | 302,060,550 | | | | 92,695,829 | | | | (67,435,605 | ) | | | 2,963,596 | | | | 330,284,370 | | | | 6,598,264 | | | | 9,025,473 | | | | 348,037,710 | | |
(b) Non-income producing.
(c) The rate shown is the seven-day current annualized yield at January 31, 2013.
The accompanying Notes to Financial Statements are an integral part of this statement.
Annual Report 2013
26
Columbia Capital Allocation Portfolios
Portfolio of Investments (continued)
Columbia Capital Allocation Conservative Portfolio
January 31, 2013
Fair Value Measurements
Generally accepted accounting principles (GAAP) require disclosure regarding the inputs and valuation techniques used to measure fair value and any changes in valuation inputs or techniques. In addition, investments shall be disclosed by major category.
The Fund categorizes its fair value measurements according to a three-level hierarchy that maximizes the use of observable inputs and minimizes the use of unobservable inputs by prioritizing that the most observable input be used when available. Observable inputs are those that market participants would use in pricing an investment based on market data obtained from sources independent of the reporting entity. Unobservable inputs are those that reflect the Fund's assumptions about the information market participants would use in pricing an investment. An investment's level within the fair value hierarchy is based on the lowest level of any input that is deemed significant to the asset or liability's fair value measurement. The input levels are not necessarily an indication of the risk or liquidity associated with investments at that level. For example, certain U.S. government securities are generally high quality and liquid, however, they are reflected as Level 2 because the inputs used to determine fair value may not always be quoted prices in an active market.
Fair value inputs are summarized in the three broad levels listed below:
> Level 1 — Valuations based on quoted prices for investments in active markets that the Fund has the ability to access at the measurement date (to include NAV for open-end mutual funds). Valuation adjustments are not applied to Level 1 investments.
> Level 2 — Valuations based on other significant observable inputs (including quoted prices for similar securities, interest rates, prepayment speeds, credit risks, etc.).
> Level 3 — Valuations based on significant unobservable inputs (including the Fund's own assumptions and judgment in determining the fair value of investments).
Inputs that are used in determining fair value of an investment may include price information, credit data, volatility statistics, and other factors. These inputs can be either observable or unobservable. The availability of observable inputs can vary between investments, and is affected by various factors such as the type of investment, and the volume and level of activity for that investment or similar investments in the marketplace. The inputs will be considered by the Investment Manager, along with any other relevant factors in the calculation of an investment's fair value. The Fund uses prices and inputs that are current as of the measurement date, which may include periods of market dislocations. During these periods, the availability of prices and inputs may be reduced for many investments. This condition could cause an investment to be reclassified between the various levels within the hierarchy.
Investments falling into the Level 3 category are primarily supported by quoted prices from brokers and dealers participating in the market for those investments. However, these may be classified as Level 3 investments due to lack of market transparency and corroboration to support these quoted prices. Additionally, valuation models may be used as the pricing source for any remaining investments classified as Level 3. These models rely on one or more significant unobservable inputs and/or significant assumptions by the Investment Manager. Inputs used in valuations may include, but are not limited to, financial statement analysis, capital account balances, discount rates and estimated cash flows, and comparable company data.
Under the direction of the Fund's Board of Trustees (the Board), the Investment Manager's Valuation Committee (the Committee) is responsible for carrying out the valuation procedures approved by the Board. The Committee consists of voting and non-voting members from various groups within the Investment Manager's organization, including operations and accounting, trading and investments, compliance, risk management and legal.
The Committee meets at least monthly to review and approve valuation matters, which may include a description of specific valuation determinations, data regarding pricing information received from approved pricing vendors and brokers and the results of Board-approved valuation control policies and procedures (the Policies). The Policies address, among other things, instances when market quotations are readily available, including recommendations of third party pricing vendors and a determination of appropriate pricing methodologies; events that require specific valuation determinations and assessment of fair value techniques; securities with a potential for stale pricing, including those that are illiquid, restricted, or in default; and the effectiveness of third-party pricing vendors, including periodic reviews of vendors. The Committee meets more frequently, as needed, to discuss additional valuation matters, which may include the need to review back-testing results, review time-sensitive information or approve related valuation actions. The Committee reports to the Board, with members of the Committee meeting with the Board at each of its regularly scheduled meetings to discuss valuation matters and actions during the period, similar to those described earlier.
For investments categorized as Level 3, the Committee monitors information similar to that described above, which may include: (i) data specific to the issuer or comparable issuers, (ii) general market or specific sector news and (iii) quoted prices and specific or similar security transactions. The Committee considers this data and any changes from prior periods in order to assess the reasonableness of observable and unobservable inputs, any assumptions or internal models used to value those securities and changes in fair value. This data is also used to corroborate, when available, information received from approved pricing vendors and brokers. Various factors impact the frequency of monitoring this information (which may occur as often as daily). However, the Committee may determine that changes to inputs, assumptions and models are not required as a result of the monitoring procedures performed.
The accompanying Notes to Financial Statements are an integral part of this statement.
Annual Report 2013
27
Columbia Capital Allocation Portfolios
Portfolio of Investments (continued)
Columbia Capital Allocation Conservative Portfolio
January 31, 2013
Fair Value Measurements (continued)
The following table is a summary of the inputs used to value the Fund's investments at January 31, 2013:
| Description | | Level 1
Quoted Prices in Active
Markets for Identical
Assets ($) | |
Level 2
Other Significant
Observable Inputs ($) | |
Level 3
Significant
Unobservable Inputs ($) | |
Total ($) | |
Mutual Funds | |
Equity Funds | | | 71,963,797 | | | | — | | | | — | | | | 71,963,797 | | |
Fixed-Income Funds | | | 239,083,558 | | | | — | | | | — | | | | 239,083,558 | | |
Alternative Investment Funds | | | 28,110,320 | | | | — | | | | — | | | | 28,110,320 | | |
Money Market Funds | | | 8,880,035 | | | | — | | | | — | | | | 8,880,035 | | |
Total Mutual Funds | | | 348,037,710 | | | | — | | | | — | | | | 348,037,710 | | |
Derivatives | |
Liabilities | |
Futures Contracts | | | (193,798 | ) | | | — | | | | — | | | | (193,798 | ) | |
Total | | | 347,843,912 | | | | — | | | | — | | | | 347,843,912 | | |
See the Portfolio of Investments for all investment classifications not indicated in the table.
There were no transfers of financial assets between Levels 1 and 2 during the period.
Derivative instruments are valued at unrealized appreciation (depreciation).
The accompanying Notes to Financial Statements are an integral part of this statement.
Annual Report 2013
28
Columbia Capital Allocation Portfolios
Portfolio of Investments
Columbia Capital Allocation Moderate Conservative Portfolio
January 31, 2013
(Percentages represent value of investments compared to net assets)
Equity Funds 29.8%
| | | Shares | | Value ($) | |
Dividend Income 5.9% | |
Columbia Dividend Income Fund,
Class I Shares(a) | | | 281,711 | | | | 4,372,156 | | |
Columbia Dividend Opportunity Fund,
Class I Shares(a) | | | 339,749 | | | | 3,125,689 | | |
Total | | | | | 7,497,845 | | |
International 3.6% | |
Columbia Emerging Markets Fund,
Class I Shares(a) | | | 251,376 | | | | 2,631,906 | | |
Columbia Greater China Fund,
Class I Shares(a) | | | 11,637 | | | | 619,562 | | |
Columbia Pacific/Asia Fund,
Class I Shares(a) | | | 141,918 | | | | 1,230,431 | | |
Total | | | | | 4,481,899 | | |
U.S. Large Cap 14.9% | |
Columbia Contrarian Core Fund,
Class I Shares(a) | | | 255,741 | | | | 4,391,077 | | |
Columbia Large Cap Growth Fund,
Class I Shares(a) | | | 173,728 | | | | 5,031,161 | | |
Columbia Large Core Quantitative
Fund, Class I Shares(a) | | | 646,890 | | | | 4,366,508 | | |
Columbia Large Growth Quantitative
Fund, Class I Shares(a) | | | 466,081 | | | | 3,747,295 | | |
Columbia Large Value Quantitative
Fund, Class I Shares(a) | | | 164,924 | | | | 1,248,472 | | |
Total | | | | | 18,784,513 | | |
U.S. Mid Cap 4.2% | |
Columbia Mid Cap Growth Fund,
Class I Shares(a)(b) | | | 93,010 | | | | 2,614,524 | | |
Columbia Mid Cap Value Fund,
Class I Shares(a) | | | 165,725 | | | | 2,625,077 | | |
Total | | | | | 5,239,601 | | |
U.S. Small Cap 1.2% | |
Columbia Small Cap Growth Fund I,
Class I Shares(a)(b) | | | 25,683 | | | | 752,252 | | |
Columbia Small Cap Value Fund I,
Class I Shares(a) | | | 15,967 | | | | 737,974 | | |
Total | | | | | 1,490,226 | | |
Total Equity Funds
(Cost: $33,585,673) | | | | | 37,494,084 | | |
Fixed-Income Funds 57.6%
| | | Shares | | Value ($) | |
Convertible 3.0% | |
Columbia Convertible Securities
Fund, Class I Shares(a) | | | 238,820 | | | | 3,756,633 | | |
Emerging Markets 3.5% | |
Columbia Emerging Markets Bond Fund,
Class I Shares(a) | | | 346,017 | | | | 4,366,734 | | |
High Yield 8.5% | |
Columbia Income Opportunities Fund,
Class I Shares(a) | | | 1,058,834 | | | | 10,704,813 | | |
International 2.9% | |
Columbia International Bond Fund,
Class I Shares(a) | | | 322,874 | | | | 3,735,658 | | |
Investment Grade 39.7% | |
Columbia Corporate Income Fund,
Class I Shares(a) | | | 2,156,238 | | | | 22,554,251 | | |
Columbia Limited Duration Credit Fund,
Class I Shares(a) | | | 846,459 | | | | 8,557,704 | | |
Columbia U.S. Government Mortgage
Fund, Class I Shares(a) | | | 3,375,176 | | | | 18,900,983 | | |
Total | | | | | 50,012,938 | | |
Total Fixed-Income Funds
(Cost: $69,110,835) | | | | | 72,576,776 | | |
Alternative Investment Funds 4.9%
Columbia Absolute Return Currency and
Income Fund, Class I Shares(a)(b) | | | 305,238 | | | | 3,116,482 | | |
Columbia Absolute Return Multi-Strategy
Fund, Class I Shares(a) | | | 311,676 | | | | 3,132,342 | | |
Total Alternative Investment Funds
(Cost: $6,196,122) | | | | | 6,248,824 | | |
Inflation-Indexed Bonds 4.3%
Issuer | | Coupon
Rate | | Principal
Amount ($) | |
Value ($) | |
U.S. Treasury Inflation-Indexed Bond
07/15/13 | | | 1.875 | % | | | 363,512 | | | | 371,407 | | |
01/15/14 | | | 2.000 | % | | | 436,086 | | | | 451,826 | | |
01/15/15 | | | 1.625 | % | | | 542,560 | | | | 580,540 | | |
01/15/16 | | | 2.000 | % | | | 411,779 | | | | 459,905 | | |
07/15/17 | | | 2.625 | % | | | 333,240 | | | | 400,851 | | |
The accompanying Notes to Financial Statements are an integral part of this statement.
Annual Report 2013
29
Columbia Capital Allocation Portfolios
Portfolio of Investments (continued)
Columbia Capital Allocation Moderate Conservative Portfolio
January 31, 2013
Inflation-Indexed Bonds (continued)
Issuer | | Coupon
Rate | | Principal
Amount ($) | | Value ($) | |
01/15/19 | | | 2.125 | % | | | 461,085 | | | | 560,758 | | |
01/15/21 | | | 1.125 | % | | | 168,389 | | | | 197,068 | | |
01/15/25 | | | 2.375 | % | | | 720,596 | | | | 962,447 | | |
04/15/29 | | | 3.875 | % | | | 686,211 | | | | 1,117,505 | | |
02/15/40 | | | 2.125 | % | | | 213,030 | | | | 303,834 | | |
Total Inflation-Indexed Bonds
(Cost: $4,805,209) | | | | | | | 5,406,141 | | |
Money Market Funds 3.4%
| | | Shares | | Value ($) | |
BofA Cash Reserves, Capital Class,
0.100%(c) | | | 1,257,927 | | | | 1,257,927 | | |
Columbia Short-Term Cash Fund,
0.132%(a)(c) | | | 2,975,445 | | | | 2,975,445 | | |
Total Money Market Funds
(Cost: $4,233,372) | | | | | 4,233,372 | | |
Total Investments
(Cost: $117,931,211) | | | | | 125,959,197 | | |
Other Assets and Liabilities | | | | | 28,769 | | |
Net Assets | | | | | 125,987,966 | | |
Investments in Derivatives
Futures Contracts Outstanding at January 31, 2013
At January 31, 2013, $31,900 was held in a margin deposit account as collateral to cover initial margin requirements on open futures contracts.
Contract Description | | Number of
Contracts
Long (Short) | | Notional
Market
Value ($) | | Expiration
Date | | Unrealized
Appreciation ($) | | Unrealized
Depreciation ($) | |
U.S. Treasury Note, 5-year | | | 24 | | | | 2,969,625 | | | April 2013 | | | — | | | | (17,602 | ) | |
U.S. Treasury Note, 10-year | | | 17 | | | | 2,231,781 | | | March 2013 | | | — | | | | (34,169 | ) | |
Total | | | | | | | | | — | | | | (51,771 | ) | |
Notes to Portfolio of Investments
(a) As defined in the Investment Company Act of 1940, an affiliated company is one in which the Fund owns 5% or more of its outstanding voting securities, or a company which is under common ownership or control with the Fund. Holdings and transactions in these affiliated companies during the year ended January 31, 2013, are as follows:
Issuer | | Beginning
Cost ($) | | Purchase
Cost ($) | | Cost/
Proceeds
From Sales ($) | | Realized
Gain/Loss ($) | | Ending
Cost ($) | | Capital Gain
Distributions ($) | | Dividends
or Interest
Income ($) | | Value ($) | |
Columbia
Absolute
Return
Currency and
Income Fund,
Class I Shares | | | 3,377,956 | | | | 220,744 | | | | (517,746 | ) | | | 12,159 | | | | 3,093,113 | | | | 70,367 | | | | — | | | | 3,116,482 | | |
Columbia
Absolute
Return
Multi-Strategy
Fund, Class I
Shares | | | 4,496,081 | | | | 195,857 | | | | (1,598,008 | ) | | | 9,080 | | | | 3,103,010 | | | | — | | | | 37,850 | | | | 3,132,342 | | |
Columbia Bond
Fund, Class I
Shares | | | 9,767,911 | | | | 12,568 | | | | (10,048,522 | ) | | | 268,043 | | | | — | | | | — | | | | 2,874 | | | | — | | |
Columbia
Contrarian
Core Fund,
Class I Shares | | | 2,720,106 | | | | 1,520,499 | | | | (1,107,390 | ) | | | 371,548 | | | | 3,504,763 | | | | 5,105 | | | | 52,764 | | | | 4,391,077 | | |
The accompanying Notes to Financial Statements are an integral part of this statement.
Annual Report 2013
30
Columbia Capital Allocation Portfolios
Portfolio of Investments (continued)
Columbia Capital Allocation Moderate Conservative Portfolio
January 31, 2013
Notes to Portfolio of Investments (continued)
Issuer | | Beginning
Cost ($) | | Purchase
Cost ($) | | Cost/
Proceeds
From Sales ($) | | Realized
Gain/Loss ($) | | Ending
Cost ($) | | Capital Gain
Distributions ($) | | Dividends
or Interest
Income ($) | | Value ($) | |
Columbia
Convertible
Securities
Fund, Class I
Shares | | | 3,673,908 | | | | 312,997 | | | | (785,204 | ) | | | 65,139 | | | | 3,266,840 | | | | — | | | | 130,293 | | | | 3,756,633 | | |
Columbia
Corporate
Income Fund,
Class I Shares | | | 13,849,170 | | | | 11,023,753 | | | | (3,609,839 | ) | | | 278,971 | | | | 21,542,055 | | | | 458,235 | | | | 828,327 | | | | 22,554,251 | | |
Columbia
Dividend
Income Fund,
Class I Shares | | | 3,991,120 | | | | 641,426 | | | | (973,973 | ) | | | 85,571 | | | | 3,744,144 | | | | — | | | | 123,122 | | | | 4,372,156 | | |
Columbia
Dividend
Opportunity
Fund, Class I
Shares | | | 1,295,105 | | | | 2,181,122 | | | | (687,383 | ) | | | 52,388 | | | | 2,841,232 | | | | — | | | | 141,333 | | | | 3,125,689 | | |
Columbia
Emerging
Markets Bond
Fund, Class I
Shares | | | 3,861,625 | | | | 1,006,694 | | | | (977,155 | ) | | | 78,155 | | | | 3,969,319 | | | | 28,334 | | | | 248,646 | | | | 4,366,734 | | |
Columbia
Emerging
Markets Fund,
Class I Shares | | | 2,101,112 | | | | 1,129,312 | | | | (620,126 | ) | | | (16,693 | ) | | | 2,593,605 | | | | 120,405 | | | | 15,673 | | | | 2,631,906 | | |
Columbia
Greater China
Fund, Class I
Shares | | | 717,880 | | | | 111,875 | | | | (234,603 | ) | | | (12,884 | ) | | | 582,268 | | | | — | | | | 9,102 | | | | 619,562 | | |
Columbia
Income
Opportunities
Fund, Class I
Shares | | | 10,298,536 | | | | 838,614 | | | | (1,884,595 | ) | | | 226,451 | | | | 9,479,006 | | | | — | | | | 636,713 | | | | 10,704,813 | | |
Columbia
International
Bond Fund,
Class I Shares | | | 4,401,191 | | | | 257,448 | | | | (1,075,119 | ) | | | 27,775 | | | | 3,611,295 | | | | — | | | | 74,396 | | | | 3,735,658 | | |
Columbia
Large Cap
Core Fund,
Class I Shares | | | 2,774,622 | | | | — | | | | (3,348,757 | ) | | | 574,135 | | | | — | | | | — | | | | — | | | | — | | |
Columbia
Large Cap
Growth Fund,
Class I Shares | | | 2,623,109 | | | | 2,504,084 | | | | (1,244,496 | ) | | | 376,187 | | | | 4,258,884 | | | | — | | | | 33,320 | | | | 5,031,161 | | |
The accompanying Notes to Financial Statements are an integral part of this statement.
Annual Report 2013
31
Columbia Capital Allocation Portfolios
Portfolio of Investments (continued)
Columbia Capital Allocation Moderate Conservative Portfolio
January 31, 2013
Notes to Portfolio of Investments (continued)
Issuer | | Beginning
Cost ($) | | Purchase
Cost ($) | | Cost/
Proceeds
From Sales ($) | | Realized
Gain/Loss ($) | | Ending
Cost ($) | | Capital Gain
Distributions ($) | | Dividends
or Interest
Income ($) | | Value ($) | |
Columbia
Large Core
Quantitative
Fund, Class I
Shares | | | 2,199,459 | | | | 2,517,991 | | | | (896,427 | ) | | | 111,291 | | | | 3,932,314 | | | | — | | | | 80,274 | | | | 4,366,508 | | |
Columbia
Large Growth
Quantitative
Fund, Class I
Shares | | | — | | | | 4,465,815 | | | | (639,699 | ) | | | 17,641 | | | | 3,843,757 | | | | 326,981 | | | | 71,394 | | | | 3,747,295 | | |
Columbia
Large Value
Quantitative
Fund, Class I
Shares | | | 820,489 | | | | 460,919 | | | | (334,527 | ) | | | 121,846 | | | | 1,068,727 | | | | 31,242 | | | | 43,095 | | | | 1,248,472 | | |
Columbia
Limited
Duration
Credit Fund,
Class I Shares | | | 8,686,033 | | | | 742,035 | | | | (963,975 | ) | | | 15,894 | | | | 8,479,987 | | | | 132,336 | | | | 208,704 | | | | 8,557,704 | | |
Columbia
Mid Cap
Growth Fund,
Class I Shares | | | 1,986,655 | | | | 1,052,640 | | | | (1,177,635 | ) | | | 530,360 | | | | 2,392,020 | | | | 75,264 | | | | — | | | | 2,614,524 | | |
Columbia
Mid Cap Value
Fund, Class I
Shares | | | 1,650,005 | | | | 977,960 | | | | (704,362 | ) | | | 264,242 | | | | 2,187,845 | | | | — | | | | 31,548 | | | | 2,625,077 | | |
Columbia
Multi-Advisor
International
Equity Fund,
Class I Shares | | | 5,606,084 | | | | 26,852 | | | | (5,473,563 | ) | | | (159,373 | ) | | | — | | | | — | | | | — | | | | — | | |
Columbia
Pacific/Asia
Fund, Class I
Shares | | | — | | | | 1,420,646 | | | | (278,590 | ) | | | 5,278 | | | | 1,147,334 | | | | — | | | | 31,628 | | | | 1,230,431 | | |
Columbia
Select
Large Cap
Growth Fund,
Class I Shares | | | 2,801,995 | | | | — | | | | (3,375,630 | ) | | | 573,635 | | | | — | | | | — | | | | — | | | | — | | |
Columbia
Select
Large-Cap
Value Fund,
Class I Shares | | | 1,267,559 | | | | 1,892 | | | | (1,277,054 | ) | | | 7,603 | | | | — | | | | — | | | | — | | | | — | | |
Columbia
Short Term
Bond Fund,
Class I Shares | | | 2,551,887 | | | | 2,009 | | | | (2,551,002 | ) | | | (2,894 | ) | | | — | | | | — | | | | 478 | | | | — | | |
The accompanying Notes to Financial Statements are an integral part of this statement.
Annual Report 2013
32
Columbia Capital Allocation Portfolios
Portfolio of Investments (continued)
Columbia Capital Allocation Moderate Conservative Portfolio
January 31, 2013
Notes to Portfolio of Investments (continued)
Issuer | | Beginning
Cost ($) | | Purchase
Cost ($) | | Cost/
Proceeds
From Sales ($) | | Realized
Gain/Loss ($) | | Ending
Cost ($) | | Capital Gain
Distributions ($) | | Dividends
or Interest
Income ($) | | Value ($) | |
Columbia
Short-Term
Cash Fund | | | 3,179,381 | | | | 5,560,606 | | | | (5,764,542 | ) | | | — | | | | 2,975,445 | | | | — | | | | 4,929 | | | | 2,975,445 | | |
Columbia
Small Cap
Growth Fund I,
Class I Shares | | | — | | | | 867,363 | | | | (87,755 | ) | | | (4,379 | ) | | | 775,229 | | | | 74,248 | | | | — | | | | 752,252 | | |
Columbia
Small Cap
Value Fund I,
Class I Shares | | | — | | | | 829,861 | | | | (116,320 | ) | | | 12 | | | | 713,553 | | | | 28,157 | | | | 7,379 | | | | 737,974 | | |
Columbia U.S.
Government
Mortgage
Fund, Class I
Shares | | | 8,396,607 | | | | 11,727,377 | | | | (1,450,456 | ) | | | 88,802 | | | | 18,762,330 | | | | 366,819 | | | | 505,649 | | | | 18,900,983 | | |
Mortgage- and
Asset-Backed
Portfolio | | | 9,062,948 | | | | 673,669 | | | | (9,711,704 | ) | | | (24,913 | ) | | | — | | | | 361,044 | | | | 136,346 | | | | — | | |
Total | | | 118,158,534 | | | | 53,284,628 | | | | (63,516,157 | ) | | | 3,941,070 | | | | 111,868,075 | | | | 2,078,537 | | | | 3,455,837 | | | | 119,295,129 | | |
(b) Non-income producing.
(c) The rate shown is the seven-day current annualized yield at January 31, 2013.
Fair Value Measurements
Generally accepted accounting principles (GAAP) require disclosure regarding the inputs and valuation techniques used to measure fair value and any changes in valuation inputs or techniques. In addition, investments shall be disclosed by major category.
The Fund categorizes its fair value measurements according to a three-level hierarchy that maximizes the use of observable inputs and minimizes the use of unobservable inputs by prioritizing that the most observable input be used when available. Observable inputs are those that market participants would use in pricing an investment based on market data obtained from sources independent of the reporting entity. Unobservable inputs are those that reflect the Fund's assumptions about the information market participants would use in pricing an investment. An investment's level within the fair value hierarchy is based on the lowest level of any input that is deemed significant to the asset or liability's fair value measurement. The input levels are not necessarily an indication of the risk or liquidity associated with investments at that level. For example, certain U.S. government securities are generally high quality and liquid, however, they are reflected as Level 2 because the inputs used to determine fair value may not always be quoted prices in an active market.
Fair value inputs are summarized in the three broad levels listed below:
> Level 1 — Valuations based on quoted prices for investments in active markets that the Fund has the ability to access at the measurement date (including NAV for open-end mutual funds). Valuation adjustments are not applied to Level 1 investments.
> Level 2 — Valuations based on other significant observable inputs (including quoted prices for similar securities, interest rates, prepayment speeds, credit risks, etc.).
> Level 3 — Valuations based on significant unobservable inputs (including the Fund's own assumptions and judgment in determining the fair value of investments).
Inputs that are used in determining fair value of an investment may include price information, credit data, volatility statistics, and other factors. These inputs can be either observable or unobservable. The availability of observable inputs can vary between investments, and is affected by various factors such as the type of investment, and the volume and level of activity for that investment or similar investments in the marketplace. The inputs will be considered by the Investment Manager, along with any other relevant factors in the calculation of an investment's fair value. The Fund uses prices and inputs that are current as of the measurement date, which may include periods of market dislocations. During these periods, the availability of prices and inputs may be reduced for many investments. This condition could cause an investment to be reclassified between the various levels within the hierarchy.
The accompanying Notes to Financial Statements are an integral part of this statement.
Annual Report 2013
33
Columbia Capital Allocation Portfolios
Portfolio of Investments (continued)
Columbia Capital Allocation Moderate Conservative Portfolio
January 31, 2013
Fair Value Measurements (continued)
Investments falling into the Level 3 category are primarily supported by quoted prices from brokers and dealers participating in the market for those investments. However, these may be classified as Level 3 investments due to lack of market transparency and corroboration to support these quoted prices. Additionally, valuation models may be used as the pricing source for any remaining investments classified as Level 3. These models rely on one or more significant unobservable inputs and/or significant assumptions by the Investment Manager. Inputs used in valuations may include, but are not limited to, financial statement analysis, capital account balances, discount rates and estimated cash flows, and comparable company data.
Under the direction of the Fund's Board of Trustees (the Board), the Investment Manager's Valuation Committee (the Committee) is responsible for carrying out the valuation procedures approved by the Board. The Committee consists of voting and non-voting members from various groups within the Investment Manager's organization, including operations and accounting, trading and investments, compliance, risk management and legal.
The Committee meets at least monthly to review and approve valuation matters, which may include a description of specific valuation determinations, data regarding pricing information received from approved pricing vendors and brokers and the results of Board-approved valuation control policies and procedures (the Policies). The Policies address, among other things, instances when market quotations are readily available, including recommendations of third party pricing vendors and a determination of appropriate pricing methodologies; events that require specific valuation determinations and assessment of fair value techniques; securities with a potential for stale pricing, including those that are illiquid, restricted, or in default; and the effectiveness of third-party pricing vendors, including periodic reviews of vendors. The Committee meets more frequently, as needed, to discuss additional valuation matters, which may include the need to review back-testing results, review time-sensitive information or approve related valuation actions. The Committee reports to the Board, with members of the Committee meeting with the Board at each of its regularly scheduled meetings to discuss valuation matters and actions during the period, similar to those described earlier.
For investments categorized as Level 3, the Committee monitors information similar to that described above, which may include: (i) data specific to the issuer or comparable issuers, (ii) general market or specific sector news and (iii) quoted prices and specific or similar security transactions. The Committee considers this data and any changes from prior periods in order to assess the reasonableness of observable and unobservable inputs, any assumptions or internal models used to value those securities and changes in fair value. This data is also used to corroborate, when available, information received from approved pricing vendors and brokers. Various factors impact the frequency of monitoring this information (which may occur as often as daily). However, the Committee may determine that changes to inputs, assumptions and models are not required as a result of the monitoring procedures performed.
The following table is a summary of the inputs used to value the Fund's investments at January 31, 2013:
Description | | Level 1
Quoted Prices in Active
Markets for Identical
Assets ($) | |
Level 2
Other Significant
Observable Inputs ($) | |
Level 3
Significant
Unobservable Inputs ($) | |
Total ($) | |
Mutual Funds | |
Equity Funds | | | 37,494,084 | | | | — | | | | — | | | | 37,494,084 | | |
Fixed-Income Funds | | | 72,576,776 | | | | — | | | | — | | | | 72,576,776 | | |
Alternative Investment Funds | | | 6,248,824 | | | | — | | | | — | | | | 6,248,824 | | |
Money Market Funds | | | 4,233,372 | | | | — | | | | — | | | | 4,233,372 | | |
Total Mutual Funds | | | 120,553,056 | | | | — | | | | — | | | | 120,553,056 | | |
Bonds | |
Inflation-Indexed Bonds | | | — | | | | 5,406,141 | | | | — | | | | 5,406,141 | | |
Total Bonds | | | — | | | | 5,406,141 | | | | — | | | | 5,406,141 | | |
Investments in Securities | | | 120,553,056 | | | | 5,406,141 | | | | — | | | | 125,959,197 | | |
Derivatives | |
Liabilities | |
Futures Contracts | | | (51,771 | ) | | | — | | | | — | | | | (51,771 | ) | |
Total | | | 120,501,285 | | | | 5,406,141 | | | | — | | | | 125,907,426 | | |
See the Portfolio of Investments for all investment classifications not indicated in the table.
The Fund's assets assigned to the Level 2 input category are generally valued using the market approach, in which a security's value is determined through reference to prices and information from market transactions for similar or identical assets.
There were no transfers of financial assets between Levels 1 and 2 during the period.
Derivative instruments are valued at unrealized appreciation (depreciation).
The accompanying Notes to Financial Statements are an integral part of this statement.
Annual Report 2013
34
Columbia Capital Allocation Portfolios
Portfolio of Investments
Columbia Capital Allocation Moderate Portfolio
January 31, 2013
(Percentages represent value of investments compared to net assets)
Equity Funds 51.2%
| | | Shares | | Value ($) | |
Dividend Income 5.6% | |
Columbia Dividend Income Fund,
Class I Shares(a) | | | 3,050,198 | | | | 47,339,077 | | |
Columbia Dividend Opportunity Fund,
Class I Shares(a) | | | 4,355,026 | | | | 40,066,235 | | |
Total | | | | | 87,405,312 | | |
International 13.4% | |
Columbia Acorn International,
Class I Shares(a) | | | 143,394 | | | | 6,079,904 | | |
Columbia Emerging Markets Fund,
Class I Shares(a) | | | 4,379,725 | | | | 45,855,723 | | |
Columbia European Equity Fund,
Class I Shares(a) | | | 11,286,725 | | | | 72,912,245 | | |
Columbia Greater China Fund,
Class I Shares(a) | | | 371,508 | | | | 19,779,078 | | |
Columbia Pacific/Asia Fund,
Class I Shares(a) | | | 7,385,552 | | | | 64,032,733 | | |
Total | | | | | 208,659,683 | | |
U.S. Large Cap 20.6% | |
Columbia Contrarian Core Fund,
Class I Shares(a) | | | 4,935,028 | | | | 84,734,426 | | |
Columbia Large Cap Core Fund,
Class I Shares(a) | | | 1,592,049 | | | | 23,896,653 | | |
Columbia Large Cap Growth Fund,
Class I Shares(a) | | | 959,469 | | | | 27,786,233 | | |
Columbia Large Core Quantitative Fund,
Class I Shares(a) | | | 9,260,714 | | | | 62,509,820 | | |
Columbia Large Growth Quantitative
Fund, Class I Shares(a) | | | 5,738,032 | | | | 46,133,778 | | |
Columbia Select Large Cap Growth Fund,
Class I Shares(a)(b) | | | 2,942,802 | | | | 43,759,470 | | |
Columbia Select Large-Cap Value Fund,
Class I Shares(a) | | | 1,886,370 | | | | 33,124,648 | | |
Total | | | | | 321,945,028 | | |
U.S. Mid Cap 8.5% | |
Columbia Mid Cap Growth Fund,
Class I Shares(a)(b) | | | 2,369,052 | | | | 66,594,049 | | |
Columbia Mid Cap Value Fund,
Class I Shares(a) | | | 1,814,138 | | | | 28,735,946 | | |
Columbia Mid Cap Value Opportunity
Fund, Class I Shares(a) | | | 4,019,111 | | | | 37,136,592 | | |
Total | | | | | 132,466,587 | | |
Equity Funds (continued)
| | | Shares | | Value ($) | |
U.S. Small Cap 3.1% | |
Columbia Select Smaller-Cap Value Fund,
Class I Shares(a)(b) | | | 922,088 | | | | 16,422,377 | | |
Columbia Small Cap Core Fund,
Class I Shares(a) | | | 1,431,387 | | | | 24,576,918 | | |
Columbia Small Cap Growth Fund I,
Class I Shares(a)(b) | | | 272,871 | | | | 7,992,393 | | |
Total | | | | | 48,991,688 | | |
Total Equity Funds
(Cost: $674,999,933) | | | | | 799,468,298 | | |
Fixed-Income Funds 44.5%
Convertible 2.6% | |
Columbia Convertible Securities Fund,
Class I Shares(a) | | | 2,541,068 | | | | 39,970,994 | | |
Emerging Markets 2.0% | |
Columbia Emerging Markets Bond Fund,
Class I Shares(a) | | | 2,440,713 | | | | 30,801,797 | | |
High Yield 4.2% | |
Columbia Income Opportunities Fund,
Class I Shares(a) | | | 6,513,841 | | | | 65,854,938 | | |
Inflation Protected Securities 1.4% | |
Columbia Inflation Protected Securities
Fund, Class I Shares(a) | | | 2,178,175 | | | | 22,609,452 | | |
Investment Grade 34.3% | |
Columbia Corporate Income Fund,
Class I Shares(a) | | | 10,515,883 | | | | 109,996,143 | | |
Columbia Diversified Bond Fund,
Class I Shares(a) | | | 45,240,652 | | | | 227,560,478 | | |
Columbia Limited Duration Credit Fund,
Class I Shares(a) | | | 4,514,852 | | | | 45,645,151 | | |
Columbia U.S. Government Mortgage
Fund, Class I Shares(a) | | | 27,177,635 | | | | 152,194,757 | | |
Total | | | | | 535,396,529 | | |
Total Fixed-Income Funds
(Cost: $662,244,179) | | | | | 694,633,710 | | |
The accompanying Notes to Financial Statements are an integral part of this statement.
Annual Report 2013
35
Columbia Capital Allocation Portfolios
Portfolio of Investments (continued)
Columbia Capital Allocation Moderate Portfolio
January 31, 2013
Alternative Investment Funds 4.0%
| | | Shares | | Value ($) | |
Columbia Absolute Return Emerging
Markets Macro Fund, Class I Shares(a) | | | 2,473,436 | | | | 25,896,873 | | |
Columbia Absolute Return Multi-Strategy
Fund, Class I Shares(a) | | | 2,699,230 | | | | 27,127,259 | | |
Columbia Flexible Capital Income Fund,
Class I Shares(a) | | | 723,337 | | | | 8,231,574 | | |
Total Alternative Investment Funds
(Cost: $58,914,755) | | | | | 61,255,706 | | |
Money Market Funds 0.3%
| | | Shares | | Value ($) | |
Columbia Short-Term Cash Fund,
0.132%(a)(c) | | | 5,311,411 | | | | 5,311,411 | | |
Total Money Market Funds
(Cost: $5,311,411) | | | | | 5,311,411 | | |
Total Investments
(Cost: $1,401,470,278) | | | | | 1,560,669,125 | | |
Other Assets and Liabilities | | | | | 617,157 | | |
Net Assets | | | | | 1,561,286,282 | | |
Investments in Derivatives
Futures Contracts Outstanding at January 31, 2013
At January 31, 2013, $232,000 was held in a margin deposit account as collateral to cover initial margin requirements on open futures contracts.
Contract Description | | Number of
Contracts
Long (Short) | | Notional
Market
Value ($) | | Expiration
Date | | Unrealized
Appreciation ($) | | Unrealized
Depreciation ($) | |
U.S. Treasury Long Bond, 20-year | | | 40 | | | | 5,738,750 | | | March 2013 | | | — | | | | (276,032 | ) | |
U.S. Treasury Note, 10-year | | | 120 | | | | 15,753,750 | | | March 2013 | | | — | | | | (271,219 | ) | |
Total | | | | | | | | | — | | | | (547,251 | ) | |
Notes to Portfolio of Investments
(a) As defined in the Investment Company Act of 1940, an affiliated company is one in which the Fund owns 5% or more of its outstanding voting securities, or a company which is under common ownership or control with the Fund. Holdings and transactions in these affiliated companies during the year ended January 31, 2013, are as follows:
Issuer | | Beginning
Cost ($) | | Purchase
Cost ($) | | Cost/
Proceeds
From Sales ($) | | Realized
Gain/Loss ($) | | Ending
Cost ($) | | Capital Gain
Distributions ($) | | Dividends
or Interest
Income ($) | | Value ($) | |
Columbia
Absolute
Return
Emerging
Markets
Macro Fund,
Class I
Shares | | | 24,714,834 | | | | 1,033,263 | | | | (831,576 | ) | | | 18,622 | | | | 24,935,143 | | | | — | | | | 257,526 | | | | 25,896,873 | | |
Columbia
Absolute
Return
Multi-Strategy
Fund,
Class I
Shares | | | 31,548,322 | | | | 1,526,574 | | | | (6,277,630 | ) | | | 37,221 | | | | 26,834,487 | | | | — | | | | 321,606 | | | | 27,127,259 | | |
Columbia
Acorn
International,
Class I
Shares | | | 8,788,868 | | | | 299,136 | | | | (3,870,782 | ) | | | 354,727 | | | | 5,571,949 | | | | — | | | | 125,494 | | | | 6,079,904 | | |
The accompanying Notes to Financial Statements are an integral part of this statement.
Annual Report 2013
36
Columbia Capital Allocation Portfolios
Portfolio of Investments (continued)
Columbia Capital Allocation Moderate Portfolio
January 31, 2013
Notes to Portfolio of Investments (continued)
Issuer | | Beginning
Cost ($) | | Purchase
Cost ($) | | Cost/
Proceeds
From Sales ($) | | Realized
Gain/Loss ($) | | Ending
Cost ($) | | Capital Gain
Distributions ($) | | Dividends
or Interest
Income ($) | | Value ($) | |
Columbia
Contrarian
Core Fund,
Class I
Shares | | | 49,669,152 | | | | 23,052,993 | | | | (6,194,947 | ) | | | (239,934 | ) | | | 66,287,264 | | | | 91,358 | | | | 944,263 | | | | 84,734,426 | | |
Columbia
Convertible
Securities
Fund,
Class I
Shares | | | 37,170,058 | | | | 2,448,214 | | | | (2,492,215 | ) | | | 38,108 | | | | 37,164,165 | | | | — | | | | 1,271,954 | | | | 39,970,994 | | |
Columbia
Corporate
Income
Fund,
Class I
Shares | | | 90,941,580 | | | | 21,485,293 | | | | (7,793,455 | ) | | | 379,716 | | | | 105,013,134 | | | | 2,199,022 | | | | 3,886,815 | | | | 109,996,143 | | |
Columbia
Diversified
Bond Fund,
Class I
Shares | | | 311,798,096 | | | | 24,800,290 | | | | (127,693,505 | ) | | | 8,443,800 | | | | 217,348,681 | | | | 8,871,802 | | | | 7,442,631 | | | | 227,560,478 | | |
Columbia
Dividend
Income
Fund,
Class I
Shares | | | 50,130,108 | | | | 1,634,707 | | | | (10,540,705 | ) | | | 537,672 | | | | 41,761,782 | | | | — | | | | 1,239,884 | | | | 47,339,077 | | |
Columbia
Dividend
Opportunity
Fund,
Class I
Shares | | | 35,006,245 | | | | 2,050,282 | | | | (9,981,687 | ) | | | 1,976,073 | | | | 29,050,913 | | | | — | | | | 1,667,597 | | | | 40,066,235 | | |
Columbia
Emerging
Markets
Bond Fund,
Class I
Shares | | | 27,856,147 | | | | 2,349,827 | | | | (3,246,739 | ) | | | 264,154 | | | | 27,223,389 | | | | 198,369 | | | | 1,671,439 | | | | 30,801,797 | | |
Columbia
Emerging
Markets
Fund,
Class I
Shares | | | 18,170,464 | | | | 28,582,446 | | | | (3,198,522 | ) | | | (230,969 | ) | | | 43,323,419 | | | | 1,890,539 | | | | 269,925 | | | | 45,855,723 | | |
Columbia
European
Equity Fund,
Class I
Shares | | | 84,425,252 | | | | 23,973,006 | | | | (48,043,420 | ) | | | 1,305,064 | | | | 61,659,902 | | | | 287,189 | | | | 1,423,734 | | | | 72,912,245 | | |
The accompanying Notes to Financial Statements are an integral part of this statement.
Annual Report 2013
37
Columbia Capital Allocation Portfolios
Portfolio of Investments (continued)
Columbia Capital Allocation Moderate Portfolio
January 31, 2013
Notes to Portfolio of Investments (continued)
Issuer | | Beginning
Cost ($) | | Purchase
Cost ($) | | Cost/
Proceeds
From Sales ($) | | Realized
Gain/Loss ($) | | Ending
Cost ($) | | Capital Gain
Distributions ($) | | Dividends
or Interest
Income ($) | | Value ($) | |
Columbia
Flexible
Capital
Income
Fund,
Class I
Shares | | | 7,063,237 | | | | 453,412 | | | | (412,486 | ) | | | 40,961 | | | | 7,145,124 | | | | 34,744 | | | | 309,112 | | | | 8,231,574 | | |
Columbia
Greater
China Fund,
Class I
Shares | | | 18,434,786 | | | | 1,244,087 | | | | (1,369,678 | ) | | | (17,521 | ) | | | 18,291,674 | | | | — | | | | 274,060 | | | | 19,779,078 | | |
Columbia
Income
Opportunities
Fund,
Class I
Shares | | | 54,471,849 | | | | 8,440,198 | | | | (5,001,971 | ) | | | 1,166,360 | | | | 59,076,436 | | | | — | | | | 3,713,719 | | | | 65,854,938 | | |
Columbia
Inflation
Protected
Securities
Fund,
Class I
Shares | | | 25,932,361 | | | | 3,355,030 | | | | (8,030,316 | ) | | | 1,099,127 | | | | 22,356,202 | | | | 1,885,338 | | | | 473,226 | | | | 22,609,452 | | |
Columbia
Large Cap
Core Fund,
Class I
Shares | | | 22,717,692 | | | | 1,304,921 | | | | (2,207,846 | ) | | | 106,864 | | | | 21,921,631 | | | | 778,969 | | | | 294,192 | | | | 23,896,653 | | |
Columbia
Large Cap
Growth
Fund,
Class I
Shares | | | 24,802,349 | | | | 517,093 | | | | (9,806,043 | ) | | | 2,063,953 | | | | 17,577,352 | | | | — | | | | 172,827 | | | | 27,786,233 | | |
Columbia
Large Core
Quantitative
Fund,
Class I
Shares | | | 36,059,536 | | | | 15,329,952 | | | | (3,910,728 | ) | | | 1,558,798 | | | | 49,037,558 | | | | — | | | | 1,092,016 | | | | 62,509,820 | | |
Columbia
Large
Growth
Quantitative
Fund,
Class I
Shares | | | 45,778,743 | | | | 5,577,725 | | | | (7,095,807 | ) | | | (873,622 | ) | | | 43,387,039 | | | | 3,843,972 | | | | 839,303 | | | | 46,133,778 | | |
Columbia
Limited
Duration
Credit Fund,
Class I
Shares | | | 30,599,366 | | | | 15,032,708 | | | | (1,741,861 | ) | | | 156,948 | | | | 44,047,161 | | | | 692,697 | | | | 1,057,920 | | | | 45,645,151 | | |
The accompanying Notes to Financial Statements are an integral part of this statement.
Annual Report 2013
38
Columbia Capital Allocation Portfolios
Portfolio of Investments (continued)
Columbia Capital Allocation Moderate Portfolio
January 31, 2013
Notes to Portfolio of Investments (continued)
Issuer | | Beginning
Cost ($) | | Purchase
Cost ($) | | Cost/
Proceeds
From Sales ($) | | Realized
Gain/Loss ($) | | Ending
Cost ($) | | Capital Gain
Distributions ($) | | Dividends
or Interest
Income ($) | | Value ($) | |
Columbia
Mid Cap
Growth
Fund,
Class I
Shares | | | 45,226,978 | | | | 16,923,467 | | | | (463,587 | ) | | | (12,654 | ) | | | 61,674,204 | | | | 1,758,278 | | | | — | | | | 66,594,049 | | |
Columbia
Mid Cap
Value Fund,
Class I
Shares | | | 18,953,185 | | | | 7,510,128 | | | | (1,225,554 | ) | | | 42,783 | | | | 25,280,542 | | | | — | | | | 301,384 | | | | 28,735,946 | | |
Columbia
Mid Cap
Value
Opportunity
Fund,
Class I
Shares | | | 22,909,673 | | | | 969,152 | | | | (2,782,207 | ) | | | 1,274,623 | | | | 22,371,241 | | | | — | | | | 319,809 | | | | 37,136,592 | | |
Columbia
Multi-Advisor
Small Cap
Value Fund,
Class I
Shares | | | 6,744,426 | | | | 9,437 | | | | (11,795,472 | ) | | | 5,041,609 | | | | — | | | | — | | | | — | | | | — | | |
Columbia
Pacific/Asia
Fund,
Class I
Shares | | | 41,637,086 | | | | 18,060,591 | | | | (2,591,303 | ) | | | (98,383 | ) | | | 57,007,991 | | | | — | | | | 1,524,536 | | | | 64,032,733 | | |
Columbia
Select Large
Cap Growth
Fund,
Class I
Shares | | | 41,417,116 | | | | 1,551,754 | | | | (6,292,074 | ) | | | 146,494 | | | | 36,823,290 | | | | — | | | | — | | | | 43,759,470 | | |
Columbia
Select
Large-Cap
Value Fund,
Class I
Shares | | | 25,921,654 | | | | 2,179,330 | | | | (2,719,365 | ) | | | 738,959 | | | | 26,120,578 | | | | 996,457 | | | | 512,660 | | | | 33,124,648 | | |
Columbia
Select
Smaller-Cap
Value Fund,
Class I
Shares | | | 4,113,629 | | | | 11,934,308 | | | | (433,923 | ) | | | (29,011 | ) | | | 15,585,003 | | | | 397,658 | | | | — | | | | 16,422,377 | | |
Columbia
Short-Term
Cash Fund | | | 2,735,837 | | | | 28,891,388 | | | | (26,315,814 | ) | | | — | | | | 5,311,411 | | | | — | | | | 9,891 | | | | 5,311,411 | | |
Columbia
Small Cap
Core Fund,
Class I
Shares | | | — | | | | 24,429,280 | | | | (762,299 | ) | | | (5,830 | ) | | | 23,661,151 | | | | 692,575 | | | | 190,213 | | | | 24,576,918 | | |
The accompanying Notes to Financial Statements are an integral part of this statement.
Annual Report 2013
39
Columbia Capital Allocation Portfolios
Portfolio of Investments (continued)
Columbia Capital Allocation Moderate Portfolio
January 31, 2013
Notes to Portfolio of Investments (continued)
Issuer | | Beginning
Cost ($) | | Purchase
Cost ($) | | Cost/
Proceeds
From Sales ($) | | Realized
Gain/Loss ($) | | Ending
Cost ($) | | Capital Gain
Distributions ($) | | Dividends
or Interest
Income ($) | | Value ($) | |
Columbia
Small Cap
Growth
Fund I,
Class I
Shares | | | 16,566,093 | | | | 994,758 | | | | (8,163,044 | ) | | | (792,353 | ) | | | 8,605,454 | | | | 725,736 | | | | — | | | | 7,992,393 | | |
Columbia
U.S.
Government
Mortgage
Fund,
Class I
Shares | | | 66,103,655 | | | | 90,344,413 | | | | (7,194,597 | ) | | | 761,537 | | | | 150,015,008 | | | | 2,900,666 | | | | 4,770,926 | | | | 152,194,757 | | |
Columbia
U.S.
Treasury
Index Fund,
Class I
Shares | | | 26,757,834 | | | | 25,165 | | | | (28,226,011 | ) | | | 1,443,012 | | | | — | | | | — | | | | 8,444 | | | | — | | |
Total | | | 1,355,166,211 | | | | 388,314,328 | | | | (368,707,169 | ) | | | 26,696,908 | | | | 1,401,470,278 | | | | 28,245,369 | | | | 36,387,106 | | | | 1,560,669,125 | | |
(b) Non-income producing.
(c) The rate shown is the seven-day current annualized yield at January 31, 2013.
Fair Value Measurements
Generally accepted accounting principles (GAAP) require disclosure regarding the inputs and valuation techniques used to measure fair value and any changes in valuation inputs or techniques. In addition, investments shall be disclosed by major category.
The Fund categorizes its fair value measurements according to a three-level hierarchy that maximizes the use of observable inputs and minimizes the use of unobservable inputs by prioritizing that the most observable input be used when available. Observable inputs are those that market participants would use in pricing an investment based on market data obtained from sources independent of the reporting entity. Unobservable inputs are those that reflect the Fund's assumptions about the information market participants would use in pricing an investment. An investment's level within the fair value hierarchy is based on the lowest level of any input that is deemed significant to the asset or liability's fair value measurement. The input levels are not necessarily an indication of the risk or liquidity associated with investments at that level. For example, certain U.S. government securities are generally high quality and liquid, however, they are reflected as Level 2 because the inputs used to determine fair value may not always be quoted prices in an active market.
Fair value inputs are summarized in the three broad levels listed below:
> Level 1 — Valuations based on quoted prices for investments in active markets that the Fund has the ability to access at the measurement date (to include NAV for open-end mutual funds). Valuation adjustments are not applied to Level 1 investments.
> Level 2 — Valuations based on other significant observable inputs (including quoted prices for similar securities, interest rates, prepayment speeds, credit risks, etc.).
> Level 3 — Valuations based on significant unobservable inputs (including the Fund's own assumptions and judgment in determining the fair value of investments).
Inputs that are used in determining fair value of an investment may include price information, credit data, volatility statistics, and other factors. These inputs can be either observable or unobservable. The availability of observable inputs can vary between investments, and is affected by various factors such as the type of investment, and the volume and level of activity for that investment or similar investments in the marketplace. The inputs will be considered by the Investment Manager, along with any other relevant factors in the calculation of an investment's fair value. The Fund uses prices and inputs that are current as of the measurement date, which may include periods of market dislocations. During these periods, the availability of prices and inputs may be reduced for many investments. This condition could cause an investment to be reclassified between the various levels within the hierarchy.
The accompanying Notes to Financial Statements are an integral part of this statement.
Annual Report 2013
40
Columbia Capital Allocation Portfolios
Portfolio of Investments (continued)
Columbia Capital Allocation Moderate Portfolio
January 31, 2013
Fair Value Measurements (continued)
Investments falling into the Level 3 category are primarily supported by quoted prices from brokers and dealers participating in the market for those investments. However, these may be classified as Level 3 investments due to lack of market transparency and corroboration to support these quoted prices. Additionally, valuation models may be used as the pricing source for any remaining investments classified as Level 3. These models rely on one or more significant unobservable inputs and/or significant assumptions by the Investment Manager. Inputs used in valuations may include, but are not limited to, financial statement analysis, capital account balances, discount rates and estimated cash flows, and comparable company data.
Under the direction of the Fund's Board of Trustees (the Board), the Investment Manager's Valuation Committee (the Committee) is responsible for carrying out the valuation procedures approved by the Board. The Committee consists of voting and non-voting members from various groups within the Investment Manager's organization, including operations and accounting, trading and investments, compliance, risk management and legal.
The Committee meets at least monthly to review and approve valuation matters, which may include a description of specific valuation determinations, data regarding pricing information received from approved pricing vendors and brokers and the results of Board-approved valuation control policies and procedures (the Policies). The Policies address, among other things, instances when market quotations are readily available, including recommendations of third party pricing vendors and a determination of appropriate pricing methodologies; events that require specific valuation determinations and assessment of fair value techniques; securities with a potential for stale pricing, including those that are illiquid, restricted, or in default; and the effectiveness of third-party pricing vendors, including periodic reviews of vendors. The Committee meets more frequently, as needed, to discuss additional valuation matters, which may include the need to review back-testing results, review time-sensitive information or approve related valuation actions. The Committee reports to the Board, with members of the Committee meeting with the Board at each of its regularly scheduled meetings to discuss valuation matters and actions during the period, similar to those described earlier.
For investments categorized as Level 3, the Committee monitors information similar to that described above, which may include: (i) data specific to the issuer or comparable issuers, (ii) general market or specific sector news and (iii) quoted prices and specific or similar security transactions. The Committee considers this data and any changes from prior periods in order to assess the reasonableness of observable and unobservable inputs, any assumptions or internal models used to value those securities and changes in fair value. This data is also used to corroborate, when available, information received from approved pricing vendors and brokers. Various factors impact the frequency of monitoring this information (which may occur as often as daily). However, the Committee may determine that changes to inputs, assumptions and models are not required as a result of the monitoring procedures performed.
The following table is a summary of the inputs used to value the Fund's investments at January 31, 2013:
Description | | Level 1
Quoted Prices in Active
Markets for Identical
Assets ($) | | Level 2
Other Significant
Observable Inputs ($) | | Level 3
Significant
Unobservable Inputs ($) | | Total ($) | |
Mutual Funds | |
Equity Funds | | | 799,468,298 | | | | — | | | | — | | | | 799,468,298 | | |
Fixed-Income Funds | | | 694,633,710 | | | | — | | | | — | | | | 694,633,710 | | |
Alternative Investment Funds | | | 61,255,706 | | | | — | | | | — | | | | 61,255,706 | | |
Money Market Funds | | | 5,311,411 | | | | — | | | | — | | | | 5,311,411 | | |
Total Mutual Funds | | | 1,560,669,125 | | | | — | | | | — | | | | 1,560,669,125 | | |
Derivatives | |
Liabilities | |
Futures Contracts | | | (547,251 | ) | | | — | | | | — | | | | (547,251 | ) | |
Total | | | 1,560,121,874 | | | | — | | | | — | | | | 1,560,121,874 | | |
See the Portfolio of Investments for all investment classifications not indicated in the table.
There were no transfers of financial assets between Levels 1 and 2 during the period.
Derivative instruments are valued at unrealized appreciation (depreciation).
The accompanying Notes to Financial Statements are an integral part of this statement.
Annual Report 2013
41
Columbia Capital Allocation Portfolios
Portfolio of Investments
Columbia Capital Allocation Moderate Aggressive Portfolio
January 31, 2013
(Percentages represent value of investments compared to net assets)
Equity Funds 60.6%
| | | Shares | | Value ($) | |
Dividend Income 6.1% | |
Columbia Dividend Income Fund,
Class I Shares(a) | | | 2,093,843 | | | | 32,496,437 | | |
Columbia Dividend Opportunity Fund,
Class I Shares(a) | | | 3,540,405 | | | | 32,571,726 | | |
Total | | | | | 65,068,163 | | |
International 12.0% | |
Columbia Emerging Markets Fund,
Class I Shares(a) | | | 5,716,113 | | | | 59,847,706 | | |
Columbia European Equity Fund,
Class I Shares(a) | | | 836,979 | | | | 5,406,882 | | |
Columbia Greater China Fund,
Class I Shares(a) | | | 202,158 | | | | 10,762,900 | | |
Columbia Overseas Value Fund,
Class I Shares(a) | | | 3,209,556 | | | | 25,259,204 | | |
Columbia Pacific/Asia Fund,
Class I Shares(a) | | | 3,090,685 | | | | 26,796,236 | | |
Total | | | | | 128,072,928 | | |
U.S. Large Cap 26.3% | |
Columbia Contrarian Core Fund,
Class I Shares(a) | | | 4,113,411 | | | | 70,627,258 | | |
Columbia Large Cap Growth Fund,
Class I Shares(a) | | | 1,119,657 | | | | 32,425,268 | | |
Columbia Large Core Quantitative Fund,
Class I Shares(a) | | | 11,934,803 | | | | 80,559,922 | | |
Columbia Large Growth Quantitative
Fund, Class I Shares(a) | | | 2,660,853 | | | | 21,393,260 | | |
Columbia Large Value Quantitative
Fund, Class I Shares(a) | | | 2,874,644 | | | | 21,761,055 | | |
Columbia Select Large Cap Growth
Fund, Class I Shares(a)(b) | | | 2,921,029 | | | | 43,435,702 | | |
Columbia Select Large-Cap Value Fund,
Class I Shares(a) | | | 625,375 | | | | 10,981,585 | | |
Total | | | | | 281,184,050 | | |
U.S. Mid Cap 9.1% | |
Columbia Mid Cap Growth Fund,
Class I Shares(a)(b) | | | 1,734,792 | | | | 48,765,020 | | |
Columbia Mid Cap Value Fund,
Class I Shares(a) | | | 3,110,481 | | | | 49,270,015 | | |
Total | | | | | 98,035,035 | | |
Equity Funds (continued)
| | | Shares | | Value ($) | |
U.S. Small Cap 7.1% | |
Columbia Small Cap Growth Fund I,
Class I Shares(a)(b) | | | 1,299,603 | | | | 38,065,372 | | |
Columbia Small Cap Value Fund I,
Class I Shares(a) | | | 353,074 | | | | 16,319,104 | | |
Columbia Small Cap Value Fund II,
Class I Shares(a) | | | 1,376,853 | | | | 21,795,580 | | |
Total | | | | | 76,180,056 | | |
Total Equity Funds
(Cost: $599,635,835) | | | | | 648,540,232 | | |
Fixed-Income Funds 28.8%
Convertible 2.0% | |
Columbia Convertible Securities Fund,
Class I Shares(a) | | | 1,376,078 | | | | 21,645,705 | | |
Emerging Markets 2.0% | |
Columbia Emerging Markets Bond Fund,
Class I Shares(a) | | | 1,644,818 | | | | 20,757,602 | | |
High Yield 4.5% | |
Columbia High Yield Bond Fund,
Class I Shares(a) | | | 5,491,184 | | | | 16,363,729 | | |
Columbia Income Opportunities Fund,
Class I Shares(a) | | | 3,118,806 | | | | 31,531,126 | | |
Total | | | | | 47,894,855 | | |
International 1.9% | |
Columbia International Bond Fund,
Class I Shares(a) | | | 1,782,251 | | | | 20,620,647 | | |
Investment Grade 18.4% | |
Columbia Corporate Income Fund,
Class I Shares(a) | | | 8,865,301 | | | | 92,731,052 | | |
Columbia Limited Duration Credit Fund,
Class I Shares(a) | | | 3,086,118 | | | | 31,200,657 | | |
Columbia U.S. Government Mortgage
Fund, Class I Shares(a) | | | 13,028,422 | | | | 72,959,161 | | |
Total | | | | | 196,890,870 | | |
Total Fixed-Income Funds
(Cost: $295,217,384) | | | | | 307,809,679 | | |
The accompanying Notes to Financial Statements are an integral part of this statement.
Annual Report 2013
42
Columbia Capital Allocation Portfolios
Portfolio of Investments (continued)
Columbia Capital Allocation Moderate Aggressive Portfolio
January 31, 2013
Alternative Investment Funds 6.1%
| | | Shares | | Value ($) | |
Columbia Absolute Return Currency and
Income Fund, Class I Shares(a)(b) | | | 2,020,480 | | | | 20,629,102 | | |
Columbia Absolute Return Multi-Strategy
Fund, Class I Shares(a) | | | 2,850,841 | | | | 28,650,949 | | |
Columbia Commodity Strategy Fund,
Class I Shares(a)(b) | | | 1,655,435 | | | | 15,958,392 | | |
Total Alternative Investment Funds
(Cost: $64,639,537) | | | | | 65,238,443 | | |
Common Stocks —%
Issuer | | Shares | | Value ($) | |
Consumer Staples —% | |
Food Products —% | |
China Milk Products Group Ltd.(b)(c)(d) | | | 322,000 | | | | 10,407 | | |
Total Consumer Staples | | | | | 10,407 | | |
Total Common Stocks
(Cost: $172,880) | | | | | 10,407 | | |
Inflation-Indexed Bonds 2.5%
Issuer | | Coupon
Rate | | Principal
Amount ($) | | Value ($) | |
U.S. Treasury Inflation-Indexed Bond
07/15/13 | | | 1.875 | % | | | 1,630,988 | | | | 1,658,525 | | |
01/15/14 | | | 2.000 | % | | | 2,347,294 | | | | 2,420,497 | | |
Inflation-Indexed Bonds (continued)
Issuer | | Coupon
Rate | | Principal
Amount ($) | | Value ($) | |
01/15/15 | | | 1.625 | % | | | 3,052,803 | | | | 3,251,023 | | |
01/15/16 | | | 2.000 | % | | | 2,109,483 | | | | 2,344,870 | | |
07/15/17 | | | 2.625 | % | | | 1,735,520 | | | | 2,077,746 | | |
01/15/19 | | | 2.125 | % | | | 2,332,571 | | | | 2,823,353 | | |
01/15/21 | | | 1.125 | % | | | 285,509 | | | | 332,551 | | |
01/15/25 | | | 2.375 | % | | | 3,706,053 | | | | 4,926,422 | | |
04/15/29 | | | 3.875 | % | | | 3,377,016 | | | | 5,473,494 | | |
02/15/40 | | | 2.125 | % | | | 1,022,060 | | | | 1,450,808 | | |
Total Inflation-Indexed Bonds
(Cost: $23,728,908) | | | | | | | 26,759,289 | | |
Money Market Funds 2.0%
| | | Shares | | Value ($) | |
Columbia Short-Term Cash Fund,
0.132%(a)(e) | | | 21,553,489 | | | | 21,553,489 | | |
Total Money Market Funds
(Cost: $21,553,489) | | | | | 21,553,489 | | |
Total Investments
(Cost: $1,004,948,033) | | | | | 1,069,911,539 | | |
Other Assets and Liabilities | | | | | (388,379 | ) | |
Net Assets | | | | | 1,069,523,160 | | |
Investments in Derivatives
Futures Contracts Outstanding at January 31, 2013
At January 31, 2013, $58,300 was held in a margin deposit account as collateral to cover initial margin requirements on open futures contracts.
Contract Description | | Number of
Contracts
Long (Short) | | Notional
Market
Value ($) | | Expiration
Date | | Unrealized
Appreciation ($) | | Unrealized
Depreciation ($) | |
U.S. Treasury Note, 10-year | | | 53 | | | | 6,957,906 | | | March 2013 | | | — | | | | (106,525 | ) | |
The accompanying Notes to Financial Statements are an integral part of this statement.
Annual Report 2013
43
Columbia Capital Allocation Portfolios
Portfolio of Investments (continued)
Columbia Capital Allocation Moderate Aggressive Portfolio
January 31, 2013
Notes to Portfolio of Investments
(a) As defined in the Investment Company Act of 1940, an affiliated company is one in which the Fund owns 5% or more of its outstanding voting securities, or a company which is under common ownership or control with the Fund. Holdings and transactions in these affiliated companies during the year ended January 31, 2013, are as follows:
Issuer | | Beginning
Cost ($) | | Purchase
Cost ($) | | Cost/
Proceeds
From Sales ($) | | Realized
Gain/Loss ($) | | Ending
Cost ($) | | Capital Gain
Distributions ($) | | Dividends
or Interest
Income ($) | | Value ($) | |
Columbia
Absolute
Return
Currency
and Income
Fund,
Class I
Shares | | | 21,809,715 | | | | 1,253,096 | | | | (2,691,515 | ) | | | 60,321 | | | | 20,431,617 | | | | 461,787 | | | | — | | | | 20,629,102 | | |
Columbia
Absolute
Return
Multi-Strategy
Fund,
Class I
Shares | | | 29,866,961 | | | | 1,344,583 | | | | (2,834,592 | ) | | | 8,241 | | | | 28,385,193 | | | | — | | | | 345,441 | | | | 28,650,949 | | |
Columbia
Bond Fund,
Class I
Shares | | | 20,656,573 | | | | — | | | | (20,988,337 | ) | | | 331,764 | | | | — | | | | — | | | | 6,007 | | | | — | | |
Columbia
Commodity
Strategy
Fund,
Class I
Shares | | | — | | | | 16,948,735 | | | | (1,127,932 | ) | | | 1,923 | | | | 15,822,726 | | | | — | | | | — | | | | 15,958,392 | | |
Columbia
Contrarian
Core Fund,
Class I
Shares | | | 52,575,084 | | | | 17,377,263 | | | | (13,431,392 | ) | | | 4,553,163 | | | | 61,074,118 | | | | 78,027 | | | | 806,477 | | | | 70,627,258 | | |
Columbia
Convertible
Securities
Fund,
Class I
Shares | | | 22,640,177 | | | | 901,420 | | | | (3,730,082 | ) | | | 369,984 | | | | 20,181,499 | | | | — | | | | 726,304 | | | | 21,645,705 | | |
Columbia
Corporate
Income
Fund,
Class I
Shares | | | 73,824,597 | | | | 28,821,643 | | | | (16,013,955 | ) | | | 1,187,214 | | | | 87,819,499 | | | | 1,861,557 | | | | 3,430,098 | | | | 92,731,052 | | |
Columbia
Dividend
Income
Fund,
Class I
Shares | | | 27,969,217 | | | | 4,540,325 | | | | (4,968,440 | ) | | | 475,356 | | | | 28,016,458 | | | | — | | | | 881,231 | | | | 32,496,437 | | |
The accompanying Notes to Financial Statements are an integral part of this statement.
Annual Report 2013
44
Columbia Capital Allocation Portfolios
Portfolio of Investments (continued)
Columbia Capital Allocation Moderate Aggressive Portfolio
January 31, 2013
Notes to Portfolio of Investments (continued)
Issuer | | Beginning
Cost ($) | | Purchase
Cost ($) | | Cost/
Proceeds
From Sales ($) | | Realized
Gain/Loss ($) | | Ending
Cost ($) | | Capital Gain
Distributions ($) | | Dividends
or Interest
Income ($) | | Value ($) | |
Columbia
Dividend
Opportunity
Fund,
Class I
Shares | | | 17,037,201 | | | | 16,667,224 | | | | (4,918,562 | ) | | | 594,939 | | | | 29,380,802 | | | | — | | | | 1,409,009 | | | | 32,571,726 | | |
Columbia
Emerging
Markets
Bond Fund,
Class I
Shares | | | 19,214,757 | | | | 3,962,772 | | | | (4,655,359 | ) | | | 334,918 | | | | 18,857,088 | | | | 134,222 | | | | 1,181,107 | | | | 20,757,602 | | |
Columbia
Emerging
Markets
Fund,
Class I
Shares | | | 37,218,998 | | | | 33,535,143 | | | | (9,723,997 | ) | | | (1,201,175 | ) | | | 59,828,969 | | | | 2,671,840 | | | | 351,347 | | | | 59,847,706 | | |
Columbia
Energy and
Natural
Resources
Fund,
Class I
Shares | | | 19,215,927 | | | | — | | | | (17,739,376 | ) | | | (1,476,551 | ) | | | — | | | | — | | | | — | | | | — | | |
Columbia
European
Equity Fund,
Class I
Shares | | | 43,721,849 | | | | 577,220 | | | | (37,853,644 | ) | | | (1,434,912 | ) | | | 5,010,513 | | | | 21,054 | | | | 104,377 | | | | 5,406,882 | | |
Columbia
Greater
China
Fund,
Class I
Shares | | | 22,078,556 | | | | 533,830 | | | | (9,296,423 | ) | | | (2,618,681 | ) | | | 10,697,282 | | | | — | | | | 149,551 | | | | 10,762,900 | | |
Columbia
High Yield
Bond Fund,
Class I
Shares | | | 16,902,033 | | | | 1,416,773 | | | | (2,967,424 | ) | | | 115,840 | | | | 15,467,222 | | | | — | | | | 1,065,953 | | | | 16,363,729 | | |
Columbia
Income
Opportunities
Fund,
Class I
Shares | | | 34,918,583 | | | | 2,416,492 | | | | (7,699,428 | ) | | | 325,799 | | | | 29,961,446 | | | | — | | | | 1,865,452 | | | | 31,531,126 | | |
Columbia
International
Bond Fund,
Class I
Shares | | | 18,918,739 | | | | 3,773,405 | | | | (2,814,373 | ) | | | 71,172 | | | | 19,948,943 | | | | — | | | | 410,514 | | | | 20,620,647 | | |
The accompanying Notes to Financial Statements are an integral part of this statement.
Annual Report 2013
45
Columbia Capital Allocation Portfolios
Portfolio of Investments (continued)
Columbia Capital Allocation Moderate Aggressive Portfolio
January 31, 2013
Notes to Portfolio of Investments (continued)
Issuer | | Beginning
Cost ($) | | Purchase
Cost ($) | | Cost/
Proceeds
From Sales ($) | | Realized
Gain/Loss ($) | | Ending
Cost ($) | | Capital Gain
Distributions ($) | | Dividends
or Interest
Income ($) | | Value ($) | |
Columbia
International
Value Fund,
Class I
Shares | | | 11 | | | | — | | | | — | | | | (11 | ) | | | — | | | | — | | | | — | | | | — | | |
Columbia
Large Cap
Core Fund,
Class I
Shares | | | 44,036,837 | | | | — | | | | (48,504,710 | ) | | | 4,467,873 | | | | — | | | | — | | | | — | | | | — | | |
Columbia
Large Cap
Growth
Fund,
Class I
Shares | | | 49,082,736 | | | | 457,964 | | | | (28,213,611 | ) | | | 5,317,788 | | | | 26,644,877 | | | | — | | | | 205,645 | | | | 32,425,268 | | |
Columbia
Large Core
Quantitative
Fund,
Class I
Shares | | | 27,608,545 | | | | 56,100,901 | | | | (11,874,817 | ) | | | 1,343,474 | | | | 73,178,103 | | | | — | | | | 1,417,044 | | | | 80,559,922 | | |
Columbia
Large
Growth
Quantitative
Fund,
Class I
Shares | | | — | | | | 25,297,422 | | | | (3,505,368 | ) | | | 116,920 | | | | 21,908,974 | | | | 1,791,870 | | | | 391,242 | | | | 21,393,260 | | |
Columbia
Large Value
Quantitative
Fund,
Class I
Shares | | | 16,558,082 | | | | 6,160,343 | | | | (3,948,776 | ) | | | 1,198,675 | | | | 19,968,324 | | | | 513,803 | | | | 708,736 | | | | 21,761,055 | | |
Columbia
Limited
Duration
Credit Fund,
Class I
Shares | | | 38,298,682 | | | | 2,201,531 | | | | (9,579,314 | ) | | | 80,910 | | | | 31,001,809 | | | | 474,148 | | | | 763,276 | | | | 31,200,657 | | |
Columbia
Mid Cap
Growth Fund,
Class I
Shares | | | 40,533,283 | | | | 12,664,497 | | | | (11,495,142 | ) | | | 4,295,111 | | | | 45,997,749 | | | | 1,324,203 | | | | — | | | | 48,765,020 | | |
Columbia
Mid Cap
Value Fund,
Class I
Shares | | | 33,218,807 | | | | 16,085,700 | | | | (8,044,917 | ) | | | 1,854,964 | | | | 43,114,554 | | | | — | | | | 561,514 | | | | 49,270,015 | | |
The accompanying Notes to Financial Statements are an integral part of this statement.
Annual Report 2013
46
Columbia Capital Allocation Portfolios
Portfolio of Investments (continued)
Columbia Capital Allocation Moderate Aggressive Portfolio
January 31, 2013
Notes to Portfolio of Investments (continued)
Issuer | | Beginning
Cost ($) | | Purchase
Cost ($) | | Cost/
Proceeds
From Sales ($) | | Realized
Gain/Loss ($) | | Ending
Cost ($) | | Capital Gain
Distributions ($) | | Dividends
or Interest
Income ($) | | Value ($) | |
Columbia
Multi-Advisor
International
Equity Fund,
Class I
Shares | | | 56,428,089 | | | | — | | | | (54,471,405 | ) | | | (1,956,684 | ) | | | — | | | | — | | | | — | | | | — | | |
Columbia
Overseas
Value Fund,
Class I
Shares | | | 28,157,431 | | | | 901,660 | | | | (4,150,363 | ) | | | (281,947 | ) | | | 24,626,781 | | | | — | | | | 570,939 | | | | 25,259,204 | | |
Columbia
Pacific/Asia
Fund,
Class I
Shares | | | 17,204,848 | | | | 12,285,663 | | | | (3,958,535 | ) | | | 134,247 | | | | 25,666,223 | | | | — | | | | 654,348 | | | | 26,796,236 | | |
Columbia
Select
Large Cap
Growth
Fund,
Class I
Shares | | | 38,640,963 | | | | 5,232,521 | | | | (6,909,481 | ) | | | 1,973,651 | | | | 38,937,654 | | | | — | | | | — | | | | 43,435,702 | | |
Columbia
Select
Large-Cap
Value Fund,
Class I
Shares | | | 9,045,981 | | | | 2,900,656 | | | | (1,981,039 | ) | | | 49,794 | | | | 10,015,392 | | | | 335,509 | | | | 172,614 | | | | 10,981,585 | | |
Columbia
Short-Term
Cash Fund | | | 37,781,238 | | | | 33,527,833 | | | | (49,755,582 | ) | | | — | | | | 21,553,489 | | | | — | | | | 38,405 | | | | 21,553,489 | | |
Columbia
Small Cap
Growth
Fund I,
Class I
Shares | | | 7,696,860 | | | | 34,365,137 | | | | (3,925,313 | ) | | | 1,086,691 | | | | 39,223,375 | | | | 3,547,413 | | | | — | | | | 38,065,372 | | |
Columbia
Small Cap
Growth
Fund II,
Class I
Shares | | | 10,486,102 | | | | — | | | | (11,729,251 | ) | | | 1,243,149 | | | | — | | | | — | | | | — | | | | — | | |
Columbia
Small Cap
Value
Fund I,
Class I
Shares | | | 19,668,743 | | | | 1,311,774 | | | | (6,099,601 | ) | | | 1,038,580 | | | | 15,919,496 | | | | 576,379 | | | | 151,243 | | | | 16,319,104 | | |
The accompanying Notes to Financial Statements are an integral part of this statement.
Annual Report 2013
47
Columbia Capital Allocation Portfolios
Portfolio of Investments (continued)
Columbia Capital Allocation Moderate Aggressive Portfolio
January 31, 2013
Notes to Portfolio of Investments (continued)
Issuer | | Beginning
Cost ($) | | Purchase
Cost ($) | | Cost/
Proceeds
From Sales ($) | | Realized
Gain/Loss ($) | | Ending
Cost ($) | | Capital Gain
Distributions ($) | | Dividends
or Interest
Income ($) | | Value ($) | |
Columbia
Small Cap
Value
Fund II,
Class I
Shares | | | 11,705,906 | | | | 12,063,119 | | | | (3,615,539 | ) | | | 272,703 | | | | 20,426,189 | | | | 450,508 | | | | 251,261 | | | | 21,795,580 | | |
Columbia
U.S.
Government
Mortgage
Fund,
Class I
Shares | | | 50,421,820 | | | | 27,902,813 | | | | (6,753,052 | ) | | | 408,300 | | | | 71,979,881 | | | | 1,392,345 | | | | 2,012,987 | | | | 72,959,161 | | |
Mortgage-
and
Asset-
Backed
Portfolio | | | 37,328,344 | | | | 2,116,450 | | | | (39,465,831 | ) | | | 21,037 | | | | — | | | | 1,182,652 | | | | 451,729 | | | | — | | |
Total | | | 1,052,472,275 | | | | 385,645,908 | | | | (481,436,478 | ) | | | 24,364,540 | | | | 981,046,245 | | | | 16,817,317 | | | | 21,083,851 | | | | 1,043,141,843 | | |
(b) Non-income producing.
(c) Identifies issues considered to be illiquid as to their marketability. The aggregate value of such securities at January 31, 2013 was $10,407, representing less than 0.01% of net assets. Information concerning such security holdings at January 31, 2013 is as follows:
Security Description | | Acquisition Dates | | Cost ($) | |
China Milk Products Group Ltd. | | 11/17/10 | | | 172,880 | | |
(d) Represents fair value as determined in good faith under procedures approved by the Board of Trustees. At January 31, 2013, the value of these securities amounted to $10,407, which represents less than 0.01% of net assets.
(e) The rate shown is the seven-day current annualized yield at January 31, 2013.
Fair Value Measurements
Generally accepted accounting principles (GAAP) require disclosure regarding the inputs and valuation techniques used to measure fair value and any changes in valuation inputs or techniques. In addition, investments shall be disclosed by major category.
The Fund categorizes its fair value measurements according to a three-level hierarchy that maximizes the use of observable inputs and minimizes the use of unobservable inputs by prioritizing that the most observable input be used when available. Observable inputs are those that market participants would use in pricing an investment based on market data obtained from sources independent of the reporting entity. Unobservable inputs are those that reflect the Fund's assumptions about the information market participants would use in pricing an investment. An investment's level within the fair value hierarchy is based on the lowest level of any input that is deemed significant to the asset or liability's fair value measurement. The input levels are not necessarily an indication of the risk or liquidity associated with investments at that level. For example, certain U.S. government securities are generally high quality and liquid, however, they are reflected as Level 2 because the inputs used to determine fair value may not always be quoted prices in an active market.
Fair value inputs are summarized in the three broad levels listed below:
> Level 1 — Valuations based on quoted prices for investments in active markets that the Fund has the ability to access at the measurement date (including NAV for open-end mutual funds). Valuation adjustments are not applied to Level 1 investments.
> Level 2 — Valuations based on other significant observable inputs (including quoted prices for similar securities, interest rates, prepayment speeds, credit risks, etc.).
> Level 3 — Valuations based on significant unobservable inputs (including the Fund's own assumptions and judgment in determining the fair value of investments).
The accompanying Notes to Financial Statements are an integral part of this statement.
Annual Report 2013
48
Columbia Capital Allocation Portfolios
Portfolio of Investments (continued)
Columbia Capital Allocation Moderate Aggressive Portfolio
January 31, 2013
Fair Value Measurements (continued)
Inputs that are used in determining fair value of an investment may include price information, credit data, volatility statistics, and other factors. These inputs can be either observable or unobservable. The availability of observable inputs can vary between investments, and is affected by various factors such as the type of investment, and the volume and level of activity for that investment or similar investments in the marketplace. The inputs will be considered by the Investment Manager, along with any other relevant factors in the calculation of an investment's fair value. The Fund uses prices and inputs that are current as of the measurement date, which may include periods of market dislocations. During these periods, the availability of prices and inputs may be reduced for many investments. This condition could cause an investment to be reclassified between the various levels within the hierarchy.
Investments falling into the Level 3 category are primarily supported by quoted prices from brokers and dealers participating in the market for those investments. However, these may be classified as Level 3 investments due to lack of market transparency and corroboration to support these quoted prices. Additionally, valuation models may be used as the pricing source for any remaining investments classified as Level 3. These models rely on one or more significant unobservable inputs and/or significant assumptions by the Investment Manager. Inputs used in valuations may include, but are not limited to, financial statement analysis, capital account balances, discount rates and estimated cash flows, and comparable company data.
Under the direction of the Fund's Board of Trustees (the Board), the Investment Manager's Valuation Committee (the Committee) is responsible for carrying out the valuation procedures approved by the Board. The Committee consists of voting and non-voting members from various groups within the Investment Manager's organization, including operations and accounting, trading and investments, compliance, risk management and legal.
The Committee meets at least monthly to review and approve valuation matters, which may include a description of specific valuation determinations, data regarding pricing information received from approved pricing vendors and brokers and the results of Board-approved valuation control policies and procedures (the Policies). The Policies address, among other things, instances when market quotations are readily available, including recommendations of third party pricing vendors and a determination of appropriate pricing methodologies; events that require specific valuation determinations and assessment of fair value techniques; securities with a potential for stale pricing, including those that are illiquid, restricted, or in default; and the effectiveness of third-party pricing vendors, including periodic reviews of vendors. The Committee meets more frequently, as needed, to discuss additional valuation matters, which may include the need to review back-testing results, review time-sensitive information or approve related valuation actions. The Committee reports to the Board, with members of the Committee meeting with the Board at each of its regularly scheduled meetings to discuss valuation matters and actions during the period, similar to those described earlier.
For investments categorized as Level 3, the Committee monitors information similar to that described above, which may include: (i) data specific to the issuer or comparable issuers, (ii) general market or specific sector news and (iii) quoted prices and specific or similar security transactions. The Committee considers this data and any changes from prior periods in order to assess the reasonableness of observable and unobservable inputs, any assumptions or internal models used to value those securities and changes in fair value. This data is also used to corroborate, when available, information received from approved pricing vendors and brokers. Various factors impact the frequency of monitoring this information (which may occur as often as daily). However, the Committee may determine that changes to inputs, assumptions and models are not required as a result of the monitoring procedures performed.
The following table is a summary of the inputs used to value the Fund's investments at January 31, 2013:
Description | | Level 1
Quoted Prices in Active
Markets for Identical
Assets ($) | | Level 2
Other Significant
Observable Inputs ($) | | Level 3
Significant
Unobservable Inputs ($) | | Total ($) | |
Mutual Funds | |
Equity Funds | | | 648,540,232 | | | | — | | | | — | | | | 648,540,232 | | |
Fixed-Income Funds | | | 307,809,679 | | | | — | | | | — | | | | 307,809,679 | | |
Alternative Investment Funds | | | 65,238,443 | | | | — | | | | — | | | | 65,238,443 | | |
Money Market Funds | | | 21,553,489 | | | | — | | | | — | | | | 21,553,489 | | |
Total Mutual Funds | | | 1,043,141,843 | | | | — | | | | — | | | | 1,043,141,843 | | |
Equity Securities | |
Common Stocks | |
Consumer Staples | | | — | | | | — | | | | 10,407 | | | | 10,407 | | |
Total Equity Securities | | | — | | | | — | | | | 10,407 | | | | 10,407 | | |
The accompanying Notes to Financial Statements are an integral part of this statement.
Annual Report 2013
49
Columbia Capital Allocation Portfolios
Portfolio of Investments (continued)
Columbia Capital Allocation Moderate Aggressive Portfolio
January 31, 2013
Fair Value Measurements (continued)
Description | | Level 1
Quoted Prices in Active
Markets for Identical
Assets ($) | | Level 2
Other Significant
Observable Inputs ($) | | Level 3
Significant
Unobservable Inputs ($) | | Total ($) | |
Bonds | |
Inflation-Indexed Bonds | | | — | | | | 26,759,289 | | | | — | | | | 26,759,289 | | |
Total Bonds | | | — | | | | 26,759,289 | | | | — | | | | 26,759,289 | | |
Investments in Securities | | | 1,043,141,843 | | | | 26,759,289 | | | | 10,407 | | | | 1,069,911,539 | | |
Derivatives | |
Liabilities | |
Futures Contracts | | | (106,525 | ) | | | — | | | | — | | | | (106,525 | ) | |
Total | | | 1,043,035,318 | | | | 26,759,289 | | | | 10,407 | | | | 1,069,805,014 | | |
See the Portfolio of Investments for all investment classifications not indicated in the table.
The Fund's assets assigned to the Level 2 input category are generally valued using the market approach, in which a security's value is determined through reference to prices and information from market transactions for similar or identical assets.
There were no transfers of financial assets between Levels 1 and 2 during the period.
Derivative instruments are valued at unrealized appreciation (depreciation).
The following table is a reconciliation of Level 3 assets for which significant observable and/or unobservable inputs were used to determine fair value.
| | | Common Stocks ($) | |
Balance as of January 31, 2012 | | | 10,240 | | |
Accrued discounts/premiums | | | — | | |
Realized gain (loss) | | | — | | |
Change in unrealized appreciation (depreciation)(a) | | | 167 | | |
Sales | | | — | | |
Purchases | | | — | | |
Transfers into Level 3 | | | — | | |
Transfers out of Level 3 | | | — | | |
Balance as of January 31, 2013 | | | 10,407 | | |
(a) Change in unrealized appreciation (depreciation) relating to securities held at January 31, 2013 was $167.
The Fund does not hold any significant investments with unobservable inputs which are categorized as Level 3.
The Fund's assets assigned to the Level 3 category are valued utilizing the valuation technique deemed the most appropriate in the circumstances. Certain common stock classified as Level 3 securities are valued using the market approach. To determine fair value for these securities, management considered various factors which may have included, but were not limited to, the halt price of the security, the movement in observed market prices for other securities from the issuer, the movement in certain foreign or domestic market indices, and the position of the security within the respective company's capital structure. Significant increases (decreases) to any of these inputs would result in a significantly lower (higher) fair value measurement.
Transfers in and/or out of Level 3 are determined based on the fair value at the beginning of the period for security positions held throughout the period.
The accompanying Notes to Financial Statements are an integral part of this statement.
Annual Report 2013
50
Columbia Capital Allocation Portfolios
Portfolio of Investments
Columbia Capital Allocation Aggressive Portfolio
January 31, 2013
(Percentages represent value of investments compared to net assets)
Equity Funds 82.3%
| | | Shares | | Value ($) | |
Dividend Income 5.3% | |
Columbia Dividend Income Fund,
Class I Shares(a) | | | 925,315 | | | | 14,360,886 | | |
Columbia Dividend Opportunity Fund,
Class I Shares(a) | | | 1,731,445 | | | | 15,929,297 | | |
Total | | | | | 30,290,183 | | |
International 21.8% | |
Columbia Acorn International,
Class I Shares(a) | | | 97,784 | | | | 4,146,044 | | |
Columbia Emerging Markets Fund,
Class I Shares(a) | | | 2,325,158 | | | | 24,344,398 | | |
Columbia European Equity Fund,
Class I Shares(a) | | | 7,073,017 | | | | 45,691,689 | | |
Columbia Greater China Fund,
Class I Shares(a) | | | 314,445 | | | | 16,741,056 | | |
Columbia Pacific/Asia Fund,
Class I Shares(a) | | | 3,951,311 | | | | 34,257,868 | | |
Total | | | | | 125,181,055 | | |
Real Estate 1.9% | |
Columbia Real Estate Equity Fund,
Class I Shares(a) | | | 757,514 | | | | 11,203,634 | | |
U.S. Large Cap 34.4% | |
Columbia Contrarian Core Fund,
Class I Shares(a) | | | 2,534,907 | | | | 43,524,345 | | |
Columbia Diversified Equity Income Fund,
Class I Shares(a) | | | 1,418,738 | | | | 15,960,801 | | |
Columbia Large Cap Core Fund,
Class I Shares(a) | | | 1,539,155 | | | | 23,102,719 | | |
Columbia Large Cap Growth Fund,
Class I Shares(a) | | | 597,316 | | | | 17,298,272 | | |
Columbia Large Core Quantitative Fund,
Class I Shares(a) | | | 4,211,589 | | | | 28,428,225 | | |
Columbia Large Growth Quantitative
Fund, Class I Shares(a) | | | 2,089,724 | | | | 16,801,383 | | |
Columbia Select Large Cap Growth
Fund, Class I Shares(a)(b) | | | 2,145,405 | | | | 31,902,166 | | |
Columbia Select Large-Cap Value Fund,
Class I Shares(a) | | | 1,169,506 | | | | 20,536,531 | | |
Total | | | | | 197,554,442 | | |
Equity Funds (continued)
| | | Shares | | Value ($) | |
U.S. Mid Cap 13.7% | |
Columbia Mid Cap Growth Fund,
Class I Shares(a)(b) | | | 1,438,206 | | | | 40,427,968 | | |
Columbia Mid Cap Value Fund,
Class I Shares(a) | | | 1,107,457 | | | | 17,542,128 | | |
Columbia Mid Cap Value Opportunity
Fund, Class I Shares(a) | | | 2,217,580 | | | | 20,490,435 | | |
Total | | | | | 78,460,531 | | |
U.S. Small Cap 5.2% | |
Columbia Multi-Advisor Small Cap Value
Fund, Class I Shares(a) | | | 848,387 | | | | 5,811,453 | | |
Columbia Select Smaller-Cap Value
Fund, Class I Shares(a)(b) | | | 245,751 | | | | 4,376,818 | | |
Columbia Small Cap Core Fund,
Class I Shares(a) | | | 545,614 | | | | 9,368,190 | | |
Columbia Small Cap Growth Fund I,
Class I Shares(a)(b) | | | 346,527 | | | | 10,149,790 | | |
Total | | | | | 29,706,251 | | |
Total Equity Funds
(Cost: $393,399,251) | | | | | 472,396,096 | | |
Fixed-Income Funds 13.5%
High Yield 3.2% | |
Columbia Income Opportunities Fund,
Class I Shares(a) | | | 1,787,529 | | | | 18,071,915 | | |
Investment Grade 10.3% | |
Columbia Corporate Income Fund,
Class I Shares(a) | | | 3,076,124 | | | | 32,176,252 | | |
Columbia U.S. Government Mortgage
Fund, Class I Shares(a) | | | 4,826,559 | | | | 27,028,732 | | |
Total | | | | | 59,204,984 | | |
Total Fixed-Income Funds
(Cost: $74,042,799) | | | | | 77,276,899 | | |
Alternative Investment Funds 3.3%
Columbia Absolute Return Emerging
Markets Macro Fund, Class I Shares(a) | | | 1,036,566 | | | | 10,852,850 | | |
Columbia Absolute Return Enhanced
Multi-Strategy Fund, Class I Shares(a) | | | 539,008 | | | | 5,406,247 | | |
Columbia Flexible Capital Income Fund,
Class I Shares(a) | | | 261,839 | | | | 2,979,733 | | |
Total Alternative Investment Funds
(Cost: $18,351,839) | | | | | 19,238,830 | | |
The accompanying Notes to Financial Statements are an integral part of this statement.
Annual Report 2013
51
Columbia Capital Allocation Portfolios
Portfolio of Investments (continued)
Columbia Capital Allocation Aggressive Portfolio
January 31, 2013
Money Market Funds 0.9%
| | | Shares | | Value ($) | |
Columbia Short-Term Cash Fund,
0.132%(a)(c) | | | 5,165,113 | | | | 5,165,113 | | |
Total Money Market Funds
(Cost: $5,165,113) | | | | | 5,165,113 | | |
Total Investments
(Cost: $490,959,002) | | | | | 574,076,938 | | |
Other Assets and Liabilities | | | | | (152,173 | ) | |
Net Assets | | | | | 573,924,765 | | |
Notes to Portfolio of Investments Funds
(a) As defined in the Investment Company Act of 1940, an affiliated company is one in which the Fund owns 5% or more of its outstanding voting securities, or a company which is under common ownership or control with the Fund. Holdings and transactions in these affiliated companies during the year ended January 31, 2013, are as follows:
Issuer | | Beginning
Cost ($) | | Purchase
Cost ($) | | Cost/
Proceeds
From Sales ($) | | Realized
Gain/Loss ($) | | Ending
Cost ($) | | Capital Gain
Distributions ($) | | Dividends
or Interest
Income ($) | | Value ($) | |
Columbia
Acorn
International,
Class I
Shares | | | 5,363,890 | | | | 106,104 | | | | (2,438,324 | ) | | | 659,008 | | | | 3,690,678 | | | | — | | | | 86,396 | | | | 4,146,044 | | |
Columbia
Absolute
Return
Emerging
Markets
Macro Fund,
Class I
Shares | | | 18,985,576 | | | | 541,852 | | | | (9,150,827 | ) | | | 51,924 | | | | 10,428,525 | | | | — | | | | 107,963 | | | | 10,852,850 | | |
Columbia
Absolute
Return
Enhanced
Multi-Strategy
Fund, Class I
Shares | | | 8,096,757 | | | | 366,424 | | | | (3,174,165 | ) | | | 45,713 | | | | 5,334,729 | | | | — | | | | 142,871 | | | | 5,406,247 | | |
Columbia
Contrarian
Core Fund,
Class I
Shares | | | 31,214,502 | | | | 10,347,222 | | | | (6,034,937 | ) | | | (914,877 | ) | | | 34,611,910 | | | | 47,160 | | | | 487,439 | | | | 43,524,345 | | |
Columbia
Corporate
Income Fund,
Class I
Shares | | | 37,650,987 | | | | 3,314,390 | | | | (10,736,785 | ) | | | 309,314 | | | | 30,537,906 | | | | 642,411 | | | | 1,173,101 | | | | 32,176,252 | | |
Columbia
Diversified
Equity Income
Fund, Class I
Shares | | | 14,081,372 | | | | 413,323 | | | | (4,786,549 | ) | | | 1,164,497 | | | | 10,872,643 | | | | — | | | | 376,754 | | | | 15,960,801 | | |
The accompanying Notes to Financial Statements are an integral part of this statement.
Annual Report 2013
52
Columbia Capital Allocation Portfolios
Portfolio of Investments (continued)
Columbia Capital Allocation Aggressive Portfolio
January 31, 2013
Notes to Portfolio of Investments (continued)
Issuer | | Beginning
Cost ($) | | Purchase
Cost ($) | | Cost/
Proceeds
From Sales ($) | | Realized
Gain/Loss ($) | | Ending
Cost ($) | | Capital Gain
Distributions ($) | | Dividends
or Interest
Income ($) | | Value ($) | |
Columbia
Dividend
Income
Fund, Class I
Shares | | | 20,582,376 | | | | 430,773 | | | | (8,781,871 | ) | | | 392,492 | | | | 12,623,770 | | | | — | | | | 380,858 | | | | 14,360,886 | | |
Columbia
Dividend
Opportunity
Fund, Class I
Shares | | | 18,268,084 | | | | 711,876 | | | | (8,998,615 | ) | | | 1,186,436 | | | | 11,167,781 | | | | — | | | | 673,396 | | | | 15,929,297 | | |
Columbia
Emerging
Markets
Fund, Class I
Shares | | | 19,266,959 | | | | 7,708,403 | | | | (5,205,685 | ) | | | (519,657 | ) | | | 21,250,020 | | | | 1,065,036 | | | | 142,328 | | | | 24,344,398 | | |
Columbia
European
Equity Fund,
Class I
Shares | | | 45,405,388 | | | | 16,024,132 | | | | (24,674,375 | ) | | | 2,018,642 | | | | 38,773,787 | | | | 177,975 | | | | 882,311 | | | | 45,691,689 | | |
Columbia
Flexible
Capital
Income Fund,
Class I
Shares | | | 2,719,943 | | | | 190,513 | | | | (349,461 | ) | | | 27,592 | | | | 2,588,587 | | | | 12,511 | | | | 113,072 | | | | 2,979,733 | | |
Columbia
Greater
China Fund,
Class I
Shares | | | 17,043,200 | | | | 790,932 | | | | (2,342,122 | ) | | | (43,781 | ) | | | 15,448,229 | | | | — | | | | 232,162 | | | | 16,741,056 | | |
Columbia
Income
Opportunities
Fund, Class I
Shares | | | 10,380,418 | | | | 8,672,089 | | | | (2,878,480 | ) | | | 678,813 | | | | 16,852,840 | | | | — | | | | 1,030,568 | | | | 18,071,915 | | |
Columbia
Large Cap
Core Fund,
Class I
Shares | | | 17,422,069 | | | | 6,492,008 | | | | (2,916,910 | ) | | | 133,791 | | | | 21,130,958 | | | | 755,007 | | | | 286,379 | | | | 23,102,719 | | |
Columbia
Large Cap
Growth Fund,
Class I
Shares | | | 18,769,297 | | | | 155,603 | | | | (8,000,791 | ) | | | (320,371 | ) | | | 10,603,738 | | | | — | | | | 107,711 | | | | 17,298,272 | | |
Columbia
Large Core
Quantitative
Fund, Class I
Shares | | | 18,689,573 | | | | 5,793,572 | | | | (3,260,788 | ) | | | (136,196 | ) | | | 21,086,161 | | | | — | | | | 495,861 | | | | 28,428,225 | | |
The accompanying Notes to Financial Statements are an integral part of this statement.
Annual Report 2013
53
Columbia Capital Allocation Portfolios
Portfolio of Investments (continued)
Columbia Capital Allocation Aggressive Portfolio
January 31, 2013
Notes to Portfolio of Investments (continued)
Issuer | | Beginning
Cost ($) | | Purchase
Cost ($) | | Cost/
Proceeds
From Sales ($) | | Realized
Gain/Loss ($) | | Ending
Cost ($) | | Capital Gain
Distributions ($) | | Dividends
or Interest
Income ($) | | Value ($) | |
Columbia
Large Growth
Quantitative
Fund, Class I
Shares | | | 20,809,126 | | | | 1,784,942 | | | | (7,682,797 | ) | | | 203,987 | | | | 15,115,258 | | | | 1,403,100 | | | | 306,356 | | | | 16,801,383 | | |
Columbia
Mid Cap
Growth Fund,
Class I
Shares | | | 32,654,912 | | | | 6,628,100 | | | | (1,682,433 | ) | | | 690,714 | | | | 38,291,293 | | | | 1,073,617 | | | | — | | | | 40,427,968 | | |
Columbia
Mid Cap
Value Fund,
Class I
Shares | | | 11,720,294 | | | | 5,851,358 | | | | (2,121,328 | ) | | | 29,390 | | | | 15,479,714 | | | | — | | | | 189,772 | | | | 17,542,128 | | |
Columbia
Mid Cap
Value
Opportunity
Fund, Class I
Shares | | | 15,599,531 | | | | 322,043 | | | | (5,864,224 | ) | | | 2,614,719 | | | | 12,672,069 | | | | — | | | | 178,815 | | | | 20,490,435 | | |
Columbia
Multi-Advisor
Small Cap
Value Fund,
Class I
Shares | | | 5,247,216 | | | | 248,388 | | | | (4,025,299 | ) | | | 2,066,126 | | | | 3,536,431 | | | | 29,649 | | | | 13,921 | | | | 5,811,453 | | |
Columbia
Pacific/Asia
Fund, Class I
Shares | | | 27,615,603 | | | | 9,252,129 | | | | (6,957,199 | ) | | | 230,618 | | | | 30,141,151 | | | | — | | | | 827,484 | | | | 34,257,868 | | |
Columbia
Real Estate
Equity Fund,
Class I
Shares | | | 8,573,499 | | | | 725,149 | | | | (2,186,338 | ) | | | 1,201,024 | | | | 8,313,334 | | | | 156,195 | | | | 245,629 | | | | 11,203,634 | | |
Columbia
Select Large
Cap Growth
Fund, Class I
Shares | | | 25,213,398 | | | | 4,874,144 | | | | (3,053,672 | ) | | | 158,960 | | | | 27,192,830 | | | | — | | | | — | | | | 31,902,166 | | |
Columbia
Select
Large-Cap
Value Fund,
Class I
Shares | | | 9,858,164 | | | | 9,434,648 | | | | (2,703,143 | ) | | | 722,989 | | | | 17,312,658 | | | | 622,021 | | | | 320,019 | | | | 20,536,531 | | |
Columbia
Select
Smaller-Cap
Value Fund,
Class I Shares | | | 4,370,116 | | | | 219,754 | | | | (678,772 | ) | | | 249,525 | | | | 4,160,623 | | | | 106,968 | | | | — | | | | 4,376,818 | | |
The accompanying Notes to Financial Statements are an integral part of this statement.
Annual Report 2013
54
Columbia Capital Allocation Portfolios
Portfolio of Investments (continued)
Columbia Capital Allocation Aggressive Portfolio
January 31, 2013
Notes to Portfolio of Investments (continued)
Issuer | | Beginning
Cost ($) | | Purchase
Cost ($) | | Cost/
Proceeds
From Sales ($) | | Realized
Gain/Loss ($) | | Ending
Cost ($) | | Capital Gain
Distributions ($) | | Dividends
or Interest
Income ($) | | Value ($) | |
Columbia
Short-Term
Cash Fund | | | 1,508,970 | | | | 9,772,007 | | | | (6,115,864 | ) | | | — | | | | 5,165,113 | | | | — | | | | 6,019 | | | | 5,165,113 | | |
Columbia
Small Cap
Core Fund,
Class I
Shares | | | — | | | | 9,878,610 | | | | (891,052 | ) | | | (20,163 | ) | | | 8,967,395 | | | | 270,407 | | | | 73,749 | | | | 9,368,190 | | |
Columbia
Small Cap
Growth
Fund I,
Class I
Shares | | | 10,979,888 | | | | 1,158,995 | | | | (1,071,845 | ) | | | (110,220 | ) | | | 10,956,818 | | | | 925,317 | | | | — | | | | 10,149,790 | | |
Columbia
U.S.
Government
Mortgage
Fund, Class I
Shares | | | 28,581,019 | | | | 2,457,038 | | | | (4,445,122 | ) | | | 59,118 | | | | 26,652,053 | | | | 516,044 | | | | 876,249 | | | | 27,028,732 | | |
Columbia
U.S.
Treasury
Index Fund,
Class I
Shares | | | 10,273,753 | | | | 405 | | | | (10,519,463 | ) | | | 245,305 | | | | — | | | | — | | | | 3,144 | | | | — | | |
Total | | | 516,945,880 | | | | 124,666,926 | | | | (163,729,236 | ) | | | 13,075,432 | | | | 490,959,002 | | | | 7,803,418 | | | | 9,760,327 | | | | 574,076,938 | | |
(b) Non-income producing.
(c) The rate shown is the seven-day current annualized yield at January 31, 2013.
Fair Value Measurements
Generally accepted accounting principles (GAAP) require disclosure regarding the inputs and valuation techniques used to measure fair value and any changes in valuation inputs or techniques. In addition, investments shall be disclosed by major category.
The Fund categorizes its fair value measurements according to a three-level hierarchy that maximizes the use of observable inputs and minimizes the use of unobservable inputs by prioritizing that the most observable input be used when available. Observable inputs are those that market participants would use in pricing an investment based on market data obtained from sources independent of the reporting entity. Unobservable inputs are those that reflect the Fund's assumptions about the information market participants would use in pricing an investment. An investment's level within the fair value hierarchy is based on the lowest level of any input that is deemed significant to the asset or liability's fair value measurement. The input levels are not necessarily an indication of the risk or liquidity associated with investments at that level. For example, certain U.S. government securities are generally high quality and liquid, however, they are reflected as Level 2 because the inputs used to determine fair value may not always be quoted prices in an active market.
Fair value inputs are summarized in the three broad levels listed below:
> Level 1 — Valuations based on quoted prices for investments in active markets that the Fund has the ability to access at the measurement date (to include NAV for open-end mutual funds). Valuation adjustments are not applied to Level 1 investments.
> Level 2 — Valuations based on other significant observable inputs (including quoted prices for similar securities, interest rates, prepayment speeds, credit risks, etc.).
> Level 3 — Valuations based on significant unobservable inputs (including the Fund's own assumptions and judgment in determining the fair value of investments).
The accompanying Notes to Financial Statements are an integral part of this statement.
Annual Report 2013
55
Columbia Capital Allocation Portfolios
Portfolio of Investments (continued)
Columbia Capital Allocation Aggressive Portfolio
January 31, 2013
Fair Value Measurements (continued)
Inputs that are used in determining fair value of an investment may include price information, credit data, volatility statistics, and other factors. These inputs can be either observable or unobservable. The availability of observable inputs can vary between investments, and is affected by various factors such as the type of investment, and the volume and level of activity for that investment or similar investments in the marketplace. The inputs will be considered by the Investment Manager, along with any other relevant factors in the calculation of an investment's fair value. The Fund uses prices and inputs that are current as of the measurement date, which may include periods of market dislocations. During these periods, the availability of prices and inputs may be reduced for many investments. This condition could cause an investment to be reclassified between the various levels within the hierarchy.
Investments falling into the Level 3 category are primarily supported by quoted prices from brokers and dealers participating in the market for those investments. However, these may be classified as Level 3 investments due to lack of market transparency and corroboration to support these quoted prices. Additionally, valuation models may be used as the pricing source for any remaining investments classified as Level 3. These models rely on one or more significant unobservable inputs and/or significant assumptions by the Investment Manager. Inputs used in valuations may include, but are not limited to, financial statement analysis, capital account balances, discount rates and estimated cash flows, and comparable company data.
Under the direction of the Fund's Board of Trustees (the Board), the Investment Manager's Valuation Committee (the Committee) is responsible for carrying out the valuation procedures approved by the Board. The Committee consists of voting and non-voting members from various groups within the Investment Manager's organization, including operations and accounting, trading and investments, compliance, risk management and legal.
The Committee meets at least monthly to review and approve valuation matters, which may include a description of specific valuation determinations, data regarding pricing information received from approved pricing vendors and brokers and the results of Board-approved valuation control policies and procedures (the Policies). The Policies address, among other things, instances when market quotations are readily available, including recommendations of third party pricing vendors and a determination of appropriate pricing methodologies; events that require specific valuation determinations and assessment of fair value techniques; securities with a potential for stale pricing, including those that are illiquid, restricted, or in default; and the effectiveness of third-party pricing vendors, including periodic reviews of vendors. The Committee meets more frequently, as needed, to discuss additional valuation matters, which may include the need to review back-testing results, review time-sensitive information or approve related valuation actions. The Committee reports to the Board, with members of the Committee meeting with the Board at each of its regularly scheduled meetings to discuss valuation matters and actions during the period, similar to those described earlier.
For investments categorized as Level 3, the Committee monitors information similar to that described above, which may include: (i) data specific to the issuer or comparable issuers, (ii) general market or specific sector news and (iii) quoted prices and specific or similar security transactions. The Committee considers this data and any changes from prior periods in order to assess the reasonableness of observable and unobservable inputs, any assumptions or internal models used to value those securities and changes in fair value. This data is also used to corroborate, when available, information received from approved pricing vendors and brokers. Various factors impact the frequency of monitoring this information (which may occur as often as daily). However, the Committee may determine that changes to inputs, assumptions and models are not required as a result of the monitoring procedures performed.
The following table is a summary of the inputs used to value the Fund's investments at January 31, 2013:
Description | | Level 1
Quoted Prices in Active
Markets for Identical
Assets ($) | | Level 2
Other Significant
Observable Inputs ($) | | Level 3
Significant
Unobservable Inputs ($) | | Total ($) | |
Mutual Funds | |
Equity Funds | | | 472,396,096 | | | | — | | | | — | | | | 472,396,096 | | |
Fixed-Income Funds | | | 77,276,899 | | | | — | | | | — | | | | 77,276,899 | | |
Alternative Investment Funds | | | 19,238,830 | | | | — | | | | — | | | | 19,238,830 | | |
Money Market Funds | | | 5,165,113 | | | | — | | | | — | | | | 5,165,113 | | |
Total Mutual Funds | | | 574,076,938 | | | | — | | | | — | | | | 574,076,938 | | |
See the Portfolio of Investments for all investment classifications not included in the table.
There were no transfers of financial assets between Levels 1 and 2 during the period.
The accompanying Notes to Financial Statements are an integral part of this statement.
Annual Report 2013
56
Columbia Capital Allocation Portfolios
Statements of Assets and Liabilities
January 31, 2013
| | | Columbia
Capital
Allocation
Conservative
Portfolio | | Columbia
Capital
Allocation
Moderate
Conservative
Portfolio | | Columbia
Capital
Allocation
Moderate
Portfolio | |
Assets | |
Investments, at value | |
Unaffiliated issuers (identified cost $—, $6,063,136, $—) | | $ | — | | | $ | 6,664,068 | | | $ | — | | |
Affiliated issuers (identified cost $330,284,370, $111,868,075,
$1,401,470,278) | | | 348,037,710 | | | | 119,295,129 | | | | 1,560,669,125 | | |
Total investments (identified cost $330,284,370, $117,931,211,
$1,401,470,278) | | | 348,037,710 | | | | 125,959,197 | | | | 1,560,669,125 | | |
Margin deposits on futures contracts | | | 82,300 | | | | 31,900 | | | | 232,000 | | |
Receivable for: | |
Investments sold | | | — | | | | 52,362 | | | | 73,793 | | |
Capital shares sold | | | 565,452 | | | | 185,872 | | | | 2,099,614 | | |
Dividends | | | 408,400 | | | | 163,753 | | | | 1,438,997 | | |
Interest | | | — | | | | 13,348 | | | | — | | |
Variation margin on futures contracts | | | 9,719 | | | | 2,531 | | | | 27,500 | | |
Expense reimbursement due from Investment Manager | | | — | | | | 175 | | | | — | | |
Prepaid expenses | | | 1,398 | | | | 1,398 | | | | 1,379 | | |
Total assets | | | 349,104,979 | | | | 126,410,536 | | | | 1,564,542,408 | | |
Liabilities | |
Payable for: | |
Investments purchased | | | 475,493 | | | | 163,407 | | | | 1,438,368 | | |
Capital shares purchased | | | 341,511 | | | | 177,036 | | | | 1,554,652 | | |
Investment management fees | | | — | | | | 130 | | | | — | | |
Distribution and/or service fees | | | 3,711 | | | | 1,387 | | | | 15,332 | | |
Transfer agent fees | | | 20,065 | | | | 24,017 | | | | 107,833 | | |
Administration fees | | | 191 | | | | 69 | | | | 856 | | |
Plan administration fees | | | — | | | | — | | | | 2 | | |
Compensation of board members | | | 4,478 | | | | 4,614 | | | | 4,616 | | |
Other expenses | | | 85,168 | | | | 51,910 | | | | 134,467 | | |
Total liabilities | | | 930,617 | | | | 422,570 | | | | 3,256,126 | | |
Net assets applicable to outstanding capital stock | | $ | 348,174,362 | | | $ | 125,987,966 | | | $ | 1,561,286,282 | | |
The accompanying Notes to Financial Statements are an integral part of this statement.
Annual Report 2013
57
Columbia Capital Allocation Portfolios
Statements of Assets and Liabilities (continued)
January 31, 2013
| | | Columbia
Capital
Allocation
Conservative
Portfolio | | Columbia
Capital
Allocation
Moderate
Conservative
Portfolio | | Columbia
Capital
Allocation
Moderate
Portfolio | |
Represented by | |
Paid-in capital | | $ | 328,010,091 | | | $ | 117,716,595 | | | $ | 1,399,149,493 | | |
Undistributed net investment income | | | 590,704 | | | | 218,846 | | | | 5,353,167 | | |
Accumulated net realized gain (loss) | | | 2,014,025 | | | | 76,310 | | | | (1,867,974 | ) | |
Unrealized appreciation (depreciation) on: | |
Investments — unaffiliated issuers | | | — | | | | 600,932 | | | | — | | |
Investments — affiliated issuers | | | 17,753,340 | | | | 7,427,054 | | | | 159,198,847 | | |
Futures contracts | | | (193,798 | ) | | | (51,771 | ) | | | (547,251 | ) | |
Total — representing net assets applicable to outstanding capital stock | | $ | 348,174,362 | | | $ | 125,987,966 | | | $ | 1,561,286,282 | | |
Class A | |
Net assets | | $ | 282,382,232 | | | $ | 71,320,574 | | | $ | 1,331,310,666 | | |
Shares outstanding | | | 26,566,612 | | | | 6,293,718 | | | | 114,714,357 | | |
Net asset value per share | | $ | 10.63 | | | $ | 11.33 | | | $ | 11.61 | | |
Maximum offering price per share(a) | | $ | 11.16 | | | $ | 12.02 | | | $ | 12.32 | | |
Class B | |
Net assets | | $ | 19,597,783 | | | $ | 8,334,814 | | | $ | 94,225,125 | | |
Shares outstanding | | | 1,849,043 | | | | 739,222 | | | | 8,155,368 | | |
Net asset value per share | | $ | 10.60 | | | $ | 11.28 | | | $ | 11.55 | | |
Class C | |
Net assets | | $ | 45,368,326 | | | $ | 23,470,108 | | | $ | 132,769,881 | | |
Shares outstanding | | | 4,288,773 | | | | 2,094,907 | | | | 11,512,283 | | |
Net asset value per share | | $ | 10.58 | | | $ | 11.20 | | | $ | 11.53 | | |
Class K(b) | |
Net assets | | $ | 11,518 | | | $ | — | | | $ | 298,277 | | |
Shares outstanding | | | 1,093 | | | | — | | | | 25,717 | | |
Net asset value per share | | $ | 10.54 | | | $ | — | | | $ | 11.60 | | |
Class R | |
Net assets | | $ | 114,070 | | | $ | 2,147,771 | | | $ | 138,070 | | |
Shares outstanding | | | 10,735 | | | | 189,379 | | | | 11,919 | | |
Net asset value per share | | $ | 10.63 | | | $ | 11.34 | | | $ | 11.58 | | |
Class R4 | |
Net assets | | $ | — | | | $ | 2,490 | | | $ | — | | |
Shares outstanding | | | — | | | | 221 | | | | — | | |
Net asset value per share(c) | | $ | — | | | $ | 11.25 | | | $ | — | | |
Class R5 | |
Net assets | | $ | — | | | $ | 2,490 | | | $ | — | | |
Shares outstanding | | | — | | | | 221 | | | | — | | |
Net asset value per share(c) | | $ | — | | | $ | 11.25 | | | $ | — | | |
Class Z | |
Net assets | | $ | 700,433 | | | $ | 20,709,719 | | | $ | 2,544,263 | | |
Shares outstanding | | | 65,922 | | | | 1,846,950 | | | | 219,428 | | |
Net asset value per share | | $ | 10.63 | | | $ | 11.21 | | | $ | 11.59 | | |
(a) The maximum offering price per share is calculated by dividing the net asset value by 1.0 minus the maximum sales charge of 4.75% for Columbia Capital Allocation Conservative Portfolio and dividing the net asset value by 1.0 minus the maximum sales charge of 5.75% for Columbia Capital Allocation Moderate Conservative Portfolio and Columbia Capital Allocation Moderate Portfolio.
(b) Effective October 25, 2012, Class R4 shares were renamed Class K shares for Columbia Capital Allocation Conservative Portfolio and Columbia Capital Allocation Moderate Portfolio.
(c) Net asset value per share rounds to this amount due to fractional shares outstanding.
The accompanying Notes to Financial Statements are an integral part of this statement.
Annual Report 2013
58
Columbia Capital Allocation Portfolios
Statements of Assets and Liabilities (continued)
January 31, 2013
| | | Columbia
Capital
Allocation
Moderate
Aggressive
Portfolio | | Columbia
Capital
Allocation
Aggressive
Portfolio | |
Assets | |
Investments, at value | |
Unaffiliated issuers (identified cost $23,901,788, $—) | | $ | 26,769,696 | | | $ | — | | |
Affiliated issuers (identified cost $981,046,245, $490,959,002) | | | 1,043,141,843 | | | | 574,076,938 | | |
Total investments (identified cost $1,004,948,033, $490,959,002) | | | 1,069,911,539 | | | | 574,076,938 | | |
Margin deposits on futures contracts | | | 58,300 | | | | — | | |
Receivable for: | |
Investments sold | | | 489,814 | | | | 251,139 | | |
Capital shares sold | | | 234,266 | | | | 430,710 | | |
Dividends | | | 678,085 | | | | 226,947 | | |
Interest | | | 65,610 | | | | — | | |
Reclaims | | | 723 | | | | — | | |
Variation margin on futures contracts | | | 4,969 | | | | — | | |
Expense reimbursement due from Investment Manager | | | — | | | | — | | |
Prepaid expenses | | | 1,398 | | | | 1,379 | | |
Trustees' deferred compensation plan | | | 139,639 | | | | — | | |
Total assets | | | 1,071,584,343 | | | | 574,987,113 | | |
Liabilities | |
Payable for: | |
Investments purchased | | | 675,618 | | | | 226,355 | | |
Capital shares purchased | | | 888,482 | | | | 687,694 | | |
Investment management fees | | | 718 | | | | — | | |
Distribution and/or service fees | | | 9,312 | | | | 5,524 | | |
Transfer agent fees | | | 164,329 | | | | 50,104 | | |
Administration fees | | | 586 | | | | 315 | | |
Plan administration fees | | | — | | | | 3 | | |
Compensation of board members | | | 79,186 | | | | 4,612 | | |
Expense reimbursement due to Investment Manager | | | — | | | | 166 | | |
Other expenses | | | 103,313 | | | | 87,575 | | |
Trustees' deferred compensation plan | | | 139,639 | | | | — | | |
Total liabilities | | | 2,061,183 | | | | 1,062,348 | | |
Net assets applicable to outstanding capital stock | | $ | 1,069,523,160 | | | $ | 573,924,765 | | |
The accompanying Notes to Financial Statements are an integral part of this statement.
Annual Report 2013
59
Columbia Capital Allocation Portfolios
Statements of Assets and Liabilities (continued)
January 31, 2013
| | | Columbia
Capital
Allocation
Moderate
Aggressive
Portfolio | | Columbia
Capital
Allocation
Aggressive
Portfolio | |
Represented by | |
Paid-in capital | | $ | 993,602,551 | | | $ | 548,457,694 | | |
Undistributed net investment income | | | 547,716 | | | | 2,657,459 | | |
Accumulated net realized gain (loss) | | | 10,515,954 | | | | (60,308,324 | ) | |
Unrealized appreciation (depreciation) on: | | | | | | | | | |
Investments — unaffiliated issuers | | | 2,867,908 | | | | — | | |
Investments — affiliated issuers | | | 62,095,598 | | | | 83,117,936 | | |
Foreign currency translations | | | (42 | ) | | | — | | |
Futures contracts | | | (106,525 | ) | | | — | | |
Total — representing net assets applicable to outstanding capital stock | | $ | 1,069,523,160 | | | $ | 573,924,765 | | |
Class A | |
Net assets | | $ | 679,108,505 | | | $ | 495,721,911 | | |
Shares outstanding | | | 56,383,093 | | | | 43,464,182 | | |
Net asset value per share | | $ | 12.04 | | | $ | 11.41 | | |
Maximum offering price per share(a) | | $ | 12.77 | | | $ | 12.11 | | |
Class B | |
Net assets | | $ | 53,008,802 | | | $ | 39,020,467 | | |
Shares outstanding | | | 4,437,932 | | | | 3,420,837 | | |
Net asset value per share | | $ | 11.94 | | | $ | 11.41 | | |
Class C | |
Net assets | | $ | 84,348,970 | | | $ | 38,461,155 | | |
Shares outstanding | | | 6,967,418 | | | | 3,422,907 | | |
Net asset value per share | | $ | 12.11 | | | $ | 11.24 | | |
Class K(b) | |
Net assets | | $ | — | | | $ | 126,358 | | |
Shares outstanding | | | — | | | | 11,058 | | |
Net asset value per share | | $ | — | | | $ | 11.43 | | |
Class R | |
Net assets | | $ | 4,664,338 | | | $ | 182,220 | | |
Shares outstanding | | | 387,722 | | | | 16,055 | | |
Net asset value per share | | $ | 12.03 | | | $ | 11.35 | | |
Class R4 | |
Net assets | | $ | 2,586 | | | $ | — | | |
Shares outstanding | | | 213 | | | | — | | |
Net asset value per share(c) | | $ | 12.11 | | | $ | — | | |
Class R5 | |
Net assets | | $ | 2,586 | | | $ | — | | |
Shares outstanding | | | 213 | | | | — | | |
Net asset value per share(c) | | $ | 12.11 | | | $ | — | | |
Class T | |
Net assets | | $ | 100,954,846 | | | $ | — | | |
Shares outstanding | | | 8,384,540 | | | | — | | |
Net asset value per share | | $ | 12.04 | | | $ | — | | |
Maximum offering price per share(a) | | $ | 12.77 | | | $ | — | | |
Class Z | |
Net assets | | $ | 147,432,527 | | | $ | 412,654 | | |
Shares outstanding | | | 12,257,017 | | | | 36,311 | | |
Net asset value per share | | $ | 12.03 | | | $ | 11.36 | | |
(a) The maximum offering price per share is calculated by dividing the net asset value by 1.0 minus the maximum sales charge of 5.75%.
(b) Effective October 25, 2012, Class R4 shares were renamed Class K shares for Columbia Capital Allocation Aggressive Portfolio.
(c) Net asset value per share rounds to this amount due to fractional shares outstanding.
The accompanying Notes to Financial Statements are an integral part of this statement.
Annual Report 2013
60
Columbia Capital Allocation Portfolios
Statements of Operations
Year Ended January 31, 2013
| | | Columbia
Capital
Allocation
Conservative
Portfolio | | Columbia
Capital
Allocation
Moderate
Conservative
Portfolio | | Columbia
Capital
Allocation
Moderate
Portfolio | |
Net investment income | |
Income: | | | | | | | | | | | | | |
Dividends — unaffiliated issuers | | $ | — | | | $ | 2,127 | | | $ | — | | |
Dividends — affiliated issuers | | | 9,025,473 | | | | 3,455,837 | | | | 36,387,106 | | |
Interest | | | — | | | | 100,347 | | | | — | | |
Total income | | | 9,025,473 | | | | 3,558,311 | | | | 36,387,106 | | |
Expenses: | | | | | | | | | | | | | |
Investment management fees | | | — | | | | 72,183 | | | | — | | |
Distribution and/or service fees | | | | | | | | | | | | | |
Class A | | | 662,668 | | | | 175,652 | | | | 3,174,852 | | |
Class B | | | 217,784 | | | | 109,645 | | | | 1,039,476 | | |
Class C | | | 405,824 | | | | 241,420 | | | | 1,191,298 | | |
Class R | | | 194 | | | | 9,231 | | | | 830 | | |
Transfer agent fees | | | | | | | | | | | | | |
Class A | | | 361,813 | | | | 128,642 | | | | 2,019,733 | | |
Class B | | | 29,382 | | | | 20,054 | | | | 162,446 | | |
Class C | | | 55,492 | | | | 44,187 | | | | 190,050 | | |
Class K(a) | | | 32 | | | | — | | | | 195 | | |
Class R | | | 55 | | | | 3,384 | | | | 262 | | |
Class R4(b) | | | — | | | | 1 | | | | — | | |
Class Z | | | 592 | | | | 40,344 | | | | 2,339 | | |
Administration fees | | | 65,589 | | | | 25,851 | | | | 298,998 | | |
Plan administration fees | | | | | | | | | | | | | |
Class K(a) | | | 161 | | | | — | | | | 975 | | |
Compensation of board members | | | 9,177 | | | | 9,276 | | | | 10,212 | | |
Custodian fees | | | 9,785 | | | | 15,811 | | | | 7,182 | | |
Printing and postage fees | | | 64,216 | | | | 69,977 | | | | 188,080 | | |
Registration fees | | | 118,457 | | | | 119,141 | | | | 173,922 | | |
Professional fees | | | 21,420 | | | | 19,157 | | | | 17,138 | | |
Other | | | 10,123 | | | | 12,612 | | | | 17,775 | | |
Total expenses | | | 2,032,764 | | | | 1,116,568 | | | | 8,495,763 | | |
Fees waived or expenses reimbursed by Investment Manager and its affiliates | | | — | | | | (172,293 | ) | | | — | | |
Expense reductions | | | (40 | ) | | | (280 | ) | | | (60 | ) | |
Total net expenses | | | 2,032,724 | | | | 943,995 | | | | 8,495,703 | | |
Net investment income | | | 6,992,749 | | | | 2,614,316 | | | | 27,891,403 | | |
Realized and unrealized gain (loss) — net | |
Net realized gain (loss) on: | | | | | | | | | | | | | |
Investments — affiliated issuers | | | 2,963,596 | | | | 3,941,070 | | | | 26,696,908 | | |
Capital gain distributions from underlying affiliated funds | | | 6,598,264 | | | | 2,078,537 | | | | 28,245,369 | | |
Foreign currency translations | | | (19,397 | ) | | | — | | | | (61,000 | ) | |
Futures contracts | | | (255,861 | ) | | | 68,026 | | | | (2,849,358 | ) | |
Net realized gain | | | 9,286,602 | | | | 6,087,633 | | | | 52,031,919 | | |
Net change in unrealized appreciation (depreciation) on: | | | | | | | | | | | | | |
Investments — unaffiliated issuers | | | — | | | | 100,441 | | | | — | | |
Investments — affiliated issuers | | | 7,328,635 | | | | 2,220,014 | | | | 72,877,333 | | |
Futures contracts | | | (193,381 | ) | | | (126,817 | ) | | | (545,418 | ) | |
Net change in unrealized appreciation (depreciation) | | | 7,135,254 | | | | 2,193,638 | | | | 72,331,915 | | |
Net realized and unrealized gain | | | 16,421,856 | | | | 8,281,271 | | | | 124,363,834 | | |
Net increase in net assets resulting from operations | | $ | 23,414,605 | | | $ | 10,895,587 | | | $ | 152,255,237 | | |
(a) Effective October 25, 2012, Class R4 shares were renamed Class K shares for Columbia Capital Allocation Conservative Portfolio and Columbia Capital Allocation Moderate Portfolio.
(b) For the period from November 8, 2012 (commencement of operations) to January 31, 2013 for Columbia Capital Allocation Moderate Conservative Portfolio.
The accompanying Notes to Financial Statements are an integral part of this statement.
Annual Report 2013
61
Columbia Capital Allocation Portfolios
Statements of Operations (continued)
Year Ended January 31, 2013
| | | Columbia
Capital
Allocation
Moderate
Aggressive
Portfolio | | Columbia
Capital
Allocation
Aggressive
Portfolio | |
Net investment income | |
Income: | | | | | | | | | |
Dividends — unaffiliated issuers | | $ | 7,399 | | | $ | — | | |
Dividends — affiliated issuers | | | 21,083,851 | | | | 9,760,327 | | |
Interest | | | 512,585 | | | | — | | |
Total income | | | 21,603,835 | | | | 9,760,327 | | |
Expenses: | | | | | | | | | |
Investment management fees | | | 363,620 | | | | — | | |
Distribution and/or service fees | | | | | | | | | |
Class A | | | 1,670,123 | | | | 1,190,622 | | |
Class B | | | 671,164 | | | | 429,176 | | |
Class C | | | 846,518 | | | | 353,645 | | |
Class R | | | 21,558 | | | | 309 | | |
Class T | | | 304,498 | | | | — | | |
Transfer agent fees | | | | | | | | | |
Class A | | | 1,153,206 | | | | 936,123 | | |
Class B | | | 114,956 | | | | 83,201 | | |
Class C | | | 146,034 | | | | 69,667 | | |
Class K(a) | | | — | | | | 213 | | |
Class R | | | 7,452 | | | | 128 | | |
Class R4(b) | | | 1 | | | | — | | |
Class T | | | 175,105 | | | | — | | |
Class Z | | | 249,095 | | | | 474 | | |
Administration fees | | | 213,998 | | | | 111,051 | | |
Plan administration fees | | | | | | | | | |
Class K(a) | | | — | | | | 1,064 | | |
Compensation of board members | | | 18,302 | | | | 11,091 | | |
Custodian fees | | | 26,898 | | | | 6,126 | | |
Printing and postage fees | | | 229,337 | | | | 98,946 | | |
Registration fees | | | 198,146 | | | | 131,829 | | |
Professional fees | | | 33,817 | | | | 19,508 | | |
Other | | | 15,050 | | | | 16,541 | | |
Total expenses | | | 6,458,878 | | | | 3,459,714 | | |
Fees waived or expenses reimbursed by Investment Manager and its affiliates | | | — | | | | (42,247 | ) | |
Expense reductions | | | (26,139 | ) | | | (360 | ) | |
Total net expenses | | | 6,432,739 | | | | 3,417,107 | | |
Net investment income | | | 15,171,096 | | | | 6,343,220 | | |
Realized and unrealized gain (loss) — net | | | | | | | | | |
Net realized gain (loss) on: | | | | | | | | | |
Investments — unaffiliated issuers | | | 380,096 | | | | — | | |
Investments — affiliated issuers | | | 24,364,540 | | | | 13,075,432 | | |
Capital gain distributions from underlying affiliated funds | | | 16,817,317 | | | | 7,803,418 | | |
Foreign currency translations | | | 4,020 | | | | 53 | | |
Futures contracts | | | 1,009,311 | | | | (1,105,514 | ) | |
Net realized gain | | | 42,575,284 | | | | 19,773,389 | | |
Net change in unrealized appreciation (depreciation) on: | | | | | | | | | |
Investments — unaffiliated issuers | | | 482,915 | | | | — | | |
Investments — affiliated issuers | | | 56,981,818 | | | | 44,510,376 | | |
Foreign currency translations | | | (1,595 | ) | | | — | | |
Futures contracts | | | (1,777,755 | ) | | | (5,338 | ) | |
Net change in unrealized appreciation (depreciation) | | | 55,685,383 | | | | 44,505,038 | | |
Net realized and unrealized gain | | | 98,260,667 | | | | 64,278,427 | | |
Net increase in net assets resulting from operations | | $ | 113,431,763 | | | $ | 70,621,647 | | |
(a) Effective October 25, 2012, Class R4 shares were renamed Class K shares for Columbia Capital Allocation Aggressive Portfolio.
(b) For the period from November 8, 2012 (commencement of operations) to January 31, 2013 for Columbia Capital Allocation Moderate Aggressive Portfolio.
The accompanying Notes to Financial Statements are an integral part of this statement.
Annual Report 2013
62
Columbia Capital Allocation Portfolios
Statements of Changes in Net Assets
| | | Columbia Capital Allocation
Conservative Portfolio | |
| | | Year Ended
January 31,
2013 | | Year Ended
January 31,
2012 | |
Operations | |
Net investment income | | $ | 6,992,749 | | | $ | 6,334,918 | | |
Net realized gain | | | 9,286,602 | | | | 19,796,978 | | |
Net change in unrealized appreciation (depreciation) | | | 7,135,254 | | | | (14,914,019 | ) | |
Net increase in net assets resulting from operations | | | 23,414,605 | | | | 11,217,877 | | |
Distributions to shareholders | |
Net investment income | | | | | |
Class A | | | (8,858,422 | ) | | | (5,549,323 | ) | |
Class B | | | (512,560 | ) | | | (416,073 | ) | |
Class C | | | (1,083,261 | ) | | | (551,460 | ) | |
Class K(a) | | | (2,065 | ) | | | (1,899 | ) | |
Class R | | | (1,567 | ) | | | (55 | ) | |
Class Z | | | (18,883 | ) | | | (1,699 | ) | |
Net realized gains | |
Class A | | | (3,076,707 | ) | | | (6,183,636 | ) | |
Class B | | | (216,489 | ) | | | (621,902 | ) | |
Class C | | | (489,418 | ) | | | (890,011 | ) | |
Class K(a) | | | (647 | ) | | | (1,994 | ) | |
Class R | | | (757 | ) | | | (64 | ) | |
Class Z | | | (5,981 | ) | | | (1,868 | ) | |
Total distributions to shareholders | | | (14,266,757 | ) | | | (14,219,984 | ) | |
Increase (decrease) in net assets from capital stock activity | | | 26,360,589 | | | | 41,606,341 | | |
Total increase in net assets | | | 35,508,437 | | | | 38,604,234 | | |
Net assets at beginning of year | | | 312,665,925 | | | | 274,061,691 | | |
Net assets at end of year | | $ | 348,174,362 | | | $ | 312,665,925 | | |
Undistributed net investment income | | $ | 590,704 | | | $ | 517,613 | | |
(a) Effective October 25, 2012, Class R4 shares were renamed Class K shares.
The accompanying Notes to Financial Statements are an integral part of this statement.
Annual Report 2013
63
Columbia Capital Allocation Portfolios
Statements of Changes in Net Assets (continued)
| | | Columbia Capital Allocation Moderate
Conservative Portfolio | |
| | | Year Ended
January 31,
2013(a) | | Year Ended
January 31,
2012(b) | | Year Ended
March 31,
2011 | |
Operations | |
Net investment income | | $ | 2,614,316 | | | $ | 2,353,562 | | | $ | 3,097,506 | | |
Net realized gain | | | 6,087,633 | | | | 6,982,936 | | | | 10,411,760 | | |
Net change in unrealized appreciation (depreciation) | | | 2,193,638 | | | | (6,304,987 | ) | | | 518,350 | | |
Net increase in net assets resulting from operations | | | 10,895,587 | | | | 3,031,511 | | | | 14,027,616 | | |
Distributions to shareholders | |
Net investment income | |
Class A | | | (2,019,638 | ) | | | (1,287,509 | ) | | | (1,484,710 | ) | |
Class B | | | (208,910 | ) | | | (245,328 | ) | | | (565,960 | ) | |
Class C | | | (511,820 | ) | | | (323,481 | ) | | | (411,751 | ) | |
Class R | | | (51,816 | ) | | | (13,383 | ) | | | (12,309 | ) | |
Class R4 | | | (36 | ) | | | — | | | | — | | |
Class R5 | | | (37 | ) | | | — | | | | — | | |
Class Z | | | (695,159 | ) | | | (440,198 | ) | | | (582,134 | ) | |
Net realized gains | |
Class A | | | (1,644,654 | ) | | | — | | | | — | | |
Class B | | | (208,483 | ) | | | — | | | | — | | |
Class C | | | (554,310 | ) | | | — | | | | — | | |
Class R | | | (47,757 | ) | | | — | | | | — | | |
Class R4 | | | (51 | ) | | | — | | | | — | | |
Class R5 | | | (51 | ) | | | — | | | | — | | |
Class Z | | | (518,082 | ) | | | — | | | | — | | |
Total distributions to shareholders | | | (6,460,804 | ) | | | (2,309,899 | ) | | | (3,056,864 | ) | |
Increase (decrease) in net assets from capital stock activity | | | (7,902,019 | ) | | | (7,172,876 | ) | | | (20,706,161 | ) | |
Total decrease in net assets | | | (3,467,236 | ) | | | (6,451,264 | ) | | | (9,735,409 | ) | |
Net assets at beginning of year | | | 129,455,202 | | | | 135,906,466 | | | | 145,641,875 | | |
Net assets at end of year | | $ | 125,987,966 | | | $ | 129,455,202 | | | $ | 135,906,466 | | |
Undistributed net investment income | | $ | 218,846 | | | $ | 240,169 | | | $ | 134,174 | | |
(a) Class R4 and R5 shares are for the period from November 8, 2012 (commencement of operations) to January 31, 2013.
(b) For the period from April 1, 2011 to January 31, 2012. During the period, the Fund's fiscal year end was changed from March 31 to January 31.
The accompanying Notes to Financial Statements are an integral part of this statement.
Annual Report 2013
64
Columbia Capital Allocation Portfolios
Statements of Changes in Net Assets (continued)
| | | Columbia Capital Allocation
Moderate Portfolio | |
| | | Year Ended
January 31,
2013 | | Year Ended
January 31,
2012 | |
Operations | |
Net investment income | | $ | 27,891,403 | | | $ | 28,212,098 | | |
Net realized gain | | | 52,031,919 | | | | 59,725,049 | | |
Net change in unrealized appreciation (depreciation) | | | 72,331,915 | | | | (50,051,615 | ) | |
Net increase in net assets resulting from operations | | | 152,255,237 | | | | 37,885,532 | | |
Distributions to shareholders | |
Net investment income | |
Class A | | | (33,484,327 | ) | | | (28,279,024 | ) | |
Class B | | | (1,898,902 | ) | | | (2,100,858 | ) | |
Class C | | | (2,336,981 | ) | | | (1,672,751 | ) | |
Class K(a) | | | (9,733 | ) | | | (18,729 | ) | |
Class R | | | (3,952 | ) | | | (547 | ) | |
Class Z | | | (48,911 | ) | | | (11,006 | ) | |
Total distributions to shareholders | | | (37,782,806 | ) | | | (32,082,915 | ) | |
Increase (decrease) in net assets from capital stock activity | | | 4,645,590 | | | | 27,527,143 | | |
Total increase in net assets | | | 119,118,021 | | | | 33,329,760 | | |
Net assets at beginning of year | | | 1,442,168,261 | | | | 1,408,838,501 | | |
Net assets at end of year | | $ | 1,561,286,282 | | | $ | 1,442,168,261 | | |
Undistributed net investment income | | $ | 5,353,167 | | | $ | 5,371,818 | | |
(a) Effective October 25, 2012, Class R4 shares were renamed Class K shares.
The accompanying Notes to Financial Statements are an integral part of this statement.
Annual Report 2013
65
Columbia Capital Allocation Portfolios
Statements of Changes in Net Assets (continued)
| | | Columbia Capital Allocation Moderate
Aggressive Portfolio | |
| | | Year Ended
January 31,
2013(a) | | Year Ended
January 31,
2012(b) | | Year Ended
March 31,
2011(c) | |
Operations | |
Net investment income | | $ | 15,171,096 | | | $ | 13,402,329 | | | $ | 8,088,913 | | |
Net realized gain | | | 42,575,284 | | | | 65,594,144 | | | | 34,013,224 | | |
Net change in unrealized appreciation (depreciation) | | | 55,685,383 | | | | (116,910,856 | ) | | | 35,185,237 | | |
Net increase (decrease) in net assets resulting from operations | | | 113,431,763 | | | | (37,914,383 | ) | | | 77,287,374 | | |
Distributions to shareholders | |
Net investment income | |
Class A | | | (12,092,814 | ) | | | (8,763,127 | ) | | | (4,512,130 | ) | |
Class B | | | (612,563 | ) | | | (713,220 | ) | | | (1,529,833 | ) | |
Class C | | | (888,392 | ) | | | (652,539 | ) | | | (857,409 | ) | |
Class R | | | (67,920 | ) | | | (35,925 | ) | | | (31,530 | ) | |
Class R4 | | | (30 | ) | | | — | | | | — | | |
Class R5 | | | (31 | ) | | | — | | | | — | | |
Class T | | | (1,780,427 | ) | | | (1,332,779 | ) | | | (6 | ) | |
Class Z | | | (2,926,629 | ) | | | (2,351,181 | ) | | | (1,130,790 | ) | |
Net realized gains | |
Class A | | | (16,397,431 | ) | | | (1,000,010 | ) | | | — | | |
Class B | | | (1,442,652 | ) | | | (134,466 | ) | | | — | | |
Class C | | | (2,047,116 | ) | | | (130,698 | ) | | | — | | |
Class R | | | (106,359 | ) | | | (5,155 | ) | | | — | | |
Class R4 | | | (47 | ) | | | — | | | | — | | |
Class R5 | | | (47 | ) | | | — | | | | — | | |
Class T | | | (2,478,029 | ) | | | (155,678 | ) | | | — | | |
Class Z | | | (3,474,247 | ) | | | (223,444 | ) | | | — | | |
Total distributions to shareholders | | | (44,314,734 | ) | | | (15,498,222 | ) | | | (8,061,698 | ) | |
Increase (decrease) in net assets from capital stock activity | | | (90,403,587 | ) | | | 568,809,486 | | | | (74,373,436 | ) | |
Proceeds from regulatory settlements (Note 7) | | | — | | | | 4,433 | | | | — | | |
Total increase (decrease) in net assets | | | (21,286,558 | ) | | | 515,401,314 | | | | (5,147,760 | ) | |
Net assets at beginning of year | | | 1,090,809,718 | | | | 575,408,404 | | | | 580,556,164 | | |
Net assets at end of year | | $ | 1,069,523,160 | | | $ | 1,090,809,718 | | | $ | 575,408,404 | | |
Undistributed net investment income | | $ | 547,716 | | | $ | 314,308 | | | $ | 328,801 | | |
(a) Class R4 and R5 shares are for the period from November 8, 2012 (commencement of operations) to January 31, 2013.
(b) For the period from April 1, 2011 to January 31, 2012. During the period, the Fund's fiscal year end was changed from March 31 to January 31.
(c) Class T shares are for the period from March 7, 2011 (commencement of operations) to March 31, 2011.
The accompanying Notes to Financial Statements are an integral part of this statement.
Annual Report 2013
66
Columbia Capital Allocation Portfolios
Statements of Changes in Net Assets (continued)
| | | Columbia Capital Allocation
Aggressive Portfolio | |
| | | Year Ended
January 31,
2013 | | Year Ended
January 31,
2012 | |
Operations | |
Net investment income | | $ | 6,343,220 | | | $ | 6,036,946 | | |
Net realized gain (loss) | | | 19,773,389 | | | | (2,722,468 | ) | |
Net change in unrealized appreciation (depreciation) | | | 44,505,038 | | | | (1,878,258 | ) | |
Net increase in net assets resulting from operations | | | 70,621,647 | | | | 1,436,220 | | |
Distributions to shareholders | |
Net investment income | |
Class A | | | (6,990,036 | ) | | | (6,633,718 | ) | |
Class B | | | (203,687 | ) | | | (219,908 | ) | |
Class C | | | (291,987 | ) | | | (238,061 | ) | |
Class K(a) | | | (6,465 | ) | | | (6,830 | ) | |
Class R | | | (980 | ) | | | (31 | ) | |
Class Z | | | (6,998 | ) | | | (1,860 | ) | |
Total distributions to shareholders | | | (7,500,153 | ) | | | (7,100,408 | ) | |
Increase (decrease) in net assets from capital stock activity | | | (44,943,075 | ) | | | (26,391,393 | ) | |
Total increase (decrease) in net assets | | | 18,178,419 | | | | (32,055,581 | ) | |
Net assets at beginning of year | | | 555,746,346 | | | | 587,801,927 | | |
Net assets at end of year | | $ | 573,924,765 | | | $ | 555,746,346 | | |
Undistributed net investment income | | $ | 2,657,459 | | | $ | 2,821,505 | | |
(a) Effective October 25, 2012, Class R4 shares were renamed Class K shares.
The accompanying Notes to Financial Statements are an integral part of this statement.
Annual Report 2013
67
Columbia Capital Allocation Portfolios
Statements of Changes in Net Assets (continued)
| | | Columbia Capital Allocation Conservative Portfolio | |
| | | Year Ended January 31,
2013 | | Year Ended January 31,
2012 | |
| | | Shares | | Dollars ($) | | Shares | | Dollars ($) | |
Capital stock activity | |
Class A shares | |
Subscriptions(a) | | | 6,781,719 | | | | 72,018,617 | | | | 7,913,022 | | | | 82,910,451 | | |
Distributions reinvested | | | 1,110,833 | | | | 11,708,940 | | | | 1,101,338 | | | | 11,183,272 | | |
Redemptions | | | (5,654,986 | ) | | | (59,897,077 | ) | | | (5,492,438 | ) | | | (57,565,180 | ) | |
Net increase | | | 2,237,566 | | | | 23,830,480 | | | | 3,521,922 | | | | 36,528,543 | | |
Class B shares | |
Subscriptions | | | 296,084 | | | | 3,129,259 | | | | 509,124 | | | | 5,307,025 | | |
Distributions reinvested | | | 68,064 | | | | 715,538 | | | | 96,881 | | | | 980,182 | | |
Redemptions(a) | | | (916,733 | ) | | | (9,644,126 | ) | | | (1,146,328 | ) | | | (12,062,778 | ) | |
Net decrease | | | (552,585 | ) | | | (5,799,329 | ) | | | (540,323 | ) | | | (5,775,571 | ) | |
Class C shares | |
Subscriptions | | | 1,263,252 | | | | 13,333,831 | | | | 1,481,126 | | | | 15,430,759 | | |
Distributions reinvested | | | 147,801 | | | | 1,551,695 | | | | 127,694 | | | | 1,288,663 | | |
Redemptions | | | (687,099 | ) | | | (7,233,547 | ) | | | (565,975 | ) | | | (5,897,139 | ) | |
Net increase | | | 723,954 | | | | 7,651,979 | | | | 1,042,845 | | | | 10,822,283 | | |
Class K shares(b) | |
Subscriptions | | | 28 | | | | 294 | | | | 12 | | | | 117 | | |
Distributions reinvested | | | 214 | | | | 2,232 | | | | 335 | | | | 3,380 | | |
Redemptions | | | (6,867 | ) | | | (72,046 | ) | | | (467 | ) | | | (4,903 | ) | |
Net decrease | | | (6,625 | ) | | | (69,520 | ) | | | (120 | ) | | | (1,406 | ) | |
Class R shares | |
Subscriptions | | | 10,284 | | | | 108,921 | | | | — | | | | — | | |
Distributions reinvested | | | 210 | | | | 2,215 | | | | — | | | | — | | |
Redemptions | | | (3 | ) | | | (28 | ) | | | — | | | | — | | |
Net increase | | | 10,491 | | | | 111,108 | | | | — | | | | — | | |
Class Z shares | |
Subscriptions | | | 126,954 | | | | 1,336,128 | | | | 10,518 | | | | 109,313 | | |
Distributions reinvested | | | 2,350 | | | | 24,744 | | | | 339 | | | | 3,435 | | |
Redemptions | | | (68,393 | ) | | | (725,001 | ) | | | (7,730 | ) | | | (80,256 | ) | |
Net increase | | | 60,911 | | | | 635,871 | | | | 3,127 | | | | 32,492 | | |
Total net increase | | | 2,473,712 | | | | 26,360,589 | | | | 4,027,451 | | | | 41,606,341 | | |
(a) Includes conversions of Class B shares to Class A shares, if any. The line items from the prior year have been combined to conform to the current year presentation.
(b) Effective October 25, 2012, Class R4 shares were renamed Class K shares.
The accompanying Notes to Financial Statements are an integral part of this statement.
Annual Report 2013
68
Columbia Capital Allocation Portfolios
Statements of Changes in Net Assets (continued)
| | | Columbia Capital Allocation Moderate Conservative Portfolio | |
| | | Year Ended January 31,
2013(a) | | Year Ended January 31,
2012(b) | | Year Ended March 31,
2011 | |
| | | Shares | | Dollars ($) | | Shares | | Dollars ($) | | Shares | | Dollars ($) | |
Capital stock activity | |
Class A shares | |
Subscriptions(c) | | | 1,263,090 | | | | 14,202,737 | | | | 1,554,698 | | | | 16,759,129 | | | | 1,770,333 | | | | 18,308,738 | | |
Distributions reinvested | | | 137,040 | | | | 1,532,528 | | | | 42,979 | | | | 455,165 | | | | 70,168 | | | | 713,359 | | |
Redemptions | | | (1,353,714 | ) | | | (15,254,025 | ) | | | (1,210,036 | ) | | | (13,006,625 | ) | | | (2,041,585 | ) | | | (20,875,315 | ) | |
Net increase (decrease) | | | 46,416 | | | | 481,240 | | | | 387,641 | | | | 4,207,669 | | | | (201,084 | ) | | | (1,853,218 | ) | |
Class B shares | |
Subscriptions | | | 53,589 | | | | 597,049 | | | | 89,180 | | | | 950,952 | | | | 102,115 | | | | 1,035,407 | | |
Distributions reinvested | | | 10,630 | | | | 118,401 | | | | 4,555 | | | | 48,153 | | | | 25,558 | | | | 254,142 | | |
Redemptions(c) | | | (662,372 | ) | | | (7,410,612 | ) | | | (1,169,734 | ) | | | (12,578,086 | ) | | | (1,763,643 | ) | | | (18,113,872 | ) | |
Net decrease | | | (598,153 | ) | | | (6,695,162 | ) | | | (1,075,999 | ) | | | (11,578,981 | ) | | | (1,635,970 | ) | | | (16,824,323 | ) | |
Class C shares | |
Subscriptions | | | 298,681 | | | | 3,326,163 | | | | 448,336 | | | | 4,773,031 | | | | 344,262 | | | | 3,500,601 | | |
Distributions reinvested | | | 53,807 | | | | 595,527 | | | | 13,879 | | | | 145,532 | | | | 21,010 | | | | 211,334 | | |
Redemptions | | | (486,194 | ) | | | (5,429,932 | ) | | | (427,640 | ) | | | (4,557,514 | ) | | | (517,115 | ) | | | (5,270,481 | ) | |
Net increase (decrease) | | | (133,706 | ) | | | (1,508,242 | ) | | | 34,575 | | | | 361,049 | | | | (151,843 | ) | | | (1,558,546 | ) | |
Class R shares | |
Subscriptions | | | 124,813 | | | | 1,404,746 | | | | 71,112 | | | | 765,094 | | | | 24,212 | | | | 251,076 | | |
Distributions reinvested | | | 7,535 | | | | 84,402 | | | | 1,242 | | | | 13,182 | | | | 1,199 | | | | 12,309 | | |
Redemptions | | | (43,497 | ) | | | (494,573 | ) | | | (11,128 | ) | | | (121,119 | ) | | | (41,743 | ) | | | (439,144 | ) | |
Net increase (decrease) | | | 88,851 | | | | 994,575 | | | | 61,226 | | | | 657,157 | | | | (16,332 | ) | | | (175,759 | ) | |
Class R4 shares | |
Subscriptions | | | 221 | | | | 2,500 | | | | — | | | | — | | | | — | | | | — | | |
Net increase | | | 221 | | | | 2,500 | | | | — | | | | — | | | | — | | | | — | | |
Class R5 shares | |
Subscriptions | | | 221 | | | | 2,500 | | | | — | | | | — | | | | — | | | | — | | |
Net increase | | | 221 | | | | 2,500 | | | | — | | | | — | | | | — | | | | — | | |
Class Z shares | |
Subscriptions | | | 366,700 | | | | 4,078,776 | | | | 312,750 | | | | 3,346,709 | | | | 632,691 | | | | 6,396,894 | | |
Distributions reinvested | | | 50,534 | | | | 559,185 | | | | 17,365 | | | | 182,189 | | | | 24,952 | | | | 254,906 | | |
Redemptions | | | (520,598 | ) | | | (5,817,391 | ) | | | (405,484 | ) | | | (4,348,668 | ) | | | (684,476 | ) | | | (6,946,115 | ) | |
Net decrease | | | (103,364 | ) | | | (1,179,430 | ) | | | (75,369 | ) | | | (819,770 | ) | | | (26,833 | ) | | | (294,315 | ) | |
Total net decrease | | | (699,514 | ) | | | (7,902,019 | ) | | | (667,926 | ) | | | (7,172,876 | ) | | | (2,032,062 | ) | | | (20,706,161 | ) | |
(a) Class R4 and R5 are for the period from November 8, 2012 (commencement of operations) to January 31, 2013.
(b) For the period from April 1, 2011 to January 31, 2012. During the period, the Fund's fiscal year end was changed from March 31 to January 31.
(c) Includes conversions of Class B shares to Class A shares, if any.
The accompanying Notes to Financial Statements are an integral part of this statement.
Annual Report 2013
69
Columbia Capital Allocation Portfolios
Statements of Changes in Net Assets (continued)
| | | Columbia Capital Allocation Moderate Portfolio | |
| | | Year Ended January 31,
2013 | | Year Ended January 31,
2012 | |
| | | Shares | | Dollars ($) | | Shares | | Dollars ($) | |
Capital stock activity | |
Class A shares | |
Subscriptions(a) | | | 20,436,757 | | | | 226,643,024 | | | | 24,050,965 | | | | 257,275,879 | | |
Distributions reinvested | | | 2,955,792 | | | | 33,017,329 | | | | 2,597,985 | | | | 27,200,795 | | |
Redemptions | | | (21,722,889 | ) | | | (241,624,219 | ) | | | (22,340,003 | ) | | | (238,031,148 | ) | |
Net increase | | | 1,669,660 | | | | 18,036,134 | | | | 4,308,947 | | | | 46,445,526 | | |
Class B shares | |
Subscriptions | | | 714,059 | | | | 7,890,332 | | | | 1,389,537 | | | | 14,775,221 | | |
Distributions reinvested | | | 169,808 | | | | 1,890,351 | | | | 192,392 | | | | 2,012,722 | | |
Redemptions(a) | | | (3,680,334 | ) | | | (40,155,576 | ) | | | (5,014,892 | ) | | | (54,009,930 | ) | |
Net decrease | | | (2,796,467 | ) | | | (30,374,893 | ) | | | (3,432,963 | ) | | | (37,221,987 | ) | |
Class C shares | |
Subscriptions | | | 3,196,378 | | | | 35,365,027 | | | | 3,330,891 | | | | 35,311,883 | | |
Distributions reinvested | | | 208,454 | | | | 2,321,367 | | | | 146,166 | | | | 1,521,429 | | |
Redemptions | | | (1,979,826 | ) | | | (21,878,134 | ) | | | (1,838,943 | ) | | | (19,404,704 | ) | |
Net increase | | | 1,425,006 | | | | 15,808,260 | | | | 1,638,114 | | | | 17,428,608 | | |
Class K shares(b) | |
Subscriptions | | | 9,909 | | | | 112,636 | | | | 13,432 | | | | 145,283 | | |
Distributions reinvested | | | 849 | | | | 9,431 | | | | 1,764 | | | | 18,464 | | |
Redemptions | | | (54,681 | ) | | | (601,177 | ) | | | (16,538 | ) | | | (174,403 | ) | |
Net decrease | | | (43,923 | ) | | | (479,110 | ) | | | (1,342 | ) | | | (10,656 | ) | |
Class R shares | |
Subscriptions | | | 18,048 | | | | 199,494 | | | | 5,287 | | | | 53,421 | | |
Distributions reinvested | | | 350 | | | | 3,885 | | | | 47 | | | | 488 | | |
Redemptions | | | (12,052 | ) | | | (133,325 | ) | | | (9 | ) | | | (94 | ) | |
Net increase | | | 6,346 | | | | 70,054 | | | | 5,325 | | | | 53,815 | | |
Class Z shares | |
Subscriptions | | | 211,738 | | | | 2,369,031 | | | | 80,993 | | | | 871,373 | | |
Distributions reinvested | | | 4,185 | | | | 46,841 | | | | 1,038 | | | | 10,790 | | |
Redemptions | | | (74,333 | ) | | | (830,727 | ) | | | (4,874 | ) | | | (50,326 | ) | |
Net increase | | | 141,590 | | | | 1,585,145 | | | | 77,157 | | | | 831,837 | | |
Total net increase | | | 402,212 | | | | 4,645,590 | | | | 2,595,238 | | | | 27,527,143 | | |
(a) Includes conversions of Class B shares to Class A shares, if any. The line items from the prior year have been combined to conform to the current year presentation.
(b) Effective October 25, 2012, Class R4 shares were renamed Class K shares.
The accompanying Notes to Financial Statements are an integral part of this statement.
Annual Report 2013
70
Columbia Capital Allocation Portfolios
Statements of Changes in Net Assets (continued)
| | | Columbia Capital Allocation Moderate Aggressive Portfolio | |
| | | Year Ended January 31,
2013(a) | | Year Ended January 31,
2012(b) | | Year Ended March 31,
2011(c) | |
| | | Shares | | Dollars ($) | | Shares | | Dollars ($) | | Shares | | Dollars ($) | |
Capital stock activity | |
Class A shares | |
Subscriptions(d) | | | 5,118,664 | | | | 59,713,687 | | | | 5,912,598 | | | | 66,186,698 | | | | 6,541,121 | | | | 69,860,832 | | |
Fund merger | | | — | | | | — | | | | 35,995,473 | | | | 429,174,661 | | | | — | | | | — | | |
Distributions reinvested | | | 1,503,792 | | | | 17,424,301 | | | | 535,765 | | | | 5,802,182 | | | | 215,592 | | | | 2,209,949 | | |
Redemptions | | | (9,165,395 | ) | | | (106,841,676 | ) | | | (8,647,077 | ) | | | (96,275,570 | ) | | | (5,615,106 | ) | | | (59,795,287 | ) | |
Net increase (decrease) | | | (2,542,939 | ) | | | (29,703,688 | ) | | | 33,796,759 | | | | 404,887,971 | | | | 1,141,607 | | | | 12,275,494 | | |
Class B shares | |
Subscriptions | | | 155,609 | | | | 1,787,919 | | | | 129,496 | | | | 1,427,206 | | | | 213,510 | | | | 2,293,757 | | |
Fund merger | | | — | | | | — | | | | 761,031 | | | | 9,005,433 | | | | — | | | | — | | |
Distributions reinvested | | | 48,899 | | | | 561,009 | | | | 18,923 | | | | 203,617 | | | | 72,300 | | | | 715,651 | | |
Redemptions(d) | | | (3,349,084 | ) | | | (38,757,333 | ) | | | (4,929,584 | ) | | | (54,849,016 | ) | | | (6,505,211 | ) | | | (68,380,032 | ) | |
Net decrease | | | (3,144,576 | ) | | | (36,408,405 | ) | | | (4,020,134 | ) | | | (44,212,760 | ) | | | (6,219,401 | ) | | | (65,370,624 | ) | |
Class C shares | |
Subscriptions | | | 799,777 | | | | 9,368,298 | | | | 848,142 | | | | 9,606,164 | | | | 966,168 | | | | 10,322,022 | | |
Fund merger | | | — | | | | — | | | | 584,952 | | | | 7,007,012 | | | | — | | | | — | | |
Distributions reinvested | | | 127,886 | | | | 1,489,852 | | | | 31,621 | | | | 344,295 | | | | 43,487 | | | | 447,942 | | |
Redemptions | | | (1,561,467 | ) | | | (18,303,886 | ) | | | (1,704,392 | ) | | | (18,964,791 | ) | | | (1,674,694 | ) | | | (17,771,209 | ) | |
Net decrease | | | (633,804 | ) | | | (7,445,736 | ) | | | (239,677 | ) | | | (2,007,320 | ) | | | (665,039 | ) | | | (7,001,245 | ) | |
Class R shares | |
Subscriptions | | | 173,922 | | | | 2,037,313 | | | | 249,996 | | | | 2,804,879 | | | | 116,201 | | | | 1,182,795 | | |
Distributions reinvested | | | 15,056 | | | | 174,279 | | | | 3,805 | | | | 41,080 | | | | 2,990 | | | | 31,530 | | |
Redemptions | | | (147,472 | ) | | | (1,717,075 | ) | | | (38,358 | ) | | | (427,710 | ) | | | (158,727 | ) | | | (1,747,133 | ) | |
Net increase (decrease) | | | 41,506 | | | | 494,517 | | | | 215,443 | | | | 2,418,249 | | | | (39,536 | ) | | | (532,808 | ) | |
Class R4 shares | |
Subscriptions | | | 213 | | | | 2,500 | | | | — | | | | — | | | | — | | | | — | | |
Net increase | | | 213 | | | | 2,500 | | | | — | | | | — | | | | — | | | | — | | |
Class R5 shares | |
Subscriptions | | | 213 | | | | 2,500 | | | | — | | | | — | | | | — | | | | — | | |
Net increase | | | 213 | | | | 2,500 | | | | — | | | | — | | | | — | | | | — | | |
Class T shares | |
Subscriptions | | | 31,954 | | | | 372,493 | | | | 24,511 | | | | 270,790 | | | | 218 | | | | 2,500 | | |
Fund merger | | | — | | | | — | | | | 9,782,229 | | | | 116,583,107 | | | | — | | | | — | | |
Distributions reinvested | | | 280,223 | | | | 3,244,818 | | | | 102,021 | | | | 1,104,992 | | | | — | | | | — | | |
Redemptions | | | (1,037,773 | ) | | | (12,108,142 | ) | | | (798,843 | ) | | | (8,887,325 | ) | | | — | | | | — | | |
Net increase (decrease) | | | (725,596 | ) | | | (8,490,831 | ) | | | 9,109,918 | | | | 109,071,564 | | | | 218 | | | | 2,500 | | |
Class Z shares | |
Subscriptions | | | 2,164,449 | | | | 25,259,972 | | | | 1,278,833 | | | | 14,425,281 | | | | 1,292,743 | | | | 13,769,633 | | |
Fund merger | | | — | | | | — | | | | 10,650,993 | | | | 126,822,052 | | | | — | | | | — | | |
Distributions reinvested | | | 284,546 | | | | 3,292,261 | | | | 103,756 | | | | 1,121,594 | | | | 40,312 | | | | 424,948 | | |
Redemptions | | | (3,200,487 | ) | | | (37,406,677 | ) | | | (3,923,537 | ) | | | (43,717,145 | ) | | | (2,794,570 | ) | | | (27,941,334 | ) | |
Net increase (decrease) | | | (751,492 | ) | | | (8,854,444 | ) | | | 8,110,045 | | | | 98,651,782 | | | | (1,461,515 | ) | | | (13,746,753 | ) | |
Total net increase (decrease) | | | (7,756,475 | ) | | | (90,403,587 | ) | | | 46,972,354 | | | | 568,809,486 | | | | (7,243,666 | ) | | | (74,373,436 | ) | |
(a) Class R4 and R5 shares are for the period from November 8, 2012 (commencement of operations) to January 31, 2013.
(b) For the period from April 1, 2011 to January 31, 2012. During the period, the Fund's fiscal year end was changed from March 31 to January 31.
(c) Class T shares are for the period from March 7, 2011 (commencement of operations) to March 31, 2011.
(d) Includes conversions of Class B shares to Class A shares, if any.
The accompanying Notes to Financial Statements are an integral part of this statement.
Annual Report 2013
71
Columbia Capital Allocation Portfolios
Statements of Changes in Net Assets (continued)
| | | Columbia Capital Allocation Aggressive Portfolio | |
| | | Year Ended January 31,
2013 | | Year Ended January 31,
2012 | |
| | | Shares | | Dollars ($) | | Shares | | Dollars ($) | |
Capital stock activity | |
Class A shares | |
Subscriptions(a) | | | 5,431,267 | | | | 57,544,416 | | | | 7,252,231 | | | | 74,451,528 | | |
Distributions reinvested | | | 634,768 | | | | 6,944,361 | | | | 664,668 | | | | 6,400,753 | | |
Redemptions | | | (9,022,215 | ) | | | (96,135,357 | ) | | | (9,068,967 | ) | | | (92,101,891 | ) | |
Net decrease | | | (2,956,180 | ) | | | (31,646,580 | ) | | | (1,152,068 | ) | | | (11,249,610 | ) | |
Class B shares | |
Subscriptions | | | 123,248 | | | | 1,307,406 | | | | 304,034 | | | | 3,151,406 | | |
Distributions reinvested | | | 18,355 | | | | 200,985 | | | | 22,043 | | | | 212,051 | | |
Redemptions(a) | | | (1,539,524 | ) | | | (15,989,548 | ) | | | (1,983,801 | ) | | | (20,512,069 | ) | |
Net decrease | | | (1,397,921 | ) | | | (14,481,157 | ) | | | (1,657,724 | ) | | | (17,148,612 | ) | |
Class C shares | |
Subscriptions | | | 729,806 | | | | 7,657,395 | | | | 846,098 | | | | 8,505,955 | | |
Distributions reinvested | | | 26,508 | | | | 285,762 | | | | 22,854 | | | | 217,113 | | |
Redemptions | | | (645,587 | ) | | | (6,774,390 | ) | | | (689,270 | ) | | | (6,885,247 | ) | |
Net increase | | | 110,727 | | | | 1,168,767 | | | | 179,682 | | | | 1,837,821 | | |
Class K shares(b) | |
Subscriptions | | | 677 | | | | 7,275 | | | | 4,239 | | | | 44,892 | | |
Distributions reinvested | | | 574 | | | | 6,291 | | | | 692 | | | | 6,673 | | |
Redemptions | | | (34,435 | ) | | | (383,185 | ) | | | (5,409 | ) | | | (53,339 | ) | |
Net decrease | | | (33,184 | ) | | | (369,619 | ) | | | (478 | ) | | | (1,774 | ) | |
Class R shares | |
Subscriptions | | | 15,707 | | | | 169,400 | | | | — | | | | — | | |
Distributions reinvested | | | 86 | | | | 936 | | | | — | | | | — | | |
Redemptions | | | (3 | ) | | | (34 | ) | | | — | | | | — | | |
Net increase | | | 15,790 | | | | 170,302 | | | | — | | | | — | | |
Class Z shares | |
Subscriptions | | | 34,663 | | | | 377,096 | | | | 21,187 | | | | 221,433 | | |
Distributions reinvested | | | 569 | | | | 6,200 | | | | 136 | | | | 1,301 | | |
Redemptions | | | (15,506 | ) | | | (168,084 | ) | | | (5,003 | ) | | | (51,952 | ) | |
Net increase | | | 19,726 | | | | 215,212 | | | | 16,320 | | | | 170,782 | | |
Total net decrease | | | (4,241,042 | ) | | | (44,943,075 | ) | | | (2,614,268 | ) | | | (26,391,393 | ) | |
(a) Includes conversions of Class B shares to Class A shares, if any. The line items from the prior year have been combined to conform to the current year presentation.
(b) Effective October 25, 2012, Class R4 shares were renamed Class K shares.
The accompanying Notes to Financial Statements are an integral part of this statement.
Annual Report 2013
72
Columbia Capital Allocation Portfolios
Financial Highlights
Columbia Capital Allocation Conservative Portfolio
The following tables are intended to help you understand the Funds' financial performance. Certain information reflects financial results for a single share of a class held for the periods shown. Per share net investment income (loss) amounts are calculated based on average shares outstanding during the period. Total return assumes reinvestment of all dividends and distributions, if any. Total return does not reflect payment of sales charges, if any, and is not annualized for periods of less than one year.
| | | Year Ended January 31, | |
Class A | | 2013 | | 2012 | | 2011 | | 2010 | | 2009 | |
Per share data | |
Net asset value, beginning of period | | $ | 10.32 | | | $ | 10.44 | | | $ | 9.77 | | | $ | 8.51 | | | $ | 10.15 | | |
Income from investment operations: | |
Net investment income | | | 0.24 | | | | 0.25 | | | | 0.24 | | | | 0.25 | | | | 0.32 | | |
Net realized and unrealized gain (loss) | | | 0.54 | | | | 0.14 | | | | 0.68 | | | | 1.25 | | | | (1.63 | ) | |
Total from investment operations | | | 0.78 | | | | 0.39 | | | | 0.92 | | | | 1.50 | | | | (1.31 | ) | |
Less distributions to shareholders: | |
Net investment income | | | (0.35 | ) | | | (0.25 | ) | | | (0.25 | ) | | | (0.24 | ) | | | (0.31 | ) | |
Net realized gains | | | (0.12 | ) | | | (0.26 | ) | | | — | | | | — | | | | (0.02 | ) | |
Total distributions to shareholders | | | (0.47 | ) | | | (0.51 | ) | | | (0.25 | ) | | | (0.24 | ) | | | (0.33 | ) | |
Net asset value, end of period | | $ | 10.63 | | | $ | 10.32 | | | $ | 10.44 | | | $ | 9.77 | | | $ | 8.51 | | |
Total return | | | 7.62 | % | | | 3.90 | % | | | 9.47 | % | | | 17.78 | % | | | (13.09 | %) | |
Ratios to average net assets(a) | |
Total gross expenses | | | 0.48 | % | | | 0.49 | % | | | 0.48 | % | | | 0.47 | % | | | 0.47 | % | |
Total net expenses(b) | | | 0.48 | %(c) | | | 0.49 | %(c) | | | 0.48 | % | | | 0.47 | % | | | 0.47 | % | |
Net investment income | | | 2.28 | % | | | 2.35 | % | | | 2.32 | % | | | 2.71 | % | | | 3.44 | % | |
Supplemental data | |
Net assets, end of period (in thousands) | | $ | 282,382 | | | $ | 251,178 | | | $ | 217,147 | | | $ | 188,324 | | | $ | 145,919 | | |
Portfolio turnover | | | 19 | % | | | 88 | % | | | 16 | % | | | 26 | % | | | 27 | % | |
Notes to Financial Highlights
(a) In addition to the fees and expenses which the Fund bears directly, the Fund indirectly bears a pro rata share of the fees and expenses of the underlying funds in which it invests. Such indirect expenses are not included in the reported expense ratios.
(b) Total net expenses include the impact of certain waivers/reimbursements made by the Investment Manager and certain of its affiliates, if applicable.
(c) The benefits derived from expense reductions had an impact of less than 0.01%.
The accompanying Notes to Financial Statements are an integral part of this statement.
Annual Report 2013
73
Columbia Capital Allocation Portfolios
Financial Highlights (continued)
Columbia Capital Allocation Conservative Portfolio
| | | Year Ended January 31, | |
Class B | | 2013 | | 2012 | | 2011 | | 2010 | | 2009 | |
Per share data | |
Net asset value, beginning of period | | $ | 10.29 | | | $ | 10.40 | | | $ | 9.73 | | | $ | 8.48 | | | $ | 10.11 | | |
Income from investment operations: | |
Net investment income | | | 0.15 | | | | 0.16 | | | | 0.15 | | | | 0.17 | | | | 0.25 | | |
Net realized and unrealized gain (loss) | | | 0.54 | | | | 0.16 | | | | 0.69 | | | | 1.25 | | | | (1.62 | ) | |
Total from investment operations | | | 0.69 | | | | 0.32 | | | | 0.84 | | | | 1.42 | | | | (1.37 | ) | |
Less distributions to shareholders: | |
Net investment income | | | (0.26 | ) | | | (0.17 | ) | | | (0.17 | ) | | | (0.17 | ) | | | (0.24 | ) | |
Net realized gains | | | (0.12 | ) | | | (0.26 | ) | | | — | | | | — | | | | (0.02 | ) | |
Total distributions to shareholders | | | (0.38 | ) | | | (0.43 | ) | | | (0.17 | ) | | | (0.17 | ) | | | (0.26 | ) | |
Net asset value, end of period | | $ | 10.60 | | | $ | 10.29 | | | $ | 10.40 | | | $ | 9.73 | | | $ | 8.48 | | |
Total return | | | 6.79 | % | | | 3.19 | % | | | 8.64 | % | | | 16.82 | % | | | (13.69 | %) | |
Ratios to average net assets(a) | |
Total gross expenses | | | 1.23 | % | | | 1.24 | % | | | 1.23 | % | | | 1.23 | % | | | 1.22 | % | |
Total net expenses(b) | | | 1.23 | %(c) | | | 1.24 | %(c) | | | 1.23 | % | | | 1.23 | % | | | 1.22 | % | |
Net investment income | | | 1.47 | % | | | 1.56 | % | | | 1.47 | % | | | 1.89 | % | | | 2.60 | % | |
Supplemental data | |
Net assets, end of period (in thousands) | | $ | 19,598 | | | $ | 24,717 | | | $ | 30,599 | | | $ | 38,996 | | | $ | 41,590 | | |
Portfolio turnover | | | 19 | % | | | 88 | % | | | 16 | % | | | 26 | % | | | 27 | % | |
Notes to Financial Highlights
(a) In addition to the fees and expenses which the Fund bears directly, the Fund indirectly bears a pro rata share of the fees and expenses of the underlying funds in which it invests. Such indirect expenses are not included in the reported expense ratios.
(b) Total net expenses include the impact of certain waivers/reimbursements made by the Investment Manager and certain of its affiliates, if applicable.
(c) The benefits derived from expense reductions had an impact of less than 0.01%.
The accompanying Notes to Financial Statements are an integral part of this statement.
Annual Report 2013
74
Columbia Capital Allocation Portfolios
Financial Highlights (continued)
Columbia Capital Allocation Conservative Portfolio
| | | Year Ended January 31, | |
Class C | | 2013 | | 2012 | | 2011 | | 2010 | | 2009 | |
Per share data | |
Net asset value, beginning of period | | $ | 10.28 | | | $ | 10.39 | | | $ | 9.73 | | | $ | 8.48 | | | $ | 10.12 | | |
Income from investment operations: | |
Net investment income | | | 0.16 | | | | 0.17 | | | | 0.16 | | | | 0.18 | | | | 0.25 | | |
Net realized and unrealized gain (loss) | | | 0.53 | | | | 0.16 | | | | 0.67 | | | | 1.25 | | | | (1.63 | ) | |
Total from investment operations | | | 0.69 | | | | 0.33 | | | | 0.83 | | | | 1.43 | | | | (1.38 | ) | |
Less distributions to shareholders: | |
Net investment income | | | (0.27 | ) | | | (0.18 | ) | | | (0.17 | ) | | | (0.18 | ) | | | (0.24 | ) | |
Net realized gains | | | (0.12 | ) | | | (0.26 | ) | | | — | | | | — | | | | (0.02 | ) | |
Total distributions to shareholders | | | (0.39 | ) | | | (0.44 | ) | | | (0.17 | ) | | | (0.18 | ) | | | (0.26 | ) | |
Net asset value, end of period | | $ | 10.58 | | | $ | 10.28 | | | $ | 10.39 | | | $ | 9.73 | | | $ | 8.48 | | |
Total return | | | 6.75 | % | | | 3.28 | % | | | 8.63 | % | | | 16.92 | % | | | (13.75 | %) | |
Ratios to average net assets(a) | |
Total gross expenses | | | 1.23 | % | | | 1.24 | % | | | 1.23 | % | | | 1.22 | % | | | 1.22 | % | |
Total net expenses(b) | | | 1.23 | %(c) | | | 1.24 | %(c) | | | 1.23 | % | | | 1.22 | % | | | 1.22 | % | |
Net investment income | | | 1.54 | % | | | 1.62 | % | | | 1.60 | % | | | 1.99 | % | | | 2.68 | % | |
Supplemental data | |
Net assets, end of period (in thousands) | | $ | 45,368 | | | $ | 36,637 | | | $ | 26,212 | | | $ | 18,362 | | | $ | 10,602 | | |
Portfolio turnover | | | 19 | % | | | 88 | % | | | 16 | % | | | 26 | % | | | 27 | % | |
Notes to Financial Highlights
(a) In addition to the fees and expenses which the Fund bears directly, the Fund indirectly bears a pro rata share of the fees and expenses of the underlying funds in which it invests. Such indirect expenses are not included in the reported expense ratios.
(b) Total net expenses include the impact of certain waivers/reimbursements made by the Investment Manager and certain of its affiliates, if applicable.
(c) The benefits derived from expense reductions had an impact of less than 0.01%.
The accompanying Notes to Financial Statements are an integral part of this statement.
Annual Report 2013
75
Columbia Capital Allocation Portfolios
Financial Highlights (continued)
Columbia Capital Allocation Conservative Portfolio
| | | Year Ended January 31, | |
Class K(a) | | 2013 | | 2012 | | 2011 | | 2010 | | 2009 | |
Per share data | |
Net asset value, beginning of period | | $ | 10.25 | | | $ | 10.35 | | | $ | 9.69 | | | $ | 8.43 | | | $ | 10.05 | | |
Income from investment operations: | |
Net investment income | | | 0.24 | | | | 0.25 | | | | 0.24 | | | | 0.24 | | | | 0.35 | | |
Net realized and unrealized gain (loss) | | | 0.53 | | | | 0.16 | | | | 0.67 | | | | 1.25 | | | | (1.60 | ) | |
Total from investment operations | | | 0.77 | | | | 0.41 | | | | 0.91 | | | | 1.49 | | | | (1.25 | ) | |
Less distributions to shareholders: | |
Net investment income | | | (0.36 | ) | | | (0.25 | ) | | | (0.25 | ) | | | (0.23 | ) | | | (0.35 | ) | |
Net realized gains | | | (0.12 | ) | | | (0.26 | ) | | | — | | | | — | | | | (0.02 | ) | |
Total distributions to shareholders | | | (0.48 | ) | | | (0.51 | ) | | | (0.25 | ) | | | (0.23 | ) | | | (0.37 | ) | |
Net asset value, end of period | | $ | 10.54 | | | $ | 10.25 | | | $ | 10.35 | | | $ | 9.69 | | | $ | 8.43 | | |
Total return | | | 7.62 | % | | | 4.14 | % | | | 9.49 | % | | | 17.86 | % | | | (12.71 | %) | |
Ratios to average net assets(b) | |
Total gross expenses | | | 0.39 | % | | | 0.41 | % | | | 0.44 | % | | | 0.38 | % | | | 0.39 | % | |
Total net expenses(c) | | | 0.39 | % | | | 0.39 | % | | | 0.44 | % | | | 0.38 | % | | | 0.13 | % | |
Net investment income | | | 2.27 | % | | | 2.43 | % | | | 2.35 | % | | | 2.69 | % | | | 3.68 | % | |
Supplemental data | |
Net assets, end of period (in thousands) | | $ | 12 | | | $ | 79 | | | $ | 81 | | | $ | 68 | | | $ | 21 | | |
Portfolio turnover | | | 19 | % | | | 88 | % | | | 16 | % | | | 26 | % | | | 27 | % | |
Notes to Financial Highlights
(a) Effective October 25, 2012, Class R4 shares were renamed Class K shares.
(b) In addition to the fees and expenses which the Fund bears directly, the Fund indirectly bears a pro rata share of the fees and expenses of the underlying funds in which it invests. Such indirect expenses are not included in the reported expense ratios.
(c) Total net expenses include the impact of certain waivers/reimbursements made by the Investment Manager and certain of its affiliates, if applicable.
The accompanying Notes to Financial Statements are an integral part of this statement.
Annual Report 2013
76
Columbia Capital Allocation Portfolios
Financial Highlights (continued)
Columbia Capital Allocation Conservative Portfolio
| | | Year Ended January 31, | |
Class R | | 2013 | | 2012 | | 2011(a) | |
Per share data | |
Net asset value, beginning of period | | $ | 10.32 | | | $ | 10.44 | | | $ | 10.24 | | |
Income from investment operations: | |
Net investment income | | | 0.25 | | | | 0.22 | | | | 0.10 | | |
Net realized and unrealized gain | | | 0.50 | | | | 0.15 | | | | 0.21 | | |
Total from investment operations | | | 0.75 | | | | 0.37 | | | | 0.31 | | |
Less distributions to shareholders: | |
Net investment income | | | (0.32 | ) | | | (0.23 | ) | | | (0.11 | ) | |
Net realized gains | | | (0.12 | ) | | | (0.26 | ) | | | — | | |
Total distributions to shareholders | | | (0.44 | ) | | | (0.49 | ) | | | (0.11 | ) | |
Net asset value, end of period | | $ | 10.63 | | | $ | 10.32 | | | $ | 10.44 | | |
Total return | | | 7.39 | % | | | 3.66 | % | | | 3.03 | % | |
Ratios to average net assets(b) | |
Total gross expenses | | | 0.72 | % | | | 0.75 | % | | | 0.68 | %(c) | |
Total net expenses(d) | | | 0.72 | % | | | 0.75 | % | | | 0.68 | %(c) | |
Net investment income | | | 2.36 | % | | | 2.07 | % | | | 2.78 | %(c) | |
Supplemental data | |
Net assets, end of period (in thousands) | | $ | 114 | | | $ | 3 | | | $ | 3 | | |
Portfolio turnover | | | 19 | % | | | 88 | % | | | 16 | % | |
Notes to Financial Highlights
(a) For the period from September 27, 2010 (commencement of operations) to January 31, 2011.
(b) In addition to the fees and expenses which the Fund bears directly, the Fund indirectly bears a pro rata share of the fees and expenses of the underlying funds in which it invests. Such indirect expenses are not included in the reported expense ratios.
(c) Annualized.
(d) Total net expenses include the impact of certain waivers/reimbursements made by the Investment Manager and certain of its affiliates, if applicable.
The accompanying Notes to Financial Statements are an integral part of this statement.
Annual Report 2013
77
Columbia Capital Allocation Portfolios
Financial Highlights (continued)
Columbia Capital Allocation Conservative Portfolio
| | | Year Ended January 31, | |
Class Z | | 2013 | | 2012 | | 2011(a) | |
Per share data | |
Net asset value, beginning of period | | $ | 10.32 | | | $ | 10.44 | | | $ | 10.24 | | |
Income from investment operations: | |
Net investment income | | | 0.30 | | | | 0.28 | | | | 0.12 | | |
Net realized and unrealized gain | | | 0.51 | | | | 0.14 | | | | 0.20 | | |
Total from investment operations | | | 0.81 | | | | 0.42 | | | | 0.32 | | |
Less distributions to shareholders: | |
Net investment income | | | (0.38 | ) | | | (0.28 | ) | | | (0.12 | ) | |
Net realized gains | | | (0.12 | ) | | | (0.26 | ) | | | — | | |
Total distributions to shareholders | | | (0.50 | ) | | | (0.54 | ) | | | (0.12 | ) | |
Net asset value, end of period | | $ | 10.63 | | | $ | 10.32 | | | $ | 10.44 | | |
Total return | | | 7.91 | % | | | 4.19 | % | | | 3.15 | % | |
Ratios to average net assets(b) | |
Total gross expenses | | | 0.22 | % | | | 0.24 | % | | | 0.26 | %(c) | |
Total net expenses(d) | | | 0.22 | %(e) | | | 0.24 | %(e) | | | 0.21 | %(c) | |
Net investment income | | | 2.80 | % | | | 2.71 | % | | | 3.28 | %(c) | |
Supplemental data | |
Net assets, end of period (in thousands) | | $ | 700 | | | $ | 52 | | | $ | 20 | | |
Portfolio turnover | | | 19 | % | | | 88 | % | | | 16 | % | |
Notes to Financial Highlights
(a) For the period from September 27, 2010 (commencement of operations) to January 31, 2011.
(b) In addition to the fees and expenses which the Fund bears directly, the Fund indirectly bears a pro rata share of the fees and expenses of the underlying funds in which it invests. Such indirect expenses are not included in the reported expense ratios.
(c) Annualized.
(d) Total net expenses include the impact of certain waivers/reimbursements made by the Investment Manager and certain of its affiliates, if applicable.
(e) The benefits derived from expense reductions had an impact of less than 0.01%.
The accompanying Notes to Financial Statements are an integral part of this statement.
Annual Report 2013
78
Columbia Capital Allocation Portfolios
Financial Highlights
Columbia Capital Allocation Moderate Conservative Portfolio
| | | Year Ended January 31, | | Year Ended March 31, | |
Class A | | 2013 | | 2012(a) | | 2011 | | 2010 | | 2009 | | 2008 | |
Per share data | |
Net asset value, beginning of period | | $ | 10.96 | | | $ | 10.89 | | | $ | 10.04 | | | $ | 8.03 | | | $ | 10.40 | | | $ | 11.04 | | |
Income from investment operations: | |
Net investment income | | | 0.25 | | | | 0.21 | | | | 0.26 | | | | 0.31 | | | | 0.33 | | | | 0.36 | | |
Net realized and unrealized gain (loss) | | | 0.71 | | | | 0.07 | | | | 0.85 | | | | 2.00 | | | | (1.97 | ) | | | (0.30 | ) | |
Total from investment operations | | | 0.96 | | | | 0.28 | | | | 1.11 | | | | 2.31 | | | | (1.64 | ) | | | 0.06 | | |
Less distributions to shareholders: | |
Net investment income | | | (0.32 | ) | | | (0.21 | ) | | | (0.26 | ) | | | (0.30 | ) | | | (0.33 | ) | | | (0.36 | ) | |
Net realized gains | | | (0.27 | ) | | | — | | | | — | | | | — | | | | (0.40 | ) | | | (0.34 | ) | |
Total distributions to shareholders | | | (0.59 | ) | | | (0.21 | ) | | | (0.26 | ) | | | (0.30 | ) | | | (0.73 | ) | | | (0.70 | ) | |
Net asset value, end of period | | $ | 11.33 | | | $ | 10.96 | | | $ | 10.89 | | | $ | 10.04 | | | $ | 8.03 | | | $ | 10.40 | | |
Total return | | | 8.94 | % | | | 2.63 | % | | | 11.21 | % | | | 29.06 | % | | | (16.58 | %) | | | 0.34 | % | |
Ratios to average net assets(b)(c) | |
Total gross expenses | | | 0.70 | % | | | 0.64 | %(d)(e) | | | 0.50 | % | | | 0.50 | % | | | 0.50 | %(e) | | | 0.50 | % | |
Total net expenses(f) | | | 0.57 | %(g) | | | 0.57 | %(d)(e)(g) | | | 0.50 | % | | | 0.50 | % | | | 0.50 | %(e)(g) | | | 0.50 | %(g) | |
Net investment income | | | 2.19 | % | | | 2.37 | %(d) | | | 2.52 | % | | | 3.26 | % | | | 3.59 | % | | | 3.29 | % | |
Supplemental data | |
Net assets, end of period (in thousands) | | $ | 71,321 | | | $ | 68,452 | | | $ | 63,807 | | | $ | 60,848 | | | $ | 44,825 | | | $ | 54,370 | | |
Portfolio turnover | | | 38 | % | | | 55 | % | | | 87 | % | | | 34 | % | | | 52 | % | | | 20 | % | |
Notes to Financial Highlights
(a) For the period from April 1, 2011 to January 31, 2012. During the period, the Fund's fiscal year end was changed from March 31 to January 31.
(b) In addition to the fees and expenses which the Fund bears directly, the Fund indirectly bears a pro rata share of the fees and expenses of the underlying funds in which it invests. Such indirect expenses are not included in the reported expense ratios.
(c) Certain line items from prior years have been reclassified to conform to the current presentation.
(d) Annualized.
(e) Ratios include line of credit interest expense which rounds to less than 0.01%.
(f) Total net expenses include the impact of certain waivers/reimbursements made by the Investment Manager and certain of its affiliates, if applicable.
(g) The benefits derived from expense reductions had an impact of less than 0.01%.
The accompanying Notes to Financial Statements are an integral part of this statement.
Annual Report 2013
79
Columbia Capital Allocation Portfolios
Financial Highlights (continued)
Columbia Capital Allocation Moderate Conservative Portfolio
| | | Year Ended January 31, | | Year Ended March 31, | |
Class B | | 2013 | | 2012(a) | | 2011 | | 2010 | | 2009 | | 2008 | |
Per share data | |
Net asset value, beginning of period | | $ | 10.91 | | | $ | 10.85 | | | $ | 10.00 | | | $ | 8.01 | | | $ | 10.36 | | | $ | 11.00 | | |
Income from investment operations: | |
Net investment income | | | 0.15 | | | | 0.14 | | | | 0.18 | | | | 0.23 | | | | 0.26 | | | | 0.28 | | |
Net realized and unrealized gain (loss) | | | 0.73 | | | | 0.07 | | | | 0.85 | | | | 1.99 | | | | (1.95 | ) | | | (0.31 | ) | |
Total from investment operations | | | 0.88 | | | | 0.21 | | | | 1.03 | | | | 2.22 | | | | (1.69 | ) | | | (0.03 | ) | |
Less distributions to shareholders: | |
Net investment income | | | (0.24 | ) | | | (0.15 | ) | | | (0.18 | ) | | | (0.23 | ) | | | (0.26 | ) | | | (0.27 | ) | |
Net realized gains | | | (0.27 | ) | | | — | | | | — | | | | — | | | | (0.40 | ) | | | (0.34 | ) | |
Total distributions to shareholders | | | (0.51 | ) | | | (0.15 | ) | | | (0.18 | ) | | | (0.23 | ) | | | (0.66 | ) | | | (0.61 | ) | |
Net asset value, end of period | | $ | 11.28 | | | $ | 10.91 | | | $ | 10.85 | | | $ | 10.00 | | | $ | 8.01 | | | $ | 10.36 | | |
Total return | | | 8.17 | % | | | 1.96 | % | | | 10.43 | % | | | 27.94 | % | | | (17.09 | %) | | | (0.41 | %) | |
Ratios to average net assets(b)(c) | |
Total gross expenses | | | 1.44 | % | | | 1.39 | %(d)(e) | | | 1.25 | % | | | 1.25 | % | | | 1.25 | %(e) | | | 1.25 | % | |
Total net expenses(f) | | | 1.32 | %(g) | | | 1.31 | %(d)(e)(g) | | | 1.25 | % | | | 1.25 | % | | | 1.25 | %(e)(g) | | | 1.25 | %(g) | |
Net investment income | | | 1.36 | % | | | 1.58 | %(d) | | | 1.75 | % | | | 2.51 | % | | | 2.80 | % | | | 2.53 | % | |
Supplemental data | |
Net assets, end of period (in thousands) | | $ | 8,335 | | | $ | 14,587 | | | $ | 26,181 | | | $ | 40,508 | | | $ | 40,270 | | | $ | 66,558 | | |
Portfolio turnover | | | 38 | % | | | 55 | % | | | 87 | % | | | 34 | % | | | 52 | % | | | 20 | % | |
Notes to Financial Highlights
(a) For the period from April 1, 2011 to January 31, 2012. During the period, the Fund's fiscal year end was changed from March 31 to January 31.
(b) In addition to the fees and expenses which the Fund bears directly, the Fund indirectly bears a pro rata share of the fees and expenses of the underlying funds in which it invests. Such indirect expenses are not included in the reported expense ratios.
(c) Certain line items from prior years have been reclassified to conform to the current presentation.
(d) Annualized.
(e) Ratios include line of credit interest expense which rounds to less than 0.01%.
(f) Total net expenses include the impact of certain waivers/reimbursements made by the Investment Manager and certain of its affiliates, if applicable.
(g) The benefits derived from expense reductions had an impact of less than 0.01%.
The accompanying Notes to Financial Statements are an integral part of this statement.
Annual Report 2013
80
Columbia Capital Allocation Portfolios
Financial Highlights (continued)
Columbia Capital Allocation Moderate Conservative Portfolio
| | | Year Ended January 31, | | Year Ended March 31, | |
Class C | | 2013 | | 2012(a) | | 2011 | | 2010 | | 2009 | | 2008 | |
Per share data | |
Net asset value, beginning of period | | $ | 10.84 | | | $ | 10.78 | | | $ | 9.94 | | | $ | 7.96 | | | $ | 10.30 | | | $ | 10.94 | | |
Income from investment operations: | |
Net investment income | | | 0.16 | | | | 0.14 | | | | 0.18 | | | | 0.23 | | | | 0.26 | | | | 0.28 | | |
Net realized and unrealized gain (loss) | | | 0.71 | | | | 0.07 | | | | 0.84 | | | | 1.98 | | | | (1.94 | ) | | | (0.31 | ) | |
Total from investment operations | | | 0.87 | | | | 0.21 | | | | 1.02 | | | | 2.21 | | | | (1.68 | ) | | | (0.03 | ) | |
Less distributions to shareholders: | |
Net investment income | | | (0.24 | ) | | | (0.15 | ) | | | (0.18 | ) | | | (0.23 | ) | | | (0.26 | ) | | | (0.27 | ) | |
Net realized gains | | | (0.27 | ) | | | — | | | | — | | | | — | | | | (0.40 | ) | | | (0.34 | ) | |
Total distributions to shareholders | | | (0.51 | ) | | | (0.15 | ) | | | (0.18 | ) | | | (0.23 | ) | | | (0.66 | ) | | | (0.61 | ) | |
Net asset value, end of period | | $ | 11.20 | | | $ | 10.84 | | | $ | 10.78 | | | $ | 9.94 | | | $ | 7.96 | | | $ | 10.30 | | |
Total return | | | 8.13 | % | | | 1.97 | % | | | 10.39 | % | | | 27.99 | % | | | (17.09 | %) | | | (0.41 | %) | |
Ratios to average net assets(b)(c) | |
Total gross expenses | | | 1.45 | % | | | 1.39 | %(d)(e) | | | 1.25 | % | | | 1.25 | % | | | 1.25 | %(e) | | | 1.25 | % | |
Total net expenses(f) | | | 1.32 | %(g) | | | 1.32 | %(d)(e)(g) | | | 1.25 | % | | | 1.25 | % | | | 1.25 | %(e)(g) | | | 1.25 | %(g) | |
Net investment income | | | 1.44 | % | | | 1.61 | %(d) | | | 1.77 | % | | | 2.51 | % | | | 2.81 | % | | | 2.55 | % | |
Supplemental data | |
Net assets, end of period (in thousands) | | $ | 23,470 | | | $ | 24,156 | | | $ | 23,651 | | | $ | 23,321 | | | $ | 18,370 | | | $ | 26,501 | | |
Portfolio turnover | | | 38 | % | | | 55 | % | | | 87 | % | | | 34 | % | | | 52 | % | | | 20 | % | |
Notes to Financial Highlights
(a) For the period from April 1, 2011 to January 31, 2012. During the period, the Fund's fiscal year end was changed from March 31 to January 31.
(b) In addition to the fees and expenses which the Fund bears directly, the Fund indirectly bears a pro rata share of the fees and expenses of the underlying funds in which it invests. Such indirect expenses are not included in the reported expense ratios.
(c) Certain line items from prior years have been reclassified to conform to the current presentation.
(d) Annualized.
(e) Ratios include line of credit interest expense which rounds to less than 0.01%.
(f) Total net expenses include the impact of certain waivers/reimbursements made by the Investment Manager and certain of its affiliates, if applicable.
(g) The benefits derived from expense reductions had an impact of less than 0.01%.
The accompanying Notes to Financial Statements are an integral part of this statement.
Annual Report 2013
81
Columbia Capital Allocation Portfolios
Financial Highlights (continued)
Columbia Capital Allocation Moderate Conservative Portfolio
| | | Year Ended January 31, | | Year Ended March 31, | |
Class R | | 2013 | | 2012(a) | | 2011 | | 2010 | | 2009 | | 2008 | |
Per share data | |
Net asset value, beginning of period | | $ | 10.96 | | | $ | 10.90 | | | $ | 10.04 | | | $ | 8.04 | | | $ | 10.40 | | | $ | 11.04 | | |
Income from investment operations: | |
Net investment income | | | 0.23 | | | | 0.18 | | | | 0.23 | | | | 0.28 | | | | 0.31 | | | | 0.32 | | |
Net realized and unrealized gain (loss) | | | 0.72 | | | | 0.07 | | | | 0.86 | | | | 2.00 | | | | (1.96 | ) | | | (0.29 | ) | |
Total from investment operations | | | 0.95 | | | | 0.25 | | | | 1.09 | | | | 2.28 | | | | (1.65 | ) | | | 0.03 | | |
Less distributions to shareholders: | |
Net investment income | | | (0.30 | ) | | | (0.19 | ) | | | (0.23 | ) | | | (0.28 | ) | | | (0.31 | ) | | | (0.33 | ) | |
Net realized gains | | | (0.27 | ) | | | — | | | | — | | | | — | | | | (0.40 | ) | | | (0.34 | ) | |
Total distributions to shareholders | | | (0.57 | ) | | | (0.19 | ) | | | (0.23 | ) | | | (0.28 | ) | | | (0.71 | ) | | | (0.67 | ) | |
Net asset value, end of period | | $ | 11.34 | | | $ | 10.96 | | | $ | 10.90 | | | $ | 10.04 | | | $ | 8.04 | | | $ | 10.40 | | |
Total return | | | 8.76 | % | | | 2.34 | % | | | 11.03 | % | | | 28.58 | % | | | (16.69 | %) | | | 0.09 | % | |
Ratios to average net assets(b)(c) | |
Total gross expenses | | | 0.96 | % | | | 0.89 | %(d)(e) | | | 0.75 | % | | | 0.75 | % | | | 0.75 | %(e) | | | 0.75 | % | |
Total net expenses(f) | | | 0.81 | %(g) | | | 0.82 | %(d)(e)(g) | | | 0.75 | % | | | 0.75 | % | | | 0.75 | %(e)(g) | | | 0.75 | %(g) | |
Net investment income | | | 2.04 | % | | | 2.03 | %(d) | | | 2.28 | % | | | 3.00 | % | | | 3.34 | % | | | 2.93 | % | |
Supplemental data | |
Net assets, end of period (in thousands) | | $ | 2,148 | | | $ | 1,102 | | | $ | 428 | | | $ | 559 | | | $ | 358 | | | $ | 451 | | |
Portfolio turnover | | | 38 | % | | | 55 | % | | | 87 | % | | | 34 | % | | | 52 | % | | | 20 | % | |
Notes to Financial Highlights
(a) For the period from April 1, 2011 to January 31, 2012. During the period, the Fund's fiscal year end was changed from March 31 to January 31.
(b) In addition to the fees and expenses which the Fund bears directly, the Fund indirectly bears a pro rata share of the fees and expenses of the underlying funds in which it invests. Such indirect expenses are not included in the reported expense ratios.
(c) Certain line items from prior years have been reclassified to conform to the current presentation.
(d) Annualized.
(e) Ratios include line of credit interest expense which rounds to less than 0.01%.
(f) Total net expenses include the impact of certain waivers/reimbursements made by the Investment Manager and certain of its affiliates, if applicable.
(g) The benefits derived from expense reductions had an impact of less than 0.01%.
The accompanying Notes to Financial Statements are an integral part of this statement.
Annual Report 2013
82
Columbia Capital Allocation Portfolios
Financial Highlights (continued)
Columbia Capital Allocation Moderate Conservative Portfolio
Class R4 | | Year Ended
January 31,
2013(a) | |
Per share data | |
Net asset value, beginning of period | | $ | 11.30 | | |
Income from investment operations: | |
Net investment income | | | 0.09 | | |
Net realized and unrealized gain | | | 0.26 | | |
Total from investment operations | | | 0.35 | | |
Less distributions to shareholders: | |
Net investment income | | | (0.17 | ) | |
Net realized gains | | | (0.23 | ) | |
Total distributions to shareholders | | | (0.40 | ) | |
Net asset value, end of period | | $ | 11.25 | | |
Total return | | | 3.11 | % | |
Ratios to average net assets(b) | |
Total gross expenses | | | 0.51 | %(c) | |
Total net expenses(d) | | | 0.37 | %(c) | |
Net investment income | | | 3.68 | %(c) | |
Supplemental data | |
Net assets, end of period (in thousands) | | $ | 2 | | |
Portfolio turnover | | | 38 | % | |
Notes to Financial Highlights
(a) For the period from November 8, 2012 (commencement of operations) to January 31, 2013.
(b) In addition to the fees and expenses which the Fund bears directly, the Fund indirectly bears a pro rata share of the fees and expenses of the underlying funds in which it invests. Such indirect expenses are not included in the reported expense ratios.
(c) Annualized.
(d) Total net expenses include the impact of certain waivers/reimbursements made by the Investment Manager and certain of its affiliates, if applicable.
The accompanying Notes to Financial Statements are an integral part of this statement.
Annual Report 2013
83
Columbia Capital Allocation Portfolios
Financial Highlights (continued)
Columbia Capital Allocation Moderate Conservative Portfolio
Class R5 | | Year Ended
January 31,
2013(a) | |
Per share data | |
Net asset value, beginning of period | �� | $ | 11.30 | | |
Income from investment operations: | |
Net investment income | | | 0.10 | | |
Net realized and unrealized gain | | | 0.25 | | |
Total from investment operations | | | 0.35 | | |
Less distributions to shareholders: | |
Net investment income | | | (0.17 | ) | |
Net realized gains | | | (0.23 | ) | |
Total distributions to shareholders | | | (0.40 | ) | |
Net asset value, end of period | | $ | 11.25 | | |
Total return | | | 3.13 | % | |
Ratios to average net assets(b) | |
Total gross expenses | | | 0.41 | %(c) | |
Total net expenses(d) | | | 0.29 | %(c) | |
Net investment income | | | 3.77 | %(c) | |
Supplemental data | |
Net assets, end of period (in thousands) | | $ | 2 | | |
Portfolio turnover | | | 38 | % | |
Notes to Financial Highlights
(a) For the period from November 8, 2012 (commencement of operations) to January 31, 2013.
(b) In addition to the fees and expenses which the Fund bears directly, the Fund indirectly bears a pro rata share of the fees and expenses of the underlying funds in which it invests. Such indirect expenses are not included in the reported expense ratios.
(c) Annualized.
(d) Total net expenses include the impact of certain waivers/reimbursements made by the Investment Manager and certain of its affiliates, if applicable.
The accompanying Notes to Financial Statements are an integral part of this statement.
Annual Report 2013
84
Columbia Capital Allocation Portfolios
Financial Highlights (continued)
Columbia Capital Allocation Moderate Conservative Portfolio
| | | Year Ended January 31, | | Year Ended March 31, | |
Class Z | | 2013 | | 2012(a) | | 2011 | | 2010 | | 2009 | | 2008 | |
Per share data | |
Net asset value, beginning of period | | $ | 10.85 | | | $ | 10.78 | | | $ | 9.94 | | | $ | 7.96 | | | $ | 10.30 | | | $ | 10.96 | | |
Income from investment operations: | |
Net investment income | | | 0.27 | | | | 0.23 | | | | 0.28 | | | | 0.33 | | | | 0.35 | | | | 0.42 | | |
Net realized and unrealized gain (loss) | | | 0.71 | | | | 0.07 | | | | 0.84 | | | | 1.98 | | | | (1.93 | ) | | | (0.36 | ) | |
Total from investment operations | | | 0.98 | | | | 0.30 | | | | 1.12 | | | | 2.31 | | | | (1.58 | ) | | | 0.06 | | |
Less distributions to shareholders: | |
Net investment income | | | (0.35 | ) | | | (0.23 | ) | | | (0.28 | ) | | | (0.33 | ) | | | (0.36 | ) | | | (0.38 | ) | |
Net realized gains | | | (0.27 | ) | | | — | | | | — | | | | — | | | | (0.40 | ) | | | (0.34 | ) | |
Total distributions to shareholders | | | (0.62 | ) | | | (0.23 | ) | | | (0.28 | ) | | | (0.33 | ) | | | (0.76 | ) | | | (0.72 | ) | |
Net asset value, end of period | | $ | 11.21 | | | $ | 10.85 | | | $ | 10.78 | | | $ | 9.94 | | | $ | 7.96 | | | $ | 10.30 | | |
Total return | | | 9.22 | % | | | 2.85 | % | | | 11.49 | % | | | 29.25 | % | | | (16.23 | %) | | | 0.40 | % | |
Ratios to average net assets(b)(c) | |
Total gross expenses | | | 0.45 | % | | | 0.39 | %(d)(e) | | | 0.25 | % | | | 0.25 | % | | | 0.25 | %(e) | | | 0.25 | % | |
Total net expenses(f) | | | 0.32 | %(g) | | | 0.32 | %(d)(e)(g) | | | 0.25 | % | | | 0.25 | % | | | 0.25 | %(e)(g) | | | 0.25 | %(g) | |
Net investment income | | | 2.45 | % | | | 2.61 | %(d) | | | 2.77 | % | | | 3.51 | % | | | 3.98 | % | | | 3.78 | % | |
Supplemental data | |
Net assets, end of period (in thousands) | | $ | 20,710 | | | $ | 21,157 | | | $ | 21,839 | | | $ | 20,406 | | | $ | 16,275 | | | $ | 13,598 | | |
Portfolio turnover | | | 38 | % | | | 55 | % | | | 87 | % | | | 34 | % | | | 52 | % | | | 20 | % | |
Notes to Financial Highlights
(a) For the period from April 1, 2011 to January 31, 2012. During the period, the Fund's fiscal year end was changed from March 31 to January 31.
(b) In addition to the fees and expenses which the Fund bears directly, the Fund indirectly bears a pro rata share of the fees and expenses of the underlying funds in which it invests. Such indirect expenses are not included in the reported expense ratios.
(c) Certain line items from prior years have been reclassified to conform to the current presentation.
(d) Annualized.
(e) Ratios include line of credit interest expense which rounds to less than 0.01%.
(f) Total net expenses include the impact of certain waivers/reimbursements made by the Investment Manager and certain of its affiliates, if applicable.
(g) The benefits derived from expense reductions had an impact of less than 0.01%.
The accompanying Notes to Financial Statements are an integral part of this statement.
Annual Report 2013
85
Columbia Capital Allocation Portfolios
Financial Highlights
Columbia Capital Allocation Moderate Portfolio
| | | Year Ended January 31, | |
Class A | | 2013 | | 2012 | | 2011 | | 2010 | | 2009 | |
Per share data | |
Net asset value, beginning of period | | $ | 10.75 | | | $ | 10.71 | | | $ | 9.46 | | | $ | 7.58 | | | $ | 10.46 | | |
Income from investment operations: | |
Net investment income | | | 0.22 | | | | 0.23 | | | | 0.23 | | | | 0.23 | | | | 0.30 | | |
Net realized and unrealized gain (loss) | | | 0.93 | | | | 0.06 | | | | 1.29 | | | | 1.90 | | | | (2.93 | ) | |
Total from investment operations | | | 1.15 | | | | 0.29 | | | | 1.52 | | | | 2.13 | | | | (2.63 | ) | |
Less distributions to shareholders: | |
Net investment income | | | (0.29 | ) | | | (0.25 | ) | | | (0.27 | ) | | | (0.25 | ) | | | (0.23 | ) | |
Net realized gains | | | — | | | | — | | | | — | | | | — | | | | (0.02 | ) | |
Total distributions to shareholders | | | (0.29 | ) | | | (0.25 | ) | | | (0.27 | ) | | | (0.25 | ) | | | (0.25 | ) | |
Net asset value, end of period | | $ | 11.61 | | | $ | 10.75 | | | $ | 10.71 | | | $ | 9.46 | | | $ | 7.58 | | |
Total return | | | 10.87 | % | | | 2.84 | % | | | 16.23 | % | | | 28.49 | % | | | (25.51 | %) | |
Ratios to average net assets(a) | |
Total gross expenses | | | 0.46 | % | | | 0.43 | % | | | 0.43 | % | | | 0.45 | % | | | 0.43 | % | |
Total net expenses(b) | | | 0.46 | %(c) | | | 0.43 | %(c) | | | 0.43 | % | | | 0.45 | % | | | 0.43 | % | |
Net investment income | | | 1.98 | % | | | 2.11 | % | | | 2.32 | % | | | 2.63 | % | | | 3.19 | % | |
Supplemental data | |
Net assets, end of period (in thousands) | | $ | 1,331,311 | | | $ | 1,215,462 | | | $ | 1,164,732 | | | $ | 936,670 | | | $ | 664,054 | | |
Portfolio turnover | | | 23 | % | | | 58 | % | | | 9 | % | | | 26 | % | | | 34 | % | |
Notes to Financial Highlights
(a) In addition to the fees and expenses which the Fund bears directly, the Fund indirectly bears a pro rata share of the fees and expenses of the underlying funds in which the Fund invests. Such indirect expenses are not included in the reported expense ratios.
(b) Total net expenses include the impact of certain waivers/reimbursements made by the Investment Manager and certain of its affiliates, if applicable.
(c) The benefits derived from expense reductions had an impact of less than 0.01%.
The accompanying Notes to Financial Statements are an integral part of this statement.
Annual Report 2013
86
Columbia Capital Allocation Portfolios
Financial Highlights (continued)
Columbia Capital Allocation Moderate Portfolio
| | | Year Ended January 31, | |
Class B | | 2013 | | 2012 | | 2011 | | 2010 | | 2009 | |
Per share data | |
Net asset value, beginning of period | | $ | 10.70 | | | $ | 10.66 | | | $ | 9.41 | | | $ | 7.54 | | | $ | 10.41 | | |
Income from investment operations: | |
Net investment income | | | 0.13 | | | | 0.14 | | | | 0.15 | | | | 0.15 | | | | 0.22 | | |
Net realized and unrealized gain (loss) | | | 0.93 | | | | 0.07 | | | | 1.29 | | | | 1.91 | | | | (2.91 | ) | |
Total from investment operations | | | 1.06 | | | | 0.21 | | | | 1.44 | | | | 2.06 | | | | (2.69 | ) | |
Less distributions to shareholders: | |
Net investment income | | | (0.21 | ) | | | (0.17 | ) | | | (0.19 | ) | | | (0.19 | ) | | | (0.16 | ) | |
Net realized gains | | | — | | | | — | | | | — | | | | — | | | | (0.02 | ) | |
Total distributions to shareholders | | | (0.21 | ) | | | (0.17 | ) | | | (0.19 | ) | | | (0.19 | ) | | | (0.18 | ) | |
Net asset value, end of period | | $ | 11.55 | | | $ | 10.70 | | | $ | 10.66 | | | $ | 9.41 | | | $ | 7.54 | | |
Total return | | | 9.99 | % | | | 2.03 | % | | | 15.43 | % | | | 27.54 | % | | | (26.12 | %) | |
Ratios to average net assets(a) | |
Total gross expenses | | | 1.20 | % | | | 1.18 | % | | | 1.19 | % | | | 1.21 | % | | | 1.19 | % | |
Total net expenses(b) | | | 1.20 | %(c) | | | 1.18 | %(c) | | | 1.19 | % | | | 1.21 | % | | | 1.19 | % | |
Net investment income | | | 1.17 | % | | | 1.32 | % | | | 1.47 | % | | | 1.79 | % | | | 2.32 | % | |
Supplemental data | |
Net assets, end of period (in thousands) | | $ | 94,225 | | | $ | 117,235 | | | $ | 153,336 | | | $ | 163,375 | | | $ | 144,798 | | |
Portfolio turnover | | | 23 | % | | | 58 | % | | | 9 | % | | | 26 | % | | | 34 | % | |
Notes to Financial Highlights
(a) In addition to the fees and expenses which the Fund bears directly, the Fund indirectly bears a pro rata share of the fees and expenses of the underlying funds in which the Fund invests. Such indirect expenses are not included in the reported expense ratios.
(b) Total net expenses include the impact of certain waivers/reimbursements made by the Investment Manager and certain of its affiliates, if applicable.
(c) The benefits derived from expense reductions had an impact of less than 0.01%.
The accompanying Notes to Financial Statements are an integral part of this statement.
Annual Report 2013
87
Columbia Capital Allocation Portfolios
Financial Highlights (continued)
Columbia Capital Allocation Moderate Portfolio
| | | Year Ended January 31, | |
Class C | | 2013 | | 2012 | | 2011 | | 2010 | | 2009 | |
Per share data | |
Net asset value, beginning of period | | $ | 10.69 | | | $ | 10.65 | | | $ | 9.41 | | | $ | 7.55 | | | $ | 10.41 | | |
Income from investment operations: | |
Net investment income | | | 0.14 | | | | 0.15 | | | | 0.16 | | | | 0.17 | | | | 0.23 | | |
Net realized and unrealized gain (loss) | | | 0.91 | | | | 0.07 | | | | 1.28 | | | | 1.88 | | | | (2.91 | ) | |
Total from investment operations | | | 1.05 | | | | 0.22 | | | | 1.44 | | | | 2.05 | | | | (2.68 | ) | |
Less distributions to shareholders: | |
Net investment income | | | (0.21 | ) | | | (0.18 | ) | | | (0.20 | ) | | | (0.19 | ) | | | (0.16 | ) | |
Net realized gains | | | — | | | | — | | | | — | | | | — | | | | (0.02 | ) | |
Total distributions to shareholders | | | (0.21 | ) | | | (0.18 | ) | | | (0.20 | ) | | | (0.19 | ) | | | (0.18 | ) | |
Net asset value, end of period | | $ | 11.53 | | | $ | 10.69 | | | $ | 10.65 | | | $ | 9.41 | | | $ | 7.55 | | |
Total return | | | 9.95 | % | | | 2.10 | % | | | 15.40 | % | | | 27.45 | % | | | (25.99 | %) | |
Ratios to average net assets(a) | |
Total gross expenses | | | 1.21 | % | | | 1.18 | % | | | 1.19 | % | | | 1.20 | % | | | 1.19 | % | |
Total net expenses(b) | | | 1.21 | %(c) | | | 1.18 | %(c) | | | 1.19 | % | | | 1.20 | % | | | 1.19 | % | |
Net investment income | | | 1.25 | % | | | 1.38 | % | | | 1.62 | % | | | 1.92 | % | | | 2.45 | % | |
Supplemental data | |
Net assets, end of period (in thousands) | | $ | 132,770 | | | $ | 107,827 | | | $ | 90,001 | | | $ | 60,533 | | | $ | 33,449 | | |
Portfolio turnover | | | 23 | % | | | 58 | % | | | 9 | % | | | 26 | % | | | 34 | % | |
Notes to Financial Highlights
(a) In addition to the fees and expenses which the Fund bears directly, the Fund indirectly bears a pro rata share of the fees and expenses of the underlying funds in which the Fund invests. Such indirect expenses are not included in the reported expense ratios.
(b) Total net expenses include the impact of certain waivers/reimbursements made by the Investment Manager and certain of its affiliates, if applicable.
(c) The benefits derived from expense reductions had an impact of less than 0.01%.
The accompanying Notes to Financial Statements are an integral part of this statement.
Annual Report 2013
88
Columbia Capital Allocation Portfolios
Financial Highlights (continued)
Columbia Capital Allocation Moderate Portfolio
| | | Year Ended January 31, | |
Class K(a) | | 2013 | | 2012 | | 2011 | | 2010 | | 2009 | |
Per share data | |
Net asset value, beginning of period | | $ | 10.74 | | | $ | 10.70 | | | $ | 9.45 | | | $ | 7.57 | | | $ | 10.45 | | |
Income from investment operations: | |
Net investment income | | | 0.21 | | | | 0.23 | | | | 0.27 | | | | 0.26 | | | | 0.33 | | |
Net realized and unrealized gain (loss) | | | 0.95 | | | | 0.08 | | | | 1.26 | | | | 1.88 | | | | (2.92 | ) | |
Total from investment operations | | | 1.16 | | | | 0.31 | | | | 1.53 | | | | 2.14 | | | | (2.59 | ) | |
Less distributions to shareholders: | |
Net investment income | | | (0.30 | ) | | | (0.27 | ) | | | (0.28 | ) | | | (0.26 | ) | | | (0.27 | ) | |
Net realized gains | | | — | | | | — | | | | — | | | | — | | | | (0.02 | ) | |
Total distributions to shareholders | | | (0.30 | ) | | | (0.27 | ) | | | (0.28 | ) | | | (0.26 | ) | | | (0.29 | ) | |
Net asset value, end of period | | $ | 11.60 | | | $ | 10.74 | | | $ | 10.70 | | | $ | 9.45 | | | $ | 7.57 | | |
Total return | | | 10.94 | % | | | 2.94 | % | | | 16.38 | % | | | 28.70 | % | | | (25.22 | %) | |
Ratios to average net assets(b) | |
Total gross expenses | | | 0.34 | % | | | 0.34 | % | | | 0.33 | % | | | 0.35 | % | | | 0.35 | % | |
Total net expenses(c) | | | 0.34 | % | | | 0.34 | % | | | 0.33 | % | | | 0.35 | % | | | 0.06 | % | |
Net investment income | | | 1.93 | % | | | 2.18 | % | | | 2.66 | % | | | 2.96 | % | | | 3.50 | % | |
Supplemental data | |
Net assets, end of period (in thousands) | | $ | 298 | | | $ | 748 | | | $ | 760 | | | $ | 221 | | | $ | 78 | | |
Portfolio turnover | | | 23 | % | | | 58 | % | | | 9 | % | | | 26 | % | | | 34 | % | |
Notes to Financial Highlights
(a) Effective October 25, 2012, Class R4 shares were renamed Class K shares.
(b) In addition to the fees and expenses which the Fund bears directly, the Fund indirectly bears a pro rata share of the fees and expenses of the underlying funds in which the Fund invests. Such indirect expenses are not included in the reported expense ratios.
(c) Total net expenses include the impact of certain waivers/reimbursements made by the Investment Manager and certain of its affiliates, if applicable.
The accompanying Notes to Financial Statements are an integral part of this statement.
Annual Report 2013
89
Columbia Capital Allocation Portfolios
Financial Highlights (continued)
Columbia Capital Allocation Moderate Portfolio
| | | Year Ended January 31, | |
Class R | | 2013 | | 2012 | | 2011(a) | |
Per share data | |
Net asset value, beginning of period | | $ | 10.74 | | | $ | 10.70 | | | $ | 10.10 | | |
Income from investment operations: | |
Net investment income | | | 0.18 | | | | 0.30 | | | | 0.11 | | |
Net realized and unrealized gain (loss) | | | 0.93 | | | | (0.02 | ) | | | 0.60 | | |
Total from investment operations | | | 1.11 | | | | 0.28 | | | | 0.71 | | |
Less distributions to shareholders: | |
Net investment income | | | (0.27 | ) | | | (0.24 | ) | | | (0.11 | ) | |
Total distributions to shareholders | | | (0.27 | ) | | | (0.24 | ) | | | (0.11 | ) | |
Net asset value, end of period | | $ | 11.58 | | | $ | 10.74 | | | $ | 10.70 | | |
Total return | | | 10.46 | % | | | 2.66 | % | | | 7.06 | % | |
Ratios to average net assets(b) | |
Total gross expenses | | | 0.70 | % | | | 0.71 | % | | | 0.67 | %(c) | |
Total net expenses(d) | | | 0.70 | %(e) | | | 0.71 | % | | | 0.67 | %(c) | |
Net investment income | | | 1.67 | % | | | 2.93 | % | | | 3.18 | %(c) | |
Supplemental data | |
Net assets, end of period (in thousands) | | $ | 138 | | | $ | 60 | | | $ | 3 | | |
Portfolio turnover | | | 23 | % | | | 58 | % | | | 9 | % | |
Notes to Financial Highlights
(a) For the period from September 27, 2010 (commencement of operations) to January 31, 2011.
(b) In addition to the fees and expenses which the Fund bears directly, the Fund indirectly bears a pro rata share of the fees and expenses of the underlying funds in which the Fund invests. Such indirect expenses are not included in the reported expense ratios.
(c) Annualized.
(d) Total net expenses include the impact of certain waivers/reimbursements made by the Investment Manager and certain of its affiliates, if applicable.
(e) The benefits derived from expense reductions had an impact of less than 0.01%.
The accompanying Notes to Financial Statements are an integral part of this statement.
Annual Report 2013
90
Columbia Capital Allocation Portfolios
Financial Highlights (continued)
Columbia Capital Allocation Moderate Portfolio
| | | Year Ended January 31, | |
Class Z | | 2013 | | 2012 | | 2011(a) | |
Per share data | |
Net asset value, beginning of period | | $ | 10.75 | | | $ | 10.71 | | | $ | 10.10 | | |
Income from investment operations: | |
Net investment income | | | 0.28 | | | | 0.26 | | | | 0.16 | | |
Net realized and unrealized gain | | | 0.88 | | | | 0.07 | | | | 0.58 | | |
Total from investment operations | | | 1.16 | | | | 0.33 | | | | 0.74 | | |
Less distributions to shareholders: | |
Net investment income | | | (0.32 | ) | | | (0.29 | ) | | | (0.13 | ) | |
Total distributions to shareholders | | | (0.32 | ) | | | (0.29 | ) | | | (0.13 | ) | |
Net asset value, end of period | | $ | 11.59 | | | $ | 10.75 | | | $ | 10.71 | | |
Total return | | | 10.98 | % | | | 3.15 | % | | | 7.31 | % | |
Ratios to average net assets(b) | |
Total gross expenses | | | 0.22 | % | | | 0.19 | % | | | 0.11 | %(c) | |
Total net expenses(d) | | | 0.22 | %(e) | | | 0.19 | %(e) | | | 0.11 | %(c) | |
Net investment income | | | 2.54 | % | | | 2.49 | % | | | 4.32 | %(c) | |
Supplemental data | |
Net assets, end of period (in thousands) | | $ | 2,544 | | | $ | 836 | | | $ | 7 | | |
Portfolio turnover | | | 23 | % | | | 58 | % | | | 9 | % | |
Notes to Financial Highlights
(a) For the period from September 27, 2010 (commencement of operations) to January 31, 2011.
(b) In addition to the fees and expenses which the Fund bears directly, the Fund indirectly bears a pro rata share of the fees and expenses of the underlying funds in which the Fund invests. Such indirect expenses are not included in the reported expense ratios.
(c) Annualized.
(d) Total net expenses include the impact of certain waivers/reimbursements made by the Investment Manager and certain of its affiliates, if applicable.
(e) The benefits derived from expense reductions had an impact of less than 0.01%.
The accompanying Notes to Financial Statements are an integral part of this statement.
Annual Report 2013
91
Columbia Capital Allocation Portfolios
Financial Highlights
Columbia Capital Allocation Moderate Aggressive Portfolio
| | | Year Ended January 31, | | Year Ended March 31, | |
Class A | | 2013 | | 2012(a) | | 2011 | | 2010 | | 2009 | | 2008 | |
Per share data | |
Net asset value, beginning of period | | $ | 11.30 | | | $ | 11.61 | | | $ | 10.23 | | | $ | 7.33 | | | $ | 11.36 | | | $ | 12.38 | | |
Income from investment operations: | |
Net investment income | | | 0.18 | | | | 0.15 | | | | 0.19 | | | | 0.23 | | | | 0.22 | | | | 0.25 | | |
Net realized and unrealized gain (loss) | | | 1.07 | | | | (0.30 | ) | | | 1.37 | | | | 2.89 | | | | (2.91 | ) | | | (0.45 | ) | |
Total from investment operations | | | 1.25 | | | | (0.15 | ) | | | 1.56 | | | | 3.12 | | | | (2.69 | ) | | | (0.20 | ) | |
Less distributions to shareholders: | |
Net investment income | | | (0.22 | ) | | | (0.14 | ) | | | (0.18 | ) | | | (0.22 | ) | | | (0.22 | ) | | | (0.25 | ) | |
Net realized gains | | | (0.29 | ) | | | (0.02 | ) | | | — | | | | — | | | | (1.12 | ) | | | (0.57 | ) | |
Total distributions to shareholders | | | (0.51 | ) | | | (0.16 | ) | | | (0.18 | ) | | | (0.22 | ) | | | (1.34 | ) | | | (0.82 | ) | |
Proceeds from regulatory settlements | | | — | | | | 0.00 | (b) | | | — | | | | — | | | | — | | | | — | | |
Net asset value, end of period | | $ | 12.04 | | | $ | 11.30 | | | $ | 11.61 | | | $ | 10.23 | | | $ | 7.33 | | | $ | 11.36 | | |
Total return | | | 11.28 | % | | | (1.20 | %) | | | 15.48 | % | | | 42.94 | % | | | (26.48 | %) | | | (1.99 | %) | |
Ratios to average net assets(c)(d) | |
Total gross expenses | | | 0.53 | % | | | 0.51 | %(e)(f) | | | 0.50 | %(f) | | | 0.50 | % | | | 0.50 | % | | | 0.50 | % | |
Total net expenses(g) | | | 0.53 | %(h) | | | 0.51 | %(e)(f)(h) | | | 0.50 | %(f) | | | 0.50 | % | | | 0.50 | %(h) | | | 0.50 | %(h) | |
Net investment income | | | 1.51 | % | | | 1.60 | %(e) | | | 1.75 | % | | | 2.45 | % | | | 2.44 | % | | | 2.05 | % | |
Supplemental data | |
Net assets, end of period (in thousands) | | $ | 679,109 | | | $ | 665,859 | | | $ | 291,758 | | | $ | 245,327 | | | $ | 170,155 | | | $ | 275,576 | | |
Portfolio turnover | | | 34 | % | | | 42 | % | | | 68 | % | | | 27 | % | | | 47 | % | | | 18 | % | |
Notes to Financial Highlights
(a) For the period from April 1, 2011 to January 31, 2012. During the period, the Fund's fiscal year end was changed from March 31 to January 31.
(b) Rounds to zero.
(c) In addition to the fees and expenses which the Fund bears directly, the Fund indirectly bears a pro rata share of the fees and expenses of the underlying funds in which it invests. Such indirect expenses are not included in the reported expense ratios.
(d) Certain line items from prior years have been reclassified to conform to the current presentation.
(e) Annualized.
(f) Ratios include line of credit interest expense which rounds to less than 0.01%.
(g) Total net expenses include the impact of certain waivers/reimbursements made by the Investment Manager and certain of its affiliates, if applicable.
(h) The benefits derived from expense reductions had an impact of less than 0.01%.
The accompanying Notes to Financial Statements are an integral part of this statement.
Annual Report 2013
92
Columbia Capital Allocation Portfolios
Financial Highlights (continued)
Columbia Capital Allocation Moderate Aggressive Portfolio
| | | Year Ended January 31, | | Year Ended March 31, | |
Class B | | 2013 | | 2012(a) | | 2011 | | 2010 | | 2009 | | 2008 | |
Per share data | |
Net asset value, beginning of period | | $ | 11.21 | | | $ | 11.53 | | | $ | 10.16 | | | $ | 7.29 | | | $ | 11.30 | | | $ | 12.31 | | |
Income from investment operations: | |
Net investment income | | | 0.07 | | | | 0.07 | | | | 0.10 | | | | 0.16 | | | | 0.15 | | | | 0.16 | | |
Net realized and unrealized gain (loss) | | | 1.08 | | | | (0.29 | ) | | | 1.37 | | | | 2.87 | | | | (2.89 | ) | | | (0.44 | ) | |
Total from investment operations | | | 1.15 | | | | (0.22 | ) | | | 1.47 | | | | 3.03 | | | | (2.74 | ) | | | (0.28 | ) | |
Less distributions to shareholders: | |
Net investment income | | | (0.13 | ) | | | (0.08 | ) | | | (0.10 | ) | | | (0.16 | ) | | | (0.15 | ) | | | (0.16 | ) | |
Net realized gains | | | (0.29 | ) | | | (0.02 | ) | | | — | | | | — | | | | (1.12 | ) | | | (0.57 | ) | |
Total distributions to shareholders | | | (0.42 | ) | | | (0.10 | ) | | | (0.10 | ) | | | (0.16 | ) | | | (1.27 | ) | | | (0.73 | ) | |
Proceeds from regulatory settlements | | | — | | | | 0.00 | (b) | | | — | | | | — | | | | — | | | | — | | |
Net asset value, end of period | | $ | 11.94 | | | $ | 11.21 | | | $ | 11.53 | | | $ | 10.16 | | | $ | 7.29 | | | $ | 11.30 | | |
Total return | | | 10.45 | % | | | (1.87 | %) | | | 14.63 | % | | | 41.72 | % | | | (27.01 | %) | | | (2.66 | %) | |
Ratios to average net assets(c)(d) | |
Total gross expenses | | | 1.27 | % | | | 1.26 | %(e)(f) | | | 1.25 | %(f) | | | 1.25 | % | | | 1.25 | % | | | 1.25 | % | |
Total net expenses(g) | | | 1.27 | %(h) | | | 1.26 | %(e)(f)(h) | | | 1.25 | %(f) | | | 1.25 | % | | | 1.25 | %(h) | | | 1.25 | %(h) | |
Net investment income | | | 0.65 | % | | | 0.75 | %(e) | | | 0.99 | % | | | 1.70 | % | | | 1.67 | % | | | 1.28 | % | |
Supplemental data | |
Net assets, end of period (in thousands) | | $ | 53,009 | | | $ | 85,005 | | | $ | 133,770 | | | $ | 181,026 | | | $ | 156,679 | | | $ | 282,912 | | |
Portfolio turnover | | | 34 | % | | | 42 | % | | | 68 | % | | | 27 | % | | | 47 | % | | | 18 | % | |
Notes to Financial Highlights
(a) For the period from April 1, 2011 to January 31, 2012. During the period, the Fund's fiscal year end was changed from March 31 to January 31.
(b) Rounds to zero.
(c) In addition to the fees and expenses which the Fund bears directly, the Fund indirectly bears a pro rata share of the fees and expenses of the underlying funds in which it invests. Such indirect expenses are not included in the reported expense ratios.
(d) Certain line items from prior years have been reclassified to conform to the current presentation.
(e) Annualized.
(f) Ratios include line of credit interest expense which rounds to less than 0.01%.
(g) Total net expenses include the impact of certain waivers/reimbursements made by the Investment Manager and certain of its affiliates, if applicable.
(h) The benefits derived from expense reductions had an impact of less than 0.01%.
The accompanying Notes to Financial Statements are an integral part of this statement.
Annual Report 2013
93
Columbia Capital Allocation Portfolios
Financial Highlights (continued)
Columbia Capital Allocation Moderate Aggressive Portfolio
| | | Year Ended January 31, | | Year Ended March 31, | |
Class C | | 2013 | | 2012(a) | | 2011 | | 2010 | | 2009 | | 2008 | |
Per share data | |
Net asset value, beginning of period | | $ | 11.36 | | | $ | 11.68 | | | $ | 10.29 | | | $ | 7.38 | | | $ | 11.43 | | | $ | 12.44 | | |
Income from investment operations: | |
Net investment income | | | 0.09 | | | | 0.08 | | | | 0.11 | | | | 0.16 | | | | 0.15 | | | | 0.16 | | |
Net realized and unrealized gain (loss) | | | 1.08 | | | | (0.30 | ) | | | 1.38 | | | | 2.91 | | | | (2.93 | ) | | | (0.44 | ) | |
Total from investment operations | | | 1.17 | | | | (0.22 | ) | | | 1.49 | | | | 3.07 | | | | (2.78 | ) | | | (0.28 | ) | |
Less distributions to shareholders: | |
Net investment income | | | (0.13 | ) | | | (0.08 | ) | | | (0.10 | ) | | | (0.16 | ) | | | (0.15 | ) | | | (0.16 | ) | |
Net realized gains | | | (0.29 | ) | | | (0.02 | ) | | | — | | | | — | | | | (1.12 | ) | | | (0.57 | ) | |
Total distributions to shareholders | | | (0.42 | ) | | | (0.10 | ) | | | (0.10 | ) | | | (0.16 | ) | | | (1.27 | ) | | | (0.73 | ) | |
Proceeds from regulatory settlements | | | — | | | | 0.00 | (b) | | | — | | | | — | | | | — | | | | — | | |
Net asset value, end of period | | $ | 12.11 | | | $ | 11.36 | | | $ | 11.68 | | | $ | 10.29 | | | $ | 7.38 | | | $ | 11.43 | | |
Total return | | | 10.49 | % | | | (1.85 | %) | | | 14.64 | % | | | 41.76 | % | | | (27.05 | %) | | | (2.63 | %) | |
Ratios to average net assets(c)(d) | |
Total gross expenses | | | 1.28 | % | | | 1.26 | %(e)(f) | | | 1.25 | %(f) | | | 1.25 | % | | | 1.25 | % | | | 1.25 | % | |
Total net expenses(g) | | | 1.28 | %(h) | | | 1.26 | %(e)(f)(h) | | | 1.25 | %(f) | | | 1.25 | % | | | 1.25 | %(h) | | | 1.25 | %(h) | |
Net investment income | | | 0.75 | % | | | 0.81 | %(e) | | | 1.00 | % | | | 1.70 | % | | | 1.67 | % | | | 1.30 | % | |
Supplemental data | |
Net assets, end of period (in thousands) | | $ | 84,349 | | | $ | 86,321 | | | $ | 91,556 | | | $ | 87,496 | | | $ | 64,940 | | | $ | 112,902 | | |
Portfolio turnover | | | 34 | % | | | 42 | % | | | 68 | % | | | 27 | % | | | 47 | % | | | 18 | % | |
Notes to Financial Highlights
(a) For the period from April 1, 2011 to January 31, 2012. During the period, the Fund's fiscal year end was changed from March 31 to January 31.
(b) Rounds to zero.
(c) In addition to the fees and expenses which the Fund bears directly, the Fund indirectly bears a pro rata share of the fees and expenses of the underlying funds in which it invests. Such indirect expenses are not included in the reported expense ratios.
(d) Certain line items from prior years have been reclassified to conform to the current presentation.
(e) Annualized.
(f) Ratios include line of credit interest expense which rounds to less than 0.01%.
(g) Total net expenses include the impact of certain waivers/reimbursements made by the Investment Manager and certain of its affiliates, if applicable.
(h) The benefits derived from expense reductions had an impact of less than 0.01%.
The accompanying Notes to Financial Statements are an integral part of this statement.
Annual Report 2013
94
Columbia Capital Allocation Portfolios
Financial Highlights (continued)
Columbia Capital Allocation Moderate Aggressive Portfolio
| | | Year Ended January 31, | | Year Ended March 31, | |
Class R | | 2013 | | 2012(a) | | 2011 | | 2010 | | 2009 | | 2008 | |
Per share data | |
Net asset value, beginning of period | | $ | 11.29 | | | $ | 11.60 | | | $ | 10.22 | | | $ | 7.33 | | | $ | 11.36 | | | $ | 12.37 | | |
Income from investment operations: | |
Net investment income | | | 0.15 | | | | 0.13 | | | | 0.16 | | | | 0.20 | | | | 0.22 | | | | 0.21 | | |
Net realized and unrealized gain (loss) | | | 1.07 | | | | (0.30 | ) | | | 1.38 | | | | 2.89 | | | | (2.94 | ) | | | (0.43 | ) | |
Total from investment operations | | | 1.22 | | | | (0.17 | ) | | | 1.54 | | | | 3.09 | | | | (2.72 | ) | | | (0.22 | ) | |
Less distributions to shareholders: | |
Net investment income | | | (0.19 | ) | | | (0.12 | ) | | | (0.16 | ) | | | (0.20 | ) | | | (0.19 | ) | | | (0.22 | ) | |
Net realized gains | | | (0.29 | ) | | | (0.02 | ) | | | — | | | | — | | | | (1.12 | ) | | | (0.57 | ) | |
Total distributions to shareholders | | | (0.48 | ) | | | (0.14 | ) | | | (0.16 | ) | | | (0.20 | ) | | | (1.31 | ) | | | (0.79 | ) | |
Proceeds from regulatory settlements | | | — | | | | 0.00 | (b) | | | — | | | | — | | | | — | | | | — | | |
Net asset value, end of period | | $ | 12.03 | | | $ | 11.29 | | | $ | 11.60 | | | $ | 10.22 | | | $ | 7.33 | | | $ | 11.36 | | |
Total return | | | 11.01 | % | | | (1.39 | %) | | | 15.21 | % | | | 42.46 | % | | | (26.67 | %) | | | (2.15 | %) | |
Ratios to average net assets(c)(d) | |
Total gross expenses | | | 0.78 | % | | | 0.77 | %(e)(f) | | | 0.75 | %(f) | | | 0.75 | % | | | 0.75 | % | | | 0.75 | % | |
Total net expenses(g) | | | 0.78 | %(h) | | | 0.77 | %(e)(f)(h) | | | 0.75 | %(f) | | | 0.75 | % | | | 0.75 | %(h) | | | 0.75 | %(h) | |
Net investment income | | | 1.26 | % | | | 1.40 | %(e) | | | 1.54 | % | | | 2.16 | % | | | 2.48 | % | | | 1.69 | % | |
Supplemental data | |
Net assets, end of period (in thousands) | | $ | 4,664 | | | $ | 3,908 | | | $ | 1,517 | | | $ | 1,740 | | | $ | 1,666 | | | $ | 1,257 | | |
Portfolio turnover | | | 34 | % | | | 42 | % | | | 68 | % | | | 27 | % | | | 47 | % | | | 18 | % | |
Notes to Financial Highlights
(a) For the period from April 1, 2011 to January 31, 2012. During the period, the Fund's fiscal year end was changed from March 31 to January 31.
(b) Rounds to zero.
(c) In addition to the fees and expenses which the Fund bears directly, the Fund indirectly bears a pro rata share of the fees and expenses of the underlying funds in which it invests. Such indirect expenses are not included in the reported expense ratios.
(d) Certain line items from prior years have been reclassified to conform to the current presentation.
(e) Annualized.
(f) Ratios include line of credit interest expense which rounds to less than 0.01%.
(g) Total net expenses include the impact of certain waivers/reimbursements made by the Investment Manager and certain of its affiliates, if applicable.
(h) The benefits derived from expense reductions had an impact of less than 0.01%.
The accompanying Notes to Financial Statements are an integral part of this statement.
Annual Report 2013
95
Columbia Capital Allocation Portfolios
Financial Highlights (continued)
Columbia Capital Allocation Moderate Aggressive Portfolio
Class R4 | | Year Ended
January 31,
2013(a) | |
Per share data | |
Net asset value, beginning of period | | $ | 11.71 | | |
Income from investment operations: | |
Net investment income | | | 0.11 | | |
Net realized and unrealized gain | | | 0.65 | | |
Total from investment operations | | | 0.76 | | |
Less distributions to shareholders: | |
Net investment income | | | (0.14 | ) | |
Net realized gains | | | (0.22 | ) | |
Total distributions to shareholders | | | (0.36 | ) | |
Net asset value, end of period | | $ | 12.11 | | |
Total return | | | 6.60 | % | |
Ratios to average net assets(b) | |
Total gross expenses | | | 0.24 | %(c) | |
Total net expenses(d) | | | 0.24 | %(c) | |
Net investment income | | | 3.98 | %(c) | |
Supplemental data | |
Net assets, end of period (in thousands) | | $ | 3 | | |
Portfolio turnover | | | 34 | % | |
Notes to Financial Highlights
(a) For the period from November 8, 2012 (commencement of operations) to January 31, 2013.
(b) In addition to the fees and expenses which the Fund bears directly, the Fund indirectly bears a pro rata share of the fees and expenses of the underlying funds in which it invests. Such indirect expenses are not included in the reported expense ratios.
(c) Annualized.
(d) Total net expenses include the impact of certain waivers/reimbursements made by the Investment Manager and certain of its affiliates, if applicable.
The accompanying Notes to Financial Statements are an integral part of this statement.
Annual Report 2013
96
Columbia Capital Allocation Portfolios
Financial Highlights (continued)
Columbia Capital Allocation Moderate Aggressive Portfolio
Class R5 | | Year Ended
January 31,
2013(a) | |
Per share data | |
Net asset value, beginning of period | | $ | 11.71 | | |
Income from investment operations: | |
Net investment income | | | 0.11 | | |
Net realized and unrealized gain | | | 0.66 | | |
Total from investment operations | | | 0.77 | | |
Less distributions to shareholders: | |
Net investment income | | | (0.15 | ) | |
Net realized gains | | | (0.22 | ) | |
Total distributions to shareholders | | | (0.37 | ) | |
Net asset value, end of period | | $ | 12.11 | | |
Total return | | | 6.64 | % | |
Ratios to average net assets(b) | |
Total gross expenses | | | 0.12 | %(c) | |
Total net expenses(d) | | | 0.12 | %(c) | |
Net investment income | | | 4.10 | %(c) | |
Supplemental data | |
Net assets, end of period (in thousands) | | $ | 3 | | |
Portfolio turnover | | | 34 | % | |
Notes to Financial Highlights
(a) For the period from November 8, 2012 (commencement of operations) to January 31, 2013.
(b) In addition to the fees and expenses which the Fund bears directly, the Fund indirectly bears a pro rata share of the fees and expenses of the underlying funds in which it invests. Such indirect expenses are not included in the reported expense ratios.
(c) Annualized.
(d) Total net expenses include the impact of certain waivers/reimbursements made by the Investment Manager and certain of its affiliates, if applicable.
The accompanying Notes to Financial Statements are an integral part of this statement.
Annual Report 2013
97
Columbia Capital Allocation Portfolios
Financial Highlights (continued)
Columbia Capital Allocation Moderate Aggressive Portfolio
| | |
Year Ended January 31, | | Year Ended
March 31, | |
Class T | | 2013 | | 2012(a) | | 2011(b) | |
Per share data | |
Net asset value, beginning of period | | $ | 11.30 | | | $ | 11.61 | | | $ | 11.49 | | |
Income from investment operations: | |
Net investment income | | | 0.17 | | | | 0.15 | | | | 0.02 | | |
Net realized and unrealized gain (loss) | | | 1.07 | | | | (0.30 | ) | | | 0.13 | | |
Total from investment operations | | | 1.24 | | | | (0.15 | ) | | | 0.15 | | |
Less distributions to shareholders: | |
Net investment income | | | (0.21 | ) | | | (0.14 | ) | | | (0.03 | ) | |
Net realized gains | | | (0.29 | ) | | | (0.02 | ) | | | — | | |
Total distributions to shareholders | | | (0.50 | ) | | | (0.16 | ) | | | (0.03 | ) | |
Proceeds from regulatory settlements | | | — | | | | 0.00 | (c) | | | — | | |
Net asset value, end of period | | $ | 12.04 | | | $ | 11.30 | | | $ | 11.61 | | |
Total return | | | 11.23 | % | | | (1.23 | %) | | | 1.28 | % | |
Ratios to average net assets(d)(e) | |
Total gross expenses | | | 0.58 | % | | | 0.56 | %(f)(g) | | | 0.55 | %(f) | |
Total net expenses(h) | | | 0.58 | %(i) | | | 0.56 | %(f)(g)(i) | | | 0.55 | %(f) | |
Net investment income | | | 1.46 | % | | | 1.58 | %(f) | | | 2.26 | %(f) | |
Supplemental data | |
Net assets, end of period (in thousands) | | $ | 100,955 | | | $ | 102,913 | | | $ | 3 | | |
Portfolio turnover | | | 34 | % | | | 42 | % | | | 68 | % | |
Notes to Financial Highlights
(a) For the period from April 1, 2011 to January 31, 2012. During the period, the Fund's fiscal year end was changed from March 31 to January 31.
(b) For the period from March 1, 2011 (commencement of operations) to March 31, 2011.
(c) Rounds to zero.
(d) In addition to the fees and expenses which the Fund bears directly, the Fund indirectly bears a pro rata share of the fees and expenses of the underlying funds in which it invests. Such indirect expenses are not included in the reported expense ratios.
(e) Certain line items from prior years have been reclassified to conform to the current presentation.
(f) Annualized.
(g) Ratios include line of credit interest expense which rounds to less than 0.01%.
(h) Total net expenses include the impact of certain waivers/reimbursements made by the Investment Manager and certain of its affiliates, if applicable.
(i) The benefits derived from expense reductions had an impact of less than 0.01%.
The accompanying Notes to Financial Statements are an integral part of this statement.
Annual Report 2013
98
Columbia Capital Allocation Portfolios
Financial Highlights (continued)
Columbia Capital Allocation Moderate Aggressive Portfolio
| | | Year Ended January 31, | | Year Ended March 31, | |
Class Z | | 2013 | | 2012(a) | | 2011 | | 2010 | | 2009 | | 2008 | |
Per share data | |
Net asset value, beginning of period | | $ | 11.29 | | | $ | 11.60 | | | $ | 10.21 | | | $ | 7.33 | | | $ | 11.36 | | | $ | 12.35 | | |
Income from investment operations: | |
Net investment income | | | 0.20 | | | | 0.17 | | | | 0.21 | | | | 0.25 | | | | 0.25 | | | | 0.34 | | |
Net realized and unrealized gain (loss) | | | 1.08 | | | | (0.30 | ) | | | 1.39 | | | | 2.88 | | | | (2.92 | ) | | | (0.47 | ) | |
Total from investment operations | | | 1.28 | | | | (0.13 | ) | | | 1.60 | | | | 3.13 | | | | (2.67 | ) | | | (0.13 | ) | |
Less distributions to shareholders: | |
Net investment income | | | (0.25 | ) | | | (0.16 | ) | | | (0.21 | ) | | | (0.25 | ) | | | (0.24 | ) | | | (0.29 | ) | |
Net realized gains | | | (0.29 | ) | | | (0.02 | ) | | | — | | | | — | | | | (1.12 | ) | | | (0.57 | ) | |
Total distributions to shareholders | | | (0.54 | ) | | | (0.18 | ) | | | (0.21 | ) | | | (0.25 | ) | | | (1.36 | ) | | | (0.86 | ) | |
Proceeds from regulatory settlements | | | — | | | | 0.00 | (b) | | | — | | | | — | | | | — | | | | — | | |
Net asset value, end of period | | $ | 12.03 | | | $ | 11.29 | | | $ | 11.60 | | | $ | 10.21 | | | $ | 7.33 | | | $ | 11.36 | | |
Total return | | | 11.57 | % | | | (1.00 | %) | | | 15.89 | % | | | 43.01 | % | | | (26.28 | %) | | | (1.49 | %) | |
Ratios to average net assets(c)(d) | |
Total gross expenses | | | 0.28 | % | | | 0.26 | %(e)(f) | | | 0.25 | %(f) | | | 0.25 | % | | | 0.25 | % | | | 0.25 | % | |
Total net expenses(g) | | | 0.28 | %(h) | | | 0.26 | %(e)(f)(h) | | | 0.25 | %(f) | | | 0.25 | % | | | 0.25 | %(h) | | | 0.25 | %(h) | |
Net investment income | | | 1.72 | % | | | 1.86 | %(e) | | | 2.03 | % | | | 2.69 | % | | | 2.83 | % | | | 2.68 | % | |
Supplemental data | |
Net assets, end of period (in thousands) | | $ | 147,433 | | | $ | 146,805 | | | $ | 56,805 | | | $ | 64,967 | | | $ | 44,020 | | | $ | 46,711 | | |
Portfolio turnover | | | 34 | % | | | 42 | % | | | 68 | % | | | 27 | % | | | 47 | % | | | 18 | % | |
Notes to Financial Highlights
(a) For the period from April 1, 2011 to January 31, 2012. During the period, the Fund's fiscal year end was changed from March 31 to January 31.
(b) Rounds to zero.
(c) In addition to the fees and expenses which the Fund bears directly, the Fund indirectly bears a pro rata share of the fees and expenses of the underlying funds in which it invests. Such indirect expenses are not included in the reported expense ratios.
(d) Certain line items from prior years have been reclassified to conform to the current presentation.
(e) Annualized.
(f) Ratios include line of credit interest expense which rounds to less than 0.01%.
(g) Total net expenses include the impact of certain waivers/reimbursements made by the Investment Manager and certain of its affiliates, if applicable.
(h) The benefits derived from expense reductions had an impact of less than 0.01%.
The accompanying Notes to Financial Statements are an integral part of this statement.
Annual Report 2013
99
Columbia Capital Allocation Portfolios
Financial Highlights
Columbia Capital Allocation Aggressive Portfolio
| | | Year Ended January 31, | |
Class A | | 2013 | | 2012 | | 2011 | | 2010 | | 2009 | |
Per share data | |
Net asset value, beginning of period | | $ | 10.19 | | | $ | 10.28 | | | $ | 8.62 | | | $ | 6.49 | | | $ | 10.46 | | |
Income from investment operations: | |
Net investment income | | | 0.13 | | | | 0.12 | | | | 0.14 | | | | 0.15 | | | | 0.17 | | |
Net realized and unrealized gain (loss) | | | 1.25 | | | | (0.07 | ) | | | 1.69 | | | | 2.14 | | | | (3.98 | ) | |
Total from investment operations | | | 1.38 | | | | 0.05 | | | | 1.83 | | | | 2.29 | | | | (3.81 | ) | |
Less distributions to shareholders: | |
Net investment income | | | (0.16 | ) | | | (0.14 | ) | | | (0.17 | ) | | | (0.16 | ) | | | (0.12 | ) | |
Net realized gains | | | — | | | | — | | | | — | | | | — | | | | (0.04 | ) | |
Total distributions to shareholders | | | (0.16 | ) | | | (0.14 | ) | | | (0.17 | ) | | | (0.16 | ) | | | (0.16 | ) | |
Net asset value, end of period | | $ | 11.41 | | | $ | 10.19 | | | $ | 10.28 | | | $ | 8.62 | | | $ | 6.49 | | |
Total return | | | 13.63 | % | | | 0.60 | % | | | 21.22 | % | | | 35.27 | % | | | (36.52 | %) | |
Ratios to average net assets(a) | |
Total gross expenses | | | 0.52 | % | | | 0.49 | % | | | 0.50 | % | | | 0.53 | % | | | 0.51 | % | |
Total net expenses(b) | | | 0.51 | %(c) | | | 0.49 | %(c) | | | 0.50 | % | | | 0.51 | % | | | 0.50 | % | |
Net investment income | | | 1.25 | % | | | 1.18 | % | | | 1.48 | % | | | 1.92 | % | | | 1.83 | % | |
Supplemental data | |
Net assets, end of period (in thousands) | | $ | 495,722 | | | $ | 472,855 | | | $ | 489,241 | | | $ | 411,906 | | | $ | 294,773 | | |
Portfolio turnover | | | 21 | % | | | 83 | % | | | 10 | % | | | 28 | % | | | 35 | % | |
Notes to Financial Highlights
(a) In addition to the fees and expenses which the Fund bears directly, the Fund indirectly bears a pro rata share of the fees and expenses of the underlying funds in which the Fund invests. Such indirect expenses are not included in the reported expense ratios.
(b) Total net expenses include the impact of certain waivers/reimbursements made by the Investment Manager and certain of its affiliates, if applicable.
(c) The benefits derived from expense reductions had an impact of less than 0.01%.
The accompanying Notes to Financial Statements are an integral part of this statement.
Annual Report 2013
100
Columbia Capital Allocation Portfolios
Financial Highlights (continued)
Columbia Capital Allocation Aggressive Portfolio
| | | Year Ended January 31, | |
Class B | | 2013 | | 2012 | | 2011 | | 2010 | | 2009 | |
Per share data | |
Net asset value, beginning of period | | $ | 10.17 | | | $ | 10.24 | | | $ | 8.57 | | | $ | 6.46 | | | $ | 10.38 | | |
Income from investment operations: | |
Net investment income | | | 0.04 | | | | 0.04 | | | | 0.06 | | | | 0.08 | | | | 0.09 | | |
Net realized and unrealized gain (loss) | | | 1.26 | | | | (0.07 | ) | | | 1.69 | | | | 2.12 | | | | (3.93 | ) | |
Total from investment operations | | | 1.30 | | | | (0.03 | ) | | | 1.75 | | | | 2.20 | | | | (3.84 | ) | |
Less distributions to shareholders: | |
Net investment income | | | (0.06 | ) | | | (0.04 | ) | | | (0.08 | ) | | | (0.09 | ) | | | (0.04 | ) | |
Net realized gains | | | — | | | | — | | | | — | | | | — | | | | (0.04 | ) | |
Total distributions to shareholders | | | (0.06 | ) | | | (0.04 | ) | | | (0.08 | ) | | | (0.09 | ) | | | (0.08 | ) | |
Net asset value, end of period | | $ | 11.41 | | | $ | 10.17 | | | $ | 10.24 | | | $ | 8.57 | | | $ | 6.46 | | |
Total return | | | 12.80 | % | | | (0.22 | %) | | | 20.46 | % | | | 34.10 | % | | | (37.04 | %) | |
Ratios to average net assets(a) | |
Total gross expenses | | | 1.26 | % | | | 1.24 | % | | | 1.26 | % | | | 1.29 | % | | | 1.26 | % | |
Total net expenses(b) | | | 1.26 | %(c) | | | 1.24 | %(c) | | | 1.26 | % | | | 1.27 | % | | | 1.26 | % | |
Net investment income | | | 0.41 | % | | | 0.38 | % | | | 0.62 | % | | | 1.09 | % | | | 0.99 | % | |
Supplemental data | |
Net assets, end of period (in thousands) | | $ | 39,020 | | | $ | 49,003 | | | $ | 66,323 | | | $ | 69,632 | | | $ | 56,864 | | |
Portfolio turnover | | | 21 | % | | | 83 | % | | | 10 | % | | | 28 | % | | | 35 | % | |
Notes to Financial Highlights
(a) In addition to the fees and expenses which the Fund bears directly, the Fund indirectly bears a pro rata share of the fees and expenses of the underlying funds in which the Fund invests. Such indirect expenses are not included in the reported expense ratios.
(b) Total net expenses include the impact of certain waivers/reimbursements made by the Investment Manager and certain of its affiliates, if applicable.
(c) The benefits derived from expense reductions had an impact of less than 0.01%.
The accompanying Notes to Financial Statements are an integral part of this statement.
Annual Report 2013
101
Columbia Capital Allocation Portfolios
Financial Highlights (continued)
Columbia Capital Allocation Aggressive Portfolio
| | | Year Ended January 31, | |
Class C | | 2013 | | 2012 | | 2011 | | 2010 | | 2009 | |
Per share data | |
Net asset value, beginning of period | | $ | 10.04 | | | $ | 10.14 | | | $ | 8.50 | | | $ | 6.42 | | | $ | 10.33 | | |
Income from investment operations: | |
Net investment income | | | 0.05 | | | | 0.04 | | | | 0.07 | | | | 0.11 | | | | 0.10 | | |
Net realized and unrealized gain (loss) | | | 1.24 | | | | (0.07 | ) | | | 1.67 | | | | 2.08 | | | | (3.92 | ) | |
Total from investment operations | | | 1.29 | | | | (0.03 | ) | | | 1.74 | | | | 2.19 | | | | (3.82 | ) | |
Less distributions to shareholders: | |
Net investment income | | | (0.09 | ) | | | (0.07 | ) | | | (0.10 | ) | | | (0.11 | ) | | | (0.05 | ) | |
Net realized gains | | | — | | | | — | | | | — | | | | — | | | | (0.04 | ) | |
Total distributions to shareholders | | | (0.09 | ) | | | (0.07 | ) | | | (0.10 | ) | | | (0.11 | ) | | | (0.09 | ) | |
Net asset value, end of period | | $ | 11.24 | | | $ | 10.04 | | | $ | 10.14 | | | $ | 8.50 | | | $ | 6.42 | | |
Total return | | | 12.86 | % | | | (0.23 | %) | | | 20.45 | % | | | 34.07 | % | | | (37.00 | %) | |
Ratios to average net assets(a) | |
Total gross expenses | | | 1.27 | % | | | 1.24 | % | | | 1.25 | % | | | 1.28 | % | | | 1.26 | % | |
Total net expenses(b) | | | 1.26 | %(c) | | | 1.24 | %(c) | | | 1.25 | % | | | 1.26 | % | | | 1.25 | % | |
Net investment income | | | 0.52 | % | | | 0.44 | % | | | 0.72 | % | | | 1.37 | % | | | 1.09 | % | |
Supplemental data | |
Net assets, end of period (in thousands) | | $ | 38,461 | | | $ | 33,266 | | | $ | 31,772 | | | $ | 26,852 | | | $ | 11,330 | | |
Portfolio turnover | | | 21 | % | | | 83 | % | | | 10 | % | | | 28 | % | | | 35 | % | |
Notes to Financial Highlights
(a) In addition to the fees and expenses which the Fund bears directly, the Fund indirectly bears a pro rata share of the fees and expenses of the underlying funds in which the Fund invests. Such indirect expenses are not included in the reported expense ratios.
(b) Total net expenses include the impact of certain waivers/reimbursements made by the Investment Manager and certain of its affiliates, if applicable.
(c) The benefits derived from expense reductions had an impact of less than 0.01%.
The accompanying Notes to Financial Statements are an integral part of this statement.
Annual Report 2013
102
Columbia Capital Allocation Portfolios
Financial Highlights (continued)
Columbia Capital Allocation Aggressive Portfolio
| | | Year Ended January 31, | |
Class K(a) | | 2013 | | 2012 | | 2011 | | 2010 | | 2009 | |
Per share data | |
Net asset value, beginning of period | | $ | 10.20 | | | $ | 10.30 | | | $ | 8.63 | | | $ | 6.50 | | | $ | 10.48 | | |
Income from investment operations: | |
Net investment income | | | 0.15 | | | | 0.13 | | | | 0.15 | | | | 0.17 | | | | 0.22 | | |
Net realized and unrealized gain (loss) | | | 1.25 | | | | (0.07 | ) | | | 1.70 | | | | 2.13 | | | | (4.01 | ) | |
Total from investment operations | | | 1.40 | | | | 0.06 | | | | 1.85 | | | | 2.30 | | | | (3.79 | ) | |
Less distributions to shareholders: | |
Net investment income | | | (0.17 | ) | | | (0.16 | ) | | | (0.18 | ) | | | (0.17 | ) | | | (0.15 | ) | |
Net realized gains | | | — | | | | — | | | | — | | | | — | | | | (0.04 | ) | |
Total distributions to shareholders | | | (0.17 | ) | | | (0.16 | ) | | | (0.18 | ) | | | (0.17 | ) | | | (0.19 | ) | |
Net asset value, end of period | | $ | 11.43 | | | $ | 10.20 | | | $ | 10.30 | | | $ | 8.63 | | | $ | 6.50 | | |
Total return | | | 13.84 | % | | | 0.64 | % | | | 21.46 | % | | | 35.36 | % | | | (36.20 | %) | |
Ratios to average net assets(b) | |
Total gross expenses | | | 0.37 | % | | | 0.35 | % | | | 0.38 | % | | | 0.36 | % | | | 0.36 | % | |
Total net expenses(c) | | | 0.37 | % | | | 0.35 | % | | | 0.38 | % | | | 0.36 | % | | | 0.11 | % | |
Net investment income | | | 1.37 | % | | | 1.30 | % | | | 1.62 | % | | | 2.13 | % | | | 2.57 | % | |
Supplemental data | |
Net assets, end of period (in thousands) | | $ | 126 | | | $ | 451 | | | $ | 461 | | | $ | 391 | | | $ | 141 | | |
Portfolio turnover | | | 21 | % | | | 83 | % | | | 10 | % | | | 28 | % | | | 35 | % | |
Notes to Financial Highlights
(a) Effective October 25, 2012, Class R4 shares were renamed Class K shares.
(b) In addition to the fees and expenses which the Fund bears directly, the Fund indirectly bears a pro rata share of the fees and expenses of the underlying funds in which the Fund invests. Such indirect expenses are not included in the reported expense ratios.
(c) Total net expenses include the impact of certain waivers/reimbursements made by the Investment Manager and certain of its affiliates, if applicable.
The accompanying Notes to Financial Statements are an integral part of this statement.
Annual Report 2013
103
Columbia Capital Allocation Portfolios
Financial Highlights (continued)
Columbia Capital Allocation Aggressive Portfolio
| | | Year Ended January 31, | |
Class R | | 2013 | | 2012 | | 2011(a) | |
Per share data | |
Net asset value, beginning of period | | $ | 10.16 | | | $ | 10.25 | | | $ | 9.42 | | |
Income from investment operations: | |
Net investment income | | | 0.11 | | | | 0.10 | | | | 0.10 | | |
Net realized and unrealized gain (loss) | | | 1.24 | | | | (0.07 | ) | | | 0.92 | | |
Total from investment operations | | | 1.35 | | | | 0.03 | | | | 1.02 | | |
Less distributions to shareholders: | |
Net investment income | | | (0.16 | ) | | | (0.12 | ) | | | (0.19 | ) | |
Total distributions to shareholders | | | (0.16 | ) | | | (0.12 | ) | | | (0.19 | ) | |
Net asset value, end of period | | $ | 11.35 | | | $ | 10.16 | | | $ | 10.25 | | |
Total return | | | 13.38 | % | | | 0.33 | % | | | 10.87 | % | |
Ratios to average net assets(b) | |
Total gross expenses | | | 0.79 | % | | | 0.70 | % | | | 0.71 | %(c) | |
Total net expenses(d) | | | 0.76 | %(e) | | | 0.70 | % | | | 0.71 | %(c) | |
Net investment income | | | 1.03 | % | | | 0.98 | % | | | 2.91 | %(c) | |
Supplemental data | |
Net assets, end of period (in thousands) | | $ | 182 | | | $ | 3 | | | $ | 3 | | |
Portfolio turnover | | | 21 | % | | | 83 | % | | | 10 | % | |
Notes to Financial Highlights
(a) For the period from September 27, 2010 (commencement of operations) to January 31, 2011.
(b) In addition to the fees and expenses which the Fund bears directly, the Fund indirectly bears a pro rata share of the fees and expenses of the underlying funds in which the Fund invests. Such indirect expenses are not included in the reported expense ratios.
(c) Annualized.
(d) Total net expenses include the impact of certain waivers/reimbursements made by the Investment Manager and certain of its affiliates, if applicable.
(e) The benefits derived from expense reductions had an impact of less than 0.01%.
The accompanying Notes to Financial Statements are an integral part of this statement.
Annual Report 2013
104
Columbia Capital Allocation Portfolios
Financial Highlights (continued)
Columbia Capital Allocation Aggressive Portfolio
| | | Year Ended January 31, | |
Class Z | | 2013 | | 2012 | | 2011(a) | |
Per share data | |
Net asset value, beginning of period | | $ | 10.16 | | | $ | 10.26 | | | $ | 9.42 | | |
Income from investment operations: | |
Net investment income | | | 0.21 | | | | 0.14 | | | | 0.12 | | |
Net realized and unrealized gain (loss) | | | 1.19 | | | | (0.07 | ) | | | 0.92 | | |
Total from investment operations | | | 1.40 | | | | 0.07 | | | | 1.04 | | |
Less distributions to shareholders: | |
Net investment income | | | (0.20 | ) | | | (0.17 | ) | | | (0.20 | ) | |
Total distributions to shareholders | | | (0.20 | ) | | | (0.17 | ) | | | (0.20 | ) | |
Net asset value, end of period | | $ | 11.36 | | | $ | 10.16 | | | $ | 10.26 | | |
Total return | | | 13.87 | % | | | 0.83 | % | | | 11.11 | % | |
Ratios to average net assets(b) | |
Total gross expenses | | | 0.28 | % | | | 0.24 | % | | | 0.18 | %(c) | |
Total net expenses(d) | | | 0.26 | %(e) | | | 0.24 | %(e) | | | 0.18 | %(c) | |
Net investment income | | | 2.00 | % | | | 1.40 | % | | | 3.44 | %(c) | |
Supplemental data | |
Net assets, end of period (in thousands) | | $ | 413 | | | $ | 168 | | | $ | 3 | | |
Portfolio turnover | | | 21 | % | | | 83 | % | | | 10 | % | |
Notes to Financial Highlights
(a) For the period from September 27, 2010 (commencement of operations) to January 31, 2011.
(b) In addition to the fees and expenses which the Fund bears directly, the Fund indirectly bears a pro rata share of the fees and expenses of the underlying funds in which the Fund invests. Such indirect expenses are not included in the reported expense ratios.
(c) Annualized.
(d) Total net expenses include the impact of certain waivers/reimbursements made by the Investment Manager and certain of its affiliates, if applicable.
(e) The benefits derived from expense reductions had an impact of less than 0.01%.
The accompanying Notes to Financial Statements are an integral part of this statement.
Annual Report 2013
105
Columbia Capital Allocation Portfolios
Notes to Financial Statements
January 31, 2013
Note 1. Organization
Columbia Funds Series Trust and Columbia Funds Series Trust II (each a Trust and collectively, the Trusts) are registered under the Investment Company Act of 1940, as amended (the 1940 Act), as open-end management investment companies. Columbia Funds Series Trust is organized as a Delaware statutory trust and Columbia Funds Series Trust II is organized as a Massachusetts business trust.
Information presented in these financial statements pertains to the following series of the Trusts (each a Fund and collectively, the Funds): Columbia Capital Allocation Moderate Conservative Portfolio (formerly known as Columbia LifeGoal® Income and Growth Portfolio) and Columbia Capital Allocation Moderate Aggressive Portfolio (formerly known as Columbia LifeGoal® Balanced Growth Portfolio), each a series of Columbia Funds Series Trust, and Columbia Capital Allocation Conservative Portfolio (formerly known as Columbia Portfolio Builder Conservative Fund), Columbia Capital Allocation Moderate Portfolio (formerly known as Columbia Portfolio Builder Moderate Fund), and Columbia Capital Allocation Aggressive Portfolio (formerly known as Columbia Portfolio Builder Aggressive Fund), each a series of Columbia Funds Series Trust II. Each Fund currently operates as a diversified fund.
Each Fund is a "fund-of-funds" and invests in a combination of underlying affiliated funds* for which Columbia Management Investment Advisers, LLC (Columbia Management), a wholly-owned subsidiary of Ameriprise Financial, Inc. (Ameriprise Financial), or an affiliate acts as investment manager or principal underwriter. Each Fund may also invest in unaffiliated underlying funds, exchange traded funds (ETFs), equity and fixed income securities (including treasury inflation protected securities (TIPs)) and derivative instruments. Columbia Management is the Investment Manager for the underlying affiliated funds.
*For information on the goals, investment strategies and risks of the underlying funds please refer to the Funds' most recent prospectus and the prospectuses of the underlying funds.
Fund Shares
Each Trust may issue an unlimited number of shares (without par value) that can be allocated among the separate series as designated by the Board of Trustees (the Board).
Columbia Capital Allocation Conservative Portfolio, Columbia Capital Allocation Moderate Portfolio and Columbia Capital Allocation Aggressive Portfolio each offers Class A, Class B, Class C, Class K, Class R and Class Z shares.
Columbia Capital Allocation Moderate Conservative Portfolio offers Class A, Class B, Class C, Class R, Class R4, Class R5 and Class Z shares.
Columbia Capital Allocation Moderate Aggressive Portfolio offers Class A, Class B, Class C, Class R, Class R4, Class R5, Class T and Class Z shares.
All share classes have identical voting, dividend and liquidation rights. Each share class has its own expense structure and sales charges, as applicable.
Class A shares are subject to a maximum front-end sales charge of 4.75% for Columbia Capital Allocation Conservative Portfolio. Class A shares of Columbia Capital Allocation Moderate Conservative Portfolio, Columbia Capital Allocation Moderate Portfolio, Columbia Capital Allocation Moderate Aggressive Portfolio and Columbia Capital Allocation Aggressive Portfolio are subject to a maximum front-end sales charge of 5.75% based on the initial investment amount. Class A shares purchased without an initial sales charge in accounts aggregating $1 million to $50 million at the time of purchase are subject to a contingent deferred sales charge (CDSC) if the shares are sold within 18 months of purchase, charged as follows: 1.00% CDSC if redeemed within 12 months of purchase, and 0.50% CDSC if redeemed more than 12, but less than 18, months after purchase.
Class B shares may be subject to a maximum CDSC of 5.00% based upon the holding period after purchase. Class B shares will generally convert to Class A shares eight years after purchase. Each Portfolio no longer accepts investments by new or existing investors in the Portfolio's Class B shares, except in connection with the reinvestment of any dividend and/or capital gain distributions in Class B shares of the Portfolio and exchanges by existing Class B shareholders of certain other funds within the Columbia Family of Funds.
Class C shares are subject to a 1.00% CDSC on shares redeemed within one year of purchase.
Class K shares (formerly Class R4 shares) are not subject to sales charges; however, this share class is closed to new investors. Effective October 25, 2012, Class R4 shares of Columbia Capital Allocation Conservative Portfolio, Columbia Capital Allocation Moderate Portfolio and Columbia Capital Allocation Aggressive Portfolio were renamed Class K shares.
Class R shares are not subject to sales charges and are only available to qualifying institutional investors.
Class R4 shares are not subject to sales charges and are only available to investors purchasing through authorized investment professionals. Class R4 shares of Columbia Capital Allocation Moderate Conservative Portfolio and Columbia
Annual Report 2013
106
Columbia Capital Allocation Portfolios
Notes to Financial Statements (continued)
January 31, 2013
Capital Allocation Moderate Aggressive Portfolio commenced operations on November 8, 2012.
Class R5 shares are not subject to sales charges and are only available to investors purchasing through authorized investment professionals. Class R5 shares of Columbia Capital Allocation Moderate Conservative Portfolio and Columbia Capital Allocation Moderate Aggressive Portfolio commenced operations on November 8, 2012.
Class T shares are subject to a maximum front-end sales charge of 5.75% based on the investment amount. Class T shares purchased without an initial sales charge in accounts aggregating $1 million to $50 million at the time of purchase are subject to a contingent deferred sales charge (CDSC) if the shares are sold within 18 months of purchase, charged as follows: 1.00% CDSC if redeemed within 12 months of purchase, and 0.50% CDSC if redeemed more than 12, but less than 18, months after purchase. Class T shares are available only to investors who received (and who have continuously held) Class T shares in connection with the merger of certain Galaxy Funds into various Columbia Funds (formerly named Liberty Funds).
Class Z shares are not subject to sales charges, and are only available to certain investors.
Note 2. Summary of Significant Accounting Policies
Use of Estimates
The preparation of financial statements in accordance with U.S. generally accepted accounting principles (GAAP) requires management to make certain estimates and assumptions that affect the reported amounts of assets and liabilities, the disclosure of contingent assets and liabilities at the date of the financial statements and the reported amounts of revenue and expenses during the reporting period. Actual results could differ from those estimates.
The following is a summary of significant accounting policies consistently followed by the Funds in the preparation of their financial statements.
Security Valuation
Investments in the underlying funds are valued at the net asset value of each class of the respective underlying fund determined as of the close of the New York Stock Exchange on the valuation date.
Debt securities generally are valued by pricing services approved by the Board based upon market transactions for normal, institutional-size trading units of similar securities. The services may use various pricing techniques which take
into account appropriate factors such as yield, quality, coupon rate, maturity, type of issue, trading characteristics and other data, as well as broker quotes. Debt securities for which quotations are readily available may also be valued based upon an over-the-counter or exchange bid quotation.
All equity securities are valued at the close of business of the New York Stock Exchange (NYSE). Equity securities are valued at the last quoted sales price on the principal exchange or market on which they trade, except for securities traded on the NASDAQ Stock Market, which are valued at the NASDAQ official close price. Unlisted securities or listed securities for which there were no sales during the day are valued at the mean of the latest quoted bid and ask prices on such exchanges or markets.
Foreign securities are valued based on quotations from the principal market in which such securities are normally traded. If any foreign share prices are not readily available as a result of limited share activity the securities are valued at the mean of the latest quoted bid and ask prices on such exchanges or markets. Foreign currency exchange rates are generally determined at 4:00 p.m. Eastern (U.S.) time. However, many securities markets and exchanges outside the U.S. close prior to the close of the NYSE; therefore, the closing prices for securities in such markets or on such exchanges may not fully reflect events that occur after such close but before the close of the NYSE. In those situations, foreign securities will be fair valued pursuant to the policy adopted by the Board, including utilizing a third party pricing service to determine these fair values. The third party pricing service takes into account multiple factors, including, but not limited to, movements in the U.S. securities markets, certain depositary receipts, futures contracts and foreign exchange rates that have occurred subsequent to the close of the foreign exchange or market, to determine a good faith estimate that reasonably reflects the current market conditions as of the close of the NYSE. The fair value of a security is likely to be different from the quoted or published price, if available.
Short-term securities purchased within 60 days to maturity are valued at amortized cost, which approximates market value. The value of short-term securities originally purchased with maturities greater than 60 days is determined based on an amortized value to par upon reaching 60 days to maturity. Short-term securities maturing in more than 60 days from the valuation date are valued at the market price or approximate market value based on current interest rates.
Futures and options on futures contracts are valued based upon the settlement price established each day by the board of trade or exchange on which they are traded.
Annual Report 2013
107
Columbia Capital Allocation Portfolios
Notes to Financial Statements (continued)
January 31, 2013
Investments for which market quotations are not readily available, or that have quotations which management believes are not reliable, are valued at fair value as determined in good faith under consistently applied procedures established by and under the general supervision of the Board. If a security or class of securities (such as foreign securities) is valued at fair value, such value is likely to be different from the last quoted market price for the security.
The determination of fair value often requires significant judgment. To determine fair value, management may use assumptions including but not limited to future cash flows and estimated risk premiums. Multiple inputs from various sources may be used to determine fair value.
Foreign Currency Transactions and Translation
The values of all assets and liabilities denominated in foreign currencies are translated into U.S. dollars at that day's exchange rates. Net realized and unrealized gains (losses) on foreign currency transactions and translations include gains (losses) arising from the fluctuation in exchange rates between trade and settlement dates on securities transactions, gains (losses) arising from the disposition of foreign currency and currency gains (losses) between the accrual and payment dates on dividends, interest income and foreign withholding taxes.
For financial statement purposes, the Funds do not distinguish that portion of gains (losses) on investments which is due to changes in foreign exchange rates from that which is due to changes in market prices of the investments. Such fluctuations are included with the net realized and unrealized gains (losses) on investments in the Statements of Operations.
Derivative Instruments
Each Fund may invest in certain derivative instruments as detailed below to meet its investment objectives. Derivatives are instruments whose values depend on, or are derived from, in whole or in part, the value of one or more other assets, such as securities, currencies, commodities or indices. Derivative instruments may be used to maintain cash reserves while maintaining exposure to certain other assets, to offset anticipated declines in values of investments, to facilitate trading, to reduce transaction costs and to pursue higher investment returns. Each Fund may also use derivative instruments to mitigate certain investment risks, such as foreign currency exchange rate risk, interest rate risk and credit risk. Derivatives may involve various risks, including the potential inability of the counterparty to fulfill its obligation under the terms of the contract, the potential for an illiquid secondary market and the potential for market movements which may expose the Fund to gains or losses in
excess of the amount shown in the Statements of Assets and Liabilities.
Each Fund and any counterparty are required to maintain an agreement that requires the Fund and that counterparty to monitor (on a daily basis) the net fair value of all derivatives entered into pursuant to the agreementt between the Fund and such counterparty. If the net fair value of such derivatives between the Fund and that counterparty exceeds a certain threshold (as defined in the agreement), the Fund or the counterparty (as the case may be) is required to post cash and/or securities as collateral. Fair values of derivatives presented in the financial statements are not netted with the fair value of other derivatives or with any collateral amounts posted by the Fund or any counterparty.
Futures Contracts
Futures contracts represent commitments for the future purchase or sale of an asset at a specified price on a specified date. Columbia Capital Allocation Conservative Portfolio, Columbia Capital Allocation Moderate Conservative Portfolio, Columbia Capital Allocation Moderate Portfolio and Columbia Capital Allocation Moderate Aggressive Portfolio each bought and sold futures contracts to produce incremental earnings, manage the duration and yield curve exposure of the Funds versus the benchmark, manage exposure to movements in interest rates, manage exposure to the securities market, and maintain appropriate equity market exposure while keeping sufficient cash to accommodate daily redemptions. Upon entering into futures contracts, the Fund bears risks which may include interest rates, exchange rates or securities prices moving unexpectedly, in which case, the Fund may not achieve the anticipated benefits of the futures contracts and may realize a loss. Additional risks include counterparty credit risk, the possibility of an illiquid market, and that a change in the value of the contract or option may not correlate with changes in the value of the underlying asset.
Upon entering into a futures contract, the Fund pledges cash or securities with the broker in an amount sufficient to meet the initial margin requirement. Subsequent payments (variation margin) are made or received by the Fund each day. The variation margin payments are equal to the daily change in the contract value and are recorded as variation margin receivable or payable and are offset in unrealized gains or losses. The Fund recognizes a realized gain or loss when the contract is closed or expires. Futures contracts involve, to varying degrees, risk of loss in excess of the variation margin disclosed in the Statement of Assets and Liabilities.
Annual Report 2013
108
Columbia Capital Allocation Portfolios
Notes to Financial Statements (continued)
January 31, 2013
Effects of Derivative Transactions in the Financial Statements
The following tables are intended to provide additional information about the effect of derivatives on the financial statements of the Funds, including: the fair value of derivatives by risk category and the location of those fair values in the Statements of Assets and Liabilities; the impact of derivative transactions on each Funds' operations over the period including realized gains or losses and unrealized gains or losses. The derivative schedules following each Portfolio of Investments present additional information regarding derivative instruments outstanding at the end of the period, if any.
Columbia Capital Allocation Conservative Portfolio
The following table is a summary of the fair value of derivative instruments at January 31, 2013:
| | Liability Derivatives | |
Risk Exposure
Category | | Statement of
Assets and
Liabilities Location | | Fair Value ($) | |
Interest rate contracts | | Net assets — unrealized
depreciation on futures
contracts | | | 193,798 | * | |
*Includes cumulative appreciation (depreciation) of futures contracts as reported in the Futures Contracts Outstanding table following the Portfolio of Investments. Only the current day's variation margin is reported in receivables or payables in the Statement of Assets and Liabilities.
The effect of derivative instruments in the Statement of Operations for the year ended January 31, 2013:
Amount of Realized Gain (Loss) on Derivatives Recognized in Income | |
Risk Exposure Category | | Futures Contracts ($) | |
Equity contracts | | | (379,332 | ) | |
Interest rate contracts | | | 123,471 | | |
Total | | | (255,861 | ) | |
Change in Unrealized Appreciation (Depreciation) on Derivatives Recognized in Income | |
Risk Exposure Category | | Futures Contracts ($) | |
Equity contracts | | | 417 | | |
Interest rate contracts | | | (193,798 | ) | |
Total | | | (193,381 | ) | |
The following table is a summary of the volume of derivative instruments for the year ended January 31, 2013:
Derivative Instrument | | Contracts Opened | |
Futures contracts | | | 791 | | |
Columbia Capital Allocation Moderate Conservative Portfolio
The following table is a summary of the fair value of derivative instruments at January 31, 2013:
| | Liability Derivatives | |
Risk Exposure
Category | | Statement of
Assets and
Liabilities Location | | Fair Value ($) | |
Interest rate contracts | | Net assets — unrealized
depreciation on futures
contracts | | | 51,771 | * | |
*Includes cumulative appreciation (depreciation) of futures contracts as reported in the Futures Contracts Outstanding table following the Portfolio of Investments. Only the current day's variation margin is reported in receivables or payables in the Statement of Assets and Liabilities.
The effect of derivative instruments in the Statement of Operations for the year ended January 31, 2013:
Amount of Realized Gain (Loss) on Derivatives Recognized in Income | |
Risk Exposure Category | | Futures Contracts ($) | |
Equity contracts | | | (105,138 | ) | |
Interest rate contracts | | | 173,164 | | |
Total | | | 68,026 | | |
Change in Unrealized Appreciation (Depreciation) on Derivatives Recognized in Income | |
Risk Exposure Category | | Futures Contracts ($) | |
Equity contracts | | | (981 | ) | |
Interest rate contracts | | | (125,836 | ) | |
Total | | | (126,817 | ) | |
The following table is a summary of the volume of derivative instruments for the year ended January 31, 2013:
Derivative Instrument | | Contracts Opened | |
Futures contracts | | | 338 | | |
Columbia Capital Allocation Moderate Portfolio
The following table is a summary of the fair value of derivative instruments at January 31, 2013:
| | Liability Derivatives | |
Risk Exposure
Category | | Statement of
Assets and
Liabilities Location | | Fair Value ($) | |
Interest rate contracts | | Net assets — unrealized
depreciation on futures
contracts | | | 547,251 | * | |
*Includes cumulative appreciation (depreciation) of futures contracts as reported in the Futures Contracts Outstanding table following the Portfolio of Investments. Only the current day's variation margin is reported in receivables or payables in the Statement of Assets and Liabilities.
Annual Report 2013
109
Columbia Capital Allocation Portfolios
Notes to Financial Statements (continued)
January 31, 2013
The effect of derivative instruments in the Statement of Operations for the year ended January 31, 2013:
Amount of Realized Gain (Loss) on Derivatives Recognized in Income | |
Risk Exposure Category | | Futures Contracts ($) | |
Equity contracts | | | (3,197,457 | ) | |
Interest rate contracts | | | 348,099 | | |
Total | | | (2,849,358 | ) | |
Change in Unrealized Appreciation (Depreciation) on Derivatives Recognized in Income | |
Risk Exposure Category | | Futures Contracts ($) | |
Equity contracts | | | 1,833 | | |
Interest rate contracts | | | (547,251 | ) | |
Total | | | (545,418 | ) | |
The following table is a summary of the volume of derivative instruments for the year ended January 31, 2013:
Derivative Instrument | | Contracts Opened | |
Futures contracts | | | 3,106 | | |
Columbia Capital Allocation Moderate Aggressive Portfolio
The following table is a summary of the fair value of derivative instruments at January 31, 2013:
| | Liability Derivatives | |
Risk Exposure
Category | | Statement of
Assets and
Liabilities Location | | Fair Value ($) | |
Interest rate contracts | | Net assets — unrealized
depreciation on futures
contracts | | | 106,525 | * | |
*Includes cumulative appreciation (depreciation) of futures contracts as reported in the Futures Contracts Outstanding table following the Portfolio of Investments. Only the current day's variation margin is reported in receivables or payables in the Statement of Assets and Liabilities.
The effect of derivative instruments in the Statement of Operations for the year ended January 31, 2013:
Amount of Realized Gain (Loss) on Derivatives Recognized in Income | |
Risk Exposure Category | | Futures Contracts ($) | |
Equity contracts | | | 670,666 | | |
Interest rate contracts | | | 338,645 | | |
Total | | | 1,009,311 | | |
Change in Unrealized Appreciation (Depreciation) on Derivatives Recognized in Income | |
Risk Exposure Category | | Futures Contracts ($) | |
Equity contracts | | | (1,542,266 | ) | |
Interest rate contracts | | | (235,489 | ) | |
Total | | | (1,777,755 | ) | |
The following table is a summary of the volume of derivative instruments for the year ended January 31, 2013:
Derivative Instrument | | Contracts Opened | |
Futures contracts | | | 1,471 | | |
Columbia Capital Allocation Aggressive Portfolio
At January 31, 2013, the fund had no outstanding derivatives.
The effect of derivative instruments in the Statement of Operations for the year ended January 31, 2013:
Amount of Realized Gain (Loss) on Derivatives Recognized in Income | |
Risk Exposure Category | | Futures Contracts ($) | |
Equity contracts | | | (1,105,514 | ) | |
Change in Unrealized Appreciation (Depreciation) on Derivatives Recognized in Income | |
Risk Exposure Category | | Futures Contracts ($) | |
Equity contracts | | | (5,338 | ) | |
The following table is a summary of the volume of derivative instruments for the year ended January 31, 2013:
Derivative Instrument | | Contracts Opened | |
Futures contracts | | | 572 | | |
Treasury Inflation Protected Securities
The Funds may invest in treasury inflation protected securities (TIPS). The principal amount of TIPS is adjusted periodically and is increased for inflation or decreased for deflation based on a monthly published index. Interest payments are based on the adjusted principal at the time the interest is paid. These adjustments are recorded as interest income in the Statements of Operations.
Security Transactions
Security transactions are accounted for on the trade date. Cost is determined and gains (losses) are based upon the specific identification method for both financial statement and federal income tax purposes.
Income Recognition
Income and capital gain distributions from the Underlying Funds, if any, are recorded on the ex-dividend date.
Interest income is recorded on an accrual basis. Market premiums and discounts, including original issue discounts, are amortized and accreted, respectively, over the expected life of the security on all debt securities, unless otherwise noted.
Corporate actions and dividend income are recorded net of any non-reclaimable tax withholdings, on the ex-dividend date or upon receipt of ex-dividend notification in the case of certain foreign securities.
Annual Report 2013
110
Columbia Capital Allocation Portfolios
Notes to Financial Statements (continued)
January 31, 2013
Expenses
General expenses of the Trusts are allocated to the Funds, respectively, and other series of the Trusts based upon relative net assets or other expense allocation methodologies determined by the nature of the expense. Expenses directly attributable to a Fund are charged to such Fund. Expenses directly attributable to a specific class of shares are charged to that share class.
Determination of Class Net Asset Value
All income, expenses (other than class-specific expenses which are charged directly to that share class, as shown in the Statement of Operations) and realized and unrealized gains (losses) are allocated to each class of a Fund on a daily basis, based on the relative net assets of each class, for purposes of determining the net asset value of each class.
Federal Income Tax Status
For federal income tax purposes, each Fund is treated as a separate entity. The Funds intend to qualify each year as separate regulated investment companies under Subchapter M of the Internal Revenue Code, as amended, and will distribute substantially all of their taxable income for their tax year, and as such will not be subject to federal income taxes. In addition, the Funds intend to distribute in each calendar year substantially all of their net investment income, capital gains and certain other amounts, if any, such that the Funds should not be subject to federal excise tax. Therefore, no federal income or excise tax provisions are recorded.
Distributions to Shareholders
Distributions from net investment income, if any, are declared and paid quarterly for Columbia Capital Allocation Conservative Portfolio, Columbia Capital Allocation Moderate Conservative Portfolio, Columbia Capital Allocation Moderate Portfolio and Columbia Capital Allocation Moderate Aggressive Portfolio. Distribution from net investment income, if any, are declared and paid annually for Columbia Capital Allocation Aggressive Portfolio. Net realized capital gains, if any, are distributed along with the income dividend. Income distributions and capital gain distributions are determined in accordance with federal income tax regulations which may differ from GAAP.
Guarantees and Indemnifications
Under the Trusts' organizational documents and, in some cases by contract, their officers and trustees are indemnified against certain liabilities arising out of the performance of their duties to a Trust or its funds. In addition, certain of the Funds' contracts with their service providers contain general indemnification clauses. The Funds' maximum exposure
under these arrangements is unknown since the amount of any future claims that may be made against the Funds cannot be determined, and the Funds have no historical basis for predicting the likelihood of any such claims.
Recent Accounting Pronouncement
Disclosures about Offsetting Assets and Liabilities
In December 2011, the Financial Accounting Standards Board (FASB) issued Accounting Standards Update (ASU) No. 2011-11, Disclosures about Offsetting Assets and Liabilities. The objective of the FASB is to enhance current disclosure requirements on offsetting of certain assets and liabilities and to enable financial statement users to compare financial statements prepared under GAAP and International Financial Reporting Standards.
Specifically, ASU No. 2011-11 requires an entity to disclose both gross and net information for derivatives and other financial instruments that are subject to a master netting arrangement or similar agreement. The standard requires disclosure of collateral received in connection with the master netting agreements or similar agreements. The effective date of ASU No. 2011-11 is for interim and annual periods beginning on or after January 1, 2013. At this time, management is evaluating the implications of this guidance and the impact it will have on the financial statement amounts and footnote disclosures, if any.
Note 3. Fees and Compensation Paid to Affiliates
Investment Management Fees
Under an Investment Management Services Agreement (IMSA), the Investment Manager determines which securities will be purchased, held or sold.
Columbia Capital Allocation Conservative Portfolio, Columbia Capital Allocation Moderate Portfolio and Columbia Capital Allocation Aggressive Portfolio do not pay the Investment Manager a direct investment management fee for managing its assets.
The investment management fee for Columbia Capital Allocation Moderate Conservative Portfolio and Columbia Capital Allocation Moderate Aggressive Portfolio is an annual fee that is a blend of (i) 0.00% on assets invested in funds that pay an investment advisory fee to the Investment Manager, (ii) 0.10% on assets invested in non-exchange traded third party funds and (iii) 0.55% on assets invested in all other securities, including other funds advised by the Investment Manager that do not pay an investment advisory fee, ETFs, derivatives and individual securities.
Annual Report 2013
111
Columbia Capital Allocation Portfolios
Notes to Financial Statements (continued)
January 31, 2013
The annualized effective investment management fee rates for the year ended January 31, 2013, was 0.06% for Columbia Capital Allocation Moderate Conservative Portfolio and 0.03% for Columbia Capital Allocation Moderate Aggressive Portfolio, of each Fund's average daily net assets.
On February 27, 2013, shareholders of the Funds approved an amended IMSA for Columbia Capital Allocation Conservative Portfolio, Columbia Capital Allocation Moderate Portfolio and Columbia Capital Allocation Aggressive Portfolio that includes an annual investment management fee that is the same structure as the investment management fee for Columbia Capital Allocation Moderate Conservative Portfolio and Columbia Capital Allocation Moderate Aggressive Portfolio. The fee change became effective on March 1, 2013.
In addition to the fees and expenses which each Fund bears directly, each Fund indirectly bears a pro rata share of the fees and expenses of the underlying funds (also referred to as "acquired funds") in which a Fund invests. Because the underlying funds have varied expense and fee levels and each Fund may own different proportions of underlying funds at different times, the amount of fees and expenses incurred indirectly by each Fund will vary.
Administration Fees
Under an Administrative Services Agreement, the Investment Manager also serves as the Portfolio Administrator. Each Fund pays the Portfolio Administrator an annual fee for administration and accounting services equal to 0.02% of each Fund's average daily net assets.
Other Expenses
Other expenses are for, among other things, certain expenses of the Funds or the Board, including: Fund boardroom and office expense, employee compensation, employee health and retirement benefits, and certain other expenses. Payment of these Fund and Board expenses is facilitated by a company providing limited administrative services to each Fund and the Board. For the year ended January 31, 2013, other expenses paid to this company were as follows:
Portfolio | | Amount ($) | |
Columbia Capital Allocation Conservative Portfolio | | | 1,208 | | |
Columbia Capital Allocation Moderate Conservative Portfolio | | | 1,208 | | |
Columbia Capital Allocation Moderate Portfolio | | | 1,208 | | |
Columbia Capital Allocation Moderate Aggressive Portfolio | | | 1,208 | | |
Columbia Capital Allocation Aggressive Portfolio | | | 1,208 | | |
Compensation of Board Members
Board members are compensated for their services to the Funds as disclosed in the Statement of Operations. Under a Deferred Compensation Plan (the Plan), the Board members
who are not "interested persons" of each Fund as defined under the 1940 Act may defer receipt of their compensation. Deferred amounts are treated as though equivalent dollar amounts had been invested in shares of each Fund or certain other funds managed by the Investment Manager. Each Fund's liability for these amounts is adjusted for market value changes and remains in the Funds until distributed in accordance with the Plan.
Transfer Agent Fees
Under a Transfer and Dividend Disbursing Agent Agreement, Columbia Management Investment Services Corp. (the Transfer Agent), an affiliate of the Investment Manager and a wholly-owned subsidiary of Ameriprise Financial, is responsible for providing transfer agency services to the Funds. The Transfer Agent has contracted with Boston Financial Data Services (BFDS) to serve as sub-transfer agent.
The Transfer Agent receives monthly account-based service fees based on the number of open accounts and is reimbursed by the Funds for the fees and expenses the Transfer Agent pays to financial intermediaries that maintain omnibus accounts with the Funds that is a percentage of the average aggregate value of each Fund's shares maintained in each such omnibus account (other than omnibus accounts for which American Enterprise Investment Services Inc. is the broker of record or accounts where the beneficial shareholder is a customer of Ameriprise Financial Services, Inc., which are paid a per account fee). The Transfer Agent pays the fees of BFDS for services as sub-transfer agent and is not entitled to reimbursement for such fees from the Funds (with the exception of out-of-pocket fees).
The Transfer Agent also receives compensation from fees for various shareholder services and reimbursements for certain out-of-pocket fees. Total transfer agent fees for Class K and Class R5 shares are subject to an annual limitation of not more than 0.05% of the average daily net assets attributable to each share class.
For the year ended January 31, 2013, the Funds' annualized effective transfer agent fee rates as a percentage of average daily net assets of each class were as follows:
Portfolio | | Class A
(%) | | Class B
(%) | | Class C
(%) | | Class K
(%) | | Class R
(%) | | Class R4
(%) | | Class R5
(%) | | Class T
(%) | | Class Z
(%) | |
Columbia Capital
Allocation
Conservative
Portfolio | | | 0.14 | | | | 0.13 | | | | 0.14 | | | | 0.05 | | | | 0.14 | | | | — | | | | — | | | | — | | | | 0.14 | | |
Columbia Capital
Allocation
Moderate
Conservative
Portfolio | | | 0.18 | | | | 0.18 | | | | 0.18 | | | | — | | | | 0.18 | | | | 0.15 | | | | 0.05 | | | | — | | | | 0.18 | | |
Annual Report 2013
112
Columbia Capital Allocation Portfolios
Notes to Financial Statements (continued)
January 31, 2013
Portfolio | | Class A
(%) | | Class B
(%) | | Class C
(%) | | Class K
(%) | | Class R
(%) | | Class R4
(%) | | Class R5
(%) | | Class T
(%) | | Class Z
(%) | |
Columbia Capital
Allocation
Moderate
Portfolio | | | 0.16 | | | | 0.16 | | | | 0.16 | | | | 0.05 | | | | 0.16 | | | | — | | | | — | | | | — | | | | 0.17 | | |
Columbia Capital
Allocation
Moderate
Aggressive
Portfolio | | | 0.17 | | | | 0.17 | | | | 0.17 | | | | — | | | | 0.17 | | | | 0.17 | | | | 0.05 | | | | 0.17 | | | | 0.17 | | |
Columbia Capital
Allocation
Aggressive
Portfolio | | | 0.20 | | | | 0.19 | | | | 0.20 | | | | 0.05 | | | | 0.21 | | | | — | | | | — | | | | — | | | | 0.20 | | |
An annual minimum account balance fee of $20 may apply to certain accounts with a value below the Funds' initial minimum investment requirements to reduce the impact of small accounts on transfer agent fees. These minimum account balance fees are recorded as part of expense reductions in the Statements of Operations.
For the year ended January 31, 2013 these minimum account balance fees reduced total expenses as follows:
Portfolio | | Amount ($) | |
Columbia Capital Allocation Conservative Portfolio | | | 40 | | |
Columbia Capital Allocation Moderate Conservative Portfolio | | | 280 | | |
Columbia Capital Allocation Moderate Portfolio | | | 60 | | |
Columbia Capital Allocation Moderate Aggressive Portfolio | | | 26,139 | | |
Columbia Capital Allocation Aggressive Portfolio | | | 360 | | |
Plan Administration Fees
Under a Plan Administration Services Agreement with the Transfer Agent, Columbia Capital Allocation Conservative Portfolio, Columbia Capital Allocation Moderate Portfolio and Columbia Capital Allocation Aggressive Conservative Portfolio, each pay an annual fee at a rate of 0.25% of the Portfolio's average daily net assets attributable to Class K shares for the provision of various administrative, recordkeeping, communication and educational services.
Distribution and Service Fees
The Funds have an agreement with Columbia Management Investment Distributors, Inc. (the Distributor), an affiliate of the Investment Manager and a wholly-owned subsidiary of Ameriprise Financial, for distribution and shareholder services. Pursuant to Rule 12b-1 under the 1940 Act, the Board has approved, and the Funds have adopted, distribution and/or shareholder service plans (the Plans) which set the distribution and/or service fees for the Funds. These fees are calculated daily and are intended to compensate the Distributor and/or eligible selling and/or servicing agents for selling shares of the Funds and providing services to investors.
Under the Plans, each Fund pays a monthly fee to the Distributor at the annual rates of up to 0.25% of each Fund's average daily net assets attributable to Class A shares, up to 1.00% of the Fund's average daily net assets attributable to Class B and Class C shares and up to 0.50% of each Fund's average daily net assets attributable to Class R shares (of which up to 0.25% may be used for shareholder services for Columbia Capital Allocation Conservative Portfolio, Columbia Capital Allocation Moderate Portfolio and Columbia Capital Allocation Aggressive Portfolio).
For Class B and Class C shares of Columbia Capital Allocation Conservative Portfolio, Columbia Capital Allocation Moderate Portfolio and Columbia Capital Allocation Aggressive Portfolio, of the 1.00% fee, up to 0.75% is reimbursed for distribution expenses. The amount of distribution expenses incurred by the Distributor and not yet reimbursed (unreimbursed expense) for each Fund was approximately as follows:
Portfolio | | Class B ($) | | Class C ($) | |
Columbia Capital Allocation
Conservative Portfolio | | | 1,967,000 | | | | 306,000 | | |
Columbia Capital Allocation
Moderate Conservative Portfolio | | | 469,000 | | | | 29,000 | | |
Columbia Capital Allocation
Moderate Portfolio | | | 6,280,000 | | | | 1,727,000 | | |
Columbia Capital Allocation
Moderate Aggressive Portfolio | | | 1,641,000 | | | | — | | |
Columbia Capital Allocation
Aggressive Portfolio | | | 1,898,000 | | | | 229,000 | | |
These amounts are based on the most recent information available as of December 31, 2012, and may be recovered from future payments under the distribution plan or CDSCs. To the extent the unreimbursed expense has been fully recovered, the distribution fee is reduced.
Shareholder Services Fees
Columbia Capital Allocation Moderate Aggressive Portfolio has adopted a shareholder services plan that permits it to pay for certain services provided to Class T shareholders by their selling and/or servicing agents. The Fund may pay shareholder servicing fees up to an aggregate annual rate of 0.50% of the Fund's average daily net assets attributable to Class T shares (comprised of up to 0.25% for shareholder liaison services and up to 0.25% for administrative support services). These fees are currently limited to an aggregate annual rate of not more than 0.30% of the Fund's average daily net assets attributable to Class T shares. The annualized shareholder services fees for the year ended January 31, 2013 was 0.30% of the Fund's average daily net assets attributable to Class T shares.
Annual Report 2013
113
Columbia Capital Allocation Portfolios
Notes to Financial Statements (continued)
January 31, 2013
Sales Charges
Sales charges, including front-end and CDSCs, received by the Distributor for distributing each Fund's shares for the year ended January 31, 2013, were as follows:
Portfolio | | Class A
($) | | Class B
($) | | Class C
($) | | Class T
($) | |
Columbia Capital
Allocation Conservative
Portfolio | | | 446,948 | | | | 3,447 | | | | 1,988 | | | | — | | |
Columbia Capital
Allocation Moderate
Conservative Portfolio | | | 99,556 | | | | 7,243 | | | | 745 | | | | — | | |
Columbia Capital
Allocation Moderate
Portfolio | | | 2,809,196 | | | | 29,092 | | | | 10,856 | | | | — | | |
Columbia Capital
Allocation Moderate
Aggressive Portfolio | | | 454,893 | | | | 38,975 | | | | 4,358 | | | | 6,636 | | |
Columbia Capital
Allocation Aggressive
Portfolio | | | 1,162,343 | | | | 13,540 | | | | 3,539 | | | | — | | |
Expenses Waived/Reimbursed by the Investment Manager and its Affiliates
The Investment Manager and certain of its affiliates have contractually agreed to waive fees and/or reimburse expenses (excluding certain fees and expenses described below), through May 31, 2013, unless sooner terminated at the sole discretion of the Board, so that each Fund's net operating expenses, after giving effect to fees waived/expenses reimbursed and any balance credits and/or overdraft charges from the Funds' custodian, do not exceed the following annual rates as a percentage of the class' average daily net assets:
Portfolio | | Class A
(%) | | Class B
(%) | | Class C
(%) | | Class K
(%) | | Class R
(%) | | Class R4*
(%) | | Class R5*
(%) | | Class T
(%) | | Class Z
(%) | |
Columbia Capital
Allocation
Conservative
Portfolio | | | 0.51 | | | | 1.26 | | | | 1.26 | | | | 0.44 | | | | 0.76 | | | | N/A | | | | N/A | | | | N/A | | | | 0.26 | | |
Columbia Capital
Allocation
Moderate
Conservative
Portfolio | | | 0.51 | | | | 1.26 | | | | 1.26 | | | | N/A | | | | 0.76 | | | | 0.26 | | | | 0.18 | | | | N/A | | | | 0.26 | | |
Columbia Capital
Allocation
Moderate
Portfolio | | | 0.51 | | | | 1.26 | | | | 1.26 | | | | 0.44 | | | | 0.76 | | | | N/A | | | | N/A | | | | N/A | | | | 0.26 | | |
Columbia Capital
Allocation
Moderate
Aggressive
Portfolio | | | 0.51 | | | | 1.26 | | | | 1.26 | | | | N/A | | | | 0.76 | | | | 0.26 | | | | 0.18 | | | | 0.56 | | | | 0.26 | | |
Columbia Capital
Allocation
Aggressive
Portfolio | | | 0.51 | | | | 1.26 | | | | 1.26 | | | | 0.44 | | | | 0.76 | | | | N/A | | | | N/A | | | | N/A | | | | 0.26 | | |
*Annual rate is contractual from November 8, 2012 (the commencement of operations of each share class) through November 8, 2013.
Under the agreement governing these fee waivers and/or expense reimbursement arrangements, the following fees and expenses are excluded from the waiver/reimbursement commitment, and therefore will be paid by the Funds, if applicable: taxes (including foreign transaction taxes), expenses associated with investments in affiliated and non-affiliated pooled investment vehicles (including mutual funds and exchange traded funds), transaction costs and brokerage commissions, costs related to any securities lending program, dividend expenses associated with securities sold short, inverse floater program fees and expenses, transaction charges and interest on borrowed money, interest, extraordinary expenses and any other expenses the exclusion of which is specifically approved by the Board. For Columbia Capital Allocation Moderate Conservative Portfolio and Columbia Capital Allocation Moderate Aggressive Portfolio, each Fund's investment management fee is also excluded from the waiver/reimbursement commitment and is therefore paid by the Funds. This agreement may be modified or amended only with approval from all parties.
Note 4. Federal Tax Information
The timing and character of income and capital gain distributions are determined in accordance with income tax regulations, which may differ from GAAP because of temporary or permanent book to tax differences.
At January 31, 2013, these differences are primarily due to differing treatments for capital loss carryforwards, principal and/or interest of fixed income securities, deferral/reversal of wash sales losses, Trustees' deferred compensation, foreign currency transactions, post-October capital losses, re-characterization of distributions from investments and derivative investments. To the extent these differences are permanent, reclassifications are made among the components of the Funds' net assets in the Statements of Assets and Liabilities. Temporary differences do not require reclassifications. In the Statements of Assets and Liabilities the following reclassifications were made:
| Portfolio | | Undistributed
(Excess of
Distributions Over)
Net Investment
Income ($) | | Accumulated
Net Realized
Gain (Loss) ($) | | Paid-in Capital
Increase
(Decrease) ($) | |
Columbia Capital
Allocation
Conservative
Portfolio | | | 3,557,100 | | | | (3,557,100 | ) | | | — | | |
Columbial Capital
Allocation Moderate
Conservative Portfolio | | | 851,777 | | | | (851,777 | ) | | | — | | |
Columbia Capital
Allocation Moderate
Portfolio | | | 9,872,752 | | | | (9,872,752 | ) | | | — | | |
Columbia Capital
Allocation Moderate
Aggressive Portfolio | | | 3,431,118 | | | | (3,393,349 | ) | | | (37,769 | ) | |
Columbia Capital
Allocation
Aggressive Portfolio | | | 992,887 | | | | (992,887 | ) | | | — | | |
Annual Report 2013
114
Columbia Capital Allocation Portfolios
Notes to Financial Statements (continued)
January 31, 2013
Net investment income and net realized gains (losses), as disclosed in the Statements of Opertaions, and net assets were not affected by this reclassification.
The tax character of distributions paid during the years indicated was as follows:
| | Year Ended
January 31, 2013 | |
| Portfolio | | Ordinary
Income
($) | | Long-Term
Capital
Gains
($) | | Total
($) | |
Columbia Capital
Allocation
Conservative
Portfolio | | | 10,476,758 | | | | 3,789,999 | | | | 14,266,757 | | |
Columbial Capital
Allocation
Moderate
Conservative
Portfolio | | | 3,487,416 | | | | 2,973,388 | | | | 6,460,804 | | |
Columbia Capital
Allocation
Moderate
Portfolio | | | 37,782,806 | | | | — | | | | 37,782,806 | | |
Columbia Capital
Allocation
Moderate
Aggressive
Portfolio | | | 18,368,806 | | | | 25,945,928 | | | | 44,314,734 | | |
Columbia Capital
Allocation
Aggressive
Portfolio | | | 7,500,153 | | | | — | | | | 7,500,153 | | |
| | Year Ended
January 31, 2012 | |
| Portfolio | | Ordinary
Income
($) | | Long-Term
Capital
Gains
($) | | Total
($) | |
Columbia Capital
Allocation
Conservative
Portfolio | | | 6,520,509 | | | | 7,699,475 | | | | 14,219,984 | | |
Columbial Capital
Allocation
Moderate
Conservative
Portfolio | | | 2,309,899 | | | | — | | | | 2,309,899 | | |
Columbia Capital
Allocation
Moderate
Portfolio | | | 32,082,915 | | | | — | | | | 32,082,915 | | |
Columbia Capital
Allocation
Moderate
Aggressive
Portfolio | | | 13,848,771 | | | | 1,649,451 | | | | 15,498,222 | | |
Columbia Capital
Allocation
Aggressive
Portfolio | | | 7,100,408 | | | | — | | | | 7,100,408 | | |
Short-term capital gain distributions, if any, are considered ordinary income distributions for tax purposes.
At January 31, 2013, the components of distributable earnings on a tax basis were as follows:
| Portfolio | | Undistributed
Ordinary
Income
($) | | Undistributed
Accumulated
Long-Term Gain
($) | |
Columbia Capital Allocation
Conservative Portfolio | | | 595,234 | | | | 3,566,894 | | |
Columbial Capital Allocation
Moderate Conservative Portfolio | | | 223,383 | | | | 1,414,564 | | |
Columbia Capital Allocation
Moderate Portfolio | | | 5,357,701 | | | | 15,058,914 | | |
Columbia Capital Allocation
Moderate Aggressive Portfolio | | | 766,461 | | | | 13,985,966 | | |
Columbia Capital Allocation
Aggressive Portfolio | | | 2,661,993 | | | | — | | |
| Portfolio | | Accumulated
Realized Loss
($) | | Unrealized
Appreciation
(Depreciation)
($) | |
Columbia Capital Allocation
Conservative Portfolio | | | (43,146 | ) | | | 16,049,819 | | |
Columbial Capital Allocation
Moderate Conservative Portfolio | | | — | | | | 6,637,960 | | |
Columbia Capital Allocation
Moderate Portfolio | | | (161,817 | ) | | | 141,886,526 | | |
Columbia Capital Allocation
Moderate Aggressive Portfolio | | | — | | | | 61,386,969 | | |
Columbia Capital Allocation
Aggressive Portfolio | | | (45,623,453 | ) | | | 68,433,064 | | |
At January 31, 2013, the cost of investments for federal income tax purposes along with the aggregate gross unrealized appreciation and depreciation based on that cost was:
| Portfolio | | Tax Cost
($) | | Gross
Unrealized
Appreciation
($) | | Gross
Unrealized
Depreciation
($) | | Net
Appreciation
(Depreciation)
($) | |
Columbia Capital Allocation
Conservative Portfolio | | | 331,987,891 | | | | 16,674,240 | | | | (624,421 | ) | | �� | 16,049,819 | | |
Columbial Capital Allocation
Moderate Conservative Portfolio | | | 119,321,237 | | | | 6,757,397 | | | | (119,437 | ) | | | 6,637,960 | | |
Columbia Capital Allocation
Moderate Portfolio | | | 1,418,782,599 | | | | 142,499,587 | | | | (613,061 | ) | | | 141,886,526 | | |
Columbia Capital Allocation
Moderate Aggressive Portfolio | | | 1,008,524,570 | | | | 67,229,408 | | | | (5,842,439 | ) | | | 61,386,969 | | |
Columbia Capital Allocation
Aggressive Portfolio | | | 505,643,874 | | | | 69,240,091 | | | | (807,027 | ) | | | 68,433,064 | | |
The following capital loss carryforward, determined at January 31, 2013, may be available to reduce taxable income arising from future net realized gains on investments, if any, to the extent permitted by the Internal Revenue Code:
| Portfolio | | 2017
($) | | 2018
($) | | 2019
($) | |
Columbia Capital
Allocation Conservative
Portfolio | | | — | | | | — | | | | — | | |
Columbial Capital
Allocation Moderate
Conservative Portfolio | | | — | | | | — | | | | — | | |
Columbia Capital
Allocation Moderate
Portfolio | | | — | | | | — | | | | — | | |
Columbia Capital
Allocation Moderate
Aggressive Portfolio | | | — | | | | — | | | | — | | |
Columbia Capital
Allocation Aggressive
Portfolio | | | 6,629,032 | | | | 28,221,611 | | | | 8,579,032 | | |
| Portfolio | | Unlimited
Short-Term
($) | | Unlimited
Long-Term
($) | | Total
($) | |
Columbia Capital
Allocation Conservative
Portfolio | | | — | | | | — | | | | — | | |
Columbial Capital
Allocation Moderate
Conservative Portfolio | | | — | | | | — | | | | — | | |
Columbia Capital
Allocation Moderate
Portfolio | | | — | | | | — | | | | — | | |
Columbia Capital
Allocation Moderate
Aggressive Portfolio | | | — | | | | — | | | | — | | |
Columbia Capital
Allocation Aggressive
Portfolio | | | 2,193,778 | | | | — | | | | 45,623,453 | | |
For the year ended January 31, 2013, the amount of capital loss carryforward utilized and expired unused were as follows:
Portfolio | | Utilized ($) | | Expired ($) | |
Columbia Capital Allocation
Conservative Portfolio | | | — | | | | — | | |
Columbial Capital Allocation
Moderate Conservative Portfolio | | | — | | | | — | | |
Columbia Capital Allocation
Moderate Portfolio | | | 25,221,042 | | | | — | | |
Columbia Capital Allocation
Moderate Aggressive Portfolio | | | — | | | | — | | |
Columbia Capital Allocation
Aggressive Portfolio | | | 16,910,636 | | | | — | | |
Annual Report 2013
115
Columbia Capital Allocation Portfolios
Notes to Financial Statements (continued)
January 31, 2013
Under current tax rules, regulated investment companies can elect to treat certain late-year ordinary losses incurred and post-October capital losses (capital losses realized after October 31) as arising on the first day of the following taxable year. At January 31, 2013, the Funds have elected to treat the following post-October capital losses as arising on February 1, 2013:
Portfolio | | Amount ($) | |
Columbia Capital Allocation Conservative Portfolio | | | 43,146 | | |
Columbia Capital Allocation Moderate Conservative Portfolio | | | — | | |
Columbia Capital Allocation Moderate Portfolio | | | 161,817 | | |
Columbia Capital Allocation Moderate Aggressive Portfolio | | | — | | |
Columbia Capital Allocation Aggressive Portfolio | | | — | | |
Management of the Funds has concluded that there are no significant uncertain tax positions that would require recognition in the financial statements. However, management's conclusion may be subject to review and adjustment at a later date based on factors including, but not limited to, new tax laws, regulations, and administrative interpretations (including relevant court decisions). Generally, the Portfolios' federal tax returns for the prior three fiscal years remain subject to examination by the Internal Revenue Service.
Note 5. Portfolio Information
For the year ended January 31, 2013, the cost of purchases and proceeds from sales of securities, excluding investments in money market funds, for each Fund aggregated to:
| | | U.S. Government Securities | | Other Investment Securities | |
Portfolio | | Purchases ($) | | Proceeds ($) | | Purchases ($) | | Proceeds ($) | |
Columbia Capital Allocation
Conservative Portfolio | | | — | | | | — | | | | 76,470,050 | | | | 59,507,555 | | |
Columbia Capital Allocation
Moderate Conservative Portfolio | | | 420,213 | | | | 147,084 | | | | 47,724,022 | | | | 57,751,615 | | |
Columbia Capital Allocation
Moderate Portfolio | | | — | | | | — | | | | 359,422,940 | | | | 342,391,355 | | |
Columbia Capital Allocation
Moderate Aggressive Portfolio | | | 396,277 | | | | 722,629 | | | | 352,118,075 | | | | 431,680,896 | | |
Columbia Capital Allocation
Aggressive Portfolio | | | — | | | | — | | | | 114,894,919 | | | | 157,613,372 | | |
Note 6. Shareholder Concentration
At January 31, 2013, certain shareholder accounts owned more than 10% of the outstanding shares of one or more of the Funds. For unaffiliated shareholder accounts, the Funds have no knowledge about whether any portion of those shares was owned beneficially. Subscription and redemption activity of these accounts may have a significant effect on the operations of
the Funds. The number of accounts and aggregate percentages of shares outstanding held therein were as follows:
Portfolio | | Number of
Unaffiliated
Accounts | | Percentage
of Shares
Outstanding
Held —
Unaffiliated (%) | |
Columbia Capital Allocation
Conservative Portfolio | | | 1 | | | | 27.8 | | |
Columbia Capital Allocation
Moderate Conservative
Portfolio | | | 1 | | | | 53.9 | | |
Columbia Capital Allocation
Moderate Portfolio | | | 1 | | | | 23.9 | | |
Columbia Capital Allocation
Moderate Aggressive
Portfolio | | | 1 | | | | 38.7 | | |
Columbia Capital Allocation
Aggressive Portfolio | | | 1 | | | | 28.1 | | |
Note 7. Regulatory Settlements
During the period ended January 31, 2012, Columbia Capital Allocation Moderate Aggressive Portfolio received payments of $4,433 resulting from certain regulatory settlements with third parties in which the Fund had participated. The payments have been included in "Proceeds from regulatory settlements" in the Statement of Changes in Net Assets.
Note 8. Line of Credit
Each Fund has entered into a revolving credit facility with a syndicate of banks led by JPMorgan Chase Bank, N.A. whereby the Funds may borrow for the temporary funding of shareholder redemptions or for other temporary or emergency purposes. The credit facility agreement, as amended, which is a collective agreement between the Funds and certain other funds managed by the Investment Manager, severally and not jointly, permits collective borrowings up to $500 million. Interest is charged to each participating fund based on its borrowings at a rate equal to the higher of (i) the overnight federal funds rate plus 1.00% or (ii) the one-month LIBOR rate plus 1.00%. Each borrowing under the credit facility matures no later than 60 days after the date of borrowing.
No Funds had borrowings during the year ended January 31, 2013.
Note 9. Subsequent Events
Management has evaluated the events and transactions that have occurred through the date the financial statements were issued. Other than as noted in Note 3 above and as noted below, there were no items requiring adjustment of the financial statements or additional disclosure.
Annual Report 2013
116
Columbia Capital Allocation Portfolios
Notes to Financial Statements (continued)
January 31, 2013
At the close of business on March 15, 2013, Columbia Capital Allocation Moderate Conservative Portfolio acquired the assets and assumed the identified liabilities of Columbia Portfolio Builder Moderate Conservative Fund, a series of Columbia Funds Series Trust II. The reorganization was completed after shareholders of Columbia Portfolio Builder Moderate Conservative Fund approved the plan on February 27, 2013.
At the close of business on March 15, 2013, Columbia Capital Allocation Moderate Aggressive Portfolio acquired the assets and assumed the identified liabilities of Columbia Portfolio Builder Moderate Aggressive Fund, a series of Columbia Funds Series Trust II. The reorganization was completed after shareholders of Columbia Portfolio Builder Moderate Aggressive Fund approved the plan on February 27, 2013.
The purpose of these transactions was to combine funds managed by the Investment Manager with comparable investment objectives and strategies.
Note 10. Information Regarding Pending and Settled Legal Proceedings
In December 2005, without admitting or denying the allegations, American Express Financial Corporation (AEFC, which is now known as Ameriprise Financial, Inc. (Ameriprise Financial)) entered into settlement agreements with the Securities and Exchange Commission (SEC) and Minnesota Department of Commerce (MDOC) related to market timing activities. As a result, AEFC was censured and ordered to cease and desist from committing or causing any violations of certain provisions of the Investment Advisers Act of 1940, the Investment Company Act of 1940, and various Minnesota laws. AEFC agreed to pay disgorgement of $10 million and civil money penalties of $7 million. AEFC also agreed to retain an independent distribution consultant to assist in developing a plan for distribution of all disgorgement and civil penalties ordered by the SEC in accordance with various undertakings detailed at www.sec.gov/litigation/admin/ia-2451.pdf. Ameriprise Financial and its affiliates have cooperated with the SEC and the MDOC in these legal proceedings, and have made regular reports to the funds' Boards of Trustees.
Ameriprise Financial and certain of its affiliates have historically been involved in a number of legal, arbitration and regulatory proceedings, including routine litigation, class actions, and governmental actions, concerning matters arising in connection with the conduct of their business activities. Ameriprise Financial believes that the Funds are not currently the subject of, and that neither Ameriprise Financial nor any of its affiliates are the subject of, any pending legal, arbitration or
regulatory proceedings that are likely to have a material adverse effect on the Funds or the ability of Ameriprise Financial or its affiliates to perform under their contracts with the Funds. Ameriprise Financial is required to make 10-Q, 10-K and, as necessary, 8-K filings with the Securities and Exchange Commission on legal and regulatory matters that relate to Ameriprise Financial and its affiliates. Copies of these filings may be obtained by accessing the SEC website at www.sec.gov.
There can be no assurance that these matters, or the adverse publicity associated with them, will not result in increased fund redemptions, reduced sale of fund shares or other adverse consequences to the Funds. Further, although we believe proceedings are not likely to have a material adverse effect on the Funds or the ability of Ameriprise Financial or its affiliates to perform under their contracts with the Funds, these proceedings are subject to uncertainties and, as such, we are unable to estimate the possible loss or range of loss that may result. An adverse outcome in one or more of these proceedings could result in adverse judgments, settlements, fines, penalties or other relief that could have a material adverse effect on the consolidated financial condition or results of operations of Ameriprise Financial.
Annual Report 2013
117
Columbia Capital Allocation Portfolios
Reports of Independent Registered Public Accounting Firm
To the Trustees of Columbia Funds Series Trust
In our opinion, the accompanying statement of assets and liabilities, including the portfolio of investments, and the related statements of operations and of changes in net assets and the financial highlights present fairly, in all material respects, the financial position of Columbia Capital Allocation Moderate Conservative Portfolio (formerly known as Columbia LifeGoal® Income and Growth Portfolio) and Columbia Capital Allocation Moderate Aggressive Portfolio (formerly known as Columbia LifeGoal® Balanced Growth Portfolio), each a series of Columbia Funds Series Trust (collectively, the "Portfolios") at January 31, 2013, the results of each of their operations for the year then ended, the changes in each of their net assets and the financial highlights for each of the periods indicated, in conformity with accounting principles generally accepted in the United States of America. These financial statements and financial highlights (hereafter referred to as "financial statements") are the responsibility of the Portfolios' management. Our responsibility is to express an opinion on these financial statements based on our audits. We conducted our audits of these financial statements in accordance with the standards of the Public Company Accounting Oversight Board (United States). Those standards require that we plan and perform the audit to obtain reasonable assurance about whether the financial statements are free of material misstatement. An audit includes examining, on a test basis, evidence supporting the amounts and disclosures in the financial statements, assessing the accounting principles used and significant estimates made by management, and evaluating the overall financial statement presentation. We believe that our audits, which included confirmation of securities at January 31, 2013 by correspondence with the custodian, transfer agent and brokers, provide a reasonable basis for our opinion.
PricewaterhouseCoopers LLP
Minneapolis, Minnesota
March 22, 2013
To the Trustees of Columbia Funds Series Trust II
In our opinion, the accompanying statement of assets and liabilities, including the portfolio of investments, and the related statements of operations and of changes in net assets and the financial highlights present fairly, in all material respects, the financial position of Columbia Capital Allocation Conservative Portfolio (formerly known as Columbia Portfolio Builder Conservative Fund), Columbia Capital Allocation Moderate Portfolio (formerly known as Columbia Portfolio Builder Moderate Fund), and Columbia Capital Allocation Aggressive Portfolio (formerly known as Columbia Portfolio Builder Aggressive Fund), each a series of Columbia Funds Series Trust II (collectively, the "Portfolios") at January 31, 2013, the results of each of their operations, the changes in each of their net assets and the financial highlights for the year then ended, in conformity with accounting principles generally accepted in the United States of America. These financial statements and financial highlights (hereafter referred to as "financial statements") are the responsibility of the Portfolios' management. Our responsibility is to express an opinion on these financial statements based on our audits. We conducted our audits of these financial statements in accordance with the standards of the Public Company Accounting Oversight Board (United States). Those standards require that we plan and perform the audit to obtain reasonable assurance about whether the financial statements are free of material misstatement. An audit includes examining, on a test basis, evidence supporting the amounts and disclosures in the financial statements, assessing the accounting principles used and significant estimates made by management, and evaluating the overall financial statement presentation. We believe that our audits, which included confirmation of securities at January 31, 2013 by correspondence with the transfer agent and brokers, provide a reasonable basis for our opinion. The statements of changes in net assets and the financial highlights of the Portfolios for the periods ended January 31, 2012 and prior were audited by another independent registered public accounting firm whose report dated March 26, 2012 expressed an unqualified opinion on those statements and highlights.
PricewaterhouseCoopers LLP
Minneapolis, Minnesota
March 22, 2013
Annual Report 2013
118
Columbia Capital Allocation Portfolios
Federal Income Tax Information
(Unaudited)
The Funds hereby designates the following tax attributes for the fiscal year ended January 31, 2013. Shareholders will be notified in early 2014 of the amounts for use in preparing 2013 income tax returns.
| | Qualified
Dividend
Income (%) | | Dividends
Received
Deduction (%) | | Capital Gain
Dividend ($) | | U.S. Government
Income, may be
exempt from
state taxation (%) | | Foreign
Taxes Paid ($) | | Foreign
Source
Income ($) | |
Columbia Capital
Allocation
Conservative Portfolio | | | 14.38 | | | | 10.79 | | | | 7,625,878 | | | | 6.60 | | | | 39,857 | | | | 1,083,932 | | |
Columbia Capital
Allocation Moderate
Conservative Portfolio | | | 18.19 | | | | 15.47 | | | | 4,194,507 | | | | 2.96 | | | | 14,057 | | | | 299,733 | | |
Columbia Capital
Allocation
Moderate Portfolio | | | 30.45 | | | | 20.18 | | | | 15,811,860 | | | | 4.50 | | | | 394,037 | | | | 3,937,713 | | |
Columbia Capital
Allocation
Aggressive Portfolio | | | 79.41 | | | | 49.99 | | | | — | | | | 2.94 | | | | 215,072 | | | | 1,340,422 | | |
Columbia Capital
Allocation Moderate
Aggressive Portfolio | | | 46.37 | | | | 35.01 | | | | 35,039,043 | | | | 2.52 | | | | 290,548 | | | | 1,701,667 | | |
Qualified Dividend Income. For taxable, non-corporate shareholders, the percentage of ordinary income dividends paid during the fiscal year that represents qualified dividend income subject to reduced tax rates under the Jobs and Growth Tax Relief Reconciliation Act of 2003.
Dividends Received Deduction. The percentage of ordinary income dividends paid during the fiscal year that qualifies for the corporate dividends received deduction.
Capital Gain Dividend. The Fund designates as a capital gain dividend the amount reflected above, or if subsequently determined to be different, the net capital gain of such fiscal period. The Fund also designates as capital gain dividends, to the extent necessary to fully distribute such capital gains, earnings and profits distributed to shareholders on the redemption of shares.
Foreign Taxes. The Fund makes the election to pass through to shareholders the foreign taxes paid. These taxes, and the corresponding foreign source income, are provided.
Annual Report 2013
119
Columbia Capital Allocation Portfolios
Shareholders elect the Board that oversees the Funds' operations. The Board appoints officers who are responsible for day-to-day business decisions based on policies set by the Board. The following table provides basic biographical information about the Funds' Board members, including their principal occupations during the past five years, although specific titles for individuals may have varied over the period. Under current Board policy, members may serve until the next Board meeting after he or she reaches the mandatory retirement age established by the Board, or the fifteenth anniversary of the first Board meeting they attended as a member of the Board.
Mr. Edward J. Boudreau, Jr., Mr. William P. Carmichael, Mr. William A. Hawkins, Mr. R. Glenn Hilliard, Ms. Minor M. Shaw and Dr. Anthony M. Santomero, were members of the Legacy Columbia Nations Funds' Board ("Nations Funds"), which includes Columbia Funds Series Trust, Columbia Funds Variable Insurance Trust I and Columbia Funds Master Investment Trust, LLC and began service on the Board for the Legacy RiverSource Funds ("RiverSource Funds") effective June 1, 2011.
Independent Trustees
Name,
Address,
Year of Birth | | Position Held With
Funds and Length of
Service | | Principal Occupation
During Past Five Years | | Number of
Funds in the
Fund Family
Overseen by
Board Member | | Other Present or Past
Directorships/Trusteeships
(Within Past 5 Years) | |
Kathleen Blatz
901 S. Marquette Ave.
Minneapolis, MN 55402
1954 | | Board member since 1/06 for RiverSource Funds and since 6/11 for Nations Funds | | Attorney; Chief Justice, Minnesota Supreme Court, 1998-2006 | | | 152 | | | Director, BlueCross BlueShield of Minnesota since 2009 | |
Edward J. Boudreau, Jr.
225 Franklin Street
Boston, MA 02110
1944 | | Board member since 6/11 for RiverSource Funds and since 1/05 for Nations Funds | | Managing Director, E.J. Boudreau & Associates (consulting) since 2000 | | | 145 | | | Former Trustee, BofA Funds Series Trust (11 funds) | |
Pamela G. Carlton
901 S. Marquette Ave.
Minneapolis, MN 55402
1954 | | Board member since 7/07 for RiverSource Funds and since 6/11 for Nations Funds | | President, Springboard — Partners in Cross Cultural Leadership (consulting company) since 2003 | | | 152 | | | None | |
William P. Carmichael
225 Franklin Street
Boston, MA 02110
1943 | | Board member since 6/11 for RiverSource Funds and since 1999 for Nations Funds | | Retired | | | 145 | | | Director, Cobra Electronics Corporation (electronic equipment manufacturer); The Finish Line (athletic shoes and apparel) since July 2003; McMoRan Exploration Company (oil and gas exploration and development) since 2010; former Trustee, BofA Funds Series Trust (11 funds); former Director, Spectrum Brands, Inc. (consumer products); former Director, Simmons Company (bedding) | |
Patricia M. Flynn
901 S. Marquette Ave.
Minneapolis, MN 55402
1950 | | Board member since 11/04 for RiverSource Funds and since 6/11 for Nations Funds | | Trustee Professor of Economics and Management, Bentley University since 1976 | | | 152 | | | None | |
William A. Hawkins
225 Franklin Street
Boston, MA 02110
1942 | | Board member since 6/11 for RiverSource Funds and since 1/05 for Nations Funds | | Managing Director, Overton Partners (financial consulting), since August 2010; President and Chief Executive Officer, California General Bank, N.A., January 2008-August 2010. | | | 145 | | | Trustee, BofA Funds Series Trust (11 funds) | |
Annual Report 2013
120
Columbia Capital Allocation Portfolios
Trustees and Officers (continued)
Independent Trustees (continued)
Name,
Address,
Year of Birth | | Position Held With
Funds and Length of
Service | | Principal Occupation
During Past Five Years | | Number of
Funds in the
Fund Family
Overseen by
Board Member | | Other Present or Past
Directorships/Trusteeships
(Within Past 5 Years) | |
R. Glenn Hilliard
225 Franklin Street
Boston, MA 02110
1943 | | Board member since 6/11 for RiverSource Funds and since 1/05 for Nations Funds | | Chairman and Chief Executive Officer, Hilliard Group LLC (investing and consulting), since April 2003; Non-Executive Director & Chairman, CNO Financial Group, Inc. (insurance), September 2003-May 2011 | | | 145 | | | Chairman, BofA Fund Series Trust (11 funds); former Director, CNO Financial Group, Inc. (insurance) | |
Stephen R. Lewis, Jr.
901 S. Marquette Ave.
Minneapolis, MN 55402
1939 | | Chair of the Board for RiverSource Funds since 1/07, Board member for RiverSource Funds since 1/02 and since 6/11 for Nations Funds | | President Emeritus and Professor of Economics Emeritus, Carleton College since 2002 | | | 152 | | | Director, Valmont Industries, Inc. (manufactures irrigation systems) since 2002 | |
Catherine James Paglia
901 S. Marquette Ave.
Minneapolis, MN 55402
1952 | | Board member since 11/04 for RiverSource Funds and since 6/11 for Nations Funds | | Director, Enterprise Asset Management, Inc. (private real estate and asset management company) | | | 152 | | | Director, Valmont Industries, Inc. (manufactures irrigation systems) since 2012 | |
Leroy C. Richie
901 S. Marquette Ave.
Minneapolis, MN 55402
1941 | | Board member since 2000 for Legacy Seligman Funds, since 11/08 for RiverSource Funds and since 6/11 for Nations Funds | | Counsel, Lewis & Munday, P.C. (law firm) since 2004; former Vice President and General Counsel, Automotive Legal Affairs, Chrysler Corporation | | | 152 | | | Lead Outside Director, Digital Ally, Inc. (digital imaging) since September 2005; Director, Infinity, Inc. (oil and gas exploration and production) since 1994; Director, OGE Energy Corp. (energy and energy services) since November 2007 | |
Minor M. Shaw
225 Franklin Street
Boston, MA 02110
1947 | | Board member since 6/11 for RiverSource Funds and since 2003 for Nations Funds | | President, Micco LLC (private investments) since 2011; President, Micco Corp. since 1998 | | | 145 | | | Director, Piedmont Natural Gas; Director, BlueCross BlueShield of South Carolina since April 2008; Former Trustee, BofA Funds Series Trust (11 funds) | |
Alison Taunton-Rigby
901 S. Marquette Ave.
Minneapolis, MN 55402
1944 | | Board member since 11/02 for RiverSource Funds and since 6/11 for Nations Funds | | Chief Executive Officer and Director, RiboNovix, Inc., 2003-2010 (biotechnology) | | | 152 | | | Director, Healthways, Inc. (health and well-being improvement) since 2005; Director, ICI Mutual Insurance Company, RRG since 2011; Director, Abt Associates (government contractor) since 2001; Director, Boston Children's Hospital since 2002 | |
Annual Report 2013
121
Columbia Capital Allocation Portfolios
Trustees and Officers (continued)
Interested Trustee Not Affiliated With Investment Manager*
Name,
Address,
Year of Birth | | Position Held With
Funds and Length of
Service | | Principal Occupation
During Past Five Years | | Number of
Funds in the
Fund Family
Overseen by
Board Member | | Other Present or Past
Directorships/Trusteeships
(Within Past 5 Years) | |
Anthony M. Santomero
225 Franklin Street
Boston, MA 02110
1946 | | Board member since 6/11 for RiverSource Funds and since 1/08 for Nations Funds | | Richard K. Mellon Professor Emeritus of Finance, The Wharton School, University of Pennsylvania, since 2002; Senior Advisor, McKinsey & Company (consulting), 2006-2008 | | | 145 | | | Director, Renaissance Reinsurance Ltd. since May 2008; Trustee, Penn Mutual Life Insurance Company since March 2008; Director, Citigroup since 2009; Director, Citibank, N.A. since 2009; former Trustee, BofA Funds Series Trust (11 funds) | |
*Dr. Santomero is not an affiliated person of the investment manager or Ameriprise Financial. However, he is currently deemed by the Funds to be an "interested person" (as defined in the 1940 Act) of the Funds because he serves as a Director of Citigroup, Inc. and Citibank N.A., companies that may directly or through subsidiaries and affiliates engage from time-to-time in brokerage execution, principal transactions and lending relationships with the Funds or accounts advised/managed by the investment manager.
Interested Trustee Affiliated With Investment Manager*
Name,
Address,
Year of Birth | | Position Held With
Funds and Length of
Service | | Principal Occupation
During Past Five Years | | Number of
Funds in the
Fund Family
Overseen by
Board Member | | Other Present or Past
Directorships/Trusteeships
(Within Past 5 Years) | |
William F. Truscott
53600 Ameriprise
Financial Center
Minneapolis, MN 55474
1960 | | Board member since 11/01 for RiverSource Funds and since 6/11 for Nations Funds; Senior Vice President since 2002 | | President, Columbia Management Investment Advisers, LLC since February 2012, (previously President, Chairman of the Board and Chief Investment Officer, 2001-April 2010); Chief Executive Officer, Global Asset Management, Ameriprise Financial, Inc. since September 2012 (previously Chief Executive Officer, U.S. Asset Management & President, Annuities, May 2010-September 2012 and President — U.S. Asset Management and Chief Investment Officer, 2005-April 2010); Chief Executive Officer, Columbia Management Investment Distributors, Inc. since February 2012, (previously Chairman of the Board and Chief Executive Officer, 2006-April 2010); Chairman of the Board and Chief Executive Officer, RiverSource Distributors, Inc. since 2006; President and Chief Executive Officer, Ameriprise Certificate Company 2006-August 2012. | | | 204 | | | Chairman of the Board, Columbia Management Investment Advisers, LLC since May 2012; Director, Columbia Management Investment Distributors, Inc. since May 2010; Director, Ameriprise Certificate Company, 2006-January 2013 | |
*Interested person (as defined under the 1940 Act) by reason of being an officer, director, security holder and/or employee of the investment manager or Ameriprise Financial.
The SAI has additional information about the Fund's Board members and is available, without charge, upon request by calling 800.345.6611; contacting your financial intermediary; or visiting columbiamanagement.com.
Annual Report 2013
122
Columbia Capital Allocation Portfolios
Trustees and Officers (continued)
The Board has appointed officers who are responsible for day-to-day business decisions based on policies it has established. The officers serve at the pleasure of the Board. In addition to Mr. Truscott, who is Senior Vice President, the Funds' other officers are:
Officers
Name,
Address,
Year of Birth | | Position Held With | | Principal Occupation During Past Five Years
Funds and Length of
Service | |
J. Kevin Connaughton
225 Franklin Street
Boston, MA 02110
1964 | | President and Principal Executive Officer since 5/10 for RiverSource Funds and 2009 for Nations Funds | | Senior Vice President and General Manager — Mutual Fund Products, Columbia Management Investment Advisers, LLC since May 2010; Managing Director of Columbia Management Advisors, LLC, December 2004-April 2010; Senior Vice President and Chief Financial Officer, Columbia Funds, June 2008-January 2009; Treasurer, Columbia Funds, October 2003-May 2008 | |
Amy K. Johnson
5228 Ameriprise Financial Center Minneapolis, MN 55474
1965 | | Vice President since 12/06 for RiverSource Funds and 5/10 for Nations Funds | | Senior Vice President and Chief Operating Officer, Columbia Management Investment Advisers, LLC since May 2010 (previously Chief Administrative Officer, 2009-April 2010 and Vice President — Asset Management and Trust Company Services, 2006-2009) | |
Michael G. Clarke
225 Franklin Street
Boston, MA 02110
1969 | | Treasurer since 1/11 and Chief Financial Officer since 4/11 RiverSource Funds and Treasurer since 3/11 and Chief Financial Officer since 2009 for Nations Funds | | Vice President, Columbia Management Investment Advisers, LLC since May 2010; Managing Director of Fund Administration, Columbia Management Advisors, LLC, September 2004-April 2010; senior officer of Columbia Funds and affiliated funds since 2002 | |
Scott R. Plummer
5228 Ameriprise Financial Center Minneapolis, MN 55474
1959 | | Senior Vice President and Chief Legal Officer since 12/06 and Assistant Secretary since 6/11 for RiverSource Funds and Senior Vice President and Chief Legal Officer since 5/10 and Assistant Secretary since 6/11 for Nations Funds | | Senior Vice President, Chief Legal Officer and Assistant Secretary, Columbia Management Investment Advisers, LLC since June 2005; Vice President and Lead Chief Counsel — Asset Management, Ameriprise Financial, Inc. since May 2010 (previously Vice President and Chief Counsel — Asset Management, 2005-April 2010); Vice President, Chief Counsel and Assistant Secretary, Columbia Management Investment Distributors, Inc. since 2008; Vice President, General Counsel and Secretary, Ameriprise Certificate Company since 2005; Chief Counsel, RiverSource Distributors, Inc. since 2006 | |
Colin Moore
225 Franklin Street
Boston, MA 02110
1958 | | Senior Vice President since 5/10 for RiverSource Funds and Nations Funds | | Director and Chief Investment Officer, Columbia Management Investment Advisers, LLC since May 2010; Manager, Managing Director and Chief Investment Officer, Columbia Management Advisors, LLC, 2007-April 2010 | |
Thomas P. McGuire
225 Franklin Street
Boston, MA 02110
1972 | | Chief Compliance Officer since 3/12 | | Vice President — Asset Management Compliance, Columbia Management Investment Advisers, LLC since 2010; Chief Compliance Officer, Ameriprise Certificate Company since September 2010; Compliance Executive, Bank of America, 2005-2010 | |
Stephen T. Welsh
225 Franklin Street
Boston, MA 02110
1957 | | Vice President since 4/11 for RiverSource Funds and 2006 for Nations Funds | | President and Director, Columbia Management Investment Services Corp. since May 2010; President and Director, Columbia Management Services, Inc., July 2004- April 2010; Managing Director, Columbia Management Distributors, Inc., August 2007-April 2010 | |
Christopher O. Petersen
5228 Ameriprise Financial Center Minneapolis, MN 55474
1970 | | Vice President and Secretary since 4/11 for RiverSource Funds and 3/11 for Nations Funds | | Vice President and Chief Counsel, Ameriprise Financial, Inc. since January 2010 (formerly Vice President and Group Counsel or Counsel, April 2004-January 2010); Assistant Secretary of Legacy RiverSource Funds, January 2007-April 2011 and of the Nations Funds, May 2010-March 2011 | |
Annual Report 2013
123
Columbia Capital Allocation Portfolios
Trustees and Officers (continued)
Officers (continued)
Name,
Address,
Year of Birth | | Position Held With | | Principal Occupation During Past Five Years
Funds and Length of
Service | |
Paul D. Pearson
10468 Ameriprise Financial Center Minneapolis, MN 55474
1956 | | Vice President since 4/11 and Assistant Treasurer since 1999 for RiverSource Funds and Vice President and Assistant Treasurer since 6/11 for Nations Funds | | Vice President — Investment Accounting, Columbia Management Investment Advisers, LLC, since May 2010; Vice President — Managed Assets, Investment Accounting, Ameriprise Financial Corporation, February 1998-May 2010 | |
Joseph F. DiMaria
225 Franklin Street
Boston, MA 02110
1968 | | Vice President and Chief Accounting Officer since 4/11 and Vice President since 3/11 and Chief Accounting Officer since 2008 for Nations Funds | | Vice President, Mutual Fund Administration, Columbia Management Investment Advisers, LLC, since May 2010; Director of Fund Administration, Columbia Management Advisors, LLC, January 2006-April 2010 | |
Paul B. Goucher
100 Park Avenue
New York, NY 10017
1968 | | Vice President since 4/11 and Assistant Secretary since 11/08 for RiverSource Funds and 5/10 for Nations Funds | | Vice President and Lead Chief Counsel, Ameriprise Financial, Inc. since November 2008 and January 2013, respectively (formerly, Chief Counsel, January 2010-January 2013 and Group Counsel from November 2008-January 2010); Director, Managing Director and General Counsel, J. & W. Seligman & Co. Incorporated, July 2008-November 2008 (previously, Managing Director and Associate General Counsel, January 2005-July 2008) | |
Michael E. DeFao
225 Franklin Street
Boston, MA 02110
1968 | | Vice President since 4/11 and Assistant Secretary since 5/10 for RiverSource Funds and 2011 for Nations Funds | | Vice President and Chief Counsel, Ameriprise Financial, Inc. since May 2010; Associate General Counsel Bank of America, June 2005-April 2010 | |
Annual Report 2013
124
Columbia Capital Allocation Portfolios
Shareholder Meeting Results
(Unaudited)
Columbia Capital Allocation Conservative Portfolio
Special Meeting of Shareholders Held on February 27, 2013
At a Joint Special Meeting of Shareholders held on February 27, 2013 (the "Meeting"), shareholders of the Fund approved a proposed amendment to the Fund's investment management services agreement changing the Fund's advisory fee structure. The votes cast for or against as well as the number of abstentions and broker non-votes as to the proposal are set forth below. A vote is based on total dollar interest in the Fund as of the record date of the Meeting.
| | | Votes For | | Votes Against | | Abstentions | | Broker Non-Votes | |
| | | | | | 15,800,927 | | | | 612,375 | | | | 1,006,846 | | | | 0 | | |
Annual Report 2013
125
Columbia Capital Allocation Portfolios
Shareholder Meeting Results
(Unaudited)
Columbia Capital Allocation Moderate Portfolio
Special Meeting of Shareholders Held on February 27, 2013
At a Joint Special Meeting of Shareholders held on February 27, 2013 (the "Meeting"), shareholders of the Fund approved a proposed amendment to the Fund's investment management services agreement changing the Fund's advisory fee structure. The votes cast for or against as well as the number of abstentions and broker non-votes as to the proposal are set forth below. A vote is based on total dollar interest in the Fund as of the record date of the Meeting.
| | | Votes For | | Votes Against | | Abstentions | | Broker Non-Votes | |
| | | | | | 69,058,870 | | | | 4,409,453 | | | | 4,569,862 | | | | 0 | | |
Annual Report 2013
126
Columbia Capital Allocation Portfolios
Shareholder Meeting Results
(Unaudited)
Columbia Capital Allocation Aggressive Portfolio
Special Meeting of Shareholders Held on February 27, 2013
At a Joint Special Meeting of Shareholders held on February 27, 2013 (the "Meeting"), shareholders of the Fund approved a proposed amendment to the Fund's investment management services agreement changing the Fund's advisory fee structure. The votes cast for or against as well as the number of abstentions and broker non-votes as to the proposal are set forth below. A vote is based on total dollar interest in the Fund as of the record date of the Meeting.
| | | Votes For | | Votes Against | | Abstentions | | Broker Non-Votes | |
| | | | | | 24,257,220 | | | | 2,153,890 | | | | 1,496,992 | | | | 0 | | |
Annual Report 2013
127
This page intentionally left blank.
Annual Report 2013
128
Columbia Capital Allocation Portfolios
Important Information About This Report
Each fund mails one shareholder report to each shareholder address. If you would like more than one report, please call shareholder services at 800.345.6611 and additional reports will be sent to you.
The policy of the Board is to vote the proxies of the companies in which each fund holds investments consistent with the procedures as stated in the Statement of Additional Information (SAI). You may obtain a copy of the SAI without charge by calling 800.345.6611; contacting your financial intermediary; visiting columbiamanagement.com; or searching the website of the Securities and Exchange Commission (SEC) at sec.gov. Information regarding how each fund voted proxies relating to portfolio securities is filed with the SEC by August 31 for the most recent 12-month period ending June 30 of that year, and is available without charge by visiting columbiamanagement.com; or searching the website of the SEC at sec.gov.
Each fund files a complete schedule of portfolio holdings with the SEC for the first and third quarters of each fiscal year on Form N-Q. Each fund's Form N-Q is available on the SEC's website at sec.gov and may be reviewed and copied at the SEC's Public Reference Room in Washington, D.C. Information on the operation of the Public Reference Room may be obtained by calling 800.SEC.0330. Each fund's complete schedule of portfolio holdings, as filed on Form N-Q, can also be obtained without charge, upon request, by calling 800.345.6611.
Annual Report 2013
129

Columbia Capital Allocation Portfolios
P.O. Box 8081
Boston, MA 02266-8081
columbiamanagement.com
This information is for use with concurrent or prior delivery of a fund prospectus. Please read and consider the investment objectives, risks, charges and expenses for any fund carefully before investing. For a prospectus which contains this and other important information about the Funds go to columbiamanagement.com. The Funds are distributed by Columbia Management Investment Distributors, Inc., member FINRA, and managed by Columbia Management Investment Advisers, LLC.
© 2013 Columbia Management Investment Advisers, LLC. All rights reserved.
ANN124_01_C01_(03/13)
Item 2. Code of Ethics.
(a) The registrant has adopted a code of ethics that applies to the registrant’s principal executive officer, principal financial officer, principal accounting officer or controller, or persons performing similar functions, regardless of whether these individuals are employed by the registrant or a third party.
(b) During the period covered by this report, there were not any amendments to a provision of the code of ethics adopted in 2(a) above.
(c) During the period covered by this report, there were no waivers, including any implicit waivers, from a provision of the code of ethics described in 2(a) above that relates to one or more of the items set forth in paragraph (b) of this item’s instructions.
Item 3. Audit Committee Financial Expert.
The registrant’s Board of Trustees has determined that Edward J. Boudreau, Pamela G. Carlton, William P. Carmichael, William A. Hawkins and Alison Taunton-Rigby, each of whom are members of the registrant’s Board of Trustees and Audit Committee, each qualify as an audit committee financial expert. Mr. Boudreau, Ms. Carlton, Mr. Carmichael, Mr. Hawkins and Ms. Taunton-Rigby are each independent trustees, as defined in paragraph (a)(2) of this item’s instructions.
Item 4. Principal Accountant Fees and Services.
Fee information below is disclosed for the five series of the registrant whose report to stockholders are included in this annual filing. The series changed its fiscal year end from March 31 to January 31, effective January 31, 2012. The fees presented for 2012 represent the ten month period ended January 31, 2012.
(a) Audit Fees. Aggregate Audit Fees billed by the principal accountant for professional services rendered during the fiscal years ended January 31, 2013 and January 31, 2012 are approximately as follows:
2013 | | 2012 | |
$ | 66,300 | | $ | 77,900 | |
| | | | | |
Audit Fees include amounts related to the audit of the registrant’s annual financial statements or services that are normally provided by the accountant in connection with statutory and regulatory filings or engagements for those fiscal years.
(b) Audit-Related Fees. Aggregate Audit-Related Fees billed to the registrant by the principal accountant for professional services rendered during the fiscal years ended January 31, 2013 and January 31, 2012 are approximately as follows:
Audit-Related Fees include amounts for assurance and related services by the principal accountant that are reasonably related to the performance of the audit of the registrant’s financial statements and are not reported in Audit Fees above. In both fiscal years 2013 and 2012, Audit-Related Fees consist of agreed-upon procedures performed for semi-annual shareholder reports and agreed- upon procedures related to fund mergers. Fiscal year 2012 also included Audit-Related Fees for agreed-upon procedures for fund accounting and custody conversions.
During the fiscal years ended January 31, 2013 and January 31, 2012, there were no Audit-Related Fees billed by the registrant’s principal accountant to the registrant’s investment adviser (not including any sub-adviser whose role is primarily portfolio management and is subcontracted with or overseen by another investment adviser) and any entity controlling, controlled by, or under common control with the adviser that provides ongoing services to the registrant for an engagement that related directly to the operations and financial reporting of the registrant.
(c) Tax Fees. Aggregate Tax Fees billed by the principal accountant to the registrant for professional services rendered during the fiscal years ended January 31, 2013 and January 31, 2012 are approximately as follows:
2013 | | 2012 | |
$ | 28,600 | | $ | 36,200 | |
| | | | | |
Tax Fees include amounts for the review of annual tax returns, the review of required shareholder distribution calculations and typically include amounts for professional services by the principal accountant for tax compliance, tax advice and tax planning. In both fiscal years 2013 and 2012, Tax Fees also include agreed-upon procedures related to foreign tax filings.
During the fiscal years ended January 31, 2013 and January 31, 2012, there were no Tax Fees billed by the registrant’s principal accountant to the registrant’s investment adviser (not including any sub-adviser whose role is primarily portfolio management and is subcontracted with or overseen by another investment adviser) and any entity controlling, controlled by, or under common control with the adviser that provides ongoing services
to the registrant for an engagement that related directly to the operations and financial reporting of the registrant.
(d) All Other Fees. Aggregate All Other Fees billed by the principal accountant to the registrant for professional services rendered during the fiscal years ended January 31, 2013 and January 31, 2012 are approximately as follows:
All Other Fees include amounts for products and services provided by the principal accountant, other than the services reported in paragraphs (a) through (c) above.
Aggregate All Other Fees billed by the registrant’s principal accountant to the registrant’s investment adviser (not including any sub-adviser whose role is primarily portfolio management and is subcontracted with or overseen by another investment adviser) and any entity controlling, controlled by, or under common control with the adviser that provides ongoing services to the registrant for an engagement that related directly to the operations and financial reporting of the registrant during the fiscal years ended January 31, 2013 and January 31, 2012 are approximately as follows:
2013 | | 2012 | |
$ | 285,800 | | $ | 225,000 | |
| | | | | |
In both fiscal years 2013 and 2012, All Other Fees consist of fees billed for internal control examinations of the registrant’s transfer agent and investment advisor.
(e)(1) Audit Committee Pre-Approval Policies and Procedures
The registrant’s Audit Committee is required to pre-approve the engagement of the registrant’s independent accountants to provide audit and non-audit services to the registrant and non-audit services to its investment adviser (not including any sub-adviser whose role is primarily portfolio management and is subcontracted with or overseen by another investment adviser) or any entity controlling, controlled by or under common control with such investment adviser that provides ongoing services to the registrant (“Adviser Affiliates”), if the engagement relates directly to the operations and financial reporting of the registrant.
The Audit Committee has adopted a Policy for Engagement of Independent Accountants for Audit and Non-Audit Services (“Policy”). The Policy sets forth the understanding of the Audit Committee regarding the engagement of the registrant’s independent accountants to provide (i) audit and permissible audit-related, tax and other services to the registrant (collectively “Fund Services”); (ii) non-audit services to the registrant’s investment adviser (not including any sub-adviser whose role is primarily portfolio management and is subcontracted with or overseen by another investment adviser) and Adviser Affiliates, if the engagement relates directly to the operations or financial
reporting of a Fund (collectively “Fund-related Adviser Services”); and (iii) certain other audit and non-audit services to the registrant’s investment adviser (not including any sub-adviser whose role is primarily portfolio management and is subcontracted with or overseen by another investment adviser) and Adviser Affiliates. As set forth in this Fund Policy, a service will require specific pre-approval by the Audit Committee if it is to be provided by the Fund’s independent auditor; provided, however, that pre-approval of non-audit services to the Fund, the Adviser or Control Affiliates may be waived if certain de minimis requirements set forth in the SEC’s rules are met.
Under the Policy, the Audit Committee may delegate pre-approval authority to any pre-designated member or members who are Independent Trustees/Directors. The member(s) to whom such authority is delegated must report, for informational purposes only, any pre-approval decisions to the Audit Committee at its next regular meeting. The Audit Committee’s responsibilities with respect to the pre-approval of services performed by the independent accountants may not be delegated to management.
On an annual basis, at a regularly scheduled Audit Committee meeting, the Fund’s Treasurer or other Fund Officer shall submit to the Audit Committee a schedule of the types of Fund Services and Fund-related Adviser Services that are subject to specific pre-approval.
This schedule will provide a description of each type of service that is subject to specific pre-approval, along with total projected fees for each service. The pre-approval will generally cover a one-year period. The Audit Committee will review and approve the types of services and the projected fees for the next one-year period and may add to, or subtract from, the list of pre-approved services from time to time, based on subsequent determinations. This specific approval acknowledges that the Audit Committee is in agreement with the types of services that the independent accountants will be permitted to perform.
The Fund’s Treasurer or other Fund Officer shall report to the Audit Committee at each of its regular meetings regarding all Fund Services or Fund-related Adviser Services initiated since the last such report was rendered, including a general description of the services with forecasted fees for the annual period, proposed changes requiring specific pre-approval and a description of services provided by the independent auditor with actual fees during the current reporting period.
*****
(e)(2) 100% of the services performed for items (b) through (d) above during 2013 and 2012 were pre-approved by the registrant’s Audit Committee.
(f) Not applicable.
(g) The aggregate non-audit fees billed by the registrant’s accountant for services rendered to the registrant, and rendered to the registrant’s investment adviser (not including any sub-adviser whose role is primarily portfolio management and is
subcontracted with or overseen by another investment adviser), and any entity controlling, controlled by, or under common control with the adviser that provides ongoing services to the registrant for the fiscal years ended January 31, 2013 and January 31, 2012 are approximately as follows:
2013 | | 2012 | |
$ | 323,900 | | $ | 305,200 | |
| | | | | |
(h) The registrant’s Audit Committee of the Board of Directors has considered whether the provision of non-audit services that were rendered to the registrant’s adviser (not including any sub-adviser whose role is primarily portfolio management and is subcontracted with or overseen by another investment adviser), and any entity controlling, controlled by, or under common control with the investment adviser that provides ongoing services to the registrant that were not pre-approved pursuant to paragraph (c)(7)(ii) of Rule 2-01 of Regulation S-X, is compatible with maintaining the principal accountant’s independence.
Item 5. Audit Committee of Listed Registrants.
Not applicable.
Item 6. Investments
(a) The registrant’s “Schedule I – Investments in securities of unaffiliated issuers” (as set forth in 17 CFR 210.12-12) is included in Item 1 of this Form N-CSR.
(b) Not applicable.
Item 7. Disclosure of Proxy Voting Policies and Procedures for Closed-End Management Investment Companies.
Not applicable.
Item 8. Portfolio Managers of Closed-End Management Investment Companies.
Not applicable.
Item 9. Purchases of Equity Securities by Closed-End Management Investment Company and Affiliated Purchasers.
Not applicable.
Item 10. Submission of Matters to a Vote of Security Holders.
There were no material changes to the procedures by which shareholders may recommend nominees to the registrant’s board of directors.
Item 11. Controls and Procedures.
(a) The registrant’s principal executive officer and principal financial officers, based on their evaluation of the registrant’s disclosure controls and procedures as of a date within 90 days of the filing of this report, have concluded that such controls and procedures are adequately designed to ensure that material information required to be disclosed by the registrant in Form N-CSR is accumulated and communicated to the registrant’s management, including the principal executive officer and principal financial officer, or persons performing similar functions, as appropriate to allow timely decisions regarding required disclosure.
(b) During November 2012, the registrant enhanced internal controls over financial reporting relating to the recording of certain last day trades. These controls include (i) additional analysis of last day security purchase prices, (ii) comparisons of cost and market value for last day trades and (iii) analytical review of per share changes resulting from financial statement adjustments.
Item 12. Exhibits.
(a)(1) Code of ethics required to be disclosed under Item 2 of Form N-CSR attached hereto as Exhibit 99.CODE ETH.
(a)(2) Certifications pursuant to Rule 30a-2(a) under the Investment Company Act of 1940 (17 CFR 270.30a-2(a)) attached hereto as Exhibit 99.CERT.
(a)(3) Not applicable.
(b) Certification pursuant to Rule 30a-2(b) under the Investment Company Act of 1940 (17 CFR 270.30a-2(b)) attached hereto as Exhibit 99.906CERT.
SIGNATURES
Pursuant to the requirements of the Securities Exchange Act of 1934 and the Investment Company Act of 1940, the registrant has duly caused this report to be signed on its behalf by the undersigned, thereunto duly authorized.
(registrant) | | Columbia Funds Series Trust | |
| | |
By (Signature and Title) | /s/ J. Kevin Connaughton | |
| J. Kevin Connaughton, President and Principal Executive Officer | |
| | |
Date | | March 22, 2013 | |
| | | | |
Pursuant to the requirements of the Securities Exchange Act of 1934 and the Investment Company Act of 1940, this report has been signed below by the following persons on behalf of the registrant and in the capacities and on the dates indicated.
By (Signature and Title) | /s/ J. Kevin Connaughton | |
| J. Kevin Connaughton, President and Principal Executive Officer | |
| | |
Date | | March 22, 2013 | |
| | |
By (Signature and Title) | /s/ Michael G. Clarke | |
| Michael G. Clarke, Treasurer and Chief Financial Officer | |
| | |
Date | | March 22, 2013 | |