UNITED STATES
SECURITIES AND EXCHANGE COMMISSION
Washington, D.C. 20549
FORM N-CSR
CERTIFIED SHAREHOLDER REPORT OF REGISTERED
MANAGEMENT INVESTMENT COMPANIES
Investment Company Act file number | 811-09645 |
|
Columbia Funds Series Trust |
(Exact name of registrant as specified in charter) |
|
225 Franklin Street, Boston, Massachusetts | | 02110 |
(Address of principal executive offices) | | (Zip code) |
|
Scott R. Plummer 5228 Ameriprise Financial Center Minneapolis, MN 55474 |
(Name and address of agent for service) |
|
Registrant’s telephone number, including area code: | 1-612-671-1947 | |
|
Date of fiscal year end: | April 30 | |
|
Date of reporting period: | April 30, 2012 | |
| | | | | | | | |
Form N-CSR is to be used by management investment companies to file reports with the Commission not later than 10 days after the transmission to stockholders of any report that is required to be transmitted to stockholders under Rule 30e-1 under the Investment Company Act of 1940 (17 CFR 270.30e-1). The Commission may use the information provided on Form N-CSR in its regulatory, disclosure review, inspection, and policymaking roles.
A registrant is required to disclose the information specified by Form N-CSR, and the Commission will make this information public. A registrant is not required to respond to the collection of information contained in Form N-CSR unless the Form displays a currently valid Office of Management and Budget ("OMB") control number. Please direct comments concerning the accuracy of the information collection burden estimate and any suggestions for reducing the burden to Secretary, Securities and Exchange Commission, 450 Fifth Street, NW, Washington, DC 20549-0609. The OMB has reviewed this collection of information under the clearance requirements of 44 U.S.C. § 3507.
Item 1. Reports to Stockholders.

Columbia California Intermediate Municipal Bond Fund
Annual Report for the Period Ended April 30, 2012
Not FDIC insured • No bank guarantee • May lose value
Table of Contents
| Fund Profile | | | 1 | | |
|
| Performance Information | | | 2 | | |
|
| Understanding Your Expenses | | | 3 | | |
|
| Portfolio Managers' Report | | | 4 | | |
|
| Portfolio of Investments | | | 6 | | |
|
Statement of Assets and
Liabilities | | | 14 | | |
|
| Statement of Operations | | | 16 | | |
|
Statement of Changes in
Net Assets | | | 17 | | |
|
| Financial Highlights | | | 19 | | |
|
| Notes to Financial Statements | | | 23 | | |
|
Report of Independent Registered
Public Accounting Firm | | | 31 | | |
|
| Federal Income Tax Information | | | 32 | | |
|
| Fund Governance | | | 33 | | |
|
Approval of Investment
Management Services Agreement | | | 40 | | |
|
Important Information About
This Report | | | 45 | | |
|
The views expressed in this report reflect the current views of the respective parties. These views are not guarantees of future performance and involve certain risks, uncertainties and assumptions that are difficult to predict, so actual outcomes and results may differ significantly from the views expressed. These views are subject to change at any time based upon economic, market or other conditions and the respective parties disclaim any responsibility to update such views. These views may not be relied on as investment advice and, because investment decisions for a Columbia Fund are based on numerous factors, may not be relied on as an indication of trading intent on behalf of any particular Columbia Fund. References to specific securities should not be construed as a recommendation or investment advice.
President's Message

Dear Shareholders,
A stock market rally that commenced in the fourth quarter of 2011 continued into 2012 in the United States and around the world, as all major market regions generated double-digit returns for the three-month period ended March 31, 2012. Volatility declined sharply as European debt fears quieted somewhat and sentiment improved. Returns in developed countries were buoyed by strong results in Germany, Belgium, Austria and the Nordic markets of Denmark, Finland, Norway and Sweden. Under the cloud of its own mounting debt problem, Spain was the only eurozone country to deliver a negative return during the three-month period. Solid economic growth and accommodative monetary policy helped boost gains in emerging markets. The rally in U.S. equities was largely driven by an expansion in "multiples"—an increase in stock prices relative to their earnings. By the end of the first quarter of 2012, stocks no longer appeared as cheap as they were late in 2011. Bonds lagged stocks during the first quarter as investors responded to signs of an improved environment with a greater appetite for risk.
Concerns around the health of the global economy were centered in news headlines focusing on Washington D.C., Europe, China and the Middle East. In the United States, economic indicators remained mixed but generally indicated support for slow, sustainable economic growth. European policymakers have made progress in containing the eurozone debt crisis, though they still have not solved the issue of long-term solvency. The European Central Bank has lowered interest rates and flooded the financial system with liquidity that may provide breathing space for companies to restructure their balance sheets. These massive infusions of liquidity may whet the appetite for risk from investors around the world. However, it has delayed a true reckoning with the European financial situation, as concerns about Spain and Portugal continue to cloud the outlook. These structural challenges that persist in the developed world, and slowing growth in emerging market economies, leave the global economy in a fragile state. Domestic demand, combined with slowing inflationary trends, has also helped to shore up emerging market economies. Joblessness remains low and monetary conditions remain easy.
Despite the challenges and surprises of 2011, we see pockets of strength—and as a result, attractive opportunities—both here and abroad for 2012. We hope to help you capitalize on these opportunities with various articles in our 2012 Perspectives, which is available via the Market Insights tab at columbiamanagement.com. This publication showcases the strong research capabilities and experienced investment teams of Columbia Management and offers a diverse array of investment ideas based on our five key themes for 2012.
Other information and resources available at columbiamanagement.com include:
g detailed up-to-date fund performance and portfolio information
g economic analysis and market commentary
g quarterly fund commentaries
g Columbia Management Investor, our award-winning quarterly newsletter for shareholders
Thank you for your continued support of the Columbia Funds. We look forward to serving your investment needs for many years to come.
Best Regards,

J. Kevin Connaughton
President, Columbia Funds
Investors should consider the investment objectives, risks, charges and expenses of a mutual fund carefully before investing. For a free prospectus, which contains this and other important information about the funds, visit columbiamanagement.com. The prospectus should be read carefully before investing.
Columbia Funds are distributed by Columbia Management Investment Distributors, Inc., member FINRA, and managed by Columbia Management Investment Advisers, LLC.
© 2012 Columbia Management Investment Advisers, LLC. All rights reserved.
Fund Profile – Columbia California Intermediate Municipal Bond Fund
Summary
g For the 13-month period that ended April 30, 2012, the fund's Class A shares returned 12.23% without sales charge.
g The fund outperformed its primary benchmark, the Barclays 3-15 Year Blend Municipal Bond Index1 as well as the Barclays California 3-15 Year Blend Municipal Bond Index2 which returned 11.05% and 12.08%, respectively.
g The fund's emphasis on longer-intermediate maturities and overweights in A and BBB rated3 bonds gave it a performance advantage over its benchmarks.
Portfolio Management
Brian M. McGreevy has co-managed the fund since June 2011. From 1994 until joining Columbia Management Investment Advisers, LLC (the Investment Manager) in May 2010, Mr. McGreevy was associated with the fund's previous investment adviser as an investment professional.
Paul F. Fuchs has co-managed the fund since January 2012. From 1999 until joining the Investment Manager in May 2010, Mr. Fuchs was associated with the fund's previous investment adviser as an investment professional.
1The Barclays 3-15 Year Blend Municipal Bond Index tracks the performance of municipal bonds issued after December 31, 1990 with remaining maturities between 2 and 17 years and at least $7 million in principal amount outstanding.
2The Barclays California 3-15 Year Blend Municipal Bond Index tracks investment grade bonds issued from the state of California and its municipalities.
Indices are not available for investment, are not professionally managed and do not reflect sales charges, fees, brokerage commissions, taxes or other expenses of investing. Securities in the fund may not match those in an index.
3The credit quality ratings represent those of Moody's Investors Service, Inc. ("Moody's"), Standard & Poor's Corporation ("S&P") or Fitch Ratings ("Fitch") credit ratings. The ratings represent their opinions as to the quality of the securities they rate. Ratings are relative and subjective and are not absolute standards of quality. The security's credit quality does not eliminate risk.
Performance data quoted represents past performance and current performance may be lower or higher. Past performance is no guarantee of future results. The investment return and principal value will fluctuate so that shares, when redeemed, may be worth more or less than the original cost. Please visit www.columbiamanagement.com for daily and most recent month-end performance updates.
Summary
13-month (cumulative) return as of 04/30/12
| | | | +12.23% | |
|
|  | | | Class A shares
(without sales charge) | |
|
| | | | +11.05% | |
|
|  | | | Barclays 3-15 Year Blend Municipal Bond Index | |
|
| | | | +12.08% | |
|
|  | | | Barclays California 3-15 Year Blend Municipal Bond Index | |
|
1
Performance Information – Columbia California Intermediate Municipal Bond Fund
Performance data quoted represents past performance and current performance may be lower or higher. Past performance is no guarantee of future results. The investment return and principal value will fluctuate so that shares, when redeemed, may be worth more or less than the original cost. Please visit www.columbiamanagement.com for daily and most recent month-end performance updates.
Performance of a $10,000 investment 08/19/02 – 04/30/12
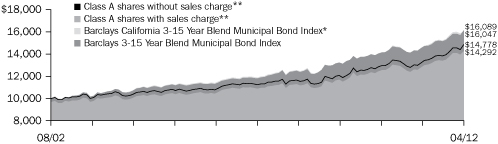
The chart above shows the change in value of a hypothetical $10,000 investment in Class A shares of Columbia California Intermediate Municipal Bond Fund during the stated time period, and does not reflect the deduction of taxes that a shareholder may pay on fund distributions or on the redemption of fund shares.
*Barclays California 3-15 Year Blend Municipal Bond Index is from August 31, 2002.
Performance of a $10,000 investment 08/19/02 – 04/30/12 ($)
| Sales charge | | without | | with | |
| Class A** | | | 14,778 | | | | 14,292 | | |
| Class B** | | | 13,737 | | | | 14,737 | | |
| Class C** | | | 13,729 | | | | 13,729 | | |
| Class Z | | | 15,138 | | | | n/a | | |
Average annual total return as of 04/30/12 (%)
| Share class | | A** | | B** | | C** | | Z | |
| Inception | | 09/09/02 | | 08/29/02 | | 09/11/02 | | 08/19/02 | |
| Sales charge | | without | | with | | without | | with | | without | | with | | without | |
1-month
(cumulative) | | | 1.22 | | | | –2.08 | | | | 1.16 | | | | –1.84 | | | | 1.16 | | | | 0.16 | | | | 1.24 | | |
| 1-year | | | 10.32 | | | | 6.72 | | | | 9.50 | | | | 6.50 | | | | 9.61 | | | | 8.61 | | | | 10.61 | | |
| 5-year | | | 5.10 | | | | 4.41 | | | | 4.32 | | | | 4.32 | | | | 4.32 | | | | 4.32 | | | | 5.35 | | |
| Life | | | 4.11 | | | | 3.75 | | | | 3.33 | | | | 3.33 | | | | 3.32 | | | | 3.32 | | | | 4.37 | | |
The "with sales charge" returns include the maximum initial sales charge of 3.25% for Class A shares, the applicable contingent deferred sales charge of 3.00% in the first year, declining to 1.00% in the fourth year and eliminated thereafter for Class B shares and 1.00% for Class C shares for the first year only. The "without sales charge" returns do not include the effect of sales charges. If they had, returns would be lower.
Performance results reflect any fee waivers or reimbursements of fund expenses by Columbia Management Investment Advisers, LLC and/or any of its affiliates. Absent these fee waivers or expense reimbursement arrangements, performance results would have been lower.
All results shown assume the reinvestment of distributions. Class Z shares are sold at net asset value with no distribution and service (Rule 12b-1) fees. Class Z shares have limited eligibility and the investment minimum requirements may vary. Please see the fund's prospectuses for details. Performance for different share classes will vary based on differences in sales charges and fees associated with each class.
The tables do not reflect the deduction of taxes that a shareholder may pay on fund distributions or on the redemption of fund shares.
**The returns shown for periods prior to the share class inception date (including returns since inception, which are since fund inception) include the returns of the fund's oldest share class. These returns are adjusted to reflect any higher class-related operating expenses of the newer share classes, as applicable. Please visit columbiamanagement.com/mutual-funds/appended-performance for more information.
2
Understanding Your Expenses – Columbia California Intermediate Municipal Bond Fund
As an investor, you incur two types of costs. There are transaction costs, which generally include sales charges on purchases and may include redemption fees. There are also ongoing costs, which generally include management fees, distribution and service (Rule 12b-1) fees, and other fund expenses. The following information is intended to help you understand your ongoing costs (in dollars) of investing in the Fund and to help you compare these costs with the ongoing costs of investing in other mutual funds.
Analyzing your fund's expenses
To illustrate these ongoing costs, we have provided examples and calculated the expenses paid by investors in each share class of the Fund during the period. The actual and hypothetical information in the table is based on an initial investment of $1,000 at the beginning of the period indicated and held for the entire period. Expense information is calculated two ways and each method provides you with different information. The amount listed in the "Actual" column is calculated using the Fund's actual operating expenses and total return for the period. You may use the Actual information, together with the amount invested, to estimate the expenses that you paid over the period. Simply divide your account value by $1,000 (for example, an $8,600 account value divided by $1,000 = 8.6), then multiply the results by the expenses paid during the period under the Actual column. The amount listed in the "Hypothetical" column assumes a 5% annual rate of return before expenses (which is not the Fund's actual return) and then applies the Fund's actual expense ratio for the period to the hypothetical return. You should not use the hypothetical account values and expenses to estimate either your actual account balance at the end of the period or the expenses you paid during the period. See "Compare with other funds" below for details on how to use the hypothetical data.
Compare with other funds
Since all mutual funds are required to include the same hypothetical calculations about expenses in shareholder reports, you can use this information to compare the ongoing cost of investing in the Fund with other funds. To do so, compare the hypothetical example with the 5% hypothetical examples that appear in the shareholder reports of other funds. As you compare hypothetical examples of other funds, it is important to note that hypothetical examples are meant to highlight the ongoing costs of investing in a fund only and do not reflect any transaction costs, such as sales charges, or redemption or exchange fees. Therefore, the hypothetical calculations are useful in comparing ongoing costs only, and will not help you determine the relative total costs of owning different funds. If transaction costs were included in these calculations, your costs would be higher.
November 1, 2011 – April 30, 2012
| | | Account value at the
beginning of the period ($) | | Account value at the
end of the period ($) | | Expenses paid
during the period ($) | | Fund's annualized
expense ratio (%) | |
| | | Actual | | Hypothetical | | Actual | | Hypothetical | | Actual | | Hypothetical | | Actual | |
| Class A | | | 1,000.00 | | | | 1,000.00 | | | | 1,053.70 | | | | 1,021.23 | | | | 3.73 | | | | 3.67 | | | | 0.73 | | |
| Class B | | | 1,000.00 | | | | 1,000.00 | | | | 1,051.90 | | | | 1,017.50 | | | | 7.55 | | | | 7.42 | | | | 1.48 | | |
| Class C | | | 1,000.00 | | | | 1,000.00 | | | | 1,050.90 | | | | 1,017.50 | | | | 7.55 | | | | 7.42 | | | | 1.48 | | |
| Class Z | | | 1,000.00 | | | | 1,000.00 | | | | 1,056.20 | | | | 1,022.48 | | | | 2.45 | | | | 2.41 | | | | 0.48 | | |
Expenses paid during the period are equal to the annualized expense ratio for each class as indicated above, multiplied by the average account value over the period and then multiplied by the number of days in the Fund's most recent fiscal half year and divided by 366.
Expenses do not include fees and expenses incurred indirectly by the Fund from the underlying funds in which the Fund may invest (also referred to as "acquired funds"), including affiliated and non-affiliated pooled investments vehicles (including mutual funds and exchange traded funds).
Had Columbia Management Investment Advisers, LLC and/or certain of its affiliates not waived/reimbursed certain fees and expenses, account value at the end of the period would have been reduced.
3
Portfolio Managers' Report – Columbia California Intermediate Municipal Bond Fund
Performance data quoted represents past performance and current performance may be lower or higher. Past performance is no guarantee of future results. The investment return and principal value will fluctuate so that shares, when redeemed, may be worth more or less than the original cost. Please visit www.columbiamanagement.com for daily and most recent month-end performance updates.
30-day SEC yields
as of 4/30/12 (%)
| Class A | | | 1.68 | | |
| Class B | | | 1.01 | | |
| Class C | | | 1.00 | | |
| Class Z | | | 1.98 | | |
The 30-day SEC yields reflect the fund's earning power, net of expenses, expressed as an annualized percentage of the public offering price per share at the end of the period. Had the Investment Manager and/or any of its affiliates not waived fees or reimbursed a portion of expenses, the 30-day SEC yields would have been lower.
Taxable Equivalent SEC yields
as of 4/30/12 (%)
| Class A | | | 2.58 | | |
| Class B | | | 1.55 | | |
| Class C | | | 1.54 | | |
| Class Z | | | 3.05 | | |
Taxable-equivalent SEC yields are calculated assuming a federal tax rate of 35.0%. This tax rate does not reflect the phase out of exemptions or the reduction of the otherwise allowable deductions that occur when adjusted gross income exceeds certain levels. Your taxable-equivalent yield may be different depending on your tax bracket.
The Board of Trustees for Columbia California Intermediate Municipal Bond Fund has approved the change of the fund's fiscal year end from March 31 to April 30. As a result, this report covers the 13-month period since the last annual report. The next report you receive will be for the six-month period from May 1, 2012 through October 31, 2012. In June 2011, the portfolio management team changed. Brian M. McGreevy took over management of the fund. Paul F. Fuchs became co-manager in January 2012.
For the 13-month period that ended April 30, 2012, the fund's Class A shares returned 12.23% without sales charge. The fund's primary benchmark, the Barclays 3-15 Year Blend Municipal Bond Index, returned 11.05%. The fund's secondary benchmark, the Barclays California 3-15 Year Blend Municipal Bond Index, returned 12.08%.
An improving economic environment
Early in the 13-month period, Europe's debt problems and wrangling in Washington over the federal budget and the national debt dominated world headlines. U.S. economic news was lackluster, housing continued to be a nagging weak spot and job growth was disappointing. However, the pace of both economic and job growth picked up as the period wore on. Consumer confidence improved as the labor market added approximately 1.2 million new jobs between November 2011 and April 2012, while the jobless rate fell to 8.1%. Household net worth also picked up as the equity markets rebounded. Headline inflation rose 2.7%, driven primarily by rising food and energy prices. Despite a modest slowdown late in the summer of 2011, manufacturing activity continued to expand throughout the period.
Municipal market generates strong returns
Against this backdrop, the U.S. municipal bond market generated strong returns, despite a host of investor concerns: 1) Net outflows from municipal mutual funds. 2) The expectation that heavy new issue volume would weigh on the market, which turned out to be unfounded. Issuance dropped off almost across the board. California, in particular, cut back significantly compared to one year earlier. 3) Fears of massive defaults, which were stoked by the media and were generally overblown. With these concerns in mind, 10-year municipal yields reached a high of 3.5% before the European debt crisis sent investors scurrying for the safety of the Treasury market, pushing Treasury yields down. Municipal yields followed. (Bond yields and prices move in opposite directions.)
By the summer of 2011, investors seemed to believe that default expectations were excessive, and demand for municipal bonds picked up. With yields close to historical lows, buyers moved down the credit curve—to A and BBB rated bonds—to garner additional income. Over the course of the 13-month period, these credits performed the best, as yields fell and the yield spread between higher and lower quality bonds tightened in response to demand. Yet, there were more downgrades than upgrades in the overall municipal market as a lackluster economy continued to pressure issuers.
4
Portfolio Manager's Report – Columbia California Intermediate Municipal Bond Fund
Fund benefited from emphasis on longer-intermediate maturities
California municipal bonds were strong performers overall, as yield spreads tightened and state revenues improved. In this favorable environment, the fund outperformed its benchmarks generally because it had less exposure to the shorter end of the intermediate maturity spectrum and more weight in bonds with maturities beyond ten years. The fund's longer maturities had a longer call structure than the bonds in the index, which benefited performance. (A bond's call structure determines how long an issuer must wait before it can "call" or redeem a bond before its maturity date.) The fund also had less exposure than the index to the very highest quality bonds and more exposure to bonds rated A and BBB. For the period, the strongest gains came from A rated bonds, which returned more than 12%. An overweight in hospital bonds was another plus for results, as the sector returned 15%+. Education and water & sewer bonds were also solid contributors to return. Because we continue to have concerns over the prospects for Puerto Rico and tobacco bonds, the fund has very little exposure to these areas, which hampered returns as lower-rated credits outperformed during the period.
As the fund experienced positive cash flows, we added bonds across the maturity spectrum, with an emphasis on bonds with maturities of 10 years and longer. Our strong credit research staff sought to identify opportunities among A and BB rated bonds, which we believed offered better value than higher quality names.
California's recovery found momentum
Stronger performance from technology and other service industries, plus an increase in K-12 teachers across the state, aided California's recovery in 2011. However, the slow recovery of housing-related industries is expected to keep the unemployment rate above the national average. An additional round of state and federal budget cuts also clouds the state's near-term outlook. Longer term, California enjoys the advantage of world-class educational institutions and widening links to the global economy, which continue to support prospects for the California municipal bond market.
Portfolio characteristics and holdings are subject to change periodically and may not be representative of current characteristics and holdings. The outlook for this fund may differ from that presented for other Columbia Funds.
Tax-exempt investing offers current tax-exempt income, but it also involves certain risks. The value of the fund will be affected by interest rate changes and the creditworthiness of issues held in the fund. When interest rates go up, bond prices generally drop and vice versa.
Interest income from certain tax-exempt bonds may be subject to certain state and local taxes and, if applicable, the alternative minimum tax. Capital gains are not exempt from income taxes.
Single-state municipal bond funds pose additional risks due to limited geographical diversification.
Quality breakdown1
as of 4/30/12 (%)
| AAA rating | | | 1.8 | | |
| AA rating | | | 38.8 | | |
| A rating | | | 37.9 | | |
| BBB rating | | | 17.3 | | |
| Non-investment grade | | | 0.9 | | |
| Not rated | | | 3.3 | | |
1Percentages indicated are based upon total fixed income securities (excluding Investments of Cash Collateral Received for Securities on Loan and money market funds).
Bond ratings apply to the underlying holdings of the Fund and not the Fund itself and are divided into categories ranging from AAA (highest) to D (lowest), and are subject to change. The ratings shown are determined by using the middle rating of Moody's, S&P, and Fitch after dropping the highest and lowest available ratings. When a rating from only two agencies is available, the lower rating is used. When a rating from only one agency is available, that rating is used. When a bond is not rated by one of these agencies, it is designated as Not rated. Credit ratings are subjective to opinions and not statements of fact.
5
Portfolio of Investments – Columbia California Intermediate Municipal Bond Fund
April 30, 2012
(Percentages represent value of investments compared to net assets)
Issue
Description | | Coupon
Rate | | Principal
Amount | | Value | |
| Municipal Bonds 97.9% | |
| Airport 4.2% | |
City of San Jose
Revenue Bonds
Series 2007B (AMBAC) | |
| 03/01/22 | | | 5.000 | % | | $ | 1,000,000 | | | $ | 1,093,380 | | |
County of Orange
Revenue Bonds
Series 2009A | |
| 07/01/25 | | | 5.250 | % | | | 1,500,000 | | | | 1,731,885 | | |
County of Sacramento
Revenue Bonds
Senior Series 2008 (AGM) | |
| 07/01/23 | | | 5.000 | % | | | 1,000,000 | | | | 1,122,920 | | |
San Diego County Regional Airport Authority
Revenue Bonds
Subordinated Series 2010A | |
| 07/01/24 | | | 5.000 | % | | | 1,000,000 | | | | 1,161,210 | | |
San Francisco City & County Airports Commission
Refunding Revenue Bonds
2nd Series 2003B (NPFGC/FGIC) | |
| 05/01/13 | | | 5.250 | % | | | 2,000,000 | | | | 2,095,680 | | |
| 2nd Series 2009C (AGM) | |
| 05/01/18 | | | 5.000 | % | | | 1,825,000 | | | | 2,186,186 | | |
Revenue Bonds
Series 2011G | |
| 05/01/26 | | | 5.250 | % | | | 2,000,000 | | | | 2,328,720 | | |
| Total | | | 11,719,981 | | |
| Higher Education 5.8% | |
California Educational Facilities Authority
Revenue Bonds
California Lutheran University
Series 2008 | |
| 10/01/21 | | | 5.250 | % | | | 1,500,000 | | | | 1,636,200 | | |
Pitzer College
Series 2005A | |
| 04/01/25 | | | 5.000 | % | | | 1,270,000 | | | | 1,321,321 | | |
| Series 2009 | |
| 04/01/19 | | | 5.000 | % | | | 1,610,000 | | | | 1,865,925 | | |
University Southern California
Series 2009C | |
| 10/01/24 | | | 5.250 | % | | | 3,000,000 | | | | 3,915,360 | | |
California State Public Works Board
Refunding Revenue Bonds
California State University
Series 2006A (NPFGC/FGIC) | |
| 10/01/16 | | | 5.000 | % | | | 1,000,000 | | | | 1,140,830 | | |
Revenue Bonds
University California Institute Project
Series 2005C | |
| 04/01/16 | | | 5.000 | % | | | 1,000,000 | | | | 1,121,260 | | |
Various University of California Projects
Series 2005D | |
| 05/01/15 | | | 5.000 | % | | | 1,000,000 | | | | 1,117,620 | | |
California State University
Revenue Bonds
Systemwide
Series 2009A | |
| 11/01/22 | | | 5.250 | % | | | 2,500,000 | | | | 2,948,825 | | |
Issue
Description | | Coupon
Rate | | Principal
Amount | | Value | |
| Municipal Bonds (continued) | |
| Higher Education (cont.) | |
University of California
Revenue Bonds
Series 2009O | |
| 05/15/20 | | | 5.000 | % | | $ | 1,000,000 | | | $ | 1,219,240 | | |
| Total | | | 16,286,581 | | |
| Hospital 7.8% | |
ABAG Finance Authority for Nonprofit Corps.
Revenue Bonds
Sharp Healthcare
Series 2011A | |
| 08/01/24 | | | 5.250 | % | | | 2,750,000 | | | | 3,160,740 | | |
California Health Facilities Financing Authority
Refunding Revenue Bonds
Sutter Health
Series 2011D | |
| 08/15/26 | | | 5.000 | % | | | 2,250,000 | | | | 2,587,635 | | |
Revenue Bonds
Catholic Healthcare West
Series 2009A | |
| 07/01/29 | | | 6.000 | % | | | 1,250,000 | | | | 1,461,237 | | |
| Series 2009E | |
| 07/01/25 | | | 5.625 | % | | | 1,500,000 | | | | 1,705,065 | | |
Children's Hospital of Orange County
Series 2009A | |
| 11/01/21 | | | 6.000 | % | | | 2,000,000 | | | | 2,424,060 | | |
California Municipal Finance Authority
Certificate of Participation
Community Hospital Central California
Series 2007 | |
| 02/01/13 | | | 5.000 | % | | | 1,150,000 | | | | 1,174,093 | | |
California Statewide Communities Development Authority
Revenue Bonds
Health Facility Adventist Health System West
Series 2005A | |
| 03/01/17 | | | 5.000 | % | | | 1,000,000 | | | | 1,091,760 | | |
John Muir Health
Series 2006A | |
| 08/15/17 | | | 5.000 | % | | | 3,000,000 | | | | 3,402,660 | | |
Kaiser Permanente
Series 2009A | |
| 04/01/19 | | | 5.000 | % | | | 2,000,000 | | | | 2,369,980 | | |
Sutter Health
Series 2011A | |
| 08/15/26 | | | 5.500 | % | | | 1,000,000 | | | | 1,174,570 | | |
City of Newport Beach
Revenue Bonds
Hoag Memorial Hospital Presbyterian
Series 2011 | |
| 12/01/30 | | | 5.875 | % | | | 1,000,000 | | | | 1,216,530 | | |
| Total | | | 21,768,330 | | |
| Independent Power 3.5% | |
Kings River Conservation District
Certificate of Participation
Peaking Project
Series 2004 | |
| 05/01/14 | | | 5.000 | % | | | 3,135,000 | | | | 3,355,202 | | |
The Accompanying Notes to Financial Statements are an integral part of this statement.
6
Columbia California Intermediate Municipal Bond Fund
April 30, 2012
(Percentages represent value of investments compared to net assets)
Issue
Description | | Coupon
Rate | | Principal
Amount | | Value | |
| Municipal Bonds (continued) | |
| Independent Power (cont.) | |
Sacramento Municipal Utility District
Refunding Revenue Bonds
Series 2005 (AMBAC) | |
| 07/01/15 | | | 5.250 | % | | $ | 3,000,000 | | | $ | 3,292,080 | | |
Revenue Bonds
Cosumnes Project
Series 2006 (NPFGC) | |
| 07/01/15 | | | 5.000 | % | | | 1,000,000 | | | | 1,086,390 | | |
| 07/01/29 | | | 5.125 | % | | | 2,000,000 | | | | 2,105,920 | | |
| Total | | | 9,839,592 | | |
| Joint Power Authority 6.2% | |
California Infrastructure & Economic Development Bank
Revenue Bonds
California Independent System Operator
Series 2009A | |
| 02/01/22 | | | 5.250 | % | | | 1,900,000 | | | | 2,054,546 | | |
M-S-R Public Power Agency
Revenue Bonds
Subordinated Lien
Series 2008L (AGM) | |
| 07/01/21 | | | 5.000 | % | | | 2,500,000 | | | | 2,907,175 | | |
Northern California Power Agency
Refunding Revenue Bonds
Hydroelectric Project No. 1
Series 2008C (AGM) | |
| 07/01/22 | | | 5.000 | % | | | 3,000,000 | | | | 3,432,690 | | |
Southern California Public Power Authority
Refunding Revenue Bonds
Sanitary Power Project
Series 2005A (AGM) | |
| 01/01/18 | | | 5.000 | % | | | 2,000,000 | | | | 2,194,060 | | |
| Series 2008A | |
| 07/01/22 | | | 5.000 | % | | | 2,000,000 | | | | 2,312,000 | | |
Revenue Bonds
Series 1989 | |
| 07/01/13 | | | 6.750 | % | | | 3,000,000 | | | | 3,203,760 | | |
Southern Transmission Project
Series 2008 | |
| 07/01/27 | | | 6.000 | % | | | 1,000,000 | | | | 1,219,340 | | |
| Total | | | 17,323,571 | | |
| Local Appropriation 7.0% | |
City & County of San Francisco
Certificate of Participation
Multiple Capital Improvement Projects
Series 2009B | |
| 04/01/24 | | | 5.000 | % | | | 1,495,000 | | | | 1,658,359 | | |
City of Vista
Certificate of Participation
Community Projects
Series 2007 (NPFGC) | |
| 05/01/21 | | | 4.750 | % | | | 750,000 | | | | 801,202 | | |
County of Monterey
Certificate of Participation
Refinancing Project
Series 2009 (AGM) | |
| 08/01/17 | | | 5.000 | % | | | 1,000,000 | | | | 1,150,680 | | |
Issue
Description | | Coupon
Rate | | Principal
Amount | | Value | |
| Municipal Bonds (continued) | |
| Local Appropriation (cont.) | |
Los Angeles Community Redevelopment Agency
Revenue Bonds
VT Manchester Social Services Project
Series 2005 (AMBAC) | |
| 09/01/15 | | | 5.000 | % | | $ | 1,095,000 | | | $ | 1,200,591 | | |
Los Angeles County Capital Asset Leasing Corp.
Refunding Revenue Bonds
Master Project
Series 2002B (AMBAC) | |
| 12/01/12 | | | 6.000 | % | | | 1,000,000 | | | | 1,020,440 | | |
Los Angeles Municipal Improvement Corp.
Refunding Revenue Bonds
Special Tax-Police Emergency
Series 2002G (NPFGC/FGIC) | |
| 09/01/13 | | | 5.250 | % | | | 1,500,000 | | | | 1,592,460 | | |
Oakland Joint Powers Financing Authority
Refunding Revenue Bonds
Oakland Administration Buildings
Series 2008B (AGM) | |
| 08/01/22 | | | 5.000 | % | | | 2,000,000 | | | | 2,185,620 | | |
Pasadena Public Financing Authority
Revenue Bonds
Rose Bowl Renovation
Series 2010A | |
| 03/01/26 | | | 5.000 | % | | | 2,500,000 | | | | 2,849,025 | | |
Pico Rivera Public Financing Authority
Revenue Bonds
Series 2009 | |
| 09/01/26 | | | 5.250 | % | | | 1,085,000 | | | | 1,207,605 | | |
Richmond Joint Powers Financing Authority
Refunding Revenue Bonds
Lease-Civic Center Project
Series 2009 (AGM) | |
| 08/01/17 | | | 5.000 | % | | | 1,570,000 | | | | 1,790,161 | | |
San Mateo Joint Powers Financing Authority
Refunding Revenue Bonds
Youth Services Campus
Series 2008A | |
| 07/15/20 | | | 5.000 | % | | | 435,000 | | | | 500,511 | | |
| 07/15/28 | | | 5.250 | % | | | 2,275,000 | | | | 2,532,894 | | |
Santa Clara County Financing Authority
Refunding Revenue Bonds
Multiple Facilities Projects
Series 2010N | |
| 05/15/17 | | | 5.000 | % | | | 1,000,000 | | | | 1,176,510 | | |
| Total | | | 19,666,058 | | |
| Local General Obligation 13.2% | |
Burbank Unified School District
Unlimited General Obligation Bonds
Capital Appreciation
Series 1998B (NPFGC/FGIC)(a) | |
| 08/01/14 | | | 0.000 | % | | | 3,000,000 | | | | 2,935,320 | | |
City & County of San Francisco
Unlimited General Obligation Bonds
Earthquake Safety
Series 2010E | |
| 06/15/27 | | | 5.000 | % | | | 3,380,000 | | | | 3,902,311 | | |
The Accompanying Notes to Financial Statements are an integral part of this statement.
7
Columbia California Intermediate Municipal Bond Fund
April 30, 2012
(Percentages represent value of investments compared to net assets)
Issue
Description | | Coupon
Rate | | Principal
Amount | | Value | |
| Municipal Bonds (continued) | |
| Local General Obligation (cont.) | |
City of Los Angeles
Unlimited General Obligation Bonds
Series 2004A (NPFGC) | |
| 09/01/13 | | | 4.000 | % | | $ | 1,000,000 | | | $ | 1,048,880 | | |
| Series 2011A | |
| 09/01/25 | | | 5.000 | % | | | 3,000,000 | | | | 3,538,830 | | |
Culver City School Facilities Financing Authority
Revenue Bonds
Unified School District
Series 2005 (AGM) | |
| 08/01/23 | | | 5.500 | % | | | 1,490,000 | | | | 1,920,610 | | |
East Bay Municipal Utility District
Unlimited General Obligation Refunding Bonds
Wastewater System
Series 2003F (AMBAC) | |
| 04/01/15 | | | 5.000 | % | | | 1,000,000 | | | | 1,041,130 | | |
East Side Union High School District
Unlimited General Obligation Refunding Bonds
2012 Crossover
Series 2006 (AGM) | |
| 09/01/20 | | | 5.250 | % | | | 1,280,000 | | | | 1,567,411 | | |
Los Alamitos Unified School District
Unlimited General Obligation Bonds
BAN Series 2011
School Facilities Improvement(a) | |
| 09/01/16 | | | 0.000 | % | | | 2,000,000 | | | | 1,866,140 | | |
Los Angeles Unified School District
Unlimited General Obligation Bonds
Election of 2004
Series 2006G (AMBAC) | |
| 07/01/20 | | | 5.000 | % | | | 1,000,000 | | | | 1,151,740 | | |
Palomar Community College District
Unlimited General Obligation Bonds
Capital Appreciation-Election of 2006
Series 2010B (a) | |
| 08/01/22 | | | 0.000 | % | | | 2,140,000 | | | | 1,450,107 | | |
Rancho Santiago Community College District
Unlimited General Obligation Refunding Bonds
Series 2005 (AGM) | |
| 09/01/19 | | | 5.250 | % | | | 1,000,000 | | | | 1,257,430 | | |
Rancho Santiago Community College District(a)
Unlimited General Obligation Bonds
Capital Appreciation-Election of 2002
Series 2006C (AGM) | |
| 09/01/31 | | | 0.000 | % | | | 3,785,000 | | | | 1,437,543 | | |
Rescue Union School District
Unlimited General Obligation Bonds
Capital Appreciation-Election of 1998
Series 2005 (NPFGC)(a) | |
| 09/01/26 | | | 0.000 | % | | | 1,100,000 | | | | 571,505 | | |
San Mateo County Community College District
Unlimited General Obligation Bonds
Capital Appreciation-Election of 2005
Series 2006A (NPFGC)(a) | |
| 09/01/15 | | | 0.000 | % | | | 1,000,000 | | | | 962,880 | | |
San Mateo Foster City School District
Revenue Bonds
Series 2005 (AGM) | |
| 08/15/19 | | | 5.500 | % | | | 2,000,000 | | | | 2,562,340 | | |
Issue
Description | | Coupon
Rate | | Principal
Amount | | Value | |
| Municipal Bonds (continued) | |
| Local General Obligation (cont.) | |
San Ramon Valley Unified School District
Unlimited General Obligation Bonds
Election of 2002
Series 2004 (AGM) | |
| 08/01/16 | | | 5.250 | % | | $ | 1,800,000 | | | $ | 1,980,378 | | |
Saugus Union School District
Unlimited General Obligation Refunding Bonds
Series 2006 (NPFGC/FGIC) | |
| 08/01/21 | | | 5.250 | % | | | 2,375,000 | | | | 2,929,111 | | |
Simi Valley School Financing Authority
Refunding Revenue Bonds
Simi Valley Unified School District
Series 2007 | |
| 08/01/18 | | | 5.000 | % | | | 1,045,000 | | | | 1,267,251 | | |
West Contra Costa Unified School District
Unlimited General Obligation Refunding Bonds
Series 2011 (AGM) | |
| 08/01/23 | | | 5.250 | % | | | 3,000,000 | | | | 3,557,430 | | |
| Total | | | 36,948,347 | | |
| Multi-Family 1.9% | |
California Statewide Communities Development Authority
Refunding Revenue Bonds
University of California Irvine East Campus Apartments
Series 2012 | |
| 05/15/19 | | | 5.000 | % | | | 1,000,000 | | | | 1,121,370 | | |
| 05/15/20 | | | 5.000 | % | | | 750,000 | | | | 838,275 | | |
Revenue Bonds
CHF-Irvine LLC-UCI East Campus
Series 2008 | |
| 05/15/17 | | | 5.000 | % | | | 1,500,000 | | | | 1,677,330 | | |
Munimae TE Bond Subsidiary LLC
Series 2004A-2(b)(c)(g) | |
| 06/29/49 | | | 4.900 | % | | | 2,000,000 | | | | 1,639,960 | | |
| Total | | | 5,276,935 | | |
| Municipal Power 8.9% | |
Anaheim Public Financing Authority
Revenue Bonds
Distribution System Electric
Series 1999 (AMBAC) | |
| 10/01/13 | | | 5.000 | % | | | 1,500,000 | | | | 1,580,880 | | |
California State Department of Water Resources
Revenue Bonds
Series 2005G-11 | |
| 05/01/18 | | | 5.000 | % | | | 2,000,000 | | | | 2,442,400 | | |
City of Riverside Electric
Revenue Bonds
Series 2008D (AGM) | |
| 10/01/23 | | | 5.000 | % | | | 1,000,000 | | | | 1,141,220 | | |
City of Santa Clara
Refunding Revenue Bonds
Series 2011A | |
| 07/01/29 | | | 5.375 | % | | | 1,000,000 | | | | 1,138,360 | | |
City of Vernon
Revenue Bonds
Series 2009A | |
| 08/01/21 | | | 5.125 | % | | | 2,000,000 | | | | 2,214,580 | | |
The Accompanying Notes to Financial Statements are an integral part of this statement.
8
Columbia California Intermediate Municipal Bond Fund
April 30, 2012
(Percentages represent value of investments compared to net assets)
Issue
Description | | Coupon
Rate | | Principal
Amount | | Value | |
| Municipal Bonds (continued) | |
| Municipal Power (cont.) | |
Imperial Irrigation District
Refunding Revenue Bonds
System
Series 2008 | |
| 11/01/21 | | | 5.250 | % | | $ | 2,500,000 | | | $ | 2,941,425 | | |
Systems
Series 2011D | |
| 11/01/22 | | | 5.000 | % | | | 2,860,000 | | | | 3,441,324 | | |
| 11/01/23 | | | 5.000 | % | | | 1,040,000 | | | | 1,239,503 | | |
Los Angeles Department of Water & Power
Revenue Bonds
Power System
Series 2009B | |
| 07/01/23 | | | 5.250 | % | | | 2,000,000 | | | | 2,415,760 | | |
| Subordinated Series 2007A-1 (AMBAC) | |
| 07/01/19 | | | 5.000 | % | | | 1,000,000 | | | | 1,170,790 | | |
Sacramento Municipal Utility District
Revenue Bonds
Series 2008U (AGM) | |
| 08/15/21 | | | 5.000 | % | | | 1,500,000 | | | | 1,777,800 | | |
Tuolumne Wind Project Authority
Revenue Bonds
Tuolumne Co. Project
Series 2009 | |
| 01/01/22 | | | 5.000 | % | | | 1,000,000 | | | | 1,151,340 | | |
Walnut Energy Center Authority
Revenue Bonds
Series 2004A (AMBAC) | |
| 01/01/16 | | | 5.000 | % | | | 2,055,000 | | | | 2,197,124 | | |
| Total | | | 24,852,506 | | |
| Oil & Gas 0.7% | |
California Pollution Control Financing Authority
Refunding Revenue Bonds
BP West Coast Products LLC
Series 2009(d) | |
| 12/01/46 | | | 2.600 | % | | | 2,000,000 | | | | 2,082,720 | | |
| Other Bond Issue 1.3% | |
California Statewide Communities Development Authority
Revenue Bonds
California Endowment
Series 2003 | |
| 07/01/13 | | | 5.000 | % | | | 1,000,000 | | | | 1,052,520 | | |
Long Beach Bond Finance Authority
Refunding Revenue Bonds
Aquarium of the Pacific
Series 2012 | |
| 11/01/27 | | | 5.000 | % | | | 2,210,000 | | | | 2,497,013 | | |
| Total | | | 3,549,533 | | |
| Ports 0.8% | |
Los Angeles Harbor Department
Revenue Bonds
Series 2009A | |
| 08/01/23 | | | 5.250 | % | | | 2,000,000 | | | | 2,371,860 | | |
Issue
Description | | Coupon
Rate | | Principal
Amount | | Value | |
| Municipal Bonds (continued) | |
| Prepaid Gas 0.8% | |
M-S-R Energy Authority
Revenue Bonds
Series 2009B | |
| 11/01/29 | | | 6.125 | % | | $ | 2,000,000 | | | $ | 2,324,380 | | |
| Refunded / Escrowed 1.9% | |
Golden State Tobacco Securitization Corp.
Revenue Bonds | |
| 06/01/40 | | | 6.625 | % | | | 1,485,000 | | | | 1,585,802 | | |
Prerefunded 06/01/13 Asset-Backed Revenue Bonds
Series 2003B | |
| 06/01/38 | | | 5.625 | % | | | 1,500,000 | | | | 1,584,735 | | |
Los Angeles Unified School District
Unlimited General Obligation Bonds
Election of 1997
Series 2003F (AGM) | |
| 07/01/18 | | | 5.000 | % | | | 1,275,000 | | | | 1,345,048 | | |
Orange County Water District
Prerefunded 08/15/13 Certificated of Participation
Series 2003B (NPFGC) | |
| 08/15/17 | | | 5.375 | % | | | 650,000 | | | | 692,666 | | |
| Total | | | 5,208,251 | | |
| Retirement Communities 2.3% | |
ABAG Finance Authority for Nonprofit Corps.
Revenue Bonds
Casa de Las Campanas, Inc.
Series 2010 | |
| 09/01/15 | | | 4.000 | % | | | 1,500,000 | | | | 1,606,515 | | |
ABAG Finance Authority for Nonprofit Corps
Refunding Revenue Bonds
Episcopal Senior Communities
Series 2011 | |
| 07/01/24 | | | 5.375 | % | | | 2,795,000 | | | | 2,918,148 | | |
California Health Facilities Financing Authority
Revenue Bonds
Insured California Nevada-Methodist
Series 2006 | |
| 07/01/26 | | | 5.000 | % | | | 1,000,000 | | | | 1,037,610 | | |
Insured Episcopal Home
Series 2010B | |
| 02/01/19 | | | 5.100 | % | | | 820,000 | | | | 911,799 | | |
| Total | | | 6,474,072 | | |
| Special Non Property Tax 2.3% | |
State of California
Unlimited General Obligation Bonds
Series 2004A (FGIC/NPFGC) | |
| 07/01/14 | | | 5.250 | % | | | 1,000,000 | | | | 1,100,750 | | |
Unlimited General Obligation Refunding Bonds
Series 2009A | |
| 07/01/18 | | | 5.000 | % | | | 3,000,000 | | | | 3,621,360 | | |
Virgin Islands Public Finance Authority
Revenue Bonds
Matching Fund Loan-Senior Lien
Series 2010A(e) | |
| 10/01/20 | | | 5.000 | % | | | 1,490,000 | | | | 1,675,416 | | |
| Total | | | 6,397,526 | | |
The Accompanying Notes to Financial Statements are an integral part of this statement.
9
Columbia California Intermediate Municipal Bond Fund
April 30, 2012
(Percentages represent value of investments compared to net assets)
Issue
Description | | Coupon
Rate | | Principal
Amount | | Value | |
| Municipal Bonds (continued) | |
| Special Property Tax 4.3% | |
Culver City Redevelopment Finance Authority
Refunding Tax Allocation Bonds
Series 1993 (AMBAC) | |
| 11/01/14 | | | 5.500 | % | | $ | 1,095,000 | | | $ | 1,125,496 | | |
Fontana Public Finance Authority
Tax Allocation Bonds
Subordinated Lien-North Fontana Redevelopment
Series 2005A (AMBAC) | |
| 10/01/20 | | | 5.000 | % | | | 1,515,000 | | | | 1,585,705 | | |
Indian Wells Redevelopment Agency
Unrefunded Tax Allocation Bonds
Consolidated Whitewater
Series 2003A (AMBAC) | |
| 09/01/14 | | | 5.000 | % | | | 450,000 | | | | 463,176 | | |
Inglewood Redevelopment Agency
Refunding Tax Allocation Bonds
Merged Redevelopment Project
Series 1998A (AMBAC) | |
| 05/01/17 | | | 5.250 | % | | | 1,425,000 | | | | 1,554,931 | | |
Long Beach Bond Finance Authority
Tax Allocation Bonds
Industrial Redevelopment Project Areas
Series 2002B (AMBAC) | |
| 11/01/19 | | | 5.500 | % | | | 1,070,000 | | | | 1,186,673 | | |
Oakland Redevelopment Agency
Refunding Senior Tax Allocation Bonds
Central District Redevelopment
Series 1992 (AMBAC) | |
| 02/01/14 | | | 5.500 | % | | | 1,335,000 | | | | 1,382,232 | | |
Redwood City Redevelopment Agency
Tax Allocation Bonds
Redevelopment Project Area No. 2
Series 2003A (AMBAC) | |
| 07/15/13 | | | 5.250 | % | | | 1,000,000 | | | | 1,028,070 | | |
San Francisco City & County Redevelopment Agency
Tax Allocation Bonds
San Francisco Redevelopment Projects
Series 2009B | |
| 08/01/18 | | | 5.000 | % | | | 1,255,000 | | | | 1,410,858 | | |
Santa Clara Redevelopment Agency
Tax Allocation Bonds
Capital Appreciation-Bayshore North Project
Series 2011(a) | |
| 06/01/14 | | | 0.000 | % | | | 1,005,000 | | | | 956,800 | | |
Tustin Community Redevelopment Agency
Tax Allocation Bonds
MCAS-Tustin Redevelopment Project Area
Series 2010 | |
| 09/01/25 | | | 5.000 | % | | | 1,250,000 | | | | 1,313,638 | | |
| Total | | | 12,007,579 | | |
| State Appropriated 6.7% | |
Bay Area Governments Association
Revenue Bonds
State Payment Acceleration Notes
Series 2006 (FGIC/NPFGC) | |
| 08/01/17 | | | 5.000 | % | | | 2,000,000 | | | | 2,158,380 | | |
| Series 2006 (XLCA) | |
| 08/01/17 | | | 5.000 | % | | | 2,000,000 | | | | 2,091,180 | | |
Issue
Description | | Coupon
Rate | | Principal
Amount | | Value | |
| Municipal Bonds (continued) | |
| State Appropriated (cont.) | |
California State Public Works Board
Revenue Bonds
Department General Services
Series 2006A | |
| 04/01/28 | | | 5.000 | % | | $ | 1,000,000 | | | $ | 1,036,280 | | |
Department of General Services-Butterfeld State
Series 2005A | |
| 06/01/15 | | | 5.000 | % | | | 1,200,000 | | | | 1,333,296 | | |
Various Capital Projects
Series 2011A | |
| 10/01/20 | | | 5.000 | % | | | 2,000,000 | | | | 2,312,840 | | |
| Subordinated Series 2009I-1 | |
| 11/01/17 | | | 5.000 | % | | | 2,000,000 | | | | 2,303,860 | | |
| Subordinated Series 2010A-1 | |
| 03/01/22 | | | 5.250 | % | | | 2,000,000 | | | | 2,285,820 | | |
California Statewide Communities Development Authority
Revenue Bonds
Proposition 1A Receivables Program
Series 2009 | |
| 06/15/13 | | | 5.000 | % | | | 2,000,000 | | | | 2,101,520 | | |
San Francisco State Building Authority
Refunding Revenue Bonds
California State & San Francisco Civic Center
Series 2005A | |
| 12/01/12 | | | 5.000 | % | | | 3,000,000 | | | | 3,080,790 | | |
| Total | | | 18,703,966 | | |
| State General Obligation 8.1% | |
Commonwealth of Puerto Rico
Unlimited General Obligation Refunding Public Improvement Bonds
Series 2007A (FGIC)(e) | |
| 07/01/21 | | | 5.500 | % | | | 1,500,000 | | | | 1,680,375 | | |
State of California
Unlimited General Oblgiation Bonds
Various Purpose
Series 2011 | |
| 10/01/19 | | | 5.000 | % | | | 4,000,000 | | | | 4,815,880 | | |
Unlimited General Obligation Bonds
Series 2010 | |
| 11/01/24 | | | 5.000 | % | | | 5,000,000 | | | | 5,715,750 | | |
Various Purpose
Series 2007 | |
| 12/01/26 | | | 5.000 | % | | | 2,000,000 | | | | 2,195,680 | | |
| Series 2009 | |
| 04/01/26 | | | 5.625 | % | | | 2,000,000 | | | | 2,337,780 | | |
| 10/01/29 | | | 5.250 | % | | | 1,500,000 | | | | 1,657,800 | | |
Unlimited General Obligation Refunding Bonds
Series 2007 | |
| 08/01/18 | | | 5.000 | % | | | 3,750,000 | | | | 4,301,925 | | |
| Total | | | 22,705,190 | | |
| Tobacco 0.8% | |
California County Tobacco Securitization Agency
Asset-Backed Revenue Bonds
Los Angeles
Series 2006 | |
| 06/01/21 | | | 5.250 | % | | | 920,000 | | | | 862,960 | | |
The Accompanying Notes to Financial Statements are an integral part of this statement.
10
Columbia California Intermediate Municipal Bond Fund
April 30, 2012
(Percentages represent value of investments compared to net assets)
Issue
Description | | Coupon
Rate | | Principal
Amount | | Value | |
| Municipal Bonds (continued) | |
| Tobacco (cont.) | |
Golden State Tobacco Securitization Corp.
Asset-Backed Revenue Bonds
Series 2005A (AMBAC)
06/01/14 | | | 5.000 | % | | $ | 1,250,000 | | | $ | 1,316,900 | | |
| Total | | | 2,179,860 | | |
| Transportation 0.4% | |
California State Department of Transportation
Revenue Bonds
Federal Highway Grant Anticipation Bonds
Series 2004A (FGIC/NPFGC)
02/01/13 | | | 4.500 | % | | | 1,000,000 | | | | 1,032,540 | | |
| Turnpike/Bridge/Toll Road 1.2% | |
Bay Area Toll Authority
Revenue Bonds
San Francisco Bay Area
Series 2006F
04/01/22 | | | 5.000 | % | | | 1,100,000 | | | | 1,260,831 | | |
Orange County Transportation Authority
Refunding Revenue Bonds
91 Express Lanes
Series 2003A (AMBAC)
08/15/19 | | | 5.000 | % | | | 2,000,000 | | | | 2,088,220 | | |
| Total | | | 3,349,051 | | |
| Water & Sewer 7.8% | |
City & County of San Francisco Clean Water
Refunding Revenue Bonds
Series 2003A (NPFGC)
10/01/13 | | | 5.000 | % | | | 1,000,000 | | | | 1,043,070 | | |
City of Fresno Sewer System
Revenue Bonds
Series 2008A
09/01/23 | | | 5.000 | % | | | 1,000,000 | | | | 1,152,580 | | |
City of Los Angeles Wastewater System
Refunding Revenue Bonds
Series 2009A
06/01/25 | | | 5.750 | % | | | 2,000,000 | | | | 2,428,060 | | |
Clovis Public Financing Authority
Revenue Bonds
Series 2007 (AMBAC)
08/01/21 | | | 5.000 | % | | | 1,000,000 | | | | 1,104,670 | | |
Kern County Water Agency Improvement District No. 4
Certificate of Participation
Series 2008A
05/01/22 | | | 5.000 | % | | | 2,020,000 | | | | 2,327,101 | | |
Issue
Description | | Coupon
Rate | | Principal
Amount | | Value | |
| Municipal Bonds (continued) | |
| Water & Sewer (cont.) | |
Oxnard Financing Authority
Revenue Bonds
Project
Series 2006
06/01/31 | | | 5.000 | % | | $ | 4,315,000 | | | $ | 4,572,821 | | |
Redwood Trunk Sewer & Headworks
Series 2004A (NPFGC/FGIC)
06/01/29 | | | 5.000 | % | | | 2,000,000 | | | | 2,030,360 | | |
Sacramento County Sanitation Districts Financing Authority
Revenue Bonds
County Sanitation District 1
Series 2005 (NPFGC)
08/01/22 | | | 5.000 | % | | | 1,500,000 | | | | 1,694,475 | | |
Sacramento Regional County Sanitation
Series 2006 (NPFGC/FGIC)
12/01/17 | | | 5.000 | % | | | 1,000,000 | | | | 1,171,230 | | |
San Diego Public Facilities Financing Authority
Refunding Revenue Bonds
Senior Series 2009B
05/15/25 | | | 5.250 | % | | | 1,500,000 | | | | 1,785,600 | | |
Series 2010A
08/01/24 | | | 5.000 | % | | | 2,000,000 | | | | 2,376,440 | | |
| Total | | | 21,686,407 | | |
Total Municipal Bonds
(Cost: $252,115,586) | | $ | 273,754,836 | | |
| | | | | Shares | | Value | |
| Money Market Funds 1.8% | |
JPMorgan Tax Free Money Market Fund,
0.010%(f) | | | | | | | 4,949,517 | | | $ | 4,949,517 | | |
Total Money Market Funds
(Cost: $4,949,517) | | $ | 4,949,517 | | |
Total Investments
(Cost: $257,065,103) | | | | | | | | | | $ | 278,704,353 | | |
| Other Assets & Liabilities, Net | | | | | | | | | | | 842,950 | | |
| Total Net Assets | | $ | 279,547,303 | | |
| Notes to Portfolio of Investments | |
(a) Zero coupon bond.
(b) Identifies issues considered to be illiquid as to their marketability. The aggregate value of such securities at April 30, 2012 was $1,639,960, representing 0.59% of net assets. Information concerning such security holdings at April 30, 2012 was as follows:
| Security Description | | Acquisition
Dates | | Cost | |
Munimae TE Bond Subsidiary LLC
Series 2004A-2
4.900% 06/29/49 | | 10/15/04 | | $ | 2,000,000 | | |
The Accompanying Notes to Financial Statements are an integral part of this statement.
11
Columbia California Intermediate Municipal Bond Fund
April 30, 2012
| Notes to Portfolio of Investments (continued) | |
(c) Security exempt from registration pursuant to Rule 144A under the Securities Act of 1933. This security may be resold in transactions exempt from registration, normally to qualified institutional buyers. At April 30, 2012, the value of these securities amounted to $1,639,960 or 0.59% of net assets.
(d) Variable rate security. The interest rate shown reflects the rate as of April 30, 2012.
(e) Municipal obligations include debt obligations issued by or on behalf of territories, possessions, or sovereign nations within the territorial boundaries of the United States. At April 30, 2012, the value of these securities amounted to $3,355,791 or 1.20% of net assets.
(f) The rate shown is the seven-day current annualized yield at April 30, 2012.
(g) At April 30, 2012 the value of securities subject to alternative minimum tax was $1,639,960, representing 0.59% of net assets.
AGM Assured Guaranty Municipal Corporation
AMBAC Ambac Assurance Corporation
BAN Bond Anticipation Note
FGIC Financial Guaranty Insurance Company
NPFGC National Public Finance Guarantee Corporation
XLCA XL Capital Assurance
Generally accepted accounting principles (GAAP) require disclosure regarding the inputs and valuation techniques used to measure fair value and any changes in valuation inputs or techniques. In addition, investments shall be disclosed by major category.
The Fund categorizes its fair value measurements according to a three-level hierarchy that maximizes the use of observable inputs and minimizes the use of unobservable inputs by prioritizing that the most observable input be used when available. Observable inputs are those that market participants would use in pricing an investment based on market data obtained from sources independent of the reporting entity. Unobservable inputs are those that reflect the Fund's assumptions about the information market participants would use in pricing an investment. An investment's level within the fair value hierarchy is based on the lowest level of any input that is deemed significant to the asset or liability's fair value measurement. The input levels are not necessarily an indication of the risk or liquidity associated with investments at that level. For example, certain U.S. government securities are generally high quality and liquid, however, they are reflected as Level 2 because the inputs used to determine fair value may not always be quoted prices in an active market.
Fair value inputs are summarized in the three broad levels listed below:
• Level 1 — Valuations based on quoted prices for investments in active markets that the Fund has the ability to access at the measurement date (including NAV for open-end mutual funds). Valuation adjustments are not applied to Level 1 investments.
• Level 2 — Valuations based on other significant observable inputs (including quoted prices for similar securities, interest rates, prepayment speeds, credit risks, etc.).
• Level 3 — Valuations based on significant unobservable inputs (including the Fund's own assumptions and judgment in determining the fair value of investments).
Inputs that are used in determining fair value of an investment may include price information, credit data, volatility statistics, and other factors. These inputs can be either observable or unobservable. The availability of observable inputs can vary between investments, and is affected by various factors such as the type of investment, and the volume and level of activity for that investment or similar investments in the marketplace. The inputs will be considered by the Investment Manager, along with any other relevant factors in the calculation of an investment's fair value. The Fund uses prices and inputs that are current as of the measurement date, which may include periods of market dislocations. During these periods, the availability of prices and inputs may be reduced for many investments. This condition could cause an investment to be reclassified between the various levels within the hierarchy.
Investments falling into the Level 3 category are primarily supported by quoted prices from brokers and dealers participating in the market for those investments. However, these may be classified as Level 3 investments due to lack of market transparency and corroboration to support these quoted prices. Additionally, valuation models may be used as the pricing source for any remaining investments classified as Level 3. These models rely on one or more significant unobservable inputs and/or significant assumptions by the Investment Manager. Inputs used in valuations may include, but are not limited to, financial statement analysis, capital account balances, discount rates and estimated cash flows, and comparable company data.
Under the direction of the Fund's Board of Trustees (the Board), the Investment Manager's Valuation Committee (the Committee) is responsible for carrying out the valuation procedures approved by the Board. The Committee consists of voting and non-voting members from various groups within the Investment Manager's organization, including operations and accounting, trading and investments, compliance, risk management and legal.
The Accompanying Notes to Financial Statements are an integral part of this statement.
12
Columbia California Intermediate Municipal Bond Fund
April 30, 2012
| Fair Value Measurements (continued) | |
The Committee meets at least monthly to review and approve valuation matters, which may include a description of specific valuation determinations, data regarding pricing information received from approved pricing vendors and brokers and the results of Board-approved valuation control policies and procedures (the Policies). The Policies address, among other things, instances when market quotations are readily available, including recommendation of third party pricing vendors and a determination of appropriate pricing methodologies; events that require specific valuation determinations and assessment of fair value techniques; securities with a potential for stale pricing, including those that are illiquid, restricted, or in default; and the effectiveness of third-party pricing vendors, including periodic reviews of vendors. The Committee meets more frequently, as needed, to discuss additional valuation matters, which may include the need to review back-testing results, review time-sensitive information or approve related valuation actions. The Committee reports to the Board, with members of the Committee meeting with the Board at each of its regularly scheduled meetings to discuss valuation matters and actions during the period, similar to those described earlier.
For investments categorized as Level 3, the Committee monitors information similar to that described above, which may include: (i) data specific to the issuer or comparable issuers, (ii) general market or specific sector news and (iii) quoted prices and specific or similar security transactions. The Committee considers this data and any changes from prior periods in order to assess the reasonableness of observable and unobservable inputs, any assumptions or internal models used to value those securities and changes in fair value. This data is also used to corroborate, when available, information received from approved pricing vendors and brokers. Various factors impact the frequency of monitoring this information (which may occur as often as daily). However, the Committee may determine that changes to inputs, assumptions and models are not required as a result of the monitoring procedures performed.
The following table is a summary of the inputs used to value the Fund's investments as of April 30, 2012:
| | | Fair value at April 30, 2012 | |
| Description | | Level 1
Quoted Prices
in Active
Markets for
Identical Assets | | Level 2
Other
Significant
Observable
Inputs | | Level 3
Significant
Unobservable
Inputs | | Total | |
| Bonds | |
| Municipal Bonds | | $ | — | | | $ | 273,754,836 | | | $ | — | | | $ | 273,754,836 | | |
| Total Bonds | | | — | | | | 273,754,836 | | | | — | | | | 273,754,836 | | |
| Other | |
| Money Market Funds | | | 4,949,517 | | | | — | | | | — | | | | 4,949,517 | | |
| Total Other | | | 4,949,517 | | | | — | | | | — | | | | 4,949,517 | | |
| Total | | $ | 4,949,517 | | | $ | 273,754,836 | | | $ | — | | | $ | 278,704,353 | | |
See the Portfolio of Investments for all investment classifications not indicated in the table.
The Fund's assets assigned to the Level 2 input category are generally valued using the market approach, in which a security's value is determined through reference to prices and information from market transactions for similar or identical assets.
There were no transfers between Levels 1 and 2 during the period from April 1, 2012 to April 30, 2012.
The following table is a summary of the inputs used to value the Fund's investments as of March 31, 2012:
| | | Fair Value at March 31, 2012 | |
| Description | | Level 1
Quoted Prices
in Active
Markets for
Identical Assets | | Level 2
Other
Significant
Observable
Inputs | | Level 3
Significant
Unobservable
Inputs | | Total | |
| Bonds | |
| Municipal Bonds | | $ | — | | | $ | 267,640,479 | | | $ | — | | | $ | 267,640,479 | | |
| Total Bonds | | | — | | | | 267,640,479 | | | | — | | | | 267,640,479 | | |
| Other | |
| Money Market Funds | | | 8,020,734 | | | | — | | | | — | | | | 8,020,734 | | |
| Total Other | | | 8,020,734 | | | | — | | | | — | | | | 8,020,734 | | |
| Total | | $ | 8,020,734 | | | $ | 267,640,479 | | | $ | — | | | $ | 275,661,213 | | |
The Fund's assets assigned to the Level 2 input category are generally valued using the market approach, in which a security's value is determined through reference to prices and information from market transactions for similar or identical assets.
There were no transfers between Levels 1 and 2 during the period from April 1, 2011 to March 31, 2012.
The Accompanying Notes to Financial Statements are an integral part of this statement.
13
Statement of Assets and Liabilities – Columbia California Intermediate Municipal Bond Fund
| | | April 30,
2012 | | March 31,
2012 | |
| Assets | |
| Investments, at value | |
| (identified cost $257,065,103 and $256,589,514) | | $ | 278,704,353 | | | $ | 275,661,213 | | |
| Receivable for: | |
| Capital shares sold | | | 561,690 | | | | 304,902 | | |
| Interest | | | 3,572,328 | | | | 3,311,060 | | |
| Expense reimbursement due from Investment Manager | | | 6,781 | | | | 1,510 | | |
| Prepaid expense | | | 1,496 | | | | 2,702 | | |
| Total assets | | | 282,846,648 | | | | 279,281,387 | | |
| Liabilities | |
| Payable for: | |
| Investments purchased on a delayed delivery basis | | | ��� | | | | 2,451,133 | | |
| Capital shares purchased | | | 2,421,702 | | | | 200,840 | | |
| Dividend distributions to shareholders | | | 756,168 | | | | 773,926 | | |
| Investment management fees | | | 9,192 | | | | 3,016 | | |
| Distribution and service fees | | | 760 | | | | 243 | | |
| Transfer agent fees | | | 40,668 | | | | 37,396 | | |
| Administration fees | | | 1,596 | | | | 524 | | |
| Compensation of board members | | | 48,378 | | | | 47,723 | | |
| Other expenses | | | 20,881 | | | | 36,234 | | |
| Total liabilities | | | 3,299,345 | | | | 3,551,035 | | |
| Net assets applicable to outstanding capital stock | | $ | 279,547,303 | | | $ | 275,730,352 | | |
The Accompanying Notes to Financial Statements are an integral part of this statement.
14
Statement of Assets and Liabilities (continued) – Columbia California Intermediate Municipal Bond Fund
| | | April 30,
2012 | | March 31,
2012 | |
| Represented by | |
| Paid-in capital | | $ | 258,243,457 | | | $ | 257,027,799 | | |
| Excess of distributions over net investment income | | | (40,656 | ) | | | (65,598 | ) | |
| Accumulated net realized loss | | | (294,748 | ) | | | (303,548 | ) | |
| Unrealized appreciation (depreciation) on: | |
| Investments | | | 21,639,250 | | | | 19,071,699 | | |
Total — representing net assets
applicable to outstanding capital stock | | $ | 279,547,303 | | | $ | 275,730,352 | | |
| Net assets applicable to outstanding shares | |
| Class A | | $ | 20,179,580 | | | $ | 18,858,374 | | |
| Class B | | $ | 2,575 | | | $ | 2,541 | | |
| Class C | | $ | 4,383,711 | | | $ | 4,222,631 | | |
| Class Z | | $ | 254,981,437 | | | $ | 252,646,806 | | |
| Shares outstanding | |
| Class A | | | 1,926,987 | | | | 1,817,765 | | |
| Class B | | | 246 | | | | 245 | | |
| Class C | | | 418,850 | | | | 407,255 | | |
| Class Z | | | 24,402,933 | | | | 24,407,079 | | |
| Net asset value per share | |
| Class A(a) | | $ | 10.47 | | | $ | 10.37 | | |
| Class B | | $ | 10.47 | | | $ | 10.37 | | |
| Class C | | $ | 10.47 | | | $ | 10.37 | | |
| Class Z | | $ | 10.45 | | | $ | 10.35 | | |
(a) At April 30, 2012 and March 31, 2012, the maximum offering price per share for Class A is $10.82 and $10.72, respectively. The offering price is calculated by dividing the net asset value by 1.0 minus the maximum sales charge of 3.25%.
The Accompanying Notes to Financial Statements are an integral part of this statement.
15
Statement of Operations – Columbia California Intermediate Municipal Bond Fund
| Year ended | | April 30,
2012(a) | | March 31,
2012 | |
| Net investment income | |
| Income: | |
| Dividends | | $ | 60 | | | $ | 676 | | |
| Interest | | | 902,382 | | | | 9,624,217 | | |
| Total income | | | 902,442 | | | | 9,624,893 | | |
| Expenses: | |
| Investment management fees | | | 94,115 | | | | 993,751 | | |
| Distribution fees | |
| Class B | | | 2 | | | | 176 | | |
| Class C | | | 2,696 | | | | 22,753 | | |
| Service fees | |
| Class B | | | 1 | | | | 59 | | |
| Class C | | | 899 | | | | 7,584 | | |
| Distribution and service fees — Class A | | | 4,098 | | | | 32,948 | | |
| Transfer agent fees | |
| Class A | | | 3,279 | | | | 28,037 | | |
| Class B | | | — | | | | 77 | | |
| Class C | | | 718 | | | | 6,078 | | |
| Class Z | | | 42,975 | | | | 452,353 | | |
| Administration fees | | | 16,352 | | | | 205,208 | | |
| Compensation of board members | | | 1,283 | | | | 18,032 | | |
| Pricing and bookkeeping fees | | | — | | | | 10,948 | | |
| Custodian fees | | | 260 | | | | 6,678 | | |
| Printing and postage fees | | | 8,182 | | | | 38,729 | | |
| Registration fees | | | 100 | | | | 426 | | |
| Professional fees | | | 7,350 | | | | 49,687 | | |
| Chief compliance officer expenses | | | — | | | | 9 | | |
| Other | | | 1,788 | | | | 20,823 | | |
| Total expenses | | | 184,098 | | | | 1,894,356 | | |
Fees waived or expenses reimbursed by
Investment Manager and its affiliates | | | (63,149 | ) | | | (600,402 | ) | |
| Expense reductions | | | — | | | | (60 | ) | |
| Total net expenses | | | 120,949 | | | | 1,293,894 | | |
| Net investment income | | | 781,493 | | | | 8,330,999 | | |
| Realized and unrealized gain (loss) — net | |
| Net realized gain (loss) on: | |
| Investments | | | 8,800 | | | | 119,391 | | |
| Net realized gain | | | 8,800 | | | | 119,391 | | |
| Net change in unrealized appreciation (depreciation) on: | |
| Investments | | | 2,567,551 | | | | 17,385,205 | | |
| Net change in unrealized appreciation | | | 2,567,551 | | | | 17,385,205 | | |
| Net realized and unrealized gain | | | 2,576,351 | | | | 17,504,596 | | |
| Net increase in net assets resulting from operations | | $ | 3,357,844 | | | $ | 25,835,595 | | |
(a) For the period from April 1, 2012 to April 30, 2012. During the period, the Fund's fiscal year end was changed from March 31 to April 30.
The Accompanying Notes to Financial Statements are an integral part of this statement.
16
Statement of Changes in Net Assets – Columbia California Intermediate Municipal Bond Fund
| Year ended | | April 30,
2012(a) | | March 31,
2012 | | March 31,
2011 | |
| Operations | |
| Net investment income | | $ | 781,493 | | | $ | 8,330,999 | | | $ | 8,146,499 | | |
| Net realized gain | | | 8,800 | | | | 119,391 | | | | 165,204 | | |
Net change in unrealized
appreciation (depreciation) | | | 2,567,551 | | | | 17,385,205 | | | | (3,280,904 | ) | |
Net increase in net
assets resulting from operations | | | 3,357,844 | | | | 25,835,595 | | | | 5,030,799 | | |
| Distributions to shareholders from: | |
| Net investment income | |
| Class A | | | (49,341 | ) | | | (413,298 | ) | | | (474,558 | ) | |
| Class B | | | (5 | ) | | | (582 | ) | | | (4,709 | ) | |
| Class C | | | (8,181 | ) | | | (72,180 | ) | | | (46,111 | ) | |
| Class Z | | | (699,024 | ) | | | (7,875,410 | ) | | | (7,621,120 | ) | |
| Total distributions to shareholders | | | (756,551 | ) | | | (8,361,470 | ) | | | (8,146,498 | ) | |
Increase in net
assets from share transactions | | | 1,215,658 | | | | 27,876,297 | | | | 6,296,453 | | |
Total increase
in net assets | | | 3,816,951 | | | | 45,350,422 | | | | 3,180,754 | | |
| Net assets at beginning of year | | | 275,730,352 | | | | 230,379,930 | | | | 227,199,176 | | |
| Net assets at end of year | | $ | 279,547,303 | | | $ | 275,730,352 | | | $ | 230,379,930 | | |
Excess of distributions over net
investment income | | $ | (40,656 | ) | | $ | (65,598 | ) | | $ | (35,127 | ) | |
(a) For the period from April 1, 2012 to April 30, 2012. During the period, the Fund's fiscal year end was changed from March 31 to April 30.
The Accompanying Notes to Financial Statements are an integral part of this statement.
17
Statement of Changes in Net Assets (continued) – Columbia California Intermediate Municipal Bond Fund
| Year ended | | April 30, 2012(a) | | March 31, 2012 | | March 31, 2011 | |
| | | Shares | | Dollars ($) | | Shares | | Dollars ($) | | Shares | | Dollars ($) | |
| Capital stock activity | |
| Class A shares | |
| Subscriptions(b) | | | 139,914 | | | | 1,459,811 | | | | 1,119,886 | | | | 11,498,514 | | | | 2,427,085 | | | | 24,429,818 | | |
| Distributions reinvested | | | 3,174 | | | | 33,227 | | | | 22,921 | | | | 233,754 | | | | 15,526 | | | | 152,363 | | |
| Redemptions | | | (33,866 | ) | | | (353,564 | ) | | | (528,950 | ) | | | (5,341,071 | ) | | | (2,684,389 | ) | | | (26,210,695 | ) | |
| Net increase (decrease) | | | 109,222 | | | | 1,139,474 | | | | 613,857 | | | | 6,391,197 | | | | (241,778 | ) | | | (1,628,514 | ) | |
| Class B shares | |
| Subscriptions | | | — | | | | — | | | | 258 | | | | 2,711 | | | | 83 | | | | 813 | | |
| Distributions reinvested | | | 1 | | | | 5 | | | | 12 | | | | 125 | | | | 53 | | | | 524 | | |
| Redemptions(b) | | | — | | | | — | | | | (14,998 | ) | | | (148,715 | ) | | | (7,650 | ) | | | (75,477 | ) | |
| Net increase (decrease) | | | 1 | | | | 5 | | | | (14,728 | ) | | | (145,879 | ) | | | (7,514 | ) | | | (74,140 | ) | |
| Class C shares | |
| Subscriptions | | | 17,548 | | | | 183,578 | | | | 285,632 | | | | 2,887,432 | | | | 66,490 | | | | 653,746 | | |
| Distributions reinvested | | | 237 | | | | 2,481 | | | | 2,131 | | | | 21,747 | | | | 1,303 | | | | 12,838 | | |
| Redemptions | | | (6,190 | ) | | | (64,660 | ) | | | (46,327 | ) | | | (471,261 | ) | | | (94,974 | ) | | | (922,403 | ) | |
| Net increase (decrease) | | | 11,595 | | | | 121,399 | | | | 241,436 | | | | 2,437,918 | | | | (27,181 | ) | | | (255,819 | ) | |
| Class Z shares | |
| Subscriptions | | | 556,413 | | | | 5,800,182 | | | | 5,959,439 | | | | 60,535,019 | | | | 5,482,045 | | | | 54,193,355 | | |
| Distributions reinvested | | | 7,914 | | | | 82,696 | | | | 74,771 | | | | 759,777 | | | | 65,365 | | | | 642,397 | | |
| Redemptions | | | (568,473 | ) | | | (5,928,098 | ) | | | (4,174,507 | ) | | | (42,101,735 | ) | | | (4,757,117 | ) | | | (46,580,826 | ) | |
| Net increase (decrease) | | | (4,146 | ) | | | (45,220 | ) | | | 1,859,703 | | | | 19,193,061 | | | | 790,293 | | | | 8,254,926 | | |
| Total net increase | | | 116,672 | | | | 1,215,658 | | | | 2,700,268 | | | | 27,876,297 | | | | 513,820 | | | | 6,296,453 | | |
(a) For the period from April 1, 2012 to April 30, 2012. During the period, the Fund's fiscal year end was changed from March 31 to April 30.
(b) Includes conversions of Class B shares to Class A shares, if any.
The Accompanying Notes to Financial Statements are an integral part of this statement.
18
Financial Highlights – Columbia California Intermediate Municipal Bond Fund
The following tables are intended to help you understand the Fund's financial performance. Certain information reflects financial results for a single share of a class held for the periods shown. Per share net investment income (loss) amounts are calculated based on average shares outstanding during the period. Total returns assume reinvestment of all dividends and distributions. Total returns do not reflect payment of sales charges, if any, and are not annualized for periods of less than one year.
| | | April 30, | | Year ended March 31, | |
| | | 2012(a) | | 2012 | | 2011 | | 2010 | | 2009 | | 2008 | |
| Class A | |
| Per share data | |
| Supplemental data | |
| Net asset value, beginning of period | | $ | 10.37 | | | $ | 9.65 | | | $ | 9.72 | | | $ | 9.34 | | | $ | 9.50 | | | $ | 9.63 | | |
| Income from investment operations: | |
| Net investment income | | | 0.03 | | | | 0.32 | | | | 0.31 | | | | 0.32 | | | | 0.31 | | | | 0.33 | | |
| Net realized and unrealized gain (loss) | | | 0.10 | | | | 0.72 | | | | (0.07 | ) | | | 0.39 | | | | (0.16 | ) | | | (0.13 | ) | |
| Total from investment operations | | | 0.13 | | | | 1.04 | | | | 0.24 | | | | 0.71 | | | | 0.15 | | | | 0.20 | | |
| Less distributions to shareholders from: | |
| Net investment income | | | (0.03 | ) | | | (0.32 | ) | | | (0.31 | ) | | | (0.32 | ) | | | (0.31 | ) | | | (0.33 | ) | |
| Net realized gains | | | — | | | | — | | | | — | | | | (0.01 | ) | | | — | | | | — | | |
| Total distributions to shareholders | | | (0.03 | ) | | | (0.32 | ) | | | (0.31 | ) | | | (0.33 | ) | | | (0.31 | ) | | | (0.33 | ) | |
| Net asset value, end of period | | $ | 10.47 | | | $ | 10.37 | | | $ | 9.65 | | | $ | 9.72 | | | $ | 9.34 | | | $ | 9.50 | | |
| Total return | | | 1.22 | % | | | 10.87 | % | | | 2.48 | % | | | 7.65 | % | | | 1.65 | % | | | 2.08 | % | |
| Ratios to average net assets(b) | |
Expenses prior to fees waived or expenses reimbursed (including
interest expense) | | | 1.00 | %(c) | | | 1.00 | % | | | 0.94 | % | | | 0.90 | % | | | 0.88 | % | | | 0.91 | %(d) | |
Net expenses after fees waived or expenses reimbursed (including
interest expense)(e) | | | 0.73 | %(c) | | | 0.74 | %(f) | | | 0.80 | %(f) | | | 0.79 | %(f) | | | 0.75 | %(f) | | | 0.75 | %(d)(f) | |
Expenses prior to fees waived or expenses reimbursed (excluding
interest expense) | | | 1.00 | %(c) | | | 1.00 | % | | | 0.94 | % | | | 0.90 | % | | | 0.88 | % | | | 0.91 | % | |
Net expenses after fees waived or expenses reimbursed (excluding
interest expense)(e) | | | 0.73 | %(c) | | | 0.74 | %(f) | | | 0.80 | %(f) | | | 0.79 | %(f) | | | 0.75 | %(f) | | | 0.75 | %(f) | |
| Net investment income | | | 3.11 | %(c) | | | 3.13 | %(f) | | | 3.14 | %(f) | | | 3.34 | %(f) | | | 3.33 | %(f) | | | 3.40 | %(f) | |
| Supplemental data | |
| Net assets, end of period (in thousands) | | $ | 20,180 | | | $ | 18,858 | | | $ | 11,613 | | | $ | 14,059 | | | $ | 18,463 | | | $ | 13,488 | | |
| Portfolio turnover | | | 0 | % | | | 9 | % | | | 26 | % | | | 25 | % | | | 19 | % | | | 5 | % | |
Notes to Financial Highlights
(a) For the period from April 1, 2012 to April 30, 2012. During the period, the Fund's fiscal year end was changed from March 31 to April 30.
(b) In addition to the fees and expenses which the Fund bears directly, the Fund indirectly bears a pro rata share of the fees and expenses of the acquired funds in which it invests. Such indirect expenses are not included in the reported expense ratios.
(c) Annualized.
(d) Includes interest expense which rounds to less than 0.01%.
(e) The Investment Manager and certain of its affiliates agreed to waive/reimburse certain fees and expenses, if applicable.
(f) The benefits derived from expense reductions had an impact of less than 0.01%.
The Accompanying Notes to Financial Statements are an integral part of this statement.
19
Financial Highlights (continued) – Columbia California Intermediate Municipal Bond Fund
| | | April 30, | | Year ended March 31, | |
| | | 2012(a) | | 2012 | | 2011 | | 2010 | | 2009 | | 2008 | |
| Class B | |
| Per share data | |
| Net asset value, beginning of period | | $ | 10.37 | | | $ | 9.64 | | | $ | 9.71 | | | $ | 9.34 | | | $ | 9.49 | | | $ | 9.62 | | |
| Income from investment operations: | |
| Net investment income | | | 0.02 | | | | 0.25 | | | | 0.24 | | | | 0.25 | | | | 0.24 | | | | 0.26 | | |
| Net realized and unrealized gain (loss) | | | 0.10 | | | | 0.71 | | | | (0.07 | ) | | | 0.37 | | | | (0.15 | ) | | | (0.14 | ) | |
| Total from investment operations | | | 0.12 | | | | 0.96 | | | | 0.17 | | | | 0.62 | | | | 0.09 | | | | 0.12 | | |
| Less distributions to shareholders from: | |
| Net investment income | | | (0.02 | ) | | | (0.23 | ) | | | (0.24 | ) | | | (0.24 | ) | | | (0.24 | ) | | | (0.25 | ) | |
| Net realized gains | | | — | | | | — | | | | — | | | | (0.01 | ) | | | — | | | | — | | |
| Total distributions to shareholders | | | (0.02 | ) | | | (0.23 | ) | | | (0.24 | ) | | | (0.25 | ) | | | (0.24 | ) | | | (0.25 | ) | |
| Net asset value, end of period | | $ | 10.47 | | | $ | 10.37 | | | $ | 9.64 | | | $ | 9.71 | | | $ | 9.34 | | | $ | 9.49 | | |
| Total return | | | 1.16 | % | | | 10.04 | % | | | 1.72 | % | | | 6.74 | % | | | 1.00 | % | | | 1.32 | % | |
| Ratios to average net assets(b) | |
Expenses prior to fees waived or expenses reimbursed (including
interest expense) | | | 1.78 | %(c) | | | 1.96 | % | | | 1.69 | % | | | 1.65 | % | | | 1.63 | % | | | 1.66 | %(d) | |
Net expenses after fees waived or expenses reimbursed (including
interest expense)(e) | | | 1.48 | %(c) | | | 1.56 | %(f) | | | 1.55 | %(f) | | | 1.54 | %(f) | | | 1.50 | %(f) | | | 1.50 | %(d)(f) | |
Expenses prior to fees waived or expenses reimbursed (excluding
interest expense) | | | 1.78 | %(c) | | | 1.96 | % | | | 1.69 | % | | | 1.65 | % | | | 1.63 | % | | | 1.66 | % | |
Net expenses after fees waived or expenses reimbursed (excluding
interest expense)(e) | | | 1.48 | %(c) | | | 1.56 | %(f) | | | 1.55 | %(f) | | | 1.54 | %(f) | | | 1.50 | %(f) | | | 1.50 | %(f) | |
| Net investment income | | | 2.38 | %(c) | | | 2.53 | %(f) | | | 2.41 | %(f) | | | 2.58 | %(f) | | | 2.58 | %(f) | | | 2.69 | %(f) | |
| Supplemental data | |
| Net assets, end of period (in thousands) | | $ | 3 | | | $ | 3 | | | $ | 144 | | | $ | 218 | | | $ | 348 | | | $ | 475 | | |
| Portfolio turnover | | | 0 | % | | | 9 | % | | | 26 | % | | | 25 | % | | | 19 | % | | | 5 | % | |
Notes to Financial Highlights
(a) For the period from April 1, 2012 to April 30, 2012. During the period, the Fund's fiscal year end was changed from March 31 to April 30.
(b) In addition to the fees and expenses which the Fund bears directly, the Fund indirectly bears a pro rata share of the fees and expenses of the acquired funds in which it invests. Such indirect expenses are not included in the reported expense ratios.
(c) Annualized.
(d) Includes interest expense which rounds to less than 0.01%.
(e) The Investment Manager and certain of its affiliates agreed to waive/reimburse certain fees and expenses, if applicable.
(f) The benefits derived from expense reductions had an impact of less than 0.01%.
The Accompanying Notes to Financial Statements are an integral part of this statement.
20
Financial Highlights (continued) – Columbia California Intermediate Municipal Bond Fund
| | | April 30, | | Year ended March 31, | |
| | | 2012(a) | | 2012 | | 2011 | | 2010 | | 2009 | | 2008 | |
| Class C | |
| Per share data | |
| Net asset value, beginning of period | | $ | 10.37 | | | $ | 9.64 | | | $ | 9.72 | | | $ | 9.35 | | | $ | 9.50 | | | $ | 9.63 | | |
| Income from investment operations: | |
| Net investment income | | | 0.02 | | | | 0.24 | | | | 0.24 | | | | 0.25 | | | | 0.24 | | | | 0.26 | | |
| Net realized and unrealized gain (loss) | | | 0.10 | | | | 0.73 | | | | (0.08 | ) | | | 0.37 | | | | (0.15 | ) | | | (0.14 | ) | |
| Total from investment operations | | | 0.12 | | | | 0.97 | | | | 0.16 | | | | 0.62 | | | | 0.09 | | | | 0.12 | | |
| Less distributions to shareholders from: | |
| Net investment income | | | (0.02 | ) | | | (0.24 | ) | | | (0.24 | ) | | | (0.24 | ) | | | (0.24 | ) | | | (0.25 | ) | |
| Net realized gains | | | — | | | | — | | | | — | | | | (0.01 | ) | | | — | | | | — | | |
| Total distributions to shareholders | | | (0.02 | ) | | | (0.24 | ) | | | (0.24 | ) | | | (0.25 | ) | | | (0.24 | ) | | | (0.25 | ) | |
| Net asset value, end of period | | $ | 10.47 | | | $ | 10.37 | | | $ | 9.64 | | | $ | 9.72 | | | $ | 9.35 | | | $ | 9.50 | | |
| Total return | | | 1.16 | % | | | 10.15 | % | | | 1.61 | % | | | 6.74 | % | | | 1.00 | % | | | 1.31 | % | |
| Ratios to average net assets(b) | |
Expenses prior to fees waived or expenses reimbursed (including
interest expense) | | | 1.75 | %(c) | | | 1.73 | % | | | 1.69 | % | | | 1.65 | % | | | 1.63 | % | | | 1.66 | %(d) | |
Net expenses after fees waived or expenses reimbursed (including
interest expense)(e) | | | 1.48 | %(c) | | | 1.49 | %(f) | | | 1.55 | %(f) | | | 1.54 | %(f) | | | 1.50 | %(f) | | | 1.50 | %(d)(f) | |
Expenses prior to fees waived or expenses reimbursed (excluding
interest expense) | | | 1.75 | %(c) | | | 1.73 | % | | | 1.69 | % | | | 1.65 | % | | | 1.63 | % | | | 1.66 | % | |
Net expenses after fees waived or expenses reimbursed (excluding
interest expense)(e) | | | 1.48 | %(c) | | | 1.49 | %(f) | | | 1.55 | %(f) | | | 1.54 | %(f) | | | 1.50 | %(f) | | | 1.50 | %(f) | |
| Net investment income | | | 2.36 | %(c) | | | 2.38 | %(f) | | | 2.42 | %(f) | | | 2.55 | %(f) | | | 2.58 | %(f) | | | 2.67 | %(f) | |
| Supplemental data | |
| Net assets, end of period (in thousands) | | $ | 4,384 | | | $ | 4,223 | | | $ | 1,599 | | | $ | 1,875 | | | $ | 1,061 | | | $ | 1,263 | | |
| Portfolio turnover | | | 0 | % | | | 9 | % | | | 26 | % | | | 25 | % | | | 19 | % | | | 5 | % | |
Notes to Financial Highlights
(a) For the period from April 1, 2012 to April 30, 2012. During the period, the Fund's fiscal year end was changed from March 31 to April 30.
(b) In addition to the fees and expenses which the Fund bears directly, the Fund indirectly bears a pro rata share of the fees and expenses of the acquired funds in which it invests. Such indirect expenses are not included in the reported expense ratios.
(c) Annualized.
(d) Includes interest expense which rounds to less than 0.01%.
(e) The Investment Manager and certain of its affiliates agreed to waive/reimburse certain fees and expenses, if applicable.
(f) The benefits derived from expense reductions had an impact of less than 0.01%.
The Accompanying Notes to Financial Statements are an integral part of this statement.
21
Financial Highlights (continued) – Columbia California Intermediate Municipal Bond Fund
| | | April 30, | | Year ended March 31, | |
| | | 2012(a) | | 2012 | | 2011 | | 2010 | | 2009 | | 2008 | |
| Class Z | |
| Per share data | |
| Net asset value, beginning of period | | $ | 10.35 | | | $ | 9.63 | | | $ | 9.70 | | | $ | 9.33 | | | $ | 9.48 | | | $ | 9.61 | | |
| Income from investment operations: | |
| Net investment income | | | 0.03 | | | | 0.34 | | | | 0.34 | | | | 0.34 | | | | 0.34 | | | | 0.35 | | |
| Net realized and unrealized gain (loss) | | | 0.10 | | | | 0.72 | | | | (0.07 | ) | | | 0.38 | | | | (0.15 | ) | | | (0.13 | ) | |
| Total from investment operations | | | 0.13 | | | | 1.06 | | | | 0.27 | | | | 0.72 | | | | 0.19 | | | | 0.22 | | |
| Less distributions to shareholders from: | |
| Net investment income | | | (0.03 | ) | | | (0.34 | ) | | | (0.34 | ) | | | (0.34 | ) | | | (0.34 | ) | | | (0.35 | ) | |
| Net realized gains | | | — | | | | — | | | | — | | | | (0.01 | ) | | | — | | | | — | | |
| Total distributions to shareholders | | | (0.03 | ) | | | (0.34 | ) | | | (0.34 | ) | | | (0.35 | ) | | | (0.34 | ) | | | (0.35 | ) | |
| Net asset value, end of period | | $ | 10.45 | | | $ | 10.35 | | | $ | 9.63 | | | $ | 9.70 | | | $ | 9.33 | | | $ | 9.48 | | |
| Total return | | | 1.24 | % | | | 11.16 | % | | | 2.74 | % | | | 7.82 | % | | | 2.02 | % | | | 2.33 | % | |
| Ratios to average net assets(b) | |
Expenses prior to fees waived or expenses reimbursed (including
interest expense) | | | 0.75 | %(c) | | | 0.74 | % | | | 0.69 | % | | | 0.65 | % | | | 0.63 | % | | | 0.66 | %(d) | |
Net expenses after fees waived or expenses reimbursed (including
interest expense)(e) | | | 0.48 | %(c) | | | 0.50 | %(f) | | | 0.55 | %(f) | | | 0.54 | %(f) | | | 0.50 | %(f) | | | 0.50 | %(d)(f) | |
Expenses prior to fees waived or expenses reimbursed (excluding
interest expense) | | | 0.75 | %(c) | | | 0.74 | % | | | 0.69 | % | | | 0.65 | % | | | 0.63 | % | | | 0.66 | % | |
Net expenses after fees waived or expenses reimbursed (excluding
interest expense)(e) | | | 0.48 | %(c) | | | 0.50 | %(f) | | | 0.55 | %(f) | | | 0.54 | %(f) | | | 0.50 | %(f) | | | 0.50 | %(f) | |
| Net investment income | | | 3.35 | %(c) | | | 3.39 | %(f) | | | 3.43 | %(f) | | | 3.56 | %(f) | | | 3.58 | %(f) | | | 3.66 | %(f) | |
| Supplemental data | |
| Net assets, end of period (in thousands) | | $ | 254,981 | | | $ | 252,647 | | | $ | 217,024 | | | $ | 211,046 | | | $ | 187,844 | | | $ | 203,426 | | |
| Portfolio turnover | | | 0 | % | | | 9 | % | | | 26 | % | | | 25 | % | | | 19 | % | | | 5 | % | |
Notes to Financial Highlights
(a) For the period from April 1, 2012 to April 30, 2012. During the period, the Fund's fiscal year end was changed from March 31 to April 30.
(b) In addition to the fees and expenses which the Fund bears directly, the Fund indirectly bears a pro rata share of the fees and expenses of the acquired funds in which it invests. Such indirect expenses are not included in the reported expense ratios.
(c) Annualized.
(d) Includes interest expense which rounds to less than 0.01%.
(e) The Investment Manager and certain of its affiliates agreed to waive/reimburse certain fees and expenses, if applicable.
(f) The benefits derived from expense reductions had an impact of less than 0.01%.
The Accompanying Notes to Financial Statements are an integral part of this statement.
22
Notes to Financial Statements – Columbia California Intermediate Municipal Bond Fund
April 30, 2012
Note 1. Organization
Columbia California Intermediate Municipal Bond Fund (the Fund), a series of Columbia Funds Series Trust (the Trust), is a diversified fund. The Trust is registered under the Investment Company Act of 1940, as amended (the 1940 Act), as an open-end management investment company organized as a Delaware statutory trust.
Fiscal Year End Change
During the period, the Fund changed its fiscal year end from March 31 to April 30. Accordingly, this report includes activity for the period April 1, 2012 to April 30, 2012 and the year ended March 31, 2012.
Fund Shares
The Trust may issue an unlimited number of shares (without par value). The Fund offers Class A, Class B, Class C and Class Z shares. All share classes have identical voting, dividend and liquidation rights. Each share class has its own expense structure and sales charges, as applicable.
Class A shares are subject to a maximum front-end sales charge of 3.25% based on the initial investment amount. Class A shares purchased without an initial sales charge in accounts aggregating $1 million to $50 million at the time of purchase are subject to a contingent deferred sales charge (CDSC) if the shares are sold within 18 months of purchase, charged as follows: 1.00% CDSC if redeemed within 12 months of purchase, and 0.50% CDSC if redeemed more than 12, but less than 18, months after purchase.
Class B shares may be subject to a maximum CDSC of 3.00% based upon the holding period after purchase. Class B shares will generally convert to Class A shares eight years after purchase. The Fund no longer accepts investments by new or existing investors in the Fund's Class B shares, except in connection with the reinvestment of any dividend and/or capital gain distributions in Class B shares of the Fund and exchanges by existing Class B shareholders of certain other funds within the Columbia Family of Funds.
Class C shares are subject to a 1.00% CDSC on shares redeemed within one year of purchase.
Class Z shares are not subject to sales charges, and are only available to certain investors, as described in the Fund's prospectus.
Note 2. Summary of Significant Accounting Policies
Use of Estimates
The preparation of financial statements in accordance with U.S. generally accepted accounting principles (GAAP) requires management to make certain estimates and assumptions that affect the reported amounts of assets and liabilities, the disclosure of contingent assets and liabilities at the date of the financial statements and the reported amounts of revenue and expenses during the reporting period. Actual results could differ from those estimates.
The following is a summary of significant accounting policies consistently followed by the Fund in the preparation of its financial statements.
Security Valuation
Debt securities generally are valued by pricing services approved by the Board of Trustees (the Board) based upon market transactions for normal, institutional-size trading units of similar securities. The services may use various pricing techniques which take into account appropriate factors such as yield, quality, coupon rate, maturity, type of issue, trading characteristics and other data, as well as broker quotes. Debt securities for which quotations are readily available may also be valued based upon an over-the-counter or exchange bid quotation.
Investments in other open-end investment companies, including money market funds, are valued at net asset value.
Short-term securities purchased within 60 days to maturity are valued at amortized cost, which approximates market value. The value of short-term securities originally purchased with maturities greater than 60 days is determined based on an amortized value to par upon reaching 60 days to maturity. Short-term securities maturing in more than 60 days from the valuation date are valued at the market price or approximate market value based on current interest rates.
Investments for which market quotations are not readily available, or that have quotations which management believes are not reliable, are valued at fair value as determined in good faith under consistently applied procedures established by and under the general supervision of the Board. If a security or class of securities (such as foreign securities) is valued at fair
23
Columbia California Intermediate Municipal Bond Fund, April 30, 2012
value, such value is likely to be different from the last quoted market price for the security. The determination of fair value often requires significant judgment. To determine fair value, management may use assumptions including but not limited to future cash flows and estimated risk premiums. Multiple inputs from various sources may be used to determine value.
Delayed Delivery Securities
The Fund may trade securities on other than normal settlement terms, including securities purchased or sold on a "when-issued" basis. This may increase the risk if the other party to the transaction fails to deliver and causes the Fund to subsequently invest at less advantageous prices. The Fund designates cash or liquid securities in an amount equal to the delayed delivery commitment.
Security Transactions
Security transactions are accounted for on the trade date. Cost is determined and gains (losses) are based upon the specific identification method for both financial statement and federal income tax purposes.
Income Recognition
Interest income is recorded on the accrual basis. Market premium and discount are amortized and accreted, respectively, on all debt securities, unless otherwise noted. Original issue discount is accreted to interest income over the life of the security with a corresponding increase in the cost basis, if any.
Dividend income is recorded on the ex-dividend date.
Expenses
General expenses of the Trust are allocated to the Fund and other funds of the Trust based upon relative net assets or other expense allocation methodologies determined by the nature of the expense. Expenses directly attributable to the Fund are charged to the Fund. Expenses directly attributable to a specific class of shares are charged to that share class.
Determination of Class Net Asset Value
All income, expenses (other than class-specific expenses, which are charged to that share class, as shown in the Statement of Operations) and realized and unrealized gains (losses) are allocated to each class of the Fund on a daily basis for purposes of determining the net asset value of each class. Income and expenses are allocated to each class based on the settled shares method, while realized and unrealized gains (losses) are allocated based on the relative net assets of each class.
Federal Income Tax Status
The Fund intends to qualify each year as a regulated investment company under Subchapter M of the Internal Revenue Code, as amended, and will distribute substantially all of its tax exempt or taxable income (including net short-term capital gains), if any, for its tax year, and as such will not be subject to federal income taxes. In addition, the Fund intends to distribute in each calendar year substantially all of its net investment income, capital gains and certain other amounts, if any, such that the Fund should not be subject to federal excise tax. Therefore, no federal income or excise tax provision is recorded.
Distributions to Shareholders
Distributions from net investment income are declared daily and paid monthly. Net realized capital gains, if any, are distributed at least annually. Income distributions and capital gain distributions are determined in accordance with federal income tax regulations which may differ from GAAP.
Guarantees and Indemnifications
Under the Trust's organizational documents and, in some cases, by contract, its officers and trustees are indemnified against certain liabilities arising out of the performance of their duties to the Trust or its funds. In addition, certain of the Fund's contracts with its service providers contain general indemnification clauses. The Fund's maximum exposure under these arrangements is unknown since the amount of any future claims that may be made against the Fund cannot be determined, and the Fund has no historical basis for predicting the likelihood of any such claims.
Note 3. Fees and Compensation Paid to Affiliates
Investment Management Fees
Under an Investment Management Services Agreement, Columbia Management Investment Advisers, LLC (the Investment Manager), a wholly-owned subsidiary of Ameriprise Financial, Inc. (Ameriprise Financial), determines which securities will be purchased, held or sold. The
24
Columbia California Intermediate Municipal Bond Fund, April 30, 2012
management fee is an annual fee that is equal to a percentage of the Fund's average daily net assets that declines from 0.40% to 0.27% as the Fund's net assets increase. For the period April 1, 2012 to April 30, 2012 and the year ended March 31, 2012, the annualized effective management fee rate was 0.40% of the Fund's average daily net assets.
Administration Fees
Under an Administrative Services Agreement, the Investment Manager serves as the Fund Administrator. Effective July 1, 2011, the Fund pays the Fund Administrator an annual fee for administration and accounting services equal to a percentage of the Fund's average daily net assets that declines from 0.07% to 0.04% as the Fund's net assets increase. Prior to July 1, 2011, the administration fee was equal to the annual rate of 0.15% of the Fund's average daily net assets, less the fees that were payable by the Fund as described under the Pricing and Bookkeeping Fees note below. For the period April 1, 2012 to April 30, 2012, the annualized effective administration fee rate was 0.07% of the Fund's average daily net assets. For the year ended March 31, 2012, the effective administration fee rate was 0.09% of the Fund's average daily net assets.
Pricing and Bookkeeping Fees
Prior to May 16, 2011, the Fund had entered into a Financial Reporting Services Agreement (the Financial Reporting Services Agreement) with State Street Bank and Trust Company (State Street) and the Investment Manager pursuant to which State Street provided financial reporting services to the Fund. The Fund also entered into an Accounting Services Agreement (collectively with the Financial Reporting Services Agreement, the State Street Agreements) with State Street and the Investment Manager pursuant to which State Street provided accounting services to the Fund. Under the State Street Agreements, the Fund paid State Street an annual fee of $38,000 paid monthly plus an additional monthly fee based on an annualized percentage rate of average daily net assets of the Fund for the month. The aggregate fee did not exceed $140,000 per year (exclusive of out-of-pocket expenses and charges). The Fund also reimbursed State Street for certain out-of-pocket expenses and charges. Effective May 16, 2011, these services are provided under the Administrative Services Agreement discussed above.
Other Fees
Effective June 1, 2011, other expenses are for, among other things, certain expenses of the Fund or the Board, including: Fund boardroom and office expense, employee compensation, employee health and retirement benefits, and certain other expenses. Payment of these Fund and Board expenses is facilitated by a company providing limited administrative services to the Fund and the Board. For the period April 1, 2012 to April 30, 2012 and the period June 1, 2011 through March 31, 2012, other expenses paid to this company were $157 and $2,038, respectively.
Compensation of Board Members
Board members are compensated for their services to the Fund as disclosed in the Statement of Operations. Under a Deferred Compensation Plan (the Plan), the Board members who are not "interested persons" of the Fund, as defined under the 1940 Act, may elect to defer payment of up to 100% of their compensation. Deferred amounts are treated as though equivalent dollar amounts had been invested in shares of certain funds managed by the Investment Manager. The Fund's liability for these amounts is adjusted for market value changes and remains in the Fund until distributed in accordance with the Plan.
Compensation of Chief Compliance Officer
The Board has appointed a Chief Compliance Officer to the Fund in accordance with federal securities regulations. The Fund's expenses associated with the Chief Compliance Officer are paid directly by the Investment Manager .
Transfer Agent Fees
Under a Transfer and Dividend Disbursing Agent Agreement, Columbia Management Investment Services Corp. (the Transfer Agent), an affiliate of the Investment Manager and a wholly-owned subsidiary of Ameriprise Financial, is responsible for providing transfer agency services to the Fund. The Transfer Agent has contracted with Boston Financial Data Services (BFDS) to serve as sub-transfer agent.
The Transfer Agent receives monthly account-based service fees based on the number of open accounts and is reimbursed by the Fund for the fees and expenses the Transfer Agent pays to financial intermediaries that maintain omnibus accounts with the Fund that is a percentage of the average aggregate
25
Columbia California Intermediate Municipal Bond Fund, April 30, 2012
value of the Fund's shares maintained in each such omnibus account (other than omnibus accounts for which American Enterprise Investment Services Inc. is the broker of record or accounts where the beneficial shareholder is a customer of Ameriprise Financial Services, Inc., which are paid a per account fee). The Transfer Agent pays the fees of BFDS for services as sub-transfer agent and is not entitled to reimbursement for such fees from the Fund (with the exception of out-of-pocket fees).
The Transfer Agent also receives compensation from fees for various shareholder services and reimbursements for certain out-of-pocket expenses.
For the period April 1, 2012 to April 30, 2012 and the year ended March 31, 2012, the Fund's annualized effective transfer agent fee rates as a percentage of average daily net assets of each class were as follows:
| | | Period ended
April 30,
2012 | | Year ended
March 31,
2012 | |
| Class A | | | 0.20 | % | | | 0.21 | % | |
| Class B | | | 0.21 | | | | 0.33 | | |
| Class C | | | 0.20 | | | | 0.20 | | |
| Class Z | | | 0.20 | | | | 0.20 | | |
An annual minimum account balance fee of $20 may apply to certain accounts with a value below the Fund's initial minimum investment requirements to reduce the impact of small accounts on transfer agent fees. These minimum account balance fees are recorded as part of expense reductions in the Statement of Operations. For the period April 1, 2012 to April 30, 2012, no minimum account balance fees were charged to accounts. For the year ended March 31, 2012, these minimum account balance fees reduced total expenses by $60.
Distribution and Service Fees
The Fund has an agreement with Columbia Management Investment Distributors, Inc. (the Distributor), an affiliate of the Investment Manager and a wholly-owned subsidiary of Ameriprise Financial, for distribution and shareholder services. Pursuant to Rule 12b-1 under the 1940 Act, the Board has approved, and the Fund has adopted, distribution and shareholder service plans (the Plans) which set the distribution and service fees for the Fund. These fees are calculated daily and are intended to compensate the Distributor and/or eligible selling and/or servicing agents for selling shares of the Fund and providing services to investors.
The Plans require the payment of a monthly combined distribution and service fee to the Distributor at the maximum annual rate of 0.25% of the average daily net assets attributable to Class A shares of the Fund. The Plans also require the payment of a monthly service fee at the maximum annual rate of 0.25% of the average daily net assets attributable to Class B and Class C shares of the Fund and the payment of a monthly distribution fee at the maximum annual rate of 0.75% of the average daily net assets attributable to Class B and Class C shares of the Fund.
Sales Charges
Sales charges, including front-end charges and CDSCs, received by the Distributor for distributing Fund shares were $326 for Class A and $25 for Class C shares for the period April 1, 2012 to April 30, 2012, and $38,331 for Class A shares for the year ended March 31, 2012.
Expenses Waived/Reimbursed by the Investment Manager and its Affiliates
Effective July 1, 2011, the Investment Manager and certain of its affiliates have contractually agreed to waive fees and/or reimburse expenses (excluding certain fees and expenses described below), through July 31, 2012, unless sooner terminated at the sole discretion of the Board, so that the Fund's net operating expenses, after giving effect to fees waived/expenses reimbursed and any balance credits and/or overdraft charges from the Fund's custodian, do not exceed the following annual rates as a percentage of the class' average daily net assets:
| Class A | | | 0.73 | % | |
| Class B | | | 1.48 | | |
| Class C | | | 1.48 | | |
| Class Z | | | 0.48 | | |
Under the agreement, the following fees and expenses are excluded from the waiver/reimbursement commitment, and
26
Columbia California Intermediate Municipal Bond Fund, April 30, 2012
therefore will be paid by the Fund, if applicable: taxes (including foreign transaction taxes), expenses associated with investments in affiliated and non-affiliated pooled investment vehicles (including mutual funds and exchange traded funds), transaction costs and brokerage commissions, costs related to any securities lending program, dividend expenses associated with securities sold short, inverse floater program fees and expenses, transaction charges and interest on borrowed money, interest, extraordinary expenses and any other expenses the exclusion of which is specifically approved by the Fund's Board. This agreement may be modified or amended only with approval from all parties.
Prior to July 1, 2011, the Investment Manager voluntarily agreed to reimburse a portion of the Fund's expenses (excluding certain expenses, such as distribution and services fees, brokerage commissions, interest, taxes and extraordinary expenses, but including custodian charges relating to overdrafts, if any) so that the Fund's ordinary net operating expenses, after giving effect to fees waived/expenses reimbursed and any balance credits and/or overdraft charges from the Fund's custodian, did not exceed 0.55% of the Fund's average daily net assets on an annualized basis.
Prior to May 1, 2011, the Investment Manager was entitled to recover from the Fund any fees waived and/or expenses reimbursed for a three year period following the date of such fee waiver and/or reimbursement under these arrangements if such recovery did not cause the Fund's expenses to exceed the expense limitations in effect at the time of recovery. Effective May 1, 2011, the Investment Manager has eliminated such fee recoupment provisions.
Note 4. Federal Tax Information
The timing and character of income and capital gain distributions are determined in accordance with income tax regulations, which may differ from GAAP because of temporary or permanent book to tax differences.
For the period April 1, 2012 to April 30, 2012, these differences are primarily due to differing treatment for Trustees' deferred compensation, distributions, capital loss carryforwards and investments in partnerships. For the year ended March 31, 2012, these differences are primarily due to differing treatment for Trustees' deferred compensation, distributions, capital loss carryforwards and investments in partnerships. To the extent these differences are permanent, reclassifications are made among the components of the Fund's net assets in the Statement of Assets and Liabilities. Temporary differences do not require reclassifications. In the Statement of Assets and Liabilities the following reclassifications were made:
| | | Period ended
April 30,
2012 | | Year ended
March 31,
2012 | |
Excess of distributions
over net investment income | | $— | | $— | |
Accumulated net realized
loss | | | — | | | | 2,491 | | |
| Paid-in capital | | | — | | | | (2,491 | ) | |
Net investment income and net realized gains (losses), as disclosed in the Statement of Operations, and net assets were not affected by this reclassification.
The tax character of distributions paid during the periods indicated was as follows:
| | | Period ended
April 30,
2012 | | Year ended
March 31,
2012 | | Year ended
March 31,
2011 | |
| Ordinary income | | $ | 1,506 | | | $ | 10,853 | | | $ | 20,192 | | |
| Tax-exempt income | | | 755,045 | | | | 8,350,617 | | | | 8,126,306 | | |
Short-term capital gain distributions, if any, are considered ordinary income distributions for tax purposes.
At April 30, 2012 and March 31, 2012, the components of distributable earnings on a tax basis were as follows:
| | | April 30,
2012 | | March 31,
2012 | |
Undistributed tax-exempt
income | | $ | 734,989 | | | $ | 727,805 | | |
| Unrealized appreciation | | | 21,679,665 | | | | 19,112,114 | | |
27
Columbia California Intermediate Municipal Bond Fund, April 30, 2012
At April 30, 2012 and March 31, 2012, the cost of investments for federal income tax purposes, and the aggregate unrealized appreciation and depreciation based on that cost was as follows:
| | | April 30,
2012 | | March 31,
2012 | |
Aggregate unrealized
appreciation | | $22,173,321 | | $19,704,745 | |
Aggregate unrealized
depreciation | | | (493,656 | ) | | | (592,631 | ) | |
Net unrealized
appreciation | | 21,679,665 | | 19,112,114 | |
Cost of investments for
tax purposes | | | 257,024,688 | | | | 256,549,099 | | |
The following capital loss carryforward, determined at April 30, 2012 and March 31, 2012, may be available to reduce taxable income arising from future net realized gains on investments, if any, to the extent permitted by the Internal Revenue Code:
| | | April 30,
2012 | | March 31,
2012 | |
| Year of Expiration | | Amount | | Amount | |
| 2017 | | $ | 307,894 | | | $ | — | | |
| 2018 | | | — | | | | 316,694 | | |
| Total | | $ | 307,894 | | | $ | 316,694 | | |
On December 22, 2010, the Regulated Investment Company Modernization Act of 2010 (the Act) was enacted, which changed various technical rules governing the tax treatment of regulated investment companies. The changes are generally effective for taxable years beginning after the date of enactment. Under the Act, the Fund will be permitted to carry forward capital losses incurred in taxable years beginning after the date of enactment for an unlimited period. However, any losses incurred during those future taxable years will be required to be utilized prior to the losses incurred in pre-enactment taxable years, which carry an expiration date. As a result of this ordering rule, pre-enactment capital loss carryforwards may be more likely to expire unused.
For the period April 1, 2012 to April 30, 2012, $8,800 of capital loss carryforward was utilized. For the year ended March 31, 2012, $121,882 of capital loss carryforward was utilized.
Management of the Fund has concluded that there are no significant uncertain tax positions that would require recognition in the financial statements. However, management's conclusion may be subject to review and adjustment at a later date based on factors including, but not limited to, new tax laws, regulations, and administrative interpretations (including relevant court decisions). Generally, the Fund's federal tax returns for the prior three fiscal years remain subject to examination by the Internal Revenue Service.
Note 5. Portfolio Information
For the period April 1, 2012 to April 30, 2012, the cost of purchases and proceeds from sales of securities, excluding short-term obligations, aggregated to $4,536,014 and $888,800, respectively.
For the year ended March 31, 2012, the cost of purchases and proceeds from sales of securities, excluding short-term obligations, aggregated to $54,847,948 and $22,187,028, respectively.
Note 6. Lending of Portfolio Securities
Effective May 16, 2011, the Fund has entered into a Master Securities Lending Agreement (the Agreement) with JPMorgan Chase Bank, N.A. (JPMorgan). The Agreement, which replaces the previous securities lending arrangement with State Street, authorizes JPMorgan as lending agent to lend securities to authorized borrowers in order to generate additional income on behalf of the Fund. Pursuant to the Agreement, the securities loaned are secured by cash or U.S. government securities equal to at least 100% of the market value of the loaned securities. Any additional collateral required to maintain those levels due to market fluctuations of the loaned securities is requested to be delivered the following business day. Cash collateral received is invested by the lending agent on behalf of the Fund into authorized investments pursuant to the Agreement. The investments made with the cash collateral are listed in the Portfolio of Investments. The values of such investments and any uninvested cash collateral are disclosed in the Statement
28
Columbia California Intermediate Municipal Bond Fund, April 30, 2012
of Assets and Liabilities along with the related obligation to return the collateral upon the return of the securities loaned.
Risks of delay in recovery of securities or even loss of rights in the securities may occur should the borrower of the securities fail financially. Risks may also arise to the extent that the value of the securities loaned increases above the value of the collateral received. JPMorgan will indemnify the Fund from losses resulting from a borrower's failure to return a loaned security when due. Such indemnification does not extend to losses associated with declines in the value of cash collateral investments. The Investment Manager is not responsible for any losses incurred by the Fund in connection with the securities lending program. Loans are subject to termination by the Fund or the borrower at any time, and are, therefore, not considered to be illiquid investments.
Pursuant to the Agreement, the Fund receives income for lending its securities either in the form of fees or by earning interest on invested cash collateral, net of negotiated rebates paid to borrowers and fees paid to the lending agent for services provided and any other securities lending expenses.
Prior to May 16, 2011, the Fund participated in a securities lending arrangement with State Street. Each security on loan was collateralized in an amount at least equal to the market value of the securities loaned plus accrued income from the investment of collateral. The income generated by the investment of the collateral, net of any fees remitted to State Street as the lending agent and borrower rebates, was paid to the Fund.
For the period ended April 30, 2012 and the year ended March 31, 2012, the Fund did not participate in securities lending activity.
Note 7. Custody Credits
Prior to May 16, 2011, the Fund had an agreement with its custodian bank under which custody fees may have been reduced by balance credits. These credits are recorded as part of expense reductions on the Statement of Operations. The Fund could have invested a portion of the assets utilized in connection with the expense offset arrangement in an income-producing asset if they had not entered into such an agreement. For the period April 1, 2011 through May 16, 2011, there were no Custody Credits charged.
Note 8. Shareholder Concentration
At April 30, 2012 and March 31, 2012, one unaffiliated shareholder account owned 82.4% and 82.8% of the outstanding shares of the Fund, respectively. The Fund has no knowledge about whether any portion of those shares was owned beneficially by such account. Subscription and redemption activity by concentrated accounts may have a significant effect on the operations of the Fund.
Note 9. Line of Credit
The Fund has entered into a revolving credit facility with a syndicate of banks led by JPMorgan, whereby the Fund may borrow for the temporary funding of shareholder redemptions or for other temporary or emergency purposes. The credit facility became effective on May 16, 2011, replacing a prior credit facility. The credit facility agreement, as amended, which is a collective agreement between the Fund and certain other funds managed by the Investment Manager, severally and not jointly, permits collective borrowings up to $500 million. Pursuant to a December 13, 2011 amendment to the credit facility agreement, interest is charged to each participating fund based on its borrowings at a rate equal to the higher of (i) the overnight federal funds rate plus 1.00% or (i) the one-month LIBOR rate plus 1.00%. Each borrowing under the credit facility matures no later than 60 days after the date of borrowing. The Fund also pays a commitment fee equal to its pro rata share of the amount of the credit facility at a rate of 0.08% per annum. For the period May 16, 2011 through December 13, 2011, interest was charged to each participating fund based on its borrowings at a rate equal to the sum of the federal funds rate plus (i) 1.25% per annum plus (ii) if one-month LIBOR exceeds the federal funds rate, the amount of such excess. The Fund also paid a commitment fee equal to its pro rata share of the amount of the credit facility at a rate of 0.10% per annum.
Prior to May 16, 2011, the Fund and certain other funds managed by the Investment Manager participated in a $225 million committed, unsecured revolving credit facility provided by State Street. Interest was charged to each fund based on its borrowings at a rate equal to the greater of the (i) federal funds rate plus 1.25% per annum or (ii) the overnight LIBOR rate plus 1.25% per annum. The Fund also paid a commitment fee equal to its pro rata share of the amount of the credit facility at a rate of 0.125% per annum.
29
Columbia California Intermediate Municipal Bond Fund, April 30, 2012
The Fund had no borrowings during the period ended April 30, 2012 and the year ended March 31, 2012.
Note 10. Significant Risks
Geographic Concentration Risk
Because state-specific tax-exempt funds invest primarily in the municipal securities issued by the state and political sub-divisions of the state, the Fund will be particularly affected by political and economic conditions and developments in the state in which it invests. The Fund may, therefore, have a greater risk than that of a municipal bond fund which is more geographically diversified. The value of the municipal securities owned by the Fund also may be adversely affected by future changes in federal or state income tax laws.
Note 11. Subsequent Events
Management has evaluated the events and transactions that have occurred through the date the financial statements were issued and noted no items requiring adjustment of the financial statements or additional disclosure.
Note 12. Information Regarding Pending and Settled Legal Proceedings
In December 2005, without admitting or denying the allegations, American Express Financial Corporation (AEFC, which is now known as Ameriprise Financial, Inc. (Ameriprise Financial)) entered into settlement agreements with the Securities and Exchange Commission (SEC) and Minnesota Department of Commerce (MDOC) related to market timing activities. As a result, AEFC was censured and ordered to cease and desist from committing or causing any violations of certain provisions of the Investment Advisers Act of 1940, the Investment Company Act of 1940, and various Minnesota laws. AEFC agreed to pay disgorgement of $10 million and civil money penalties of $7 million. AEFC also agreed to retain an independent distribution consultant to assist in developing a plan for distribution of all disgorgement and civil penalties ordered by the SEC in accordance with various undertakings detailed at www.sec.gov/litigation/admin/ia-2451.pdf. Ameriprise Financial and its affiliates have cooperated with the SEC and the MDOC in these legal proceedings, and have made regular reports to the funds' Boards of Trustees.
Ameriprise Financial and certain of its affiliates have historically been involved in a number of legal, arbitration and regulatory proceedings, including routine litigation, class actions, and governmental actions, concerning matters arising in connection with the conduct of their business activities. Ameriprise Financial believes that the Funds are not currently the subject of, and that neither Ameriprise Financial nor any of its affiliates are the subject of, any pending legal, arbitration or regulatory proceedings that are likely to have a material adverse effect on the Funds or the ability of Ameriprise Financial or its affiliates to perform under their contracts with the Funds. Ameriprise Financial is required to make 10-Q, 10-K and, as necessary, 8-K filings with the Securities and Exchange Commission on legal and regulatory matters that relate to Ameriprise Financial and its affiliates. Copies of these filings may be obtained by accessing the SEC website at www.sec.gov.
There can be no assurance that these matters, or the adverse publicity associated with them, will not result in increased fund redemptions, reduced sale of fund shares or other adverse consequences to the Funds. Further, although we believe proceedings are not likely to have a material adverse effect on the Funds or the ability of Ameriprise Financial or its affiliates to perform under their contracts with the Funds, these proceedings are subject to uncertainties and, as such, we are unable to estimate the possible loss or range of loss that may result. An adverse outcome in one or more of these proceedings could result in adverse judgments, settlements, fines, penalties or other relief that could have a material adverse effect on the consolidated financial condition or results of operations of Ameriprise Financial.
30
Report of Independent Registered Public Accounting Firm
To the Trustees of Columbia Funds Series Trust and the Shareholders of Columbia California Intermediate Municipal Bond Fund
In our opinion, the accompanying statement of assets and liabilities, including the portfolio of investments, and the related statements of operations and of changes in net assets and the financial highlights present fairly, in all material respects, the financial position of Columbia California Intermediate Municipal Bond Fund (the "Fund") (a series of Columbia Funds Series Trust) at April 30, 2012 and at March 31, 2012, the results of its operations, the changes in its net assets and the financial highlights for each of the periods indicated, in conformity with accounting principles generally accepted in the United States of America. These financial statements and financial highlights (hereafter referred to as "financial statements") are the responsibility of the Fund's management. Our responsibility is to express an opinion on these financial statements based on our audits. We conducted our audits of these financial statements in accordance with the standards of the Public Company Accounting Oversight Board (United States). Those standards require that we plan and perform the audit to obtain reasonable assurance about whether the financial statements are free of material misstatement. An audit includes examining, on a test basis, evidence supporting the amounts and disclosures in the financial statements, assessing the accounting principles used and significant estimates made by management, and evaluating the overall financial statement presentation. We believe that our audits, which included confirmation of securities at April 30, 2012 and at March 31, 2012 by correspondence with the custodian, transfer agent and brokers, provide a reasonable basis for our opinion.
PricewaterhouseCoopers LLP
Minneapolis, Minnesota
June 8, 2012
31
Federal Income Tax Information (Unaudited) – Columbia California Intermediate Municipal Bond Fund
For the fiscal period ended April 30, 2012 and the fiscal year ended March 31, 2012, 99.80% and 99.87%, respectively, of the distributions from net investment income of the Fund qualify as exempt interest dividends for federal income tax purposes. A portion of the income may be subject to federal alternative minimum tax.
The Fund will notify shareholders in January 2013 of amounts for use in preparing 2012 income tax returns.
32
Fund Governance
Shareholders elect the Board that oversees the funds' operations. The Board appoints officers who are responsible for day-to-day business decisions based on policies set by the Board. The following table provides basic biographical information about the funds' Board members, including their principal occupations during the past five years, although specific titles for individuals may have varied over the period. Under current Board policy, members may serve until the next Board meeting after he or she reaches the mandatory retirement age established by the Board, or the fifteenth anniversary of the first Board meeting they attended as a member of the Board.
On September 29, 2009, Ameriprise Financial, the parent company of Columbia Management, entered into an agreement with Bank of America, N.A. ("Bank of America") to acquire a portion of the asset management business of Columbia Management Group, LLC and certain of its affiliated companies (the "Transaction"). Following the Transaction, which became effective on May 1, 2010, various alignment activities have occurred with respect to the Fund Family. In connection with the Transaction, Mr. Edward J. Boudreau, Jr., Mr. William P. Carmichael, Mr. William A. Hawkins, Mr. R. Glenn Hilliard, Mr. John J. Nagorniak, Ms. Minor M. Shaw and Dr. Anthony M. Santomero, who were members prior to the Transaction of the Legacy Columbia Nations funds' Board ("Nations Funds"), which includes Columbia Funds Series Trust, Columbia Funds Variable Insurance Trust I and Columbia Funds Master Investment Trust, LLC., began service on the Board for the Legacy RiverSource funds ("RiverSource Funds") effective June 1, 2011, which resulted in an overall increase from twelve Trustees to sixteen for all mutual funds overseen by the Board.
Independent Board Members
| Name, Address, Age | | Position Held
with Funds
and Length
of Service | | Principal Occupation During Past Five Years | | Number of
Funds in the
Fund Family
Overseen by
Board Member | | Other Present or
Past Directorships/
Trusteeships
(Within Past 5 Years) | |
| Kathleen Blatz | | | | | | | | | |
|
901 S. Marquette Ave.
Minneapolis, MN 55402
Age 57 | | Board member since 1/06 for RiverSource Funds and since 6/11 for Nations Funds | | Attorney; Chief Justice, Minnesota Supreme Court, 1998-2006 | | | 156 | | | None | |
|
| Edward J. Boudreau, Jr. | | | | | | | | | |
|
225 Franklin Street
Mail Drop
BX32 05228
Boston, MA 02110
Age 67 | | Board member since 6/11 for RiverSource Funds and since 1/05 for Nations Funds | | Managing Director, E.J. Boudreau & Associates (consulting) since 2000 | | | 149 | | | Former Trustee, BofA Funds Series Trust (11 funds) | |
|
| Pamela G. Carlton | | | | | | | | | |
|
901 S. Marquette Ave.
Minneapolis, MN 55402
Age 57 | | Board member since 7/07 for RiverSource Funds and since 6/11 for Nations Funds | | President, Springboard-Partners in Cross Cultural Leadership (consulting company) | | | 156 | | | None | |
|
33
Fund Governance (continued)
Independent Board Members (continued)
| Name, Address, Age | | Position Held
with Funds
and Length
of Service | | Principal Occupation During Past Five Years | | Number of
Funds in the
Fund Family
Overseen by
Board Member | | Other Present or
Past Directorships/
Trusteeships
(Within Past 5 Years) | |
| William P. Carmichael | | | | | | | | | |
|
225 Franklin Street
Mail Drop
BX32 05228
Boston, MA 02110
Age 68 | | Board member since 6/11 for RiverSource Funds and since 1999 for Nations Funds | | Retired | | | 149 | | | Director, Cobra Electronics Corporation (electronic equipment manufacturer); The Finish Line (athletic shoes and apparel); McMoRan Exploration Company (oil and gas exploration and development); former Trustee, BofA Funds Series Trust (11 funds); former Director, Spectrum Brands, Inc. (consumer products); former Director, Simmons Company (bedding) | |
|
| Patricia M. Flynn | | | | | | | | | |
|
901 S. Marquette Ave.
Minneapolis, MN 55402
Age 61 | | Board member since 11/04 for RiverSource Funds and since 6/11 for Nations Funds | | Trustee Professor of Economics and Management, Bentley University; former Dean, McCallum Graduate School of Business, Bentley University | | | 156 | | | None | |
|
| William A. Hawkins | | | | | | | | | |
|
225 Franklin Street
Mail Drop
BX32 05228
Boston, MA 02110
Age 69 | | Board member since 6/11 for RiverSource Funds and since 1/05 for Nations Funds | | Managing Director, Overton Partners (financial consulting), since August 2010; President and Chief Executive Officer, California General Bank, N.A., January 2008-August 2010 | | | 149 | | | Trustee, BofA Funds Series Trust (11 funds) | |
|
| R. Glenn Hilliard | | | | | | | | | |
|
225 Franklin Street
Mail Drop
BX32 05228
Boston, MA 02110
Age 69 | | Board member since 6/11 for RiverSource Funds and since 1/05 for Nations Funds | | Chairman and Chief Executive Officer, Hilliard Group LLC (investing and consulting), since April 2003; Non-Executive Director & Chairman, CNO Financial Group, Inc. (formerly Conseco, Inc.) (insurance), September 2003-May 2011 | | | 149 | | | Chairman, BofA Fund Series Trust (11 funds); former Director, CNO Financial Group, Inc. (insurance) | |
|
34
Fund Governance (continued)
Independent Board Members (continued)
| Name, Address, Age | | Position Held
with Funds
and Length
of Service | | Principal Occupation During Past Five Years | | Number of
Funds in the
Fund Family
Overseen by
Board Member | | Other Present or
Past Directorships/
Trusteeships
(Within Past 5 Years) | |
| Stephen R. Lewis, Jr. | | | | | | | | | |
|
901 S. Marquette Ave.
Minneapolis, MN 55402
Age 73 | | Chair of the Board for RiverSource Funds since 1/07, Board member for RiverSource Funds since 1/02 and since 6/11 for Nations Funds | | President Emeritus and Professor of Economics Emeritus, Carleton College | | | 156 | | | Director, Valmont Industries, Inc. (manufactures irrigation systems) | |
|
| John F. Maher | | | | | | | | | |
|
901 S. Marquette Ave.
Minneapolis, MN 55402
Age 69 | | Board member since 12/06 for Legacy Seligman funds, since 12/08 for RiverSource Funds and since 6/11 for Nations Funds | | Retired President and Chief Executive Officer and former Director, Great Western Financial Corporation (financial services), 1986-1997 | | | 156 | | | None | |
|
| John J. Nagorniak | | | | | | | | | |
|
225 Franklin Street
Mail Drop
BX32 05228
Boston, MA 02110
Age 67 | | Board member since 6/11 for RiverSource Funds and since 1/08 for Nations Funds | | Retired; President and Director, Foxstone Financial, Inc. (consulting), 2000-2007; Director, Mellon Financial Corporation affiliates (investing), 2000-2007; Chairman, Franklin Portfolio Associates (investing—Mellon affiliate), 1982-2007 | | | 149 | | | Trustee, Research Foundation of CFA Institute; Director, MIT Investment Company; Trustee, MIT 401k Plan; former Trustee, BofA Funds Series Trust (11 funds) | |
|
| Catherine James Paglia | | | | | | | | | |
|
901 S. Marquette Ave.
Minneapolis, MN 55402
Age 59 | | Board member since 11/04 for RiverSource Funds and since 6/11 for Nations Funds | | Director, Enterprise Asset Management, Inc. (private real estate and asset management company) | | | 156 | | | None | |
|
35
Fund Governance (continued)
Independent Board Members (continued)
| Name, Address, Age | | Position Held
with Funds
and Length
of Service | | Principal Occupation During Past Five Years | | Number of
Funds in the
Fund Family
Overseen by
Board Member | | Other Present or
Past Directorships/
Trusteeships
(Within Past 5 Years) | |
| Leroy C. Richie | | | | | | | | | |
|
901 S. Marquette Ave.
Minneapolis, MN 55402
Age 70 | | Board member since 2000 for Legacy Seligman funds, since 11/08 for RiverSource Funds and since 6/11 for Nations Funds | | Counsel, Lewis & Munday, P.C. since 2004; former Vice President and General Counsel, Automotive Legal Affairs, Chrysler Corporation | | | 156 | | | Director, Digital Ally, Inc. (digital imaging); Director, Infinity, Inc. (oil and gas exploration and production); Director, OGE Energy Corp. (energy and energy services) | |
|
| Minor M. Shaw | | | | | | | | | |
|
225 Franklin Street
Mail Drop
BX32 05228
Boston, MA 02110
Age 64 | | Board member since 6/11 for RiverSource Funds and since 2003 for Nations Funds | | President—Micco LLC (private investments) | | | 149 | | | Former Trustee, BofA Funds Series Trust (11 funds); Board Member, Piedmont Natural Gas; Director, Blue Cross Blue Shield of South Carolina | |
|
| Alison Taunton-Rigby | | | | | | | | | |
|
901 S. Marquette Ave.
Minneapolis, MN 55402
Age 68 | | Board member since 11/02 for RiverSource Funds and since 6/11 for Nations Funds | | Chief Executive Officer and Director, RiboNovix, Inc. 2003-2010 (biotechnology); former President, Aquila Biopharmaceuticals | | | 156 | | | Director, Healthways, Inc. (health management programs); Director, ICI Mutual Insurance Company, RRG; Director, Abt Associates (government contractor) | |
|
36
Fund Governance (continued)
Interested Board Member Not Affiliated with Investment Manager*
| Name, Address, Age | | Position Held
with Funds
and Length
of Service | | Principal Occupation During Past Five Years | | Number of
Funds in the
Fund Family
Overseen by
Board Member | | Other Present or
Past Directorships/
Trusteeships
(Within Past 5 Years) | |
| Anthony M. Santomero* | | | | | | | | | |
|
225 Franklin Street
Mail Drop
BX32 05228
Boston, MA 02110
Age 65 | | Board member since 6/11 for RiverSource Funds and since 1/08 for Nations Funds | | Richard K. Mellon Professor Emeritus of Finance, The Wharton School, University of Pennsylvania, since 2002; Senior Advisor, McKinsey & Company (consulting), 2006-2008; President and Chief Executive Officer, Federal Reserve Bank of Philadelphia, 2000-2006 | | | 149 | | | Director, Renaissance Reinsurance Ltd.; Trustee, Penn Mutual Life Insurance Company; Director, Citigroup; Director, Citibank, N.A.; former Trustee, BofA Funds Series Trust (11 funds) | |
|
* Dr. Santomero is not an affiliated person of the Investment Manager or Ameriprise Financial. However, he is currently deemed by the funds to be an "interested person" (as defined in the 1940 Act) of the Funds because he serves as a Director of Citigroup, Inc. and Citibank N.A., companies that may directly or through subsidiaries and affiliates engage from time-to-time in brokerage execution, principal transactions and lending relationships with the funds or accounts advised/managed by the Investment Manager.
Interested Board Member Affiliated with Investment Manager*
| William F. Truscott | | | | | | | | | |
|
53600 Ameriprise Financial Center
Minneapolis, MN 55474
Age 51 | | Board member since 11/01 for RiverSource Funds and since 6/11 for Nations Funds; Senior Vice President since 2002 for RiverSource Funds and 5/10 for Nations Funds | | Chairman of the Board and President, Columbia Management Investment Advisers, LLC since May 2010 and February 2012, respectively (previously President, Chairman of the Board and Chief Investment Officer, 2001-April 2010); Chief Executive Officer, U.S. Asset Management & President, Annuities, Ameriprise Financial, Inc. since May 2010 (previously President—U.S. Asset Management and Chief Investment Officer, 2005-April 2010); Director, President and Chief Executive Officer, Ameriprise Certificate Company since 2006; Director and Chief Executive Officer, Columbia Management Investment Distributors, Inc. since May 2010 and February 2012, respectively (previously Chairman of the Board and Chief Executive Officer, 2006-April 2010); Chairman of the Board and Chief Executive Officer, RiverSource Distributors, Inc. since 2006. | | | 156 | | | Trustee, Columbia Funds Series Trust I and Columbia Funds Variable Insurance Trust | |
|
* Interested person (as defined under the 1940 Act) by reason of being an officer, director, security holder and/or employee of the Investment Manager or Ameriprise Financial.
The SAI has additional information about the Fund's Board members and is available, without charge, upon request by calling 800.345.6611; contacting your financial intermediary; or visiting columbiamanagement.com.
37
Fund Governance (continued)
Officers
| Name, Year of Birth and Address | | Principal Occupation(s) During the Past Five Years | |
| J. Kevin Connaughton (Born 1964) | |
|
225 Franklin Street
Boston, MA 02110
President (since 2009) | | Senior Vice President and General Manager—Mutual Fund Products, Columbia Management Investment Advisers, LLC since May 2010; President, Columbia Funds, since 2009, and RiverSource Funds, since May 2010 (previously Senior Vice President and Chief Financial Officer, Columbia Funds, from June 2008 to January 2009, Treasurer, Columbia Funds, from October 2003 to May 2008, and senior officer of various other affiliated funds since 2000); Managing Director, Columbia Management Advisors, LLC from December 2004 to April 2010. | |
|
| Michael G. Clarke (Born 1969) | |
|
225 Franklin Street
Boston, MA 02110
Treasurer (since 2011) and Chief Financial Officer (since 2009) | | Vice President, Columbia Management Investment Advisers, LLC since May 2010; Managing Director of Fund Administration, Columbia Management Advisors, LLC, from September 2004 to April 2010; senior officer of Columbia Funds and affiliated funds since 2002. | |
|
| Scott R. Plummer (Born 1959) | |
|
5228 Ameriprise Financial Center
Minneapolis, MN 55474
Senior Vice President and Chief Legal Officer (since 2010) | | Chief Legal Officer and Assistant Secretary, Columbia Management Investment Advisers, LLC since June 2005; Vice President and Lead Chief Counsel—Asset Management, Ameriprise Financial, Inc. since May 2010 (previously Vice President and Chief Counsel—Asset Management, from 2005 to April 2010, Vice President, Chief Counsel and Assistant Secretary, Columbia Management Investment Distributors, Inc. since 2008; Vice President, General Counsel and Secretary, Ameriprise Certificate Company since 2005; Chief Counsel, RiverSource Distributors, Inc. since 2006; Senior officer of Columbia Funds and affiliated funds, since 2006. | |
|
| Thomas P. McGuire (Born 1972) | |
|
225 Franklin Street
Boston, MA 02110
Chief Compliance Officer (since 2012) | | Vice President—Asset Management Compliance, Columbia Management Investment Advisers, LLC since March 2010; Chief Compliance Officer, Ameriprise Certificate Company, since September 2010; Compliance Executive, Bank of America, from June 2005 to April 2010. | |
|
| William F. Truscott (Born 1960) | |
|
53600 Ameriprise Financial Center
Minneapolis, MN 55474
Senior Vice President (since 2010) | | Chairman of the Board and President, Columbia Management Investment Advisers, LLC since May 2010 and February 2012, respectively (previously President, Chairman of the Board and Chief Investment Officer, from 2001 to April 2010); Chief Executive Officer, U.S. Asset Management & President, Annuities, Ameriprise Financial, Inc. since May 2010 (previously President—U.S. Asset Management and Chief Investment Officer from 2005 to April 2010; Director, President and Chief Executive Officer, Ameriprise Certificate Company since 2006; Director and Chief Executive Officer, Columbia Management Investment Distributors, Inc. since May 2010 and February 2012, respectively (previously Chairman of the Board and Chief Executive Officer from 2008 to April 2010); Chairman of the Board and Chief Executive Officer, RiverSource Distributors, Inc. since 2006. | |
|
| Paul D. Pearson (Born 1956) | |
|
10468 Ameriprise Financial Center
Minneapolis, MN 55474
Vice President and Assistant Treasurer
(since 2011) | | Vice President—Investment Accounting, Columbia Management Investment Advisers, LLC, since May 2010; Vice President—Managed Assets, Investment Accounting, Ameriprise Financial Corporation, 1998-2010 | |
|
38
Fund Governance (continued)
Officers (continued)
| Name, Year of Birth and Address | | Principal Occupation(s) During the Past Five Years | |
| Colin Moore (Born 1958) | |
|
225 Franklin Street
Boston, MA 02110
Senior Vice President (since 2010) | | Director and Chief Investment Officer, Columbia Management Investment Advisers, LLC since May 2010; Manager, Managing Director and Chief Investment Officer of Columbia Management Advisors, LLC from 2007 to April 2010; Head of Equities, Columbia Management Advisors, LLC from 2002 to 2007. | |
|
| Christopher O. Petersen (Born 1970) | |
|
5228 Ameriprise Financial Center
Minneapolis, MN 55474
Vice President and Secretary (since 2011) | | Vice President and Chief Counsel, Ameriprise Financial since January 2010 (formerly Vice President and Group Counsel or Counsel from April 2004 to January 2010); Senior officer of Columbia Funds and affiliated funds, since 2007. | |
|
| Amy K. Johnson (Born 1965) | |
|
5228 Ameriprise Financial Center
Minneapolis, MN 55474
Vice President (since 2010) | | Senior Vice President and Chief Operating Officer, Columbia Management Investment Advisers, LLC since May 2010 (previously Chief Administrative Officer, from 2009 until April 2010, Vice President—Asset Management and Trust Company Services, from 2006 to 2009, and Vice President—Operations and Compliance from 2004 to 2006). | |
|
| Joseph F. DiMaria (Born 1968) | |
|
225 Franklin Street
Boston, MA 02110
Vice President (since 2011) and Chief Accounting Officer (since 2008) | | Vice President, Mutual Fund Administration, Columbia Management Investment Advisers, LLC, since May 2010; Director of Fund Administration, Columbia Management Advisors, LLC from January 2006 to April 2010. | |
|
| Paul B. Goucher (Born 1968) | |
|
100 Park Avenue
New York, NY 10017
Vice President and Assistant Secretary (since 2010) | | Vice President and Chief Counsel of Ameriprise Financial since January 2010 (formerly Vice President and Group Counsel from November 2008 to January 2010); Director, Managing Director and General Counsel of J. & W. Seligman & Co. Incorporated (Seligman) from July 2008 to November 2008 and Managing Director and Associate General Counsel of Seligman from January 2005 to July 2008. | |
|
| Michael E. DeFao (Born 1968) | |
|
225 Franklin Street
Boston, MA 02110
Vice President and Assistant Treasurer (since 2011) | | Vice President and Chief Counsel, Ameriprise Financial since May 2010; Associate General Counsel, Bank of America from June 2005 to April 2010. | |
|
| Stephen T. Welsh (Born 1957) | |
|
225 Franklin Street
Boston, MA 02110
Vice President (since 2006) | | President and Director, Columbia Management Investment Services Corp. since May 2010; President and Director, Columbia Management Services, Inc. from July 2004 to April 2010; Managing Director, Columbia Management Distributors, Inc. from August 2007 to April 2010. | |
|
39
Approval of Investment Management Services Agreement
Columbia Management Investment Advisers, LLC ("Columbia Management" or the "investment manager"), a wholly-owned subsidiary of Ameriprise Financial, Inc. ("Ameriprise Financial"), serves as the investment manager to Columbia California Intermediate Municipal Bond Fund (the "Fund"). Under an investment management services agreement (the "IMS Agreement"), Columbia Management provides investment advice and other services to the Fund and all funds distributed by Columbia Management Investment Distributors, Inc. (collectively, the "Funds").
On an annual basis, the Fund's Board of Trustees (the "Board"), including the independent Board members (the "Independent Directors"), considers renewal of the IMS Agreement. Columbia Management prepared detailed reports for the Board and its Contracts Committee in March and April 2012, including reports based on analyses of data provided by an independent organization and a comprehensive response to each item of information requested by independent legal counsel to the Independent Directors ("Independent Legal Counsel") in a letter to the investment manager, to assist the Board in making this determination. All of the materials presented in March and April were first supplied in draft form to designated representatives of the Independent Directors, i.e., Independent Legal Counsel, the Chair and the Chair of the Contracts Committee (including materials relating to the Fund's expense cap), and the final materials were revised to reflect comments provided by these Board representatives. In addition, throughout the year, the Board (or its committees) regularly meets with portfolio management teams and senior management personnel, and reviews information prepared by Columbia Management addressing the services Columbia Management provides and Fund performance. The Board accords particular weight to the work, deliberations and conclusions of the Contracts Committee, the Investment Review Committee and the Compliance Committee in determining whether to continue the IMS Agreement.
The Board, at its April 10-12, 2012 in-person Board meeting (the "April Meeting"), considered the renewal of the IMS Agreement for an additional one-year term. At the April Meeting, Independent Legal Counsel reviewed with the Independent Directors various factors relevant to the Board's consideration of advisory agreements and the Board's legal responsibilities related to such consideration. Following an analysis and discussion of the factors identified below, the Board, including all of the Independent Directors, approved the renewal of the IMS Agreement.
Nature, Extent and Quality of Services Provided by Columbia Management: The Independent Directors analyzed various reports and presentations they had received detailing the services performed by Columbia Management, as well as its expertise, resources and capabilities. The Independent Directors specifically considered many developments during the past year concerning the services provided by Columbia Management, including, in particular, the continued investment in, and resources dedicated to, the Funds' operations and the successful completion of various integration initiatives and the consolidation of dozens of Funds. The Independent Directors noted the information they received concerning Columbia Management's ability to retain key portfolio management personnel. In that connection, the Independent Directors took into account their meetings with Columbia Management's Chief Investment Officer (the "CIO") and considered the CIO's successful execution of additional risk and portfolio management oversight applied to the Funds. The Independent Directors also assessed Columbia Management's significant investment in upgrading technology (such as an equity trading system) and considered management's commitments to enhance existing resources in this area.
In connection with the Board's evaluation of the overall package of services provided by Columbia Management, the Board also considered the quality of administrative services provided to the Fund by Columbia Management. In addition, the Board also reviewed the financial condition of Columbia Management (and its affiliates) and each entity's ability to carry out its responsibilities under the IMS Agreement and the Fund's other services agreements with Ameriprise affiliates. The Board also discussed the acceptability of the terms of the IMS Agreement (including the relatively broad scope of services required to be performed by Columbia Management). The Board concluded that the services being performed under the IMS Agreement were of a reasonably high quality.
Based on the foregoing, and based on other information received (both oral and written, including the information on investment performance referenced below) and other considerations, the Board concluded that Columbia
40
Approval of Investment Management Services Agreement (continued)
Management and its affiliates were in a position to continue to provide a high quality and level of services to the Fund.
Investment Performance: For purposes of evaluating the nature, extent and quality of services provided under the IMS Agreement, the Board carefully reviewed the investment performance of the Fund. In this regard, the Board considered detailed reports providing the results of analyses performed by an independent organization showing, for various periods, the performance of the Fund, the performance of a benchmark index, the percentage ranking of the Fund among its comparison group and the net assets of the Fund. The Board observed that the Fund's investment performance met expectations.
Comparative Fees, Costs of Services Provided and the Profits Realized By Columbia Management and its Affiliates from their Relationships with the Fund: The Board reviewed comparative fees and the costs of services to be provided under the IMS Agreement. The Board members considered detailed comparative information set forth in an annual report on fees and expenses, including, among other things, data (based on analyses conducted by an independent organization) showing a comparison of the Fund's expenses with median expenses paid by funds in its comparative peer universe, as well as data showing the Fund's contribution to Columbia Management's profitability. The Board reviewed the fees charged to comparable institutional or other accounts/vehicles managed by Columbia Management and discussed differences in how the products are managed and operated, noting no unreasonable differences in the levels of contractual fees.
The Board accorded particular weight to the notion that the level of fees should reflect a rational pricing model applied consistently across the various product lines in the Fund family, while assuring that the overall fees for each Fund (with few defined exceptions) are generally in line with the "pricing philosophy" (i.e., that the total expense ratio of the Fund is at, or below, the median expense ratio of funds in the same comparison universe of the Fund). The Board took into account that the Fund's total expense ratio (after considering proposed expense caps/waivers) approximated the peer universe's median expense ratio. Based on its review, the Board concluded that the Fund's management fee was fair and reasonable in light of the extent and quality of services that the Fund receives.
The Board also considered the expected profitability of Columbia Management and its affiliates in connection with Columbia Management providing investment management services to the Fund. In this regard, the Board referred to a detailed profitability report, discussing the profitability to Columbia Management and Ameriprise Financial from managing, operating and distributing the Funds. In this regard, the Board observed that 2011 profitability, while slightly lower than 2010, was generally in line with the reported profitability of other asset management firms. The Board also considered the indirect economic benefits flowing to Columbia Management or its affiliates in connection with managing or distributing the Funds, such as the enhanced ability to offer various other financial products to Ameriprise Financial customers, soft dollar benefits and overall reputational advantages. The Board noted that the fees paid by the Fund should permit the investment manager to offer competitive compensation to its personnel, make necessary investments in its business and earn an appropriate profit. The Board concluded that profitability levels were reasonable.
Economies of Scale to be Realized: The Board also considered the economies of scale that might be realized by Columbia Management as the Fund grows and took note of the extent to which Fund shareholders might also benefit from such growth.
Based on the foregoing, the Board, including all of the Independent Directors, concluded that the investment management service fees were fair and reasonable in light of the extent and quality of services provided. In reaching this conclusion, no single factor was determinative. On April 12, 2012, the Board, including all of the Independent Directors, approved the renewal of the IMS Agreement.
41
This page intentionally left blank.
42
This page intentionally left blank.
43
This page intentionally left blank.
44
Important Information About This Report
The fund mails one shareholder report to each shareholder address. If you would like more than one report, please call shareholder services at 1-800-345-6611 and additional reports will be sent to you. This report has been prepared for shareholders of Columbia California Intermediate Municipal Bond Fund.
A description of the policies and procedures that the fund uses to determine how to vote proxies and a copy of the fund's voting records are available (i) at www.columbiamanagement.com, (ii) on the Securities and Exchange Commission's website at www.sec.gov, and (iii) without charge, upon request, by calling 1-800-368-0346. Information regarding how the fund voted proxies relating to portfolio securities during the 12-month period ended June 30 is available from the SEC's website. Information regarding how the fund voted proxies relating to portfolio securities is also available from the fund's website, www.columbiamanagement.com.
The fund files a complete schedule of portfolio holdings with the SEC for the first and third quarters of each fiscal year on Form N-Q. The fund's Form N-Q is available on the SEC's website at www.sec.gov and may be reviewed and copied at the SEC's Public Reference Room in Washington, D.C. Information on the operation of the Public Reference Room may be obtained by calling 1-800-SEC-0330.
Transfer Agent
Columbia Management Investment
Services Corp.
P.O. Box 8081
Boston, MA 02266-8081
1-800-345-6611
Distributor
Columbia Management Investment
Distributors, Inc.
225 Franklin Street
Boston, MA 02110
Investment Manager
Columbia Management Investment Advisers, LLC
225 Franklin Street
Boston, MA 02110
45

Columbia California Intermediate Municipal Bond Fund
P. O. Box 8081
Boston, MA 02266-8081
columbiamanagement.com
This information is for use with concurrent or prior delivery of a fund prospectus. Investors should consider the investment objectives, risks, charges and expenses of a mutual fund carefully before investing. For a free prospectus, which contains this and other important information about the funds, visit columbiamanagement.com. Read the prospectus carefully before investing. The Fund is distributed by Columbia Management Investment Distributors, Inc., member FINRA, and managed by Columbia Management Investment Advisers, LLC.
© 2012 Columbia Management Investment Advisers, LLC. All rights reserved.
C-1081 C (5/12)

Columbia Georgia Intermediate Municipal Bond Fund
Annual Report for the Period Ended April 30, 2012
Not FDIC insured • No bank guarantee • May lose value
Table of Contents
| Fund Profile | | | 1 | | |
|
| Performance Information | | | 2 | | |
|
| Understanding Your Expenses | | | 3 | | |
|
| Portfolio Managers' Report | | | 4 | | |
|
| Portfolio of Investments | | | 6 | | |
|
Statement of Assets and
Liabilities | | | 11 | | |
|
| Statement of Operations | | | 13 | | |
|
Statement of Changes in
Net Assets | | | 14 | | |
|
| Financial Highlights | | | 16 | | |
|
| Notes to Financial Statements | | | 20 | | |
|
Report of Independent Registered
Public Accounting Firm | | | 28 | | |
|
| Federal Income Tax Information | | | 29 | | |
|
| Fund Governance | | | 30 | | |
|
| Approval of Investment Management Services Agreement | | | 37 | | |
|
Important Information About
This Report | | | 41 | | |
|
The views expressed in this report reflect the current views of the respective parties. These views are not guarantees of future performance and involve certain risks, uncertainties and assumptions that are difficult to predict, so actual outcomes and results may differ significantly from the views expressed. These views are subject to change at any time based upon economic, market or other conditions and the respective parties disclaim any responsibility to update such views. These views may not be relied on as investment advice and, because investment decisions for a Columbia Fund are based on numerous factors, may not be relied on as an indication of trading intent on behalf of any particular Columbia Fund. References to specific securities should not be construed as a recommendation or investment advice.
President's Message

Dear Shareholders,
A stock market rally that commenced in the fourth quarter of 2011 continued into 2012 in the United States and around the world, as all major market regions generated double-digit returns for the three-month period ended March 31, 2012. Volatility declined sharply as European debt fears quieted somewhat and sentiment improved. Returns in developed countries were buoyed by strong results in Germany, Belgium, Austria and the Nordic markets of Denmark, Finland, Norway and Sweden. Under the cloud of its own mounting debt problem, Spain was the only eurozone country to deliver a negative return during the three-month period. Solid economic growth and accommodative monetary policy helped boost gains in emerging markets. The rally in U.S. equities was largely driven by an expansion in "multiples"—an increase in stock prices relative to their earnings. By the end of the first quarter of 2012, stocks no longer appeared as cheap as they were late in 2011. Bonds lagged stocks during the first quarter as investors responded to signs of an improved environment with a greater appetite for risk.
Concerns around the health of the global economy were centered in news headlines focusing on Washington D.C., Europe, China and the Middle East. In the United States, economic indicators remained mixed but generally indicated support for slow, sustainable economic growth. European policymakers have made progress in containing the eurozone debt crisis, though they still have not solved the issue of long-term solvency. The European Central Bank has lowered interest rates and flooded the financial system with liquidity that may provide breathing space for companies to restructure their balance sheets. These massive infusions of liquidity may whet the appetite for risk from investors around the world. However, it has delayed a true reckoning with the European financial situation, as concerns about Spain and Portugal continue to cloud the outlook. These structural challenges that persist in the developed world, and slowing growth in emerging market economies, leave the global economy in a fragile state. Domestic demand, combined with slowing inflationary trends, has also helped to shore up emerging market economies. Joblessness remains low and monetary conditions remain easy.
Despite the challenges and surprises of 2011, we see pockets of strength—and as a result, attractive opportunities—both here and abroad for 2012. We hope to help you capitalize on these opportunities with various articles in our 2012 Perspectives, which is available via the Market Insights tab at columbiamanagement.com. This publication showcases the strong research capabilities and experienced investment teams of Columbia Management and offers a diverse array of investment ideas based on our five key themes for 2012.
Other information and resources available at columbiamanagement.com include:
g detailed up-to-date fund performance and portfolio information
g economic analysis and market commentary
g quarterly fund commentaries
g Columbia Management Investor, our award-winning quarterly newsletter for shareholders
Thank you for your continued support of the Columbia Funds. We look forward to serving your investment needs for many years to come.
Best Regards,

J. Kevin Connaughton
President, Columbia Funds
Investors should consider the investment objectives, risks, charges and expenses of a mutual fund carefully before investing. For a free prospectus, which contains this and other important information about the funds, visit columbiamanagement.com. The prospectus should be read carefully before investing.
Columbia Funds are distributed by Columbia Management Investment Distributors, Inc., member FINRA, and managed by Columbia Management Investment Advisers, LLC.
© 2012 Columbia Management Investment Advisers, LLC. All rights reserved.
Fund Profile – Columbia Georgia Intermediate Municipal Bond Fund
Summary
g For the 13-month period that ended April 30, 2012, the fund's Class A shares returned 9.99% without sales charge.
g The fund's benchmark, the Barclays 3-15 Year Blend Municipal Bond Index, returned 11.05%.1
g The fund's maturity positioning accounted for its modest shortfall relative to the index. It had slightly more exposure to bonds in the seven- to nine-year range and slightly less in the 15- to 17-year range, the latter of which had the best returns.
Portfolio Management
Brian M. McGreevy has managed the fund since June 2011. From 1994 until joining Columbia Management Investment Advisers, LLC (the Investment Manager) in May 2010, Mr. McGreevy was associated with the fund's previous investment adviser as an investment professional.
1The Barclays 3-15 Year Blend Municipal Bond Index tracks the performance of municipal bonds issued after December 31, 1990 with remaining maturities between 2 and 17 years and at least $7 million in principal amount outstanding.
Indices are not available for investment, are not professionally managed and do not reflect sales charges, fees, brokerage commissions, taxes or other expenses of investing. Securities in the fund may not match those in an index.
Performance data quoted represents past performance and current performance may be lower or higher. Past performance is no guarantee of future results. The investment return and principal value will fluctuate so that shares, when redeemed, may be worth more or less than the original cost. Please visit www.columbiamanagement.com for daily and most recent month-end performance updates.
Summary
13-month (cumulative) return as of 04/30/12
| | +9.99% | |
|
|  | | | Class A shares
(without sales charge) | |
|
| | +11.05% | |
|
|  | | | Barclays 3-15 Year Blend
Municipal Bond Index | |
|
1
Performance Information – Columbia Georgia Intermediate Municipal Bond Fund
Performance data quoted represents past performance and current performance may be lower or higher. Past performance is no guarantee of future results. The investment return and principal value will fluctuate so that shares, when redeemed, may be worth more or less than the original cost. Please visit www.columbiamanagement.com for daily and most recent month-end performance updates.
Performance of a $10,000 investment 05/01/02 – 04/30/12
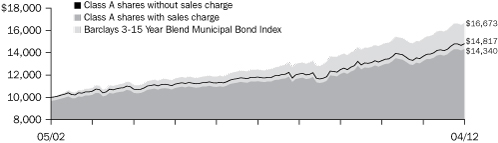
The chart above shows the change in value of a hypothetical $10,000 investment in Class A shares of Columbia Georgia Intermediate Municipal Bond Fund during the stated time period, and does not reflect the deduction of taxes that a shareholder may pay on fund distributions or on the redemption of fund shares.
Performance of a $10,000 investment 05/01/02 – 04/30/12 ($)
| Sales charge | | without | | with | |
| Class A | | | 14,817 | | | | 14,340 | | |
| Class B | | | 13,760 | | | | 13,760 | | |
| Class C | | | 13,743 | | | | 13,743 | | |
| Class Z | | | 15,200 | | | | n/a | | |
Average annual total return as of 04/30/12 (%)
| Share class | | A | | B | | C | | Z | |
| Inception | | 05/04/92 | | 06/07/93 | | 06/17/92 | | 03/01/92 | |
| Sales charge | | without | | with | | without | | with | | without | | with | | without | |
1-month
(cumulative) | | | 1.05 | | | | -2.21 | | | | 0.90 | | | | -2.10 | | | | 0.99 | | | | -0.01 | | | | 1.07 | | |
| 1-year | | | 8.26 | | | | 4.72 | | | | 7.43 | | | | 4.43 | | | | 7.43 | | | | 6.43 | | | | 8.50 | | |
| 5-year | | | 4.62 | | | | 3.94 | | | | 3.84 | | | | 3.84 | | | | 3.83 | | | | 3.83 | | | | 4.88 | | |
| 10-year | | | 4.01 | | | | 3.67 | | | | 3.24 | | | | 3.24 | | | | 3.23 | | | | 3.23 | | | | 4.28 | | |
The "with sales charge" returns include the maximum initial sales charge of 3.25% for Class A shares, the applicable contingent deferred sales charge of 3.00% in the first year, declining to 1.00% in the fourth year and eliminated thereafter for Class B shares and 1.00% for Class C shares for the first year only. The "without sales charge" returns do not include the effect of sales charges. If they had, returns would be lower.
Performance results reflect any fee waivers or reimbursements of fund expenses by Columbia Management Investment Advisers, LLC and/or any of its affiliates. Absent these fee waivers or expense reimbursement arrangements, performance results would have been lower.
All results shown assume reinvestment of distributions. Class Z shares are sold at net asset value with no distribution and service (Rule 12b-1) fees. Class Z shares have limited eligibility and the investment minimum requirements may vary. Please see the fund's prospectuses for details. Performance for different share classes will vary based on differences in sales charges and fees associated with each class.
The tables do not reflect the deduction of taxes that a shareholder may pay on fund distributions or on the redemption of fund shares.
2
Understanding Your Expenses – Columbia Georgia Intermediate Municipal Bond Fund
As an investor, you incur two types of costs. There are transaction costs, which generally include sales charges on purchases and may include redemption fees. There are also ongoing costs, which generally include management fees, distribution and service (Rule 12b-1) fees, and other fund expenses. The following information is intended to help you understand your ongoing costs (in dollars) of investing in the Fund and to help you compare these costs with the ongoing costs of investing in other mutual funds.
Analyzing your fund's expenses
To illustrate these ongoing costs, we have provided examples and calculated the expenses paid by investors in each share class of the Fund during the period. The actual and hypothetical information in the table is based on an initial investment of $1,000 at the beginning of the period indicated and held for the entire period. Expense information is calculated two ways and each method provides you with different information. The amount listed in the "Actual" column is calculated using the Fund's actual operating expenses and total return for the period. You may use the Actual information, together with the amount invested, to estimate the expenses that you paid over the period. Simply divide your account value by $1,000 (for example, an $8,600 account value divided by $1,000 = 8.6), then multiply the results by the expenses paid during the period under the Actual column. The amount listed in the "Hypothetical" column assumes a 5% annual rate of return before expenses (which is not the Fund's actual return) and then applies the Fund's actual expense ratio for the period to the hypothetical return. You should not use the hypothetical account values and expenses to estimate either your actual account balance at the end of the period or the expenses you paid during the period. See "Compare with other funds" below for details on how to use the hypothetical data.
Compare with other funds
Since all mutual funds are required to include the same hypothetical calculations about expenses in shareholder reports, you can use this information to compare the ongoing cost of investing in the Fund with other funds. To do so, compare the hypothetical example with the 5% hypothetical examples that appear in the shareholder reports of other funds. As you compare hypothetical examples of other funds, it is important to note that hypothetical examples are meant to highlight the ongoing costs of investing in a fund only and do not reflect any transaction costs, such as sales charges, or redemption or exchange fees. Therefore, the hypothetical calculations are useful in comparing ongoing costs only, and will not help you determine the relative total costs of owning different funds. If transaction costs were included in these calculations, your costs would be higher.
November 1, 2011 – April 30, 2012
| | | Account value at the
beginning of the period ($) | | Account value at the
end of the period ($) | | Expenses paid
during the period ($) | | Fund's annualized
expense ratio (%) | |
| | | Actual | | Hypothetical | | Actual | | Hypothetical | | Actual | | Hypothetical | | Actual | |
| Class A | | | 1,000.00 | | | | 1,000.00 | | | | 1,044.40 | | | | 1,020.89 | | | | 4.07 | | | | 4.02 | | | | 0.80 | | |
| Class B | | | 1,000.00 | | | | 1,000.00 | | | | 1,040.60 | | | | 1,017.16 | | | | 7.86 | | | | 7.77 | | | | 1.55 | | |
| Class C | | | 1,000.00 | | | | 1,000.00 | | | | 1,040.50 | | | | 1,017.16 | | | | 7.86 | | | | 7.77 | | | | 1.55 | | |
| Class Z | | | 1,000.00 | | | | 1,000.00 | | | | 1,045.70 | | | | 1,022.13 | | | | 2.80 | | | | 2.77 | | | | 0.55 | | |
Expenses paid during the period are equal to the annualized expense ratio for each class as indicated above, multiplied by the average account value over the period and then multiplied by the number of days in the Fund's most recent six months and divided by 366.
Expenses do not include fees and expenses incurred indirectly by the Fund from the underlying funds in which the Fund may invest (also referred to as "acquired funds"), including affiliated and non-affiliated pooled investments vehicles (including mutual funds and exchange traded funds).
Had Columbia Management Investment Advisers, LLC and/or certain of its affiliates not waived/reimbursed certain fees and expenses, account value at the end of the period would have been reduced.
3
Portfolio Manager's Report – Columbia Georgia Intermediate Municipal Bond Fund
Performance data quoted represents past performance and current performance may be lower or higher. Past performance is no guarantee of future results. The investment return and principal value will fluctuate so that shares, when redeemed, may be worth more or less than the original cost. Please visit www.columbiamanagement.com for daily and most recent month-end performance updates.
30-day SEC yields
as of 4/30/12 (%)
| Class A | | | 1.40 | | |
| Class B | | | 0.71 | | |
| Class C | | | 0.71 | | |
| Class Z | | | 1.70 | | |
The 30-day SEC yields reflect the fund's earning power, net of expenses, expressed as an annualized percentage of the public offering price per share at the end of the period. Had the Investment Manager and/or any of its affiliates not waived fees or reimbursed a portion of expenses, the 30-day SEC yields would have been lower.
Taxable Equivalent SEC yields
as of 4/30/12 (%)
| Class A | | | 2.15 | | |
| Class B | | | 1.09 | | |
| Class C | | | 1.09 | | |
| Class Z | | | 2.62 | | |
Taxable-equivalent SEC yields are calculated assuming a federal tax rate of 35.0%. This tax rate does not reflect the phase out of exemptions or the reduction of the otherwise allowable deductions that occur when adjusted gross income exceeds certain levels. Your taxable-equivalent yield may be different depending on your tax bracket.
The Board of Trustees for Columbia Georgia Intermediate Municipal Bond Fund has approved the change of the fund's fiscal year end from March 31 to April 30. As a result, this report covers the 13-month period since the last annual report. The next report you receive will be for the six-month period from May 1, 2012 through October 31, 2012. In June 2011, Brian McGreevy became portfolio manager of the fund.
For the 13-month period that ended April 30, 2012, the fund's Class A shares returned 9.99% without sales charge. The fund's benchmark, the Barclays 3-15 Year Blend Municipal Bond Index, returned 11.05% for the period.
An improving economic environment
Early in the 13-month period, Europe's debt problems and wrangling in Washington over the federal budget and the national debt dominated world headlines. U.S. economic news was lackluster, housing continued to be a nagging weak spot and job growth was disappointing. However, the pace of both economic and job growth picked up as the period wore on. Consumer confidence improved as the labor market added approximately 1.2 million new jobs between November 2011 and April 2012, while the jobless rate fell to 8.1%. Household net worth also picked up as the equity markets rebounded. Headline inflation rose 2.7%, driven primarily by rising food and energy prices. Despite a modest slowdown late in the summer of 2011, manufacturing activity continued to expand throughout the period.
Municipal market generates strong returns
Against this backdrop, the U.S. municipal bond market generated strong returns, despite a host of investor concerns at the outset of the period: 1) Net outflows from municipal mutual funds. 2) The expectation that heavy new issue volume would weigh on the market, which turned out to be unfounded. Issuance dropped off almost across the board. 3) Fears of massive defaults, which were stoked by the media and were generally overblown. With these concerns in mind, 10-year municipal yields reached a high of 3.5% before the European debt crisis sent investors scurrying for the safety of the Treasury market, pushing Treasury yields down. Municipal yields followed. (Bond yields and prices move in opposite directions.)
By the summer of 2011, investors seemed to believe that default expectations were excessive and demand for municipal bonds picked up. With yields close to historical lows, buyers moved down the credit curve—to A and BBB rated2 bonds—to garner additional income. Over the course of the 13-month period, these credits performed the best, as yields fell and the yield spread between higher and lower quality bonds tightened in response to demand. Yet, there were more downgrades than upgrades in the overall municipal market as a lackluster economy continued to pressure issuers.
2The credit quality ratings represent those of Moody's Investors Service, Inc. ("Moody's"), Standard & Poor's Corporation ("S&P") or Fitch Ratings ("Fitch") credit ratings. The ratings represent their opinions as to the quality of the securities they rate. Ratings are relative and subjective and are not absolute standards of quality. The security's credit quality does not eliminate risk.
4
Portfolio Manager's Report (continued) – Columbia Georgia Intermediate Municipal Bond Fund
Shorter duration, sector positioning hampered returns
The fund generated solid returns for the 13-month period. However, it lagged the index due to a combination of duration and sector positioning. (Duration is a measure of interest rate sensitivity that, like maturity, is measured in years.) The fund's duration was shorter than the index because it had somewhat more exposure to bonds in the seven- to nine-year range and less exposure to the 15- to 17-year range, the latter of which had the best returns. The fund had more weight in the electric revenue sector, which lagged the overall market. The fund's holdings in this sector were also shorter than the index, which further detracted from performance. Holdings in the hospital sector had a positive impact on performance. However, some of the bonds in the portfolio had shorter call dates, which partially offset this advantage.
Local general obligation bonds, which account for more than 18% of the fund's assets, slightly underperformed the index, primarily because of their higher quality. During the period, higher quality bonds generally underperformed lower quality bonds. Because Georgia is a high quality (AAA rated) credit, it did not benefit as yield spreads (the yield difference between higher and lower quality bonds) tightened in the market. We would have preferred to add exposure to A rated bonds. However, there was limited opportunity to do so because few A rated bonds came to either the new issue or secondary market in Georgia. As a result, buying activity during the period was focused on AA rated bonds.
A slow recovery for Georgia
With gains in the retail trade, professional business services and educational and health services, Georgia's economy appears to be on the mend. Durable goods manufacturing is also growing and leading the state's recovery. However, the state's troubled real estate market will continue to be a drag on the economy. And the rising cost of fuel poses a serious downside risk to Georgia's transportation-related industries. However, over the long term Georgia stands to benefit from its many strong businesses, its low overall cost of doing business and favorable demographics—all of which are favorable for the state's municipal bond market.
Portfolio characteristics and holdings are subject to change periodically and may not be representative of current characteristics and holdings. The outlook for this fund may differ from that presented for other Columbia Funds.
Tax-exempt investing offers current tax-exempt income, but it also involves special risks. The value of the fund will be affected by interest rate changes and the creditworthiness of issues held in the fund. When interest rates go up, bond prices generally drop and vice versa.
Interest income from certain tax-exempt bonds may be subject to certain state and local taxes and, if applicable, the alternative minimum tax. Capital gains are not exempt from income taxes.
Single-state municipal bond funds pose additional risks due to limited geographical diversification.
Quality breakdown1
as of 04/30/12 (%)
| AAA rating | | | 9.0 | | |
| AA rating | | | 51.8 | | |
| A rating | | | 24.1 | | |
| BBB rating | | | 10.8 | | |
| BB rating | | | 2.5 | | |
| Not rated | | | 1.8 | | |
1Percentages indicated are based upon total fixed income securities (excluding Investments of Cash Collateral Received for Securities on Loan and money market funds).
Bond ratings apply to the underlying holdings of the Fund and not the Fund itself and are divided into categories from AAA (highest) to D (lowest), and are subject to change. The ratings shown are determined by using middle rating of Moody's, S&P, and Fitch after dropping the highest and lowest available ratings. When a rating from only two agencies is available, the lower rating is used. When a rating from only one agency is available, that rating is used. When a bond is not rated by one of these agencies, it is designated as Not rated. Credit ratings are subjective to opinions and not statements of fact.
5
Portfolio of Investments – Columbia Georgia Intermediate Municipal Bond Fund
April 30, 2012
Issue
Description | | Coupon
Rate | | Principal
Amount | | Value | |
| Municipal Bonds 98.0% | |
| AIRPORT 1.7% | |
City of Atlanta Airport
Refunding Revenue Bonds
Series 2010C
01/01/25 | | | 5.000 | % | | $ | 1,500,000 | | | $ | 1,724,985 | | |
| FOREST PRODUCTS 1.0% | |
Richmond County Development Authority
Revenue Bonds
International Paper Co. Project
Series 2001A
03/01/15 | | | 5.150 | % | | | 1,000,000 | | | | 1,089,730 | | |
| HIGHER EDUCATION 12.3% | |
Athens Housing Authority
Refunding Revenue Bonds
UGAREF East
Series 2010
12/01/16 | | | 4.000 | % | | | 500,000 | | | | 557,545 | | |
Ugaref East Campus Housing
Series 2011
12/01/25 | | | 5.000 | % | | | 1,000,000 | | | | 1,150,500 | | |
Bleckley County & Dodge County Joint Development Authority
Revenue Bonds
Middle Georgia College
Series 2008
07/01/21 | | | 5.000 | % | | | 1,260,000 | | | | 1,404,295 | | |
Bulloch County Development Authority
Revenue Bonds
Georgia Southern University Housing Foundation Four
Series 2008 (AGM)
07/01/20 | | | 5.250 | % | | | 1,000,000 | | | | 1,193,810 | | |
Cobb County Development Authority
Revenue Bonds
Kennesaw State University Foundation, Inc.
Series 2004 (NPFGC)
07/15/19 | | | 5.000 | % | | | 1,870,000 | | | | 1,983,453 | | |
DeKalb Newton & Gwinnett Counties Joint Development Authority
Revenue Bonds
GGC Foundation LLC Project
Series 2009
07/01/24 | | | 5.500 | % | | | 2,500,000 | | | | 2,877,750 | | |
Private Colleges & Universities Authority
Revenue Bonds
Spelman College
Series 2003
06/01/19 | | | 5.250 | % | | | 2,250,000 | | | | 2,337,210 | | |
South Regional Joint Development Authority
Revenue Bonds
VSU Auxiliary Services-Student
Series 2008A
08/01/23 | | | 5.000 | % | | | 1,125,000 | | | | 1,259,370 | | |
| Total | | | 12,763,933 | | |
| HOSPITAL 9.5% | |
Chatham County Hospital Authority
Revenue Bonds
Memorial Health Medical Center
Series 2001A
01/01/24 | | | 6.125 | % | | | 2,500,000 | | | | 2,504,175 | | |
Issue
Description | | Coupon
Rate | | Principal
Amount | | Value | |
| Municipal Bonds (continued) | |
Cobb County Kennestone Hospital Authority
Revenue Bonds
Certificates
Series 2005B(AMBAC)
04/01/16 | | | 4.000 | % | | $ | 1,110,000 | | | $ | 1,212,797 | | |
DeKalb Private Hospital Authority
Revenue Bonds
Children's Healthcare
Series 2009
11/15/17 | | | 5.000 | % | | | 320,000 | | | | 377,216 | | |
Fayette County Hospital Authority
Revenue Bonds
Fayette Community Hospital
Series 2009A
06/15/23 | | | 5.250 | % | | | 2,000,000 | | | | 2,291,240 | | |
Floyd County Hospital Authority
Revenue Bonds
Floyd Medical Center Project
RAC Series 2002 (NPFGC)
07/01/18 | | | 5.500 | % | | | 1,290,000 | | | | 1,311,401 | | |
Gwinnett County Hospital Authority
Revenue Bonds
Gwinnet Hospital System
Series 2007A (AGM)
07/01/23 | | | 5.000 | % | | | 2,000,000 | | | | 2,230,280 | | |
| Total | | | 9,927,109 | | |
| JOINT POWER AUTHORITY 5.0% | |
Municipal Electric Authority of Georgia
Revenue Bonds
Project One
Subordinated Series 2008A
01/01/21 | | | 5.250 | % | | | 1,395,000 | | | | 1,698,371 | | |
Subordinated Series 2008D
01/01/23 | | | 6.000 | % | | | 1,000,000 | | | | 1,185,090 | | |
Series 1992B (NPFGC)
01/01/16 | | | 6.375 | % | | | 2,000,000 | | | | 2,283,840 | | |
| Total | | | 5,167,301 | | |
| LOCAL APPROPRIATION 5.6% | |
Atlanta Public Safety & Judicial Facilities Authority
Revenue Bonds
Public Safety Facility Project
Series 2006 (AGM)
12/01/17 | | | 5.000 | % | | | 1,310,000 | | | | 1,525,796 | | |
Fulton County Facilities Corp.
Certificate of Participation
Fulton County Public Purpose Project
Series 2009
11/01/17 | | | 5.000 | % | | | 1,000,000 | | | | 1,158,580 | | |
Winder-Barrow Industrial Building Authority
Refunding Revenue Bonds
City of Winder Project
Series 2012 (AGM)
12/01/24 | | | 5.000 | % | | | 2,650,000 | | | | 3,126,126 | | |
| Total | | | 5,810,502 | | |
The Accompanying Notes to Financial Statements are an integral part of this statement.
6
Columbia Georgia Intermediate Municipal Bond Fund
April 30, 2012
Issue
Description | | Coupon
Rate | | Principal
Amount | | Value | |
| Municipal Bonds (continued) | |
| LOCAL GENERAL OBLIGATION 19.5% | |
Atlanta Solid Waste Management Authority
Refunding Revenue Bonds
Series 2008 (AGM)
12/01/17 | | | 5.000 | % | | $ | 795,000 | | | $ | 959,700 | | |
Banks County School District
Unlimited General Obligation Bonds
Sales Tax
Series 2011
09/01/14 | | | 4.000 | % | | | 1,000,000 | | | | 1,077,460 | | |
Barrow County School District
Unrefunded Unlimited General Obligation Bonds
Series 2006
02/01/14 | | | 5.000 | % | | | 335,000 | | | | 362,018 | | |
Carroll County Georgia School District
Unlimited General Obligation Bonds
Series 2011
04/01/14 | | | 4.000 | % | | | 1,000,000 | | | | 1,065,080 | | |
Chatham County School District
Unlimited General Obligation Refunding Bonds
Series 2002 (AGM)
08/01/14 | | | 5.250 | % | | | 1,000,000 | | | | 1,106,100 | | |
Series 2004 (AGM)
08/01/19 | | | 5.250 | % | | | 2,000,000 | | | | 2,533,660 | | |
Cherokee County Board of Education
Unlimited General Obligation Bonds
Series 2009A
08/01/22 | | | 5.000 | % | | | 2,000,000 | | | | 2,382,600 | | |
City of Atlanta
Unlimited General Obligaion Public Improvement Bonds
Series 2004B (NPFGC)
12/01/18 | | | 5.000 | % | | | 1,200,000 | | | | 1,307,256 | | |
College Park Business & Industrial Development Authority
Refunding Revenue Bonds
Civic Center Project
Series 2005 (AMBAC)
09/01/19 | | | 5.250 | % | | | 2,000,000 | | | | 2,302,040 | | |
Douglas County School District
Unlimited General Obligation Bonds
Series 2007 (AGM)
04/01/21 | | | 5.000 | % | | | 2,000,000 | | | | 2,350,060 | | |
Gwinnett County School District
Unlimited General Obligation Refunding Bonds
Series 2010
02/01/24 | | | 5.000 | % | | | 1,500,000 | | | | 1,927,080 | | |
Thomas County School District
Unlimited General Obligation Bonds
Sales Tax
Series 2012
03/01/18 | | | 5.000 | % | | | 1,000,000 | | | | 1,201,920 | | |
Walton County School District
Prerefunded 08/01/15 Unlimited General Obligation Bonds
Series 2005A (NPFGC)
08/01/22 | | | 5.000 | % | | | 1,500,000 | | | | 1,717,395 | | |
| Total | | | 20,292,369 | | |
Issue
Description | | Coupon
Rate | | Principal
Amount | | Value | |
| Municipal Bonds (continued) | |
| MULTI-FAMILY 4.7% | |
Cobb County Development Authority
Revenue Bonds
KSU Village Real Estate
Series 2007A (AMBAC)
07/15/27 | | | 5.250 | % | | $ | 2,250,000 | | | $ | 2,310,502 | | |
Kennesaw State University-Housing
Series 2004A (NPFGC)
07/15/19 | | | 5.250 | % | | | 2,000,000 | | | | 2,155,820 | | |
Lawrenceville Housing Authority
Revenue Bonds
Housing-Knollwood Park Apartments Project
Series 1997 (FNMA) AMT (a)(b)
12/01/29 | | | 6.250 | % | | | 460,000 | | | | 473,506 | | |
| Total | | | 4,939,828 | | |
| MUNICIPAL POWER 4.8% | |
City of Griffin
Improvement Refunding Bonds
Series 2002 (AMBAC)
01/01/19 | | | 5.125 | % | | | 2,585,000 | | | | 2,687,625 | | |
Puerto Rico Electric Power Authority (c)
Refunding Revenue Bonds
Series 2002JJ (XLCA)
07/01/16 | | | 5.375 | % | | | 1,405,000 | | | | 1,582,648 | | |
Revenue Bonds
Series 2007TT
07/01/20 | | | 5.000 | % | | | 655,000 | | | | 712,365 | | |
| Total | | | 4,982,638 | | |
| PREPAID GAS 0.3% | |
Main Street Natural Gas, Inc.
Revenue Bonds
Series 2007A
09/15/19 | | | 5.250 | % | | | 295,000 | | | | 325,264 | | |
| REFUNDED/ESCROWED 5.4% | |
Barrow County School District
Unlimited General Obligation Bonds
Series 2006 Escrowed to Maturity
02/01/14 | | | 5.000 | % | | | 665,000 | | | | 719,729 | | |
Gwinnett County School District
Prerefunded 02/01/18 Unlimited General Obligation Bonds
Series 2008
02/01/22 | | | 5.000 | % | | | 1,000,000 | | | | 1,214,950 | | |
Unlimited General Obligation Bonds
Series 2008 Escrowed to Maturity
02/01/17 | | | 5.000 | % | | | 1,000,000 | | | | 1,190,320 | | |
State of Georgia
Prerefunded 12/01/17 Unlimited General Obligation Bonds
Series 2007G
12/01/20 | | | 5.000 | % | | | 2,000,000 | | | | 2,454,320 | | |
| Total | | | 5,579,319 | | |
| SPECIAL NON PROPERTY TAX 5.4% | |
Cobb-Marietta Coliseum & Exhibit Hall Authority
Refunding Revenue Bonds
Series 2005 (NPFGC) | |
| 10/01/19 | | | 5.250 | % | | | 2,430,000 | | | | 2,987,418 | | |
The Accompanying Notes to Financial Statements are an integral part of this statement.
7
Columbia Georgia Intermediate Municipal Bond Fund
April 30, 2012
Issue
Description | | Coupon
Rate | | Principal
Amount | | Value | |
| Municipal Bonds (continued) | |
| SPECIAL NON PROPERTY TAX (cont.) | |
Metropolitan Atlanta Rapid Transit Authority
Refunding Revenue Bonds
Series 1992N (NPFGC/BNY)
07/01/18 | | | 6.250 | % | | $ | 2,000,000 | | | $ | 2,314,740 | | |
Territory of Guam
Revenue Bonds
Series 2011A (c)
01/01/31 | | | 5.000 | % | | | 300,000 | | | | 329,652 | | |
| Total | | | 5,631,810 | | |
| SPECIAL PROPERTY TAX 1.6% | |
City of Atlanta
Refunding Tax Allocation Bonds
Atlanta Station Project
Series 2007 (AGM)
12/01/20 | | | 5.250 | % | | | 1,545,000 | | | | 1,708,538 | | |
| STATE GENERAL OBLIGATION 2.3% | |
State of Georgia
Unlimited General Obligation Bonds
Series 2009D
05/01/23 | | | 5.000 | % | | | 2,000,000 | | | | 2,443,900 | | |
| TRANSPORTATION 3.4% | |
Georgia State Road & Tollway Authority
Revenue Bonds
Federal Highway Grant
BAN Series 2006 (NPFGC)
06/01/16 | | | 5.000 | % | | | 2,000,000 | | | | 2,320,120 | | |
BAN Series 2009A
06/01/21 | | | 5.000 | % | | | 1,000,000 | | | | 1,198,660 | | |
| Total | | | 3,518,780 | | |
| WATER & SEWER 15.5% | |
Augusta Water & Sewerage
Refunding Revenue Bonds
Series 2007 (AGM)
10/01/21 | | | 5.000 | % | | | 1,000,000 | | | | 1,157,680 | | |
| 10/01/22 | | | 5.000 | % | | | 2,000,000 | | | | 2,293,180 | | |
City of Atlanta Water & Wastewater
Revenue Bonds
Series 2009B (AGM)
11/01/17 | | | 5.000 | % | | | 2,000,000 | | | | 2,325,320 | | |
County of DeKalb
Refunding Revenue Bond
Series 2006B
10/01/21 | | | 5.250 | % | | | 2,000,000 | | | | 2,504,780 | | |
County of Fulton Water & Sewerage
Revenue Bonds
Series 2004 (NPFGC/FGIC)
01/01/30 | | | 5.000 | % | | | 1,500,000 | | | | 1,573,995 | | |
Jackson County Water & Sewer Authority
Revenue Bonds
Series 2006A (XLCA)
09/01/16 | | | 5.000 | % | | | 1,030,000 | | | | 1,139,180 | | |
Upper Oconee Basin Water Authority
Refunding Revenue Bonds
Series 2005 (NPFGC)
07/01/17 | | | 5.000 | % | | | 1,140,000 | | | | 1,351,139 | | |
| 07/01/22 | | | 5.000 | % | | | 1,855,000 | | | | 2,080,939 | | |
Issue
Description | | Coupon
Rate | | Principal
Amount | | Value | |
| Municipal Bonds (continued) | |
Walton County Water & Sewer Authority
Revenue Bonds
Hard Labor Creek Project
Series 2008 (AGM)
02/01/25 | | | 5.000 | % | | $ | 1,495,000 | | | $ | 1,659,929 | | |
| Total | | | 16,086,142 | | |
Total Municipal Bonds
(Cost: $93,687,890) | | $ | 101,992,148 | | |
| | | Shares | | Value | |
| Money Market Funds 1.0% | |
JPMorgan Tax Free Money Market
Fund, 0.010% (d) | | | 1,078,001 | | | $ | 1,078,001 | | |
Total Money Market Funds
(Cost: $1,078,001) | | $ | 1,078,001 | | |
| Total Investments | |
| (Cost: $94,765,891) | | | | $ | 103,070,149 | | |
| Other Assets & Liabilities, Net | | | | | 991,946 | | |
| Total Net Assets | | | | $ | 104,062,095 | | |
| Notes to Portfolio of Investments | |
(a) At April 30, 2012, the value of securities subject to alternative minimum tax was $473,506, representing 0.46% of net assets.
(b) Variable rate security. The interest rate shown reflects the rate as of April 30, 2012.
(c) Municipal obligations include debt obligations issued by or on behalf of territories, possessions, or sovereign nations within the territorial boundaries of the United States. At April 30, 2012, the value of these securities amounted to $2,624,665 or 2.52% of net assets.
(d) The rate shown is the seven-day current annualized yield at April 30, 2012.
AGM Assured Guaranty Municipal Corporation
AMBAC Ambac Assurance Corporation
AMT Alternative Minimum Tax
BAN Bond Anticipation Note
BNY Bank of New York
FGIC Financial Guaranty Insurance Company
FNMA Federal National Mortgage Association
NPFGC National Public Finance Guarantee Corporation
RAC Revenue Anticipation Certificate
XLCA XL Capital Assurance
The Accompanying Notes to Financial Statements are an integral part of this statement.
8
Columbia Georgia Intermediate Municipal Bond Fund
April 30, 2012
Generally accepted accounting principles (GAAP) require disclosure regarding the inputs and valuation techniques used to measure fair value and any changes in valuation inputs or techniques. In addition, investments shall be disclosed by major category.
The Fund categorizes its fair value measurements according to a three-level hierarchy that maximizes the use of observable inputs and minimizes the use of unobservable inputs by prioritizing that the most observable input be used when available. Observable inputs are those that market participants would use in pricing an investment based on market data obtained from sources independent of the reporting entity. Unobservable inputs are those that reflect the Fund's assumptions about the information market participants would use in pricing an investment. An investment's level within the fair value hierarchy is based on the lowest level of any input that is deemed significant to the asset or liability's fair value measurement. The input levels are not necessarily an indication of the risk or liquidity associated with investments at that level. For example, certain U.S. government securities are generally high quality and liquid, however, they are reflected as Level 2 because the inputs used to determine fair value may not always be quoted prices in an active market.
Fair value inputs are summarized in the three broad levels listed below:
• Level 1 — Valuations based on quoted prices for investments in active markets that the Fund has the ability to access at the measurement date (including NAV for open-end mutual funds). Valuation adjustments are not applied to Level 1 investments.
• Level 2 — Valuations based on other significant observable inputs (including quoted prices for similar securities, interest rates, prepayment speeds, credit risks, etc.).
• Level 3 — Valuations based on significant unobservable inputs (including the Fund's own assumptions and judgment in determining the fair value of investments).
Inputs that are used in determining fair value of an investment may include price information, credit data, volatility statistics, and other factors. These inputs can be either observable or unobservable. The availability of observable inputs can vary between investments, and is affected by various factors such as the type of investment, and the volume and level of activity for that investment or similar investments in the marketplace. The inputs will be considered by the Investment Manager, along with any other relevant factors in the calculation of an investment's fair value. The Fund uses prices and inputs that are current as of the measurement date, which may include periods of market dislocations. During these periods, the availability of prices and inputs may be reduced for many investments. This condition could cause an investment to be reclassified between the various levels within the hierarchy.
Investments falling into the Level 3 category are primarily supported by quoted prices from brokers and dealers participating in the market for those investments. However, these may be classified as Level 3 investments due to lack of market transparency and corroboration to support these quoted prices. Additionally, valuation models may be used as the pricing source for any remaining investments classified as Level 3. These models rely on one or more significant unobservable inputs and/or significant assumptions by the Investment Manager. Inputs used in valuations may include, but are not limited to, financial statement analysis, capital account balances, discount rates and estimated cash flows, and comparable company data.
Under the direction of the Fund's Board of Trustees (the Board), the Investment Manager's Valuation Committee (the Committee) is responsible for carrying out the valuation procedures approved by the Board. The Committee consists of voting and non-voting members from various groups within the Investment Manager's organization, including operations and accounting, trading and investments, compliance, risk management and legal.
The Committee meets at least monthly to review and approve valuation matters, which may include a description of specific valuation determinations, data regarding pricing information received from approved pricing vendors and brokers and the results of Board-approved valuation control policies and procedures (the Policies). The Policies address, among other things, instances when market quotations are readily available, including recommendation of third party pricing vendors and a determination of appropriate pricing methodologies; events that require specific valuation determinations and assessment of fair value techniques; securities with a potential for stale pricing, including those that are illiquid, restricted, or in default; and the effectiveness of third-party pricing vendors, including periodic reviews of vendors. The Committee meets more frequently, as needed, to discuss additional valuation matters, which may include the need to review back-testing results, review time-sensitive information or approve related valuation actions. The Committee reports to the Board, with members of the Committee meeting with the Board at each of its regularly scheduled meetings to discuss valuation matters and actions during the period, similar to those described earlier.
For investments categorized as Level 3, the Committee monitors information similar to that described above, which may include: (i) data specific to the issuer or comparable issuers, (ii) general market or specific sector news and (iii) quoted prices and specific or similar security transactions. The Committee considers this data and any changes from prior periods in order to assess the reasonableness of observable and unobservable inputs, any assumptions or internal models used to value those securities and changes in fair value. This data is also used to corroborate, when available, information received from approved pricing vendors and brokers. Various factors impact the frequency of monitoring this information (which may occur as often as daily). However, the Committee may determine that changes to inputs, assumptions and models are not required as a result of the monitoring procedures performed.
The Accompanying Notes to Financial Statements are an integral part of this statement.
9
Columbia Georgia Intermediate Municipal Bond Fund
April 30, 2012
| Fair Value Measurements (continued) | |
The following table is a summary of the inputs used to value the Fund's investments as of April 30, 2012:
| | | Fair value at April 30, 2012 | |
| Description | | Level 1
quoted prices
in active
markets for
identical assets | | Level 2
other
significant
observable
inputs | | Level 3
significant
unobservable
inputs | | Total | |
| Bonds | |
| Municipal Bonds | | $ | — | | | $ | 101,992,148 | | | $ | — | | | $ | 101,992,148 | | |
| Total Bonds | | | — | | | | 101,992,148 | | | | — | | | | 101,992,148 | | |
| Other | |
| Money Market Funds | | | 1,078,001 | | | | — | | | | — | | | | 1,078,001 | | |
| Total Other | | | 1,078,001 | | | | — | | | | — | | | | 1,078,001 | | |
| Total | | $ | 1,078,001 | | | $ | 101,992,148 | | | $ | — | | | $ | 103,070,149 | | |
See the Portfolio of Investments for all investment classifications not indicated in the table.
The Fund's assets assigned to the Level 2 input category are generally valued using the market approach, in which a security's value is determined through reference to prices and information from market transactions for similar or identical assets.
There were no transfers between Levels 1 and 2 during the period from April 1, 2012 to April 30, 2012.
The following table is a summary of the inputs used to value the Fund's investments as of March 31, 2012:
| | | Fair Value at March 31, 2012 | |
| Description | | Level 1
Quoted Prices
in Active
Markets for
Identical Assets | | Level 2
Other
Significant
Observable
Inputs | | Level 3
Significant
Unobservable
Inputs | | Total | |
| Bonds | |
| Municipal Bonds | | $ | — | | | $ | 102,025,317 | | | $ | — | | | $ | 102,025,317 | | |
| Total Bonds | | | — | | | | 102,025,317 | | | | — | | | | 102,025,317 | | |
| Other | |
| Money Market Funds | | | 1,648,573 | | | | — | | | | — | | | | 1,648,573 | | |
| Total Other | | | 1,648,573 | | | | — | | | | — | | | | 1,648,573 | | |
| Total | | $ | 1,648,573 | | | $ | 102,025,317 | | | $ | — | | | $ | 103,673,890 | | |
The Fund's assets assigned to the Level 2 input category are generally valued using the market approach, in which a security's value is determined through reference to prices and information from market transactions for similar or identical assets.
There were no transfers between Levels 1 and 2 during the period from April 1, 2011 to March 31, 2012.
The Accompanying Notes to Financial Statements are an integral part of this statement.
10
Statement of Assets and Liabilities – Columbia Georgia Intermediate Municipal Bond Fund
| | | April 30,
2012 | | March 31,
2012 | |
| Assets | |
| Investments, at value | | | | | |
| (identified cost $94,765,891 and $96,182,261) | | $ | 103,070,149 | | | $ | 103,673,890 | | |
| Receivable for: | | | | | |
| Capital shares sold | | | 54,697 | | | | 70,446 | | |
| Interest | | | 1,354,811 | | | | 1,256,782 | | |
| Expense reimbursement due from Investment Manager | | | 1,760 | | | | 640 | | |
| Prepaid expense | | | 986 | | | | 1,973 | | |
| Total assets | | | 104,482,403 | | | | 105,003,731 | | |
| Liabilities | |
| Payable for: | |
| Investments purchased | | | — | | | | 1,192,710 | | |
| Capital shares purchased | | | 45,448 | | | | 39,386 | | |
| Dividend distributions to shareholders | | | 261,628 | | | | 270,901 | | |
| Investment management fees | | | 3,409 | | | | 1,130 | | |
| Distribution and service fees | | | 758 | | | | 255 | | |
| Transfer agent fees | | | 14,989 | | | | 16,221 | | |
| Administration fees | | | 597 | | | | 198 | | |
| Compensation of board members | | | 78,105 | | | | 77,484 | | |
| Other expenses | | | 15,374 | | | | 36,047 | | |
| Total liabilities | | | 420,308 | | | | 1,634,332 | | |
| Net assets applicable to outstanding capital stock | | $ | 104,062,095 | | | $ | 103,369,399 | | |
The Accompanying Notes to Financial Statements are an integral part of this statement.
11
Statement of Assets and Liabilities (continued) – Columbia Georgia Intermediate Municipal Bond Fund
| | | April 30,
2012 | | March 31,
2012 | |
| Represented by | |
| Paid-in capital | | $ | 95,607,192 | | | $ | 95,737,170 | | |
| Undistributed net investment income | | | 165,803 | | | | 157,086 | | |
| Accumulated net realized loss | | | (15,158 | ) | | | (16,486 | ) | |
| Unrealized appreciation (depreciation) on: | |
| Investments | | | 8,304,258 | | | | 7,491,629 | | |
Total — representing net assets
applicable to outstanding capital stock | | $ | 104,062,095 | | | $ | 103,369,399 | | |
| Net assets applicable to outstanding shares | |
| Class A | | $ | 19,861,300 | | | $ | 19,563,380 | | |
| Class B | | $ | 372,577 | | | $ | 369,336 | | |
| Class C | | $ | 3,918,700 | | | $ | 4,065,986 | | |
| Class Z | | $ | 79,909,518 | | | $ | 79,370,697 | | |
| Shares outstanding | |
| Class A | | | 1,776,925 | | | | 1,764,243 | | |
| Class B | | | 33,313 | | | | 33,286 | | |
| Class C | | | 350,418 | | | | 366,490 | | |
| Class Z | | | 7,147,464 | | | | 7,155,986 | | |
| Net asset value per share | |
| Class A(a) | | $ | 11.18 | | | $ | 11.09 | | |
| Class B | | $ | 11.18 | | | $ | 11.10 | | |
| Class C | | $ | 11.18 | | | $ | 11.09 | | |
| Class Z | | $ | 11.18 | | | $ | 11.09 | | |
(a) At April 30, 2012 and March 31, 2012 the maximum offering price per share for Class A is $11.56 and $11.46, respectively. The offering price is calculated by dividing the net asset value by 1.0 minus the maximum sales charge of 3.25%.
The Accompanying Notes to Financial Statements are an integral part of this statement.
12
Statement of Operations – Columbia Georgia Intermediate Municipal Bond Fund
| Year ended | | April 30,
2012(a) | | March 31,
2012 | |
| Net investment income | |
| Income: | |
| Dividends | | $ | 17 | | | $ | 384 | | |
| Interest | | | 326,571 | | | | 3,869,268 | | |
| Total income | | | 326,588 | | | | 3,869,652 | | |
| Expenses: | | | | | |
| Investment management fees | | | 35,075 | | | | 409,366 | | |
| Distribution fees | | | | | |
| Class B | | | 236 | | | | 3,263 | | |
| Class C | | | 2,539 | | | | 27,136 | | |
| Service fees | | | | | |
| Class B | | | 78 | | | | 1,087 | | |
| Class C | | | 846 | | | | 9,046 | | |
| Distribution and service fees — Class A | | | 4,162 | | | | 48,142 | | |
| Transfer agent fees | | | | | |
| Class A | | | 2,823 | | | | 35,566 | | |
| Class B | | | 53 | | | | 843 | | |
| Class C | | | 574 | | | | 6,540 | | |
| Class Z | | | 11,423 | | | | 145,038 | | |
| Administration fees | | | 6,138 | | | | 86,372 | | |
| Compensation of board members | | | 1,102 | | | | 15,589 | | |
| Pricing and bookkeeping fees | | | — | | | | 7,583 | | |
| Custodian fees | | | 163 | | | | 4,615 | | |
| Printing and postage fees | | | 1,555 | | | | 28,215 | | |
| Registration fees | | | 100 | | | | 427 | | |
| Professional fees | | | 7,085 | | | | 50,582 | | |
| Chief compliance officer expenses | | | — | | | | 4 | | |
| Other | | | 1,615 | | | | 15,672 | | |
| Total expenses | | | 75,567 | | | | 895,086 | | |
Fees waived or expenses reimbursed by
Investment Manager and its affiliates | | | (19,346 | ) | | | (244,283 | ) | |
| Expense reductions | | | — | | | | (20 | ) | |
| Total net expenses | | | 56,221 | | | | 650,783 | | |
| Net investment income | | | 270,367 | | | | 3,218,869 | | |
| Realized and unrealized gain (loss) — net | |
| Net realized gain (loss) on: | |
| Investments | | | 1,328 | | | | 89,867 | | |
| Net realized gain | | | 1,328 | | | | 89,867 | | |
| Net change in unrealized appreciation (depreciation) on: | |
| Investments | | | 812,629 | | | | 5,603,483 | | |
| Net change in unrealized appreciation | | | 812,629 | | | | 5,603,483 | | |
| Net realized and unrealized gain | | | 813,957 | | | | 5,693,350 | | |
| Net increase in net assets resulting from operations | | $ | 1,084,324 | | | $ | 8,912,219 | | |
(a) For the period from April 1, 2012 to April 30, 2012. During the period, the Fund's fiscal year end was changed from March 31 to April 30.
The Accompanying Notes to Financial Statements are an integral part of this statement.
13
Statement of Changes in Net Assets – Columbia Georgia Intermediate Municipal Bond Fund
| Year ended | | April 30,
2012(a) | | March 31,
2012 | | March 31,
2011 | |
| Operations | |
| Net investment income | | $ | 270,367 | | | $ | 3,218,869 | | | $ | 4,034,371 | | |
| Net realized gain | | | 1,328 | | | | 89,867 | | | | 853,561 | | |
Net change in unrealized
appreciation (depreciation) | | | 812,629 | | | | 5,603,483 | | | | (1,509,643 | ) | |
Net increase in net
assets resulting from operations | | | 1,084,324 | | | | 8,912,219 | | | | 3,378,289 | | |
| Distributions to shareholders from: | |
| Net investment income | |
| Class A | | | (47,105 | ) | | | (581,420 | ) | | | (589,516 | ) | |
| Class B | | | (660 | ) | | | (9,810 | ) | | | (15,911 | ) | |
| Class C | | | (7,119 | ) | | | (80,774 | ) | | | (85,928 | ) | |
| Class Z | | | (206,766 | ) | | | (2,560,819 | ) | | | (3,343,016 | ) | |
| Total distributions to shareholders | | | (261,650 | ) | | | (3,232,823 | ) | | | (4,034,371 | ) | |
Increase (decrease) in net
assets from share transactions | | | (129,978 | ) | | | (11,131,127 | ) | | | (24,447,360 | ) | |
Total increase (decrease)
in net assets | | | 692,696 | | | | (5,451,731 | ) | | | (25,103,442 | ) | |
| Net assets at beginning of year | | | 103,369,399 | | | | 108,821,130 | | | | 133,924,572 | | |
| Net assets at end of year | | $ | 104,062,095 | | | $ | 103,369,399 | | | $ | 108,821,130 | | |
Undistributed net
investment income | | $ | 165,803 | | | $ | 157,086 | | | $ | 171,044 | | |
(a) For the period from April 1, 2012 to April 30, 2012. During the period, the Fund's fiscal year end was changed from March 31 to April 30.
The Accompanying Notes to Financial Statements are an integral part of this statement.
14
Statement of Changes in Net Assets (continued) – Columbia Georgia Intermediate Municipal Bond Fund
| Year ended | | April 30, 2012(a) | | March 31, 2012 | | March 31, 2011 | |
| | | Shares | | Dollars ($) | | Shares | | Dollars ($) | | Shares | | Dollars ($) | |
| Capital stock activity | |
| Class A shares | |
| Subscriptions(b) | | | 21,093 | | | | 235,451 | | | | 192,801 | | | | 2,103,521 | | | | 501,954 | | | | 5,305,218 | | |
| Distributions reinvested | | | 2,857 | | | | 31,937 | | | | 31,915 | | | | 349,426 | | | | 31,411 | | | | 336,881 | | |
| Redemptions | | | (11,268 | ) | | | (125,579 | ) | | | (331,602 | ) | | | (3,581,870 | ) | | | (499,187 | ) | | | (5,355,329 | ) | |
| Net increase (decrease) | | | 12,682 | | | | 141,809 | | | | (106,886 | ) | | | (1,128,923 | ) | | | 34,178 | | | | 286,770 | | |
| Class B shares | |
| Subscriptions | | | 14 | | | | 154 | | | | 256 | | | | 2,783 | | | | 258 | | | | 2,773 | | |
| Distributions reinvested | | | 42 | | | | 466 | | | | 494 | | | | 5,410 | | | | 855 | | | | 9,184 | | |
| Redemptions(b) | | | (29 | ) | | | (318 | ) | | | (17,757 | ) | | | (193,559 | ) | | | (34,481 | ) | | | (372,916 | ) | |
| Net increase (decrease) | | | 27 | | | | 302 | | | | (17,007 | ) | | | (185,366 | ) | | | (33,368 | ) | | | (360,959 | ) | |
| Class C shares | |
| Subscriptions | | | 202 | | | | 2,272 | | | | 87,482 | | | | 965,912 | | | | 90,131 | | | | 965,858 | | |
| Distributions reinvested | | | 474 | | | | 5,294 | | | | 4,844 | | | | 53,110 | | | | 4,526 | | | | 48,513 | | |
| Redemptions | | | (16,748 | ) | | | (186,566 | ) | | | (44,600 | ) | | | (487,616 | ) | | | (112,972 | ) | | | (1,203,247 | ) | |
| Net increase (decrease) | | | (16,072 | ) | | | (179,000 | ) | | | 47,726 | | | | 531,406 | | | | (18,315 | ) | | | (188,876 | ) | |
| Class Z shares | |
| Subscriptions | | | 29,958 | | | | 334,239 | | | | 834,015 | | | | 9,196,772 | | | | 401,573 | | | | 4,312,332 | | |
| Distributions reinvested | | | 631 | | | | 7,056 | | | | 6,602 | | | | 72,210 | | | | 8,875 | | | | 95,257 | | |
| Redemptions | | | (39,111 | ) | | | (434,384 | ) | | | (1,811,102 | ) | | | (19,617,226 | ) | | | (2,686,058 | ) | | | (28,591,884 | ) | |
| Net decrease | | | (8,522 | ) | | | (93,089 | ) | | | (970,485 | ) | | | (10,348,244 | ) | | | (2,275,610 | ) | | | (24,184,295 | ) | |
| Total net decrease | | | (11,885 | ) | | | (129,978 | ) | | | (1,046,652 | ) | | | (11,131,127 | ) | | | (2,293,115 | ) | | | (24,447,360 | ) | |
(a) For the period from April 1, 2012 to April 30, 2012. During the period, the Fund's fiscal year end was changed from March 31 to April 30.
(b) Includes conversions of Class B shares to Class A shares, if any.
The Accompanying Notes to Financial Statements are an integral part of this statement.
15
Financial Highlights – Columbia Georgia Intermediate Municipal Bond Fund
The following tables are intended to help you understand the Fund's financial performance. Certain information reflects financial results for a single share of a class held for the periods shown. Per share net investment income (loss) amounts are calculated based on average shares outstanding during the period. Total returns assume reinvestment of all dividends and distributions. Total returns do not reflect payments of sales charges, if any, and are not annualized for periods of less than one year.
| | | April 30, | | Year ended March 31, | |
| | | 2012(a) | | 2012 | | 2011 | | 2010 | | 2009 | | 2008 | |
| Class A | |
| Per share data | |
| Net asset value, beginning of period | | $ | 11.09 | | | $ | 10.50 | | | $ | 10.58 | | | $ | 10.18 | | | $ | 10.35 | | | $ | 10.54 | | |
| Income from investment operations: | |
| Net investment income | | | 0.03 | | | | 0.33 | | | | 0.33 | | | | 0.34 | | | | 0.37 | | | | 0.40 | | |
| Net realized and unrealized gain (loss) | | | 0.09 | | | | 0.59 | | | | (0.08 | ) | | | 0.40 | | | | (0.17 | ) | | | (0.19 | ) | |
| Total from investment operations | | | 0.12 | | | | 0.92 | | | | 0.25 | | | | 0.74 | | | | 0.20 | | | | 0.21 | | |
| Less distributions to shareholders from: | |
| Net investment income | | | (0.03 | ) | | | (0.33 | ) | | | (0.33 | ) | | | (0.34 | ) | | | (0.37 | ) | | | (0.40 | ) | |
| Total distributions to shareholders | | | (0.03 | ) | | | (0.33 | ) | | | (0.33 | ) | | | (0.34 | ) | | | (0.37 | ) | | | (0.40 | ) | |
| Net asset value, end of period | | $ | 11.18 | | | $ | 11.09 | | | $ | 10.50 | | | $ | 10.58 | | | $ | 10.18 | | | $ | 10.35 | | |
| Total return | | | 1.05 | % | | | 8.85 | % | | | 2.35 | % | | | 7.31 | % | | | 2.04 | % | | | 2.00 | % | |
| Ratios to average net assets(b) | |
Expenses prior to fees waived or expenses reimbursed
(including interest expense) | | | 1.02 | %(c) | | | 1.04 | % | | | 0.99 | % | | | 0.95 | % | | | 0.92 | % | | | 0.95 | %(d) | |
Net expenses after fees waived or expenses reimbursed
(including interest expense)(e) | | | 0.80 | %(c) | | | 0.80 | %(f) | | | 0.80 | %(f) | | | 0.78 | %(f) | | | 0.75 | %(f) | | | 0.75 | %(d)(f) | |
Expenses prior to fees waived or expenses reimbursed
(excluding interest expense) | | | 1.02 | %(c) | | | 1.04 | % | | | 0.99 | % | | | 0.95 | % | | | 0.92 | % | | | 0.95 | % | |
Net expenses after fees waived or expenses reimbursed
(excluding interest expense)(e) | | | 0.80 | %(c) | | | 0.80 | %(f) | | | 0.80 | %(f) | | | 0.78 | %(f) | | | 0.75 | %(f) | | | 0.75 | %(f) | |
| Net investment income | | | 2.92 | %(c) | | | 2.99 | %(f) | | | 3.09 | %(f) | | | 3.20 | %(f) | | | 3.67 | %(f) | | | 3.80 | %(f) | |
| Supplemental data | |
| Net assets, end of period (in thousands) | | $ | 19,861 | | | $ | 19,563 | | | $ | 19,641 | | | $ | 19,433 | | | $ | 14,801 | | | $ | 13,742 | | |
| Portfolio turnover | | | 0 | % | | | 11 | % | | | 11 | % | | | 22 | % | | | 22 | % | | | 28 | % | |
| Notes to Financial Highlights | |
(a) For the period from April 1, 2012 to April 30, 2012. During the period, the Fund's fiscal year end was changed from March 31 to April 30.
(b) In addition to the fees and expenses which the Fund bears directly, the Fund indirectly bears a pro rata share of the fees and expenses of the acquired funds in which it invests. Such indirect expenses are not included in the reported expense ratios.
(c) Annualized.
(d) Includes interest expense which rounds to less than 0.01%.
(e) The Investment Manager and certain of its affiliates agreed to waive/reimburse certain fees and expenses, if applicable.
(f) The benefits derived from expense reductions had an impact of less than 0.01%.
The Accompanying Notes to Financial Statements are an integral part of this statement.
16
Financial Highlights (continued) – Columbia Georgia Intermediate Municipal Bond Fund
| | | April 30, | | Year ended March 31, | |
| | | 2012(a) | | 2012 | | 2011 | | 2010 | | 2009 | | 2008 | |
| Class B | |
| Per share data | |
| Net asset value, beginning of period | | $ | 11.10 | | | $ | 10.50 | | | $ | 10.58 | | | $ | 10.19 | | | $ | 10.35 | | | $ | 10.55 | | |
| Income from investment operations: | |
| Net investment income | | | 0.02 | | | | 0.24 | | | | 0.25 | | | | 0.26 | | | | 0.30 | | | | 0.32 | | |
| Net realized and unrealized gain (loss) | | | 0.08 | | | | 0.60 | | | | (0.08 | ) | | | 0.39 | | | | (0.16 | ) | | | (0.20 | ) | |
| Total from investment operations | | | 0.10 | | | | 0.84 | | | | 0.17 | | | | 0.65 | | | | 0.14 | | | | 0.12 | | |
| Less distributions to shareholders from: | |
| Net investment income | | | (0.02 | ) | | | (0.24 | ) | | | (0.25 | ) | | | (0.26 | ) | | | (0.30 | ) | | | (0.32 | ) | |
| Total distributions to shareholders | | | (0.02 | ) | | | (0.24 | ) | | | (0.25 | ) | | | (0.26 | ) | | | (0.30 | ) | | | (0.32 | ) | |
| Net asset value, end of period | | $ | 11.18 | | | $ | 11.10 | | | $ | 10.50 | | | $ | 10.58 | | | $ | 10.19 | | | $ | 10.35 | | |
| Total return | | | 0.90 | % | | | 8.10 | % | | | 1.59 | % | | | 6.41 | % | | | 1.38 | % | | | 1.15 | % | |
| Ratios to average net assets(b) | |
Expenses prior to fees waived or expenses reimbursed
(including interest expense) | | | 1.77 | %(c) | | | 1.81 | % | | | 1.74 | % | | | 1.70 | % | | | 1.67 | % | | | 1.70 | %(d) | |
Net expenses after fees waived or expenses reimbursed
(including interest expense)(e) | | | 1.55 | %(c) | | | 1.55 | %(f) | | | 1.55 | %(f) | | | 1.53 | %(f) | | | 1.50 | %(f) | | | 1.50 | %(d)(f) | |
Expenses prior to fees waived or expenses reimbursed
(excluding interest expense) | | | 1.77 | %(c) | | | 1.81 | % | | | 1.74 | % | | | 1.70 | % | | | 1.67 | % | | | 1.70 | % | |
Net expenses after fees waived or expenses reimbursed
(excluding interest expense)(e) | | | 1.55 | %(c) | | | 1.55 | %(f) | | | 1.55 | %(f) | | | 1.53 | %(f) | | | 1.50 | %(f) | | | 1.50 | %(f) | |
| Net investment income | | | 2.17 | %(c) | | | 2.25 | %(f) | | | 2.33 | %(f) | | | 2.47 | %(f) | | | 2.92 | %(f) | | | 3.05 | %(f) | |
| Supplemental data | |
| Net assets, end of period (in thousands) | | $ | 373 | | | $ | 369 | | | $ | 528 | | | $ | 886 | | | $ | 1,266 | | | $ | 1,364 | | |
| Portfolio turnover | | | 0 | % | | | 11 | % | | | 11 | % | | | 22 | % | | | 22 | % | | | 28 | % | |
| Notes to Financial Highlights | |
(a) For the period from April 1, 2012 to April 30, 2012. During the period, the Fund's fiscal year end was changed from March 31 to April 30.
(b) In addition to the fees and expenses which the Fund bears directly, the Fund indirectly bears a pro rata share of the fees and expenses of the acquired funds in which it invests. Such indirect expenses are not included in the reported expense ratios.
(c) Annualized.
(d) Includes interest expense which rounds to less than 0.01%.
(e) The Investment Manager and certain of its affiliates agreed to waive/reimburse certain fees and expenses, if applicable.
(f) The benefits derived from expense reductions had an impact of less than 0.01%.
The Accompanying Notes to Financial Statements are an integral part of this statement.
17
Financial Highlights (continued) – Columbia Georgia Intermediate Municipal Bond Fund
| | | April 30, | | Year ended March 31, | |
| | | 2012(a) | | 2012 | | 2011 | | 2010 | | 2009 | | 2008 | |
| Class C | |
| Per share data | |
| Net asset value, beginning of period | | $ | 11.09 | | | $ | 10.50 | | | $ | 10.58 | | | $ | 10.18 | | | $ | 10.35 | | | $ | 10.55 | | |
| Income from investment operations: | |
| Net investment income | | | 0.02 | | | | 0.24 | | | | 0.25 | | | | 0.26 | | | | 0.30 | | | | 0.32 | | |
| Net realized and unrealized gain (loss) | | | 0.09 | | | | 0.59 | | | | (0.08 | ) | | | 0.40 | | | | (0.17 | ) | | | (0.20 | ) | |
| Total from investment operations | | | 0.11 | | | | 0.83 | | | | 0.17 | | | | 0.66 | | | | 0.13 | | | | 0.12 | | |
| Less distributions to shareholders from: | |
| Net investment income | | | (0.02 | ) | | | (0.24 | ) | | | (0.25 | ) | | | (0.26 | ) | | | (0.30 | ) | | | (0.32 | ) | |
| Total distributions to shareholders | | | (0.02 | ) | | | (0.24 | ) | | | (0.25 | ) | | | (0.26 | ) | | | (0.30 | ) | | | (0.32 | ) | |
| Net asset value, end of period | | $ | 11.18 | | | $ | 11.09 | | | $ | 10.50 | | | $ | 10.58 | | | $ | 10.18 | | | $ | 10.35 | | |
| Total return | | | 0.99 | % | | | 8.00 | % | | | 1.59 | % | | | 6.51 | % | | | 1.28 | % | | | 1.14 | % | |
| Ratios to average net assets(b) | |
Expenses prior to fees waived or expenses reimbursed
(including interest expense) | | | 1.77 | %(c) | | | 1.78 | % | | | 1.74 | % | | | 1.70 | % | | | 1.67 | % | | | 1.70 | %(d) | |
Net expenses after fees waived or expenses reimbursed
(including interest expense)(e) | | | 1.55 | %(c) | | | 1.55 | %(f) | | | 1.55 | %(f) | | | 1.53 | %(f) | | | 1.50 | %(f) | | | 1.50 | %(d)(f) | |
Expenses prior to fees waived or expenses reimbursed
(excluding interest expense) | | | 1.77 | %(c) | | | 1.78 | % | | | 1.74 | % | | | 1.70 | % | | | 1.67 | % | | | 1.70 | % | |
Net expenses after fees waived or expenses reimbursed
(excluding interest expense)(e) | | | 1.55 | %(c) | | | 1.55 | %(f) | | | 1.55 | %(f) | | | 1.53 | %(f) | | | 1.50 | %(f) | | | 1.50 | %(f) | |
| Net investment income | | | 2.17 | %(c) | | | 2.23 | %(f) | | | 2.34 | %(f) | | | 2.42 | %(f) | | | 2.92 | %(f) | | | 3.05 | %(f) | |
| Supplemental data | |
| Net assets, end of period (in thousands) | | $ | 3,919 | | | $ | 4,066 | | | $ | 3,347 | | | $ | 3,567 | | | $ | 2,100 | | | $ | 1,830 | | |
| Portfolio turnover | | | 0 | % | | | 11 | % | | | 11 | % | | | 22 | % | | | 22 | % | | | 28 | % | |
| Notes to Financial Highlights | |
(a) For the period from April 1, 2012 to April 30, 2012. During the period, the Fund's fiscal year end was changed from March 31 to April 30.
(b) In addition to the fees and expenses which the Fund bears directly, the Fund indirectly bears a pro rata share of the fees and expenses of the acquired funds in which it invests. Such indirect expenses are not included in the reported expense ratios.
(c) Annualized.
(d) Includes interest expense which rounds to less than 0.01%.
(e) The Investment Manager and certain of its affiliates agreed to waive/reimburse certain fees and expenses, if applicable.
(f) The benefits derived from expense reductions had an impact of less than 0.01%.
The Accompanying Notes to Financial Statements are an integral part of this statement.
18
Financial Highlights (continued) – Columbia Georgia Intermediate Municipal Bond Fund
| | | April 30, | | Year ended March 31, | |
| | | 2012(a) | | 2012 | | 2011 | | 2010 | | 2009 | | 2008 | |
| Class Z | |
| Per share data | |
| Net asset value, beginning of period | | $ | 11.09 | | | $ | 10.50 | | | $ | 10.58 | | | $ | 10.18 | | | $ | 10.35 | | | $ | 10.54 | | |
| Income from investment operations: | |
| Net investment income | | | 0.03 | | | | 0.35 | | | | 0.36 | | | | 0.36 | | | | 0.40 | | | | 0.42 | | |
| Net realized and unrealized gain (loss) | | | 0.09 | | | | 0.59 | | | | (0.08 | ) | | | 0.40 | | | | (0.17 | ) | | | (0.19 | ) | |
| Total from investment operations | | | 0.12 | | | | 0.94 | | | | 0.28 | | | | 0.76 | | | | 0.23 | | | | 0.23 | | |
| Less distributions to shareholders from: | |
| Net investment income | | | (0.03 | ) | | | (0.35 | ) | | | (0.36 | ) | | | (0.36 | ) | | | (0.40 | ) | | | (0.42 | ) | |
| Total distributions to shareholders | | | (0.03 | ) | | | (0.35 | ) | | | (0.36 | ) | | | (0.36 | ) | | | (0.40 | ) | | | (0.42 | ) | |
| Net asset value, end of period | | $ | 11.18 | | | $ | 11.09 | | | $ | 10.50 | | | $ | 10.58 | | | $ | 10.18 | | | $ | 10.35 | | |
| Total return | | | 1.07 | % | | | 9.08 | % | | | 2.61 | % | | | 7.58 | % | | | 2.30 | % | | | 2.26 | % | |
| Ratios to average net assets(b) | |
Expenses prior to fees waived or expenses reimbursed
(including interest expense) | | | 0.77 | %(c) | | | 0.79 | % | | | 0.74 | % | | | 0.70 | % | | | 0.67 | % | | | 0.70 | %(d) | |
Net expenses after fees waived or expenses reimbursed
(including interest expense)(e) | | | 0.55 | %(c) | | | 0.55 | %(f) | | | 0.55 | %(f) | | | 0.53 | %(f) | | | 0.50 | %(f) | | | 0.50 | %(d)(f) | |
Expenses prior to fees waived or expenses reimbursed
(excluding interest expense) | | | 0.77 | %(c) | | | 0.79 | % | | | 0.74 | % | | | 0.70 | % | | | 0.67 | % | | | 0.70 | % | |
Net expenses after fees waived or expenses reimbursed
(excluding interest expense)(e) | | | 0.55 | %(c) | | | 0.55 | %(f) | | | 0.55 | %(f) | | | 0.53 | %(f) | | | 0.50 | %(f) | | | 0.50 | %(f) | |
| Net investment income | | | 3.17 | %(c) | | | 3.24 | %(f) | | | 3.34 | %(f) | | | 3.46 | %(f) | | | 3.92 | %(f) | | | 4.05 | %(f) | |
| Supplemental data | |
| Net assets, end of period (in thousands) | | $ | 79,910 | | | $ | 79,371 | | | $ | 85,305 | | | $ | 110,040 | | | $ | 110,408 | | | $ | 106,927 | | |
| Portfolio turnover | | | 0 | % | | | 11 | % | | | 11 | % | | | 22 | % | | | 22 | % | | | 28 | % | |
| Notes to Financial Highlights | |
(a) For the period from April 1, 2012 to April 30, 2012. During the period, the Fund's fiscal year end was changed from March 31 to April 30.
(b) In addition to the fees and expenses which the Fund bears directly, the Fund indirectly bears a pro rata share of the fees and expenses of the acquired funds in which it invests. Such indirect expenses are not included in the reported expense ratios.
(c) Annualized.
(d) Includes interest expense which rounds to less than 0.01%.
(e) The Investment Manager and certain of its affiliates agreed to waive/reimburse certain fees and expenses, if applicable.
(f) The benefits derived from expense reductions had an impact of less than 0.01%.
The Accompanying Notes to Financial Statements are an integral part of this statement.
19
Notes to Financial Statements – Columbia Georgia Intermediate Municipal Bond Fund
April 30, 2012
Note 1. Organization
Columbia Georgia Intermediate Municipal Bond Fund (the Fund), a series of Columbia Funds Series Trust (the Trust), is a diversified fund. The Trust is registered under the Investment Company Act of 1940, as amended (the 1940 Act), as an open-end management investment company organized as a Delaware statutory trust.
Fiscal Year End Change
During the period, the Fund changed its fiscal year end from March 31 to April 30. Accordingly, this report includes activity for the period April 1, 2012 to April 30, 2012 and the year ended March 31, 2012.
Fund Shares
The Trust may issue an unlimited number of shares (without par value). The Fund offers Class A, Class B, Class C and Class Z shares. All share classes have identical voting, dividend and liquidation rights. Each share class has its own expense structure and sales charges, as applicable.
Class A shares are subject to a maximum front-end sales charge of 3.25% based on the initial investment amount. Class A shares purchased without an initial sales charge in accounts aggregating $1 million to $50 million at the time of purchase are subject to a contingent deferred sales charge (CDSC) if the shares are sold within 18 months of purchase, charged as follows: 1.00% CDSC if redeemed within 12 months of purchase, and 0.50% CDSC if redeemed more than 12, but less than 18, months after purchase.
Class B shares may be subject to a maximum CDSC of 3.00% based upon the holding period after purchase. Class B shares will generally convert to Class A shares eight years after purchase. The Fund no longer accepts investments by new or existing investors in the Fund's Class B shares, except in connection with the reinvestment of any dividend and/or capital gain distributions in Class B shares of the Fund and exchanges by existing Class B shareholders of certain other funds within the Columbia Family of Funds.
Class C shares are subject to a 1.00% CDSC on shares redeemed within one year of purchase.
Class Z shares are not subject to sales charges, and are only available to certain investors, as described in the Fund's prospectus.
Note 2. Summary of Significant Accounting Policies
Use of Estimates
The preparation of financial statements in accordance with U.S. generally accepted accounting principles (GAAP) requires management to make certain estimates and assumptions that affect the reported amounts of assets and liabilities, the disclosure of contingent assets and liabilities at the date of the financial statements and the reported amounts of revenue and expenses during the reporting period. Actual results could differ from those estimates.
The following is a summary of significant accounting policies consistently followed by the Fund in the preparation of its financial statements.
Security Valuation
Debt securities generally are valued by pricing services approved by the Board of Trustees (the Board) based upon market transactions for normal, institutional-size trading units of similar securities. The services may use various pricing techniques which take into account appropriate factors such as yield, quality, coupon rate, maturity, type of issue, trading characteristics and other data, as well as broker quotes. Debt securities for which quotations are readily available may also be valued based upon an over-the-counter or exchange bid quotation.
Investments in other open-end investment companies, including money market funds, are valued at net asset value.
Short-term securities purchased within 60 days to maturity are valued at amortized cost, which approximates market value. The value of short-term securities originally purchased with maturities greater than 60 days is determined based on an amortized value to par upon reaching 60 days to maturity. Short-term securities maturing in more than 60 days from the valuation date are valued at the market price or approximate market value based on current interest rates.
Investments for which market quotations are not readily available, or that have quotations which management believes are not reliable, are valued at fair value as determined in good faith under consistently applied procedures established by and under the general supervision of the Board. If a security or class of securities (such as foreign securities) is valued at fair
20
Columbia Georgia Intermediate Municipal Bond Fund, April 30, 2012
value, such value is likely to be different from the last quoted market price for the security. The determination of fair value often requires significant judgment. To determine fair value, management may use assumptions including but not limited to future cash flows and estimated risk premiums. Multiple inputs from various sources may be used to determine value.
Security Transactions
Security transactions are accounted for on the trade date. Cost is determined and gains (losses) are based upon the specific identification method for both financial statement and federal income tax purposes.
Income Recognition
Interest income is recorded on the accrual basis. Market premium and discount are amortized and accreted, respectively, on all debt securities, unless otherwise noted. Original issue discount is accreted to interest income over the life of the security with a corresponding increase in the cost basis, if any.
Dividend income is recorded on the ex-dividend date.
Expenses
General expenses of the Trust are allocated to the Fund and other funds of the Trust based upon relative net assets or other expense allocation methodologies determined by the nature of the expense. Expenses directly attributable to the Fund are charged to the Fund. Expenses directly attributable to a specific class of shares are charged to that share class.
Determination of Class Net Asset Value
All income, expenses (other than class-specific expenses, which are charged to that share class, as shown in the Statement of Operations) and realized and unrealized gains (losses) are allocated to each class of the Fund on a daily basis for purposes of determining the net asset value of each class. Income and expenses are allocated to each class based on the settled shares method, while realized and unrealized gains (losses) are allocated based on the relative net assets of each class.
Federal Income Tax Status
The Fund intends to qualify each year as a regulated investment company under Subchapter M of the Internal Revenue Code, as amended, and will distribute substantially all of its tax exempt or taxable income (including net short-term capital gains), if any, for its tax year, and as such will not be subject to federal income taxes. In addition, the Fund intends to distribute in each calendar year substantially all of its net investment income, capital gains and certain other amounts, if any, such that the Fund should not be subject to federal excise tax. Therefore, no federal income or excise tax provision is recorded.
Distributions to Shareholders
Distributions from net investment income are declared daily and paid monthly. Net realized capital gains, if any, are distributed at least annually. Income distributions and capital gain distributions are determined in accordance with federal income tax regulations which may differ from GAAP.
Guarantees and Indemnifications
Under the Trust's organizational documents and, in some cases, by contract, its officers and trustees are indemnified against certain liabilities arising out of the performance of their duties to the Trust or its funds. In addition, certain of the Fund's contracts with its service providers contain general indemnification clauses. The Fund's maximum exposure under these arrangements is unknown since the amount of any future claims that may be made against the Fund cannot be determined, and the Fund has no historical basis for predicting the likelihood of any such claims.
Note 3. Fees and Compensation Paid to Affiliates
Investment Management Fees
Under an Investment Management Services Agreement, Columbia Management Investment Advisers, LLC (the Investment Manager), a wholly-owned subsidiary of Ameriprise Financial, Inc. (Ameriprise Financial), determines which securities will be purchased, held or sold. The management fee is an annual fee that is equal to a percentage of the Fund's average daily net assets that declines from 0.40% to 0.27% as the Fund's net assets increase. For the period April 1, 2012 to April 30, 2012 and the year ended March 31, 2012, the annualized effective management fee rate was 0.40% of the Fund's average daily net assets.
21
Columbia Georgia Intermediate Municipal Bond Fund, April 30, 2012
Administration Fees
Under an Administrative Services Agreement, the Investment Manager serves as the Fund Administrator. Effective July 1, 2011, the Fund pays the Fund Administrator an annual fee for administration and accounting services equal to a percentage of the Fund's average daily net assets that declines from 0.07% to 0.04% as the Fund's net assets increase. Prior to July 1, 2011, the administration fee was equal to the annual rate of 0.15% of the Fund's average daily net assets, less the fees that were payable by the Fund as described under the Pricing and Bookkeeping Fees note below.
For the period April 1, 2012 to April 30, 2012, the annualized effective administration fee rate was 0.07% of the Fund's average daily net assets. For the year ended March 31, 2012, the effective administration fee rate was 0.09% of the Fund's average daily net assets.
Pricing and Bookkeeping Fees
Prior to May 16, 2011, the Fund had entered into a Financial Reporting Services Agreement (the Financial Reporting Services Agreement) with State Street Bank and Trust Company (State Street) and the Investment Manager pursuant to which State Street provided financial reporting services to the Fund. The Fund also entered into an Accounting Services Agreement (collectively with the Financial Reporting Services Agreement, the State Street Agreements) with State Street and the Investment Manager pursuant to which State Street provided accounting services to the Fund. Under the State Street Agreements, the Fund paid State Street an annual fee of $38,000 paid monthly plus an additional monthly fee based on an annualized percentage rate of average daily net assets of the Fund for the month. The aggregate fee did not exceed $140,000 per year (exclusive of out-of-pocket expenses and charges). The Fund also reimbursed State Street for certain out-of-pocket expenses and charges. Effective May 16, 2011, these services are provided under the Administrative Services Agreement discussed above.
Other Fees
Effective June 1, 2011, other expenses are for, among other things, certain expenses of the Fund or the Board, including: Fund boardroom and office expense, employee compensation, employee health and retirement benefits, and certain other expenses. Payment of these Fund and Board expenses is facilitated by a company providing limited administrative services to the Fund and the Board.
For the period April 1, 2012 to April 30, 2012, and June 1, 2011 through March 31, 2012, other expenses paid to this company were $121 and $1,608, respectively.
Compensation of Board Members
Board members are compensated for their services to the Fund as disclosed in the Statement of Operations. Under a Deferred Compensation Plan (the Plan), the Board members who are not "interested persons" of the Fund, as defined under the 1940 Act, may elect to defer payment of up to 100% of their compensation. Deferred amounts are treated as though equivalent dollar amounts had been invested in shares of certain funds managed by the Investment Manager. The Fund's liability for these amounts is adjusted for market value changes and remains in the Fund until distributed in accordance with the Plan.
Compensation of Chief Compliance Officer
The Board has appointed a Chief Compliance Officer to the Fund in accordance with federal securities regulations. The Fund's expenses associated with the Chief Compliance Officer are paid directly by the Investment Manager.
Transfer Agent Fees
Under a Transfer and Dividend Disbursing Agent Agreement, Columbia Management Investment Services Corp. (the Transfer Agent), an affiliate of the Investment Manager and a wholly-owned subsidiary of Ameriprise Financial, is responsible for providing transfer agency services to the Fund. The Transfer Agent has contracted with Boston Financial Data Services (BFDS) to serve as sub-transfer agent.
The Transfer Agent receives monthly account-based service fees based on the number of open accounts and is reimbursed by the Fund for the fees and expenses the Transfer Agent pays to financial intermediaries that maintain omnibus accounts with the Fund that is a percentage of the average aggregate value of the Fund's shares maintained in each such omnibus account (other than omnibus accounts for which American Enterprise Investment Services Inc. is the broker of record or accounts where the beneficial shareholder is a customer of Ameriprise Financial Services, Inc., which are paid a per
22
Columbia Georgia Intermediate Municipal Bond Fund, April 30, 2012
account fee). The Transfer Agent pays the fees of BFDS for services as sub-transfer agent and is not entitled to reimbursement for such fees from the Fund (with the exception of out-of-pocket fees).
The Transfer Agent also receives compensation from fees for various shareholder services and reimbursements for certain out-of-pocket expenses.
For the period April 1, 2012 to April 30, 2012 and the year ended March 31, 2012, the Fund's annualized effective transfer agent fee rates as a percentage of average daily net assets of each class were as follows:
| | | Period ended
April 30,
2012 | | Year ended
March 31,
2012 | |
| Class A | | | 0.17 | % | | | 0.19 | % | |
| Class B | | | 0.17 | | | | 0.19 | | |
| Class C | | | 0.17 | | | | 0.18 | | |
| Class Z | | | 0.17 | | | | 0.18 | | |
An annual minimum account balance fee of $20 may apply to certain accounts with a value below the Fund's initial minimum investment requirements to reduce the impact of small accounts on transfer agent fees. These minimum account balance fees are recorded as part of expense reductions in the Statement of Operations. For the period April 1, 2012 to April 30, 2012, no minimum account balance fees were charged to accounts. For the year ended March 31, 2012, these minimum account balance fees reduced total expenses by $20.
Distribution and Service Fees
The Fund has an agreement with Columbia Management Investment Distributors, Inc. (the Distributor), an affiliate of the Investment Manager and a wholly-owned subsidiary of Ameriprise Financial, for distribution and shareholder services. Pursuant to Rule 12b-1 under the 1940 Act, the Board has approved, and the Fund has adopted, distribution and shareholder service plans (the Plans) which set the distribution and service fees for the Fund. These fees are calculated daily and are intended to compensate the Distributor and/or eligible selling and/or servicing agents for selling shares of the Fund and providing services to investors.
The Plans require the payment of a monthly combined distribution and service fee to the Distributor at the maximum annual rate of 0.25% of the average daily net assets attributable to Class A shares of the Fund. The Plans also require the payment of a monthly service fee at the maximum annual rate of 0.25% of the average daily net assets attributable to Class B and Class C shares of the Fund and the payment of a monthly distribution fee at the maximum annual rate of 0.75% of the average daily net assets attributable to Class B and Class C shares of the Fund.
Sales Charges
Sales charges, including front-end charges and CDSCs, received by the Distributor for distributing Fund shares were $901 for Class A, for the period April 1, 2012 to April 30, 2012, and $15,958 for Class A, $630 for Class B and $181 for Class C for the year ended March 31, 2012.
Expenses Waived/Reimbursed by the Investment Manager and its Affiliates
Effective August 1, 2011, the Investment Manager and certain of its affiliates have contractually agreed to waive fees and/or reimburse expenses (excluding certain fees and expenses described below), through July 31, 2012, unless sooner terminated at the sole discretion of the Board, so that the Fund's net operating expenses, after giving effect to fees waived/expenses reimbursed and any balance credits and/or overdraft charges from the Fund's custodian, do not exceed the following annual rates as a percentage of the class' average daily net assets:
| Class A | | | 0.80 | % | |
| Class B | | | 1.55 | | |
| Class C | | | 1.55 | | |
| Class Z | | | 0.55 | | |
Under the agreement, the following fees and expenses are excluded from the waiver/reimbursement commitment, and therefore will be paid by the Fund, if applicable: taxes (including foreign transaction taxes), expenses associated with investments in affiliated and non-affiliated pooled investment vehicles (including mutual funds and exchange traded funds), transaction costs and brokerage commissions, costs related to any securities lending program, dividend
23
Columbia Georgia Intermediate Municipal Bond Fund, April 30, 2012
expenses associated with securities sold short, inverse floater program fees and expenses, transaction charges and interest on borrowed money, interest, extraordinary expenses and any other expenses the exclusion of which is specifically approved by the Board. This agreement may be modified or amended only with approval from all parties.
Prior to August 1, 2011, the Investment Manager voluntarily agreed to reimburse a portion of the Fund's expenses (excluding certain expenses, such as distribution and services fees, brokerage commissions, interest, taxes and extraordinary expenses, but including custodian charges relating to overdrafts, if any) so that the Fund's ordinary net operating expenses, after giving effect to fees waived/expenses reimbursed and any balance credits and/or overdraft charges from the Fund's custodian, did not exceed 0.55% of the Fund's average daily net assets on an annualized basis.
Prior to May 1, 2011, the Investment Manager was entitled to recover from the Fund any fees waived and/or expenses reimbursed for a three year period following the date of such fee waiver and/or reimbursement under these arrangements if such recovery did not cause the Fund's expenses to exceed the expense limitations in effect at the time of recovery. Effective May 1, 2011, the Investment Manager has eliminated such fee recoupment provisions.
Note 4. Federal Tax Information
The timing and character of income and capital gain distributions are determined in accordance with income tax regulations, which may differ from GAAP because of temporary or permanent book to tax differences.
For the period April 1, 2012 to April 30, 2012, these differences are primarily due to differing treatment for Trustees' deferred compensation and distributions. For the year ended March 31, 2012, these differences are primarily due to differing treatment for Trustees' deferred compensation and distributions. To the extent these differences are permanent, reclassifications are made among the components of the Fund's net assets in the Statement of Assets and Liabilities. Temporary differences do not require reclassifications. In the Statement of Assets and Liabilities the following reclassifications were made:
| | | Period ended
April 30,
2012 | | Year ended
March 31,
2012 | |
Undistributed
net investment income | | $ | — | | | $ | (4 | ) | |
Accumulated net realized
loss | | | — | | | | 4 | | |
| Paid-in capital | | | — | | | | — | | |
Net investment income and net realized gains (losses), as disclosed in the Statement of Operations, and net assets were not affected by this reclassification.
The tax character of distributions paid during the periods indicated was as follows:
| | | Period ended
April 30,
2012 | | Year ended
March 31,
2012 | | Year ended
March 31,
2011 | |
| Ordinary income | | $ | — | | | $ | 125 | | | $ | 3,993 | | |
Tax-exempt
income | | | 261,650 | | | | 3,232,698 | | | | 4,030,378 | | |
Short-term capital gain distributions, if any, are considered ordinary income distributions for tax purposes.
At April 30, 2012 and March 31, 2012, the components of distributable earnings on a tax basis were as follows:
| | | April 30,
2012 | | March 31,
2012 | |
| Undistributed ordinary income | | $ | — | | | $ | — | | |
Undistributed tax-exempt
income | | | 500,777 | | | | 501,333 | | |
| Unrealized appreciation | | | 8,304,258 | | | | 7,491,629 | | |
At April 30, 2012 and March 31, 2012, the cost of investments for federal income tax purposes, and the
24
Columbia Georgia Intermediate Municipal Bond Fund, April 30, 2012
aggregate unrealized appreciation and depreciation based on that cost was as follows:
| | | April 30,
2012 | | March 31,
2012 | |
Aggregate unrealized
appreciation | | $ | 8,308,315 | | | $ | 7,581,964 | | |
Aggregate unrealized
depreciation | | | (4,057 | ) | | | (90,335 | ) | |
Net unrealized appreciation/
depreciation | | | 8,304,258 | | | | 7,491,629 | | |
Cost of investments for
tax purposes | | | 94,765,891 | | | | 96,182,261 | | |
The following capital loss carryforward, determined at April 30, 2012 and March 31, 2012, may be available to reduce taxable income arising from future net realized gains on investments, if any, to the extent permitted by the Internal Revenue Code:
| | | April 30,
2012 | | March 31,
2012 | |
| Year of Expiration | | Amount | | Amount | |
| 2017 | | $ | 15,158 | | | $ | — | | |
| 2018 | | | — | | | | 16,486 | | |
| Total | | $ | 15,158 | | | $ | 16,486 | | |
On December 22, 2010, the Regulated Investment Company Modernization Act of 2010 (the Act) was enacted, which changed various technical rules governing the tax treatment of regulated investment companies. The changes are generally effective for taxable years beginning after the date of enactment. Under the Act, the Fund will be permitted to carry forward capital losses incurred in taxable years beginning after the date of enactment for an unlimited period. However, any losses incurred during those future taxable years will be required to be utilized prior to the losses incurred in pre-enactment taxable years, which carry an expiration date. As a result of this ordering rule, pre-enactment capital loss carryforwards may be more likely to expire unused.
For the period April 1, 2012 to April 30, 2012, $1,328 of capital loss carryforward was utilized. For the year ended March 31, 2012, $89,867 of capital loss carryforward was utilized.
Management of the Fund has concluded that there are no significant uncertain tax positions that would require recognition in the financial statements. However, management's conclusion may be subject to review and adjustment at a later date based on factors including, but not limited to, new tax laws, regulations, and administrative interpretations (including relevant court decisions). Generally, the Fund's federal tax returns for the prior three fiscal years remain subject to examination by the Internal Revenue Service.
Note 5. Portfolio Information
For the period April 1, 2012 to April 30, 2012, the cost of purchases and proceeds from sales of securities, excluding short-term obligations, aggregated to $0 and $781,195, respectively.
For the year ended March 31, 2012, the cost of purchases and proceeds from sales of securities, excluding short-term obligations, aggregated to $10,899,874 and $19,323,593, respectively.
Note 6. Lending of Portfolio Securities
Effective May 16, 2011, the Fund has entered into a Master Securities Lending Agreement (the Agreement) with JPMorgan Chase Bank, N.A. (JPMorgan). The Agreement, which replaces the previous securities lending arrangement with State Street, authorizes JPMorgan as lending agent to lend securities to authorized borrowers in order to generate additional income on behalf of the Fund. Pursuant to the Agreement, the securities loaned are secured by cash or U.S. government securities equal to at least 100% of the market value of the loaned securities. Any additional collateral required to maintain those levels due to market fluctuations of the loaned securities is requested to be delivered the following business day. Cash collateral received is invested by the lending agent on behalf of the Fund into authorized investments pursuant to the Agreement. The investments made with the cash collateral are listed in the Portfolio of Investments. The values of such investments and any uninvested cash collateral are disclosed in the Statement of Assets and Liabilities along with the related obligation to return the collateral upon the return of the securities loaned.
Risks of delay in recovery of securities or even loss of rights in the securities may occur should the borrower of the securities fail financially. Risks may also arise to the extent
25
Columbia Georgia Intermediate Municipal Bond Fund, April 30, 2012
that the value of the securities loaned increases above the value of the collateral received. JPMorgan will indemnify the Fund from losses resulting from a borrower's failure to return a loaned security when due. Such indemnification does not extend to losses associated with declines in the value of cash collateral investments. The Investment Manager is not responsible for any losses incurred by the Fund in connection with the securities lending program. Loans are subject to termination by the Fund or the borrower at any time, and are, therefore, not considered to be illiquid investments.
Pursuant to the Agreement, the Fund receives income for lending its securities either in the form of fees or by earning interest on invested cash collateral, net of negotiated rebates paid to borrowers and fees paid to the lending agent for services provided and any other securities lending expenses. The Fund continues to earn and accrue interest and dividends on the securities loaned.
Prior to May 16, 2011, the Fund participated in a securities lending arrangement with State Street. Each security on loan was collateralized in an amount at least equal to the market value of the securities loaned plus accrued income from the investment of collateral. The income generated by the investment of the collateral, net of any fees remitted to State Street as the lending agent and borrower rebates, was paid to the Fund.
For the period ended April 30, 2012 and the year ended March 31, 2012, the Fund did not participate in securities lending activity.
Note 7. Custody Credits
Prior to May 16, 2011, the Fund had an agreement with its custodian bank under which custody fees may have been reduced by balance credits. These credits are recorded as part of expense reductions on the Statement of Operations. The Fund could have invested a portion of the assets utilized in connection with the expense offset arrangement in an income-producing asset if they had not entered into such an agreement. For the period April 1, 2011 through May 16, 2011, there were no expense reductions.
Note 8. Shareholder Concentration
At April 30, 2012 and March 31, 2012, one unaffiliated shareholder account owned 78.9% and 79.1% of the outstanding shares of the Fund, respectively. The Fund has no knowledge about whether any portion of those shares was owned beneficially by such accounts. Subscription and redemption activity by concentrated accounts may have a significant effect on the operations of the Fund.
Note 9. Line of Credit
The Fund has entered into a revolving credit facility with a syndicate of banks led by JPMorgan, whereby the Fund may borrow for the temporary funding of shareholder redemptions or for other temporary or emergency purposes. The credit facility became effective on May 16, 2011, replacing a prior credit facility. The credit facility agreement, which is a collective agreement between the Fund and certain other funds managed by the Investment Manager, severally and not jointly, permits collective borrowings up to $500 million.
Interest is charged to each participating fund based on its borrowings at a rate equal to the sum of the federal funds rate plus (i) 1.25% per annum plus (ii) if one-month LIBOR exceeds the federal funds rate, the amount of such excess. Each borrowing under the credit facility matures no later than 60 days after the date of borrowing. The Fund also pays a commitment fee equal to its pro rata share of the amount of the credit facility at a rate of 0.10% per annum.
Prior to May 16, 2011, the Fund and certain other funds managed by the Investment Manager participated in a $225 million committed, unsecured revolving credit facility provided by State Street. Interest was charged to each fund based on its borrowings at a rate equal to the greater of the (i) federal funds rate plus 1.25% per annum or (ii) the overnight LIBOR rate plus 1.25% per annum. The Fund also paid a commitment fee equal to its pro rata share of the amount of the credit facility at a rate of 0.125% per annum. The Fund had no borrowings during the period ended April 30, 2012 and the year ended March 31, 2012.
Note 10. Significant Risks
Geographic Concentration Risk
Because state-specific tax-exempt funds invest primarily in the municipal securities issued by the state and political sub-divisions of the state, the Fund will be particularly affected by political and economic conditions and developments in the state in which it invests. The Fund may,
26
Columbia Georgia Intermediate Municipal Bond Fund, April 30, 2012
therefore, have a greater risk than that of a municipal bond fund which is more geographically diversified. The value of the municipal securities owned by the Fund also may be adversely affected by future changes in federal or state income tax laws.
Note 11. Subsequent Events
Management has evaluated the events and transactions that have occurred through the date the financial statements were issued and noted no items requiring adjustment of the financial statements or additional disclosure.
Note 12. Information Regarding Pending and Settled Legal Proceedings
In December 2005, without admitting or denying the allegations, American Express Financial Corporation (AEFC, which is now known as Ameriprise Financial, Inc. (Ameriprise Financial)) entered into settlement agreements with the Securities and Exchange Commission (SEC) and Minnesota Department of Commerce (MDOC) related to market timing activities. As a result, AEFC was censured and ordered to cease and desist from committing or causing any violations of certain provisions of the Investment Advisers Act of 1940, the Investment Company Act of 1940, and various Minnesota laws. AEFC agreed to pay disgorgement of $10 million and civil money penalties of $7 million. AEFC also agreed to retain an independent distribution consultant to assist in developing a plan for distribution of all disgorgement and civil penalties ordered by the SEC in accordance with various undertakings detailed at www.sec.gov/litigation/admin/ia-2451.pdf. Ameriprise Financial and its affiliates have cooperated with the SEC and the MDOC in these legal proceedings, and have made regular reports to the funds' Boards of Trustees.
Ameriprise Financial and certain of its affiliates have historically been involved in a number of legal, arbitration and regulatory proceedings, including routine litigation, class actions, and governmental actions, concerning matters arising in connection with the conduct of their business activities. Ameriprise Financial believes that the Funds are not currently the subject of, and that neither Ameriprise Financial nor any of its affiliates are the subject of, any pending legal, arbitration or regulatory proceedings that are likely to have a material adverse effect on the Funds or the ability of Ameriprise Financial or its affiliates to perform under their contracts with the Funds. Ameriprise Financial is required to make 10-Q, 10-K and, as necessary, 8-K filings with the Securities and Exchange Commission on legal and regulatory matters that relate to Ameriprise Financial and its affiliates. Copies of these filings may be obtained by accessing the SEC website at www.sec.gov.
There can be no assurance that these matters, or the adverse publicity associated with them, will not result in increased fund redemptions, reduced sale of fund shares or other adverse consequences to the Funds. Further, although we believe proceedings are not likely to have a material adverse effect on the Funds or the ability of Ameriprise Financial or its affiliates to perform under their contracts with the Funds, these proceedings are subject to uncertainties and, as such, we are unable to estimate the possible loss or range of loss that may result. An adverse outcome in one or more of these proceedings could result in adverse judgments, settlements, fines, penalties or other relief that could have a material adverse effect on the consolidated financial condition or results of operations of Ameriprise Financial.
27
Report of Independent Registered Public Accounting Firm
To the Trustees of Columbia Funds Series Trust and the Shareholders of Columbia Georgia Intermediate Municipal Bond Fund
In our opinion, the accompanying statement of assets and liabilities, including the portfolio of investments, and the related statements of operations and of changes in net assets and the financial highlights present fairly, in all material respects, the financial position of Georgia Intermediate Municipal Bond Fund (the "Fund") (a series of Columbia Funds Series Trust) at April 30, 2012 and at March 31, 2012, the results of its operations, the changes in its net assets and the financial highlights for each of the periods indicated, in conformity with accounting principles generally accepted in the United States of America. These financial statements and financial highlights (hereafter referred to as "financial statements") are the responsibility of the Fund's management. Our responsibility is to express an opinion on these financial statements based on our audits. We conducted our audits of these financial statements in accordance with the standards of the Public Company Accounting Oversight Board (United States). Those standards require that we plan and perform the audit to obtain reasonable assurance about whether the financial statements are free of material misstatement. An audit includes examining, on a test basis, evidence supporting the amounts and disclosures in the financial statements, assessing the accounting principles used and significant estimates made by management, and evaluating the overall financial statement presentation. We believe that our audits, which included confirmation of securities at April 30, 2012 and at March 31, 2012 by correspondence with the custodian, transfer agent and brokers, provide a reasonable basis for our opinion.
PricewaterhouseCoopers LLP
Minneapolis, Minnesota
June 8, 2012
28
Federal Income Tax Information (Unaudited) – Columbia Georgia Intermediate Municipal Bond Fund
For the fiscal period ended April 30, 2012 and the fiscal year ended March 31, 2012, 100.00% and 100.00%, respectively, of the distributions from net investment income of the Fund qualify as exempt interest dividends for federal income tax purposes. A portion of the income may be subject to federal alternative minimum tax.
The Fund will notify shareholders in January 2013 of amounts for use in preparing 2012 income tax returns.
29
Fund Governance
Shareholders elect the Board that oversees the funds' operations. The Board appoints officers who are responsible for day-to-day business decisions based on policies set by the Board. The following table provides basic biographical information about the funds' Board members, including their principal occupations during the past five years, although specific titles for individuals may have varied over the period. Under current Board policy, members may serve until the next Board meeting after he or she reaches the mandatory retirement age established by the Board, or the fifteenth anniversary of the first Board meeting they attended as a member of the Board.
On September 29, 2009, Ameriprise Financial, the parent company of Columbia Management, entered into an agreement with Bank of America, N.A. ("Bank of America") to acquire a portion of the asset management business of Columbia Management Group, LLC and certain of its affiliated companies (the "Transaction"). Following the Transaction, which became effective on May 1, 2010, various alignment activities have occurred with respect to the Fund Family. In connection with the Transaction, Mr. Edward J. Boudreau, Jr., Mr. William P. Carmichael, Mr. William A. Hawkins, Mr. R. Glenn Hilliard, Mr. John J. Nagorniak, Ms. Minor M. Shaw and Dr. Anthony M. Santomero, who were members prior to the Transaction of the Legacy Columbia Nations funds' Board ("Nations Funds"), which includes Columbia Funds Series Trust, Columbia Funds Variable Insurance Trust I and Columbia Funds Master Investment Trust, LLC., began service on the Board for the Legacy RiverSource funds ("RiverSource Funds") effective June 1, 2011, which resulted in an overall increase from twelve Trustees to sixteen for all mutual funds overseen by the Board.
Independent Board Members
| Name, Address, Age | | Position Held
with Funds
and Length
of Service | | Principal Occupation During Past Five Years | | Number of
Funds in the
Fund Family
Overseen by
Board Member | | Other Present or
Past Directorships/
Trusteeships
(Within Past 5 Years) | |
| Kathleen Blatz | | | | | | | | | |
|
901 S. Marquette Ave.
Minneapolis, MN 55402
Age 57 | | Board member since 1/06 for RiverSource Funds and since 6/11 for Nations Funds | | Attorney; Chief Justice, Minnesota Supreme Court, 1998-2006 | | | 156 | | | None | |
|
| Edward J. Boudreau, Jr. | | | | | | | | | |
|
225 Franklin Street
Mail Drop
BX32 05228
Boston, MA 02110
Age 67 | | Board member since 6/11 for RiverSource Funds and since 1/05 for Nations Funds | | Managing Director, E.J. Boudreau & Associates (consulting) since 2000 | | | 149 | | | Former Trustee, BofA Funds Series Trust (11 funds) | |
|
| Pamela G. Carlton | | | | | | | | | |
|
901 S. Marquette Ave.
Minneapolis, MN 55402
Age 57 | | Board member since 7/07 for RiverSource Funds and since 6/11 for Nations Funds | | President, Springboard-Partners in Cross Cultural Leadership (consulting company) | | | 156 | | | None | |
|
30
Fund Governance (continued)
Independent Board Members (continued)
| Name, Address, Age | | Position Held
with Funds
and Length
of Service | | Principal Occupation During Past Five Years | | Number of
Funds in the
Fund Family
Overseen by
Board Member | | Other Present or
Past Directorships/
Trusteeships
(Within Past 5 Years) | |
| William P. Carmichael | | | | | | | | | |
|
225 Franklin Street
Mail Drop
BX32 05228
Boston, MA 02110
Age 68 | | Board member since 6/11 for RiverSource Funds and since 1999 for Nations Funds | | Retired | | | 149 | | | Director, Cobra Electronics Corporation (electronic equipment manufacturer); The Finish Line (athletic shoes and apparel); McMoRan Exploration Company (oil and gas exploration and development); former Trustee, BofA Funds Series Trust (11 funds); former Director, Spectrum Brands, Inc. (consumer products); former Director, Simmons Company (bedding) | |
|
| Patricia M. Flynn | | | | | | | | | |
|
901 S. Marquette Ave.
Minneapolis, MN 55402
Age 61 | | Board member since 11/04 for RiverSource Funds and since 6/11 for Nations Funds | | Trustee Professor of Economics and Management, Bentley University; former Dean, McCallum Graduate School of Business, Bentley University | | | 156 | | | None | |
|
| William A. Hawkins | | | | | | | | | |
|
225 Franklin Street
Mail Drop
BX32 05228
Boston, MA 02110
Age 69 | | Board member since 6/11 for RiverSource Funds and since 1/05 for Nations Funds | | Managing Director, Overton Partners (financial consulting), since August 2010; President and Chief Executive Officer, California General Bank, N.A., January 2008-August 2010 | | | 149 | | | Trustee, BofA Funds Series Trust (11 funds) | |
|
| R. Glenn Hilliard | | | | | | | | | |
|
225 Franklin Street
Mail Drop
BX32 05228
Boston, MA 02110
Age 69 | | Board member since 6/11 for RiverSource Funds and since 1/05 for Nations Funds | | Chairman and Chief Executive Officer, Hilliard Group LLC (investing and consulting), since April 2003; Non-Executive Director & Chairman, CNO Financial Group, Inc. (formerly Conseco, Inc.) (insurance), September 2003-May 2011 | | | 149 | | | Chairman, BofA Fund Series Trust (11 funds); former Director, CNO Financial Group, Inc. (insurance) | |
|
31
Fund Governance (continued)
Independent Board Members (continued)
| Name, Address, Age | | Position Held
with Funds
and Length
of Service | | Principal Occupation During Past Five Years | | Number of
Funds in the
Fund Family
Overseen by
Board Member | | Other Present or
Past Directorships/
Trusteeships
(Within Past 5 Years) | |
| Stephen R. Lewis, Jr. | | | | | | | | | |
|
901 S. Marquette Ave.
Minneapolis, MN 55402
Age 73 | | Chair of the Board for RiverSource Funds since 1/07, Board member for RiverSource Funds since 1/02 and since 6/11 for Nations Funds | | President Emeritus and Professor of Economics Emeritus, Carleton College | | | 156 | | | Director, Valmont Industries, Inc. (manufactures irrigation systems) | |
|
| John F. Maher | | | | | | | | | |
|
901 S. Marquette Ave.
Minneapolis, MN 55402
Age 69 | | Board member since 12/06 for Legacy Seligman funds, since 12/08 for RiverSource Funds and since 6/11 for Nations Funds | | Retired President and Chief Executive Officer and former Director, Great Western Financial Corporation (financial services), 1986-1997 | | | 156 | | | None | |
|
| John J. Nagorniak | | | | | | | | | |
|
225 Franklin Street
Mail Drop
BX32 05228
Boston, MA 02110
Age 67 | | Board member since 6/11 for RiverSource Funds and since 1/08 for Nations Funds | | Retired; President and Director, Foxstone Financial, Inc. (consulting), 2000-2007; Director, Mellon Financial Corporation affiliates (investing), 2000-2007; Chairman, Franklin Portfolio Associates (investing—Mellon affiliate), 1982-2007 | | | 149 | | | Trustee, Research Foundation of CFA Institute; Director, MIT Investment Company; Trustee, MIT 401k Plan; former Trustee, BofA Funds Series Trust (11 funds) | |
|
| Catherine James Paglia | | | | | | | | | |
|
901 S. Marquette Ave.
Minneapolis, MN 55402
Age 59 | | Board member since 11/04 for RiverSource Funds and since 6/11 for Nations Funds | | Director, Enterprise Asset Management, Inc. (private real estate and asset management company) | | | 156 | | | None | |
|
32
Fund Governance (continued)
Independent Board Members (continued)
| Name, Address, Age | | Position Held
with Funds
and Length
of Service | | Principal Occupation During Past Five Years | | Number of
Funds in the
Fund Family
Overseen by
Board Member | | Other Present or
Past Directorships/
Trusteeships
(Within Past 5 Years) | |
| Leroy C. Richie | | | | | | | | | |
|
901 S. Marquette Ave.
Minneapolis, MN 55402
Age 70 | | Board member since 2000 for Legacy Seligman funds, since 11/08 for RiverSource Funds and since 6/11 for Nations Funds | | Counsel, Lewis & Munday, P.C. since 2004; former Vice President and General Counsel, Automotive Legal Affairs, Chrysler Corporation | | | 156 | | | Director, Digital Ally, Inc. (digital imaging); Director, Infinity, Inc. (oil and gas exploration and production); Director, OGE Energy Corp. (energy and energy services) | |
|
| Minor M. Shaw | | | | | | | | | |
|
225 Franklin Street
Mail Drop
BX32 05228
Boston, MA 02110
Age 64 | | Board member since 6/11 for RiverSource Funds and since 2003 for Nations Funds | | President—Micco LLC (private investments) | | | 149 | | | Former Trustee, BofA Funds Series Trust (11 funds); Board Member, Piedmont Natural Gas; Director, Blue Cross Blue Shield of South Carolina | |
|
| Alison Taunton-Rigby | | | | | | | | | |
|
901 S. Marquette Ave.
Minneapolis, MN 55402
Age 68 | | Board member since 11/02 for RiverSource Funds and since 6/11 for Nations Funds | | Chief Executive Officer and Director, RiboNovix, Inc. 2003-2010 (biotechnology); former President, Aquila Biopharmaceuticals | | | 156 | | | Director, Healthways, Inc. (health management programs); Director, ICI Mutual Insurance Company, RRG; Director, Abt Associates (government contractor) | |
|
33
Fund Governance (continued)
Interested Board Member Not Affiliated with Investment Manager*
| Name, Address, Age | | Position Held
with Funds
and Length
of Service | | Principal Occupation During Past Five Years | | Number of
Funds in the
Fund Family
Overseen by
Board Member | | Other Present or
Past Directorships/
Trusteeships
(Within Past 5 Years) | |
| Anthony M. Santomero* | | | | | | | | | |
|
225 Franklin Street
Mail Drop
BX32 05228
Boston, MA 02110
Age 65 | | Board member since 6/11 for RiverSource Funds and since 1/08 for Nations Funds | | Richard K. Mellon Professor Emeritus of Finance, The Wharton School, University of Pennsylvania, since 2002; Senior Advisor, McKinsey & Company (consulting), 2006-2008; President and Chief Executive Officer, Federal Reserve Bank of Philadelphia, 2000-2006 | | | 149 | | | Director, Renaissance Reinsurance Ltd.; Trustee, Penn Mutual Life Insurance Company; Director, Citigroup; Director, Citibank, N.A.; former Trustee, BofA Funds Series Trust (11 funds) | |
|
* Dr. Santomero is not an affiliated person of the Investment Manager or Ameriprise Financial. However, he is currently deemed by the funds to be an "interested person" (as defined in the 1940 Act) of the Funds because he serves as a Director of Citigroup, Inc. and Citibank N.A., companies that may directly or through subsidiaries and affiliates engage from time-to-time in brokerage execution, principal transactions and lending relationships with the funds or accounts advised/managed by the Investment Manager.
Interested Board Member Affiliated with Investment Manager*
| William F. Truscott | | | | | | | | | |
|
53600 Ameriprise Financial Center
Minneapolis, MN 55474
Age 51 | | Board member since 11/01 for RiverSource Funds and since 6/11 for Nations Funds; Senior Vice President since 2002 for RiverSource Funds and 5/10 for Nations Funds | | Chairman of the Board and President, Columbia Management Investment Advisers, LLC since May 2010 and February 2012, respectively (previously President, Chairman of the Board and Chief Investment Officer, 2001-April 2010); Chief Executive Officer, U.S. Asset Management & President, Annuities, Ameriprise Financial, Inc. since May 2010 (previously President—U.S. Asset Management and Chief Investment Officer, 2005-April 2010); Director, President and Chief Executive Officer, Ameriprise Certificate Company since 2006; Director and Chief Executive Officer, Columbia Management Investment Distributors, Inc. since May 2010 and February 2012, respectively (previously Chairman of the Board and Chief Executive Officer, 2006-April 2010); Chairman of the Board and Chief Executive Officer, RiverSource Distributors, Inc. since 2006. | | | 156 | | | Trustee, Columbia Funds Series Trust I and Columbia Funds Variable Insurance Trust | |
|
* Interested person (as defined under the 1940 Act) by reason of being an officer, director, security holder and/or employee of the Investment Manager or Ameriprise Financial.
The SAI has additional information about the Fund's Board members and is available, without charge, upon request by calling 800.345.6611; contacting your financial intermediary; or visiting columbiamanagement.com.
34
Fund Governance (continued)
Officers
| Name, Year of Birth and Address | | Principal Occupation(s) During the Past Five Years | |
| J. Kevin Connaughton (Born 1964) | |
|
225 Franklin Street
Boston, MA 02110
President (since 2009) | | Senior Vice President and General Manager—Mutual Fund Products, Columbia Management Investment Advisers, LLC since May 2010; President, Columbia Funds, since 2009, and RiverSource Funds, since May 2010 (previously Senior Vice President and Chief Financial Officer, Columbia Funds, from June 2008 to January 2009, Treasurer, Columbia Funds, from October 2003 to May 2008, and senior officer of various other affiliated funds since 2000); Managing Director, Columbia Management Advisors, LLC from December 2004 to April 2010. | |
|
| Michael G. Clarke (Born 1969) | |
|
225 Franklin Street
Boston, MA 02110
Treasurer (since 2011) and Chief Financial Officer (since 2009) | | Vice President, Columbia Management Investment Advisers, LLC since May 2010; Managing Director of Fund Administration, Columbia Management Advisors, LLC, from September 2004 to April 2010; senior officer of Columbia Funds and affiliated funds since 2002. | |
|
| Scott R. Plummer (Born 1959) | |
|
5228 Ameriprise Financial Center
Minneapolis, MN 55474
Senior Vice President and Chief Legal Officer (since 2010) | | Chief Legal Officer and Assistant Secretary, Columbia Management Investment Advisers, LLC since June 2005; Vice President and Lead Chief Counsel—Asset Management, Ameriprise Financial, Inc. since May 2010 (previously Vice President and Chief Counsel—Asset Management, from 2005 to April 2010, Vice President, Chief Counsel and Assistant Secretary, Columbia Management Investment Distributors, Inc. since 2008; Vice President, General Counsel and Secretary, Ameriprise Certificate Company since 2005; Chief Counsel, RiverSource Distributors, Inc. since 2006; Senior officer of Columbia Funds and affiliated funds, since 2006. | |
|
| Thomas P. McGuire (Born 1972) | |
|
225 Franklin Street
Boston, MA 02110
Chief Compliance Officer (since 2012) | | Vice President—Asset Management Compliance, Columbia Management Investment Advisers, LLC since March 2010; Chief Compliance Officer, Ameriprise Certificate Company, since September 2010; Compliance Executive, Bank of America, from June 2005 to April 2010. | |
|
| William F. Truscott (Born 1960) | |
|
53600 Ameriprise Financial Center
Minneapolis, MN 55474
Senior Vice President (since 2010) | | Chairman of the Board and President, Columbia Management Investment Advisers, LLC since May 2010 and February 2012, respectively (previously President, Chairman of the Board and Chief Investment Officer, from 2001 to April 2010); Chief Executive Officer, U.S. Asset Management & President, Annuities, Ameriprise Financial, Inc. since May 2010 (previously President—U.S. Asset Management and Chief Investment Officer from 2005 to April 2010; Director, President and Chief Executive Officer, Ameriprise Certificate Company since 2006; Director and Chief Executive Officer, Columbia Management Investment Distributors, Inc. since May 2010 and February 2012, respectively (previously Chairman of the Board and Chief Executive Officer from 2008 to April 2010); Chairman of the Board and Chief Executive Officer, RiverSource Distributors, Inc. since 2006. | |
|
| Paul D. Pearson (Born 1956) | |
|
10468 Ameriprise Financial Center
Minneapolis, MN 55474
Vice President and Assistant Treasurer
(since 2011) | | Vice President—Investment Accounting, Columbia Management Investment Advisers, LLC, since May 2010; Vice President—Managed Assets, Investment Accounting, Ameriprise Financial Corporation, 1998-2010 | |
|
35
Fund Governance (continued)
Officers (continued)
| Name, Year of Birth and Address | | Principal Occupation(s) During the Past Five Years | |
| Colin Moore (Born 1958) | |
|
225 Franklin Street
Boston, MA 02110
Senior Vice President (since 2010) | | Director and Chief Investment Officer, Columbia Management Investment Advisers, LLC since May 2010; Manager, Managing Director and Chief Investment Officer of Columbia Management Advisors, LLC from 2007 to April 2010; Head of Equities, Columbia Management Advisors, LLC from 2002 to 2007. | |
|
| Christopher O. Petersen (Born 1970) | |
|
5228 Ameriprise Financial Center
Minneapolis, MN 55474
Vice President and Secretary (since 2011) | | Vice President and Chief Counsel, Ameriprise Financial since January 2010 (formerly Vice President and Group Counsel or Counsel from April 2004 to January 2010); Senior officer of Columbia Funds and affiliated funds, since 2007. | |
|
| Amy K. Johnson (Born 1965) | |
|
5228 Ameriprise Financial Center
Minneapolis, MN 55474
Vice President (since 2010) | | Senior Vice President and Chief Operating Officer, Columbia Management Investment Advisers, LLC since May 2010 (previously Chief Administrative Officer, from 2009 until April 2010, Vice President—Asset Management and Trust Company Services, from 2006 to 2009, and Vice President—Operations and Compliance from 2004 to 2006). | |
|
| Joseph F. DiMaria (Born 1968) | |
|
225 Franklin Street
Boston, MA 02110
Vice President (since 2011) and Chief Accounting Officer (since 2008) | | Vice President, Mutual Fund Administration, Columbia Management Investment Advisers, LLC, since May 2010; Director of Fund Administration, Columbia Management Advisors, LLC from January 2006 to April 2010. | |
|
| Paul B. Goucher (Born 1968) | |
|
100 Park Avenue
New York, NY 10017
Vice President and Assistant Secretary (since 2010) | | Vice President and Chief Counsel of Ameriprise Financial since January 2010 (formerly Vice President and Group Counsel from November 2008 to January 2010); Director, Managing Director and General Counsel of J. & W. Seligman & Co. Incorporated (Seligman) from July 2008 to November 2008 and Managing Director and Associate General Counsel of Seligman from January 2005 to July 2008. | |
|
| Michael E. DeFao (Born 1968) | |
|
225 Franklin Street
Boston, MA 02110
Vice President and Assistant Treasurer (since 2011) | | Vice President and Chief Counsel, Ameriprise Financial since May 2010; Associate General Counsel, Bank of America from June 2005 to April 2010. | |
|
| Stephen T. Welsh (Born 1957) | |
|
225 Franklin Street
Boston, MA 02110
Vice President (since 2006) | | President and Director, Columbia Management Investment Services Corp. since May 2010; President and Director, Columbia Management Services, Inc. from July 2004 to April 2010; Managing Director, Columbia Management Distributors, Inc. from August 2007 to April 2010. | |
|
36
Approval of Investment Management Services Agreement
Columbia Management Investment Advisers, LLC ("Columbia Management" or the "investment manager"), a wholly-owned subsidiary of Ameriprise Financial, Inc. ("Ameriprise Financial"), serves as the investment manager to Columbia Georgia Intermediate Municipal Bond Fund (the "Fund"). Under an investment management services agreement (the "IMS Agreement"), Columbia Management provides investment advice and other services to the Fund and all funds distributed by Columbia Management Investment Distributors, Inc. (collectively, the "Funds").
On an annual basis, the Fund's Board of Trustees (the "Board"), including the independent Board members (the "Independent Directors"), considers renewal of the IMS Agreement. Columbia Management prepared detailed reports for the Board and its Contracts Committee in March and April 2012, including reports based on analyses of data provided by an independent organization and a comprehensive response to each item of information requested by independent legal counsel to the Independent Directors ("Independent Legal Counsel") in a letter to the investment manager, to assist the Board in making this determination. All of the materials presented in March and April were first supplied in draft form to designated representatives of the Independent Directors, i.e., Independent Legal Counsel, the Chair and the Chair of the Contracts Committee (including materials relating to the Fund's expense cap), and the final materials were revised to reflect comments provided by these Board representatives. In addition, throughout the year, the Board (or its committees) regularly meets with portfolio management teams and senior management personnel, and reviews information prepared by Columbia Management addressing the services Columbia Management provides and Fund performance. The Board accords particular weight to the work, deliberations and conclusions of the Contracts Committee, the Investment Review Committee and the Compliance Committee in determining whether to continue the IMS Agreement.
The Board, at its April 10-12, 2012 in-person Board meeting (the "April Meeting"), considered the renewal of the IMS Agreement for an additional one-year term. At the April Meeting, Independent Legal Counsel reviewed with the Independent Directors various factors relevant to the Board's consideration of advisory agreements and the Board's legal responsibilities related to such consideration. Following an analysis and discussion of the factors identified below, the Board, including all of the Independent Directors, approved the renewal of the IMS Agreement.
Nature, Extent and Quality of Services Provided by Columbia Management: The Independent Directors analyzed various reports and presentations they had received detailing the services performed by Columbia Management, as well as its expertise, resources and capabilities. The Independent Directors specifically considered many developments during the past year concerning the services provided by Columbia Management, including, in particular, the continued investment in, and resources dedicated to, the Funds' operations and the successful completion of various integration initiatives and the consolidation of dozens of Funds. The Independent Directors noted the information they received concerning Columbia Management's ability to retain key portfolio management personnel. In that connection, the Independent Directors took into account their meetings with Columbia Management's Chief Investment Officer (the "CIO") and considered the CIO's successful execution of additional risk and portfolio management oversight applied to the Funds. The Independent Directors also assessed Columbia Management's significant investment in upgrading technology (such as an equity trading system) and considered management's commitments to enhance existing resources in this area.
In connection with the Board's evaluation of the overall package of services provided by Columbia Management, the Board also considered the quality of administrative services provided to the Fund by Columbia Management. In addition, the Board also reviewed the financial condition of Columbia Management (and its affiliates) and each entity's ability to carry out its responsibilities under the IMS Agreement and the Fund's other services agreements with Ameriprise affiliates. The Board also discussed the acceptability of the terms of the IMS Agreement (including the relatively broad scope of services required to be performed by Columbia Management). The Board concluded that the services being performed under the IMS Agreement were of a reasonably high quality.
Based on the foregoing, and based on other information received (both oral and written, including the information on investment performance referenced below) and other considerations, the Board concluded that Columbia
37
Approval of Investment Management Services Agreement (continued)
Management and its affiliates were in a position to continue to provide a high quality and level of services to the Fund.
Investment Performance: For purposes of evaluating the nature, extent and quality of services provided under the IMS Agreement, the Board carefully reviewed the investment performance of the Fund. In this regard, the Board considered detailed reports providing the results of analyses performed by an independent organization showing, for various periods, the performance of the Fund, the performance of a benchmark index, the percentage ranking of the Fund among its comparison group and the net assets of the Fund. The Board observed that the Fund's investment performance met expectations.
Comparative Fees, Costs of Services Provided and the Profits Realized By Columbia Management and its Affiliates from their Relationships with the Fund: The Board reviewed comparative fees and the costs of services to be provided under the IMS Agreement. The Board members considered detailed comparative information set forth in an annual report on fees and expenses, including, among other things, data (based on analyses conducted by an independent organization) showing a comparison of the Fund's expenses with median expenses paid by funds in its comparative peer universe, as well as data showing the Fund's contribution to Columbia Management's profitability. The Board reviewed the fees charged to comparable institutional or other accounts/vehicles managed by Columbia Management and discussed differences in how the products are managed and operated, noting no unreasonable differences in the levels of contractual fees.
The Board accorded particular weight to the notion that the level of fees should reflect a rational pricing model applied consistently across the various product lines in the Fund family, while assuring that the overall fees for each Fund (with few defined exceptions) are generally in line with the "pricing philosophy" (i.e., that the total expense ratio of the Fund is at, or below, the median expense ratio of funds in the same comparison universe of the Fund). The Board took into account that the Fund's total expense ratio (after considering proposed expense caps/waivers) approximated the peer universe's median expense ratio. Based on its review, the Board concluded that the Fund's management fee was fair and reasonable in light of the extent and quality of services that the Fund receives.
The Board also considered the expected profitability of Columbia Management and its affiliates in connection with Columbia Management providing investment management services to the Fund. In this regard, the Board referred to a detailed profitability report, discussing the profitability to Columbia Management and Ameriprise Financial from managing, operating and distributing the Funds. In this regard, the Board observed that 2011 profitability, while slightly lower than 2010, was generally in line with the reported profitability of other asset management firms. The Board also considered the indirect economic benefits flowing to Columbia Management or its affiliates in connection with managing or distributing the Funds, such as the enhanced ability to offer various other financial products to Ameriprise Financial customers, soft dollar benefits and overall reputational advantages. The Board noted that the fees paid by the Fund should permit the investment manager to offer competitive compensation to its personnel, make necessary investments in its business and earn an appropriate profit. The Board concluded that profitability levels were reasonable.
Economies of Scale to be Realized: The Board also considered the economies of scale that might be realized by Columbia Management as the Fund grows and took note of the extent to which Fund shareholders might also benefit from such growth.
Based on the foregoing, the Board, including all of the Independent Directors, concluded that the investment management service fees were fair and reasonable in light of the extent and quality of services provided. In reaching this conclusion, no single factor was determinative. On April 12, 2012, the Board, including all of the Independent Directors, approved the renewal of the IMS Agreement.
38
This page intentionally left blank.
39
This page intentionally left blank.
40
Important Information About This Report
The fund mails one shareholder report to each shareholder address. If you would like more than one report, please call shareholder services at 1-800-345-6611 and additional reports will be sent to you. This report has been prepared for shareholders of Columbia Georgia Intermediate Municipal Bond Fund.
A description of the policies and procedures that the fund uses to determine how to vote proxies and a copy of the fund's voting records are available (i) at www.columbiamanagement.com, (ii) on the Securities and Exchange Commission's website at www.sec.gov, and (iii) without charge, upon request, by calling 1-800-368-0346. Information regarding how the fund voted proxies relating to portfolio securities during the 12-month period ended June 30 is available from the SEC's website. Information regarding how the fund voted proxies relating to portfolio securities is also available from the fund's website, www.columbiamanagement.com.
The fund files a complete schedule of portfolio holdings with the SEC for the first and third quarters of each fiscal year on Form N-Q. The fund's Form N-Q is available on the SEC's website at www.sec.gov and may be reviewed and copied at the SEC's Public Reference Room in Washington, D.C. Information on the operation of the Public Reference Room may be obtained by calling 1-800-SEC-0330.
Transfer Agent
Columbia Management Investment
Services Corp.
P.O. Box 8081
Boston, MA 02266-8081
1-800-345-6611
Distributor
Columbia Management Investment
Distributors, Inc.
225 Franklin Street
Boston, MA 02110
Investment Manager
Columbia Management Investment Advisers, LLC
225 Franklin Street
Boston, MA 02110
41

Columbia Georgia Intermediate Municipal Bond Fund
P. O. Box 8081
Boston, MA 02266-8081
columbiamanagement.com
This information is for use with concurrent or prior delivery of a fund prospectus. Investors should consider the investment objectives, risks, charges and expenses of a mutual fund carefully before investing. For a free prospectus, which contains this and other important information about the funds, visit columbiamanagement.com. Read the prospectus carefully before investing. The Fund is distributed by Columbia Management Investment Distributors, Inc., member FINRA, and managed by Columbia Management Investment Advisers, LLC.
© 2012 Columbia Management Investment Advisers, LLC. All rights reserved.
C-1086 C (5/12)

Columbia Maryland Intermediate Municipal Bond Fund
Annual Report for the Period Ended April 30, 2012
Not FDIC insured • No bank guarantee • May lose value
Table of Contents
| Fund Profile | | | 1 | | |
|
| Performance Information | | | 2 | | |
|
| Understanding Your Expenses | | | 3 | | |
|
| Portfolio Manager's Report | | | 4 | | |
|
| Portfolio of Investments | | | 6 | | |
|
Statement of Assets and
Liabilities | | | 11 | | |
|
| Statement of Operations | | | 13 | | |
|
Statement of Changes in
Net Assets | | | 14 | | |
|
| Financial Highlights | | | 16 | | |
|
| Notes to Financial Statements | | | 20 | | |
|
Report of Independent Registered
Public Accounting Firm | | | 28 | | |
|
| Federal Income Tax Information | | | 29 | | |
|
| Fund Governance | | | 30 | | |
|
Approval of Investment Management
Services Agreement | | | 37 | | |
|
Important Information About
This Report | | | 41 | | |
|
The views expressed in this report reflect the current views of the respective parties. These views are not guarantees of future performance and involve certain risks, uncertainties and assumptions that are difficult to predict, so actual outcomes and results may differ significantly from the views expressed. These views are subject to change at any time based upon economic, market or other conditions and the respective parties disclaim any responsibility to update such views. These views may not be relied on as investment advice and, because investment decisions for a Columbia Fund are based on numerous factors, may not be relied on as an indication of trading intent on behalf of any particular Columbia Fund. References to specific securities should not be construed as a recommendation or investment advice.
President's Message

Dear Shareholders,
A stock market rally that commenced in the fourth quarter of 2011 continued into 2012 in the United States and around the world, as all major market regions generated double-digit returns for the three-month period ended March 31, 2012. Volatility declined sharply as European debt fears quieted somewhat and sentiment improved. Returns in developed countries were buoyed by strong results in Germany, Belgium, Austria and the Nordic markets of Denmark, Finland, Norway and Sweden. Under the cloud of its own mounting debt problem, Spain was the only eurozone country to deliver a negative return during the three-month period. Solid economic growth and accommodative monetary policy helped boost gains in emerging markets. The rally in U.S. equities was largely driven by an expansion in "multiples"—an increase in stock prices relative to their earnings. By the end of the first quarter of 2012, stocks no longer appeared as cheap as they were late in 2011. Bonds lagged stocks during the first quarter as investors responded to signs of an improved environment with a greater appetite for risk.
Concerns around the health of the global economy were centered in news headlines focusing on Washington D.C., Europe, China and the Middle East. In the United States, economic indicators remained mixed but generally indicated support for slow, sustainable economic growth. European policymakers have made progress in containing the eurozone debt crisis, though they still have not solved the issue of long-term solvency. The European Central Bank has lowered interest rates and flooded the financial system with liquidity that may provide breathing space for companies to restructure their balance sheets. These massive infusions of liquidity may whet the appetite for risk from investors around the world. However, it has delayed a true reckoning with the European financial situation, as concerns about Spain and Portugal continue to cloud the outlook. These structural challenges that persist in the developed world, and slowing growth in emerging market economies, leave the global economy in a fragile state. Domestic demand, combined with slowing inflationary trends, has also helped to shore up emerging market economies. Joblessness remains low and monetary conditions remain easy.
Despite the challenges and surprises of 2011, we see pockets of strength—and as a result, attractive opportunities—both here and abroad for 2012. We hope to help you capitalize on these opportunities with various articles in our 2012 Perspectives, which is available via the Market Insights tab at columbiamanagement.com. This publication showcases the strong research capabilities and experienced investment teams of Columbia Management and offers a diverse array of investment ideas based on our five key themes for 2012.
Other information and resources available at columbiamanagement.com include:
g detailed up-to-date fund performance and portfolio information
g economic analysis and market commentary
g quarterly fund commentaries
g Columbia Management Investor, our award-winning quarterly newsletter for shareholders
Thank you for your continued support of the Columbia Funds. We look forward to serving your investment needs for many years to come.
Best Regards,

J. Kevin Connaughton
President, Columbia Funds
Investors should consider the investment objectives, risks, charges and expenses of a mutual fund carefully before investing. For a free prospectus, which contains this and other important information about the funds, visit columbiamanagement.com. The prospectus should be read carefully before investing.
Columbia Funds are distributed by Columbia Management Investment Distributors, Inc., member FINRA, and managed by Columbia Management Investment Advisers, LLC.
© 2012 Columbia Management Investment Advisers, LLC. All rights reserved.
Fund Profile – Columbia Maryland Intermediate Municipal Bond Fund
Summary
• For the 13-month period that ended April 30, 2012, the fund's Class A shares returned 9.69% without sales charge.
• The fund lagged its benchmark, the Barclays 3-15 Year Blend Municipal Bond Index1 which returned 11.05%.
• The fund's duration was shorter than the index, which was a drag on performance, as was the portfolio's higher quality positioning, as lower-rated names performed the best during the period.
Portfolio Management
Brian M. McGreevy has managed the fund since June 2011. From 1994 until joining Columbia Management Investment Advisers, LLC (the Investment Manager) in May 2010, Mr. McGreevy was associated with the fund's previous investment adviser as an investment professional.
1The Barclays Capital 3-15 Year Blend Municipal Bond Index tracks the performance of municipal bonds issued after December 31, 1990 with remaining maturities between 2 and 17 years and at least $7 million in principal amount outstanding.
Indices are not available for investment, are not professionally managed and do not reflect sales charges, fees, brokerage commissions, taxes or other expenses of investing. Securities in the fund may not match those in an index.
Performance data quoted represents past performance and current performance may be lower or higher. Past performance is no guarantee of future results. The investment return and principal value will fluctuate so that shares, when redeemed, may be worth more or less than the original cost. Please visit www.columbiamanagement.com for daily and most recent month-end performance updates.
Summary
13-month (cumulative) return as of 04/30/12
| | +9.69% | |
|
|  | | | Class A shares
(without sales charge) | |
|
| | +11.05% | |
|
|  | | | Barclays Capital 3-15 Year
Blend Municipal Bond Index | |
|
1
Performance Information – Columbia Maryland Intermediate Municipal Bond Fund
Performance data quoted represents past performance and current performance may be lower or higher. Past performance is no guarantee of future results. The investment return and principal value will fluctuate so that shares, when redeemed, may be worth more or less than the original cost. Please visit www.columbiamanagement.com for daily and most recent month-end performance updates.
Performance of a $10,000 investment 05/01/02 – 04/30/12
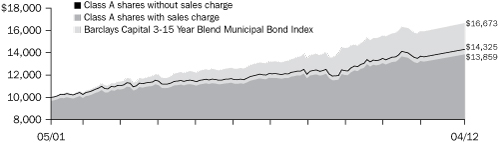
The chart above shows the change in value of a hypothetical $10,000 investment in Class A shares of Columbia Maryland Intermediate Municipal Bond Fund during the stated time period, and does not reflect the deduction of taxes that a shareholder may pay on fund distributions or on the redemption of fund shares.
Performance of a $10,000 investment 05/01/02 – 04/30/12 ($)
| Sales charge | | without | | with | |
| Class A | | | 14,325 | | | | 13,859 | | |
| Class B | | | 13,307 | | | | 13,307 | | |
| Class C | | | 13,291 | | | | 13,291 | | |
| Class Z | | | 14,687 | | | | n/a | | |
Average annual total return as of 04/30/12 (%)
| Share class | | A | | B | | C | | Z | |
| Inception | | 09/01/90 | | 06/08/93 | | 06/17/92 | | 09/01/90 | |
| Sales charge | | without | | with | | without | | with | | without | | with | | without | |
| 1-month (cumulative) | | | 1.05 | | | | –2.25 | | | | 0.99 | | | | –2.01 | | | | 0.99 | | | | –0.01 | | | | 1.07 | | |
| 1-year | | | 7.94 | | | | 4.47 | | | | 7.13 | | | | 4.13 | | | | 7.13 | | | | 6.13 | | | | 8.10 | | |
| 5-year | | | 4.27 | | | | 3.57 | | | | 3.51 | | | | 3.51 | | | | 3.49 | | | | 3.49 | | | | 4.53 | | |
| 10-year | | | 3.66 | | | | 3.32 | | | | 2.90 | | | | 2.90 | | | | 2.89 | | | | 2.89 | | | | 3.92 | | |
The "with sales charge" returns include the maximum initial sales charge of 3.25% for Class A shares and the applicable contingent deferred sales charge of 3.00% in the first year, declining to 1.00% in the fourth year and eliminated thereafter for Class B shares and 1.00% for Class C shares for the first year only. The "without sales charge" returns do not include the effect of sales charges. If they had, returns would be lower.
Performance results reflect any fee waivers or reimbursements of fund expenses by Columbia Management Investment Advisers, LLC and/or any of its affiliates. Absent these fee waivers or expense reimbursement arrangements, performance results would have been lower.
All results shown assume reinvestment of distributions. Class Z shares are sold at net asset value with no distribution and service (Rule 12b-1) fees. Class Z shares have limited eligibility and the investment minimum requirements may vary. Please see the fund's prospectuses for details. Performance for different share classes will vary based on differences in sales charges and fees associated with each class.
The tables do not reflect the deduction of taxes that a shareholder may pay on fund distributions or on the redemption of fund shares.
2
Understanding Your Expenses – Columbia Maryland Intermediate Municipal Bond Fund
As an investor, you incur two types of costs. There are transaction costs, which generally include sales charges on purchases and may include redemption fees. There are also ongoing costs, which generally include management fees, distribution and service (Rule 12b-1) fees, and other fund expenses. The following information is intended to help you understand your ongoing costs (in dollars) of investing in the Fund and to help you compare these costs with the ongoing costs of investing in other mutual funds.
Analyzing your fund's expenses
To illustrate these ongoing costs, we have provided examples and calculated the expenses paid by investors in each share class of the Fund during the period. The actual and hypothetical information in the table is based on an initial investment of $1,000 at the beginning of the period indicated and held for the entire period. Expense information is calculated two ways and each method provides you with different information. The amount listed in the "Actual" column is calculated using the Fund's actual operating expenses and total return for the period. You may use the Actual information, together with the amount invested, to estimate the expenses that you paid over the period. Simply divide your account value by $1,000 (for example, an $8,600 account value divided by $1,000 = 8.6), then multiply the results by the expenses paid during the period under the Actual column. The amount listed in the "Hypothetical" column assumes a 5% annual rate of return before expenses (which is not the Fund's actual return) and then applies the Fund's actual expense ratio for the period to the hypothetical return. You should not use the hypothetical account values and expenses to estimate either your actual account balance at the end of the period or the expenses you paid during the period. See "Compare with other funds" below for details on how to use the hypothetical data.
Compare with other funds
Since all mutual funds are required to include the same hypothetical calculations about expenses in shareholder reports, you can use this information to compare the ongoing cost of investing in the Fund with other funds. To do so, compare the hypothetical example with the 5% hypothetical examples that appear in the shareholder reports of other funds. As you compare hypothetical examples of other funds, it is important to note that hypothetical examples are meant to highlight the ongoing costs of investing in a fund only and do not reflect any transaction costs, such as sales charges, or redemption or exchange fees. Therefore, the hypothetical calculations are useful in comparing ongoing costs only, and will not help you determine the relative total costs of owning different funds. If transaction costs were included in these calculations, your costs would be higher.
November 1, 2011 – April 30, 2012
| | | Account value at the
beginning of the period ($) | | Account value at the
end of the period ($) | | Expenses paid
during the period ($) | | Fund's annualized
expense ratio (%) | |
| | | Actual | | Hypothetical | | Actual | | Hypothetical | | Actual | | Hypothetical | | Actual | |
| Class A | | | 1,000.00 | | | | 1,000.00 | | | | 1,038.90 | | | | 1,020.84 | | | | 4.11 | | | | 4.07 | | | | 0.81 | | |
| Class B | | | 1,000.00 | | | | 1,000.00 | | | | 1,035.10 | | | | 1,017.16 | | | | 7.84 | | | | 7.77 | | | | 1.55 | | |
| Class C | | | 1,000.00 | | | | 1,000.00 | | | | 1,035.10 | | | | 1,017.16 | | | | 7.84 | | | | 7.77 | | | | 1.55 | | |
| Class Z | | | 1,000.00 | | | | 1,000.00 | | | | 1,040.20 | | | | 1,022.13 | | | | 2.79 | | | | 2.77 | | | | 0.55 | | |
Expenses paid during the period are equal to the annualized expense ratio for each class as indicated above, multiplied by the average account value over the period and then multiplied by the number of days in the Fund's most recent fiscal half year and divided by 366.
Expenses do not include fees and expenses incurred indirectly by the Fund from the underlying funds in which the Fund may invest (also referred to as "acquired funds"), including affiliated and non-affiliated pooled investments vehicles (including mutual funds and exchange traded funds).
Had Columbia Management Investment Advisers, LLC and/or certain of its affiliates not waived/reimbursed certain fees and expenses, account value at the end of the period would have been reduced.
3
Portfolio Manager's Report – Columbia Maryland Intermediate Municipal Bond Fund
Performance data quoted represents past performance and current performance may be lower or higher. Past performance is no guarantee of future results. The investment return and principal value will fluctuate so that shares, when redeemed, may be worth more or less than the original cost. Please visit www.columbiamanagement.com for daily and most recent month-end performance updates.
30-day SEC yields
as of 04/30/12 (%)
| Class A | | | 1.30 | | |
| Class B | | | 0.61 | | |
| Class C | | | 0.61 | | |
| Class Z | | | 1.59 | | |
The 30-day SEC yields reflect the fund's earning power, net of expenses, expressed as an annualized percentage of the public offering price per share at the end of the period. Had the Investment Manager and/or any of its affiliates not waived fees or reimbursed a portion of expenses, the 30-day SEC yields would have been lower.
Taxable equivalent SEC yields
as of 04/30/12 (%)
| Class A | | | 2.00 | | |
| Class B | | | 0.94 | | |
| Class C | | | 0.94 | | |
| Class Z | | | 2.45 | | |
Taxable-equivalent SEC yields are calculated assuming a federal tax rate of 35.0%. This tax rate does not reflect the phase out of exemptions or the reduction of the otherwise allowable deductions that occur when adjusted gross income exceeds certain levels. Your taxable-equivalent yield may be different depending on your tax bracket.
Quality breakdown1
as of 04/30/12 (%)
| AAA rating | | | 14.3 | | |
| AA rating | | | 52.1 | | |
| A rating | | | 13.6 | | |
| BBB rating | | | 15.1 | | |
| Non-investment grade | | | 1.9 | | |
| Not rated | | | 3.0 | | |
1 Percentages indicated are based upon total fixed income securities (excluding Investments of Cash Collateral Received for Securities on Loan and money market funds).
Bond ratings apply to the underlying holdings of the Fund and not the Fund itself and are divided into categories ranging from AAA (highest) to D (lowest), and are subject to change. The ratings shown are determined by using the middle rating of Moody's, S&P, and Fitch after dropping the highest and lowest available ratings. When a rating from only two agencies is available, the lower rating is used. When a rating from only one agency is available, that rating is used. When a bond is not rated by one of these agencies, it is designated as Not rated. Credit ratings are subjective to opinions and not statements of fact.
The Board of Trustees for Columbia Maryland Intermediate Municipal Bond Fund has approved the change of the fund's fiscal year end from March 31 to April 30. As a result, this report covers the 13-month period since the last annual report. The next report you receive will be for the six-month period from May 1, 2012 through October 31, 2012. In June 2011, Brian McGreevy became portfolio manager of the fund.
For the 13-month period that ended April 30, 2012, the fund's Class A shares returned 9.69% without sales charge. The Barclays 3-15 Year Blend Municipal Bond Index, which is national in scope, gained 11.05%. The fund's duration was shorter than the index, which was a drag on performance, as was the portfolio's higher quality positioning, as lower-rated names performed the best during the period. Duration is a measure of interest-rate sensitivity and, like maturity, is measured in years.
An improving economic environment
Early in the 13-month period, Europe's debt problems and wrangling in Washington over the federal budget and the national debt dominated world headlines. U.S. economic news was lackluster, housing continued to be a nagging weak spot and job growth was disappointing. However, the pace of both economic and job growth picked up as the period wore on. Consumer confidence improved as the labor market added approximately 1.2 million new jobs between November 2011 and April 2012, while the jobless rate fell to 8.1%. Household net worth also picked up as the equity markets rebounded. Headline inflation rose 2.7%, driven primarily by rising food and energy prices. Despite a modest slowdown late in the summer of 2011, manufacturing activity continued to expand throughout the period.
Municipal market generates strong returns
Against this backdrop, the U.S. municipal bond market generated strong returns, despite a host of investor concerns at the outset of the period: 1) Net outflows from municipal mutual funds. 2) The expectation that heavy new issue volume would weigh on the market, which turned out to be unfounded. Issuance dropped off almost across the board. 3) Fears of massive defaults, which were stoked by the media and were generally overblown. With these concerns in mind, 10-year municipal yields reached a high of 3.5% before the European debt crisis sent investors scurrying for the safety of the Treasury market, pushing Treasury yields down. Municipal yields followed. (Bond yields and prices move in opposite directions.)
By the summer of 2011, investors seemed to believe that default expectations were excessive and demand for municipal bonds picked up. With yields close to historical lows, buyers moved down the credit curve—to A and BBB rated2 bonds—to garner additional income. Over the course of the 13-month period, these credits performed the best, as yields fell and the yield spread between higher and lower quality bonds tightened in response to demand. Yet, there were more downgrades than upgrades in the overall municipal market as a lackluster economy continued to pressure issuers.
2The credit quality ratings represent those of Moody's Investors Service, Inc. ("Moody's"), Standard & Poor's Corporation ("S&P") or Fitch Ratings ("Fitch") credit ratings. The ratings represent their opinions as to the quality of the securities they rate. Ratings are relative and subjective and are not absolute standards of quality. The security's credit quality does not eliminate risk.
4
Portfolio Manager's Report (continued) – Columbia Maryland Intermediate Municipal Bond Fund
Duration, quality orientation hampered returns
The fund delivered a solid return for the 13-month period, but it lagged the index because it was marginally shorter in duration and because it had more weight in higher quality names. The fund's position in cash and zero to two-year bonds, at the short end of the maturity spectrum, and slightly less weight in 13- to 17-year bonds, which was the best performing maturity range, were a drag on returns. However, the fund was overweight in nine- to 11-year bonds, which was a positive for returns. Because Maryland is a higher quality state, the fund had more weight in AAA and AA1 rated bonds, which hampered performance because lower-rated names were the better performers. The local general obligation bond sector, which accounts for 15% of fund assets, is also of very high quality. Holdings in the education sector lagged due to shorter maturities and shorter call dates. By contrast, the electric revenue sector was a positive contributor to returns, as were hospitals and transportation bonds.
Cash deployed across the yield curve
During the period, the fund experienced positive cash flows. We deployed this cash across the yield curve (a graphic depiction of yields at various maturities, from short to long), investing in bonds that mature from 2018 to 2028. New holdings included two hospital names and some higher quality general obligation bonds. We would have liked to add to the fund's lower quality holdings. However, given the limited supply of A rated Maryland bonds, our research team found it difficult to find solid names that they believed would add value to the portfolio.
A slow recovery for Maryland
Maryland is recovering slowly, lagging the nation in its post-recession progress. Soft consumer spending, a distressed housing market and continued cuts to state and local budgets have restrained a more robust comeback. As a result, we do not forsee a gain of steady momentum until 2013. However, over the long term, we believe that Maryland will benefit from its highly educated workforce and proximity to Washington D.C., providing support for the municipal bond market going forward.
Portfolio characteristics and holdings are subject to change periodically and may not be representative of current characteristics and holdings. The outlook for this fund may differ from that presented for other Columbia Funds.
Tax-exempt investing offers current tax-exempt income, but it also involves special risks. The value of the fund will be affected by interest rate changes and the creditworthiness of issues held in the fund. When interest rates go up, bond prices generally drop and vice versa.
Interest income from certain tax-exempt bonds may be subject to certain state and local taxes and, if applicable, the alternative minimum tax. Capital gains are not exempt from income taxes.
Non-diversified investments increase the risk that a change in the value of any one investment held by the fund could affect the overall value of he fund more than it would affect that of a diversified fund holding a greater number of investments. Accordingly, the fund's value will like be more volatile than the value of more diversified funds.
Single-state municipal bond funds pose additional risks due to limited geographical diversification.
5
Portfolio of Investments – Columbia Maryland Intermediate Municipal Bond Fund
April 30, 2012
(Percentages represent value of investments compared to net assets)
Issue
Description | | Coupon
Rate | | Principal
Amount | | Value | |
| Municipal Bonds 92.1% | |
| DISPOSAL 0.9% | |
Maryland Environmental Service
Revenue Bonds
Mid Shore II Regional Landfill | |
| Series 2011 | |
| 11/01/24 | | | 5.000 | % | | $ | 1,030,000 | | | $ | 1,206,346 | | |
| HIGHER EDUCATION 4.8% | |
City of Westminster
Revenue Bonds
McDaniel College, Inc.
Series 2006 | |
| 11/01/17 | | | 5.000 | % | | | 575,000 | | | | 638,911 | | |
Maryland Health & Higher Educational Facilities Authority
Revenue Bonds
College of Notre Dame
Series 1998 (NPFGC) | |
| 10/01/14 | | | 4.600 | % | | | 510,000 | | | | 555,406 | | |
| Johns Hopkins University | |
| Series 2008A | |
| 07/01/18 | | | 5.000 | % | | | 1,750,000 | | | | 2,133,810 | | |
Maryland Industrial Development Financing Authority
Refunding Revenue Bonds
American Center for Physics Facility
Series 2001 | |
| 12/15/15 | | | 5.250 | % | | | 1,000,000 | | | | 1,004,030 | | |
University System of Maryland
Revenue Bonds
Series 2006A | |
| 10/01/15 | | | 5.000 | % | | | 2,000,000 | | | | 2,298,500 | | |
| Total | | | | | | | | | | | 6,630,657 | | |
| HOSPITAL 11.1% | |
County of Baltimore
Revenue Bonds
Catholic Health Initiatives
Series 2006A | |
| 09/01/16 | | | 5.000 | % | | | 1,000,000 | | | | 1,144,570 | | |
| 09/01/26 | | | 5.000 | % | | | 1,500,000 | | | | 1,695,300 | | |
Maryland Health & Higher Educational Facilities Authority
Revenue Bonds
Carroll Hospital Center
Series 2006 | |
| 07/01/26 | | | 4.500 | % | | | 1,000,000 | | | | 1,015,140 | | |
| FHA Insured Mortgage-Western Health | |
| Series 2006 | |
| 07/01/13 | | | 5.000 | % | | | 1,280,000 | | | | 1,336,525 | | |
| 01/01/20 | | | 5.000 | % | | | 1,450,000 | | | | 1,617,417 | | |
| MedStar Health | |
| Series 2011 | |
| 08/15/22 | | | 5.000 | % | | | 1,620,000 | | | | 1,897,020 | | |
| Peninsula Regional Medical Center | |
| Series 2006 | |
| 07/01/26 | | | 5.000 | % | | | 2,000,000 | | | | 2,088,500 | | |
| University of Maryland Medical System | |
| Series 2010 | |
| 07/01/20 | | | 5.000 | % | | | 1,000,000 | | | | 1,139,880 | | |
Issue
Description | | Coupon
Rate | | Principal
Amount | | Value | |
| Municipal Bonds (continued) | |
| HOSPITAL (cont.) | |
Maryland Health & Higher Educational Facilities Authority(a)
Revenue Bonds
Johns Hopkins Health System
Series 2012 | |
| 07/01/28 | | | 5.000 | % | | $ | 1,000,000 | | | $ | 1,152,340 | | |
Maryland Health & Higher Educational Facilities Authority(b)
Revenue Bonds
Johns Hopkins Health System
Series 2008 | |
| 05/15/48 | | | 5.000 | % | | | 2,000,000 | | | | 2,231,280 | | |
| Total | | | | | | | | | | | 15,317,972 | | |
| HOTELS 1.0% | |
City of Baltimore
Senior Revenue Bonds
Series 2006A (XLCA) | |
| 09/01/17 | | | 5.250 | % | | | 1,300,000 | | | | 1,344,148 | | |
| INVESTOR OWNED 2.2% | |
Maryland Economic Development Corp.
Refunding Revenue Bonds
Potomac
Series 2009 | |
| 09/01/22 | | | 6.200 | % | | | 2,500,000 | | | | 3,033,550 | | |
| LOCAL APPROPRIATION 1.8% | |
City of Baltimore
Refunding Certificate of Participation
Series 2010A | |
| 10/01/17 | | | 5.000 | % | | | 1,500,000 | | | | 1,768,590 | | |
Howard County Housing Commission
Revenue Bonds
Roger Carter Recreation Center Project
Series 2011 | |
| 06/01/26 | | | 5.000 | % | | | 585,000 | | | | 665,859 | | |
| Total | | | | | | | | | | | 2,434,449 | | |
| LOCAL GENERAL OBLIGATION 15.6% | |
City of Baltimore
Unlimited General Obligation Bonds
Consolidated Public Improvement
Series 2008A (AGM) | |
| 10/15/22 | | | 5.000 | % | | | 2,000,000 | | | | 2,347,540 | | |
County of Anne Arundel
General Obligation Limited Notes
Consolidated General Improvement
Series 2006 | |
| 03/01/18 | | | 5.000 | % | | | 3,300,000 | | | | 3,790,941 | | |
| Limited General Obligation Refunding Bonds | |
| Consolidated General Improvement | |
| Series 2006 | |
| 03/01/15 | | | 5.000 | % | | | 2,000,000 | | | | 2,254,940 | | |
County of Baltimore
Unlimited General Obligation Bonds
Consolidated Public Improvement
Series 2008 | |
| 02/01/18 | | | 5.000 | % | | | 1,000,000 | | | | 1,223,000 | | |
The Accompanying Notes to Financial Statements are an integral part of this statement.
6
Columbia Maryland Intermediate Municipal Bond Fund
April 30, 2012
(Percentages represent value of investments compared to net assets)
Issue
Description | | Coupon
Rate | | Principal
Amount | | Value | |
| Municipal Bonds (continued) | |
| LOCAL GENERAL OBLIGATION (cont.) | |
County of Frederick
Unlimited General Obligation Refunding Bonds
Public Facilities
Series 2005 | |
| 08/01/14 | | | 5.000 | % | | $ | 1,500,000 | | | $ | 1,653,930 | | |
| Series 2006 | |
| 11/01/18 | | | 5.250 | % | | | 2,005,000 | | | | 2,510,220 | | |
| 11/01/21 | | | 5.250 | % | | | 2,500,000 | | | | 3,244,675 | | |
County of Montgomery
Unlimited General Obligation Refunding Bonds
Consolidated Public Improvement
Series 2005A | |
| 07/01/16 | | | 5.000 | % | | | 1,500,000 | | | | 1,766,610 | | |
County of Prince George's
Limited General Obligation Bonds
Consolidated Public Improvement
Series 2001 (NPFGC/FGIC) | |
| 12/01/12 | | | 5.250 | % | | | 120,000 | | | | 121,707 | | |
| Limited General Obligation Refunding & Public Improvement Bonds | |
| Series 2011B | |
| 09/15/20 | | | 5.000 | % | | | 2,000,000 | | | | 2,542,460 | | |
| Unrefunded Unlimited General Obligation Bonds | |
| Consolidated Public Improvement | |
| Series 1999 (AGM) | |
| 10/01/12 | | | 5.000 | % | | | 65,000 | | | | 65,261 | | |
| Total | | | | | | | | | | | 21,521,284 | | |
| MULTI-FAMILY 6.2% | |
Maryland Economic Development Corp.
Refunding Revenue Bonds
University of Maryland-Baltimore County Project
Series 2006 (XLCA) | |
| 07/01/20 | | | 5.000 | % | | | 600,000 | | | | 625,374 | | |
| University of Maryland-College Park Projects | |
| Series 2006 (AGCP) | |
| 06/01/17 | | | 5.000 | % | | | 1,000,000 | | | | 1,098,920 | | |
| 06/01/19 | | | 5.000 | % | | | 1,000,000 | | | | 1,081,750 | | |
| Revenue Bonds | |
| Collegiate Housing-Salisbury | |
| Series 1999A | |
| 06/01/19 | | | 6.000 | % | | | 745,000 | | | | 747,302 | | |
| 06/01/30 | | | 6.000 | % | | | 1,850,000 | | | | 1,850,722 | | |
| Collegiate Housing-Towson | |
| Series 1999A | |
| 06/01/12 | | | 5.700 | % | | | 355,000 | | | | 355,426 | | |
| Senior Revenue Bonds | |
| Towson University Project | |
| Series 2007A | |
| 07/01/24 | | | 5.250 | % | | | 1,185,000 | | | | 1,227,719 | | |
Montgomery County Housing Opportunities Commission
Revenue Bonds
Housing Development
Series 2000A | |
| 07/01/30 | | | 6.100 | % | | | 1,500,000 | | | | 1,502,445 | | |
| Total | | | | | | | | | | | 8,489,658 | | |
Issue
Description | | Coupon
Rate | | Principal
Amount | | Value | |
| Municipal Bonds (continued) | |
| MUNICIPAL POWER 1.5% | |
Puerto Rico Electric Power Authority
Refunding Revenue Bonds
Series 2010ZZ(c) | |
| 07/01/25 | | | 5.250 | % | | $ | 1,985,000 | | | $ | 2,143,423 | | |
| OTHER BOND ISSUE 1.8% | |
County of Montgomery
Revenue Bonds
Department of Liquor Control
Series 2009A | |
| 04/01/22 | | | 5.000 | % | | | 2,055,000 | | | | 2,424,304 | | |
| OTHER INDUSTRIAL DEVELOPMENT BOND 0.8% | |
Maryland Economic Development Corp.
Refunding Revenue Bonds
CNX Marine Terminals, Inc.
Series 2010 | |
| 09/01/25 | | | 5.750 | % | | | 1,000,000 | | | | 1,046,720 | | |
| POOL/BOND BANK 0.9% | |
Maryland Water Quality Financing Administration
Revolving Loan Fund
Revenue Bonds
Series 2008A | |
| 03/01/23 | | | 5.000 | % | | | 1,000,000 | | | | 1,183,260 | | |
| REFUNDED/ESCROWED 1.6% | |
City of Baltimore
Revenue Bonds
Water Project
Series 1994A Escrowed to Maturity (FGIC) | |
| 07/01/24 | | | 5.000 | % | | | 1,400,000 | | | | 1,774,500 | | |
Maryland State Transportation Authority
Revenue Bonds
Series 1978 Escrowed to Maturity | |
| 07/01/16 | | | 6.800 | % | | | 370,000 | | | | 418,703 | | |
| Total | | | | | | | | | | | 2,193,203 | | |
| RETIREMENT COMMUNITIES 3.9% | |
City of Gaithersburg
Refunding Revenue Bonds
Asbury Obligation
Series 2009B | |
| 01/01/23 | | | 6.000 | % | | | 1,250,000 | | | | 1,367,000 | | |
County of Baltimore
Revenue Bonds
Oak Crest Village Incorporate Facility
Series 2007A | |
| 01/01/22 | | | 5.000 | % | | | 1,045,000 | | | | 1,102,715 | | |
| 01/01/27 | | | 5.000 | % | | | 2,000,000 | | | | 2,052,580 | | |
Maryland Health & Higher Educational Facilities Authority
Revenue Bonds
King Farm Presbyterian Community
Series 2007A | |
| 01/01/27 | | | 5.250 | % | | | 1,000,000 | | | | 899,010 | | |
| Total | | | | | | | | | | | 5,421,305 | | |
| SINGLE FAMILY 4.0% | |
Maryland Community Development Administration
Revenue Bonds
Capital Fund Securitization
Series 2003 (AGM) | |
| 07/01/21 | | | 4.400 | % | | | 1,500,000 | | | | 1,531,905 | | |
The Accompanying Notes to Financial Statements are an integral part of this statement.
7
Columbia Maryland Intermediate Municipal Bond Fund
April 30, 2012
(Percentages represent value of investments compared to net assets)
Issue
Description | | Coupon
Rate | | Principal
Amount | | Value | |
| Municipal Bonds (continued) | |
| SINGLE FAMILY (cont.) | |
| Residential | |
| Series 2010B | |
| 09/01/30 | | | 5.125 | % | | $ | 1,500,000 | | | $ | 1,619,805 | | |
Maryland Community Development Administration(d)
Revenue Bonds
Residential
Series 1999D AMT | |
| 09/01/24 | | | 5.375 | % | | | 2,410,000 | | | | 2,412,530 | | |
| Total | | | | | | | | | | | 5,564,240 | | |
| SPECIAL NON PROPERTY TAX 8.9% | |
Maryland State Department of Transportation
Revenue Bonds
Series 2002 | |
| 02/01/14 | | | 5.500 | % | | | 5,000,000 | | | | 5,458,900 | | |
| Series 2008 | |
| 02/15/22 | | | 5.000 | % | | | 3,125,000 | | | | 3,649,719 | | |
| Series 2009 | |
| 06/15/21 | | | 4.000 | % | | | 1,495,000 | | | | 1,702,730 | | |
Territory of Guam
Revenue Bonds
Series 2011A(c) | |
| 01/01/31 | | | 5.000 | % | | | 350,000 | | | | 384,594 | | |
Virgin Islands Public Finance Authority
Revenue Bonds
Matching Fund Loan-Senior Lien
Series 2010A(c) | |
| 10/01/17 | | | 5.000 | % | | | 1,000,000 | | | | 1,110,420 | | |
| Total | | | | | | | | | | | 12,306,363 | | |
| SPECIAL PROPERTY TAX 2.0% | |
County of Frederick
Special Tax Bonds
Urbana Community Development Authority
Series 2010A | |
| 07/01/25 | | | 5.000 | % | | | 2,500,000 | | | | 2,762,475 | | |
| STATE APPROPRIATED 2.8% | |
Maryland Economic Development Corp.
Refunding Revenue Bonds
Department of Transportation Headquarters
Series 2010 | |
| 06/01/22 | | | 4.500 | % | | | 2,675,000 | | | | 3,223,108 | | |
New Jersey Transportation Trust Fund Authority
Revenue Bonds
Transportation System
Series 2006A | |
| 12/15/19 | | | 5.250 | % | | | 500,000 | | | | 612,240 | | |
| Total | | | | | | | | | | | 3,835,348 | | |
| STATE GENERAL OBLIGATION 8.2% | |
Commonwealth of Puerto Rico
Unlimited General Obligation Public Improvement Bonds
Series 2002A (FGIC)(c) | |
| 07/01/17 | | | 5.500 | % | | | 2,520,000 | | | | 2,854,958 | | |
State of Maryland
Unlimited General Obligation Bonds
1st Series 2011B | |
| 03/15/18 | | | 5.000 | % | | | 2,500,000 | | | | 3,066,600 | | |
Issue
Description | | Coupon
Rate | | Principal
Amount | | Value | |
| Municipal Bonds (continued) | |
| STATE GENERAL OBLIGATION (cont.) | |
| State & Local Facilities | |
| 1st Series 2009C | |
| 03/01/21 | | | 5.000 | % | | $ | 1,500,000 | | | $ | 1,824,855 | | |
| State & Local Facilities-Capital Improvement | |
| 1st Series 2003A | |
| 03/01/17 | | | 5.250 | % | | | 3,000,000 | | | | 3,633,120 | | |
| Total | | | | | | | | | | | 11,379,533 | | |
| TRANSPORTATION 2.6% | |
Washington Metropolitan Area Transit Authority
Revenue Bonds
Transit
Series 2009 | |
| 07/01/23 | | | 5.250 | % | | | 3,000,000 | | | | 3,585,060 | | |
| TURNPIKE/BRIDGE/TOLL ROAD 2.6% | |
Maryland State Transportation Authority
Revenue Bonds
Series 2009A | |
| 07/01/22 | | | 5.000 | % | | | 3,000,000 | | | | 3,655,320 | | |
| WATER & SEWER 6.9% | |
City of Baltimore
Revenue Bonds
Wastewater Projects
Series 2006C (AMBAC) | |
| 07/01/18 | | | 5.000 | % | | | 1,125,000 | | | | 1,302,660 | | |
| Series 2007D (AMBAC) | |
| 07/01/19 | | | 5.000 | % | | | 1,250,000 | | | | 1,482,612 | | |
| Series 2008A (AGM) | |
| 07/01/21 | | | 5.000 | % | | | 1,250,000 | | | | 1,477,638 | | |
Maryland Water Quality Financing Administration
Revolving Loan Fund
Revenue Bonds
Series 2008 | |
| 03/01/21 | | | 5.000 | % | | | 2,500,000 | | | | 2,917,425 | | |
Washington Suburban Sanitary Commission
Unlimited General Obligation Refunding & Public
Improvement Bonds
Series 2009 | |
| 06/01/21 | | | 4.000 | % | | | 2,000,000 | | | | 2,306,420 | | |
| Total | | | | | | | | | | | 9,486,755 | | |
Total Municipal Bonds
(Cost: $116,445,801) | | $ | 126,965,373 | | |
| | | | | Shares | | Value | |
| Money Market Funds 8.1% | |
JPMorgan Tax-Free Money Market
Fund, 0.010%(e) | | | 11,180,808 | | | $ | 11,180,808 | | |
Total Money Market Funds
(Cost: $11,180,808) | | $ | 11,180,808 | | |
Total Investments
(Cost: $127,626,609) | | | | $ | 138,146,181 | | |
| Other Assets & Liabilities, Net | | | | | (251,958 | ) | |
| Total Net Assets | | $ | 137,894,223 | | |
The Accompanying Notes to Financial Statements are an integral part of this statement.
8
Columbia Maryland Intermediate Municipal Bond Fund
April 30, 2012
| Notes to Portfolio of Investments | |
(a) Represents a security purchased on a when-issued or delayed delivery basis.
(b) Variable rate security. The interest rate shown reflects the rate as of April 30, 2012.
(c) Municipal obligations include debt obligations issued by or on behalf of territories, possessions, or sovereign nations within the territorial boundaries of the United States. At April 30, 2012, the value of these securities amounted to $6,493,395 or 4.71% of net assets.
(d) At April 30, 2012, the value of securities subject to alternative minimum tax was $2,412,530, representing 1.75% of net assets.
(e) The rate shown is the seven-day current annualized yield at April 30, 2012.
AGCP Assured Guaranty Corporation
AGM Assured Guaranty Municipal Corporation
AMBAC Ambac Assurance Corporation
AMT Alternative Minimum Tax
FGIC Financial Guaranty Insurance Company
NPFGC National Public Finance Guarantee Corporation
XLCA XL Capital Assurance
Generally accepted accounting principles (GAAP) require disclosure regarding the inputs and valuation techniques used to measure fair value and any changes in valuation inputs or techniques. In addition, investments shall be disclosed by major category.
The Fund categorizes its fair value measurements according to a three-level hierarchy that maximizes the use of observable inputs and minimizes the use of unobservable inputs by prioritizing that the most observable input be used when available. Observable inputs are those that market participants would use in pricing an investment based on market data obtained from sources independent of the reporting entity. Unobservable inputs are those that reflect the Fund's assumptions about the information market participants would use in pricing an investment. An investment's level within the fair value hierarchy is based on the lowest level of any input that is deemed significant to the asset or liability's fair value measurement. The input levels are not necessarily an indication of the risk or liquidity associated with investments at that level. For example, certain U.S. government securities are generally high quality and liquid, however, they are reflected as Level 2 because the inputs used to determine fair value may not always be quoted prices in an active market.
Fair value inputs are summarized in the three broad levels listed below:
• Level 1 — Valuations based on quoted prices for investments in active markets that the Fund has the ability to access at the measurement date (including NAV for open-end mutual funds). Valuation adjustments are not applied to Level 1 investments.
• Level 2 — Valuations based on other significant observable inputs (including quoted prices for similar securities, interest rates, prepayment speeds, credit risks, etc.).
• Level 3 — Valuations based on significant unobservable inputs (including the Fund's own assumptions and judgment in determining the fair value of investments).
Inputs that are used in determining fair value of an investment may include price information, credit data, volatility statistics, and other factors. These inputs can be either observable or unobservable. The availability of observable inputs can vary between investments, and is affected by various factors such as the type of investment, and the volume and level of activity for that investment or similar investments in the marketplace. The inputs will be considered by the Investment Manager, along with any other relevant factors in the calculation of an investment's fair value. The Fund uses prices and inputs that are current as of the measurement date, which may include periods of market dislocations. During these periods, the availability of prices and inputs may be reduced for many investments. This condition could cause an investment to be reclassified between the various levels within the hierarchy.
Investments falling into the Level 3 category are primarily supported by quoted prices from brokers and dealers participating in the market for those investments. However, these may be classified as Level 3 investments due to lack of market transparency and corroboration to support these quoted prices. Additionally, valuation models may be used as the pricing source for any remaining investments classified as Level 3. These models rely on one or more significant unobservable inputs and/or significant assumptions by the Investment Manager. Inputs used in valuations may include, but are not limited to, financial statement analysis, capital account balances, discount rates and estimated cash flows, and comparable company data.
Under the direction of the Fund's Board of Trustees (the Board), the Investment Manager's Valuation Committee (the Committee) is responsible for carrying out the valuation procedures approved by the Board. The Committee consists of voting and non-voting members from various groups within the Investment Manager's organization, including operations and accounting, trading and investments, compliance, risk management and legal.
The Accompanying Notes to Financial Statements are an integral part of this statement.
9
Columbia Maryland Intermediate Municipal Bond Fund
April 30, 2012
| Fair Value Measurements (continued) | |
The Committee meets at least monthly to review and approve valuation matters, which may include a description of specific valuation determinations, data regarding pricing information received from approved pricing vendors and brokers and the results of Board-approved valuation control policies and procedures (the Policies). The Policies address, among other things, instances when market quotations are readily available, including recommendation of third party pricing vendors and a determination of appropriate pricing methodologies; events that require specific valuation determinations and assessment of fair value techniques; securities with a potential for stale pricing, including those that are illiquid, restricted, or in default; and the effectiveness of third-party pricing vendors, including periodic reviews of vendors. The Committee meets more frequently, as needed, to discuss additional valuation matters, which may include the need to review back-testing results, review time-sensitive information or approve related valuation actions. The Committee reports to the Board, with members of the Committee meeting with the Board at each of its regularly scheduled meetings to discuss valuation matters and actions during the period, similar to those described earlier.
For investments categorized as Level 3, the Committee monitors information similar to that described above, which may include: (i) data specific to the issuer or comparable issuers, (ii) general market or specific sector news and (iii) quoted prices and specific or similar security transactions. The Committee considers this data and any changes from prior periods in order to assess the reasonableness of observable and unobservable inputs, any assumptions or internal models used to value those securities and changes in fair value. This data is also used to corroborate, when available, information received from approved pricing vendors and brokers. Various factors impact the frequency of monitoring this information (which may occur as often as daily). However, the Committee may determine that changes to inputs, assumptions and models are not required as a result of the monitoring procedures performed.
The following table is a summary of the inputs used to value the Fund's investments as of April 30, 2012:
| | | Fair Value at April 30, 2012 | |
| Description | | Level 1
Quoted Prices
in Active
Markets for
Identical Assets | | Level 2
Other
Significant
Observable
Inputs | | Level 3
Significant
Unobservable
Inputs | | Total | |
| Bonds | |
| Municipal Bonds | | $ | — | | | $ | 126,965,373 | | | $ | — | | | $ | 126,965,373 | | |
| Total Bonds | | | — | | | | 126,965,373 | | | | — | | | | 126,965,373 | | |
| Other | |
| Money Market Funds | | | 11,180,808 | | | | — | | | | — | | | | 11,180,808 | | |
| Total Other | | | 11,180,808 | | | | — | | | | — | | | | 11,180,808 | | |
| Total | | $ | 11,180,808 | | | $ | 126,965,373 | | | $ | — | | | $ | 138,146,181 | | |
See the Portfolio of Investments for all investment classifications not indicated in the table.
The Fund's assets assigned to the Level 2 input category are generally valued using the market approach, in which a security's value is determined through reference to prices and information from market transactions for similar or identical assets.
There were no transfers of financial assets between Levels 1 and 2 during the period from April 1, 2012 to April 30, 2012.
The following table is a summary of the inputs used to value the Fund's investments as of March 31, 2012:
| | | Fair Value at March 31, 2012 | |
| Description | | Level 1
Quoted Prices
in Active
Markets for
Identical Assets | | Level 2
Other
Significant
Observable
Inputs | | Level 3
Significant
Unobservable
Inputs | | Total | |
| Bonds | |
| Municipal Bonds | | $ | — | | | $ | 127,836,949 | | | $ | — | | | $ | 127,836,949 | | |
| Total Bonds | | | — | | | | 127,836,949 | | | | — | | | | 127,836,949 | | |
| Other | |
| Money Market Funds | | | 9,193,947 | | | | — | | | | — | | | | 9,193,947 | | |
| Total Other | | | 9,193,947 | | | | — | | | | — | | | | 9,193,947 | | |
| Total | | $ | 9,193,947 | | | $ | 127,836,949 | | | $ | — | | | $ | 137,030,896 | | |
The Fund's assets assigned to the Level 2 input category are generally valued using the market approach, in which a security's value is determined through reference to prices and information from market transactions for similar or identical assets.
There were no transfers of financial assets between Levels 1 and 2 during the period from April 1, 2011 to March 31, 2012.
The Accompanying Notes to Financial Statements are an integral part of this statement.
10
Statement of Assets and Liabilities – Columbia Maryland Intermediate Municipal Bond Fund
| | | April 30,
2012 | | March 31,
2012 | |
| Assets | |
| Investments, at value (identified cost $127,626,609 and $127,563,741) | | $ | 138,146,181 | | | $ | 137,030,896 | | |
| Receivable for: | |
| Capital shares sold | | | 66,303 | | | | 158,482 | | |
| Interest | | | 1,554,207 | | | | 1,312,229 | | |
| Expense reimbursement due from Investment Manager | | | 2,492 | | | | 810 | | |
| Prepaid expense | | | 1,027 | | | | 2,055 | | |
| Total assets | | | 139,770,210 | | | | 138,504,472 | | |
| Liabilities | |
| Payable for: | |
| Investments purchased on a delayed delivery basis | | | 1,139,210 | | | | — | | |
| Capital shares purchased | | | 277,399 | | | | 820,755 | | |
| Dividend distributions to shareholders | | | 338,858 | | | | 356,448 | | |
| Investment management fees | | | 4,530 | | | | 1,507 | | |
| Distribution and service fees | | | 752 | | | | 253 | | |
| Transfer agent fees | | | 19,845 | | | | 21,885 | | |
| Administration fees | | | 793 | | | | 264 | | |
| Compensation of board members | | | 80,777 | | | | 78,737 | | |
| Other expenses | | | 13,823 | | | | 32,556 | | |
| Total liabilities | | | 1,875,987 | | | | 1,312,405 | | |
| Net assets applicable to outstanding capital stock | | $ | 137,894,223 | | | $ | 137,192,067 | | |
The Accompanying Notes to Financial Statements are an integral part of this statement.
11
Statement of Assets and Liabilities (continued) – Columbia Maryland Intermediate Municipal Bond Fund
| | | April 30,
2012 | | March 31,
2012 | |
| Represented by | |
| Paid-in capital | | $ | 130,695,855 | | | $ | 131,811,295 | | |
| Undistributed net investment income | | | 175,757 | | | | 164,390 | | |
| Accumulated net realized loss | | | (3,496,961 | ) | | | (4,250,773 | ) | |
| Unrealized appreciation (depreciation) on: | |
| Investments | | | 10,519,572 | | | | 9,467,155 | | |
| Total — representing net assets applicable to outstanding capital stock | | $ | 137,894,223 | | | $ | 137,192,067 | | |
| Net assets applicable to outstanding shares | |
| Class A | | $ | 24,780,723 | | | $ | 24,707,831 | | |
| Class B | | $ | 165,796 | | | $ | 164,230 | | |
| Class C | | $ | 2,821,549 | | | $ | 2,838,256 | | |
| Class Z | | $ | 110,126,155 | | | $ | 109,481,750 | | |
| Shares outstanding | |
| Class A | | | 2,242,738 | | | | 2,254,083 | | |
| Class B | | | 14,994 | | | | 14,971 | | |
| Class C | | | 255,318 | | | | 258,889 | | |
| Class Z | | | 9,964,485 | | | | 9,985,757 | | |
| Net asset value per share | |
| Class A(a) | | $ | 11.05 | | | $ | 10.96 | | |
| Class B | | $ | 11.06 | | | $ | 10.97 | | |
| Class C | | $ | 11.05 | | | $ | 10.96 | | |
| Class Z | | $ | 11.05 | | | $ | 10.96 | | |
(a) At April 30, 2012 and March 31, 2012, the maximum offering price per share for Class A is $11.42 and $11.33, respectively. The offering price is calculated by dividing the net asset value by 1.0 minus the maximum sales charge of 3.25%.
The Accompanying Notes to Financial Statements are an integral part of this statement.
12
Statement of Operations – Columbia Maryland Intermediate Municipal Bond Fund
| Year ended | | April 30,
2012(a) | | March 31,
2012 | |
| Net investment income | |
| Income: | | | | | |
| Dividends | | $ | 82 | | | $ | 931 | | |
| Interest | | | 422,175 | | | | 5,128,343 | | |
| Total income | | | 422,257 | | | | 5,129,274 | | |
| Expenses: | | | | | |
| Investment management fees | | | 46,586 | | | | 531,638 | | |
| Distribution fees | |
| Class B | | | 105 | | | | 1,780 | | |
| Class C | | | 1,779 | | | | 23,826 | | |
| Service fees | | | | | |
| Class B | | | 35 | | | | 594 | | |
| Class C | | | 593 | | | | 7,941 | | |
| Distribution and service fees — Class A | | | 5,229 | | | | 60,408 | | |
| Transfer agent fees | |
| Class A | | | 3,669 | | | | 46,682 | | |
| Class B | | | 24 | | | | 503 | | |
| Class C | | | 416 | | | | 6,163 | | |
| Class Z | | | 16,311 | | | | 198,818 | | |
| Administration fees | | | 8,153 | | | | 112,277 | | |
| Compensation of board members | | | 2,551 | | | | 13,535 | | |
| Pricing and bookkeeping fees | | | — | | | | 8,201 | | |
| Custodian fees | | | 188 | | | | 4,756 | | |
| Printing and postage fees | | | 2,595 | | | | 31,898 | | |
| Registration fees | | | 4,000 | | | | 4,787 | | |
| Professional fees | | | 7,111 | | | | 48,236 | | |
| Chief compliance officer expenses | | | — | | | | 24 | | |
| Other | | | 1,768 | | | | 16,162 | | |
| Total expenses | | | 101,113 | | | | 1,118,229 | | |
| Fees waived or expenses reimbursed by Investment Manager and its affiliates | | | (29,139 | ) | | | (293,304 | ) | |
| Expense reductions | | | — | | | | (60 | ) | |
| Total net expenses | | | 71,974 | | | | 824,865 | | |
| Net investment income | | | 350,283 | | | | 4,304,409 | | |
| Realized and unrealized gain (loss) — net | |
| Net realized gain (loss) on: | | | | | |
| Investments | | | 34,081 | | | | 75,004 | | |
| Net realized gain | | | 34,081 | | | | 75,004 | | |
| Net change in unrealized appreciation (depreciation) on: | |
| Investments | | | 1,052,417 | | | | 6,645,176 | | |
| Net change in unrealized appreciation | | | 1,052,417 | | | | 6,645,176 | | |
| Net realized and unrealized gain | | | 1,086,498 | | | | 6,720,180 | | |
| Net increase in net assets resulting from operations | | $ | 1,436,781 | | | $ | 11,024,589 | | |
(a) For the period from April 1, 2012 to April 30, 2012. During the period, the Fund's fiscal year end was changed from March 31 to April 30.
The Accompanying Notes to Financial Statements are an integral part of this statement.
13
Statement of Changes in Net Assets – Columbia Maryland Intermediate Municipal Bond Fund
| Year ended | | April 30,
2012(a) | | March 31,
2012 | | March 31,
2011 | |
| Operations | |
| Net investment income | | $ | 350,283 | | | $ | 4,304,409 | | | $ | 5,158,020 | | |
| Net realized gain | | | 34,081 | | | | 75,004 | | | | 271,338 | | |
| Net change in unrealized appreciation (depreciation) | | | 1,052,417 | | | | 6,645,176 | | | | (1,709,143 | ) | |
| Net increase in net assets resulting from operations | | | 1,436,781 | | | | 11,024,589 | | | | 3,720,215 | | |
| Distributions to shareholders from: | |
| Net investment income | |
| Class A | | | (57,180 | ) | | | (739,657 | ) | | | (843,558 | ) | |
| Class B | | | (280 | ) | | | (5,541 | ) | | | (14,545 | ) | |
| Class C | | | (4,781 | ) | | | (73,733 | ) | | | (97,205 | ) | |
| Class Z | | | (276,675 | ) | | | (3,486,613 | ) | | | (4,202,712 | ) | |
| Total distributions to shareholders | | | (338,916 | ) | | | (4,305,544 | ) | | | (5,158,020 | ) | |
| Decrease in net assets from share transactions | | | (395,709 | ) | | | (87,900 | ) | | | (30,855,959 | ) | |
| Total increase (decrease) in net assets | | | 702,156 | | | | 6,631,145 | | | | (32,293,764 | ) | |
| Net assets at beginning of year | | | 137,192,067 | | | | 130,560,922 | | | | 162,854,686 | | |
| Net assets at end of year | | $ | 137,894,223 | | | $ | 137,192,067 | | | $ | 130,560,922 | | |
| Undistributed net investment income | | $ | 175,757 | | | $ | 164,390 | | | $ | 165,047 | | |
(a) For the period from April 1, 2012 to April 30, 2012. During the period, the Fund's fiscal year end was changed from March 31 to April 30.
The Accompanying Notes to Financial Statements are an integral part of this statement.
14
Statement of Changes in Net Assets (continued) – Columbia Maryland Intermediate Municipal Bond Fund
| Year ended | | April 30, 2012(a) | | March 31, 2012 | | March 31, 2011 | |
| | | Shares | | Dollars ($) | | Shares | | Dollars ($) | | Shares | | Dollars ($) | |
| Capital stock activity | |
| Class A shares | |
| Subscriptions(b) | | | 4,381 | | | | 48,387 | | | | 199,208 | | | | 2,151,822 | | | | 231,923 | | | | 2,474,616 | | |
| Distributions reinvested | | | 1,269 | | | | 14,018 | | | | 15,538 | | | | 168,507 | | | | 35,693 | | | | 381,387 | | |
| Redemptions | | | (16,995 | ) | | | (186,859 | ) | | | (213,412 | ) | | | (2,287,445 | ) | | | (618,863 | ) | | | (6,579,671 | ) | |
| Net increase (decrease) | | | (11,345 | ) | | | (124,454 | ) | | | 1,334 | | | | 32,884 | | | | (351,247 | ) | | | (3,723,668 | ) | |
| Class B shares | |
| Subscriptions | | | 10 | | | | 111 | | | | 187 | | | | 2,013 | | | | 348 | | | | 3,697 | | |
| Distributions reinvested | | | 15 | | | | 169 | | | | 200 | | | | 2,170 | | | | 654 | | | | 6,984 | | |
| Redemptions(b) | | | (2 | ) | | | (29 | ) | | | (20,987 | ) | | | (225,328 | ) | | | (53,603 | ) | | | (572,016 | ) | |
| Net increase (decrease) | | | 23 | | | | 251 | | | | (20,600 | ) | | | (221,145 | ) | | | (52,601 | ) | | | (561,335 | ) | |
| Class C shares | |
| Subscriptions | | | 9,739 | | | | 107,311 | | | | 48,269 | | | | 526,024 | | | | 175,943 | | | | 1,892,940 | | |
| Distributions reinvested | | | 259 | | | | 2,859 | | | | 4,298 | | | | 46,512 | | | | 5,851 | | | | 62,325 | | |
| Redemptions | | | (13,569 | ) | | | (149,080 | ) | | | (149,498 | ) | | | (1,616,516 | ) | | | (136,350 | ) | | | (1,439,106 | ) | |
| Net increase (decrease) | | | (3,571 | ) | | | (38,910 | ) | | | (96,931 | ) | | | (1,043,980 | ) | | | 45,444 | | | | 516,159 | | |
| Class Z shares | |
| Subscriptions | | | 75,448 | | | | 831,559 | | | | 1,522,571 | | | | 16,591,299 | | | | 684,337 | | | | 7,323,647 | | |
| Distributions reinvested | | | 1,118 | | | | 12,350 | | | | 12,260 | | | | 132,978 | | | | 16,832 | | | | 179,322 | | |
| Redemptions | | | (97,838 | ) | | | (1,076,505 | ) | | | (1,442,848 | ) | | | (15,579,936 | ) | | | (3,266,739 | ) | | | (34,590,084 | ) | |
| Net increase (decrease) | | | (21,272 | ) | | | (232,596 | ) | | | 91,983 | | | | 1,144,341 | | | | (2,565,570 | ) | | | (27,087,115 | ) | |
| Total net decrease | | | (36,165 | ) | | | (395,709 | ) | | | (24,214 | ) | | | (87,900 | ) | | | (2,923,974 | ) | | | (30,855,959 | ) | |
(a) For the period from April 1, 2012 to April 30, 2012. During the period, the Fund's fiscal year end was changed from March 31 to April 30.
(b) Includes conversions of Class B shares to Class A shares, if any.
The Accompanying Notes to Financial Statements are an integral part of this statement.
15
Financial Highlights – Columbia Maryland Intermediate Municipal Bond Fund
The following tables are intended to help you understand the Fund's financial performance. Certain information reflects financial results for a single share of a class held for the periods shown. Per share net investment income (loss) amounts are calculated based on average shares outstanding during the period. Total returns assume reinvestment of all dividends and distributions. Total returns do not reflect payment of sales charges, if any, and are not annualized for periods of less than one year.
| | | Year ended
April 30, | | Year ended March 31, | |
| | | 2012(a) | | 2012 | | 2011 | | 2010 | | 2009 | | 2008 | |
| Class A | |
| Per share data | |
| Net asset value, beginning of period | | $ | 10.96 | | | $ | 10.41 | | | $ | 10.53 | | | $ | 10.08 | | | $ | 10.44 | | | $ | 10.63 | | |
| Income from investment operations: | |
| Net investment income | | | 0.03 | | | | 0.33 | | | | 0.34 | | | | 0.34 | | | | 0.38 | | | | 0.39 | | |
| Net realized and unrealized gain (loss) | | | 0.09 | | | | 0.55 | | | | (0.12 | ) | | | 0.45 | | | | (0.36 | ) | | | (0.19 | ) | |
| Total from investment operations | | | 0.12 | | | | 0.88 | | | | 0.22 | | | | 0.79 | | | | 0.02 | | | | 0.20 | | |
| Less distributions to shareholders from: | |
| Net investment income | | | (0.03 | ) | | | (0.33 | ) | | | (0.34 | ) | | | (0.34 | ) | | | (0.38 | ) | | | (0.39 | ) | |
| Total distributions to shareholders | | | (0.03 | ) | | | (0.33 | ) | | | (0.34 | ) | | | (0.34 | ) | | | (0.38 | ) | | | (0.39 | ) | |
| Net asset value, end of period | | $ | 11.05 | | | $ | 10.96 | | | $ | 10.41 | | | $ | 10.53 | | | $ | 10.08 | | | $ | 10.44 | | |
| Total return | | | 1.05 | % | | | 8.55 | % | | | 2.05 | % | | | 7.93 | % | | | 0.26 | % | | | 1.96 | % | |
| Ratios to average net assets(b) | |
| Expenses prior to fees waived or expenses reimbursed | | | 1.05 | %(c) | | | 1.03 | % | | | 0.97 | % | | | 0.94 | % | | | 0.90 | % | | | 0.91 | % | |
| Net expenses after fees waived or expenses reimbursed(d) | | | 0.80 | %(c) | | | 0.80 | %(e) | | | 0.80 | %(e) | | | 0.79 | %(e) | | | 0.75 | %(e) | | | 0.75 | %(e) | |
| Net investment income | | | 2.83 | %(c) | | | 3.07 | %(e) | | | 3.18 | %(e) | | | 3.26 | %(e) | | | 3.76 | %(e) | | | 3.74 | %(e) | |
| Supplemental data | |
| Net assets, end of period (in thousands) | | $ | 24,781 | | | $ | 24,708 | | | $ | 23,454 | | | $ | 27,423 | | | $ | 23,530 | | | $ | 24,405 | | |
| Portfolio turnover | | | 1 | % | | | 7 | % | | | 11 | % | | | 23 | % | | | 11 | % | | | 8 | % | |
Notes to Financial Highlights
(a) For the period from April 1, 2012 to April 30, 2012. During the period, the Fund's fiscal year end was changed from March 31 to April 30.
(b) In addition to the fees and expenses which the Fund bears directly, the Fund indirectly bears a pro rata share of the fees and expenses of the acquired funds in which it invests. Such indirect expenses are not included in the reported expense ratios.
(c) Annualized.
(d) The Investment Manager and certain of its affiliates agreed to waive/reimburse certain fees and expenses, if applicable.
(e) The benefits derived from expense reductions had an impact of less than 0.01%.
The Accompanying Notes to Financial Statements are an integral part of this statement.
16
Financial Highlights (continued) – Columbia Maryland Intermediate Municipal Bond Fund
| | | Year ended
April 30, | | Year ended March 31, | |
| | | 2012(a) | | 2012 | | 2011 | | 2010 | | 2009 | | 2008 | |
| Class B | |
| Per share data | |
| Net asset value, beginning of period | | $ | 10.97 | | | $ | 10.42 | | | $ | 10.54 | | | $ | 10.09 | | | $ | 10.45 | | | $ | 10.64 | | |
| Income from investment operations: | |
| Net investment income | | | 0.02 | | | | 0.25 | | | | 0.26 | | | | 0.27 | | | | 0.31 | | | | 0.32 | | |
| Net realized and unrealized gain (loss) | | | 0.09 | | | | 0.55 | | | | (0.12 | ) | | | 0.45 | | | | (0.36 | ) | | | (0.19 | ) | |
| Total from investment operations | | | 0.11 | | | | 0.80 | | | | 0.14 | | | | 0.72 | | | | (0.05 | ) | | | 0.13 | | |
| Less distributions to shareholders from: | |
| Net investment income | | | (0.02 | ) | | | (0.25 | ) | | | (0.26 | ) | | | (0.27 | ) | | | (0.31 | ) | | | (0.32 | ) | |
| Total distributions to shareholders | | | (0.02 | ) | | | (0.25 | ) | | | (0.26 | ) | | | (0.27 | ) | | | (0.31 | ) | | | (0.32 | ) | |
| Net asset value, end of period | | $ | 11.06 | | | $ | 10.97 | | | $ | 10.42 | | | $ | 10.54 | | | $ | 10.09 | | | $ | 10.45 | | |
| Total return | | | 0.99 | % | | | 7.73 | % | | | 1.30 | % | | | 7.13 | % | | | (0.48 | %) | | | 1.20 | % | |
| Ratios to average net assets(b) | |
| Expenses prior to fees waived or expenses reimbursed | | | 1.80 | %(c) | | | 1.81 | % | | | 1.72 | % | | | 1.69 | % | | | 1.65 | % | | | 1.66 | % | |
| Net expenses after fees waived or expenses reimbursed(d) | | | 1.55 | %(c) | | | 1.55 | %(e) | | | 1.55 | %(e) | | | 1.54 | %(e) | | | 1.50 | %(e) | | | 1.50 | %(e) | |
| Net investment income | | | 2.08 | %(c) | | | 2.34 | %(e) | | | 2.43 | %(e) | | | 2.56 | %(e) | | | 3.01 | %(e) | | | 3.00 | %(e) | |
| Supplemental data | |
| Net assets, end of period (in thousands) | | $ | 166 | | | $ | 164 | | | $ | 371 | | | $ | 929 | | | $ | 2,220 | | | $ | 2,689 | | |
| Portfolio turnover | | | 1 | % | | | 7 | % | | | 11 | % | | | 23 | % | | | 11 | % | | | 8 | % | |
Notes to Financial Highlights
(a) For the period from April 1, 2012 to April 30, 2012. During the period, the Fund's fiscal year end was changed from March 31 to April 30.
(b) In addition to the fees and expenses which the Fund bears directly, the Fund indirectly bears a pro rata share of the fees and expenses of the acquired funds in which it invests. Such indirect expenses are not included in the reported expense ratios.
(c) Annualized.
(d) The Investment Manager and certain of its affiliates agreed to waive/reimburse certain fees and expenses, if applicable.
(e) The benefits derived from expense reductions had an impact of less than 0.01%.
The Accompanying Notes to Financial Statements are an integral part of this statement.
17
Financial Highlights (continued) – Columbia Maryland Intermediate Municipal Bond Fund
| | | Year ended
April 30, | | Year ended March 31, | |
| | | 2012(a) | | 2012 | | 2011 | | 2010 | | 2009 | | 2008 | |
| Class C | |
| Per share data | |
| Net asset value, beginning of period | | $ | 10.96 | | | $ | 10.41 | | | $ | 10.53 | | | $ | 10.08 | | | $ | 10.44 | | | $ | 10.63 | | |
| Income from investment operations: | |
| Net investment income | | | 0.02 | | | | 0.25 | | | | 0.26 | | | | 0.26 | | | | 0.31 | | | | 0.32 | | |
| Net realized and unrealized gain (loss) | | | 0.09 | | | | 0.55 | | | | (0.12 | ) | | | 0.45 | | | | (0.36 | ) | | | (0.19 | ) | |
| Total from investment operations | | | 0.11 | | | | 0.80 | | | | 0.14 | | | | 0.71 | | | | (0.05 | ) | | | 0.13 | | |
| Less distributions to shareholders from: | |
| Net investment income | | | (0.02 | ) | | | (0.25 | ) | | | (0.26 | ) | | | (0.26 | ) | | | (0.31 | ) | | | (0.32 | ) | |
| Total distributions to shareholders | | | (0.02 | ) | | | (0.25 | ) | | | (0.26 | ) | | | (0.26 | ) | | | (0.31 | ) | | | (0.32 | ) | |
| Net asset value, end of period | | $ | 11.05 | | | $ | 10.96 | | | $ | 10.41 | | | $ | 10.53 | | | $ | 10.08 | | | $ | 10.44 | | |
| Total return | | | 0.99 | % | | | 7.74 | % | | | 1.29 | % | | | 7.12 | % | | | (0.49 | %) | | | 1.20 | % | |
| Ratios to average net assets(b) | |
| Expenses prior to fees waived or expenses reimbursed | | | 1.80 | %(c) | | | 1.78 | % | | | 1.72 | % | | | 1.69 | % | | | 1.65 | % | | | 1.66 | % | |
| Net expenses after fees waived or expenses reimbursed(d) | | | 1.55 | %(c) | | | 1.55 | %(e) | | | 1.55 | %(e) | | | 1.54 | %(e) | | | 1.50 | %(e) | | | 1.50 | %(e) | |
| Net investment income | | | 2.09 | %(c) | | | 2.33 | %(e) | | | 2.42 | %(e) | | | 2.49 | %(e) | | | 3.02 | %(e) | | | 2.99 | %(e) | |
| Supplemental data | |
| Net assets, end of period (in thousands) | | $ | 2,822 | | | $ | 2,838 | | | $ | 3,705 | | | $ | 3,269 | | | $ | 2,143 | | | $ | 1,597 | | |
| Portfolio turnover | | | 1 | % | | | 7 | % | | | 11 | % | | | 23 | % | | | 11 | % | | | 8 | % | |
Notes to Financial Highlights
(a) For the period from April 1, 2012 to April 30, 2012. During the period, the Fund's fiscal year end was changed from March 31 to April 30.
(b) In addition to the fees and expenses which the Fund bears directly, the Fund indirectly bears a pro rata share of the fees and expenses of the acquired funds in which it invests. Such indirect expenses are not included in the reported expense ratios.
(c) Annualized.
(d) The Investment Manager and certain of its affiliates agreed to waive/reimburse certain fees and expenses, if applicable.
(e) The benefits derived from expense reductions had an impact of less than 0.01%.
The Accompanying Notes to Financial Statements are an integral part of this statement.
18
Financial Highlights (continued) – Columbia Maryland Intermediate Municipal Bond Fund
| | | Year ended
April 30, | | Year ended March 31, | |
| | | 2012(a) | | 2012 | | 2011 | | 2010 | | 2009 | | 2008 | |
| Class Z | |
| Per share data | |
| Net asset value, beginning of period | | $ | 10.96 | | | $ | 10.41 | | | $ | 10.53 | | | $ | 10.09 | | | $ | 10.44 | | | $ | 10.63 | | |
| Income from investment operations: | |
| Net investment income | | | 0.03 | | | | 0.36 | | | | 0.36 | | | | 0.37 | | | | 0.41 | | | | 0.42 | | |
| Net realized and unrealized gain (loss) | | | 0.09 | | | | 0.55 | | | | (0.11 | ) | | | 0.44 | | | | (0.35 | ) | | | (0.19 | ) | |
| Total from investment operations | | | 0.12 | | | | 0.91 | | | | 0.25 | | | | 0.81 | | | | 0.06 | | | | 0.23 | | |
| Less distributions to shareholders from: | |
| Net investment income | | | (0.03 | ) | | | (0.36 | ) | | | (0.37 | ) | | | (0.37 | ) | | | (0.41 | ) | | | (0.42 | ) | |
| Total distributions to shareholders | | | (0.03 | ) | | | (0.36 | ) | | | (0.37 | ) | | | (0.37 | ) | | | (0.41 | ) | | | (0.42 | ) | |
| Net asset value, end of period | | $ | 11.05 | | | $ | 10.96 | | | $ | 10.41 | | | $ | 10.53 | | | $ | 10.09 | | | $ | 10.44 | | |
| Total return | | | 1.07 | % | | | 8.82 | % | | | 2.31 | % | | | 8.09 | % | | | 0.61 | % | | | 2.21 | % | |
| Ratios to average net assets(b) | |
| Expenses prior to fees waived or expenses reimbursed | | | 0.80 | %(c) | | | 0.77 | % | | | 0.72 | % | | | 0.69 | % | | | 0.65 | % | | | 0.66 | % | |
| Net expenses after fees waived or expenses reimbursed(d) | | | 0.55 | %(c) | | | 0.55 | %(e) | | | 0.55 | %(e) | | | 0.54 | %(e) | | | 0.50 | %(e) | | | 0.50 | %(e) | |
| Net investment income | | | 3.07 | %(c) | | | 3.31 | %(e) | | | 3.43 | %(e) | | | 3.52 | %(e) | | | 4.01 | %(e) | | | 3.99 | %(e) | |
| Supplemental data | |
| Net assets, end of period (in thousands) | | $ | 110,126 | | | $ | 109,482 | | | $ | 103,031 | | | $ | 131,234 | | | $ | 126,661 | | | $ | 135,506 | | |
| Portfolio turnover | | | 1 | % | | | 7 | % | | | 11 | % | | | 23 | % | | | 11 | % | | | 8 | % | |
Notes to Financial Highlights
(a) For the period from April 1, 2012 to April 30, 2012. During the period, the Fund's fiscal year end was changed from March 31 to April 30.
(b) In addition to the fees and expenses which the Fund bears directly, the Fund indirectly bears a pro rata share of the fees and expenses of the acquired funds in which it invests. Such indirect expenses are not included in the reported expense ratios.
(c) Annualized.
(d) The Investment Manager and certain of its affiliates agreed to waive/reimburse certain fees and expenses, if applicable.
(e) The benefits derived from expense reductions had an impact of less than 0.01%.
The Accompanying Notes to Financial Statements are an integral part of this statement.
19
Notes to Financial Statements – Columbia Maryland Intermediate Municipal Bond Fund
April 30, 2012
Note 1. Organization
Columbia Maryland Intermediate Municipal Bond Fund (the Fund), a series of Columbia Funds Series Trust (the Trust), is a non-diversified fund. The Trust is registered under the Investment Company Act of 1940, as amended (the 1940 Act), as an open-end management investment company organized as a Delaware statutory trust.
Fiscal Year End Change
During the period, the Fund changed its fiscal year end from March 31 to April 30. Accordingly, this report includes activity for the period April 1, 2012 to April 30, 2012 and the year ended March 31, 2012.
Fund Shares
The Trust may issue an unlimited number of shares (without par value). The Fund offers Class A, Class B, Class C and Class Z shares. All share classes have identical voting, dividend and liquidation rights. Each share class has its own expense structure and sales charges, as applicable.
Class A shares are subject to a maximum front-end sales charge of 3.25% based on the initial investment amount. Class A shares purchased without an initial sales charge in accounts aggregating $1 million to $50 million at the time of purchase are subject to a contingent deferred sales charge (CDSC) if the shares are sold within 18 months of purchase, charged as follows: 1.00% CDSC if redeemed within 12 months of purchase, and 0.50% CDSC if redeemed more than 12, but less than 18, months after purchase.
Class B shares may be subject to a maximum CDSC of 3.00% based upon the holding period after purchase. Class B shares will generally convert to Class A shares eight years after purchase. The Fund no longer accepts investments by new or existing investors in the Fund's Class B shares, except in connection with the reinvestment of any dividend and/or capital gain distributions in Class B shares of the Fund and exchanges by existing Class B shareholders of certain other funds within the Columbia Family of Funds.
Class C shares are subject to a 1.00% CDSC on shares redeemed within one year of purchase.
Class Z shares are not subject to sales charges, and are only available to certain investors, as described in the Fund's prospectus.
Note 2. Summary of Significant Accounting Policies
Use of Estimates
The preparation of financial statements in accordance with U.S. generally accepted accounting principles (GAAP) requires management to make certain estimates and assumptions that affect the reported amounts of assets and liabilities, the disclosure of contingent assets and liabilities at the date of the financial statements and the reported amounts of revenue and expenses during the reporting period. Actual results could differ from those estimates.
The following is a summary of significant accounting policies consistently followed by the Fund in the preparation of its financial statements.
Security Valuation
Debt securities generally are valued by pricing services approved by the Board of Trustees (the Board) based upon market transactions for normal, institutional-size trading units of similar securities. The services may use various pricing techniques which take into account appropriate factors such as yield, quality, coupon rate, maturity, type of issue, trading characteristics and other data, as well as broker quotes. Debt securities for which quotations are readily available may also be valued based upon an over-the-counter or exchange bid quotation.
Investments in other open-end investment companies, including money market funds, are valued at net asset value.
Short-term securities purchased within 60 days to maturity are valued at amortized cost, which approximates market value. The value of short-term securities originally purchased with maturities greater than 60 days is determined based on an amortized value to par upon reaching 60 days to maturity. Short-term securities maturing in more than 60 days from the valuation date are valued at the market price or approximate market value based on current interest rates.
Investments for which market quotations are not readily available, or that have quotations which management believes are not reliable, are valued at fair value as determined in good faith under consistently applied procedures established by and under the general supervision of the Board. If a security or class of securities (such as foreign securities) is valued at fair
20
Columbia Maryland Intermediate Municipal Bond Fund, April 30, 2012
value, such value is likely to be different from the last quoted market price for the security. The determination of fair value often requires significant judgment. To determine fair value, management may use assumptions including but not limited to future cash flows and estimated risk premiums. Multiple inputs from various sources may be used to determine value.
Security Transactions
Security transactions are accounted for on the trade date. Cost is determined and gains (losses) are based upon the specific identification method for both financial statement and federal income tax purposes.
Income Recognition
Interest income is recorded on the accrual basis. Market premium and discount are amortized and accreted, respectively, on all debt securities, unless otherwise noted. Original issue discount is accreted to interest income over the life of the security with a corresponding increase in the cost basis, if any.
Dividend income is recorded on the ex-dividend date.
Expenses
General expenses of the Trust are allocated to the Fund and other funds of the Trust based upon relative net assets or other expense allocation methodologies determined by the nature of the expense. Expenses directly attributable to the Fund are charged to the Fund. Expenses directly attributable to a specific class of shares are charged to that share class.
Determination of Class Net Asset Value
All income, expenses (other than class-specific expenses, which are charged to that share class, as shown in the Statement of Operations) and realized and unrealized gains (losses) are allocated to each class of the Fund on a daily basis for purposes of determining the net asset value of each class. Income and expenses are allocated to each class based on the settled shares method, while realized and unrealized gains (losses) are allocated based on the relative net assets of each class.
Federal Income Tax Status
The Fund intends to qualify each year as a regulated investment company under Subchapter M of the Internal Revenue Code, as amended, and will distribute substantially all of its tax exempt or taxable income (including net short-term capital gains), if any, for its tax year, and as such will not be subject to federal income taxes. In addition, the Fund intends to distribute in each calendar year substantially all of its net investment income, capital gains and certain other amounts, if any, such that the Fund should not be subject to federal excise tax. Therefore, no federal income or excise tax provision is recorded.
Distributions to Shareholders
Distributions from net investment income are declared daily and paid monthly. Net realized capital gains, if any, are distributed at least annually. Income distributions and capital gain distributions are determined in accordance with federal income tax regulations which may differ from GAAP.
Guarantees and Indemnifications
Under the Trust's organizational documents and, in some cases, by contract, its officers and trustees are indemnified against certain liabilities arising out of the performance of their duties to the Trust or its funds. In addition, certain of the Fund's contracts with its service providers contain general indemnification clauses. The Fund's maximum exposure under these arrangements is unknown since the amount of any future claims that may be made against the Fund cannot be determined, and the Fund has no historical basis for predicting the likelihood of any such claims.
Note 3. Fees and Compensation Paid to Affiliates
Investment Management Fees
Under an Investment Management Services Agreement, Columbia Management Investment Advisers, LLC (the Investment Manager), a wholly-owned subsidiary of Ameriprise Financial, Inc. (Ameriprise Financial), determines which securities will be purchased, held or sold. The management fee is an annual fee that is equal to a percentage of the Fund's average daily net assets that declines from 0.40% to 0.27% as the Fund's net assets increase. For the period April 1, 2012 to April 30, 2012 and the year ended March 31, 2012, the annualized effective management fee rate was 0.40% of the Fund's average daily net assets.
Administration Fees
Under an Administrative Services Agreement, the Investment Manager serves as the Fund Administrator. Effective
21
Columbia Maryland Intermediate Municipal Bond Fund, April 30, 2012
July 1, 2011, the Fund pays the Fund Administrator an annual fee for administration and accounting services equal to a percentage of the Fund's average daily net assets that declines from 0.07% to 0.04% as the Fund's net assets increase. Prior to July 1, 2011, the administration fee was equal to the annual rate of 0.15% of the Fund's average daily net assets, less the fees that were payable by the Fund as described under the Pricing and Bookkeeping Fees note below.
For the period April 1, 2012 to April 30, 2012, the annualized effective administration fee rate was 0.07% of the Fund's average daily net assets. For the year ended March 31, 2012, the effective administration fee rate was 0.09% of the Fund's average daily net assets.
Pricing and Bookkeeping Fees
Prior to May 16, 2011, the Fund had entered into a Financial Reporting Services Agreement (the Financial Reporting Services Agreement) with State Street Bank and Trust Company (State Street) and the Investment Manager pursuant to which State Street provided financial reporting services to the Fund. The Fund also entered into an Accounting Services Agreement (collectively with the Financial Reporting Services Agreement, the State Street Agreements) with State Street and the Investment Manager pursuant to which State Street provided accounting services to the Fund. Under the State Street Agreements, the Fund paid State Street an annual fee of $38,000 paid monthly plus an additional monthly fee based on an annualized percentage rate of average daily net assets of the Fund for the month. The aggregate fee did not exceed $140,000 per year (exclusive of out-of-pocket expenses and charges). The Fund also reimbursed State Street for certain out-of-pocket expenses and charges. Effective May 16, 2011, these services are provided under the Administrative Services Agreement discussed above.
Other Fees
Effective June 1, 2011, other expenses are for, among other things, certain expenses of the Fund or the Board, including: Fund boardroom and office expense, employee compensation, employee health and retirement benefits, and certain other expenses. Payment of these Fund and Board expenses is facilitated by a company providing limited administrative services to the Fund and the Board. For the period April 1, 2012 to April 30, 2012 and the period June 1, 2011 through March 31, 2012, other expenses paid to this company were $128 and $1,699, respectively.
Compensation of Board Members
Board members are compensated for their services to the Fund as disclosed in the Statement of Operations. Under a Deferred Compensation Plan (the Plan), the Board members who are not "interested persons" of the Fund, as defined under the 1940 Act, may elect to defer payment of up to 100% of their compensation. Deferred amounts are treated as though equivalent dollar amounts had been invested in shares of certain funds managed by the Investment Manager. The Fund's liability for these amounts is adjusted for market value changes and remains in the Fund until distributed in accordance with the Plan.
Compensation of Chief Compliance Officer
The Board has appointed a Chief Compliance Officer to the Fund in accordance with federal securities regulations. The Fund's expenses associated with the Chief Compliance Officer are paid directly by the Investment Manager.
Transfer Agent Fees
Under a Transfer and Dividend Disbursing Agent Agreement, Columbia Management Investment Services Corp. (the Transfer Agent), an affiliate of the Investment Manager and a wholly-owned subsidiary of Ameriprise Financial, is responsible for providing transfer agency services to the Fund. The Transfer Agent has contracted with Boston Financial Data Services (BFDS) to serve as sub-transfer agent.
The Transfer Agent receives monthly account-based service fees based on the number of open accounts and is reimbursed by the Fund for the fees and expenses the Transfer Agent pays to financial intermediaries that maintain omnibus accounts with the Fund that is a percentage of the average aggregate value of the Fund's shares maintained in each such omnibus account (other than omnibus accounts for which American Enterprise Investment Services Inc. is the broker of record or accounts where the beneficial shareholder is a customer of Ameriprise Financial Services, Inc., which are paid a per account fee). The Transfer Agent pays the fees of BFDS for services as sub-transfer agent and is not entitled to reimbursement for such fees from the Fund (with the exception of out-of-pocket fees).
22
Columbia Maryland Intermediate Municipal Bond Fund, April 30, 2012
The Transfer Agent also receives compensation from fees for various shareholder services and reimbursements for certain out-of-pocket expenses.
For the period April 1, 2012 to April 30, 2012 and the year ended March 31, 2012, the Fund's annualized effective transfer agent fee rates as a percentage of average daily net assets of each class were as follows:
| | | Period ended
April 30,
2012 | | Year ended
March 31,
2012 | |
| Class A | | | 0.17 | % | | | 0.19 | % | |
| Class B | | | 0.17 | | | | 0.21 | | |
| Class C | | | 0.17 | | | | 0.19 | | |
| Class Z | | | 0.17 | | | | 0.19 | | |
An annual minimum account balance fee of $20 may apply to certain accounts with a value below the Fund's initial minimum investment requirements to reduce the impact of small accounts on transfer agent fees. These minimum account balance fees are recorded as part of expense reductions in the Statement of Operations. For the period April 1, 2012 to April 30, 2012, no minimum account balance fees were charged to accounts. For the year ended March 31, 2012, these minimum account balance fees reduced total expenses by $60.
Distribution and Service Fees
The Fund has an agreement with Columbia Management Investment Distributors, Inc. (the Distributor), an affiliate of the Investment Manager and a wholly-owned subsidiary of Ameriprise Financial, for distribution and shareholder services. Pursuant to Rule 12b-1 under the 1940 Act, the Board has approved, and the Fund has adopted, distribution and shareholder service plans (the Plans) which set the distribution and service fees for the Fund. These fees are calculated daily and are intended to compensate the Distributor and/or eligible selling and/or servicing agents for selling shares of the Fund and providing services to investors.
The Plans require the payment of a monthly combined distribution and service fee to the Distributor at the maximum annual rate of 0.25% of the average daily net assets attributable to Class A shares of the Fund. The Plans also require the payment of a monthly service fee at the maximum annual rate of 0.25% of the average daily net assets attributable to Class B and Class C shares of the Fund and the payment of a monthly distribution fee at the maximum annual rate of 0.75% of the average daily net assets attributable to Class B and Class C shares of the Fund.
Sales Charges
Sales charges, including front-end charges and CDSCs, received by the Distributor for distributing Fund shares were $342 for Class A shares for the period April 1, 2012 to April 30, 2012, and $31,062 for Class A, $30 for Class B and $1,726 for Class C for the year ended March 31, 2012.
Expenses Waived/Reimbursed by the Investment Manager and its Affiliates
Effective August 1, 2011, the Investment Manager and certain of its affiliates have contractually agreed to waive fees and/or reimburse expenses (excluding certain fees and expenses described below), through July 31, 2012, unless sooner terminated at the sole discretion of the Board, so that the Fund's net operating expenses, after giving effect to fees waived/expenses reimbursed and any balance credits and/or overdraft charges from the Fund's custodian, do not exceed the following annual rates as a percentage of the class' average daily net assets:
| Class A | | | 0.80 | % | |
| Class B | | | 1.55 | | |
| Class C | | | 1.55 | | |
| Class Z | | | 0.55 | | |
Under the agreement, the following fees and expenses are excluded from the waiver/reimbursement commitment, and therefore will be paid by the Fund, if applicable: taxes (including foreign transaction taxes), expenses associated with investments in affiliated and non-affiliated pooled investment vehicles (including mutual funds and exchange traded funds), transaction costs and brokerage commissions, costs related to any securities lending program, dividend expenses associated with securities sold short, inverse floater program fees and expenses, transaction charges and interest on borrowed money, interest, extraordinary expenses and any other expenses the exclusion of which is specifically approved by the Fund's Board. This agreement may be modified or amended only with approval from all parties.
23
Columbia Maryland Intermediate Municipal Bond Fund, April 30, 2012
Prior to August 1, 2011, the Investment Manager voluntarily agreed to reimburse a portion of the Fund's expenses (excluding certain expenses, such as distribution and services fees, brokerage commissions, interest, taxes and extraordinary expenses, but including custodian charges relating to overdrafts, if any) so that the Fund's ordinary net operating expenses, after giving effect to fees waived/expenses reimbursed and any balance credits from the Fund's custodian, did not exceed 0.55% of the Fund's average daily net assets on an annualized basis.
Prior to May 1, 2011, the Investment Manager was entitled to recover from the Fund any fees waived and/or expenses reimbursed for a three year period following the date of such fee waiver and/or reimbursement under these arrangements if such recovery did not cause the Fund's expenses to exceed the expense limitations in effect at the time of recovery. Effective May 1, 2011, the Investment Manager has eliminated such fee recoupment provisions.
Note 4. Federal Tax Information
The timing and character of income and capital gain distributions are determined in accordance with income tax regulations, which may differ from GAAP because of temporary or permanent book to tax differences.
For the period April 1, 2012 to April 30, 2012, these differences are primarily due to differing treatment for Trustees' deferred compensation, distributions, expiring capital loss carryforwards, and market discount/premium. For the year ended March 31, 2012, these differences are primarily due to differing treatment for Trustees' deferred compensation, distributions, and market discount/premium. To the extent these differences are permanent, reclassifications are made among the components of the Fund's net assets in the Statement of Assets and Liabilities. Temporary differences do not require reclassifications. In the Statement of Assets and Liabilities the following reclassifications were made:
| | | Period ended
April 30,
2012 | | Year ended
March 31,
2012 | |
Undistributed net investment
income | | $ | — | | | $ | 478 | | |
| Accumulated net realized loss | | | 719,731 | | | | (484 | ) | |
| Paid-in capital | | | (719,731 | ) | | | 6 | | |
Net investment income and net realized gains (losses), as disclosed in the Statement of Operations, and net assets were not affected by this reclassification.
The tax character of distributions paid during the periods indicated was as follows:
| | | Period ended
April 30,
2012 | | Year ended
March 31,
2012 | | Year ended
March 31,
2011 | |
Tax-exempt
income | | $ | 338,031 | | | $ | 4,285,655 | | | $ | 5,135,836 | | |
Ordinary
income | | | 885 | | | | 19,889 | | | | 22,184 | | |
Short-term capital gain distributions, if any, are considered ordinary income distributions for tax purposes.
At April 30, 2012 and March 31, 2012, the components of distributable earnings on a tax basis were as follows:
| | | April 30,
2012 | | March 31,
2012 | |
| Undistributed tax-exempt income | | $ | 440,965 | | | $ | 448,502 | | |
Undistributed accumulated
long-term capital gains | | | — | | | | — | | |
| Unrealized appreciation | | | 10,667,760 | | | | 9,614,029 | | |
At April 30, 2012 and March 31, 2012, the cost of investments for federal income tax purposes, and the aggregate unrealized appreciation and depreciation based on that cost was as follows:
| | | April 30,
2012 | | March 31,
2012 | |
Aggregate unrealized
appreciation | | $ | 10,687,607 | | | $ | 9,649,194 | | |
Aggregate unrealized
depreciation | | | (19,847 | ) | | | (35,165 | ) | |
Net unrealized
appreciation | | $ | 10,667,760 | | | $ | 9,614,029 | | |
Cost of investments for
tax purposes | | $ | 127,478,421 | | | $ | 127,416,867 | | |
24
Columbia Maryland Intermediate Municipal Bond Fund, April 30, 2012
The following capital loss carryforward, determined at April 30, 2012 and March 31, 2012, may be available to reduce taxable income arising from future net realized gains on investments, if any, to the extent permitted by the Internal Revenue Code:
| Year of Expiration | | April 30,
2012
Amount | | March 31,
2012
Amount | |
| 2013 | | $ | 901,428 | | | $ | 753,812 | | |
| 2014 | | | 271,557 | | | | 901,428 | | |
| 2015 | | | — | | | | 271,557 | | |
| 2016 | | | 511 | | | | — | | |
| 2017 | | | 2,323,465 | | | | 511 | | |
| 2018 | | | — | | | | 2,323,465 | | |
| Total | | $ | 3,496,961 | | | $ | 4,250,773 | | |
On December 22, 2010, the Regulated Investment Company Modernization Act of 2010 (the Act) was enacted, which changed various technical rules governing the tax treatment of regulated investment companies. The changes are generally effective for taxable years beginning after the date of enactment. Under the Act, the Fund will be permitted to carry forward capital losses incurred in taxable years beginning after the date of enactment for an unlimited period. However, any losses incurred during those future taxable years will be required to be utilized prior to the losses incurred in pre-enactment taxable years, which carry an expiration date. As a result of this ordering rule, pre-enactment capital loss carryforwards may be more likely to expire unused.
For the period April 1, 2012 to April 30, 2012, $34,081 and $719,731 of capital loss carryforwards were utilized and expired unused, respectively. For the year ended March 31, 2012, $74,520 of capital loss carryforward was utilized.
Management of the Fund has concluded that there are no significant uncertain tax positions that would require recognition in the financial statements. However, management's conclusion may be subject to review and adjustment at a later date based on factors including, but not limited to, new tax laws, regulations, and administrative interpretations (including relevant court decisions). Generally, the Fund's federal tax returns for the prior three fiscal years remain subject to examination by the Internal Revenue Service.
Note 5. Portfolio Information
For the period April 1, 2012 to April 30, 2012, the cost of purchases and proceeds from sales of securities, excluding short-term obligations, aggregated to $1,139,210 and $3,030,000, respectively.
For the year ended March 31, 2012, the cost of purchases and proceeds from sales of securities, excluding short-term obligations, aggregated to $8,417,687 and $13,517,447, respectively.
Note 6. Lending of Portfolio Securities
Effective May 16, 2011, the Fund has entered into a Master Securities Lending Agreement (the Agreement) with JPMorgan Chase Bank, N.A. (JPMorgan). The Agreement, which replaces the previous securities lending arrangement with State Street, authorizes JPMorgan as lending agent to lend securities to authorized borrowers in order to generate additional income on behalf of the Fund. Pursuant to the Agreement, the securities loaned are secured by cash or U.S. government securities equal to at least 100% of the market value of the loaned securities. Any additional collateral required to maintain those levels due to market fluctuations of the loaned securities is requested to be delivered the following business day. Cash collateral received is invested by the lending agent on behalf of the Fund into authorized investments pursuant to the Agreement. The investments made with the cash collateral are listed in the Portfolio of Investments. The values of such investments and any uninvested cash collateral are disclosed in the Statement of Assets and Liabilities along with the related obligation to return the collateral upon the return of the securities loaned.
Risks of delay in recovery of securities or even loss of rights in the securities may occur should the borrower of the securities fail financially. Risks may also arise to the extent that the value of the securities loaned increases above the value of the collateral received. JPMorgan will indemnify the Fund from losses resulting from a borrower's failure to return a loaned security when due. Such indemnification does not extend to losses associated with declines in the value of cash collateral investments. The Investment Manager is not responsible for any losses incurred by the Fund in connection
25
Columbia Maryland Intermediate Municipal Bond Fund, April 30, 2012
with the securities lending program. Loans are subject to termination by the Fund or the borrower at any time, and are, therefore, not considered to be illiquid investments.
Pursuant to the Agreement, the Fund receives income for lending its securities either in the form of fees or by earning interest on invested cash collateral, net of negotiated rebates paid to borrowers and fees paid to the lending agent for services provided and any other securities lending expenses. The Fund continues to earn and accrue interest and dividends on the securities loaned.
Prior to May 16, 2011, the Fund participated in a securities lending arrangement with State Street. Each security on loan was collateralized in an amount at least equal to the market value of the securities loaned plus accrued income from the investment of collateral. The income generated by the investment of the collateral, net of any fees remitted to State Street as the lending agent and borrower rebates, was paid to the Fund.
For the period ended April 30, 2012 and the year ended March 31, 2012, the Fund did not participate in securities lending activity.
Note 7. Custody Credits
Prior to May 16, 2011, the Fund had an agreement with its custodian bank under which custody fees may have been reduced by balance credits. These credits are recorded as part of expense reductions on the Statement of Operations. The Fund could have invested a portion of the assets utilized in connection with the expense offset arrangement in an income-producing asset if they had not entered into such an agreement. For the period April 1, 2011 through May 16, 2011, there were no custody credits.
Note 8. Shareholder Concentration
At April 30, 2012 and March 31, 2012, one unaffiliated shareholder account owned 88.7% and 88.9% of the outstanding shares of the Fund, respectively. The Fund has no knowledge about whether any portion of those shares was owned beneficially by such accounts. Subscription and redemption activity by concentrated accounts may have a significant effect on the operations of the Fund.
Note 9. Line of Credit
The Fund has entered into a revolving credit facility with a syndicate of banks led by JPMorgan, whereby the Fund may borrow for the temporary funding of shareholder redemptions or for other temporary or emergency purposes. The credit facility became effective on May 16, 2011, replacing a prior credit facility. The credit facility agreement, as amended, which is a collective agreement between the Fund and certain other funds managed by the Investment Manager, severally and not jointly, permits collective borrowings up to $500 million. Pursuant to a December 13, 2011 amendment to the credit facility agreement, interest is charged to each participating fund based on its borrowings at a rate equal to the higher of (i) the overnight federal funds rate plus 1.00% or (i) the one-month LIBOR rate plus 1.00%. Each borrowing under the credit facility matures no later than 60 days after the date of borrowing. The Fund also pays a commitment fee equal to its pro rata share of the amount of the credit facility at a rate of 0.08% per annum. For the period May 16, 2011 through December 13, 2011, interest was charged to each participating fund based on its borrowings at a rate equal to the sum of the federal funds rate plus (i) 1.25% per annum plus (ii) if one-month LIBOR exceeds the federal funds rate, the amount of such excess. The Fund also paid a commitment fee equal to its pro rata share of the amount of the credit facility at a rate of 0.10% per annum.
Prior to May 16, 2011, the Fund and certain other funds managed by the Investment Manager participated in a $225 million committed, unsecured revolving credit facility provided by State Street. Interest was charged to each fund based on its borrowings at a rate equal to the greater of the (i) federal funds rate plus 1.25% per annum or (ii) the overnight LIBOR rate plus 1.25% per annum. The Fund also paid a commitment fee equal to its pro rata share of the amount of the credit facility at a rate of 0.125% per annum.
The Fund had no borrowings during the period ended April 30, 2012 and the year ended March 31, 2012.
Note 10. Significant Risks
Geographic Concentration Risk
Because state-specific tax-exempt funds invest primarily in the municipal securities issued by the state and political sub-divisions of the state, the Fund will be particularly
26
Columbia Maryland Intermediate Municipal Bond Fund, April 30, 2012
affected by political and economic conditions and developments in the state in which it invests. The Fund may, therefore, have a greater risk than that of a municipal bond fund which is more geographically diversified. The value of the municipal securities owned by the Fund also may be adversely affected by future changes in federal or state income tax laws.
Non-Diversification Risk
A non-diversified fund is permitted to invest a greater percentage of its total assets in fewer issuers than a diversified fund. The Fund may, therefore, have a greater risk of loss from a few issuers than a similar fund that invests more broadly.
Note 11. Subsequent Events
Management has evaluated the events and transactions that have occurred through the date the financial statements were issued and noted no items requiring adjustment of the financial statements or additional disclosure.
Note 12. Information Regarding Pending and Settled Legal Proceedings
In December 2005, without admitting or denying the allegations, American Express Financial Corporation (AEFC, which is now known as Ameriprise Financial, Inc. (Ameriprise Financial)) entered into settlement agreements with the Securities and Exchange Commission (SEC) and Minnesota Department of Commerce (MDOC) related to market timing activities. As a result, AEFC was censured and ordered to cease and desist from committing or causing any violations of certain provisions of the Investment Advisers Act of 1940, the Investment Company Act of 1940, and various Minnesota laws. AEFC agreed to pay disgorgement of $10 million and civil money penalties of $7 million. AEFC also agreed to retain an independent distribution consultant to assist in developing a plan for distribution of all disgorgement and civil penalties ordered by the SEC in accordance with various undertakings detailed at www.sec.gov/litigation/admin/ia-2451.pdf. Ameriprise Financial and its affiliates have cooperated with the SEC and the MDOC in these legal proceedings, and have made regular reports to the funds' Boards of Trustees.
Ameriprise Financial and certain of its affiliates have historically been involved in a number of legal, arbitration and regulatory proceedings, including routine litigation, class actions, and governmental actions, concerning matters arising in connection with the conduct of their business activities. Ameriprise Financial believes that the Funds are not currently the subject of, and that neither Ameriprise Financial nor any of its affiliates are the subject of, any pending legal, arbitration or regulatory proceedings that are likely to have a material adverse effect on the Funds or the ability of Ameriprise Financial or its affiliates to perform under their contracts with the Funds. Ameriprise Financial is required to make 10-Q, 10-K and, as necessary, 8-K filings with the Securities and Exchange Commission on legal and regulatory matters that relate to Ameriprise Financial and its affiliates. Copies of these filings may be obtained by accessing the SEC website at www.sec.gov.
There can be no assurance that these matters, or the adverse publicity associated with them, will not result in increased fund redemptions, reduced sale of fund shares or other adverse consequences to the Funds. Further, although we believe proceedings are not likely to have a material adverse effect on the Funds or the ability of Ameriprise Financial or its affiliates to perform under their contracts with the Funds, these proceedings are subject to uncertainties and, as such, we are unable to estimate the possible loss or range of loss that may result. An adverse outcome in one or more of these proceedings could result in adverse judgments, settlements, fines, penalties or other relief that could have a material adverse effect on the consolidated financial condition or results of operations of Ameriprise Financial.
27
Report of Independent Registered Public Accounting Firm
To the Trustees of Columbia Funds Series Trust and the Shareholders of Columbia Maryland Intermediate Municipal Bond Fund
In our opinion, the accompanying statement of assets and liabilities, including the portfolio of investments, and the related statements of operations and of changes in net assets and the financial highlights present fairly, in all material respects, the financial position of Columbia Maryland Intermediate Municipal Bond Fund (the "Fund") (a series of Columbia Funds Series Trust) at April 30, 2012 and at March 31, 2012, the results of its operations, the changes in its net assets and the financial highlights for each of the periods indicated, in conformity with accounting principles generally accepted in the United States of America. These financial statements and financial highlights (hereafter referred to as "financial statements") are the responsibility of the Fund's management. Our responsibility is to express an opinion on these financial statements based on our audits. We conducted our audits of these financial statements in accordance with the standards of the Public Company Accounting Oversight Board (United States). Those standards require that we plan and perform the audit to obtain reasonable assurance about whether the financial statements are free of material misstatement. An audit includes examining, on a test basis, evidence supporting the amounts and disclosures in the financial statements, assessing the accounting principles used and significant estimates made by management, and evaluating the overall financial statement presentation. We believe that our audits, which included confirmation of securities at April 30, 2012 and at March 31, 2012 by correspondence with the custodian, transfer agent and brokers, provide a reasonable basis for our opinion.
PricewaterhouseCoopers LLP
Minneapolis, Minnesota
June 8, 2012
28
Federal Income Tax Information (Unaudited) – Columbia Maryland Intermediate Municipal Bond Fund
For the period ended April 30, 2012 and for the fiscal year ended March 31, 2012, 99.74% and 99.54%, respectively, of the distributions from net investment income of the Fund qualify as exempt interest dividends for federal income tax purposes. A portion of the income may be subject to federal alternative minimum tax.
The Fund will notify shareholders in January 2013 of amounts for use in preparing 2012 income tax returns.
29
Fund Governance
Shareholders elect the Board that oversees the funds' operations. The Board appoints officers who are responsible for day-to-day business decisions based on policies set by the Board. The following table provides basic biographical information about the funds' Board members, including their principal occupations during the past five years, although specific titles for individuals may have varied over the period. Under current Board policy, members may serve until the next Board meeting after he or she reaches the mandatory retirement age established by the Board, or the fifteenth anniversary of the first Board meeting they attended as a member of the Board.
On September 29, 2009, Ameriprise Financial, the parent company of Columbia Management, entered into an agreement with Bank of America, N.A. ("Bank of America") to acquire a portion of the asset management business of Columbia Management Group, LLC and certain of its affiliated companies (the "Transaction"). Following the Transaction, which became effective on May 1, 2010, various alignment activities have occurred with respect to the Fund Family. In connection with the Transaction, Mr. Edward J. Boudreau, Jr., Mr. William P. Carmichael, Mr. William A. Hawkins, Mr. R. Glenn Hilliard, Mr. John J. Nagorniak, Ms. Minor M. Shaw and Dr. Anthony M. Santomero, who were members prior to the Transaction of the Legacy Columbia Nations funds' Board ("Nations Funds"), which includes Columbia Funds Series Trust, Columbia Funds Variable Insurance Trust I and Columbia Funds Master Investment Trust, LLC., began service on the Board for the Legacy RiverSource funds ("RiverSource Funds") effective June 1, 2011, which resulted in an overall increase from twelve Trustees to sixteen for all mutual funds overseen by the Board.
Independent Board Members
| Name, Address, Age | | Position Held
with Funds
and Length
of Service | | Principal Occupation During Past Five Years | | Number of
Funds in the
Fund Family
Overseen by
Board Member | | Other Present or
Past Directorships/
Trusteeships
(Within Past 5 Years) | |
| Kathleen Blatz | | | | | | | | | |
|
901 S. Marquette Ave.
Minneapolis, MN 55402
Age 57 | | Board member since 1/06 for RiverSource Funds and since 6/11 for Nations Funds | | Attorney; Chief Justice, Minnesota Supreme Court, 1998-2006 | | | 156 | | | None | |
|
| Edward J. Boudreau, Jr. | | | | | | | | | |
|
225 Franklin Street
Mail Drop
BX32 05228
Boston, MA 02110
Age 67 | | Board member since 6/11 for RiverSource Funds and since 1/05 for Nations Funds | | Managing Director, E.J. Boudreau & Associates (consulting) since 2000 | | | 149 | | | Former Trustee, BofA Funds Series Trust (11 funds) | |
|
| Pamela G. Carlton | | | | | | | | | |
|
901 S. Marquette Ave.
Minneapolis, MN 55402
Age 57 | | Board member since 7/07 for RiverSource Funds and since 6/11 for Nations Funds | | President, Springboard-Partners in Cross Cultural Leadership (consulting company) | | | 156 | | | None | |
|
30
Fund Governance (continued)
Independent Board Members (continued)
| Name, Address, Age | | Position Held
with Funds
and Length
of Service | | Principal Occupation During Past Five Years | | Number of
Funds in the
Fund Family
Overseen by
Board Member | | Other Present or
Past Directorships/
Trusteeships
(Within Past 5 Years) | |
| William P. Carmichael | | | | | | | | | |
|
225 Franklin Street
Mail Drop
BX32 05228
Boston, MA 02110
Age 68 | | Board member since 6/11 for RiverSource Funds and since 1999 for Nations Funds | | Retired | | | 149 | | | Director, Cobra Electronics Corporation (electronic equipment manufacturer); The Finish Line (athletic shoes and apparel); McMoRan Exploration Company (oil and gas exploration and development); former Trustee, BofA Funds Series Trust (11 funds); former Director, Spectrum Brands, Inc. (consumer products); former Director, Simmons Company (bedding) | |
|
| Patricia M. Flynn | | | | | | | | | |
|
901 S. Marquette Ave.
Minneapolis, MN 55402
Age 61 | | Board member since 11/04 for RiverSource Funds and since 6/11 for Nations Funds | | Trustee Professor of Economics and Management, Bentley University; former Dean, McCallum Graduate School of Business, Bentley University | | | 156 | | | None | |
|
| William A. Hawkins | | | | | | | | | |
|
225 Franklin Street
Mail Drop
BX32 05228
Boston, MA 02110
Age 69 | | Board member since 6/11 for RiverSource Funds and since 1/05 for Nations Funds | | Managing Director, Overton Partners (financial consulting), since August 2010; President and Chief Executive Officer, California General Bank, N.A., January 2008-August 2010 | | | 149 | | | Trustee, BofA Funds Series Trust (11 funds) | |
|
| R. Glenn Hilliard | | | | | | | | | |
|
225 Franklin Street
Mail Drop
BX32 05228
Boston, MA 02110
Age 69 | | Board member since 6/11 for RiverSource Funds and since 1/05 for Nations Funds | | Chairman and Chief Executive Officer, Hilliard Group LLC (investing and consulting), since April 2003; Non-Executive Director & Chairman, CNO Financial Group, Inc. (formerly Conseco, Inc.) (insurance), September 2003-May 2011 | | | 149 | | | Chairman, BofA Fund Series Trust (11 funds); former Director, CNO Financial Group, Inc. (insurance) | |
|
31
Fund Governance (continued)
Independent Board Members (continued)
| Name, Address, Age | | Position Held
with Funds
and Length
of Service | | Principal Occupation During Past Five Years | | Number of
Funds in the
Fund Family
Overseen by
Board Member | | Other Present or
Past Directorships/
Trusteeships
(Within Past 5 Years) | |
| Stephen R. Lewis, Jr. | | | | | | | | | |
|
901 S. Marquette Ave.
Minneapolis, MN 55402
Age 73 | | Chair of the Board for RiverSource Funds since 1/07, Board member for RiverSource Funds since 1/02 and since 6/11 for Nations Funds | | President Emeritus and Professor of Economics Emeritus, Carleton College | | | 156 | | | Director, Valmont Industries, Inc. (manufactures irrigation systems) | |
|
| John F. Maher | | | | | | | | | |
|
901 S. Marquette Ave.
Minneapolis, MN 55402
Age 69 | | Board member since 12/06 for Legacy Seligman funds, since 12/08 for RiverSource Funds and since 6/11 for Nations Funds | | Retired President and Chief Executive Officer and former Director, Great Western Financial Corporation (financial services), 1986-1997 | | | 156 | | | None | |
|
| John J. Nagorniak | | | | | | | | | |
|
225 Franklin Street
Mail Drop
BX32 05228
Boston, MA 02110
Age 67 | | Board member since 6/11 for RiverSource Funds and since 1/08 for Nations Funds | | Retired; President and Director, Foxstone Financial, Inc. (consulting), 2000-2007; Director, Mellon Financial Corporation affiliates (investing), 2000-2007; Chairman, Franklin Portfolio Associates (investing—Mellon affiliate), 1982-2007 | | | 149 | | | Trustee, Research Foundation of CFA Institute; Director, MIT Investment Company; Trustee, MIT 401k Plan; former Trustee, BofA Funds Series Trust (11 funds) | |
|
| Catherine James Paglia | | | | | | | | | |
|
901 S. Marquette Ave.
Minneapolis, MN 55402
Age 59 | | Board member since 11/04 for RiverSource Funds and since 6/11 for Nations Funds | | Director, Enterprise Asset Management, Inc. (private real estate and asset management company) | | | 156 | | | None | |
|
32
Fund Governance (continued)
Independent Board Members (continued)
| Name, Address, Age | | Position Held
with Funds
and Length
of Service | | Principal Occupation During Past Five Years | | Number of
Funds in the
Fund Family
Overseen by
Board Member | | Other Present or
Past Directorships/
Trusteeships
(Within Past 5 Years) | |
| Leroy C. Richie | | | | | | | | | |
|
901 S. Marquette Ave.
Minneapolis, MN 55402
Age 70 | | Board member since 2000 for Legacy Seligman funds, since 11/08 for RiverSource Funds and since 6/11 for Nations Funds | | Counsel, Lewis & Munday, P.C. since 2004; former Vice President and General Counsel, Automotive Legal Affairs, Chrysler Corporation | | | 156 | | | Director, Digital Ally, Inc. (digital imaging); Director, Infinity, Inc. (oil and gas exploration and production); Director, OGE Energy Corp. (energy and energy services) | |
|
| Minor M. Shaw | | | | | | | | | |
|
225 Franklin Street
Mail Drop
BX32 05228
Boston, MA 02110
Age 64 | | Board member since 6/11 for RiverSource Funds and since 2003 for Nations Funds | | President—Micco LLC (private investments) | | | 149 | | | Former Trustee, BofA Funds Series Trust (11 funds); Board Member, Piedmont Natural Gas; Director, Blue Cross Blue Shield of South Carolina | |
|
| Alison Taunton-Rigby | | | | | | | | | |
|
901 S. Marquette Ave.
Minneapolis, MN 55402
Age 68 | | Board member since 11/02 for RiverSource Funds and since 6/11 for Nations Funds | | Chief Executive Officer and Director, RiboNovix, Inc. 2003-2010 (biotechnology); former President, Aquila Biopharmaceuticals | | | 156 | | | Director, Healthways, Inc. (health management programs); Director, ICI Mutual Insurance Company, RRG; Director, Abt Associates (government contractor) | |
|
33
Fund Governance (continued)
Interested Board Member Not Affiliated with Investment Manager*
| Name, Address, Age | | Position Held
with Funds
and Length
of Service | | Principal Occupation During Past Five Years | �� | Number of
Funds in the
Fund Family
Overseen by
Board Member | | Other Present or
Past Directorships/
Trusteeships
(Within Past 5 Years) | |
| Anthony M. Santomero* | | | | | | | | | |
|
225 Franklin Street
Mail Drop
BX32 05228
Boston, MA 02110
Age 65 | | Board member since 6/11 for RiverSource Funds and since 1/08 for Nations Funds | | Richard K. Mellon Professor Emeritus of Finance, The Wharton School, University of Pennsylvania, since 2002; Senior Advisor, McKinsey & Company (consulting), 2006-2008; President and Chief Executive Officer, Federal Reserve Bank of Philadelphia, 2000-2006 | | | 149 | | | Director, Renaissance Reinsurance Ltd.; Trustee, Penn Mutual Life Insurance Company; Director, Citigroup; Director, Citibank, N.A.; former Trustee, BofA Funds Series Trust (11 funds) | |
|
* Dr. Santomero is not an affiliated person of the Investment Manager or Ameriprise Financial. However, he is currently deemed by the funds to be an "interested person" (as defined in the 1940 Act) of the Funds because he serves as a Director of Citigroup, Inc. and Citibank N.A., companies that may directly or through subsidiaries and affiliates engage from time-to-time in brokerage execution, principal transactions and lending relationships with the funds or accounts advised/managed by the Investment Manager.
Interested Board Member Affiliated with Investment Manager*
| William F. Truscott | | | | | | | | | |
|
53600 Ameriprise Financial Center
Minneapolis, MN 55474
Age 51 | | Board member since 11/01 for RiverSource Funds and since 6/11 for Nations Funds; Senior Vice President since 2002 for RiverSource Funds and 5/10 for Nations Funds | | Chairman of the Board and President, Columbia Management Investment Advisers, LLC since May 2010 and February 2012, respectively (previously President, Chairman of the Board and Chief Investment Officer, 2001-April 2010); Chief Executive Officer, U.S. Asset Management & President, Annuities, Ameriprise Financial, Inc. since May 2010 (previously President—U.S. Asset Management and Chief Investment Officer, 2005-April 2010); Director, President and Chief Executive Officer, Ameriprise Certificate Company since 2006; Director and Chief Executive Officer, Columbia Management Investment Distributors, Inc. since May 2010 and February 2012, respectively (previously Chairman of the Board and Chief Executive Officer, 2006-April 2010); Chairman of the Board and Chief Executive Officer, RiverSource Distributors, Inc. since 2006. | | | 156 | | | Trustee, Columbia Funds Series Trust I and Columbia Funds Variable Insurance Trust | |
|
* Interested person (as defined under the 1940 Act) by reason of being an officer, director, security holder and/or employee of the Investment Manager or Ameriprise Financial.
The SAI has additional information about the Fund's Board members and is available, without charge, upon request by calling 800.345.6611; contacting your financial intermediary; or visiting columbiamanagement.com.
34
Fund Governance (continued)
Officers
| Name, Year of Birth and Address | | Principal Occupation(s) During the Past Five Years | |
| J. Kevin Connaughton (Born 1964) | |
|
225 Franklin Street
Boston, MA 02110
President (since 2009) | | Senior Vice President and General Manager—Mutual Fund Products, Columbia Management Investment Advisers, LLC since May 2010; President, Columbia Funds, since 2009, and RiverSource Funds, since May 2010 (previously Senior Vice President and Chief Financial Officer, Columbia Funds, from June 2008 to January 2009, Treasurer, Columbia Funds, from October 2003 to May 2008, and senior officer of various other affiliated funds since 2000); Managing Director, Columbia Management Advisors, LLC from December 2004 to April 2010. | |
|
| Michael G. Clarke (Born 1969) | |
|
225 Franklin Street
Boston, MA 02110
Treasurer (since 2011) and Chief Financial Officer (since 2009) | | Vice President, Columbia Management Investment Advisers, LLC since May 2010; Managing Director of Fund Administration, Columbia Management Advisors, LLC, from September 2004 to April 2010; senior officer of Columbia Funds and affiliated funds since 2002. | |
|
| Scott R. Plummer (Born 1959) | |
|
5228 Ameriprise Financial Center
Minneapolis, MN 55474
Senior Vice President and Chief Legal Officer (since 2010) | | Chief Legal Officer and Assistant Secretary, Columbia Management Investment Advisers, LLC since June 2005; Vice President and Lead Chief Counsel—Asset Management, Ameriprise Financial, Inc. since May 2010 (previously Vice President and Chief Counsel—Asset Management, from 2005 to April 2010, Vice President, Chief Counsel and Assistant Secretary, Columbia Management Investment Distributors, Inc. since 2008; Vice President, General Counsel and Secretary, Ameriprise Certificate Company since 2005; Chief Counsel, RiverSource Distributors, Inc. since 2006; Senior officer of Columbia Funds and affiliated funds, since 2006. | |
|
| Thomas P. McGuire (Born 1972) | |
|
225 Franklin Street
Boston, MA 02110
Chief Compliance Officer (since 2012) | | Vice President—Asset Management Compliance, Columbia Management Investment Advisers, LLC since March 2010; Chief Compliance Officer, Ameriprise Certificate Company, since September 2010; Compliance Executive, Bank of America, from June 2005 to April 2010. | |
|
| William F. Truscott (Born 1960) | |
|
53600 Ameriprise Financial Center
Minneapolis, MN 55474
Senior Vice President (since 2010) | | Chairman of the Board and President, Columbia Management Investment Advisers, LLC since May 2010 and February 2012, respectively (previously President, Chairman of the Board and Chief Investment Officer, from 2001 to April 2010); Chief Executive Officer, U.S. Asset Management & President, Annuities, Ameriprise Financial, Inc. since May 2010 (previously President—U.S. Asset Management and Chief Investment Officer from 2005 to April 2010; Director, President and Chief Executive Officer, Ameriprise Certificate Company since 2006; Director and Chief Executive Officer, Columbia Management Investment Distributors, Inc. since May 2010 and February 2012, respectively (previously Chairman of the Board and Chief Executive Officer from 2008 to April 2010); Chairman of the Board and Chief Executive Officer, RiverSource Distributors, Inc. since 2006. | |
|
| Paul D. Pearson (Born 1956) | |
|
10468 Ameriprise Financial Center
Minneapolis, MN 55474
Vice President and Assistant Treasurer
(since 2011) | | Vice President—Investment Accounting, Columbia Management Investment Advisers, LLC, since May 2010; Vice President—Managed Assets, Investment Accounting, Ameriprise Financial Corporation, 1998-2010 | |
|
35
Fund Governance (continued)
Officers (continued)
| Name, Year of Birth and Address | | Principal Occupation(s) During the Past Five Years | |
| Colin Moore (Born 1958) | |
|
225 Franklin Street
Boston, MA 02110
Senior Vice President (since 2010) | | Director and Chief Investment Officer, Columbia Management Investment Advisers, LLC since May 2010; Manager, Managing Director and Chief Investment Officer of Columbia Management Advisors, LLC from 2007 to April 2010; Head of Equities, Columbia Management Advisors, LLC from 2002 to 2007. | |
|
| Christopher O. Petersen (Born 1970) | |
|
5228 Ameriprise Financial Center
Minneapolis, MN 55474
Vice President and Secretary (since 2011) | | Vice President and Chief Counsel, Ameriprise Financial since January 2010 (formerly Vice President and Group Counsel or Counsel from April 2004 to January 2010); Senior officer of Columbia Funds and affiliated funds, since 2007. | |
|
| Amy K. Johnson (Born 1965) | |
|
5228 Ameriprise Financial Center
Minneapolis, MN 55474
Vice President (since 2010) | | Senior Vice President and Chief Operating Officer, Columbia Management Investment Advisers, LLC since May 2010 (previously Chief Administrative Officer, from 2009 until April 2010, Vice President—Asset Management and Trust Company Services, from 2006 to 2009, and Vice President—Operations and Compliance from 2004 to 2006). | |
|
| Joseph F. DiMaria (Born 1968) | |
|
225 Franklin Street
Boston, MA 02110
Vice President (since 2011) and Chief Accounting Officer (since 2008) | | Vice President, Mutual Fund Administration, Columbia Management Investment Advisers, LLC, since May 2010; Director of Fund Administration, Columbia Management Advisors, LLC from January 2006 to April 2010. | |
|
| Paul B. Goucher (Born 1968) | |
|
100 Park Avenue
New York, NY 10017
Vice President and Assistant Secretary (since 2010) | | Vice President and Chief Counsel of Ameriprise Financial since January 2010 (formerly Vice President and Group Counsel from November 2008 to January 2010); Director, Managing Director and General Counsel of J. & W. Seligman & Co. Incorporated (Seligman) from July 2008 to November 2008 and Managing Director and Associate General Counsel of Seligman from January 2005 to July 2008. | |
|
| Michael E. DeFao (Born 1968) | |
|
225 Franklin Street
Boston, MA 02110
Vice President and Assistant Treasurer (since 2011) | | Vice President and Chief Counsel, Ameriprise Financial since May 2010; Associate General Counsel, Bank of America from June 2005 to April 2010. | |
|
| Stephen T. Welsh (Born 1957) | |
|
225 Franklin Street
Boston, MA 02110
Vice President (since 2006) | | President and Director, Columbia Management Investment Services Corp. since May 2010; President and Director, Columbia Management Services, Inc. from July 2004 to April 2010; Managing Director, Columbia Management Distributors, Inc. from August 2007 to April 2010. | |
|
36
Approval of Investment Management Services Agreement
Columbia Management Investment Advisers, LLC ("Columbia Management" or the "investment manager"), a wholly-owned subsidiary of Ameriprise Financial, Inc. ("Ameriprise Financial"), serves as the investment manager to Columbia Maryland Intermediate Municipal Bond Fund (the "Fund"). Under an investment management services agreement (the "IMS Agreement"), Columbia Management provides investment advice and other services to the Fund and all funds distributed by Columbia Management Investment Distributors, Inc. (collectively, the "Funds").
On an annual basis, the Fund's Board of Trustees (the "Board"), including the independent Board members (the "Independent Directors"), considers renewal of the IMS Agreement. Columbia Management prepared detailed reports for the Board and its Contracts Committee in March and April 2012, including reports based on analyses of data provided by an independent organization and a comprehensive response to each item of information requested by independent legal counsel to the Independent Directors ("Independent Legal Counsel") in a letter to the investment manager, to assist the Board in making this determination. All of the materials presented in March and April were first supplied in draft form to designated representatives of the Independent Directors, i.e., Independent Legal Counsel, the Chair and the Chair of the Contracts Committee (including materials relating to the Fund's expense cap), and the final materials were revised to reflect comments provided by these Board representatives. In addition, throughout the year, the Board (or its committees) regularly meets with portfolio management teams and senior management personnel, and reviews information prepared by Columbia Management addressing the services Columbia Management provides and Fund performance. The Board accords particular weight to the work, deliberations and conclusions of the Contracts Committee, the Investment Review Committee and the Compliance Committee in determining whether to continue the IMS Agreement.
The Board, at its April 10-12, 2012 in-person Board meeting (the "April Meeting"), considered the renewal of the IMS Agreement for an additional one-year term. At the April Meeting, Independent Legal Counsel reviewed with the Independent Directors various factors relevant to the Board's consideration of advisory agreements and the Board's legal responsibilities related to such consideration. Following an analysis and discussion of the factors identified below, the Board, including all of the Independent Directors, approved the renewal of the IMS Agreement.
Nature, Extent and Quality of Services Provided by Columbia Management: The Independent Directors analyzed various reports and presentations they had received detailing the services performed by Columbia Management, as well as its expertise, resources and capabilities. The Independent Directors specifically considered many developments during the past year concerning the services provided by Columbia Management, including, in particular, the continued investment in, and resources dedicated to, the Funds' operations and the successful completion of various integration initiatives and the consolidation of dozens of Funds. The Independent Directors noted the information they received concerning Columbia Management's ability to retain key portfolio management personnel. In that connection, the Independent Directors took into account their meetings with Columbia Management's Chief Investment Officer (the "CIO") and considered the CIO's successful execution of additional risk and portfolio management oversight applied to the Funds. The Independent Directors also assessed Columbia Management's significant investment in upgrading technology (such as an equity trading system) and considered management's commitments to enhance existing resources in this area.
In connection with the Board's evaluation of the overall package of services provided by Columbia Management, the Board also considered the quality of administrative services provided to the Fund by Columbia Management. In addition, the Board also reviewed the financial condition of Columbia Management (and its affiliates) and each entity's ability to carry out its responsibilities under the IMS Agreement and the Fund's other services agreements with Ameriprise affiliates. The Board also discussed the acceptability of the terms of the IMS Agreement (including the relatively broad scope of services required to be performed by Columbia Management). The Board concluded that the services being performed under the IMS Agreement were of a reasonably high quality.
37
Approval of Investment Management Services Agreement (continued)
Based on the foregoing, and based on other information received (both oral and written, including the information on investment performance referenced below) and other considerations, the Board concluded that Columbia Management and its affiliates were in a position to continue to provide a high quality and level of services to the Fund.
Investment Performance: For purposes of evaluating the nature, extent and quality of services provided under the IMS Agreement, the Board carefully reviewed the investment performance of the Fund. In this regard, the Board considered detailed reports providing the results of analyses performed by an independent organization showing, for various periods, the performance of the Fund, the performance of a benchmark index, the percentage ranking of the Fund among its comparison group and the net assets of the Fund. The Board observed that the Fund's investment performance met expectations.
Comparative Fees, Costs of Services Provided and the Profits Realized By Columbia Management and its Affiliates from their Relationships with the Fund: The Board reviewed comparative fees and the costs of services to be provided under the IMS Agreement. The Board members considered detailed comparative information set forth in an annual report on fees and expenses, including, among other things, data (based on analyses conducted by an independent organization) showing a comparison of the Fund's expenses with median expenses paid by funds in its comparative peer universe, as well as data showing the Fund's contribution to Columbia Management's profitability. The Board reviewed the fees charged to comparable institutional or other accounts/vehicles managed by Columbia Management and discussed differences in how the products are managed and operated, noting no unreasonable differences in the levels of contractual fees.
The Board accorded particular weight to the notion that the level of fees should reflect a rational pricing model applied consistently across the various product lines in the Fund family, while assuring that the overall fees for each Fund (with few defined exceptions) are generally in line with the "pricing philosophy" (i.e., that the total expense ratio of the Fund is at, or below, the median expense ratio of funds in the same comparison universe of the Fund). The Board took into account that the Fund's total expense ratio (after considering proposed expense caps/waivers) approximated the peer universe's median expense ratio. Based on its review, the Board concluded that the Fund's management fee was fair and reasonable in light of the extent and quality of services that the Fund receives.
The Board also considered the expected profitability of Columbia Management and its affiliates in connection with Columbia Management providing investment management services to the Fund. In this regard, the Board referred to a detailed profitability report, discussing the profitability to Columbia Management and Ameriprise Financial from managing, operating and distributing the Funds. In this regard, the Board observed that 2011 profitability, while slightly lower than 2010, was generally in line with the reported profitability of other asset management firms. The Board also considered the indirect economic benefits flowing to Columbia Management or its affiliates in connection with managing or distributing the Funds, such as the enhanced ability to offer various other financial products to Ameriprise Financial customers, soft dollar benefits and overall reputational advantages. The Board noted that the fees paid by the Fund should permit the investment manager to offer competitive compensation to its personnel, make necessary investments in its business and earn an appropriate profit. The Board concluded that profitability levels were reasonable.
Economies of Scale to be Realized: The Board also considered the economies of scale that might be realized by Columbia Management as the Fund grows and took note of the extent to which Fund shareholders might also benefit from such growth.
Based on the foregoing, the Board, including all of the Independent Directors, concluded that the investment management service fees were fair and reasonable in light of the extent and quality of services provided. In reaching this conclusion, no single factor was determinative. On April 12, 2012, the Board, including all of the Independent Directors, approved the renewal of the IMS Agreement.
38
This page intentionally left blank.
39
This page intentionally left blank.
40
Important Information About This Report
The fund mails one shareholder report to each shareholder address. If you would like more than one report, please call shareholder services at 1-800-345-6611 and additional reports will be sent to you. This report has been prepared for shareholders of Columbia Maryland Intermediate Municipal Bond Fund.
A description of the policies and procedures that the fund uses to determine how to vote proxies and a copy of the fund's voting records are available (i) at www.columbiamanagement.com, (ii) on the Securities and Exchange Commission's website at www.sec.gov, and (iii) without charge, upon request, by calling 1-800-368-0346. Information regarding how the fund voted proxies relating to portfolio securities during the 12-month period ended June 30 is available from the SEC's website. Information regarding how the fund voted proxies relating to portfolio securities is also available from the fund's website, www.columbiamanagement.com.
The fund files a complete schedule of portfolio holdings with the SEC for the first and third quarters of each fiscal year on Form N-Q. The fund's Form N-Q is available on the SEC's website at www.sec.gov and may be reviewed and copied at the SEC's Public Reference Room in Washington, D.C. Information on the operation of the Public Reference Room may be obtained by calling 1-800-SEC-0330.
Transfer Agent
Columbia Management Investment
Services Corp.
P.O. Box 8081
Boston, MA 02266-8081
1-800-345-6611
Distributor
Columbia Management Investment
Distributors, Inc.
225 Franklin Street
Boston, MA 02110
Investment Manager
Columbia Management Investment Advisers, LLC
225 Franklin Street
Boston, MA 02110
41

Columbia Maryland Intermediate Municipal Bond Fund
P. O. Box 8081
Boston, MA 02266-8081
columbiamanagement.com
This information is for use with concurrent or prior delivery of a fund prospectus. Investors should consider the investment objectives, risks, charges and expenses of a mutual fund carefully before investing. For a free prospectus, which contains this and other important information about the funds, visit columbiamanagement.com. Read the prospectus carefully before investing. The Fund is distributed by Columbia Management Investment Distributors, Inc., member FINRA, and managed by Columbia Management Investment Advisers, LLC.
© 2012 Columbia Management Investment Advisers, LLC. All rights reserved.
C-1091 C (5/12)

Columbia North Carolina Intermediate Municipal Bond Fund
Annual Report for the Period Ended April 30, 2012
Not FDIC insured • No bank guarantee • May lose value
Table of Contents
| Fund Profile | | | 1 | | |
|
| Performance Information | | | 2 | | |
|
| Understanding Your Expenses | | | 3 | | |
|
| Portfolio Manager's Report | | | 4 | | |
|
| Portfolio of Investments | | | 6 | | |
|
Statement of Assets and
Liabilities | | | 13 | | |
|
| Statement of Operations | | | 15 | | |
|
Statement of Changes in
Net Assets | | | 16 | | |
|
| Financial Highlights | | | 18 | | |
|
| Notes to Financial Statements | | | 22 | | |
|
Report of Independent Registered
Public Accounting Firm | | | 30 | | |
|
| Federal Income Tax Information | | | 31 | | |
|
| Fund Governance | | | 32 | | |
|
| Approval of Investment Management Services Agreement | | | 39 | | |
|
Important Information About
This Report | | | 41 | | |
|
The views expressed in this report reflect the current views of the respective parties. These views are not guarantees of future performance and involve certain risks, uncertainties and assumptions that are difficult to predict, so actual outcomes and results may differ significantly from the views expressed. These views are subject to change at any time based upon economic, market or other conditions and the respective parties disclaim any responsibility to update such views. These views may not be relied on as investment advice and, because investment decisions for a Columbia Fund are based on numerous factors, may not be relied on as an indication of trading intent on behalf of any particular Columbia Fund. References to specific securities should not be construed as a recommendation or investment advice.
President's Message

Dear Shareholders,
A stock market rally that commenced in the fourth quarter of 2011 continued into 2012 in the United States and around the world, as all major market regions generated double-digit returns for the three-month period ended March 31, 2012. Volatility declined sharply as European debt fears quieted somewhat and sentiment improved. Returns in developed countries were buoyed by strong results in Germany, Belgium, Austria and the Nordic markets of Denmark, Finland, Norway and Sweden. Under the cloud of its own mounting debt problem, Spain was the only eurozone country to deliver a negative return during the three-month period. Solid economic growth and accommodative monetary policy helped boost gains in emerging markets. The rally in U.S. equities was largely driven by an expansion in "multiples"—an increase in stock prices relative to their earnings. By the end of the first quarter of 2012, stocks no longer appeared as cheap as they were late in 2011. Bonds lagged stocks during the first quarter as investors responded to signs of an improved environment with a greater appetite for risk.
Concerns around the health of the global economy were centered in news headlines focusing on Washington D.C., Europe, China and the Middle East. In the United States, economic indicators remained mixed but generally indicated support for slow, sustainable economic growth. European policymakers have made progress in containing the eurozone debt crisis, though they still have not solved the issue of long-term solvency. The European Central Bank has lowered interest rates and flooded the financial system with liquidity that may provide breathing space for companies to restructure their balance sheets. These massive infusions of liquidity may whet the appetite for risk from investors around the world. However, it has delayed a true reckoning with the European financial situation, as concerns about Spain and Portugal continue to cloud the outlook. These structural challenges that persist in the developed world, and slowing growth in emerging market economies, leave the global economy in a fragile state. Domestic demand, combined with slowing inflationary trends, has also helped to shore up emerging market economies. Joblessness remains low and monetary conditions remain easy.
Despite the challenges and surprises of 2011, we see pockets of strength—and as a result, attractive opportunities—both here and abroad for 2012. We hope to help you capitalize on these opportunities with various articles in our 2012 Perspectives, which is available via the Market Insights tab at columbiamanagement.com. This publication showcases the strong research capabilities and experienced investment teams of Columbia Management and offers a diverse array of investment ideas based on our five key themes for 2012.
Other information and resources available at columbiamanagement.com include:
g detailed up-to-date fund performance and portfolio information
g economic analysis and market commentary
g quarterly fund commentaries
g Columbia Management Investor, our award-winning quarterly newsletter for shareholders
Thank you for your continued support of the Columbia Funds. We look forward to serving your investment needs for many years to come.
Best Regards,

J. Kevin Connaughton
President, Columbia Funds
Investors should consider the investment objectives, risks, charges and expenses of a mutual fund carefully before investing. For a free prospectus, which contains this and other important information about the funds, visit columbiamanagement.com. The prospectus should be read carefully before investing.
Columbia Funds are distributed by Columbia Management Investment Distributors, Inc., member FINRA, and managed by Columbia Management Investment Advisers, LLC.
© 2012 Columbia Management Investment Advisers, LLC. All rights reserved.
Fund Profile – Columbia North Carolina Intermediate Municipal Bond Fund
Summary
• For the 13-month period that ended April 30, 2012, the fund's Class A shares returned 10.27% without sales charge.
• The fund's benchmark, the Barclays 3-15 Year Blend Municipal Bond Index, returned 11.05%.1
• The fund lost some ground relative to the index because it had slightly more exposure to shorter-term bonds and a slightly higher quality orientation.
Portfolio Management
Brian M. McGreevy has managed the fund since June 2011. From 1994 until joining Columbia Management Investment Advisers, LLC (the Investment Manager) in May 2010, Mr. McGreevy was associated with the fund's previous investment adviser as an investment professional.
1The Barclays 3-15 Year Blend Municipal Bond Index tracks the performance of municipal bonds issued after December 31, 1990 with remaining maturities between 2 and 17 years and at least $7 million in principal amount outstanding.
Indices are not available for investment, are not professionally managed and do not reflect sales charges, fees, brokerage commissions, taxes or other expenses of investing. Securities in the fund may not match those in an index.
Performance data quoted represents past performance and current performance may be lower or higher. Past performance is no guarantee of future results. The investment return and principal value will fluctuate so that shares, when redeemed, may be worth more or less than the original cost. Please visit www.columbiamanagement.com for daily and most recent month-end performance updates.
Summary
13-month (cumulative) return as of 04/30/12
| | +10.27% | |
|
|  | | | Class A shares
(without sales charge) | |
|
| | +11.05% | |
|
|  | | | Barclays 3-15 Year Blend
Municipal Bond Index | |
|
1
Performance Information – Columbia North Carolina Intermediate Municipal Bond Fund
Performance data quoted represents past performance and current performance may be lower or higher. Past performance is no guarantee of future results. The investment return and principal value will fluctuate so that shares, when redeemed, may be worth more or less than the original cost. Please visit www.columbiamanagement.com for daily and most recent month-end performance updates.
Performance of a $10,000 investment 05/01/02 – 04/30/12
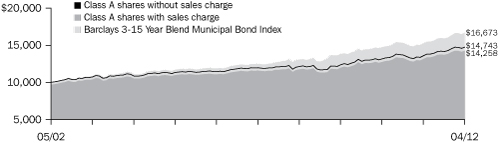
The chart above shows the change in value of a hypothetical $10,000 investment in Class A shares of Columbia North Carolina Intermediate Municipal Bond Fund during the stated time period, and does not reflect the deduction of taxes that a shareholder may pay on fund distributions or on the redemption of fund shares.
Performance of a $10,000 investment 05/01/02 – 04/30/12 ($)
| Sales charge | | without | | with | |
| Class A | | | 14,743 | | | | 14,258 | | |
| Class B | | | 13,666 | | | | 13,666 | | |
| Class C | | | 13,666 | | | | 13,666 | | |
| Class Z | | | 15,103 | | | | n/a | | |
Average annual total return as of 04/30/12 (%)
| Share class | | A | | B | | C | | Z | |
| Inception | | 12/14/92 | | 06/07/93 | | 12/16/92 | | 12/11/92 | |
| Sales charge | | without | | with | | without | | with | | without | | with | | without | |
| 1-month (cumulative) | | | 1.15 | | | | –2.13 | | | | 1.09 | | | | –1.91 | | | | 0.99 | | | | –0.01 | | | | 1.17 | | |
| 1-year | | | 8.48 | | | | 5.00 | | | | 7.46 | | | | 4.46 | | | | 7.52 | | | | 6.52 | | | | 8.68 | | |
| 5-year | | | 4.28 | | | | 3.59 | | | | 3.47 | | | | 3.47 | | | | 3.48 | | | | 3.48 | | | | 4.52 | | |
| 10-year | | | 3.96 | | | | 3.61 | | | | 3.17 | | | | 3.17 | | | | 3.17 | | | | 3.17 | | | | 4.21 | | |
The "with sales charge" returns include the maximum initial sales charge of 3.25% for Class A shares and the applicable contingent deferred sales charge of 3.00% in the first year, declining to 1.00% in the fourth year, and eliminated thereafter for Class B shares and 1.00% for Class C shares for the first year only. The "without sales charge" returns do not include the effect of sales charges. If they had, returns would be lower.
Performance results reflect any fee waivers or reimbursements of fund expenses by Columbia Management Investment Advisers, LLC and/or any of its affiliates. Absent these fee waivers or expense reimbursement arrangements, performance results would have been lower.
All results shown assume reinvestment of distributions. Class Z shares are sold at net asset value with no distribution and service (Rule 12b-1) fees. Class Z shares have limited eligibility and the investment minimum requirements may vary. Please see the fund's prospectuses for details. Performance for different share classes will vary based on differences in sales charges and fees associated with each class.
The tables do not reflect the deduction of taxes that a shareholder may pay on fund distributions or on the redemption of fund shares.
2
Understanding Your Expenses – Columbia North Carolina Intermediate Municipal Bond Fund
As an investor, you incur two types of costs. There are transaction costs, which generally include sales charges on purchases and may include redemption fees. There are also ongoing costs, which generally include management fees, distribution and service (Rule 12b-1) fees, and other fund expenses. The following information is intended to help you understand your ongoing costs (in dollars) of investing in the Fund and to help you compare these costs with the ongoing costs of investing in other mutual funds.
Analyzing your fund's expenses
To illustrate these ongoing costs, we have provided examples and calculated the expenses paid by investors in each share class of the Fund during the period. The actual and hypothetical information in the table is based on an initial investment of $1,000 at the beginning of the period indicated and held for the entire period. Expense information is calculated two ways and each method provides you with different information. The amount listed in the "Actual" column is calculated using the Fund's actual operating expenses and total return for the period. You may use the Actual information, together with the amount invested, to estimate the expenses that you paid over the period. Simply divide your account value by $1,000 (for example, an $8,600 account value divided by $1,000 = 8.6), then multiply the results by the expenses paid during the period under the Actual column. The amount listed in the "Hypothetical" column assumes a 5% annual rate of return before expenses (which is not the Fund's actual return) and then applies the Fund's actual expense ratio for the period to the hypothetical return. You should not use the hypothetical account values and expenses to estimate either your actual account balance at the end of the period or the expenses you paid during the period. See "Compare with other funds" below for details on how to use the hypothetical data.
Compare with other funds
Since all mutual funds are required to include the same hypothetical calculations about expenses in shareholder reports, you can use this information to compare the ongoing cost of investing in the Fund with other funds. To do so, compare the hypothetical example with the 5% hypothetical examples that appear in the shareholder reports of other funds. As you compare hypothetical examples of other funds, it is important to note that hypothetical examples are meant to highlight the ongoing costs of investing in a fund only and do not reflect any transaction costs, such as sales charges, or redemption or exchange fees. Therefore, the hypothetical calculations are useful in comparing ongoing costs only, and will not help you determine the relative total costs of owning different funds. If transaction costs were included in these calculations, your costs would be higher.
November 1, 2011 – April 30, 2012
| | | Account value at the
beginning of the period ($) | | Account value at the
end of the period ($) | | Expenses paid
during the period ($) | | Fund's annualized
expense ratio (%) | |
| | | Actual | | Hypothetical | | Actual | | Hypothetical | | Actual | | Hypothetical | | Actual | |
| Class A | | | 1,000.00 | | | | 1,000.00 | | | | 1,042.00 | | | | 1,020.93 | | | | 4.01 | | | | 3.97 | | | | 0.79 | | |
| Class B | | | 1,000.00 | | | | 1,000.00 | | | | 1,035.20 | | | | 1,017.21 | | | | 7.79 | | | | 7.72 | | | | 1.54 | | |
| Class C | | | 1,000.00 | | | | 1,000.00 | | | | 1,036.70 | | | | 1,017.21 | | | | 7.80 | | | | 7.72 | | | | 1.54 | | |
| Class Z | | | 1,000.00 | | | | 1,000.00 | | | | 1,043.50 | | | | 1,022.18 | | | | 2.74 | | | | 2.72 | | | | 0.54 | | |
Expenses paid during the period are equal to the annualized expense ratio for each class as indicated above, multiplied by the average account value over the period and then multiplied by the number of days in the Fund's most recent six months and divided by 366.
Expenses do not include fees and expenses incurred indirectly by the Fund from the underlying funds in which the Fund may invest (also referred to as "acquired funds"), including affiliated and non-affiliated pooled investments vehicles (including mutual funds and exchange traded funds).
Had Columbia Management Investment Advisers, LLC and/or certain of its affiliates not waived/reimbursed certain fees and expenses, account value at the end of the period would have been reduced.
3
Portfolio Manager's Report – Columbia North Carolina Intermediate Municipal Bond Fund
Performance data quoted represents past performance and current performance may be lower or higher. Past performance is no guarantee of future results. The investment return and principal value will fluctuate so that shares, when redeemed, may be worth more or less than the original cost. Please visit www.columbiamanagement.com for daily and most recent month-end performance updates.
30-day SEC yields
as of 4/30/12 (%)
| Class A | | | 1.22 | | |
| Class B | | | 0.52 | | |
| Class C | | | 0.52 | | |
| Class Z | | | 1.50 | | |
The 30-day SEC yields reflect the fund's earning power, net of expenses, expressed as an annualized percentage of the public offering price per share at the end of the period. Had the Investment Manager and/or any of its affiliates not waived fees or reimbursed a portion of expenses, the 30-day SEC yields would have been lower.
Taxable Equivalent SEC yields
as of 4/30/12 (%)
| Class A | | | 1.88 | | |
| Class B | | | 0.80 | | |
| Class C | | | 0.80 | | |
| Class Z | | | 2.31 | | |
Taxable-equivalent SEC yields are calculated assuming a federal tax rate of 35.0%. This tax rate does not reflect the phase out of exemptions or the reduction of the otherwise allowable deductions that occur when adjusted gross income exceeds certain levels. Your taxable-equivalent yield may be different depending on your tax bracket.
QUALITY BREAKDOWN1
as of 04/30/12 (%)
| AAA rating | | | 16.3 | | |
| AA rating | | | 55.2 | | |
| A rating | | | 14.9 | | |
| BBB rating | | | 11.7 | | |
| Not rated | | | 1.9 | | |
1Percentages indicated are based upon total fixed income securities (excluding Investments of Cash Collateral Received for Securities on Loan and money market funds).
Bond ratings apply to the underlying holdings of the Fund and not the Fund itself and are divided into categories ranging from AAA (highest) to D (lowest), and are subject to change. The ratings shown are determined by using the middle rating of Moody's, S&P, and Fitch after dropping the highest and lowest available ratings. When a rating from only two agencies is available, the lower rating is used. When a rating from only one agency is available, that rating is used. When a bond is not rated by one of these agencies, it is designated as Not rated. Credit ratings are subjective to opinions and not statements of fact.
The Board of Trustees for Columbia North Carolina Intermediate Municipal Bond Fund has approved the change of the fund's fiscal year end from March 31 to April 30. As a result, this report covers the 13-month period since the last annual report. The next report you receive will be for the six-month period from May 1, 2012 through October 31, 2012. In June 2011, Brian McGreevy became portfolio manager of the fund.
For the 13-month period that ended April 30, 2012, the fund's Class A shares returned 10.27% without sales charge. The fund's benchmark, the Barclays 3-15 Year Blend Municipal Bond Index, returned 11.05% for the period. The fund performed generally in line with the index. Its modest shortfall was generally the result of more exposure to shorter-term bonds and its higher quality orientation during a period in which lower-quality investment grade bonds were stronger performers.
An improving economic environment
Early in the 13-month period, Europe's debt problems and wrangling in Washington over the federal budget and the national debt dominated world headlines. U.S. economic news was lackluster, housing continued to be a nagging weak spot and job growth was disappointing. However, the pace of both economic and job growth picked up as the period wore on. Consumer confidence improved as the labor market added approximately 1.2 million new jobs between November 2011 and April 2012, while the jobless rate fell to 8.1%. Household net worth also picked up as the equity markets rebounded. Headline inflation rose 2.7%, driven primarily by rising food and energy prices. Despite a modest slowdown late in the summer of 2011, manufacturing activity continued to expand throughout the period.
Municipal market generates strong returns
Against this backdrop, the U.S. municipal bond market generated strong returns, despite a host of investor concerns at the outset of the period: 1) Net outflows from municipal mutual funds. 2) The expectation that heavy new issue volume would weigh on the market, which turned out to be unfounded. Issuance dropped off almost across the board. 3) Fears of massive defaults, which were stoked by the media and were generally overblown. With these concerns in mind, 10-year municipal yields reached a high of 3.5% before the European debt crisis sent investors scurrying for the safety of the Treasury market, pushing Treasury yields down. Municipal yields followed. (Bond yields and prices move in opposite directions.)
By the summer of 2011, investors seemed to believe that default expectations were excessive and demand for municipal bonds picked up. With yields close to historical lows, buyers moved down the credit curve—to A and BBB rated2 bonds—to garner additional income. Over the course of the 13-month period, these credits performed the best, as yields fell and the yield spread between higher and lower quality bonds tightened in response to demand. Yet, there were more downgrades than upgrades in the overall municipal market as a lackluster economy continued to pressure issuers.
2The credit quality ratings represent those of Moody's Investors Service, Inc. ("Moody's"), Standard & Poor's Corporation ("S&P") or Fitch Ratings ("Fitch") credit ratings. The ratings represent their opinions as to the quality of the securities they rate. Ratings are relative and subjective and are not absolute standards of quality. The security's credit quality does not eliminate risk.
4
Portfolio Manager's Report (continued) – Columbia North Carolina Intermediate Municipal Bond Fund
Duration, quality orientation hampered returns
The fund performed generally in line with the index, delivering a solid return for the 13-month period. However, it had a slightly heavier weight in shorter-term bonds; a lower weight in bonds in the 15- to 17-year range, which generated returns of 13%+ and an overweight in higher quality bonds, which underperformed lower quality bonds for the period. These factors generally accounted for its modest shortfall to the index. An overweight in seven- to 10-year bonds aided returns, and a slightly longer duration among the fund's AAA rated bond holdings also benefited results. (Duration is a measure of interest rate sensitivity.) An underweight in A rated securities was a drag on results, as these bonds generated double-digit returns. However, the fund had more exposure to BBB rated bonds, which generated the very best returns for the fund and partially offset the impact of the underweight in A rated bonds.
Cash deployed across the yield curve
During the period, the fund experienced strong positive cash flows. We deployed this cash in the eight- to 15-year maturity range, investing in health care bonds, local AA rated general obligation bonds and certain housing bonds. We added some lower coupon bonds, which are attractive to retail buyers because they have lower dollar prices. These holdings provide a cushion that would allow us to raise cash should we choose to do so in the future. We would have liked to add to the fund's lower quality holdings, but our research team found it difficult to find solid A rated names that they believed would add value to the portfolio.
On a separate note, we have limited the fund's exposure to Puerto Rico bonds because we continue to believe the credit is weak and the market has not properly priced in the potential risk of a downgrade to a below investment-grade rating. Over the period this was a slight negative for performance as Puerto Rico offered more yield than North Carolina credits and yields spreads tightened.
A slow, but improving, recovery for North Carolina
North Carolina has been slow to recover from recession, but it picked up the pace slightly in 2011. Private sector job growth has been solid and population growth has brought more workers into the labor pool. The unemployment rate in North Carolina is falling. Yet, it remains well above the national average. With few prospects for public sector contributions to growth and no expectation for manufacturing to drive economic improvement, North Carolina's hopes are pinned on healthy demographic trends: an uptick in population growth and the continued growth of urban centers where high-tech and professional jobs attract newcomers. Even though we expect North Carolina to continue to lag the overall U.S. economy in its recovery, we believe that consumer spending, travel and tourism, education, government spending and homebuilding have the potential to help accelerate growth in 2013 and beyond. These positives should provide some support for the municipal bond market going forward.
Portfolio characteristics and holdings are subject to change periodically and may not be representative of current characteristics and holdings. The outlook for this fund may differ from that presented for other Columbia Funds.
Tax-exempt investing offers current tax-exempt income, but it also involves special risks. The value of the fund will be affected by interest rate changes and the creditworthiness of issues held in the fund. When interest rates go up, bond prices generally drop and vice versa.
Interest income from certain tax-exempt bonds may be subject to certain state and local taxes and, if applicable, the alternative minimum tax. Capital gains are not exempt from income taxes.
Single-state municipal bond funds pose additional risks due to limited geographical diversification.
5
Portfolio of Investments – Columbia North Carolina Intermediate Municipal Bond Fund
April 30, 2012
(Percentages represent value of investments compared to net assets)
Issue
Description | | Coupon
Rate | | Principal
Amount | | Value | |
| Municipal Bonds 97.9% | |
| AIRPORT 1.6% | |
Raleigh Durham Airport Authority
Refunding Revenue Bonds
Series 2010A
05/01/23 | | | 5.000 | % | | $ | 3,000,000 | | | $ | 3,552,150 | | |
| HIGHER EDUCATION 7.1% | |
Appalachian State University
Refunding Revenue Bonds
Series 2005 (NPFGC)
07/15/21 | | | 5.000 | % | | | 1,485,000 | | | | 1,602,582 | | |
Utility System
Series 1998 (NPFGC)
05/15/12 | | | 5.000 | % | | | 1,000,000 | | | | 1,001,960 | | |
North Carolina Capital Facilities Finance Agency
Revenue Bonds
Johnson & Wales University Project
Series 2003A (XLCA)
04/01/21 | | | 5.250 | % | | | 1,000,000 | | | | 1,019,130 | | |
Meredith College
Series 2008
06/01/31 | | | 6.000 | % | | | 1,000,000 | | | | 1,090,700 | | |
Wake Forest University
Series 2009
01/01/26 | | | 5.000 | % | | | 1,000,000 | | | | 1,146,710 | | |
University of North Carolina System
Revenue Bonds
Asheville/Wilmington
Series 2010C
10/01/16 | | | 5.000 | % | | | 3,000,000 | | | | 3,531,000 | | |
General Trust Indenture
Series 2009B
10/01/17 | | | 4.250 | % | | | 1,000,000 | | | | 1,148,630 | | |
Series 2008A
10/01/22 | | | 5.000 | % | | | 2,000,000 | | | | 2,320,780 | | |
University of North Carolina at Charlotte
Revenue Bonds
Series 2012A
2/23/2012
04/01/21 | | | 4.000 | % | | | 2,370,000 | | | | 2,756,476 | | |
| Total | | | 15,617,968 | | |
| HOSPITAL 12.2% | |
Albemarle Hospital Authority
Refunding Revenue Bonds
Series 2007
10/01/21 | | | 5.250 | % | | | 2,000,000 | | | | 2,067,460 | | |
| 10/01/27 | | | 5.250 | % | | | 1,000,000 | | | | 983,360 | | |
Charlotte-Mecklenburg Hospital Authority
Refunding Revenue Bonds
Carolinas Health Care System Group
Series 2007A (AGM)
01/15/20 | | | 5.000 | % | | | 1,550,000 | | | | 1,752,322 | | |
Carolinas HealthCare System Group
Series 2008A
01/15/24 | | | 5.250 | % | | | 2,000,000 | | | | 2,256,760 | | |
Series 2009A
01/15/21 | | | 5.000 | % | | | 1,000,000 | | | | 1,177,060 | | |
Issue
Description | | Coupon
Rate | | Principal
Amount | | Value | |
| Municipal Bonds (continued) | |
| HOSPITAL (cont.) | |
North Carolina Medical Care Commission
Refunding Revenue Bonds
North Carolina Baptist Hospital
Series 2010
06/01/17 | | | 5.000 | % | | $ | 1,500,000 | | | $ | 1,753,665 | | |
Revenue Bonds
Moses Cone Health System
Series 2011
10/01/20 | | | 5.000 | % | | | 3,215,000 | | | | 3,839,803 | | |
Novant Health Obligation Group
Series 2003A
11/01/13 | | | 5.000 | % | | | 3,000,000 | | | | 3,180,360 | | |
| 11/01/17 | | | 5.000 | % | | | 3,290,000 | | | | 3,477,300 | | |
Wilson Medical Center
Series 2007
11/01/19 | | | 5.000 | % | | | 3,385,000 | | | | 3,695,709 | | |
North Carolina Medical Care Commission(a)
Refunding Revenue Bonds
Vidant Health
Series 2012A
06/01/25 | | | 5.000 | % | | | 1,500,000 | | | | 1,686,930 | | |
Northern Hospital District of Surry County
Revenue Bonds
Series 2008
10/01/24 | | | 5.750 | % | | | 1,000,000 | | | | 1,055,620 | | |
| Total | | | 26,926,349 | | |
| JOINT POWER AUTHORITY 7.4% | |
North Carolina Eastern Municipal Power Agency
Refunding Revenue Bonds
Series 1993B (NPFGC)
01/01/22 | | | 6.000 | % | | | 1,000,000 | | | | 1,271,330 | | |
Series 1993B (NPFGC/FGIC)
01/01/22 | | | 6.000 | % | | | 3,000,000 | | | | 3,849,240 | | |
Series 2005A (AMBAC)
01/01/20 | | | 5.250 | % | | | 2,000,000 | | | | 2,302,340 | | |
Series 2008A (AGM)
01/01/19 | | | 5.250 | % | | | 1,500,000 | | | | 1,761,780 | | |
Revenue Bonds
Series 2009B
01/01/26 | | | 5.000 | % | | | 1,500,000 | | | | 1,671,420 | | |
North Carolina Municipal Power Agency No. 1
Refunding Revenue Bonds
Series 2008A
01/01/17 | | | 5.250 | % | | | 1,185,000 | | | | 1,400,504 | | |
| 01/01/20 | | | 5.250 | % | | | 2,000,000 | | | | 2,346,700 | | |
Revenue Bonds
Series 2009A
01/01/25 | | | 5.000 | % | | | 1,500,000 | | | | 1,687,785 | | |
| Total | | | 16,291,099 | | |
| LOCAL APPROPRIATION 20.0% | |
City of Charlotte
Refunding Certificate of Participation
Convention Facility Project
Series 2003A
08/01/16 | | | 5.500 | % | | | 2,550,000 | | | | 2,722,737 | | |
The Accompanying Notes to Financial Statements are an integral part of this statement.
6
Columbia North Carolina Intermediate Municipal Bond Fund
April 30, 2012
(Percentages represent value of investments compared to net assets)
Issue
Description | | Coupon
Rate | | Principal
Amount | | Value | |
| Municipal Bonds (continued) | |
| LOCAL APPROPRIATION (cont.) | |
City of Greenville
Certificate of Participation
Public Facilities & Equipment Project
Series 2004 (AMBAC)
06/01/22 | | | 5.250 | % | | $ | 2,180,000 | | | $ | 2,309,012 | | |
City of Wilmington
Refunding Certificate of Participation
Series 2006A
06/01/17 | | | 5.000 | % | | | 1,005,000 | | | | 1,163,629 | | |
County of Burke
Certificate of Participation
Series 2006B (AMBAC)
04/01/18 | | | 5.000 | % | | | 1,425,000 | | | | 1,584,514 | | |
County of Cabarrus
Certificate of Participation
Installment Financing Contract
Series 2008C
06/01/22 | | | 5.000 | % | | | 1,545,000 | | | | 1,790,516 | | |
County of Catawba
Revenue Bonds
Series 2011
10/01/22 | | | 5.000 | % | | | 400,000 | | | | 480,184 | | |
County of Chatham
Certificate of Participation
Series 2006 (AMBAC)
06/01/20 | | | 5.000 | % | | | 1,065,000 | | | | 1,214,643 | | |
Refunding Revenue Bonds
Series 2012
12/01/18 | | | 4.000 | % | | | 570,000 | | | | 651,083 | | |
County of Craven
Certificate of Participation
Series 2007 (NPFGC)
06/01/18 | | | 5.000 | % | | | 2,825,000 | | | | 3,279,147 | | |
| 06/01/19 | | | 5.000 | % | | | 1,825,000 | | | | 2,100,502 | | |
County of Cumberland
Refunding Certificate of Participation
Improvement Projects
Series 2009-B1
12/01/21 | | | 5.000 | % | | | 2,775,000 | | | | 3,308,466 | | |
County of Dare
Certificate of Participation
Series 2005 (NPFGC/FGIC)
06/01/20 | | | 5.000 | % | | | 3,005,000 | | | | 3,334,739 | | |
County of Gaston
Refunding Certificate of Participation
Series 2005 (NPFGC)
12/01/15 | | | 5.000 | % | | | 1,350,000 | | | | 1,532,128 | | |
County of Harnett
Certificate of Participation
Series 2009
06/01/22 | | | 5.000 | % | | | 1,880,000 | | | | 2,160,270 | | |
County of Henderson
Certificate of Participation
Series 2006A (AMBAC)
06/01/16 | | | 5.000 | % | | | 1,060,000 | | | | 1,219,223 | | |
County of Iredell
Certificate of Participation
Iredell County School Project
Series 2006 (AMBAC)
06/01/20 | | | 5.000 | % | | | 1,690,000 | | | | 1,897,701 | | |
Issue
Description | | Coupon
Rate | | Principal
Amount | | Value | |
| Municipal Bonds (continued) | |
| LOCAL APPROPRIATION (cont.) | |
County of Mecklenburg
Certificate of Participation
Series 2009A
02/01/23 | | | 5.000 | % | | $ | 1,000,000 | | | $ | 1,152,600 | | |
County of Moore
Revenue Bonds
Series 2010
06/01/24 | | | 5.000 | % | | | 1,635,000 | | | | 1,909,729 | | |
County of New Hanover
Refunding Certificate of Participation
Series 2005B (AMBAC)
09/01/18 | | | 5.000 | % | | | 1,755,000 | | | | 2,129,640 | | |
County of Randolph
Refunding Certificate of Participation
Series 2004 (AGM)
06/01/14 | | | 5.000 | % | | | 1,640,000 | | | | 1,779,597 | | |
County of Sampson
Certificate of Participation
Series 2006 (AGM)
06/01/16 | | | 5.000 | % | | | 1,000,000 | | | | 1,162,240 | | |
County of Union
Refunding Revenue Bonds
Series 2012(a)
12/01/24 | | | 5.000 | % | | | 1,715,000 | | | | 2,091,460 | | |
Orange County Public Facilities Co.
Revenue Bonds
Series 2012
10/01/24 | | | 5.000 | % | | | 1,325,000 | | | | 1,597,473 | | |
Town of Chapel Hill
Certificate of Participation
Chapel Hill Operations Center
Series 2005
06/01/21 | | | 5.250 | % | | | 1,360,000 | | | | 1,484,957 | | |
| Total | | | 44,056,190 | | |
| LOCAL GENERAL OBLIGATION 11.3% | |
City of Charlotte
Unlimited General Obligation Bonds
Series 2002C
07/01/20 | | | 5.000 | % | | | 1,570,000 | | | | 1,582,780 | | |
| 07/01/22 | | | 5.000 | % | | | 1,265,000 | | | | 1,275,297 | | |
County of Brunswick
Unlimited General Obligation Refunding Bonds
Series 2012
02/01/21 | | | 5.000 | % | | | 2,370,000 | | | | 2,957,855 | | |
County of Cabarrus
Unlimited General Obligation Bonds
Public Improvement
Series 2006
03/01/15 | | | 5.000 | % | | | 1,000,000 | | | | 1,123,450 | | |
| 03/01/16 | | | 5.000 | % | | | 1,000,000 | | | | 1,156,700 | | |
County of Iredell
Unlimited General Obligation Bonds
School
Series 2006
02/01/19 | | | 5.000 | % | | | 2,420,000 | | | | 2,754,783 | | |
County of Mecklenburg
Unlimited General Obligation Refunding Bonds
Series 2009A
08/01/19 | | | 5.000 | % | | | 1,000,000 | | | | 1,255,910 | | |
The Accompanying Notes to Financial Statements are an integral part of this statement.
7
Columbia North Carolina Intermediate Municipal Bond Fund
April 30, 2012
(Percentages represent value of investments compared to net assets)
Issue
Description | | Coupon
Rate | | Principal
Amount | | Value | |
| Municipal Bonds (continued) | |
| LOCAL GENERAL OBLIGATION (cont.) | |
County of New Hanover
Unlimited General Obligation Refunding Bonds
Series 2009
12/01/17 | | | 5.000 | % | | $ | 1,170,000 | | | $ | 1,430,898 | | |
County of Orange
Unlimited General Obligation Refunding Bonds
Series 2005B
04/01/16 | | | 5.250 | % | | | 1,000,000 | | | | 1,132,650 | | |
County of Stanly
Unlimited General Obligation Refunding Bonds
Series 2010
02/01/18 | | | 4.000 | % | | | 1,500,000 | | | | 1,758,180 | | |
County of Wake
Unlimited General Obligation Public Improvement Bonds
Series 2011
04/01/15 | | | 5.000 | % | | | 2,000,000 | | | | 2,263,000 | | |
Unlimited General Obligation Refunding Bonds
Series 2009D
02/01/18 | | | 4.000 | % | | | 2,000,000 | | | | 2,334,460 | | |
Unrefunded Unlimited General Obligation Public Improvement Bonds
Series 2009
03/01/20 | | | 5.000 | % | | | 3,065,000 | | | | 3,783,007 | | |
| Total | | | 24,808,970 | | |
| MUNICIPAL POWER 1.4% | |
Greenville Utilities Commission
Revenue Bonds
Series 2008A (AGM)
11/01/18 | | | 5.000 | % | | | 1,040,000 | | | | 1,264,359 | | |
Puerto Rico Electric Power Authority
Refunding Revenue Bonds
Series 2007VV (NPFGC)(b)
07/01/25 | | | 5.250 | % | | | 1,690,000 | | | | 1,887,071 | | |
| Total | | | 3,151,430 | | |
| OTHER BOND ISSUE 1.3% | |
Durham County Industrial Facilities & Pollution Control Financing Authority
Revenue Bonds
Research Triangle Institute
Series 2010
02/01/17 | | | 4.000 | % | | | 1,440,000 | | | | 1,623,787 | | |
| 02/01/18 | | | 4.000 | % | | | 1,000,000 | | | | 1,144,940 | | |
| Total | | | 2,768,727 | | |
| PORTS 1.0% | |
North Carolina Ports Authority
Revenue Bonds
Senior Lien
Series 2010B
02/01/25 | | | 5.000 | % | | | 2,000,000 | | | | 2,192,940 | | |
| REFUNDED/ESCROWED 8.6% | |
City of High Point
Prerefunded 06/01/12 Unlimited General Obligation Bonds
Water & Sewer
Series 2002 (NPFGC)
06/01/14 | | | 4.500 | % | | | 1,275,000 | | | | 1,292,493 | | |
County of Craven
Prerefunded 05/01/12 Unlimited General Obligation Bonds
Series 2002 (AMBAC)
05/01/19 | | | 5.000 | % | | | 1,000,000 | | | | 1,010,130 | | |
Issue
Description | | Coupon
Rate | | Principal
Amount | | Value | |
| Municipal Bonds (continued) | |
| REFUNDED/ESCROWED (cont.) | |
County of Gaston
Prerefunded 06/012/12 Unlimited General Obligation Bonds
Series 2002 (AMBAC)
06/01/20 | | | 5.250 | % | | $ | 1,500,000 | | | $ | 1,521,540 | | |
County of Orange
Prerefunded 04/01/15 Unlimited General Obligation Bonds
Public Improvement
Series 2005A
04/01/22 | | | 5.000 | % | | | 2,000,000 | | | | 2,264,880 | | |
County of Wake
Prerefunded 03/01/19 Unlimited General Obligation Bonds
Public Improvement
Series 2009
03/01/20 | | | 5.000 | % | | | 935,000 | | | | 1,164,870 | | |
Revenue Bonds
Series 1993 Escrowed to Maturity (NPFGC)
10/01/26 | | | 5.125 | % | | | 3,065,000 | | | | 3,713,370 | | |
North Carolina Eastern Municipal Power Agency
Prerefunded 01/01/22 Revenue Bonds
Series 1988A
01/01/26 | | | 6.000 | % | | | 1,000,000 | | | | 1,345,880 | | |
Revenue Bonds
Series 1986A Escrowed to Maturity
01/01/17 | | | 5.000 | % | | | 2,165,000 | | | | 2,485,398 | | |
Puerto Rico Highway & Transportation Authority
Refunding Revenue Bonds
Series 2003AA Escrowed to Maturity (NPFGC)(b)
07/01/18 | | | 5.500 | % | | | 3,360,000 | | | | 4,214,347 | | |
| Total | | | 19,012,908 | | |
| RETIREMENT COMMUNITIES 0.5% | |
North Carolina Medical Care Commission
Refunding Revenue Bonds
1st Mortgage-Givens Estates
Series 2007
07/01/16 | | | 5.000 | % | | | 1,000,000 | | | | 1,088,850 | | |
| SINGLE FAMILY 2.0% | |
North Carolina Housing Finance Agency
Revenue Bonds
Series 2011-2
07/01/25 | | | 4.000 | % | | | 2,000,000 | | | | 2,113,160 | | |
North Carolina Housing Finance Agency(c)
Revenue Bonds
Home Ownership
Series 1998-2-A AMT
01/01/20 | | | 5.200 | % | | | 470,000 | | | | 470,662 | | |
Series 1999-3-A AMT
01/01/19 | | | 5.150 | % | | | 645,000 | | | | 645,858 | | |
Series 2000-8-A AMT
07/01/12 | | | 6.050 | % | | | 75,000 | | | | 75,256 | | |
Series 2007-30-A AMT
07/01/23 | | | 5.000 | % | | | 970,000 | | | | 1,017,210 | | |
| Total | | | 4,322,146 | | |
| SPECIAL NON PROPERTY TAX 2.2% | |
City of Charlotte Storm Water
Revenue Bonds
Series 2006
06/01/17 | | | 5.000 | % | | | 1,120,000 | | | | 1,306,850 | | |
The Accompanying Notes to Financial Statements are an integral part of this statement.
8
Columbia North Carolina Intermediate Municipal Bond Fund
April 30, 2012
(Percentages represent value of investments compared to net assets)
Issue
Description | | Coupon
Rate | | Principal
Amount | | Value | |
| Municipal Bonds (continued) | |
| SPECIAL NON PROPERTY TAX (cont.) | |
Puerto Rico Infrastructure Financing Authority
Refunding Revenue Bonds
Series 2005C (FGIC)(b)
07/01/20 | | | 5.500 | % | | $ | 1,200,000 | | | $ | 1,352,832 | | |
Territory of Guam
Revenue Bonds
Series 2011A(b)
01/01/31 | | | 5.000 | % | | | 500,000 | | | | 549,420 | | |
Virgin Islands Public Finance Authority
Revenue Bonds
Matching Fund Loan-Senior Lien
Series 2010A(b)
10/01/20 | | | 5.000 | % | | | 1,560,000 | | | | 1,754,126 | | |
| Total | | | 4,963,228 | | |
| STATE APPROPRIATED 1.3% | |
North Carolina Infrastructure Finance Corp.
Certificate of Participation
Capital Improvement
Series 2007A (AGM)
05/01/24 | | | 5.000 | % | | | 2,570,000 | | | | 2,878,194 | | |
| STATE GENERAL OBLIGATION 1.0% | |
Commonwealth of Puerto Rico
Unlimited General Obligation Refunding Public Improvement Bonds
Series 2001A (NPFGC)(b)
07/01/14 | | | 5.500 | % | | | 1,725,000 | | | | 1,859,619 | | |
State of North Carolina
Unrefunded Unlimited General Obligation Bonds
Public Improvement
Series 2001A
03/01/14 | | | 4.750 | % | | | 395,000 | | | | 400,404 | | |
| Total | | | 2,260,023 | | |
| TRANSPORTATION 1.1% | |
State of North Carolina
Revenue Bonds
Vehicle
Series 2012
03/01/19 | | | 5.000 | % | | | 2,000,000 | | | | 2,451,560 | | |
| TURNPIKE/BRIDGE/TOLL ROAD 0.1% | |
Puerto Rico Highway & Transportation Authority
Refunding Revenue Bonds
Series 2003AA (NPFGC)(b)
07/01/18 | | | 5.500 | % | | | 140,000 | | | | 159,657 | | |
| WATER & SEWER 17.8% | |
Cape Fear Public Utility Authority
Revenue Bonds
Series 2008
08/01/20 | | | 5.000 | % | | | 1,000,000 | | | | 1,174,670 | | |
City of Charlotte
Revenue Bonds
Series 2002A
07/01/14 | | | 5.500 | % | | | 1,250,000 | | | | 1,387,850 | | |
Series 2009B
07/01/25 | | | 5.000 | % | | | 5,835,000 | | | | 6,999,666 | | |
Water & Sewer System
Series 2008
07/01/23 | | | 5.000 | % | | | 3,000,000 | | | | 3,523,680 | | |
City of Concord
Refunding Revenue Bonds
Series 2008B
12/01/19 | | | 5.000 | % | | | 1,500,000 | | | | 1,840,230 | | |
Issue
Description | | Coupon
Rate | | Principal
Amount | | Value | |
| Municipal Bonds (continued) | |
| WATER & SEWER (cont.) | |
City of Gastonia
Refunding Revenue Bonds
Series 2009
05/01/17 | | | 4.000 | % | | $ | 1,205,000 | | | $ | 1,376,978 | | |
City of Greensboro
Refunding Revenue Bonds
Series 2006
06/01/17 | | | 5.250 | % | | | 2,000,000 | | | | 2,423,560 | | |
| 06/01/22 | | | 5.250 | % | | | 1,200,000 | | | | 1,561,356 | | |
| 06/01/23 | | | 5.250 | % | | | 2,000,000 | | | | 2,621,780 | | |
City of High Point
Revenue Bonds
Series 2008 (AGM)
11/01/24 | | | 5.000 | % | | | 1,000,000 | | | | 1,179,760 | | |
| 11/01/25 | | | 5.000 | % | | | 1,000,000 | | | | 1,150,990 | | |
City of Raleigh
Revenue Bonds
Series 2006A
03/01/16 | | | 5.000 | % | | | 1,500,000 | | | | 1,741,845 | | |
Series 2011
03/01/27 | | | 5.000 | % | | | 800,000 | | | | 952,624 | | |
City of Thomasville(a)
Refunding Revenue Bonds
Series 2012
05/01/24 | | | 4.000 | % | | | 500,000 | | | | 550,655 | | |
| 05/01/26 | | | 4.000 | % | | | 860,000 | | | | 916,975 | | |
City of Winston-Salem
Refunding Revenue Bonds
Series 2007A
06/01/19 | | | 5.000 | % | | | 3,000,000 | | | | 3,536,280 | | |
Revenue Bonds
Series 2009
06/01/23 | | | 5.000 | % | | | 1,000,000 | | | | 1,223,980 | | |
County of Brunswick
Revenue Bonds
Series 2008A
04/01/20 | | | 5.000 | % | | | 1,915,000 | | | | 2,254,070 | | |
| 04/01/22 | | | 5.000 | % | | | 1,390,000 | | | | 1,625,007 | | |
County of Union
Refunding Revenue Bonds
Series 2011A
12/01/19 | | | 4.000 | % | | | 500,000 | | | | 582,370 | | |
| 12/01/20 | | | 4.000 | % | | | 600,000 | | | | 698,448 | | |
| Total | | | 39,322,774 | | |
Total Municipal Bonds
(Cost: $198,483,189) | | $ | 215,825,163 | | |
| Floating Rate Notes 0.5% | |
County of Forsyth
Unlimited General Obligation Bonds
VRDN Series 2007B (Wells Fargo Bank)(d)(e)
10/01/26 | | | 0.240 | % | | $ | 1,000,000 | | | $ | 1,000,000 | | |
Total Floating Rate Notes
(Cost: $1,000,000) | | $ | 1,000,000 | | |
The Accompanying Notes to Financial Statements are an integral part of this statement.
9
Columbia North Carolina Intermediate Municipal Bond Fund
April 30, 2012
(Percentages represent value of investments compared to net assets)
Issue
Description | | Shares | | Value | |
| Money Market Funds 1.5% | |
JPMorgan Tax Free Money Market Fund,
0.010%(f) | | | 3,289,743 | | | $ | 3,289,743 | | |
Total Money Market Funds
(Cost: $3,289,743) | | | | $ | 3,289,743 | | |
Total Investments
(Cost: $202,772,932) | | | | $ | 220,114,906 | | |
| Other Assets & Liabilities, Net | | | | | 318,295 | | |
| Total Net Assets | | | | $ | 220,433,201 | | |
| Notes to Portfolio of Investments | |
(a) Represents a security purchased on a when-issued or delayed delivery basis.
(b) Municipal obligations include debt obligations issued by or on behalf of territories, possessions, or sovereign nations within the territorial boundaries of the United States. At April 30, 2012, the value of these securities amounted to $11,777,072 or 5.34% of net assets.
(c) At April 30, 2012, the value of securities subject to alternative minimum tax was $2,208,986, representing 1.00% of net assets.
(d) Variable rate security. The interest rate shown reflects the rate as of April 30, 2012.
(e) The Fund is entitled to receive principal and interest from the guarantor after a day or a week's notice or upon maturity. The maturity date disclosed represents the final maturity.
(f) The rate shown is the seven-day current annualized yield at April 30, 2012.
AGM Assured Guaranty Municipal Corporation
AMBAC Ambac Assurance Corporation
AMT Alternative Minimum Tax
FGIC Financial Guaranty Insurance Company
NPFGC National Public Finance Guarantee Corporation
VRDN Variable Rate Demand Note
XLCA XL Capital Assurance
Generally accepted accounting principles (GAAP) require disclosure regarding the inputs and valuation techniques used to measure fair value and any changes in valuation inputs or techniques. In addition, investments shall be disclosed by major category.
The Fund categorizes its fair value measurements according to a three-level hierarchy that maximizes the use of observable inputs and minimizes the use of unobservable inputs by prioritizing that the most observable input be used when available. Observable inputs are those that market participants would use in pricing an investment based on market data obtained from sources independent of the reporting entity. Unobservable inputs are those that reflect the Fund's assumptions about the information market participants would use in pricing an investment. An investment's level within the fair value hierarchy is based on the lowest level of any input that is deemed significant to the asset or liability's fair value measurement. The input levels are not necessarily an indication of the risk or liquidity associated with investments at that level. For example, certain U.S. government securities are generally high quality and liquid, however, they are reflected as Level 2 because the inputs used to determine fair value may not always be quoted prices in an active market.
Fair value inputs are summarized in the three broad levels listed below:
• Level 1 — Valuations based on quoted prices for investments in active markets that the Fund has the ability to access at the measurement date (including NAV for open-end mutual funds). Valuation adjustments are not applied to Level 1 investments.
• Level 2 — Valuations based on other significant observable inputs (including quoted prices for similar securities, interest rates, prepayment speeds, credit risks, etc.).
• Level 3 — Valuations based on significant unobservable inputs (including the Fund's own assumptions and judgment in determining the fair value of investments).
The Accompanying Notes to Financial Statements are an integral part of this statement.
10
Columbia North Carolina Intermediate Municipal Bond Fund
April 30, 2012
Inputs that are used in determining fair value of an investment may include price information, credit data, volatility statistics, and other factors. These inputs can be either observable or unobservable. The availability of observable inputs can vary between investments, and is affected by various factors such as the type of investment, and the volume and level of activity for that investment or similar investments in the marketplace. The inputs will be considered by the Investment Manager, along with any other relevant factors in the calculation of an investment's fair value. The Fund uses prices and inputs that are current as of the measurement date, which may include periods of market dislocations. During these periods, the availability of prices and inputs may be reduced for many investments. This condition could cause an investment to be reclassified between the various levels within the hierarchy.
Investments falling into the Level 3 category are primarily supported by quoted prices from brokers and dealers participating in the market for those investments. However, these may be classified as Level 3 investments due to lack of market transparency and corroboration to support these quoted prices. Additionally, valuation models may be used as the pricing source for any remaining investments classified as Level 3. These models rely on one or more significant unobservable inputs and/or significant assumptions by the Investment Manager. Inputs used in valuations may include, but are not limited to, financial statement analysis, capital account balances, discount rates and estimated cash flows, and comparable company data.
Under the direction of the Fund's Board of Trustees (the Board), the Investment Manager's Valuation Committee (the Committee) is responsible for carrying out the valuation procedures approved by the Board. The Committee consists of voting and non-voting members from various groups within the Investment Manager's organization, including operations and accounting, trading and investments, compliance, risk management and legal.
The Committee meets at least monthly to review and approve valuation matters, which may include a description of specific valuation determinations, data regarding pricing information received from approved pricing vendors and brokers and the results of Board-approved valuation control policies and procedures (the Policies). The Policies address, among other things, instances when market quotations are readily available, including recommendation of third party pricing vendors and a determination of appropriate pricing methodologies; events that require specific valuation determinations and assessment of fair value techniques; securities with a potential for stale pricing, including those that are illiquid, restricted, or in default; and the effectiveness of third-party pricing vendors, including periodic reviews of vendors. The Committee meets more frequently, as needed, to discuss additional valuation matters, which may include the need to review back-testing results, review time-sensitive information or approve related valuation actions. The Committee reports to the Board, with members of the Committee meeting with the Board at each of its regularly scheduled meetings to discuss valuation matters and actions during the period, similar to those described earlier.
For investments categorized as Level 3, the Committee monitors information similar to that described above, which may include: (i) data specific to the issuer or comparable issuers, (ii) general market or specific sector news and (iii) quoted prices and specific or similar security transactions. The Committee considers this data and any changes from prior periods in order to assess the reasonableness of observable and unobservable inputs, any assumptions or internal models used to value those securities and changes in fair value. This data is also used to corroborate, when available, information received from approved pricing vendors and brokers. Various factors impact the frequency of monitoring this information (which may occur as often as daily). However, the Committee may determine that changes to inputs, assumptions and models are not required as a result of the monitoring procedures performed.
The following table is a summary of the inputs used to value the Fund's investments as of April 30, 2012:
| | | Fair value at April 30, 2012 | |
| Description | | Level 1
Quoted Prices
in Active
Markets for
Identical Assets | | Level 2
Other
Significant
Observable
Inputs | | Level 3
Significant
Unobservable
Inputs | | Total | |
| Bonds | |
| Municipal Bonds | | $ | — | | | $ | 215,825,163 | | | $ | — | | | $ | 215,825,163 | | |
| Total Bonds | | | — | | | | 215,825,163 | | | | — | | | | 215,825,163 | | |
| Short-Term Securities | |
| Floating Rate Notes | | | — | | | | 1,000,000 | | | | — | | | | 1,000,000 | | |
| Total Short-Term Securities | | | — | | | | 1,000,000 | | | | — | | | | 1,000,000 | | |
| Other | |
| Money Market Funds | | | 3,289,743 | | | | — | | | | — | | | | 3,289,743 | | |
| Total Other | | | 3,289,743 | | | | — | | | | — | | | | 3,289,743 | | |
| Total | | $ | 3,289,743 | | | $ | 216,825,163 | | | $ | — | | | $ | 220,114,906 | | |
See the Portfolio of Investments for all investment classifications not indicated in the table.
The Fund's assets assigned to the Level 2 input category are generally valued using the market approach, in which a security's value is determined through reference to prices and information from market transactions for similar or identical assets.
There were no transfers of financial assets between Levels 1 and 2 during the period from April 1, 2012 to April 30, 2012.
The Accompanying Notes to Financial Statements are an integral part of this statement.
11
Columbia North Carolina Intermediate Municipal Bond Fund
April 30, 2012
The following table is a summary of the inputs used to value the Fund's investments as of March 31, 2012:
| | | Fair Value at March 31, 2012 | |
| Description | | Level 1
Quoted Prices
in Active
Markets for
Identical Assets | | Level 2
Other
Significant
Observable
Inputs | | Level 3
Significant
Unobservable
Inputs | | Total | |
| Bonds | |
| Municipal Bonds | | $ | — | | | $ | 210,839,959 | | | $ | — | | | $ | 210,839,959 | | |
| Total Bonds | | | — | | | | 210,839,959 | | | | — | | | | 210,839,959 | | |
| Short-Term Securities | |
| Floating Rate Notes | | | — | | | | 1,945,000 | | | | — | | | | 1,945,000 | | |
| Total Short-Term Securities | | | — | | | | 1,945,000 | | | | — | | | | 1,945,000 | | |
| Other | |
| Money Market Funds | | | 6,682,926 | | | | — | | | | — | | | | 6,682,926 | | |
| Total Other | | | 6,682,926 | | | | — | | | | — | | | | 6,682,926 | | |
| Total | | $ | 6,682,926 | | | $ | 212,784,959 | | | $ | — | | | $ | 219,467,885 | | |
The Fund's assets assigned to the Level 2 input category are generally valued using the market approach, in which a security's value is determined through reference to prices and information from market transactions for similar or identical assets.
There were no transfers of financial assets between Levels 1 and 2 during the period from April 1, 2011 to March 31, 2012.
The Accompanying Notes to Financial Statements are an integral part of this statement.
12
Statement of Assets and Liabilities – Columbia North Carolina Intermediate Municipal Bond Fund
| | | April 30,
2012 | | March 31,
2012 | |
| Assets | |
| Investments, at value | |
| (identified cost $202,772,932 and $204,048,085) | | $ | 220,114,906 | | | $ | 219,467,885 | | |
| Receivable for: | |
| Investments sold | | | 2,949,820 | | | | — | | |
| Capital shares sold | | | 398,770 | | | | 211,938 | | |
| Interest | | | 2,856,552 | | | | 2,809,836 | | |
| Expense reimbursement due from Investment Manager | | | 1,999 | | | | 1,245 | | |
| Prepaid expense | | | 1,140 | | | | 2,280 | | |
| Total assets | | | 226,323,187 | | | | 222,493,184 | | |
| Liabilities | |
| Payable for: | |
| Investments purchased on a delayed delivery basis | | | 5,207,537 | | | | 2,196,467 | | |
| Capital shares purchased | | | 37,761 | | | | 59,743 | | |
| Dividend distributions to shareholders | | | 509,683 | | | | 526,745 | | |
| Investment management fees | | | 7,217 | | | | 2,398 | | |
| Distribution and service fees | | | 1,376 | | | | 452 | | |
| Transfer agent fees | | | 31,113 | | | | 36,238 | | |
| Administration fees | | | 1,263 | | | | 420 | | |
| Compensation of board members | | | 79,883 | | | | 78,025 | | |
| Other expenses | | | 14,153 | | | | 32,423 | | |
| Total liabilities | | | 5,889,986 | | | | 2,932,911 | | |
| Net assets applicable to outstanding capital stock | | $ | 220,433,201 | | | $ | 219,560,273 | | |
The Accompanying Notes to Financial Statements are an integral part of this statement.
13
Statement of Assets and Liabilities (continued) – Columbia North Carolina Intermediate Municipal Bond Fund
| | | April 30,
2012 | | March 31,
2012 | |
| Represented by | |
| Paid-in capital | | $ | 205,715,371 | | | $ | 206,786,564 | | |
| Undistributed net investment income | | | 737,043 | | | | 720,117 | | |
| Accumulated net realized loss | | | (3,361,187 | ) | | | (3,366,208 | ) | |
| Unrealized appreciation (depreciation) on: | |
| Investments | | | 17,341,974 | | | | 15,419,800 | | |
Total — representing net assets
applicable to outstanding capital stock | | $ | 220,433,201 | | | $ | 219,560,273 | | |
| Net assets applicable to outstanding shares | |
| Class A | | $ | 33,601,181 | | | $ | 33,061,251 | | |
| Class B | | $ | 184,652 | | | $ | 182,790 | | |
| Class C | | $ | 8,222,238 | | | $ | 8,112,156 | | |
| Class Z | | $ | 178,425,130 | | | $ | 178,204,076 | | |
| Shares outstanding | |
| Class A | | | 3,100,615 | | | | 3,077,767 | | |
| Class B | | | 17,036 | | | | 17,013 | | |
| Class C | | | 758,909 | | | | 755,352 | | |
| Class Z | | | 16,478,394 | | | | 16,603,579 | | |
| Net asset value per share | |
| Class A(a) | | $ | 10.84 | | | $ | 10.74 | | |
| Class B | | $ | 10.84 | | | $ | 10.74 | | |
| Class C | | $ | 10.83 | | | $ | 10.74 | | |
| Class Z | | $ | 10.83 | | | $ | 10.73 | | |
(a) At April 30, 2012 and March 31, 2012, the maximum offering price per share for Class A is $11.20 and $11.10, respectively. The offering price is calculated by dividing the net asset value by 1.0 minus the maximum sales charge of 3.25%.
The Accompanying Notes to Financial Statements are an integral part of this statement.
14
Statement of Operations – Columbia North Carolina Intermediate Municipal Bond Fund
| Year ended | | April 30,
2012(a) | | March 31,
2012 | |
| Net investment income | |
| Income: | |
| Dividends | | $ | 58 | | | $ | 1,394 | | |
| Interest | | | 641,854 | | | | 7,370,351 | | |
| Total income | | | 641,912 | | | | 7,371,745 | | |
| Expenses: | |
| Investment management fees | | | 74,667 | | | | 822,262 | | |
| Distribution fees | |
| Class B | | | 117 | | | | 2,329 | | |
| Class C | | | 5,201 | | | | 50,085 | | |
| Service fees | |
| Class B | | | 39 | | | | 777 | | |
| Class C | | | 1,734 | | | | 16,695 | | |
| Distribution and service fees — Class A | | | 7,050 | | | | 79,315 | | |
| Transfer agent fees | |
| Class A | | | 4,434 | | | | 60,504 | | |
| Class B | | | 25 | | | | 769 | | |
| Class C | | | 1,091 | | | | 12,338 | | |
| Class Z | | | 23,830 | | | | 310,681 | | |
| Administration fees | | | 13,067 | | | | 175,678 | | |
| Compensation of board members | | | 2,437 | | | | 14,463 | | |
| Pricing and bookkeeping fees | | | — | | | | 9,953 | | |
| Custodian fees | | | 229 | | | | 6,665 | | |
| Printing and postage fees | | | 3,144 | | | | 31,682 | | |
| Registration fees | | | 600 | | | | 2,688 | | |
| Professional fees | | | 7,335 | | | | 52,282 | | |
| Chief compliance officer expenses | | | — | | | | 29 | | |
| Other | | | 1,995 | | | | 18,843 | | |
| Total expenses | | | 146,995 | | | | 1,668,038 | | |
Fees waived or expenses reimbursed by
Investment Manager and its affiliates | | | (31,781 | ) | | | (405,635 | ) | |
| Total net expenses | | | 115,214 | | | | 1,262,403 | | |
| Net investment income | | | 526,698 | | | | 6,109,342 | | |
| Realized and unrealized gain (loss) — net | |
| Net realized gain (loss) on: | |
| Investments | | | 5,021 | | | | 187,006 | | |
| Net realized gain | | | 5,021 | | | | 187,006 | | |
| Net change in unrealized appreciation (depreciation) on: | |
| Investments | | | 1,922,174 | | | | 11,583,225 | | |
| Net change in unrealized appreciation | | | 1,922,174 | | | | 11,583,225 | | |
| Net realized and unrealized gain | | | 1,927,195 | | | | 11,770,231 | | |
| Net increase in net assets resulting from operations | | $ | 2,453,893 | | | $ | 17,879,573 | | |
(a) For the period from April 1, 2012 to April 30, 2012. During the period, the Fund's fiscal year end was changed from March 31 to April 30.
The Accompanying Notes to Financial Statements are an integral part of this statement.
15
Statement of Changes in Net Assets – Columbia North Carolina Intermediate Municipal Bond Fund
| Year ended | | April 30,
2012(a) | | March 31,
2012 | | March 31,
2011 | |
| Operations | |
| Net investment income | | $ | 526,698 | | | $ | 6,109,342 | | | $ | 6,621,166 | | |
| Net realized gain | | | 5,021 | | | | 187,006 | | | | 421,138 | | |
Net change in unrealized
appreciation (depreciation) | | | 1,922,174 | | | | 11,583,225 | | | | (1,571,989 | ) | |
Net increase in net
assets resulting from operations | | | 2,453,893 | | | | 17,879,573 | | | | 5,470,315 | | |
| Distributions to shareholders from: | |
| Net investment income | |
| Class A | | | (72,299 | ) | | | (888,222 | ) | | | (1,021,135 | ) | |
| Class B | | | (286 | ) | | | (6,424 | ) | | | (25,047 | ) | |
| Class C | | | (12,742 | ) | | | (135,648 | ) | | | (100,745 | ) | |
| Class Z | | | (424,445 | ) | | | (5,095,405 | ) | | | (5,474,239 | ) | |
| Total distributions to shareholders | | | (509,772 | ) | | | (6,125,699 | ) | | | (6,621,166 | ) | |
Increase (decrease) in net
assets from share transactions | | | (1,071,193 | ) | | | 9,824,155 | | | | (12,026,995 | ) | |
Total increase (decrease)
in net assets | | | 872,928 | | | | 21,578,029 | | | | (13,177,846 | ) | |
| Net assets at beginning of year | | | 219,560,273 | | | | 197,982,244 | | | | 211,160,090 | | |
| Net assets at end of year | | $ | 220,433,201 | | | $ | 219,560,273 | | | $ | 197,982,244 | | |
Undistributed net
investment income | | $ | 737,043 | | | $ | 720,117 | | | $ | 736,474 | | |
(a) For the period from April 1, 2012 to April 30, 2012. During the period, the Fund's fiscal year end was changed from March 31 to April 30.
The Accompanying Notes to Financial Statements are an integral part of this statement.
16
Statement of Changes in Net Assets (continued) – Columbia North Carolina Intermediate Municipal Bond Fund
| Year ended | | April 30, 2012(a) | | March 31, 2012 | | March 31, 2011 | |
| | | Shares | | Dollars ($) | | Shares | | Dollars ($) | | Shares | | Dollars ($) | |
| Capital stock activity | |
| Class A shares | |
| Subscriptions(b) | | | 31,546 | | | | 340,406 | | | | 600,962 | | | | 6,350,373 | | | | 744,742 | | | | 7,705,255 | | |
| Distributions reinvested | | | 4,337 | | | | 47,012 | | | | 51,185 | | | | 542,078 | | | | 66,632 | | | | 688,368 | | |
| Redemptions | | | (13,035 | ) | | | (140,645 | ) | | | (706,718 | ) | | | (7,424,714 | ) | | | (952,825 | ) | | | (9,935,460 | ) | |
| Net increase (decrease) | | | 22,848 | | | | 246,773 | | | | (54,571 | ) | | | (532,263 | ) | | | (141,451 | ) | | | (1,541,837 | ) | |
| Class B shares | |
| Subscriptions | | | 2 | | | | 27 | | | | 3,067 | | | | 32,564 | | | | 6,350 | | | | 65,743 | | |
| Distributions reinvested | | | 21 | | | | 223 | | | | 263 | | | | 2,777 | | | | 1,042 | | | | 10,808 | | |
| Redemptions(b) | | | — | | | | — | | | | (41,001 | ) | | | (429,726 | ) | | | (76,554 | ) | | | (778,304 | ) | |
| Net increase (decrease) | | | 23 | | | | 250 | | | | (37,671 | ) | | | (394,385 | ) | | | (69,162 | ) | | | (701,753 | ) | |
| Class C shares | |
| Subscriptions | | | 11,996 | | | | 129,238 | | | | 267,163 | | | | 2,818,144 | | | | 255,153 | | | | 2,624,201 | | |
| Distributions reinvested | | | 753 | | | | 8,152 | | | | 7,413 | | | | 78,601 | | | | 4,823 | | | | 49,683 | | |
| Redemptions | | | (9,192 | ) | | | (99,458 | ) | | | (39,495 | ) | | | (414,412 | ) | | | (113,002 | ) | | | (1,163,003 | ) | |
| Net increase | | | 3,557 | | | | 37,932 | | | | 235,081 | | | | 2,482,333 | | | | 146,974 | | | | 1,510,881 | | |
| Class Z shares | |
| Subscriptions | | | 164,125 | | | | 1,769,928 | | | | 3,167,604 | | | | 33,571,858 | | | | 3,796,730 | | | | 39,249,860 | | |
| Distributions reinvested | | | 3,476 | | | | 37,640 | | | | 36,972 | | | | 391,733 | | | | 31,553 | | | | 325,530 | | |
| Redemptions | | | (292,786 | ) | | | (3,163,716 | ) | | | (2,449,003 | ) | | | (25,695,121 | ) | | | (4,975,352 | ) | | | (50,869,676 | ) | |
| Net increase (decrease) | | | (125,185 | ) | | | (1,356,148 | ) | | | 755,573 | | | | 8,268,470 | | | | (1,147,069 | ) | | | (11,294,286 | ) | |
| Total net increase (decrease) | | | (98,757 | ) | | | (1,071,193 | ) | | | 898,412 | | | | 9,824,155 | | | | (1,210,708 | ) | | | (12,026,995 | ) | |
(a) For the period from April 1, 2012 to April 30, 2012. During the period, the Fund's fiscal year end was changed from March 31 to April 30.
(b) Includes conversions of Class B shares to Class A shares, if any.
The Accompanying Notes to Financial Statements are an integral part of this statement.
17
Financial Highlights – Columbia North Carolina Intermediate Municipal Bond Fund
The following tables are intended to help you understand the Fund's financial performance. Certain information reflects financial results for a single share of a class held for the periods shown. Per share net investment income (loss) amounts are calculated based on average shares outstanding during the period. Total returns assume reinvestment of all dividends and distributions. Total returns do not reflect payments of sales charges, if any, and are not annualized for periods of less than one year.
| | | Year ended
April 30, | | Year ended March 31, | |
| | | 2012(a) | | 2012 | | 2011 | | 2010 | | 2009 | | 2008 | |
| Class A | |
| Per share data | |
| Net asset value, beginning of period | | $ | 10.74 | | | $ | 10.13 | | | $ | 10.17 | | | $ | 9.79 | | | $ | 10.08 | | | $ | 10.38 | | |
| Income from investment operations: | |
| Net investment income | | | 0.02 | | | | 0.30 | | | | 0.31 | | | | 0.33 | | | | 0.37 | | | | 0.39 | | |
| Net realized and unrealized gain (loss) | | | 0.10 | | | | 0.61 | | | | (0.04 | ) | | | 0.38 | | | | (0.29 | ) | | | (0.30 | ) | |
| Total from investment operations | | | 0.12 | | | | 0.91 | | | | 0.27 | | | | 0.71 | | | | 0.08 | | | | 0.09 | | |
| Less distributions to shareholders from: | |
| Net investment income | | | (0.02 | ) | | | (0.30 | ) | | | (0.31 | ) | | | (0.33 | ) | | | (0.37 | ) | | | (0.39 | ) | |
| Net realized gains | | | — | | | | — | | | | — | | | | — | | | | — | | | | (0.00 | )(b) | |
| Total distributions to shareholders | | | (0.02 | ) | | | (0.30 | ) | | | (0.31 | ) | | | (0.33 | ) | | | (0.37 | ) | | | (0.39 | ) | |
| Net asset value, end of period | | $ | 10.84 | | | $ | 10.74 | | | $ | 10.13 | | | $ | 10.17 | | | $ | 9.79 | | | $ | 10.08 | | |
| Total return | | | 1.15 | % | | | 9.02 | % | | | 2.61 | % | | | 7.34 | % | | | 0.87 | % | | | 0.84 | % | |
| Ratios to average net assets(c) | |
| Expenses prior to fees waived or expenses reimbursed | | | 0.96 | %(d) | | | 1.00 | % | | | 0.94 | % | | | 0.91 | % | | | 0.89 | % | | | 0.91 | % | |
| Net expenses after fees waived or expenses reimbursed(e) | | | 0.79 | %(d) | | | 0.79 | % | | | 0.80 | %(f) | | | 0.78 | %(f) | | | 0.75 | %(f) | | | 0.75 | %(f) | |
| Net investment income | | | 2.65 | %(d) | | | 2.80 | % | | | 2.97 | %(f) | | | 3.27 | %(f) | | | 3.79 | %(f) | | | 3.73 | %(f) | |
| Supplemental data | |
| Net assets, end of period (in thousands) | | $ | 33,601 | | | $ | 33,061 | | | $ | 31,731 | | | $ | 33,307 | | | $ | 23,236 | | | $ | 22,399 | | |
| Portfolio turnover | | | 1 | % | | | 4 | % | | | 16 | % | | | 15 | % | | | 20 | % | | | 25 | % | |
| Notes to Financial Highlights | |
(a) For the period from April 1, 2012 to April 30, 2012. During the period, the Fund's fiscal year end was changed from March 31 to April 30.
(b) Rounds to less than $0.01.
(c) In addition to the fees and expenses which the Fund bears directly, the Fund indirectly bears a pro rata share of the fees and expenses of the acquired funds in which it invests. Such indirect expenses are not included in the reported expense ratios.
(d) Annualized.
(e) The Investment Manager and certain of its affiliates agreed to waive/reimburse certain fees and expenses, if applicable.
(f) The benefits derived from expense reductions had an impact of less than 0.01%.
The Accompanying Notes to Financial Statements are an integral part of this statement.
18
Financial Highlights (continued) – Columbia North Carolina Intermediate Municipal Bond Fund
| | | Year ended
April 30, | | Year ended March 31, | |
| | | 2012(a) | | 2012 | | 2011 | | 2010 | | 2009 | | 2008 | |
| Class B | |
| Per share data | |
| Net asset value, beginning of period | | $ | 10.74 | | | $ | 10.13 | | | $ | 10.17 | | | $ | 9.79 | | | $ | 10.08 | | | $ | 10.38 | | |
| Income from investment operations: | |
| Net investment income | | | 0.02 | | | | 0.22 | | | | 0.23 | | | | 0.26 | | | | 0.30 | | | | 0.31 | | |
| Net realized and unrealized gain (loss) | | | 0.10 | | | | 0.59 | | | | (0.04 | ) | | | 0.38 | | | | (0.29 | ) | | | (0.30 | ) | |
| Total from investment operations | | | 0.12 | | | | 0.81 | | | | 0.19 | | | | 0.64 | | | | 0.01 | | | | 0.01 | | |
| Less distributions to shareholders from: | |
| Net investment income | | | (0.02 | ) | | | (0.20 | ) | | | (0.23 | ) | | | (0.26 | ) | | | (0.30 | ) | | | (0.31 | ) | |
| Net realized gains | | | — | | | | — | | | | — | | | | — | | | | — | | | | (0.00 | )(b) | |
| Total distributions to shareholders | | | (0.02 | ) | | | (0.20 | ) | | | (0.23 | ) | | | (0.26 | ) | | | (0.30 | ) | | | (0.31 | ) | |
| Net asset value, end of period | | $ | 10.84 | | | $ | 10.74 | | | $ | 10.13 | | | $ | 10.17 | | | $ | 9.79 | | | $ | 10.08 | | |
| Total return | | | 1.09 | % | | | 8.07 | % | | | 1.85 | % | | | 6.55 | % | | | 0.13 | % | | | 0.09 | % | |
| Ratios to average net assets(c) | |
| Expenses prior to fees waived or expenses reimbursed | | | 1.71 | %(d) | | | 1.82 | % | | | 1.69 | % | | | 1.66 | % | | | 1.64 | % | | | 1.66 | % | |
| Net expenses after fees waived or expenses reimbursed(e) | | | 1.54 | %(d) | | | 1.55 | % | | | 1.55 | %(f) | | | 1.53 | %(f) | | | 1.50 | %(f) | | | 1.50 | %(f) | |
| Net investment income | | | 1.90 | %(d) | | | 2.08 | % | | | 2.22 | %(f) | | | 2.56 | %(f) | | | 3.04 | %(f) | | | 2.99 | %(f) | |
| Supplemental data | |
| Net assets, end of period (in thousands) | | $ | 185 | | | $ | 183 | | | $ | 554 | | | $ | 1,260 | | | $ | 1,920 | | | $ | 2,668 | | |
| Portfolio turnover | | | 1 | % | | | 4 | % | | | 16 | % | | | 15 | % | | | 20 | % | | | 25 | % | |
| Notes to Financial Highlights | |
(a) For the period from April 1, 2012 to April 30, 2012. During the period, the Fund's fiscal year end was changed from March 31 to April 30.
(b) Rounds to less than $0.01.
(c) In addition to the fees and expenses which the Fund bears directly, the Fund indirectly bears a pro rata share of the fees and expenses of the acquired funds in which it invests. Such indirect expenses are not included in the reported expense ratios.
(d) Annualized.
(e) The Investment Manager and certain of its affiliates agreed to waive/reimburse certain fees and expenses, if applicable.
(f) The benefits derived from expense reductions had an impact of less than 0.01%.
The Accompanying Notes to Financial Statements are an integral part of this statement.
19
Financial Highlights (continued) – Columbia North Carolina Intermediate Municipal Bond Fund
| | | Year ended
April 30, | | Year ended March 31, | |
| | | 2012(a) | | 2012 | | 2011 | | 2010 | | 2009 | | 2008 | |
| Class C | |
| Per share data | |
| Net asset value, beginning of period | | $ | 10.74 | | | $ | 10.13 | | | $ | 10.17 | | | $ | 9.79 | | | $ | 10.08 | | | $ | 10.38 | | |
| Income from investment operations: | |
| Net investment income | | | 0.02 | | | | 0.21 | | | | 0.23 | | | | 0.26 | | | | 0.30 | | | | 0.31 | | |
| Net realized and unrealized gain (loss) | | | 0.09 | | | | 0.62 | | | | (0.04 | ) | | | 0.38 | | | | (0.29 | ) | | | (0.30 | ) | |
| Total from investment operations | | | 0.11 | | | | 0.83 | | | | 0.19 | | | | 0.64 | | | | 0.01 | | | | 0.01 | | |
| Less distributions to shareholders from: | |
| Net investment income | | | (0.02 | ) | | | (0.22 | ) | | | (0.23 | ) | | | (0.26 | ) | | | (0.30 | ) | | | (0.31 | ) | |
| Net realized gains | | | — | | | | — | | | | — | | | | — | | | | — | | | | (0.00 | )(b) | |
| Total distributions to shareholders | | | (0.02 | ) | | | (0.22 | ) | | | (0.23 | ) | | | (0.26 | ) | | | (0.30 | ) | | | (0.31 | ) | |
| Net asset value, end of period | | $ | 10.83 | | | $ | 10.74 | | | $ | 10.13 | | | $ | 10.17 | | | $ | 9.79 | | | $ | 10.08 | | |
| Total return | | | 0.99 | % | | | 8.23 | % | | | 1.84 | % | | | 6.55 | % | | | 0.12 | % | | | 0.09 | % | |
| Ratios to average net assets(c) | |
| Expenses prior to fees waived or expenses reimbursed | | | 1.71 | %(d) | | | 1.74 | % | | | 1.69 | % | | | 1.66 | % | | | 1.64 | % | | | 1.66 | % | |
| Net expenses after fees waived or expenses reimbursed(e) | | | 1.54 | %(d) | | | 1.54 | % | | | 1.55 | %(f) | | | 1.53 | %(f) | | | 1.50 | %(f) | | | 1.50 | %(f) | |
| Net investment income | | | 1.90 | %(d) | | | 2.03 | % | | | 2.22 | %(f) | | | 2.54 | %(f) | | | 3.04 | %(f) | | | 2.99 | %(f) | |
| Supplemental data | |
| Net assets, end of period (in thousands) | | $ | 8,222 | | | $ | 8,112 | | | $ | 5,270 | | | $ | 3,797 | | | $ | 3,672 | | | $ | 3,108 | | |
| Portfolio turnover | | | 1 | % | | | 4 | % | | | 16 | % | | | 15 | % | | | 20 | % | | | 25 | % | |
| Notes to Financial Highlights | |
(a) For the period from April 1, 2012 to April 30, 2012. During the period, the Fund's fiscal year end was changed from March 31 to April 30.
(b) Rounds to less than $0.01.
(c) In addition to the fees and expenses which the Fund bears directly, the Fund indirectly bears a pro rata share of the fees and expenses of the acquired funds in which it invests. Such indirect expenses are not included in the reported expense ratios.
(d) Annualized.
(e) The Investment Manager and certain of its affiliates agreed to waive/reimburse certain fees and expenses, if applicable.
(f) The benefits derived from expense reductions had an impact of less than 0.01%.
The Accompanying Notes to Financial Statements are an integral part of this statement.
20
Financial Highlights (continued) – Columbia North Carolina Intermediate Municipal Bond Fund
| | | Year ended
April 30, | | Year ended March 31, | |
| | | 2012(a) | | 2012 | | 2011 | | 2010 | | 2009 | | 2008 | |
| Class Z | |
| Per share data | |
| Net asset value, beginning of period | | $ | 10.73 | | | $ | 10.12 | | | $ | 10.17 | | | $ | 9.79 | | | $ | 10.07 | | | $ | 10.38 | | |
| Income from investment operations: | |
| Net investment income | | | 0.03 | | | | 0.32 | | | | 0.33 | | | | 0.36 | | | | 0.40 | | | | 0.41 | | |
| Net realized and unrealized gain (loss) | | | 0.10 | | | | 0.61 | | | | (0.05 | ) | | | 0.38 | | | | (0.28 | ) | | | (0.31 | ) | |
| Total from investment operations | | | 0.13 | | | | 0.93 | | | | 0.28 | | | | 0.74 | | | | 0.12 | | | | 0.10 | | |
| Less distributions to shareholders from: | |
| Net investment income | | | (0.03 | ) | | | (0.32 | ) | | | (0.33 | ) | | | (0.36 | ) | | | (0.40 | ) | | | (0.41 | ) | |
| Net realized gains | | | — | | | | — | | | | — | | | | — | | | | — | | | | (0.00 | )(b) | |
| Total distributions to shareholders | | | (0.03 | ) | | | (0.32 | ) | | | (0.33 | ) | | | (0.36 | ) | | | (0.40 | ) | | | (0.41 | ) | |
| Net asset value, end of period | | $ | 10.83 | | | $ | 10.73 | | | $ | 10.12 | | | $ | 10.17 | | | $ | 9.79 | | | $ | 10.07 | | |
| Total return | | | 1.17 | % | | | 9.30 | % | | | 2.76 | % | | | 7.61 | % | | | 1.22 | % | | | 0.99 | % | |
| Ratios to average net assets(c) | |
| Expenses prior to fees waived or expenses reimbursed | | | 0.71 | %(d) | | | 0.74 | % | | | 0.69 | % | | | 0.66 | % | | | 0.64 | % | | | 0.66 | % | |
| Net expenses after fees waived or expenses reimbursed(e) | | | 0.54 | %(d) | | | 0.54 | % | | | 0.55 | %(f) | | | 0.53 | %(f) | | | 0.50 | %(f) | | | 0.50 | %(f) | |
| Net investment income | | | 2.90 | %(d) | | | 3.05 | % | | | 3.22 | %(f) | | | 3.54 | %(f) | | | 4.03 | %(f) | | | 3.99 | %(f) | |
| Supplemental data | |
| Net assets, end of period (in thousands) | | $ | 178,425 | | | $ | 178,204 | | | $ | 160,427 | | | $ | 172,795 | | | $ | 163,885 | | | $ | 154,515 | | |
| Portfolio turnover | | | 1 | % | | | 4 | % | | | 16 | % | | | 15 | % | | | 20 | % | | | 25 | % | |
| Notes to Financial Highlights | |
(a) For the period from April 1, 2012 to April 30, 2012. During the period, the Fund's fiscal year end was changed from March 31 to April 30.
(b) Rounds to less than $0.01.
(c) In addition to the fees and expenses which the Fund bears directly, the Fund indirectly bears a pro rata share of the fees and expenses of the acquired funds in which it invests. Such indirect expenses are not included in the reported expense ratios.
(d) Annualized.
(e) The Investment Manager and certain of its affiliates agreed to waive/reimburse certain fees and expenses, if applicable.
(f) The benefits derived from expense reductions had an impact of less than 0.01%.
The Accompanying Notes to Financial Statements are an integral part of this statement.
21
Notes to Financial Statements – Columbia North Carolina Intermediate Municipal Bond Fund
April 30, 2012
Note 1. Organization
Columbia North Carolina Intermediate Municipal Bond Fund (the Fund), a series of Columbia Funds Series Trust (the Trust), is a diversified fund. The Trust is registered under the Investment Company Act of 1940, as amended (the 1940 Act), as an open-end management investment company organized as a Delaware statutory trust.
Fiscal Year End Change
During the period, the Fund changed its fiscal year end from March 31 to April 30. Accordingly, this report includes activity for the period April 1, 2012 to April 30, 2012 and the year ended March 31, 2012.
Fund Shares
The Trust may issue an unlimited number of shares (without par value). The Fund offers Class A, Class B, Class C and Class Z shares. All share classes have identical voting, dividend and liquidation rights. Each share class has its own expense structure and sales charges, as applicable.
Class A shares are subject to a maximum front-end sales charge of 3.25% based on the initial investment amount. Class A shares purchased without an initial sales charge in accounts aggregating $1 million to $50 million at the time of purchase are subject to a contingent deferred sales charge (CDSC) if the shares are sold within 18 months of purchase, charged as follows: 1.00% CDSC if redeemed within 12 months of purchase, and 0.50% CDSC if redeemed more than 12, but less than 18, months after purchase.
Class B shares may be subject to a maximum CDSC of 3.00% based upon the holding period after purchase. Class B shares will generally convert to Class A shares eight years after purchase. The Fund no longer accepts investments by new or existing investors in the Fund's Class B shares, except in connection with the reinvestment of any dividend and/or capital gain distributions in Class B shares of the Fund and exchanges by existing Class B shareholders of certain other funds within the Columbia Family of Funds.
Class C shares are subject to a 1.00% CDSC on shares redeemed within one year of purchase.
Class Z shares are not subject to sales charges, and are only available to certain investors, as described in the Fund's prospectus.
Note 2. Summary of Significant Accounting Policies
Use of Estimates
The preparation of financial statements in accordance with U.S. generally accepted accounting principles (GAAP) requires management to make certain estimates and assumptions that affect the reported amounts of assets and liabilities, the disclosure of contingent assets and liabilities at the date of the financial statements and the reported amounts of revenue and expenses during the reporting period. Actual results could differ from those estimates.
The following is a summary of significant accounting policies consistently followed by the Fund in the preparation of its financial statements.
Security Valuation
Debt securities generally are valued by pricing services approved by the Board of Trustees (the Board) based upon market transactions for normal, institutional-size trading units of similar securities. The services may use various pricing techniques which take into account appropriate factors such as yield, quality, coupon rate, maturity, type of issue, trading characteristics and other data, as well as broker quotes. Debt securities for which quotations are readily available may also be valued based upon an over-the-counter or exchange bid quotation.
Investments in other open-end investment companies, including money market funds, are valued at net asset value.
Short-term securities purchased within 60 days to maturity are valued at amortized cost, which approximates market value. The value of short-term securities originally purchased with maturities greater than 60 days is determined based on an amortized value to par upon reaching 60 days to maturity. Short-term securities maturing in more than 60 days from the valuation date are valued at the market price or approximate market value based on current interest rates.
Investments for which market quotations are not readily available, or that have quotations which management believes are not reliable, are valued at fair value as determined in good faith under consistently applied procedures established by and under the general supervision of the Board. If a security or class of securities (such as foreign securities) is valued at fair
22
Columbia North Carolina Intermediate Municipal Bond Fund, April 30, 2012
value, such value is likely to be different from the last quoted market price for the security. The determination of fair value often requires significant judgment. To determine fair value, management may use assumptions including but not limited to future cash flows and estimated risk premiums. Multiple inputs from various sources may be used to determine value.
Delayed Delivery Securities
The Fund may trade securities on other than normal settlement terms, including securities purchased or sold on "when-issued" basis. This may increase the risk if the other party to the transaction fails to deliver and causes the Fund to subsequently invest in less advantageous prices. The Fund designates cash or liquid securities in an amount equal to the delayed delivery commitment.
Security Transactions
Security transactions are accounted for on the trade date. Cost is determined and gains (losses) are based upon the specific identification method for both financial statement and federal income tax purposes.
Income Recognition
Interest income is recorded on the accrual basis. Market premium and discount are amortized and accreted, respectively, on all debt securities, unless otherwise noted. Original issue discount is accreted to interest income over the life of the security with a corresponding increase in the cost basis, if any.
Dividend income is recorded on the ex-dividend date.
Expenses
General expenses of the Trust are allocated to the Fund and other funds of the Trust based upon relative net assets or other expense allocation methodologies determined by the nature of the expense. Expenses directly attributable to the Fund are charged to the Fund. Expenses directly attributable to a specific class of shares are charged to that share class.
Determination of Class Net Asset Value
All income, expenses (other than class-specific expenses, which are charged to that share class, as shown in the Statement of Operations) and realized and unrealized gains (losses) are allocated to each class of the Fund on a daily basis for purposes of determining the net asset value of each class. Income and expenses are allocated to each class based on the settled shares method, while realized and unrealized gains (losses) are allocated based on the relative net assets of each class.
Federal Income Tax Status
The Fund intends to qualify each year as a regulated investment company under Subchapter M of the Internal Revenue Code, as amended, and will distribute substantially all of its tax exempt or taxable income (including net short-term capital gains), if any, for its tax year, and as such will not be subject to federal income taxes. In addition, the Fund intends to distribute in each calendar year substantially all of its net investment income, capital gains and certain other amounts, if any, such that the Fund should not be subject to federal excise tax. Therefore, no federal income or excise tax provision is recorded.
Distributions to Shareholders
Distributions from net investment income are declared daily and paid monthly. Net realized capital gains, if any, are distributed at least annually. Income distributions and capital gain distributions are determined in accordance with federal income tax regulations which may differ from GAAP.
Guarantees and Indemnifications
Under the Trust's organizational documents and, in some cases, by contract, its officers and trustees are indemnified against certain liabilities arising out of the performance of their duties to the Trust or its funds. In addition, certain of the Fund's contracts with its service providers contain general indemnification clauses. The Fund's maximum exposure under these arrangements is unknown since the amount of any future claims that may be made against the Fund cannot be determined, and the Fund has no historical basis for predicting the likelihood of any such claims.
Note 3. Fees and Compensation Paid to Affiliates
Investment Management Fees
Under an Investment Management Services Agreement, Columbia Management Investment Advisers, LLC (the Investment Manager), a wholly-owned subsidiary of Ameriprise Financial, Inc. (Ameriprise Financial), determines which securities will be purchased, held or sold. The management fee is an annual fee that is equal to a percentage
23
Columbia North Carolina Intermediate Municipal Bond Fund, April 30, 2012
of the Fund's average daily net assets that declines from 0.40% to 0.27% as the Fund's net assets increase. For the period April 1, 2012 to April 30, 2012 and the year ended March 31, 2012, the annualized effective management fee rate was 0.40% of the Fund's average daily net assets.
Administration Fees
Under an Administrative Services Agreement, the Investment Manager serves as the Fund Administrator. Effective July 1, 2011, the Fund pays the Fund Administrator an annual fee for administration and accounting services equal to a percentage of the Fund's average daily net assets that declines from 0.07% to 0.04% as the Fund's net assets increase. Prior to July 1, 2011, the administration fee was equal to the annual rate of 0.15% of the Fund's average daily net assets, less the fees that were payable by the Fund as described under the Pricing and Bookkeeping Fees note below. For the period April 1, 2012 to April 30, 2012, the annualized effective administration fee rate was 0.07% of the Fund's average daily net assets. For the year ended March 31, 2012, the effective administration fee rate was 0.09% of the Fund's average daily net assets.
Pricing and Bookkeeping Fees
Prior to May 16, 2011, the Fund had entered into a Financial Reporting Services Agreement (the Financial Reporting Services Agreement) with State Street Bank and Trust Company (State Street) and the Investment Manager pursuant to which State Street provided financial reporting services to the Fund. The Fund also entered into an Accounting Services Agreement (collectively with the Financial Reporting Services Agreement, the State Street Agreements) with State Street and the Investment Manager pursuant to which State Street provided accounting services to the Fund. Under the State Street Agreements, the Fund paid State Street an annual fee of $38,000 paid monthly plus an additional monthly fee based on an annualized percentage rate of average daily net assets of the Fund for the month. The aggregate fee did not exceed $140,000 per year (exclusive of out-of-pocket expenses and charges). The Fund also reimbursed State Street for certain out-of-pocket expenses and charges. Effective May 16, 2011, these services are provided under the Administrative Services Agreement discussed above.
Other Fees
Effective June 1, 2011, other expenses are for, among other things, certain expenses of the Fund or the Board, including: Fund boardroom and office expense, employee compensation, employee health and retirement benefits, and certain other expenses. Payment of these Fund and Board expenses is facilitated by a company providing limited administrative services to the Fund and the Board. For the period April 1, 2012 to April 30, 2012 and the period June 1, 2011 through March 31, 2012, other expenses paid to this company were $145 and $1,913, respectively.
Compensation of Board Members
Board members are compensated for their services to the Fund as disclosed in the Statement of Operations. Under a Deferred Compensation Plan (the Plan), the Board members who are not "interested persons" of the Fund, as defined under the 1940 Act, may elect to defer payment of up to 100% of their compensation. Deferred amounts are treated as though equivalent dollar amounts had been invested in shares of certain funds managed by the Investment Manager. The Fund's liability for these amounts is adjusted for market value changes and remains in the Fund until distributed in accordance with the Plan.
Compensation of Chief Compliance Officer
The Board has appointed a Chief Compliance Officer to the Fund in accordance with federal securities regulations. The Fund's expenses associated with the Chief Compliance Officer are paid directly by the Investment Manager.
Transfer Agent Fees
Under a Transfer and Dividend Disbursing Agent Agreement, Columbia Management Investment Services Corp. (the Transfer Agent), an affiliate of the Investment Manager and a wholly-owned subsidiary of Ameriprise Financial, is responsible for providing transfer agency services to the Fund. The Transfer Agent has contracted with Boston Financial Data Services (BFDS) to serve as sub-transfer agent.
The Transfer Agent receives monthly account-based service fees based on the number of open accounts and is reimbursed by the Fund for the fees and expenses the Transfer Agent pays to financial intermediaries that maintain omnibus accounts with the Fund that is a percentage of the average aggregate
24
Columbia North Carolina Intermediate Municipal Bond Fund, April 30, 2012
value of the Fund's shares maintained in each such omnibus account (other than omnibus accounts for which American Enterprise Investment Services Inc. is the broker of record or accounts where the beneficial shareholder is a customer of Ameriprise Financial Services, Inc., which are paid a per account fee). The Transfer Agent pays the fees of BFDS for services as sub-transfer agent and is not entitled to reimbursement for such fees from the Fund (with the exception of out-of-pocket fees).
The Transfer Agent also receives compensation from fees for various shareholder services and reimbursements for certain out-of-pocket expenses.
For the period April 1, 2012 to April 30, 2012 and the year ended March 31, 2012, the Fund's annualized effective transfer agent fee rates as a percentage of average daily net assets of each class were as follows:
| | | Period ended
April 30,
2012 | | Year ended
March 31,
2012 | |
| Class A | | | 0.16 | % | | | 0.19 | % | |
| Class B | | | 0.16 | | | | 0.25 | | |
| Class C | | | 0.16 | | | | 0.19 | | |
| Class Z | | | 0.16 | | | | 0.19 | | |
An annual minimum account balance fee of $20 may apply to certain accounts with a value below the Fund's initial minimum investment requirements to reduce the impact of small accounts on transfer agent fees. These minimum account balance fees are recorded as part of expense reductions in the Statement of Operations. For the period April 1, 2012 to April 30, 2012 and the year ended March 31, 2012, no minimum account balance fees were charged to accounts.
Distribution and Service Fees
The Fund has an agreement with Columbia Management Investment Distributors, Inc. (the Distributor), an affiliate of the Investment Manager and a wholly-owned subsidiary of Ameriprise Financial, for distribution and shareholder services. Pursuant to Rule 12b-1 under the 1940 Act, the Board has approved, and the Fund has adopted, distribution and shareholder service plans (the Plans) which set the distribution and service fees for the Fund. These fees are calculated daily and are intended to compensate the Distributor and/or eligible selling and/or servicing agents for selling shares of the Fund and providing services to investors.
The Plans require the payment of a monthly combined distribution and service fee to the Distributor at the maximum annual rate of 0.25% of the average daily net assets attributable to Class A shares of the Fund. The Plans also require the payment of a monthly service fee at the maximum annual rate of 0.25% of the average daily net assets attributable to Class B and Class C shares of the Fund and the payment of a monthly distribution fee at the maximum annual rate of 0.75% of the average daily net assets attributable to Class B and Class C shares of the Fund.
Sales Charges
Sales charges, including front-end charges and CDSCs, received by the Distributor for distributing Fund shares were $4,362 for Class A shares for the period April 1, 2012 to April 30, 2012, and $46,642 for Class A and $311 for Class C for the year ended March 31, 2012.
Expenses Waived/Reimbursed by the Investment Manager and its Affiliates
Effective July 1, 2011, the Investment Manager and certain of its affiliates have contractually agreed to waive fees and/or reimburse expenses (excluding certain fees and expenses described below), through July 31, 2012, unless sooner terminated at the sole discretion of the Board, so that the Fund's net operating expenses, after giving effect to fees waived/expenses reimbursed and any balance credits and/or overdraft charges from the Fund's custodian, do not exceed the following annual rates as a percentage of the class' average daily net assets:
| Class A | | | 0.79 | % | |
| Class B | | | 1.54 | | |
| Class C | | | 1.54 | | |
| Class Z | | | 0.54 | | |
Under the agreement, the following fees and expenses are excluded from the waiver/reimbursement commitment, and therefore will be paid by the Fund, if applicable: taxes (including foreign transaction taxes), expenses associated with investments in affiliated and non-affiliated pooled
25
Columbia North Carolina Intermediate Municipal Bond Fund, April 30, 2012
investment vehicles (including mutual funds and exchange traded funds), transaction costs and brokerage commissions, costs related to any securities lending program, dividend expenses associated with securities sold short, inverse floater program fees and expenses, transaction charges and interest on borrowed money, interest, extraordinary expenses and any other expenses the exclusion of which is specifically approved by the Fund's Board. This agreement may be modified or amended only with approval from all parties.
Prior to July 1, 2011, the Investment Manager voluntarily agreed to reimburse a portion of the Fund's expenses (excluding certain expenses, such as distribution and services fees, brokerage commissions, interest, taxes and extraordinary expenses, but including custodian charges relating to overdrafts, if any) so that the Fund's ordinary net operating expenses, after giving effect to fees waived/expenses reimbursed and any balance credits and/or overdraft charges from the Fund's custodian, did not exceed 0.55% of the Fund's average daily net assets on an annualized basis.
Prior to May 1, 2011, the Investment Manager was entitled to recover from the Fund any fees waived and/or expenses reimbursed for a three year period following the date of such fee waiver and/or reimbursement under these arrangements if such recovery did not cause the Fund's expenses to exceed the expense limitations in effect at the time of recovery. Effective May 1, 2011, the Investment Manager has eliminated such fee recoupment provisions.
Note 4. Federal Tax Information
The timing and character of income and capital gain distributions are determined in accordance with income tax regulations, which may differ from GAAP because of temporary or permanent book to tax differences.
For the period April 1, 2012 to April 30, 2012, these differences are primarily due to differing treatment for capital loss carryforwards, market discount, Trustees' deferred compensation, distributions and tax straddles. For the year ended March 31, 2012, these differences are primarily due to differing treatment for capital loss carryforwards, Trustees' deferred compensation, distributions and tax straddles. To the extent these differences are permanent, reclassifications are made among the components of the Fund's net assets in the Statement of Assets and Liabilities. Temporary differences do not require reclassifications. In the Statement of Assets and Liabilities no reclassifications were made.
The tax character of distributions paid during the periods indicated was as follows:
| | | Period ended
April 30,
2012 | | Year ended
March 31,
2012 | | Year ended
March 31,
2011 | |
| Ordinary income | | $ | 1,416 | | | $ | 14,625 | | | $ | 76,413 | | |
Tax-exempt
Income | | | 508,356 | | | | 6,111,074 | | | | 6,544,753 | | |
Short-term capital gain distributions, if any, are considered ordinary income distributions for tax purposes.
At April 30, 2012 and March 31, 2012, the components of distributable earnings on a tax basis were as follows:
| | | April 30,
2012 | | March 31,
2012 | |
Undistributed
tax-exempt income | | $ | 1,294,650 | | | $ | 1,294,786 | | |
Undistributed
accumulated
long-term gain | | | — | | | | — | | |
Unrealized
appreciation | | | 17,341,974 | | | | 15,419,800 | | |
At April 30, 2012 and March 31, 2012, the cost of investments for federal income tax purposes, and the aggregate unrealized appreciation and depreciation based on that cost was as follows:
| | | April 30,
2012 | | March 31,
2012 | |
Aggregate unrealized
appreciation | | $ | 17,412,043 | | | $ | 15,628,037 | | |
Aggregate unrealized
depreciation | | | (70,069 | ) | | | (208,237 | ) | |
Net unrealized
appreciation | | | 17,341,974 | | | | 15,419,800 | | |
Cost of investments for
tax purposes | | | 202,772,932 | | | | 204,048,085 | | |
26
Columbia North Carolina Intermediate Municipal Bond Fund, April 30, 2012
The following capital loss carryforward, determined at April 30, 2012 and March 31, 2012, may be available to reduce taxable income arising from future net realized gains on investments, if any, to the extent permitted by the Internal Revenue Code:
| Year of Expiration | | April 30,
2012
Amount | | March 31,
2012
Amount | |
| 2016 | | $ | 428,412 | | | $ | — | | |
| 2017 | | | 2,905,585 | | | | 433,433 | | |
| 2018 | | | — | | | | 2,905,585 | | |
| Total | | $ | 3,333,997 | | | $ | 3,339,018 | | |
On December 22, 2010, the Regulated Investment Company Modernization Act of 2010 (the Act) was enacted, which changed various technical rules governing the tax treatment of regulated investment companies. The changes are generally effective for taxable years beginning after the date of enactment. Under the Act, the Fund will be permitted to carry forward capital losses incurred in taxable years beginning after the date of enactment for an unlimited period. However, any losses incurred during those future taxable years will be required to be utilized prior to the losses incurred in pre-enactment taxable years, which carry an expiration date. As a result of this ordering rule, pre-enactment capital loss carryforwards may be more likely to expire unused.
For the period April 1, 2012 to April 30, 2012, $5,021 of capital loss carryforward was utilized. For the year ended March 31, 2012, $187,005 of capital loss carryforward was utilized.
Management of the Fund has concluded that there are no significant uncertain tax positions that would require recognition in the financial statements. However, management's conclusion may be subject to review and adjustment at a later date based on factors including, but not limited to, new tax laws, regulations, and administrative interpretations (including relevant court decisions). Generally, the Fund's federal tax returns for the prior three fiscal years remain subject to examination by the Internal Revenue Service.
Note 5. Portfolio Information
For the period April 1, 2012 to April 30, 2012, the cost of purchases and proceeds from sales of securities, excluding short-term obligations, aggregated to $5,207,537 and $2,004,820, respectively.
For the year ended March 31, 2012, the cost of purchases and proceeds from sales of securities, excluding short-term obligations, aggregated to $20,560,723 and $8,169,588, respectively,.
Note 6. Lending of Portfolio Securities
Effective May 16, 2011, the Fund has entered into a Master Securities Lending Agreement (the Agreement) with JPMorgan Chase Bank, N.A. (JPMorgan). The Agreement, which replaces the previous securities lending arrangement with State Street, authorizes JPMorgan as lending agent to lend securities to authorized borrowers in order to generate additional income on behalf of the Fund. Pursuant to the Agreement, the securities loaned are secured by cash or U.S. government securities equal to at least 100% of the market value of the loaned securities. Any additional collateral required to maintain those levels due to market fluctuations of the loaned securities is requested to be delivered the following business day. Cash collateral received is invested by the lending agent on behalf of the Fund into authorized investments pursuant to the Agreement. The investments made with the cash collateral are listed in the Portfolio of Investments. The values of such investments and any uninvested cash collateral are disclosed in the Statement of Assets and Liabilities along with the related obligation to return the collateral upon the return of the securities loaned.
Risks of delay in recovery of securities or even loss of rights in the securities may occur should the borrower of the securities fail financially. Risks may also arise to the extent that the value of the securities loaned increases above the value of the collateral received. JPMorgan will indemnify the Fund from losses resulting from a borrower's failure to return a loaned security when due. Such indemnification does not extend to losses associated with declines in the value of cash collateral investments. The Investment Manager is not responsible for any losses incurred by the Fund in connection with the securities lending program. Loans are subject to termination by the Fund or the borrower at any time, and are, therefore, not considered to be illiquid investments.
27
Columbia North Carolina Intermediate Municipal Bond Fund, April 30, 2012
Pursuant to the Agreement, the Fund receives income for lending its securities either in the form of fees or by earning interest on invested cash collateral, net of negotiated rebates paid to borrowers and fees paid to the lending agent for services provided and any other securities lending expenses. The Fund continues to earn and accrue interest and dividends on the securities loaned.
Prior to May 16, 2011, the Fund participated in a securities lending arrangement with State Street. Each security on loan was collateralized in an amount at least equal to the market value of the securities loaned plus accrued income from the investment of collateral. The income generated by the investment of the collateral, net of any fees remitted to State Street as the lending agent and borrower rebates, was paid to the Fund.
For the period ended April 30, 2012 and the year ended March 31, 2012, the Fund did not participate in securities lending activity.
Note 7. Custody Credits
Prior to May 16, 2011, the Fund had an agreement with its custodian bank under which custody fees may have been reduced by balance credits. These credits are recorded as part of expense reductions on the Statement of Operations. The Fund could have invested a portion of the assets utilized in connection with the expense offset arrangement in an income-producing asset if they had not entered into such an agreement. For the period April 1, 2011 through May 16, 2011, there were no custody credits.
Note 8. Shareholder Concentration
At April 30, 2012 and March 31, 2012, one unaffiliated shareholder account owned 76.9% and 77.4% of the outstanding shares of the Fund, respectively. The Fund has no knowledge about whether any portion of those shares was owned beneficially by such accounts. Subscription and redemption activity by concentrated accounts may have a significant effect on the operations of the Fund.
Note 9. Line of Credit
The Fund has entered into a revolving credit facility with a syndicate of banks led by JPMorgan, whereby the Fund may borrow for the temporary funding of shareholder redemptions or for other temporary or emergency purposes. The credit facility became effective on May 16, 2011, replacing a prior credit facility. The credit facility agreement, as amended, which is a collective agreement between the Fund and certain other funds managed by the Investment Manager, severally and not jointly, permits collective borrowings up to $500 million. Pursuant to a December 13, 2011 amendment to the credit facility agreement, interest is charged to each participating fund based on its borrowings at a rate equal to the higher of (i) the overnight federal funds rate plus 1.00% or (i) the one-month LIBOR rate plus 1.00%. Each borrowing under the credit facility matures no later than 60 days after the date of borrowing. The Fund also pays a commitment fee equal to its pro rata share of the amount of the credit facility at a rate of 0.08% per annum. For the period May 16, 2011 through December 13, 2011, interest was charged to each participating fund based on its borrowings at a rate equal to the sum of the federal funds rate plus (i) 1.25% per annum plus (ii) if one-month LIBOR exceeds the federal funds rate, the amount of such excess. The Fund also paid a commitment fee equal to its pro rata share of the amount of the credit facility at a rate of 0.10% per annum.
Prior to May 16, 2011, the Fund and certain other funds managed by the Investment Manager participated in a $225 million committed, unsecured revolving credit facility provided by State Street. Interest was charged to each fund based on its borrowings at a rate equal to the greater of the (i) federal funds rate plus 1.25% per annum or (ii) the overnight LIBOR rate plus 1.25% per annum. The Fund also paid a commitment fee equal to its pro rata share of the amount of the credit facility at a rate of 0.125% per annum.
The Fund had no borrowings during the period ended April 30, 2012 and the year ended March 31, 2012.
Note 10. Significant Risks
Geographic Concentration Risk
Because state-specific tax-exempt funds invest primarily in the municipal securities issued by the state and political sub-divisions of the state, the Fund will be particularly affected by political and economic conditions and developments in the state in which it invests. The Fund may, therefore, have a greater risk than that of a municipal bond fund which is more geographically diversified. The value of the municipal
28
Columbia North Carolina Intermediate Municipal Bond Fund, April 30, 2012
securities owned by the Fund also may be adversely affected by future changes in federal or state income tax laws.
Note 11. Subsequent Events
Management has evaluated the events and transactions that have occurred through the date the financial statements were issued and noted no items requiring adjustment of the financial statements or additional disclosure.
Note 12. Information Regarding Pending and Settled Legal Proceedings
In December 2005, without admitting or denying the allegations, American Express Financial Corporation (AEFC, which is now known as Ameriprise Financial, Inc. (Ameriprise Financial)) entered into settlement agreements with the Securities and Exchange Commission (SEC) and Minnesota Department of Commerce (MDOC) related to market timing activities. As a result, AEFC was censured and ordered to cease and desist from committing or causing any violations of certain provisions of the Investment Advisers Act of 1940, the Investment Company Act of 1940, and various Minnesota laws. AEFC agreed to pay disgorgement of $10 million and civil money penalties of $7 million. AEFC also agreed to retain an independent distribution consultant to assist in developing a plan for distribution of all disgorgement and civil penalties ordered by the SEC in accordance with various undertakings detailed at www.sec.gov/litigation/admin/ia-2451.pdf. Ameriprise Financial and its affiliates have cooperated with the SEC and the MDOC in these legal proceedings, and have made regular reports to the funds' Boards of Trustees.
Ameriprise Financial and certain of its affiliates have historically been involved in a number of legal, arbitration and regulatory proceedings, including routine litigation, class actions, and governmental actions, concerning matters arising in connection with the conduct of their business activities. Ameriprise Financial believes that the Funds are not currently the subject of, and that neither Ameriprise Financial nor any of its affiliates are the subject of, any pending legal, arbitration or regulatory proceedings that are likely to have a material adverse effect on the Funds or the ability of Ameriprise Financial or its affiliates to perform under their contracts with the Funds. Ameriprise Financial is required to make 10-Q, 10-K and, as necessary, 8-K filings with the Securities and Exchange Commission on legal and regulatory matters that relate to Ameriprise Financial and its affiliates. Copies of these filings may be obtained by accessing the SEC website at www.sec.gov.
There can be no assurance that these matters, or the adverse publicity associated with them, will not result in increased fund redemptions, reduced sale of fund shares or other adverse consequences to the Funds. Further, although we believe proceedings are not likely to have a material adverse effect on the Funds or the ability of Ameriprise Financial or its affiliates to perform under their contracts with the Funds, these proceedings are subject to uncertainties and, as such, we are unable to estimate the possible loss or range of loss that may result. An adverse outcome in one or more of these proceedings could result in adverse judgments, settlements, fines, penalties or other relief that could have a material adverse effect on the consolidated financial condition or results of operations of Ameriprise Financial.
29
Report of Independent Registered Public Accounting Firm
To the Trustees of Columbia Funds Series Trust and the Shareholders of Columbia North Carolina Intermediate Municipal Bond Fund
In our opinion, the accompanying statement of assets and liabilities, including the portfolio of investments, and the related statements of operations and of changes in net assets and the financial highlights present fairly, in all material respects, the financial position of Columbia North Carolina Intermediate Municipal Bond Fund (the "Fund") (a series of Columbia Funds Series Trust) at April 30, 2012 and at March 31, 2012, the results of its operations, the changes in its net assets and the financial highlights for each of the periods indicated, in conformity with accounting principles generally accepted in the United States of America. These financial statements and financial highlights (hereafter referred to as "financial statements") are the responsibility of the Fund's management. Our responsibility is to express an opinion on these financial statements based on our audits. We conducted our audits of these financial statements in accordance with the standards of the Public Company Accounting Oversight Board (United States). Those standards require that we plan and perform the audit to obtain reasonable assurance about whether the financial statements are free of material misstatement. An audit includes examining, on a test basis, evidence supporting the amounts and disclosures in the financial statements, assessing the accounting principles used and significant estimates made by management, and evaluating the overall financial statement presentation. We believe that our audits, which included confirmation of securities at April 30, 2012 and at March 31, 2012 by correspondence with the custodian, transfer agent and brokers, provide a reasonable basis for our opinion.
PricewaterhouseCoopers LLP
Minneapolis, Minnesota
June 8, 2012
30
Federal Income Tax Information (Unaudited) – Columbia North Carolina Intermediate Municipal Bond Fund
For the fiscal period ended April 30, 2012 and the fiscal year ended March 31, 2012, 99.72% and 99.76%, respectively, of the distributions from net investment income of the Fund qualifies as exempt interest dividends for federal income tax purposes. A portion of the income may be subject to federal alternative minimum tax.
The Fund will notify shareholders in January 2013 of amounts for use in preparing 2012 income tax returns.
31
Fund Governance
Shareholders elect the Board that oversees the funds' operations. The Board appoints officers who are responsible for day-to-day business decisions based on policies set by the Board. The following table provides basic biographical information about the funds' Board members, including their principal occupations during the past five years, although specific titles for individuals may have varied over the period. Under current Board policy, members may serve until the next Board meeting after he or she reaches the mandatory retirement age established by the Board, or the fifteenth anniversary of the first Board meeting they attended as a member of the Board.
On September 29, 2009, Ameriprise Financial, the parent company of Columbia Management, entered into an agreement with Bank of America, N.A. ("Bank of America") to acquire a portion of the asset management business of Columbia Management Group, LLC and certain of its affiliated companies (the "Transaction"). Following the Transaction, which became effective on May 1, 2010, various alignment activities have occurred with respect to the Fund Family. In connection with the Transaction, Mr. Edward J. Boudreau, Jr., Mr. William P. Carmichael, Mr. William A. Hawkins, Mr. R. Glenn Hilliard, Mr. John J. Nagorniak, Ms. Minor M. Shaw and Dr. Anthony M. Santomero, who were members prior to the Transaction of the Legacy Columbia Nations funds' Board ("Nations Funds"), which includes Columbia Funds Series Trust, Columbia Funds Variable Insurance Trust I and Columbia Funds Master Investment Trust, LLC., began service on the Board for the Legacy RiverSource funds ("RiverSource Funds") effective June 1, 2011, which resulted in an overall increase from twelve Trustees to sixteen for all mutual funds overseen by the Board.
Independent Board Members
| Name, Address, Age | | Position Held
with Funds
and Length
of Service | | Principal Occupation During Past Five Years | | Number of
Funds in the
Fund Family
Overseen by
Board Member | | Other Present or
Past Directorships/
Trusteeships
(Within Past 5 Years) | |
| Kathleen Blatz | | | | | | | | | |
|
901 S. Marquette Ave.
Minneapolis, MN 55402
Age 57 | | Board member since 1/06 for RiverSource Funds and since 6/11 for Nations Funds | | Attorney; Chief Justice, Minnesota Supreme Court, 1998-2006 | | | 156 | | | None | |
|
| Edward J. Boudreau, Jr. | | | | | | | | | |
|
225 Franklin Street
Mail Drop
BX32 05228
Boston, MA 02110
Age 67 | | Board member since 6/11 for RiverSource Funds and since 1/05 for Nations Funds | | Managing Director, E.J. Boudreau & Associates (consulting) since 2000 | | | 149 | | | Former Trustee, BofA Funds Series Trust (11 funds) | |
|
| Pamela G. Carlton | | | | | | | | | |
|
901 S. Marquette Ave.
Minneapolis, MN 55402
Age 57 | | Board member since 7/07 for RiverSource Funds and since 6/11 for Nations Funds | | President, Springboard-Partners in Cross Cultural Leadership (consulting company) | | | 156 | | | None | |
|
32
Fund Governance (continued)
Independent Board Members (continued)
| Name, Address, Age | | Position Held
with Funds
and Length
of Service | | Principal Occupation During Past Five Years | | Number of
Funds in the
Fund Family
Overseen by
Board Member | | Other Present or
Past Directorships/
Trusteeships
(Within Past 5 Years) | |
| William P. Carmichael | | | | | | | | | |
|
225 Franklin Street
Mail Drop
BX32 05228
Boston, MA 02110
Age 68 | | Board member since 6/11 for RiverSource Funds and since 1999 for Nations Funds | | Retired | | | 149 | | | Director, Cobra Electronics Corporation (electronic equipment manufacturer); The Finish Line (athletic shoes and apparel); McMoRan Exploration Company (oil and gas exploration and development); former Trustee, BofA Funds Series Trust (11 funds); former Director, Spectrum Brands, Inc. (consumer products); former Director, Simmons Company (bedding) | |
|
| Patricia M. Flynn | | | | | | | | | |
|
901 S. Marquette Ave.
Minneapolis, MN 55402
Age 61 | | Board member since 11/04 for RiverSource Funds and since 6/11 for Nations Funds | | Trustee Professor of Economics and Management, Bentley University; former Dean, McCallum Graduate School of Business, Bentley University | | | 156 | | | None | |
|
| William A. Hawkins | | | | | | | | | |
|
225 Franklin Street
Mail Drop
BX32 05228
Boston, MA 02110
Age 69 | | Board member since 6/11 for RiverSource Funds and since 1/05 for Nations Funds | | Managing Director, Overton Partners (financial consulting), since August 2010; President and Chief Executive Officer, California General Bank, N.A., January 2008-August 2010 | | | 149 | | | Trustee, BofA Funds Series Trust (11 funds) | |
|
| R. Glenn Hilliard | | | | | | | | | |
|
225 Franklin Street
Mail Drop
BX32 05228
Boston, MA 02110
Age 69 | | Board member since 6/11 for RiverSource Funds and since 1/05 for Nations Funds | | Chairman and Chief Executive Officer, Hilliard Group LLC (investing and consulting), since April 2003; Non-Executive Director & Chairman, CNO Financial Group, Inc. (formerly Conseco, Inc.) (insurance), September 2003-May 2011 | | | 149 | | | Chairman, BofA Fund Series Trust (11 funds); former Director, CNO Financial Group, Inc. (insurance) | |
|
33
Fund Governance (continued)
Independent Board Members (continued)
| Name, Address, Age | | Position Held
with Funds
and Length
of Service | | Principal Occupation During Past Five Years | | Number of
Funds in the
Fund Family
Overseen by
Board Member | | Other Present or
Past Directorships/
Trusteeships
(Within Past 5 Years) | |
| Stephen R. Lewis, Jr. | | | | | | | | | |
|
901 S. Marquette Ave.
Minneapolis, MN 55402
Age 73 | | Chair of the Board for RiverSource Funds since 1/07, Board member for RiverSource Funds since 1/02 and since 6/11 for Nations Funds | | President Emeritus and Professor of Economics Emeritus, Carleton College | | | 156 | | | Director, Valmont Industries, Inc. (manufactures irrigation systems) | |
|
| John F. Maher | | | | | | | | | |
|
901 S. Marquette Ave.
Minneapolis, MN 55402
Age 69 | | Board member since 12/06 for Legacy Seligman funds, since 12/08 for RiverSource Funds and since 6/11 for Nations Funds | | Retired President and Chief Executive Officer and former Director, Great Western Financial Corporation (financial services), 1986-1997 | | | 156 | | | None | |
|
| John J. Nagorniak | | | | | | | | | |
|
225 Franklin Street
Mail Drop
BX32 05228
Boston, MA 02110
Age 67 | | Board member since 6/11 for RiverSource Funds and since 1/08 for Nations Funds | | Retired; President and Director, Foxstone Financial, Inc. (consulting), 2000-2007; Director, Mellon Financial Corporation affiliates (investing), 2000-2007; Chairman, Franklin Portfolio Associates (investing—Mellon affiliate), 1982-2007 | | | 149 | | | Trustee, Research Foundation of CFA Institute; Director, MIT Investment Company; Trustee, MIT 401k Plan; former Trustee, BofA Funds Series Trust (11 funds) | |
|
| Catherine James Paglia | | | | | | | | | |
|
901 S. Marquette Ave.
Minneapolis, MN 55402
Age 59 | | Board member since 11/04 for RiverSource Funds and since 6/11 for Nations Funds | | Director, Enterprise Asset Management, Inc. (private real estate and asset management company) | | | 156 | | | None | |
|
34
Fund Governance (continued)
Independent Board Members (continued)
| Name, Address, Age | | Position Held
with Funds
and Length
of Service | | Principal Occupation During Past Five Years | | Number of
Funds in the
Fund Family
Overseen by
Board Member | | Other Present or
Past Directorships/
Trusteeships
(Within Past 5 Years) | |
| Leroy C. Richie | | | | | | | | | |
|
901 S. Marquette Ave.
Minneapolis, MN 55402
Age 70 | | Board member since 2000 for Legacy Seligman funds, since 11/08 for RiverSource Funds and since 6/11 for Nations Funds | | Counsel, Lewis & Munday, P.C. since 2004; former Vice President and General Counsel, Automotive Legal Affairs, Chrysler Corporation | | | 156 | | | Director, Digital Ally, Inc. (digital imaging); Director, Infinity, Inc. (oil and gas exploration and production); Director, OGE Energy Corp. (energy and energy services) | |
|
| Minor M. Shaw | | | | | | | | | |
|
225 Franklin Street
Mail Drop
BX32 05228
Boston, MA 02110
Age 64 | | Board member since 6/11 for RiverSource Funds and since 2003 for Nations Funds | | President—Micco LLC (private investments) | | | 149 | | | Former Trustee, BofA Funds Series Trust (11 funds); Board Member, Piedmont Natural Gas; Director, Blue Cross Blue Shield of South Carolina | |
|
| Alison Taunton-Rigby | | | | | | | | | |
|
901 S. Marquette Ave.
Minneapolis, MN 55402
Age 68 | | Board member since 11/02 for RiverSource Funds and since 6/11 for Nations Funds | | Chief Executive Officer and Director, RiboNovix, Inc. 2003-2010 (biotechnology); former President, Aquila Biopharmaceuticals | | | 156 | | | Director, Healthways, Inc. (health management programs); Director, ICI Mutual Insurance Company, RRG; Director, Abt Associates (government contractor) | |
|
35
Fund Governance (continued)
Interested Board Member Not Affiliated with Investment Manager*
| Name, Address, Age | | Position Held
with Funds
and Length
of Service | | Principal Occupation During Past Five Years | | Number of
Funds in the
Fund Family
Overseen by
Board Member | | Other Present or
Past Directorships/
Trusteeships
(Within Past 5 Years) | |
| Anthony M. Santomero* | | | | | | | | | |
|
225 Franklin Street
Mail Drop
BX32 05228
Boston, MA 02110
Age 65 | | Board member since 6/11 for RiverSource Funds and since 1/08 for Nations Funds | | Richard K. Mellon Professor Emeritus of Finance, The Wharton School, University of Pennsylvania, since 2002; Senior Advisor, McKinsey & Company (consulting), 2006-2008; President and Chief Executive Officer, Federal Reserve Bank of Philadelphia, 2000-2006 | | | 149 | | | Director, Renaissance Reinsurance Ltd.; Trustee, Penn Mutual Life Insurance Company; Director, Citigroup; Director, Citibank, N.A.; former Trustee, BofA Funds Series Trust (11 funds) | |
|
* Dr. Santomero is not an affiliated person of the Investment Manager or Ameriprise Financial. However, he is currently deemed by the funds to be an "interested person" (as defined in the 1940 Act) of the Funds because he serves as a Director of Citigroup, Inc. and Citibank N.A., companies that may directly or through subsidiaries and affiliates engage from time-to-time in brokerage execution, principal transactions and lending relationships with the funds or accounts advised/managed by the Investment Manager.
Interested Board Member Affiliated with Investment Manager*
| William F. Truscott | | | | | | | | | |
|
53600 Ameriprise Financial Center
Minneapolis, MN 55474
Age 51 | | Board member since 11/01 for RiverSource Funds and since 6/11 for Nations Funds; Senior Vice President since 2002 for RiverSource Funds and 5/10 for Nations Funds | | Chairman of the Board and President, Columbia Management Investment Advisers, LLC since May 2010 and February 2012, respectively (previously President, Chairman of the Board and Chief Investment Officer, 2001-April 2010); Chief Executive Officer, U.S. Asset Management & President, Annuities, Ameriprise Financial, Inc. since May 2010 (previously President—U.S. Asset Management and Chief Investment Officer, 2005-April 2010); Director, President and Chief Executive Officer, Ameriprise Certificate Company since 2006; Director and Chief Executive Officer, Columbia Management Investment Distributors, Inc. since May 2010 and February 2012, respectively (previously Chairman of the Board and Chief Executive Officer, 2006-April 2010); Chairman of the Board and Chief Executive Officer, RiverSource Distributors, Inc. since 2006. | | | 156 | | | Trustee, Columbia Funds Series Trust I and Columbia Funds Variable Insurance Trust | |
|
* Interested person (as defined under the 1940 Act) by reason of being an officer, director, security holder and/or employee of the Investment Manager or Ameriprise Financial.
The SAI has additional information about the Fund's Board members and is available, without charge, upon request by calling 800.345.6611; contacting your financial intermediary; or visiting columbiamanagement.com.
36
Fund Governance (continued)
Officers
| Name, Year of Birth and Address | | Principal Occupation(s) During the Past Five Years | |
| J. Kevin Connaughton (Born 1964) | |
|
225 Franklin Street
Boston, MA 02110
President (since 2009) | | Senior Vice President and General Manager—Mutual Fund Products, Columbia Management Investment Advisers, LLC since May 2010; President, Columbia Funds, since 2009, and RiverSource Funds, since May 2010 (previously Senior Vice President and Chief Financial Officer, Columbia Funds, from June 2008 to January 2009, Treasurer, Columbia Funds, from October 2003 to May 2008, and senior officer of various other affiliated funds since 2000); Managing Director, Columbia Management Advisors, LLC from December 2004 to April 2010. | |
|
| Michael G. Clarke (Born 1969) | |
|
225 Franklin Street
Boston, MA 02110
Treasurer (since 2011) and Chief Financial Officer (since 2009) | | Vice President, Columbia Management Investment Advisers, LLC since May 2010; Managing Director of Fund Administration, Columbia Management Advisors, LLC, from September 2004 to April 2010; senior officer of Columbia Funds and affiliated funds since 2002. | |
|
| Scott R. Plummer (Born 1959) | |
|
5228 Ameriprise Financial Center
Minneapolis, MN 55474
Senior Vice President and Chief Legal Officer (since 2010) | | Chief Legal Officer and Assistant Secretary, Columbia Management Investment Advisers, LLC since June 2005; Vice President and Lead Chief Counsel—Asset Management, Ameriprise Financial, Inc. since May 2010 (previously Vice President and Chief Counsel—Asset Management, from 2005 to April 2010, Vice President, Chief Counsel and Assistant Secretary, Columbia Management Investment Distributors, Inc. since 2008; Vice President, General Counsel and Secretary, Ameriprise Certificate Company since 2005; Chief Counsel, RiverSource Distributors, Inc. since 2006; Senior officer of Columbia Funds and affiliated funds, since 2006. | |
|
| Thomas P. McGuire (Born 1972) | |
|
225 Franklin Street
Boston, MA 02110
Chief Compliance Officer (since 2012) | | Vice President—Asset Management Compliance, Columbia Management Investment Advisers, LLC since March 2010; Chief Compliance Officer, Ameriprise Certificate Company, since September 2010; Compliance Executive, Bank of America, from June 2005 to April 2010. | |
|
| William F. Truscott (Born 1960) | |
|
53600 Ameriprise Financial Center
Minneapolis, MN 55474
Senior Vice President (since 2010) | | Chairman of the Board and President, Columbia Management Investment Advisers, LLC since May 2010 and February 2012, respectively (previously President, Chairman of the Board and Chief Investment Officer, from 2001 to April 2010); Chief Executive Officer, U.S. Asset Management & President, Annuities, Ameriprise Financial, Inc. since May 2010 (previously President—U.S. Asset Management and Chief Investment Officer from 2005 to April 2010; Director, President and Chief Executive Officer, Ameriprise Certificate Company since 2006; Director and Chief Executive Officer, Columbia Management Investment Distributors, Inc. since May 2010 and February 2012, respectively (previously Chairman of the Board and Chief Executive Officer from 2008 to April 2010); Chairman of the Board and Chief Executive Officer, RiverSource Distributors, Inc. since 2006. | |
|
| Paul D. Pearson (Born 1956) | |
|
10468 Ameriprise Financial Center
Minneapolis, MN 55474
Vice President and Assistant Treasurer
(since 2011) | | Vice President—Investment Accounting, Columbia Management Investment Advisers, LLC, since May 2010; Vice President—Managed Assets, Investment Accounting, Ameriprise Financial Corporation, 1998-2010 | |
|
37
Fund Governance (continued)
Officers (continued)
| Name, Year of Birth and Address | | Principal Occupation(s) During the Past Five Years | |
| Colin Moore (Born 1958) | |
|
225 Franklin Street
Boston, MA 02110
Senior Vice President (since 2010) | | Director and Chief Investment Officer, Columbia Management Investment Advisers, LLC since May 2010; Manager, Managing Director and Chief Investment Officer of Columbia Management Advisors, LLC from 2007 to April 2010; Head of Equities, Columbia Management Advisors, LLC from 2002 to 2007. | |
|
| Christopher O. Petersen (Born 1970) | |
|
5228 Ameriprise Financial Center
Minneapolis, MN 55474
Vice President and Secretary (since 2011) | | Vice President and Chief Counsel, Ameriprise Financial since January 2010 (formerly Vice President and Group Counsel or Counsel from April 2004 to January 2010); Senior officer of Columbia Funds and affiliated funds, since 2007. | |
|
| Amy K. Johnson (Born 1965) | |
|
5228 Ameriprise Financial Center
Minneapolis, MN 55474
Vice President (since 2010) | | Senior Vice President and Chief Operating Officer, Columbia Management Investment Advisers, LLC since May 2010 (previously Chief Administrative Officer, from 2009 until April 2010, Vice President—Asset Management and Trust Company Services, from 2006 to 2009, and Vice President—Operations and Compliance from 2004 to 2006). | |
|
| Joseph F. DiMaria (Born 1968) | |
|
225 Franklin Street
Boston, MA 02110
Vice President (since 2011) and Chief Accounting Officer (since 2008) | | Vice President, Mutual Fund Administration, Columbia Management Investment Advisers, LLC, since May 2010; Director of Fund Administration, Columbia Management Advisors, LLC from January 2006 to April 2010. | |
|
| Paul B. Goucher (Born 1968) | |
|
100 Park Avenue
New York, NY 10017
Vice President and Assistant Secretary (since 2010) | | Vice President and Chief Counsel of Ameriprise Financial since January 2010 (formerly Vice President and Group Counsel from November 2008 to January 2010); Director, Managing Director and General Counsel of J. & W. Seligman & Co. Incorporated (Seligman) from July 2008 to November 2008 and Managing Director and Associate General Counsel of Seligman from January 2005 to July 2008. | |
|
| Michael E. DeFao (Born 1968) | |
|
225 Franklin Street
Boston, MA 02110
Vice President and Assistant Treasurer (since 2011) | | Vice President and Chief Counsel, Ameriprise Financial since May 2010; Associate General Counsel, Bank of America from June 2005 to April 2010. | |
|
| Stephen T. Welsh (Born 1957) | |
|
225 Franklin Street
Boston, MA 02110
Vice President (since 2006) | | President and Director, Columbia Management Investment Services Corp. since May 2010; President and Director, Columbia Management Services, Inc. from July 2004 to April 2010; Managing Director, Columbia Management Distributors, Inc. from August 2007 to April 2010. | |
|
38
Approval of Investment Management Services Agreement
Columbia Management Investment Advisers, LLC ("Columbia Management" or the "investment manager"), a wholly-owned subsidiary of Ameriprise Financial, Inc. ("Ameriprise Financial"), serves as the investment manager to Columbia North Carolina Intermediate Municipal Bond Fund (the "Fund"). Under an investment management services agreement (the "IMS Agreement"), Columbia Management provides investment advice and other services to the Fund and all funds distributed by Columbia Management Investment Distributors, Inc. (collectively, the "Funds").
On an annual basis, the Fund's Board of Trustees (the "Board"), including the independent Board members (the "Independent Directors"), considers renewal of the IMS Agreement. Columbia Management prepared detailed reports for the Board and its Contracts Committee in March and April 2012, including reports based on analyses of data provided by an independent organization and a comprehensive response to each item of information requested by independent legal counsel to the Independent Directors ("Independent Legal Counsel") in a letter to the investment manager, to assist the Board in making this determination. All of the materials presented in March and April were first supplied in draft form to designated representatives of the Independent Directors, i.e., Independent Legal Counsel, the Chair and the Chair of the Contracts Committee (including materials relating to the Fund's expense cap), and the final materials were revised to reflect comments provided by these Board representatives. In addition, throughout the year, the Board (or its committees) regularly meets with portfolio management teams and senior management personnel, and reviews information prepared by Columbia Management addressing the services Columbia Management provides and Fund performance. The Board accords particular weight to the work, deliberations and conclusions of the Contracts Committee, the Investment Review Committee and the Compliance Committee in determining whether to continue the IMS Agreement.
The Board, at its April 10-12, 2012 in-person Board meeting (the "April Meeting"), considered the renewal of the IMS Agreement for an additional one-year term. At the April Meeting, Independent Legal Counsel reviewed with the Independent Directors various factors relevant to the Board's consideration of advisory agreements and the Board's legal responsibilities related to such consideration. Following an analysis and discussion of the factors identified below, the Board, including all of the Independent Directors, approved the renewal of the IMS Agreement.
Nature, Extent and Quality of Services Provided by Columbia Management: The Independent Directors analyzed various reports and presentations they had received detailing the services performed by Columbia Management, as well as its expertise, resources and capabilities. The Independent Directors specifically considered many developments during the past year concerning the services provided by Columbia Management, including, in particular, the continued investment in, and resources dedicated to, the Funds' operations and the successful completion of various integration initiatives and the consolidation of dozens of Funds. The Independent Directors noted the information they received concerning Columbia Management's ability to retain key portfolio management personnel. In that connection, the Independent Directors took into account their meetings with Columbia Management's Chief Investment Officer (the "CIO") and considered the CIO's successful execution of additional risk and portfolio management oversight applied to the Funds. The Independent Directors also assessed Columbia Management's significant investment in upgrading technology (such as an equity trading system) and considered management's commitments to enhance existing resources in this area.
In connection with the Board's evaluation of the overall package of services provided by Columbia Management, the Board also considered the quality of administrative services provided to the Fund by Columbia Management. In addition, the Board also reviewed the financial condition of Columbia Management (and its affiliates) and each entity's ability to carry out its responsibilities under the IMS Agreement and the Fund's other services agreements with Ameriprise affiliates. The Board also discussed the acceptability of the terms of the IMS Agreement (including the relatively broad scope of services required to be performed by Columbia Management). The Board concluded that the services being performed under the IMS Agreement were of a reasonably high quality.
39
Approval of Investment Management Services Agreement (continued)
Based on the foregoing, and based on other information received (both oral and written, including the information on investment performance referenced below) and other considerations, the Board concluded that Columbia Management and its affiliates were in a position to continue to provide a high quality and level of services to the Fund.
Investment Performance: For purposes of evaluating the nature, extent and quality of services provided under the IMS Agreement, the Board carefully reviewed the investment performance of the Fund. In this regard, the Board considered detailed reports providing the results of analyses performed by an independent organization showing, for various periods, the performance of the Fund, the performance of a benchmark index, the percentage ranking of the Fund among its comparison group and the net assets of the Fund. The Board observed that the Fund's investment performance met expectations.
Comparative Fees, Costs of Services Provided and the Profits Realized By Columbia Management and its Affiliates from their Relationships with the Fund: The Board reviewed comparative fees and the costs of services to be provided under the IMS Agreement. The Board members considered detailed comparative information set forth in an annual report on fees and expenses, including, among other things, data (based on analyses conducted by an independent organization) showing a comparison of the Fund's expenses with median expenses paid by funds in its comparative peer universe, as well as data showing the Fund's contribution to Columbia Management's profitability. The Board reviewed the fees charged to comparable institutional or other accounts/vehicles managed by Columbia Management and discussed differences in how the products are managed and operated, noting no unreasonable differences in the levels of contractual fees.
The Board accorded particular weight to the notion that the level of fees should reflect a rational pricing model applied consistently across the various product lines in the Fund family, while assuring that the overall fees for each Fund (with few defined exceptions) are generally in line with the "pricing philosophy" (i.e., that the total expense ratio of the Fund is at, or below, the median expense ratio of funds in the same comparison universe of the Fund). The Board took into account that the Fund's total expense ratio (after considering proposed expense caps/waivers) approximated the peer universe's median expense ratio. Based on its review, the Board concluded that the Fund's management fee was fair and reasonable in light of the extent and quality of services that the Fund receives.
The Board also considered the expected profitability of Columbia Management and its affiliates in connection with Columbia Management providing investment management services to the Fund. In this regard, the Board referred to a detailed profitability report, discussing the profitability to Columbia Management and Ameriprise Financial from managing, operating and distributing the Funds. In this regard, the Board observed that 2011 profitability, while slightly lower than 2010, was generally in line with the reported profitability of other asset management firms. The Board also considered the indirect economic benefits flowing to Columbia Management or its affiliates in connection with managing or distributing the Funds, such as the enhanced ability to offer various other financial products to Ameriprise Financial customers, soft dollar benefits and overall reputational advantages. The Board noted that the fees paid by the Fund should permit the investment manager to offer competitive compensation to its personnel, make necessary investments in its business and earn an appropriate profit. The Board concluded that profitability levels were reasonable.
Economies of Scale to be Realized: The Board also considered the economies of scale that might be realized by Columbia Management as the Fund grows and took note of the extent to which Fund shareholders might also benefit from such growth.
Based on the foregoing, the Board, including all of the Independent Directors, concluded that the investment management service fees were fair and reasonable in light of the extent and quality of services provided. In reaching this conclusion, no single factor was determinative. On April 12, 2012, the Board, including all of the Independent Directors, approved the renewal of the IMS Agreement.
40
Important Information About This Report
The fund mails one shareholder report to each shareholder address. If you would like more than one report, please call shareholder services at 1-800-345-6611 and additional reports will be sent to you. This report has been prepared for shareholders of Columbia North Carolina Intermediate Municipal Bond Fund.
A description of the policies and procedures that the fund uses to determine how to vote proxies and a copy of the fund's voting records are available (i) at www.columbiamanagement.com, (ii) on the Securities and Exchange Commission's website at www.sec.gov, and (iii) without charge, upon request, by calling 1-800-368-0346. Information regarding how the fund voted proxies relating to portfolio securities during the 12-month period ended June 30 is available from the SEC's website. Information regarding how the fund voted proxies relating to portfolio securities is also available from the fund's website, www.columbiamanagement.com.
The fund files a complete schedule of portfolio holdings with the SEC for the first and third quarters of each fiscal year on Form N-Q. The fund's Form N-Q is available on the SEC's website at www.sec.gov and may be reviewed and copied at the SEC's Public Reference Room in Washington, D.C. Information on the operation of the Public Reference Room may be obtained by calling 1-800-SEC-0330.
Transfer Agent
Columbia Management Investment
Services Corp.
P.O. Box 8081
Boston, MA 02266-8081
1-800-345-6611
Distributor
Columbia Management Investment
Distributors, Inc.
225 Franklin Street
Boston, MA 02110
Investment Manager
Columbia Management Investment Advisers, LLC
225 Franklin Street
Boston, MA 02110
41

Columbia North Carolina Intermediate Municipal Bond Fund
P. O. Box 8081
Boston, MA 02266-8081
columbiamanagement.com
This information is for use with concurrent or prior delivery of a fund prospectus. Investors should consider the investment objectives, risks, charges and expenses of a mutual fund carefully before investing. For a free prospectus, which contains this and other important information about the funds, visit columbiamanagement.com. Read the prospectus carefully before investing. The Fund is distributed by Columbia Management Investment Distributors, Inc., member FINRA, and managed by Columbia Management Investment Advisers, LLC.
© 2012 Columbia Management Investment Advisers, LLC. All rights reserved.
C-1096 C (5/12)

Columbia Short Term Municipal Bond Fund
Annual Report for the Period Ended April 30, 2012
Not FDIC insured • No bank guarantee • May lose value
Table of Contents
| Fund Profile | | | 1 | | |
|
| Performance Information | | | 2 | | |
|
| Understanding Your Expenses | | | 3 | | |
|
| Portfolio Managers' Report | | | 4 | | |
|
| Portfolio of Investments | | | 6 | | |
|
Statement of Assets and
Liabilities | | | 23 | | |
|
| Statement of Operations | | | 25 | | |
|
Statement of Changes in
Net Assets | | | 26 | | |
|
| Financial Highlights | | | 28 | | |
|
| Notes to Financial Statements | | | 32 | | |
|
Report of Independent Registered
Public Accounting Firm | | | 40 | | |
|
| Federal Income Tax Information | | | 41 | | |
|
| Fund Governance | | | 42 | | |
|
Approval of Investment
Management Services Agreement | | | 49 | | |
|
Important Information About
This Report | | | 53 | | |
|
The views expressed in this report reflect the current views of the respective parties. These views are not guarantees of future performance and involve certain risks, uncertainties and assumptions that are difficult to predict, so actual outcomes and results may differ significantly from the views expressed. These views are subject to change at any time based upon economic, market or other conditions and the respective parties disclaim any responsibility to update such views. These views may not be relied on as investment advice and, because investment decisions for a Columbia Fund are based on numerous factors, may not be relied on as an indication of trading intent on behalf of any particular Columbia Fund. References to specific securities should not be construed as a recommendation or investment advice.
President's Message

Dear Shareholders,
A stock market rally that commenced in the fourth quarter of 2011 continued into 2012 in the United States and around the world, as all major market regions generated double-digit returns for the three-month period ended March 31, 2012. Volatility declined sharply as European debt fears quieted somewhat and sentiment improved. Returns in developed countries were buoyed by strong results in Germany, Belgium, Austria and the Nordic markets of Denmark, Finland, Norway and Sweden. Under the cloud of its own mounting debt problem, Spain was the only eurozone country to deliver a negative return during the three-month period. Solid economic growth and accommodative monetary policy helped boost gains in emerging markets. The rally in U.S. equities was largely driven by an expansion in "multiples"—an increase in stock prices relative to their earnings. By the end of the first quarter of 2012, stocks no longer appeared as cheap as they were late in 2011. Bonds lagged stocks during the first quarter as investors responded to signs of an improved environment with a greater appetite for risk.
Concerns around the health of the global economy were centered in news headlines focusing on Washington D.C., Europe, China and the Middle East. In the United States, economic indicators remained mixed but generally indicated support for slow, sustainable economic growth. European policymakers have made progress in containing the eurozone debt crisis, though they still have not solved the issue of long-term solvency. The European Central Bank has lowered interest rates and flooded the financial system with liquidity that may provide breathing space for companies to restructure their balance sheets. These massive infusions of liquidity may whet the appetite for risk from investors around the world. However, it has delayed a true reckoning with the European financial situation, as concerns about Spain and Portugal continue to cloud the outlook. These structural challenges that persist in the developed world, and slowing growth in emerging market economies, leave the global economy in a fragile state. Domestic demand, combined with slowing inflationary trends, has also helped to shore up emerging market economies. Joblessness remains low and monetary conditions remain easy.
Despite the challenges and surprises of 2011, we see pockets of strength—and as a result, attractive opportunities—both here and abroad for 2012. We hope to help you capitalize on these opportunities with various articles in our 2012 Perspectives, which is available via the Market Insights tab at columbiamanagement.com. This publication showcases the strong research capabilities and experienced investment teams of Columbia Management and offers a diverse array of investment ideas based on our five key themes for 2012.
Other information and resources available at columbiamanagement.com include:
g detailed up-to-date fund performance and portfolio information
g economic analysis and market commentary
g quarterly fund commentaries
g Columbia Management Investor, our award-winning quarterly newsletter for shareholders
Thank you for your continued support of the Columbia Funds. We look forward to serving your investment needs for many years to come.
Best Regards,

J. Kevin Connaughton
President, Columbia Funds
Investors should consider the investment objectives, risks, charges and expenses of a mutual fund carefully before investing. For a free prospectus, which contains this and other important information about the funds, visit columbiamanagement.com. The prospectus should be read carefully before investing.
Columbia Funds are distributed by Columbia Management Investment Distributors, Inc., member FINRA, and managed by Columbia Management Investment Advisers, LLC.
© 2012 Columbia Management Investment Advisers, LLC. All rights reserved.
Fund Profile – Columbia Short Term Municipal Bond Fund
Summary
g For the 13-month period that ended April 30, 2012, the fund's Class A shares returned 2.31% without sales charge.
g The fund's benchmark, the Barclays 1-3 Year Municipal Bond Index1, returned 2.17%.
g The fund had more exposure than the index to bonds with longer maturities and to A rated2 securities, which accounted for the slight performance edge.
Portfolio Management
Brian M. McGreevy has managed or co-managed the fund since June 2011. From 1994 until joining Columbia Management Investment Advisers, LLC (the Investment Manager) in May 2010, Mr. McGreevy was associated with the fund's previous investment adviser as an investment professional.
Paul F. Fuchs has co-managed the fund since January 2012. From 1999 until joining the Investment Manager in May 2010, Mr. Fuchs was associated with the fund's previous investment adviser as an investment professional.
1The Barclays 1-3 Year Municipal Bond Index consists of a broad selection of investment grade general obligation and revenue bonds of maturities ranging from one to three years.
Indices are not available for investment, are not professionally managed and do not reflect sales charges, fees, brokerage commissions, taxes or other expenses of investing. Securities in the fund may not match those in an index.
2The credit quality ratings represent those of Moody's Investors Service, Inc. ("Moody's"), Standard & Poor's Corporation ("S&P") or Fitch Ratings ("Fitch") credit ratings. The ratings represent their opinions as to the quality of the securities they rate. Ratings are relative and subjective and are not absolute standards of quality. The security's credit quality does not eliminate risk.
Performance data quoted represents past performance and current performance may be lower or higher. Past performance is no guarantee of future results. The investment return and principal value will fluctuate so that shares, when redeemed, may be worth more or less than the original cost. Please visit www.columbiamanagement.com for daily and most recent month-end performance updates.
Summary
13-month (cumulative) return as of 04/30/2012
| | | | | +2.31% | | |
|
|  | | | Class A shares
(without sales charge) | |
|
| | | | | +2.17% | | |
|
|  | | | Barclays 1-3 Year Municipal Bond Index | |
|
1
Performance Information – Columbia Short Term Municipal Bond Fund
Performance data quoted represents past performance and current performance may be lower or higher. Past performance is no guarantee of future results. The investment return and principal value will fluctuate so that shares, when redeemed, may be worth more or less than the original cost. Please visit www.columbiamanagement.com for daily and most recent month-end performance updates.
Performance of a $10,000 investment 05/01/02 – 04/30/12
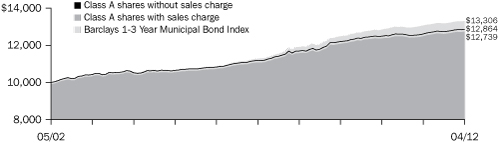
The chart above shows the change in value of a hypothetical $10,000 investment in Class A shares of Columbia Short Term Municipal Bond Fund during the stated time period, and does not reflect the deduction of taxes that a shareholder may pay on fund distributions or on the redemption of fund shares.
Performance of a $10,000 investment 05/01/02 – 04/30/12 ($)
| Sales charge: | | without | | with | |
| Class A | | | 12,864 | | | | 12,739 | | |
| Class B | | | 11,937 | | | | n/a | | |
| Class C | | | 11,935 | | | | 11,935 | | |
| Class Z | | | 13,189 | | | | n/a | | |
Average annual total return as of 04/30/12 (%)
| Share class | | A | | B | | C | | Z | |
| Inception | | 11/02/93 | | 10/12/93 | | 05/19/94 | | 10/07/93 | |
| Sales charge | | without | | with | | without | | without | | with | | without | |
1-month
(cumulative) | | | 0.19 | | | | –0.85 | | | | 0.12 | | | | 0.12 | | | | –0.88 | | | | 0.21 | | |
| 1-year | | | 1.97 | | | | 0.91 | | | | 1.21 | | | | 1.12 | | | | 0.21 | | | | 2.22 | | |
| 5-year | | | 2.83 | | | | 2.63 | | | | 2.07 | | | | 2.07 | | | | 2.07 | | | | 3.09 | | |
| 10-year | | | 2.55 | | | | 2.45 | | | | 1.79 | | | | 1.78 | | | | 1.78 | | | | 2.81 | | |
The "with sales charge" returns include the maximum initial sales charge of 1.00% for Class A shares and the applicable contingent deferred sales charge of 1.00% for Class C shares in the first year after purchase. The "without sales charge" returns do not include the effect of sales charges. If they had, returns would be lower.
Performance results reflect any fee waivers or reimbursements of fund expenses by Columbia Management Investment Advisers, LLC and/or any of its affiliates. Absent these fee waivers or expense reimbursement arrangements, performance results would have been lower.
All results shown assume the reinvestment of distributions. Class Z shares are sold at net asset value with no distribution and service (Rule 12b-1) fees. Class Z shares have limited eligibility and the investment minimum requirements may vary. Please see the fund's prospectuses for details. Performance for different share classes will vary based on differences in sales charges and fees associated with each class.
The tables do not reflect the deduction of taxes that a shareholder may pay on fund distributions or on the redemption of fund shares.
2
Understanding Your Expenses – Columbia Short Term Municipal Bond Fund
As an investor, you incur two types of costs. There are transaction costs, which generally include sales charges on purchases and may include redemption fees. There are also ongoing costs, which generally include management fees, distribution and service (Rule 12b-1) fees, and other fund expenses. The following information is intended to help you understand your ongoing costs (in dollars) of investing in the Fund and to help you compare these costs with the ongoing costs of investing in other mutual funds.
Analyzing your fund's expenses
To illustrate these ongoing costs, we have provided examples and calculated the expenses paid by investors in each share class of the Fund during the period. The actual and hypothetical information in the table is based on an initial investment of $1,000 at the beginning of the period indicated and held for the entire period. Expense information is calculated two ways and each method provides you with different information. The amount listed in the "Actual" column is calculated using the Fund's actual operating expenses and total return for the period. You may use the Actual information, together with the amount invested, to estimate the expenses that you paid over the period. Simply divide your account value by $1,000 (for example, an $8,600 account value divided by $1,000 = 8.6), then multiply the results by the expenses paid during the period under the Actual column. The amount listed in the "Hypothetical" column assumes a 5% annual rate of return before expenses (which is not the Fund's actual return) and then applies the Fund's actual expense ratio for the period to the hypothetical return. You should not use the hypothetical account values and expenses to estimate either your actual account balance at the end of the period or the expenses you paid during the period. See "Compare with other funds" below for details on how to use the hypothetical data.
Compare with other funds
Since all mutual funds are required to include the same hypothetical calculations about expenses in shareholder reports, you can use this information to compare the ongoing cost of investing in the Fund with other funds. To do so, compare the hypothetical example with the 5% hypothetical examples that appear in the shareholder reports of other funds. As you compare hypothetical examples of other funds, it is important to note that hypothetical examples are meant to highlight the ongoing costs of investing in a fund only and do not reflect any transaction costs, such as sales charges, or redemption or exchange fees. Therefore, the hypothetical calculations are useful in comparing ongoing costs only, and will not help you determine the relative total costs of owning different funds. If transaction costs were included in these calculations, your costs would be higher.
November 1, 2011 – April 30, 2012
| | | Account value at the
beginning of the period ($) | | Account value at the
end of the period ($) | | Expenses paid
during the period ($) | | Fund's annualized
expense ratio (%) | |
| | | Actual | | Hypothetical | | Actual | | Hypothetical | | Actual | | Hypothetical | | Actual | |
| Class A | | | 1,000.00 | | | | 1,000.00 | | | | 1,010.00 | | | | 1,021.28 | | | | 3.60 | | | | 3.62 | | | | 0.72 | | |
| Class B | | | 1,000.00 | | | | 1,000.00 | | | | 1,006.20 | | | | 1,017.55 | | | | 7.33 | | | | 7.37 | | | | 1.47 | | |
| Class C | | | 1,000.00 | | | | 1,000.00 | | | | 1,005.30 | | | | 1,017.55 | | | | 7.33 | | | | 7.37 | | | | 1.47 | | |
| Class Z | | | 1,000.00 | | | | 1,000.00 | | | | 1,011.20 | | | | 1,022.53 | | | | 2.35 | | | | 2.36 | | | | 0.47 | | |
Expenses paid during the period are equal to the annualized expense ratio for each class as indicated above, multiplied by the average account value over the period and then multiplied by the number of days in the Fund's most recent six months and divided by 366.
Expenses do not include fees and expenses incurred indirectly by the Fund from the underlying funds in which the Fund may invest (also referred to as "acquired funds"), including affiliated and non-affiliated pooled investments vehicles (including mutual funds and exchange traded funds).
Had Columbia Management Investment Advisers, LLC and/or certain of its affiliates not waived/reimbursed certain fees and expenses, account value at the end of the period would have been reduced.
3
Portfolio Manager's Report – Columbia Short Term Municipal Bond Fund
Performance data quoted represents past performance and current performance may be lower or higher. Past performance is no guarantee of future results. The investment return and principal value will fluctuate so that shares, when redeemed, may be worth more or less than the original cost. Please visit www.columbiamanagement.com for daily and most recent month-end performance updates.
30-day SEC yields
as of 4/30/12 (%)
| Class A | | | 0.41 | | |
| Class B | | | (0.33 | ) | |
| Class C | | | (0.33 | ) | |
| Class Z | | | 0.66 | | |
The 30-day SEC yields reflect the fund's earning power, net of expenses, expressed as an annualized percentage of the public offering price per share at the end of the period. Had the Investment Manager and/or any of its affiliates not waived fees or reimbursed a portion of expenses, the 30-day SEC yields would have been lower.
Taxable Equivalent SEC yields
as of 4/30/12 (%)
| Class A | | | 0.63 | | |
| Class B | | | (0.51 | ) | |
| Class C | | | (0.51 | ) | |
| Class Z | | | 1.02 | | |
Taxable-equivalent SEC yields are calculated assuming a federal tax rate of 35.0%. This tax rate does not reflect the phase out of exemptions or the reduction of the otherwise allowable deductions that occur when adjusted gross income exceeds certain levels. Your taxable-equivalent yield may be different depending on your tax bracket.
The Board of Trustees for Columbia Short Term Municipal Bond Fund has approved the change of the fund's fiscal year end from March 31 to April 30. As a result, this report covers the 13-month period since the last annual report. The next report you receive will be for the six-month period from May 1, 2012 through October 31, 2012.
For the 13-month period that ended April 30, 2012, the fund's Class A shares returned 2.31% without sales charge. The fund's benchmark, the Barclays 1-3 Year Municipal Bond Index, returned 2.17%. The fund benefited from having more exposure than the index to bonds with slightly longer maturities and a larger allocation to A rated securities. Together, these factors produced additional yield for the fund.
In June 2011, the portfolio management team changed. Brian M. McGreevy took over management of the fund. Paul Fuchs was added as co-manager on January 1, 2012.
An improving economic environment
Early in the 13-month period, Europe's debt problems and wrangling in Washington over the federal budget and the national debt dominated world headlines. U.S. economic news was lackluster, housing continued to be a nagging weak spot and job growth was disappointing. However, the pace of both economic and job growth picked up as the period wore on. Consumer confidence improved as the labor market added approximately 1.2 million new jobs between November 2011 and April 2012, while the jobless rate fell to 8.1%. Household net worth also picked up as the equity markets rebounded. Headline inflation rose 2.7%, driven primarily by rising food and energy prices. Despite a modest slowdown late in the summer of 2011, manufacturing activity continued to expand throughout the period.
Municipal market generates strong returns
Against this backdrop, the U.S. municipal bond market generated strong returns, despite a host of investor concerns at the outset of the period: 1) Net outflows from municipal mutual funds. 2) The expectation that heavy new issue volume would weigh on the market, which turned out to be unfounded. Issuance dropped off almost across the board. 3) Fears of massive defaults, which were stoked by the media and were generally overblown. With these concerns in mind, 10-year municipal yields reached a high of 3.5% before the European debt crisis sent investors scurrying for the safety of the Treasury market, pushing Treasury yields down. Municipal yields followed. (Bond yields and prices move in opposite directions.)
By the summer of 2011, investors seemed to believe that default expectations were excessive and demand for municipal bonds picked up. With yields close to historical lows, buyers moved down the credit curve—to A and BBB rated bonds—to garner additional income. Over the course of the 13-month period, these credits performed the best, as yields fell and the yield spread between higher and lower quality bonds tightened in response to demand. Yet, there were more downgrades than upgrades in the overall municipal market as a lackluster economy continued to pressure issuers.
4
Portfolio Manager's Report (continued) – Columbia Short Term Municipal Bond Fund
Maturity positioning, quality figured into fund returns
The fund was "barbelled" relative to the index: it had more holdings than the index positioned in both the zero to one-year and three- to five-year range of the yield curve (a graphic depiction of yields at various maturities, from short to long) and that portion of the portfolio that was longer than the index produced the best returns. The fund's overweight in A rated securities also benefited results as lower-rated securities outperformed for the period. Industrial development, public power, transportation and education were the top-performing sectors for the period, and the fund was overweight in all four relative to the index. These holdings also had slightly longer maturities compared to index holdings in the same sectors, which also made a contribution to excess returns.
By contrast, holdings with maturities shorter than one year were poor performers. With very low short-term interest rates, these holdings contributed little to the portfolio's overall return. However, they provided valuable liquidity to the portfolio and helped reduce overall volatility.
Looking ahead
With the Federal Reserve Board expressing its intention to hold short-term interest rates at their current lows through 2014, we believe that the short end of the municipal market should be relatively stable in 2012. The new issue market has recently picked-up and is offering more opportunities to invest. Currently, the municipal yield curve is steep and is compensating investors to invest further out on the curve. The portfolio continues to have a barbelled maturity profile versus its index to provide competitive yield and limited volatility. We will continue to select opportunities by utilizing our management, credit research and trading staff. Going forward, we will continue to focus investments in the three- to five-year maturity range where we see value, sound credit fundamentals and the potential for additional income.
Portfolio characteristics and holdings are subject to change periodically and may not be representative of current characteristics and holdings. The outlook for the fund may differ from that presented for other Columbia Funds.
Tax-exempt investing offers current tax-exempt income, but it also involves certain risks. The value of the fund will be affected by interest rate changes and the creditworthiness of issues held in the fund. When interest rates go up, bond prices generally drop and vice versa.
Interest income from certain tax-exempt bonds may be subject to certain state and local taxes and, if applicable, the alternative minimum tax. Capital gains are not exempt from income taxes.
Quality breakdown1
as of 04/30/12 (%)
| AAA rating | | | 53.5 | | |
| A rating | | | 40.0 | | |
| BBB rating | | | 5.2 | | |
| Not rated | | | 1.3 | | |
1Percentages indicated are based upon total fixed income securities (excluding Investments of Cash Collateral Received for Securities on Loan and money market funds).
Bond ratings apply to the underlying holdings of the Fund and not the Fund itself and are divided into categories ranging from AAA (highest) to D (lowest), and are subject to change. The ratings shown are determined by using the middle rating of Moody's, S&P, and Fitch after dropping the highest and lowest available ratings. When a rating from only two agencies is available, the lower rating is used. When a rating from only one agency is available, that rating is used. When a bond is not rated by one of these agencies, it is designated as Not rated. Credit ratings are subjective to opinions and not statements of fact.
5
Portfolio of Investments – Columbia Short Term Municipal Bond Fund
April 30, 2012
(Percentages represent value of investments compared to net assets)
Issue
Description | | Coupon
Rate | | Principal
Amount | | Value | |
| Municipal Bonds 85.6% | |
| Alabama 1.8% | |
Alabama 21st Century Authority
Revenue Bonds
Series 2012A | |
| 06/01/18 | | | 5.000 | % | | $ | 1,250,000 | | | $ | 1,466,363 | | |
Alabama Public School & College Authority
Refunding Revenue Bonds
Pool
Series 2012A | |
| 03/01/17 | | | 5.000 | % | | | 4,560,000 | | | | 5,401,411 | | |
| 03/01/18 | | | 5.000 | % | | | 7,510,000 | | | | 9,063,894 | | |
| Series 2009A | |
| 05/01/14 | | | 5.000 | % | | | 9,000,000 | | | | 9,816,840 | | |
Auburn University
Revenue Bonds
Series 2012A | |
| 06/01/16 | | | 5.000 | % | | | 3,000,000 | | | | 3,495,900 | | |
Chatom Industrial Development Board
Refunding Revenue Bonds
Powersouth Energy
Series 2010B | |
| 08/01/12 | | | 4.000 | % | | | 5,895,000 | | | | 5,941,806 | | |
Mobile Industrial Development Board
Revenue Bonds
Alabama Power Company
Series 2007 | |
| 06/01/34 | | | 1.650 | % | | | 5,000,000 | | | | 4,996,700 | | |
| Total | | | | | | | | | | | 40,182,914 | | |
| Alaska 0.9% | |
Alaska Industrial Development &
Export Authority
Refunding Revenue Bonds
Revolving Fund
Series 2010A | |
| 04/01/16 | | | 5.000 | % | | | 2,500,000 | | | | 2,850,275 | | |
Borough of North Slope
Unlimited General Obligation Bonds
Series 2010A | |
| 06/30/12 | | | 3.000 | % | | | 2,500,000 | | | | 2,511,650 | | |
State of Alaska
Unlimited General Obligation Bonds
Series 2003A (AGM) | |
| 08/01/14 | | | 5.000 | % | | | 14,000,000 | | | | 14,828,100 | | |
| Total | | | | | | | | | | | 20,190,025 | | |
| Arizona 1.5% | |
Arizona School Facilities Board
Certificate of Participation
Series 2005A-1 (FGIC/NPFGC) | |
| 09/01/14 | | | 5.000 | % | | | 10,000,000 | | | | 10,814,700 | | |
| Series 2008 | |
| 09/01/13 | | | 5.500 | % | | | 8,000,000 | | | | 8,485,360 | | |
County of Pima
Refunding Revenue Bonds
Sewer System
Series 2011A | |
| 07/01/12 | | | 5.000 | % | | | 1,000,000 | | | | 1,008,150 | | |
| 07/01/13 | | | 5.000 | % | | | 1,250,000 | | | | 1,314,288 | | |
Issue
Description | | Coupon
Rate | | Principal
Amount | | Value | |
| Municipal Bonds (continued) | |
| Arizona (cont.) | |
Phoenix Civic Improvement Corp.
Revenue Bonds
Senior Lien
Series 2002B (NPFGC/FGIC) AMT(a) | |
| 07/01/17 | | | 5.750 | % | | $ | 6,000,000 | | | $ | 6,038,880 | | |
State of Arizona
Certificate of Participation
Department Administration
Series 2010A (AGM) | |
| 10/01/15 | | | 5.000 | % | | | 5,000,000 | | | | 5,618,850 | | |
| Total | | | | | | | | | | | 33,280,228 | | |
| California 11.7% | |
California Health Facilities
Financing Authority
Refunding Revenue Bonds
St. Joseph Health System
Series 2009C | |
| 07/01/34 | | | 5.000 | % | | | 12,000,000 | | | | 13,058,160 | | |
Revenue Bonds
Catholic Healthcare West
Series 2009C | |
| 07/01/37 | | | 5.000 | % | | | 15,250,000 | | | | 15,367,272 | | |
| Series 2009G | |
| 07/01/28 | | | 5.000 | % | | | 3,000,000 | | | | 3,023,070 | | |
California Infrastructure &
Economic Development Bank
Revenue Bonds
California Independent
System Operator
Series 2008A | |
| 02/01/13 | | | 5.000 | % | | | 11,000,000 | | | | 11,381,810 | | |
California Pollution Control
Financing Authority
Refunding Revenue Bonds
BP West Coast Products LLC
Series 2009 | |
| 12/01/46 | | | 2.600 | % | | | 5,000,000 | | | | 5,206,800 | | |
South Dakota Gas and Electric
Series 1996A (NPFGC) | |
| 06/01/14 | | | 5.900 | % | | | 4,500,000 | | | | 4,972,905 | | |
California State Department of
Water Resources
Prerefunded 05/01/12
Revenue Bonds
Series 2002A | |
| 05/01/14 | | | 6.000 | % | | | 8,250,000 | | | | 8,333,820 | | |
| Series 2002A (AMBAC) | |
| 05/01/14 | | | 5.500 | % | | | 7,035,000 | | | | 7,106,405 | | |
Revenue Bonds
Series 2002A (AGM) | |
| 05/01/12 | | | 5.250 | % | | | 4,200,000 | | | | 4,200,587 | | |
California State Public Works Board
Revenue Bonds
Various Capital Projects
Series 2011A | |
| 10/01/16 | | | 4.000 | % | | | 2,000,000 | | | | 2,196,820 | | |
The Accompanying Notes to Financial Statements are an integral part of this statement.
6
Columbia Short Term Municipal Bond Fund
April 30, 2012
(Percentages represent value of investments compared to net assets)
Issue
Description | | Coupon
Rate | | Principal
Amount | | Value | |
| Municipal Bonds (continued) | |
| California (cont.) | |
| Subordinated Series 2010A-1 | |
| 03/01/15 | | | 5.000 | % | | $ | 3,000,000 | | | $ | 3,313,440 | | |
| 03/01/16 | | | 5.000 | % | | | 1,325,000 | | | | 1,492,679 | | |
California Statewide Communities
Development Authority
Revenue Bonds
Kaiser Permanente
Series 2009A | |
| 04/01/13 | | | 5.000 | % | | | 10,250,000 | | | | 10,673,018 | | |
Proposition 1A Receivables Program
Series 2009 | |
| 06/15/13 | | | 5.000 | % | | | 20,945,000 | | | | 22,008,168 | | |
California Statewide Communities
Development Authority(a)
Revenue Bonds
Disposal-Republic Services, Inc.
Series 2003A AMT | |
| 12/01/12 | | | 4.950 | % | | | 3,000,000 | | | | 3,072,300 | | |
City of Los Angeles Department of Airports
Refunding Revenue Bonds
Ontario International
Series 2006A (NPFGC) AMT(a) | |
| 05/15/14 | | | 4.750 | % | | | 3,410,000 | | | | 3,648,120 | | |
City of Los Angeles Wastewater System
Refunding Revenue Bonds
Series 2009A | |
| 06/01/12 | | | 5.000 | % | | | 6,040,000 | | | | 6,066,014 | | |
County of Sacramento
Revenue Bonds
GNMA Mortgage
Series 1998A Escrowed to Maturity AMT(a) | |
| 07/01/16 | | | 8.000 | % | | | 12,810,000 | | | | 16,234,113 | | |
Gilroy Unified School District
Unlimited General Obligation Bonds
BAN Series 2010 Escrowed to Maturity | |
| 04/01/13 | | | 5.000 | % | | | 730,000 | | | | 761,894 | | |
Unrefunded Unlimited General
Obligation Bonds
BAN Series 2010 | |
| 04/01/13 | | | 5.000 | % | | | 8,185,000 | | | | 8,530,980 | | |
Golden State Tobacco Securitization Corp.
Prerefunded 06/01/13 Revenue Bonds
Series 2003A-1 | |
| 06/01/39 | | | 6.750 | % | | | 4,250,000 | | | | 4,544,228 | | |
Long Beach Community College District
Unlimited General Obligation Bonds
BAN Series 2010A | |
| 01/15/13 | | | 9.850 | % | | | 13,875,000 | | | | 14,794,496 | | |
M-S-R Public Power Agency
Revenue Bonds
Subordinated Lien
Series 2011O | |
| 07/01/12 | | | 2.500 | % | | | 1,250,000 | | | | 1,254,375 | | |
| 07/01/14 | | | 4.000 | % | | | 2,300,000 | | | | 2,441,289 | | |
Issue
Description | | Coupon
Rate | | Principal
Amount | | Value | |
| Municipal Bonds (continued) | |
| California (cont.) | |
Northern California Power Agency
Revenue Bonds
Series 2010A | |
| 07/01/15 | | | 4.000 | % | | $ | 1,355,000 | | | $ | 1,473,725 | | |
Port of Oakland
Refunding Revenue Bonds
Intermediate Lien
Series 2007A (NPFGC) AMT(a) | |
| 11/01/13 | | | 5.000 | % | | | 5,610,000 | | | | 5,891,959 | | |
State of California
Prerefunded 07/01/14 Unlimited
General Obligation Bonds
Series 2004A | |
| 07/01/15 | | | 5.000 | % | | | 1,170,000 | | | | 1,289,352 | | |
Unlimited General Obligation Bonds
Series 2010 | |
| 11/01/13 | | | 4.000 | % | | | 1,650,000 | | | | 1,738,803 | | |
| 11/01/14 | | | 4.000 | % | | | 1,250,000 | | | | 1,353,238 | | |
Unlimited General Obligation Bonds
Various Purpose
Series 2005 | |
| 03/01/15 | | | 5.000 | % | | | 4,000,000 | | | | 4,464,280 | | |
| Series 2006 | |
| 03/01/14 | | | 5.000 | % | | | 4,000,000 | | | | 4,326,000 | | |
| Series 2011 | |
| 10/01/16 | | | 5.000 | % | | | 20,000,000 | | | | 23,256,800 | | |
Unlimited General Obligation
Refunding Bonds
Series 2004 | |
| 12/01/15 | | | 5.000 | % | | | 2,200,000 | | | | 2,379,586 | | |
| Series 2009B | |
| 07/01/23 | | | 5.000 | % | | | 19,250,000 | | | | 21,050,837 | | |
| Series 2012 | |
| 02/01/15 | | | 5.000 | % | | | 10,000,000 | | | | 11,133,600 | | |
Unrefunded Unlimited General
Obligation Bonds
Series 2004A | |
| 07/01/15 | | | 5.000 | % | | | 1,690,000 | | | | 1,841,948 | | |
Tobacco Securitization Authority of
Southern California
Prerefunded 06/01/12 Asset-Backed
Revenue Bonds
Senior Series 2002A | |
| 06/01/43 | | | 5.625 | % | | | 6,270,000 | | | | 6,298,967 | | |
| Total | | | | | | | | | | | 260,181,858 | | |
| Colorado 1.5% | |
City & County of Denver Airport System(a)
Revenue Bonds
Series 2011A AMT | |
| 11/15/15 | | | 5.000 | % | | | 1,500,000 | | | | 1,681,080 | | |
| Series 2011B AMT | |
| 11/15/15 | | | 5.000 | % | | | 8,000,000 | | | | 8,965,760 | | |
City of Colorado Springs Utilities System
Refunding Revenue Bonds
Series 2011A | |
| 11/15/14 | | | 4.000 | % | | | 5,380,000 | | | | 5,854,946 | | |
The Accompanying Notes to Financial Statements are an integral part of this statement.
7
Columbia Short Term Municipal Bond Fund
April 30, 2012
(Percentages represent value of investments compared to net assets)
Issue
Description | | Coupon
Rate | | Principal
Amount | | Value | |
| Municipal Bonds (continued) | |
| Colorado (cont.) | |
Colorado Health Facilities Authority
Revenue Bonds
Catholic Health Initiatives
Series 2009B | |
| 07/01/39 | | | 5.000 | % | | $ | 3,000,000 | | | $ | 3,073,800 | | |
Unrefunded Revenue Bonds
Catholic Health Initiatives
Series 2008D2 | |
| 10/01/38 | | | 5.250 | % | | | 2,185,000 | | | | 2,343,129 | | |
Colorado Health Facilities Authority(b)
Prerefunded 11/12/13
Revenue Bonds
Catholic Health Initiatives
Series 2008D2 | |
| 10/01/38 | | | 5.250 | % | | | 315,000 | | | | 338,587 | | |
Denver Wastewater Management
Division Department of Public Works
Revenue Bonds
Series 2012 | |
| 11/01/14 | | | 5.000 | % | | | 2,440,000 | | | | 2,716,184 | | |
E-470 Public Highway Authority
Revenue Bonds
Senior Capital Appreciation
Series 1997B (NPFGC)(c) | |
| 09/01/16 | | | 0.000 | % | | | 4,460,000 | | | | 3,986,883 | | |
Regional Transportation District
Certificate of Participation
Series 2010A | |
| 06/01/15 | | | 5.000 | % | | | 1,420,000 | | | | 1,576,086 | | |
| 06/01/16 | | | 5.000 | % | | | 2,010,000 | | | | 2,277,712 | | |
| Total | | | | | | | | | | | 32,814,167 | | |
| Connecticut 1.4% | |
Connecticut State Development Authority
Refunding Revenue Bonds
Connecticut Light & Power Co.
Series 2011 | |
| 09/01/28 | | | 1.250 | % | | | 6,000,000 | | | | 6,040,500 | | |
Connecticut State Development Authority(a)
Revenue Bonds
Connecticut Light & Power
Series 1996A AMT | |
| 05/01/31 | | | 1.550 | % | | | 6,000,000 | | | | 6,013,500 | | |
State of Connecticut(b)
Unlimited General Obligation Bonds
SIFMA
Series 2011A | |
| 05/15/13 | | | 0.400 | % | | | 7,000,000 | | | | 7,000,000 | | |
| Series 2011A | |
| 05/15/15 | | | 0.750 | % | | | 11,265,000 | | | | 11,265,000 | | |
| Total | | | | | | | | | | | 30,319,000 | | |
| Delaware 0.4% | |
University of Delaware
Revenue Bonds
Series 2009A(b) | |
| 11/01/37 | | | 0.850 | % | | | 9,500,000 | | | | 9,564,980 | | |
Issue
Description | | Coupon
Rate | | Principal
Amount | | Value | |
| Municipal Bonds (continued) | |
| District of Columbia 0.2% | |
Metropolitan Washington Airports Authority
Refunding Revenue Bonds
Series 2010B AMT(a) | |
| 10/01/12 | | | 5.000 | % | | $ | 3,300,000 | | | $ | 3,366,924 | | |
| Florida 6.2% | |
Citizens Property Insurance Corp.
Refunding Revenue Bonds
Senior Secured High Risk
Series 2007A (NPFGC) | |
| 03/01/13 | | | 5.000 | % | | | 15,000,000 | | | | 15,573,600 | | |
Citizens Property Insurance Corp.(b)
Revenue Bonds
High Risk
Series 2010A3 | |
| 06/01/13 | | | 2.000 | % | | | 20,000,000 | | | | 20,159,600 | | |
City of Jacksonville
Refunding Revenue Bonds
Better Jacksonville
Series 2012 | |
| 10/01/17 | | | 5.000 | % | | | 2,000,000 | | | | 2,308,340 | | |
Revenue Bonds
Series 2010A-1 | |
| 10/01/16 | | | 5.000 | % | | | 5,000,000 | | | | 5,789,650 | | |
City of Lakeland Energy System
Refunding Revenue Bonds
Series 2009(b) | |
| 10/01/12 | | | 1.000 | % | | | 13,475,000 | | | | 13,492,922 | | |
City of Tampa
Revenue Bonds
Baycare Health Systems
Series 2010 | |
| 11/15/16 | | | 5.000 | % | | | 2,000,000 | | | | 2,301,260 | | |
County of Hillsborough Solid
Waste & Resource Recovery
Revenue Bonds
Series 2006A (AMBAC) AMT(a) | |
| 09/01/14 | | | 5.000 | % | | | 3,025,000 | | | | 3,255,929 | | |
County of Lee Airport
Refunding Revenue Bonds
Series 2010A (AGM) AMT(a) | |
| 10/01/12 | | | 5.000 | % | | | 1,500,000 | | | | 1,527,600 | | |
County of Miami-Dade
Revenue Bonds
Miami International Airport
Series 2007C (AGM) AMT(a) | |
| 10/01/13 | | | 5.000 | % | | | 3,500,000 | | | | 3,702,440 | | |
Florida Housing Finance Corp.
Revenue Bonds
Homeowner Mortgage Special Program
Series 2010A (GNMA/FNMA/FHLMC) | |
| 07/01/28 | | | 5.000 | % | | | 3,290,000 | | | | 3,549,055 | | |
The Accompanying Notes to Financial Statements are an integral part of this statement.
8
Columbia Short Term Municipal Bond Fund
April 30, 2012
(Percentages represent value of investments compared to net assets)
Issue
Description | | Coupon
Rate | | Principal
Amount | | Value | |
| Municipal Bonds (continued) | |
| Florida (cont.) | |
Florida Ports Financing Commission
Refunding Revenue Bonds
State Transportation Fund
Series 2011B AMT(a) | |
| 06/01/14 | | | 5.000 | % | | $ | 2,000,000 | | | $ | 2,151,280 | | |
Florida State Department of
Environmental Protection
Refunding Revenue Bonds
Florida Forever
Series 2011B | |
| 07/01/15 | | | 5.000 | % | | | 15,335,000 | | | | 17,277,024 | | |
JEA
Refunding Revenue Bonds
Issue 2
Series 2011-23 | |
| 10/01/17 | | | 5.000 | % | | | 3,000,000 | | | | 3,573,480 | | |
Orange County Health Facilities Authority
Revenue Bonds
Hospital-Orlando Health, Inc.
Series 2009 | |
| 10/01/14 | | | 5.000 | % | | | 2,000,000 | | | | 2,154,780 | | |
Orlando Utilities Commission
Refunding Revenue Bonds
Series 2008 | |
| 10/01/25 | | | 3.500 | % | | | 10,500,000 | | | | 10,526,250 | | |
Palm Beach County School District
Refunding Certificate of Participation
Series 2002E (AMBAC) | |
| 08/01/12 | | | 5.250 | % | | | 7,625,000 | | | | 7,714,670 | | |
State of Florida Lottery
Revenue Bonds
Series 2006A (AMBAC) | |
| 07/01/12 | | | 5.000 | % | | | 6,150,000 | | | | 6,200,368 | | |
State of Florida
Unlimited General Obligation Refunding Bonds
Capital Outlay
Series 2009D | |
| 06/01/14 | | | 5.000 | % | | | 16,460,000 | | | | 18,030,613 | | |
| Total | | | | | | | | | | | 139,288,861 | | |
| Georgia 2.2% | |
Burke County Development Authority
Revenue Bonds
Georgia Power Co. Plant Vogtle Project
Series 1994-9T | |
| 10/01/32 | | | 1.200 | % | | | 5,000,000 | | | | 5,029,700 | | |
| Series 1995-4T | |
| 10/01/32 | | | 1.200 | % | | | 2,000,000 | | | | 2,011,880 | | |
City of Atlanta Airport
Refunding Revenue Bonds
Series 2003D (FGIC/NPFGC) AMT(a) | |
| 01/01/15 | | | 5.250 | % | | | 5,000,000 | | | | 5,301,900 | | |
County of Douglas
Unlimited General Obligation Bonds
Sales Tax
Series 2011 | |
| 08/01/12 | | | 5.000 | % | | | 4,000,000 | | | | 4,048,800 | | |
Issue
Description | | Coupon
Rate | | Principal
Amount | | Value | |
| Municipal Bonds (continued) | |
| Georgia (cont.) | |
Gwinnett County School District
Unlimited General Obligation Bonds
Series 2007 | |
| 02/01/13 | | | 5.000 | % | | $ | 5,485,000 | | | $ | 5,681,527 | | |
Sales Tax
Series 2012A | |
| 10/01/16 | | | 4.000 | % | | | 9,500,000 | | | | 10,826,295 | | |
Municipal Electric Authority of Georgia
Revenue Bonds
Combined Cycle Project
Series 2012A | |
| 11/01/14 | | | 4.000 | % | | | 1,000,000 | | | | 1,082,200 | | |
| 11/01/15 | | | 4.000 | % | | | 1,000,000 | | | | 1,103,780 | | |
| Series 1998Y (AGM) | |
| 01/01/17 | | | 6.500 | % | | | 100,000 | | | | 110,352 | | |
Unrefunded Revenue Bonds
Series 1998Y (AGM) | |
| 01/01/17 | | | 6.500 | % | | | 6,200,000 | | | | 7,084,740 | | |
Public Gas Partners, Inc.
Revenue Bonds
Series 2009A | |
| 10/01/12 | | | 5.000 | % | | | 2,300,000 | | | | 2,340,664 | | |
| 10/01/14 | | | 5.000 | % | | | 3,630,000 | | | | 3,938,877 | | |
| Total | | | | | | | | | | | 48,560,715 | | |
| Hawaii 0.3% | |
State of Hawaii Airports System
Refunding Revenue Bonds
Series 2010B AMT(a) | |
| 07/01/15 | | | 5.000 | % | | | 7,000,000 | | | | 7,779,800 | | |
| Idaho 0.3% | |
Idaho Housing & Finance Association
Revenue Bonds
Series 2011 | |
| 08/15/13 | | | 4.000 | % | | | 5,525,000 | | | | 5,776,443 | | |
| Illinois 7.1% | |
Chicago Board of Education
Unlimited General Obligation
Refunding Bonds
Series 2010F | |
| 12/01/15 | | | 5.000 | % | | | 2,000,000 | | | | 2,279,800 | | |
Chicago Board of Education(c)
Unlimited General Obligation Bonds
Capital Appreciation-Chicago
School Reform
Series 1997A (AMBAC) | |
| 12/01/14 | | | 0.000 | % | | | 7,085,000 | | | | 6,855,021 | | |
Chicago Public Building Commission
Refunding Revenue Bonds
Chicago School Reform
Series 1999B (NPFGC/FGIC) | |
| 12/01/15 | | | 5.250 | % | | | 3,165,000 | | | | 3,585,407 | | |
Chicago Transit Authority
Revenue Bonds
Federal Transit Administration
Section 5309
Series 2008A | |
| 06/01/12 | | | 5.000 | % | | | 3,650,000 | | | | 3,663,863 | | |
The Accompanying Notes to Financial Statements are an integral part of this statement.
9
Columbia Short Term Municipal Bond Fund
April 30, 2012
(Percentages represent value of investments compared to net assets)
Issue
Description | | Coupon
Rate | | Principal
Amount | | Value | |
| Municipal Bonds (continued) | |
| Illinois (cont.) | |
City of Chicago Midway Airport
Revenue Bonds
2nd Lien
Series 2010B | |
| 01/01/34 | | | 5.000 | % | | $ | 5,500,000 | | | $ | 5,970,085 | | |
City of Chicago Wastewater Transmission
Refunding Revenue Bonds
Series 1993 (NPFGC/FGIC) | |
| 01/01/13 | | | 5.375 | % | | | 720,000 | | | | 734,501 | | |
County of Cook
Unlimited General Obligation Bonds
Capital Equipment
Series 2009D | |
| 11/15/14 | | | 5.000 | % | | | 3,000,000 | | | | 3,302,400 | | |
Unlimited General Obligation
Refunding Bonds
Series 2009C | |
| 11/15/12 | | | 5.000 | % | | | 4,000,000 | | | | 4,099,440 | | |
Illinois Finance Authority
Revenue Bonds
Art Institute of Chicago
Series 2010A | |
| 03/01/15 | | | 5.000 | % | | | 3,200,000 | | | | 3,552,160 | | |
| Series 2010B | |
| 07/01/15 | | | 4.000 | % | | | 13,850,000 | | | | 14,343,198 | | |
Northwestern Memorial Hospital
Series 2009A | |
| 08/15/12 | | | 5.000 | % | | | 5,130,000 | | | | 5,199,460 | | |
| 08/15/13 | | | 5.000 | % | | | 3,500,000 | | | | 3,693,830 | | |
University of Chicago
Series 1998 | |
| 07/01/25 | | | 3.375 | % | | | 5,650,000 | | | | 5,921,878 | | |
Illinois Finance Authority(b)
Revenue Bonds
Advocate Health Care
Series 2008A-3 | |
| 11/01/30 | | | 5.000 | % | | | 2,250,000 | | | | 2,689,043 | | |
Illinois Finance Authority(d)
Revenue Bonds
Ascension Health
Series 2012E | |
| 11/15/42 | | | 5.000 | % | | | 2,750,000 | | | | 3,085,637 | | |
Railsplitter Tobacco Settlement
Authority Revenue Bonds
Series 2010 | |
| 06/01/12 | | | 4.000 | % | | | 3,500,000 | | | | 3,509,841 | | |
| 06/01/15 | | | 5.000 | % | | | 3,615,000 | | | | 3,981,308 | | |
| 06/01/16 | | | 5.000 | % | | | 7,280,000 | | | | 8,157,022 | | |
Regional Transportation Authority
Revenue Bonds
Series 2006A (NPFGC) | |
| 07/01/18 | | | 5.000 | % | | | 4,970,000 | | | | 5,676,237 | | |
State of Illinois
Unlimited General Obligation Bonds
1st Series 2002 (NPFGC) | |
| 10/01/14 | | | 5.250 | % | | | 5,000,000 | | | | 5,105,600 | | |
| 07/01/16 | | | 5.375 | % | | | 4,880,000 | | | | 4,918,113 | | |
Issue
Description | | Coupon
Rate | | Principal
Amount | | Value | |
| Municipal Bonds (continued) | |
| Illinois (cont.) | |
Unlimited General Obligation
Refunding Bonds
1st Series 2002 (NPFGC) | |
| 08/01/16 | | | 5.500 | % | | $ | 6,700,000 | | | $ | 6,780,132 | | |
| Series 2006 | |
| 01/01/13 | | | 5.000 | % | | | 7,000,000 | | | | 7,198,240 | | |
| Series 2010 | |
| 01/01/14 | | | 5.000 | % | | | 25,635,000 | | | | 27,305,889 | | |
| 01/01/16 | | | 5.000 | % | | | 10,000,000 | | | | 11,059,800 | | |
| Series 2010 (AGM) | |
| 01/01/16 | | | 5.000 | % | | | 4,250,000 | | | | 4,716,352 | | |
| Total | | | | | | | | | | | 157,384,257 | | |
| Indiana 1.3% | |
City of Whiting
Revenue Bonds
BP Products North America, Inc.
Series 2008 | |
| 06/01/44 | | | 2.800 | % | | | 13,250,000 | | | | 13,811,270 | | |
Indiana Finance Authority
Revenue Bonds
Series 2011C
2nd Lien-CWA | |
| 10/01/16 | | | 3.000 | % | | | 10,000,000 | | | | 10,701,100 | | |
Indiana Finance Authority(b)
Revenue Bonds
Republic Services, Inc. Project
Series 2010B | |
| 05/01/28 | | | 0.450 | % | | | 5,000,000 | | | | 5,000,000 | | |
| Total | | | | | | | | | | | 29,512,370 | | |
| Iowa 2.0% | |
Iowa Finance Authority
Revenue Bonds
Genesis Health System
Series 2010 | |
| 07/01/15 | | | 5.000 | % | | | 1,075,000 | | | | 1,198,088 | | |
| 07/01/16 | | | 5.000 | % | | | 1,150,000 | | | | 1,302,594 | | |
| Series 2009F | |
| 08/15/39 | | | 5.000 | % | | | 5,100,000 | | | | 5,167,065 | | |
Iowa Student Loan Liquidity Corp.
Revenue Bonds
Series 2009-1 | |
| 12/01/14 | | | 3.750 | % | | | 5,050,000 | | | | 5,296,389 | | |
| 12/01/14 | | | 5.000 | % | | | 5,475,000 | | | | 5,962,165 | | |
| Series 2009-3 | |
| 12/01/24 | | | 5.250 | % | | | 4,595,000 | | | | 4,740,983 | | |
Iowa Student Loan Liquidity Corp.(a)
Revenue Bonds
Senior Series 2011A-1 AMT | |
| 12/01/15 | | | 3.500 | % | | | 20,300,000 | | | | 21,262,220 | | |
| Total | | | | | | | | | | | 44,929,504 | | |
| Kansas 0.9% | |
Kansas State Department of Transportation
Refunding Revenue Bonds
Series 2003A | |
| 09/01/12 | | | 5.000 | % | | | 8,000,000 | | | | 8,128,080 | | |
The Accompanying Notes to Financial Statements are an integral part of this statement.
10
Columbia Short Term Municipal Bond Fund
April 30, 2012
(Percentages represent value of investments compared to net assets)
Issue
Description | | Coupon
Rate | | Principal
Amount | | Value | |
| Municipal Bonds (continued) | |
| Kansas (cont.) | |
Wyandotte County-Kansas City
Unified Government
Revenue Bonds
Capital Appreciation Sales Tax
Subordinated Lien
Series 2010(c) | |
| 06/01/21 | | | 0.000 | % | | $ | 18,025,000 | | | $ | 12,166,695 | | |
| Total | | | | | | | | | | | 20,294,775 | | |
| Kentucky 0.2% | |
Kentucky Economic Development
Finance Authority
Revenue Bonds
Catholic Health
Series 2009B | |
| 05/01/39 | | | 5.000 | % | | | 2,000,000 | | | | 2,199,200 | | |
Louisville Regional Airport Authority
Revenue Bonds
Series 2008 (AGM) AMT(a) | |
| 07/01/12 | | | 5.000 | % | | | 2,935,000 | | | | 2,958,245 | | |
| Total | | | | | | | | | | | 5,157,445 | | |
| Louisiana 2.9% | |
Louisiana Local Government
Environmental Facilities &
Community Development Authority
Revenue Bonds
LCTCS Facilities Corp. Project
Series 2009A | |
| 10/01/14 | | | 4.000 | % | | | 1,545,000 | | | | 1,654,633 | | |
Louisiana Office Facilities Corp.
Refunding Revenue Bonds
State Capitol
Series 2010A | |
| 05/01/16 | | | 5.000 | % | | | 4,505,000 | | | | 5,154,981 | | |
Louisiana Offshore Terminal
Authority(b)
Revenue Bonds
Loop LLC Project
Series 2007B-1A | |
| 10/01/37 | | | 1.600 | % | | | 3,350,000 | | | | 3,360,486 | | |
| Series 2010B-1 | |
| 10/01/40 | | | 1.875 | % | | | 3,500,000 | | | | 3,533,390 | | |
Louisiana Public Facilities Authority
Revenue Bonds
Entergy Gulf States Louisiana
Series 2010B | |
| 11/01/15 | | | 2.875 | % | | | 2,750,000 | | | | 2,824,800 | | |
Orleans Parish Parishwide
School District
Unlimited General Obligation
Refunding Bonds
Series 2010 (AGM) | |
| 09/01/15 | | | 4.000 | % | | | 8,240,000 | | | | 8,950,700 | | |
| 09/01/16 | | | 5.000 | % | | | 3,785,000 | | | | 4,323,643 | | |
Issue
Description | | Coupon
Rate | | Principal
Amount | | Value | |
| Municipal Bonds (continued) | |
| Louisiana (cont.) | |
Regional Transit Authority
Revenue Bonds
Sales Tax
Series 2010 (AGM) | |
| 12/01/15 | | | 4.000 | % | | $ | 1,150,000 | | | $ | 1,264,000 | | |
| 12/01/16 | | | 4.000 | % | | | 1,000,000 | | | | 1,116,980 | | |
State of Louisiana Gasoline &
Fuels Tax
Revenue Bonds
2nd Lien
Series 2010A-1(b) | |
| 05/01/43 | | | 1.000 | % | | | 21,250,000 | | | | 21,272,737 | | |
State of Louisiana
Unlimited General Obligation
Refunding Bonds
Series 2005A (NPFGC) | |
| 08/01/12 | | | 5.000 | % | | | 10,000,000 | | | | 10,121,000 | | |
| Total | | | | | | | | | | | 63,577,350 | | |
| Maine 0.3% | |
Maine Health & Higher Educational
Facilities Authority
Revenue Bonds
Series 2010B | |
| 07/01/15 | | | 5.000 | % | | | 3,455,000 | | | | 3,863,761 | | |
| 07/01/16 | | | 4.000 | % | | | 3,555,000 | | | | 3,893,223 | | |
| Total | | | | | | | | | | | 7,756,984 | | |
| Maryland 0.5% | |
County of Montgomery
Unlimited General Obligation Bonds
Series 2011A | |
| 07/01/12 | | | 2.000 | % | | | 10,985,000 | | | | 11,019,273 | | |
| Massachusetts 4.2% | |
Commonwealth of Massachusetts(b)
Unlimited General Obligation Bonds
Series 2010A | |
| 02/01/13 | | | 0.630 | % | | | 14,500,000 | | | | 14,516,820 | | |
| 02/01/14 | | | 0.780 | % | | | 5,050,000 | | | | 5,053,081 | | |
Unlimited General Obligation
Refunding Bonds
Series 2011A | |
| 02/01/14 | | | 0.730 | % | | | 6,680,000 | | | | 6,680,000 | | |
| 02/01/15 | | | 0.910 | % | | | 2,000,000 | | | | 2,000,000 | | |
Massachusetts Development
Finance Agency
Revenue Bonds
Boston College
Series 2010R-1 | |
| 07/01/12 | | | 5.000 | % | | | 1,000,000 | | | | 1,008,140 | | |
Boston University
Series 2009V-2 | |
| 10/01/14 | | | 2.875 | % | | | 4,975,000 | | | | 5,236,237 | | |
The Accompanying Notes to Financial Statements are an integral part of this statement.
11
Columbia Short Term Municipal Bond Fund
April 30, 2012
(Percentages represent value of investments compared to net assets)
Issue
Description | | Coupon
Rate | | Principal
Amount | | Value | |
| Municipal Bonds (continued) | |
| Massachusetts (cont.) | |
Massachusetts Development
Finance Agency(b)
Revenue Bonds
Partners Healthcare
Series 2011K-3 | |
| 07/01/38 | | | 0.900 | % | | $ | 8,465,000 | | | $ | 8,464,831 | | |
Williams College
Series 2011N | |
| 07/01/41 | | | 0.750 | % | | | 11,250,000 | | | | 11,266,650 | | |
Massachusetts Educational
Financing Authority
Revenue Bonds
Series 2009I | |
| 01/01/16 | | | 5.250 | % | | | 12,500,000 | | | | 13,934,750 | | |
Massachusetts Health & Educational
Facilities Authority
Revenue Bonds
Caregroup
Series 2008E-2 | |
| 07/01/12 | | | 5.000 | % | | | 2,500,000 | | | | 2,518,875 | | |
Massachusetts Housing Finance Agency
Revenue Bonds
Construction Loan Notes
Series 2012A | |
| 11/01/13 | | | 0.800 | % | | | 1,800,000 | | | | 1,801,494 | | |
Massachusetts Municipal Wholesale
Electric Co.
Revenue Bonds
Project 6
Series 2012A | |
| 07/01/15 | | | 5.000 | % | | | 1,500,000 | | | | 1,684,455 | | |
Massachusetts Port Authority(a)
Refunding Revenue Bonds
Series 2010E AMT | |
| 07/01/14 | | | 5.000 | % | | | 5,000,000 | | | | 5,404,450 | | |
| 07/01/15 | | | 5.000 | % | | | 4,000,000 | | | | 4,431,680 | | |
Massachusetts School Building Authority
Revenue Bonds
Series 2005A (AGM) | |
| 08/15/12 | | | 5.000 | % | | | 6,100,000 | | | | 6,185,888 | | |
University of Massachusetts
Building Authority
Refunding Revenue Bonds
Senior Series 2005-2 (AMBAC) | |
| 11/01/15 | | | 5.000 | % | | | 3,000,000 | | | | 3,416,610 | | |
| Total | | | | | | | | | | | 93,603,961 | | |
| Michigan 2.0% | |
Detroit City School District
Unlimited General Obligation
Refunding Bonds Improvement
School Building & Site
Series 2012A (Qualified School Board Loan Fund) | |
| 05/01/14 | | | 4.000 | % | | | 1,700,000 | | | | 1,796,832 | | |
Issue
Description | | Coupon
Rate | | Principal
Amount | | Value | |
| Municipal Bonds (continued) | |
| Michigan (cont.) | |
Michigan State Hospital Finance Authority
Revenue Bonds
Ascension Health Care Group
Series 1999 | |
| 11/15/33 | | | 0.900 | % | | $ | 5,000,000 | | | $ | 4,990,350 | | |
Ascension Health Senior Care Group
Series 2010 | |
| 11/15/15 | | | 5.000 | % | | | 2,000,000 | | | | 2,261,260 | | |
Michigan Strategic Fund
Refunding Revenue Bonds
Detroit Edison
Series 2009 | |
| 08/01/24 | | | 3.050 | % | | | 5,000,000 | | | | 5,059,900 | | |
Dow Chemical
Series 2003B-1 | |
| 06/01/14 | | | 6.250 | % | | | 12,000,000 | | | | 13,216,320 | | |
State of Michigan
Unlimited General Obligation Bonds
Environmental Program
Series 2008A | |
| 05/01/12 | | | 5.000 | % | | | 3,670,000 | | | | 3,670,479 | | |
Wayne County Airport Authority
Refunding Revenue Bonds
Detroit Metro Airport
Series 2010C | |
| 12/01/14 | | | 5.000 | % | | | 12,805,000 | | | | 13,804,302 | | |
| Total | | | | | | | | | | | 44,799,443 | | |
| Minnesota 0.9% | |
Dakota & Washington Counties
Housing & Redevelopment Authority
Revenue Bonds
Single Family-Residential
Series 1988 Escrowed to Maturity (GNMA) AMT(a) | |
| 03/01/13 | | | 7.950 | % | | | 8,000,000 | | | | 8,499,040 | | |
Minneapolis-St Paul Metropolitan
Airports Commission(a)
Refunding Revenue Bonds
Senior Series 2009B AMT | |
| 01/01/14 | | | 5.000 | % | | | 2,055,000 | | | | 2,203,535 | | |
| Subordinated Series 2010D AMT | |
| 01/01/16 | | | 5.000 | % | | | 5,160,000 | | | | 5,774,866 | | |
Minnesota Municipal Power Agency
Revenue Bonds
Series 2010B | |
| 10/01/13 | | | 4.000 | % | | | 3,000,000 | | | | 3,007,560 | | |
| Total | | | | | | | | | | | 19,485,001 | | |
| Mississippi 0.4% | |
State of Mississippi
Prerefunded 11/01/12 Unlimited
General Obligation Bonds
Capital Improvement
Series 2002 (FGIC) | |
| 11/01/13 | | | 5.250 | % | | | 7,925,000 | | | | 8,124,789 | | |
The Accompanying Notes to Financial Statements are an integral part of this statement.
12
Columbia Short Term Municipal Bond Fund
April 30, 2012
(Percentages represent value of investments compared to net assets)
Issue
Description | | Coupon
Rate | | Principal
Amount | | Value | |
| Municipal Bonds (continued) | |
| Missouri 0.8% | |
Bi-State Development Agency of the
Missouri-Illinois Metropolitan District
Revenue Bonds
Metrolink Cross County Project
Series 2002B (AGM) | |
| 10/01/15 | | | 5.250 | % | | $ | 10,500,000 | | | $ | 11,195,205 | | |
Missouri State Board of Public Buildings
Refunding Revenue Bonds
Series 2011A | |
| 10/01/16 | | | 3.000 | % | | | 6,195,000 | | | | 6,761,595 | | |
| Total | | | | | | | | | | | 17,956,800 | | |
| Nebraska 0.2% | |
City of Lincoln Electric System
Refunding Revenue Bonds
Series 2002 | |
| 09/01/14 | | | 5.000 | % | | | 5,000,000 | | | | 5,078,700 | | |
| Nevada 1.5% | |
City of Reno
Revenue Bonds
Renown Regional Medical
Center Project
Series 2007A | |
| 06/01/12 | | | 5.000 | % | | | 815,000 | | | | 817,574 | | |
| 06/01/13 | | | 5.000 | % | | | 500,000 | | | | 516,860 | | |
County of Clark Airport System
Revenue Bonds
Subordinated Lien Notes
Series 2010-E2 | |
| 07/01/12 | | | 5.000 | % | | | 9,965,000 | | | | 10,037,346 | | |
County of Clark
Limited General Obligation Bonds
Series 2002 (NPFGC)
Bond Bank | |
| 06/01/16 | | | 5.250 | % | | | 4,285,000 | | | | 4,405,280 | | |
Refunding Revenue Bonds
Las Vegas McCarran
Series 2010 | |
| 07/01/12 | | | 3.000 | % | | | 2,000,000 | | | | 2,008,080 | | |
Las Vegas Convention & Visitors Authority
Refunding Revenue Bonds
Series 2005 (AMBAC) | |
| 07/01/17 | | | 5.000 | % | | | 13,380,000 | | | | 14,870,130 | | |
| Total | | | | | | | | | | | 32,655,270 | | |
| New Jersey 1.5% | |
New Jersey Building Authority
Refunding Revenue Bonds
Series 2007B | |
| 06/15/13 | | | 5.000 | % | | | 8,205,000 | | | | 8,612,870 | | |
New Jersey Economic
Development Authority
Revenue Bonds
Capital Appreciation-Economic
Recovery
Series 1992A(c) | |
| 03/15/13 | | | 0.000 | % | | | 4,500,000 | | | | 4,464,405 | | |
Issue
Description | | Coupon
Rate | | Principal
Amount | | Value | |
| Municipal Bonds (continued) | |
| New Jersey (cont.) | |
State of New Jersey
Certificate of Participation
Series 2004A
Equipment Lease Purchase | |
| 06/15/15 | | | 5.000 | % | | $ | 3,000,000 | | | $ | 3,238,650 | | |
Unlimited General Obligation
Refunding Bonds
Series 2010S | |
| 02/15/13 | | | 5.000 | % | | | 10,000,000 | | | | 10,378,600 | | |
Tobacco Settlement Financing Corp.
Prerefunded 06/01/12 Asset-Backed
Revenue Bonds
Series 2002 | |
| 06/01/42 | | | 6.125 | % | | | 6,425,000 | | | | 6,457,575 | | |
| Total | | | | | | | | | | | 33,152,100 | | |
| New Mexico 0.7% | |
Inc County of Los Alamos
Revenue Bonds
Series 2004A (AGM) | |
| 07/01/15 | | | 5.000 | % | | | 2,555,000 | | | | 2,653,827 | | |
New Mexico Educational
Assistance Foundation
Revenue Bonds
Educational Loan
Senior Series 2009C AMT(a) | |
| 09/01/14 | | | 3.900 | % | | | 4,890,000 | | | | 5,145,992 | | |
State of New Mexico
Revenue Bonds
Series 2009A | |
| 07/01/14 | | | 5.000 | % | | | 7,895,000 | | | | 8,687,658 | | |
| Total | | | | | | | | | | | 16,487,477 | | |
| New York 9.8% | |
Babylon Industrial Development Agency
Revenue Bonds
Covanta Babylon
Series 2009A | |
| 01/01/13 | | | 5.000 | % | | | 1,500,000 | | | | 1,540,215 | | |
| 01/01/14 | | | 5.000 | % | | | 2,000,000 | | | | 2,127,280 | | |
Buffalo & Fort Erie Public Bridge Authority
Refunding Revenue Bonds
Series 2005(b) | |
| 01/01/25 | | | 2.625 | % | | | 9,855,000 | | | | 10,116,256 | | |
City of New York
Unlimited General Obligation Bonds
Fiscal 2008
Series 2007A-1 | |
| 08/01/12 | | | 5.000 | % | | | 3,000,000 | | | | 3,036,360 | | |
| Series 2004H-A | |
| 03/01/15 | | | 5.000 | % | | | 6,500,000 | | | | 7,291,245 | | |
| Series 2005G | |
| 08/01/18 | | | 5.000 | % | | | 3,650,000 | | | | 4,143,444 | | |
| Series 2005J (FGIC) | |
| 03/01/16 | | | 5.000 | % | | | 8,000,000 | | | | 8,940,240 | | |
| Series 2005O | |
| 06/01/14 | | | 5.000 | % | | | 4,250,000 | | | | 4,644,783 | | |
| Series 2009E | |
| 08/01/15 | | | 5.000 | % | | | 3,500,000 | | | | 3,980,725 | | |
The Accompanying Notes to Financial Statements are an integral part of this statement.
13
Columbia Short Term Municipal Bond Fund
April 30, 2012
(Percentages represent value of investments compared to net assets)
Issue
Description | | Coupon
Rate | | Principal
Amount | | Value | |
| Municipal Bonds (continued) | |
| New York (cont.) | |
County of Monroe
Unlimited General Obligation
Refunding Bonds
Series 2012 | |
| 03/01/15 | | | 5.000 | % | | $ | 1,000,000 | | | $ | 1,094,120 | | |
Erie County Industrial Development
Agency (The)
Revenue Bonds
Series 2012 | |
| 05/01/15 | | | 5.000 | % | | | 2,000,000 | | | | 2,239,040 | | |
| 05/01/17 | | | 5.000 | % | | | 3,000,000 | | | | 3,524,970 | | |
Long Island Power Authority
Revenue Bonds
Series 2003B | |
| 06/01/13 | | | 5.250 | % | | | 4,250,000 | | | | 4,467,855 | | |
Metropolitan Transportation Authority
Revenue Bonds
Series 2003B (NPFGC/FGIC) | |
| 11/15/16 | | | 5.250 | % | | | 4,500,000 | | | | 4,791,825 | | |
| Subordinated Series 2012B-2 | |
| 11/01/16 | | | 5.000 | % | | | 8,085,000 | | | | 9,552,427 | | |
New York City Health & Hospital Corp.
Revenue Bonds
Health System
Series 2010A | |
| 02/15/15 | | | 5.000 | % | | | 4,500,000 | | | | 4,989,645 | | |
New York City Transitional Finance Authority
Revenue Bonds
Future Tax Secured
Subordinated Series 2009C-1 | |
| 08/01/14 | | | 5.000 | % | | | 6,795,000 | | | | 7,490,740 | | |
| Subordinated Series 2011E | |
| 11/01/12 | | | 4.000 | % | | | 7,000,000 | | | | 7,133,980 | | |
New York State Dormitory Authority
Refunding Revenue Bonds
Department of Health
Series 2004 (NPFGC/FGIC) | |
| 07/01/14 | | | 5.000 | % | | | 3,660,000 | | | | 3,987,826 | | |
Revenue Bonds
Mental Health Services
Facilities Improvement
Series 2009 | |
| 02/15/13 | | | 5.000 | % | | | 13,505,000 | | | | 13,996,312 | | |
Mount Sinai School of Medicine
Series 2010A | |
| 07/01/12 | | | 5.000 | % | | | 1,000,000 | | | | 1,007,590 | | |
| 07/01/15 | | | 5.000 | % | | | 1,000,000 | | | | 1,114,010 | | |
| 07/01/16 | | | 5.000 | % | | | 2,645,000 | | | | 3,002,842 | | |
Municipal Facilities Health-Lease NYC
Series 2008-1 | |
| 01/15/14 | | | 5.000 | % | | | 6,300,000 | | | | 6,704,145 | | |
State University Educational
Facilities-Third General Resolution
Series 2002B (NPFGC/FGIC) | |
| 11/15/29 | | | 5.250 | % | | | 10,000,000 | | | | 10,020,900 | | |
Issue
Description | | Coupon
Rate | | Principal
Amount | | Value | |
| Municipal Bonds (continued) | |
| New York (cont.) | |
New York State Housing Finance Agency
Refunding Revenue Bonds
Consolidated
Series 2011A | |
| 09/15/13 | | | 5.000 | % | | $ | 5,000,000 | | | $ | 5,312,850 | | |
New York State Thruway Authority
Revenue Bonds
Local Highway & Bridge
Series 2012A | |
| 04/01/15 | | | 4.000 | % | | | 8,500,000 | | | | 9,291,010 | | |
Port Authority of New York &
New Jersey(a)
Revenue Bonds
Consolidated 127th
Series 2002 (AMBAC) AMT | |
| 12/15/16 | | | 5.500 | % | | | 3,630,000 | | | | 3,684,051 | | |
Consolidated 131st
Series 2003 (CIFG/TCRS) AMT | |
| 12/15/16 | | | 5.000 | % | | | 10,000,000 | | | | 10,568,900 | | |
Tobacco Settlement Financing Corp.
Asset-Backed Revenue Bonds
Series 2011B | |
| 06/01/14 | | | 5.000 | % | | | 7,950,000 | | | | 8,655,642 | | |
| 06/01/16 | | | 5.000 | % | | | 20,000,000 | | | | 23,064,800 | | |
Town of Ramapo
Unlimited General Obligation Notes
BANS Series 2011C | |
| 12/05/12 | | | 2.000 | % | | | 8,855,000 | | | | 8,897,061 | | |
Triborough Bridge & Tunnel Authority
Refunding Revenue Bonds
Series 2002B | |
| 11/15/16 | | | 5.250 | % | | | 10,000,000 | | | | 10,267,900 | | |
United Nations Development Corp.
Refunding Revenue Bonds
Series 2009A | |
| 07/01/12 | | | 4.000 | % | | | 3,925,000 | | | | 3,950,120 | | |
| 07/01/13 | | | 4.500 | % | | | 2,200,000 | | | | 2,307,250 | | |
| 07/01/14 | | | 5.000 | % | | | 2,000,000 | | | | 2,186,640 | | |
| Total | | | | | | | | | | | 219,124,999 | | |
| North Carolina 1.8% | |
North Carolina Eastern Municipal
Power Agency
Refunding Revenue Bonds
Series 2003F | |
| 01/01/13 | | | 5.375 | % | | | 7,000,000 | | | | 7,225,330 | | |
North Carolina Municipal Power
Agency No. 1
Revenue Bonds
Series 2003A (AMBAC) | |
| 01/01/15 | | | 5.250 | % | | | 2,000,000 | | | | 2,063,400 | | |
State of North Carolina
Refunding Revenue Bonds
Series 2011B | |
| 11/01/16 | | | 5.000 | % | | | 17,555,000 | | | | 20,794,951 | | |
The Accompanying Notes to Financial Statements are an integral part of this statement.
14
Columbia Short Term Municipal Bond Fund
April 30, 2012
(Percentages represent value of investments compared to net assets)
Issue
Description | | Coupon
Rate | | Principal
Amount | | Value | |
| Municipal Bonds (continued) | |
| North Carolina (cont.) | |
Revenue Bonds
Series 2011C | |
| 05/01/13 | | | 5.000 | % | | $ | 9,355,000 | | | $ | 9,798,801 | | |
| Total | | | | | | | | | | | 39,882,482 | | |
| North Dakota 1.0% | |
County of McLean
Revenue Bonds
Great River Energy
Series 2010C AMT(a) | |
| 07/01/38 | | | 3.500 | % | | | 22,000,000 | | | | 23,018,600 | | |
| Ohio 2.2% | |
County of Franklin
Refunding Revenue Bonds
Ohiohealth Corp.
Series 2011B | |
| 11/15/33 | | | 2.000 | % | | | 5,000,000 | | | | 5,015,500 | | |
| Series 2003C (NPFGC) | |
| Ohiohealth Corp. | |
| 05/15/15 | | | 5.250 | % | | | 3,420,000 | | | | 3,575,747 | | |
| 05/15/16 | | | 5.250 | % | | | 4,090,000 | | | | 4,270,573 | | |
County of Lorain
Revenue Bonds
Catholic HealthCare Partners
Series 2002 | |
| 10/01/16 | | | 5.500 | % | | | 2,665,000 | | | | 2,714,436 | | |
Ohio Air Quality Development Authority
Refunding Revenue Bonds
Ohio Power Co.
Series 2010A | |
| 06/01/41 | | | 3.250 | % | | | 6,150,000 | | | | 6,294,771 | | |
Ohio Air Quality Development Authority(a)
Refunding Revenue Bonds
Ohio Power Co. Galvin
Series 2010A AMT | |
| 12/01/27 | | | 2.875 | % | | | 3,130,000 | | | | 3,189,282 | | |
Ohio Housing Finance Agency
Revenue Bonds
Series 2010-1 | |
| 11/01/28 | | | 5.000 | % | | | 3,580,000 | | | | 3,898,155 | | |
Ohio State Building Authority
Prerefunded 04/01/13 Revenue Bonds
State Facilities-Administration
Building Fund
Series 2003A (AGM) | |
| 04/01/15 | | | 5.000 | % | | | 2,080,000 | | | | 2,170,875 | | |
State of Ohio
Revenue Bonds
Series 2008-1 | |
| 06/15/12 | | | 5.000 | % | | | 2,200,000 | | | | 2,213,803 | | |
Unlimited General Obligation
Refunding Bonds
Common Schools
Series 2009C | |
| 09/15/14 | | | 5.000 | % | | | 15,000,000 | | | | 16,614,600 | | |
| Total | | | | | | | | | | | 49,957,742 | | |
Issue
Description | | Coupon
Rate | | Principal
Amount | | Value | |
| Municipal Bonds (continued) | |
| Oklahoma 0.3% | |
Oklahoma County Finance Authority
Revenue Bonds
Midwest City—Delaware City
Public Schools
Series 2012 | |
| 03/01/14 | | | 2.000 | % | | $ | 1,750,000 | | | $ | 1,789,235 | | |
| 03/01/15 | | | 2.000 | % | | | 1,500,000 | | | | 1,540,935 | | |
Tulsa County Industrial Authority
Revenue Bonds
Jenks Public Schools
Series 2009 | |
| 09/01/13 | | | 4.000 | % | | | 1,000,000 | | | | 1,046,310 | | |
| 09/01/14 | | | 5.500 | % | | | 1,280,000 | | | | 1,424,512 | | |
| Total | | | | | | | | | | | 5,800,992 | | |
| Oregon 0.7% | |
Oregon State Department of
Administrative Services
Certificate of Participation
Series 2009A | |
| 05/01/14 | | | 5.000 | % | | | 3,125,000 | | | | 3,404,687 | | |
Refunding Certificate of Participation
Series 2002B (NPFGC) | |
| 05/01/15 | | | 5.250 | % | | | 6,020,000 | | | | 6,020,843 | | |
| 05/01/16 | | | 5.250 | % | | | 6,085,000 | | | | 6,085,852 | | |
| Total | | | | | | | | | | | 15,511,382 | | |
| Pennsylvania 1.6% | |
Delaware Valley Regional Financial
Authority
Revenue Bonds
Series 2002 | |
| 07/01/12 | | | 5.500 | % | | | 6,000,000 | | | | 6,049,500 | | |
Pennsylvania Higher Educational
Facilities Authority
Revenue Bonds
University of Pittsburgh Medical Center
Series 2010E | |
| 05/15/15 | | | 5.000 | % | | | 4,250,000 | | | | 4,739,855 | | |
Pennsylvania Industrial
Development Authority
Refunding Revenue Bonds
Economic Development
Series 2012(d) | |
| 07/01/15 | | | 5.000 | % | | | 2,000,000 | | | | 2,232,640 | | |
Pennsylvania Turnpike
Commission(b)
Revenue Bonds
Series 2009C | |
| 12/01/12 | | | 0.870 | % | | | 10,000,000 | | | | 10,014,000 | | |
| Series 2011B | |
| 06/01/14 | | | 0.900 | % | | | 3,000,000 | | | | 2,999,910 | | |
| Series 2011D | |
| 12/01/13 | | | 0.600 | % | | | 7,000,000 | | | | 6,999,860 | | |
The Accompanying Notes to Financial Statements are an integral part of this statement.
15
Columbia Short Term Municipal Bond Fund
April 30, 2012
(Percentages represent value of investments compared to net assets)
Issue
Description | | Coupon
Rate | | Principal
Amount | | Value | |
| Municipal Bonds (continued) | |
| Pennsylvania (cont.) | |
Southeastern Pennsylvania
Transportation Authority
Revenue Bonds
Series 2011
Capital Grant Receipts | |
| 06/01/13 | | | 3.000 | % | | $ | 750,000 | | | $ | 768,292 | | |
| 06/01/13 | | | 5.000 | % | | | 800,000 | | | | 836,784 | | |
| 06/01/14 | | | 3.000 | % | | | 1,000,000 | | | | 1,043,380 | | |
| 06/01/14 | | | 5.000 | % | | | 430,000 | | | | 466,387 | | |
| Total | | | | | | | | | | | 36,150,608 | | |
| Rhode Island 0.3% | |
Rhode Island Convention
Center Authority
Refunding Revenue Bonds
Series 2003A (AGM) | |
| 05/15/16 | | | 5.000 | % | | | 5,610,000 | | | | 5,834,232 | | |
| South Carolina 1.0% | |
Greenville County School District
Prerefunded 12/01/12 Revenue Bonds
Building Equity Sooner Tomorrow
Series 2002 | |
| 12/01/16 | | | 5.875 | % | | | 5,475,000 | | | | 5,711,137 | | |
South Carolina State Public
Service Authority
Revenue Bonds
Santee Cooper
Series 2009E | |
| 01/01/14 | | | 5.000 | % | | | 1,500,000 | | | | 1,613,370 | | |
| 01/01/15 | | | 5.000 | % | | | 8,225,000 | | | | 9,184,199 | | |
South Carolina Transportation
Infrastructure Bank
Refunding Revenue Bonds
Series 2012A | |
| 10/01/15 | | | 4.000 | % | | | 6,000,000 | | | | 6,597,600 | | |
| Total | | | | | | | | | | | 23,106,306 | | |
| South Dakota 0.1% | |
South Dakota Health & Educational
Facilities Authority
Revenue Bonds
Regional Health
Series 2011 | |
| 09/01/14 | | | 5.000 | % | | | 1,470,000 | | | | 1,613,060 | | |
| Tennessee 0.5% | |
Knox County Health Educational &
Housing Facilities Board
Refunding Revenue Bonds
Fort Sanders Alliance
Series 1993 | |
| 01/01/14 | | | 5.750 | % | | | 2,000,000 | | | | 2,158,940 | | |
| Series 1993 (NPFGC) | |
| 01/01/15 | | | 5.250 | % | | | 4,550,000 | | | | 5,030,070 | | |
Memphis-Shelby County Airport Authority(a)
Refunding Revenue Bonds
Series 2010B AMT | |
| 07/01/15 | | | 4.000 | % | | | 2,060,000 | | | | 2,192,479 | | |
| 07/01/16 | | | 5.000 | % | | | 1,000,000 | | | | 1,120,260 | | |
Issue
Description | | Coupon
Rate | | Principal
Amount | | Value | |
| Municipal Bonds (continued) | |
| Tennessee (cont.) | |
Metropolitan Government of
Nashville & Davidson County
Water & Sewer
Refunding Revenue Bonds
Subordinated Lien
Series 2012 | |
| 07/01/16 | | | 5.000 | % | | $ | 1,250,000 | | | $ | 1,454,788 | | |
| Total | | | | | | | | | | | 11,956,537 | | |
| Texas 3.3% | |
City of Dallas
Refunding Revenue Bonds
Series 2007 (AMBAC) | |
| 10/01/12 | | | 5.000 | % | | | 5,000,000 | | | | 5,099,900 | | |
City of Houston Airport System
Prerefunded 07/01/12 Revenue Bonds
Subordinated Lien
Series 2002 (AGM) | |
| 07/01/13 | | | 5.500 | % | | | 6,330,000 | | | | 6,384,944 | | |
City of Houston Airport System(a)
Refunding Revenue Bonds
Subordinated Lien
Series 2011A AMT | |
| 07/01/14 | | | 5.000 | % | | | 5,000,000 | | | | 5,455,350 | | |
City of Houston
Limited General Obligation
Refunding Bonds
Series 2011A | |
| 03/01/16 | | | 5.000 | % | | | 11,470,000 | | | | 13,308,412 | | |
City of Lubbock
Limited General Obligation Bonds
Waterworks
Series 2011 | |
| 02/15/15 | | | 5.000 | % | | | 1,250,000 | | | | 1,403,625 | | |
City of San Antonio
Refunding Revenue Bonds
Systems
Series 2011 | |
| 02/01/16 | | | 5.000 | % | | | 4,000,000 | | | | 4,633,200 | | |
Gulf Coast Waste Disposal Authority
Revenue Bonds
BP Products North America
Series 2007 | |
| 01/01/42 | | | 2.300 | % | | | 2,950,000 | | | | 3,008,469 | | |
Harris County Cultural Education
Facilities Finance Corp.
Refunding Revenue Bonds
Memorial Hermann Hospital
Series 2010A | |
| 06/01/12 | | | 4.000 | % | | | 1,000,000 | | | | 1,003,037 | | |
Methodist Hospital System
Series 2009B-1 | |
| 12/01/28 | | | 5.000 | % | | | 10,000,000 | | | | 10,040,200 | | |
Lower Colorado River Authority
Refunding Revenue Bonds
Series 2010 Escrowed to Maturity | |
| 05/15/14 | | | 5.000 | % | | | 5,000 | | | | 5,464 | | |
The Accompanying Notes to Financial Statements are an integral part of this statement.
16
Columbia Short Term Municipal Bond Fund
April 30, 2012
(Percentages represent value of investments compared to net assets)
Issue
Description | | Coupon
Rate | | Principal
Amount | | Value | |
| Municipal Bonds (continued) | |
| Texas (cont.) | |
| 05/15/14 | | | 5.000 | % | | $ | 5,000 | | | $ | 5,473 | | |
| 05/15/15 | | | 5.000 | % | | | 5,000 | | | | 5,667 | | |
| 05/15/15 | | | 5.000 | % | | | 10,000 | | | | 11,360 | | |
Unrefunded Revenue Bonds
Series 2010 | |
| 05/15/14 | | | 5.000 | % | | | 2,220,000 | | | | 2,417,913 | | |
| 05/15/15 | | | 5.000 | % | | | 3,985,000 | | | | 4,485,915 | | |
Lubbock Health Facilities
Development Corp.
Refunding Revenue Bonds
St. Joseph Health System
Series 2008A | |
| 07/01/30 | | | 3.050 | % | | | 4,745,000 | | | | 4,799,567 | | |
North Texas Tollway Authority
Revenue Bonds
1st Tier
Series 2009A | |
| 01/01/13 | | | 5.000 | % | | | 1,300,000 | | | | 1,337,518 | | |
State of Texas
Unlimited General Obligation
Refunding Bonds
College Student Loan
Series 2010 AMT(a) | |
| 08/01/15 | | | 5.000 | % | | | 5,775,000 | | | | 6,519,166 | | |
Texas Public Finance Authority
Revenue Bonds
Unemployment Compensation
Series 2010A | |
| 07/01/12 | | | 5.000 | % | | | 3,100,000 | | | | 3,125,234 | | |
| Total | | | | | | | | | | | 73,050,414 | | |
| Utah 1.2% | |
City of Riverton
Revenue Bonds
IHC Health Services, Inc.
Series 2009 | |
| 08/15/13 | | | 5.000 | % | | | 1,400,000 | | | | 1,483,916 | | |
Intermountain Power Agency
Refunding Revenue Bonds
Series 2009A | |
| 07/01/13 | | | 5.000 | % | | | 10,000,000 | | | | 10,540,900 | | |
State of Utah
Unlimited General Obligation Bonds
Series 2009C | |
| 07/01/14 | | | 5.000 | % | | | 2,500,000 | | | | 2,752,150 | | |
| Series 2010A | |
| 07/01/12 | | | 5.000 | % | | | 6,180,000 | | | | 6,230,614 | | |
Utah Associated Municipal
Power Systems
Refunding Revenue Bonds
Payson Power Project
Series 2012 | |
| 04/01/16 | | | 4.000 | % | | | 4,690,000 | | | | 5,172,320 | | |
| Total | | | | | | | | | | | 26,179,900 | | |
Issue
Description | | Coupon
Rate | | Principal
Amount | | Value | |
| Municipal Bonds (continued) | |
| Virgin Islands 0.2% | |
Virgin Islands Public Finance Authority
Refunding Revenue Bonds
Senior Lien
Series 2009B(e) | |
| 10/01/12 | | | 5.000 | % | | $ | 4,145,000 | | | $ | 4,199,590 | | |
| Virginia 1.1% | |
City of Norfolk
Unlimited General Obligation Bonds
BAN Series 2011A | |
| 01/01/14 | | | 3.000 | % | | | 3,250,000 | | | | 3,265,015 | | |
County of Pittsylvania
Unlimited General Obligation
Refunding Bonds
Series 2010A | |
| 07/15/13 | | | 3.500 | % | | | 3,000,000 | | | | 3,008,370 | | |
Peninsula Ports Authority
Refunding Revenue Bonds
Dominion Term Association Project
Series 2003(b) | |
| 10/01/33 | | | 2.375 | % | | | 3,335,000 | | | | 3,382,657 | | |
Roanoke Economic Development
Authority
Revenue Bonds
Carilion Health System
Series 2002A (NPFGC) | |
| 07/01/16 | | | 5.500 | % | | | 1,500,000 | | | | 1,513,380 | | |
| 07/01/17 | | | 5.500 | % | | | 1,945,000 | | | | 1,962,349 | | |
Virginia College Building Authority
Revenue Bonds
Series 2011A
21st Century College & Equipment | |
| 02/01/13 | | | 3.000 | % | | | 7,690,000 | | | | 7,851,875 | | |
York County Economic
Development Authority
Refunding Revenue Bonds
Virginia Electric & Power
Series 2009A | |
| 05/01/33 | | | 4.050 | % | | | 3,500,000 | | | | 3,684,485 | | |
| Total | | | | | | | | | | | 24,668,131 | | |
| Washington 3.9% | |
City of Seattle Municipal Light & Power
Improvement Refunding Revenue Bonds
Series 2004 (AGM) | |
| 08/01/15 | | | 5.000 | % | | | 6,000,000 | | | | 6,600,780 | | |
Clark County Public Utility District No. 1
Refunding Revenue Bonds
Series 2010 | |
| 01/01/15 | | | 5.000 | % | | | 2,900,000 | | | | 3,195,858 | | |
Energy Northwest
Refunding Revenue Bonds
Project 1
Series 2012B | |
| 07/01/17 | | | 5.000 | % | | | 40,220,000 | | | | 48,248,716 | | |
The Accompanying Notes to Financial Statements are an integral part of this statement.
17
Columbia Short Term Municipal Bond Fund
April 30, 2012
(Percentages represent value of investments compared to net assets)
Issue
Description | | Coupon
Rate | | Principal
Amount | | Value | |
| Municipal Bonds (continued) | |
| Washington (cont.) | |
Project No. 1
Series 2002A (NPFGC) | |
| 07/01/15 | | | 5.500 | % | | $ | 5,000,000 | | | $ | 5,043,600 | | |
| Series 1992A | |
| 07/01/12 | | | 6.300 | % | | | 9,000,000 | | | | 9,092,700 | | |
FYI Properties
Revenue Bonds
Washington State Disposal Project
Series 2009 | |
| 06/01/13 | | | 5.000 | % | | | 2,400,000 | | | | 2,509,560 | | |
Port of Seattle
Refunding Revenue Bonds
Series 2010B AMT(a) | |
| 12/01/15 | | | 5.000 | % | | | 5,500,000 | | | | 6,119,850 | | |
State of Washington
Unlimited General Obligation
Refunding Bonds
Series 2010A | |
| 01/01/14 | | | 5.000 | % | | | 5,110,000 | | | | 5,506,076 | | |
Washington State Housing
Finance Commission
Revenue Bonds
Series 2010A (GNMA/FNMA/FHLMC) | |
| 10/01/28 | | | 4.700 | % | | | 1,420,000 | | | | 1,517,327 | | |
| Total | | | | | | | | | | | 87,834,467 | | |
| West Virginia 0.5% | |
County of Mason
Revenue Bonds
Appalachian Power Co.
Series 2003L | |
| 10/01/22 | | | 2.000 | % | | | 8,000,000 | | | | 8,032,000 | | |
West Virginia University
Revenue Bonds
West Virginia University Projects
Series 2011C(b) | |
| 10/01/41 | | | 0.900 | % | | | 4,000,000 | | | | 4,000,880 | | |
| Total | | | | | | | | | | | 12,032,880 | | |
| Wisconsin 0.3% | |
Badger Tobacco Asset Securitization Corp.
Prerefunded 06/01/12 Asset-Backed
Revenue Bonds
Series 2002 | |
| 06/01/27 | | | 6.125 | % | | | 7,000,000 | | | | 7,035,350 | | |
Total Municipal Bonds
(Cost: $1,875,197,538) | | $ | 1,909,239,086 | | |
Issue
Description | | Effective
Yield | | Amount
Payable at
Maturity | | Value | |
| Floating Rate Notes 6.9% | |
| California 1.1% | |
California Statewide Communities
Development Authority
Revenue Bonds
Kaiser Permanente
VRDN Series 2008A(b)(f) | |
| 04/01/32 | | | 0.210 | % | | $ | 25,000,000 | | | $ | 25,000,000 | | |
| Colorado 1.1% | |
City & County of Denver Airport System
Revenue Bonds
Systems
VRDN Series 2009C(b)(f) | |
| 11/15/22 | | | 0.210 | % | | | 15,195,000 | | | | 15,195,000 | | |
City of Colorado Springs Utilities System
Refunding Revenue Bonds
VRDN Series 2004 (Citibank)(b) | |
| 11/01/23 | | | 0.270 | % | | | 9,800,000 | | | | 9,800,000 | | |
| Total | | | | | | | | | | | 24,995,000 | | |
| Florida 0.9% | |
Miami-Dade County Industrial
Development Authority
Refunding Revenue Bonds
Florida Power & Light Co.
VRDN Series 1993(b)(f) | |
| 06/01/21 | | | 0.180 | % | | | 10,000,000 | | | | 10,000,000 | | |
University Athletic Association, Inc.
Revenue Bonds
Remk
VRDN Series 2001(b)(f) | |
| 10/01/31 | | | 0.230 | % | | | 10,000,000 | | | | 10,000,000 | | |
| Total | | | | | | | | | | | 20,000,000 | | |
| Indiana 0.5% | |
Indiana Development Finance Authority
Revenue Bonds
PSI Energy, Inc. Projects
VRDN Series 2003A AMT(a)(b)(f) | |
| 12/01/38 | | | 0.470 | % | | | 12,000,000 | | | | 12,000,000 | | |
| Mississippi 0.4% | |
Mississippi Business Finance Corp.
Revenue Bonds
Chevron USA Inc. Project
VRDN Series 2009A(b)(f) | |
| 12/01/30 | | | 0.190 | % | | | 8,000,000 | | | | 8,000,000 | | |
| New York 0.4% | |
New York State Dormitory Authority
Revenue Bonds
Culinary Institute American
VRDN Series 2006(b)(f) | |
| 07/01/36 | | | 0.230 | % | | | 8,175,000 | | | | 8,175,000 | | |
The Accompanying Notes to Financial Statements are an integral part of this statement.
18
Columbia Short Term Municipal Bond Fund
April 30, 2012
(Percentages represent value of investments compared to net assets)
Issue
Description | | Effective
Yield | | Amount
Payable at
Maturity | | Value | |
| Floating Rate Notes (continued) | |
| Ohio 0.8% | |
Ohio Higher Educational Facility
Commission
Revenue Bonds
Pooled Program
VRDN Series 2006 (Fifth Third Bank)(b)(f) | |
| 09/01/36 | | | 0.400 | % | | $ | 17,075,000 | | | $ | 17,075,000 | | |
| Oregon 0.2% | |
State of Oregon
Unlimited General Obligation Bonds
Veterans Welfare
VRDN Series 2006(b) | |
| 06/01/41 | | | 0.190 | % | | | 4,940,000 | | | | 4,940,000 | | |
| South Dakota 0.3% | |
South Dakota Health & Educational
Facilities Authority
Revenue Bonds
Regional Health
VRDN Series 2008(b) | |
| 09/01/27 | | | 0.190 | % | | | 6,010,000 | | | | 6,010,000 | | |
| Virginia 0.3% | |
Albermarle County Economic
Development Authority
Revenue Bonds
Martha Jefferson Hospital
VRDN Series 2008D(b)(f) | |
| 10/01/48 | | | 0.150 | % | | | 6,000,000 | | | | 6,000,000 | | |
| Wisconsin 0.9% | |
Wisconsin Health & Educational
Facilities Authority(b)
Revenue Bonds
16th Street Community Health Center
VRDN Series 2006 (JP Morgan Chase Bank) | |
| 01/01/36 | | | 0.230 | % | | | 5,370,000 | | | | 5,370,000 | | |
Indian Community School of Milwaukee
VRDN Series 2006 (JP Morgan Chase Bank) | |
| 01/01/36 | | | 0.230 | % | | | 6,000,000 | | | | 6,000,000 | | |
Wisconsin Housing & Economic
Development Authority
Revenue Bonds
Non-Ace
VRDN Series 2012A(b)(f) | |
| 05/01/55 | | | 0.250 | % | | | 9,100,000 | | | | 9,100,000 | | |
| Total | | | | | | | | | | | 20,470,000 | | |
Total Floating Rate Notes
(Cost: $152,665,000) | | $ | 152,665,000 | | |
| | | | | Shares | | Value | |
| Money Market Funds 1.9% | |
JPMorgan Tax Free Money Market
Fund, 0.010%(g) | | | | | | | 42,398,489 | | | $ | 42,398,489 | | |
Total Money Market Funds
(Cost: $42,398,489) | | $ | 42,398,489 | | |
Issue
Description | | Coupon
Rate | | Principal
Amount | | Value | |
| Municipal Short Term 4.9% | |
| California 0.4% | |
Golden Empire Schools Financing Authority
Refunding Revenue Bonds
Kern High School District Projects
Series 2010 | |
| 05/01/12 | | | 4.000 | % | | $ | 10,000,000 | | | $ | 10,000,933 | | |
| Massachusetts 1.8% | |
City of Quincy
Limited General Obligation Notes
Series 2012 (BAN) | |
| 01/25/13 | | | 2.000 | % | | | 15,000,000 | | | | 15,189,450 | | |
Town of Holyoke
General Obligation Limited Notes
BANS Series 2011B | |
| 11/14/12 | | | 1.500 | % | | | 5,843,900 | | | | 5,875,691 | | |
Town of Winchester
BAN Series 2011 | |
| 07/06/12 | | | 2.000 | % | | | 10,000,000 | | | | 10,034,000 | | |
Wachusett Regional School District
Limited General Obligation Notes
RAN Series 2011 | |
| 06/29/12 | | | 2.000 | % | | | 9,000,000 | | | | 9,021,954 | | |
| Total | | | | | | | | | | | 40,121,095 | | |
| New Jersey 1.1% | |
City of Newark
Unlimited General Obligation Notes
TAN Series 2012A | |
| 02/20/13 | | | 2.400 | % | | | 3,500,000 | | | | 3,508,295 | | |
Hudson County Improvement Authority
Revenue Notes
Series 2011 | |
| 08/17/12 | | | 2.000 | % | | | 12,375,000 | | | | 12,425,861 | | |
State of New Jersey
Revenue Notes
Series 2011C | |
| 06/21/12 | | | 2.000 | % | | | 8,300,000 | | | | 8,321,439 | | |
| Total | | | | | | | | | | | 24,255,595 | | |
| New York 1.4% | |
County of Rockland
Limited General Obligation Notes
Series 2012 (TAN) | |
| 03/06/13 | | | 2.500 | % | | | 5,000,000 | | | | 5,034,750 | | |
County of Westchester
Revenue Notes
Series 2012 (RAN) | |
| 06/29/12 | | | 1.250 | % | | | 7,000,000 | | | | 7,002,548 | | |
Erie County Fiscal Stability Authority
Revenue Notes
BANS Series 2011A | |
| 07/31/12 | | | 1.500 | % | | | 8,000,000 | | | | 8,024,320 | | |
Hannibal Central School District
Unlimited General Obligation Notes
BAN Series 2011 | |
| 06/29/12 | | | 2.000 | % | | | 11,470,000 | | | | 11,498,543 | | |
| Total | | | | | | | | | | | 31,560,161 | | |
The Accompanying Notes to Financial Statements are an integral part of this statement.
19
Columbia Short Term Municipal Bond Fund
April 30, 2012
(Percentages represent value of investments compared to net assets)
Issue
Description | | Coupon
Rate | | Principal
Amount | | Value | |
| Municipal Short Term (continued) | |
| Ohio 0.2% | |
Cleveland Department of Public
Utilities Division of Water
Revenue Notes
Series 2011
Subordinated Lien | |
| 07/26/12 | | | 1.000 | % | | $ | 4,000,000 | | | $ | 4,005,960 | | |
Total Municipal Short Term
(Cost: $109,915,495) | | $ | 109,943,744 | | |
Total Investments
(Cost: $2,180,176,522) | | | | | | | | | | $ | 2,214,246,319 | | |
| Other Assets & Liabilities, Net | | | | | | | | | | | 15,342,998 | | |
| Total Net Assets | | $ | 2,229,589,317 | | |
| Notes to Portfolio of Investments | |
(a) At April 30, 2012, the value of securities subject to alternative minimum tax was $208,179,551, representing 9.34% of net assets.
(b) Variable rate security. The interest rate shown reflects the rate as of April 30, 2012.
(c) Zero coupon bond.
(d) Represents a security purchased on a when-issued or delayed delivery basis.
(e) Municipal obligations include debt obligations issued by or on behalf of territories, possessions, or sovereign nations within the territorial boundaries of the United States. At April 30, 2012, the value of these securities amounted to $4,199,590 or 0.19% of net assets.
(f) The Fund is entitled to receive principal and interest from the guarantor after a day or a week's notice or upon maturity. The maturity date disclosed represents the final maturity.
(g) The rate shown is the seven-day current annualized yield at April 30, 2012.
AGM Assured Guaranty Municipal Corporation
AMBAC Ambac Assurance Corporation
AMT Alternative Minimum Tax
BAN Bond Anticipation Note
CIFG IXIS Financial Guaranty
FGIC Financial Guaranty Insurance Company
FHLMC Federal Home Loan Mortgage Corporation
FNMA Federal National Mortgage Association
GNMA Government National Mortgage Association
NPFGC National Public Finance Guarantee Corporation
RAN Revenue Anticipation Note
TAN Tax Anticipation Note
TCRS Transferable Custodial Receipts
VRDN Variable Rate Demand Note
The Accompanying Notes to Financial Statements are an integral part of this statement.
20
Columbia Short Term Municipal Bond Fund
April 30, 2012
Generally accepted accounting principles (GAAP) require disclosure regarding the inputs and valuation techniques used to measure fair value and any changes in valuation inputs or techniques. In addition, investments shall be disclosed by major category.
The Fund categorizes its fair value measurements according to a three-level hierarchy that maximizes the use of observable inputs and minimizes the use of unobservable inputs by prioritizing that the most observable input be used when available. Observable inputs are those that market participants would use in pricing an investment based on market data obtained from sources independent of the reporting entity. Unobservable inputs are those that reflect the Fund's assumptions about the information market participants would use in pricing an investment. An investment's level within the fair value hierarchy is based on the lowest level of any input that is deemed significant to the asset or liability's fair value measurement. The input levels are not necessarily an indication of the risk or liquidity associated with investments at that level. For example, certain U.S. government securities are generally high quality and liquid, however, they are reflected as Level 2 because the inputs used to determine fair value may not always be quoted prices in an active market.
Fair value inputs are summarized in the three broad levels listed below:
• Level 1 — Valuations based on quoted prices for investments in active markets that the Fund has the ability to access at the measurement date (including NAV for open-end mutual funds). Valuation adjustments are not applied to Level 1 investments.
• Level 2 — Valuations based on other significant observable inputs (including quoted prices for similar securities, interest rates, prepayment speeds, credit risks, etc.).
• Level 3 — Valuations based on significant unobservable inputs (including the Fund's own assumptions and judgment in determining the fair value of investments).
Inputs that are used in determining fair value of an investment may include price information, credit data, volatility statistics, and other factors. These inputs can be either observable or unobservable. The availability of observable inputs can vary between investments, and is affected by various factors such as the type of investment, and the volume and level of activity for that investment or similar investments in the marketplace. The inputs will be considered by the Investment Manager, along with any other relevant factors in the calculation of an investment's fair value. The Fund uses prices and inputs that are current as of the measurement date, which may include periods of market dislocations. During these periods, the availability of prices and inputs may be reduced for many investments. This condition could cause an investment to be reclassified between the various levels within the hierarchy.
Investments falling into the Level 3 category are primarily supported by quoted prices from brokers and dealers participating in the market for those investments. However, these may be classified as Level 3 investments due to lack of market transparency and corroboration to support these quoted prices. Additionally, valuation models may be used as the pricing source for any remaining investments classified as Level 3. These models rely on one or more significant unobservable inputs and/or significant assumptions by the Investment Manager. Inputs used in valuations may include, but are not limited to, financial statement analysis, capital account balances, discount rates and estimated cash flows, and comparable company data.
Under the direction of the Fund's Board of Trustees (the Board), the Investment Manager's Valuation Committee (the Committee) is responsible for carrying out the valuation procedures approved by the Board. The Committee consists of voting and non-voting members from various groups within the Investment Manager's organization, including operations and accounting, trading and investments, compliance, risk management and legal.
The Committee meets at least monthly to review and approve valuation matters, which may include a description of specific valuation determinations, data regarding pricing information received from approved pricing vendors and brokers and the results of Board-approved valuation control policies and procedures (the Policies). The Policies address, among other things, instances when market quotations are readily available, including recommendation of third party pricing vendors and a determination of appropriate pricing methodologies; events that require specific valuation determinations and assessment of fair value techniques; securities with a potential for stale pricing, including those that are illiquid, restricted, or in default; and the effectiveness of third-party pricing vendors, including periodic reviews of vendors. The Committee meets more frequently, as needed, to discuss additional valuation matters, which may include the need to review back-testing results, review time-sensitive information or approve related valuation actions. The Committee reports to the Board, with members of the Committee meeting with the Board at each of its regularly scheduled meetings to discuss valuation matters and actions during the period, similar to those described earlier.
For investments categorized as Level 3, the Committee monitors information similar to that described above, which may include: (i) data specific to the issuer or comparable issuers, (ii) general market or specific sector news and (iii) quoted prices and specific or similar security transactions. The Committee considers this data and any changes from prior periods in order to assess the reasonableness of observable and unobservable inputs, any assumptions or internal models used to value those securities and changes in fair value. This data is also used to corroborate, when available, information received from approved pricing vendors and brokers. Various factors impact the frequency of monitoring this information (which may occur as often as daily). However, the Committee may determine that changes to inputs, assumptions and models are not required as a result of the monitoring procedures performed.
The Accompanying Notes to Financial Statements are an integral part of this statement.
21
Columbia Short Term Municipal Bond Fund
April 30, 2012
| Fair Value Measurements (continued) | |
The following table is a summary of the inputs used to value the Fund's investments as of April 30, 2012:
| | | Fair Value at April 30, 2012 | |
| Description | | Level 1
Quoted Prices
in Active
Markets for
Identical Assets | | Level 2
Other
Significant
Observable
Inputs | | Level 3
Significant
Unobservable
Inputs | | Total | |
| Bonds | |
| Municipal Bonds | | $ | — | | | $ | 1,909,239,086 | | | $ | — | | | $ | 1,909,239,086 | | |
| Total Bonds | | | — | | | | 1,909,239,086 | | | | — | | | | 1,909,239,086 | | |
| Short-Term Securities | |
| Floating Rate Notes | | | — | | | | 152,665,000 | | | | — | | | | 152,665,000 | | |
| Municipal Short Term | | | — | | | | 109,943,744 | | | | — | | | | 109,943,744 | | |
| Total Short-Term Securities | | | — | | | | 262,608,744 | | | | — | | | | 262,608,744 | | |
| Other | |
| Money Market Funds | | | 42,398,489 | | | | — | | | | — | | | | 42,398,489 | | |
| Total Other | | | 42,398,489 | | | | — | | | | — | | | | 42,398,489 | | |
| Total | | $ | 42,398,489 | | | $ | 2,171,847,830 | | | $ | — | | | $ | 2,214,246,319 | | |
See the Portfolio of Investments for all investment classifications not indicated in the table.
The Fund's assets assigned to the Level 2 input category are generally valued using the market approach, in which a security's value is determined through reference to prices and information from market transactions for similar or identical assets.
There were no transfers of financial assets between Levels 1 and 2 during the period from April 1, 2012 to April 30, 2012.
The following table is a summary of the inputs used to value the Fund's investments as of March 31, 2012:
| | | Fair Value at March 31, 2012 | |
| Description | | Level 1
Quoted Prices
in Active
Markets for
Identical Assets | | Level 2
Other
Significant
Observable
Inputs | | Level 3
Significant
Unobservable
Inputs | | Total | |
| Bonds | |
| Municipal Bonds | | $ | — | | | $ | 1,934,082,006 | | | $ | — | | | $ | 1,934,082,006 | | |
| Total Bonds | | | — | | | | 1,934,082,006 | | | | — | | | | 1,934,082,006 | | |
| Short-Term Securities | |
| Floating Rate Notes | | | — | | | | 145,715,000 | | | | — | | | | 145,715,000 | | |
| Municipal Short Term | | | — | | | | 129,622,620 | | | | — | | | | 129,622,620 | | |
| Tax Exempt Commercial Paper | | | — | | | | 27,721,000 | | | | — | | | | 27,721,000 | | |
| Total Short-Term Securities | | | — | | | | 303,058,620 | | | | — | | | | 303,058,620 | | |
| Other | |
| Money Market Funds | | | 87,201,167 | | | | — | | | | — | | | | 87,201,167 | | |
| Total Other | | | 87,201,167 | | | | — | | | | — | | | | 87,201,167 | | |
| Total | | $ | 87,201,167 | | | $ | 2,237,140,626 | | | $ | — | | | $ | 2,324,341,793 | | |
The Fund's assets assigned to the Level 2 input category are generally valued using the market approach, in which a security's value is determined through reference to prices and information from market transactions for similar or identical assets.
There were no transfers of financial assets between Levels 1 and 2 during the period from April 1, 2011 to March 31, 2012.
The Accompanying Notes to Financial Statements are an integral part of this statement.
22
Statement of Assets and Liabilities – Columbia Short Term Municipal Bond Fund
| | | April 30,
2012 | | March 31,
2012 | |
| Assets | |
| Investments, at value | |
| (identified cost $2,180,176,522 and $2,292,510,470) | | $ | 2,214,246,319 | | | $ | 2,324,341,793 | | |
| Receivable for: | |
| Investments sold | | | 210,125 | | | | 5,649,778 | | |
| Capital shares sold | | | 2,229,837 | | | | 2,670,018 | | |
| Interest | | | 24,384,037 | | | | 22,171,988 | | |
| Expense reimbursement due from Investment Manager | | | 36,574 | | | | 8,695 | | |
| Prepaid expense | | | 4,562 | | | | 8,589 | | |
| Total assets | | | 2,241,111,454 | | | | 2,354,850,861 | | |
| Liabilities | |
| Payable for: | |
| Investments purchased on a delayed delivery basis | | | 5,302,805 | | | | 59,761,315 | | |
| Capital shares purchased | | | 3,196,121 | �� | | | 1,680,017 | | |
| Dividend distributions to shareholders | | | 2,458,462 | | | | 2,751,284 | | |
| Investment management fees | | | 65,051 | | | | 22,329 | | |
| Distribution and service fees | | | 7,019 | | | | 2,386 | | |
| Transfer agent fees | | | 327,282 | | | | 316,890 | | |
| Administration fees | | | 11,556 | | | | 3,963 | | |
| Compensation of board members | | | 80,568 | | | | 79,279 | | |
| Other expenses | | | 73,273 | | | | 99,694 | | |
| Total liabilities | | | 11,522,137 | | | | 64,717,157 | | |
| Net assets applicable to outstanding capital stock | | $ | 2,229,589,317 | | | $ | 2,290,133,704 | | |
The Accompanying Notes to Financial Statements are an integral part of this statement.
23
Statement of Assets and Liabilities (continued) – Columbia Short Term Municipal Bond Fund
| | | April 30,
2012 | | March 31,
2012 | |
| Represented by | |
| Paid-in capital | | $ | 2,204,013,393 | | | $ | 2,269,136,634 | | |
| Undistributed net investment income | | | 2,260,575 | | | | 2,079,010 | | |
| Accumulated net realized loss | | | (10,754,448 | ) | | | (12,913,263 | ) | |
| Unrealized appreciation (depreciation) on: | |
| Investments | | | 34,069,797 | | | | 31,831,323 | | |
| Total — representing net assets applicable to outstanding capital stock | | $ | 2,229,589,317 | | | $ | 2,290,133,704 | | |
| Net assets applicable to outstanding shares | |
| Class A | | $ | 209,557,003 | | | $ | 216,298,388 | | |
| Class B | | $ | 243,193 | | | $ | 242,876 | | |
| Class C | | $ | 32,952,740 | | | $ | 33,175,930 | | |
| Class Z | | $ | 1,986,836,381 | | | $ | 2,040,416,510 | | |
| Shares outstanding | |
| Class A | | | 19,863,796 | | | | 20,524,094 | | |
| Class B | | | 23,050 | | | | 23,044 | | |
| Class C | | | 3,123,123 | | | | 3,147,507 | | |
| Class Z | | | 188,311,068 | | | | 193,592,955 | | |
| Net asset value per share | |
| Class A(a) | | $ | 10.55 | | | $ | 10.54 | | |
| Class B | | $ | 10.55 | | | $ | 10.54 | | |
| Class C | | $ | 10.55 | | | $ | 10.54 | | |
| Class Z | | $ | 10.55 | | | $ | 10.54 | | |
(a) At April 30, 2012 and March 31, 2012, the maximum offering price per share for Class A is $10.66 and $10.65, respectively. The offering price is calculated by dividing the net asset value by 1.0 minus the maximum sales charge of 1.00%.
The Accompanying Notes to Financial Statements are an integral part of this statement.
24
Statement of Operations – Columbia Short Term Municipal Bond Fund
| Year ended | | April 30,
2012(a) | | March 31,
2012 | |
| Net investment income | |
| Income: | |
| Dividends | | $ | 1,063 | | | $ | 19,500 | | |
| Interest | | | 3,619,607 | | | | 46,562,266 | | |
| Total income | | | 3,620,670 | | | | 46,581,766 | | |
| Expenses: | |
| Investment management fees | | | 686,394 | | | | 6,944,073 | | |
| Distribution fees | |
| Class B | | | 154 | | | | 1,960 | | |
| Class C | | | 20,980 | | | | 272,908 | | |
| Service fees | |
| Class B | | | 51 | | | | 654 | | |
| Class C | | | 6,993 | | | | 90,969 | | |
| Distribution and service fees — Class A | | | 45,085 | | | | 611,151 | | |
| Transfer agent fees | |
| Class A | | | 35,614 | | | | 501,587 | | |
| Class B | | | 41 | | | | 490 | | |
| Class C | | | 5,532 | | | | 70,411 | | |
| Class Z | | | 338,471 | | | | 3,326,536 | | |
| Administration fees | | | 121,842 | | | | 1,717,276 | | |
| Compensation of board members | | | 3,619 | | | | 54,431 | | |
| Pricing and bookkeeping fees | | | — | | | | 29,401 | | |
| Custodian fees | | | 1,291 | | | | 25,059 | | |
| Printing and postage fees | | | — | | | | 83,265 | | |
| Registration fees | | | 14,000 | | | | 123,123 | | |
| Professional fees | | | 8,955 | | | | 60,124 | | |
| Other | | | 6,254 | | | | 80,546 | | |
| Total expenses | | | 1,295,276 | | | | 13,993,964 | | |
Fees waived or expenses reimbursed by
Investment Manager and its affiliates | | | (314,801 | ) | | | (3,133,665 | ) | |
| Expense reductions | | | — | | | | (134 | ) | |
| Total net expenses | | | 980,475 | | | | 10,860,165 | | |
| Net investment income | | | 2,640,195 | | | | 35,721,601 | | |
| Realized and unrealized gain (loss) — net | |
| Net realized gain (loss) on: | |
| Investments | | | (11,682 | ) | | | (1,801,444 | ) | |
| Net realized loss | | | (11,682 | ) | | | (1,801,444 | ) | |
| Net change in unrealized appreciation (depreciation) on: | |
| Investments | | | 2,238,474 | | | | 11,922,226 | | |
| Net change in unrealized appreciation | | | 2,238,474 | | | | 11,922,226 | | |
| Net realized and unrealized gain | | | 2,226,792 | | | | 10,120,782 | | |
| Net increase in net assets resulting from operations | | $ | 4,866,987 | | | $ | 45,842,383 | | |
(a) For the period from April 1, 2012 to April 30, 2012. During the period, the Fund's fiscal year end was changed from March 31 to April 30.
The Accompanying Notes to Financial Statements are an integral part of this statement.
25
Statement of Changes in Net Assets – Columbia Short Term Municipal Bond Fund
| Year ended | | April 30,
2012(a) | | March 31,
2012 | | March 31,
2011 | |
| Operations | |
| Net investment income | | $ | 2,640,195 | | | $ | 35,721,601 | | | $ | 39,456,956 | | |
| Net realized loss | | | (11,682 | ) | | | (1,801,444 | ) | | | (876,253 | ) | |
Net change in unrealized
appreciation (depreciation) | | | 2,238,474 | | | | 11,922,226 | | | | (15,352,790 | ) | |
Net increase in
net assets resulting from operations | | | 4,866,987 | | | | 45,842,383 | | | | 23,227,913 | | |
| Distributions to shareholders from: | |
| Net investment income | |
| Class A | | | (194,430 | ) | | | (3,524,028 | ) | | | (5,845,572 | ) | |
| Class B | | | (72 | ) | | | (1,810 | ) | | | (2,562 | ) | |
| Class C | | | (9,812 | ) | | | (250,567 | ) | | | (383,703 | ) | |
| Class Z | | | (2,254,316 | ) | | | (29,939,616 | ) | | | (33,225,119 | ) | |
| Total distributions to shareholders | | | (2,458,630 | ) | | | (33,716,021 | ) | | | (39,456,956 | ) | |
Increase (decrease) in net
assets from share transactions | | | (62,952,744 | ) | | | 252,510,236 | | | | (523,375,361 | ) | |
Total increase (decrease)
in net assets | | | (60,544,387 | ) | | | 264,636,598 | | | | (539,604,404 | ) | |
| Net assets at beginning of year | | | 2,290,133,704 | | | | 2,025,497,106 | | | | 2,565,101,510 | | |
| Net assets at end of year | | $ | 2,229,589,317 | | | $ | 2,290,133,704 | | | $ | 2,025,497,106 | | |
Undistributed net
investment income | | $ | 2,260,575 | | | $ | 2,079,010 | | | $ | 73,430 | | |
(a) For the period from April 1, 2012 to April 30, 2012. During the period, the Fund's fiscal year end was changed from March 31 to April 30.
The Accompanying Notes to Financial Statements are an integral part of this statement.
26
Statement of Changes in Net Assets (continued) – Columbia Short Term Municipal Bond Fund
| Year ended | | April 30, 2012(a) | | March 31, 2012 | | March 31, 2011 | |
| | | Shares | | Dollars ($) | | Shares | | Dollars ($) | | Shares | | Dollars ($) | |
| Capital stock activity | |
| Class A shares | |
| Subscriptions(b) | | | 269,278 | | | | 2,840,093 | | | | 8,925,474 | | | | 93,980,005 | | | | 12,279,571 | | | | 129,517,642 | | |
| Distributions reinvested | | | 10,937 | | | | 115,383 | | | | 174,619 | | | | 1,838,867 | | | | 313,484 | | | | 3,303,797 | | |
| Redemptions | | | (940,513 | ) | | | (9,920,995 | ) | | | (15,409,435 | ) | | | (162,226,110 | ) | | | (31,778,107 | ) | | | (334,757,283 | ) | |
| Net decrease | | | (660,298 | ) | | | (6,965,519 | ) | | | (6,309,342 | ) | | | (66,407,238 | ) | | | (19,185,052 | ) | | | (201,935,844 | ) | |
| Class B shares | |
| Subscriptions | | | 5 | | | | 47 | | | | 132 | | | | 1,382 | | | | 771 | | | | 8,128 | | |
| Distributions reinvested | | | 2 | | | | 23 | | | | 33 | | | | 351 | | | | 115 | | | | 1,216 | | |
| Redemptions(b) | | | (1 | ) | | | (4 | ) | | | (8,166 | ) | | | (85,778 | ) | | | (1,233 | ) | | | (12,926 | ) | |
| Net increase (decrease) | | | 6 | | | | 66 | | | | (8,001 | ) | | | (84,045 | ) | | | (347 | ) | | | (3,582 | ) | |
| Class C shares | |
| Subscriptions | | | 20,684 | | | | 218,200 | | | | 1,095,839 | | | | 11,547,931 | | | | 855,755 | | | | 9,024,645 | | |
| Distributions reinvested | | | 454 | | | | 4,785 | | | | 10,084 | | | | 106,197 | | | | 15,439 | | | | 162,652 | | |
| Redemptions | | | (45,522 | ) | | | (480,184 | ) | | | (1,835,168 | ) | | | (19,319,495 | ) | | | (2,542,799 | ) | | | (26,774,517 | ) | |
| Net decrease | | | (24,384 | ) | | | (257,199 | ) | | | (729,245 | ) | | | (7,665,367 | ) | | | (1,671,605 | ) | | | (17,587,220 | ) | |
| Class Z shares | |
| Subscriptions | | | 5,696,721 | | | | 60,083,242 | | | | 93,088,122 | | | | 981,100,039 | | | | 75,831,499 | | | | 799,144,349 | | |
| Distributions reinvested | | | 19,188 | | | | 202,439 | | | | 251,888 | | | | 2,652,894 | | | | 310,136 | | | | 3,266,953 | | |
| Redemptions | | | (10,997,796 | ) | | | (116,015,773 | ) | | | (62,405,797 | ) | | | (657,086,047 | ) | | | (105,049,996 | ) | | | (1,106,260,017 | ) | |
| Net increase (decrease) | | | (5,281,887 | ) | | | (55,730,092 | ) | | | 30,934,213 | | | | 326,666,886 | | | | (28,908,361 | ) | | | (303,848,715 | ) | |
| Total net increase (decrease) | | | (5,966,563 | ) | | | (62,952,744 | ) | | | 23,887,625 | | | | 252,510,236 | | | | (49,765,365 | ) | | | (523,375,361 | ) | |
(a) For the period from April 1, 2012 to April 30, 2012. During the period, the Fund's fiscal year end was changed from March 31 to April 30.
(b) Includes conversions of Class B shares to Class A shares, if any.
The Accompanying Notes to Financial Statements are an integral part of this statement.
27
Financial Highlights – Columbia Short Term Municipal Bond Fund
The following tables are intended to help you understand the Fund's financial performance. Certain information reflects financial results for a single share of a class held for the periods shown. Per share net investment income (loss) amounts are calculated based on average shares outstanding during the period. Total returns assume reinvestment of all dividends and distributions. Total returns do not reflect payments of sales charges, if any, and are not annualized for periods of less than one year.
| | | Year ended
April 30, | | Year ended March 31, | |
| | | 2012(a) | | 2012 | | 2011 | | 2010 | | 2009 | | 2008 | |
| Class A | |
| Per share data | |
| Net asset value, beginning of period | | $ | 10.54 | | | $ | 10.47 | | | $ | 10.55 | | | $ | 10.46 | | | $ | 10.32 | | | $ | 10.17 | | |
| Income from investment operations: | |
| Net investment income | | | 0.01 | | | | 0.16 | | | | 0.16 | | | | 0.17 | | | | 0.27 | | | | 0.32 | | |
| Net realized and unrealized gain (loss) | | | 0.01 | | | | 0.06 | | | | (0.08 | ) | | | 0.09 | | | | 0.15 | | | | 0.15 | | |
| Total from investment operations | | | 0.02 | | | | 0.22 | | | | 0.08 | | | | 0.26 | | | | 0.42 | | | | 0.47 | | |
| Less distributions to shareholders from: | |
| Net investment income | | | (0.01 | ) | | | (0.15 | ) | | | (0.16 | ) | | | (0.17 | ) | | | (0.28 | ) | | | (0.32 | ) | |
| Total distributions to shareholders | | | (0.01 | ) | | | (0.15 | ) | | | (0.16 | ) | | | (0.17 | ) | | | (0.28 | ) | | | (0.32 | ) | |
| Proceeds from regulatory settlement | | | — | | | | — | | | | — | | | | 0.00 | (b) | | | — | | | | — | | |
| Net asset value, end of period | | $ | 10.55 | | | $ | 10.54 | | | $ | 10.47 | | | $ | 10.55 | | | $ | 10.46 | | | $ | 10.32 | | |
| Total return | | | 0.19 | % | | | 2.12 | % | | | 0.75 | % | | | 2.53 | % | | | 4.14 | % | | | 4.66 | % | |
| Ratios to average net assets(c) | |
Expenses prior to fees waived or expenses reimbursed
(including interest expense) | | | 0.88 | %(d) | | | 0.90 | % | | | 0.78 | %(e) | | | 0.73 | %(e) | | | 0.72 | %(e) | | | 0.76 | %(e) | |
Net expenses after fees waived or expenses reimbursed
(including interest expense)(f) | | | 0.72 | %(d) | | | 0.73 | %(g) | | | 0.75 | %(e)(g) | | | 0.72 | %(e)(g) | | | 0.65 | %(e)(g) | | | 0.65 | %(e)(g) | |
Expenses prior to fees waived or expenses reimbursed
(excluding interest expense) | | | 0.88 | %(d) | | | 0.90 | % | | | 0.78 | % | | | 0.73 | % | | | 0.72 | % | | | 0.76 | % | |
Net expenses after fees waived or expenses reimbursed
(excluding interest expense)(f) | | | 0.72 | %(d) | | | 0.73 | %(g) | | | 0.75 | %(g) | | | 0.72 | %(g) | | | 0.65 | %(g) | | | 0.65 | %(g) | |
| Net investment income | | | 1.17 | %(d) | | | 1.54 | %(g) | | | 1.50 | %(g) | | | 1.57 | %(g) | | | 2.60 | %(g) | | | 3.09 | %(g) | |
| Supplemental data | |
| Net assets, end of period (in thousands) | | $ | 209,557 | | | $ | 216,298 | | | $ | 281,009 | | | $ | 485,404 | | | $ | 209,539 | | | $ | 31,952 | | |
| Portfolio turnover | | | 2 | % | | | 39 | % | | | 38 | % | | | 62 | % | | | 94 | % | | | 73 | % | |
| Notes to Financial Highlights | |
(a) For the period from April 1, 2012 to April 30, 2012. During the period, the Fund's fiscal year end was changed from March 31 to April 30.
(b) Rounds to less than $0.01.
(c) In addition to the fees and expenses which the Fund bears directly, the Fund indirectly bears a pro rata share of the fees and expenses of the acquired funds in which it invests. Such indirect expenses are not included in the reported expense ratios.
(d) Annualized.
(e) Includes interest expense which rounds to less than 0.01%.
(f) The Investment Manager and certain of its affiliates agreed to waive/reimburse certain fees and expenses, if applicable.
(g) The benefits derived from expense reductions had an impact of less than 0.01%.
The Accompanying Notes to Financial Statements are an integral part of this statement.
28
Financial Highlights (continued) – Columbia Short Term Municipal Bond Fund
| | | Year ended
April 30, | | Year ended March 31, | |
| | | 2012(a) | | 2012 | | 2011 | | 2010 | | 2009 | | 2008 | |
| Class B | |
| Per share data | |
| Net asset value, beginning of period | | $ | 10.54 | | | $ | 10.47 | | | $ | 10.55 | | | $ | 10.46 | | | $ | 10.32 | | | $ | 10.17 | | |
| Income from investment operations: | |
| Net investment income | | | 0.00 | (b) | | | 0.08 | | | | 0.08 | | | | 0.10 | | | | 0.20 | | | | 0.24 | | |
| Net realized and unrealized gain (loss) | | | 0.01 | | | | 0.06 | | | | (0.08 | ) | | | 0.08 | | | | 0.14 | | | | 0.15 | | |
| Total from investment operations | | | 0.01 | | | | 0.14 | | | | — | | | | 0.18 | | | | 0.34 | | | | 0.39 | | |
| Less distributions to shareholders from: | |
| Net investment income | | | (0.00 | )(b) | | | (0.07 | ) | | | (0.08 | ) | | | (0.09 | ) | | | (0.20 | ) | | | (0.24 | ) | |
| Total distributions to shareholders | | | (0.00 | )(b) | | | (0.07 | ) | | | (0.08 | ) | | | (0.09 | ) | | | (0.20 | ) | | | (0.24 | ) | |
| Proceeds from regulatory settlement | | | — | | | | — | | | | — | | | | 0.00 | (b) | | | — | | | | — | | |
| Net asset value, end of period | | $ | 10.55 | | | $ | 10.54 | | | $ | 10.47 | | | $ | 10.55 | | | $ | 10.46 | | | $ | 10.32 | | |
| Total return | | | 0.12 | % | | | 1.35 | % | | | 0.00 | %(c) | | | 1.77 | % | | | 3.37 | % | | | 3.88 | % | |
| Ratios to average net assets(d) | |
Expenses prior to fees waived or expenses reimbursed
(including interest expense) | | | 1.63 | %(e) | | | 1.63 | % | | | 1.53 | %(f) | | | 1.48 | %(f) | | | 1.47 | %(f) | | | 1.51 | %(f) | |
Net expenses after fees waived or expenses reimbursed
(including interest expense)(g) | | | 1.47 | %(e) | | | 1.48 | %(h) | | | 1.50 | %(f)(h) | | | 1.47 | %(f)(h) | | | 1.40 | %(f)(h) | | | 1.40 | %(f)(h) | |
Expenses prior to fees waived or expenses reimbursed
(excluding interest expense) | | | 1.63 | %(e) | | | 1.63 | % | | | 1.53 | % | | | 1.48 | % | | | 1.47 | % | | | 1.51 | % | |
Net expenses after fees waived or expenses reimbursed
(excluding interest expense)(g) | | | 1.47 | %(e) | | | 1.48 | %(h) | | | 1.50 | %(h) | | | 1.47 | %(h) | | | 1.40 | %(h) | | | 1.40 | %(h) | |
| Net investment income | | | 0.41 | %(e) | | | 0.79 | %(h) | | | 0.76 | %(h) | | | 0.91 | %(h) | | | 1.98 | %(h) | | | 2.35 | %(h) | |
| Supplemental data | |
| Net assets, end of period (in thousands) | | $ | 243 | | | $ | 243 | | | $ | 325 | | | $ | 331 | | | $ | 458 | | | $ | 615 | | |
| Portfolio turnover | | | 2 | % | | | 39 | % | | | 38 | % | | | 62 | % | | | 94 | % | | | 73 | % | |
| Notes to Financial Highlights | |
(a) For the period from April 1, 2012 to April 30, 2012. During the period, the Fund's fiscal year end was changed from March 31 to April 30.
(b) Rounds to less than $0.01.
(c) Rounds to less than 0.01%.
(d) In addition to the fees and expenses which the Fund bears directly, the Fund indirectly bears a pro rata share of the fees and expenses of the acquired funds in which it invests. Such indirect expenses are not included in the reported expense ratios.
(e) Annualized.
(f) Includes interest expense which rounds to less than 0.01%.
(g) The Investment Manager and certain of its affiliates agreed to waive/reimburse certain fees and expenses, if applicable.
(h) The benefits derived from expense reductions had an impact of less than 0.01%.
The Accompanying Notes to Financial Statements are an integral part of this statement.
29
Financial Highlights (continued) – Columbia Short Term Municipal Bond Fund
| | | Year ended
April 30, | | Year ended March 31, | |
| | | 2012(a) | | 2012 | | 2011 | | 2010 | | 2009 | | 2008 | |
| Class C | |
| Per share data | |
| Net asset value, beginning of period | | $ | 10.54 | | | $ | 10.47 | | | $ | 10.55 | | | $ | 10.46 | | | $ | 10.32 | | | $ | 10.17 | | |
| Income from investment operations: | |
| Net investment income | | | 0.00 | (b) | | | 0.08 | | | | 0.08 | | | | 0.09 | | | | 0.20 | | | | 0.24 | | |
| Net realized and unrealized gain (loss) | | | 0.01 | | | | 0.06 | | | | (0.08 | ) | | | 0.09 | | | | 0.14 | | | | 0.15 | | |
| Total from investment operations | | | 0.01 | | | | 0.14 | | | | — | | | | 0.18 | | | | 0.34 | | | | 0.39 | | |
| Less distributions to shareholders from: | |
| Net investment income | | | (0.00 | )(b) | | | (0.07 | ) | | | (0.08 | ) | | | (0.09 | ) | | | (0.20 | ) | | | (0.24 | ) | |
| Total distributions to shareholders | | | (0.00 | )(b) | | | (0.07 | ) | | | (0.08 | ) | | | (0.09 | ) | | | (0.20 | ) | | | (0.24 | ) | |
| Proceeds from regulatory settlement | | | — | | | | — | | | | — | | | | 0.00 | (b) | | | — | | | | — | | |
| Net asset value, end of period | | $ | 10.55 | | | $ | 10.54 | | | $ | 10.47 | | | $ | 10.55 | | | $ | 10.46 | | | $ | 10.32 | | |
| Total return | | | 0.12 | % | | | 1.35 | % | | | 0.00 | %(c) | | | 1.76 | % | | | 3.37 | % | | | 3.88 | % | |
| Ratios to average net assets(d) | |
Expenses prior to fees waived or expenses reimbursed
(including interest expense) | | | 1.63 | %(e) | | | 1.64 | % | | | 1.53 | %(f) | | | 1.48 | %(f) | | | 1.47 | %(f) | | | 1.51 | %(f) | |
Net expenses after fees waived or expenses reimbursed
(including interest expense)(g) | | | 1.47 | %(e) | | | 1.48 | %(h) | | | 1.50 | %(f)(h) | | | 1.47 | %(f)(h) | | | 1.40 | %(f)(h) | | | 1.40 | %(f)(h) | |
Expenses prior to fees waived or expenses reimbursed
(excluding interest expense) | | | 1.63 | %(e) | | | 1.64 | % | | | 1.53 | % | | | 1.48 | % | | | 1.47 | % | | | 1.51 | % | |
Net expenses after fees waived or expenses reimbursed
(excluding interest expense)(g) | | | 1.47 | %(e) | | | 1.48 | %(h) | | | 1.50 | %(h) | | | 1.47 | %(h) | | | 1.40 | %(h) | | | 1.40 | %(h) | |
| Net investment income | | | 0.42 | %(e) | | | 0.79 | %(h) | | | 0.75 | %(h) | | | 0.84 | %(h) | | | 1.92 | %(h) | | | 2.35 | %(h) | |
| Supplemental data | |
| Net assets, end of period (in thousands) | | $ | 32,953 | | | $ | 33,176 | | | $ | 40,603 | | | $ | 58,529 | | | $ | 32,750 | | | $ | 14,816 | | |
| Portfolio turnover | | | 2 | % | | | 39 | % | | | 38 | % | | | 62 | % | | | 94 | % | | | 73 | % | |
| Notes to Financial Highlights | |
(a) For the period from April 1, 2012 to April 30, 2012. During the period, the Fund's fiscal year end was changed from March 31 to April 30.
(b) Rounds to less than $0.01.
(c) Rounds to less than 0.01%.
(d) In addition to the fees and expenses which the Fund bears directly, the Fund indirectly bears a pro rata share of the fees and expenses of the acquired funds in which it invests. Such indirect expenses are not included in the reported expense ratios.
(e) Annualized.
(f) Includes interest expense which rounds to less than 0.01%.
(g) The Investment Manager and certain of its affiliates agreed to waive/reimburse certain fees and expenses, if applicable.
(h) The benefits derived from expense reductions had an impact of less than 0.01%.
The Accompanying Notes to Financial Statements are an integral part of this statement.
30
Financial Highlights (continued) – Columbia Short Term Municipal Bond Fund
| | | Year ended
April 30, | | Year ended March 31, | |
| | | 2012(a) | | 2012 | | 2011 | | 2010 | | 2009 | | 2008 | |
| Class Z | |
| Per share data | |
| Net asset value, beginning of period | | $ | 10.54 | | | $ | 10.47 | | | $ | 10.55 | | | $ | 10.46 | | | $ | 10.32 | | | $ | 10.17 | | |
| Income from investment operations: | |
| Net investment income | | | 0.01 | | | | 0.19 | | | | 0.18 | | | | 0.19 | | | | 0.30 | | | | 0.34 | | |
| Net realized and unrealized gain (loss) | | | 0.01 | | | | 0.06 | | | | (0.07 | ) | | | 0.10 | | | | 0.15 | | | | 0.15 | | |
| Total from investment operations | | | 0.02 | | | | 0.25 | | | | 0.11 | | | | 0.29 | | | | 0.45 | | | | 0.49 | | |
| Less distributions to shareholders from: | |
| Net investment income | | | (0.01 | ) | | | (0.18 | ) | | | (0.19 | ) | | | (0.20 | ) | | | (0.31 | ) | | | (0.34 | ) | |
| Total distributions to shareholders | | | (0.01 | ) | | | (0.18 | ) | | | (0.19 | ) | | | (0.20 | ) | | | (0.31 | ) | | | (0.34 | ) | |
| Proceeds from regulatory settlement | | | — | | | | — | | | | — | | | | 0.00 | (b) | | | — | | | | — | | |
| Net asset value, end of period | | $ | 10.55 | | | $ | 10.54 | | | $ | 10.47 | | | $ | 10.55 | | | $ | 10.46 | | | $ | 10.32 | | |
| Total return | | | 0.21 | % | | | 2.37 | % | | | 1.00 | % | | | 2.79 | % | | | 4.41 | % | | | 4.92 | % | |
| Ratios to average net assets(c) | |
Expenses prior to fees waived or expenses reimbursed
(including interest expense) | | | 0.63 | %(d) | | | 0.63 | % | | | 0.53 | %(e) | | | 0.48 | %(e) | | | 0.47 | %(e) | | | 0.51 | %(e) | |
Net expenses after fees waived or expenses reimbursed
(including interest expense)(f) | | | 0.47 | %(d) | | | 0.48 | %(g) | | | 0.50 | %(e)(g) | | | 0.47 | %(e)(g) | | | 0.40 | %(e)(g) | | | 0.40 | %(e)(g) | |
Expenses prior to fees waived or expenses reimbursed
(excluding interest expense) | | | 0.63 | %(d) | | | 0.63 | % | | | 0.53 | % | | | 0.48 | % | | | 0.47 | % | | | 0.51 | % | |
Net expenses after fees waived or expenses reimbursed
(excluding interest expense)(f) | | | 0.47 | %(d) | | | 0.48 | %(g) | | | 0.50 | %(g) | | | 0.47 | %(g) | | | 0.40 | %(g) | | | 0.40 | %(g) | |
| Net investment income | | | 1.41 | %(d) | | | 1.77 | %(g) | | | 1.75 | %(g) | | | 1.83 | %(g) | | | 2.94 | %(g) | | | 3.34 | %(g) | |
| Supplemental data | |
| Net assets, end of period (in thousands) | | $ | 1,986,836 | | | $ | 2,040,417 | | | $ | 1,703,560 | | | $ | 2,020,837 | | | $ | 1,044,788 | | | $ | 519,786 | | |
| Portfolio turnover | | | 2 | % | | | 39 | % | | | 38 | % | | | 62 | % | | | 94 | % | | | 73 | % | |
| Notes to Financial Highlights | |
(a) For the period from April 1, 2012 to April 30, 2012. During the period, the Fund's fiscal year end was changed from March 31 to April 30.
(b) Rounds to less than $0.01.
(c) In addition to the fees and expenses which the Fund bears directly, the Fund indirectly bears a pro rata share of the fees and expenses of the acquired funds in which it invests. Such indirect expenses are not included in the reported expense ratios.
(d) Annualized.
(e) Includes interest expense which rounds to less than 0.01%.
(f) The Investment Manager and certain of its affiliates agreed to waive/reimburse certain fees and expenses, if applicable.
(g) The benefits derived from expense reductions had an impact of less than 0.01%.
The Accompanying Notes to Financial Statements are an integral part of this statement.
31
Notes to Financial Statements – Columbia Short Term Municipal Bond Fund
April 30, 2012
Note 1. Organization
Columbia Short Term Municipal Bond Fund (the Fund), a series of Columbia Funds Series Trust (the Trust), is a diversified fund. The Trust is registered under the Investment Company Act of 1940, as amended (the 1940 Act), as an open-end management investment company organized as a Delaware statutory trust.
Fiscal Year End Change
During the period, the Fund changed its fiscal year end from March 31 to April 30. Accordingly, this report includes activity for the period April 1, 2012 to April 30, 2012 and the year ended March 31, 2012.
Fund Shares
The Trust may issue an unlimited number of shares (without par value). The Fund offers Class A, Class B, Class C and Class Z shares. All share classes have identical voting, dividend and liquidation rights. Each share class has its own expense structure and sales charges, as applicable.
Class A shares are subject to a maximum front-end sales charge of 1.00% based on the initial investment amount. Class A shares purchased without an initial sales charge in accounts aggregating $1 million to $50 million at the time of purchase are subject to a contingent deferred sales charge (CDSC) if the shares are sold within 18 months of purchase, charged as follows: 1.00% CDSC if redeemed within 12 months of purchase, and 0.50% CDSC if redeemed more than 12, but less than 18, months after purchase.
Class B shares will generally convert to Class A shares eight years after purchase. The Fund no longer accepts investments by new or existing investors in the Fund's Class B shares, except in connection with the reinvestment of any dividend and/or capital gain distributions in Class B shares of the Fund and exchanges by existing Class B shareholders of certain other funds within the Columbia Family of Funds.
Class C shares are subject to a 1.00% CDSC on shares redeemed within one year of purchase.
Class Z shares are not subject to sales charges, and are only available to certain investors, as described in the Fund's prospectus.
Note 2. Summary of Significant Accounting Policies
Use of Estimates
The preparation of financial statements in accordance with U.S. generally accepted accounting principles (GAAP) requires management to make certain estimates and assumptions that affect the reported amounts of assets and liabilities, the disclosure of contingent assets and liabilities at the date of the financial statements and the reported amounts of revenue and expenses during the reporting period. Actual results could differ from those estimates.
The following is a summary of significant accounting policies consistently followed by the Fund in the preparation of its financial statements.
Security Valuation
Debt securities generally are valued by pricing services approved by the Board of Trustees (the Board) based upon market transactions for normal, institutional-size trading units of similar securities. The services may use various pricing techniques which take into account appropriate factors such as yield, quality, coupon rate, maturity, type of issue, trading characteristics and other data, as well as broker quotes. Debt securities for which quotations are readily available may also be valued based upon an over-the-counter or exchange bid quotation.
Investments in other open-end investment companies, including money market funds, are valued at net asset value.
Short-term securities purchased within 60 days to maturity are valued at amortized cost, which approximates market value. The value of short-term securities originally purchased with maturities greater than 60 days is determined based on an amortized value to par upon reaching 60 days to maturity. Short-term securities maturing in more than 60 days from the valuation date are valued at the market price or approximate market value based on current interest rates.
Investments for which market quotations are not readily available, or that have quotations which management believes are not reliable, are valued at fair value as determined in good faith under consistently applied procedures established by and under the general supervision of the Board. If a security or class of securities (such as foreign securities) is valued at fair
32
Columbia Short Term Municipal Bond Fund, April 30, 2012
value, such value is likely to be different from the last quoted market price for the security. The determination of fair value often requires significant judgment. To determine fair value, management may use assumptions including but not limited to future cash flows and estimated risk premiums. Multiple inputs from various sources may be used to determine value.
Delayed Delivery Securities
The Fund may trade securities on other than normal settlement terms, including securities purchased or sold on a "when-issued" basis. This may increase the risk if the other party to the transaction fails to deliver and causes the Fund to subsequently invest at less advantageous prices. The Fund designates cash or liquid securities in an amount equal to the delayed delivery commitment.
Security Transactions
Security transactions are accounted for on the trade date. Cost is determined and gains (losses) are based upon the specific identification method for both financial statement and federal income tax purposes.
Income Recognition
Interest income is recorded on the accrual basis. Market premium and discount are amortized and accreted, respectively, on all debt securities, unless otherwise noted. Original issue discount is accreted to interest income over the life of the security with a corresponding increase in the cost basis, if any. For convertible securities, premiums attributable to the conversion feature are not amortized.
Dividend income is recorded on the ex-dividend date.
Expenses
General expenses of the Trust are allocated to the Fund and other funds of the Trust based upon relative net assets or other expense allocation methodologies determined by the nature of the expense. Expenses directly attributable to the Fund are charged to the Fund. Expenses directly attributable to a specific class of shares are charged to that share class.
Determination of Class Net Asset Value
All income, expenses (other than class-specific expenses, which are charged to that share class, as shown in the Statement of Operations) and realized and unrealized gains (losses) are allocated to each class of the Fund on a daily basis for purposes of determining the net asset value of each class. Income and expenses are allocated to each class based on the settled shares method, while realized and unrealized gains (losses) are allocated based on the relative net assets of each class.
Federal Income Tax Status
The Fund intends to qualify each year as a regulated investment company under Subchapter M of the Internal Revenue Code, as amended, and will distribute substantially all of its tax exempt or taxable income (including net short-term capital gains), if any, for its tax year, and as such will not be subject to federal income taxes. In addition, the Fund intends to distribute in each calendar year substantially all of its net investment income, capital gains and certain other amounts, if any, such that the Fund should not be subject to federal excise tax. Therefore, no federal income or excise tax provision is recorded.
Distributions to Shareholders
Distributions from net investment income are declared daily and paid monthly. Net realized capital gains, if any, are distributed at least annually. Income distributions and capital gain distributions are determined in accordance with federal income tax regulations which may differ from GAAP.
Guarantees and Indemnifications
Under the Trust's organizational documents and, in some cases, by contract, its officers and trustees are indemnified against certain liabilities arising out of the performance of their duties to the Trust or its funds. In addition, certain of the Fund's contracts with its service providers contain general indemnification clauses. The Fund's maximum exposure under these arrangements is unknown since the amount of any future claims that may be made against the Fund cannot be determined, and the Fund has no historical basis for predicting the likelihood of any such claims.
Note 3. Fees and Compensation Paid to Affiliates
Investment Management Fees
Under an Investment Management Services Agreement (IMSA), Columbia Management Investment Advisers, LLC (the Investment Manager), a wholly-owned subsidiary of
33
Columbia Short Term Municipal Bond Fund, April 30, 2012
Ameriprise Financial, Inc. (Ameriprise Financial), determines which securities will be purchased, held or sold. Effective July 1, 2011, the management fee is an annual fee that is equal to a percentage of the Fund's average daily net assets that declines from 0.36% to 0.24% as the Fund's net assets increase. Prior to July 1, 2011, the management fee was equal to a percentage of the Fund's average daily net assets that declined from 0.30% to 0.25% as the Fund's net assets increased. For the period April 1, 2012 to April 30, 2012, the annualized effective management fee rate was 0.36% of the Fund's average daily net assets. For the year ended March 31, 2012, the effective management fee rate was 0.34% of the Fund's average daily net assets.
Administration Fees
Under an Administrative Services Agreement, the Investment Manager serves as the Fund Administrator. Effective July 1, 2011, the Fund pays the Fund Administrator an annual fee for administration and accounting services equal to a percentage of the Fund's average daily net assets that declines from 0.07% to 0.04% as the Fund's net assets increase. Prior to July 1, 2011, the administration fee was equal to the annual rate of 0.15% of the Fund's average daily net assets, less the fees that were payable by the Fund as described under the Pricing and Bookkeeping Fees note below. For the period April 1, 2012 to April 30, 2012, the annualized effective administration fee rate was 0.06% of the Fund's average daily net assets. For the year ended March 31, 2012, the effective administration fee rate was 0.08% of the Fund's average daily net assets.
Pricing and Bookkeeping Fees
Prior to May 16, 2011, the Fund had entered into a Financial Reporting Services Agreement (the Financial Reporting Services Agreement) with State Street Bank and Trust Company (State Street) and the Investment Manager pursuant to which State Street provided financial reporting services to the Fund. The Fund also entered into an Accounting Services Agreement (collectively with the Financial Reporting Services Agreement, the State Street Agreements) with State Street and the Investment Manager pursuant to which State Street provided accounting services to the Fund. Under the State Street Agreements, the Fund paid State Street an annual fee of $38,000 paid monthly plus an additional monthly fee based on an annualized percentage rate of average daily net assets of the Fund for the month. The aggregate fee did not exceed $140,000 per year (exclusive of out-of-pocket expenses and charges). The Fund also reimbursed State Street for certain out-of-pocket expenses and charges. Effective May 16, 2011, these services are provided under the Administrative Services Agreement discussed above.
Other Fees
Effective June 1, 2011, other expenses are for, among other things, certain expenses of the Fund or the Board, including: Fund boardroom and office expense, employee compensation, employee health and retirement benefits, and certain other expenses. Payment of these Fund and Board expenses is facilitated by a company providing limited administrative services to the Fund and the Board. For the period April 1, 2012 to April 30, 2012 and the period June 1, 2011 through March 31, 2012, other expenses paid to this company were $573 and $7,397, respectively.
Compensation of Board Members
Board members are compensated for their services to the Fund as disclosed in the Statement of Operations. Under a Deferred Compensation Plan (the Plan), the Board members who are not "interested persons" of the Fund, as defined under the 1940 Act, may elect to defer payment of up to 100% of their compensation. Deferred amounts are treated as though equivalent dollar amounts had been invested in shares of certain funds managed by the Investment Manager. The Fund's liability for these amounts is adjusted for market value changes and remains in the Fund until distributed in accordance with the Plan.
Compensation of Chief Compliance Officer
The Board has appointed a Chief Compliance Officer to the Fund in accordance with federal securities regulations. The Fund's expenses associated with the Chief Compliance Officer are paid directly by the Investment Manager.
Transfer Agent Fees
Under a Transfer and Dividend Disbursing Agent Agreement, Columbia Management Investment Services Corp. (the Transfer Agent), an affiliate of the Investment Manager and a wholly-owned subsidiary of Ameriprise Financial, is responsible for providing transfer agency services to the Fund. The Transfer Agent has contracted with Boston Financial Data Services (BFDS) to serve as sub-transfer agent.
34
Columbia Short Term Municipal Bond Fund, April 30, 2012
The Transfer Agent receives monthly account-based service fees based on the number of open accounts and is reimbursed by the Fund for the fees and expenses the Transfer Agent pays to financial intermediaries that maintain omnibus accounts with the Fund that is a percentage of the average aggregate value of the Fund's shares maintained in each such omnibus account (other than omnibus accounts for which American Enterprise Investment Services Inc. is the broker of record or accounts where the beneficial shareholder is a customer of Ameriprise Financial Services, Inc., which are paid a per account fee). The Transfer Agent pays the fees of BFDS for services as sub-transfer agent and is not entitled to reimbursement for such fees from the Fund (with the exception of out-of-pocket fees).
The Transfer Agent also receives compensation from fees for various shareholder services and reimbursements for certain out-of-pocket expenses.
For the period April 1, 2012 to April 30, 2012 and the year ended March 31, 2012, the Fund's annualized effective transfer agent fee rates as a percentage of average daily net assets of each class were as follows:
| | | Period ended
April 30,
2012 | | Year ended
March 31,
2012 | |
| Class A | | | 0.20 | % | | | 0.21 | % | |
| Class B | | | 0.20 | | | | 0.19 | | |
| Class C | | | 0.20 | | | | 0.19 | | |
| Class Z | | | 0.20 | | | | 0.19 | | |
An annual minimum account balance fee of $20 may apply to certain accounts with a value below the Fund's initial minimum investment requirements to reduce the impact of small accounts on transfer agent fees. These minimum account balance fees are recorded as part of expense reductions in the Statement of Operations. For the period April 1, 2012 to April 30, 2012, no minimum account balance fees were charged to accounts. For the year ended March 31, 2012, these minimum account balance fees reduced total expenses by $120.
Distribution and Service Fees
The Fund has an agreement with Columbia Management Investment Distributors, Inc. (the Distributor), an affiliate of the Investment Manager and a wholly-owned subsidiary of Ameriprise Financial, for distribution and shareholder services. Pursuant to Rule 12b-1 under the 1940 Act, the Board has approved, and the Fund has adopted, distribution and shareholder service plans (the Plans) which set the distribution and service fees for the Fund. These fees are calculated daily and are intended to compensate the Distributor and/or eligible selling and/or servicing agents for selling shares of the Fund and providing services to investors.
The Plans require the payment of a monthly combined distribution and service fee to the Distributor at the maximum annual rate of 0.25% of the average daily net assets attributable to Class A shares of the Fund. The Plans also require the payment of a monthly service fee at the maximum annual rate of 0.25% of the average daily net assets attributable to Class B and Class C shares of the Fund and the payment of a monthly distribution fee at the maximum annual rate of 0.75% of the average daily net assets attributable to Class B and Class C shares of the Fund.
Sales Charges
Sales charges, including front-end charges and CDSCs, received by the Distributor for distributing Fund shares were $3,565 for Class A and $210 for Class C shares for the period April 1, 2012 to April 30, 2012, and $41,230 for Class A and $3,560 for Class C for the year ended March 31, 2012.
Expenses Waived/Reimbursed by the Investment Manager and its Affiliates
Effective July 1, 2011, the Investment Manager and certain of its affiliates have contractually agreed to waive fees and/or reimburse expenses (excluding certain fees and expenses described below), through July 31, 2012, unless sooner terminated at the sole discretion of the Board, so that the Fund's net operating expenses, after giving effect to fees waived/expenses reimbursed and any balance credits and/or overdraft charges from the Fund's custodian, do not exceed
35
Columbia Short Term Municipal Bond Fund, April 30, 2012
the following annual rates as a percentage of the class' average daily net assets:
| Class A | | | 0.72 | % | |
| Class B | | | 1.47 | | |
| Class C | | | 1.47 | | |
| Class Z | | | 0.47 | | |
Under the agreement, the following fees and expenses are excluded from the waiver/reimbursement commitment, and therefore will be paid by the Fund, if applicable: taxes (including foreign transaction taxes), expenses associated with investments in affiliated and non-affiliated pooled investment vehicles (including mutual funds and exchange traded funds), transaction costs and brokerage commissions, costs related to any securities lending program, dividend expenses associated with securities sold short, inverse floater program fees and expenses, transaction charges and interest on borrowed money, interest, extraordinary expenses and any other expenses the exclusion of which is specifically approved by the Fund's Board. This agreement may be modified or amended only with approval from all parties.
Prior to July 1, 2011, the Investment Manager voluntarily agreed to reimburse a portion of the Fund's expenses (excluding certain expenses, such as distribution and services fees, brokerage commissions, interest, taxes and extraordinary expenses, but including custodian charges relating to overdrafts, if any) so that the Fund's ordinary net operating expenses, after giving effect to fees waived/expenses reimbursed and any balance credits and/or overdraft charges from the Fund's custodian, did not exceed 0.50% of the Fund's average daily net assets on an annualized basis.
Prior to May 1, 2011, the Investment Manager was entitled to recover from the Fund any fees waived and/or expenses reimbursed for a three year period following the date of such fee waiver and/or reimbursement under these arrangements if such recovery did not cause the Fund's expenses to exceed the expense limitations in effect at the time of recovery. Effective May 1, 2011, the Investment Manager has eliminated such fee recoupment provisions.
Note 4. Federal Tax Information
The timing and character of income and capital gain distributions are determined in accordance with income tax regulations, which may differ from GAAP because of temporary or permanent book to tax differences.
For the period April 1, 2012 to April 30, 2012, these differences are primarily due to differing treatment for deferral/reversal of wash sales, Trustees' deferred compensation, distributions and expiring capital loss carryforwards. For the year ended March 31, 2012, these differences are primarily due to differing treatment for deferral/reversal of wash sales, Trustees' deferred compensation, distributions, expiring capital loss carryforwards, and post-October losses. To the extent these differences are permanent; reclassifications are made among the components of the Fund's net assets in the Statement of Assets and Liabilities. Temporary differences do not require reclassifications. In the Statement of Assets and Liabilities the following reclassifications were made:
| | | Period ended
April 30,
2012 | | Year ended
March 31,
2012 | |
Undistributed
net investment income | | $ | — | | | $ | — | | |
| Accumulated net realized loss | | | 2,170,497 | | | | 397,238 | | |
| Paid-in capital | | | (2,170,497 | ) | | | (397,238 | ) | |
Net investment income and net realized gains (losses), as disclosed in the Statement of Operations, and net assets were not affected by this reclassification.
The tax character of distributions paid during the periods indicated was as follows:
| | | Period ended
April 30,
2012 | | Year ended
March 31,
2012 | | Year ended
March 31,
2011 | |
| Ordinary income | | $ | — | | | $ | 282 | | | $ | 7,182 | | |
Tax-exempt
income | | | 2,458,629 | | | | 33,715,739 | | | | 39,449,774 | | |
Short-term capital gain distributions, if any, are considered ordinary income distributions for tax purposes.
36
Columbia Short Term Municipal Bond Fund, April 30, 2012
At April 30, 2012 and March 31, 2012, the components of distributable earnings on a tax basis were as follows:
| | | April 30,
2012 | | March 31,
2012 | |
Undistributed tax-exempt
income | | $ | 4,789,942 | | | $ | 4,901,200 | | |
Undistributed accumulated
long-term gain | | | — | | | | — | | |
| Unrealized appreciation | | | 33,789,547 | | | | 31,551,073 | | |
At April 30, 2012 and March 31, 2012, the cost of investments for federal income tax purposes, and the aggregate unrealized appreciation and depreciation based on that cost was as follows:
| | | April 30,
2012 | | March 31,
2012 | |
Aggregate unrealized
appreciation | | $ | 34,899,058 | | | $ | 32,794,389 | | |
Aggregate unrealized
depreciation | | | (1,109,511 | ) | | | (1,243,316 | ) | |
Net unrealized
appreciation | | | 33,789,547 | | | | 31,551,073 | | |
Cost of investments for
tax purposes | | | 2,180,456,772 | | | | 2,292,790,720 | | |
The following capital loss carryforward, determined at April 30, 2012 and March 31, 2012, may be available to reduce taxable income arising from future net realized gains on investments, if any, to the extent permitted by the Internal Revenue Code:
| Year of Expiration | | April 30,
2012
Amount | | March 31,
2012
Amount | |
| 2013 | | $ | 3,786,208 | | | $ | 2,170,497 | | |
| 2014 | | | 3,090,745 | | | | 3,786,208 | | |
| 2015 | | | 1,181,270 | | | | 3,090,745 | | |
| 2016 | | | — | | | | 1,181,270 | | |
| 2018 | | | 602,849 | | | | — | | |
| 2019 | | | — | | | | 602,849 | | |
| Year of Expiration | | April 30,
2012
Amount | | March 31,
2012
Amount | |
| Unlimited short-term | | $ | 170,038 | | | $ | — | | |
| Unlimited long-term | | | 1,643,088 | | | | 183,372 | | |
| Total | | $ | 10,474,198 | | | $ | 11,014,941 | | |
On December 22, 2010, the Regulated Investment Company Modernization Act of 2010 (the Act) was enacted, which changed various technical rules governing the tax treatment of regulated investment companies. The changes are generally effective for taxable years beginning after the date of enactment. Under the Act, the Fund will be permitted to carry forward capital losses incurred in taxable years beginning after the date of enactment for an unlimited period. However, any losses incurred during those future taxable years will be required to be utilized prior to the losses incurred in pre-enactment taxable years, which carry an expiration date. As a result of this ordering rule, pre-enactment capital loss carryforwards may be more likely to expire unused.
For the period April 1, 2012 to April 30, 2012, $2,170,497 of capital loss carryforward expired. For the year ended March 31, 2012, $397,238 of capital loss carryforward expired.
Under current tax rules, regulated investment companies can elect to treat certain late-year ordinary losses incurred and post-October capital losses (capital losses realized after October 31) as arising on the first day of the following taxable year. As of March 31, 2012, the Fund will elect to treat post-October capital losses of $1,618,072 as arising on April 1, 2012.
Management of the Fund has concluded that there are no significant uncertain tax positions that would require recognition in the financial statements. However, management's conclusion may be subject to review and adjustment at a later date based on factors including, but not limited to, new tax laws, regulations, and administrative interpretations (including relevant court decisions). Generally, the Fund's federal tax returns for the prior three fiscal years remain subject to examination by the Internal Revenue Service.
Note 5. Portfolio Information
For the period April 1, 2012 to April 30, 2012, the cost of purchases and proceeds from sales of securities, excluding
37
Columbia Short Term Municipal Bond Fund, April 30, 2012
short-term obligations, aggregated to $36,870,832 and $60,890,100, respectively.
For the year ended March 31, 2012, the cost of purchases and proceeds from sales of securities, excluding short-term obligations, aggregated to $744,569,369 and $715,355,250, respectively.
Note 6. Lending of Portfolio Securities
Effective May 16, 2011, the Fund has entered into a Master Securities Lending Agreement (the Agreement) with JPMorgan Chase Bank, N.A. (JPMorgan). The Agreement, which replaces the previous securities lending arrangement with State Street, authorizes JPMorgan as lending agent to lend securities to authorized borrowers in order to generate additional income on behalf of the Fund. Pursuant to the Agreement, the securities loaned are secured by cash or U.S. government securities equal to at least 100% of the market value of the loaned securities. Any additional collateral required to maintain those levels due to market fluctuations of the loaned securities is requested to be delivered the following business day. Cash collateral received is invested by the lending agent on behalf of the Fund into authorized investments pursuant to the Agreement. The investments made with the cash collateral are listed in the Portfolio of Investments. The values of such investments and any uninvested cash collateral are disclosed in the Statement of Assets and Liabilities along with the related obligation to return the collateral upon the return of the securities loaned.
Risks of delay in recovery of securities or even loss of rights in the securities may occur should the borrower of the securities fail financially. Risks may also arise to the extent that the value of the securities loaned increases above the value of the collateral received. JPMorgan will indemnify the Fund from losses resulting from a borrower's failure to return a loaned security when due. Such indemnification does not extend to losses associated with declines in the value of cash collateral investments. The Investment Manager is not responsible for any losses incurred by the Fund in connection with the securities lending program. Loans are subject to termination by the Fund or the borrower at any time, and are, therefore, not considered to be illiquid investments.
Pursuant to the Agreement, the Fund receives income for lending its securities either in the form of fees or by earning interest on invested cash collateral, net of negotiated rebates paid to borrowers and fees paid to the lending agent for services provided and any other securities lending expenses. The Fund continues to earn and accrue interest and dividends on the securities loaned.
Prior to May 16, 2011, the Fund participated in a securities lending arrangement with State Street. Each security on loan was collateralized in an amount at least equal to the market value of the securities loaned plus accrued income from the investment of collateral. The income generated by the investment of the collateral, net of any fees remitted to State Street as the lending agent and borrower rebates, was paid to the Fund.
For the period ended April 30, 2012, and the year ended March 31, 2012, the Fund did not participate in securities lending activity.
Note 7. Custody Credits
Prior to May 16, 2011, the Fund had an agreement with its custodian bank under which custody fees may have been reduced by balance credits. These credits are recorded as part of expense reductions on the Statement of Operations. The Fund could have invested a portion of the assets utilized in connection with the expense offset arrangement in an income-producing asset if they had not entered into such an agreement. For the period April 1, 2011 through May 16, 2011, these credits reduced total expenses by $14.
Note 8. Shareholder Concentration
At April 30, 2012 and March 31, 2012, one unaffiliated shareholder account owned 83.3% and 83.9% of the outstanding shares of the Fund, respectively. The Fund has no knowledge about whether any portion of those shares was owned beneficially by such accounts. Subscription and redemption activity by concentrated accounts may have a significant effect on the operations of the Fund.
Note 9. Line of Credit
The Fund has entered into a revolving credit facility with a syndicate of banks led by JPMorgan, whereby the Fund may borrow for the temporary funding of shareholder redemptions or for other temporary or emergency purposes. The credit facility became effective on May 16, 2011, replacing a prior credit facility. The credit facility agreement, as amended, which is a collective agreement between the Fund and certain
38
Columbia Short Term Municipal Bond Fund, April 30, 2012
other funds managed by the Investment Manager, severally and not jointly, permits collective borrowings up to $500 million. Pursuant to a December 13, 2011 amendment to the credit facility agreement, interest is charged to each participating fund based on its borrowings at a rate equal to the higher of (i) the overnight federal funds rate plus 1.00% or (i) the one-month LIBOR rate plus 1.00%. Each borrowing under the credit facility matures no later than 60 days after the date of borrowing. The Fund also pays a commitment fee equal to its pro rata share of the amount of the credit facility at a rate of 0.08% per annum. For the period May 16, 2011 through December 13, 2011, interest was charged to each participating fund based on its borrowings at a rate equal to the sum of the federal funds rate plus (i) 1.25% per annum plus (ii) if one-month LIBOR exceeds the federal funds rate, the amount of such excess. The Fund also paid a commitment fee equal to its pro rata share of the amount of the credit facility at a rate of 0.10% per annum.
Prior to May 16, 2011, the Fund and certain other funds managed by the Investment Manager participated in a $225 million committed, unsecured revolving credit facility provided by State Street. Interest was charged to each fund based on its borrowings at a rate equal to the greater of the (i) federal funds rate plus 1.25% per annum or (ii) the overnight LIBOR rate plus 1.25% per annum. The Fund also paid a commitment fee equal to its pro rata share of the amount of the credit facility at a rate of 0.125% per annum.
The Fund had no borrowings during the period ended April 30, 2012 and the year ended March 31, 2012.
Note 10. Subsequent Events
Management has evaluated the events and transactions that have occurred through the date the financial statements were issued and noted no items requiring adjustment of the financial statements or additional disclosure.
Note 11. Information Regarding Pending and Settled Legal Proceedings
In December 2005, without admitting or denying the allegations, American Express Financial Corporation (AEFC, which is now known as Ameriprise Financial, Inc. (Ameriprise Financial)) entered into settlement agreements with the Securities and Exchange Commission (SEC) and Minnesota Department of Commerce (MDOC) related to market timing activities. As a result, AEFC was censured and ordered to cease and desist from committing or causing any violations of certain provisions of the Investment Advisers Act of 1940, the Investment Company Act of 1940, and various Minnesota laws. AEFC agreed to pay disgorgement of $10 million and civil money penalties of $7 million. AEFC also agreed to retain an independent distribution consultant to assist in developing a plan for distribution of all disgorgement and civil penalties ordered by the SEC in accordance with various undertakings detailed at www.sec.gov/litigation/admin/ia-2451.pdf. Ameriprise Financial and its affiliates have cooperated with the SEC and the MDOC in these legal proceedings, and have made regular reports to the funds' Boards of Trustees.
Ameriprise Financial and certain of its affiliates have historically been involved in a number of legal, arbitration and regulatory proceedings, including routine litigation, class actions, and governmental actions, concerning matters arising in connection with the conduct of their business activities. Ameriprise Financial believes that the Funds are not currently the subject of, and that neither Ameriprise Financial nor any of its affiliates are the subject of, any pending legal, arbitration or regulatory proceedings that are likely to have a material adverse effect on the Funds or the ability of Ameriprise Financial or its affiliates to perform under their contracts with the Funds. Ameriprise Financial is required to make 10-Q, 10-K and, as necessary, 8-K filings with the Securities and Exchange Commission on legal and regulatory matters that relate to Ameriprise Financial and its affiliates. Copies of these filings may be obtained by accessing the SEC website at www.sec.gov.
There can be no assurance that these matters, or the adverse publicity associated with them, will not result in increased fund redemptions, reduced sale of fund shares or other adverse consequences to the Funds. Further, although we believe proceedings are not likely to have a material adverse effect on the Funds or the ability of Ameriprise Financial or its affiliates to perform under their contracts with the Funds, these proceedings are subject to uncertainties and, as such, we are unable to estimate the possible loss or range of loss that may result. An adverse outcome in one or more of these proceedings could result in adverse judgments, settlements, fines, penalties or other relief that could have a material adverse effect on the consolidated financial condition or results of operations of Ameriprise Financial.
39
Report of Independent Registered Public Accounting Firm
To the Trustees of Columbia Funds Series Trust and the Shareholders of Columbia Short Term Municipal Bond Fund
In our opinion, the accompanying statement of assets and liabilities, including the portfolio of investments, and the related statements of operations and of changes in net assets and the financial highlights present fairly, in all material respects, the financial position of Columbia Short Term Municipal Bond Fund (the "Fund") (a series of Columbia Funds Series Trust) at April 30, 2012 and at March 31, 2012, the results of its operations, the changes in its net assets and the financial highlights for each of the periods indicated, in conformity with accounting principles generally accepted in the United States of America. These financial statements and financial highlights (hereafter referred to as "financial statements") are the responsibility of the Fund's management. Our responsibility is to express an opinion on these financial statements based on our audits. We conducted our audits of these financial statements in accordance with the standards of the Public Company Accounting Oversight Board (United States). Those standards require that we plan and perform the audit to obtain reasonable assurance about whether the financial statements are free of material misstatement. An audit includes examining, on a test basis, evidence supporting the amounts and disclosures in the financial statements, assessing the accounting principles used and significant estimates made by management, and evaluating the overall financial statement presentation. We believe that our audits, which included confirmation of securities at April 30, 2012 and at March 31, 2012 by correspondence with the custodian, transfer agent and brokers, provide a reasonable basis for our opinion.
PricewaterhouseCoopers LLP
Minneapolis, Minnesota
June 8, 2012
40
Federal Income Tax Information (Unaudited) – Columbia Short Term Municipal Bond Fund
For the fiscal period ended April 30, 2012 and the fiscal year ended March 31, 2012, 100.00% and 100.00%, respectively, of the distributions from net investment income of the Fund qualify as exempt interest dividends for federal income tax purposes. A portion of the income may be subject to federal alternative minimum tax.
The Fund will notify shareholders in January 2013 of amounts for use in preparing 2012 income tax returns.
41
Fund Governance
Shareholders elect the Board that oversees the funds' operations. The Board appoints officers who are responsible for day-to-day business decisions based on policies set by the Board. The following table provides basic biographical information about the funds' Board members, including their principal occupations during the past five years, although specific titles for individuals may have varied over the period. Under current Board policy, members may serve until the next Board meeting after he or she reaches the mandatory retirement age established by the Board, or the fifteenth anniversary of the first Board meeting they attended as a member of the Board.
On September 29, 2009, Ameriprise Financial, the parent company of Columbia Management, entered into an agreement with Bank of America, N.A. ("Bank of America") to acquire a portion of the asset management business of Columbia Management Group, LLC and certain of its affiliated companies (the "Transaction"). Following the Transaction, which became effective on May 1, 2010, various alignment activities have occurred with respect to the Fund Family. In connection with the Transaction, Mr. Edward J. Boudreau, Jr., Mr. William P. Carmichael, Mr. William A. Hawkins, Mr. R. Glenn Hilliard, Mr. John J. Nagorniak, Ms. Minor M. Shaw and Dr. Anthony M. Santomero, who were members prior to the Transaction of the Legacy Columbia Nations funds' Board ("Nations Funds"), which includes Columbia Funds Series Trust, Columbia Funds Variable Insurance Trust I and Columbia Funds Master Investment Trust, LLC., began service on the Board for the Legacy RiverSource funds ("RiverSource Funds") effective June 1, 2011, which resulted in an overall increase from twelve Trustees to sixteen for all mutual funds overseen by the Board.
Independent Board Members
| Name, Address, Age | | Position Held
with Funds
and Length
of Service | | Principal Occupation During Past Five Years | | Number of
Funds in the
Fund Family
Overseen by
Board Member | | Other Present or
Past Directorships/
Trusteeships
(Within Past 5 Years) | |
| Kathleen Blatz | | | | | | | | | |
|
901 S. Marquette Ave.
Minneapolis, MN 55402
Age 57 | | Board member since 1/06 for RiverSource Funds and since 6/11 for Nations Funds | | Attorney; Chief Justice, Minnesota Supreme Court, 1998-2006 | | | 156 | | | | None | | |
|
| Edward J. Boudreau, Jr. | | | | | | | | | |
|
225 Franklin Street
Mail Drop
BX32 05228
Boston, MA 02110
Age 67 | | Board member since 6/11 for RiverSource Funds and since 1/05 for Nations Funds | | Managing Director, E.J. Boudreau & Associates (consulting) since 2000 | | | 149 | | | Former Trustee, BofA Funds Series Trust (11 funds) | |
|
| Pamela G. Carlton | | | | | | | | | |
|
901 S. Marquette Ave.
Minneapolis, MN 55402
Age 57 | | Board member since 7/07 for RiverSource Funds and since 6/11 for Nations Funds | | President, Springboard-Partners in Cross Cultural Leadership (consulting company) | | | 156 | | | | None | | |
|
42
Fund Governance (continued)
Independent Board Members (continued)
| Name, Address, Age | | Position Held
with Funds
and Length
of Service | | Principal Occupation During Past Five Years | | Number of
Funds in the
Fund Family
Overseen by
Board Member | | Other Present or
Past Directorships/
Trusteeships
(Within Past 5 Years) | |
| William P. Carmichael | | | | | | | | | |
|
225 Franklin Street
Mail Drop
BX32 05228
Boston, MA 02110
Age 68 | | Board member since 6/11 for RiverSource Funds and since 1999 for Nations Funds | | Retired | | | 149 | | | Director, Cobra Electronics Corporation (electronic equipment manufacturer); The Finish Line (athletic shoes and apparel); McMoRan Exploration Company (oil and gas exploration and development); former Trustee, BofA Funds Series Trust (11 funds); former Director, Spectrum Brands, Inc. (consumer products); former Director, Simmons Company (bedding) | |
|
| Patricia M. Flynn | | | | | | | | | |
|
901 S. Marquette Ave.
Minneapolis, MN 55402
Age 61 | | Board member since 11/04 for RiverSource Funds and since 6/11 for Nations Funds | | Trustee Professor of Economics and Management, Bentley University; former Dean, McCallum Graduate School of Business, Bentley University | | | 156 | | | | None | | |
|
| William A. Hawkins | | | | | | | | | |
|
225 Franklin Street
Mail Drop
BX32 05228
Boston, MA 02110
Age 69 | | Board member since 6/11 for RiverSource Funds and since 1/05 for Nations Funds | | Managing Director, Overton Partners (financial consulting), since August 2010; President and Chief Executive Officer, California General Bank, N.A., January 2008-August 2010 | | | 149 | | | Trustee, BofA Funds Series Trust (11 funds) | |
|
| R. Glenn Hilliard | | | | | | | | | |
|
225 Franklin Street
Mail Drop
BX32 05228
Boston, MA 02110
Age 69 | | Board member since 6/11 for RiverSource Funds and since 1/05 for Nations Funds | | Chairman and Chief Executive Officer, Hilliard Group LLC (investing and consulting), since April 2003; Non-Executive Director & Chairman, CNO Financial Group, Inc. (formerly Conseco, Inc.) (insurance), September 2003-May 2011 | | | 149 | | | Chairman, BofA Fund Series Trust (11 funds); former Director, CNO Financial Group, Inc. (insurance) | |
|
43
Fund Governance (continued)
Independent Board Members (continued)
| Name, Address, Age | | Position Held
with Funds
and Length
of Service | | Principal Occupation During Past Five Years | | Number of
Funds in the
Fund Family
Overseen by
Board Member | | Other Present or
Past Directorships/
Trusteeships
(Within Past 5 Years) | |
| Stephen R. Lewis, Jr. | | | | | | | | | |
|
901 S. Marquette Ave.
Minneapolis, MN 55402
Age 73 | | Chair of the Board for RiverSource Funds since 1/07, Board member for RiverSource Funds since 1/02 and since 6/11 for Nations Funds | | President Emeritus and Professor of Economics Emeritus, Carleton College | | | 156 | | | Director, Valmont Industries, Inc. (manufactures irrigation systems) | |
|
| John F. Maher | | | | | | | | | |
|
901 S. Marquette Ave.
Minneapolis, MN 55402
Age 69 | | Board member since 12/06 for Legacy Seligman funds, since 12/08 for RiverSource Funds and since 6/11 for Nations Funds | | Retired President and Chief Executive Officer and former Director, Great Western Financial Corporation (financial services), 1986-1997 | | | 156 | | | | None | | |
|
| John J. Nagorniak | | | | | | | | | |
|
225 Franklin Street
Mail Drop
BX32 05228
Boston, MA 02110
Age 67 | | Board member since 6/11 for RiverSource Funds and since 1/08 for Nations Funds | | Retired; President and Director, Foxstone Financial, Inc. (consulting), 2000-2007; Director, Mellon Financial Corporation affiliates (investing), 2000-2007; Chairman, Franklin Portfolio Associates (investing—Mellon affiliate), 1982-2007 | | | 149 | | | Trustee, Research Foundation of CFA Institute; Director, MIT Investment Company; Trustee, MIT 401k Plan; former Trustee, BofA Funds Series Trust (11 funds) | |
|
| Catherine James Paglia | | | | | | | | | |
|
901 S. Marquette Ave.
Minneapolis, MN 55402
Age 59 | | Board member since 11/04 for RiverSource Funds and since 6/11 for Nations Funds | | Director, Enterprise Asset Management, Inc. (private real estate and asset management company) | | | 156 | | | | None | | |
|
44
Fund Governance (continued)
Independent Board Members (continued)
| Name, Address, Age | | Position Held
with Funds
and Length
of Service | | Principal Occupation During Past Five Years | | Number of
Funds in the
Fund Family
Overseen by
Board Member | | Other Present or
Past Directorships/
Trusteeships
(Within Past 5 Years) | |
| Leroy C. Richie | | | | | | | | | |
|
901 S. Marquette Ave.
Minneapolis, MN 55402
Age 70 | | Board member since 2000 for Legacy Seligman funds, since 11/08 for RiverSource Funds and since 6/11 for Nations Funds | | Counsel, Lewis & Munday, P.C. since 2004; former Vice President and General Counsel, Automotive Legal Affairs, Chrysler Corporation | | | 156 | | | Director, Digital Ally, Inc. (digital imaging); Director, Infinity, Inc. (oil and gas exploration and production); Director, OGE Energy Corp. (energy and energy services) | |
|
| Minor M. Shaw | | | | | | | | | |
|
225 Franklin Street
Mail Drop
BX32 05228
Boston, MA 02110
Age 64 | | Board member since 6/11 for RiverSource Funds and since 2003 for Nations Funds | | President—Micco LLC (private investments) | | | 149 | | | Former Trustee, BofA Funds Series Trust (11 funds); Board Member, Piedmont Natural Gas; Director, Blue Cross Blue Shield of South Carolina | |
|
| Alison Taunton-Rigby | | | | | | | | | |
|
901 S. Marquette Ave.
Minneapolis, MN 55402
Age 68 | | Board member since 11/02 for RiverSource Funds and since 6/11 for Nations Funds | | Chief Executive Officer and Director, RiboNovix, Inc. 2003-2010 (biotechnology); former President, Aquila Biopharmaceuticals | | | 156 | | | Director, Healthways, Inc. (health management programs); Director, ICI Mutual Insurance Company, RRG; Director, Abt Associates (government contractor) | |
|
45
Fund Governance (continued)
Interested Board Member Not Affiliated with Investment Manager*
| Name, Address, Age | | Position Held
with Funds
and Length
of Service | | Principal Occupation During Past Five Years | | Number of
Funds in the
Fund Family
Overseen by
Board Member | | Other Present or
Past Directorships/
Trusteeships
(Within Past 5 Years) | |
| Anthony M. Santomero* | | | | | | | | | |
|
225 Franklin Street
Mail Drop
BX32 05228
Boston, MA 02110
Age 65 | | Board member since 6/11 for RiverSource Funds and since 1/08 for Nations Funds | | Richard K. Mellon Professor Emeritus of Finance, The Wharton School, University of Pennsylvania, since 2002; Senior Advisor, McKinsey & Company (consulting), 2006-2008; President and Chief Executive Officer, Federal Reserve Bank of Philadelphia, 2000-2006 | | | 149 | | | Director, Renaissance Reinsurance Ltd.; Trustee, Penn Mutual Life Insurance Company; Director, Citigroup; Director, Citibank, N.A.; former Trustee, BofA Funds Series Trust (11 funds) | |
|
* Dr. Santomero is not an affiliated person of the Investment Manager or Ameriprise Financial. However, he is currently deemed by the funds to be an "interested person" (as defined in the 1940 Act) of the Funds because he serves as a Director of Citigroup, Inc. and Citibank N.A., companies that may directly or through subsidiaries and affiliates engage from time-to-time in brokerage execution, principal transactions and lending relationships with the funds or accounts advised/managed by the Investment Manager.
Interested Board Member Affiliated with Investment Manager*
| William F. Truscott | | | | | | | | | |
|
53600 Ameriprise Financial Center
Minneapolis, MN 55474
Age 51 | | Board member since 11/01 for RiverSource Funds and since 6/11 for Nations Funds; Senior Vice President since 2002 for RiverSource Funds and 5/10 for Nations Funds | | Chairman of the Board and President, Columbia Management Investment Advisers, LLC since May 2010 and February 2012, respectively (previously President, Chairman of the Board and Chief Investment Officer, 2001-April 2010); Chief Executive Officer, U.S. Asset Management & President, Annuities, Ameriprise Financial, Inc. since May 2010 (previously President—U.S. Asset Management and Chief Investment Officer, 2005-April 2010); Director, President and Chief Executive Officer, Ameriprise Certificate Company since 2006; Director and Chief Executive Officer, Columbia Management Investment Distributors, Inc. since May 2010 and February 2012, respectively (previously Chairman of the Board and Chief Executive Officer, 2006-April 2010); Chairman of the Board and Chief Executive Officer, RiverSource Distributors, Inc. since 2006. | | | 156 | | | Trustee, Columbia Funds Series Trust I and Columbia Funds Variable Insurance Trust | |
|
* Interested person (as defined under the 1940 Act) by reason of being an officer, director, security holder and/or employee of the Investment Manager or Ameriprise Financial.
The SAI has additional information about the Fund's Board members and is available, without charge, upon request by calling 800.345.6611; contacting your financial intermediary; or visiting columbiamanagement.com.
46
Fund Governance (continued)
Officers
| Name, Year of Birth and Address | | Principal Occupation(s) During the Past Five Years | |
| J. Kevin Connaughton (Born 1964) | |
|
225 Franklin Street
Boston, MA 02110
President (since 2009) | | Senior Vice President and General Manager—Mutual Fund Products, Columbia Management Investment Advisers, LLC since May 2010; President, Columbia Funds, since 2009, and RiverSource Funds, since May 2010 (previously Senior Vice President and Chief Financial Officer, Columbia Funds, from June 2008 to January 2009, Treasurer, Columbia Funds, from October 2003 to May 2008, and senior officer of various other affiliated funds since 2000); Managing Director, Columbia Management Advisors, LLC from December 2004 to April 2010. | |
|
| Michael G. Clarke (Born 1969) | |
|
225 Franklin Street
Boston, MA 02110
Treasurer (since 2011) and Chief Financial Officer (since 2009) | | Vice President, Columbia Management Investment Advisers, LLC since May 2010; Managing Director of Fund Administration, Columbia Management Advisors, LLC, from September 2004 to April 2010; senior officer of Columbia Funds and affiliated funds since 2002. | |
|
| Scott R. Plummer (Born 1959) | |
|
5228 Ameriprise Financial Center
Minneapolis, MN 55474
Senior Vice President and Chief Legal Officer (since 2010) | | Chief Legal Officer and Assistant Secretary, Columbia Management Investment Advisers, LLC since June 2005; Vice President and Lead Chief Counsel—Asset Management, Ameriprise Financial, Inc. since May 2010 (previously Vice President and Chief Counsel—Asset Management, from 2005 to April 2010, Vice President, Chief Counsel and Assistant Secretary, Columbia Management Investment Distributors, Inc. since 2008; Vice President, General Counsel and Secretary, Ameriprise Certificate Company since 2005; Chief Counsel, RiverSource Distributors, Inc. since 2006; Senior officer of Columbia Funds and affiliated funds, since 2006. | |
|
| Thomas P. McGuire (Born 1972) | |
|
225 Franklin Street
Boston, MA 02110
Chief Compliance Officer (since 2012) | | Vice President—Asset Management Compliance, Columbia Management Investment Advisers, LLC since March 2010; Chief Compliance Officer, Ameriprise Certificate Company, since September 2010; Compliance Executive, Bank of America, from June 2005 to April 2010. | |
|
| William F. Truscott (Born 1960) | |
|
53600 Ameriprise Financial Center
Minneapolis, MN 55474
Senior Vice President (since 2010) | | Chairman of the Board and President, Columbia Management Investment Advisers, LLC since May 2010 and February 2012, respectively (previously President, Chairman of the Board and Chief Investment Officer, from 2001 to April 2010); Chief Executive Officer, U.S. Asset Management & President, Annuities, Ameriprise Financial, Inc. since May 2010 (previously President—U.S. Asset Management and Chief Investment Officer from 2005 to April 2010; Director, President and Chief Executive Officer, Ameriprise Certificate Company since 2006; Director and Chief Executive Officer, Columbia Management Investment Distributors, Inc. since May 2010 and February 2012, respectively (previously Chairman of the Board and Chief Executive Officer from 2008 to April 2010); Chairman of the Board and Chief Executive Officer, RiverSource Distributors, Inc. since 2006. | |
|
| Paul D. Pearson (Born 1956) | |
|
10468 Ameriprise Financial Center
Minneapolis, MN 55474
Vice President and Assistant Treasurer
(since 2011) | | Vice President—Investment Accounting, Columbia Management Investment Advisers, LLC, since May 2010; Vice President—Managed Assets, Investment Accounting, Ameriprise Financial Corporation, 1998-2010 | |
|
47
Fund Governance (continued)
Officers (continued)
| Name, Year of Birth and Address | | Principal Occupation(s) During the Past Five Years | |
| Colin Moore (Born 1958) | |
|
225 Franklin Street
Boston, MA 02110
Senior Vice President (since 2010) | | Director and Chief Investment Officer, Columbia Management Investment Advisers, LLC since May 2010; Manager, Managing Director and Chief Investment Officer of Columbia Management Advisors, LLC from 2007 to April 2010; Head of Equities, Columbia Management Advisors, LLC from 2002 to 2007. | |
|
| Christopher O. Petersen (Born 1970) | |
|
5228 Ameriprise Financial Center
Minneapolis, MN 55474
Vice President and Secretary (since 2011) | | Vice President and Chief Counsel, Ameriprise Financial since January 2010 (formerly Vice President and Group Counsel or Counsel from April 2004 to January 2010); Senior officer of Columbia Funds and affiliated funds, since 2007. | |
|
| Amy K. Johnson (Born 1965) | |
|
5228 Ameriprise Financial Center
Minneapolis, MN 55474
Vice President (since 2010) | | Senior Vice President and Chief Operating Officer, Columbia Management Investment Advisers, LLC since May 2010 (previously Chief Administrative Officer, from 2009 until April 2010, Vice President—Asset Management and Trust Company Services, from 2006 to 2009, and Vice President—Operations and Compliance from 2004 to 2006). | |
|
| Joseph F. DiMaria (Born 1968) | |
|
225 Franklin Street
Boston, MA 02110
Vice President (since 2011) and Chief Accounting Officer (since 2008) | | Vice President, Mutual Fund Administration, Columbia Management Investment Advisers, LLC, since May 2010; Director of Fund Administration, Columbia Management Advisors, LLC from January 2006 to April 2010. | |
|
| Paul B. Goucher (Born 1968) | |
|
100 Park Avenue
New York, NY 10017
Vice President and Assistant Secretary (since 2010) | | Vice President and Chief Counsel of Ameriprise Financial since January 2010 (formerly Vice President and Group Counsel from November 2008 to January 2010); Director, Managing Director and General Counsel of J. & W. Seligman & Co. Incorporated (Seligman) from July 2008 to November 2008 and Managing Director and Associate General Counsel of Seligman from January 2005 to July 2008. | |
|
| Michael E. DeFao (Born 1968) | |
|
225 Franklin Street
Boston, MA 02110
Vice President and Assistant Treasurer (since 2011) | | Vice President and Chief Counsel, Ameriprise Financial since May 2010; Associate General Counsel, Bank of America from June 2005 to April 2010. | |
|
| Stephen T. Welsh (Born 1957) | |
|
225 Franklin Street
Boston, MA 02110
Vice President (since 2006) | | President and Director, Columbia Management Investment Services Corp. since May 2010; President and Director, Columbia Management Services, Inc. from July 2004 to April 2010; Managing Director, Columbia Management Distributors, Inc. from August 2007 to April 2010. | |
|
48
Approval of Investment Management Services Agreement
Columbia Management Investment Advisers, LLC ("Columbia Management" or the "investment manager"), a wholly-owned subsidiary of Ameriprise Financial, Inc. ("Ameriprise Financial"), serves as the investment manager to Columbia Short Term Municipal Bond Fund (the "Fund"). Under an investment management services agreement (the "IMS Agreement"), Columbia Management provides investment advice and other services to the Fund and all funds distributed by Columbia Management Investment Distributors, Inc. (collectively, the "Funds").
On an annual basis, the Fund's Board of Trustees (the "Board"), including the independent Board members (the "Independent Directors"), considers renewal of the IMS Agreement. Columbia Management prepared detailed reports for the Board and its Contracts Committee in March and April 2012, including reports based on analyses of data provided by an independent organization and a comprehensive response to each item of information requested by independent legal counsel to the Independent Directors ("Independent Legal Counsel") in a letter to the investment manager, to assist the Board in making this determination. All of the materials presented in March and April were first supplied in draft form to designated representatives of the Independent Directors, i.e., Independent Legal Counsel, the Chair and the Chair of the Contracts Committee (including materials relating to the Fund's expense cap), and the final materials were revised to reflect comments provided by these Board representatives. In addition, throughout the year, the Board (or its committees) regularly meets with portfolio management teams and senior management personnel, and reviews information prepared by Columbia Management addressing the services Columbia Management provides and Fund performance. The Board accords particular weight to the work, deliberations and conclusions of the Contracts Committee, the Investment Review Committee and the Compliance Committee in determining whether to continue the IMS Agreement.
The Board, at its April 10-12, 2012 in-person Board meeting (the "April Meeting"), considered the renewal of the IMS Agreement for an additional one-year term. At the April Meeting, Independent Legal Counsel reviewed with the Independent Directors various factors relevant to the Board's consideration of advisory agreements and the Board's legal responsibilities related to such consideration. Following an analysis and discussion of the factors identified below, the Board, including all of the Independent Directors, approved the renewal of the IMS Agreement.
Nature, Extent and Quality of Services Provided by Columbia Management: The Independent Directors analyzed various reports and presentations they had received detailing the services performed by Columbia Management, as well as its expertise, resources and capabilities. The Independent Directors specifically considered many developments during the past year concerning the services provided by Columbia Management, including, in particular, the continued investment in, and resources dedicated to, the Funds' operations and the successful completion of various integration initiatives and the consolidation of dozens of Funds. The Independent Directors noted the information they received concerning Columbia Management's ability to retain key portfolio management personnel. In that connection, the Independent Directors took into account their meetings with Columbia Management's Chief Investment Officer (the "CIO") and considered the CIO's successful execution of additional risk and portfolio management oversight applied to the Funds. The Independent Directors also assessed Columbia Management's significant investment in upgrading technology (such as an equity trading system) and considered management's commitments to enhance existing resources in this area.
In connection with the Board's evaluation of the overall package of services provided by Columbia Management, the Board also considered the quality of administrative services provided to the Fund by Columbia Management. In addition, the Board also reviewed the financial condition of Columbia Management (and its affiliates) and each entity's ability to carry out its responsibilities under the IMS Agreement and the Fund's other services agreements with Ameriprise affiliates. The Board also discussed the acceptability of the terms of the IMS Agreement (including the relatively broad scope of services required to be performed by Columbia Management). The Board concluded that the services being performed under the IMS Agreement were of a reasonably high quality.
Based on the foregoing, and based on other information received (both oral and written, including the information on investment performance referenced below) and other considerations, the Board concluded that Columbia
49
Approval of Investment Management Services Agreement (continued)
Management and its affiliates were in a position to continue to provide a high quality and level of services to the Fund.
Investment Performance: For purposes of evaluating the nature, extent and quality of services provided under the IMS Agreement, the Board carefully reviewed the investment performance of the Fund. In this regard, the Board considered detailed reports providing the results of analyses performed by an independent organization showing, for various periods, the performance of the Fund, the performance of a benchmark index, the percentage ranking of the Fund among its comparison group and the net assets of the Fund. The Board observed that the Fund's investment performance was appropriate in light of the particular management style.
Comparative Fees, Costs of Services Provided and the Profits Realized By Columbia Management and its Affiliates from their Relationships with the Fund: The Board reviewed comparative fees and the costs of services to be provided under the IMS Agreement. The Board members considered detailed comparative information set forth in an annual report on fees and expenses, including, among other things, data (based on analyses conducted by an independent organization) showing a comparison of the Fund's expenses with median expenses paid by funds in its comparative peer universe, as well as data showing the Fund's contribution to Columbia Management's profitability. The Board reviewed the fees charged to comparable institutional or other accounts/vehicles managed by Columbia Management and discussed differences in how the products are managed and operated, noting no unreasonable differences in the levels of contractual fees.
The Board accorded particular weight to the notion that the level of fees should reflect a rational pricing model applied consistently across the various product lines in the Fund family, while assuring that the overall fees for each Fund (with few defined exceptions) are generally in line with the "pricing philosophy" (i.e., that the total expense ratio of the Fund is at, or below, the median expense ratio of funds in the same comparison universe of the Fund). The Board took into account that the Fund's total expense ratio (after considering proposed expense caps/waivers) approximated the peer universe's median expense ratio. Based on its review, the Board concluded that the Fund's management fee was fair and reasonable in light of the extent and quality of services that the Fund receives.
The Board also considered the expected profitability of Columbia Management and its affiliates in connection with Columbia Management providing investment management services to the Fund. In this regard, the Board referred to a detailed profitability report, discussing the profitability to Columbia Management and Ameriprise Financial from managing, operating and distributing the Funds. In this regard, the Board observed that 2011 profitability, while slightly lower than 2010, was generally in line with the reported profitability of other asset management firms. The Board also considered the indirect economic benefits flowing to Columbia Management or its affiliates in connection with managing or distributing the Funds, such as the enhanced ability to offer various other financial products to Ameriprise Financial customers, soft dollar benefits and overall reputational advantages. The Board noted that the fees paid by the Fund should permit the investment manager to offer competitive compensation to its personnel, make necessary investments in its business and earn an appropriate profit. The Board concluded that profitability levels were reasonable.
Economies of Scale to be Realized: The Board also considered the economies of scale that might be realized by Columbia Management as the Fund grows and took note of the extent to which Fund shareholders might also benefit from such growth.
Based on the foregoing, the Board, including all of the Independent Directors, concluded that the investment management service fees were fair and reasonable in light of the extent and quality of services provided. In reaching this conclusion, no single factor was determinative. On April 12, 2012, the Board, including all of the Independent Directors, approved the renewal of the IMS Agreement.
50
This page intentionally left blank.
51
This page intentionally left blank.
52
Important Information About This Report
The fund mails one shareholder report to each shareholder address. If you would like more than one report, please call shareholder services at 1-800-345-6611 and additional reports will be sent to you. This report has been prepared for shareholders of Columbia Short Term Municipal Bond Fund.
A description of the policies and procedures that the fund uses to determine how to vote proxies and a copy of the fund's voting records are available (i) at www.columbiamanagement.com, (ii) on the Securities and Exchange Commission's website at www.sec.gov, and (iii) without charge, upon request, by calling 1-800-368-0346. Information regarding how the fund voted proxies relating to portfolio securities during the 12-month period ended June 30 is available from the SEC's website. Information regarding how the fund voted proxies relating to portfolio securities is also available from the fund's website, www.columbiamanagement.com.
The fund files a complete schedule of portfolio holdings with the SEC for the first and third quarters of each fiscal year on Form N-Q. The fund's Form N-Q is available on the SEC's website at www.sec.gov and may be reviewed and copied at the SEC's Public Reference Room in Washington, D.C. Information on the operation of the Public Reference Room may be obtained by calling 1-800-SEC-0330.
Transfer Agent
Columbia Management Investment
Services Corp.
P.O. Box 8081
Boston, MA 02266-8081
1-800-345-6611
Distributor
Columbia Management Investment
Distributors, Inc.
225 Franklin Street
Boston, MA 02110
Investment Manager
Columbia Management Investment Advisers, LLC
225 Franklin Street
Boston, MA 02110
53

Columbia Short Term Municipal Bond Fund
P. O. Box 8081
Boston, MA 02266-8081
columbiamanagement.com
This information is for use with concurrent or prior delivery of a fund prospectus. Investors should consider the investment objectives, risks, charges and expenses of a mutual fund carefully before investing. For a free prospectus, which contains this and other important information about the funds, visit columbiamanagement.com. Read the prospectus carefully before investing. The Fund is distributed by Columbia Management Investment Distributors, Inc., member FINRA, and managed by Columbia Management Investment Advisers, LLC.
© 2012 Columbia Management Investment Advisers, LLC. All rights reserved.
C-1076 C (5/12)

Columbia South Carolina Intermediate Municipal Bond Fund
Annual Report for the Period Ended April 30, 2012
Not FDIC insured • No bank guarantee • May lose value
Table of Contents
| Fund Profile | | | 1 | | |
|
| Performance Information | | | 2 | | |
|
| Understanding Your Expenses | | | 3 | | |
|
| Portfolio Managers' Report | | | 4 | | |
|
| Portfolio of Investments | | | 6 | | |
|
Statement of Assets and
Liabilities | | | 12 | | |
|
| Statement of Operations | | | 14 | | |
|
Statement of Changes in
Net Assets | | | 15 | | |
|
| Financial Highlights | | | 17 | | |
|
| Notes to Financial Statements | | | 21 | | |
|
Report of Independent Registered
Public Accounting Firm | | | 29 | | |
|
| Federal Income Tax Information | | | 30 | | |
|
| Fund Governance | | | 31 | | |
|
Approval of Investment
Management Services Agreement | | | 38 | | |
|
Important Information About
This Report | | | 41 | | |
|
The views expressed in this report reflect the current views of the respective parties. These views are not guarantees of future performance and involve certain risks, uncertainties and assumptions that are difficult to predict, so actual outcomes and results may differ significantly from the views expressed. These views are subject to change at any time based upon economic, market or other conditions and the respective parties disclaim any responsibility to update such views. These views may not be relied on as investment advice and, because investment decisions for a Columbia Fund are based on numerous factors, may not be relied on as an indication of trading intent on behalf of any particular Columbia Fund. References to specific securities should not be construed as a recommendation or investment advice.
President's Message

Dear Shareholders,
A stock market rally that commenced in the fourth quarter of 2011 continued into 2012 in the United States and around the world, as all major market regions generated double-digit returns for the three-month period ended March 31, 2012. Volatility declined sharply as European debt fears quieted somewhat and sentiment improved. Returns in developed countries were buoyed by strong results in Germany, Belgium, Austria and the Nordic markets of Denmark, Finland, Norway and Sweden. Under the cloud of its own mounting debt problem, Spain was the only eurozone country to deliver a negative return during the three-month period. Solid economic growth and accommodative monetary policy helped boost gains in emerging markets. The rally in U.S. equities was largely driven by an expansion in "multiples"—an increase in stock prices relative to their earnings. By the end of the first quarter of 2012, stocks no longer appeared as cheap as they were late in 2011. Bonds lagged stocks during the first quarter as investors responded to signs of an improved environment with a greater appetite for risk.
Concerns around the health of the global economy were centered in news headlines focusing on Washington D.C., Europe, China and the Middle East. In the United States, economic indicators remained mixed but generally indicated support for slow, sustainable economic growth. European policymakers have made progress in containing the eurozone debt crisis, though they still have not solved the issue of long-term solvency. The European Central Bank has lowered interest rates and flooded the financial system with liquidity that may provide breathing space for companies to restructure their balance sheets. These massive infusions of liquidity may whet the appetite for risk from investors around the world. However, it has delayed a true reckoning with the European financial situation, as concerns about Spain and Portugal continue to cloud the outlook. These structural challenges that persist in the developed world, and slowing growth in emerging market economies, leave the global economy in a fragile state. Domestic demand, combined with slowing inflationary trends, has also helped to shore up emerging market economies. Joblessness remains low and monetary conditions remain easy.
Despite the challenges and surprises of 2011, we see pockets of strength—and as a result, attractive opportunities—both here and abroad for 2012. We hope to help you capitalize on these opportunities with various articles in our 2012 Perspectives, which is available via the Market Insights tab at columbiamanagement.com. This publication showcases the strong research capabilities and experienced investment teams of Columbia Management and offers a diverse array of investment ideas based on our five key themes for 2012.
Other information and resources available at columbiamanagement.com include:
g detailed up-to-date fund performance and portfolio information
g economic analysis and market commentary
g quarterly fund commentaries
g Columbia Management Investor, our award-winning quarterly newsletter for shareholders
Thank you for your continued support of the Columbia Funds. We look forward to serving your investment needs for many years to come.
Best Regards,

J. Kevin Connaughton
President, Columbia Funds
Investors should consider the investment objectives, risks, charges and expenses of a mutual fund carefully before investing. For a free prospectus, which contains this and other important information about the funds, visit columbiamanagement.com. The prospectus should be read carefully before investing.
Columbia Funds are distributed by Columbia Management Investment Distributors, Inc., member FINRA, and managed by Columbia Management Investment Advisers, LLC.
© 2012 Columbia Management Investment Advisers, LLC. All rights reserved.
Fund Profile – Columbia South Carolina Intermediate Municipal Bond Fund
Summary
g For the 13-month period that ended April 30, 2012, the fund's Class A shares returned 10.26% without sales charge.
g The fund's benchmark, the Barclays 3-15 Year Blend Municipal Bond Index, returned 11.05%.1
g An underweight in the very longest intermediate-maturity bonds detracted from performance, as these were the best performers for the period.
Portfolio Management
Brian M. McGreevy has managed the fund since June 2011. From 1994 until joining Columbia Management Investment Advisers, LLC (the Investment Manager) in May 2010, Mr. McGreevy was associated with the fund's previous investment adviser as an investment professional.
The Barclays 3-15 Year Blend Municipal Bond Index tracks the performance of municipal bonds issued after December 31, 1990 with remaining maturities between 2 and 17 years and at least $7 million in principal amount outstanding.
Indices are not available for investment, are not professionally managed and do not reflect sales charges, fees, brokerage commissions, taxes or other expenses of investing. Securities in the fund may not match those in an index.
Performance data quoted represents past performance and current performance may be lower or higher. Past performance is no guarantee of future results. The investment return and principal value will fluctuate so that shares, when redeemed, may be worth more or less than the original cost. Please visit www.columbiamanagement.com for daily and most recent month-end performance updates.
Summary
13-month (cumulative) return as of 04/30/12
| | | | +10.26% | |
|
|  | | | Class A shares
(without sales charge) | |
|
| | | | +11.05% | |
|
|  | | | Barclays 3-15 Year Blend
Municipal Bond Index | |
|
1
Performance Information – Columbia South Carolina Intermediate Municipal Bond Fund
Performance data quoted represents past performance and current performance may be lower or higher. Past performance is no guarantee of future results. The investment return and principal value will fluctuate so that shares, when redeemed, may be worth more or less than the original cost. Please visit www.columbiamanagement.com for daily and most recent month-end performance updates.
Performance of a $10,000 investment 05/01/02 – 04/30/12
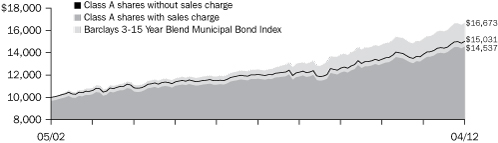
The chart above shows the change in value of a hypothetical $10,000 investment in Class A shares of Columbia South Carolina Intermediate Municipal Bond Fund during the stated time period, and does not reflect the deduction of taxes that a shareholder may pay on fund distributions or on the redemption of fund shares.
Performance of a $10,000 investment 05/01/02 – 04/30/12 ($)
| Sales charge | | without | | with | |
| Class A | | | 15,031 | | | | 14,537 | | |
| Class B | | | 13,964 | | | | 13,964 | | |
| Class C | | | 13,945 | | | | 13,945 | | |
| Class Z | | | 15,421 | | | | n/a | | |
Average annual total return as of 04/30/12 (%)
| Share class | | A | | B | | C | | Z | |
| Inception | | 05/05/92 | | 06/08/93 | | 06/17/92 | | 01/06/92 | |
| Sales charge | | without | | with | | without | | with | | without | | with | | without | |
| 1-month (cumulative) | | | 1.18 | | | | –2.13 | | | | 1.12 | | | | –1.88 | | | | 1.12 | | | | 0.12 | | | | 1.20 | | |
| 1-year | | | 8.44 | | | | 4.95 | | | | 7.73 | | | | 4.73 | | | | 7.64 | | | | 6.64 | | | | 8.80 | | |
| 5-year | | | 4.54 | | | | 3.86 | | | | 3.76 | | | | 3.76 | | | | 3.76 | | | | 3.76 | | | | 4.80 | | |
| 10-year | | | 4.16 | | | | 3.81 | | | | 3.40 | | | | 3.40 | | | | 3.38 | | | | 3.38 | | | | 4.43 | | |
The "with sales charge" returns include the maximum initial sales charge of 3.25% for Class A shares, the applicable contingent deferred sales charge of 3.00% in the first year, declining to 1.00% in the fourth year and eliminated thereafter for Class B shares and 1.00% for Class C shares for the first year only. The "without sales charge" returns do not include the effect of sales charges. If they had, returns would be lower.
Performance results reflect any fee waivers or reimbursements of fund expenses by Columbia Management Investment Advisers, LLC and/or any of its affiliates. Absent these fee waivers or expense reimbursement arrangements, performance results would have been lower.
All results shown assume the reinvestment of distributions. Class Z shares are sold at net asset value with no distribution and service (Rule 12b-1) fees. Class Z shares have limited eligibility and the investment minimum requirements may vary. Please see the fund's prospectuses for details. Performance for different share classes will vary based on differences in sales charges and fees associated with each class.
The tables do not reflect the deduction of taxes that a shareholder may pay on fund distributions or on the redemption of fund shares.
2
Understanding Your Expenses – Columbia South Carolina Intermediate Municipal Bond Fund
As an investor, you incur two types of costs. There are transaction costs, which generally include sales charges on purchases and may include redemption fees. There are also ongoing costs, which generally include management fees, distribution and service (Rule 12b-1) fees, and other fund expenses. The following information is intended to help you understand your ongoing costs (in dollars) of investing in the Fund and to help you compare these costs with the ongoing costs of investing in other mutual funds.
Analyzing your fund's expenses
To illustrate these ongoing costs, we have provided examples and calculated the expenses paid by investors in each share class of the Fund during the period. The actual and hypothetical information in the table is based on an initial investment of $1,000 at the beginning of the period indicated and held for the entire period. Expense information is calculated two ways and each method provides you with different information. The amount listed in the "Actual" column is calculated using the Fund's actual operating expenses and total return for the period. You may use the Actual information, together with the amount invested, to estimate the expenses that you paid over the period. Simply divide your account value by $1,000 (for example, an $8,600 account value divided by $1,000 = 8.6), then multiply the results by the expenses paid during the period under the Actual column. The amount listed in the "Hypothetical" column assumes a 5% annual rate of return before expenses (which is not the Fund's actual return) and then applies the Fund's actual expense ratio for the period to the hypothetical return. You should not use the hypothetical account values and expenses to estimate either your actual account balance at the end of the period or the expenses you paid during the period. See "Compare with other funds" below for details on how to use the hypothetical data.
Compare with other funds
Since all mutual funds are required to include the same hypothetical calculations about expenses in shareholder reports, you can use this information to compare the ongoing cost of investing in the Fund with other funds. To do so, compare the hypothetical example with the 5% hypothetical examples that appear in the shareholder reports of other funds. As you compare hypothetical examples of other funds, it is important to note that hypothetical examples are meant to highlight the ongoing costs of investing in a fund only and do not reflect any transaction costs, such as sales charges, or redemption or exchange fees. Therefore, the hypothetical calculations are useful in comparing ongoing costs only, and will not help you determine the relative total costs of owning different funds. If transaction costs were included in these calculations, your costs would be higher.
November 1, 2011 – April 30, 2012
| | | Account value at the
beginning of the period ($) | | Account value at the
end of the period ($) | | Expenses paid
during the period ($) | | Fund's annualized
expense ratio (%) | |
| | | Actual | | Hypothetical | | Actual | | Hypothetical | | Actual | | Hypothetical | | Actual | |
| Class A | | | 1,000.00 | | | | 1,000.00 | | | | 1,043.50 | | | | 1,020.93 | | | | 4.01 | | | | 3.97 | | | | 0.79 | | |
| Class B | | | 1,000.00 | | | | 1,000.00 | | | | 1,039.50 | | | | 1,017.21 | | | | 7.81 | | | | 7.72 | | | | 1.54 | | |
| Class C | | | 1,000.00 | | | | 1,000.00 | | | | 1,039.60 | | | | 1,017.16 | | | | 7.86 | | | | 7.77 | | | | 1.55 | | |
| Class Z | | | 1,000.00 | | | | 1,000.00 | | | | 1,044.60 | | | | 1,022.18 | | | | 2.75 | | | | 2.72 | | | | 0.54 | | |
Expenses paid during the period are equal to the annualized expense ratio for each class as indicated above, multiplied by the average account value over the period and then multiplied by the number of days in the Fund's most recent six months and divided by 366.
Expenses do not include fees and expenses incurred indirectly by the Fund from the underlying funds in which the Fund may invest (also referred to as "acquired funds"), including affiliated and non-affiliated pooled investments vehicles (including mutual funds and exchange traded funds).
Had Columbia Management Investment Advisers, LLC and/or certain of its affiliates not waived/reimbursed certain fees and expenses, account value at the end of the period would have been reduced.
3
Portfolio Manager's Report – Columbia South Carolina Intermediate Municipal Bond Fund
Performance data quoted represents past performance and current performance may be lower or higher. Past performance is no guarantee of future results. The investment return and principal value will fluctuate so that shares, when redeemed, may be worth more or less than the original cost. Please visit www.columbiamanagement.com for daily and most recent month-end performance updates.
30-day SEC yields
as of 04/30/12 (%)
| Class A | | | 1.38 | | |
| Class B | | | 0.68 | | |
| Class C | | | 0.68 | | |
| Class Z | | | 1.67 | | |
The 30-day SEC yields reflect the fund's earning power, net of expenses, expressed as an annualized percentage of the public offering price per share at the end of the period. Had the Investment Manager and/or any of its affiliates not waived fees or reimbursed a portion of expenses, the 30-day SEC yields would have been lower.
Taxable equivalent SEC yields
as of 04/30/12 (%)
| Class A | | | 2.12 | | |
| Class B | | | 1.05 | | |
| Class C | | | 1.05 | | |
| Class Z | | | 2.57 | | |
Taxable-equivalent SEC yields are calculated assuming a federal tax rate of 35.0%. This tax rate does not reflect the phase out of exemptions or the reduction of the otherwise allowable deductions that occur when adjusted gross income exceeds certain levels. Your taxable-equivalent yield may be different depending on your tax bracket.
Quality breakdown(1)
as of 04/30/12 (%)
| AAA rating | | | 4.8 | | |
| AA rating | | | 62.0 | | |
| A rating | | | 23.7 | | |
| BBB rating | | | 5.9 | | |
| Not rated | | | 3.6 | | |
(1)Percentages indicated are based upon total fixed income securities (excluding Investments of Cash Collateral Received for Securities on Loan and money market funds).
Bond ratings apply to the underlying holdings of the Fund and not the Fund itself and are divided into categories ranging from AAA (highest) to D (lowest), and are subject to change. The ratings shown are determined by using the middle rating of Moody's, S&P, and Fitch after dropping the highest and lowest available ratings. When a rating from only two agencies is available, the lower rating is used. When a rating from only one agency is available, that rating is used. When a bond is not rated by one of these agencies, it is designated as Not rated. Credit ratings are subjective to opinions and not statements of fact.
The Board of Trustees for Columbia South Carolina Intermediate Municipal Bond Fund has approved the change of the fund's fiscal year end from March 31 to April 30. As a result, this report covers the 13-month period since the last annual report. The next report you receive will be for the six-month period from May 1, 2012 through October 31, 2012. In June 2011, Brian McGreevy became portfolio manager of the fund.
For the 13-month period that ended April 30, 2012, the fund's Class A shares returned 10.26% without sales charge. The fund's benchmark, the Barclays 3-15 Year Blend Municipal Bond Index, returned 11.05% for the period. An underweight in the very longest intermediate-maturity bonds detracted from results, as these were the best performers for the period.
An improving economic environment
Early in the 13-month period, Europe's debt problems and wrangling in Washington over the federal budget and the national debt dominated world headlines. U.S. economic news was lackluster, housing continued to be a nagging weak spot and job growth was disappointing. However, the pace of both economic and job growth picked up as the period wore on. Consumer confidence improved as the labor market added approximately 1.2 million new jobs between November 2011 and April 2012, while the jobless rate fell to 8.1%. Household net worth also picked up as the equity markets rebounded. Headline inflation rose 2.7%, driven primarily by rising food and energy prices. Despite a modest slowdown late in the summer of 2011, manufacturing activity continued to expand throughout the period.
Municipal market generates strong returns
Against this backdrop, the U.S. municipal bond market generated strong returns, despite a host of investor concerns at the outset of the period: 1) Net outflows from municipal mutual funds. 2) The expectation that heavy new issue volume would weigh on the market, which turned out to be unfounded. Issuance dropped off almost across the board. 3) Fears of massive defaults, which were stoked by the media and were generally overblown. With these concerns in mind, 10-year municipal yields reached a high of 3.5% before the European debt crisis sent investors scurrying for the safety of the Treasury market, pushing Treasury yields down. Municipal yields followed. (Bond yields and prices move in opposite directions.)
By the summer of 2011, investors seemed to believe that default expectations were excessive and demand for municipal bonds picked up. With yields close to historical lows, buyers moved down the credit curve—to A and BBB rated2 bonds—to garner additional income. Over the course of the 13-month period, these credits performed the best, as yields fell and the yield spread between higher and lower quality bonds tightened in response to demand. Yet, there were more downgrades than upgrades in the overall municipal market as a lackluster economy continued to pressure issuers.
Duration positioning, quality figured into fund returns
While the fund was generally in line with the index in terms of duration, a measure of interest rate sensitivity, it had less exposure to the longest intermediate maturities (14
2The credit quality ratings represent those of Moody's Investors Service, Inc. ("Moody's"), Standard & Poor's Corporation ("S&P") or Fitch Ratings ("Fitch") credit ratings. The ratings represent their opinions as to the quality of the securities they rate. Ratings are relative and subjective and are not absolute standards of quality. The security's credit quality does not eliminate risk.
4
Portfolio Manager's Report (continued) – Columbia South Carolina Intermediate Municipal Bond Fund
to 17 years), which detracted from performance as these maturities generated the best gains during the period. However, the fund had more exposure to bonds in the 10- to13-year range, which aided returns, and had less weight in three- to six-year bonds, which also was positive. The fund also benefited from having a slightly longer call structure than the index. A bond's "call" structure determines how long the bond must be held before the issuer can call it for redemption.
The fund's heavier weight in AA3 bonds was a drag on performance, as A rated bonds performed better. The electric revenue sector, which accounted for more than 12% of fund assets, was a further dag on returns, as its duration was slightly shorter than the index and its overall quality was higher than the index. Education and water & sewer bonds also underperformed, primarily due to their higher quality. Longer duration and lower quality holdings performed better during the period. By contrast, the hospital sector was positive for the fund and the index, generating 11%+ in returns for the period.
Putting cash to work
Positive cash inflows and decreasing the fund's exposure to shorter-term bonds and shorter calls allowed us to better position the fund with longer maturities. We added bonds in the 10- to 17-year range in the higher education, electric revenue and water & sewer sectors. Most of these new purchases also had longer call structures than the other securities in the fund.
South Carolina's economy gains momentum
After a weak period mid way through 2011, South Carolina's economy has registered steady gains in 2012. Employment has risen steadily and the outlook for manufacturing is generally upbeat. In particular, the auto industry is doing well. State revenues have been higher than expected. However, housing remains a drag on the South Carolina economy, with excess inventory still above historical norms. While we expect South Carolina to grow at an average pace in 2012, it could take several years for employment to return to its prerecession peak. Low business costs should help draw new investment into the state and enable above-average, long-term job growth.
Portfolio characteristics and holdings are subject to change periodically and may not be representative of current characteristics and holdings. The outlook for this fund may differ from that presented for other Columbia Funds.
Tax-exempt investing offers current tax-exempt income, but it also involves special risks. The value of the fund will be affected by interest rate changes and the creditworthiness of issues held in the fund. When interest rates go up, bond prices generally drop and vice versa.
Interest income from certain tax-exempt bonds may be subject to certain state and local taxes and, if applicable, the alternative minimum tax. Capital gains are not exempt from income taxes.
Single-state municipal bond funds pose additional risks due to limited geographical diversification.
5
Portfolio of Investments – Columbia South Carolina Intermediate Municipal Bond Fund
April 30, 2012
(Percentages represent value of investments compared to net assets)
Issue
Description | | Coupon
Rate | | Principal
Amount | | Value | |
| Municipal Bonds 95.6% | |
| AIRPORT 1.6% | |
County of Horry
Revenue Bonds
Series 2010A | |
| 07/01/18 | | | 5.000 | % | | $ | 1,315,000 | | | $ | 1,503,847 | | |
| 07/01/20 | | | 5.000 | % | | | 1,150,000 | | | | 1,327,215 | | |
| Total | | | | | | | | | | | 2,831,062 | | |
| FOREST PRODUCTS 0.3% | |
County of Georgetown
Revenue Bonds
International Paper Co. Project
Series 1997A AMT(a) | |
| 10/01/21 | | | 5.700 | % | | | 500,000 | | | | 500,375 | | |
| HIGHER EDUCATION 4.7% | |
College of Charleston
Refunding Revenue Bonds
Series 2012A | |
| 04/01/24 | | | 4.000 | % | | | 1,300,000 | | | | 1,443,195 | | |
| 04/01/26 | | | 4.000 | % | | | 1,390,000 | | | | 1,500,171 | | |
Florence-Darlington Commission for Technical Education
Revenue Bonds
Series 2005A (NPFGC) | |
| 03/01/18 | | | 5.000 | % | | | 1,725,000 | | | | 1,885,132 | | |
| 03/01/20 | | | 5.000 | % | | | 1,905,000 | | | | 2,081,841 | | |
University of South Carolina
Revenue Bonds
Series 2008A (AGM) | |
| 06/01/21 | | | 5.000 | % | | | 1,060,000 | | | | 1,235,674 | | |
| Total | | | | | | | | | | | 8,146,013 | | |
| HOSPITAL 14.2% | |
County of Charleston
Revenue Bonds
Care Alliance Health Services
Series 1999A (AGM) | |
| 08/15/15 | | | 5.125 | % | | | 6,120,000 | | | | 6,841,303 | | |
County of Greenwood
Refunding Revenue Bonds
Self Regional Healthcare
Series 2012B | |
| 10/01/27 | | | 5.000 | % | | | 1,750,000 | | | | 1,913,065 | | |
Greenville Hospital System Board
Refunding Revenue Bonds
Series 2008A | |
| 05/01/21 | | | 5.250 | % | | | 2,750,000 | | | | 3,142,755 | | |
Lexington County Health Services District, Inc.
Refunding Revenue Bonds
Series 2007 | |
| 11/01/17 | | | 5.000 | % | | | 1,230,000 | | | | 1,438,005 | | |
| 11/01/18 | | | 5.000 | % | | | 1,000,000 | | | | 1,172,540 | | |
South Carolina Jobs-Economic Development Authority
Refunding Revenue Bonds
Anmed Health Project
Series 2010 | |
| 02/01/17 | | | 5.000 | % | | | 1,000,000 | | | | 1,149,200 | | |
Palmetto Health
Series 2005A (AGM) | |
| 08/01/21 | | | 5.250 | % | | | 3,000,000 | | | | 3,342,270 | | |
Issue
Description | | Coupon
Rate | | Principal
Amount | | Value | |
| Municipal Bonds (continued) | |
| HOSPITAL (cont.) | |
Revenue Bonds
Kershaw County Medical Center Project
Series 2008 | |
| 09/15/25 | | | 5.500 | % | | $ | 1,925,000 | | | $ | 2,044,235 | | |
Unrefunded Revenue Bonds
Bon Secours Health
Series 2002B | |
| 11/15/23 | | | 5.500 | % | | | 2,235,000 | | | | 2,249,706 | | |
Spartanburg County Regional Health Services District
Revenue Bonds
Series 2008A | |
| 04/15/19 | | | 5.000 | % | | | 1,225,000 | | | | 1,423,426 | | |
| Total | | | | | | | | | | | 24,716,505 | | |
| INVESTOR OWNED 2.3% | |
County of Oconee
Refunding Revenue Bonds
Duke Power Co. Project
Series 2009 | |
| 02/01/17 | | | 3.600 | % | | | 2,000,000 | | | | 2,176,300 | | |
South Carolina Jobs-Economic Development Authority
Revenue Bonds
Electric & Gas Co. Project
Series 2002B (AMBAC) AMT(a) | |
| 11/01/12 | | | 4.200 | % | | | 1,750,000 | | | | 1,781,588 | | |
| Total | | | | | | | | | | | 3,957,888 | | |
| JOINT POWER AUTHORITY 6.8% | |
City of Easley
Refunding Revenue Bonds
Series 2011 (AGM) | |
| 12/01/28 | | | 5.000 | % | | | 1,000,000 | | | | 1,096,150 | | |
Piedmont Municipal Power Agency
Refunding Revenue Bonds
Series 2008A-3 (AGM) | |
| 01/01/17 | | | 5.000 | % | | | 2,000,000 | | | | 2,319,400 | | |
| 01/01/18 | | | 5.000 | % | | | 3,050,000 | | | | 3,575,515 | | |
South Carolina State Public Service Authority
Refunding Revenue Bonds
Series 2009A | |
| 01/01/28 | | | 5.000 | % | | | 2,000,000 | | | | 2,238,800 | | |
Revenue Bonds
Santee Cooper
Series 2006A (NPFGC) | |
| 01/01/30 | | | 5.000 | % | | | 1,000,000 | | | | 1,097,050 | | |
| Series 2009B | |
| 01/01/24 | | | 5.000 | % | | | 1,250,000 | | | | 1,437,525 | | |
| Total | | | | | | | | | | | 11,764,440 | | |
| LOCAL APPROPRIATION 19.5% | |
Berkeley County School District
Revenue Bonds
Securing Assets for Education
Series 2006 | |
| 12/01/20 | | | 5.000 | % | | | 1,000,000 | | | | 1,099,150 | | |
| 12/01/21 | | | 5.000 | % | | | 2,000,000 | | | | 2,182,680 | | |
| 12/01/22 | | | 5.000 | % | | | 3,545,000 | | | | 3,841,362 | | |
The Accompanying Notes to Financial Statements are an integral part of this statement.
6
Columbia South Carolina Intermediate Municipal Bond Fund
April 30, 2012
(Percentages represent value of investments compared to net assets)
Issue
Description | | Coupon
Rate | | Principal
Amount | | Value | |
| Municipal Bonds (continued) | |
| LOCAL APPROPRIATION (cont.) | |
Charleston Educational Excellence Finance Corp.
Revenue Bonds
Charleston County School District Project
Series 2006 | |
| 12/01/19 | | | 5.000 | % | | $ | 2,000,000 | | | $ | 2,279,720 | | |
County of Charleston
Refunding Certificate of Participation
Charleston Public Facilities Corp.
Series 2005 (NPFGC) | |
| 06/01/17 | | | 5.125 | % | | | 1,470,000 | | | | 1,647,414 | | |
Fort Mill School Facilities Corp.
Revenue Bonds
Series 2006 | |
| 12/01/17 | | | 5.000 | % | | | 2,900,000 | | | | 3,258,527 | | |
Greenville County School District
Refunding Revenue Bonds
Building Equity Sooner Tomorrow
Series 2006 | |
| 12/01/27 | | | 5.000 | % | | | 1,300,000 | | | | 1,446,445 | | |
Revenue Bonds
Building Equity Sooner Tomorrow
Series 2003 | |
| 12/01/16 | | | 5.250 | % | | | 2,625,000 | | | | 2,805,259 | | |
| Series 2006 (AGM) | |
| 12/01/15 | | | 5.000 | % | | | 500,000 | | | | 573,130 | | |
Hilton Head Island Public Facilities Corp.
Certificate of Participation
Beach Preservation Fee Pledge
Series 2006 (NPFGC) | |
| 08/01/14 | | | 5.000 | % | | | 1,600,000 | | | | 1,757,968 | | |
Newberry Investing in Children's Education
Revenue Bonds
Newberry County School District Project
Series 2005 | |
| 12/01/15 | | | 5.250 | % | | | 1,265,000 | | | | 1,401,013 | | |
Scago Educational Facilities Corp. for Colleton School District
Revenue Bonds
School Project
Series 2006 | |
| 12/01/14 | | | 5.000 | % | | | 1,325,000 | | | | 1,446,781 | | |
Scago Educational Facilities Corp. for Pickens School District
Revenue Bonds
Pickens County Project
Series 2006 (AGM) | |
| 12/01/23 | | | 5.000 | % | | | 5,000,000 | | | | 5,478,350 | | |
| 12/01/24 | | | 5.000 | % | | | 2,000,000 | | | | 2,176,860 | | |
Sumter Two School Facilities, Inc.
Refunding Revenue Bonds
Sumter County School District No. 2
Series 2007 | |
| 12/01/17 | | | 5.000 | % | | | 1,000,000 | | | | 1,170,830 | | |
Town of Hilton Head Island
Revenue Bonds
Series 2011A | |
| 06/01/23 | | | 5.000 | % | | | 555,000 | | | | 662,015 | | |
| 06/01/24 | | | 5.000 | % | | | 580,000 | | | | 685,966 | | |
| Total | | | | | | | | | | | 33,913,470 | | |
Issue
Description | | Coupon
Rate | | Principal
Amount | | Value | |
| Municipal Bonds (continued) | |
| LOCAL GENERAL OBLIGATION 6.1% | |
Anderson County School District No. 4
Unlimited General Obligation Bonds
Series 2006 (AGM) | |
| 03/01/19 | | | 5.250 | % | | $ | 1,115,000 | | | $ | 1,286,788 | | |
County of Charleston
Unlimited General Obligation Bonds
Improvement
Series 2009A | |
| 08/01/23 | | | 5.000 | % | | | 2,000,000 | | | | 2,397,620 | | |
| 08/01/24 | | | 5.000 | % | | | 2,000,000 | | | | 2,381,580 | | |
Spartanburg County School District No. 7
Unlimited General Obligation Bonds
Series 2001 | |
| 03/01/18 | | | 5.000 | % | | | 2,000,000 | | | | 2,355,400 | | |
| 03/01/21 | | | 5.000 | % | | | 1,940,000 | | | | 2,253,989 | | |
| Total | | | | | | | | | | | 10,675,377 | | |
| MUNICIPAL POWER 3.2% | |
City of Rock Hill
Improvement Refunding Revenue Bonds
Series 2003A (AGM) | |
| 01/01/19 | | | 5.375 | % | | | 1,500,000 | | | | 1,541,805 | | |
Refunding Revenue Bonds
Series 2012A (AGM) | |
| 01/01/23 | | | 5.000 | % | | | 1,560,000 | | | | 1,821,550 | | |
Puerto Rico Electric Power Authority
Revenue Bonds
Series 2007TT(b) | |
| 07/01/20 | | | 5.000 | % | | | 1,000,000 | | | | 1,087,580 | | |
Town of Winnsboro Combined Utility System
Refunding Revenue Bonds
Series 1999 (NPFGC) | |
| 08/15/13 | | | 5.250 | % | | | 1,020,000 | | | | 1,076,814 | | |
| Total | | | | | | | | | | | 5,527,749 | | |
| PORTS 1.0% | |
South Carolina State Ports Authority
Revenue Bonds
Series 2010 | |
| 07/01/16 | | | 5.000 | % | | | 500,000 | | | | 577,255 | | |
| 07/01/23 | | | 5.250 | % | | | 1,000,000 | | | | 1,185,380 | | |
| Total | | | | | | | | | | | 1,762,635 | | |
| REFUNDED/ESCROWED 5.5% | |
City of Columbia
Revenue Bonds
Series 2005 (AGM) | |
| 02/01/23 | | | 5.000 | % | | | 2,000,000 | | | | 2,247,660 | | |
| 02/01/27 | | | 5.000 | % | | | 1,500,000 | | | | 1,685,745 | | |
Lexington County Health Services District, Inc.
Prerefunded 11/01/13 Revenue Bonds
Series 2003 | |
| 11/01/23 | | | 5.500 | % | | | 2,000,000 | | | | 2,155,280 | | |
Puerto Rico Highway & Transportation Authority
Refunding Revenue Bonds
Series 2003AA Escrowed to Maturity (NPFGC)(b) | |
| 07/01/18 | | | 5.500 | % | | | 1,050,000 | | | | 1,316,983 | | |
The Accompanying Notes to Financial Statements are an integral part of this statement.
7
Columbia South Carolina Intermediate Municipal Bond Fund
April 30, 2012
(Percentages represent value of investments compared to net assets)
Issue
Description | | Coupon
Rate | | Principal
Amount | | Value | |
| Municipal Bonds (continued) | |
| REFUNDED/ESCROWED (cont.) | |
Town of Lexington Waterworks & Sewer System
Prerefunded 10/01/14 Revenue Bonds
Series 1997 | |
| 04/01/19 | | | 5.450 | % | | $ | 2,000,000 | | | $ | 2,183,960 | | |
| Total | | | | | | | | | | | 9,589,628 | | |
| RESOURCE RECOVERY 1.2% | |
Three Rivers Solid Waste Authority(c)
Revenue Bonds
Capital Appreciation-Landfill Gas Project
Series 2007 | |
| 10/01/24 | | | 0.000 | % | | | 1,835,000 | | | | 1,120,286 | | |
| 10/01/25 | | | 0.000 | % | | | 1,835,000 | | | | 1,059,511 | | |
| Total | | | | | | | | | | | 2,179,797 | | |
| RETIREMENT COMMUNITIES 2.9% | |
South Carolina Jobs-Economic Development Authority
Refunding Revenue Bonds
1st Mortgage-Episcopal Church
Series 2007 | |
| 04/01/15 | | | 5.000 | % | | | 525,000 | | | | 562,259 | | |
| 04/01/16 | | | 5.000 | % | | | 600,000 | | | | 649,476 | | |
1st Mortgage-Lutheran Homes
Series 2007 | |
| 05/01/16 | | | 5.000 | % | | | 1,245,000 | | | | 1,264,385 | | |
| 05/01/21 | | | 5.375 | % | | | 1,650,000 | | | | 1,663,150 | | |
1st Mortgage-Wesley Commons
Series 2006 | |
| 10/01/26 | | | 5.125 | % | | | 1,000,000 | | | | 908,830 | | |
| Total | | | | | | | | | | | 5,048,100 | | |
| SINGLE FAMILY 0.6% | |
South Carolina State Housing Finance & Development
Authority
Revenue Bonds
Series 2010-1 (GNMA/FNMA/FHLMC) | |
| 01/01/28 | | | 5.000 | % | | | 890,000 | | | | 964,724 | | |
| SPECIAL NON PROPERTY TAX 3.4% | |
City of Greenville
Improvement Refunding Bonds
Series 2011 (AGM) | |
| 04/01/21 | | | 5.000 | % | | | 1,290,000 | | | | 1,556,694 | | |
Puerto Rico Infrastructure Financing Authority
Refunding Revenue Bonds
Series 2005C (FGIC)(b) | |
| 07/01/20 | | | 5.500 | % | | | 1,200,000 | | | | 1,352,832 | | |
Territory of Guam
Revenue Bonds
Series 2011A(b) | |
| 01/01/31 | | | 5.000 | % | | | 400,000 | | | | 439,536 | | |
Town of Hilton Head Island
Revenue Bonds
Series 2002 (NPFGC) | |
| 12/01/16 | | | 5.250 | % | | | 1,440,000 | | | | 1,479,643 | | |
Virgin Islands Public Finance Authority
Revenue Bonds
Senior Lien-Matching Fund Loan Note
Series 2010A(b) | |
| 10/01/25 | | | 5.000 | % | | | 1,060,000 | | | | 1,138,239 | | |
| Total | | | | | | | | | | | 5,966,944 | | |
Issue
Description | | Coupon
Rate | | Principal
Amount | | Value | |
| Municipal Bonds (continued) | |
| STATE GENERAL OBLIGATION 1.3% | |
State of South Carolina
Unlimited General Obligation Bonds
State Economic Development
Series 2010B | |
| 04/01/23 | | | 5.000 | % | | $ | 1,775,000 | | | $ | 2,218,164 | | |
| STUDENT LOAN 1.5% | |
South Carolina State Education Assistance Authority
Revenue Bonds
Student Loan
Series 2009I | |
| 10/01/24 | | | 5.000 | % | | | 2,475,000 | | | | 2,697,948 | | |
| TRANSPORTATION 3.5% | |
South Carolina Transportation Infrastructure Bank
Refunding Revenue Bonds
Series 2005A (AMBAC) | |
| 10/01/20 | | | 5.250 | % | | | 4,880,000 | | | | 6,018,162 | | |
| TURNPIKE/BRIDGE/TOLL ROAD —% | |
Puerto Rico Highway & Transportation Authority
Refunding Revenue Bonds
Series 2003AA (NPFGC)(b) | |
| 07/01/18 | | | 5.500 | % | | | 50,000 | | | | 57,021 | | |
| WATER & SEWER 16.0% | |
Anderson Regional Joint Water System
Refunding Revenue Bonds
Series 2011A | |
| 07/15/13 | | | 4.000 | % | | | 685,000 | | | | 713,722 | | |
| 07/15/14 | | | 4.000 | % | | | 1,000,000 | | | | 1,072,430 | | |
| Series 2012 | |
| 07/15/28 | | | 5.000 | % | | | 2,000,000 | | | | 2,303,780 | | |
Beaufort-Jasper Water & Sewer Authority
Improvement Refunding Revenue Bonds
Series 2006 (AGM) | |
| 03/01/23 | | | 5.000 | % | | | 1,500,000 | | | | 1,756,725 | | |
| 03/01/25 | | | 4.750 | % | | | 3,000,000 | | | | 3,351,990 | | |
City of Charleston
Refunding Revenue Bonds
Series 2009A | |
| 01/01/21 | | | 5.000 | % | | | 2,500,000 | | | | 3,007,550 | | |
City of Columbia
Refunding Revenue Bonds
Series 2011A | |
| 02/01/27 | | | 5.000 | % | | | 2,435,000 | | | | 2,868,674 | | |
| Series 2012 | |
| 02/01/23 | | | 4.000 | % | | | 1,360,000 | | | | 1,549,829 | | |
County of Berkeley Water & Sewer
Refunding Revenue Bonds
Series 2008A (AGM) | |
| 06/01/21 | | | 5.000 | % | | | 1,000,000 | | | | 1,175,300 | | |
Unrefunded Revenue Bonds
Series 2003 (NPFGC) | |
| 06/01/19 | | | 5.250 | % | | | 155,000 | | | | 161,885 | | |
North Charleston Sewer District
Refunding Revenue Bonds
Series 2002 (AGM) | |
| 07/01/17 | | | 5.500 | % | | | 3,040,000 | | | | 3,097,608 | | |
The Accompanying Notes to Financial Statements are an integral part of this statement.
8
Columbia South Carolina Intermediate Municipal Bond Fund
April 30, 2012
(Percentages represent value of investments compared to net assets)
Issue
Description | | Coupon
Rate | | Principal
Amount | | Value | |
| Municipal Bonds (continued) | |
| WATER & SEWER (cont.) | |
Renewable Water Resources
Refunding Revenue Bonds
Series 2005B (AGM) | |
| 03/01/19 | | | 5.250 | % | | $ | 1,000,000 | | | $ | 1,234,500 | | |
| Series 2010A | |
| 01/01/20 | | | 5.000 | % | | | 1,500,000 | | | | 1,838,760 | | |
| | | Series 2012 | |
| 01/01/24 | | | 5.000 | % | | | 2,000,000 | | | | 2,415,600 | | |
Town of Mount Pleasant
Improvement Refunding Revenue Bonds
Series 2002 (NPFGC/FGIC) | |
| 12/01/18 | | | 5.250 | % | | | 1,270,000 | | | | 1,304,201 | | |
| Total | | | | | | | | | | | 27,852,554 | | |
Total Municipal Bonds
(Cost: $153,919,141) | | $ | 166,388,556 | | |
| | | | | Shares | | Value | |
| Money Market Funds 3.4% | |
JPMorgan Tax-Free Money Market
Fund, 0.010%(d) | | | | | | | 5,991,707 | | | $ | 5,991,707 | | |
Total Money Market Funds
(Cost: $5,991,707) | | $ | 5,991,707 | | |
Total Investments
(Cost: $159,910,848) | | | | | | | | | | $ | 172,380,263 | | |
| Other Assets & Liabilities, Net | | | | | | | | | | | 1,750,095 | | |
| Total Net Assets | | $ | 174,130,358 | | |
Notes to Portfolio of Investments
(a) At April 30, 2012, the value of securities subject to alternative minimum tax was $2,281,963, representing 1.31% of net assets.
(b) Municipal obligations include debt obligations issued by or on behalf of territories, possessions, or sovereign nations within the territorial boundaries of the United States. At April 30, 2012, the value of these securities amounted to $5,392,191 or 3.10% of net assets.
(c) Zero coupon bond.
(d) The rate shown is the seven-day current annualized yield at April 30, 2012.
Abbreviation Legend
AGM Assured Guaranty Municipal Corporation
AMBAC Ambac Assurance Corporation
AMT Alternative Minimum Tax
FGIC Financial Guaranty Insurance Company
FHLMC Federal Home Loan Mortgage Corporation
FNMA Federal National Mortgage Association
GNMA Government National Mortgage Association
NPFGC National Public Finance Guarantee Corporation
Fair Value Measurements
Generally accepted accounting principles (GAAP) require disclosure regarding the inputs and valuation techniques used to measure fair value and any changes in valuation inputs or techniques. In addition, investments shall be disclosed by major category.
The Fund categorizes its fair value measurements according to a three-level hierarchy that maximizes the use of observable inputs and minimizes the use of unobservable inputs by prioritizing that the most observable input be used when available. Observable inputs are those that market participants would use in pricing an investment based on market data obtained from sources independent of the reporting entity. Unobservable inputs are those that reflect the Fund's assumptions about the information market participants would use in pricing an investment. An investment's level within the fair value hierarchy is based on the lowest level of any input that is deemed significant to the asset or liability's fair value measurement. The input levels are not necessarily an indication of the risk or liquidity associated with investments at that level. For example, certain U.S. government securities are generally high quality and liquid, however, they are reflected as Level 2 because the inputs used to determine fair value may not always be quoted prices in an active market.
Fair value inputs are summarized in the three broad levels listed below:
• Level 1 — Valuations based on quoted prices for investments in active markets that the Fund has the ability to access at the measurement date (including NAV for open-end mutual funds). Valuation adjustments are not applied to Level 1 investments.
• Level 2 — Valuations based on other significant observable inputs (including quoted prices for similar securities, interest rates, prepayment speeds, credit risks, etc.).
The Accompanying Notes to Financial Statements are an integral part of this statement.
9
Columbia South Carolina Intermediate Municipal Bond Fund
April 30, 2012
Fair Value Measurements (continued)
• Level 3 — Valuations based on significant unobservable inputs (including the Fund's own assumptions and judgment in determining the fair value of investments).
Inputs that are used in determining fair value of an investment may include price information, credit data, volatility statistics, and other factors. These inputs can be either observable or unobservable. The availability of observable inputs can vary between investments, and is affected by various factors such as the type of investment, and the volume and level of activity for that investment or similar investments in the marketplace. The inputs will be considered by the Investment Manager, along with any other relevant factors in the calculation of an investment's fair value. The Fund uses prices and inputs that are current as of the measurement date, which may include periods of market dislocations. During these periods, the availability of prices and inputs may be reduced for many investments. This condition could cause an investment to be reclassified between the various levels within the hierarchy.
Investments falling into the Level 3 category are primarily supported by quoted prices from brokers and dealers participating in the market for those investments. However, these may be classified as Level 3 investments due to lack of market transparency and corroboration to support these quoted prices. Additionally, valuation models may be used as the pricing source for any remaining investments classified as Level 3. These models rely on one or more significant unobservable inputs and/or significant assumptions by the Investment Manager. Inputs used in valuations may include, but are not limited to, financial statement analysis, capital account balances, discount rates and estimated cash flows, and comparable company data.
Under the direction of the Fund's Board of Trustees (the Board), the Investment Manager's Valuation Committee (the Committee) is responsible for carrying out the valuation procedures approved by the Board. The Committee consists of voting and non-voting members from various groups within the Investment Manager's organization, including operations and accounting, trading and investments, compliance, risk management and legal.
The Committee meets at least monthly to review and approve valuation matters, which may include a description of specific valuation determinations, data regarding pricing information received from approved pricing vendors and brokers and the results of Board-approved valuation control policies and procedures (the Policies). The Policies address, among other things, instances when market quotations are readily available, including recommendation of third party pricing vendors and a determination of appropriate pricing methodologies; events that require specific valuation determinations and assessment of fair value techniques; securities with a potential for stale pricing, including those that are illiquid, restricted, or in default; and the effectiveness of third-party pricing vendors, including periodic reviews of vendors. The Committee meets more frequently, as needed, to discuss additional valuation matters, which may include the need to review back-testing results, review time-sensitive information or approve related valuation actions. The Committee reports to the Board, with members of the Committee meeting with the Board at each of its regularly scheduled meetings to discuss valuation matters and actions during the period, similar to those described earlier.
For investments categorized as Level 3, the Committee monitors information similar to that described above, which may include: (i) data specific to the issuer or comparable issuers, (ii) general market or specific sector news and (iii) quoted prices and specific or similar security transactions. The Committee considers this data and any changes from prior periods in order to assess the reasonableness of observable and unobservable inputs, any assumptions or internal models used to value those securities and changes in fair value. This data is also used to corroborate, when available, information received from approved pricing vendors and brokers. Various factors impact the frequency of monitoring this information (which may occur as often as daily). However, the Committee may determine that changes to inputs, assumptions and models are not required as a result of the monitoring procedures performed.
The following table is a summary of the inputs used to value the Fund's investments as of April 30, 2012:
| | | Fair Value at April 30, 2012 | |
| Description | | Level 1
Quoted Prices
in Active
Markets for
Identical Assets | | Level 2
Other
Significant
Observable
Inputs | | Level 3
Significant
Unobservable
Inputs | | Total | |
| Bonds | |
| Municipal Bonds | | $ | — | | | $ | 166,388,556 | | | $ | — | | | $ | 166,388,556 | | |
| Total Bonds | | | — | | | | 166,388,556 | | | | — | | | | 166,388,556 | | |
| Other | |
| Money Market Funds | | | 5,991,707 | | | | — | | | | — | | | | 5,991,707 | | |
| Total Other | | | 5,991,707 | | | | — | | | | — | | | | 5,991,707 | | |
| Total Investments | | $ | 5,991,707 | | | $ | 166,388,556 | | | $ | — | | | $ | 172,380,263 | | |
See the Portfolio of Investments for all investment classifications not indicated in the table.
The Fund's assets assigned to the Level 2 input category are generally valued using the market approach, in which a security's value is determined through reference to prices and information from market transactions for similar or identical assets.
There were no transfers of financial assets between Levels 1 and 2 during the period from April 1, 2012 to April 30, 2012.
The Accompanying Notes to Financial Statements are an integral part of this statement.
10
Columbia South Carolina Intermediate Municipal Bond Fund
April 30, 2012
The following table is a summary of the inputs used to value the Fund's investments as of March 31, 2012:
| | | Fair Value at March 31, 2012 | |
| Description | | Level 1
Quoted Prices
in Active
Markets for
Identical Assets | | Level 2
Other
Significant
Observable
Inputs | | Level 3
Significant
Unobservable
Inputs | | Total | |
| Bonds | |
| Municipal Bonds | | $ | — | | | $ | 163,041,973 | | | $ | — | | | $ | 163,041,973 | | |
| Total Bonds | | | — | | | | 163,041,973 | | | | — | | | | 163,041,973 | | |
| Other | |
| Money Market Funds | | | 9,099,445 | | | | — | | | | — | | | | 9,099,445 | | |
| Total Other | | | 9,099,445 | | | | — | | | | — | | | | 9,099,445 | | |
| Total Investments | | $ | 9,099,445 | | | $ | 163,041,973 | | | $ | — | | | $ | 172,141,418 | | |
The Fund's assets assigned to the Level 2 input category are generally valued using the market approach, in which a security's value is determined through reference to prices and information from market transactions for similar or identical assets.
There were no transfers of financial assets between Levels 1 and 2 during the period from April 1, 2012 to March 31, 2012.
The Accompanying Notes to Financial Statements are an integral part of this statement.
11
Statement of Assets and Liabilities – Columbia South Carolina Intermediate Municipal Bond Fund
| | | April 30,
2012 | | March 31,
2012 | |
| Assets | |
| Investments, at value (identified cost $159,910,848 and $161,196,325) | | $ | 172,380,263 | | | $ | 172,141,418 | | |
| Receivable for: | |
| Investments sold | | | — | | | | 56,000 | | |
| Capital shares sold | | | 297,550 | | | | 174,283 | | |
| Interest | | | 2,085,313 | | | | 1,936,619 | | |
| Expense reimbursement due from Investment Manager | | | 2,476 | | | | 1,012 | | |
| Prepaid expense | | | 1,842 | | | | 3,685 | | |
| Total assets | | | 174,767,444 | | | | 174,313,017 | | |
| Liabilities | |
| Payable for: | |
| Investments purchased on a delayed delivery basis | | | — | | | | 4,008,320 | | |
| Capital shares purchased | | | 56,856 | | | | 45,043 | | |
| Dividend distributions to shareholders | | | 433,290 | | | | 439,989 | | |
| Investment management fees | | | 5,650 | | | | 1,855 | | |
| Distribution and service fees | | | 1,665 | | | | 530 | | |
| Transfer agent fees | | | 26,278 | | | | 27,715 | | |
| Administration fees | | | 989 | | | | 325 | | |
| Compensation of board members | | | 79,677 | | | | 79,145 | | |
| Other expenses | | | 32,681 | | | | 52,514 | | |
| Total liabilities | | | 637,086 | | | | 4,655,436 | | |
| Net assets applicable to outstanding capital stock | | $ | 174,130,358 | | | $ | 169,657,581 | | |
The Accompanying Notes to Financial Statements are an integral part of this statement.
12
Statement of Assets and Liabilities (continued) – Columbia South Carolina Intermediate Municipal Bond Fund
| | | April 30,
2012 | | March 31,
2012 | |
| Represented by | |
| Paid-in capital | | $ | 161,315,761 | | | $ | 158,381,543 | | |
| Undistributed net investment income | | | 1,101,374 | | | | 1,087,137 | | |
| Accumulated net realized loss | | | (756,192 | ) | | | (756,192 | ) | |
| Unrealized appreciation (depreciation) on: | |
| Investments | | | 12,469,415 | | | | 10,945,093 | | |
| Total — representing net assets applicable to outstanding capital stock | | $ | 174,130,358 | | | $ | 169,657,581 | | |
| Net assets applicable to outstanding shares | |
| Class A | | $ | 24,706,598 | | | $ | 24,747,967 | | |
| Class B | | $ | 155,177 | | | $ | 153,671 | | |
| Class C | | $ | 14,041,490 | | | $ | 13,092,686 | | |
| Class Z | | $ | 135,227,093 | | | $ | 131,663,257 | | |
| Shares outstanding | |
| Class A | | | 2,300,381 | | | | 2,325,035 | | |
| Class B | | | 14,441 | | | | 14,430 | | |
| Class C | | | 1,306,564 | | | | 1,229,274 | | |
| Class Z | | | 12,584,707 | | | | 12,363,626 | | |
| Net asset value per share | |
| Class A(a) | | $ | 10.74 | | | $ | 10.64 | | |
| Class B | | $ | 10.75 | | | $ | 10.65 | | |
| Class C | | $ | 10.75 | | | $ | 10.65 | | |
| Class Z | | $ | 10.75 | | | $ | 10.65 | | |
(a) At April 30, 2012 and March 31, 2012, the maximum offering price per share for Class A is $11.10 and $11.00, respectively. The offering price is calculated by dividing the net asset value by 1.0 minus the maximum sales charge of 3.25%.
The Accompanying Notes to Financial Statements are an integral part of this statement.
13
Statement of Operations – Columbia South Carolina Intermediate Municipal Bond Fund
| Year ended | | April 30,
2012(a) | | March 31,
2012 | |
| Net investment income | |
| Income: | |
| Dividends | | $ | 78 | | | $ | 1,080 | | |
| Interest | | | 542,838 | | | | 6,299,825 | | |
| Total income | | | 542,916 | | | | 6,300,905 | | |
| Expenses: | |
| Investment management fees | | | 57,983 | | | | 637,516 | | |
| Distribution fees | |
| Class B | | | 98 | | | | 1,395 | | |
| Class C | | | 8,608 | | | | 87,833 | | |
| Service fees | |
| Class B | | | 33 | | | | 465 | | |
| Class C | | | 2,869 | | | | 29,278 | | |
| Distribution and service fees — Class A | | | 5,241 | | | | 52,767 | | |
| Transfer agent fees | |
| Class A | | | 3,700 | | | | 43,215 | | |
| Class B | | | 23 | | | | 465 | | |
| Class C | | | 2,000 | | | | 23,534 | | |
| Class Z | | | 18,491 | | | | 244,447 | | |
| Administration fees | | | 10,147 | | | | 135,833 | | |
| Compensation of board members | | | 1,066 | | | | 17,656 | | |
| Pricing and bookkeeping fees | | | — | | | | 8,707 | | |
| Custodian fees | | | 237 | | | | 5,790 | | |
| Printing and postage fees | | | — | | | | 42,417 | | |
| Registration fees | | | 50 | | | | 1,346 | | |
| Professional fees | | | 9,783 | | | | 60,549 | | |
| Other | | | 2,207 | | | | 18,968 | | |
| Total expenses | | | 122,536 | | | | 1,412,182 | | |
| Fees waived or expenses reimbursed by Investment Manager and its affiliates | | | (27,147 | ) | | | (377,522 | ) | |
| Expense reductions | | | — | | | | (60 | ) | |
| Total net expenses | | | 95,389 | | | | 1,034,600 | | |
| Net investment income | | | 447,527 | | | | 5,266,305 | | |
| Realized and unrealized gain (loss) — net | |
| Net realized gain (loss) on: | |
| Investments | | | — | | | | 109,317 | | |
| Net realized gain | | | — | | | | 109,317 | | |
| Net change in unrealized appreciation (depreciation) on: | |
| Investments | | | 1,524,322 | | | | 8,441,009 | | |
| Net change in unrealized appreciation | | | 1,524,322 | | | | 8,441,009 | | |
| Net realized and unrealized gain | | | 1,524,322 | | | | 8,550,326 | | |
| Net increase in net assets resulting from operations | | $ | 1,971,849 | | | $ | 13,816,631 | | |
(a) For the period from April 1, 2012 to April 30, 2012. During the period, the Fund's fiscal year end was changed from March 31 to April 30.
The Accompanying Notes to Financial Statements are an integral part of this statement.
14
Statement of Changes in Net Assets – Columbia South Carolina Intermediate Municipal Bond Fund
| Year ended | | April 30,
2012(a) | | March 31,
2012 | | March 31,
2011 | |
| Operations | |
| Net investment income | | $ | 447,527 | | | $ | 5,266,305 | | | $ | 6,266,890 | | |
| Net realized gain | | | — | | | | 109,317 | | | | 1,946,509 | | |
| Net change in unrealized appreciation (depreciation) | | | 1,524,322 | | | | 8,441,009 | | | | (3,484,580 | ) | |
| Net increase in net assets resulting from operations | | | 1,971,849 | | | | 13,816,631 | | | | 4,728,819 | | |
| Distributions to shareholders from: | |
| Net investment income | |
| Class A | | | (59,883 | ) | | | (672,366 | ) | | | (725,948 | ) | |
| Class B | | | (278 | ) | | | (4,556 | ) | | | (23,049 | ) | |
| Class C | | | (24,319 | ) | | | (286,015 | ) | | | (261,647 | ) | |
| Class Z | | | (348,810 | ) | | | (4,335,919 | ) | | | (5,256,247 | ) | |
| Total distributions to shareholders | | | (433,290 | ) | | | (5,298,856 | ) | | | (6,266,891 | ) | |
| Increase (decrease) in net assets from share transactions | | | 2,934,218 | | | | 5,247,959 | | | | (28,142,285 | ) | |
| Total increase (decrease) in net assets | | | 4,472,777 | | | | 13,765,734 | | | | (29,680,357 | ) | |
| Net assets at beginning of year | | | 169,657,581 | | | | 155,891,847 | | | | 185,572,204 | | |
| Net assets at end of year | | $ | 174,130,358 | | | $ | 169,657,581 | | | $ | 155,891,847 | | |
| Undistributed net investment income | | $ | 1,101,374 | | | $ | 1,087,137 | | | $ | 1,123,082 | | |
(a) For the period from April 1, 2012 to April 30, 2012. During the period, the Fund's fiscal year end was changed from March 31 to April 30.
The Accompanying Notes to Financial Statements are an integral part of this statement.
15
Statement of Changes in Net Assets (continued) – Columbia South Carolina Intermediate Municipal Bond Fund
| Year ended | | April 30, 2012(a) | | March 31, 2012 | | March 31, 2011 | |
| | | Shares | | Dollars ($) | | Shares | | Dollars ($) | | Shares | | Dollars ($) | |
| Capital stock activity | |
| Class A shares | |
| Subscriptions(b) | | | 57,198 | | | | 611,384 | | | | 705,043 | | | | 7,433,042 | | | | 425,661 | | | | 4,369,782 | | |
| Distributions reinvested | | | 3,359 | | | | 36,073 | | | | 33,351 | | | | 351,090 | | | | 28,453 | | | | 292,547 | | |
| Redemptions | | | (85,211 | ) | | | (912,345 | ) | | | (250,572 | ) | | | (2,639,648 | ) | | | (988,465 | ) | | | (10,313,460 | ) | |
| Net increase (decrease) | | | (24,654 | ) | | | (264,888 | ) | | | 487,822 | | | | 5,144,484 | | | | (534,351 | ) | | | (5,651,131 | ) | |
| Class B shares | |
| Subscriptions | | | — | | | | — | | | | 38 | | | | 400 | | | | 183 | | | | 1,904 | | |
| Distributions reinvested | | | 24 | | | | 255 | | | | 342 | | | | 3,588 | | | | 1,132 | | | | 11,664 | | |
| Redemptions(b) | | | (13 | ) | | | (133 | ) | | | (10,371 | ) | | | (107,905 | ) | | | (92,375 | ) | | | (944,122 | ) | |
| Net increase (decrease) | | | 11 | | | | 122 | | | | (9,991 | ) | | | (103,917 | ) | | | (91,060 | ) | | | (930,554 | ) | |
| Class C shares | |
| Subscriptions | | | 78,311 | | | | 839,222 | | | | 452,974 | | | | 4,754,965 | | | | 218,107 | | | | 2,243,051 | | |
| Distributions reinvested | | | 1,258 | | | | 13,519 | | | | 13,353 | | | | 140,594 | | | | 10,407 | | | | 107,061 | | |
| Redemptions | | | (2,279 | ) | | | (24,431 | ) | | | (231,851 | ) | | | (2,440,406 | ) | | | (147,265 | ) | | | (1,511,610 | ) | |
| Net increase | | | 77,290 | | | | 828,310 | | | | 234,476 | | | | 2,455,153 | | | | 81,249 | | | | 838,502 | | |
| Class Z shares | |
| Subscriptions | | | 259,079 | | | | 2,778,174 | | | | 2,593,620 | | | | 27,444,929 | | | | 2,393,454 | | | | 24,761,171 | | |
| Distributions reinvested | | | 2,912 | | | | 31,303 | | | | 34,037 | | | | 357,402 | | | | 31,046 | | | | 319,327 | | |
| Redemptions | | | (40,910 | ) | | | (438,803 | ) | | | (2,872,432 | ) | | | (30,050,092 | ) | | | (4,651,717 | ) | | | (47,479,600 | ) | |
| Net increase (decrease) | | | 221,081 | | | | 2,370,674 | | | | (244,775 | ) | | | (2,247,761 | ) | | | (2,227,217 | ) | | | (22,399,102 | ) | |
| Total net increase (decrease) | | | 273,728 | | | | 2,934,218 | | | | 467,532 | | | | 5,247,959 | | | | (2,771,379 | ) | | | (28,142,285 | ) | |
(a) For the period from April 1, 2012 to April 30, 2012. During the period, the Fund's fiscal year end was changed from March 31 to April 30.
(b) Includes conversions of Class B shares to Class A shares, if any.
The Accompanying Notes to Financial Statements are an integral part of this statement.
16
Financial Highlights – Columbia South Carolina Intermediate Municipal Bond Fund
The following tables are intended to help you understand the Fund's financial performance. Certain information reflects financial results for a single share of a class held for the periods shown. Per share net investment income (loss) amounts are calculated based on average shares outstanding during the period. Total returns assume reinvestment of all dividends and distributions. Total returns do not reflect payments of sales charges, if any, and are not annualized for periods of less than one year.
| | | Year ended
April 30, | | March 31, | |
| | | 2012(a) | | 2012 | | 2011 | | 2010 | | 2009 | | 2008 | |
| Class A | |
| Per share data | |
| Net asset value, beginning of period | | $ | 10.64 | | | $ | 10.08 | | | $ | 10.17 | | | $ | 9.84 | | | $ | 10.01 | | | $ | 10.27 | | |
| Income from investment operations: | |
| Net investment income | | | 0.03 | | | | 0.33 | | | | 0.35 | | | | 0.34 | | | | 0.37 | | | | 0.39 | | |
| Net realized and unrealized gain (loss) | | | 0.10 | | | | 0.56 | | | | (0.09 | ) | | | 0.33 | | | | (0.17 | ) | | | (0.25 | ) | |
| Total from investment operations | | | 0.13 | | | | 0.89 | | | | 0.26 | | | | 0.67 | | | | 0.20 | | | | 0.14 | | |
| Less distributions to shareholders from: | |
| Net investment income | | | (0.03 | ) | | | (0.33 | ) | | | (0.35 | ) | | | (0.34 | ) | | | (0.37 | ) | | | (0.38 | ) | |
| Net realized gains | | | — | | | | — | | | | — | | | | — | | | | — | | | | (0.02 | ) | |
| Total distributions to shareholders | | | (0.03 | ) | | | (0.33 | ) | | | (0.35 | ) | | | (0.34 | ) | | | (0.37 | ) | | | (0.40 | ) | |
| Net asset value, end of period | | $ | 10.74 | | | $ | 10.64 | | | $ | 10.08 | | | $ | 10.17 | | | $ | 9.84 | | | $ | 10.01 | | |
| Total return | | | 1.18 | % | | | 8.97 | % | | | 2.54 | % | | | 6.91 | % | | | 2.09 | % | | | 1.39 | % | |
| Ratios to average net assets(b) | |
| Expenses prior to fees waived or expenses reimbursed | | | 0.99 | %(c) | | | 1.04 | % | | | 0.95 | % | | | 0.91 | % | | | 0.88 | % | | | 0.90 | % | |
| Net expenses after fees waived or expenses reimbursed(d) | | | 0.79 | %(c) | | | 0.79 | %(e) | | | 0.80 | %(e) | | | 0.78 | %(e) | | | 0.75 | %(e) | | | 0.75 | %(e) | |
| Net investment income | | | 2.95 | %(c) | | | 3.16 | %(e) | | | 3.41 | %(e) | | | 3.39 | %(e) | | | 3.76 | %(e) | | | 3.78 | %(e) | |
| Supplemental data | |
| Net assets, end of period (in thousands) | | $ | 24,707 | | | $ | 24,748 | | | $ | 18,513 | | | $ | 24,126 | | | $ | 23,865 | | | $ | 16,007 | | |
| Portfolio turnover | | | 0 | % | | | 9 | % | | | 15 | % | | | 16 | % | | | 21 | % | | | 13 | % | |
Notes to Financial Highlights
(a) For the period from April 1, 2012 to April 30, 2012. During the period, the Fund's fiscal year end was changed from March 31 to April 30.
(b) In addition to the fees and expenses which the Fund bears directly, the Fund indirectly bears a pro rata share of the fees and expenses of the acquired funds in which it invests. Such indirect expenses are not included in the reported expense ratios.
(c) Annualized.
(d) The Investment Manager and certain of its affiliates agreed to waive/reimburse certain fees and expenses, if applicable.
(e) The benefits derived from expense reductions had an impact of less than 0.01%.
The Accompanying Notes to Financial Statements are an integral part of this statement.
17
Financial Highlights (continued) – Columbia South Carolina Intermediate Municipal Bond Fund
| | | Year ended
April 30, | | March 31, | |
| | | 2012(a) | | 2012 | | 2011 | | 2010 | | 2009 | | 2008 | |
| Class B | |
| Per share data | |
| Net asset value, beginning of period | | $ | 10.65 | | | $ | 10.08 | | | $ | 10.18 | | | $ | 9.85 | | | $ | 10.01 | | | $ | 10.27 | | |
| Income from investment operations: | |
| Net investment income | | | 0.02 | | | | 0.25 | | | | 0.27 | | | | 0.27 | | | | 0.30 | | | | 0.31 | | |
| Net realized and unrealized gain (loss) | | | 0.10 | | | | 0.58 | | | | (0.09 | ) | | | 0.33 | | | | (0.16 | ) | | | (0.24 | ) | |
| Total from investment operations | | | 0.12 | | | | 0.83 | | | | 0.18 | | | | 0.60 | | | | 0.14 | | | | 0.07 | | |
| Less distributions to shareholders from: | |
| Net investment income | | | (0.02 | ) | | | (0.26 | ) | | | (0.28 | ) | | | (0.27 | ) | | | (0.30 | ) | | | (0.31 | ) | |
| Net realized gains | | | — | | | | — | | | | — | | | | — | | | | — | | | | (0.02 | ) | |
| Total distributions to shareholders | | | (0.02 | ) | | | (0.26 | ) | | | (0.28 | ) | | | (0.27 | ) | | | (0.30 | ) | | | (0.33 | ) | |
| Net asset value, end of period | | $ | 10.75 | | | $ | 10.65 | | | $ | 10.08 | | | $ | 10.18 | | | $ | 9.85 | | | $ | 10.01 | | |
| Total return | | | 1.12 | % | | | 8.25 | % | | | 1.70 | % | | | 6.12 | % | | | 1.43 | % | | | 0.64 | % | |
| Ratios to average net assets(b) | |
| Expenses prior to fees waived or expenses reimbursed | | | 1.74 | %(c) | | | 1.84 | % | | | 1.70 | % | | | 1.66 | % | | | 1.63 | % | | | 1.65 | % | |
| Net expenses after fees waived or expenses reimbursed(d) | | | 1.54 | %(c) | | | 1.54 | %(e) | | | 1.55 | %(e) | | | 1.53 | %(e) | | | 1.50 | %(e) | | | 1.50 | %(e) | |
| Net investment income | | | 2.20 | %(c) | | | 2.43 | %(e) | | | 2.65 | %(e) | | | 2.64 | %(e) | | | 3.03 | %(e) | | | 3.03 | %(e) | |
| Supplemental data | |
| Net assets, end of period (in thousands) | | $ | 155 | | | $ | 154 | | | $ | 246 | | | $ | 1,175 | | | $ | 1,978 | | | $ | 2,268 | | |
| Portfolio turnover | | | 0 | % | | | 9 | % | | | 15 | % | | | 16 | % | | | 21 | % | | | 13 | % | |
Notes to Financial Highlights
(a) For the period from April 1, 2012 to April 30, 2012. During the period, the Fund's fiscal year end was changed from March 31 to April 30.
(b) In addition to the fees and expenses which the Fund bears directly, the Fund indirectly bears a pro rata share of the fees and expenses of the acquired funds in which it invests. Such indirect expenses are not included in the reported expense ratios.
(c) Annualized.
(d) The Investment Manager and certain of its affiliates agreed to waive/reimburse certain fees and expenses, if applicable.
(e) The benefits derived from expense reductions had an impact of less than 0.01%.
The Accompanying Notes to Financial Statements are an integral part of this statement.
18
Financial Highlights (continued) – Columbia South Carolina Intermediate Municipal Bond Fund
| | | Year ended
April 30, | | March 31, | |
| | | 2012(a) | | 2012 | | 2011 | | 2010 | | 2009 | | 2008 | |
| Class C | |
| Per share data | |
| Net asset value, beginning of period | | $ | 10.65 | | | $ | 10.08 | | | $ | 10.18 | | | $ | 9.85 | | | $ | 10.01 | | | $ | 10.28 | | |
| Income from investment operations: | |
| Net investment income | | | 0.02 | | | | 0.25 | | | | 0.27 | | | | 0.27 | | | | 0.30 | | | | 0.31 | | |
| Net realized and unrealized gain (loss) | | | 0.10 | | | | 0.58 | | | | (0.10 | ) | | | 0.33 | | | | (0.16 | ) | | | (0.26 | ) | |
| Total from investment operations | | | 0.12 | | | | 0.83 | | | | 0.17 | | | | 0.60 | | | | 0.14 | | | | 0.05 | | |
| Less distributions to shareholders from: | |
| Net investment income | | | (0.02 | ) | | | (0.26 | ) | | | (0.27 | ) | | | (0.27 | ) | | | (0.30 | ) | | | (0.30 | ) | |
| Net realized gains | | | — | | | | — | | | | — | | | | — | | | | — | | | | (0.02 | ) | |
| Total distributions to shareholders | | | (0.02 | ) | | | (0.26 | ) | | | (0.27 | ) | | | (0.27 | ) | | | (0.30 | ) | | | (0.32 | ) | |
| Net asset value, end of period | | $ | 10.75 | | | $ | 10.65 | | | $ | 10.08 | | | $ | 10.18 | | | $ | 9.85 | | | $ | 10.01 | | |
| Total return | | | 1.12 | % | | | 8.27 | % | | | 1.68 | % | | | 6.11 | % | | | 1.43 | % | | | 0.54 | % | |
| Ratios to average net assets(b) | |
| Expenses prior to fees waived or expenses reimbursed | | | 1.73 | %(c) | | | 1.78 | % | | | 1.70 | % | | | 1.66 | % | | | 1.63 | % | | | 1.65 | % | |
| Net expenses after fees waived or expenses reimbursed(d) | | | 1.54 | %(c) | | | 1.54 | %(e) | | | 1.55 | %(e) | | | 1.53 | %(e) | | | 1.50 | %(e) | | | 1.50 | %(e) | |
| Net investment income | | | 2.19 | %(c) | | | 2.41 | %(e) | | | 2.65 | %(e) | | | 2.63 | %(e) | | | 3.02 | %(e) | | | 3.03 | %(e) | |
| Supplemental data | |
| Net assets, end of period (in thousands) | | $ | 14,041 | | | $ | 13,093 | | | $ | 10,031 | | | $ | 9,300 | | | $ | 6,146 | | | $ | 5,697 | | |
| Portfolio turnover | | | 0 | % | | | 9 | % | | | 15 | % | | | 16 | % | | | 21 | % | | | 13 | % | |
Notes to Financial Highlights
(a) For the period from April 1, 2012 to April 30, 2012. During the period, the Fund's fiscal year end was changed from March 31 to April 30.
(b) In addition to the fees and expenses which the Fund bears directly, the Fund indirectly bears a pro rata share of the fees and expenses of the acquired funds in which it invests. Such indirect expenses are not included in the reported expense ratios.
(c) Annualized.
(d) The Investment Manager and certain of its affiliates agreed to waive/reimburse certain fees and expenses, if applicable.
(e) The benefits derived from expense reductions had an impact of less than 0.01%.
The Accompanying Notes to Financial Statements are an integral part of this statement.
19
Financial Highlights (continued) – Columbia South Carolina Intermediate Municipal Bond Fund
| | | Year ended
April 30, | | March 31, | |
| | | 2012(a) | | 2012 | | 2011 | | 2010 | | 2009 | | 2008 | |
| Class Z | |
| Per share data | |
| Net asset value, beginning of period | | $ | 10.65 | | | $ | 10.08 | | | $ | 10.18 | | | $ | 9.84 | | | $ | 10.01 | | | $ | 10.27 | | |
| Income from investment operations: | |
| Net investment income | | | 0.03 | | | | 0.36 | | | | 0.38 | | | | 0.37 | | | | 0.40 | | | | 0.41 | | |
| Net realized and unrealized gain (loss) | | | 0.10 | | | | 0.57 | | | | (0.10 | ) | | | 0.34 | | | | (0.17 | ) | | | (0.24 | ) | |
| Total from investment operations | | | 0.13 | | | | 0.93 | | | | 0.28 | | | | 0.71 | | | | 0.23 | | | | 0.17 | | |
| Less distributions to shareholders from: | |
| Net investment income | | | (0.03 | ) | | | (0.36 | ) | | | (0.38 | ) | | | (0.37 | ) | | | (0.40 | ) | | | (0.41 | ) | |
| Net realized gains | | | — | | | | — | | | | — | | | | — | | | | — | | | | (0.02 | ) | |
| Total distributions to shareholders | | | (0.03 | ) | | | (0.36 | ) | | | (0.38 | ) | | | (0.37 | ) | | | (0.40 | ) | | | (0.43 | ) | |
| Net asset value, end of period | | $ | 10.75 | | | $ | 10.65 | | | $ | 10.08 | | | $ | 10.18 | | | $ | 9.84 | | | $ | 10.01 | | |
| Total return | | | 1.20 | % | | | 9.33 | % | | | 2.70 | % | | | 7.28 | % | | | 2.34 | % | | | 1.65 | % | |
| Ratios to average net assets(b) | |
| Expenses prior to fees waived or expenses reimbursed | | | 0.73 | %(c) | | | 0.78 | % | | | 0.70 | % | | | 0.66 | % | | | 0.63 | % | | | 0.65 | % | |
| Net expenses after fees waived or expenses reimbursed(d) | | | 0.54 | %(c) | | | 0.54 | %(e) | | | 0.55 | %(e) | | | 0.53 | %(e) | | | 0.50 | %(e) | | | 0.50 | %(e) | |
| Net investment income | | | 3.20 | %(c) | | | 3.42 | %(e) | | | 3.65 | %(e) | | | 3.64 | %(e) | | | 4.03 | %(e) | | | 4.03 | %(e) | |
| Supplemental data | |
| Net assets, end of period (in thousands) | | $ | 135,227 | | | $ | 131,663 | | | $ | 127,101 | | | $ | 150,971 | | | $ | 172,604 | | | $ | 170,987 | | |
| Portfolio turnover | | | 0 | % | | | 9 | % | | | 15 | % | | | 16 | % | | | 21 | % | | | 13 | % | |
Notes to Financial Highlights
(a) For the period from April 1, 2012 to April 30, 2012. During the period, the Fund's fiscal year end was changed from March 31 to April 30.
(b) In addition to the fees and expenses which the Fund bears directly, the Fund indirectly bears a pro rata share of the fees and expenses of the acquired funds in which it invests. Such indirect expenses are not included in the reported expense ratios.
(c) Annualized.
(d) The Investment Manager and certain of its affiliates agreed to waive/reimburse certain fees and expenses, if applicable.
(e) The benefits derived from expense reductions had an impact of less than 0.01%.
The Accompanying Notes to Financial Statements are an integral part of this statement.
20
Notes to Financial Statements – Columbia South Carolina Intermediate Municipal Bond Fund
April 30, 2012
Note 1. Organization
Columbia South Carolina Intermediate Municipal Bond Fund (the Fund), a series of Columbia Funds Series Trust (the Trust), is a diversified fund. The Trust is registered under the Investment Company Act of 1940, as amended (the 1940 Act), as an open-end management investment company organized as a Delaware statutory trust.
Fiscal Year End Change
During the period, the Fund changed its fiscal year end from March 31 to April 30. Accordingly, this report includes activity for the period April 1, 2012 to April 30, 2012 and the year ended March 31, 2012.
Fund Shares
The Trust may issue an unlimited number of shares (without par value). The Fund offers Class A, Class B, Class C and Class Z shares. All share classes have identical voting, dividend and liquidation rights. Each share class has its own expense structure and sales charges, as applicable.
Class A shares are subject to a maximum front-end sales charge of 3.25% based on the initial investment amount. Class A shares purchased without an initial sales charge in accounts aggregating $1 million to $50 million at the time of purchase are subject to a contingent deferred sales charge (CDSC) if the shares are sold within 18 months of purchase, charged as follows: 1.00% CDSC if redeemed within 12 months of purchase, and 0.50% CDSC if redeemed more than 12, but less than 18, months after purchase.
Class B shares may be subject to a maximum CDSC of 3.00% based upon the holding period after purchase. Class B shares will generally convert to Class A shares eight years after purchase. The Fund no longer accepts investments by new or existing investors in the Fund's Class B shares, except in connection with the reinvestment of any dividend and/or capital gain distributions in Class B shares of the Fund and exchanges by existing Class B shareholders of certain other funds within the Columbia Family of Funds.
Class C shares are subject to a 1.00% CDSC on shares redeemed within one year of purchase.
Class Z shares are not subject to sales charges, and are only available to certain investors, as described in the Fund's prospectus.
Note 2. Summary of Significant Accounting Policies
Use of Estimates
The preparation of financial statements in accordance with U.S. generally accepted accounting principles (GAAP) requires management to make certain estimates and assumptions that affect the reported amounts of assets and liabilities, the disclosure of contingent assets and liabilities at the date of the financial statements and the reported amounts of revenue and expenses during the reporting period. Actual results could differ from those estimates.
The following is a summary of significant accounting policies consistently followed by the Fund in the preparation of its financial statements.
Security Valuation
Debt securities generally are valued by pricing services approved by the Board of Trustees (the Board) based upon market transactions for normal, institutional-size trading units of similar securities. The services may use various pricing techniques which take into account appropriate factors such as yield, quality, coupon rate, maturity, type of issue, trading characteristics and other data, as well as broker quotes. Debt securities for which quotations are readily available may also be valued based upon an over-the-counter or exchange bid quotation.
Investments in other open-end investment companies, including money market funds, are valued at net asset value.
Short-term securities purchased within 60 days to maturity are valued at amortized cost, which approximates market value. The value of short-term securities originally purchased with maturities greater than 60 days is determined based on an amortized value to par upon reaching 60 days to maturity. Short-term securities maturing in more than 60 days from the valuation date are valued at the market price or approximate market value based on current interest rates.
Investments for which market quotations are not readily available, or that have quotations which management believes are not reliable, are valued at fair value as determined in good faith under consistently applied procedures established by and under the general supervision of the Board. If a security or class of securities (such as foreign securities) is valued at fair
21
Columbia South Carolina Intermediate Municipal Bond Fund, April 30, 2012
value, such value is likely to be different from the last quoted market price for the security. The determination of fair value often requires significant judgment. To determine fair value, management may use assumptions including but not limited to future cash flows and estimated risk premiums. Multiple inputs from various sources may be used to determine value.
Delayed Delivery Securities
The Fund may trade securities on other than normal settlement terms, including securities purchased or sold on a "when-issued" basis. This may increase the risk if the other party to the transaction fails to deliver and causes the Fund to subsequently invest at less advantageous prices. The Fund designates cash or liquid securities in an amount equal to the delayed delivery commitment.
Security Transactions
Security transactions are accounted for on the trade date. Cost is determined and gains (losses) are based upon the specific identification method for both financial statement and federal income tax purposes.
Income Recognition
Interest income is recorded on the accrual basis. Market premium and discount are amortized and accreted, respectively, on all debt securities, unless otherwise noted. Original issue discount is accreted to interest income over the life of the security with a corresponding increase in the cost basis, if any.
Dividend income is recorded on the ex-dividend date.
Expenses
General expenses of the Trust are allocated to the Fund and other funds of the Trust based upon relative net assets or other expense allocation methodologies determined by the nature of the expense. Expenses directly attributable to the Fund are charged to the Fund. Expenses directly attributable to a specific class of shares are charged to that share class.
Determination of Class Net Asset Value
All income, expenses (other than class-specific expenses, which are charged to that share class, as shown in the Statement of Operations) and realized and unrealized gains (losses) are allocated to each class of the Fund on a daily basis for purposes of determining the net asset value of each class. Income and expenses are allocated to each class based on the settled shares method, while realized and unrealized gains (losses) are allocated based on the relative net assets of each class.
Federal Income Tax Status
The Fund intends to qualify each year as a regulated investment company under Subchapter M of the Internal Revenue Code, as amended, and will distribute substantially all of its tax exempt or taxable income (including net short-term capital gains), if any, for its tax year, and as such will not be subject to federal income taxes. In addition, the Fund intends to distribute in each calendar year substantially all of its net investment income, capital gains and certain other amounts, if any, such that the Fund should not be subject to federal excise tax. Therefore, no federal income or excise tax provision is recorded.
Distributions to Shareholders
Distributions from net investment income are declared daily and paid monthly. Net realized capital gains, if any, are distributed at least annually. Income distributions and capital gain distributions are determined in accordance with federal income tax regulations which may differ from GAAP.
Guarantees and Indemnifications
Under the Trust's organizational documents and, in some cases, by contract, its officers and trustees are indemnified against certain liabilities arising out of the performance of their duties to the Trust or its funds. In addition, certain of the Fund's contracts with its service providers contain general indemnification clauses. The Fund's maximum exposure under these arrangements is unknown since the amount of any future claims that may be made against the Fund cannot be determined, and the Fund has no historical basis for predicting the likelihood of any such claims.
Note 3. Fees and Compensation Paid to Affiliates
Investment Management Fees
Under an Investment Management Services Agreement, Columbia Management Investment Advisers, LLC (the Investment Manager), a wholly-owned subsidiary of Ameriprise Financial, Inc. (Ameriprise Financial), determines which securities will be purchased, held or sold. The management fee is an annual fee that is equal to a percentage
22
Columbia South Carolina Intermediate Municipal Bond Fund, April 30, 2012
of the Fund's average daily net assets that declines from 0.40% to 0.27% as the Fund's net assets increase. For the period April 1, 2012 to April 30, 2012 and the year ended March 31, 2012, the annualized effective management fee rate was 0.40% of the Fund's average daily net assets.
Administration Fees
Under an Administrative Services Agreement, the Investment Manager serves as the Fund Administrator. Effective July 1, 2011, the Fund pays the Fund Administrator an annual fee for administration and accounting services equal to a percentage of the Fund's average daily net assets that declines from 0.07% to 0.04% as the Fund's net assets increase. Prior to July 1, 2011, the administration fee was equal to the annual rate of 0.15% of the Fund's average daily net assets, less the fees that were payable by the Fund as described under the Pricing and Bookkeeping Fees note below. For the period April 1, 2012 to April 30, 2012, the annualized effective administration fee rate was 0.07% of the Fund's average daily net assets. For the year ended March 31, 2012, the effective administration fee rate was 0.09% of the Fund's average daily net assets.
Pricing and Bookkeeping Fees
Prior to May 16, 2011, the Fund had entered into a Financial Reporting Services Agreement (the Financial Reporting Services Agreement) with State Street Bank and Trust Company (State Street) and the Investment Manager pursuant to which State Street provided financial reporting services to the Fund. The Fund also entered into an Accounting Services Agreement (collectively with the Financial Reporting Services Agreement, the State Street Agreements) with State Street and the Investment Manager pursuant to which State Street provided accounting services to the Fund. Under the State Street Agreements, the Fund paid State Street an annual fee of $38,000 paid monthly plus an additional monthly fee based on an annualized percentage rate of average daily net assets of the Fund for the month. The aggregate fee did not exceed $140,000 per year (exclusive of out-of-pocket expenses and charges). The Fund also reimbursed State Street for certain out-of-pocket expenses and charges. Effective May 16, 2011, these services are provided under the Administrative Services Agreement discussed above.
Other Fees
Effective June 1, 2011, other expenses are for, among other things, certain expenses of the Fund or the Board, including: Fund boardroom and office expense, employee compensation, employee health and retirement benefits, and certain other expenses. Payment of these Fund and Board expenses is facilitated by a company providing limited administrative services to the Fund and the Board. For the period April 1, 2012 to April 30, 2012 and the period June 1, 2011 through March 31, 2012, other expenses paid to this company were $134 and $1,776, respectively.
Compensation of Board Members
Board members are compensated for their services to the Fund as disclosed in the Statement of Operations. Under a Deferred Compensation Plan (the Plan), the Board members who are not "interested persons" of the Fund, as defined under the 1940 Act, may elect to defer payment of up to 100% of their compensation. Deferred amounts are treated as though equivalent dollar amounts had been invested in shares of certain funds managed by the Investment Manager. The Fund's liability for these amounts is adjusted for market value changes and remains in the Fund until distributed in accordance with the Plan.
Compensation of Chief Compliance Officer
The Board has appointed a Chief Compliance Officer to the Fund in accordance with federal securities regulations. The Fund's expenses associated with the Chief Compliance Officer are paid directly by the Investment Manager.
Transfer Agent Fees
Under a Transfer and Dividend Disbursing Agent Agreement, Columbia Management Investment Services Corp. (the Transfer Agent), an affiliate of the Investment Manager and a wholly-owned subsidiary of Ameriprise Financial, is responsible for providing transfer agency services to the Fund. The Transfer Agent has contracted with Boston Financial Data Services (BFDS) to serve as sub-transfer agent.
The Transfer Agent receives monthly account-based service fees based on the number of open accounts and is reimbursed by the Fund for the fees and expenses the Transfer Agent pays
23
Columbia South Carolina Intermediate Municipal Bond Fund, April 30, 2012
to financial intermediaries that maintain omnibus accounts with the Fund that is a percentage of the average aggregate value of the Fund's shares maintained in each such omnibus account (other than omnibus accounts for which American Enterprise Investment Services Inc. is the broker of record or accounts where the beneficial shareholder is a customer of Ameriprise Financial Services, Inc., which are paid a per account fee). The Transfer Agent pays the fees of BFDS for services as sub-transfer agent and is not entitled to reimbursement for such fees from the Fund (with the exception of out-of-pocket fees).
The Transfer Agent also receives compensation from fees for various shareholder services and reimbursements for certain out-of-pocket expenses.
For the period April 1, 2012 to April 30, 2012 and the year ended March 31, 2012, the Fund's annualized effective transfer agent fee rates as a percentage of average daily net assets of each class were as follows:
| | | Period ended
April 30,
2012 | | Year ended
March 31,
2012 | |
| Class A | | | 0.18 | % | | | 0.21 | % | |
| Class B | | | 0.18 | | | | 0.25 | | |
| Class C | | | 0.17 | | | | 0.20 | | |
| Class Z | | | 0.16 | | | | 0.19 | | |
An annual minimum account balance fee of $20 may apply to certain accounts with a value below the Fund's initial minimum investment requirements to reduce the impact of small accounts on transfer agent fees. These minimum account balance fees are recorded as part of expense reductions in the Statement of Operations. For the period April 1, 2012 to April 30, 2012, no minimum account balance fees were charged to accounts. For the year ended March 31, 2012, these minimum account balance fees reduced total expenses by $60.
Distribution and Service Fees
The Fund has an agreement with Columbia Management Investment Distributors, Inc. (the Distributor), an affiliate of the Investment Manager and a wholly-owned subsidiary of Ameriprise Financial, for distribution and shareholder services. Pursuant to Rule 12b-1 under the 1940 Act, the Board has approved, and the Fund has adopted, distribution and shareholder service plans (the Plans) which set the distribution and service fees for the Fund. These fees are calculated daily and are intended to compensate the Distributor and/or eligible selling and/or servicing agents for selling shares of the Fund and providing services to investors.
The Plans require the payment of a monthly combined distribution and service fee to the Distributor at the maximum annual rate of 0.25% of the average daily net assets attributable to Class A shares of the Fund. The Plans also require the payment of a monthly service fee at the maximum annual rate of 0.25% of the average daily net assets attributable to Class B and Class C shares of the Fund and the payment of a monthly distribution fee at the maximum annual rate of 0.75% of the average daily net assets attributable to Class B and Class C shares of the Fund.
Sales Charges
Sales charges, including front-end charges and CDSCs, received by the Distributor for distributing Fund shares were $6,332 for Class A shares for the period April 1, 2012 to April 30, 2012, and $57,264 for Class A and $4,957 for Class C for the year ended March 31, 2012.
Expenses Waived/Reimbursed by the Investment Manager and its Affiliates
Effective July 1, 2011, the Investment Manager and certain of its affiliates have contractually agreed to waive fees and/or reimburse expenses (excluding certain fees and expenses described below), through July 31, 2012, unless sooner terminated at the sole discretion of the Board, so that the Fund's net operating expenses, after giving effect to fees waived/expenses reimbursed and any balance credits and/or overdraft charges from the Fund's custodian, do not exceed the following annual rates as a percentage of the class' average daily net assets:
| Class A | | | 0.79 | % | |
| Class B | | | 1.54 | | |
| Class C | | | 1.54 | | |
| Class Z | | | 0.54 | | |
24
Columbia South Carolina Intermediate Municipal Bond Fund, April 30, 2012
Under the agreement, the following fees and expenses are excluded from the waiver/reimbursement commitment, and therefore will be paid by the Fund, if applicable: taxes (including foreign transaction taxes), expenses associated with investments in affiliated and non-affiliated pooled investment vehicles (including mutual funds and exchange traded funds), transaction costs and brokerage commissions, costs related to any securities lending program, dividend expenses associated with securities sold short, inverse floater program fees and expenses, transaction charges and interest on borrowed money, interest, extraordinary expenses and any other expenses the exclusion of which is specifically approved by the Fund's Board. This agreement may be modified or amended only with approval from all parties.
Prior to July 1, 2011, the Investment Manager voluntarily agreed to reimburse a portion of the Fund's expenses (excluding certain expenses, such as distribution and services fees, brokerage commissions, interest, taxes and extraordinary expenses, but including custodian charges relating to overdrafts, if any) so that the Fund's ordinary net operating expenses, after giving effect to fees waived/expenses reimbursed and any balance credits and/or overdraft charges from the Fund's custodian, did not exceed 0.55% of the Fund's average daily net assets on an annualized basis.
Prior to May 1, 2011, the Investment Manager was entitled to recover from the Fund any fees waived and/or expenses reimbursed for a three year period following the date of such fee waiver and/or reimbursement under these arrangements if such recovery did not cause the Fund's expenses to exceed the expense limitations in effect at the time of recovery. Effective May 1, 2011, the Investment Manager has eliminated such fee recoupment provisions.
Note 4. Federal Tax Information
The timing and character of income and capital gain distributions are determined in accordance with income tax regulations, which may differ from GAAP because of temporary or permanent book to tax differences.
For the period April 1, 2012 to April 30, 2012, these differences are primarily due to differing treatment for capital loss carryforwards, Trustees' deferred compensation, distributions and post-October loss reversals. For the year ended March 31, 2012, these differences are primarily due to differing treatment for capital loss carryforwards, Trustees' deferred compensation, distributions, market discount reclassification and post-October loss deferrals. To the extent these differences are permanent, reclassifications are made among the components of the Fund's net assets in the Statement of Assets and Liabilities. Temporary differences do not require reclassifications. In the Statement of Assets and Liabilities the following reclassifications were made:
| | | Period ended
April 30,
2012 | | Year ended
March 31,
2012 | |
Undistributed net
investment income | | $ | — | | | $ | (3,394 | ) | |
| Accumulated net realized loss | | | — | | | | 3,395 | | |
| Paid-in capital | | | — | | | | (1 | ) | |
Net investment income and net realized gains (losses), as disclosed in the Statement of Operations, and net assets were not affected by this reclassification.
The tax character of distributions paid during the periods indicated was as follows:
| | | Period ended
April 30,
2012 | | Year ended
March 31,
2012 | | Year ended
March 31,
2011 | |
| Ordinary income | | $ | 1,513 | | | $ | 195,420 | | | $ | 73,588 | | |
| Tax-exempt income | | | 431,777 | | | | 5,103,436 | | | | 6,193,303 | | |
Short-term capital gain distributions, if any, are considered ordinary income distributions for tax purposes.
25
Columbia South Carolina Intermediate Municipal Bond Fund, April 30, 2012
At April 30, 2012 and March 31, 2012, the components of distributable earnings on a tax basis were as follows:
| | | April 30,
2012 | | March 31,
2012 | |
Undistributed tax-exempt
income | | | $1,608,027 | | | | $1,600,489 | | |
| Unrealized appreciation | | | 12,469,919 | | | | 10,945,597 | | |
At April 30, 2012 and March 31, 2012, the cost of investments for federal income tax purposes, and the aggregate unrealized appreciation and depreciation based on that cost was as follows:
| | | April 30,
2012 | | March 31,
2012 | |
Aggregate unrealized
appreciation | | | $12,492,766 | | | | $11,114,113 | | |
Aggregate unrealized
depreciation | | | (22,847 | ) | | | (168,516 | ) | |
| Net unrealized appreciation | | | 12,469,919 | | | | 10,945,597 | | |
Cost of investments for tax
purposes | | | 159,910,344 | | | | 161,195,821 | | |
The following capital loss carryforward, determined at April 30, 2012 and March 31, 2012, may be available to reduce taxable income arising from future net realized gains on investments, if any, to the extent permitted by the Internal Revenue Code:
| Year of expiration | | April 30,
2012
Amount | | March 31,
2012
Amount | |
| 2017 | | $ | 752,607 | | | $ | — | | |
| 2018 | | | — | | | | 752,607 | | |
| Unlimited Short-term | | | 3,585 | | | | — | | |
| Total | | $ | 756,192 | | | $ | 752,607 | | |
On December 22, 2010, the Regulated Investment Company Modernization Act of 2010 (the Act) was enacted, which changed various technical rules governing the tax treatment of regulated investment companies. The changes are generally effective for taxable years beginning after the date of enactment. Under the Act, the Fund will be permitted to carry forward capital losses incurred in taxable years beginning after the date of enactment for an unlimited period. However, any losses incurred during those future taxable years will be required to be utilized prior to the losses incurred in pre-enactment taxable years, which carry an expiration date. As a result of this ordering rule, pre-enactment capital loss carryforwards may be more likely to expire unused.
For the period ended April 30, 2012, no capital loss carryforwards were utilized.
For the year ended March 31, 2012, $116,298 of capital loss carryforward was utilized.
Management of the Fund has concluded that there are no significant uncertain tax positions that would require recognition in the financial statements. However, management's conclusion may be subject to review and adjustment at a later date based on factors including, but not limited to, new tax laws, regulations, and administrative interpretations (including relevant court decisions). Generally, the Fund's federal tax returns for the prior three fiscal years remain subject to examination by the Internal Revenue Service.
Under current tax rules, regulated investment companies can elect to treat certain late-year ordinary losses incurred and post-October capital losses (capital losses realized after October 31) as arising on the first day of the following taxable year. As of March 31, 2012, the Fund will elect to treat post-October capital losses of $3,585 as arising on April 1, 2012.
Note 5. Portfolio Information
For the period April 1, 2012 to April 30, 2012, the cost of purchases, excluding short-term obligations, aggregated to $1,892,275. There were no proceeds from sales of securities.
For the year ended March 31, 2012, the cost of purchases and proceeds from sales of securities, excluding short-term obligations, aggregated to $19,263,235 and $13,901,155, respectively.
Note 6. Lending of Portfolio Securities
Effective May 16, 2011, the Fund has entered into a Master Securities Lending Agreement (the Agreement) with
26
Columbia South Carolina Intermediate Municipal Bond Fund, April 30, 2012
JPMorgan Chase Bank, N.A. (JPMorgan). The Agreement, which replaces the previous securities lending arrangement with State Street, authorizes JPMorgan as lending agent to lend securities to authorized borrowers in order to generate additional income on behalf of the Fund. Pursuant to the Agreement, the securities loaned are secured by cash or U.S. government securities equal to at least 100% of the market value of the loaned securities. Any additional collateral required to maintain those levels due to market fluctuations of the loaned securities is requested to be delivered the following business day. Cash collateral received is invested by the lending agent on behalf of the Fund into authorized investments pursuant to the Agreement. The investments made with the cash collateral are listed in the Portfolio of Investments. The values of such investments and any uninvested cash collateral are disclosed in the Statement of Assets and Liabilities along with the related obligation to return the collateral upon the return of the securities loaned.
Risks of delay in recovery of securities or even loss of rights in the securities may occur should the borrower of the securities fail financially. Risks may also arise to the extent that the value of the securities loaned increases above the value of the collateral received. JPMorgan will indemnify the Fund from losses resulting from a borrower's failure to return a loaned security when due. Such indemnification does not extend to losses associated with declines in the value of cash collateral investments. The Investment Manager is not responsible for any losses incurred by the Fund in connection with the securities lending program. Loans are subject to termination by the Fund or the borrower at any time, and are, therefore, not considered to be illiquid investments.
Pursuant to the Agreement, the Fund receives income for lending its securities either in the form of fees or by earning interest on invested cash collateral, net of negotiated rebates paid to borrowers and fees paid to the lending agent for services provided and any other securities lending expenses.
Prior to May 16, 2011, the Fund participated in a securities lending arrangement with State Street. Each security on loan was collateralized in an amount at least equal to the market value of the securities loaned plus accrued income from the investment of collateral. The income generated by the investment of the collateral, net of any fees remitted to State Street as the lending agent and borrower rebates, was paid to the Fund.
For the period ended April 30, 2012 and the year ended March 31, 2012, the Fund did not participate in securities lending activity.
Note 7. Custody Credits
Prior to May 16, 2011, the Fund had an agreement with its custodian bank under which custody fees may have been reduced by balance credits. These credits are recorded as part of expense reductions on the Statement of Operations. The Fund could have invested a portion of the assets utilized in connection with the expense offset arrangement in an income-producing asset if they had not entered into such an agreement. For the period April 1, 2011 through May 16, 2011, there were no custody credits.
Note 8. Shareholder Concentration
At April 30, 2012 and March 31, 2012, one unaffiliated shareholder account owned 76.0% and 76.9% respectively of the outstanding shares of the Fund. The Fund has no knowledge about whether any portion of those shares was owned beneficially by such accounts. Subscription and redemption activity by concentrated accounts may have a significant effect on the operations of the Fund.
Note 9. Line of Credit
The Fund has entered into a revolving credit facility with a syndicate of banks led by JPMorgan Chase Bank, N.A. (the Administrative Agent), whereby the Fund may borrow for the temporary funding of shareholder redemptions or for other temporary or emergency purposes. The credit facility became effective on May 16, 2011, replacing a prior credit facility. The credit facility agreement, as amended, which is a collective agreement between the Fund and certain other funds managed by the Investment Manager, severally and not jointly, permits collective borrowings up to $500 million. Pursuant to a December 13, 2011 amendment to the credit facility agreement, interest is charged to each participating fund based on its borrowings at a rate equal to the higher of (i) the overnight federal funds rate plus 1.00% or (i) the one-month LIBOR rate plus 1.00%. Each borrowing under the credit facility matures no later than 60 days after the date of borrowing. The Fund also pays a commitment fee equal to its pro rata share of the amount of the credit facility at a rate of 0.08% per annum. For the period May 16, 2011 through December 13, 2011, interest was charged to each
27
Columbia South Carolina Intermediate Municipal Bond Fund, April 30, 2012
participating fund based on its borrowings at a rate equal to the sum of the federal funds rate plus (i) 1.25% per annum plus (ii) if one-month LIBOR exceeds the federal funds rate, the amount of such excess. The Fund also paid a commitment fee equal to its pro rata share of the amount of the credit facility at a rate of 0.10% per annum.
Prior to May 16, 2011, the Fund and certain other funds managed by the Investment Manager participated in a $225 million committed, unsecured revolving credit facility provided by State Street. Interest was charged to each fund based on its borrowings at a rate equal to the greater of the (i) federal funds rate plus 1.25% per annum or (ii) the overnight LIBOR rate plus 1.25% per annum. The Fund also paid a commitment fee equal to its pro rata share of the amount of the credit facility at a rate of 0.125% per annum.
The Fund had no borrowings during the period ended April 30, 2012 and the year ended March 31, 2012.
Note 10. Significant Risks
Geographic Concentration Risk
Because state-specific tax-exempt funds invest primarily in the municipal securities issued by the state and political sub-divisions of the state, the Fund will be particularly affected by political and economic conditions and developments in the state in which it invests. The Fund may, therefore, have a greater risk than that of a municipal bond fund which is more geographically diversified. The value of the municipal securities owned by the Fund also may be adversely affected by future changes in federal or state income tax laws.
Note 11. Subsequent Events
Management has evaluated the events and transactions that have occurred through the date the financial statements were issued and noted no items requiring adjustment of the financial statements or additional disclosure.
Note 12. Information Regarding Pending and Settled Legal Proceedings
In December 2005, without admitting or denying the allegations, American Express Financial Corporation (AEFC, which is now known as Ameriprise Financial, Inc. (Ameriprise Financial)) entered into settlement agreements with the Securities and Exchange Commission (SEC) and Minnesota Department of Commerce (MDOC) related to market timing activities. As a result, AEFC was censured and ordered to cease and desist from committing or causing any violations of certain provisions of the Investment Advisers Act of 1940, the Investment Company Act of 1940, and various Minnesota laws. AEFC agreed to pay disgorgement of $10 million and civil money penalties of $7 million. AEFC also agreed to retain an independent distribution consultant to assist in developing a plan for distribution of all disgorgement and civil penalties ordered by the SEC in accordance with various undertakings detailed at www.sec.gov/litigation/admin/ia-2451.pdf. Ameriprise Financial and its affiliates have cooperated with the SEC and the MDOC in these legal proceedings, and have made regular reports to the funds' Boards of Trustees.
Ameriprise Financial and certain of its affiliates have historically been involved in a number of legal, arbitration and regulatory proceedings, including routine litigation, class actions, and governmental actions, concerning matters arising in connection with the conduct of their business activities. Ameriprise Financial believes that the Funds are not currently the subject of, and that neither Ameriprise Financial nor any of its affiliates are the subject of, any pending legal, arbitration or regulatory proceedings that are likely to have a material adverse effect on the Funds or the ability of Ameriprise Financial or its affiliates to perform under their contracts with the Funds. Ameriprise Financial is required to make 10-Q, 10-K and, as necessary, 8-K filings with the Securities and Exchange Commission on legal and regulatory matters that relate to Ameriprise Financial and its affiliates. Copies of these filings may be obtained by accessing the SEC website at www.sec.gov.
There can be no assurance that these matters, or the adverse publicity associated with them, will not result in increased fund redemptions, reduced sale of fund shares or other adverse consequences to the Funds. Further, although we believe proceedings are not likely to have a material adverse effect on the Funds or the ability of Ameriprise Financial or its affiliates to perform under their contracts with the Funds, these proceedings are subject to uncertainties and, as such, we are unable to estimate the possible loss or range of loss that may result. An adverse outcome in one or more of these proceedings could result in adverse judgments, settlements, fines, penalties or other relief that could have a material adverse effect on the consolidated financial condition or results of operations of Ameriprise Financial.
28
Report of Independent Registered Public Accounting Firm
To the Trustees of Columbia Funds Series Trust and the Shareholders of Columbia South Carolina Intermediate Municipal Bond Fund
In our opinion, the accompanying statement of assets and liabilities, including the portfolio of investments, and the related statements of operations and of changes in net assets and the financial highlights present fairly, in all material respects, the financial position of Columbia South Carolina Intermediate Municipal Bond Fund (the "Fund") (a series of Columbia Funds Series Trust) at April 30, 2012 and at March 31, 2012, the results of its operations, the changes in its net assets and the financial highlights for each of the periods indicated, in conformity with accounting principles generally accepted in the United States of America. These financial statements and financial highlights (hereafter referred to as "financial statements") are the responsibility of the Fund's management. Our responsibility is to express an opinion on these financial statements based on our audits. We conducted our audits of these financial statements in accordance with the standards of the Public Company Accounting Oversight Board (United States). Those standards require that we plan and perform the audit to obtain reasonable assurance about whether the financial statements are free of material misstatement. An audit includes examining, on a test basis, evidence supporting the amounts and disclosures in the financial statements, assessing the accounting principles used and significant estimates made by management, and evaluating the overall financial statement presentation. We believe that our audits, which included confirmation of securities at April 30, 2012 and at March 31, 2012 by correspondence with the custodian, transfer agent and brokers, provide a reasonable basis for our opinion.
PricewaterhouseCoopers LLP
Minneapolis, Minnesota
June 8, 2012
29
Federal Income Tax Information (Unaudited) – Columbia South Carolina Intermediate Municipal Bond Fund
For the fiscal period ended April 30, 2012 and the fiscal year ended March 31, 2012, 99.65% and 96.31%, respectively, of the distributions from net investment income of the Fund qualify as exempt interest dividends for federal income tax purposes. A portion of the income may be subject to federal alternative minimum tax.
The Fund will notify shareholders in January 2013 of amounts for use in preparing 2012 income tax returns.
30
Fund Governance
Shareholders elect the Board that oversees the funds' operations. The Board appoints officers who are responsible for day-to-day business decisions based on policies set by the Board. The following table provides basic biographical information about the funds' Board members, including their principal occupations during the past five years, although specific titles for individuals may have varied over the period. Under current Board policy, members may serve until the next Board meeting after he or she reaches the mandatory retirement age established by the Board, or the fifteenth anniversary of the first Board meeting they attended as a member of the Board.
On September 29, 2009, Ameriprise Financial, the parent company of Columbia Management, entered into an agreement with Bank of America, N.A. ("Bank of America") to acquire a portion of the asset management business of Columbia Management Group, LLC and certain of its affiliated companies (the "Transaction"). Following the Transaction, which became effective on May 1, 2010, various alignment activities have occurred with respect to the Fund Family. In connection with the Transaction, Mr. Edward J. Boudreau, Jr., Mr. William P. Carmichael, Mr. William A. Hawkins, Mr. R. Glenn Hilliard, Mr. John J. Nagorniak, Ms. Minor M. Shaw and Dr. Anthony M. Santomero, who were members prior to the Transaction of the Legacy Columbia Nations funds' Board ("Nations Funds"), which includes Columbia Funds Series Trust, Columbia Funds Variable Insurance Trust I and Columbia Funds Master Investment Trust, LLC., began service on the Board for the Legacy RiverSource funds ("RiverSource Funds") effective June 1, 2011, which resulted in an overall increase from twelve Trustees to sixteen for all mutual funds overseen by the Board.
Independent Board Members
| Name, Address, Age | | Position Held
with Funds
and Length
of Service | | Principal Occupation During Past Five Years | | Number of
Funds in the
Fund Family
Overseen by
Board Member | | Other Present or
Past Directorships/
Trusteeships
(Within Past 5 Years) | |
| Kathleen Blatz | | | | | | | | | |
|
901 S. Marquette Ave.
Minneapolis, MN 55402
Age 57 | | Board member since 1/06 for RiverSource Funds and since 6/11 for Nations Funds | | Attorney; Chief Justice, Minnesota Supreme Court, 1998-2006 | | | 156 | | | | None | | |
|
| Edward J. Boudreau, Jr. | | | | | | | | | |
|
225 Franklin Street
Mail Drop
BX32 05228
Boston, MA 02110
Age 67 | | Board member since 6/11 for RiverSource Funds and since 1/05 for Nations Funds | | Managing Director, E.J. Boudreau & Associates (consulting) since 2000 | | | 149 | | | Former Trustee, BofA Funds Series Trust (11 funds) | |
|
| Pamela G. Carlton | | | | | | | | | |
|
901 S. Marquette Ave.
Minneapolis, MN 55402
Age 57 | | Board member since 7/07 for RiverSource Funds and since 6/11 for Nations Funds | | President, Springboard-Partners in Cross Cultural Leadership (consulting company) | | | 156 | | | | None | | |
|
31
Fund Governance (continued)
Independent Board Members (continued)
| Name, Address, Age | | Position Held
with Funds
and Length
of Service | | Principal Occupation During Past Five Years | | Number of
Funds in the
Fund Family
Overseen by
Board Member | | Other Present or
Past Directorships/
Trusteeships
(Within Past 5 Years) | |
| William P. Carmichael | | | | | | | | | |
|
225 Franklin Street
Mail Drop
BX32 05228
Boston, MA 02110
Age 68 | | Board member since 6/11 for RiverSource Funds and since 1999 for Nations Funds | | Retired | | | 149 | | | Director, Cobra Electronics Corporation (electronic equipment manufacturer); The Finish Line (athletic shoes and apparel); McMoRan Exploration Company (oil and gas exploration and development); former Trustee, BofA Funds Series Trust (11 funds); former Director, Spectrum Brands, Inc. (consumer products); former Director, Simmons Company (bedding) | |
|
| Patricia M. Flynn | | | | | | | | | |
|
901 S. Marquette Ave.
Minneapolis, MN 55402
Age 61 | | Board member since 11/04 for RiverSource Funds and since 6/11 for Nations Funds | | Trustee Professor of Economics and Management, Bentley University; former Dean, McCallum Graduate School of Business, Bentley University | | | 156 | | | | None | | |
|
| William A. Hawkins | | | | | | | | | |
|
225 Franklin Street
Mail Drop
BX32 05228
Boston, MA 02110
Age 69 | | Board member since 6/11 for RiverSource Funds and since 1/05 for Nations Funds | | Managing Director, Overton Partners (financial consulting), since August 2010; President and Chief Executive Officer, California General Bank, N.A., January 2008-August 2010 | | | 149 | | | Trustee, BofA Funds Series Trust (11 funds) | |
|
| R. Glenn Hilliard | | | | | | | | | |
|
225 Franklin Street
Mail Drop
BX32 05228
Boston, MA 02110
Age 69 | | Board member since 6/11 for RiverSource Funds and since 1/05 for Nations Funds | | Chairman and Chief Executive Officer, Hilliard Group LLC (investing and consulting), since April 2003; Non-Executive Director & Chairman, CNO Financial Group, Inc. (formerly Conseco, Inc.) (insurance), September 2003-May 2011 | | | 149 | | | Chairman, BofA Fund Series Trust (11 funds); former Director, CNO Financial Group, Inc. (insurance) | |
|
32
Fund Governance (continued)
Independent Board Members (continued)
| Name, Address, Age | | Position Held
with Funds
and Length
of Service | | Principal Occupation During Past Five Years | | Number of
Funds in the
Fund Family
Overseen by
Board Member | | Other Present or
Past Directorships/
Trusteeships
(Within Past 5 Years) | |
| Stephen R. Lewis, Jr. | | | | | | | | | |
|
901 S. Marquette Ave.
Minneapolis, MN 55402
Age 73 | | Chair of the Board for RiverSource Funds since 1/07, Board member for RiverSource Funds since 1/02 and since 6/11 for Nations Funds | | President Emeritus and Professor of Economics Emeritus, Carleton College | | | 156 | | | Director, Valmont Industries, Inc. (manufactures irrigation systems) | |
|
| John F. Maher | | | | | | | | | |
|
901 S. Marquette Ave.
Minneapolis, MN 55402
Age 69 | | Board member since 12/06 for Legacy Seligman funds, since 12/08 for RiverSource Funds and since 6/11 for Nations Funds | | Retired President and Chief Executive Officer and former Director, Great Western Financial Corporation (financial services), 1986-1997 | | | 156 | | | | None | | |
|
| John J. Nagorniak | | | | | | | | | |
|
225 Franklin Street
Mail Drop
BX32 05228
Boston, MA 02110
Age 67 | | Board member since 6/11 for RiverSource Funds and since 1/08 for Nations Funds | | Retired; President and Director, Foxstone Financial, Inc. (consulting), 2000-2007; Director, Mellon Financial Corporation affiliates (investing), 2000-2007; Chairman, Franklin Portfolio Associates (investing—Mellon affiliate), 1982-2007 | | | 149 | | | Trustee, Research Foundation of CFA Institute; Director, MIT Investment Company; Trustee, MIT 401k Plan; former Trustee, BofA Funds Series Trust (11 funds) | |
|
| Catherine James Paglia | | | | | | | | | |
|
901 S. Marquette Ave.
Minneapolis, MN 55402
Age 59 | | Board member since 11/04 for RiverSource Funds and since 6/11 for Nations Funds | | Director, Enterprise Asset Management, Inc. (private real estate and asset management company) | | | 156 | | | | None | | |
|
33
Fund Governance (continued)
Independent Board Members (continued)
| Name, Address, Age | | Position Held
with Funds
and Length
of Service | | Principal Occupation During Past Five Years | | Number of
Funds in the
Fund Family
Overseen by
Board Member | | Other Present or
Past Directorships/
Trusteeships
(Within Past 5 Years) | |
| Leroy C. Richie | | | | | | | | | |
|
901 S. Marquette Ave.
Minneapolis, MN 55402
Age 70 | | Board member since 2000 for Legacy Seligman funds, since 11/08 for RiverSource Funds and since 6/11 for Nations Funds | | Counsel, Lewis & Munday, P.C. since 2004; former Vice President and General Counsel, Automotive Legal Affairs, Chrysler Corporation | | | 156 | | | Director, Digital Ally, Inc. (digital imaging); Director, Infinity, Inc. (oil and gas exploration and production); Director, OGE Energy Corp. (energy and energy services) | |
|
| Minor M. Shaw | | | | | | | | | |
|
225 Franklin Street
Mail Drop
BX32 05228
Boston, MA 02110
Age 64 | | Board member since 6/11 for RiverSource Funds and since 2003 for Nations Funds | | President—Micco LLC (private investments) | | | 149 | | | Former Trustee, BofA Funds Series Trust (11 funds); Board Member, Piedmont Natural Gas; Director, Blue Cross Blue Shield of South Carolina | |
|
| Alison Taunton-Rigby | | | | | | | | | |
|
901 S. Marquette Ave.
Minneapolis, MN 55402
Age 68 | | Board member since 11/02 for RiverSource Funds and since 6/11 for Nations Funds | | Chief Executive Officer and Director, RiboNovix, Inc. 2003-2010 (biotechnology); former President, Aquila Biopharmaceuticals | | | 156 | | | Director, Healthways, Inc. (health management programs); Director, ICI Mutual Insurance Company, RRG; Director, Abt Associates (government contractor) | |
|
34
Fund Governance (continued)
Interested Board Member Not Affiliated with Investment Manager*
| Name, Address, Age | | Position Held
with Funds
and Length
of Service | | Principal Occupation During Past Five Years | | Number of
Funds in the
Fund Family
Overseen by
Board Member | | Other Present or
Past Directorships/
Trusteeships
(Within Past 5 Years) | |
| Anthony M. Santomero* | | | | | | | | | |
|
225 Franklin Street
Mail Drop
BX32 05228
Boston, MA 02110
Age 65 | | Board member since 6/11 for RiverSource Funds and since 1/08 for Nations Funds | | Richard K. Mellon Professor Emeritus of Finance, The Wharton School, University of Pennsylvania, since 2002; Senior Advisor, McKinsey & Company (consulting), 2006-2008; President and Chief Executive Officer, Federal Reserve Bank of Philadelphia, 2000-2006 | | | 149 | | | Director, Renaissance Reinsurance Ltd.; Trustee, Penn Mutual Life Insurance Company; Director, Citigroup; Director, Citibank, N.A.; former Trustee, BofA Funds Series Trust (11 funds) | |
|
* Dr. Santomero is not an affiliated person of the Investment Manager or Ameriprise Financial. However, he is currently deemed by the funds to be an "interested person" (as defined in the 1940 Act) of the Funds because he serves as a Director of Citigroup, Inc. and Citibank N.A., companies that may directly or through subsidiaries and affiliates engage from time-to-time in brokerage execution, principal transactions and lending relationships with the funds or accounts advised/managed by the Investment Manager.
Interested Board Member Affiliated with Investment Manager*
| William F. Truscott | | | | | | | | | |
|
53600 Ameriprise Financial Center
Minneapolis, MN 55474
Age 51 | | Board member since 11/01 for RiverSource Funds and since 6/11 for Nations Funds; Senior Vice President since 2002 for RiverSource Funds and 5/10 for Nations Funds | | Chairman of the Board and President, Columbia Management Investment Advisers, LLC since May 2010 and February 2012, respectively (previously President, Chairman of the Board and Chief Investment Officer, 2001-April 2010); Chief Executive Officer, U.S. Asset Management & President, Annuities, Ameriprise Financial, Inc. since May 2010 (previously President—U.S. Asset Management and Chief Investment Officer, 2005-April 2010); Director, President and Chief Executive Officer, Ameriprise Certificate Company since 2006; Director and Chief Executive Officer, Columbia Management Investment Distributors, Inc. since May 2010 and February 2012, respectively (previously Chairman of the Board and Chief Executive Officer, 2006-April 2010); Chairman of the Board and Chief Executive Officer, RiverSource Distributors, Inc. since 2006. | | | 156 | | | Trustee, Columbia Funds Series Trust I and Columbia Funds Variable Insurance Trust | |
|
* Interested person (as defined under the 1940 Act) by reason of being an officer, director, security holder and/or employee of the Investment Manager or Ameriprise Financial.
The SAI has additional information about the Fund's Board members and is available, without charge, upon request by calling 800.345.6611; contacting your financial intermediary; or visiting columbiamanagement.com.
35
Fund Governance (continued)
Officers
| Name, Year of Birth and Address | | Principal Occupation(s) During the Past Five Years | |
| J. Kevin Connaughton (Born 1964) | |
|
225 Franklin Street
Boston, MA 02110
President (since 2009) | | Senior Vice President and General Manager—Mutual Fund Products, Columbia Management Investment Advisers, LLC since May 2010; President, Columbia Funds, since 2009, and RiverSource Funds, since May 2010 (previously Senior Vice President and Chief Financial Officer, Columbia Funds, from June 2008 to January 2009, Treasurer, Columbia Funds, from October 2003 to May 2008, and senior officer of various other affiliated funds since 2000); Managing Director, Columbia Management Advisors, LLC from December 2004 to April 2010. | |
|
| Michael G. Clarke (Born 1969) | |
|
225 Franklin Street
Boston, MA 02110
Treasurer (since 2011) and Chief Financial Officer (since 2009) | | Vice President, Columbia Management Investment Advisers, LLC since May 2010; Managing Director of Fund Administration, Columbia Management Advisors, LLC, from September 2004 to April 2010; senior officer of Columbia Funds and affiliated funds since 2002. | |
|
| Scott R. Plummer (Born 1959) | |
|
5228 Ameriprise Financial Center
Minneapolis, MN 55474
Senior Vice President and Chief Legal Officer (since 2010) | | Chief Legal Officer and Assistant Secretary, Columbia Management Investment Advisers, LLC since June 2005; Vice President and Lead Chief Counsel—Asset Management, Ameriprise Financial, Inc. since May 2010 (previously Vice President and Chief Counsel—Asset Management, from 2005 to April 2010, Vice President, Chief Counsel and Assistant Secretary, Columbia Management Investment Distributors, Inc. since 2008; Vice President, General Counsel and Secretary, Ameriprise Certificate Company since 2005; Chief Counsel, RiverSource Distributors, Inc. since 2006; Senior officer of Columbia Funds and affiliated funds, since 2006. | |
|
| Thomas P. McGuire (Born 1972) | |
|
225 Franklin Street
Boston, MA 02110
Chief Compliance Officer (since 2012) | | Vice President—Asset Management Compliance, Columbia Management Investment Advisers, LLC since March 2010; Chief Compliance Officer, Ameriprise Certificate Company, since September 2010; Compliance Executive, Bank of America, from June 2005 to April 2010. | |
|
| William F. Truscott (Born 1960) | |
|
53600 Ameriprise Financial Center
Minneapolis, MN 55474
Senior Vice President (since 2010) | | Chairman of the Board and President, Columbia Management Investment Advisers, LLC since May 2010 and February 2012, respectively (previously President, Chairman of the Board and Chief Investment Officer, from 2001 to April 2010); Chief Executive Officer, U.S. Asset Management & President, Annuities, Ameriprise Financial, Inc. since May 2010 (previously President—U.S. Asset Management and Chief Investment Officer from 2005 to April 2010; Director, President and Chief Executive Officer, Ameriprise Certificate Company since 2006; Director and Chief Executive Officer, Columbia Management Investment Distributors, Inc. since May 2010 and February 2012, respectively (previously Chairman of the Board and Chief Executive Officer from 2008 to April 2010); Chairman of the Board and Chief Executive Officer, RiverSource Distributors, Inc. since 2006. | |
|
| Paul D. Pearson (Born 1956) | |
|
10468 Ameriprise Financial Center
Minneapolis, MN 55474
Vice President and Assistant Treasurer
(since 2011) | | Vice President—Investment Accounting, Columbia Management Investment Advisers, LLC, since May 2010; Vice President—Managed Assets, Investment Accounting, Ameriprise Financial Corporation, 1998-2010 | |
|
36
Fund Governance (continued)
Officers (continued)
| Name, Year of Birth and Address | | Principal Occupation(s) During the Past Five Years | |
| Colin Moore (Born 1958) | |
|
225 Franklin Street
Boston, MA 02110
Senior Vice President (since 2010) | | Director and Chief Investment Officer, Columbia Management Investment Advisers, LLC since May 2010; Manager, Managing Director and Chief Investment Officer of Columbia Management Advisors, LLC from 2007 to April 2010; Head of Equities, Columbia Management Advisors, LLC from 2002 to 2007. | |
|
| Christopher O. Petersen (Born 1970) | |
|
5228 Ameriprise Financial Center
Minneapolis, MN 55474
Vice President and Secretary (since 2011) | | Vice President and Chief Counsel, Ameriprise Financial since January 2010 (formerly Vice President and Group Counsel or Counsel from April 2004 to January 2010); Senior officer of Columbia Funds and affiliated funds, since 2007. | |
|
| Amy K. Johnson (Born 1965) | |
|
5228 Ameriprise Financial Center
Minneapolis, MN 55474
Vice President (since 2010) | | Senior Vice President and Chief Operating Officer, Columbia Management Investment Advisers, LLC since May 2010 (previously Chief Administrative Officer, from 2009 until April 2010, Vice President—Asset Management and Trust Company Services, from 2006 to 2009, and Vice President—Operations and Compliance from 2004 to 2006). | |
|
| Joseph F. DiMaria (Born 1968) | |
|
225 Franklin Street
Boston, MA 02110
Vice President (since 2011) and Chief Accounting Officer (since 2008) | | Vice President, Mutual Fund Administration, Columbia Management Investment Advisers, LLC, since May 2010; Director of Fund Administration, Columbia Management Advisors, LLC from January 2006 to April 2010. | |
|
| Paul B. Goucher (Born 1968) | |
|
100 Park Avenue
New York, NY 10017
Vice President and Assistant Secretary (since 2010) | | Vice President and Chief Counsel of Ameriprise Financial since January 2010 (formerly Vice President and Group Counsel from November 2008 to January 2010); Director, Managing Director and General Counsel of J. & W. Seligman & Co. Incorporated (Seligman) from July 2008 to November 2008 and Managing Director and Associate General Counsel of Seligman from January 2005 to July 2008. | |
|
| Michael E. DeFao (Born 1968) | |
|
225 Franklin Street
Boston, MA 02110
Vice President and Assistant Treasurer (since 2011) | | Vice President and Chief Counsel, Ameriprise Financial since May 2010; Associate General Counsel, Bank of America from June 2005 to April 2010. | |
|
| Stephen T. Welsh (Born 1957) | |
|
225 Franklin Street
Boston, MA 02110
Vice President (since 2006) | | President and Director, Columbia Management Investment Services Corp. since May 2010; President and Director, Columbia Management Services, Inc. from July 2004 to April 2010; Managing Director, Columbia Management Distributors, Inc. from August 2007 to April 2010. | |
|
37
Approval of Investment Management Services Agreement
Columbia Management Investment Advisers, LLC ("Columbia Management" or the "investment manager"), a wholly-owned subsidiary of Ameriprise Financial, Inc. ("Ameriprise Financial"), serves as the investment manager to Columbia South Carolina Intermediate Municipal Bond Fund (the "Fund"). Under an investment management services agreement (the "IMS Agreement"), Columbia Management provides investment advice and other services to the Fund and all funds distributed by Columbia Management Investment Distributors, Inc. (collectively, the "Funds").
On an annual basis, the Fund's Board of Trustees (the "Board"), including the independent Board members (the "Independent Directors"), considers renewal of the IMS Agreement. Columbia Management prepared detailed reports for the Board and its Contracts Committee in March and April 2012, including reports based on analyses of data provided by an independent organization and a comprehensive response to each item of information requested by independent legal counsel to the Independent Directors ("Independent Legal Counsel") in a letter to the investment manager, to assist the Board in making this determination. All of the materials presented in March and April were first supplied in draft form to designated representatives of the Independent Directors, i.e., Independent Legal Counsel, the Chair and the Chair of the Contracts Committee (including materials relating to the Fund's expense cap), and the final materials were revised to reflect comments provided by these Board representatives. In addition, throughout the year, the Board (or its committees) regularly meets with portfolio management teams and senior management personnel, and reviews information prepared by Columbia Management addressing the services Columbia Management provides and Fund performance. The Board accords particular weight to the work, deliberations and conclusions of the Contracts Committee, the Investment Review Committee and the Compliance Committee in determining whether to continue the IMS Agreement.
The Board, at its April 10-12, 2012 in-person Board meeting (the "April Meeting"), considered the renewal of the IMS Agreement for an additional one-year term. At the April Meeting, Independent Legal Counsel reviewed with the Independent Directors various factors relevant to the Board's consideration of advisory agreements and the Board's legal responsibilities related to such consideration. Following an analysis and discussion of the factors identified below, the Board, including all of the Independent Directors, approved the renewal of the IMS Agreement.
Nature, Extent and Quality of Services Provided by Columbia Management: The Independent Directors analyzed various reports and presentations they had received detailing the services performed by Columbia Management, as well as its expertise, resources and capabilities. The Independent Directors specifically considered many developments during the past year concerning the services provided by Columbia Management, including, in particular, the continued investment in, and resources dedicated to, the Funds' operations and the successful completion of various integration initiatives and the consolidation of dozens of Funds. The Independent Directors noted the information they received concerning Columbia Management's ability to retain key portfolio management personnel. In that connection, the Independent Directors took into account their meetings with Columbia Management's Chief Investment Officer (the "CIO") and considered the CIO's successful execution of additional risk and portfolio management oversight applied to the Funds. The Independent Directors also assessed Columbia Management's significant investment in upgrading technology (such as an equity trading system) and considered management's commitments to enhance existing resources in this area.
In connection with the Board's evaluation of the overall package of services provided by Columbia Management, the Board also considered the quality of administrative services provided to the Fund by Columbia Management. In addition, the Board also reviewed the financial condition of Columbia Management (and its affiliates) and each entity's ability to carry out its responsibilities under the IMS Agreement and the Fund's other services agreements with Ameriprise affiliates. The Board also discussed the acceptability of the terms of the IMS Agreement (including the relatively broad scope of services required to be performed by Columbia Management). The Board concluded that the services being performed under the IMS Agreement were of a reasonably high quality.
Based on the foregoing, and based on other information received (both oral and written, including the information on investment performance referenced below) and other considerations, the Board concluded that Columbia
38
Approval of Investment Management Services Agreement (continued)
Management and its affiliates were in a position to continue to provide a high quality and level of services to the Fund.
Investment Performance: For purposes of evaluating the nature, extent and quality of services provided under the IMS Agreement, the Board carefully reviewed the investment performance of the Fund. In this regard, the Board considered detailed reports providing the results of analyses performed by an independent organization showing, for various periods, the performance of the Fund, the performance of a benchmark index, the percentage ranking of the Fund among its comparison group and the net assets of the Fund. The Board observed that the Fund's investment performance met expectations.
Comparative Fees, Costs of Services Provided and the Profits Realized By Columbia Management and its Affiliates from their Relationships with the Fund: The Board reviewed comparative fees and the costs of services to be provided under the IMS Agreement. The Board members considered detailed comparative information set forth in an annual report on fees and expenses, including, among other things, data (based on analyses conducted by an independent organization) showing a comparison of the Fund's expenses with median expenses paid by funds in its comparative peer universe, as well as data showing the Fund's contribution to Columbia Management's profitability. The Board reviewed the fees charged to comparable institutional or other accounts/vehicles managed by Columbia Management and discussed differences in how the products are managed and operated, noting no unreasonable differences in the levels of contractual fees.
The Board accorded particular weight to the notion that the level of fees should reflect a rational pricing model applied consistently across the various product lines in the Fund family, while assuring that the overall fees for each Fund (with few defined exceptions) are generally in line with the "pricing philosophy" (i.e., that the total expense ratio of the Fund is at, or below, the median expense ratio of funds in the same comparison universe of the Fund). The Board took into account that the Fund's total expense ratio (after considering proposed expense caps/waivers) approximated the peer universe's median expense ratio. Based on its review, the Board concluded that the Fund's management fee was fair and reasonable in light of the extent and quality of services that the Fund receives.
The Board also considered the expected profitability of Columbia Management and its affiliates in connection with Columbia Management providing investment management services to the Fund. In this regard, the Board referred to a detailed profitability report, discussing the profitability to Columbia Management and Ameriprise Financial from managing, operating and distributing the Funds. In this regard, the Board observed that 2011 profitability, while slightly lower than 2010, was generally in line with the reported profitability of other asset management firms. The Board also considered the indirect economic benefits flowing to Columbia Management or its affiliates in connection with managing or distributing the Funds, such as the enhanced ability to offer various other financial products to Ameriprise Financial customers, soft dollar benefits and overall reputational advantages. The Board noted that the fees paid by the Fund should permit the investment manager to offer competitive compensation to its personnel, make necessary investments in its business and earn an appropriate profit. The Board concluded that profitability levels were reasonable.
Economies of Scale to be Realized: The Board also considered the economies of scale that might be realized by Columbia Management as the Fund grows and took note of the extent to which Fund shareholders might also benefit from such growth.
Based on the foregoing, the Board, including all of the Independent Directors, concluded that the investment management service fees were fair and reasonable in light of the extent and quality of services provided. In reaching this conclusion, no single factor was determinative. On April 12, 2012, the Board, including all of the Independent Directors, approved the renewal of the IMS Agreement.
39
This page intentionally left blank.
40
Important Information About This Report
The fund mails one shareholder report to each shareholder address. If you would like more than one report, please call shareholder services at 1-800-345-6611 and additional reports will be sent to you. This report has been prepared for shareholders of Columbia South Carolina Intermediate Municipal Bond Fund.
A description of the policies and procedures that the fund uses to determine how to vote proxies and a copy of the fund's voting records are available (i) at www.columbiamanagement.com, (ii) on the Securities and Exchange Commission's website at www.sec.gov, and (iii) without charge, upon request, by calling 1-800-368-0346. Information regarding how the fund voted proxies relating to portfolio securities during the 12-month period ended June 30 is available from the SEC's website. Information regarding how the fund voted proxies relating to portfolio securities is also available from the fund's website, www.columbiamanagement.com.
The fund files a complete schedule of portfolio holdings with the SEC for the first and third quarters of each fiscal year on Form N-Q. The fund's Form N-Q is available on the SEC's website at www.sec.gov and may be reviewed and copied at the SEC's Public Reference Room in Washington, D.C. Information on the operation of the Public Reference Room may be obtained by calling 1-800-SEC-0330.
Transfer Agent
Columbia Management Investment
Services Corp.
P.O. Box 8081
Boston, MA 02266-8081
1-800-345-6611
Distributor
Columbia Management Investment
Distributors, Inc.
225 Franklin Street
Boston, MA 02110
Investment Manager
Columbia Management Investment Advisers, LLC
225 Franklin Street
Boston, MA 02110
41

Columbia South Carolina Intermediate Municipal Bond Fund
P. O. Box 8081
Boston, MA 02266-8081
columbiamanagement.com
This information is for use with concurrent or prior delivery of a fund prospectus. Investors should consider the investment objectives, risks, charges and expenses of a mutual fund carefully before investing. For a free prospectus, which contains this and other important information about the funds, visit columbiamanagement.com. Read the prospectus carefully before investing. The Fund is distributed by Columbia Management Investment Distributors, Inc., member FINRA, and managed by Columbia Management Investment Advisers, LLC.
© 2012 Columbia Management Investment Advisers, LLC. All rights reserved.
C-1101 C (5/12)

Columbia Virginia Intermediate Municipal Bond Fund
Annual Report for the Period Ended April 30, 2012
Not FDIC insured • No bank guarantee • May lose value
Table of Contents
| Fund Profile | | | 1 | | |
|
| Performance Information | | | 2 | | |
|
| Understanding Your Expenses | | | 3 | | |
|
| Portfolio Managers' Report | | | 4 | | |
|
| Portfolio of Investments | | | 6 | | |
|
Statement of Assets and
Liabilities | | | 14 | | |
|
| Statement of Operations | | | 16 | | |
|
Statement of Changes in
Net Assets | | | 17 | | |
|
| Financial Highlights | | | 19 | | |
|
| Notes to Financial Statements | | | 23 | | |
|
Report of Independent Registered
Public Accounting Firm | | | 31 | | |
|
| Federal Income Tax Information | | | 32 | | |
|
| Fund Governance | | | 33 | | |
|
Approval of Investment
Management Services Agreement | | | 40 | | |
|
Important Information About
This Report | | | 45 | | |
|
The views expressed in this report reflect the current views of the respective parties. These views are not guarantees of future performance and involve certain risks, uncertainties and assumptions that are difficult to predict, so actual outcomes and results may differ significantly from the views expressed. These views are subject to change at any time based upon economic, market or other conditions and the respective parties disclaim any responsibility to update such views. These views may not be relied on as investment advice and, because investment decisions for a Columbia Fund are based on numerous factors, may not be relied on as an indication of trading intent on behalf of any particular Columbia Fund. References to specific securities should not be construed as a recommendation or investment advice.
President's Message

Dear Shareholders,
A stock market rally that commenced in the fourth quarter of 2011 continued into 2012 in the United States and around the world, as all major market regions generated double-digit returns for the three-month period ended March 31, 2012. Volatility declined sharply as European debt fears quieted somewhat and sentiment improved. Returns in developed countries were buoyed by strong results in Germany, Belgium, Austria and the Nordic markets of Denmark, Finland, Norway and Sweden. Under the cloud of its own mounting debt problem, Spain was the only eurozone country to deliver a negative return during the three-month period. Solid economic growth and accommodative monetary policy helped boost gains in emerging markets. The rally in U.S. equities was largely driven by an expansion in "multiples"—an increase in stock prices relative to their earnings. By the end of the first quarter of 2012, stocks no longer appeared as cheap as they were late in 2011. Bonds lagged stocks during the first quarter as investors responded to signs of an improved environment with a greater appetite for risk.
Concerns around the health of the global economy were centered in news headlines focusing on Washington D.C., Europe, China and the Middle East. In the United States, economic indicators remained mixed but generally indicated support for slow, sustainable economic growth. European policymakers have made progress in containing the eurozone debt crisis, though they still have not solved the issue of long-term solvency. The European Central Bank has lowered interest rates and flooded the financial system with liquidity that may provide breathing space for companies to restructure their balance sheets. These massive infusions of liquidity may whet the appetite for risk from investors around the world. However, it has delayed a true reckoning with the European financial situation, as concerns about Spain and Portugal continue to cloud the outlook. These structural challenges that persist in the developed world, and slowing growth in emerging market economies, leave the global economy in a fragile state. Domestic demand, combined with slowing inflationary trends, has also helped to shore up emerging market economies. Joblessness remains low and monetary conditions remain easy.
Despite the challenges and surprises of 2011, we see pockets of strength—and as a result, attractive opportunities—both here and abroad for 2012. We hope to help you capitalize on these opportunities with various articles in our 2012 Perspectives, which is available via the Market Insights tab at columbiamanagement.com. This publication showcases the strong research capabilities and experienced investment teams of Columbia Management and offers a diverse array of investment ideas based on our five key themes for 2012.
Other information and resources available at columbiamanagement.com include:
g detailed up-to-date fund performance and portfolio information
g economic analysis and market commentary
g quarterly fund commentaries
g Columbia Management Investor, our award-winning quarterly newsletter for shareholders
Thank you for your continued support of the Columbia Funds. We look forward to serving your investment needs for many years to come.
Best Regards,

J. Kevin Connaughton
President, Columbia Funds
Investors should consider the investment objectives, risks, charges and expenses of a mutual fund carefully before investing. For a free prospectus, which contains this and other important information about the funds, visit columbiamanagement.com. The prospectus should be read carefully before investing.
Columbia Funds are distributed by Columbia Management Investment Distributors, Inc., member FINRA, and managed by Columbia Management Investment Advisers, LLC.
© 2012 Columbia Management Investment Advisers, LLC. All rights reserved.
Fund Profile – Columbia Virginia Intermediate Municipal Bond Fund
Summary
g For the 13-month period that ended April 30, 2012, the fund's Class A shares returned 9.01% without sales charge.
g The fund's benchmark, the Barclays 3-15 Year Blend Municipal Bond Index, returned 11.05%.1
g The fund had more exposure than the index to shorter maturities and to bonds of higher quality, which hampered performance as longer maturities and lower quality securities were the best performers.
Portfolio Management
Brian M. McGreevy has managed the fund since June 2011. From 1994 until joining Columbia Management Investment Advisers, LLC (the Investment Manager) in May 2010, Mr. McGreevy was associated with the fund's previous investment adviser as an investment professional.
1The Barclays 3-15 Year Blend Municipal Bond Index tracks the performance of municipal bonds issued after December 31, 1990 with remaining maturities between 2 and 17 years and at least $7 million in principal amount outstanding.
Indices are not available for investment, are not professionally managed and do not reflect sales charges, fees, brokerage commissions, taxes or other expenses of investing. Securities in the fund may not match those in an index.
Performance data quoted represents past performance and current performance may be lower or higher. Past performance is no guarantee of future results. The investment return and principal value will fluctuate so that shares, when redeemed, may be worth more or less than the original cost. Please visit www.columbiamanagement.com for daily and most recent month-end performance updates.
Summary
13-month (cumulative) return as of 04/30/12
| | +9.01% | |
|
|  | | | Class A shares
(without sales charge) | |
|
| | +11.05% | |
|
|  | | | Barclays 3-15 Year Blend Municipal Bond Index | |
|
1
Performance Information – Columbia Virginia Intermediate Municipal Bond Fund
Performance data quoted represents past performance and current performance may be lower or higher. Past performance is no guarantee of future results. The investment return and principal value will fluctuate so that shares, when redeemed, may be worth more or less than the original cost. Please visit www.columbiamanagement.com for daily and most recent month-end performance updates.
Performance of a $10,000 investment 05/01/02 – 04/30/12
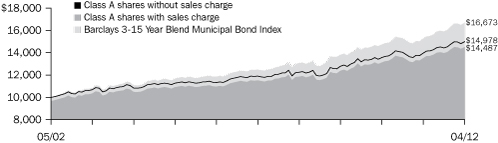
The chart above shows the change in value of a hypothetical $10,000 investment in Class A shares of Columbia Virginia Intermediate Municipal Bond Fund during the stated time period, and does not reflect the deduction of taxes that a shareholder may pay on fund distributions or on the redemption of fund shares.
Performance of a $10,000 investment 05/01/02 – 04/30/12 ($)
| Sales charge | | without | | with | |
| Class A | | | 14,978 | | | | 14,487 | | |
| Class B | | | 13,913 | | | | 13,913 | | |
| Class C | | | 13,909 | | | | 13,909 | | |
| Class Z | | | 15,356 | | | | n/a | | |
Average annual total return as of 04/30/12 (%)
| Share class | | A | | B | | C | | Z | |
| Inception | | 12/05/89 | | 06/07/93 | | 06/17/92 | | 09/20/89 | |
| Sales charge | | without | | with | | without | | with | | without | | with | | without | |
| 1-month (cumulative) | | | 1.06 | | | | –2.21 | | | | 1.08 | | | | –1.92 | | | | 1.08 | | | | 0.08 | | | | 1.08 | | |
| 1-year | | | 7.33 | | | | 3.84 | | | | 6.53 | | | | 3.53 | | | | 6.53 | | | | 5.53 | | | | 7.60 | | |
| 5-year | | | 4.69 | | | | 4.00 | | | | 3.93 | | | | 3.93 | | | | 3.92 | | | | 3.92 | | | | 4.95 | | |
| 10-year | | | 4.12 | | | | 3.78 | | | | 3.36 | | | | 3.36 | | | | 3.35 | | | | 3.35 | | | | 4.38 | | |
The "with sales charge" returns include the maximum initial sales charge of 3.25% for Class A shares and the applicable contingent deferred sales charge of 3.00% in the first year, declining to 1.00% in the fourth year and eliminated thereafter for Class B shares and 1.00% for Class C shares for the first year only. The "without sales charge" returns do not include the effect of sales charges. If they had, returns would be lower.
Performance results reflect any fee waivers or reimbursements of fund expenses by Columbia Management Investment Advisers, LLC and/or any of its affiliates. Absent these fee waivers or expense reimbursement arrangements, performance results would have been lower.
All results shown assume reinvestment of distributions. Class Z shares are sold at net asset value with no distribution and service (Rule 12b-1) fees. Class Z shares have limited eligibility and the investment minimum requirements may vary. Please see the fund's prospectuses for details. Performance for different share classes will vary based on differences in sales charges and fees associated with each class.
The tables do not reflect the deduction of taxes that a shareholder may pay on fund distributions or on the redemption of fund shares.
2
Understanding Your Expenses – Columbia Virginia Intermediate Municipal Bond Fund
As an investor, you incur two types of costs. There are transaction costs, which generally include sales charges on purchases and may include redemption fees. There are also ongoing costs, which generally include management fees, distribution and service (Rule 12b-1) fees, and other fund expenses. The following information is intended to help you understand your ongoing costs (in dollars) of investing in the Fund and to help you compare these costs with the ongoing costs of investing in other mutual funds.
Analyzing your fund's expenses
To illustrate these ongoing costs, we have provided examples and calculated the expenses paid by investors in each share class of the Fund during the period. The actual and hypothetical information in the table is based on an initial investment of $1,000 at the beginning of the period indicated and held for the entire period. Expense information is calculated two ways and each method provides you with different information. The amount listed in the "Actual" column is calculated using the Fund's actual operating expenses and total return for the period. You may use the Actual information, together with the amount invested, to estimate the expenses that you paid over the period. Simply divide your account value by $1,000 (for example, an $8,600 account value divided by $1,000 = 8.6), then multiply the results by the expenses paid during the period under the Actual column. The amount listed in the "Hypothetical" column assumes a 5% annual rate of return before expenses (which is not the Fund's actual return) and then applies the Fund's actual expense ratio for the period to the hypothetical return. You should not use the hypothetical account values and expenses to estimate either your actual account balance at the end of the period or the expenses you paid during the period. See "Compare with other funds" below for details on how to use the hypothetical data.
Compare with other funds
Since all mutual funds are required to include the same hypothetical calculations about expenses in shareholder reports, you can use this information to compare the ongoing cost of investing in the Fund with other funds. To do so, compare the hypothetical example with the 5% hypothetical examples that appear in the shareholder reports of other funds. As you compare hypothetical examples of other funds, it is important to note that hypothetical examples are meant to highlight the ongoing costs of investing in a fund only and do not reflect any transaction costs, such as sales charges, or redemption or exchange fees. Therefore, the hypothetical calculations are useful in comparing ongoing costs only, and will not help you determine the relative total costs of owning different funds. If transaction costs were included in these calculations, your costs would be higher.
November 1, 2011 – April 30, 2012
| | | Account value at the
beginning of the period ($) | | Account value at the
end of the period ($) | | Expenses paid
during the period ($) | | Fund's annualized
expense ratio (%) | |
| | | Actual | | Hypothetical | | Actual | | Hypothetical | | Actual | | Hypothetical | | Actual | |
| Class A | | | 1,000.00 | | | | 1,000.00 | | | | 1,037.80 | | | | 1,020.93 | | | | 4.00 | | | | 3.97 | | | | 0.79 | | |
| Class B | | | 1,000.00 | | | | 1,000.00 | | | | 1,034.80 | | | | 1,017.21 | | | | 7.79 | | | | 7.72 | | | | 1.54 | | |
| Class C | | | 1,000.00 | | | | 1,000.00 | | | | 1,033.90 | | | | 1,017.21 | | | | 7.79 | | | | 7.72 | | | | 1.54 | | |
| Class Z | | | 1,000.00 | | | | 1,000.00 | | | | 1,039.10 | | | | 1,022.18 | | | | 2.74 | | | | 2.72 | | | | 0.54 | | |
Expenses paid during the period are equal to the annualized expense ratio for each class as indicated above, multiplied by the average account value over the period and then multiplied by the number of days in the Fund's most recent six months and divided by 366.
Expenses do not include fees and expenses incurred indirectly by the Fund from the underlying funds in which the Fund may invest (also referred to as "acquired funds"), including affiliated and non-affiliated pooled investments vehicles (including mutual funds and exchange traded funds).
Had Columbia Management Investment Advisers, LLC and/or certain of its affiliates not waived/reimbursed certain fees and expenses, account value at the end of the period would have been reduced.
3
Portfolio Manager's Report – Columbia Virginia Intermediate Municipal Bond Fund
Performance data quoted represents past performance and current performance may be lower or higher. Past performance is no guarantee of future results. The investment return and principal value will fluctuate so that shares, when redeemed, may be worth more or less than the original cost. Please visit www.columbiamanagement.com for daily and most recent month-end performance updates.
30-day SEC yields
as of 04/30/12 (%)
| Class A | | | 1.20 | | |
| Class B | | | 0.50 | | |
| Class C | | | 0.51 | | |
| Class Z | | | 1.49 | | |
The 30-day SEC yields reflect the fund's earning power, net of expenses, expressed as an annualized percentage of the public offering price per share at the end of the period. Had the Investment Manager and/or any of its affiliates not waived fees or reimbursed a portion of expenses, the 30-day SEC yields would have been lower.
Taxable-equivalent SEC yields
as of 04/30/12 (%)
| Class A | | | 1.85 | | |
| Class B | | | 0.77 | | |
| Class C | | | 0.78 | | |
| Class Z | | | 2.29 | | |
Taxable-equivalent SEC yields are based on the combined maximum effective 35.0% federal income tax rate and applicable state income tax rate. This tax rate does not reflect the phase out of exemptions or the reduction of the otherwise allowable deductions that occur when adjusted gross income exceeds certain levels. Your taxable-equivalent yield may be different depending on your tax bracket.
Quality breakdown1
as of 04/30/12 (%)
| AAA rating | | | 18.6 | | |
| AA rating | | | 52.0 | | |
| A rating | | | 12.7 | | |
| BBB rating | | | 12.9 | | |
| Not rated | | | 3.8 | | |
1Percentages indicated are based upon total fixed income securities (excluding Investments of Cash Collateral Received for Securities on Loan and money market funds).
Bond ratings apply to the underlying holdings of the Fund and not the Fund itself and are divided into categories ranging from AAA (highest) to D (lowest), and are subject to change. The ratings shown are determined by using the middle rating of Moody's, S&P, and Fitch after dropping the highest and lowest available ratings. When a rating from only two agencies is available, the lower rating is used. When a rating from only one agency is available, that rating is used. When a bond is not rated by one of these agencies, it is designated as Not rated. Credit ratings are subjective to opinions and not statements of fact.
The Board of Trustees for Columbia Virginia Intermediate Municipal Bond Fund has approved the change of the fund's fiscal year end from March 31 to April 30. As a result, this report covers the 13-month period since the last annual report. The next report you receive will be for the six-month period from May 1, 2012 through October 31, 2012. In June 2011, Brian McGreevy became portfolio manager of the fund.
For the 13-month period that ended April 30, 2012, the fund's Class A shares returned 9.01% without sales charge. The fund underperformed its benchmark, the Barclays 3-15 Year Blend Municipal Bond Index, which returned 11.05% for the period. The fund had more exposure than the index to bonds with shorter maturities and higher quality, which hampered performance as longer maturities and lower quality securities were the best performers.
An improving economic environment
Early in the 13-month period, Europe's debt problems and wrangling in Washington over the federal budget and the national debt dominated world headlines. U.S. economic news was lackluster, housing continued to be a nagging weak spot and job growth was disappointing. However, the pace of both economic and job growth picked up as the period wore on. Consumer confidence improved as the labor market added approximately 1.2 million new jobs between November 2011 and April 2012, while the jobless rate fell to 8.1%. Household net worth also picked up as the equity markets rebounded. Headline inflation rose 2.7%, driven primarily by rising food and energy prices. Despite a modest slowdown late in the summer of 2011, manufacturing activity continued to expand throughout the period.
Municipal market generates strong returns
Against this backdrop, the U.S. municipal bond market generated strong returns, despite a host of investor concerns at the outset of the period: 1) Net outflows from municipal mutual funds. 2) The expectation that heavy new issue volume would weigh on the market, which turned out to be unfounded. Issuance dropped off almost across the board. 3) Fears of massive defaults, which were stoked by the media and were generally overblown. With these concerns in mind, 10-year municipal yields reached a high of 3.5% before the European debt crisis sent investors scurrying for the safety of the Treasury market, pushing Treasury yields down. Municipal yields followed. (Bond yields and prices move in opposite directions.)
By the summer of 2011, investors seemed to believe that default expectations were excessive and demand for municipal bonds picked up. With yields close to historical lows, buyers moved down the credit curve—to A and BBB rated2 bonds—to garner additional income. Over the course of the 13-month period, these credits performed the best, as yields fell and the yield spread between higher and lower quality bonds tightened in response to demand. Yet, there were more downgrades than upgrades in the overall municipal market as a lackluster economy continued to pressure issuers.
2The credit quality ratings represent those of Moody's Investors Service, Inc. ("Moody's"), Standard & Poor's Corporation ("S&P") or Fitch Ratings ("Fitch") credit ratings. The ratings represent their opinions as to the quality of the securities they rate. Ratings are relative and subjective and are not absolute standards of quality. The security's credit quality does not eliminate risk.
4
Portfolio Manager's Report (continued) – Columbia Virginia Intermediate Municipal Bond Fund
Duration positioning, quality figured into fund returns
The fund had more exposure to bonds with maturities of less than two years and held more cash than it is accustomed to doing, which detracted performance. The higher quality orientation of the portfolio was an even bigger drag on returns. Local general obligation bonds, which are very high quality bonds, accounted for approximately 18% of the fund's assets. The weight of bonds rated AAA and AA1 was more than eight percentage points higher than the index, and bonds rated A and BBB outperformed these higher quality bonds as the yield spread between higher and lower quality bonds tightened. Lower quality bonds also offered more yield, which further enhanced total return for the sector.
With a limited supply of lower-rated bonds available in the new issue or secondary market during the period, our ability to add to A rated holdings was limited. However, we added BBB rated bonds in the electric revenue sector, several higher quality names in the 10- to 15-year range and, near the end of the period, some exposure to the A rated health care sector.
Pace of recovery set to pick up in Virginia
With the unemployment rate down to nearly 6% and house prices rising, we believe Virginia is positioned to recover at a moderately accelerating pace over the next few years. National and international growth should support growth while federal deficit reduction is likely to restrain it. Longer term, Virginia remains a desirable place to do business, which is positive for investment, for job growth—and for the Virginia municipal bond market.
Portfolio characteristics and holdings are subject to change and may not be representative of current characteristics and holdings. The outlook for this fund may differ from that presented for other Columbia Funds.
Tax-exempt investing offers current tax-exempt income, but it also involves special risks. The value of the fund will be affected by interest rate changes and the creditworthiness of issues held in the fund. When interest rates go up, bond prices generally drop and vice versa.
Interest income from certain tax-exempt bonds may be subject to certain state and local taxes and, if applicable, the alternative minimum tax. Capital gains are not exempt from income taxes.
Single-state municipal bond funds pose additional risks due to limited geographical diversification.
5
Portfolio of Investments – Columbia Virginia Intermediate Municipal Bond Fund
April 30, 2012
(Percentages represent value of investments compared to net assets)
Issue
Description | | Coupon
Rate | | Principal
Amount | | Value | |
| Municipal Bonds 96.1% | |
| AIRPORT 3.8% | |
Metropolitan Washington Airports Authority
Refunding Revenue Bonds
Series 2010F-1 | |
| 10/01/21 | | | 5.000 | % | | $ | 1,000,000 | | | $ | 1,230,330 | | |
| Revenue Bonds | |
| Series 2009B | |
| 10/01/21 | | | 5.000 | % | | | 3,000,000 | | | | 3,556,290 | | |
Series 2009C
10/01/23 | | | 5.000 | % | | | 3,000,000 | | | | 3,424,620 | | |
Series 2010A
10/01/23 | | | 5.000 | % | | | 2,475,000 | | | | 2,923,148 | | |
| 10/01/27 | | | 5.000 | % | | | 1,515,000 | | | | 1,714,844 | | |
Norfolk Airport Authority
Refunding Revenue Bonds
Series 2011 (AGM) | |
| 07/01/24 | | | 5.000 | % | | | 1,000,000 | | | | 1,138,610 | | |
| Total | | | | | | | | | | | 13,987,842 | | |
| HIGHER EDUCATION 4.7% | |
Amherst Industrial Development Authority
Refunding Revenue Bonds
Educational Facilities Sweet Briar Institute
Series 2006 | |
| 09/01/26 | | | 5.000 | % | | | 1,000,000 | | | | 1,033,760 | | |
Lexington Industrial Development Authority
Revenue Bonds
VMI Development Board, Inc. Project
Series 2006A | |
| 12/01/20 | | | 5.000 | % | | | 1,400,000 | | | | 1,769,152 | | |
Virginia College Building Authority
Refunding Revenue Bonds
University of Richmond Project
Series 2011A | |
| 03/01/22 | | | 5.000 | % | | | 1,245,000 | | | | 1,539,741 | | |
Series 2011B
03/01/21 | | | 5.000 | % | | | 2,250,000 | | | | 2,819,835 | | |
| Revenue Bonds | |
| Liberty University Projects | |
Series 2010
03/01/19 | | | 5.000 | % | | | 1,000,000 | | | | 1,221,420 | | |
| 03/01/22 | | | 5.000 | % | | | 1,455,000 | | | | 1,726,460 | | |
| 03/01/23 | | | 5.000 | % | | | 2,000,000 | | | | 2,343,960 | | |
| Roanoke College | |
Series 2007
04/01/23 | | | 5.000 | % | | | 1,000,000 | | | | 1,091,920 | | |
| Washington & Lee University Project | |
Series 1998 (NPFGC)
01/01/26 | | | 5.250 | % | | | 3,115,000 | | | | 3,867,615 | | |
| Total | | | | | | | | | | | 17,413,863 | | |
| HOSPITAL 7.2% | |
Augusta County Industrial Development Authority
Refunding Revenue Bonds
Augusta Health Care, Inc.
Series 2003 | |
| 09/01/19 | | | 5.250 | % | | | 905,000 | | | | 1,062,226 | | |
Issue
Description | | Coupon
Rate | | Principal
Amount | | Value | |
| Municipal Bonds (continued) | |
| HOSPITAL (cont.) | |
Chesapeake Hospital Authority
Refunding Revenue Bonds
Chesapeake General Hospital
Series 2004A | |
| 07/01/18 | | | 5.250 | % | | $ | 1,500,000 | | | $ | 1,613,655 | | |
Fairfax County Industrial Development Authority
Refunding Revenue Bonds
Inova Health System Project
Series 1993 | |
| 08/15/19 | | | 5.250 | % | | | 1,000,000 | | | | 1,166,800 | | |
Series 1993I (NPFGC)
08/15/19 | | | 5.250 | % | | | 1,000,000 | | | | 1,157,870 | | |
| Revenue Bonds | |
| Health Care-Inova Health | |
Series 2009C
05/15/25 | | | 5.000 | % | | | 1,000,000 | | | | 1,133,550 | | |
Fredericksburg Economic Development Authority
Refunding Revenue Bonds
MediCorp Health Systems Obligation
Series 2007 | |
| 06/15/18 | | | 5.250 | % | | | 2,000,000 | | | | 2,306,080 | | |
| 06/15/20 | | | 5.250 | % | | | 6,495,000 | | | | 7,578,756 | | |
Roanoke Economic Development Authority
Refunding Revenue Bonds
Carolina Clinic Obligation
Series 2010 | |
| 07/01/25 | | | 5.000 | % | | | 3,500,000 | | | | 3,884,510 | | |
| Revenue Bonds | |
| Carilion Clinic Obligation Group | |
Series 2012
07/01/22 | | | 5.000 | % | | | 2,000,000 | | | | 2,351,140 | | |
| 07/01/23 | | | 5.000 | % | | | 1,000,000 | | | | 1,160,810 | | |
Virginia Small Business Financing Authority
Refunding Revenue Bonds
Sentara Healthcare
Series 2010 | |
| 11/01/16 | | | 4.000 | % | | | 1,000,000 | | | | 1,113,080 | | |
| Revenue Bonds | |
| Wellmont Health System Project | |
Series 2007A
09/01/22 | | | 5.125 | % | | | 710,000 | | | | 752,096 | | |
Winchester Industrial Development Authority
Revenue Bonds
Valley Health System
Series 2007 | |
| 01/01/26 | | | 5.000 | % | | | 1,250,000 | | | | 1,348,512 | | |
| Total | | | | | | | | | | | 26,629,085 | | |
| INVESTOR OWNED 1.3% | |
Chesterfield County Economic Development Authority
Refunding Revenue Bonds
Virginia Electric & Power
Series 2009A | |
| 05/01/23 | | | 5.000 | % | | | 2,000,000 | | | | 2,275,320 | | |
The Accompanying Notes to Financial Statements are an integral part of this statement.
6
Columbia Virginia Intermediate Municipal Bond Fund
April 30, 2012
(Percentages represent value of investments compared to net assets)
Issue
Description | | Coupon
Rate | | Principal
Amount | | Value | |
| Municipal Bonds (continued) | |
| INVESTOR OWNED (cont.) | |
Louisa Industrial Development Authority
Revenue Bonds
Virginia Electric & Power Co. Project
Series 2008A | |
| 11/01/35 | | | 5.375 | % | | $ | 1,000,000 | | | $ | 1,062,460 | | |
York County Economic Development Authority
Refunding Revenue Bonds
Virginia Electric & Power
Series 2009A | |
| 05/01/33 | | | 4.050 | % | | | 1,300,000 | | | | 1,368,523 | | |
| Total | | | | | | | | | | | 4,706,303 | | |
| LOCAL APPROPRIATION 9.7% | |
Appomattox County Economic Development Authority
Refunding Revenue Bonds
Series 2010 | |
| 05/01/22 | | | 5.000 | % | | | 1,490,000 | | | | 1,762,685 | | |
Arlington County Industrial Development Authority
Revenue Bonds
Virginia Capital Project
Series 2004 | |
| 08/01/17 | | | 5.000 | % | | | 1,205,000 | | | | 1,315,053 | | |
| 08/01/18 | | | 5.000 | % | | | 1,205,000 | | | | 1,313,354 | | |
Bedford County Economic Development Authority
Revenue Bonds
Public Facilities Project
Series 2006 (NPFGC) | |
| 05/01/15 | | | 5.000 | % | | | 1,230,000 | | | | 1,373,516 | | |
County of Prince William
Certificate of Participation
Prince William County Facilities
Series 2006A (AMBAC) | |
| 09/01/17 | | | 5.000 | % | | | 800,000 | | | | 929,640 | | |
| 09/01/21 | | | 5.000 | % | | | 1,625,000 | | | | 1,812,639 | | |
Fairfax County Economic Development Authority
Revenue Bonds
Fairfax Public Improvement Projects
Series 2005 | |
| 01/15/24 | | | 5.000 | % | | | 2,315,000 | | | | 2,545,296 | | |
| Government Center Properties | |
Series 2003F (AMBAC)
05/15/15 | | | 5.000 | % | | | 5,000,000 | | | | 5,640,750 | | |
| School Board Center Administration Building Project I | |
Series 2005A
04/01/19 | | | 5.000 | % | | | 1,380,000 | | | | 1,524,113 | | |
| Six Public Facilities Projects | |
Series 2010
04/01/24 | | | 4.000 | % | | | 1,340,000 | | | | 1,465,183 | | |
Hampton Roads Regional Jail Authority
Refunding Revenue Bonds
Series 2004 (NPFGC) | |
| 07/01/14 | | | 5.000 | % | | | 1,750,000 | | | | 1,890,193 | | |
| 07/01/15 | | | 5.000 | % | | | 1,685,000 | | | | 1,812,453 | | |
| 07/01/16 | | | 5.000 | % | | | 1,930,000 | | | | 2,065,042 | | |
Henrico County Economic Development Authority
Refunding Revenue Bonds
Series 2009B | |
| 08/01/21 | | | 4.500 | % | | | 1,770,000 | | | | 2,095,379 | | |
Issue
Description | | Coupon
Rate | | Principal
Amount | | Value | |
| Municipal Bonds (continued) | |
| LOCAL APPROPRIATION (cont.) | |
James City County Economic Development Authority
Revenue Bonds
Public Facilities Projects
Series 2006 (AGM) | |
| 06/15/23 | | | 5.000 | % | | $ | 2,000,000 | | | $ | 2,231,300 | | |
Montgomery County Industrial Development Authority
Revenue Bonds
Public Projects
Series 2008 | |
| 02/01/29 | | | 5.000 | % | | | 1,000,000 | | | | 1,092,200 | | |
New Kent County Economic Development Authority
Revenue Bonds
School & Governmental Projects
Series 2006 (AGM) | |
| 02/01/15 | | | 5.000 | % | | | 1,000,000 | | | | 1,115,800 | | |
| 02/01/21 | | | 5.000 | % | | | 2,075,000 | | | | 2,339,853 | | |
Prince William County Industrial Development Authority
Refunding Revenue Bonds
ATCC Project
Series 2005 | |
| 02/01/17 | | | 5.250 | % | | | 1,115,000 | | | | 1,334,911 | | |
| Total | | | | | | | | | | | 35,659,360 | | |
| LOCAL GENERAL OBLIGATION 20.3% | |
City of Colonial Heights
Unlimited General Obligation Refunding & Public
Improvement Bonds
Series 2012 | |
| 06/01/21 | | | 4.000 | % | | | 1,025,000 | | | | 1,203,740 | | |
City of Hampton
Limited General Obligation Refunding & Public Improvement Bonds
Series 2010A | |
| 01/15/19 | | | 4.000 | % | | | 2,000,000 | | | | 2,346,500 | | |
Unlimited General Obligation Refunding & Public Improvement Bonds
Series 2004 | |
| 02/01/15 | | | 5.000 | % | | | 1,275,000 | | | | 1,375,177 | | |
City of Lynchburg
Unlimited General Obligation Public Improvement Bonds
Series 2009A | |
| 08/01/20 | | | 5.000 | % | | | 525,000 | | | | 643,214 | | |
| 08/01/21 | | | 5.000 | % | | | 530,000 | | | | 641,851 | | |
City of Manassas Park
Unlimited General Obligation Refunding Bonds
Series 2008 (AGM) | |
| 01/01/22 | | | 5.000 | % | | | 1,205,000 | | | | 1,399,342 | | |
City of Newport News
Unlimited General Obligation Improvement Bonds
Series 2011A | |
| 07/01/23 | | | 5.000 | % | | | 1,380,000 | | | | 1,662,859 | | |
Unlimited General Obligation Refunding Bonds
Improvement-Water | |
Series 2007B
07/01/20 | | | 5.250 | % | | | 2,000,000 | | | | 2,552,520 | | |
Series 2006B
02/01/18 | | | 5.250 | % | | | 3,030,000 | | | | 3,716,901 | | |
The Accompanying Notes to Financial Statements are an integral part of this statement.
7
Columbia Virginia Intermediate Municipal Bond Fund
April 30, 2012
(Percentages represent value of investments compared to net assets)
Issue
Description | | Coupon
Rate | | Principal
Amount | | Value | |
| Municipal Bonds (continued) | |
| LOCAL GENERAL OBLIGATION (cont.) | |
City of Norfolk
Unlimited General Obligation Refunding Bonds
Capital Improvement
Series 2005 (NPFGC) | |
| 03/01/15 | | | 5.000 | % | | $ | 5,070,000 | | | $ | 5,711,203 | | |
City of Portsmouth
Unlimited General Obligation Refunding Bonds
Public Utilities
Series 2012A | |
| 07/15/21 | | | 5.000 | % | | | 3,000,000 | | | | 3,769,470 | | |
Series 2003 (AGM)
07/01/17 | | | 5.000 | % | | | 4,035,000 | | | | 4,407,874 | | |
| 07/01/19 | | | 5.000 | % | | | 1,895,000 | | | | 2,064,527 | | |
Series 2006A (NPFGC)
07/01/16 | | | 5.000 | % | | | 1,000,000 | | | | 1,172,780 | | |
City of Richmond
Unlimited General Obligation Public Improvement Bonds
Series 2010D | |
| 07/15/22 | | | 5.000 | % | | | 575,000 | | | | 706,238 | | |
| 07/15/24 | | | 5.000 | % | | | 1,000,000 | | | | 1,248,160 | | |
Unlimited General Obligation Refunding Public Improvement Bonds
Series 2005A (AGM) | |
| 07/15/15 | | | 5.000 | % | | | 5,340,000 | | | | 6,112,111 | | |
City of Virginia Beach
Unlimited General Obligation Refunding & Public Improvement Bonds
Series 2004B | |
| 05/01/13 | | | 5.000 | % | | | 1,305,000 | | | | 1,367,353 | | |
| 05/01/17 | | | 5.000 | % | | | 1,000,000 | | | | 1,183,800 | | |
County of Arlington
Unlimited General Obligation Refunding Bonds
Public Improvement
Series 2006 | |
| 08/01/17 | | | 5.000 | % | | | 2,400,000 | | | | 2,817,096 | | |
Series 1993
06/01/12 | | | 6.000 | % | | | 3,285,000 | | | | 3,301,974 | | |
Series 2012A
08/01/22 | | | 5.000 | % | | | 3,000,000 | | | | 3,876,180 | | |
County of Fairfax
Unlimited General Obligation Refunding Bonds
Public Improvement
Series 2011A | |
| 04/01/24 | | | 4.000 | % | | | 2,000,000 | | | | 2,284,000 | | |
County of Fauquier
Unlimited General Obligation Refunding Bonds
School
Series 2012 | |
| 07/15/21 | | | 4.000 | % | | | 1,000,000 | | | | 1,175,320 | | |
County of Loudoun
Unlimited General Obligation Refunding Bonds
Series 1998B | |
| 12/01/15 | | | 5.250 | % | | | 1,000,000 | | | | 1,165,620 | | |
Series 2005A
07/01/14 | | | 5.000 | % | | | 4,000,000 | | | | 4,400,720 | | |
County of Pittsylvania
Unlimited General Obligation Bonds
Series 2008B | |
| 02/01/23 | | | 5.500 | % | | | 1,030,000 | | | | 1,233,878 | | |
Issue
Description | | Coupon
Rate | | Principal
Amount | | Value | |
| Municipal Bonds (continued) | |
| LOCAL GENERAL OBLIGATION (cont.) | |
County of Prince William
Unlimited General Obligation Refunding & Public
Improvements Bonds
Series 2012A | |
| 08/01/21 | | | 4.000 | % | | $ | 2,815,000 | | | $ | 3,366,036 | | |
County of Smyth
Unlimited General Obligation Bonds
Public Improvement
Series 2011A | |
| 11/01/31 | | | 5.000 | % | | | 4,000,000 | | | | 4,522,920 | | |
Newport News Economic Development Authority
Revenue Bonds
Series 2005A | |
| 01/15/23 | | | 5.250 | % | | | 1,510,000 | | | | 1,720,917 | | |
Town of Leesburg
Unlimited General Obligation Refunding Bonds
Series 2006B | |
| 09/15/17 | | | 5.000 | % | | | 1,145,000 | | | | 1,382,347 | | |
| Total | | | | | | | | | | | 74,532,628 | | |
| MULTI-FAMILY 0.2% | |
Prince William County Industrial Development Authority
Subordinated Revenue Bonds
Melrose Apartment
Series 1998C(a) | |
| 07/01/29 | | | 7.000 | % | | | 570,000 | | | | 568,233 | | |
| MUNICIPAL POWER 0.6% | |
Puerto Rico Electric Power Authority(b)
Refunding Revenue Bonds
Series 2002JJ (XLCA) | |
| 07/01/16 | | | 5.375 | % | | | 1,100,000 | | | | 1,239,084 | | |
Series 2007VV (NPFGC/FGIC)
07/01/24 | | | 5.250 | % | | | 1,000,000 | | | | 1,124,590 | | |
| Total | | | | | | | | | | | 2,363,674 | | |
| OTHER BOND ISSUE 1.9% | |
City of Norfolk
Refunding Revenue Bonds
Series 2005A (NPFGC) | |
| 02/01/21 | | | 5.000 | % | | | 5,170,000 | | | | 5,408,906 | | |
Virginia Beach Development Authority
Revenue Bonds
Series 2010C | |
| 08/01/23 | | | 5.000 | % | | | 1,380,000 | | | | 1,647,471 | | |
| Total | | | | | | | | | | | 7,056,377 | | |
| OTHER INDUSTRIAL DEVELOPMENT BOND 0.6% | |
Peninsula Ports Authority
Refunding Revenue Bonds
Dominion Term Association Project
Series 2003(c) | |
| 10/01/33 | | | 2.375 | % | | | 2,000,000 | | | | 2,028,580 | | |
| POOL/BOND BANK 13.9% | |
Virginia Public School Authority
Refunding Revenue Bonds
School Financing
Series 2004C | |
| 08/01/16 | | | 5.000 | % | | | 7,425,000 | | | | 8,742,640 | | |
Series 2009C
08/01/25 | | | 4.000 | % | | | 2,560,000 | | | | 2,778,317 | | |
The Accompanying Notes to Financial Statements are an integral part of this statement.
8
Columbia Virginia Intermediate Municipal Bond Fund
April 30, 2012
(Percentages represent value of investments compared to net assets)
Issue
Description | | Coupon
Rate | | Principal
Amount | | Value | |
| Municipal Bonds (continued) | |
| POOL/BOND BANK (cont.) | |
Virginia Resources Authority
Refunding Revenue Bonds
Revolving Fund
Series 2011A | |
| 08/01/24 | | | 5.000 | % | | $ | 1,395,000 | | | $ | 1,669,341 | | |
| Subordinated State Revolving Fund | |
Series 2005
10/01/19 | | | 5.500 | % | | | 5,180,000 | | | | 6,673,757 | | |
| 10/01/20 | | | 5.500 | % | | | 3,500,000 | | | | 4,566,975 | | |
| 10/01/21 | | | 5.500 | % | | | 6,475,000 | | | | 8,527,640 | | |
| Revenue Bonds | |
| Pooled Financing | |
Series 2009B
11/01/18 | | | 4.000 | % | | | 4,000,000 | | | | 4,704,360 | | |
| Pooled Financing Program | |
Series 2005B
11/01/18 | | | 5.000 | % | | | 1,030,000 | | | | 1,177,094 | | |
| Pooled Loan Bond Program | |
Series 2002B
11/01/13 | | | 5.000 | % | | | 1,175,000 | | | | 1,257,849 | | |
| Pooled Moral Obligation | |
Series 2009B
11/01/18 | | | 4.000 | % | | | 1,000,000 | | | | 1,166,890 | | |
| State Revolving Fund | |
Series 2009
10/01/17 | | | 5.000 | % | | | 1,380,000 | | | | 1,674,133 | | |
| Subordinated State Revolving Fund | |
Series 2008
10/01/29 | | | 5.000 | % | | | 5,000,000 | | | | 5,745,400 | | |
| Unrefunded Revenue Bonds | |
Subordinated Series 2003
11/01/18 | | | 5.000 | % | | | 1,055,000 | | | | 1,119,956 | | |
| 11/01/19 | | | 5.000 | % | | | 1,100,000 | | | | 1,167,727 | | |
| Total | | | | | | | | | | | 50,972,079 | | |
| PORTS 0.8% | |
Virginia Port Authority(d)
Revenue Bonds
Series 2003 (NPFGC) AMT | |
| 07/01/14 | | | 5.125 | % | | | 1,360,000 | | | | 1,432,407 | | |
| 07/01/15 | | | 5.125 | % | | | 1,430,000 | | | | 1,504,660 | | |
| Total | | | | | | | | | | | 2,937,067 | | |
| REFUNDED/ESCROWED 5.4% | |
City of Hampton
Prerefunded 04/01/15 Unlimited General Obligation
Public Improvement Bonds
Series 2005A (NPFGC/FGIC) | |
| 04/01/18 | | | 5.000 | % | | | 1,500,000 | | | | 1,698,195 | | |
City of Portsmouth
Prerefunded 07/01/14 Unlimited General Obligation Bonds
Series 2003 (AGM) | |
| 07/01/17 | | | 5.000 | % | | | 350,000 | | | | 383,299 | | |
| 07/01/19 | | | 5.000 | % | | | 165,000 | | | | 180,698 | | |
County of Arlington
Prerefunded 08/01/16 Unlimited General Obligation
Public Improvement Bonds
Series 2006 | |
| 08/01/17 | | | 5.000 | % | | | 1,600,000 | | | | 1,887,248 | | |
Issue
Description | | Coupon
Rate | | Principal
Amount | | Value | |
| Municipal Bonds (continued) | |
| REFUNDED/ESCROWED (cont.) | |
County of Henrico
Prerefunded 12/01/18 Unlimited General Obligation
Public Improvement Bonds
Series 2008A | |
| 12/01/21 | | | 5.000 | % | | $ | 1,000,000 | | | $ | 1,245,670 | | |
Richmond Metropolitan Authority
Refunding Revenue Bonds
Series 1998 Escrowed to Maturity (NPFGC/FGIC) | |
| 07/15/17 | | | 5.250 | % | | | 530,000 | | | | 606,331 | | |
Roanoke Economic Development Authority
Revenue Bonds
Carilion Health System
Series 2002A (NPFGC) | |
| 07/01/12 | | | 5.250 | % | | | 4,000,000 | | | | 4,034,000 | | |
Tobacco Settlement Financing Corp.
Asset-Backed Revenue Bonds
Series 2005 | |
| 06/01/19 | | | 5.250 | % | | | 635,000 | | | | 637,730 | | |
| Prerefunded 06/01/15 Asset-Backed Revenue Bonds | |
| Series 2005 | |
| 06/01/26 | | | 5.500 | % | | | 4,250,000 | | | | 4,633,562 | | |
Virginia Beach Development Authority
Prerefunded 05/01/15 Revenue Bonds
Series 2005A | |
| 05/01/21 | | | 5.000 | % | | | 4,000,000 | | | | 4,542,600 | | |
Virginia Resources Authority
Prerefunded 11/01/13 Revenue Bonds
Subordinated Series 2003 | |
| 11/01/18 | | | 5.000 | % | | | 20,000 | | | | 21,374 | | |
| 11/01/19 | | | 5.000 | % | | | 25,000 | | | | 26,718 | | |
| Total | | | | | | | | | | | 19,897,425 | | |
| RETIREMENT COMMUNITIES 1.6% | |
Fairfax County Economic Development Authority
Refunding Revenue Bonds
Retirement-Greenspring
Series 2006A | |
| 10/01/26 | | | 4.750 | % | | | 2,000,000 | | | | 2,065,480 | | |
| Revenue Bonds | |
| Goodwin House, Inc. | |
Series 2007
10/01/22 | | | 5.000 | % | | | 2,500,000 | | | | 2,630,600 | | |
Henrico County Economic Development Authority
Refunding Revenue Bonds
Westminster Canterbury Corp.
Series 2006 | |
| 10/01/21 | | | 5.000 | % | | | 1,000,000 | | | | 1,050,570 | | |
| Total | | | | | | | | | | | 5,746,650 | | |
| SPECIAL NON PROPERTY TAX 5.9% | |
Greater Richmond Convention Center Authority
Refunding Revenue Bonds
Series 2005 (NPFGC) | |
| 06/15/15 | | | 5.000 | % | | | 2,480,000 | | | | 2,748,882 | | |
| 06/15/18 | | | 5.000 | % | | | 3,800,000 | | | | 4,161,380 | | |
| 06/15/25 | | | 5.000 | % | | | 3,000,000 | | | | 3,168,600 | | |
The Accompanying Notes to Financial Statements are an integral part of this statement.
9
Columbia Virginia Intermediate Municipal Bond Fund
April 30, 2012
(Percentages represent value of investments compared to net assets)
Issue
Description | | Coupon
Rate | | Principal
Amount | | Value | |
| Municipal Bonds (continued) | |
| SPECIAL NON PROPERTY TAX (cont.) | |
Puerto Rico Infrastructure Financing Authority
Refunding Revenue Bonds
Series 2005C (FGIC)(b) | |
| 07/01/19 | | | 5.500 | % | | $ | 2,500,000 | | | $ | 2,815,325 | | |
Reynolds Crossing Community Development Authority
Special Assessment Bonds
Reynolds Crossing Project
Series 2007 | |
| 03/01/21 | | | 5.100 | % | | | 1,063,000 | | | | 1,074,491 | | |
Territory of Guam
Revenue Bonds
Series 2011A(b) | |
| 01/01/31 | | | 5.000 | % | | | 850,000 | | | | 934,014 | | |
Virgin Islands Public Finance Authority
Revenue Bonds
Senior Lien-Matching Fund Loan Note
Series 2010A(b) | |
| 10/01/25 | | | 5.000 | % | | | 2,450,000 | | | | 2,630,835 | | |
Watkins Centre Community Development Authority
Revenue Bonds
Series 2007 | |
| 03/01/20 | | | 5.400 | % | | | 2,063,000 | | | | 2,113,997 | | |
White Oak Village Shops Community Development
Authority
Special Assessment Bonds
Series 2007 | |
| 03/01/17 | | | 5.300 | % | | | 2,078,000 | | | | 2,201,225 | | |
| Total | | | | | | | | | | | 21,848,749 | | |
| SPECIAL PROPERTY TAX 4.1% | |
Fairfax County Economic Development Authority
Special Tax Bonds
Route 28 Project
Series 2004 (NPFGC) | |
| 04/01/24 | | | 5.000 | % | | | 2,865,000 | | | | 3,065,836 | | |
| Silver Line Phase I Project | |
Series 2011
04/01/19 | | | 5.000 | % | | | 4,315,000 | | | | 5,265,336 | | |
| 04/01/26 | | | 5.000 | % | | | 4,185,000 | | | | 4,866,444 | | |
Marquis Community Development Authority
Tax Allocation Bonds
Series 2007B | |
| 09/01/41 | | | 5.625 | % | | | 2,084,000 | | | | 1,735,513 | | |
Marquis Community Development Authority(e)
Tax Allocation Bonds
Series 2007C | |
| 09/01/41 | | | 0.000 | % | | | 3,164,000 | | | | 281,311 | | |
| Total | | | | | | | | | | | 15,214,440 | | |
| STATE APPROPRIATED 5.0% | |
Virginia College Building Authority
Revenue Bonds
Public Higher Education Financing Program
Series 2006A | |
| 09/01/13 | | | 5.000 | % | | | 2,000,000 | | | | 2,126,160 | | |
| 09/01/14 | | | 5.000 | % | | | 2,925,000 | | | | 3,235,781 | | |
Issue
Description | | Coupon
Rate | | Principal
Amount | | Value | |
| Municipal Bonds (continued) | |
| STATE APPROPRIATED (cont.) | |
Virginia Public Building Authority
Revenue Bonds
Public Facility
Series 2006B | |
| 08/01/26 | | | 4.500 | % | | $ | 2,000,000 | | | $ | 2,140,660 | | |
Series 2005C
08/01/14 | | | 5.000 | % | | | 2,000,000 | | | | 2,201,260 | | |
Series 2006A
08/01/15 | | | 5.000 | % | | | 4,775,000 | | | | 5,448,753 | | |
Virginia Public School Authority
Refunding Revenue Bonds
School Financing 1997
Series 2012 | |
| 08/01/26 | | | 4.000 | % | | | 3,000,000 | | | | 3,289,080 | | |
| Total | | | | | | | | | | | 18,441,694 | | |
| STATE GENERAL OBLIGATION 1.0% | |
Puerto Rico Public Buildings Authority
Revenue Bonds
Government Facilities
Series 2007N(b) | |
| 07/01/24 | | | 5.500 | % | | | 3,425,000 | | | | 3,623,239 | | |
| TURNPIKE/BRIDGE/TOLL ROAD 2.2% | |
Chesapeake Bay Bridge & Tunnel District
Refunding Revenue Bonds
General Resolution
Series 1998 (NPFGC) | |
| 07/01/25 | | | 5.500 | % | | | 4,000,000 | | | | 4,539,040 | | |
Metropolitan Washington Airports Authority
Revenue Bonds
Capital Appreciation-2nd Senior Lien
Series 2009B (AGM)(e) | |
| 10/01/23 | | | 0.000 | % | | | 5,000,000 | | | | 3,051,950 | | |
Richmond Metropolitan Authority
Refunding Revenue Bonds
Series 1998 (NPFGC/FGIC) | |
| 07/15/17 | | | 5.250 | % | | | 470,000 | | | | 517,569 | | |
| Total | | | | | | | | | | | 8,108,559 | | |
| WATER & SEWER 5.9% | |
City of Newport News
Revenue Bonds
Series 2007 (AGM) | |
| 06/01/19 | | | 5.000 | % | | | 1,035,000 | | | | 1,206,883 | | |
City of Norfolk Water
Refunding Revenue Bonds
Series 2012 | |
| 11/01/19 | | | 5.000 | % | | | 1,000,000 | | | | 1,247,560 | | |
City of Richmond
Revenue Bonds
Series 2007 (AGM) | |
| 01/15/21 | | | 4.500 | % | | | 1,000,000 | | | | 1,117,790 | | |
County of Spotsylvania
Revenue Bonds
Series 2007 (AGM) | |
| 06/01/19 | | | 5.000 | % | | | 1,030,000 | | | | 1,197,602 | | |
The Accompanying Notes to Financial Statements are an integral part of this statement.
10
Columbia Virginia Intermediate Municipal Bond Fund
April 30, 2012
(Percentages represent value of investments compared to net assets)
Issue
Description | | Coupon
Rate | | Principal
Amount | | Value | |
| Municipal Bonds (continued) | |
| WATER & SEWER (cont.) | |
Fairfax County Water Authority
Refunding Revenue Bonds
Subordinated Series 2005B | |
| 04/01/19 | | | 5.250 | % | | $ | 1,835,000 | | | $ | 2,320,761 | | |
Hampton Roads Sanitation District
Revenue Bonds
Hampton Roads
Series 2008 | |
| 04/01/22 | | | 5.000 | % | | | 1,000,000 | | | | 1,163,480 | | |
| 04/01/24 | | | 5.000 | % | | | 3,000,000 | | | | 3,475,080 | | |
Series 2011
11/01/24 | | | 5.000 | % | | | 1,750,000 | | | | 2,083,200 | | |
| 11/01/25 | | | 5.000 | % | | | 1,380,000 | | | | 1,629,683 | | |
Upper Occoquan Sewage Authority
Refunding Revenue Bonds
Series 2003 (AGM) | |
| 07/01/13 | | | 5.000 | % | | | 1,640,000 | | | | 1,730,905 | | |
Series 2005 (AGM)
07/01/21 | | | 5.000 | % | | | 2,640,000 | | | | 2,965,063 | | |
Issue
Description | | Coupon
Rate | | Principal
Amount | | Value | |
| Municipal Bonds (continued) | |
| WATER & SEWER (cont.) | |
| Revenue Bonds | |
Series 1995A (NPFGC)
07/01/20 | | | 5.150 | % | | $ | 1,295,000 | | | $ | 1,569,890 | | |
| Total | | | | | | | | | | | 21,707,897 | | |
Total Municipal Bonds
(Cost: $327,125,627) | | $ | 353,443,744 | | |
| | | Shares | | Value | |
| Money Market Funds 3.1% | |
JPMorgan Tax Free Money Market
Fund, 0.010%(f) | | | 11,362,093 | | | $ | 11,362,093 | | |
Total Money Market Funds
(Cost: $11,362,093) | | $ | 11,362,093 | | |
Total Investments
(Cost: $338,487,720) | | | | | | | | | | $ | 364,805,837 | | |
| Other Assets & Liabilities, Net | | | | | | | | | | | 2,910,269 | | |
| Total Net Assets | | $ | 367,716,106 | | |
| Notes to Portfolio of Investments | |
(a) Identifies issues considered to be illiquid as to their marketability. The aggregate value of such securities at April 30, 2012 was $568,233, representing 0.15% of net assets. Information concerning such security holdings at April 30, 2012 was as follows:
| Security Description | | Acquisition
Dates | | Cost | |
Prince William County Industrial Development Authority
Subordinated Revenue Bonds
Melrose Apartment
Series 1998C
7.000% 07/01/29 | | 04/02/08 | | $ | 564,300 | | |
(b) Municipal obligations include debt obligations issued by or on behalf of territories, possessions, or sovereign nations within the territorial boundaries of the United States. At April 30, 2012, the value of these securities amounted to $12,367,087 or 3.36% of net assets.
(c) Variable rate security. The interest rate shown reflects the rate as of April 30, 2012.
(d) At April 30, 2012, the value of securities subject to alternative minimum tax was $2,937,067, representing 0.80% of net assets.
(e) Zero coupon bond.
(f) The rate shown is the seven-day current annualized yield at April 30, 2012.
AGM Assured Guaranty Municipal Corporation
AMBAC Ambac Assurance Corporation
AMT Alternative Minimum Tax
FGIC Financial Guaranty Insurance Company
NPFGC National Public Finance Guarantee Corporation
XLCA XL Capital Assurance
The Accompanying Notes to Financial Statements are an integral part of this statement.
11
Columbia Virginia Intermediate Municipal Bond Fund
April 30, 2012
Generally accepted accounting principles (GAAP) require disclosure regarding the inputs and valuation techniques used to measure fair value and any changes in valuation inputs or techniques. In addition, investments shall be disclosed by major category.
The Fund categorizes its fair value measurements according to a three-level hierarchy that maximizes the use of observable inputs and minimizes the use of unobservable inputs by prioritizing that the most observable input be used when available. Observable inputs are those that market participants would use in pricing an investment based on market data obtained from sources independent of the reporting entity. Unobservable inputs are those that reflect the Fund's assumptions about the information market participants would use in pricing an investment. An investment's level within the fair value hierarchy is based on the lowest level of any input that is deemed significant to the asset or liability's fair value measurement. The input levels are not necessarily an indication of the risk or liquidity associated with investments at that level. For example, certain U.S. government securities are generally high quality and liquid, however, they are reflected as Level 2 because the inputs used to determine fair value may not always be quoted prices in an active market.
Fair value inputs are summarized in the three broad levels listed below:
• Level 1 — Valuations based on quoted prices for investments in active markets that the Fund has the ability to access at the measurement date (including NAV for open-end mutual funds). Valuation adjustments are not applied to Level 1 investments.
• Level 2 — Valuations based on other significant observable inputs (including quoted prices for similar securities, interest rates, prepayment speeds, credit risks, etc.).
• Level 3 — Valuations based on significant unobservable inputs (including the Fund's own assumptions and judgment in determining the fair value of investments).
Inputs that are used in determining fair value of an investment may include price information, credit data, volatility statistics, and other factors. These inputs can be either observable or unobservable. The availability of observable inputs can vary between investments, and is affected by various factors such as the type of investment, and the volume and level of activity for that investment or similar investments in the marketplace. The inputs will be considered by the Investment Manager, along with any other relevant factors in the calculation of an investment's fair value. The Fund uses prices and inputs that are current as of the measurement date, which may include periods of market dislocations. During these periods, the availability of prices and inputs may be reduced for many investments. This condition could cause an investment to be reclassified between the various levels within the hierarchy.
Investments falling into the Level 3 category are primarily supported by quoted prices from brokers and dealers participating in the market for those investments. However, these may be classified as Level 3 investments due to lack of market transparency and corroboration to support these quoted prices. Additionally, valuation models may be used as the pricing source for any remaining investments classified as Level 3. These models rely on one or more significant unobservable inputs and/or significant assumptions by the Investment Manager. Inputs used in valuations may include, but are not limited to, financial statement analysis, capital account balances, discount rates and estimated cash flows, and comparable company data.
Under the direction of the Fund's Board of Trustees (the Board), the Investment Manager's Valuation Committee (the Committee) is responsible for carrying out the valuation procedures approved by the Board. The Committee consists of voting and non-voting members from various groups within the Investment Manager's organization, including operations and accounting, trading and investments, compliance, risk management and legal.
The Committee meets at least monthly to review and approve valuation matters, which may include a description of specific valuation determinations, data regarding pricing information received from approved pricing vendors and brokers and the results of Board-approved valuation control policies and procedures (the Policies). The Policies address, among other things, instances when market quotations are readily available, including recommendation of third party pricing vendors and a determination of appropriate pricing methodologies; events that require specific valuation determinations and assessment of fair value techniques; securities with a potential for stale pricing, including those that are illiquid, restricted, or in default; and the effectiveness of third-party pricing vendors, including periodic reviews of vendors. The Committee meets more frequently, as needed, to discuss additional valuation matters, which may include the need to review back-testing results, review time-sensitive information or approve related valuation actions. The Committee reports to the Board, with members of the Committee meeting with the Board at each of its regularly scheduled meetings to discuss valuation matters and actions during the period, similar to those described earlier.
For investments categorized as Level 3, the Committee monitors information similar to that described above, which may include: (i) data specific to the issuer or comparable issuers, (ii) general market or specific sector news and (iii) quoted prices and specific or similar security transactions. The Committee considers this data and any changes from prior periods in order to assess the reasonableness of observable and unobservable inputs, any assumptions or internal models used to value those securities and changes in fair value. This data is also used to corroborate, when available, information received from approved pricing vendors and brokers. Various factors impact the frequency of monitoring this information (which may occur as often as daily). However, the Committee may determine that changes to inputs, assumptions and models are not required as a result of the monitoring procedures performed.
The Accompanying Notes to Financial Statements are an integral part of this statement.
12
Columbia Virginia Intermediate Municipal Bond Fund
April 30, 2012
| Fair Value Measurements (continued) | |
The following table is a summary of the inputs used to value the Fund's investments as of April 30, 2012:
| | | Fair Value at April 30, 2012 | |
| Description | | Level 1
Quoted Prices
in Active
Markets for
Identical Assets | | Level 2
Other
Significant
Observable
Inputs | | Level 3
Significant
Unobservable
Inputs | | Total | |
| Bonds | |
| Municipal Bonds | | $ | — | | | $ | 353,443,744 | | | $ | — | | | $ | 353,443,744 | | |
| Total Bonds | | | — | | | | 353,443,744 | | | | — | | | | 353,443,744 | | |
| Other | |
| Money Market Funds | | | 11,362,093 | | | | — | | | | — | | | | 11,362,093 | | |
| Total Other | | | 11,362,093 | | | | — | | | | — | | | | 11,362,093 | | |
| Total | | $ | 11,362,093 | | | $ | 353,443,744 | | | $ | — | | | $ | 364,805,837 | | |
See the Portfolio of Investments for all investment classifications not indicated in the table.
The Fund's assets assigned to the Level 2 input category are generally valued using the market approach, in which a security's value is determined through reference to prices and information from market transactions for similar or identical assets.
There were no transfers of financial assets between Levels 1 and 2 during the period from April 1, 2012 to April 30, 2012.
The following table is a summary of the inputs used to value the Fund's investments as of March 31, 2012:
| | | Fair Value at March 31, 2012 | |
| Description | | Level 1
Quoted Prices
in Active
Markets for
Identical Assets | | Level 2
Other
Significant
Observable
Inputs | | Level 3
Significant
Unobservable
Inputs | | Total | |
| Bonds | |
| Municipal Bonds | | $ | — | | | $ | 350,512,805 | | | $ | — | | | $ | 350,512,805 | | |
| Total Bonds | | | — | | | | 350,512,805 | | | | — | | | | 350,512,805 | | |
| Other | |
| Money Market Funds | | | 13,856,332 | | | | — | | | | — | | | | 13,856,332 | | |
| Total Other | | | 13,856,332 | | | | — | | | | — | | | | 13,856,332 | | |
| Total | | $ | 13,856,332 | | | $ | 350,512,805 | | | $ | — | | | $ | 364,369,137 | | |
The Fund's assets assigned to the Level 2 input category are generally valued using the market approach, in which a security's value is determined through reference to prices and information from market transactions for similar or identical assets.
There were no transfers of financial assets between Levels 1 and 2 during the period from April 1, 2011 to March 31, 2012.
The Accompanying Notes to Financial Statements are an integral part of this statement.
13
Statement of Assets and Liabilities – Columbia Virginia Intermediate Municipal Bond Fund
| | | April 30,
2012 | | March 31,
2012 | |
| Assets | |
| Investments, at value | |
| (identified cost $338,487,720 and $341,097,968) | | $ | 364,805,837 | | | $ | 364,369,137 | | |
| Receivable for: | |
| Capital shares sold | | | 327,838 | | | | 151,497 | | |
| Interest | | | 4,001,964 | | | | 4,404,975 | | |
| Expense reimbursement due from Investment Manager | | | 2,950 | | | | 1,863 | | |
| Prepaid expense | | | 2,296 | | | | 4,592 | | |
| Total assets | | | 369,140,885 | | | | 368,932,064 | | |
| Liabilities | |
| Payable for: | |
| Investments purchased | | | — | | | | 1,638,270 | | |
| Investments purchased on a delayed delivery basis | | | — | | | | 1,209,100 | | |
| Capital shares purchased | | | 223,600 | | | | 127,598 | | |
| Dividend distributions to shareholders | | | 1,024,252 | | | | 904,683 | | |
| Investment management fees | | | 12,037 | | | | 3,989 | | |
| Distribution and service fees | | | 1,505 | | | | 501 | | |
| Transfer agent fees | | | 56,150 | | | | 61,542 | | |
| Administration fees | | | 2,059 | | | | 682 | | |
| Compensation of board members | | | 80,533 | | | | 80,160 | | |
| Other expenses | | | 24,643 | | | | 44,437 | | |
| Total liabilities | | | 1,424,779 | | | | 4,070,962 | | |
| Net assets applicable to outstanding capital stock | | $ | 367,716,106 | | | $ | 364,861,102 | | |
The Accompanying Notes to Financial Statements are an integral part of this statement.
14
Statement of Assets and Liabilities (continued) – Columbia Virginia Intermediate Municipal Bond Fund
| | | April 30,
2012 | | March 31,
2012 | |
| Represented by | |
| Paid-in capital | | $ | 340,782,656 | | | $ | 340,954,556 | | |
| Undistributed net investment income | | | 851,335 | | | | 871,379 | | |
| Accumulated net realized loss | | | (236,002 | ) | | | (236,002 | ) | |
| Unrealized appreciation (depreciation) on: | |
| Investments | | | 26,318,117 | | | | 23,271,169 | | |
| Total — representing net assets applicable to outstanding capital stock | | $ | 367,716,106 | | | $ | 364,861,102 | | |
| Net assets applicable to outstanding shares | |
| Class A | | $ | 54,025,110 | | | $ | 53,774,711 | | |
| Class B | | $ | 161,316 | | | $ | 181,774 | | |
| Class C | | $ | 4,693,844 | | | $ | 4,738,940 | | |
| Class Z | | $ | 308,835,836 | | | $ | 306,165,677 | | |
| Shares outstanding | |
| Class A | | | 4,708,337 | | | | 4,725,377 | | |
| Class B | | | 14,055 | | | | 15,969 | | |
| Class C | | | 408,912 | | | | 416,260 | | |
| Class Z | | | 26,918,201 | | | | 26,906,982 | | |
| Net asset value per share | |
| Class A(a) | | $ | 11.47 | | | $ | 11.38 | | |
| Class B | | $ | 11.48 | | | $ | 11.38 | | |
| Class C | | $ | 11.48 | | | $ | 11.38 | | |
| Class Z | | $ | 11.47 | | | $ | 11.38 | | |
(a) At April 30, 2012 and March 31, 2012, the maximum offering price per share for Class A is $11.86 and $11.76, respectively. The offering price is calculated by dividing the net asset value by 1.0 minus the maximum sales charge of 3.25%.
The Accompanying Notes to Financial Statements are an integral part of this statement.
15
Statement of Operations – Columbia Virginia Intermediate Municipal Bond Fund
| Year ended | | April 30,
2012(a) | | March 31,
2012 | |
| Net investment income | |
| Income: | |
| Dividends | | $ | 149 | | | $ | 1,339 | | |
| Interest | | | 1,187,911 | | | | 12,391,304 | | |
| Total income | | | 1,188,060 | | | | 12,392,643 | | |
| Expenses: | |
| Investment management fees | | | 124,130 | | | | 1,340,595 | | |
| Distribution fees | |
| Class B | | | 110 | | | | 1,929 | | |
| Class C | | | 2,994 | | | | 31,113 | | |
| Service fees | |
| Class B | | | 37 | | | | 643 | | |
| Class C | | | 998 | | | | 10,371 | | |
| Distribution and service fees — Class A | | | 11,418 | | | | 130,842 | | |
| Transfer agent fees | |
| Class A | | | 8,167 | | | | 100,707 | | |
| Class B | | | 25 | | | | 674 | | |
| Class C | | | 731 | | | | 7,966 | | |
| Class Z | | | 44,802 | | | | 535,524 | | |
| Administration fees | | | 21,230 | | | | 285,097 | | |
| Compensation of board members | | | 1,075 | | | | 18,137 | | |
| Pricing and bookkeeping fees | | | — | | | | 12,533 | | |
| Custodian fees | | | 230 | | | | 9,878 | | |
| Printing and postage fees | | | — | | | | 36,926 | | |
| Registration fees | | | 200 | | | | 2,779 | | |
| Professional fees | | | 9,783 | | | | 57,911 | | |
| Chief compliance officer expenses | | | — | | | | 5 | | |
| Other | | | 2,773 | | | | 22,162 | | |
| Total expenses | | | 228,703 | | | | 2,605,792 | | |
| Fees waived or expenses reimbursed by Investment Manager and its affiliates | | | (45,071 | ) | | | (616,163 | ) | |
| Expense reductions | | | — | | | | (20 | ) | |
| Total net expenses | | | 183,632 | | | | 1,989,609 | | |
| Net investment income | | | 1,004,428 | | | | 10,403,034 | | |
| Realized and unrealized gain (loss) — net | |
| Net realized gain (loss) on: | |
| Investments | | | — | | | | (20,059 | ) | |
| Net realized gain (loss) | | | — | | | | (20,059 | ) | |
| Net change in unrealized appreciation (depreciation) on: | |
| Investments | | | 3,046,948 | | | | 14,966,600 | | |
| Net change in unrealized appreciation | | | 3,046,948 | | | | 14,966,600 | | |
| Net realized and unrealized gain | | | 3,046,948 | | | | 14,946,541 | | |
| Net increase in net assets resulting from operations | | $ | 4,051,376 | | | $ | 25,349,575 | | |
(a) For the period from April 1, 2012 to April 30, 2012. During the period, the Fund's fiscal year end was changed from March 31 to April 30.
The Accompanying Notes to Financial Statements are an integral part of this statement.
16
Statement of Changes in Net Assets – Columbia Virginia Intermediate Municipal Bond Fund
| Year ended | | April 30,
2012(a) | | March 31,
2012 | | March 31,
2011 | |
| Operations | |
| Net investment income | | $ | 1,004,428 | | | $ | 10,403,034 | | | $ | 10,939,384 | | |
| Net realized gain (loss) | | | — | | | | (20,059 | ) | | | 944,804 | | |
| Net change in unrealized appreciation (depreciation) | | | 3,046,948 | | | | 14,966,600 | | | | (3,524,802 | ) | |
| Net increase in net assets resulting from operations | | | 4,051,376 | | | | 25,349,575 | | | | 8,359,386 | | |
| Distributions to shareholders from: | |
| Net investment income | |
| Class A | | | (141,925 | ) | | | (1,520,549 | ) | | | (1,609,269 | ) | |
| Class B | | | (350 | ) | | | (5,614 | ) | | | (23,816 | ) | |
| Class C | | | (9,518 | ) | | | (88,821 | ) | | | (79,442 | ) | |
| Class Z | | | (872,679 | ) | | | (8,772,472 | ) | | | (9,226,858 | ) | |
| Total distributions to shareholders | | | (1,024,472 | ) | | | (10,387,456 | ) | | | (10,939,385 | ) | |
| Increase (decrease) in net assets from share transactions | | | (171,900 | ) | | | 30,261,636 | | | | (12,192,563 | ) | |
| Total increase (decrease) in net assets | | | 2,855,004 | | | | 45,223,755 | | | | (14,772,562 | ) | |
| Net assets at beginning of year | | | 364,861,102 | | | | 319,637,347 | | | | 334,409,909 | | |
| Net assets at end of year | | $ | 367,716,106 | | | $ | 364,861,102 | | | $ | 319,637,347 | | |
| Undistributed net investment income | | $ | 851,335 | | | $ | 871,379 | | | $ | 855,801 | | |
(a) For the period from April 1, 2012 to April 30, 2012. During the period, the Fund's fiscal year end was changed from March 31 to April 30.
The Accompanying Notes to Financial Statements are an integral part of this statement.
17
Statement of Changes in Net Assets (continued) – Columbia Virginia Intermediate Municipal Bond Fund
| Year ended | | April 30, 2012(a) | | March 31, 2012 | | March 31, 2011 | |
| | | Shares | | Dollars ($) | | Shares | | Dollars ($) | | Shares | | Dollars ($) | |
| Capital stock activity | |
| Class A shares | |
| Subscriptions(b) | | | 20,083 | | | | 230,314 | | | | 608,725 | | | | 6,864,588 | | | | 636,302 | | | | 6,986,838 | | |
| Distributions reinvested | | | 4,702 | | | | 53,927 | | | | 41,031 | | | | 463,382 | | | | 67,509 | | | | 749,647 | | |
| Redemptions | | | (41,825 | ) | | | (479,313 | ) | | | (640,513 | ) | | | (7,186,141 | ) | | | (725,931 | ) | | | (8,021,397 | ) | |
| Net increase (decrease) | | | (17,040 | ) | | | (195,072 | ) | | | 9,243 | | | | 141,829 | | | | (22,120 | ) | | | (284,912 | ) | |
| Class B shares | |
| Subscriptions | | | 16 | | | | 192 | | | | 972 | | | | 11,017 | | | | 2,104 | | | | 23,309 | | |
| Distributions reinvested | | | 15 | | | | 168 | | | | 193 | | | | 2,167 | | | | 876 | | | | 9,748 | | |
| Redemptions(b) | | | (1,945 | ) | | | (22,251 | ) | | | (21,295 | ) | | | (237,861 | ) | | | (110,751 | ) | | | (1,220,503 | ) | |
| Net decrease | | | (1,914 | ) | | | (21,891 | ) | | | (20,130 | ) | | | (224,677 | ) | | | (107,771 | ) | | | (1,187,446 | ) | |
| Class C shares | |
| Subscriptions | | | 1,650 | | | | 18,912 | | | | 150,587 | | | | 1,694,920 | | | | 211,559 | | | | 2,351,630 | | |
| Distributions reinvested | | | 512 | | | | 5,874 | | | | 4,378 | | | | 49,457 | | | | 4,380 | | | | 48,552 | | |
| Redemptions | | | (9,510 | ) | | | (108,742 | ) | | | (65,097 | ) | | | (729,025 | ) | | | (117,843 | ) | | | (1,282,673 | ) | |
| Net increase (decrease) | | | (7,348 | ) | | | (83,956 | ) | | | 89,868 | | | | 1,015,352 | | | | 98,096 | | | | 1,117,509 | | |
| Class Z shares | |
| Subscriptions | | | 276,412 | | | | 3,163,736 | | | | 6,577,650 | | | | 74,757,766 | | | | 3,242,791 | | | | 35,857,898 | | |
| Distributions reinvested | | | 2,694 | | | | 30,902 | | | | 29,608 | | | | 333,621 | | | | 36,806 | | | | 407,886 | | |
| Redemptions | | | (267,887 | ) | | | (3,065,619 | ) | | | (4,068,933 | ) | | | (45,762,255 | ) | | | (4,358,459 | ) | | | (48,103,498 | ) | |
| Net increase (decrease) | | | 11,219 | | | | 129,019 | | | | 2,538,325 | | | | 29,329,132 | | | | (1,078,862 | ) | | | (11,837,714 | ) | |
| Total net increase (decrease) | | | (15,083 | ) | | | (171,900 | ) | | | 2,617,306 | | | | 30,261,636 | | | | (1,110,657 | ) | | | (12,192,563 | ) | |
(a) For the period from April 1, 2012 to April 30, 2012. During the period, the Fund's fiscal year end was changed from March 31 to April 30.
(b) Includes conversions of Class B shares to Class A shares, if any.
The Accompanying Notes to Financial Statements are an integral part of this statement.
18
Financial Highlights – Columbia Virginia Intermediate Municipal Bond Fund
The following tables are intended to help you understand the Fund's financial performance. Certain information reflects financial results for a single share of a class held for the periods shown. Per share net investment income (loss) amounts are calculated based on average shares outstanding during the period. Total returns assume reinvestment of all dividends and distributions. Total returns do not reflect payments of sales charges, if any, and are not annualized for periods of less than one year.
| | | Year ended
April 30, | | Year ended March 31, | |
| | | 2012(a) | | 2012 | | 2011 | | 2010 | | 2009 | | 2008 | |
| Class A | |
| Per share data | |
| Net asset value, beginning of period | | $ | 11.38 | | | $ | 10.86 | | | $ | 10.94 | | | $ | 10.57 | | | $ | 10.65 | | | $ | 10.73 | | |
| Income from investment operations: | |
| Net investment income | | | 0.03 | | | | 0.33 | | | | 0.34 | | | | 0.35 | | | | 0.37 | | | | 0.38 | | |
| Net realized and unrealized gain (loss) | | | 0.09 | | | | 0.52 | | | | (0.08 | ) | | | 0.37 | | | | (0.08 | ) | | | (0.08 | ) | |
| Total from investment operations | | | 0.12 | | | | 0.85 | | | | 0.26 | | | | 0.72 | | | | 0.29 | | | | 0.30 | | |
| Less distributions to shareholders from: | |
| Net investment income | | | (0.03 | ) | | | (0.33 | ) | | | (0.34 | ) | | | (0.35 | ) | | | (0.37 | ) | | | (0.38 | ) | |
| Net realized gains | | | — | | | | — | | | | — | | | | — | | | | — | | | | (0.00 | )(b) | |
| Total distributions to shareholders | | | (0.03 | ) | | | (0.33 | ) | | | (0.34 | ) | | | (0.35 | ) | | | (0.37 | ) | | | (0.38 | ) | |
| Net asset value, end of period | | $ | 11.47 | | | $ | 11.38 | | | $ | 10.86 | | | $ | 10.94 | | | $ | 10.57 | | | $ | 10.65 | | |
| Total return | | | 1.06 | % | | | 7.87 | % | | | 2.40 | % | | | 6.83 | % | | | 2.83 | % | | | 2.85 | % | |
| Ratios to average net assets(c) | |
| Expenses prior to fees waived or expenses reimbursed | | | 0.94 | %(d) | | | 0.98 | % | | | 0.92 | % | | | 0.87 | % | | | 0.86 | % | | | 0.87 | % | |
| Net expenses after fees waived or expenses reimbursed(e) | | | 0.79 | %(d) | | | 0.79 | %(f) | | | 0.80 | %(f) | | | 0.78 | %(f) | | | 0.75 | %(f) | | | 0.75 | %(f) | |
| Net investment income | | | 3.04 | %(d) | | | 2.92 | %(f) | | | 3.11 | %(f) | | | 3.17 | %(f) | | | 3.54 | %(f) | | | 3.51 | %(f) | |
| Supplemental data | |
| Net assets, end of period (in thousands) | | $ | 54,025 | | | $ | 53,775 | | | $ | 51,196 | | | $ | 51,857 | | | $ | 47,970 | | | $ | 48,158 | | |
| Portfolio turnover | | | 0 | % | | | 8 | % | | | 14 | % | | | 12 | % | | | 12 | % | | | 12 | % | |
| Notes to Financial Highlights | |
(a) For the period from April 1, 2012 to April 30, 2012. During the period, the Fund's fiscal year end was changed from March 31 to April 30.
(b) Rounds to less than $0.01.
(c) In addition to the fees and expenses which the Fund bears directly, the Fund indirectly bears a pro rata share of the fees and expenses of the acquired funds in which it invests. Such indirect expenses are not included in the reported expense ratios.
(d) Annualized.
(e) The Investment Manager and certain of its affiliates agreed to waive/reimburse certain fees and expenses, if applicable.
(f) The benefits derived from expense reductions had an impact of less than 0.01%.
The Accompanying Notes to Financial Statements are an integral part of this statement.
19
Financial Highlights (continued) – Columbia Virginia Intermediate Municipal Bond Fund
| | | Year ended
April 30, | | Year ended March 31, | |
| | | 2012(a) | | 2012 | | 2011 | | 2010 | | 2009 | | 2008 | |
| Class B | |
| Per share data | |
| Net asset value, beginning of period | | $ | 11.38 | | | $ | 10.86 | | | $ | 10.95 | | | $ | 10.57 | | | $ | 10.65 | | | $ | 10.73 | | |
| Income from investment operations: | |
| Net investment income | | | 0.02 | | | | 0.25 | | | | 0.26 | | | | 0.27 | | | | 0.29 | | | | 0.30 | | |
| Net realized and unrealized gain (loss) | | | 0.10 | | | | 0.51 | | | | (0.09 | ) | | | 0.37 | | | | (0.08 | ) | | | (0.08 | ) | |
| Total from investment operations | | | 0.12 | | | | 0.76 | | | | 0.17 | | | | 0.64 | | | | 0.21 | | | | 0.22 | | |
| Less distributions to shareholders from: | |
| Net investment income | | | (0.02 | ) | | | (0.24 | ) | | | (0.26 | ) | | | (0.26 | ) | | | (0.29 | ) | | | (0.30 | ) | |
| Net realized gains | | | — | | | | — | | | | — | | | | — | | | | — | | | | (0.00 | )(b) | |
| Total distributions to shareholders | | | (0.02 | ) | | | (0.24 | ) | | | (0.26 | ) | | | (0.26 | ) | | | (0.29 | ) | | | (0.30 | ) | |
| Net asset value, end of period | | $ | 11.48 | | | $ | 11.38 | | | $ | 10.86 | | | $ | 10.95 | | | $ | 10.57 | | | $ | 10.65 | | |
| Total return | | | 1.08 | % | | | 7.06 | % | | | 1.55 | % | | | 6.14 | % | | | 2.07 | % | | | 2.08 | % | |
| Ratios to average net assets(c) | |
| Expenses prior to fees waived or expenses reimbursed | | | 1.69 | %(d) | | | 1.81 | % | | | 1.67 | % | | | 1.62 | % | | | 1.61 | % | | | 1.62 | % | |
| Net expenses after fees waived or expenses reimbursed(e) | | | 1.54 | %(d) | | | 1.54 | %(f) | | | 1.55 | %(f) | | | 1.53 | %(f) | | | 1.50 | %(f) | | | 1.50 | %(f) | |
| Net investment income | | | 2.29 | %(d) | | | 2.19 | %(f) | | | 2.34 | %(f) | | | 2.44 | %(f) | | | 2.80 | %(f) | | | 2.77 | %(f) | |
| Supplemental data | |
| Net assets, end of period (in thousands) | | $ | 161 | | | $ | 182 | | | $ | 392 | | | $ | 1,575 | | | $ | 2,220 | | | $ | 2,434 | | |
| Portfolio turnover | | | 0 | % | | | 8 | % | | | 14 | % | | | 12 | % | | | 12 | % | | | 12 | % | |
| Notes to Financial Highlights | |
(a) For the period from April 1, 2012 to April 30, 2012. During the period, the Fund's fiscal year end was changed from March 31 to April 30.
(b) Rounds to less than $0.01.
(c) In addition to the fees and expenses which the Fund bears directly, the Fund indirectly bears a pro rata share of the fees and expenses of the acquired funds in which it invests. Such indirect expenses are not included in the reported expense ratios.
(d) Annualized.
(e) The Investment Manager and certain of its affiliates agreed to waive/reimburse certain fees and expenses, if applicable.
(f) The benefits derived from expense reductions had an impact of less than 0.01%.
The Accompanying Notes to Financial Statements are an integral part of this statement.
20
Financial Highlights (continued) – Columbia Virginia Intermediate Municipal Bond Fund
| | | Year ended
April 30, | | Year ended March 31, | |
| | | 2012(a) | | 2012 | | 2011 | | 2010 | | 2009 | | 2008 | |
| Class C | |
| Per share data | |
| Net asset value, beginning of period | | $ | 11.38 | | | $ | 10.86 | | | $ | 10.95 | | | $ | 10.57 | | | $ | 10.65 | | | $ | 10.73 | | |
| Income from investment operations: | |
| Net investment income | | | 0.02 | | | | 0.24 | | | | 0.26 | | | | 0.26 | | | | 0.29 | | | | 0.30 | | |
| Net realized and unrealized gain (loss) | | | 0.10 | | | | 0.52 | | | | (0.09 | ) | | | 0.38 | | | | (0.08 | ) | | | (0.08 | ) | |
| Total from investment operations | | | 0.12 | | | | 0.76 | | | | 0.17 | | | | 0.64 | | | | 0.21 | | | | 0.22 | | |
| Less distributions to shareholders from: | |
| Net investment income | | | (0.02 | ) | | | (0.24 | ) | | | (0.26 | ) | | | (0.26 | ) | | | (0.29 | ) | | | (0.30 | ) | |
| Net realized gains | | | — | | | | — | | | | — | | | | — | | | | — | | | | (0.00 | )(b) | |
| Total distributions to shareholders | | | (0.02 | ) | | | (0.24 | ) | | | (0.26 | ) | | | (0.26 | ) | | | (0.29 | ) | | | (0.30 | ) | |
| Net asset value, end of period | | $ | 11.48 | | | $ | 11.38 | | | $ | 10.86 | | | $ | 10.95 | | | $ | 10.57 | | | $ | 10.65 | | |
| Total return | | | 1.08 | % | | | 7.06 | % | | | 1.54 | % | | | 6.13 | % | | | 2.07 | % | | | 2.08 | % | |
| Ratios to average net assets(c) | |
| Expenses prior to fees waived or expenses reimbursed | | | 1.70 | %(d) | | | 1.73 | % | | | 1.67 | % | | | 1.62 | % | | | 1.61 | % | | | 1.62 | % | |
| Net expenses after fees waived or expenses reimbursed(e) | | | 1.54 | %(d) | | | 1.54 | %(f) | | | 1.55 | %(f) | | | 1.53 | %(f) | | | 1.50 | %(f) | | | 1.50 | %(f) | |
| Net investment income | | | 2.29 | %(d) | | | 2.15 | %(f) | | | 2.35 | %(f) | | | 2.41 | %(f) | | | 2.79 | %(f) | | | 2.77 | %(f) | |
| Supplemental data | |
| Net assets, end of period (in thousands) | | $ | 4,694 | | | $ | 4,739 | | | $ | 3,544 | | | $ | 2,499 | | | $ | 1,898 | | | $ | 967 | | |
| Portfolio turnover | | | 0 | % | | | 8 | % | | | 14 | % | | | 12 | % | | | 12 | % | | | 12 | % | |
| Notes to Financial Highlights | |
(a) For the period from April 1, 2012 to April 30, 2012. During the period, the Fund's fiscal year end was changed from March 31 to April 30.
(b) Rounds to less than $0.01.
(c) In addition to the fees and expenses which the Fund bears directly, the Fund indirectly bears a pro rata share of the fees and expenses of the acquired funds in which it invests. Such indirect expenses are not included in the reported expense ratios.
(d) Annualized.
(e) The Investment Manager and certain of its affiliates agreed to waive/reimburse certain fees and expenses, if applicable.
(f) The benefits derived from expense reductions had an impact of less than 0.01%.
The Accompanying Notes to Financial Statements are an integral part of this statement.
21
Financial Highlights (continued) – Columbia Virginia Intermediate Municipal Bond Fund
| | | Year ended
April 30, | | Year ended March 31, | |
| | | 2012(a) | | 2012 | | 2011 | | 2010 | | 2009 | | 2008 | |
| Class Z | |
| Per share data | |
| Net asset value, beginning of period | | $ | 11.38 | | | $ | 10.85 | | | $ | 10.94 | | | $ | 10.57 | | | $ | 10.65 | | | $ | 10.73 | | |
| Income from investment operations: | |
| Net investment income | | | 0.03 | | | | 0.35 | | | | 0.37 | | | | 0.37 | | | | 0.40 | | | | 0.40 | | |
| Net realized and unrealized gain (loss) | | | 0.09 | | | | 0.53 | | | | (0.09 | ) | | | 0.37 | | | | (0.08 | ) | | | (0.07 | ) | |
| Total from investment operations | | | 0.12 | | | | 0.88 | | | | 0.28 | | | | 0.74 | | | | 0.32 | | | | 0.33 | | |
| Less distributions to shareholders from: | |
| Net investment income | | | (0.03 | ) | | | (0.35 | ) | | | (0.37 | ) | | | (0.37 | ) | | | (0.40 | ) | | | (0.41 | ) | |
| Net realized gains | | | — | | | | — | | | | — | | | | — | | | | — | | | | (0.00 | )(b) | |
| Total distributions to shareholders | | | (0.03 | ) | | | (0.35 | ) | | | (0.37 | ) | | | (0.37 | ) | | | (0.40 | ) | | | (0.41 | ) | |
| Net asset value, end of period | | $ | 11.47 | | | $ | 11.38 | | | $ | 10.85 | | | $ | 10.94 | | | $ | 10.57 | | | $ | 10.65 | | |
| Total return | | | 1.08 | % | | | 8.23 | % | | | 2.56 | % | | | 7.10 | % | | | 3.09 | % | | | 3.10 | % | |
| Ratios to average net assets(c) | |
| Expenses prior to fees waived or expenses reimbursed | | | 0.69 | %(d) | | | 0.73 | % | | | 0.67 | % | | | 0.62 | % | | | 0.61 | % | | | 0.62 | % | |
| Net expenses after fees waived or expenses reimbursed(e) | | | 0.54 | %(d) | | | 0.54 | %(f) | | | 0.55 | %(f) | | | 0.53 | %(f) | | | 0.50 | %(f) | | | 0.50 | %(f) | |
| Net investment income | | | 3.29 | %(d) | | | 3.16 | %(f) | | | 3.36 | %(f) | | | 3.42 | %(f) | | | 3.80 | %(f) | | | 3.76 | %(f) | |
| Supplemental data | |
| Net assets, end of period (in thousands) | | $ | 308,836 | | | $ | 306,166 | | | $ | 264,505 | | | $ | 278,479 | | | $ | 267,576 | | | $ | 288,262 | | |
| Portfolio turnover | | | 0 | % | | | 8 | % | | | 14 | % | | | 12 | % | | | 12 | % | | | 12 | % | |
| Notes to Financial Highlights | |
(a) For the period from April 1, 2012 to April 30, 2012. During the period, the Fund's fiscal year end was changed from March 31 to April 30.
(b) Rounds to less than $0.01.
(c) In addition to the fees and expenses which the Fund bears directly, the Fund indirectly bears a pro rata share of the fees and expenses of the acquired funds in which it invests. Such indirect expenses are not included in the reported expense ratios.
(d) Annualized.
(e) The Investment Manager and certain of its affiliates agreed to waive/reimburse certain fees and expenses, if applicable.
(f) The benefits derived from expense reductions had an impact of less than 0.01%.
The Accompanying Notes to Financial Statements are an integral part of this statement.
22
Notes to Financial Statements – Columbia Virginia Intermediate Municipal Bond Fund
April 30, 2012
Note 1. Organization
Columbia Virginia Intermediate Municipal Bond Fund (the Fund), a series of Columbia Funds Series Trust (the Trust), is a diversified fund. The Trust is registered under the Investment Company Act of 1940, as amended (the 1940 Act), as an open-end management investment company organized as a Delaware statutory trust.
Fiscal Year End Change
During the period, the Fund changed its fiscal year end from March 31 to April 30. Accordingly, this report includes activity for the period April 1, 2012 to April 30, 2012 and the year ended March 31, 2012.
Fund Shares
The Trust may issue an unlimited number of shares (without par value). The Fund offers Class A, Class B, Class C and Class Z shares. All share classes have identical voting, dividend and liquidation rights. Each share class has its own expense structure and sales charges, as applicable.
Class A shares are subject to a maximum front-end sales charge of 3.25% based on the initial investment amount. Class A shares purchased without an initial sales charge in accounts aggregating $1 million to $50 million at the time of purchase are subject to a contingent deferred sales charge (CDSC) if the shares are sold within 18 months of purchase, charged as follows: 1.00% CDSC if redeemed within 12 months of purchase, and 0.50% CDSC if redeemed more than 12, but less than 18, months after purchase.
Class B shares may be subject to a maximum CDSC of 3.00% based upon the holding period after purchase. Class B shares will generally convert to Class A shares eight years after purchase. The Fund no longer accepts investments by new or existing investors in the Fund's Class B shares, except in connection with the reinvestment of any dividend and/or capital gain distributions in Class B shares of the Fund and exchanges by existing Class B shareholders of certain other funds within the Columbia Family of Funds.
Class C shares are subject to a 1.00% CDSC on shares redeemed within one year of purchase.
Class Z shares are not subject to sales charges, and are only available to certain investors, as described in the Fund's prospectus.
Note 2. Summary of Significant Accounting Policies
Use of Estimates
The preparation of financial statements in accordance with U.S. generally accepted accounting principles (GAAP) requires management to make certain estimates and assumptions that affect the reported amounts of assets and liabilities, the disclosure of contingent assets and liabilities at the date of the financial statements and the reported amounts of revenue and expenses during the reporting period. Actual results could differ from those estimates.
The following is a summary of significant accounting policies consistently followed by the Fund in the preparation of its financial statements.
Security Valuation
Debt securities generally are valued by pricing services approved by the Board of Trustees (the Board) based upon market transactions for normal, institutional-size trading units of similar securities. The services may use various pricing techniques which take into account appropriate factors such as yield, quality, coupon rate, maturity, type of issue, trading characteristics and other data, as well as broker quotes. Debt securities for which quotations are readily available may also be valued based upon an over-the-counter or exchange bid quotation.
Investments in other open-end investment companies, including money market funds, are valued at net asset value.
Short-term securities purchased within 60 days to maturity are valued at amortized cost, which approximates market value. The value of short-term securities originally purchased with maturities greater than 60 days is determined based on an amortized value to par upon reaching 60 days to maturity. Short-term securities maturing in more than 60 days from the valuation date are valued at the market price or approximate market value based on current interest rates.
Investments for which market quotations are not readily available, or that have quotations which management believes are not reliable, are valued at fair value as determined in good faith under consistently applied procedures established by and under the general supervision of the Board. If a security or class of securities (such as foreign securities) is valued at fair
23
Columbia Virginia Intermediate Municipal Bond Fund April 30, 2012
value, such value is likely to be different from the last quoted market price for the security. The determination of fair value often requires significant judgment. To determine fair value, management may use assumptions including but not limited to future cash flows and estimated risk premiums. Multiple inputs from various sources may be used to determine value.
Delayed Delivery Securities
The Fund may trade securities on other than normal settlement terms, including securities purchased or sold on "when-issued" basis. This may increase the risk if the other party to the transaction fails to deliver and causes the Fund to subsequently invest in less advantageous prices. The Fund designates cash or liquid securities in an amount equal to the delayed delivery commitment.
Security Transactions
Security transactions are accounted for on the trade date. Cost is determined and gains (losses) are based upon the specific identification method for both financial statement and federal income tax purposes.
Income Recognition
Interest income is recorded on the accrual basis. Market premium and discount are amortized and accreted, respectively, on all debt securities, unless otherwise noted. Original issue discount is accreted to interest income over the life of the security with a corresponding increase in the cost basis, if any.
Dividend income is recorded on the ex-dividend date.
Expenses
General expenses of the Trust are allocated to the Fund and other funds of the Trust based upon relative net assets or other expense allocation methodologies determined by the nature of the expense. Expenses directly attributable to the Fund are charged to the Fund. Expenses directly attributable to a specific class of shares are charged to that share class.
Determination of Class Net Asset Value
All income, expenses (other than class-specific expenses, which are charged to that share class, as shown in the Statement of Operations) and realized and unrealized gains (losses) are allocated to each class of the Fund on a daily basis for purposes of determining the net asset value of each class. Income and expenses are allocated to each class based on the settled shares method, while realized and unrealized gains (losses) are allocated based on the relative net assets of each class.
Federal Income Tax Status
The Fund intends to qualify each year as a regulated investment company under Subchapter M of the Internal Revenue Code, as amended, and will distribute substantially all of its tax exempt or taxable income (including net short-term capital gains), if any, for its tax year, and as such will not be subject to federal income taxes. In addition, the Fund intends to distribute in each calendar year substantially all of its net investment income, capital gains and certain other amounts, if any, such that the Fund should not be subject to federal excise tax. Therefore, no federal income or excise tax provision is recorded.
Distributions to Shareholders
Distributions from net investment income are declared daily and paid monthly. Net realized capital gains, if any, are distributed at least annually. Income distributions and capital gain distributions are determined in accordance with federal income tax regulations which may differ from GAAP.
Guarantees and Indemnifications
Under the Trust's organizational documents and, in some cases, by contract, its officers and trustees are indemnified against certain liabilities arising out of the performance of their duties to the Trust or its funds. In addition, certain of the Fund's contracts with its service providers contain general indemnification clauses. The Fund's maximum exposure under these arrangements is unknown since the amount of any future claims that may be made against the Fund cannot be determined, and the Fund has no historical basis for predicting the likelihood of any such claims.
Note 3. Fees and Compensation Paid to Affiliates
Investment Management Fees
Under an Investment Management Services Agreement, Columbia Management Investment Advisers, LLC (the Investment Manager), a wholly-owned subsidiary of Ameriprise Financial, Inc. (Ameriprise Financial), determines which securities will be purchased, held or sold. The management fee is an annual fee that is equal to a percentage of the Fund's
24
Columbia Virginia Intermediate Municipal Bond Fund April 30, 2012
average daily net assets that declines from 0.40% to 0.27% as the Fund's net assets increase. For the period April 1, 2012 to April 30, 2012 and the year ended March 31, 2012, the annualized effective management fee rate was 0.40% of the Fund's average daily net assets.
Administration Fees
Under an Administrative Services Agreement, the Investment Manager serves as the Fund Administrator. Effective July 1, 2011, the Fund pays the Fund Administrator an annual fee for administration and accounting services equal to a percentage of the Fund's average daily net assets that declines from 0.07% to 0.04% as the Fund's net assets increase. Prior to July 1, 2011, the administration fee was equal to the annual rate of 0.15% of the Fund's average daily net assets, less the fees that were payable by the Fund as described under the Pricing and Bookkeeping Fees note below. For the period April 1, 2012 to April 30, 2012, the annualized effective administration fee rate was 0.07% of the Fund's average daily net assets. For the year ended March 31, 2012, the effective administration fee rate was 0.09% of the Fund's average daily net assets.
Pricing and Bookkeeping Fees
Prior to May 16, 2011, the Fund had entered into a Financial Reporting Services Agreement (the Financial Reporting Services Agreement) with State Street Bank and Trust Company (State Street) and the Investment Manager pursuant to which State Street provided financial reporting services to the Fund. The Fund also entered into an Accounting Services Agreement (collectively with the Financial Reporting Services Agreement, the State Street Agreements) with State Street and the Investment Manager pursuant to which State Street provided accounting services to the Fund. Under the State Street Agreements, the Fund paid State Street an annual fee of $38,000 paid monthly plus an additional monthly fee based on an annualized percentage rate of average daily net assets of the Fund for the month. The aggregate fee did not exceed $140,000 per year (exclusive of out-of-pocket expenses and charges). The Fund also reimbursed State Street for certain out-of-pocket expenses and charges. Effective May 16, 2011, these services are provided under the Administrative Services Agreement discussed above.
Other Fees
Effective June 1, 2011, other expenses are for, among other things, certain expenses of the Fund or the Board, including: Fund boardroom and office expense, employee compensation, employee health and retirement benefits, and certain other expenses. Payment of these Fund and Board expenses is facilitated by a company providing limited administrative services to the Fund and the Board. For the period April 1, 2012 to April 30, 2012 and the period June 1, 2011 through March 31, 2012, other expenses paid to this company were $175 and $2,292, respectively.
Compensation of Board Members
Board members are compensated for their services to the Fund as disclosed in the Statement of Operations. Under a Deferred Compensation Plan (the Plan), the Board members who are not "interested persons" of the Fund, as defined under the 1940 Act, may elect to defer payment of up to 100% of their compensation. Deferred amounts are treated as though equivalent dollar amounts had been invested in shares of certain funds managed by the Investment Manager. The Fund's liability for these amounts is adjusted for market value changes and remains in the Fund until distributed in accordance with the Plan.
Compensation of Chief Compliance Officer
The Board has appointed a Chief Compliance Officer to the Fund in accordance with federal securities regulations. The Fund's expenses associated with the Chief Compliance Officer are paid directly by the Investment Manager.
Transfer Agent Fees
Under a Transfer and Dividend Disbursing Agent Agreement, Columbia Management Investment Services Corp. (the Transfer Agent), an affiliate of the Investment Manager and a wholly-owned subsidiary of Ameriprise Financial, is responsible for providing transfer agency services to the Fund. The Transfer Agent has contracted with Boston Financial Data Services (BFDS) to serve as sub-transfer agent.
The Transfer Agent receives monthly account-based service fees based on the number of open accounts and is reimbursed by the Fund for the fees and expenses the Transfer Agent pays to financial intermediaries that maintain omnibus accounts
25
Columbia Virginia Intermediate Municipal Bond Fund April 30, 2012
with the Fund that is a percentage of the average aggregate value of the Fund's shares maintained in each such omnibus account (other than omnibus accounts for which American Enterprise Investment Services Inc. is the broker of record or accounts where the beneficial shareholder is a customer of Ameriprise Financial Services, Inc., which are paid a per account fee). The Transfer Agent pays the fees of BFDS for services as sub-transfer agent and is not entitled to reimbursement for such fees from the Fund (with the exception of out-of-pocket fees).
The Transfer Agent also receives compensation from fees for various shareholder services and reimbursements for certain out-of-pocket expenses.
For the period April 1, 2012 to April 30, 2012 and the year ended March 31, 2012, the Fund's annualized effective transfer agent fee rates as a percentage of average daily net assets of each class were as follows:
| | | Period ended
April 30,
2012 | | Year ended
March 31,
2012 | |
| Class A | | | 0.18 | % | | | 0.19 | % | |
| Class B | | | 0.17 | | | | 0.26 | | |
| Class C | | | 0.18 | | | | 0.19 | | |
| Class Z | | | 0.17 | | | | 0.19 | | |
An annual minimum account balance fee of $20 may apply to certain accounts with a value below the Fund's initial minimum investment requirements to reduce the impact of small accounts on transfer agent fees. These minimum account balance fees are recorded as part of expense reductions in the Statement of Operations. For the period April 1, 2012 to April 30, 2012, no minimum account balance fees were charged to accounts. For the year ended March 31, 2012, these minimum account balance fees reduced total expenses by $20.
Distribution and Service Fees
The Fund has an agreement with Columbia Management Investment Distributors, Inc. (the Distributor), an affiliate of the Investment Manager and a wholly-owned subsidiary of Ameriprise Financial, for distribution and shareholder services. Pursuant to Rule 12b-1 under the 1940 Act, the Board has approved, and the Fund has adopted, distribution and shareholder service plans (the Plans) which set the distribution and service fees for the Fund. These fees are calculated daily and are intended to compensate the Distributor and/or eligible selling and/or servicing agents for selling shares of the Fund and providing services to investors.
The Plans require the payment of a monthly combined distribution and service fee to the Distributor at the maximum annual rate of 0.25% of the average daily net assets attributable to Class A shares of the Fund. The Plans also require the payment of a monthly service fee at the maximum annual rate of 0.25% of the average daily net assets attributable to Class B and Class C shares of the Fund and the payment of a monthly distribution fee at the maximum annual rate of 0.75% of the average daily net assets attributable to Class B and Class C shares of the Fund.
Sales Charges
Sales charges, including front-end charges and CDSCs, received by the Distributor for distributing Fund shares were $640 for Class A and $205 for Class B shares for the period April 1, 2012 to April 30, 2012, and $35,555 for Class A and $32 for Class C for the year ended March 31, 2012.
Expenses Waived/Reimbursed by the Investment Manager and its Affiliates
Effective July 1, 2011, the Investment Manager and certain of its affiliates have contractually agreed to waive fees and/or reimburse expenses (excluding certain fees and expenses described below), through July 31, 2012, unless sooner terminated at the sole discretion of the Board, so that the Fund's net operating expenses, after giving effect to fees waived/expenses reimbursed and any balance credits and/or overdraft charges from the Fund's custodian, do not exceed the following annual rates as a percentage of the class' average daily net assets:
| Class A | | | 0.79 | % | |
| Class B | | | 1.54 | | |
| Class C | | | 1.54 | | |
| Class Z | | | 0.54 | | |
26
Columbia Virginia Intermediate Municipal Bond Fund April 30, 2012
Under the agreement, the following fees and expenses are excluded from the waiver/reimbursement commitment, and therefore will be paid by the Fund, if applicable: taxes (including foreign transaction taxes), expenses associated with investments in affiliated and non-affiliated pooled investment vehicles (including mutual funds and exchange traded funds), transaction costs and brokerage commissions, costs related to any securities lending program, dividend expenses associated with securities sold short, inverse floater program fees and expenses, transaction charges and interest on borrowed money, interest, extraordinary expenses and any other expenses the exclusion of which is specifically approved by the Fund's Board. This agreement may be modified or amended only with approval from all parties.
Prior to July 1, 2011, the Investment Manager voluntarily agreed to reimburse a portion of the Fund's expenses (excluding certain expenses, such as distribution and services fees, brokerage commissions, interest, taxes and extraordinary expenses, but including custodian charges relating to overdrafts, if any) so that the Fund's ordinary net operating expenses, after giving effect to fees waived/expenses reimbursed and any balance credits and/or overdraft charges from the Fund's custodian, did not exceed 0.55% of the Fund's average daily net assets on an annualized basis.
Prior to May 1, 2011, the Investment Manager was entitled to recover from the Fund any fees waived and/or expenses reimbursed for a three year period following the date of such fee waiver and/or reimbursement under these arrangements if such recovery did not cause the Fund's expenses to exceed the expense limitations in effect at the time of recovery. Effective May 1, 2011, the Investment Manager has eliminated such fee recoupment provisions.
Note 4. Federal Tax Information
The timing and character of income and capital gain distributions are determined in accordance with income tax regulations, which may differ from GAAP because of temporary or permanent book to tax differences.
For the period April 1, 2012 to April 30, 2012, these differences are primarily due to differing treatment for capital loss carryforwards, Trustees' deferred compensation and distributions. For the year ended March 31, 2012, these differences are primarily due to differing treatment for capital loss carryforwards, Trustees' deferred compensation and distributions. To the extent these differences are permanent, reclassifications are made among the components of the Fund's net assets in the Statement of Assets and Liabilities. Temporary differences do not require reclassifications. In the Statement of Assets and Liabilities no reclassifications were made.
The tax character of distributions paid during the periods indicated was as follows:
| | | Period ended
April 30,
2012 | | Year ended
March 31,
2012 | | Year ended
March 31,
2011 | |
| Ordinary income | | $ | 86,305 | | | $ | 57,001 | | | $ | 13,464 | | |
Tax-exempt
income | | | 938,167 | | | | 10,330,455 | | | | 10,925,921 | | |
Short-term capital gain distributions, if any, are considered ordinary income distributions for tax purposes.
At April 30, 2012 and March 31, 2012, the components of distributable earnings on a tax basis were as follows:
| | | April 30,
2012 | | March 31,
2012 | |
| Undistributed tax-exempt | |
| income | | $ | 1,953,513 | | | $ | 1,853,988 | | |
Undistributed accumulated
long-term gain | | | — | | | | — | | |
| Unrealized appreciation | | | 26,318,117 | | | | 23,271,169 | | |
At April 30, 2012 and March 31, 2012, the cost of investments for federal income tax purposes, and the aggregate unrealized appreciation and depreciation based on that cost was as follows:
| | | April 30,
2012 | | March 31,
2012 | |
| Aggregate unrealized | |
| appreciation | | $ | 27,243,453 | | | $ | 24,731,161 | | |
Aggregate unrealized
depreciation | | | (925,336 | ) | | | (1,459,992 | ) | |
| Net unrealized | |
| appreciation | | | 26,318,117 | | | | 23,271,169 | | |
Cost of investments
for tax purposes | | | 338,487,720 | | | | 341,097,968 | | |
27
Columbia Virginia Intermediate Municipal Bond Fund April 30, 2012
The following capital loss carryforward, determined at April 30, 2012 and March 31, 2012, may be available to reduce taxable income arising from future net realized gains on investments, if any, to the extent permitted by the Internal Revenue Code:
| Year of Expiration | | April 30,
2012
Amount | | March 31,
2012
Amount | |
| 2017 | | $ | 215,943 | | | $ | — | | |
| 2018 | | | — | | | | 215,943 | | |
| Unlimited short-term | | | 20,059 | | | | 20,059 | | |
| Total | | $ | 236,002 | | | $ | 236,002 | | |
On December 22, 2010, the Regulated Investment Company Modernization Act of 2010 (the Act) was enacted, which changed various technical rules governing the tax treatment of regulated investment companies. The changes are generally effective for taxable years beginning after the date of enactment. Under the Act, the Fund will be permitted to carry forward capital losses incurred in taxable years beginning after the date of enactment for an unlimited period. However, any losses incurred during those future taxable years will be required to be utilized prior to the losses incurred in pre-enactment taxable years, which carry an expiration date. As a result of this ordering rule, pre-enactment capital loss carryforwards may be more likely to expire unused.
Management of the Fund has concluded that there are no significant uncertain tax positions that would require recognition in the financial statements. However, management's conclusion may be subject to review and adjustment at a later date based on factors including, but not limited to, new tax laws, regulations, and administrative interpretations (including relevant court decisions). Generally, the Fund's federal tax returns for the prior three fiscal years remain subject to examination by the Internal Revenue Service.
Note 5. Portfolio Information
For the period April 1, 2012 to April 30, 2012, there were no purchases or proceeds from sales of securities.
For the year ended March 31, 2012, the cost of purchases and proceeds from sales of securities, excluding short-term obligations, aggregated to $50,884,418 and $24,114,618, respectively.
Note 6. Lending of Portfolio Securities
Effective May 16, 2011, the Fund has entered into a Master Securities Lending Agreement (the Agreement) with JPMorgan Chase Bank, N.A. (JPMorgan). The Agreement, which replaces the previous securities lending arrangement with State Street, authorizes JPMorgan as lending agent to lend securities to authorized borrowers in order to generate additional income on behalf of the Fund. Pursuant to the Agreement, the securities loaned are secured by cash or U.S. government securities equal to at least 100% of the market value of the loaned securities. Any additional collateral required to maintain those levels due to market fluctuations of the loaned securities is requested to be delivered the following business day. Cash collateral received is invested by the lending agent on behalf of the Fund into authorized investments pursuant to the Agreement. The investments made with the cash collateral are listed in the Portfolio of Investments. The values of such investments and any uninvested cash collateral are disclosed in the Statement of Assets and Liabilities along with the related obligation to return the collateral upon the return of the securities loaned.
Risks of delay in recovery of securities or even loss of rights in the securities may occur should the borrower of the securities fail financially. Risks may also arise to the extent that the value of the securities loaned increases above the value of the collateral received. JPMorgan will indemnify the Fund from losses resulting from a borrower's failure to return a loaned security when due. Such indemnification does not extend to losses associated with declines in the value of cash collateral investments. The Investment Manager is not responsible for any losses incurred by the Fund in connection with the securities lending program. Loans are subject to termination by the Fund or the borrower at any time, and are, therefore, not considered to be illiquid investments.
Pursuant to the Agreement, the Fund receives income for lending its securities either in the form of fees or by earning interest on invested cash collateral, net of negotiated rebates paid to borrowers and fees paid to the lending agent for services provided and any other securities lending expenses. The Fund continues to earn and accrue interest and dividends on the securities loaned.
28
Columbia Virginia Intermediate Municipal Bond Fund April 30, 2012
Prior to May 16, 2011, the Fund participated in a securities lending arrangement with State Street. Each security on loan was collateralized in an amount at least equal to the market value of the securities loaned plus accrued income from the investment of collateral. The income generated by the investment of the collateral, net of any fees remitted to State Street as the lending agent and borrower rebates, was paid to the Fund.
For the period ended April 30, 2012 and the year ended March 31, 2012, the Fund did not participate in securities lending activity.
Note 7. Custody Credits
Prior to May 16, 2011, the Fund had an agreement with its custodian bank under which custody fees may have been reduced by balance credits. These credits are recorded as part of expense reductions on the Statement of Operations. The Fund could have invested a portion of the assets utilized in connection with the expense offset arrangement in an income-producing asset if they had not entered into such an agreement. For the period April 1, 2011 through May 16, 2011, there were no custody credits.
Note 8. Shareholder Concentration
At April 30, 2012 and March 31, 2012, one unaffiliated shareholder account owned 88.7% and 88.9% of the outstanding shares of the Fund, respectively. The Fund has no knowledge about whether any portion of those shares was owned beneficially by such accounts. Subscription and redemption activity by concentrated accounts may have a significant effect on the operations of the Fund.
Note 9. Line of Credit
The Fund has entered into a revolving credit facility with a syndicate of banks led by JPMorgan, whereby the Fund may borrow for the temporary funding of shareholder redemptions or for other temporary or emergency purposes. The credit facility became effective on May 16, 2011, replacing a prior credit facility. The credit facility agreement, as amended, which is a collective agreement between the Fund and certain other funds managed by the Investment Manager, severally and not jointly, permits collective borrowings up to $500 million. Pursuant to a December 13, 2011 amendment to the credit facility agreement, interest is charged to each participating fund based on its borrowings at a rate equal to the higher of (i) the overnight federal funds rate plus 1.00% or (i) the one-month LIBOR rate plus 1.00%. Each borrowing under the credit facility matures no later than 60 days after the date of borrowing. The Fund also pays a commitment fee equal to its pro rata share of the amount of the credit facility at a rate of 0.08% per annum. For the period May 16, 2011 through December 13, 2011, interest was charged to each participating fund based on its borrowings at a rate equal to the sum of the federal funds rate plus (i) 1.25% per annum plus (ii) if one-month LIBOR exceeds the federal funds rate, the amount of such excess. The Fund also paid a commitment fee equal to its pro rata share of the amount of the credit facility at a rate of 0.10% per annum.
Prior to May 16, 2011, the Fund and certain other funds managed by the Investment Manager participated in a $225 million committed, unsecured revolving credit facility provided by State Street. Interest was charged to each fund based on its borrowings at a rate equal to the greater of the (i) federal funds rate plus 1.25% per annum or (ii) the overnight LIBOR rate plus 1.25% per annum. The Fund also paid a commitment fee equal to its pro rata share of the amount of the credit facility at a rate of 0.125% per annum.
The Fund had no borrowings during the period ended Apriil 30, 2012 and the year ended March 31, 2012.
Note 10. Significant Risks
Geographic Concentration Risk
Because state-specific tax-exempt funds invest primarily in the municipal securities issued by the state and political sub-divisions of the state, the Fund will be particularly affected by political and economic conditions and developments in the state in which it invests. The Fund may, therefore, have a greater risk than that of a municipal bond fund which is more geographically diversified. The value of the municipal securities owned by the Fund also may be adversely affected by future changes in federal or state income tax laws.
29
Columbia Virginia Intermediate Municipal Bond Fund April 30, 2012
Note 11. Subsequent Events
Management has evaluated the events and transactions that have occurred through the date the financial statements were issued and noted no items requiring adjustment of the financial statements or additional disclosure.
Note 12. Information Regarding Pending and Settled Legal Proceedings
In December 2005, without admitting or denying the allegations, American Express Financial Corporation (AEFC, which is now known as Ameriprise Financial, Inc. (Ameriprise Financial)) entered into settlement agreements with the Securities and Exchange Commission (SEC) and Minnesota Department of Commerce (MDOC) related to market timing activities. As a result, AEFC was censured and ordered to cease and desist from committing or causing any violations of certain provisions of the Investment Advisers Act of 1940, the Investment Company Act of 1940, and various Minnesota laws. AEFC agreed to pay disgorgement of $10 million and civil money penalties of $7 million. AEFC also agreed to retain an independent distribution consultant to assist in developing a plan for distribution of all disgorgement and civil penalties ordered by the SEC in accordance with various undertakings detailed at www.sec.gov/litigation/admin/ia-2451.pdf. Ameriprise Financial and its affiliates have cooperated with the SEC and the MDOC in these legal proceedings, and have made regular reports to the funds' Boards of Trustees.
Ameriprise Financial and certain of its affiliates have historically been involved in a number of legal, arbitration and regulatory proceedings, including routine litigation, class actions, and governmental actions, concerning matters arising in connection with the conduct of their business activities. Ameriprise Financial believes that the Funds are not currently the subject of, and that neither Ameriprise Financial nor any of its affiliates are the subject of, any pending legal, arbitration or regulatory proceedings that are likely to have a material adverse effect on the Funds or the ability of Ameriprise Financial or its affiliates to perform under their contracts with the Funds. Ameriprise Financial is required to make 10-Q, 10-K and, as necessary, 8-K filings with the Securities and Exchange Commission on legal and regulatory matters that relate to Ameriprise Financial and its affiliates. Copies of these filings may be obtained by accessing the SEC website at www.sec.gov.
There can be no assurance that these matters, or the adverse publicity associated with them, will not result in increased fund redemptions, reduced sale of fund shares or other adverse consequences to the Funds. Further, although we believe proceedings are not likely to have a material adverse effect on the Funds or the ability of Ameriprise Financial or its affiliates to perform under their contracts with the Funds, these proceedings are subject to uncertainties and, as such, we are unable to estimate the possible loss or range of loss that may result. An adverse outcome in one or more of these proceedings could result in adverse judgments, settlements, fines, penalties or other relief that could have a material adverse effect on the consolidated financial condition or results of operations of Ameriprise Financial.
30
Report of Independent Registered Public Accounting Firm
To the Trustees of Columbia Funds Series Trust and the Shareholders of Columbia Virginia Intermediate Municipal Bond Fund
In our opinion, the accompanying statement of assets and liabilities, including the portfolio of investments, and the related statements of operations and of changes in net assets and the financial highlights present fairly, in all material respects, the financial position of Columbia Virginia Intermediate Municipal Bond Fund (the "Fund") (a series of Columbia Funds Series Trust) at April 30, 2012 and at March 31, 2012, the results of its operations, the changes in its net assets and the financial highlights for each of the periods indicated, in conformity with accounting principles generally accepted in the United States of America. These financial statements and financial highlights (hereafter referred to as "financial statements") are the responsibility of the Fund's management. Our responsibility is to express an opinion on these financial statements based on our audits. We conducted our audits of these financial statements in accordance with the standards of the Public Company Accounting Oversight Board (United States). Those standards require that we plan and perform the audit to obtain reasonable assurance about whether the financial statements are free of material misstatement. An audit includes examining, on a test basis, evidence supporting the amounts and disclosures in the financial statements, assessing the accounting principles used and significant estimates made by management, and evaluating the overall financial statement presentation. We believe that our audits, which included confirmation of securities at April 30, 2012 and at March 31, 2012 by correspondence with the custodian, transfer agent and brokers, provide a reasonable basis for our opinion.
PricewaterhouseCoopers LLP
Minneapolis, Minnesota
June 8, 2012
31
Federal Income Tax Information (Unaudited) – Columbia Virginia Intermediate Municipal Bond Fund
For the fiscal period ended April 30, 2012 and the fiscal year ended March 31, 2012, 91.58% and 99.45%, respectively, of the distributions made from net investment income of the Fund qualify as exempt interest dividends for federal income tax purposes. A portion of the income may be subject to federal alternative minimum tax.
The Fund will notify shareholders in January 2013 of amounts for use in preparing 2012 income tax returns.
32
Fund Governance
Shareholders elect the Board that oversees the funds' operations. The Board appoints officers who are responsible for day-to-day business decisions based on policies set by the Board. The following table provides basic biographical information about the funds' Board members, including their principal occupations during the past five years, although specific titles for individuals may have varied over the period. Under current Board policy, members may serve until the next Board meeting after he or she reaches the mandatory retirement age established by the Board, or the fifteenth anniversary of the first Board meeting they attended as a member of the Board.
On September 29, 2009, Ameriprise Financial, the parent company of Columbia Management, entered into an agreement with Bank of America, N.A. ("Bank of America") to acquire a portion of the asset management business of Columbia Management Group, LLC and certain of its affiliated companies (the "Transaction"). Following the Transaction, which became effective on May 1, 2010, various alignment activities have occurred with respect to the Fund Family. In connection with the Transaction, Mr. Edward J. Boudreau, Jr., Mr. William P. Carmichael, Mr. William A. Hawkins, Mr. R. Glenn Hilliard, Mr. John J. Nagorniak, Ms. Minor M. Shaw and Dr. Anthony M. Santomero, who were members prior to the Transaction of the Legacy Columbia Nations funds' Board ("Nations Funds"), which includes Columbia Funds Series Trust, Columbia Funds Variable Insurance Trust I and Columbia Funds Master Investment Trust, LLC., began service on the Board for the Legacy RiverSource funds ("RiverSource Funds") effective June 1, 2011, which resulted in an overall increase from twelve Trustees to sixteen for all mutual funds overseen by the Board.
Independent Board Members
| Name, Address, Age | | Position Held
with Funds
and Length
of Service | | Principal Occupation During Past Five Years | | Number of
Funds in the
Fund Family
Overseen by
Board Member | | Other Present or
Past Directorships/
Trusteeships
(Within Past 5 Years) | |
| Kathleen Blatz | | | | | | | | | |
|
901 S. Marquette Ave.
Minneapolis, MN 55402
Age 57 | | Board member since 1/06 for RiverSource Funds and since 6/11 for Nations Funds | | Attorney; Chief Justice, Minnesota Supreme Court, 1998-2006 | | | 156 | | | None | |
|
| Edward J. Boudreau, Jr. | | | | | | | | | |
|
225 Franklin Street
Mail Drop
BX32 05228
Boston, MA 02110
Age 67 | | Board member since 6/11 for RiverSource Funds and since 1/05 for Nations Funds | | Managing Director, E.J. Boudreau & Associates (consulting) since 2000 | | | 149 | | | Former Trustee, BofA Funds Series Trust (11 funds) | |
|
| Pamela G. Carlton | | | | | | | | | |
|
901 S. Marquette Ave.
Minneapolis, MN 55402
Age 57 | | Board member since 7/07 for RiverSource Funds and since 6/11 for Nations Funds | | President, Springboard-Partners in Cross Cultural Leadership (consulting company) | | | 156 | | | None | |
|
33
Fund Governance (continued)
Independent Board Members (continued)
| Name, Address, Age | | Position Held
with Funds
and Length
of Service | | Principal Occupation During Past Five Years | | Number of
Funds in the
Fund Family
Overseen by
Board Member | | Other Present or
Past Directorships/
Trusteeships
(Within Past 5 Years) | |
| William P. Carmichael | | | | | | | | | |
|
225 Franklin Street
Mail Drop
BX32 05228
Boston, MA 02110
Age 68 | | Board member since 6/11 for RiverSource Funds and since 1999 for Nations Funds | | Retired | | | 149 | | | Director, Cobra Electronics Corporation (electronic equipment manufacturer); The Finish Line (athletic shoes and apparel); McMoRan Exploration Company (oil and gas exploration and development); former Trustee, BofA Funds Series Trust (11 funds); former Director, Spectrum Brands, Inc. (consumer products); former Director, Simmons Company (bedding) | |
|
| Patricia M. Flynn | | | | | | | | | |
|
901 S. Marquette Ave.
Minneapolis, MN 55402
Age 61 | | Board member since 11/04 for RiverSource Funds and since 6/11 for Nations Funds | | Trustee Professor of Economics and Management, Bentley University; former Dean, McCallum Graduate School of Business, Bentley University | | | 156 | | | None | |
|
| William A. Hawkins | | | | | | | | | |
|
225 Franklin Street
Mail Drop
BX32 05228
Boston, MA 02110
Age 69 | | Board member since 6/11 for RiverSource Funds and since 1/05 for Nations Funds | | Managing Director, Overton Partners (financial consulting), since August 2010; President and Chief Executive Officer, California General Bank, N.A., January 2008-August 2010 | | | 149 | | | Trustee, BofA Funds Series Trust (11 funds) | |
|
| R. Glenn Hilliard | | | | | | | | | |
|
225 Franklin Street
Mail Drop
BX32 05228
Boston, MA 02110
Age 69 | | Board member since 6/11 for RiverSource Funds and since 1/05 for Nations Funds | | Chairman and Chief Executive Officer, Hilliard Group LLC (investing and consulting), since April 2003; Non-Executive Director & Chairman, CNO Financial Group, Inc. (formerly Conseco, Inc.) (insurance), September 2003-May 2011 | | | 149 | | | Chairman, BofA Fund Series Trust (11 funds); former Director, CNO Financial Group, Inc. (insurance) | |
|
34
Fund Governance (continued)
Independent Board Members (continued)
| Name, Address, Age | | Position Held
with Funds
and Length
of Service | | Principal Occupation During Past Five Years | | Number of
Funds in the
Fund Family
Overseen by
Board Member | | Other Present or
Past Directorships/
Trusteeships
(Within Past 5 Years) | |
| Stephen R. Lewis, Jr. | | | | | | | | | |
|
901 S. Marquette Ave.
Minneapolis, MN 55402
Age 73 | | Chair of the Board for RiverSource Funds since 1/07, Board member for RiverSource Funds since 1/02 and since 6/11 for Nations Funds | | President Emeritus and Professor of Economics Emeritus, Carleton College | | | 156 | | | Director, Valmont Industries, Inc. (manufactures irrigation systems) | |
|
| John F. Maher | | | | | | | | | |
|
901 S. Marquette Ave.
Minneapolis, MN 55402
Age 69 | | Board member since 12/06 for Legacy Seligman funds, since 12/08 for RiverSource Funds and since 6/11 for Nations Funds | | Retired President and Chief Executive Officer and former Director, Great Western Financial Corporation (financial services), 1986-1997 | | | 156 | | | None | |
|
| John J. Nagorniak | | | | | | | | | |
|
225 Franklin Street
Mail Drop
BX32 05228
Boston, MA 02110
Age 67 | | Board member since 6/11 for RiverSource Funds and since 1/08 for Nations Funds | | Retired; President and Director, Foxstone Financial, Inc. (consulting), 2000-2007; Director, Mellon Financial Corporation affiliates (investing), 2000-2007; Chairman, Franklin Portfolio Associates (investing—Mellon affiliate), 1982-2007 | | | 149 | | | Trustee, Research Foundation of CFA Institute; Director, MIT Investment Company; Trustee, MIT 401k Plan; former Trustee, BofA Funds Series Trust (11 funds) | |
|
| Catherine James Paglia | | | | | | | | | |
|
901 S. Marquette Ave.
Minneapolis, MN 55402
Age 59 | | Board member since 11/04 for RiverSource Funds and since 6/11 for Nations Funds | | Director, Enterprise Asset Management, Inc. (private real estate and asset management company) | | | 156 | | | None | |
|
35
Fund Governance (continued)
Independent Board Members (continued)
| Name, Address, Age | | Position Held
with Funds
and Length
of Service | | Principal Occupation During Past Five Years | | Number of
Funds in the
Fund Family
Overseen by
Board Member | | Other Present or
Past Directorships/
Trusteeships
(Within Past 5 Years) | |
| Leroy C. Richie | | | | | | | | | |
|
901 S. Marquette Ave.
Minneapolis, MN 55402
Age 70 | | Board member since 2000 for Legacy Seligman funds, since 11/08 for RiverSource Funds and since 6/11 for Nations Funds | | Counsel, Lewis & Munday, P.C. since 2004; former Vice President and General Counsel, Automotive Legal Affairs, Chrysler Corporation | | | 156 | | | Director, Digital Ally, Inc. (digital imaging); Director, Infinity, Inc. (oil and gas exploration and production); Director, OGE Energy Corp. (energy and energy services) | |
|
| Minor M. Shaw | | | | | | | | | |
|
225 Franklin Street
Mail Drop
BX32 05228
Boston, MA 02110
Age 64 | | Board member since 6/11 for RiverSource Funds and since 2003 for Nations Funds | | President—Micco LLC (private investments) | | | 149 | | | Former Trustee, BofA Funds Series Trust (11 funds); Board Member, Piedmont Natural Gas; Director, Blue Cross Blue Shield of South Carolina | |
|
| Alison Taunton-Rigby | | | | | | | | | |
|
901 S. Marquette Ave.
Minneapolis, MN 55402
Age 68 | | Board member since 11/02 for RiverSource Funds and since 6/11 for Nations Funds | | Chief Executive Officer and Director, RiboNovix, Inc. 2003-2010 (biotechnology); former President, Aquila Biopharmaceuticals | | | 156 | | | Director, Healthways, Inc. (health management programs); Director, ICI Mutual Insurance Company, RRG; Director, Abt Associates (government contractor) | |
|
36
Fund Governance (continued)
Interested Board Member Not Affiliated with Investment Manager*
| Name, Address, Age | | Position Held
with Funds
and Length
of Service | | Principal Occupation During Past Five Years | | Number of
Funds in the
Fund Family
Overseen by
Board Member | | Other Present or
Past Directorships/
Trusteeships
(Within Past 5 Years) | |
| Anthony M. Santomero* | | | | | | | | | |
|
225 Franklin Street
Mail Drop
BX32 05228
Boston, MA 02110
Age 65 | | Board member since 6/11 for RiverSource Funds and since 1/08 for Nations Funds | | Richard K. Mellon Professor Emeritus of Finance, The Wharton School, University of Pennsylvania, since 2002; Senior Advisor, McKinsey & Company (consulting), 2006-2008; President and Chief Executive Officer, Federal Reserve Bank of Philadelphia, 2000-2006 | | | 149 | | | Director, Renaissance Reinsurance Ltd.; Trustee, Penn Mutual Life Insurance Company; Director, Citigroup; Director, Citibank, N.A.; former Trustee, BofA Funds Series Trust (11 funds) | |
|
* Dr. Santomero is not an affiliated person of the Investment Manager or Ameriprise Financial. However, he is currently deemed by the funds to be an "interested person" (as defined in the 1940 Act) of the Funds because he serves as a Director of Citigroup, Inc. and Citibank N.A., companies that may directly or through subsidiaries and affiliates engage from time-to-time in brokerage execution, principal transactions and lending relationships with the funds or accounts advised/managed by the Investment Manager.
Interested Board Member Affiliated with Investment Manager*
| William F. Truscott | | | | | | | | | |
|
53600 Ameriprise Financial Center
Minneapolis, MN 55474
Age 51 | | Board member since 11/01 for RiverSource Funds and since 6/11 for Nations Funds; Senior Vice President since 2002 for RiverSource Funds and 5/10 for Nations Funds | | Chairman of the Board and President, Columbia Management Investment Advisers, LLC since May 2010 and February 2012, respectively (previously President, Chairman of the Board and Chief Investment Officer, 2001-April 2010); Chief Executive Officer, U.S. Asset Management & President, Annuities, Ameriprise Financial, Inc. since May 2010 (previously President—U.S. Asset Management and Chief Investment Officer, 2005-April 2010); Director, President and Chief Executive Officer, Ameriprise Certificate Company since 2006; Director and Chief Executive Officer, Columbia Management Investment Distributors, Inc. since May 2010 and February 2012, respectively (previously Chairman of the Board and Chief Executive Officer, 2006-April 2010); Chairman of the Board and Chief Executive Officer, RiverSource Distributors, Inc. since 2006. | | | 156 | | | Trustee, Columbia Funds Series Trust I and Columbia Funds Variable Insurance Trust | |
|
* Interested person (as defined under the 1940 Act) by reason of being an officer, director, security holder and/or employee of the Investment Manager or Ameriprise Financial.
The SAI has additional information about the Fund's Board members and is available, without charge, upon request by calling 800.345.6611; contacting your financial intermediary; or visiting columbiamanagement.com.
37
Fund Governance (continued)
Officers
| Name, Year of Birth and Address | | Principal Occupation(s) During the Past Five Years | |
| J. Kevin Connaughton (Born 1964) | |
|
225 Franklin Street
Boston, MA 02110
President (since 2009) | | Senior Vice President and General Manager—Mutual Fund Products, Columbia Management Investment Advisers, LLC since May 2010; President, Columbia Funds, since 2009, and RiverSource Funds, since May 2010 (previously Senior Vice President and Chief Financial Officer, Columbia Funds, from June 2008 to January 2009, Treasurer, Columbia Funds, from October 2003 to May 2008, and senior officer of various other affiliated funds since 2000); Managing Director, Columbia Management Advisors, LLC from December 2004 to April 2010. | |
|
| Michael G. Clarke (Born 1969) | |
|
225 Franklin Street
Boston, MA 02110
Treasurer (since 2011) and Chief Financial Officer (since 2009) | | Vice President, Columbia Management Investment Advisers, LLC since May 2010; Managing Director of Fund Administration, Columbia Management Advisors, LLC, from September 2004 to April 2010; senior officer of Columbia Funds and affiliated funds since 2002. | |
|
| Scott R. Plummer (Born 1959) | |
|
5228 Ameriprise Financial Center
Minneapolis, MN 55474
Senior Vice President and Chief Legal Officer (since 2010) | | Chief Legal Officer and Assistant Secretary, Columbia Management Investment Advisers, LLC since June 2005; Vice President and Lead Chief Counsel—Asset Management, Ameriprise Financial, Inc. since May 2010 (previously Vice President and Chief Counsel—Asset Management, from 2005 to April 2010, Vice President, Chief Counsel and Assistant Secretary, Columbia Management Investment Distributors, Inc. since 2008; Vice President, General Counsel and Secretary, Ameriprise Certificate Company since 2005; Chief Counsel, RiverSource Distributors, Inc. since 2006; Senior officer of Columbia Funds and affiliated funds, since 2006. | |
|
| Thomas P. McGuire (Born 1972) | |
|
225 Franklin Street
Boston, MA 02110
Chief Compliance Officer (since 2012) | | Vice President—Asset Management Compliance, Columbia Management Investment Advisers, LLC since March 2010; Chief Compliance Officer, Ameriprise Certificate Company, since September 2010; Compliance Executive, Bank of America, from June 2005 to April 2010. | |
|
| William F. Truscott (Born 1960) | |
|
53600 Ameriprise Financial Center
Minneapolis, MN 55474
Senior Vice President (since 2010) | | Chairman of the Board and President, Columbia Management Investment Advisers, LLC since May 2010 and February 2012, respectively (previously President, Chairman of the Board and Chief Investment Officer, from 2001 to April 2010); Chief Executive Officer, U.S. Asset Management & President, Annuities, Ameriprise Financial, Inc. since May 2010 (previously President—U.S. Asset Management and Chief Investment Officer from 2005 to April 2010; Director, President and Chief Executive Officer, Ameriprise Certificate Company since 2006; Director and Chief Executive Officer, Columbia Management Investment Distributors, Inc. since May 2010 and February 2012, respectively (previously Chairman of the Board and Chief Executive Officer from 2008 to April 2010); Chairman of the Board and Chief Executive Officer, RiverSource Distributors, Inc. since 2006. | |
|
| Paul D. Pearson (Born 1956) | |
|
10468 Ameriprise Financial Center
Minneapolis, MN 55474
Vice President and Assistant Treasurer
(since 2011) | | Vice President—Investment Accounting, Columbia Management Investment Advisers, LLC, since May 2010; Vice President—Managed Assets, Investment Accounting, Ameriprise Financial Corporation, 1998-2010 | |
|
38
Fund Governance (continued)
Officers (continued)
| Name, Year of Birth and Address | | Principal Occupation(s) During the Past Five Years | |
| Colin Moore (Born 1958) | |
|
225 Franklin Street
Boston, MA 02110
Senior Vice President (since 2010) | | Director and Chief Investment Officer, Columbia Management Investment Advisers, LLC since May 2010; Manager, Managing Director and Chief Investment Officer of Columbia Management Advisors, LLC from 2007 to April 2010; Head of Equities, Columbia Management Advisors, LLC from 2002 to 2007. | |
|
| Christopher O. Petersen (Born 1970) | |
|
5228 Ameriprise Financial Center
Minneapolis, MN 55474
Vice President and Secretary (since 2011) | | Vice President and Chief Counsel, Ameriprise Financial since January 2010 (formerly Vice President and Group Counsel or Counsel from April 2004 to January 2010); Senior officer of Columbia Funds and affiliated funds, since 2007. | |
|
| Amy K. Johnson (Born 1965) | |
|
5228 Ameriprise Financial Center
Minneapolis, MN 55474
Vice President (since 2010) | | Senior Vice President and Chief Operating Officer, Columbia Management Investment Advisers, LLC since May 2010 (previously Chief Administrative Officer, from 2009 until April 2010, Vice President—Asset Management and Trust Company Services, from 2006 to 2009, and Vice President—Operations and Compliance from 2004 to 2006). | |
|
| Joseph F. DiMaria (Born 1968) | |
|
225 Franklin Street
Boston, MA 02110
Vice President (since 2011) and Chief Accounting Officer (since 2008) | | Vice President, Mutual Fund Administration, Columbia Management Investment Advisers, LLC, since May 2010; Director of Fund Administration, Columbia Management Advisors, LLC from January 2006 to April 2010. | |
|
| Paul B. Goucher (Born 1968) | |
|
100 Park Avenue
New York, NY 10017
Vice President and Assistant Secretary (since 2010) | | Vice President and Chief Counsel of Ameriprise Financial since January 2010 (formerly Vice President and Group Counsel from November 2008 to January 2010); Director, Managing Director and General Counsel of J. & W. Seligman & Co. Incorporated (Seligman) from July 2008 to November 2008 and Managing Director and Associate General Counsel of Seligman from January 2005 to July 2008. | |
|
| Michael E. DeFao (Born 1968) | |
|
225 Franklin Street
Boston, MA 02110
Vice President and Assistant Treasurer (since 2011) | | Vice President and Chief Counsel, Ameriprise Financial since May 2010; Associate General Counsel, Bank of America from June 2005 to April 2010. | |
|
| Stephen T. Welsh (Born 1957) | |
|
225 Franklin Street
Boston, MA 02110
Vice President (since 2006) | | President and Director, Columbia Management Investment Services Corp. since May 2010; President and Director, Columbia Management Services, Inc. from July 2004 to April 2010; Managing Director, Columbia Management Distributors, Inc. from August 2007 to April 2010. | |
|
39
Approval of Investment Management Services Agreement
Columbia Management Investment Advisers, LLC ("Columbia Management" or the "investment manager"), a wholly-owned subsidiary of Ameriprise Financial, Inc. ("Ameriprise Financial"), serves as the investment manager to Columbia Virginia Intermediate Municipal Bond Fund (the "Fund"). Under an investment management services agreement (the "IMS Agreement"), Columbia Management provides investment advice and other services to the Fund and all funds distributed by Columbia Management Investment Distributors, Inc. (collectively, the "Funds").
On an annual basis, the Fund's Board of Trustees (the "Board"), including the independent Board members (the "Independent Directors"), considers renewal of the IMS Agreement. Columbia Management prepared detailed reports for the Board and its Contracts Committee in March and April 2012, including reports based on analyses of data provided by an independent organization and a comprehensive response to each item of information requested by independent legal counsel to the Independent Directors ("Independent Legal Counsel") in a letter to the investment manager, to assist the Board in making this determination. All of the materials presented in March and April were first supplied in draft form to designated representatives of the Independent Directors, i.e., Independent Legal Counsel, the Chair and the Chair of the Contracts Committee (including materials relating to the Fund's expense cap), and the final materials were revised to reflect comments provided by these Board representatives. In addition, throughout the year, the Board (or its committees) regularly meets with portfolio management teams and senior management personnel, and reviews information prepared by Columbia Management addressing the services Columbia Management provides and Fund performance. The Board accords particular weight to the work, deliberations and conclusions of the Contracts Committee, the Investment Review Committee and the Compliance Committee in determining whether to continue the IMS Agreement.
The Board, at its April 10-12, 2012 in-person Board meeting (the "April Meeting"), considered the renewal of the IMS Agreement for an additional one-year term. At the April Meeting, Independent Legal Counsel reviewed with the Independent Directors various factors relevant to the Board's consideration of advisory agreements and the Board's legal responsibilities related to such consideration. Following an analysis and discussion of the factors identified below, the Board, including all of the Independent Directors, approved the renewal of the IMS Agreement.
Nature, Extent and Quality of Services Provided by Columbia Management: The Independent Directors analyzed various reports and presentations they had received detailing the services performed by Columbia Management, as well as its expertise, resources and capabilities. The Independent Directors specifically considered many developments during the past year concerning the services provided by Columbia Management, including, in particular, the continued investment in, and resources dedicated to, the Funds' operations and the successful completion of various integration initiatives and the consolidation of dozens of Funds. The Independent Directors noted the information they received concerning Columbia Management's ability to retain key portfolio management personnel. In that connection, the Independent Directors took into account their meetings with Columbia Management's Chief Investment Officer (the "CIO") and considered the CIO's successful execution of additional risk and portfolio management oversight applied to the Funds. The Independent Directors also assessed Columbia Management's significant investment in upgrading technology (such as an equity trading system) and considered management's commitments to enhance existing resources in this area.
In connection with the Board's evaluation of the overall package of services provided by Columbia Management, the Board also considered the quality of administrative services provided to the Fund by Columbia Management. In addition, the Board also reviewed the financial condition of Columbia Management (and its affiliates) and each entity's ability to carry out its responsibilities under the IMS Agreement and the Fund's other services agreements with Ameriprise affiliates. The Board also discussed the acceptability of the terms of the IMS Agreement (including the relatively broad scope of services required to be performed by Columbia Management). The Board concluded that the services being performed under the IMS Agreement were of a reasonably high quality.
Based on the foregoing, and based on other information received (both oral and written, including the information on investment performance referenced below) and other considerations, the Board concluded that Columbia Management and its affiliates were in a position to continue to provide a high quality and level of services to the Fund.
40
Approval of Investment Management Services Agreement (continued)
Investment Performance: For purposes of evaluating the nature, extent and quality of services provided under the IMS Agreement, the Board carefully reviewed the investment performance of the Fund. In this regard, the Board considered detailed reports providing the results of analyses performed by an independent organization showing, for various periods, the performance of the Fund, the performance of a benchmark index, the percentage ranking of the Fund among its comparison group and the net assets of the Fund. The Board observed that the Fund's investment performance was appropriate in light of the particular management style.
Comparative Fees, Costs of Services Provided and the Profits Realized By Columbia Management and its Affiliates from their Relationships with the Fund: The Board reviewed comparative fees and the costs of services to be provided under the IMS Agreement. The Board members considered detailed comparative information set forth in an annual report on fees and expenses, including, among other things, data (based on analyses conducted by an independent organization) showing a comparison of the Fund's expenses with median expenses paid by funds in its comparative peer universe, as well as data showing the Fund's contribution to Columbia Management's profitability. The Board reviewed the fees charged to comparable institutional or other accounts/vehicles managed by Columbia Management and discussed differences in how the products are managed and operated, noting no unreasonable differences in the levels of contractual fees.
The Board accorded particular weight to the notion that the level of fees should reflect a rational pricing model applied consistently across the various product lines in the Fund family, while assuring that the overall fees for each Fund (with few defined exceptions) are generally in line with the "pricing philosophy" (i.e., that the total expense ratio of the Fund is at, or below, the median expense ratio of funds in the same comparison universe of the Fund). The Board took into account that the Fund's total expense ratio (after considering proposed expense caps/waivers) approximated the peer universe's median expense ratio. Based on its review, the Board concluded that the Fund's management fee was fair and reasonable in light of the extent and quality of services that the Fund receives.
The Board also considered the expected profitability of Columbia Management and its affiliates in connection with Columbia Management providing investment management services to the Fund. In this regard, the Board referred to a detailed profitability report, discussing the profitability to Columbia Management and Ameriprise Financial from managing, operating and distributing the Funds. In this regard, the Board observed that 2011 profitability, while slightly lower than 2010, was generally in line with the reported profitability of other asset management firms. The Board also considered the indirect economic benefits flowing to Columbia Management or its affiliates in connection with managing or distributing the Funds, such as the enhanced ability to offer various other financial products to Ameriprise Financial customers, soft dollar benefits and overall reputational advantages. The Board noted that the fees paid by the Fund should permit the investment manager to offer competitive compensation to its personnel, make necessary investments in its business and earn an appropriate profit. The Board concluded that profitability levels were reasonable.
Economies of Scale to be Realized: The Board also considered the economies of scale that might be realized by Columbia Management as the Fund grows and took note of the extent to which Fund shareholders might also benefit from such growth.
Based on the foregoing, the Board, including all of the Independent Directors, concluded that the investment management service fees were fair and reasonable in light of the extent and quality of services provided. In reaching this conclusion, no single factor was determinative. On April 12, 2012, the Board, including all of the Independent Directors, approved the renewal of the IMS Agreement.
41
This page intentionally left blank.
42
This page intentionally left blank.
43
This page intentionally left blank.
44
Important Information About This Report
The fund mails one shareholder report to each shareholder address. If you would like more than one report, please call shareholder services at 1-800-345-6611 and additional reports will be sent to you. This report has been prepared for shareholders of Columbia Virginia Intermediate Municipal Bond Fund.
A description of the policies and procedures that the fund uses to determine how to vote proxies and a copy of the fund's voting records are available (i) at www.columbiamanagement.com, (ii) on the Securities and Exchange Commission's website at www.sec.gov, and (iii) without charge, upon request, by calling 1-800-368-0346. Information regarding how the fund voted proxies relating to portfolio securities during the 12-month period ended June 30 is available from the SEC's website. Information regarding how the fund voted proxies relating to portfolio securities is also available from the fund's website, www.columbiamanagement.com.
The fund files a complete schedule of portfolio holdings with the SEC for the first and third quarters of each fiscal year on Form N-Q. The fund's Form N-Q is available on the SEC's website at www.sec.gov and may be reviewed and copied at the SEC's Public Reference Room in Washington, D.C. Information on the operation of the Public Reference Room may be obtained by calling 1-800-SEC-0330.
Transfer Agent
Columbia Management Investment
Services Corp.
P.O. Box 8081
Boston, MA 02266-8081
1-800-345-6611
Distributor
Columbia Management Investment
Distributors, Inc.
225 Franklin Street
Boston, MA 02110
Investment Manager
Columbia Management Investment Advisers, LLC
225 Franklin Street
Boston, MA 02110
45

Columbia Virginia Intermediate Municipal Bond Fund
P. O. Box 8081
Boston, MA 02266-8081
columbiamanagement.com
This information is for use with concurrent or prior delivery of a fund prospectus. Investors should consider the investment objectives, risks, charges and expenses of a mutual fund carefully before investing. For a free prospectus, which contains this and other important information about the funds, visit columbiamanagement.com. Read the prospectus carefully before investing. The Fund is distributed by Columbia Management Investment Distributors, Inc., member FINRA, and managed by Columbia Management Investment Advisers, LLC.
© 2012 Columbia Management Investment Advisers, LLC. All rights reserved.
C-1106 C (5/12)

Fixed Income Sector Portfolios
Annual Report for the Period Ended April 30, 2012
> Corporate Bond Portfolio
> Mortgage- and Asset-Backed Portfolio
Not FDIC insured • No bank guarantee • May lose value
Table of Contents
| Corporate Bond Portfolio | | | 1 | | |
|
| Mortgage- and Asset-Backed Portfolio | | | 6 | | |
|
| Portfolio of Investments | | | 11 | | |
|
Statement of Assets and
Liabilities | | | 24 | | |
|
| Statement of Operations | | | 26 | | |
|
Statement of Changes in
Net Assets | | | 28 | | |
|
| Financial Highlights | | | 30 | | |
|
| Notes to Financial Statements | | | 32 | | |
|
Report of Independent Registered
Public Accounting Firm | | | 45 | | |
|
| Fund Governance | | | 46 | | |
|
| Approval of Investment Management Services Agreement | | | 53 | | |
|
Important Information About
This Report | | | 57 | | |
|
The views expressed in this report reflect the current views of the respective parties. These views are not guarantees of future performance and involve certain risks, uncertainties and assumptions that are difficult to predict, so actual outcomes and results may differ significantly from the views expressed. These views are subject to change at any time based upon economic, market or other conditions and the respective parties disclaim any responsibility to update such views. These views may not be relied on as investment advice and, because investment decisions for a Columbia Fund are based on numerous factors, may not be relied on as an indication of trading intent on behalf of any particular Columbia Fund. References to specific securities should not be construed as a recommendation or investment advice.
President's Message

Dear Shareholders,
A stock market rally that commenced in the fourth quarter of 2011 continued into 2012 in the United States and around the world, as all major market regions generated double-digit returns for the three-month period ended March 31, 2012. Volatility declined sharply as European debt fears quieted somewhat and sentiment improved. Returns in developed countries were buoyed by strong results in Germany, Belgium, Austria and the Nordic markets of Denmark, Finland, Norway and Sweden. Under the cloud of its own mounting debt problem, Spain was the only eurozone country to deliver a negative return during the three-month period. Solid economic growth and accommodative monetary policy helped boost gains in emerging markets. The rally in U.S. equities was largely driven by an expansion in "multiples"—an increase in stock prices relative to their earnings. By the end of the first quarter of 2012, stocks no longer appeared as cheap as they were late in 2011. Bonds lagged stocks during the first quarter as investors responded to signs of an improved environment with a greater appetite for risk.
Concerns around the health of the global economy were centered in news headlines focusing on Washington D.C., Europe, China and the Middle East. In the United States, economic indicators remained mixed but generally indicated support for slow, sustainable economic growth. European policymakers have made progress in containing the eurozone debt crisis, though they still have not solved the issue of long-term solvency. The European Central Bank has lowered interest rates and flooded the financial system with liquidity that may provide breathing space for companies to restructure their balance sheets. These massive infusions of liquidity may whet the appetite for risk from investors around the world. However, it has delayed a true reckoning with the European financial situation, as concerns about Spain and Portugal continue to cloud the outlook. These structural challenges that persist in the developed world, and slowing growth in emerging market economies, leave the global economy in a fragile state. Domestic demand, combined with slowing inflationary trends, has also helped to shore up emerging market economies. Joblessness remains low and monetary conditions remain easy.
Despite the challenges and surprises of 2011, we see pockets of strength—and as a result, attractive opportunities—both here and abroad for 2012. We hope to help you capitalize on these opportunities with various articles in our 2012 Perspectives, which is available via the Market Insights tab at columbiamanagement.com. This publication showcases the strong research capabilities and experienced investment teams of Columbia Management and offers a diverse array of investment ideas based on our five key themes for 2012.
Other information and resources available at columbiamanagement.com include:
g detailed up-to-date fund performance and portfolio information
g economic analysis and market commentary
g quarterly fund commentaries
g Columbia Management Investor, our award-winning quarterly newsletter for shareholders
Thank you for your continued support of the Columbia Funds. We look forward to serving your investment needs for many years to come.
Best Regards,

J. Kevin Connaughton
President, Columbia Funds
Investors should consider the investment objectives, risks, charges and expenses of a mutual fund carefully before investing. For a free prospectus, which contains this and other important information about the funds, visit columbiamanagement.com. The prospectus should be read carefully before investing.
Columbia Funds are distributed by Columbia Management Investment Distributors, Inc., member FINRA, and managed by Columbia Management Investment Advisers, LLC.
© 2012 Columbia Management Investment Advisers, LLC. All rights reserved.
Fund Profile – Corporate Bond Portfolio
Summary
g For the 13-month period that ended April 30, 2012, the portfolio returned 11.35%.
g The portfolio outperformed its benchmark, the Barclays U.S. Credit Bond Index.1
g Efforts to reduce risk helped the portfolio exceed the double-digit gain of the benchmark.
Portfolio Management
Carl Pappo has managed the portfolio since November 2006. From 1993 until joining Columbia Management Investment Advisers, LLC (the Investment Manager) in May 2010, Mr. Pappo was associated with the portfolio's previous investment adviser as an investment professional.
1The Barclays U.S. Credit Bond Index consists of publicly issued investment grade corporate securities and dollar-denominated SEC registered global debentures.
Indices are not available for investment, are not professionally managed and do not reflect sales charges, fees, brokerage commissions, taxes or other expenses of investing. Securities in the portfolio may not match those in an index.
Performance data quoted represents past performance and current performance may be lower or higher. Past performance is no guarantee of future results. The investment return and principal value will fluctuate so that shares, when redeemed, may be worth more or less than the original cost. Please visit www.columbiamanagement.com for daily and most recent month-end performance updates.
Summary
13-month (cumulative) return as of 04/30/12
| | +11.35% | |
|
 | | Portfolio | |
|
| | +11.05% | |
|
 | | Barclays U.S Credit Bond Index | |
|
1
Performance Information – Corporate Bond Portfolio
Performance data quoted represents past performance and current performance may be lower or higher. Past performance is no guarantee of future results. The investment return and principal value will fluctuate so that shares, when redeemed, may be worth more or less than the original cost. Please visit www.columbiamanagement.com for daily and most recent month-end performance updates.
Performance of a $10,000 investment 08/30/02 – 04/30/12
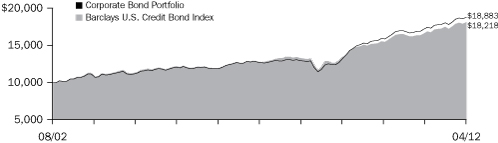
The chart above shows the change in value of a hypothetical $10,000 investment in Class A shares of Corporate Bond Portfolio during the stated time period, and does not reflect the deduction of taxes that a shareholder may pay on portfolio distributions or on the redemption of portfolio shares.
Average annual total return as of 04/30/12 (%)
| Inception | | 08/30/02 | |
| 1-month (cumulative) | | | 1.13 | | |
| 1-year | | | 9.31 | | |
| 5-year | | | 7.91 | | |
| Life | | | 6.80 | | |
The Investment Manager bears all fees and expenses of the portfolio other than taxes, brokerage fees and commissions, costs of borrowing money and extraordinary expenses. Participants in wrap fee programs eligible to invest in the portfolio, however, pay an asset-based fee, which is negotiable, for investment services, brokerage services and investment consultation. The portfolio may incur significant costs that are in addition to the wrap fees paid to the program sponsor that are not included in this table. All results shown assume reinvestment of distributions.
The tables do not reflect the deduction of taxes that a shareholder may pay on portfolio distributions or on the redemption of portfolio shares.
2
Understanding Your Expenses – Corporate Bond Portfolio
The information on this page is intended to help you understand your ongoing costs of investing in the Portfolio.
The table below reflects the fact that no fees or expenses are charged to the Portfolio. Participants in the wrap fee programs eligible to invest in the Portfolio pay an asset-based fee, which is negotiable, for investment services, brokerage services and investment consultation. Please read the wrap program documents for information regarding fees charged.
The information in the following table is based on an initial investment of $1,000, which is invested at the beginning of the period and held for the entire period. The amount listed in the "Actual" column is calculated using the Portfolio's actual total return for the period. The amount listed in the "Hypothetical" column is calculated using a hypothetical annual return of 5%. You should not use the hypothetical account value to estimate your actual account balance.
Account value at the
beginning of the period ($)
11/01/11 | | Account value at the
end of the period ($)
04/30/12 | | Expenses paid
during the period ($)* | |
| Actual | | Hypothetical | | Actual | | Hypothetical | | Actual | | Hypothetical | |
| | 1,000.00 | | | | 1,000.00 | | | | 1,041.20 | | | | 1,024.86 | | | | — | | | | — | | |
* Columbia Management Investment Advisers, LLC bears all fees and expenses of the Portfolio other than taxes, brokerage fees and commissions, costs of borrowing money and extraordinary expenses. Participants in wrap fee programs pay an asset-based fee that is not included in this table.
Expenses do not include fees and expenses incurred indirectly by the Portfolio from the underlying funds in which the Portfolio may invest (also referred to as "acquired funds"), including affiliated and non-affiliated pooled investments vehicles (including mutual funds and exchange traded funds).
3
Portfolio Manager's Report – Corporate Bond Portfolio
Performance data quoted represents past performance and current performance may be lower or higher. Past performance is no guarantee of future results. The investment return and principal value will fluctuate so that shares, when redeemed, may be worth more or less than the original cost. Please visit www.columbiamanagement.com for daily and most recent month-end performance updates.
Portfolio breakdown1
(at 04/30/12) (%)
| Corporate Bonds & Notes | | | 90.9 | | |
| Municipal Bonds | | | 4.4 | | |
| Foreign Government Obligations | | | 2.7 | | |
| Preferred Debt | | | 1.2 | | |
| Other2 | | | 0.6 | | |
| U.S. Treasury Obligations | | | 0.2 | | |
1Percentages indicated are based upon total investments. Portfolio composition is subject to change.
2Includes investments in money market funds.
Top 10 holdings1
(at 04/30/12) (%)
| NBCUniversal Media LLC | | | 2.1 | | |
| General Electric Capital Corp. | | | 2.1 | | |
| KeyCorp | | | 1.8 | | |
| Kroger Co. (The) | | | 1.8 | | |
| McDonald's Corp. | | | 1.6 | | |
| Nevada Power Co. | | | 1.5 | | |
| Wells Fargo & Co. | | | 1.4 | | |
| JPMorgan Chase Capital XX | | | 1.4 | | |
| Bank of America Corp. | | | 1.3 | | |
| Prudential Financial, Inc. | | | 1.3 | | |
1Percentages indicated are based upon total investments (excluding money market funds).
For further detail about these holdings, please refer to the section entitled "Portfolio of Investments."
Portfolio holdings are as of the date given, are subject to change at any time, and are not recommendations to buy or sell any security.
The Board of Trustees for Corporate Bond Portfolio has approved the change of the portfolio's fiscal year end from March 31 to April 30. As a result, this report covers the 13-month period since the last annual report. The next report you receive will be for the six-month period from May 1, 2012 through October 31, 2012.
For the 13-month period that ended April 30, 2012, the portfolio returned 11.35%, compared with 11.05% for its benchmark, the Barclays U.S. Credit Bond Index. An emphasis on higher quality securities during what became a risk-averse investment environment enabled the portfolio to outperform its benchmark.
A shifting economic and market environment
The period was characterized by economic frustrations, both at home and abroad. Early in the period, Europe's debt problems and wrangling in Washington over the federal budget and the national debt dominated world headlines. U.S. economic news was lackluster and job growth was disappointing. However, the pace of both economic and job growth picked up as the period wore on. Consumer confidence improved as the labor market added approximately 1.2 million new jobs between November 2011 and April 2012, while the jobless rate fell to 8.1%. Household net worth also picked up as the equity markets rebounded. Headline inflation rose 2.7%, driven primarily by rising food and energy prices. Despite a modest slowdown in manufacturing activity late in the summer of 2011, manufacturing activity continued to expand throughout the period.
Investors grew risk averse in face of uncertainty
Corporate bonds took their cues from economies and markets, domestic and foreign. By the late summer of 2011 it was apparent that risk avoidance was the investment strategy of choice, given the magnitude of economic uncertainty. In that context, total returns from corporate bonds were surprisingly high for the period. Although interest rates were at or near historical lows in many segments of the fixed-income markets when the period began, the subsequent decline in long-term rates was significant. The capital gains available from some high quality, long-term bonds were sufficient to propel the portfolio's return into double digits.
Higher quality outperformed
Higher quality fixed-income securities generally outperformed lower quality issues over the 13-month period. The portfolio capitalized on this trend in several ways. Within the financial sector, which underperformed the broader market, the portfolio gained ground against the benchmark because its holdings were concentrated in higher quality financials, a strategy that reduced exposure to problem areas such as European banks. Similarly, the portfolio's holdings in the utilities sector were concentrated in high quality first mortgage bonds that aided to relative performance. By contrast, the portfolio's underweight relative to the benchmark in non-corporate assets, such as Canadian and Mexican sovereign bonds, hurt relative performance, as these bonds bucked the trend in Europe and moved sharply higher.
4
Portfolio Manager's Report (continued) – Corporate Bond Portfolio
Looking ahead
We expect Europe to continue to cast a long shadow in the months ahead, a reflection of the seriousness of its sovereign crisis as well as the interdependency of the global economy. The political season in the United States adds another meaningful element of uncertainty to the investment equation. In this environment, we believe the portfolio's relatively conservative positioning remains warranted for the time being. We will monitor global events with an eye to increasing the portfolio's risk exposure when we feel it is appropriate.
Portfolio characteristics and holdings are subject to change periodically and may not be representative of current characteristics and holdings. The outlook for this portfolio may differ from that presented for other Columbia Funds.
Investing in fixed-income securities may involve certain risks, including the credit quality of individual issuers, possible prepayments, market or economic developments and yields and share price fluctuations due to changes in interest rates. When interest rates go up, bond prices typically drop, and vice versa.
Investments in high-yield bonds (sometimes referred to as "junk" bonds) offer the potential for high current income and attractive total return, but involve certain risks. Changes in economic conditions or other circumstances may adversely affect a high-yield bond issuer's ability to make principal and interest payments.
5
Fund Profile – Mortgage- and Asset-Backed Portfolio
Performance data quoted represents past performance and current performance may be lower or higher. Past performance is no guarantee of future results. The investment return and principal value will fluctuate so that shares, when redeemed, may be worth more or less than the original cost. Please visit www.columbiamanagement.com for daily and most recent month-end performance updates.
Summary
13-month (cumulative) return as of 04/30/12
| | | | | +7.13% | | |
|
|  | | | Portfolio | |
|
| | | | | +6.96% | | |
|
|  | | | Barclays U.S. Securitized Index | |
|
Summary
g For the 13-month period that ended April 30, 2012, the portfolio returned 7.13%.
g The portfolio's return was slightly higher than the return of the Barclays U.S. Securitized Index.1
g The portfolio's positions in commercial mortgage-backed securities and its timely investments in agency mortgages helped create this performance advantage versus the benchmark index.
Portfolio Management
Michael Zazzarino has managed the portfolio since December 2007. From 2005 until joining Columbia Management Investment Advisers, LLC (the Investment Manager) in May 2010, Mr. Zazzarino was associated with the portfolio's previous investment adviser as an investment professional.
1The Barclays Capital U.S. Securitized Index is the largest component of the U.S. Aggregate Index and consists of the U.S. MBS Index, the ERISA-Eligible CMBS Index and the fixed-rate ABS Index. The U.S. MBS Index includes both fixed-rate agency passthroughs and agency hybrid ARM securities.
Indices are not available for investment, are not professionally managed and do not reflect sales charges, fees, brokerage commissions, taxes or other expenses of investing. Securities in the portfolio may not match those in an index.
6
Performance Information – Mortgage- and Asset-Backed Portfolio
Performance of a $10,000 investment 08/30/02 – 04/30/12

The chart above shows the change in value of a hypothetical $10,000 investment in Class A shares of Mortgage- and Asset-Backed Portfolio during the stated time period, and does not reflect the deduction of taxes that a shareholder may pay on portfolio distributions or on the redemption of portfolio shares.
Average annual total return as of 04/30/12 (%)
| Inception | | 08/30/02 | |
| 1-month (cumulative) | | | 0.87 | | |
| 1-year | | | 5.70 | | |
| 5-year | | | 3.75 | | |
| Life | | | 3.96 | | |
The Investment Manager bears all fees and expenses of the portfolio other than taxes, brokerage fees and commissions, costs of borrowing money and extraordinary expenses. Participants in wrap fee programs eligible to invest in the Portfolio, however, pay an asset-based fee, which is negotiable, for investment services, brokerage services and investment consultation. The Portfolio may incur significant costs that are in addition to the wrap fees paid to the program sponsor that are not included in this table. All results shown assume reinvestment of distributions.
The tables do not reflect the deduction of taxes that a shareholder may pay on portfolio distributions or on the redemption of portfolio shares.
Performance data quoted represents past performance and current performance may be lower or higher. Past performance is no guarantee of future results. The investment return and principal value will fluctuate so that shares, when redeemed, may be worth more or less than the original cost. Please visit www.columbiamanagement.com for daily and most recent month-end performance updates.
7
Understanding Your Expenses – Mortgage- and Asset-Backed Portfolio
The information on this page is intended to help you understand your ongoing costs of investing in the Portfolio.
The table below reflects the fact that no fees or expenses are charged to the Portfolio. Participants in the wrap fee programs eligible to invest in the Portfolio pay an asset-based fee, which is negotiable, for investment services, brokerage services and investment consultation. Please read the wrap program documents for information regarding fees charged.
The information in the following table is based on an initial investment of $1,000, which is invested at the beginning of the period and held for the entire period. The amount listed in the "Actual" column is calculated using the Portfolio's actual total return for the period. The amount listed in the "Hypothetical" column is calculated using a hypothetical annual return of 5%. You should not use the hypothetical account value to estimate your actual account balance.
Account value at the
beginning of the period ($)
11/01/11 | | Account value at the
end of the period ($)
04/30/12 | | Expenses paid
during the period ($)* | |
| Actual | | Hypothetical | | Actual | | Hypothetical | | Actual | | Hypothetical | |
| | 1,000.00 | | | | 1,000.00 | | | | 1,030.60 | | | | 1,024.86 | | | | — | | | | — | | |
* Columbia Management Investment Advisers, LLC bears all fees and expenses of the Portfolio other than taxes, brokerage fees and commissions, costs of borrowing money and extraordinary expenses. Participants in wrap fee programs pay an asset-based fee that is not included in this table.
Expenses do not include fees and expenses incurred indirectly by the Portfolio from the underlying funds in which the Portfolio may invest (also referred to as "acquired funds"), including affiliated and non-affiliated pooled investments vehicles (including mutual funds and exchange traded funds).
8
Portfolio Manager's Report – Mortgage- and Asset-Backed Portfolio
The Board of Trustees for Mortgage- and Asset-Backed Portfolio has approved the change of the portfolio's fiscal year end from March 31 to April 30. As a result, this report covers the 13-month period since the last annual report. The next report you receive will be for the six-month period from May 1, 2012 through October 31, 2012.
For the 13-month period that ended April 30, 2012, Mortgage- and Asset-Backed Portfolio returned 7.13%, compared with 6.96% for its benchmark, the Barclays U.S. Securitized Index. The portfolio's positions in commercial mortgage-backed securities and its timely investments in agency mortgages helped create this small performance advantage versus the benchmark index.
Portfolio positioning benefited returns
In the aftermath of the 2008 financial crisis, the Federal Reserve Board (the Fed) has responded with a series of initiatives designed to prop up various sectors of the fixed-income market. The portfolio has responded, in turn, by identifying and investing in those market segments in which the Fed was, or in which we believed it was likely to, become an active market participant. During the past 13 months, we applied this strategy to the agency mortgage market. We began the period with an underweight position in agency mortgages but added to it during the summer of 2011, just as the Fed announced it would support this asset class in order to boost a soft housing market. The portfolio concentrated its purchases in lower-coupon mortgage pools, where prepayment risk was the lowest and where the Fed was expected to provide active support through June 2012.
Throughout the reporting period, the portfolio maintained what has been a longstanding overweight position in commercial mortgage-backed securities (CMBS), whose higher yields and relatively low default rates combined to present what we feel is an attractive risk-reward profile. However, the magnitude of the portfolio's overweight in CMBS declined during the past 13 months. The decline was partly the result of our decision to increase investments in agency mortgages but also reflects a steadily shrinking CMBS market, in line with the significant decline since 2008 in the volume of commercial construction. Although CMBS experienced some difficult stretches during the past 13 months—notably during August 2011, when financial markets experienced a widespread pullback—they finished the period with a slightly positive contribution to overall performance. The portfolio's preference for high quality CMBS was a slight drag on performance as lower quality CMBS staged the strongest rebound during the fourth quarter of 2011.
The portfolio's asset allocation mix was also affected by a late-period decision to invest in a hybrid between mortgages and CMBS: multi-family residential bonds backed by apartments rather than retail properties. These holdings, which the portfolio began to purchase in early February, now account for approximately 10 percent of overall portfolio assets.
Performance data quoted represents past performance and current performance may be lower or higher. Past performance is no guarantee of future results. The investment return and principal value will fluctuate so that shares, when redeemed, may be worth more or less than the original cost. Please visit www.columbiamanagement.com for daily and most recent month-end performance updates.
Portfolio breakdown1
| (at 04/30/12) (%) | |
Residential Mortgage-Backed
Securities—Agency | | | 65.2 | | |
Residential Mortgage-Backed
Securities—Non-Agency | | | 0.8 | | |
Commercial Mortgage-Backed
Securities—Agency | | | 4.6 | | |
Commercial Mortgage-Backed
Securities—Non-Agency | | | 18.3 | | |
Asset-Backed Securities—
Non-Agency | | | 1.1 | | |
| Treasury Notes Short-term | | | 9.9 | | |
| Other2 | | | 0.1 | | |
1Percentages indicated are based upon total investments. Portfolio composition is subject to change.
2Includes investments in money market funds.
9
Portfolio Manager's Report (continued) – Mortgage- and Asset-Backed Portfolio
Looking ahead
We will continue to monitor the fixed-income initiatives of the Fed in an effort to achieve what we consider to be the ideal asset mix for the portfolio. As the economic recovery continues to languish, we consider it increasingly likely that the Fed will initiate another round of quantitative easing to increase the money supply at a time when the discount rate and other standard interest rate benchmarks are already close to zero. We would not be surprised to see such an effort emerge during the summer of 2012, when other forms of assistance will have reached their stated cutoff points.
Portfolio characteristics and holdings are subject to change periodically and may not be representative of current characteristics and holdings. The outlook for the portfolio may differ from that presented for other Columbia Funds.
Investing in fixed-income securities may involve certain risks, including the credit quality of individual issuers, possible prepayments, market or economic developments and yields and share price fluctuations due to changes in interest rates. When interest rates go up, bond prices typically drop, and vice versa.
Investments in high-yield bonds (sometimes referred to as "junk" bonds) offer the potential for high current income and attractive total return, but involve certain risks. Changes in economic conditions or other circumstances may adversely affect a high-yield bond issuer's ability to make principal and interest payments.
10
Portfolio of Investments – Corporate Bond Portfolio
April 30, 2012
(Percentages represent value of investments compared to net assets)
| Issuer | | Coupon
Rate | | Principal
Amount | | Value | |
| Corporate Bonds & Notes 89.7% | |
| Aerospace & Defense 0.8% | |
| L-3 Communications Corp. | |
| 02/15/21 | | | 4.950 | % | | $ | 105,000 | | | $ | 112,361 | | |
Raytheon Co.
Senior Unsecured | |
| 11/01/28 | | | 7.000 | % | | | 45,000 | | | | 58,814 | | |
| Total | | | | | | | | | | | 171,175 | | |
| Airlines 0.1% | |
| Continental Airlines 1997-1 Class A Pass-Through Trust | |
| 04/01/15 | | | 7.461 | % | | | 22,252 | | | | 22,502 | | |
| Banking 21.0% | |
Bank of America Corp.
Senior Unsecured | |
| 01/24/22 | | | 5.700 | % | | | 275,000 | | | | 288,687 | | |
| 02/07/42 | | | 5.875 | % | | | 95,000 | | | | 93,884 | | |
Barclays Bank PLC
Senior Unsecured | |
| 09/22/16 | | | 5.000 | % | | | 250,000 | | | | 269,747 | | |
| Capital One/IV(a) | |
| 02/17/37 | | | 6.745 | % | | | 209,000 | | | | 209,000 | | |
| Capital One/V | |
| 08/15/39 | | | 10.250 | % | | | 165,000 | | | | 172,013 | | |
Chinatrust Commercial Bank
Subordinated Notes(a)(b) | |
| 03/29/49 | | | 5.625 | % | | | 45,000 | | | | 42,750 | | |
Citigroup, Inc.
Senior Unsecured | |
| 01/10/17 | | | 4.450 | % | | | 65,000 | | | | 67,899 | | |
| 01/30/42 | | | 5.875 | % | | | 105,000 | | | | 111,700 | | |
Comerica Bank
Subordinated Notes | |
| 08/22/17 | | | 5.200 | % | | | 115,000 | | | | 128,322 | | |
Discover Bank
Subordinated Notes | |
| 11/18/19 | | | 8.700 | % | | | 205,000 | | | | 258,568 | | |
Fifth Third Bancorp
Senior Unsecured | |
| 01/25/16 | | | 3.625 | % | | | 115,000 | | | | 121,972 | | |
HSBC Holdings PLC
Senior Unsecured | |
| 01/14/22 | | | 4.875 | % | | | 35,000 | | | | 37,744 | | |
HSBC USA, Inc.
Subordinated Notes | |
| 09/27/20 | | | 5.000 | % | | | 195,000 | | | | 197,459 | | |
ING Bank NV
Senior Unsecured(b) | |
| 03/15/16 | | | 4.000 | % | | | 200,000 | | | | 202,922 | | |
| JPMorgan Chase & Co.(a) | |
| 04/29/49 | | | 7.900 | % | | | 45,000 | | | | 49,304 | | |
| JPMorgan Chase Capital XX | |
| 09/29/36 | | | 6.550 | % | | | 290,000 | | | | 291,087 | | |
| JPMorgan Chase Capital XXII | |
| 02/02/37 | | | 6.450 | % | | | 252,000 | | | | 252,000 | | |
| JPMorgan Chase Capital XXIII(a) | |
| 05/15/47 | | | 1.503 | % | | | 150,000 | | | | 111,003 | | |
KeyCorp
Senior Unsecured | |
| 03/24/21 | | | 5.100 | % | | | 342,000 | | | | 384,464 | | |
| Issuer | | Coupon
Rate | | Principal
Amount | | Value | |
| Corporate Bonds & Notes (continued) | |
| Banking (cont.) | |
Lloyds TSB Bank PLC
Bank Guaranteed(b) | |
| 01/12/15 | | | 4.375 | % | | $ | 196,000 | | | $ | 200,472 | | |
Merrill Lynch & Co., Inc.
Senior Unsecured | |
| 02/03/14 | | | 5.000 | % | | | 100,000 | | | | 103,273 | | |
| Subordinated Notes | |
| 05/02/17 | | | 5.700 | % | | | 40,000 | | | | 41,027 | | |
| National City Preferred Capital Trust I(a) | |
| 12/31/49 | | | 12.000 | % | | | 55,000 | | | | 58,542 | | |
| PNC Financial Services Group, Inc.(a) | |
| 07/29/49 | | | 6.750 | % | | | 90,000 | | | | 94,335 | | |
Scotland International Finance No. 2 BV
Bank Guaranteed(b) | |
| 05/23/13 | | | 4.250 | % | | | 127,000 | | | | 126,987 | | |
| State Street Corp. | |
| 03/15/18 | | | 4.956 | % | | | 45,000 | | | | 47,684 | | |
| Senior Unsecured | |
| 03/07/16 | | | 2.875 | % | | | 220,000 | | | | 231,586 | | |
| USB Capital XIII Trust | |
| 12/15/39 | | | 6.625 | % | | | 85,000 | | | | 86,677 | | |
Wells Fargo & Co.
Senior Unsecured(a) | |
| 06/15/16 | | | 3.676 | % | | | 285,000 | | | | 305,760 | | |
| Total | | | | | | | | | | | 4,586,868 | | |
| Brokerage 0.6% | |
Eaton Vance Corp.
Senior Unsecured | |
| 10/02/17 | | | 6.500 | % | | | 110,000 | | | | 125,787 | | |
| Chemicals 1.0% | |
Dow Chemical Co. (The)
Senior Unsecured | |
| 05/15/19 | | | 8.550 | % | | | 32,000 | | | | 42,432 | | |
| 11/15/20 | | | 4.250 | % | | | 90,000 | | | | 95,521 | | |
| 05/15/39 | | | 9.400 | % | | | 45,000 | | | | 70,357 | | |
| Total | | | | | | | | | | | 208,310 | | |
| Diversified Manufacturing 0.6% | |
| Tyco International Ltd./Finance SA | |
| 01/15/21 | | | 6.875 | % | | | 95,000 | | | | 120,291 | | |
| Electric 9.5% | |
Alabama Power Co.
Senior Unsecured | |
| 03/15/41 | | | 5.500 | % | | | 50,000 | | | | 61,692 | | |
Commonwealth Edison Co.
1st Mortgage | |
| 08/15/16 | | | 5.950 | % | | | 75,000 | | | | 88,756 | | |
| 08/01/20 | | | 4.000 | % | | | 105,000 | | | | 115,719 | | |
| Senior Unsecured | |
| 07/15/18 | | | 6.950 | % | | | 90,000 | | | | 109,058 | | |
Detroit Edison Co. (The)
1st Mortgage | |
| 10/01/20 | | | 3.450 | % | | | 185,000 | | | | 196,593 | | |
Duke Energy Carolinas LLC
1st Mortgage | |
| 10/01/15 | | | 5.300 | % | | | 165,000 | | | | 188,865 | | |
The Accompanying Notes to Financial Statements are an integral part of this statement.
11
Corporate Bond Portfolio
April 30, 2012
(Percentages represent value of investments compared to net assets)
| Issuer | | Coupon
Rate | | Principal
Amount | | Value | |
| Corporate Bonds & Notes (continued) | |
| Electric (cont.) | |
Exelon Generation Co. LLC
Senior Unsecured | |
| 10/01/17 | | | 6.200 | % | | $ | 205,000 | | | $ | 240,880 | | |
Georgia Power Co.
Senior Unsecured | |
| 09/01/40 | | | 4.750 | % | | | 210,000 | | | | 228,686 | | |
MidAmerican Energy Holdings Co.
Senior Unsecured | |
| 02/15/14 | | | 5.000 | % | | | 197,000 | | | | 211,393 | | |
| Nevada Power Co. | |
| 09/15/40 | | | 5.375 | % | | | 265,000 | | | | 311,034 | | |
Niagara Mohawk Power Corp.
Senior Unsecured(b) | |
| 08/15/19 | | | 4.881 | % | | | 65,000 | | | | 72,515 | | |
Pacific Gas & Electric Co.
Senior Unsecured | |
| 01/15/40 | | | 5.400 | % | | | 45,000 | | | | 52,089 | | |
Southern California Edison Co.
1st Mortgage | |
| 09/01/40 | | | 4.500 | % | | | 45,000 | | | | 48,639 | | |
Southern Co. (The)
Senior Unsecured | |
| 05/15/14 | | | 4.150 | % | | | 60,000 | | | | 64,031 | | |
Xcel Energy, Inc.
Senior Unsecured | |
| 05/15/20 | | | 4.700 | % | | | 65,000 | | | | 74,256 | | |
| Total | | | | | | | | | | | 2,064,206 | | |
| Entertainment 0.7% | |
| Time Warner, Inc. | |
| 11/15/36 | | | 6.500 | % | | | 135,000 | | | | 159,189 | | |
| Food and Beverage 4.4% | |
| Anheuser-Busch InBev Worldwide, Inc. | |
| 01/15/19 | | | 7.750 | % | | | 185,000 | | | | 244,765 | | |
ConAgra Foods, Inc.
Senior Unsecured | |
| 10/01/28 | | | 7.000 | % | | | 70,000 | | | | 85,023 | | |
General Mills, Inc.
Senior Unsecured | |
| 12/15/21 | | | 3.150 | % | | | 260,000 | | | | 264,335 | | |
Kraft Foods, Inc.
Senior Unsecured | |
| 02/09/16 | | | 4.125 | % | | | 215,000 | | | | 235,085 | | |
| 02/09/40 | | | 6.500 | % | | | 100,000 | | | | 125,415 | | |
| Total | | | | | | | | | | | 954,623 | | |
| Gas Distributors 1.5% | |
Atmos Energy Corp.
Senior Unsecured | |
| 06/15/17 | | | 6.350 | % | | | 100,000 | | | | 117,849 | | |
| 03/15/19 | | | 8.500 | % | | | 105,000 | | | | 139,094 | | |
Sempra Energy
Senior Unsecured | |
| 06/01/16 | | | 6.500 | % | | | 60,000 | | | | 71,400 | | |
| Total | | | | | | | | | | | 328,343 | | |
| Gas Pipelines 4.8% | |
| El Paso Pipeline Partners Operating Co. LLC | |
| 10/01/21 | | | 5.000 | % | | | 159,000 | | | | 167,975 | | |
| Issuer | | Coupon
Rate | | Principal
Amount | | Value | |
| Corporate Bonds & Notes (continued) | |
| Gas Pipelines (cont.) | |
Energy Transfer Partners LP
Senior Unsecured | |
| 02/01/42 | | | 6.500 | % | | $ | 70,000 | | | $ | 74,195 | | |
| Plains All American Pipeline LP/Finance Corp. | |
| 05/01/18 | | | 6.500 | % | | | 55,000 | | | | 66,696 | | |
| 05/01/19 | | | 8.750 | % | | | 185,000 | | | | 244,054 | | |
| 01/15/20 | | | 5.750 | % | | | 10,000 | | | | 11,605 | | |
Southern Natural Gas Co. LLC
Senior Unsecured | |
| 03/01/32 | | | 8.000 | % | | | 105,000 | | | | 135,548 | | |
| TransCanada PipeLines Ltd.(a) | |
| 05/15/67 | | | 6.350 | % | | | 180,000 | | | | 187,901 | | |
Williams Partners LP
Senior Unsecured | |
| 04/15/40 | | | 6.300 | % | | | 135,000 | | | | 160,372 | | |
| Total | | | | | | | | | | | 1,048,346 | | |
| Health Care 2.1% | |
| Express Scripts Holding Co.(b) | |
| 02/15/17 | | | 2.650 | % | | | 231,000 | | | | 235,153 | | |
| 02/15/22 | | | 3.900 | % | | | 215,000 | | | | 221,253 | | |
| Total | | | | | | | | | | | 456,406 | | |
| Healthcare Insurance 0.5% | |
UnitedHealth Group, Inc.
Senior Unsecured | |
| 02/15/18 | | | 6.000 | % | | | 90,000 | | | | 109,780 | | |
| Home Construction —% | |
| D.R. Horton, Inc. | |
| 09/15/14 | | | 5.625 | % | | | 10,000 | | | | 10,550 | | |
| Independent Energy 1.8% | |
Canadian Natural Resources Ltd.
Senior Unsecured | |
| 03/15/38 | | | 6.250 | % | | | 155,000 | | | | 193,468 | | |
Devon Energy Corp.
Senior Unsecured | |
| 01/15/19 | | | 6.300 | % | | | 70,000 | | | | 86,483 | | |
Nexen, Inc.
Senior Unsecured | |
| 03/10/35 | | | 5.875 | % | | | 60,000 | | | | 62,830 | | |
| 07/30/39 | | | 7.500 | % | | | 45,000 | | | | 55,126 | | |
| Total | | | | | | | | | | | 397,907 | | |
| Integrated Energy 1.7% | |
Hess Corp.
Senior Unsecured | |
| 08/15/31 | | | 7.300 | % | | | 50,000 | | | | 64,347 | | |
| 02/15/41 | | | 5.600 | % | | | 145,000 | | | | 156,838 | | |
Marathon Oil Corp.
Senior Unsecured | |
| 10/01/17 | | | 6.000 | % | | | 54,000 | | | | 63,625 | | |
| Shell International Finance BV | |
| 03/25/40 | | | 5.500 | % | | | 70,000 | | | | 87,427 | | |
| Total | | | | | | | | | | | 372,237 | | |
| Life Insurance 5.6% | |
Lincoln National Corp.
Senior Unsecured | |
| 07/01/19 | | | 8.750 | % | | | 155,000 | | | | 198,269 | | |
| Lincoln National Corp.(a) | |
| 04/20/67 | | | 6.050 | % | | | 249,000 | | | | 231,570 | | |
The Accompanying Notes to Financial Statements are an integral part of this statement.
12
Corporate Bond Portfolio
April 30, 2012
(Percentages represent value of investments compared to net assets)
| Issuer | | Coupon
Rate | | Principal
Amount | | Value | |
| Corporate Bonds & Notes (continued) | |
| Life Insurance (cont.) | |
| MetLife Capital Trust X(b) | |
| 04/08/38 | | | 9.250 | % | | $ | 195,000 | | | $ | 237,900 | | |
| MetLife, Inc. | |
| 08/01/39 | | | 10.750 | % | | | 85,000 | | | | 118,150 | | |
Prudential Financial, Inc.
Senior Unsecured | |
| 07/15/13 | | | 4.500 | % | | | 90,000 | | | | 93,612 | | |
| 06/15/19 | | | 7.375 | % | | | 50,000 | | | | 62,234 | | |
| Prudential Financial, Inc.(a) | |
| 06/15/38 | | | 8.875 | % | | | 235,000 | | | | 278,769 | | |
| Total | | | | | | | | | | | 1,220,504 | | |
| Media Cable 1.2% | |
| DIRECTV Holdings LLC/Financing Co., Inc. | |
| 02/15/16 | | | 3.125 | % | | | 175,000 | | | | 182,129 | | |
| Time Warner Cable, Inc. | |
| 05/01/17 | | | 5.850 | % | | | 60,000 | | | | 70,271 | | |
| Total | | | | | | | | | | | 252,400 | | |
| Media Non-Cable 3.2% | |
NBCUniversal Media LLC
Senior Unsecured | |
| 04/01/16 | | | 2.875 | % | | | 430,000 | | | | 449,685 | | |
| News America, Inc. | |
| 12/15/35 | | | 6.400 | % | | | 159,000 | | | | 181,949 | | |
| 02/15/41 | | | 6.150 | % | | | 64,000 | | | | 73,450 | | |
| Total | | | | | | | | | | | 705,084 | | |
| Metals 2.5% | |
ArcelorMittal
Senior Unsecured | |
| 10/15/39 | | | 7.000 | % | | | 140,000 | | | | 136,514 | | |
| 03/01/41 | | | 6.750 | % | | | 40,000 | | | | 37,825 | | |
Nucor Corp.
Senior Unsecured | |
| 06/01/18 | | | 5.850 | % | | | 215,000 | | | | 259,942 | | |
| Vale Overseas Ltd. | |
| 11/21/36 | | | 6.875 | % | | | 95,000 | | | | 113,070 | | |
| Total | | | | | | | | | | | 547,351 | | |
| Non-Captive Consumer 0.3% | |
| Discover Financial Services(b) | |
| 04/27/22 | | | 5.200 | % | | | 60,000 | | | | 62,256 | | |
| Non-Captive Diversified 2.0% | |
General Electric Capital Corp.
Senior Unsecured | |
| 01/07/21 | | | 4.625 | % | | | 410,000 | | | | 444,724 | | |
| Oil Field Services 0.1% | |
| Weatherford International Ltd. | |
| 09/15/20 | | | 5.125 | % | | | 30,000 | | | | 32,147 | | |
| Other Industry 0.7% | |
President and Fellows of Harvard College
Senior Notes | |
| 10/15/40 | | | 4.875 | % | | | 85,000 | | | | 99,826 | | |
| President and Fellows of Harvard College(b) | |
| 01/15/39 | | | 6.500 | % | | | 30,000 | | | | 43,839 | | |
| Total | | | | | | | | | | | 143,665 | | |
| Issuer | | Coupon
Rate | | Principal
Amount | | Value | |
| Corporate Bonds & Notes (continued) | |
| Pharmaceuticals 0.7% | |
Johnson & Johnson
Senior Unsecured | |
| 05/15/41 | | | 4.850 | % | | $ | 126,000 | | | $ | 148,672 | | |
| Property & Casualty 2.3% | |
CNA Financial Corp.
Senior Unsecured | |
| 12/15/14 | | | 5.850 | % | | | 61,000 | | | | 65,737 | | |
| 11/15/19 | | | 7.350 | % | | | 104,000 | | | | 123,379 | | |
| 08/15/21 | | | 5.750 | % | | | 25,000 | | | | 27,358 | | |
| Liberty Mutual Group, Inc.(a)(b) | |
| 06/15/58 | | | 10.750 | % | | | 30,000 | | | | 40,800 | | |
| OneBeacon US Holdings, Inc. | |
| 05/15/13 | | | 5.875 | % | | | 38,000 | | | | 39,335 | | |
Transatlantic Holdings, Inc.
Senior Unsecured | |
| 11/30/39 | | | 8.000 | % | | | 175,000 | | | | 199,563 | | |
| Total | | | | | | | | | | | 496,172 | | |
| Railroads 2.4% | |
| BNSF Funding Trust I(a) | |
| 12/15/55 | | | 6.613 | % | | | 130,000 | | | | 135,363 | | |
Burlington Northern Santa Fe LLC
Senior Unsecured | |
| 08/15/30 | | | 7.950 | % | | | 110,000 | | | | 151,699 | | |
CSX Corp.
Senior Unsecured | |
| 06/01/21 | | | 4.250 | % | | | 125,000 | | | | 136,032 | | |
| 05/30/42 | | | 4.750 | % | | | 90,000 | | | | 90,295 | | |
| Union Pacific Railroad Co. 2003 Pass-Through Trust | |
| 01/02/24 | | | 4.698 | % | | | 8,906 | | | | 9,870 | | |
| Total | | | | | | | | | | | 523,259 | | |
| REITs 1.7% | |
| Brandywine Operating Partnership LP | |
| 05/15/15 | | | 7.500 | % | | | 105,000 | | | | 117,345 | | |
Duke Realty LP
Senior Unsecured | |
| 08/15/19 | | | 8.250 | % | | | 155,000 | | | | 193,307 | | |
Highwoods Realty LP
Senior Unsecured | |
| 03/15/17 | | | 5.850 | % | | | 55,000 | | | | 59,429 | | |
| Total | | | | | | | | | | | 370,081 | | |
| Restaurants 1.5% | |
McDonald's Corp.
Senior Unsecured | |
| 05/20/21 | | | 3.625 | % | | | 305,000 | | | | 335,350 | | |
| Retailers 1.4% | |
Best Buy Co., Inc.
Senior Unsecured | |
| 03/15/21 | | | 5.500 | % | | | 95,000 | | | | 88,878 | | |
CVS Pass-Through Trust
Pass-Through Certificates(b) | |
| 01/11/27 | | | 5.298 | % | | | 93,083 | | | | 97,259 | | |
| Macy's Retail Holdings, Inc. | |
| 01/15/42 | | | 5.125 | % | | | 125,000 | | | | 126,242 | | |
| Total | | | | | | | | | | | 312,379 | | |
The Accompanying Notes to Financial Statements are an integral part of this statement.
13
Corporate Bond Portfolio
April 30, 2012
(Percentages represent value of investments compared to net assets)
| Issuer | | Coupon
Rate | | Principal
Amount | | Value | |
| Corporate Bonds & Notes (continued) | |
| Supermarkets 2.2% | |
| Kroger Co. (The) | |
| 10/01/15 | | | 3.900 | % | | $ | 350,000 | | | $ | 381,022 | | |
| 12/15/18 | | | 6.800 | % | | | 85,000 | | | | 105,223 | | |
| Total | | | | | | | 486,245 | | |
| Technology 2.8% | |
Corning, Inc.
Senior Unsecured | |
| 03/15/42 | | | 4.750 | % | | | 135,000 | | | | 134,793 | | |
Hewlett-Packard Co.
Senior Unsecured | |
| 06/01/21 | | | 4.300 | % | | | 55,000 | | | | 56,561 | | |
| 09/15/21 | | | 4.375 | % | | | 90,000 | | | | 93,359 | | |
| 12/09/21 | | | 4.650 | % | | | 65,000 | | | | 68,683 | | |
| 09/15/41 | | | 6.000 | % | | | 240,000 | | | | 265,280 | | |
| Total | | | | | | | | | | | 618,676 | | |
| Transportation Services 0.8% | |
| ERAC U.S.A. Finance LLC(b) | |
| 10/01/20 | | | 5.250 | % | | | 155,000 | | | | 171,099 | | |
| Wireless —% | |
| Rogers Communications, Inc. | |
| 06/15/13 | | | 6.250 | % | | | 6,000 | | | | 6,359 | | |
| Wirelines 7.2% | |
AT&T, Inc.
Senior Unsecured | |
| 06/15/16 | | | 5.625 | % | | | 130,000 | | | | 151,549 | | |
| 02/15/39 | | | 6.550 | % | | | 215,000 | | | | 266,496 | | |
CenturyLink, Inc.
Senior Unsecured | |
| 06/15/21 | | | 6.450 | % | | | 150,000 | | | | 156,116 | | |
Embarq Corp.
Senior Unsecured | |
| 06/01/36 | | | 7.995 | % | | | 90,000 | | | | 90,335 | | |
| Telecom Italia Capital SA | |
| 07/18/36 | | | 7.200 | % | | | 115,000 | | | | 105,369 | | |
| Telefonica Emisiones SAU | |
| 06/20/16 | | | 6.421 | % | | | 170,000 | | | | 175,000 | | |
| 07/03/17 | | | 6.221 | % | | | 95,000 | | | | 96,920 | | |
| 04/27/20 | | | 5.134 | % | | | 190,000 | | | | 176,095 | | |
Verizon Communications, Inc.
Senior Unsecured | |
| 04/01/16 | | | 3.000 | % | | | 200,000 | | | | 213,231 | | |
| 04/01/21 | | | 4.600 | % | | | 130,000 | | | | 147,187 | | |
| Total | | | | | | | | | | | 1,578,298 | | |
Total Corporate Bonds & Notes
(Cost: $18,137,743) | | $ | 19,591,241 | | |
| U.S. Treasury Obligations 0.2% | |
| U.S. Treasury | |
| 02/15/22 | | | 2.000 | % | | $ | 40,000 | | | $ | 40,300 | | |
| 02/15/42 | | | 3.125 | % | | | 5,000 | | | | 5,014 | | |
Total U.S. Treasury Obligations
(Cost: $45,045) | | $ | 45,314 | | |
| Issuer | | Coupon
Rate | | Principal
Amount | | Value | |
| Foreign Government Obligations 2.6% | |
| CANADA 1.3% | |
| Hydro Quebec | |
| 12/01/29 | | | 8.500 | % | | $ | 40,000 | | | $ | 64,190 | | |
| Province of Quebec | |
| 11/14/16 | | | 5.125 | % | | | 200,000 | | | | 233,514 | | |
| Total | | | | | | | 297,704 | | |
| MEXICO 0.6% | |
| Pemex Project Funding Master Trust | |
| 03/01/18 | | | 5.750 | % | | | 110,000 | | | | 125,400 | | |
| QATAR 0.7% | |
Nakilat, Inc.
Senior Secured(b) | |
| 12/31/33 | | | 6.067 | % | | | 145,000 | | | | 157,325 | | |
Total Foreign Government Obligations
(Cost: $513,998) | | $ | 580,429 | | |
Issue
Description | | Coupon
Rate | | Principal
Amount | | Value | |
| Municipal Bonds 4.3% | |
City of Chicago Waterworks
Revenue Bonds
Build America Bonds
Series 2010 | |
| 11/01/40 | | | 6.742 | % | | $ | 25,000 | | | $ | 32,264 | | |
Commonwealth of Massachusetts
Revenue Bonds
Build America Bonds-Recovery
Series 2010Z | |
| 06/01/30 | | | 5.631 | % | | | 85,000 | | | | 107,485 | | |
| 06/01/40 | | | 5.731 | % | | | 115,000 | | | | 147,937 | | |
Kentucky Asset Liability Commission
Revenue Bonds
Taxable
Series 2010 | |
| 04/01/18 | | | 3.165 | % | | | 165,000 | | | | 172,928 | | |
Los Angeles Unified School District
Unlimited General Obligation Bonds
Build America Bonds
Series 2009 | |
| 07/01/34 | | | 5.750 | % | | | 115,000 | | | | 134,853 | | |
State of California
Unlimited General Obligation Bonds
Taxable
Series 2010 | |
| 11/01/15 | | | 3.950 | % | | | 115,000 | | | | 124,456 | | |
Taxable Build America Bonds
Series 2009 | |
| 04/01/39 | | | 7.550 | % | | | 170,000 | | | | 224,805 | | |
Total Municipal Bonds
(Cost: $826,230) | | $ | 944,728 | | |
The Accompanying Notes to Financial Statements are an integral part of this statement.
14
Corporate Bond Portfolio
April 30, 2012
(Percentages represent value of investments compared to net assets)
| Issuer | | Coupon
Rate | | Principal
Amount | | Value | |
| Preferred Debt 1.2% | |
| Banking 1.2% | |
| Citigroup Capital XIII(a) | |
| 10/30/40 | | | 7.875 | % | | $ | 4,810 | | | $ | 128,090 | | |
| U.S. Bancorp(a) | |
| 01/15/22 | | | 6.500 | % | | | 5,000 | | | | 135,300 | | |
| Total | | | | | | | 263,390 | | |
Total Preferred Debt
(Cost: $259,414) | | | | | | $ | 263,390 | | |
| | |
| |
Shares | |
Value | |
| Money Market Funds 0.6% | |
Columbia Short-Term Cash Fund,
0.144%(c)(d) | | | | | 120,157 | | | $ | 120,157 | | |
Total Money Market Funds
(Cost: $120,157) | | | | | | $ | 120,157 | | |
Total Investments
(Cost: $19,902,587) | | | | | | $ | 21,545,259 | | |
| Other Assets & Liabilities, Net | | | | | | | 294,885 | | |
| Net Assets | | | | | | $ | 21,840,144 | | |
| Investment in Derivatives | |
At April 30, 2012, $26,759 was held in a margin deposit account as collateral to cover initial margin requirements on open futures contracts.
Futures Contracts Outstanding at April 30, 2012
| Contract Description | | Number of
Contracts
Long (Short) | | Notional
Market Value | | Expiration
Date | | Unrealized
Appreciation | | Unrealized
Depreciation | |
| U.S. Treasury Long Bond, 20-year | | | (4 | ) | | $ | (571,500 | ) | | June 2012 | | $ | — | | | $ | (9,976 | ) | |
| U.S. Treasury Note, 2-year | | | 7 | | | | 1,543,828 | | | July 2012 | | | 2,175 | | | | — | | |
| U.S. Treasury Note, 5-year | | | (5 | ) | | | (618,984 | ) | | July 2012 | | | — | | | | (3,915 | ) | |
| U.S. Treasury Note, 10-year | | | (1 | ) | | | (132,281 | ) | | June 2012 | | | — | | | | (1,565 | ) | |
| U.S. Treasury Ultra Bond, 30-year | | | (3 | ) | | | (473,438 | ) | | June 2012 | | | — | | | | (7,608 | ) | |
| Total | | | | $ | (252,375 | ) | | | | $ | 2,175 | | | $ | (23,064 | ) | |
| Notes to Portfolio of Investments | |
(a) Variable rate security. The interest rate shown reflects the rate as of April 30, 2012.
(b) Security exempt from registration pursuant to Rule 144A under the Securities Act of 1933. This security may be resold in transactions exempt from registration, normally to qualified institutional buyers. At April 30, 2012, the value of these securities amounted to $1,912,530 or 8.76% of net assets.
(c) The rate shown is the seven-day current annualized yield at April 30, 2012.
(d) Investments in affiliates during the period ended April 30, 2012:
| Issuer | |
Beginning
Cost | |
Purchase
Cost | | Sales Cost/
Proceeds
from Sales | |
Realized
Gain/Loss | |
Ending
Cost | | Dividends
or Interest
Income | | Value | |
Columbia Short-Term
Cash Fund | | $ | — | | | $ | 341,174 | | | $ | (221,017 | ) | | $ | — | | | $ | 120,157 | | | $ | 24 | | | $ | 120,157 | | |
Investments in affiliates during the year ended March 31, 2012:
| Issuer | |
Beginning
Cost | |
Purchase
Cost | | Sales Cost/
Proceeds
from Sales | |
Realized
Gain/Loss | |
Ending
Cost | | Dividends
or Interest
Income | |
Value | |
| Columbia Short-Term Cash Fund | | $ | — | | | $ | 5,938,111 | | | $ | 5,938,111 | | | $ | — | | | $ | — | | | $ | 233 | | | $ | — | | |
| Fair Value Measurements | |
Generally accepted accounting principles (GAAP) require disclosure regarding the inputs and valuation techniques used to measure fair value and any changes in valuation inputs or techniques. In addition, investments shall be disclosed by major category.
The Portfolio categorizes its fair value measurements according to a three-level hierarchy that maximizes the use of observable inputs and minimizes the use of unobservable inputs by prioritizing that the most observable input be used when available. Observable inputs are those that market participants would use in pricing an investment based on market data obtained from sources independent of the reporting entity. Unobservable inputs are those that reflect the Portfolio's assumptions about the information market participants would use in pricing an investment. An investment's level within the fair value hierarchy is based on the lowest level of any
The Accompanying Notes to Financial Statements are an integral part of this statement.
15
Corporate Bond Portfolio
April 30, 2012
| Fair Value Measurements (continued) | |
input that is deemed significant to the asset or liability's fair value measurement. The input levels are not necessarily an indication of the risk or liquidity associated with investments at that level. For example, certain U.S. government securities are generally high quality and liquid, however, they are reflected as Level 2 because the inputs used to determine fair value may not always be quoted prices in an active market.
Fair value inputs are summarized in the three broad levels listed below:
• Level 1 — Valuations based on quoted prices for investments in active markets that the Portfolio has the ability to access at the measurement date (including NAV for open-end mutual funds). Valuation adjustments are not applied to Level 1 investments.
• Level 2 — Valuations based on other significant observable inputs (including quoted prices for similar securities, interest rates, prepayment speeds, credit risks, etc.).
• Level 3 — Valuations based on significant unobservable inputs (including the Portfolio's own assumptions and judgment in determining the fair value of investments).
Inputs that are used in determining fair value of an investment may include price information, credit data, volatility statistics, and other factors. These inputs can be either observable or unobservable. The availability of observable inputs can vary between investments, and is affected by various factors such as the type of investment, and the volume and level of activity for that investment or similar investments in the marketplace. The inputs will be considered by the Investment Manager, along with any other relevant factors in the calculation of an investment's fair value. The Portfolio uses prices and inputs that are current as of the measurement date, which may include periods of market dislocations. During these periods, the availability of prices and inputs may be reduced for many investments. This condition could cause an investment to be reclassified between the various levels within the hierarchy.
Investments falling into the Level 3 category are primarily supported by quoted prices from brokers and dealers participating in the market for those investments. However, these may be classified as Level 3 investments due to lack of market transparency and corroboration to support these quoted prices. Additionally, valuation models may be used as the pricing source for any remaining investments classified as Level 3. These models rely on one or more significant unobservable inputs and/or significant assumptions by the Investment Manager. Inputs used in valuations may include, but are not limited to, financial statement analysis, capital account balances, discount rates and estimated cash flows, and comparable company data.
Under the direction of the Portfolio's Board of Trustees (the Board), the Investment Manager's Valuation Committee (the Committee) is responsible for carrying out the valuation procedures approved by the Board. The Committee consists of voting and non-voting members from various groups within the Investment Manager's organization, including operations and accounting, trading and investments, compliance, risk management and legal.
The Committee meets at least monthly to review and approve valuation matters, which may include a description of specific valuation determinations, data regarding pricing information received from approved pricing vendors and brokers and the results of Board-approved valuation control policies and procedures (the Policies). The Policies address, among other things, instances when market quotations are readily available, including recommendation of third party pricing vendors and a determination of appropriate pricing methodologies; events that require specific valuation determinations and assessment of fair value techniques; securities with a potential for stale pricing, including those that are illiquid, restricted, or in default; and the effectiveness of third-party pricing vendors, including periodic reviews of vendors. The Committee meets more frequently, as needed, to discuss additional valuation matters, which may include the need to review back-testing results, review time-sensitive information or approve related valuation actions. The Committee reports to the Board, with members of the Committee meeting with the Board at each of its regularly scheduled meetings to discuss valuation matters and actions during the period, similar to those described earlier.
For investments categorized as Level 3, the Committee monitors information similar to that described above, which may include: (i) data specific to the issuer or comparable issuers, (ii) general market or specific sector news and (iii) quoted prices and specific or similar security transactions. The Committee considers this data and any changes from prior periods in order to assess the reasonableness of observable and unobservable inputs, any assumptions or internal models used to value those securities and changes in fair value. This data is also used to corroborate, when available, information received from approved pricing vendors and brokers. Various factors impact the frequency of monitoring this information (which may occur as often as daily). However, the Committee may determine that changes to inputs, assumptions and models are not required as a result of the monitoring procedures performed.
The Accompanying Notes to Financial Statements are an integral part of this statement.
16
Corporate Bond Portfolio
April 30, 2012
| Fair Value Measurements (continued) | |
The following table is a summary of the inputs used to value the Portfolio's investments as of April 30, 2012:
| | | Fair Value at April 30, 2012 | |
| Description | | Level 1
Quoted Prices
in Active
Markets for
Identical Assets | | Level 2
Other
Significant
Observable
Inputs | | Level 3
Significant
Unobservable
Inputs | | Total | |
| Bonds | |
| Corporate Bonds & Notes | | $ | — | | | $ | 19,591,241 | | | $ | — | | | $ | 19,591,241 | | |
| U.S. Treasury Obligations | | | 45,314 | | | | — | | | | — | | | | 45,314 | | |
| Foreign Government Obligations | | | — | | | | 580,429 | | | | — | | | | 580,429 | | |
| Municipal Bonds | | | — | | | | 944,728 | | | | — | | | | 944,728 | | |
| Preferred Debt | | | 263,390 | | | | — | | | | — | | | | 263,390 | | |
| Total Bonds | | | 308,704 | | | | 21,116,398 | | | | — | | | | 21,425,102 | | |
| Other | |
| Money Market Funds | | | 120,157 | | | | — | | | | — | | | | 120,157 | | |
| Total Other | | | 120,157 | | | | — | | | | — | | | | 120,157 | | |
| Investments in Securities | | | 428,861 | | | | 21,116,398 | | | | — | | | | 21,545,259 | | |
| Derivatives | |
| Assets | |
| Futures Contracts | | | 2,175 | | | | — | | | | — | | | | 2,175 | | |
| Liabilities | |
| Futures Contracts | | | (23,064 | ) | | | — | | | | — | | | | (23,064 | ) | |
| Total | | $ | 407,972 | | | $ | 21,116,398 | | | $ | — | | | $ | 21,524,370 | | |
See the Portfolio of Investments for all investment classifications not indicated in the table.
The Portfolio's assets assigned to the Level 2 input category are generally valued using the market approach, in which a security's value is determined through reference to prices and information from market transactions for similar or identical assets.
There were no transfers of financial assets between Levels 1 and 2 during the period from April 1, 2012 to April 30, 2012.
Derivative instruments are valued at unrealized appreciation (depreciation).
The Accompanying Notes to Financial Statements are an integral part of this statement.
17
Corporate Bond Portfolio
April 30, 2012
| Fair Value Measurements (continued) | |
The following table is a summary of the inputs used to value the Portfolio's investments as of March 31, 2012:
| | | Fair Value at March 31, 2012 | |
| Description | | Level 1
Quoted Prices
in Active
Markets for
Identical Assets | | Level 2
Other
Significant
Observable
Inputs | | Level 3
Significant
Unobservable
Inputs | | Total | |
| Bonds | |
| Corporate Bonds & Notes | | $ | — | | | $ | 19,382,605 | | | $ | — | | | $ | 19,382,605 | | |
| Foreign Government Obligations | | | — | | | | 574,108 | | | | — | | | | 574,108 | | |
| Municipal Bonds | | | — | | | | 922,293 | | | | — | | | | 922,293 | | |
| Preferred Debt | | | 266,782 | | | | — | | | | — | | | | 266,782 | | |
| Total Bonds | | | 266,782 | | | | 20,879,006 | | | | — | | | | 21,145,788 | | |
| Investments in Securities | | | 266,782 | | | | 20,879,006 | | | | — | | | | 21,145,788 | | |
| Derivatives | |
| Assets | |
| Futures Contracts | | | 27,611 | | | | — | | | | — | | | | 27,611 | | |
| Liabilities | |
| Futures Contracts | | | (669 | ) | | | — | | | | — | | | | (669 | ) | |
| Total | | $ | 293,724 | | | $ | 20,879,006 | | | $ | — | | | $ | 21,172,730 | | |
The Portfolio's assets assigned to the Level 2 input category are generally valued using the market approach, in which a security's value is determined through reference to prices and information from market transactions for similar or identical assets.
There were no transfers of financial assets between Levels 1 and 2 during the period from April 1, 2011 to March 31, 2012.
Derivative instruments are valued at unrealized appreciation (depreciation).
The following table is a reconciliation of Level 3 assets for which significant observable and/or unobservable inputs were used to determine fair value.
| | | Corporate
Bonds & Notes | |
| Balance as of March 31, 2011 | | $ | 65,674 | | |
| Accrued discounts/premiums | | | — | | |
| Realized gain (loss) | | | — | | |
| Change in unrealized appreciation (depreciation)* | | | — | | |
| Sales | | | — | | |
| Purchases | | | — | | |
| Transfers into Level 3 | | | — | | |
| Transfers out of Level 3 | | | (65,674 | ) | |
| Balance as of March 31, 2012 | | $ | — | | |
Financial assets were transferred from Level 3 to Level 2 as observable market inputs were utilized and management's determination that there was sufficient, reliable and observable market data to value these assets as of period end.
Transfers in and/or out of Level 3 are determined based on the fair value at the beginning of the period for security positions held throughout the period.
The Accompanying Notes to Financial Statements are an integral part of this statement.
18
Portfolio of Investments – Mortgage- and Asset-Backed Portfolio
April 30, 2012
(Percentages represent value of investments compared to net assets)
| Issuer | | Coupon
Rate | | Principal
Amount | | Value | |
Residential Mortgage-Backed Securities –
Agency 71.1% | |
| Federal Home Loan Mortgage Corp.(a) | |
| 12/01/40 | | | 4.000 | % | | $ | 1,746,704 | | | $ | 1,854,143 | | |
| 05/01/38-06/01/40 | | | 5.500 | % | | | 373,143 | | | | 407,371 | | |
| 04/01/40 | | | 6.000 | % | | | 1,595,040 | | | | 1,762,332 | | |
| 11/01/32 | | | 6.500 | % | | | 4,755 | | | | 5,443 | | |
| Federal National Mortgage Association(a) | |
| 03/01/41-10/01/41 | | | 3.500 | % | | | 1,821,759 | | | | 1,893,739 | | |
| 11/01/40-02/01/41 | | | 4.000 | % | | | 9,068,855 | | | | 9,691,082 | | |
| 04/01/39-03/01/41 | | | 4.500 | % | | | 8,534,945 | | | | 9,250,279 | | |
| 06/01/40-07/01/40 | | | 5.000 | % | | | 6,094,777 | | | | 6,660,543 | | |
| 08/01/37 | | | 5.500 | % | | | 90,491 | | | | 99,643 | | |
| 10/01/37 | | | 6.500 | % | | | 149,631 | | | | 169,092 | | |
| 02/01/32 | | | 7.000 | % | | | 5,332 | | | | 6,348 | | |
| CMO Series 2011-79 Class AD | |
| 11/25/37 | | | 3.000 | % | | | 504,232 | | | | 522,684 | | |
| Federal National Mortgage Association(a)(b) | |
| 05/01/42 | | | 3.500 | % | | | 3,930,000 | | | | 4,080,445 | | |
| 05/01/42 | | | 4.000 | % | | | 2,750,000 | | | | 2,908,555 | | |
| Federal National Mortgage Association(a)(c) | |
| 04/01/41 | | | 4.500 | % | | | 2,498,939 | | | | 2,731,799 | | |
| Government National Mortgage Association(a) | |
| 06/15/39-03/15/41 | | | 4.500 | % | | | 1,768,247 | | | | 1,937,664 | | |
| 03/15/31 | | | 7.000 | % | | | 1,367 | | | | 1,641 | | |
| Government National Mortgage Association(a)(b) | |
| 05/01/42 | | | 3.500 | % | | | 1,250,000 | | | | 1,316,602 | | |
Total Residential Mortgage-Backed Securities – Agency
(Cost: $43,664,500) | | $ | 45,299,405 | | |
Residential Mortgage-Backed Securities –
Non-Agency 0.9% | |
BNPP Mortgage Securities LLC
CMO Series 2009-1 Class A1(a)(d) | |
| 08/27/37 | | | 6.000 | % | | $ | 73,882 | | | $ | 77,735 | | |
Morgan Stanley Mortgage Loan Trust
CMO Series 2007-6XS Class 2A1M(a)(e) | |
| 02/25/47 | | | 0.459 | % | | | 636,597 | | | | 68,705 | | |
Springleaf Mortgage Loan Trust
CMO Series 2012-1A Class A(a)(d)(e) | |
| 09/25/57 | | | 2.667 | % | | | 101,000 | | | | 101,000 | | |
Structured Asset Securities Corp.
CMO Series 2004-21XS Class 2A6A(a)(e) | |
| 12/25/34 | | | 4.740 | % | | | 318,944 | | | | 321,591 | | |
Total Residential Mortgage-Backed Securities – Non-Agency
(Cost: $1,139,255) | | $ | 569,031 | | |
| Commercial Mortgage-Backed Securities – Agency 5.0% | |
Federal Home Loan Mortgage Corp. Multifamily
Structured Pass-Through Certificates(a)
CMO Series K705 Class A2 | |
| 09/25/18 | | | 2.303 | % | | $ | 1,075,000 | | | $ | 1,100,561 | | |
| CMO Series K706 Class A2 | |
| 10/25/18 | | | 2.323 | % | | | 860,000 | | | | 880,353 | | |
| Issuer | | Coupon
Rate | | Principal
Amount | | Value | |
Commercial Mortgage-Backed Securities – Agency
(continued) | |
Federal Home Loan Mortgage Corp. Multifamily
Structured Pass-Through Certificates(a)(e)
CMO Series 20K011 Class A2 | |
| 12/25/20 | | | 4.186 | % | | $ | 475,000 | | | $ | 533,390 | | |
| Federal National Mortgage Association(a) | |
| 01/01/19 | | | 2.600 | % | | | 675,000 | | | | 700,049 | | |
Total Commercial Mortgage-Backed Securities – Agency
(Cost: $3,135,955) | | $ | 3,214,353 | | |
Commercial Mortgage-Backed Securities –
Non-Agency 20.0% | |
Banc of America Merrill Lynch Commercial Mortgage, Inc.(a)
Series 2005-3 Class A4 | |
| 07/10/43 | | | 4.668 | % | | $ | 330,000 | | | $ | 361,014 | | |
| Series 2005-4 Class A5A | |
| 07/10/45 | | | 4.933 | % | | | 182,000 | | | | 199,324 | | |
Bear Stearns Commercial Mortgage Securities(a)
Series 2003-T10 Class A2 | |
| 03/13/40 | | | 4.740 | % | | | 93,096 | | | | 94,789 | | |
| Series 2006-PW14 Class A4 | |
| 12/11/38 | | | 5.201 | % | | | 474,847 | | | | 533,701 | | |
| Series 2007-PW18 Class A4 | |
| 06/11/50 | | | 5.700 | % | | | 870,000 | | | | 999,661 | | |
Bear Stearns Commercial Mortgage Securities(a)(e)
Series 2004-T14 Class A4 | |
| 01/12/41 | | | 5.200 | % | | | 70,000 | | | | 74,011 | | |
| Series 2007-PW16 Class A4 | |
| 06/11/40 | | | 5.905 | % | | | 675,000 | | | | 773,552 | | |
Citigroup/Deutsche Bank Commercial Mortgage Trust
Series 2007-CD4 Class A4(a) | |
| 12/11/49 | | | 5.322 | % | | | 626,667 | | | | 695,156 | | |
Commercial Mortgage Pass-Through Certificates
Series 2004-LB2A Class A4(a) | |
| 03/10/39 | | | 4.715 | % | | | 593,976 | | | | 622,599 | | |
Credit Suisse Mortgage Capital Certificates(a)(e)
Series 2006-C1 Class AAB | |
| 02/15/39 | | | 5.596 | % | | | 36,332 | | | | 38,280 | | |
| Series 2006-C3 Class A3 | |
| 06/15/38 | | | 6.008 | % | | | 690,000 | | | | 784,735 | | |
GMAC Commercial Mortgage Securities, Inc.
CMO Series 2003-C2 Class A2(a)(e) | |
| 05/10/40 | | | 5.636 | % | | | 80,000 | | | | 83,760 | | |
Greenwich Capital Commercial Funding Corp.(a)
Series 2007-GG9 Class A4 | |
| 03/10/39 | | | 5.444 | % | | | 620,000 | | | | 686,088 | | |
Greenwich Capital Commercial Funding Corp.(a)(e)
Series 2005-GG3 Class A4 | |
| 08/10/42 | | | 4.799 | % | | | 140,000 | | | | 150,896 | | |
JPMorgan Chase Commercial Mortgage Securities Corp.(a)
Series 2003-C1 Class A2 | |
| 01/12/37 | | | 4.985 | % | | | 85,000 | | | | 86,575 | | |
| Series 2006-CB16 Class A4 | |
| 05/12/45 | | | 5.552 | % | | | 865,000 | | | | 973,659 | | |
The Accompanying Notes to Financial Statements are an integral part of this statement.
19
Mortgage- and Asset-Backed Portfolio
April 30, 2012
(Percentages represent value of investments compared to net assets)
| Issuer | | Coupon
Rate | | Principal
Amount | | Value | |
| Commercial Mortgage-Backed Securities – Non-Agency (continued) | |
JPMorgan Chase Commercial Mortgage Securities Corp.(a)(e)
Series 2003-CB6 Class A2 | |
| 07/12/37 | | | 5.255 | % | | $ | 30,000 | | | $ | 31,169 | | |
| Series 2005-LDP4 Class A4 | |
| 10/15/42 | | | 4.918 | % | | | 590,000 | | | | 640,018 | | |
| Series 2005-LDP5 Class A4 | |
| 12/15/44 | | | 5.372 | % | | | 560,000 | | | | 626,235 | | |
LB-UBS Commercial Mortgage Trust(a)
Series 2005-C3 Class A5 | |
| 07/15/30 | | | 4.739 | % | | | 275,000 | | | | 300,437 | | |
| Series 2007-C2 Class A3 | |
| 02/15/40 | | | 5.430 | % | | | 680,000 | | | | 751,133 | | |
Morgan Stanley Capital I(a)
Series 2003-IQ6 Class A4 | |
| 12/15/41 | | | 4.970 | % | | | 280,000 | | | | 294,359 | | |
| Series 2006-IQ12 Class A4 | |
| 12/15/43 | | | 5.332 | % | | | 844,566 | | | | 949,896 | | |
Wachovia Bank Commercial Mortgage Trust(a)
Series 2004-C10 Class A4 | |
| 02/15/41 | | | 4.748 | % | | | 230,372 | | | | 241,895 | | |
| Series 2006-C29 Class A4 | |
| 11/15/48 | | | 5.308 | % | | | 115,000 | | | | 128,915 | | |
Wachovia Bank Commercial Mortgage Trust(a)(e)
Series 2005-C22 Class A4 | |
| 12/15/44 | | | 5.443 | % | | | 770,000 | | | | 860,007 | | |
| Series 2006-C27 Class A3 | |
| 07/15/45 | | | 5.765 | % | | | 650,000 | | | | 735,030 | | |
Total Commercial Mortgage-Backed Securities – Non-Agency
(Cost: $11,997,033) | | $ | 12,716,894 | | |
| Asset-Backed Securities – Non-Agency 1.2% | |
BMW Vehicle Lease Trust
Series 2010-1 Class A3 | |
| 04/15/13 | | | 0.820 | % | | $ | 59,508 | | | $ | 59,556 | | |
CNH Equipment Trust
Series 2010-C Class A3 | |
| 05/15/15 | | | 1.170 | % | | | 125,133 | | | | 125,569 | | |
| Issuer | | Coupon
Rate | | Principal
Amount | | Value | |
| Asset-Backed Securities – Non-Agency (continued) | |
Citibank Credit Card Issuance Trust
Series 2008-C6 Class C6 | |
| 06/20/14 | | | 6.300 | % | | $ | 375,000 | | | $ | 377,817 | | |
Harley-Davidson Motorcycle Trust
Series 2010-1 Class A3 | |
| 02/15/15 | | | 1.160 | % | | | 100,000 | | | | 100,276 | | |
SACO I, Inc.
Series 2005-2 Class A(d)(e) | |
| 04/25/35 | | | 0.639 | % | | | 13,515 | | | | 5,923 | | |
SMART Trust
Series 2012-1USA Class A4A(d) | |
| 12/14/17 | | | 2.010 | % | | | 100,000 | | | | 99,915 | | |
Total Asset-Backed Securities – Non-Agency
(Cost: $787,428) | | $ | 769,056 | | |
| | | | | Shares | | Value | |
| Money Market Funds 0.1% | |
Columbia Short-Term Cash Fund,
0.144%(f)(g) | | | | | 94,498 | | | $ | 94,498 | | |
Total Money Market Funds
(Cost: $94,498) | | $ | 94,498 | | |
| Issuer | | Coupon
Rate | | Principal
Amount | | Value | |
| Treasury Note Short-Term 10.8% | |
| U.S. Treasury Bills(h) | |
| 05/10/12 | | | 0.000 | % | | $ | 2,870,000 | | | $ | 2,869,949 | | |
| 09/27/12 | | | 0.000 | % | | | 4,010,000 | | | | 4,007,887 | | |
Total Treasury Note Short-Term
(Cost: $6,877,726) | | $ | 6,877,836 | | |
Total Investments
(Cost: $67,696,395) | | | | | | | | | | $ | 69,541,073 | | |
| Other Assets & Liabilities, Net | | | | | | | | | | | (5,818,789 | ) | |
| Net Assets | | | | | | $ | 63,722,284 | | |
| Investment in Derivatives | |
Futures Contracts Outstanding at April 30, 2012
| Contract Description | | Number of
Contracts
Long (Short) | | Notional
Market Value | | Expiration
Date | | Unrealized
Appreciation | | Unrealized
Depreciation | |
| U.S. Treasury Note, 10-year | | | (40 | ) | | $ | (5,291,250 | ) | | June 2012 | | $ | — | | | $ | (66,298 | ) | |
| Total | | | | | | | | $ | — | | | $ | (66,298 | ) | |
| Notes to Portfolio of Investments | |
(a) The maturity dates shown represent the original maturity of the underlying obligation. Actual maturity may vary based upon prepayment activity on these obligations. Unless otherwise noted, the coupon rates presented are fixed rates.
(b) Represents a security purchased on a when-issued or delayed delivery basis.
The Accompanying Notes to Financial Statements are an integral part of this statement.
20
Mortgage- and Asset-Backed Portfolio
April 30, 2012
| Notes to Portfolio of Investments (continued) | |
(c) At April 30, 2012, investments in securities included securities valued at $198,893 that were partially pledged as collateral to cover initial margin deposits on open interest rate futures contracts.
(d) Security exempt from registration pursuant to Rule 144A under the Securities Act of 1933. This security may be resold in transactions exempt from registration, normally to qualified institutional buyers. At April 30, 2012, the value of these securities amounted to $284,573 or 0.45% of net assets.
(e) Variable rate security. The interest rate shown reflects the rate as of April 30, 2012.
(f) The rate shown is the seven-day current annualized yield at April 30, 2012.
(g) Investments in affiliates during the period ended April 30, 2012:
| Issuer | | Beginning
Cost | | Purchase
Cost | | Sales Cost/
Proceeds
from Sales | | Realized
Gain/Loss | | Ending
Cost | | Dividends
or Interest
Income | | Value | |
Columbia Short-Term
Cash Fund | | $ | 37,091 | | | $ | 1,228,736 | | | $ | (1,171,329 | ) | | $ | — | | | $ | 94,498 | | | $ | 21 | | | $ | 94,498 | | |
Investments in affiliates during the year ended March 31, 2012:
| Issuer | | Beginning
Cost | | Purchase
Cost | | Sales Cost/
Proceeds
from Sales | | Realized
Gain/Loss | | Ending
Cost | | Dividends
or Interest
Income | | Value | |
Columbia Short-Term
Cash Fund | | $ | — | | | $ | 24,642,995 | | | $ | (24,605,904 | ) | | $ | — | | | $ | 37,091 | | | $ | 981 | | | $ | 37,091 | | |
(h) Zero coupon bond.
CMO Collateralized Mortgage Obligation
Generally accepted accounting principles (GAAP) require disclosure regarding the inputs and valuation techniques used to measure fair value and any changes in valuation inputs or techniques. In addition, investments shall be disclosed by major category.
The Portfolio categorizes its fair value measurements according to a three-level hierarchy that maximizes the use of observable inputs and minimizes the use of unobservable inputs by prioritizing that the most observable input be used when available. Observable inputs are those that market participants would use in pricing an investment based on market data obtained from sources independent of the reporting entity. Unobservable inputs are those that reflect the Portfolio's assumptions about the information market participants would use in pricing an investment. An investment's level within the fair value hierarchy is based on the lowest level of any input that is deemed significant to the asset or liability's fair value measurement. The input levels are not necessarily an indication of the risk or liquidity associated with investments at that level. For example, certain U.S. government securities are generally high quality and liquid, however, they are reflected as Level 2 because the inputs used to determine fair value may not always be quoted prices in an active market.
Fair value inputs are summarized in the three broad levels listed below:
• Level 1 — Valuations based on quoted prices for investments in active markets that the Portfolio has the ability to access at the measurement date (including NAV for open-end mutual funds). Valuation adjustments are not applied to Level 1 investments.
• Level 2 — Valuations based on other significant observable inputs (including quoted prices for similar securities, interest rates, prepayment speeds, credit risks, etc.).
• Level 3 — Valuations based on significant unobservable inputs (including the Portfolio's own assumptions and judgment in determining the fair value of investments).
Inputs that are used in determining fair value of an investment may include price information, credit data, volatility statistics, and other factors. These inputs can be either observable or unobservable. The availability of observable inputs can vary between investments, and is affected by various factors such as the type of investment, and the volume and level of activity for that investment or similar investments in the marketplace. The inputs will be considered by the Investment Manager, along with any other relevant factors in the calculation of an investment's fair value. The Portfolio uses prices and inputs that are current as of the measurement date, which may include periods of market dislocations. During these periods, the availability of prices and inputs may be reduced for many investments. This condition could cause an investment to be reclassified between the various levels within the hierarchy.
Investments falling into the Level 3 category are primarily supported by quoted prices from brokers and dealers participating in the market for those investments. However, these may be classified as Level 3 investments due to lack of market transparency and corroboration to support these quoted prices. Additionally, valuation models may be used as the pricing source for any remaining investments classified as Level 3. These models rely on one or more significant unobservable inputs and/or significant assumptions by the Investment Manager. Inputs used in valuations may include, but are not limited to, financial statement analysis, capital account balances, discount rates and estimated cash flows, and comparable company data.
The Accompanying Notes to Financial Statements are an integral part of this statement.
21
Mortgage- and Asset-Backed Portfolio
April 30, 2012
| Fair Value Measurements (continued) | |
Under the direction of the Portfolio's Board of Trustees (the Board), the Investment Manager's Valuation Committee (the Committee) is responsible for carrying out the valuation procedures approved by the Board. The Committee consists of voting and non-voting members from various groups within the Investment Manager's organization, including operations and accounting, trading and investments, compliance, risk management and legal.
The Committee meets at least monthly to review and approve valuation matters, which may include a description of specific valuation determinations, data regarding pricing information received from approved pricing vendors and brokers and the results of Board-approved valuation control policies and procedures (the Policies). The Policies address, among other things, instances when market quotations are readily available, including recommendation of third party pricing vendors and a determination of appropriate pricing methodologies; events that require specific valuation determinations and assessment of fair value techniques; securities with a potential for stale pricing, including those that are illiquid, restricted, or in default; and the effectiveness of third-party pricing vendors, including periodic reviews of vendors. The Committee meets more frequently, as needed, to discuss additional valuation matters, which may include the need to review back-testing results, review time-sensitive information or approve related valuation actions. The Committee reports to the Board, with members of the Committee meeting with the Board at each of its regularly scheduled meetings to discuss valuation matters and actions during the period, similar to those described earlier.
For investments categorized as Level 3, the Committee monitors information similar to that described above, which may include: (i) data specific to the issuer or comparable issuers, (ii) general market or specific sector news and (iii) quoted prices and specific or similar security transactions. The Committee considers this data and any changes from prior periods in order to assess the reasonableness of observable and unobservable inputs, any assumptions or internal models used to value those securities and changes in fair value. This data is also used to corroborate, when available, information received from approved pricing vendors and brokers. Various factors impact the frequency of monitoring this information (which may occur as often as daily). However, the Committee may determine that changes to inputs, assumptions and models are not required as a result of the monitoring procedures performed.
The following table is a summary of the inputs used to value the Portfolio's investments as of April 30, 2012:
| | | Fair Value at April 30, 2012 | |
| Description | | Level 1
Quoted Prices
in Active
Markets for
Identical Assets | | Level 2
Other
Significant
Observable
Inputs | | Level 3
Significant
Unobservable
Inputs | | Total | |
| Bonds | |
| Residential Mortgage-Backed Securities — Agency | | $ | — | | | $ | 45,299,405 | | | $ | — | | | $ | 45,299,405 | | |
| Residential Mortgage-Backed Securities — Non-Agency | | | — | | | | 569,031 | | | | — | | | | 569,031 | | |
| Commercial Mortgage-Backed Securities — Agency | | | — | | | | 3,214,353 | | | | — | | | | 3,214,353 | | |
| Commercial Mortgage-Backed Securities — Non-Agency | | | — | | | | 12,716,894 | | | | — | | | | 12,716,894 | | |
| Asset-Backed Securities — Non-Agency | | | — | | | | 769,056 | | | | — | | | | 769,056 | | |
| Total Bonds | | | — | | | | 62,568,739 | | | | — | | | | 62,568,739 | | |
| Short-Term Securities | |
| Treasury Note Short-Term | | | 6,877,836 | | | | — | | | | — | | | | 6,877,836 | | |
| Total Short-Term Securities | | | 6,877,836 | | | | — | | | | — | | | | 6,877,836 | | |
| Other | |
| Money Market Funds | | | 94,498 | | | | — | | | | — | | | | 94,498 | | |
| Total Other | | | 94,498 | | | | — | | | | — | | | | 94,498 | | |
| Investments in Securities | | | 6,972,334 | | | | 62,568,739 | | | | — | | | | 69,541,073 | | |
| Derivatives | |
| Futures Contracts | | | (66,298 | ) | | | — | | | | — | | | | (66,298 | ) | |
| Total | | $ | 6,906,036 | | | $ | 62,568,739 | | | $ | — | | | $ | 69,474,775 | | |
See the Portfolio of Investments for all investment classifications not indicated in the table.
The Portfolio's assets assigned to the Level 2 input category are generally valued using the market approach, in which a security's value is determined through reference to prices and information from market transactions for similar or identical assets.
There were no transfers of financial assets between Levels 1 and 2 during the period from April 1, 2012 to April 30, 2012.
Derivative instruments are valued at unrealized appreciation (depreciation).
The Accompanying Notes to Financial Statements are an integral part of this statement.
22
Mortgage- and Asset-Backed Portfolio
April 30, 2012
| Fair Value Measurements (continued) | |
The following table is a summary of the inputs used to value the Portfolio's investments as of March 31, 2012:
| | | Fair Value at March 31, 2012 | |
| Description | | Level 1
Quoted Prices
in Active
Markets for
Identical Assets | | Level 2
Other
Significant
Observable
Inputs | | Level 3
Significant
Unobservable
Inputs | | Total | |
| Bonds | |
| Residential Mortgage-Backed Securities — Agency | | $ | — | | | $ | 45,752,845 | | | $ | — | | | $ | 45,752,845 | | |
| Residential Mortgage-Backed Securities — Non-Agency | | | — | | | | 475,199 | | | | — | | | | 475,199 | | |
| Commercial Mortgage-Backed Securities — Agency | | | — | | | | 3,169,550 | | | | — | | | | 3,169,550 | | |
| Commercial Mortgage-Backed Securities — Non-Agency | | | — | | | | 13,028,861 | | | | — | | | | 13,028,861 | | |
| Asset-Backed Securities — Non-Agency | | | — | | | | 840,987 | | | | — | | | | 840,987 | | |
| U.S. Treasury Obligations | | | 100,125 | | | | — | | | | — | | | | 100,125 | | |
| Total Bonds | | | 100,125 | | | | 63,267,442 | | | | — | | | | 63,367,567 | | |
| Short-Term Securities | |
| Treasury Note Short-Term | | | 5,972,844 | | | | — | | | | — | | | | 5,972,844 | | |
| Total Short-Term Securities | | | 5,972,844 | | | | — | | | | — | | | | 5,972,844 | | |
| Other | |
| Money Market Funds | | | 37,091 | | | | — | | | | — | | | | 37,091 | | |
| Total Other | | | 37,091 | | | | — | | | | — | | | | 37,091 | | |
| Investments in Securities | | | 6,110,060 | | | | 63,267,442 | | | | — | | | | 69,377,502 | | |
| Derivatives | |
| Assets | |
| Futures Contracts | | | 45,563 | | | | — | | | | — | | | | 45,563 | | |
| Total | | $ | 6,155,623 | | | $ | 63,267,442 | | | $ | — | | | $ | 69,423,065 | | |
The Portfolio's assets assigned to the Level 2 input category are generally valued using the market approach, in which a security's value is determined through reference to prices and information from market transactions for similar or identical assets.
There were no transfers of financial assets between Levels 1 and 2 during the period from April 1, 2011 to March 31, 2012.
Derivative instruments are valued at unrealized appreciation (depreciation).
The Accompanying Notes to Financial Statements are an integral part of this statement.
23
Statement of Assets and Liabilities – Fixed Income Sector Portfolios
| | | Corporate Bond Portfolio | |
| | | April 30,
2012 | | March 31,
2012 | |
| Assets | |
| Investments, at value | |
| Unaffiliated issuers (identified cost $19,782,430 and $19,711,538) | | $ | 21,425,102 | | | $ | 21,145,788 | | |
| Affiliated issuers (identified cost $120,157 and $—) | | | 120,157 | | | | — | | |
| Total investments (identified cost $19,902,587 and $19,711,538) | | | 21,545,259 | | | | 21,145,788 | | |
| Margin deposits on futures contracts | | | 26,759 | | | | 30,859 | | |
| Receivable for: | |
| Investments sold | | | — | | | | 5,289 | | |
| Dividends | | | 24 | | | | 1,892 | | |
| Interest | | | 265,248 | | | | 274,632 | | |
| Reclaims | | | 818 | | | | — | | |
| Variation margin on futures contracts | | | — | | | | 11,703 | | |
| Other assets | | | 3,302 | | | | 6,052 | | |
| Total assets | | | 21,841,410 | | | | 21,476,215 | | |
| Liabilities | |
| Disbursements in excess of cash | | | — | | | | 594 | | |
| Payable for: | |
| Investments purchased | | | — | | | | 6,334 | | |
| Variation margin on futures contracts | | | 1,266 | | | | — | | |
| Total liabilities | | | 1,266 | | | | 6,928 | | |
| Net assets applicable to outstanding capital stock | | $ | 21,840,144 | | | $ | 21,469,287 | | |
| Represented by | |
| Paid-in capital | | $ | 22,756,884 | | | $ | 22,548,029 | | |
| Undistributed net investment income | | | 42,174 | | | | 42,586 | | |
| Accumulated net realized loss | | | (2,571,772 | ) | | | (2,576,346 | ) | |
| Unrealized appreciation (depreciation) on: | |
| Investments | | | 1,642,672 | | | | 1,434,250 | | |
| Futures contracts | | | (20,889 | ) | | | 26,942 | | |
| Swap contracts | | | (8,925 | ) | | | (6,174 | ) | |
| Total — representing net assets applicable to outstanding capital stock | | $ | 21,840,144 | | | $ | 21,469,287 | | |
| Shares outstanding | | | 1,964,344 | | | | 1,945,464 | | |
| Net asset value per share | | $ | 11.12 | | | $ | 11.04 | | |
The Accompanying Notes to Financial Statements are an integral part of this statement.
24
Statement of Assets and Liabilities (continued) – Fixed Income Sector Portfolios
| | | Mortgage- and Asset-Backed Portfolio | |
| | | April 30,
2012 | | March 31,
2012 | |
| Assets | |
| Investments, at value | |
| Unaffiliated issuers (identified cost $67,601,897 and $67,912,429) | | $ | 69,446,575 | | | $ | 69,340,411 | | |
| Affiliated issuers (identified cost $94,498 and 37,091) | | | 94,498 | | | | 37,091 | | |
| Total investments (identified cost $67,696,395 and 67,949,520) | | | 69,541,073 | | | | 69,377,502 | | |
| Cash | | | — | | | | 26 | | |
| Receivable for: | |
| Investments sold | | | 2,228,436 | | | | — | | |
| Capital shares sold | | | 1,375 | | | | — | | |
| Dividends | | | 21 | | | | 187 | | |
| Interest | | | 215,136 | | | | 212,749 | | |
| Variation margin on futures contracts | | | — | | | | 20,250 | | |
| Total assets | | | 71,986,041 | | | | 69,610,714 | | |
| Liabilities | |
| Payable for: | |
| Investments purchased on a delayed delivery basis | | | 8,254,846 | | | | 6,184,358 | | |
| Capital shares purchased | | | 3,911 | | | | — | | |
| Variation margin on futures contracts | | | 5,000 | | | | — | | |
| Total liabilities | | | 8,263,757 | | | | 6,184,358 | | |
| Net assets applicable to outstanding capital stock | | $ | 63,722,284 | | | $ | 63,426,356 | | |
| Represented by | |
| Paid-in capital | | $ | 73,207,009 | | | $ | 73,281,738 | | |
| Undistributed net investment income | | | 116,040 | | | | 103,084 | | |
| Accumulated net realized loss | | | (11,379,145 | ) | | | (11,432,011 | ) | |
| Unrealized appreciation (depreciation) on: | |
| Investments | | | 1,844,678 | | | | 1,427,982 | | |
| Futures contracts | | | (66,298 | ) | | | 45,563 | | |
| Total — representing net assets applicable to outstanding capital stock | | $ | 63,722,284 | | | $ | 63,426,356 | | |
| Shares outstanding | | | 6,577,754 | | | | 6,585,406 | | |
| Net asset value per share | | $ | 9.69 | | | $ | 9.63 | | |
The Accompanying Notes to Financial Statements are an integral part of this statement.
25
Statement of Operations – Fixed Income Sector Portfolios
| | | Corporate Bond Portfolio | |
| Year ended | | April 30,
2012(a) | | March 31,
2012 | |
| Net investment income | |
| Income: | |
| Dividends | | $ | 2,367 | | | $ | 11,320 | | |
| Interest | | | 84,176 | | | | 1,005,862 | | |
| Dividends from affiliates | | | 24 | | | | 233 | | |
| Foreign taxes withheld | | | (290 | ) | | | — | | |
| Total income | | | 86,277 | | | | 1,017,415 | | |
| Net investment income | | | 86,277 | | | | 1,017,415 | | |
| Realized and unrealized gain (loss) — net | |
| Net realized gain (loss) on: | |
| Investments | | | 6,347 | | | | 529,859 | | |
| Futures contracts | | | (1,206 | ) | | | (118,697 | ) | |
| Swap contracts | | | — | | | | (8,638 | ) | |
| Net realized gain | | | 5,141 | | | | 402,524 | | |
| Net change in unrealized appreciation (depreciation) on: | |
| Investments | | | 208,422 | | | | 634,220 | | |
| Futures contracts | | | (47,831 | ) | | | 30,461 | | |
| Swap contracts | | | (2,751 | ) | | | 1,178 | | |
| Net change in unrealized appreciation | | | 157,840 | | | | 665,859 | | |
| Net realized and unrealized gain | | | 162,981 | | | | 1,068,383 | | |
| Net increase in net assets resulting from operations | | $ | 249,258 | | | $ | 2,085,798 | | |
(a) For the period from April 1, 2012 to April 30, 2012. During the period, the Portfolio's fiscal year end was changed from March 31 to April 30.
The Accompanying Notes to Financial Statements are an integral part of this statement.
26
Statement of Operations (continued) – Fixed Income Sector Portfolios
| | | Mortgage- and Asset-Backed
Portfolio | |
| Year ended | | April 30,
2012(a) | | March 31,
2012 | |
| Net investment income | |
| Income: | |
| Interest | | $ | 171,441 | | | $ | 3,178,658 | | |
| Dividends from affiliates | | | 21 | | | | 981 | | |
| Total income | | | 171,462 | | | | 3,179,639 | | |
| Expenses: | |
| Interest expense | | | — | | | | 352 | | |
| Total expenses | | | — | | | | 352 | | |
| Net investment income | | | 171,462 | | | | 3,179,287 | | |
| Realized and unrealized gain (loss) — net | |
| Net realized gain (loss) on: | |
| Investments | | | 56,303 | | | | 1,803,873 | | |
| Futures contracts | | | (3,403 | ) | | | (992,342 | ) | |
| Net realized gain | | | 52,900 | | | | 811,531 | | |
| Net change in unrealized appreciation (depreciation) on: | |
| Investments | | | 416,696 | | | | 1,472,894 | | |
| Futures contracts | | | (111,861 | ) | | | 46,391 | | |
| Net change in unrealized appreciation | | | 304,835 | | | | 1,519,285 | | |
| Net realized and unrealized gain | | | 357,735 | | | | 2,330,816 | | |
| Net increase in net assets resulting from operations | | $ | 529,197 | | | $ | 5,510,103 | | |
(a) For the period from April 1, 2012 to April 30, 2012. During the period, the Portfolio's fiscal year end was changed from March 31 to April 30.
The Accompanying Notes to Financial Statements are an integral part of this statement.
27
Statement of Changes in Net Assets – Fixed Income Sector Portfolios
| | | Corporate Bond Portfolio | |
| Year ended | | April 30,
2012(a) | | March 31,
2012 | | March 31,
2011 | |
| Operations | |
| Net investment income | | $ | 86,277 | | | $ | 1,017,415 | | | $ | 1,149,050 | | |
| Net realized gain | | | 5,141 | | | | 402,524 | | | | 794,746 | | |
| Net change in unrealized appreciation (depreciation) | | | 157,840 | | | | 665,859 | | | | (231,172 | ) | |
| Net increase in net assets resulting from operations | | | 249,258 | | | | 2,085,798 | | | | 1,712,624 | | |
| Distributions to shareholders from: | |
| Net investment income | | | (87,256 | ) | | | (1,050,300 | ) | | | (1,167,963 | ) | |
| Total distributions to shareholders | | | (87,256 | ) | | | (1,050,300 | ) | | | (1,167,963 | ) | |
| Increase (decrease) in net assets from share transactions | | | 208,855 | | | | (2,471,032 | ) | | | (1,471,501 | ) | |
| Total increase (decrease) in net assets | | | 370,857 | | | | (1,435,534 | ) | | | (926,840 | ) | |
| Net assets at beginning of year | | | 21,469,287 | | | | 22,904,821 | | | | 23,831,661 | | |
| Net assets at end of year | | $ | 21,840,144 | | | $ | 21,469,287 | | | $ | 22,904,821 | | |
| Undistributed net investment income | | $ | 42,174 | | | $ | 42,586 | | | $ | 73,292 | | |
| | | Corporate Bond Portfolio | |
| Year ended | | April 30, 2012(a) | | March 31, 2012 | | March 31, 2011 | |
| | | Shares | | Dollars ($) | | Shares | | Dollars ($) | | Shares | | Dollars ($) | |
| Capital stock activity | |
| Subscriptions | | | 18,880 | | | | 208,855 | | | | 236,242 | | | | 2,603,545 | | | | 300,583 | | | | 3,142,631 | | |
| Distributions reinvested | | | — | | | | — | | | | — | | | | — | | | | 296 | | | | 3,074 | | |
| Redemptions | | | — | | | | — | | | | (465,760 | ) | | | (5,074,577 | ) | | | (439,728 | ) | | | (4,617,206 | ) | |
| Total increase (decrease) | | | 18,880 | | | | 208,855 | | | | (229,518 | ) | | | (2,471,032 | ) | | | (138,849 | ) | | | (1,471,501 | ) | |
(a) For the period from April 1, 2012 to April 30, 2012. During the period, the Portfolio's fiscal year end was changed from March 31 to April 30.
The Accompanying Notes to Financial Statements are an integral part of this statement.
28
Statement of Changes in Net Assets (continued) – Fixed Income Sector Portfolios
| | | Mortgage- and Asset-Backed Portfolio | |
| Year ended | | April 30,
2012(a) | | March 31,
2012 | | March 31,
2011 | |
| Operations | |
| Net investment income | | $ | 171,462 | | | $ | 3,179,287 | | | $ | 1,444,145 | | |
| Net realized gain | | | 52,900 | | | | 811,531 | | | | 933,559 | | |
| Net change in unrealized appreciation (depreciation) | | | 304,835 | | | | 1,519,285 | | | | (307,747 | ) | |
| Net increase in net assets resulting from operations | | | 529,197 | | | | 5,510,103 | | | | 2,069,957 | | |
| Distributions to shareholders from: | |
| Net investment income | | | (158,540 | ) | | | (3,159,071 | ) | | | (1,417,691 | ) | |
| Total distributions to shareholders | | | (158,540 | ) | | | (3,159,071 | ) | | | (1,417,691 | ) | |
| Increase (decrease) in net assets from share transactions | | | (74,729 | ) | | | (21,056,516 | ) | | | 40,823,318 | | |
| Total increase (decrease) in net assets | | | 295,928 | | | | (18,705,484 | ) | | | 41,475,584 | | |
| Net assets at beginning of year | | | 63,426,356 | | | | 82,131,840 | | | | 40,656,256 | | |
| Net assets at end of year | | $ | 63,722,284 | | | $ | 63,426,356 | | | $ | 82,131,840 | | |
| Undistributed net investment income | | $ | 116,040 | | | $ | 103,084 | | | $ | 75,765 | | |
| | | Mortgage- and Asset-Backed Portfolio | |
| Year ended | | April 30, 2012(a) | | March 31, 2012 | | March 31, 2011 | |
| | | Shares | | Dollars ($) | | Shares | | Dollars ($) | | Shares | | Dollars ($) | |
| Capital stock activity | |
| Subscriptions | | | 33,940 | | | | 327,704 | | | | 3,414,442 | | | | 32,366,187 | | | | 5,402,346 | | | | 50,734,583 | | |
| Distributions reinvested | | | 7,903 | | | | 76,422 | | | | 208,362 | | | | 1,987,550 | | | | 33,563 | | | | 315,612 | | |
| Redemptions | | | (49,495 | ) | | | (478,855 | ) | | | (5,775,398 | ) | | | (55,410,253 | ) | | | (1,090,178 | ) | | | (10,226,877 | ) | |
| Total increase (decrease) | | | (7,652 | ) | | | (74,729 | ) | | | (2,152,594 | ) | | | (21,056,516 | ) | | | 4,345,731 | | | | 40,823,318 | | |
(a) For the period from April 1, 2012 to April 30, 2012. During the period, the Portfolio's fiscal year end was changed from March 31 to April 30.
The Accompanying Notes to Financial Statements are an integral part of this statement.
29
Financial Highlights – Fixed Income Sector Portfolios
The following tables are intended to help you understand the Portfolio's financial performance. Certain information reflects financial results for a single share of a class held for the periods shown. Per share net investment income (loss) amounts are calculated based on average shares outstanding during the period. Total returns assume reinvestment of all dividends and distributions. Total returns do not reflect payments of sales charges, if any, and are not annualized for periods of less than one year.
Corporate Bond Portfolio
| | | Year ended
April 30, | | Year ended March 31, | |
| | | 2012(a) | | 2012 | | 2011 | | 2010 | | 2009 | | 2008 | |
| Per share data | |
| Net asset value, beginning of period | | $ | 11.04 | | | $ | 10.53 | | | $ | 10.30 | | | $ | 8.64 | | | $ | 9.66 | | | $ | 10.06 | | |
| Income from investment operations: | |
| Net investment income (loss) | | | 0.04 | | | | 0.51 | | | | 0.56 | | | | 0.60 | | | | 0.56 | | | | 0.58 | | |
| Net realized and unrealized gain (loss) | | | 0.08 | | | | 0.53 | | | | 0.24 | | | | 1.65 | | | | (1.01 | ) | | | (0.40 | ) | |
| Total from investment operations | | | 0.12 | | | | 1.04 | | | | 0.80 | | | | 2.25 | | | | (0.45 | ) | | | 0.18 | | |
| Less distributions to shareholders from: | |
| Net investment income | | | (0.04 | ) | | | (0.53 | ) | | | (0.57 | ) | | | (0.59 | ) | | | (0.57 | ) | | | (0.58 | ) | |
| Total distributions to shareholders | | | (0.04 | ) | | | (0.53 | ) | | | (0.57 | ) | | | (0.59 | ) | | | (0.57 | ) | | | (0.58 | ) | |
| Net asset value, end of period | | $ | 11.12 | | | $ | 11.04 | | | $ | 10.53 | | | $ | 10.30 | | | $ | 8.64 | | | $ | 9.66 | | |
| Total return | | | 1.13 | % | | | 10.11 | % | | | 7.87 | % | | | 26.58 | % | | | (4.65 | %) | | | 1.81 | %(b) | |
| Ratios to average net assets(c) | |
| Total expenses (including interest expense) | | | — | | | | — | | | | 0.02 | % | | | — | | | | — | | | | — | | |
| Total expenses (excluding interest expense) | | | — | | | | — | | | | — | | | | — | | | | — | | | | — | | |
| Net investment income | | | 4.70 | %(d) | | | 4.76 | % | | | 5.28 | % | | | 6.14 | % | | | 6.10 | % | | | 5.84 | % | |
| Supplemental data | |
| Net assets, end of period (in thousands) | | $ | 21,840 | | | $ | 21,469 | | | $ | 22,905 | | | $ | 23,832 | | | $ | 19,555 | | | $ | 73,803 | | |
| Portfolio turnover | | | 0 | % | | | 83 | % | | | 132 | % | | | 146 | % | | | 137 | % | | | 189 | % | |
| Notes to Financial Highlights | |
(a) For the period from April 1, 2012 to April 30, 2012. During the period, the Portfolio's fiscal year end was changed from March 31 to April 30.
(b) During the year ended March 31, 2008, the Investment Manager reimbursed the Portfolio for a loss on a trading error. Had the Portfolio not received this reimbursement, total return would have been lower by less than 0.01%.
(c) Any expenses charged directly to shareholders are not included in the reported expense ratios.
(d) Annualized.
The Accompanying Notes to Financial Statements are an integral part of this statement.
30
Financial Highlights (continued) – Fixed Income Sector Portfolios
Mortgage- and Asset-Backed Portfolio
| | | Year ended
April 30, | | Year ended March 31, | |
| | | 2012(a) | | 2012 | | 2011 | | 2010 | | 2009 | | 2008 | |
| Per share data | |
| Net asset value, beginning of period | | $ | 9.63 | | | $ | 9.40 | | | $ | 9.26 | | | $ | 8.88 | | | $ | 9.32 | | | $ | 10.01 | | |
| Income from investment operations: | |
| Net investment income (loss) | | | 0.03 | | | | 0.35 | | | | 0.30 | | | | 0.38 | | | | 0.44 | | | | 0.54 | | |
| Net realized and unrealized gain (loss) | | | 0.05 | | | | 0.22 | | | | 0.14 | | | | 0.39 | | | | (0.44 | ) | | | (0.67 | ) | |
| Total from investment operations | | | 0.08 | | | | 0.57 | | | | 0.44 | | | | 0.77 | | | | — | | | | (0.13 | ) | |
| Less distributions to shareholders from: | |
| Net investment income | | | (0.02 | ) | | | (0.34 | ) | | | (0.30 | ) | | | (0.39 | ) | | | (0.44 | ) | | | (0.53 | ) | |
| Net realized gains | | | — | | | | — | | | | — | | | | — | | | | — | | | | (0.03 | ) | |
| Total distributions to shareholders | | | (0.02 | ) | | | (0.34 | ) | | | (0.30 | ) | | | (0.39 | ) | | | (0.44 | ) | | | (0.56 | ) | |
| Net asset value, end of period | | $ | 9.69 | | | $ | 9.63 | | | $ | 9.40 | | | $ | 9.26 | | | $ | 8.88 | | | $ | 9.32 | | |
| Total return | | | 0.87 | % | | | 6.21 | % | | | 4.82 | % | | | 8.79 | % | | | 0.10 | % | | | (1.34 | %) | |
| Ratios to average net assets(b) | |
| Total expenses (including interest expense) | | | — | | | | 0.00 | %(c) | | | — | | | | — | | | | — | | | | — | | |
| Total expenses (excluding interest expense) | | | — | | | | — | | | | — | | | | — | | | | — | | | | — | | |
| Net investment income | | | 3.18 | %(d) | | | 3.65 | % | | | 3.19 | % | | | 4.20 | % | | | 4.92 | % | | | 5.50 | % | |
| Supplemental data | |
| Net assets, end of period (in thousands) | | $ | 63,722 | | | $ | 63,426 | | | $ | 82,132 | | | $ | 40,656 | | | $ | 48,128 | | | $ | 138,196 | | |
| Portfolio turnover | | | 20 | %(e) | | | 114 | %(e) | | | 194 | % | | | 146 | % | | | 142 | % | | | 369 | % | |
| Notes to Financial Highlights | |
(a) For the period from April 1, 2012 to April 30, 2012. During the period, the Portfolio's fiscal year end was changed from March 31 to April 30.
(b) Any expenses charged directly to shareholders are not included in the reported expense ratios.
(c) Includes interest expense which rounds to less than 0.01%.
(d) Annualized.
(e) Includes mortgage dollar rolls. If mortgage dollar roll transactions were excluded, the portfolio turnover would have been 12% and 114% for the period ended April 30, 2012 and for the year ended March 31, 2012, respectively.
The Accompanying Notes to Financial Statements are an integral part of this statement.
31
Notes to Financial Statements – Fixed Income Sector Portfolios
April 30, 2012
Note 1. Organization
Columbia Funds Series Trust (the Trust) is registered under the Investment Company Act of 1940, as amended (the 1940 Act), as an open-end management investment company organized as a Delaware statutory trust. Information presented in these financial statements pertains to the following series of the Trust (each a Portfolio and collectively, the Portfolios): Corporate Bond Portfolio and Mortgage- and Asset-Backed Portfolio. Each Portfolio currently operates as a diversified portfolio.
Fiscal Year End Change
During the period, the Portfolios changed their fiscal year end from March 31 to April 30. Accordingly, this report includes activity for the period April 1, 2012 to April 30, 2012 and the year ended March 31, 2012.
Shares
The Trust may issue an unlimited number of shares (without par value). Shares of the Portfolios are available only to certain eligible investors through certain wrap fee programs, certain other managed accounts and certain registered investment companies, including those sponsored or managed by Ameriprise Financial, Inc. and certain of its affiliates.
Note 2. Summary of Significant Accounting Policies
Use of Estimates
The preparation of financial statements in accordance with U.S. generally accepted accounting principles (GAAP) requires management to make certain estimates and assumptions that affect the reported amounts of assets and liabilities, the disclosure of contingent assets and liabilities at the date of the financial statements and the reported amounts of revenue and expenses during the reporting period. Actual results could differ from those estimates.
The following is a summary of significant accounting policies consistently followed by the Portfolios in the preparation of their financial statements.
Security Valuation
All equity securities are valued at the close of business of the New York Stock Exchange (NYSE). Equity securities are valued at the last quoted sales price on the principal exchange or market on which they trade, except for securities traded on the NASDAQ Stock Market, which are valued at the NASDAQ official close price. Unlisted securities or listed securities for which there were no sales during the day are valued at the mean of the latest quoted bid and asked prices on such exchanges or markets.
Debt securities generally are valued by pricing services approved by the Board of Trustees (the Board) based upon market transactions for normal, institutional-size trading units of similar securities. The services may use various pricing techniques which take into account appropriate factors such as yield, quality, coupon rate, maturity, type of issue, trading characteristics and other data, as well as broker quotes. Debt securities for which quotations are readily available may also be valued based upon an over-the-counter or exchange bid quotation.
Asset and mortgage-backed securities are generally valued by pricing services, which utilize pricing models that incorporate the securities' cash flow and loan performance data. These models also take into account available market data, including trades, market quotations, and benchmark yield curves for identical or similar securities. Factors used to identify similar securities may include, but are not limited to, issuer, collateral type, vintage, prepayment speeds, collateral performance, credit ratings, credit enhancement and expected life. Asset-backed securities for which quotations are readily available may also be valued based upon an over-the-counter or exchange bid quotation.
Foreign securities are valued based on quotations from the principal market in which such securities are normally traded. If any foreign share prices are not readily available as a result of limited share activity the securities are valued at the mean of the latest quoted bid and asked prices on such exchanges or markets. Foreign currency exchange rates are generally determined at 4:00 p.m. Eastern (U.S.) time. However, many securities markets and exchanges outside the U.S. close prior to the close of the NYSE; therefore, the closing prices for securities in such markets or on such exchanges may not fully reflect events that occur after such close but before the close of the NYSE. In those situations, foreign securities will be fair valued pursuant to the policy adopted by the Board, including utilizing a third party pricing service to determine these fair values. The third party pricing service takes into
32
Fixed Income Sector Portfolios, April 30, 2012
account multiple factors, including, but not limited to, movements in the U.S. securities markets, certain depositary receipts, futures contracts and foreign exchange rates that have occurred subsequent to the close of the foreign exchange, to determine a good faith estimate that reasonably reflects the current market conditions as of the close of the NYSE. The fair value of a security is likely to be different from the quoted or published price, if available.
Investments in other open-end investment companies, including money market funds, are valued at net asset value.
Short-term securities purchased within 60 days to maturity are valued at amortized cost, which approximates market value. The value of short-term securities originally purchased with maturities greater than 60 days is determined based on an amortized value to par upon reaching 60 days to maturity. Short-term securities maturing in more than 60 days from the valuation date are valued at the market price or approximate market value based on current interest rates.
Futures and options on futures contracts are valued based upon the settlement price established each day by the board of trade or exchange on which they are traded.
Swap transactions are valued through an independent pricing service or broker, or if neither is available, through an internal model based upon observable inputs.
Investments for which market quotations are not readily available, or that have quotations which management believes are not reliable, are valued at fair value as determined in good faith under consistently applied procedures established by and under the general supervision of the Board. If a security or class of securities (such as foreign securities) is valued at fair value, such value is likely to be different from the last quoted market price for the security. The determination of fair value often requires significant judgment. To determine fair value, management may use assumptions including but not limited to future cash flows and estimated risk premiums. Multiple inputs from various sources may be used to determine value.
Derivative Instruments
The Portfolios invest in certain derivative instruments as detailed below to meet their investment objectives. Derivatives are instruments whose values depend on, or are derived from, in whole or in part, the value of one or more other assets, such as securities, currencies, commodities or indices. Derivative instruments may be used to maintain cash reserves while maintaining exposure to certain other assets, to offset anticipated declines in values of investments, to facilitate trading, to reduce transaction costs and to pursue higher investment returns. The Portfolios may also use derivative instruments to mitigate certain investment risks, such as foreign currency exchange rate risk, interest rate risk and credit risk. Derivatives may involve various risks, including the potential inability of the counterparty to fulfill its obligation under the terms of the contract, the potential for an illiquid secondary market and the potential for market movements which may expose the Portfolios to gains or losses in excess of the amount shown in the Statements of Assets and Liabilities.
The Portfolios and any counterparty are required to maintain an agreement that requires each Portfolio and that counterparty to monitor (on a daily basis) the net fair value of all derivatives entered into pursuant to the agreement between the Portfolio and such counterparty. If the net fair value of such derivatives between a Portfolio and that counterparty exceeds a certain threshold (as defined in the agreement), the Portfolio or the counterparty (as the case may be) is required to post cash and/or securities as collateral. Fair values of derivatives presented in the financial statements are not netted with the fair value of other derivatives or with any collateral amounts posted by each Portfolio or any counterparty.
Futures Contracts
Futures contracts represent commitments for the future purchase or sale of an asset at a specified price on a specified date. The Portfolios bought and sold futures contracts to manage the duration and yield curve exposure of the Portfolio versus the benchmark and manage exposure to movements in interest rates. Upon entering into futures contracts, the Portfolios bear risks which may include interest rates, exchange rates or securities prices moving unexpectedly, in which case, the Portfolios may not achieve the anticipated benefits of the futures contracts and may realize a loss. Additional risks include counterparty credit risk, the possibility of an illiquid market, and that a change in the value of the contract or option may not correlate with changes in the value of the underlying asset.
Upon entering into a futures contract, each Portfolio pledges cash or securities with the broker in an amount sufficient to
33
Fixed Income Sector Portfolios, April 30, 2012
meet the initial margin requirement. Subsequent payments (variation margin) are made or received by the Portfolios each day. The variation margin payments are equal to the daily change in the contract value and are recorded as variation margin receivable or payable and are offset in unrealized gains or losses. The Portfolios recognize a realized gain or loss when the contract is closed or expires. Futures contracts involve, to varying degrees, risk of loss in excess of the variation margin disclosed in the Statements of Assets and Liabilities.
Credit Default Swap Contracts
Credit default swap contracts are agreements in which one party pays fixed periodic payments to a counterparty in consideration for a guarantee from the counterparty to make a specific payment should a specified negative credit event(s) take place. Corporate Bond Portfolio entered into credit default swap contracts to increase or decrease its credit exposure to a single issuer of debt securities, increase or decrease its credit exposure to a specific debt security or a basket of debt securities. Additionally, credit default swap contracts were used to hedge the Portfolio's exposure on a debt security that it owns or in lieu of selling such debt security.
As the purchaser of a credit default swap contract, the Portfolio purchases protection by paying a periodic interest rate on the notional amount to the counterparty. The interest amount is accrued daily as a component of unrealized appreciation (depreciation) and is recorded as a realized loss upon payment. If a credit event as specified in the contract occurs, the Portfolio may have the option either to deliver the reference obligation to the seller in exchange for a cash payment of its par amount, or to receive a net cash settlement equal to the par amount less an agreed-upon value of the reference obligation as of the date of the credit event. The difference between the value of the obligation or cash delivered and the notional amount received will be recorded as a realized gain (loss).
As the seller of a credit default swap contract, the Portfolio sells protection to a buyer and will generally receive a periodic interest rate on the notional amount. The interest amount is accrued daily as a component of unrealized appreciation (depreciation) and is recorded as a realized gain upon receipt of the payment. If a credit event as specified in the contract occurs, the Portfolio may either be required to accept the reference obligation from the buyer in exchange for a cash payment of its notional amount, or to pay the buyer a net cash settlement equal to the notional amount less an agreed-upon value of the reference obligation as of the date of the credit event. The difference between the value of the obligation or cash received and the notional amount paid will be recorded as a realized gain (loss). The maximum potential amount of undiscounted future payments the Portfolio could be required to make as the seller of protection under a credit default swap contract is equal to the notional amount of the reference obligation. Notional amounts of all credit default swap contracts outstanding for which the Portfolio is the seller of protection, if any, are disclosed in the Credit Default Swap Contracts Outstanding schedule following the Portfolios of Investments. These potential amounts may be partially offset by any recovery values of the respective reference obligations or premiums received upon entering into the agreement.
As a protection seller, the Portfolio bears the risk of loss from the credit events specified in the contract. Although specified events are contract specific, credit events are generally defined as bankruptcy, failure to pay, restructuring, obligation acceleration, obligation default, or repudiation/moratorium. For credit default swap contracts on credit indices, quoted market prices and resulting market values serve as an indicator of the current status of the payment/performance risk. Increasing market values, in absolute terms when compared to the notional amount of the swap, represent a deterioration of the reference entity's credit soundness and a greater likelihood or risk of default or other credit event occurring as defined under the terms of the contract. Market values for credit default swap contracts in which the Portfolio is the seller of protection, if any, are disclosed in the Credit Default Swap Contracts Outstanding schedule following the Portfolios of Investments.
The notional amounts and market values of credit default swap contracts are not recorded in the financial statements. Any premium paid or received by the Portfolio upon entering into a credit default swap contract is recorded as an asset or liability, respectively, and amortized daily as a component of realized gain (loss) in the Statements of Operations. Credit default swap contracts are valued daily, and the change in value is recorded as unrealized appreciation (depreciation)
34
Fixed Income Sector Portfolios, April 30, 2012
until the termination of the swap, at which time a realized gain (loss) is recorded.
Credit default swap contracts can involve greater risks than if the Portfolio had invested in the reference obligation directly since, in addition to general market risks, credit default swaps are subject to counterparty credit risk, leverage risk, hedging risk, correlation risk and liquidity risk. The Portfolio will enter into credit default swap transactions only with counterparties that meet certain standards of creditworthiness.
Effects of Derivative Transactions in the Financial Statements
The following tables are intended to provide additional information about the effect of derivatives on the financial statements of the Portfolios including: the fair value of derivatives by risk category and the location of those fair values in the Statements of Assets and Liabilities; the impact of derivative transactions on each Portfolio's operations over the period including realized gains or losses and unrealized gains or losses. The derivative schedules following each Portfolio of Investments present additional information regarding derivative instruments outstanding at April 30, 2012 and March 31, 2012, if any.
Corporate Bond Portfolio
| Fair Values of Derivative Instruments at April 30, 2012 | |
| | | Asset Derivatives | | Liability Derivatives | |
| Risk Exposure Category | | Statement of Assets
and Liabilities Location | | Fair Value | | Statement of Assets
and Liabilities Location | | Fair Value | |
Interest rate contracts
| | Net assets—unrealized
appreciation on futures
contracts | | $ | 2,175 | * | | Net assets—unrealized
depreciation on futures
contracts | | $ | 23,064 | * | |
* Includes cumulative appreciation (depreciation) of futures contracts as reported in the Futures Contracts Outstanding table following the Portfolio of Investments. Only the current day's variation margin is reported in receivables or payables in the Statement of Assets and Liabilities.
Effect of Derivative Instruments in the Statement of Operations for the Period Ended April 30, 2012
Amount of Realized Gain (Loss) on Derivatives Recognized in Income
| Risk Exposure Category | | Futures Contracts | |
| Interest rate contracts | | $ | (1,206 | ) | |
Change in Unrealized Appreciation (Depreciation) on Derivatives Recognized in Income
| Risk Exposure Category | | Futures Contracts | |
| Interest rate contracts | | $ | (47,831 | ) | |
| Volume of Derivative Instruments for the Period Ended April 30, 2012 | |
| | | Contracts
Opened | |
| Futures Contracts | | | — | | |
35
Fixed Income Sector Portfolios, April 30, 2012
| Fair Values of Derivative Instruments at March 31, 2012 | |
| | | Asset Derivatives | | Liability Derivatives | |
| Risk Exposure Category | | Statement of Assets
and Liabilities Location | | Fair Value | | Statement of Assets
and Liabilities Location | | Fair Value | |
Interest rate contracts
| | Net assets—unrealized
appreciation on futures
contracts | | $ | 27,611 | * | | Net assets—unrealized
depreciation on futures
contracts | | $ | 669 | * | |
* Includes cumulative appreciation (depreciation) of futures contracts as reported in the Futures Contracts Outstanding table in the Statement of Assets and Liabilities. Only the current day's variation margin is reported in receivables or payables in the Statement of Assets and Liabilities.
Effect of Derivative Instruments in the Statement of Operations for the Year Ended March 31, 2012
Amount of Realized Gain (Loss) on Derivatives Recognized in Income
| Risk Exposure Category | | Futures Contracts | | Swap Contracts | | Total | |
| Credit contracts | | $ | — | | | $ | (8,638 | ) | | $ | (8,638 | ) | |
| Interest rate contracts | | | (118,697 | ) | | | — | | | $ | (118,697 | ) | |
| Total | | $ | (118,697 | ) | | $ | (8,638 | ) | | $ | (127,335 | ) | |
Change in Unrealized Appreciation (Depreciation) on Derivatives Recognized in Income
| Risk Exposure Category | | Futures Contracts | | Swap Contracts | | Total | |
| Credit contracts | | $ | — | | | $ | 505 | | | $ | 505 | | |
| Interest rate contracts | | | 30,461 | | | | — | | | $ | 30,461 | | |
| Total | | $ | 30,461 | | | $ | 505 | | | $ | 30,966 | | |
Volume of Derivative Instruments for the Year Ended March 31, 2012
| | | Contracts
Opened | |
| Futures Contracts | | | 143 | | |
| | | Aggregate
Notional Opened | |
Credit Default Swap
Contracts—Buy Protection | | $ | 2,565,000 | | |
Credit Default Swap
Contracts—Sell Protection | | $ | 540,000 | | |
36
Fixed Income Sector Portfolios, April 30, 2012
Mortgage- and Asset-Backed Portfolio
Fair Values of Derivative Instruments at April 30, 2012
| | | Liability Derivatives | |
Risk Exposure
Category | | Statement of Assets
and Liabilities Location | |
Fair Value | |
Interest rate
contracts
| | Net assets—unrealized
depreciation on futures
contracts | | $ | 66,298 | * | |
* Includes cumulative appreciation (depreciation) of futures contracts as reported in the Futures Contracts Outstanding table following the Portfolio of Investments. Only the current day's variation margin is reported in receivables or payables in the Statement of Assets and Liabilities.
Effect of Derivative Instruments in the Statement of Operations for the Period Ended April 30, 2012
Amount of Realized Gain (Loss) on Derivatives Recognized in Income
| Risk Exposure Category | | Futures Contracts | |
| Interest rate contracts | | $ | (3,403 | ) | |
Change in Unrealized Appreciation (Depreciation) on Derivatives Recognized in Income
| Risk Exposure Category | | Futures Contracts | |
| Interest rate contracts | | $ | (111,861 | ) | |
Volume of Derivative Instruments for the Period Ended April 30, 2012
| | | Contracts
Opened | |
| Futures Contracts | | | — | | |
Fair Values of Derivative Instruments at March 31, 2012
| | | Asset Derivatives | |
Risk Exposure
Category | | Statement of Assets
and Liabilities Location | | Fair Value | |
Interest rate
contracts
| | Net assets—unrealized
appreciation on futures
contracts | | $ | 45,563 | * | |
* Includes cumulative appreciation (depreciation) of futures contracts as reported in the Futures Contracts Outstanding table in the Statement of Assets and Liabilities. Only the current day's variation margin is reported in receivables or payables in the Statement of Assets and Liabilities.
Effect of Derivative Instruments in the Statement of Operations for the Year Ended March 31, 2012
Amount of Realized Gain (Loss) on Derivatives Recognized in Income
| Risk Exposure Category | | Futures Contracts | |
| Interest rate contracts | | $ | (992,342 | ) | |
Change in Unrealized Appreciation (Depreciation) on Derivatives Recognized in Income
| Risk Exposure Category | | Futures Contracts | |
| Interest rate contracts | | $ | 46,391 | | |
Volume of Derivative Instruments for the Year Ended March 31, 2012
| | | Contracts
Opened | |
| Futures Contracts | | | 436 | | |
Delayed Delivery Securities
The Portfolios may trade securities on other than normal settlement terms, including securities purchased or sold on a "when-issued" basis. This may increase the risk if the other party to the transaction fails to deliver and causes the Portfolios to subsequently invest at less advantageous prices. Each Portfolio identifies within its Portfolio of Investments cash or liquid securities in an amount equal to the delayed delivery commitment.
Mortgage Dollar Roll Transactions
Certain Portfolios may enter into mortgage "dollar rolls" in which the Portfolio sells securities for delivery in the current month and simultaneously contracts with the same counterparty to repurchase similar (same type, coupon and maturity) but not identical securities on a specified future date not exceeding 120 days. During the roll period, the Portfolio loses the right to receive principal and interest paid on the securities sold. However, the Portfolio will benefit because it receives negotiated amounts in the form of reductions of the purchase price for the future purchase plus the interest earned on the cash proceeds of the securities sold until the settlement date of the forward purchase. The Portfolio records the incremental difference between the forward purchase and sale of each forward roll as a realized gain or loss. Unless any
37
Fixed Income Sector Portfolios, April 30, 2012
realized gains exceed the income, capital appreciation, and gain or loss due to mortgage prepayments that would have been realized on the securities sold as part of the mortgage dollar roll, the use of this technique will diminish the investment performance of the Portfolio compared to what the performance would have been without the use of mortgage dollar rolls. All cash proceeds will be invested in instruments that are permissible investments for the Portfolio. The Portfolio identifies within its Portfolio of Investments cash or liquid securities in an amount equal to the forward purchase price.
For financial reporting and tax purposes, the Portfolio treats "to be announced" mortgage dollar rolls as two separate transactions, one involving the purchase of a security and a separate transaction involving a sale. This treatment may exaggerate the Portfolio's portfolio turnover rate. The Portfolio does not currently enter into mortgage dollar rolls that are accounted for as financing transactions.
Mortgage dollar rolls involve certain risks. If the broker-dealer to whom the Portfolio sells the securities becomes insolvent, the Portfolio's right to purchase or repurchase the mortgage-related securities may be restricted and the instruments which the Portfolio is required to repurchase may be worth less than instruments which the Portfolio originally held. Successful use of mortgage dollar rolls may depend upon the Investment Manager's ability to predict interest rates and mortgage prepayments. For these reasons, there is no assurance that mortgage dollar rolls can be successfully employed.
Security Transactions
Security transactions are accounted for on the trade date. Cost is determined and gains (losses) are based upon the specific identification method for both financial statement and federal income tax purposes.
Income Recognition
Interest income is recorded on the accrual basis. Market premium and discount are amortized and accreted, respectively, on all debt securities, unless otherwise noted. Original issue discount is accreted to interest income over the life of the security with a corresponding increase in the cost basis, if any. For convertible securities, premiums attributable to the conversion feature are not amortized.
Corporate actions and dividend income are recorded net of any non-reclaimable tax withholdings, on the ex-dividend date or upon receipt of ex-dividend notification in the case of certain foreign securities.
Interest income is recorded on the accrual basis and includes accretion of discounts, amortization of premiums and paydown gains and losses. Fee income attributable to mortgage dollar roll transactions is recorded on the accrual basis over the term of the transaction. The value of additional securities received as an income payment is recorded as income and as the cost basis of such securities.
Expenses
General expenses of the Trust are allocated to the Portfolios and other series of the Trust based upon relative net assets or other expense allocation methodologies determined by the nature of the expense. Expenses directly attributable to a Portfolio are charged to such Portfolio.
Federal Income Tax Status
For federal income tax purposes, each Portfolio is treated as a separate entity. The Portfolios intend to qualify each year as separate regulated investment companies under Subchapter M of the Internal Revenue Code, as amended, and will distribute substantially all of their taxable income for their tax year, and as such will not be subject to federal income taxes. In addition, the Portfolios intend to distribute in each calendar year substantially all of their net investment income, capital gains and certain other amounts, if any, such that the Portfolios should not be subject to federal excise tax. Therefore, no federal income or excise tax provisions are recorded.
Foreign Taxes
The Portfolios may be subject to foreign taxes on income, gains on investments or currency repatriation, a portion of which may be recoverable. The Portfolios will accrue such taxes and recoveries, as applicable, based upon its current interpretation of tax rules and regulations that exist in the markets in which it invests.
Realized gains in certain countries may be subject to foreign taxes at the Portfolio level, based on statutory rates. The Portfolio accrues for such foreign taxes on net realized and unrealized gains at the appropriate rate for each jurisdiction, as applicable.
Distributions to Shareholders
Distributions from net investment income are declared and paid monthly. Net realized capital gains, if any, are distributed
38
along with the income dividend. Income distributions and capital gain distributions are determined in accordance with federal income tax regulations which may differ from GAAP.
Guarantees and Indemnifications
Under the Trust's organizational documents and, in some cases by contract, their officers and trustees are indemnified against certain liabilities arising out of the performance of their duties to the Trust or its funds. In addition, certain of the Portfolios' contracts with their service providers contain general indemnification clauses. The Portfolios' maximum exposure under these arrangements is unknown since the amount of any future claims that may be made against the Portfolios cannot be determined, and the Portfolios have no historical basis for predicting the likelihood of any such claims.
Note 3. Fees and Compensation Paid to Affiliates
Investment Management Fees
Under an Investment Management Services Agreement (IMSA), Columbia Management Investment Advisers, LLC (the Investment Manager), a wholly-owned subsidiary of Ameriprise Financial, Inc. (Ameriprise Financial), determines which securities will be purchased, held or sold. Under the IMSA, the Investment Manager does not receive any compensation from the Portfolios for its investment management services.
The Portfolios do not incur any fees or expenses except brokerage fees and commissions, taxes, interest expense and extraordinary expenses. Participants in the wrap fee program eligible to invest in the Portfolios are required to pay fees to the program sponsor pursuant to separate agreements and should review the wrap program disclosure document for fees and expenses charged.
Administration Fees
Under an Administrative Services Agreement, the Investment Manager serves as the Portfolio Administrator. The Portfolio Administrator does not receive any compensation from the Portfolios for its administration and accounting services.
Transfer Agent Fees
Under a Transfer Agency Agreement, Columbia Management Investment Services Corp. (the Transfer Agent), an affiliate of the Investment Manager and a wholly-owned subsidiary of Ameriprise Financial, is responsible for providing transfer agency services to the Portfolios. The Transfer Agent has contracted with Boston Financial Data Services (BFDS) to serve as sub-transfer agent. The Transfer Agent pays the fees of BFDS for services as sub-transfer agent and is not entitled to reimbursement for such fees from the Portfolios. The Transfer Agent does not receive any compensation from the Portfolios for its services.
Distribution and Service Fees
The Portfolios have an agreement with Columbia Management Investment Distributors, Inc. (the Distributor), an affiliate of the Investment Manager and a wholly-owned subsidiary of Ameriprise Financial, for distribution and shareholder services. The Distributor does not receive any compensation from the Portfolios for its services
Note 4. Federal Tax Information
The timing and character of income and capital gain distributions are determined in accordance with income tax regulations, which may differ from GAAP because of temporary or permanent book to tax differences.
For the period April 1, 2012 to April 30, 2012, these differences are primarily due to differing treatment of capital loss carryforwards, deferral/reversal of wash sales, paydown reclassification, adjustments on certain convertible preferred securities and recognition of unrealized appreciation (depreciation) for certain derivative investments. For the year ended March 31, 2012, these differences are primarily due to deferral/reversal of wash sales, capital loss carryforwards, defaulted bonds and recognition of unrealized appreciation (depreciation) for certain derivative investments. To the extent these differences are permanent, reclassifications are made among the components of the Portfolio's net assets in the Statement of Assets and Liabilities. Temporary differences do not require reclassifications. In the Statement of Assets and Liabilities the following reclassifications were made:
| Corporate Bond Portfolio | | Period ended
April 30,
2012 | | Year ended
March 31,
2012 | |
Undistributed net investment
income | | $ | 567 | | | $ | 2,179 | | |
Accumulated net realized
loss | | | (567 | ) | | | (2,179 | ) | |
| Paid-in capital | | | — | | | | — | | |
Fixed Income Sector Portfolios, April 30, 2012
39
Fixed Income Sector Portfolios, April 30, 2012
Mortgage- and
Asset-Backed Portfolio | | Period ended
April 30,
2012 | | Year ended
March 31,
2012 | |
Undistributed net investment
income | | $ | 34 | | | $ | 7,103 | | |
Accumulated net realized
loss | | | (34 | ) | | | (7,103 | ) | |
| Paid-in capital | | | — | | | | — | | |
Net investment income and net realized gains (losses), as disclosed in the Statement of Operations, and net assets were not affected by this reclassification.
The tax character of distributions paid during the periods indicated was as follows:
Corporate
Bond Portfolio | | Period ended
April 30,
2012 | | Year ended
March 31,
2012 | | Year ended
March 31,
2011 | |
| Ordinary income | | $ | 87,256 | | | $ | 1,050,300 | | | $ | 1,167,963 | | |
Mortgage- and
Asset-Backed
Portfolio | | Period ended
April 30,
2012 | | Year ended
March 31,
2012 | | Year ended
March 31,
2011 | |
| Ordinary income | | $ | 158,540 | | | $ | 3,159,071 | | | $ | 1,417,691 | | |
Short-term capital gain distributions, if any, are considered ordinary income distributions for tax purposes.
At April 30, 2012 and March 31, 2012, the components of distributable earnings on a tax basis were as follows:
| Corporate Bond Portfolio | | April 30,
2012 | | March 31,
2012 | |
| Undistributed ordinary income | | $ | 42,174 | | | $ | 44,165 | | |
Undistributed accumulated
long-term gain | | | — | | | | — | | |
| Unrealized appreciation | | | 1,628,676 | | | | 1,420,254 | | |
Mortgage- and
Asset-Backed Portfolio | | April 30,
2012 | | March 31,
2012 | |
| Undistributed ordinary income | | $ | 116,041 | | | $ | 103,087 | | |
Undistributed accumulated
long-term gain | | | — | | | | — | | |
| Unrealized appreciation | | | 1,844,678 | | | | 1,427,982 | | |
At April 30, 2012 and March 31, 2012, the cost of investments for federal income tax purposes, and the aggregate unrealized appreciation and depreciation based on that cost was as follows:
| Corporate Bond Portfolio | | April 30,
2012 | | March 31,
2012 | |
Aggregate unrealized
appreciation | | $ | 1,699,906 | | | $ | 1,504,231 | | |
Aggregate unrealized
depreciation | | | (71,230 | ) | | | (83,977 | ) | |
| Net unrealized appreciation | | $ | 1,628,676 | | | $ | 1,420,254 | | |
Cost of investments for
tax purposes | | $ | 19,916,583 | | | $ | 19,725,534 | | |
Mortgage- and
Asset-Backed Portfolio | | April 30,
2012 | | March 31,
2012 | |
Aggregate unrealized
appreciation | | $ | 2,441,738 | | | $ | 2,055,852 | | |
Aggregate unrealized
depreciation | | | (597,060 | ) | | | (627,870 | ) | |
| Net unrealized appreciation | | $ | 1,844,678 | | | $ | 1,427,982 | | |
Cost of investments for
tax purposes | | $ | 67,696,395 | | | $ | 67,949,520 | | |
The following capital loss carryforward, determined at April 30, 2012 and March 31, 2012, may be available to reduce taxable income arising from future net realized gains on investments, if any, to the extent permitted by the Internal Revenue Code:
| Corporate Bond Portfolio | | April 30, | | March 31, | |
| | | 2012 | | 2012 | |
| Year of Expiration | | Amount | | Amount | |
| | 2015 | | | $ | 189,825 | | | $ | — | | |
| | 2016 | | | | 2,121,554 | | | | 189,825 | | |
| | 2017 | | | | 224,029 | | | | 2,121,554 | | |
| | 2018 | | | | — | | | | 224,029 | | |
| | Unlimited short-term | | | | 19,512 | | | | — | | |
| | Unlimited long-term | | | | 23,745 | | | | — | | |
| | Total | | | $ | 2,578,665 | | | $ | 2,535,408 | | |
40
Fixed Income Sector Portfolios, April 30, 2012
Mortgage- and
Asset-Backed Portfolio | | April 30,
2012 | | March 31,
2012 | |
| Year of Expiration | | Amount | | Amount | |
| 2016 | | $ | 11,386,448 | | | $ | — | | |
| 2017 | | | — | | | | 11,386,448 | | |
| Unlimited short-term | | | 39,618 | | | | — | | |
| Unlimited long-term | | | 19,376 | | | | — | | |
| Total | | $ | 11,445,442 | | | $ | 11,386,448 | | |
On December 22, 2010, the Regulated Investment Company Modernization Act of 2010 (the Act) was enacted, which changed various technical rules governing the tax treatment of regulated investment companies. The changes are generally effective for taxable years beginning after the date of enactment. Under the Act, the Portfolios will be permitted to carry forward capital losses incurred in taxable years beginning after the date of enactment for an unlimited period. However, any losses incurred during those future taxable years will be required to be utilized prior to the losses incurred in pre-enactment taxable years, which carry an expiration date. As a result of this ordering rule, pre-enactment capital loss carryforwards may be more likely to expire unused.
For the year ended March 31, 2012, capital loss carryforwards of $405,209 for Corporate Bond Portfolio and $847,120 for Mortgage- and Asset-Backed Portfolio were utilized.
Management of the Portfolios has concluded that there are no significant uncertain tax positions that would require recognition in the financial statements. However, management's conclusion may be subject to review and adjustment at a later date based on factors including, but not limited to, new tax laws, regulations, and administrative interpretations (including relevant court decisions). Generally, the Portfolios' federal tax returns for the prior three fiscal years remain subject to examination by the Internal Revenue Service.
Note 5. Portfolio Information
For the period ended April 30, 2012, the cost of purchases and proceeds from sales of securities, including U.S. government securities and any applicable mortgage dollar rolls, but excluding short-term obligations, for each Portfolio aggregated to:
| Portfolio | | Purchases | | Proceeds | | Purchases of U.S.
Government Securities | | Proceeds of U.S.
Government Securities | |
| Corporate Bond Portfolio | | $ | 170,967 | | | $ | 101,881 | | | $ | 45,045 | | | $ | — | | |
| Mortgage- and Asset-Backed Portfolio | | | 12,321,406 | | | | 13,564,114 | | | | 12,220,408 | | | | 13,136,711 | | |
For the year ended March 31, 2012, the cost of purchases and proceeds from sales of securities, including U.S. government securities and any applicable mortgage dollar rolls, but excluding short-term obligations, for each Portfolio aggregated to:
| Portfolio | | Purchases | | Proceeds | | Purchases of U.S.
Government Securities | | Proceeds of U.S.
Government Securities | |
| Corporate Bond Portfolio | | $ | 17,603,539 | | | $ | 19,969,249 | | | $ | 5,788,235 | | | $ | 6,346,828 | | |
| Mortgage- and Asset-Backed Portfolio | | | 97,673,244 | | | | 117,003,519 | | | | 79,676,967 | | | | 115,151,659 | | |
41
Fixed Income Sector Portfolios, April 30, 2012
Note 6. Shareholder Concentration
The table below details the affiliated and significant unaffiliated shareholder account ownership of outstanding shares of each Portfolio. For affiliated ownership, subscription and redemption activity of these accounts may have a significant effect on the operations of the Portfolio. For unaffiliated shares, the Portfolio has no knowledge about whether any portion of those shares was owned beneficially.
| | | April 30, 2012 | | March 31, 2012 | |
| Portfolio | | Number of
unaffiliated
accounts | | Percentage
of shares
outstanding
held—
unaffiliated | | Percentage
of shares
outstanding
held—
affiliated | | Number of
unaffiliated
accounts | | Percentage
of shares
outstanding
held—
unaffiliated | | Percentage
of shares
outstanding
held—
affiliated | |
| Corporate Bond Portfolio | | | 1 | | | | 100 | % | | | — | | | | 1 | | | | 100 | % | | | — | | |
| Mortgage- and Asset-Backed Portfolio | | | 1 | | | | 51.7 | % | | | 48.3 | % | | | 1 | | | | 51.2 | % | | | 48.8 | % | |
Note 7. Line of Credit
The Portfolios have entered into a revolving credit facility with a syndicate of banks led by JPMorgan Chase Bank, N.A. (the Administrative Agent), whereby each Portfolio may borrow for the temporary funding of shareholder redemptions or for other temporary or emergency purposes. The credit facility became effective on June 27, 2011 for Corporate Bond Portfolio and July 25, 2011 for Mortgage- and Asset-Backed Portfolio, replacing a prior credit facility. The credit facility agreement, as amended, which is a collective agreement between the Portfolios and certain other funds managed by the Investment Manager, severally and not jointly, permits collective borrowings up to $500 million. Pursuant to a December 13, 2011 amendment to the credit facility agreement, interest is charged to each participating portfolio based on its borrowings at a rate equal to the higher of (i) the overnight federal funds rate plus 1.00% or (i) the one-month LIBOR rate plus 1.00%. Each borrowing under the credit facility matures no later than 60 days after the date of borrowing. Each Portfolio also pays a commitment fee equal to its pro rata share of the amount of the credit facility at a rate of 0.08% per annum.
For the period June 27, 2011 through December 13, 2011 for Corporate Bond Portfolio, and the period July 25, 2011 through December 13, 2011 for Mortgage-and Asset-Backed Portfolio, interest was charged to each participating portfolio based on its borrowings at a rate equal to the sum of the federal funds rate plus (i) 1.25% per annum plus (ii) if one-month LIBOR exceeds the federal funds rate, the amount of such excess. Each Portfolio also paid a commitment fee equal to its pro rata share of the amount of the credit facility at a rate of 0.10% per annum.
For the period June 27, 2011 through July 24, 2011, Mortgage- and Asset-Backed Portfolio and certain other funds managed by the Investment Manager participated in a $100 million committed, unsecured revolving credit facility provided by State Street.
For the period May 16, 2011 through June 26, 2011, each Portfolio and certain other funds managed by the Investment Manager participated in a $150 million committed, unsecured revolving credit facility provided by State Street. Prior to May 16, 2011, the collective borrowing amount of the credit facility was $225 million. Interest was charged to each portfolio based on its borrowings at a rate equal to the greater of the (i) federal funds rate plus 1.25% per annum or (ii) the overnight LIBOR rate plus 1.25% per annum. Each Portfolio also paid a commitment fee equal to its pro rata share of the amount of the credit facility at a rate of 0.125% per annum.
Corporate Bond Portfolio had no borrowings during the period ended April 30, 2012 and the year ended March 31, 2012.
Mortgage- and Asset-Backed Portfolio had no borrowings during the period ended April 31, 2012. For the year ended March 31, 2012, the average daily loan balance outstanding for Mortgage- and Asset-Backed Portfolio on days when borrowing existed was $1,716,667 at a weighted average interest rate of 1.379%.
42
Fixed Income Sector Portfolios, April 30, 2012
Note 8. Significant Risks
Foreign Securities Risk
Investing in foreign securities may include certain risks and considerations not typically associated with investing in U.S. securities, such as fluctuating currency values and changing local and regional economic, political and social conditions, which may result in greater market volatility. In addition, certain foreign securities may not be as liquid as U.S. securities.
Asset-Backed Securities Risk
The value of asset-backed securities may be affected by, among other factors, changes in interest rates, the market's assessment of the quality of underlying assets, the creditworthiness of the servicer for the underlying assets, factors concerning the interests in and structure of the issuer or the originator of the underlying assets, or the creditworthiness or rating of the entities that provide any supporting letters of credit, surety bonds, derivative instruments, or other credit enhancement. The value of asset-backed securities also will be affected by the exhaustion, termination or expiration of any credit enhancement. Most asset-backed securities are subject to prepayment risk, which is the possibility that the underlying debt may be refinanced or prepaid prior to maturity during periods of declining or low interest rates, causing the Portfolios to have to reinvest the money received in securities that have lower yields. In addition, the impact of prepayments on the value of asset-backed securities may be difficult to predict and may result in greater volatility.
Mortgage-Backed Securities Risk
The value of mortgage-backed securities may be affected by, among other things, changes in interest rates, factors concerning the interests in and structure of the issuer or the originator of the mortgages, the creditworthiness of the entities that provide any supporting letters of credit, surety bonds or other credit enhancements or the quality of underlying assets or the market's assessment thereof. Mortgage-backed securities are subject to prepayment risk, which is the possibility that the underlying mortgage may be refinanced or prepaid prior to maturity during periods of declining or low interest rates, causing the Portfolios to have to reinvest the money received in securities that have lower yields. In addition, the impact of prepayments on the value of mortgage-backed securities may be difficult to predict and may result in greater volatility.
Note 9. Subsequent Events
Management has evaluated the events and transactions that have occurred through the date the financial statements were issued and noted no items requiring adjustment of the financial statements or additional disclosure.
Note 10. Information Regarding Pending and Settled Legal Proceedings
In December 2005, without admitting or denying the allegations, American Express Financial Corporation (AEFC, which is now known as Ameriprise Financial, Inc. (Ameriprise Financial)) entered into settlement agreements with the Securities and Exchange Commission (SEC) and Minnesota Department of Commerce (MDOC) related to market timing activities. As a result, AEFC was censured and ordered to cease and desist from committing or causing any violations of certain provisions of the Investment Advisers Act of 1940, the Investment Company Act of 1940, and various Minnesota laws. AEFC agreed to pay disgorgement of $10 million and civil money penalties of $7 million. AEFC also agreed to retain an independent distribution consultant to assist in developing a plan for distribution of all disgorgement and civil penalties ordered by the SEC in accordance with various undertakings detailed at www.sec.gov/litigation/admin/ia-2451.pdf. Ameriprise Financial and its affiliates have cooperated with the SEC and the MDOC in these legal proceedings, and have made regular reports to the funds' Boards of Trustees.
Ameriprise Financial and certain of its affiliates have historically been involved in a number of legal, arbitration and regulatory proceedings, including routine litigation, class actions, and governmental actions, concerning matters arising in connection with the conduct of their business activities. Ameriprise Financial believes that the Funds are not currently the subject of, and that neither Ameriprise Financial nor any of its affiliates are the subject of, any pending legal, arbitration or regulatory proceedings that are likely to have a material adverse effect on the Funds or the ability of Ameriprise Financial or its affiliates to perform under their contracts with the Funds. Ameriprise Financial is required to make 10-Q, 10-K and, as necessary, 8-K filings with the Securities and Exchange Commission on legal and regulatory
43
Fixed Income Sector Portfolios, April 30, 2012
matters that relate to Ameriprise Financial and its affiliates. Copies of these filings may be obtained by accessing the SEC website at www.sec.gov.
There can be no assurance that these matters, or the adverse publicity associated with them, will not result in increased fund redemptions, reduced sale of fund shares or other adverse consequences to the Funds. Further, although we believe proceedings are not likely to have a material adverse effect on the Funds or the ability of Ameriprise Financial or its affiliates to perform under their contracts with the Funds, these proceedings are subject to uncertainties and, as such, we are unable to estimate the possible loss or range of loss that may result. An adverse outcome in one or more of these proceedings could result in adverse judgments, settlements, fines, penalties or other relief that could have a material adverse effect on the consolidated financial condition or results of operations of Ameriprise Financial.
44
Report of Independent Registered Public Accounting Firm
To the Trustees of Columbia Funds Series Trust and the Shareholders of Fixed Income Sector Portfolios
In our opinion, the accompanying statement of assets and liabilities, including the portfolio of investments, and the related statements of operations and of changes in net assets and the financial highlights present fairly, in all material respects, the financial position of Corporate Bond Portfolio and Mortgage- and Asset-Backed Portfolio (each a series of Columbia Funds Series Trust, hereafter referred to as the "Portfolios") at April 30, 2012 and at March 31, 2012, the results of its operations, the changes in its net assets and the financial highlights for each of the periods indicated, in conformity with accounting principles generally accepted in the United States of America. These financial statements and financial highlights (hereafter referred to as "financial statements") are the responsibility of the Portfolios' management. Our responsibility is to express an opinion on these financial statements based on our audits. We conducted our audits of these financial statements in accordance with the standards of the Public Company Accounting Oversight Board (United States). Those standards require that we plan and perform the audit to obtain reasonable assurance about whether the financial statements are free of material misstatement. An audit includes examining, on a test basis, evidence supporting the amounts and disclosures in the financial statements, assessing the accounting principles used and significant estimates made by management, and evaluating the overall financial statement presentation. We believe that our audits, which included confirmation of securities at April 30, 2012 and at March 31, 2012 by correspondence with the custodian, transfer agent and brokers, provide a reasonable basis for our opinion.
PricewaterhouseCoopers LLP
Minneapolis, Minnesota
June 8, 2012
45
Fund Governance
Shareholders elect the Board that oversees the funds' operations. The Board appoints officers who are responsible for day-to-day business decisions based on policies set by the Board. The following table provides basic biographical information about the funds' Board members, including their principal occupations during the past five years, although specific titles for individuals may have varied over the period. Under current Board policy, members may serve until the next Board meeting after he or she reaches the mandatory retirement age established by the Board, or the fifteenth anniversary of the first Board meeting they attended as a member of the Board.
On September 29, 2009, Ameriprise Financial, the parent company of Columbia Management, entered into an agreement with Bank of America, N.A. ("Bank of America") to acquire a portion of the asset management business of Columbia Management Group, LLC and certain of its affiliated companies (the "Transaction"). Following the Transaction, which became effective on May 1, 2010, various alignment activities have occurred with respect to the Fund Family. In connection with the Transaction, Mr. Edward J. Boudreau, Jr., Mr. William P. Carmichael, Mr. William A. Hawkins, Mr. R. Glenn Hilliard, Mr. John J. Nagorniak, Ms. Minor M. Shaw and Dr. Anthony M. Santomero, who were members prior to the Transaction of the Legacy Columbia Nations funds' Board ("Nations Funds"), which includes Columbia Funds Series Trust, Columbia Funds Variable Insurance Trust I and Columbia Funds Master Investment Trust, LLC., began service on the Board for the Legacy RiverSource funds ("RiverSource Funds") effective June 1, 2011, which resulted in an overall increase from twelve Trustees to sixteen for all mutual funds overseen by the Board.
Independent Board Members
| Name, Address, Age | | Position Held
with Funds
and Length
of Service | | Principal Occupation During Past Five Years | | Number of
Funds in the
Fund Family
Overseen by
Board Member | | Other Present or
Past Directorships/
Trusteeships
(Within Past 5 Years) | |
| Kathleen Blatz | | | | | | | | | |
|
901 S. Marquette Ave.
Minneapolis, MN 55402
Age 57 | | Board member since 1/06 for RiverSource Funds and since 6/11 for Nations Funds | | Attorney; Chief Justice, Minnesota Supreme Court, 1998-2006 | | | 156 | | | None | |
|
| Edward J. Boudreau, Jr. | | | | | | | | | |
|
225 Franklin Street
Mail Drop
BX32 05228
Boston, MA 02110
Age 67 | | Board member since 6/11 for RiverSource Funds and since 1/05 for Nations Funds | | Managing Director, E.J. Boudreau & Associates (consulting) since 2000 | | | 149 | | | Former Trustee, BofA Funds Series Trust (11 funds) | |
|
| Pamela G. Carlton | | | | | | | | | |
|
901 S. Marquette Ave.
Minneapolis, MN 55402
Age 57 | | Board member since 7/07 for RiverSource Funds and since 6/11 for Nations Funds | | President, Springboard-Partners in Cross Cultural Leadership (consulting company) | | | 156 | | | None | |
|
46
Fund Governance (continued)
Independent Board Members (continued)
| Name, Address, Age | | Position Held
with Funds
and Length
of Service | | Principal Occupation During Past Five Years | | Number of
Funds in the
Fund Family
Overseen by
Board Member | | Other Present or
Past Directorships/
Trusteeships
(Within Past 5 Years) | |
| William P. Carmichael | | | | | | | | | |
|
225 Franklin Street
Mail Drop
BX32 05228
Boston, MA 02110
Age 68 | | Board member since 6/11 for RiverSource Funds and since 1999 for Nations Funds | | Retired | | | 149 | | | Director, Cobra Electronics Corporation (electronic equipment manufacturer); The Finish Line (athletic shoes and apparel); McMoRan Exploration Company (oil and gas exploration and development); former Trustee, BofA Funds Series Trust (11 funds); former Director, Spectrum Brands, Inc. (consumer products); former Director, Simmons Company (bedding) | |
|
| Patricia M. Flynn | | | | | | | | | |
|
901 S. Marquette Ave.
Minneapolis, MN 55402
Age 61 | | Board member since 11/04 for RiverSource Funds and since 6/11 for Nations Funds | | Trustee Professor of Economics and Management, Bentley University; former Dean, McCallum Graduate School of Business, Bentley University | | | 156 | | | None | |
|
| William A. Hawkins | | | | | | | | | |
|
225 Franklin Street
Mail Drop
BX32 05228
Boston, MA 02110
Age 69 | | Board member since 6/11 for RiverSource Funds and since 1/05 for Nations Funds | | Managing Director, Overton Partners (financial consulting), since August 2010; President and Chief Executive Officer, California General Bank, N.A., January 2008-August 2010 | | | 149 | | | Trustee, BofA Funds Series Trust (11 funds) | |
|
| R. Glenn Hilliard | | | | | | | | | |
|
225 Franklin Street
Mail Drop
BX32 05228
Boston, MA 02110
Age 69 | | Board member since 6/11 for RiverSource Funds and since 1/05 for Nations Funds | | Chairman and Chief Executive Officer, Hilliard Group LLC (investing and consulting), since April 2003; Non-Executive Director & Chairman, CNO Financial Group, Inc. (formerly Conseco, Inc.) (insurance), September 2003-May 2011 | | | 149 | | | Chairman, BofA Fund Series Trust (11 funds); former Director, CNO Financial Group, Inc. (insurance) | |
|
47
Fund Governance (continued)
Independent Board Members (continued)
| Name, Address, Age | | Position Held
with Funds
and Length
of Service | | Principal Occupation During Past Five Years | | Number of
Funds in the
Fund Family
Overseen by
Board Member | | Other Present or
Past Directorships/
Trusteeships
(Within Past 5 Years) | |
| Stephen R. Lewis, Jr. | | | | | | | | | |
|
901 S. Marquette Ave.
Minneapolis, MN 55402
Age 73 | | Chair of the Board for RiverSource Funds since 1/07, Board member for RiverSource Funds since 1/02 and since 6/11 for Nations Funds | | President Emeritus and Professor of Economics Emeritus, Carleton College | | | 156 | | | Director, Valmont Industries, Inc. (manufactures irrigation systems) | |
|
| John F. Maher | | | | | | | | | |
|
901 S. Marquette Ave.
Minneapolis, MN 55402
Age 69 | | Board member since 12/06 for Legacy Seligman funds, since 12/08 for RiverSource Funds and since 6/11 for Nations Funds | | Retired President and Chief Executive Officer and former Director, Great Western Financial Corporation (financial services), 1986-1997 | | | 156 | | | None | |
|
| John J. Nagorniak | | | | | | | | | |
|
225 Franklin Street
Mail Drop
BX32 05228
Boston, MA 02110
Age 67 | | Board member since 6/11 for RiverSource Funds and since 1/08 for Nations Funds | | Retired; President and Director, Foxstone Financial, Inc. (consulting), 2000-2007; Director, Mellon Financial Corporation affiliates (investing), 2000-2007; Chairman, Franklin Portfolio Associates (investing—Mellon affiliate), 1982-2007 | | | 149 | | | Trustee, Research Foundation of CFA Institute; Director, MIT Investment Company; Trustee, MIT 401k Plan; former Trustee, BofA Funds Series Trust (11 funds) | |
|
| Catherine James Paglia | | | | | | | | | |
|
901 S. Marquette Ave.
Minneapolis, MN 55402
Age 59 | | Board member since 11/04 for RiverSource Funds and since 6/11 for Nations Funds | | Director, Enterprise Asset Management, Inc. (private real estate and asset management company) | | | 156 | | | None | |
|
48
Fund Governance (continued)
Independent Board Members (continued)
| Name, Address, Age | | Position Held
with Funds
and Length
of Service | | Principal Occupation During Past Five Years | | Number of
Funds in the
Fund Family
Overseen by
Board Member | | Other Present or
Past Directorships/
Trusteeships
(Within Past 5 Years) | |
| Leroy C. Richie | | | | | | | | | |
|
901 S. Marquette Ave.
Minneapolis, MN 55402
Age 70 | | Board member since 2000 for Legacy Seligman funds, since 11/08 for RiverSource Funds and since 6/11 for Nations Funds | | Counsel, Lewis & Munday, P.C. since 2004; former Vice President and General Counsel, Automotive Legal Affairs, Chrysler Corporation | | | 156 | | | Director, Digital Ally, Inc. (digital imaging); Director, Infinity, Inc. (oil and gas exploration and production); Director, OGE Energy Corp. (energy and energy services) | |
|
| Minor M. Shaw | | | | | | | | | |
|
225 Franklin Street
Mail Drop
BX32 05228
Boston, MA 02110
Age 64 | | Board member since 6/11 for RiverSource Funds and since 2003 for Nations Funds | | President—Micco LLC (private investments) | | | 149 | | | Former Trustee, BofA Funds Series Trust (11 funds); Board Member, Piedmont Natural Gas; Director, Blue Cross Blue Shield of South Carolina | |
|
| Alison Taunton-Rigby | | | | | | | | | |
|
901 S. Marquette Ave.
Minneapolis, MN 55402
Age 68 | | Board member since 11/02 for RiverSource Funds and since 6/11 for Nations Funds | | Chief Executive Officer and Director, RiboNovix, Inc. 2003-2010 (biotechnology); former President, Aquila Biopharmaceuticals | | | 156 | | | Director, Healthways, Inc. (health management programs); Director, ICI Mutual Insurance Company, RRG; Director, Abt Associates (government contractor) | |
|
49
Fund Governance (continued)
Interested Board Member Not Affiliated with Investment Manager*
| Name, Address, Age | | Position Held
with Funds
and Length
of Service | | Principal Occupation During Past Five Years | | Number of
Funds in the
Fund Family
Overseen by
Board Member | | Other Present or
Past Directorships/
Trusteeships
(Within Past 5 Years) | |
| Anthony M. Santomero* | | | | | | | | | |
|
225 Franklin Street
Mail Drop
BX32 05228
Boston, MA 02110
Age 65 | | Board member since 6/11 for RiverSource Funds and since 1/08 for Nations Funds | | Richard K. Mellon Professor Emeritus of Finance, The Wharton School, University of Pennsylvania, since 2002; Senior Advisor, McKinsey & Company (consulting), 2006-2008; President and Chief Executive Officer, Federal Reserve Bank of Philadelphia, 2000-2006 | | | 149 | | | Director, Renaissance Reinsurance Ltd.; Trustee, Penn Mutual Life Insurance Company; Director, Citigroup; Director, Citibank, N.A.; former Trustee, BofA Funds Series Trust (11 funds) | |
|
* Dr. Santomero is not an affiliated person of the Investment Manager or Ameriprise Financial. However, he is currently deemed by the funds to be an "interested person" (as defined in the 1940 Act) of the Funds because he serves as a Director of Citigroup, Inc. and Citibank N.A., companies that may directly or through subsidiaries and affiliates engage from time-to-time in brokerage execution, principal transactions and lending relationships with the funds or accounts advised/managed by the Investment Manager.
Interested Board Member Affiliated with Investment Manager*
| William F. Truscott | | | | | | | | | |
|
53600 Ameriprise Financial Center
Minneapolis, MN 55474
Age 51 | | Board member since 11/01 for RiverSource Funds and since 6/11 for Nations Funds; Senior Vice President since 2002 for RiverSource Funds and 5/10 for Nations Funds | | Chairman of the Board and President, Columbia Management Investment Advisers, LLC since May 2010 and February 2012, respectively (previously President, Chairman of the Board and Chief Investment Officer, 2001-April 2010); Chief Executive Officer, U.S. Asset Management & President, Annuities, Ameriprise Financial, Inc. since May 2010 (previously President—U.S. Asset Management and Chief Investment Officer, 2005-April 2010); Director, President and Chief Executive Officer, Ameriprise Certificate Company since 2006; Director and Chief Executive Officer, Columbia Management Investment Distributors, Inc. since May 2010 and February 2012, respectively (previously Chairman of the Board and Chief Executive Officer, 2006-April 2010); Chairman of the Board and Chief Executive Officer, RiverSource Distributors, Inc. since 2006. | | | 156 | | | Trustee, Columbia Funds Series Trust I and Columbia Funds Variable Insurance Trust | |
|
* Interested person (as defined under the 1940 Act) by reason of being an officer, director, security holder and/or employee of the Investment Manager or Ameriprise Financial.
The SAI has additional information about the Fund's Board members and is available, without charge, upon request by calling 800.345.6611; contacting your financial intermediary; or visiting columbiamanagement.com.
50
Fund Governance (continued)
Officers
| Name, Year of Birth and Address | | Principal Occupation(s) During the Past Five Years | |
| J. Kevin Connaughton (Born 1964) | |
|
225 Franklin Street
Boston, MA 02110
President (since 2009) | | Senior Vice President and General Manager—Mutual Fund Products, Columbia Management Investment Advisers, LLC since May 2010; President, Columbia Funds, since 2009, and RiverSource Funds, since May 2010 (previously Senior Vice President and Chief Financial Officer, Columbia Funds, from June 2008 to January 2009, Treasurer, Columbia Funds, from October 2003 to May 2008, and senior officer of various other affiliated funds since 2000); Managing Director, Columbia Management Advisors, LLC from December 2004 to April 2010. | |
|
| Michael G. Clarke (Born 1969) | |
|
225 Franklin Street
Boston, MA 02110
Treasurer (since 2011) and Chief Financial Officer (since 2009) | | Vice President, Columbia Management Investment Advisers, LLC since May 2010; Managing Director of Fund Administration, Columbia Management Advisors, LLC, from September 2004 to April 2010; senior officer of Columbia Funds and affiliated funds since 2002. | |
|
| Scott R. Plummer (Born 1959) | |
|
5228 Ameriprise Financial Center
Minneapolis, MN 55474
Senior Vice President and Chief Legal Officer (since 2010) | | Chief Legal Officer and Assistant Secretary, Columbia Management Investment Advisers, LLC since June 2005; Vice President and Lead Chief Counsel—Asset Management, Ameriprise Financial, Inc. since May 2010 (previously Vice President and Chief Counsel—Asset Management, from 2005 to April 2010, Vice President, Chief Counsel and Assistant Secretary, Columbia Management Investment Distributors, Inc. since 2008; Vice President, General Counsel and Secretary, Ameriprise Certificate Company since 2005; Chief Counsel, RiverSource Distributors, Inc. since 2006; Senior officer of Columbia Funds and affiliated funds, since 2006. | |
|
| Thomas P. McGuire (Born 1972) | |
|
225 Franklin Street
Boston, MA 02110
Chief Compliance Officer (since 2012) | | Vice President—Asset Management Compliance, Columbia Management Investment Advisers, LLC since March 2010; Chief Compliance Officer, Ameriprise Certificate Company, since September 2010; Compliance Executive, Bank of America, from June 2005 to April 2010. | |
|
| William F. Truscott (Born 1960) | |
|
53600 Ameriprise Financial Center
Minneapolis, MN 55474
Senior Vice President (since 2010) | | Chairman of the Board and President, Columbia Management Investment Advisers, LLC since May 2010 and February 2012, respectively (previously President, Chairman of the Board and Chief Investment Officer, from 2001 to April 2010); Chief Executive Officer, U.S. Asset Management & President, Annuities, Ameriprise Financial, Inc. since May 2010 (previously President—U.S. Asset Management and Chief Investment Officer from 2005 to April 2010; Director, President and Chief Executive Officer, Ameriprise Certificate Company since 2006; Director and Chief Executive Officer, Columbia Management Investment Distributors, Inc. since May 2010 and February 2012, respectively (previously Chairman of the Board and Chief Executive Officer from 2008 to April 2010); Chairman of the Board and Chief Executive Officer, RiverSource Distributors, Inc. since 2006. | |
|
| Paul D. Pearson (Born 1956) | |
|
10468 Ameriprise Financial Center
Minneapolis, MN 55474
Vice President and Assistant Treasurer
(since 2011) | | Vice President—Investment Accounting, Columbia Management Investment Advisers, LLC, since May 2010; Vice President—Managed Assets, Investment Accounting, Ameriprise Financial Corporation, 1998-2010 | |
|
51
Fund Governance (continued)
Officers (continued)
| Name, Year of Birth and Address | | Principal Occupation(s) During the Past Five Years | |
| Colin Moore (Born 1958) | |
|
225 Franklin Street
Boston, MA 02110
Senior Vice President (since 2010) | | Director and Chief Investment Officer, Columbia Management Investment Advisers, LLC since May 2010; Manager, Managing Director and Chief Investment Officer of Columbia Management Advisors, LLC from 2007 to April 2010; Head of Equities, Columbia Management Advisors, LLC from 2002 to 2007. | |
|
| Christopher O. Petersen (Born 1970) | |
|
5228 Ameriprise Financial Center
Minneapolis, MN 55474
Vice President and Secretary (since 2011) | | Vice President and Chief Counsel, Ameriprise Financial since January 2010 (formerly Vice President and Group Counsel or Counsel from April 2004 to January 2010); Senior officer of Columbia Funds and affiliated funds, since 2007. | |
|
| Amy K. Johnson (Born 1965) | |
|
5228 Ameriprise Financial Center
Minneapolis, MN 55474
Vice President (since 2010) | | Senior Vice President and Chief Operating Officer, Columbia Management Investment Advisers, LLC since May 2010 (previously Chief Administrative Officer, from 2009 until April 2010, Vice President—Asset Management and Trust Company Services, from 2006 to 2009, and Vice President—Operations and Compliance from 2004 to 2006). | |
|
| Joseph F. DiMaria (Born 1968) | |
|
225 Franklin Street
Boston, MA 02110
Vice President (since 2011) and Chief Accounting Officer (since 2008) | | Vice President, Mutual Fund Administration, Columbia Management Investment Advisers, LLC, since May 2010; Director of Fund Administration, Columbia Management Advisors, LLC from January 2006 to April 2010. | |
|
| Paul B. Goucher (Born 1968) | |
|
100 Park Avenue
New York, NY 10017
Vice President and Assistant Secretary (since 2010) | | Vice President and Chief Counsel of Ameriprise Financial since January 2010 (formerly Vice President and Group Counsel from November 2008 to January 2010); Director, Managing Director and General Counsel of J. & W. Seligman & Co. Incorporated (Seligman) from July 2008 to November 2008 and Managing Director and Associate General Counsel of Seligman from January 2005 to July 2008. | |
|
| Michael E. DeFao (Born 1968) | |
|
225 Franklin Street
Boston, MA 02110
Vice President and Assistant Treasurer (since 2011) | | Vice President and Chief Counsel, Ameriprise Financial since May 2010; Associate General Counsel, Bank of America from June 2005 to April 2010. | |
|
| Stephen T. Welsh (Born 1957) | |
|
225 Franklin Street
Boston, MA 02110
Vice President (since 2006) | | President and Director, Columbia Management Investment Services Corp. since May 2010; President and Director, Columbia Management Services, Inc. from July 2004 to April 2010; Managing Director, Columbia Management Distributors, Inc. from August 2007 to April 2010. | |
|
52
Approval of Investment Management Services Agreement
Columbia Management Investment Advisers, LLC ("Columbia Management" or the "investment manager"), a wholly-owned subsidiary of Ameriprise Financial, Inc. ("Ameriprise Financial"), serves as the investment manager to each of the Fixed Income Sector Portfolios: Corporate Bond Portfolio and Mortgage- and Asset -Backed Portfolio (each a "Fund", together the "Sector Portfolios"). Under an investment management services agreement (the "IMS Agreement"), Columbia Management provides investment advice and other services to each Fund and all funds distributed by Columbia Management Investment Distributors, Inc. (collectively, the "Funds").
On an annual basis, each Fund's Board of Trustees (the "Board"), including the independent Board members (the "Independent Trustees"), considers renewal of each IMS Agreement. Columbia Management prepared detailed reports for the Board and its Contracts Committee in March and April 2012, including reports based on analyses of data provided by an independent organization and a comprehensive response to each item of information requested by independent legal counsel to the Independent Trustees ("Independent Legal Counsel") in a letter to the investment manager, to assist the Board in making this determination. All of the materials presented in March and April were first supplied in draft form to designated representatives of the Independent Trustees, i.e., Independent Legal Counsel, the Chair and the Chair of the Contracts Committee and the final materials were revised to reflect comments provided by these Board representatives. In addition, throughout the year, the Board (or its committees) regularly meets with portfolio management teams and senior management personnel, and reviews information prepared by Columbia Management addressing the services Columbia Management provides and Fund performance. The Board accords particular weight to the work, deliberations and conclusions of the Contracts Committee, the Investment Review Committee and the Compliance Committee in determining whether to continue each IMS Agreement.
The Board, at its April 10-12, 2012 in-person Board meeting (the "April Meeting"), considered the renewal of the IMS Agreement for an additional one-year term. At the April Meeting, Independent Legal Counsel reviewed with the Independent Trustees various factors relevant to the Board's consideration of advisory agreements and the Board's legal responsibilities related to such consideration. Following an analysis and discussion of the factors identified below, the Board, including all of the Independent Trustees, approved the renewal of each IMS Agreement.
Nature, Extent and Quality of Services Provided by Columbia Management: The Independent Trustees analyzed various reports and presentations they had received detailing the services performed by Columbia Management, as well as its expertise, resources and capabilities. The Independent Trustees specifically considered many developments during the past year concerning the services provided by Columbia Management, including, in particular, the continued investment in, and resources dedicated to, each Funds' operations and the successful completion of various integration initiatives and the consolidation of dozens of Funds. The Independent Trustees noted the information they received concerning Columbia Management's ability to retain key portfolio management personnel. In that connection, the Independent Trustees took into account their meetings with Columbia Management's Chief Investment Officer (the "CIO") and considered the CIO's successful execution of additional risk and portfolio management oversight applied to the Funds. The Independent Trustees also assessed Columbia Management's significant investment in upgrading technology (such as an equity trading system) and considered management's commitments to enhance existing resources in this area.
In connection with the Board's evaluation of the overall package of services provided by Columbia Management, the Board also considered the quality of administrative services provided to each Fund by Columbia Management. In addition, the Board also reviewed the financial condition of Columbia Management (and its affiliates) and each entity's ability to carry out its responsibilities under each IMS Agreement and each Fund's other services agreements with Ameriprise affiliates. The Board also discussed the acceptability of the terms of each IMS Agreement (including the relatively broad scope of services required to be performed by Columbia Management). The Board concluded that the services being performed under each IMS Agreement were of a reasonably high quality.
Based on the foregoing, and based on other information received (both oral and written, including the information on investment performance referenced below) and other
53
Approval of Investment Management Services Agreement (continued)
considerations, the Board concluded that Columbia Management and its affiliates were in a position to continue to provide a high quality and level of services to each Fund.
Investment Performance: For purposes of evaluating the nature, extent and quality of services provided under each IMS Agreement, the Board carefully reviewed the investment performance of each Fund. In this regard, the Board considered detailed reports providing the results of analyses performed by an independent organization showing, for various periods, the performance of each Fund, the performance of a benchmark index and the net assets of each Fund. The Board observed that for i) Corporate Bond Portfolio, the Fund's investment performance met expectations and for ii) Mortgage- and Asset- Backed Portfolio, the Fund's investment performance was appropriate in light of the particular management style.
Comparative Fees, Costs of Services Provided and the Profits Realized By Columbia Management and its Affiliates from their Relationships with each Fund: The Board reviewed comparative fees and the costs of services to be provided under each IMS Agreement. The Board members considered detailed comparative information set forth in an annual report on fees and expenses, including, among other things, data (based on analyses conducted by an independent organization) showing a comparison of each Fund's expenses with median expenses paid by funds in its comparative peer universe, as well as data showing each Fund's contribution to Columbia Management's profitability.
The Board accorded particular weight to the notion that the level of fees should reflect a rational pricing model applied consistently across the various product lines in the Fund family, while assuring that the overall fees for each Fund (with few defined exceptions) are generally in line with the "pricing philosophy" (i.e., that the total expense ratio of each Fund is at, or below, the median expense ratio of funds in the same comparison universe of each Fund). The Board considered, in particular, that each Fund is not subject to any fees under the IMS Agreement. (Each Fund also does not incur any fees or expenses except brokerage fees and commissions, taxes, interest expense and extraordinary expenses.)
The Board also considered the expected profitability of Columbia Management and its affiliates in connection with Columbia Management providing investment management services to each Fund. In this regard, the Board referred to a detailed profitability report, discussing the profitability to Columbia Management and Ameriprise Financial from managing, operating and distributing the Funds. In this regard, the Board observed that 2011 profitability, while slightly lower than 2010, was generally in line with the reported profitability of other asset management firms. The Board also considered the indirect economic benefits flowing to Columbia Management or its affiliates in connection with managing or distributing the Funds, such as the enhanced ability to offer various other financial products to Ameriprise Financial customers, soft dollar benefits and overall reputational advantages. The Board noted that the fees paid by the Funds should permit the investment manager to offer competitive compensation to its personnel, make necessary investments in its business and earn an appropriate profit. The Board concluded that profitability levels were reasonable.
Economies of Scale to be Realized: The Board also considered the economies of scale that might be realized by Columbia Management as each Fund grows and took note of the extent to which Fund shareholders might also benefit from such growth.
Based on the foregoing, the Board, including all of the Independent Trustees, concluded that each Fund's fees were fair and reasonable in light of the extent and quality of services provided. In reaching this conclusion, no single factor was determinative. On April 12, 2012, the Board, including all of the Independent Trustees, approved the renewal of each IMS Agreement.
54
This page intentionally left blank.
55
This page intentionally left blank.
56
Important Information About This Report
The fund mails one shareholder report to each shareholder address. If you would like more than one report, please call shareholder services at 1-800-345-6611 and additional reports will be sent to you. This report has been prepared for shareholders of Fixed Income Sector Portfolios.
A description of the policies and procedures that the fund uses to determine how to vote proxies and a copy of the fund's voting records are available (i) at www.columbiamanagement.com, (ii) on the Securities and Exchange Commission's website at www.sec.gov, and (iii) without charge, upon request, by calling 1-800-368-0346. Information regarding how the fund voted proxies relating to portfolio securities during the 12-month period ended June 30 is available from the SEC's website. Information regarding how the fund voted proxies relating to portfolio securities is also available from the fund's website, www.columbiamanagement.com.
The fund files a complete schedule of portfolio holdings with the SEC for the first and third quarters of each fiscal year on Form N-Q. The fund's Form N-Q is available on the SEC's website at www.sec.gov and may be reviewed and copied at the SEC's Public Reference Room in Washington, D.C. Information on the operation of the Public Reference Room may be obtained by calling 1-800-SEC-0330.
Transfer Agent
Columbia Management Investment
Services Corp.
P.O. Box 8081
Boston, MA 02266-8081
1-800-345-6611
Distributor
Columbia Management Investment
Distributors, Inc.
225 Franklin Street
Boston, MA 02110
Investment Manager
Columbia Management Investment Advisers, LLC
225 Franklin Street
Boston, MA 02110
57

Fixed Income Sector Portfolios
P. O. Box 8081
Boston, MA 02266-8081
columbiamanagement.com
This information is for use with concurrent or prior delivery of a fund prospectus. Investors should consider the investment objectives, risks, charges and expenses of a mutual fund carefully before investing. For a free prospectus, which contains this and other important information about the funds, visit columbiamanagement.com. Read the prospectus carefully before investing. The Fund is distributed by Columbia Management Investment Distributors, Inc., member FINRA, and managed by Columbia Management Investment Advisers, LLC.
© 2012 Columbia Management Investment Advisers, LLC. All rights reserved.
C-1121 C (5/12)
Item 2. Code of Ethics.
(a) The registrant has adopted a code of ethics that applies to the registrant’s principal executive officer, principal financial officer, principal accounting officer or controller, or persons performing similar functions, regardless of whether these individuals are employed by the registrant or a third party.
(b) During the period covered by this report, there were not any amendments to a provision of the code of ethics adopted in 2(a) above.
(c) During the period covered by this report, there were no waivers, including any implicit waivers, from a provision of the code of ethics described in 2(a) above that relates to one or more of the items set forth in paragraph (b) of this item’s instructions.
Item 3. Audit Committee Financial Expert.
The registrant’s Board of Trustees has determined that Edward J. Boudreau Jr., Pamela G. Carlton, William P. Carmichael, William A. Hawkins and John F. Maher, each of whom are members of the registrant’s Board of Trustees and Audit Committee, each qualify as an audit committee financial expert. Mr. Boudreau, Ms. Carlton, Mr. Carmichael, Mr. Hawkins and Mr. Maher each are independent trustees, as defined in paragraph (a)(2) of this item’s instructions.
Item 4. Principal Accountant Fees and Services.
Fee information below is disclosed for the nine series of the registrant whose reports to stockholders are included in this annual filing. The series changed its fiscal year end from March 31 to April 30, effective April 30, 2012. The fees presented for 2012 represent the one month period ended April 30, 2012 and the fiscal year ended March 31, 2012. The fees presented for 2011 represent the fiscal year ended March 31, 2011.
(a) Audit Fees. Aggregate Audit Fees billed by the principal accountant for professional services rendered during the one month period ended April 30, 2012 and the fiscal years ended March 31, 2012 and March 31, 2011 are approximately as follows:
April 30, 2012 | | March 31, 2012 | | March 31, 2011 | |
$ | 63,800 | | $ | 284,400 | | $ | 239,900 | |
| | | | | | | | |
Audit Fees include amounts related to the audit of the registrant’s annual financial statements or services that are normally provided by the accountant in connection with statutory and regulatory filings or engagements for those fiscal years.
(b) Audit-Related Fees. Aggregate Audit-Related Fees billed to the registrant by the principal accountant for professional services rendered during the one month period ended April 30, 2012 and the fiscal years ended March 31, 2012 and March 31, 2011 are approximately as follows:
April 30, 2012 | | March 31, 2012 | | March 31, 2011 | |
$ | 0 | | $ | 59,800 | | $ | 47,200 | |
| | | | | | | | |
Audit-Related Fees include amounts for assurance and related services by the principal accountant that are reasonably related to the performance of the audit of the registrant’s financial statements and are not reported in Audit Fees above. In both fiscal years 2012 and 2011, Audit-Related Fees consist of agreed-upon procedures performed for semi-annual shareholder reports. Fiscal year 2012 also includes Audit-Related Fees for agreed-upon procedures for fund accounting and custody conversions. Fiscal year 2011 also includes agreed- upon procedures related to fund mergers.
During the one month period ended April 30, 2012 and the fiscal years ended March 31, 2012 and March 31, 2011, there were no Audit-Related Fees billed by the registrant’s principal accountant to the registrant’s investment adviser (not including any sub-adviser whose role is primarily portfolio management and is subcontracted with or overseen by another investment adviser) and any entity controlling, controlled by, or under common control with the adviser that provides ongoing services to the registrant for an engagement that related directly to the operations and financial reporting of the registrant.
(c) Tax Fees. Aggregate Tax Fees billed by the principal accountant to the registrant for professional services rendered during the one month period ended April 30, 2012 and the fiscal years ended March 31, 2012 and March 31, 2011 are approximately as follows:
April 30, 2012 | | March 31, 2012 | | March 31, 2011 | |
$ | 0 | | $ | 43,000 | | $ | 32,900 | |
| | | | | | | | |
Tax Fees include amounts for the review of annual tax returns, the review of required shareholder distribution calculations and typically include amounts for professional services by the principal accountant for tax compliance, tax advice and tax planning.
During the one month period ended April 30, 2012 and the fiscal years ended March 31, 2012 and March 31, 2011, there were no Tax Fees billed by the registrant’s principal accountant to the registrant’s investment adviser (not including any sub-adviser whose role is primarily portfolio management and is subcontracted with or overseen by another investment adviser) and any entity controlling, controlled by, or under common control
with the adviser that provides ongoing services to the registrant for an engagement that related directly to the operations and financial reporting of the registrant.
(d) All Other Fees. Aggregate All Other Fees billed by the principal accountant to the registrant for professional services rendered during the one month period ended April 30, 2012 and the fiscal years ended March 31, 2012 and March 31, 2011 are approximately as follows:
April 30, 2012 | | March 31, 2012 | | March 31, 2011 | |
$ | 0 | | $ | 0 | | $ | 0 | |
| | | | | | | | |
All Other Fees include amounts for products and services provided by the principal accountant, other than the services reported in paragraphs (a) through (c) above.
Aggregate All Other Fees billed by the registrant’s principal accountant to the registrant’s investment adviser (not including any sub-adviser whose role is primarily portfolio management and is subcontracted with or overseen by another investment adviser) and any entity controlling, controlled by, or under common control with the adviser that provides ongoing services to the registrant for an engagement that related directly to the operations and financial reporting of the registrant during the one month period ended April 30, 2012 and the fiscal years ended March 31, 2012 and March 31, 2011 are approximately as follows:
April 30, 2012 | | March 31, 2012 | | March 31, 2011 | |
$ | 0 | | $ | 395,800 | | $ | 495,300 | |
| | | | | | | | |
In both fiscal years 2012 and 2011, All Other Fees consist of fees billed for internal control examinations of the registrant’s transfer agent and investment advisor.
(e)(1) Audit Committee Pre-Approval Policies and Procedures
The registrant’s Audit Committee is required to pre-approve the engagement of the registrant’s independent accountants to provide audit and non-audit services to the registrant and non-audit services to its investment adviser (not including any sub-adviser whose role is primarily portfolio management and is subcontracted with or overseen by another investment adviser) or any entity controlling, controlled by or under common control with such investment adviser that provides ongoing services to the registrant (“Adviser Affiliates”), if the engagement relates directly to the operations and financial reporting of the registrant.
The Audit Committee has adopted a Policy for Engagement of Independent Accountants for Audit and Non-Audit Services (“Policy”). The Policy sets forth the understanding of the Audit Committee regarding the engagement of the registrant’s independent accountants to provide (i) audit and permissible audit-related, tax and other services to the registrant (collectively “Fund Services”); (ii) non-audit services to the registrant’s investment adviser (not including any sub-adviser whose role is primarily portfolio
management and is subcontracted with or overseen by another investment adviser) and Adviser Affiliates, if the engagement relates directly to the operations or financial reporting of a Fund (collectively “Fund-related Adviser Services”); and (iii) certain other audit and non-audit services to the registrant’s investment adviser (not including any sub-adviser whose role is primarily portfolio management and is subcontracted with or overseen by another investment adviser) and Adviser Affiliates. As set forth in this Fund Policy, a service will require specific pre-approval by the Audit Committee if it is to be provided by the Fund’s independent auditor; provided, however, that pre-approval of non-audit services to the Fund, the Adviser or Control Affiliates may be waived if certain de minimis requirements set forth in the SEC’s rules are met.
Under the Policy, the Audit Committee may delegate pre-approval authority to any pre-designated member or members who are Independent Trustees/Directors. The member(s) to whom such authority is delegated must report, for informational purposes only, any pre-approval decisions to the Audit Committee at its next regular meeting. The Audit Committee’s responsibilities with respect to the pre-approval of services performed by the independent accountants may not be delegated to management.
On an annual basis, at a regularly scheduled Audit Committee meeting, the Fund’s Treasurer or other Fund Officer shall submit to the Audit Committee a schedule of the types of Fund Services and Fund-related Adviser Services that are subject to specific pre-approval.
This schedule will provide a description of each type of service that is subject to specific pre-approval, along with total projected fees for each service. The pre-approval will generally cover a one-year period. The Audit Committee will review and approve the types of services and the projected fees for the next one-year period and may add to, or subtract from, the list of pre-approved services from time to time, based on subsequent determinations. This specific approval acknowledges that the Audit Committee is in agreement with the types of services that the independent accountants will be permitted to perform.
The Fund’s Treasurer or other Fund Officer shall report to the Audit Committee at each of its regular meetings regarding all Fund Services or Fund-related Adviser Services initiated since the last such report was rendered, including a general description of the services with forecasted fees for the annual period, proposed changes requiring specific pre-approval and a description of services provided by the independent auditor with actual fees during the current reporting period.
*****
(e)(2) The percentage of services described in paragraphs (b) through (d) of this Item approved pursuant to the “de minimis” exception under paragraph (c)(7)(i)(C) of Rule 2-01 of Regulation S-X during the one month period ended April 30, 2012 and the fiscal years ended March 31, 2012 and March 31, 2011 was zero.
(f) Not applicable.
(g) The aggregate non-audit fees billed by the registrant’s accountant for services rendered to the registrant, and rendered to the registrant’s investment adviser (not including any sub-adviser whose role is primarily portfolio management and is subcontracted with or overseen by another investment adviser), and any entity controlling, controlled by, or under common control with the adviser that provides ongoing services to the registrant for the one month period ended April 30, 2012 and the fiscal years ended March 31, 2012 and March 31, 2011 are approximately as follows:
April 30, 2012 | | March 31, 2012 | | March 31, 2011 | |
$ | 0 | | $ | 498,600 | | $ | 575,400 | |
| | | | | | | | |
(h) The registrant’s Audit Committee of the Board of Directors has considered whether the provision of non-audit services that were rendered to the registrant’s adviser (not including any sub-adviser whose role is primarily portfolio management and is subcontracted with or overseen by another investment adviser), and any entity controlling, controlled by, or under common control with the investment adviser that provides ongoing services to the registrant that were not pre-approved pursuant to paragraph (c)(7)(ii) of Rule 2-01 of Regulation S-X, is compatible with maintaining the principal accountant’s independence.
Item 5. Audit Committee of Listed Registrants.
Not applicable.
Item 6. Investments
(a) The registrant’s “Schedule I — Investments in securities of unaffiliated issuers” (as set forth in 17 CFR 210.12-12) is included in Item 1 of this Form N-CSR.
(b) Not applicable.
Item 7. Disclosure of Proxy Voting Policies and Procedures for Closed-End Management Investment Companies.
Not applicable.
Item 8. Portfolio Managers of Closed-End Management Investment Companies.
Not applicable.
Item 9. Purchases of Equity Securities by Closed-End Management Investment Company and Affiliated Purchasers.
Not applicable.
Item 10. Submission of Matters to a Vote of Security Holders.
There were no material changes to the procedures by which shareholders may recommend nominees to the registrant’s board of directors.
Item 11. Controls and Procedures.
(a) The registrant’s principal executive officer and principal financial officers, based on their evaluation of the registrant’s disclosure controls and procedures as of a date within 90 days of the filing of this report, have concluded that such controls and procedures are adequately designed to ensure that material information required to be disclosed by the registrant in Form N-CSR is accumulated and communicated to the registrant’s management, including the principal executive officer and principal financial officer, or persons performing similar functions, as appropriate to allow timely decisions regarding required disclosure.
(b) There was no change in the registrant’s internal control over financial reporting that occurred during the registrant’s second fiscal quarter of the period covered by this report that has materially affected, or is reasonably likely to materially affect, the registrant’s internal control over financial reporting.
Item 12. Exhibits.
(a)(1) Code of ethics required to be disclosed under Item 2 of Form N-CSR attached hereto as Exhibit 99.CODE ETH.
(a)(2) Certifications pursuant to Rule 30a-2(a) under the Investment Company Act of 1940 (17 CFR 270.30a-2(a)) attached hereto as Exhibit 99.CERT.
(a)(3) Not applicable.
(b) Certification pursuant to Rule 30a-2(b) under the Investment Company Act of 1940 (17 CFR 270.30a-2(b)) attached hereto as Exhibit 99.906CERT.
SIGNATURES
Pursuant to the requirements of the Securities Exchange Act of 1934 and the Investment Company Act of 1940, the registrant has duly caused this report to be signed on its behalf by the undersigned, thereunto duly authorized.
(registrant) | | Columbia Funds Series Trust | |
| | | |
| | | |
By (Signature and Title) | | /s/ J. Kevin Connaughton | |
| | J. Kevin Connaughton, President and Principal Executive Officer | |
| | |
| | |
Date | | June 8, 2012 | |
| | | | | |
Pursuant to the requirements of the Securities Exchange Act of 1934 and the Investment Company Act of 1940, this report has been signed below by the following persons on behalf of the registrant and in the capacities and on the dates indicated.
By (Signature and Title) | | /s/ J. Kevin Connaughton | |
| | J. Kevin Connaughton, President and Principal Executive Officer | |
| | | | |
| | | | |
Date | | June 8, 2012 | |
| | | | | |
By (Signature and Title) | | /s/ Michael G. Clarke | |
| | Michael G. Clarke, Treasurer and Chief Financial Officer | |
| | | | |
| | | | |
Date | | June 8, 2012 | |
| | | | | |