UNITED STATES
SECURITIES AND EXCHANGE COMMISSION
Washington, D.C. 20549
FORM N-CSR
CERTIFIED SHAREHOLDER REPORT OF REGISTERED
MANAGEMENT INVESTMENT COMPANIES
Investment Company Act file number | 811-09645 |
|
Columbia Funds Series Trust |
(Exact name of registrant as specified in charter) |
|
225 Franklin Street, Boston, Massachusetts | | 02110 |
(Address of principal executive offices) | | (Zip code) |
|
Scott R. Plummer 5228 Ameriprise Financial Center Minneapolis, MN 55474 |
(Name and address of agent for service) |
|
Registrant’s telephone number, including area code: | 1-612-671-1947 | |
|
Date of fiscal year end: | January 31 | |
|
Date of reporting period: | January 31, 2012 | |
| | | | | | | | |
Form N-CSR is to be used by management investment companies to file reports with the Commission not later than 10 days after the transmission to stockholders of any report that is required to be transmitted to stockholders under Rule 30e-1 under the Investment Company Act of 1940 (17 CFR 270.30e-1). The Commission may use the information provided on Form N-CSR in its regulatory, disclosure review, inspection, and policymaking roles.
A registrant is required to disclose the information specified by Form N-CSR, and the Commission will make this information public. A registrant is not required to respond to the collection of information contained in Form N-CSR unless the Form displays a currently valid Office of Management and Budget ("OMB") control number. Please direct comments concerning the accuracy of the information collection burden estimate and any suggestions for reducing the burden to Secretary, Securities and Exchange Commission, 450 Fifth Street, NW, Washington, DC 20549-0609. The OMB has reviewed this collection of information under the clearance requirements of 44 U.S.C. § 3507.
Item 1. Reports to Stockholders.

Columbia Masters International Equity Portfolio
Annual Report for the Period Ended January 31, 2012
Not FDIC insured • No bank guarantee • May lose value
Table of Contents
| Portfolio Profile | | | 1 | | |
|
| Performance Information | | | 2 | | |
|
| Understanding Your Expenses | | | 3 | | |
|
| Portfolio Manager's Report | | | 4 | | |
|
| Portfolio of Investments | | | 6 | | |
|
Statement of Assets and
Liabilities | | | 9 | | |
|
| Statement of Operations | | | 11 | | |
|
Statement of Changes in
Net Assets | | | 12 | | |
|
| Financial Highlights | | | 14 | | |
|
| Notes to Financial Statements | | | 19 | | |
|
Report of Independent Registered
Public Accounting Firm | | | 28 | | |
|
| Federal Income Tax Information | | | 29 | | |
|
| Fund Governance | | | 30 | | |
|
Important Information About
This Report | | | 37 | | |
|
The views expressed in this report reflect the current views of the respective parties. These views are not guarantees of future performance and involve certain risks, uncertainties and assumptions that are difficult to predict, so actual outcomes and results may differ significantly from the views expressed. These views are subject to change at any time based upon economic, market or other conditions and the respective parties disclaim any responsibility to update such views. These views may not be relied on as investment advice and, because investment decisions for a Columbia Fund are based on numerous factors, may not be relied on as an indication of trading intent on behalf of any particular Columbia Fund. References to specific securities should not be construed as a recommendation or investment advice.
President's Message

Dear Shareholders,
Americans were dispirited in the fourth quarter of 2011 by Washington's inability to reach a plan for deficit reduction and Europe's piecemeal attempt to address its own fiscal issues. Yet, there was sufficient good news to encourage risk taking, buoying both stocks and bonds to solid gains.
U.S. economic data surprised on the upside and fears of recession abated. With the bar of expectations set low, investors responded positively to the announcement that the economy had expanded by 1.8% in the third quarter. Consumer confidence improved, even though consumers remain under pressure with no real increase in disposable income and a continued decline in household net worth. Headline inflation—which tracks a broad range of consumer expenditures, including food and energy—declined. Even manufacturing held its ground.
Against this backdrop, the U.S. equity markets logged solid returns. The S&P 500 Index gained 11.82%, moving into positive territory for the year with quarterly advances in all ten sectors. Mid- and small-cap stocks did even better. Value outperformed growth across all market capitalizations. Energy stocks led the market, as the price of oil moved above $100 a barrel in December. Industrials and materials stocks rose, buoyed by improving economic data. The U.S. fixed-income markets logged modest but solid returns. High-yield bonds were the best performers as the economy showed signs of improvement. Emerging market bonds were strong performers, as inflation came under control in key regions. Municipal bonds and Treasuries eked out only modest gains, as investors moved away from quality in favor of riskier assets.
While fourth quarter gains were encouraging, challenges still remain. Columbia Management, however, remains strong and steadfast. Columbia Management is the eighth largest manager of long-term mutual fund assets with $326 billion under management as of December 31, 2011. The past year has been one of considerable change for the organization as we worked diligently to align products, services and resources in the integration of Columbia Management with RiverSource Investments. The strong line-up of talent, resources and capabilities that has resulted is highlighted by the success of our products. As of December 31, 2011, Columbia Management offers 52 funds rated either 4 or 5 stars by Morningstar.*
For more information about these and other funds offered by Columbia Management, including detailed, up-to-date fund performance and portfolio information, please visit us online at columbiamanagement.com. Other information and resources available on our website include:
g timely economic analysis and market commentary
g quarterly fund commentaries
g Columbia Management Investor, a quarterly newsletter for shareholders
Thank you for your continued support of the Columbia Funds. We look forward to serving your investment needs for many years to come.
Best Regards,

J. Kevin Connaughton
President, Columbia Funds
*All ratings are based on Class Z shares as of 12/31/2011. Out of 119 Class Z share Columbia funds rated by Morningstar, 7 funds received a 5-star Overall Rating and 45 funds received a 4-star Overall Rating. The Overall Morningstar Rating for a retail mutual fund is derived from a weighted average of the performance figures associated with its 3-, 5- and 10-year (if applicable) Morningstar Rating metrics. For share classes that do not have a 3-, 5-, or 10-year actual performance history, the fund's independent Morningstar Rating metric is then compared against the retail mutual fund universe breakpoints to determine its hypothetical rating.
For each fund with at least a three-year history, Morningstar calculates a Morningstar RatingTM based on a Morningstar Risk-Adjusted Return measure that accounts for variation in a fund's monthly performance (including the effects of sales charges/loads, and redemption fees), placing more emphasis on downward variations and rewarding consistent performance. The top 10% of funds in each category receive 5 stars, the next 22.5% receive 4 stars, the next 35% receive 3 stars, the next 22.5% receive 2 stars and the bottom 10% receive 1 star. (Each share class is counted as a fraction of one fund within this scale and rated separately, which may cause slight variations in the distribution percentages.)
The Morningstar RatingTM is for Class Z shares only; other classes may have different performance characteristics and may have different ratings. ©2012 Morningstar, Inc. All Rights Reserved. The Morningstar information contained herein: (1) is proprietary to Morningstar and/or its content providers; (2) may not be copied or distributed; and (3) is not warranted to be accurate, complete or timely. Neither Morningstar nor its content providers are responsible for any damages or losses arising from any use of this information.
Investors should consider the investment objectives, risks, charges and expenses of a mutual fund carefully before investing. For a free prospectus, which contains this and other important information about the funds, visit columbiamanagement.com. The prospectus should be read carefully before investing.
Columbia Funds are distributed by Columbia Management Investment Distributors, Inc., member FINRA, and managed by Columbia Management Investment Advisers, LLC.
© 2012 Columbia Management Investment Advisers, LLC. All rights reserved.
Portfolio Profile – Columbia Masters International Equity Portfolio
Summary
g Effective January 31, 2012, the fiscal year end of Columbia Masters International Equity Portfolio was changed from March 31 to January 31.
g For the 10-month period that ended January 31, 2012, the portfolio's Class A shares returned –9.18% without sales charge.
g In a difficult period for the world's stock markets, the portfolio held up better than its benchmark, the MSCI EAFE Index1 (Net).
g Diversification across a broad range of markets and solid performance from underlying funds generally accounted for the portfolio's advantage against its benchmark.
Portfolio Management
Fred Copper has co-managed the portfolio since May 2010 and has been associated with the advisor or its predecessors since 2005.
Colin Moore has co-managed the portfolio since February 2009 and has been associated with the advisor or its predecessors since 2002.
1The Morgan Stanley Capital International Europe, Australasia, Far East (MSCI EAFE) Index (Net) is a free float-adjusted market capitalization Index that is designed to measure the equity market performance of developed markets, excluding the U.S. & Canada. As of December 2010, the MSCI EAFE Index (Net) consisted of the following 22 developed market country indices: Australia, Austria, Belgium, Denmark, Finland, France, Germany, Greece, Hong Kong, Ireland, Israel, Italy, Japan, the Netherlands, New Zealand, Norway, Portugal, Singapore, Spain, Sweden, Switzerland, and the United Kingdom.
Indices are not available for investment, are not professionally managed and do not reflect sales charges, fees, brokerage commissions, taxes or other expenses of investing. Securities in the fund may not match those in an index.
Performance data quoted represents past performance and current performance may be lower or higher. Past performance is no guarantee of future results. The investment return and principal value will fluctuate so that shares, when redeemed, may be worth more or less than the original cost. Please visit www.columbiamanagement.com for daily and most recent month-end performance updates.
Summary
10-month (cumulative) return
as of 01/31/12
| | | | –9.18% | |
|
|  | | | Class A shares
(without sales charge) | |
|
| | | | –10.47% | |
|
|  | | | MSCI EAFE Index (Net) | |
|
Morningstar Style BoxTM
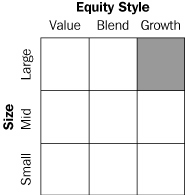
The Morningstar Style BoxTM is based on the fund's portfolio holdings as of period end. For equity funds, the vertical axis shows the market capitalization of the stocks owned, and the horizontal axis shows investment style (value, blend, or growth). Information shown is based on the most recent data provided by Morningstar.
© 2012 Morningstar, Inc. All rights reserved. The Morningstar information contained herein: (1) is proprietary to Morningstar and/or its content providers; (2) may not be copied or distributed; and (3) is not warranted to be accurate, complete or timely. Neither Morningstar nor its content providers are responsible for any damages or losses arising from any use of this information.
1
Performance Information – Columbia Masters International Equity Portfolio
Performance data quoted represents past performance and current performance may be lower or higher. Past performance is no guarantee of future results. The investment return and principal value will fluctuate so that shares, when redeemed, may be worth more or less than the original cost. Please visit www.columbiamanagement.com for daily and most recent month-end performance updates.
Performance of a $10,000 investment 02/15/06 – 01/31/12 ($)
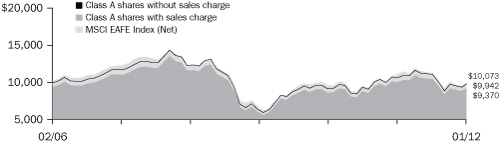
The chart above shows the change in value of a hypothetical $10,000 investment in Class A shares of Columbia Masters International Equity Portfolio during the stated time period, and does not reflect the deduction of taxes that a shareholder may pay on fund distributions or on the redemption of fund shares.
Performance of a $10,000 investment 02/15/06 – 01/31/12 ($)
| Sales charge | | without | | with | |
| Class A | | | 9,942 | | | | 9,370 | | |
| Class B | | | 9,510 | | | | 9,431 | | |
| Class C | | | 9,510 | | | | 9,510 | | |
| Class R | | | 9,779 | | | | n/a | | |
| Class Z | | | 10,085 | | | | n/a | | |
Average annual total return as of 01/31/12 (%)
| Share class | | A | | B | | C | | R | | Z | |
| Inception | | 02/15/06 | | 02/15/06 | | 02/15/06 | | 02/15/06 | | 02/15/06 | |
| Sales charge | | without | | with | | without | | with | | without | | with | | without | | without | |
| 10-mth | | | | | | | | | | | | | | | | | | | | | | | | | | | | | | | | | |
| (cumulative) | | | –9.18 | | | | –14.44 | | | | –9.86 | | | | –14.33 | | | | –9.75 | | | | –10.65 | | | | –9.36 | | | | –8.99 | | |
| 1-year | | | –6.84 | | | | –12.18 | | | | –7.65 | | | | –12.23 | | | | –7.54 | | | | –8.46 | | | | –7.14 | | | | –6.65 | | |
| 5-year | | | –3.38 | | | | –4.52 | | | | –4.12 | | | | –4.45 | | | | –4.10 | | | | –4.10 | | | | –3.65 | | | | –3.15 | | |
| Life | | | –0.10 | | | | –1.09 | | | | –0.84 | | | | –0.98 | | | | –0.84 | | | | –0.84 | | | | –0.37 | | | | 0.14 | | |
The "with sales charge" returns include the maximum initial sales charge of 5.75% for Class A shares, the applicable contingent deferred sales charge of 5.00% in the first year, declining to 1.00% in the sixth year and eliminated thereafter for Class B shares and 1.00% for Class C shares for the first year only. The "without sales charge" returns do not include the effect of sales charges. If they had, returns would be lower.
Performance results reflect any fee waivers or reimbursements of portfolio expenses by Columbia Management Investment Advisers, LLC (the Investment Manager) and/or any of its affiliates. Absent these fee waivers or expense reimbursement arrangements, performance results would have been lower.
All results shown assume the reinvestment of distributions. Class Z shares are sold at net asset value with no distribution and service (Rule 12b-1) fees. Class R shares are sold at net asset value with distribution (Rule 12b-1) fees. Class Z and Class R shares have limited eligibility and the investment minimum requirements may vary. Please see the portfolio's prospectus for details. Performance for different share classes will vary based on differences in sales charges and fees associated with each class.
2
Understanding Your Expenses – Columbia Masters International Equity Portfolio
As an investor, you incur two types of costs. There are transaction costs, which generally include sales charges on purchases and may include redemption fees. There are also ongoing costs, which generally include management fees, distribution and service (Rule 12b-1) fees, and other fund expenses. The following information is intended to help you understand your ongoing costs (in dollars) of investing in the Portfolio and to help you compare these costs with the ongoing costs of investing in other mutual funds.
Analyzing your fund's expenses
To illustrate these ongoing costs, we have provided examples and calculated the expenses paid by investors in each share class of the Portfolio during the period. The actual and hypothetical information in the table is based on an initial investment of $1,000 at the beginning of the period indicated and held for the entire period. Expense information is calculated two ways and each method provides you with different information. The amount listed in the "Actual" column is calculated using the Portfolio's actual operating expenses and total return for the period. You may use the Actual information, together with the amount invested, to estimate the expenses that you paid over the period. Simply divide your account value by $1,000 (for example, an $8,600 account value divided by $1,000 = 8.6), then multiply the results by the expenses paid during the period under the Actual column. The amount listed in the "Hypothetical" column assumes a 5% annual rate of return before expenses (which is not the Portfolio's actual return) and then applies the Portfolio's actual expense ratio for the period to the hypothetical return. You should not use the hypothetical account values and expenses to estimate either your actual account balance at the end of the period or the expenses you paid during the period. See "Compare with other funds" below for details on how to use the hypothetical data.
In addition to the ongoing expenses which the Portfolio bears directly, the Portfolio's shareholders indirectly bear the Portfolio's allocable share of the costs and expenses of each underlying fund in which the Portfolio invests. You can also estimate the effective expenses paid during the period, which includes the indirect fees associated with investing in the underlying funds, by using the amounts listed in the effective expenses paid during the period column.
Compare with other funds
Since all mutual funds are required to include the same hypothetical calculations about expenses in shareholder reports, you can use this information to compare the ongoing cost of investing in the Portfolio with other funds. To do so, compare the hypothetical example with the 5% hypothetical examples that appear in the shareholder reports of other funds. As you compare hypothetical examples of other funds, it is important to note that hypothetical examples are meant to highlight the ongoing costs of investing in a fund only and do not reflect any transaction costs, such as sales charges, or redemption or exchange fees. Therefore, the hypothetical calculations are useful in comparing ongoing costs only, and will not help you determine the relative total costs of owning different funds. If transaction costs were included in these calculations, your costs would be higher.
August 1, 2011 – January 31, 2012
| | | Account value
at the beginning
of the period ($) | | Account value
at the end
of the period ($) | | Expenses
paid during
the period ($) | | Portfolio's
annualized
expense
ratio (%) | | Effective
expenses paid
during the
period ($) | | Portfolio's
effective
annualized
expense
ratio (%) | |
| | | Actual | | Hypothetical | | Actual | | Hypothetical | | Actual | | Hypothetical | | Actual | | Actual | | Hypothetical | | Actual | |
| Class A | | | 1,000.00 | | | | 1,000.00 | | | | 894.00 | | | | 1,024.21 | | | | 1.21 | | | | 1.29 | | | | 0.25 | % | | | 6.56 | | | | 7.01 | | | | 1.36 | % | |
| Class B | | | 1,000.00 | | | | 1,000.00 | | | | 890.30 | | | | 1,020.38 | | | | 4.82 | | | | 5.15 | | | | 1.00 | % | | | 10.16 | | | | 10.86 | | | | 2.11 | % | |
| Class C | | | 1,000.00 | | | | 1,000.00 | | | | 891.30 | | | | 1,020.38 | | | | 4.82 | | | | 5.15 | | | | 1.00 | % | | | 10.17 | | | | 10.86 | | | | 2.11 | % | |
| Class R | | | 1,000.00 | | | | 1,000.00 | | | | 892.10 | | | | 1,022.98 | | | | 2.36 | | | | 2.53 | | | | 0.49 | % | | | 7.71 | | | | 8.25 | | | | 1.60 | % | |
| Class Z | | | 1,000.00 | | | | 1,000.00 | | | | 894.80 | | | | 1,025.48 | | | | — | | | | — | | | | 0.00 | % | | | 5.36 | | | | 5.73 | | | | 1.11 | % | |
Expenses paid during the period are equal to the annualized expense ratio for each class as indicated above, multiplied by the average account value over the period and then multiplied by the number of days in the Portfolio's most recent fiscal half year and divided by 365.
Expenses do not include fees and expenses incurred indirectly by the Portfolio from the underlying funds in which the Portfolio may invest (also referred to as "acquired funds"), including affiliated and non-affiliated pooled investments vehicles (including mutual funds and exchange traded funds).
Had Columbia Management Investment Advisers, LLC and/or any of its affiliates not waived/reimbursed a portion of fees and expenses, account value at the end of the period would have been reduced.
3
Portfolio Managers' Report – Columbia Masters International Equity Portfolio
Performance data quoted represents past performance and current performance may be lower or higher. Past performance is no guarantee of future results. The investment return and principal value will fluctuate so that shares, when redeemed, may be worth more or less than the original cost. Please visit www.columbiamanagement.com for daily and most recent month-end performance updates.
Net asset value per share
as of 01/31/12 ($)
| Class A | | | 7.87 | | |
| Class B | | | 7.86 | | |
| Class C | | | 7.86 | | |
| Class R | | | 7.85 | | |
| Class Z | | | 7.87 | | |
Distributions declared per share
04/01/11 – 01/31/12 ($)
| Class A | | | 0.10 | | |
| Class B | | | 0.05 | | |
| Class C | | | 0.05 | | |
| Class R | | | 0.08 | | |
| Class Z | | | 0.11 | | |
For the 10-month period that ended January 31, 2012, the portfolio's Class A shares returned –9.18% without sales charge. In a period that was generally difficult for international stock markets, the portfolio held up better than its benchmark, the MSCI EAFE Index (Net), which returned –10.47% over the same period. The portfolio invests in shares of four Columbia funds: Columbia Acorn International, Columbia Emerging Markets Fund, Columbia Pacific/Asia Fund and Columbia European Equity Fund. We believe that the portfolio's diversification across regions and markets aided returns during this volatile period. In addition, solid performance from the portfolio's underlying funds helped cushion losses.
A volatile period for international stock markets
Fears of a global recession and continuing financial crisis plagued international stock markets throughout most of the 10-month period. In Europe, concerns were directly tied to sovereign debt issues in the peripheral countries of Greece, Italy, Spain, Portugal and Ireland. Markets also contended with lower expectations for global growth and inflation and monetary policy tightening in emerging markets. Concerns over inflation abated as the year progressed, but Europe's debt problems lingered. The combination of these factors led to a period of significant equity weakness and exceptional volatility. Yet, near the end of the period, there was sufficient good news to encourage some risk taking, buoying international stock markets in the final months of the period.
Underlying funds helped returns
Two of the four Columbia funds in the portfolio performed better than their individual benchmarks. Columbia European Equity Fund, which accounts for approximately 60% of the portfolio's assets, ended the period with close to a two percentage point advantage over its benchmark, the MSCI Europe Index (Net). The fund had less exposure than the index to Europe's troubled countries—Greece, Ireland and Italy, which helped minimize losses. Columbia Acorn International also held up better than its benchmarks, the S&P Global Ex-U.S. $500 million – $5 billion Index, the S&P Global Ex-U.S. Small Cap Index and the MSCI EAFE (Net). Notwithstanding the devastating Japanese tsunami and associated nuclear catastrophe in the spring of 2011, Japanese equities proved to be among the best performers for Columbia Acorn International. The fund's Japanese holdings fell less than 1% (in U.S.dollars), buoyed in part by an appreciating yen. Columbia Emerging Markets Fund and Columbia Pacific/Asia Fund generated returns that were generally in line with their benchmarks.
Looking ahead
We believe that several major catalysts will affect global risk and the opportunity for continued growth in international markets in 2012. In Europe, all eyes are on euro zone leaders to make real progress in solving the region's debt crisis. Until that occurs, we are reasonably cautious on Europe, given a backdrop of slower economic activity. In emerging markets, we see the potential for positive benefits from lower inflation and more favorable monetary policy. Central banks are beginning to ease policy in order to stimulate growth in domestic economies. Emerging market balance sheets are generally quite strong and should allow for further fiscal stimulus, if required, to boost
4
Portfolio Managers' Report (continued) – Columbia Masters International Equity Portfolio
growth. Favorable demographics and ongoing urbanization are also positive factors, especially in Asia. And finally, valuations are generally attractive in both developed foreign and emerging stock markets, which improves prospects for 2012.
Portfolio characteristics and holdings are subject to change periodically and may not be representative of current characteristics and holdings. The outlook for this portfolio may differ from that presented for other Columbia Funds.
Asset allocation cannot eliminate the risk of fluctuating prices and uncertain returns.
The portfolio is a "fund of funds."
A fund of funds bears its allocable share of the costs and expenses of the underlying funds in which it invests. Such funds are thus subject to two levels of fees and a potentially higher expense ratio than would be associated with an investment in an investment fund that invests and trades directly in financial instruments under the direction of a single manager. Risks, among others, include stock market fluctuations due to business and economic developments.
Stocks of small- and mid-cap companies may pose special risks, including possible illiquidity and greater price volatility than stocks of larger, more established companies.
Value stocks are stocks of companies that may have experienced adverse business or industry developments or may be subject to special risks that have caused the stocks to be out of favor. If the manager's assessment of a company's prospects is wrong, the price of its stock may not approach the value the manager has placed on it.
International investing involves special risks, including foreign taxation, currency risks, risks associated with possible differences in financial standards and other risks associated with future political and economic developments.
Investing in emerging markets may involve greater risks than investing in more developed countries. In addition, concentration of investments in a single region may result in greater volatility.
5
Portfolio of Investments – Columbia Masters International Equity Portfolio
January 31, 2012
(Percentages represent value of investments compared to net assets)
| | | Shares | | Value | |
| Equity Funds 100.2% | |
| International 100.2% | |
| Columbia Acorn International(a) | | | 88,499 | | | $ | 3,267,380 | | |
| Columbia Pacific/Asia Fund(a) | | | 2,072,677 | | | | 16,291,243 | | |
| Columbia Emerging Markets Fund(a)(b) | | | 672,136 | | | | 6,533,160 | | |
| Columbia European Equity Fund(a) | | | 7,121,503 | | | | 38,883,406 | | |
| Total | | | 64,975,189 | | |
Total Equity Funds
(Cost: $69,700,922) | | $ | 64,975,189 | | |
| | | Shares | | Value | |
| Money Market Funds —% | |
| Columbia Short-Term Cash Fund, 0.134%(a)(c) | | | 7 | | | $ | 7 | | |
Total Money Market Funds
(Cost: $7) | | | | | | $ | 7 | | |
Total Investments in Affiliated Funds
(Cost: $69,700,929) | | | | $ | 64,975,196 | | |
| Other Assets and Liabilities | | | | | | | (156,552 | ) | |
| Net Assets | | | | | | $ | 64,818,644 | | |
| Forward Foreign Currency Exchange Contracts Open at January 31, 2012 | |
| Counterparty | | Exchange Date | | Currency to be
Delivered | | Currency to be
Received | | Unrealized
Appreciation | | Unrealized
Depreciation | |
| HSBC Securities (USA), Inc. | | Feb. 10, 2012
| | | 6,290,000
(EUR) | | | | 8,055,623
(USD) | | | $ | —
| | | $ | (172,127
| ) | |
| Citigroup Global Markets, Inc. | | Feb. 10, 2012
| | | 382,448,000
(JPY) | | | | 4,981,444
(USD) | | | | —
| | | | (36,655
| ) | |
| Credit Suisse | | Feb. 10, 2012
| | | 4,051,000
(NZD) | | | | 3,259,374
(USD) | | | | —
| | | | (83,552
| ) | |
| Barclays Bank PLC | | Feb. 10, 2012
| | | 3,260,337
(USD) | | | | 3,118,000
(AUD) | | | | 47,019
| | | | —
| | |
| Goldman, Sachs & Co. | | Feb. 10, 2012
| | | 4,850,869
(USD) | | | | 28,999,000
(NOK) | | | | 90,349
| | | | —
| | |
| State Street Bank & Trust Company | | Feb. 10, 2012
| | | 8,086,883
(USD) | | | | 55,602,000
(SEK) | | | | 83,830
| | | | —
| | |
| Citigroup Global Markets, Inc. | | March 5, 2012
| | | 1,203,000
(BRL) | | | | 645,733
(USD) | | | | —
| | | | (37,261
| ) | |
| Citigroup Global Markets, Inc. | | March 5, 2012
| | | 842,000
(GBP) | | | | 1,303,374
(USD) | | | | —
| | | | (23,124
| ) | |
| Citigroup Global Markets, Inc. | | March 5, 2012
| | | 3,006,901,000
(IDR) | | | | 323,671
(USD) | | | | —
| | | | (9,810
| ) | |
| Citigroup Global Markets, Inc. | | March 5, 2012
| | | 35,052,000
(INR) | | | | 651,524
(USD) | | | | —
| | | | (51,955
| ) | |
| Citigroup Global Markets, Inc. | | March 5, 2012
| | | 3,010,120,000
(KRW) | | | | 2,592,696
(USD) | | | | —
| | | | (80,209
| ) | |
| Citigroup Global Markets, Inc. | | March 5, 2012
| | | 1,847,000
(MYR) | | | | 583,570
(USD) | | | | —
| | | | (22,209
| ) | |
| Citigroup Global Markets, Inc. | | March 5, 2012
| | | 14,275,000
(PHP) | | | | 322,351
(USD) | | | | —
| | | | (9,626
| ) | |
| Citigroup Global Markets, Inc. | | March 5, 2012
| | | 14,437,000
(THB) | | | | 453,994
(USD) | | | | —
| | | | (11,746
| ) | |
| Citigroup Global Markets, Inc. | | March 5, 2012
| | | 59,204,000
(TWD) | | | | 1,952,961
(USD) | | | | —
| | | | (48,944
| ) | |
| Citigroup Global Markets, Inc. | | March 5, 2012
| | | 4,287,000
(ZAR) | | | | 519,070
(USD) | | | | —
| | | | (26,503
| ) | |
| Citigroup Global Markets, Inc. | | March 5, 2012
| | | 2,907,329
(USD) | | | | 2,852,000
(AUD) | | | | 109,980
| | | | —
| | |
| Citigroup Global Markets, Inc. | | March 5, 2012
| | | 912,439
(USD) | | | | 867,000
(CHF) | | | | 29,845
| | | | —
| | |
| Citigroup Global Markets, Inc. | | March 5, 2012
| | | 219,085
(USD) | | | | 171,000
(EUR) | | | | 4,605
| | | | —
| | |
| Citigroup Global Markets, Inc. | | March 5, 2012
| | | 392,101
(USD) | | | | 1,509,000
(ILS) | | | | 10,598
| | | | —
| | |
| Citigroup Global Markets, Inc. | | March 5, 2012
| | | 6,998,899
(USD) | | | | 539,229,000
(JPY) | | | | 78,124
| | | | —
| | |
| Citigroup Global Markets, Inc. | | March 5, 2012
| | | 394,150
(USD) | | | | 2,296,000
(NOK) | | | | —
| | | | (3,290
| ) | |
| Citigroup Global Markets, Inc. | | March 5, 2012
| | | 519,205
(USD) | | | | 671,000
(SGD) | | | | 14,238
| | | | —
| | |
| Total | | | | | | | | $ | 468,588 | | | $ | (617,011 | ) | |
The Accompanying Notes to Financial Statements are an integral part of this statement.
6
Columbia Masters International Equity Portfolio
January 31, 2012
Notes to Investments in Affiliated Funds
(a) Investment in affiliated mutual fund advised by Columbia Management Investment Advisers, LLC or one of its affiliates.
(b) Non-income producing.
(c) The rate shown is the seven-day current annualized yield at January 31, 2012.
Currency Legend
AUD Australian Dollar
BRL Brazilian Real
CHF Swiss Franc
EUR Euro
GBP Pound Sterling
IDR Indonesian Rupiah
ILS Israeli Shekel
INR Indian Rupee
JPY Japanese Yen
KRW Korean Won
MYR Malaysia Ringgits
NOK Norwegian Krone
NZD New Zealand Dollar
PHP Philippine Peso
SEK Swedish Krona
SGD Singapore Dollar
THB Thailand Baht
TWD Taiwan Dollar
USD US Dollar
ZAR South African Rand
Fair Value Measurements
Generally accepted accounting principles (GAAP) require disclosure regarding the inputs and valuation techniques used to measure fair value and any changes in valuation inputs or techniques. In addition, investments shall be disclosed by major category.
The Fund categorizes its fair value measurements according to a three-level hierarchy that maximizes the use of observable inputs and minimizes the use of unobservable inputs by prioritizing that the most observable input be used when available. Observable inputs are those that market participants would use in pricing an investment based on market data obtained from sources independent of the reporting entity. Unobservable inputs are those that reflect the Fund's assumptions about the information market participants would use in pricing an investment. An investment's level within the fair value hierarchy is based on the lowest level of any input that is deemed significant to the asset or liability's fair value measurement. The input levels are not necessarily an indication of the risk or liquidity associated with investments at that level. For example, certain U.S. government securities are generally high quality and liquid, however, they are reflected as Level 2 because the inputs used to determine fair value may not always be quoted prices in an active market.
Fair value inputs are summarized in the three broad levels listed below:
• Level 1 — Valuations based on quoted prices for investments in active markets that the Fund has the ability to access at the measurement date (to include NAV for open-end mutual funds). Valuation adjustments are not applied to Level 1 investments.
• Level 2 — Valuations based on other significant observable inputs (including quoted prices for similar securities, interest rates, prepayment speeds, credit risks, etc.).
• Level 3 — Valuations based on significant unobservable inputs (including the Fund's own assumptions and judgment in determining the fair value of investments).
Inputs that are used in determining fair value of an investment may include price information, credit data, volatility statistics, and other factors. These inputs can be either observable or unobservable. The availability of observable inputs can vary between investments, and is affected by various factors such as the type of investment, and the volume and level of activity for that investment or similar investments in the marketplace. The inputs will be considered by the Investment Manager, along with any other relevant factors in the calculation of an investment's fair value. The Fund uses prices and inputs that are current as of the measurement date, which may include periods of market dislocations. During these periods, the availability of prices and inputs may be reduced for many investments. This condition could cause an investment to be reclassified between the various levels within the hierarchy.
Investments falling into the Level 3 category are primarily supported by quoted prices from brokers and dealers participating in the market for those investments. However, these may be classified as Level 3 investments due to lack of market transparency and corroboration to support these quoted prices. Additionally, valuation models may be used as the pricing source for any remaining investments classified as Level 3. These models rely on one or more significant unobservable inputs and/or significant assumptions by the Investment Manager. Inputs used in a valuation model may include, but are not limited to, financial statement analysis, discount rates and estimated cash flows, and comparable company data.
The Accompanying Notes to Financial Statements are an integral part of this statement.
7
Columbia Masters International Equity Portfolio
January 31, 2012
Fair Value Measurements (continued)
The following table is a summary of the inputs used to value the Fund's investments as of January 31, 2012:
| | | Fair Value at January 31, 2012 | |
| Description | | Level 1
Quoted Prices
in Active
Markets for
Identical Assets(a) | | Level 2
Other
Significant
Observable
Inputs | | Level 3
Significant
Unobservable
Inputs | | Total | |
| Investments in Affilated Funds | | $ | 64,975,196 | | | $ | — | | | $ | — | | | $ | 64,975,196 | | |
| Total Investments in Affiliated Funds | | | 64,975,196 | | | | — | | | | — | | | | 64,975,196 | | |
| Derivatives(b) | |
Assets
Forward Foreign Currency Exchange Contracts | | | — | | | | 468,588 | | | | — | | | | 468,588 | | |
Liabilities
Forward Foreign Currency Exchange Contracts | | | — | | | | (617,011 | ) | | | — | | | | (617,011 | ) | |
| Total | | $ | 64,975,196 | | | $ | (148,423 | ) | | $ | — | | | $ | 64,826,773 | | |
(a) There were no significant transfers between Levels 1 and 2 during the period.
(b) Derivative instruments are valued at unrealized appreciation (depreciation).
The Accompanying Notes to Financial Statements are an integral part of this statement.
8
Statement of Assets and Liabilities – Columbia Masters International Equity Portfolio
January 31, 2012
| Assets | |
| Investments in affiliated funds, at value | |
| (identified cost $69,700,929) | | $ | 64,975,196 | | |
| Unrealized appreciation on forward foreign currency exchange contracts | | | 468,588 | | |
| Receivable for: | |
| Affiliated investments sold | | | 341,123 | | |
| Capital shares sold | | | 13,422 | | |
| Expense reimbursement due from Investment Manager | | | 1,179 | | |
| Prepaid expense | | | 3,177 | | |
| Total assets | | | 65,802,685 | | |
| Liabilities | |
| Unrealized depreciation on forward foreign currency exchange contracts | | | 617,011 | | |
| Payable for: | |
| Affiliated investments purchased | | | 125,568 | | |
| Capital shares purchased | | | 105,893 | | |
| Distribution and service fees | | | 377 | | |
| Transfer agent fees | | | 18,833 | | |
| Administration fees | | | 35 | | |
| Other expenses | | | 116,324 | | |
| Total liabilities | | | 984,041 | | |
| Net assets applicable to outstanding capital stock | | $ | 64,818,644 | | |
The Accompanying Notes to Financial Statements are an integral part of this statement.
9
Statement of Assets and Liabilities (continued) – Columbia Masters International Equity Portfolio
January 31, 2012
| Represented by | |
| Paid-in capital | | $ | 161,130,430 | | |
| Undistributed net investment income | | | 450,752 | | |
| Accumulated net realized loss | | | (91,888,382 | ) | |
| Unrealized appreciation (depreciation) on: | |
| Affiliated investments | | | (4,725,733 | ) | |
| Forward foreign currency exchange contracts | | | (148,423 | ) | |
| Total — representing net assets applicable to outstanding capital stock | | $ | 64,818,644 | | |
| Net assets applicable to outstanding shares | |
| Class A | | $ | 25,068,647 | | |
| Class B | | $ | 2,027,502 | | |
| Class C | | $ | 5,485,859 | | |
| Class R | | $ | 49,182 | | |
| Class Z | | $ | 32,187,454 | | |
| Shares outstanding | |
| Class A | | | 3,187,039 | | |
| Class B | | | 257,846 | | |
| Class C | | | 698,360 | | |
| Class R | | | 6,264 | | |
| Class Z | | | 4,089,879 | | |
| Net asset value per share | |
| Class A(a) | | $ | 7.87 | | |
| Class B | | $ | 7.86 | | |
| Class C | | $ | 7.86 | | |
| Class R | | $ | 7.85 | | |
| Class Z | | $ | 7.87 | | |
(a) The maximum offering price per share for Class A is $8.35. The offering price is calculated by dividing the net asset value by 1.0 minus the maximum sales charge of 5.75%.
The Accompanying Notes to Financial Statements are an integral part of this statement.
10
Statement of Operations – Columbia Masters International Equity Portfolio
| | | Year ended
Jan. 31, 2012(a) | | Year ended
March 31, 2011 | |
| Net investment income | |
| Income: | |
| Dividend distributions from underlying affiliated funds | | $ | 886,815 | | | $ | 2,363,828 | | |
| Expenses: | |
| Distribution fees | |
| Class B | | | 15,778 | | | | 25,546 | | |
| Class C | | | 42,070 | | | | 70,263 | | |
| Class R | | | 110 | | | | 125 | | |
| Service fees | |
| Class B | | | 5,258 | | | | 8,511 | | |
| Class C | | | 14,024 | | | | 23,396 | | |
| Distribution and service fees — Class A | | | 67,829 | | | | 112,843 | | |
| Transfer agent fees | |
| Class A | | | 53,038 | | | | 67,594 | | |
| Class B | | | 4,093 | | | | 5,112 | | |
| Class C | | | 10,872 | | | | 13,973 | | |
| Class R | | | 42 | | | | 37 | | |
| Class Z | | | 70,744 | | | | 85,725 | | |
| Administration fees | | | 14,245 | | | | — | | |
| Compensation of board members | | | 9,636 | | | | 30,131 | | |
| Stockholders' meeting fees | | | 106 | | | | — | | |
| Pricing and bookkeeping fees | | | 509 | | | | 27,115 | | |
| Custodian fees | | | 5,858 | | | | 5,386 | | |
| Printing and postage fees | | | 57,197 | | | | 91,961 | | |
| Registration fees | | | 64,268 | | | | 63,004 | | |
| Professional fees | | | 60,648 | | | | 66,057 | | |
| Chief compliance officer expenses | | | 30 | | | | 1,096 | | |
| Other | | | 13,308 | | | | 6,753 | | |
| Total expenses | | | 509,663 | | | | 704,628 | | |
| Fees waived or expenses reimbursed by Investment Manager and its affiliates | | | (364,519 | ) | | | (463,944 | ) | |
| Expense reductions | | | (148 | ) | | | (1 | ) | |
| Total net expenses | | | 144,996 | | | | 240,683 | | |
| Net investment income | | | 741,819 | | | | 2,123,145 | | |
| Realized and unrealized gain (loss) — net | |
| Net realized gain (loss) on: | |
| Sales of underlying affiliated funds | | | (1,610,120 | ) | | | (32,550,340 | ) | |
| Capital gain distributions from underlying affiliated funds | | | 501,156 | | | | — | | |
| Forward foreign currency exchange contracts | | | 578,558 | | | | — | | |
| Net realized loss | | | (530,406 | ) | | | (32,550,340 | ) | |
| Net change in unrealized appreciation (depreciation) on: | |
| Investments — affiliated issuers | | | (9,300,064 | ) | | | 42,289,227 | | |
| Forward foreign currency exchange contracts | | | (148,423 | ) | | | — | | |
| Net change in unrealized appreciation (depreciation) | | | (9,448,487 | ) | | | 42,289,227 | | |
| Net realized and unrealized gain (loss) | | | (9,978,893 | ) | | | 9,738,887 | | |
| Net change in net assets resulting from operations | | $ | (9,237,074 | ) | | $ | 11,862,032 | | |
(a) For the period from April 1, 2011 to January 31, 2012.
The Accompanying Notes to Financial Statements are an integral part of this statement.
11
Statement of Changes in Net Assets – Columbia Masters International Equity Portfolio
| | | Year ended
Jan. 31, 2012(a) | | Year ended
March 31, 2011 | | Year ended
March 31, 2010 | |
| Operations | |
| Net investment income | | $ | 741,819 | | | $ | 2,123,145 | | | $ | 5,124,789 | | |
| Net realized loss | | | (530,406 | ) | | | (32,550,340 | ) | | | (22,127,081 | ) | |
| Net change in unrealized appreciation (depreciation) | | | (9,448,487 | ) | | | 42,289,227 | | | | 75,038,404 | | |
| Net increase (decrease) in net assets resulting from operations | | | (9,237,074 | ) | | | 11,862,032 | | | | 58,036,112 | | |
| Distributions to shareholders from: | |
| Net investment income | |
| Class A | | | (330,929 | ) | | | (2,202,252 | ) | | | (1,162,782 | ) | |
| Class B | | | (13,728 | ) | | | (124,341 | ) | | | (29,094 | ) | |
| Class C | | | (37,257 | ) | | | (338,096 | ) | | | (79,794 | ) | |
| Class R | | | (369 | ) | | | (1,323 | ) | | | (433 | ) | |
| Class Z | | | (487,342 | ) | | | (3,064,636 | ) | | | (1,875,064 | ) | |
| Total distributions to shareholders | | | (869,625 | ) | | | (5,730,648 | ) | | | (3,147,167 | ) | |
| Decrease in net assets from share transactions | | | (33,477,580 | ) | | | (34,562,344 | ) | | | (33,028,724 | ) | |
| Redemption fees | | | — | | | | — | | | | 938 | | |
| Total increase (decrease) in net assets | | | (43,584,279 | ) | | | (28,430,960 | ) | | | 21,861,159 | | |
| Net assets at beginning of year | | | 108,402,923 | | | | 136,833,883 | | | | 114,972,724 | | |
| Net assets at end of year | | $ | 64,818,644 | | | $ | 108,402,923 | | | $ | 136,833,883 | | |
| Undistributed net investment income | | $ | 450,752 | | | $ | — | | | $ | 3,552,388 | | |
(a) For the period from April 1, 2011 to January 31, 2012.
The Accompanying Notes to Financial Statements are an integral part of this statement.
12
Statement of Changes in Net Assets (continued) – Columbia Masters International Equity Portfolio
| | | Year ended Jan. 31, 2012(a) | | Year ended March 31, 2011 | | Year ended March 31, 2010 | |
| | | Shares | | Dollars ($) | | Shares | | Dollars ($) | | Shares | | Dollars ($) | |
| Capital stock activity | |
| Class A shares | |
| Subscriptions | | | 239,852 | | | | 1,967,901 | | | | 262,902 | | | | 2,132,786 | | | | 860,237 | | | | 6,474,067 | | |
| Distributions reinvested | | | 31,876 | | | | 235,242 | | | | 223,830 | | | | 1,698,913 | | | | 148,393 | | | | 1,091,724 | | |
| Redemptions | | | (1,782,769 | ) | | | (14,476,248 | ) | | | (2,218,381 | ) | | | (17,966,365 | ) | | | (2,688,107 | ) | | | (20,377,765 | ) | |
| Net decrease | | | (1,511,041 | ) | | | (12,273,105 | ) | | | (1,731,649 | ) | | | (14,134,666 | ) | | | (1,679,477 | ) | | | (12,811,974 | ) | |
| Class B shares | |
| Subscriptions | | | 3,611 | | | | 31,983 | | | | 8,062 | | | | 64,000 | | | | 45,790 | | | | 340,223 | | |
| Distributions reinvested | | | 953 | | | | 7,033 | | | | 12,356 | | | | 92,087 | | | | 3,423 | | | | 25,770 | | |
| Redemptions | | | (104,870 | ) | | | (855,978 | ) | | | (144,060 | ) | | | (1,173,513 | ) | | | (128,083 | ) | | | (968,770 | ) | |
| Net decrease | | | (100,306 | ) | | | (816,962 | ) | | | (123,642 | ) | | | (1,017,426 | ) | | | (78,870 | ) | | | (602,777 | ) | |
| Class C shares | |
| Subscriptions | | | 11,959 | | | | 96,428 | | | | 53,320 | | | | 427,667 | | | | 88,936 | | | | 682,997 | | |
| Distributions reinvested | | | 3,291 | | | | 24,258 | | | | 32,952 | | | | 249,551 | | | | 7,447 | | | | 56,125 | | |
| Redemptions | | | (342,370 | ) | | | (2,893,474 | ) | | | (343,277 | ) | | | (2,768,247 | ) | | | (489,572 | ) | | | (3,645,416 | ) | |
| Net decrease | | | (327,120 | ) | | | (2,772,788 | ) | | | (257,005 | ) | | | (2,091,029 | ) | | | (393,189 | ) | | | (2,906,294 | ) | |
| Class R shares | |
| Subscriptions | | | 4,508 | | | | 34,553 | | | | 1,589 | | | | 13,173 | | | | 3,559 | | | | 27,333 | | |
| Distributions reinvested | | | 48 | | | | 351 | | | | 99 | | | | 740 | | | | 58 | | | | 431 | | |
| Redemptions | | | (525 | ) | | | (1,227 | ) | | | (3,279 | ) | | | (26,273 | ) | | | (4,632 | ) | | | (35,426 | ) | |
| Net increase (decrease) | | | 4,031 | | | | 33,677 | | | | (1,591 | ) | | | (12,360 | ) | | | (1,015 | ) | | | (7,662 | ) | |
| Class Z shares | |
| Subscriptions | | | 145,916 | | | | 1,220,541 | | | | 616,761 | | | | 5,026,829 | | | | 1,509,342 | | | | 11,298,156 | | |
| Distributions reinvested | | | 5,503 | | | | 40,616 | | | | 22,151 | | | | 167,907 | | | | 14,075 | | | | 104,306 | | |
| Redemptions | | | (2,325,700 | ) | | | (18,909,559 | ) | | | (2,764,352 | ) | | | (22,501,599 | ) | | | (3,692,821 | ) | | | (28,102,479 | ) | |
| Net decrease | | | (2,174,281 | ) | | | (17,648,402 | ) | | | (2,125,440 | ) | | | (17,306,863 | ) | | | (2,169,404 | ) | | | (16,700,017 | ) | |
| Total net decrease | | | (4,108,717 | ) | | | (33,477,580 | ) | | | (4,239,327 | ) | | | (34,562,344 | ) | | | (4,321,955 | ) | | | (33,028,724 | ) | |
(a) For the period from April 1, 2011 to January 31, 2012.
The Accompanying Notes to Financial Statements are an integral part of this statement.
13
Financial Highlights – Columbia Masters International Equity Portfolio
The following tables are intended to help you understand the Portfolio's financial performance. Certain information reflects financial results for a single share of a class held for the periods shown. Per share net investment income (loss) amounts are calculated based on average shares outstanding during the period. Total returns assume reinvestment of all dividends and distributions. Total returns do not reflect payment of sales charges, if any, and are not annualized for periods of less than one year.
| | | Year ended
Jan. 31, | | Year ended March 31, | |
| | | 2012(a) | | 2011 | | 2010 | | 2009 | | 2008 | | 2007 | |
| Class A | |
| Per share data | |
| Net asset value, beginning of period | | $ | 8.78 | | | $ | 8.24 | | | $ | 5.49 | | | $ | 11.14 | | | $ | 11.69 | | | $ | 10.26 | | |
| Income from investment operations: | |
| Net investment income | | | 0.07 | | | | 0.15 | | | | 0.27 | | | | 0.05 | | | | 0.17 | | | | 0.15 | | |
| Net realized and unrealized gain (loss) | | | (0.88 | ) | | | 0.78 | | | | 2.64 | | | | (5.14 | ) | | | 0.11 | | | | 1.63 | | |
| Total from investment operations | | | (0.81 | ) | | | 0.93 | | | | 2.91 | | | | (5.09 | ) | | | 0.28 | | | | 1.78 | | |
| Less distributions to shareholders from: | |
| Net investment income | | | (0.10 | ) | | | (0.39 | ) | | | (0.16 | ) | | | — | | | | (0.13 | ) | | | (0.07 | ) | |
| Net realized gains | | | — | | | | — | | | | — | | | | (0.56 | ) | | | (0.70 | ) | | | (0.28 | ) | |
| Total distributions to shareholders | | | (0.10 | ) | | | (0.39 | ) | | | (0.16 | ) | | | (0.56 | ) | | | (0.83 | ) | | | (0.35 | ) | |
| Redemption fees: | |
| Redemption fees added to paid-in-capital | | | — | | | | — | | | | (0.00 | )(b) | | | (0.00 | )(b) | | | (0.00 | )(b) | | | (0.00 | )(b) | |
| Net asset value, end of period | | $ | 7.87 | | | $ | 8.78 | | | $ | 8.24 | | | $ | 5.49 | | | $ | 11.14 | | | $ | 11.69 | | |
| Total return | | | (9.18 | %) | | | 12.08 | % | | | 53.33 | % | | | (48.03 | %) | | | 1.76 | % | | | 17.39 | % | |
| Ratios to average net assets(c) | |
| Expenses prior to fees waived or expenses reimbursed | | | 0.76 | %(d) | | | 0.65 | % | | | 0.53 | % | | | 0.51 | % | | | 0.47 | % | | | 0.84 | % | |
| Net expenses after fees waived or expenses reimbursed(e) | | | 0.25 | %(d)(f) | | | 0.25 | %(f) | | | 0.25 | %(f) | | | 0.25 | %(f) | | | 0.25 | %(f) | | | 0.25 | %(f) | |
| Net investment income | | | 1.01 | %(d)(f) | | | 1.80 | %(f) | | | 3.50 | %(f) | | | 0.56 | %(f) | | | 1.39 | %(f) | | | 1.31 | %(f) | |
| Supplemental data | |
| Net assets, end of period (in thousands) | | $ | 25,069 | | | $ | 41,237 | | | $ | 53,013 | | | $ | 44,548 | | | $ | 119,670 | | | $ | 75,289 | | |
| Portfolio turnover | | | 3 | % | | | 95 | % | | | 2 | % | | | 20 | % | | | 3 | % | | | 1 | % | |
| Notes to Financial Highlights | |
(a) For the period from April 1, 2011 to January 31, 2012. During the period, the Portfolio's fiscal year end was changed from March 31 to January 31.
(b) Rounds to less than $0.01.
(c) In addition to the fees and expenses which the Portfolio bears directly, the Portfolio indirectly bears a pro rata share of the fees and expenses of the acquired funds in which it invests. Such indirect expenses are not included in the reported expense ratios.
(d) Annualized.
(e) The Investment Manager and certain of its affiliates agreed to waive/reimburse certain fees and expenses, if applicable.
(f) The benefits derived from expense reductions had an impact of less than 0.01%.
The accompanying Notes to Financial Statements are an integral part of this statement.
14
Financial Highlights (continued) – Columbia Masters International Equity Portfolio
| | | Year ended
Jan. 31, | | Year ended March 31, | |
| | | 2012(a) | | 2011 | | 2010 | | 2009 | | 2008 | | 2007 | |
| Class B | |
| Per share data | |
| Net asset value, beginning of period | | $ | 8.78 | | | $ | 8.20 | | | $ | 5.43 | | | $ | 11.09 | | | $ | 11.66 | | | $ | 10.26 | | |
| Income from investment operations: | |
| Net investment income (loss) | | | 0.02 | | | | 0.08 | | | | 0.21 | | | | (0.01 | ) | | | 0.07 | | | | 0.10 | | |
| Net realized and unrealized gain (loss) | | | (0.89 | ) | | | 0.79 | | | | 2.62 | | | | (5.09 | ) | | | 0.12 | | | | 1.59 | | |
| Total from investment operations | | | (0.87 | ) | | | 0.87 | | | | 2.83 | | | | (5.10 | ) | | | 0.19 | | | | 1.69 | | |
| Less distributions to shareholders from: | |
| Net investment income | | | (0.05 | ) | | | (0.29 | ) | | | (0.06 | ) | | | — | | | | (0.06 | ) | | | (0.01 | ) | |
| Net realized gains | | | — | | | | — | | | | — | | | | (0.56 | ) | | | (0.70 | ) | | | (0.28 | ) | |
| Total distributions to shareholders | | | (0.05 | ) | | | (0.29 | ) | | | (0.06 | ) | | | (0.56 | ) | | | (0.76 | ) | | | (0.29 | ) | |
| Redemption fees: | |
| Redemption fees added to paid-in-capital | | | — | | | | — | | | | (0.00 | )(b) | | | (0.00 | )(b) | | | (0.00 | )(b) | | | (0.00 | )(b) | |
| Net asset value, end of period | | $ | 7.86 | | | $ | 8.78 | | | $ | 8.20 | | | $ | 5.43 | | | $ | 11.09 | | | $ | 11.66 | | |
| Total return | | | (9.86 | %) | | | 11.18 | % | | | 52.13 | % | | | (48.35 | %) | | | 1.03 | % | | | 16.50 | % | |
| Ratios to average net assets(c) | |
| Expenses prior to fees waived or expenses reimbursed | | | 1.51 | %(d) | | | 1.40 | % | | | 1.28 | % | | | 1.26 | % | | | 1.22 | % | | | 1.59 | % | |
| Net expenses after fees waived or expenses reimbursed(e) | | | 1.00 | %(d)(f) | | | 1.00 | %(f) | | | 1.00 | %(f) | | | 1.00 | %(f) | | | 1.00 | %(f) | | | 1.00 | %(f) | |
| Net investment income (loss) | | | 0.26 | %(d)(f) | | | 1.05 | %(f) | | | 2.73 | %(f) | | | (0.18 | %)(f) | | | 0.55 | %(f) | | | 0.93 | %(f) | |
| Supplemental data | |
| Net assets, end of period (in thousands) | | $ | 2,028 | | | $ | 3,143 | | | $ | 3,950 | | | $ | 3,043 | | | $ | 7,490 | | | $ | 5,960 | | |
| Portfolio turnover | | | 3 | % | | | 95 | % | | | 2 | % | | | 20 | % | | | 3 | % | | | 1 | % | |
| Notes to Financial Highlights | |
(a) For the period from April 1, 2011 to January 31, 2012. During the period, the Portfolio's fiscal year end was changed from March 31 to January 31.
(b) Rounds to less than $0.01.
(c) In addition to the fees and expenses which the Portfolio bears directly, the Portfolio indirectly bears a pro rata share of the fees and expenses of the acquired funds in which it invests. Such indirect expenses are not included in the reported expense ratios.
(d) Annualized.
(e) The Investment Manager and certain of its affiliates agreed to waive/reimburse certain fees and expenses, if applicable.
(f) The benefits derived from expense reductions had an impact of less than 0.01%.
The accompanying Notes to Financial Statements are an integral part of this statement.
15
Financial Highlights (continued) – Columbia Masters International Equity Portfolio
| | | Year ended
Jan. 31, | | Year ended March 31, | |
| | | 2012(a) | | 2011 | | 2010 | | 2009 | | 2008 | | 2007 | |
| Class C | |
| Per share data | |
| Net asset value, beginning of period | | $ | 8.77 | | | $ | 8.19 | | | $ | 5.42 | | | $ | 11.08 | | | $ | 11.66 | | | $ | 10.25 | | |
| Income from investment operations: | |
| Net investment income (loss) | | | 0.02 | | | | 0.09 | | | | 0.21 | | | | (0.02 | ) | | | 0.07 | | | | 0.10 | | |
| Net realized and unrealized gain (loss) | | | (0.88 | ) | | | 0.78 | | | | 2.62 | | | | (5.08 | ) | | | 0.11 | | | | 1.60 | | |
| Total from investment operations | | | (0.86 | ) | | | 0.87 | | | | 2.83 | | | | (5.10 | ) | | | 0.18 | | | | 1.70 | | |
| Less distributions to shareholders from: | |
| Net investment income | | | (0.05 | ) | | | (0.29 | ) | | | (0.06 | ) | | | — | | | | (0.06 | ) | | | (0.01 | ) | |
| Net realized gains | | | — | | | | — | | | | — | | | | (0.56 | ) | | | (0.70 | ) | | | (0.28 | ) | |
| Total distributions to shareholders | | | (0.05 | ) | | | (0.29 | ) | | | (0.06 | ) | | | (0.56 | ) | | | (0.76 | ) | | | (0.29 | ) | |
| Redemption fees: | |
| Redemption fees added to paid-in-capital | | | — | | | | — | | | | (0.00 | )(b) | | | (0.00 | )(b) | | | (0.00 | )(b) | | | (0.00 | )(b) | |
| Net asset value, end of period | | $ | 7.86 | | | $ | 8.77 | | | $ | 8.19 | | | $ | 5.42 | | | $ | 11.08 | | | $ | 11.66 | | |
| Total return | | | (9.75 | %) | | | 11.19 | % | | | 52.22 | % | | | (48.39 | %) | | | 0.94 | % | | | 16.61 | % | |
| Ratios to average net assets(c) | |
| Expenses prior to fees waived or expenses reimbursed | | | 1.51 | %(d) | | | 1.40 | % | | | 1.28 | % | | | 1.26 | % | | | 1.22 | % | | | 1.59 | % | |
| Net expenses after fees waived or expenses reimbursed(e) | | | 1.00 | %(d)(f) | | | 1.00 | %(f) | | | 1.00 | %(f) | | | 1.00 | %(f) | | | 1.00 | %(f) | | | 1.00 | %(f) | |
| Net investment income (loss) | | | 0.25 | %(d)(f) | | | 1.05 | %(f) | | | 2.77 | %(f) | | | (0.19 | %)(f) | | | 0.60 | %(f) | | | 0.88 | %(f) | |
| Supplemental data | |
| Net assets, end of period (in thousands) | | $ | 5,486 | | | $ | 8,990 | | | $ | 10,506 | | | $ | 9,087 | | | $ | 27,656 | | | $ | 21,210 | | |
| Portfolio turnover | | | 3 | % | | | 95 | % | | | 2 | % | | | 20 | % | | | 3 | % | | | 1 | % | |
| Notes to Financial Highlights | |
(a) For the period from April 1, 2011 to January 31, 2012. During the period, the Portfolio's fiscal year end was changed from March 31 to January 31.
(b) Rounds to less than $0.01.
(c) In addition to the fees and expenses which the Portfolio bears directly, the Portfolio indirectly bears a pro rata share of the fees and expenses of the acquired funds in which it invests. Such indirect expenses are not included in the reported expense ratios.
(d) Annualized.
(e) The Investment Manager and certain of its affiliates agreed to waive/reimburse certain fees and expenses, if applicable.
(f) The benefits derived from expense reductions had an impact of less than 0.01%.
The accompanying Notes to Financial Statements are an integral part of this statement.
16
Financial Highlights (continued) – Columbia Masters International Equity Portfolio
| | | Year ended
Jan. 31, | | Year ended March 31, | |
| | | 2012(a) | | 2011 | | 2010 | | 2009 | | 2008 | | 2007 | |
| Class R | |
| Per share data | |
| Net asset value, beginning of period | | $ | 8.76 | | | $ | 8.22 | | | $ | 5.47 | | | $ | 11.12 | | | $ | 11.68 | | | $ | 10.26 | | |
| Income from investment operations: | |
| Net investment income | | | 0.07 | | | | 0.14 | | | | 0.28 | | | | 0.02 | | | | 0.15 | | | | 0.16 | | |
| Net realized and unrealized gain (loss) | | | (0.90 | ) | | | 0.76 | | | | 2.59 | | | | (5.11 | ) | | | 0.09 | | | | 1.59 | | |
| Total from investment operations | | | (0.83 | ) | | | 0.90 | | | | 2.87 | | | | (5.09 | ) | | | 0.24 | | | | 1.75 | | |
| Less distributions to shareholders from: | |
| Net investment income | | | (0.08 | ) | | | (0.36 | ) | | | (0.12 | ) | | | — | | | | (0.10 | ) | | | (0.05 | ) | |
| Net realized gains | | | — | | | | — | | | | — | | | | (0.56 | ) | | | (0.70 | ) | | | (0.28 | ) | |
| Total distributions to shareholders | | | (0.08 | ) | | | (0.36 | ) | | | (0.12 | ) | | | (0.56 | ) | | | (0.80 | ) | | | (0.33 | ) | |
| Redemption fees: | |
| Redemption fees added to paid-in-capital | | | — | | | | — | | | | (0.00 | )(b) | | | (0.00 | )(b) | | | (0.00 | )(b) | | | (0.00 | )(b) | |
| Net asset value, end of period | | $ | 7.85 | | | $ | 8.76 | | | $ | 8.22 | | | $ | 5.47 | | | $ | 11.12 | | | $ | 11.68 | | |
| Total return | | | (9.36 | %) | | | 11.62 | % | | | 52.81 | % | | | (48.12 | %) | | | 1.48 | % | | | 17.09 | % | |
| Ratios to average net assets(c) | |
| Expenses prior to fees waived or expenses reimbursed | | | 1.01 | %(d) | | | 0.90 | % | | | 0.78 | % | | | 0.76 | % | | | 0.72 | % | | | 1.09 | % | |
| Net expenses after fees waived or expenses reimbursed(e) | | | 0.50 | %(d)(f) | | | 0.50 | %(f) | | | 0.50 | %(f) | | | 0.50 | %(f) | | | 0.50 | %(f) | | | 0.50 | %(f) | |
| Net investment income | | | 0.98 | %(d)(f) | | | 1.75 | %(f) | | | 3.78 | %(f) | | | 0.26 | %(f) | | | 1.22 | %(f) | | | 1.46 | %(f) | |
| Supplemental data | |
| Net assets, end of period (in thousands) | | $ | 49 | | | $ | 20 | | | $ | 31 | | | $ | 26 | | | $ | 44 | | | $ | 12 | | |
| Portfolio turnover | | | 3 | % | | | 95 | % | | | 2 | % | | | 20 | % | | | 3 | % | | | 1 | % | |
| Notes to Financial Highlights | |
(a) For the period from April 1, 2011 to January 31, 2012. During the period, the Portfolio's fiscal year end was changed from March 31 to January 31.
(b) Rounds to less than $0.01.
(c) In addition to the fees and expenses which the Portfolio bears directly, the Portfolio indirectly bears a pro rata share of the fees and expenses of the acquired funds in which it invests. Such indirect expenses are not included in the reported expense ratios.
(d) Annualized.
(e) The Investment Manager and certain of its affiliates agreed to waive/reimburse certain fees and expenses, if applicable.
(f) The benefits derived from expense reductions had an impact of less than 0.01%.
The accompanying Notes to Financial Statements are an integral part of this statement.
17
Financial Highlights (continued) – Columbia Masters International Equity Portfolio
| | | Year ended
Jan. 31, | | Year ended March 31, | |
| | | 2012(a) | | 2011 | | 2010 | | 2009 | | 2008 | | 2007 | |
| Class Z | |
| Per share data | |
| Net asset value, beginning of period | | $ | 8.78 | | | $ | 8.26 | | | $ | 5.52 | | | $ | 11.16 | | | $ | 11.70 | | | $ | 10.26 | | |
| Income from investment operations: | |
| Net investment income | | | 0.09 | | | | 0.17 | | | | 0.29 | | | | 0.07 | | | | 0.23 | | | | 0.12 | | |
| Net realized and unrealized gain (loss) | | | (0.89 | ) | | | 0.78 | | | | 2.64 | | | | (5.15 | ) | | | 0.08 | | | | 1.69 | | |
| Total from investment operations | | | (0.80 | ) | | | 0.95 | | | | 2.93 | | | | (5.08 | ) | | | 0.31 | | | | 1.81 | | |
| Less distributions to shareholders from: | |
| Net investment income | | | (0.11 | ) | | | (0.43 | ) | | | (0.19 | ) | | | — | | | | (0.15 | ) | | | (0.09 | ) | |
| Net realized gains | | | — | | | | — | | | | — | | | | (0.56 | ) | | | (0.70 | ) | | | (0.28 | ) | |
| Total distributions to shareholders | | | (0.11 | ) | | | (0.43 | ) | | | (0.19 | ) | | | (0.56 | ) | | | (0.85 | ) | | | (0.37 | ) | |
| Redemption fees: | |
| Redemption fees added to paid-in-capital | | | — | | | | — | | | | (0.00 | )(b) | | | (0.00 | )(b) | | | (0.00 | )(b) | | | (0.00 | )(b) | |
| Net asset value, end of period | | $ | 7.87 | | | $ | 8.78 | | | $ | 8.26 | | | $ | 5.52 | | | $ | 11.16 | | | $ | 11.70 | | |
| Total return | | | (8.99 | %) | | | 12.28 | % | | | 53.58 | % | | | (47.84 | %) | | | 2.03 | % | | | 17.69 | % | |
| Ratios to average net assets(c) | |
| Expenses prior to fees waived or expenses reimbursed | | | 0.51 | %(d) | | | 0.40 | % | | | 0.28 | % | | | 0.26 | % | | | 0.22 | % | | | 0.59 | % | |
| Net expenses after fees waived or expenses reimbursed(e) | | | 0.00 | %(d)(f) | | | 0.00 | %(f) | | | 0.00 | %(f) | | | 0.00 | %(f) | | | 0.00 | %(f) | | | 0.00 | %(f) | |
| Net investment income | | | 1.23 | %(d)(f) | | | 2.04 | %(f) | | | 3.77 | %(f) | | | 0.83 | %(f) | | | 1.89 | %(f) | | | 0.93 | %(f) | |
| Supplemental data | |
| Net assets, end of period (in thousands) | | $ | 32,187 | | | $ | 55,013 | | | $ | 69,334 | | | $ | 58,268 | | | $ | 89,568 | | | $ | 31,029 | | |
| Portfolio turnover | | | 3 | % | | | 95 | % | | | 2 | % | | | 20 | % | | | 3 | % | | | 1 | % | |
| Notes to Financial Highlights | |
(a) For the period from April 1, 2011 to January 31, 2012. During the period, the Portfolio's fiscal year end was changed from March 31 to January 31.
(b) Rounds to less than $0.01.
(c) In addition to the fees and expenses which the Portfolio bears directly, the Portfolio indirectly bears a pro rata share of the fees and expenses of the acquired funds in which it invests. Such indirect expenses are not included in the reported expense ratios.
(d) Annualized.
(e) The Investment Manager and certain of its affiliates agreed to waive/reimburse certain fees and expenses, if applicable.
(f) The benefits derived from expense reductions had an impact of less than 0.01%.
The accompanying Notes to Financial Statements are an integral part of this statement.
18
Notes to Financial Statements – Columbia Masters International Equity Portfolio
January 31, 2012
Note 1. Organization
Columbia Masters International Equity Portfolio (the Portfolio), a series of Columbia Funds Series Trust (the Trust), is a diversified portfolio. The Trust is registered under the Investment Company Act of 1940, as amended (the 1940 Act), as an open-end management investment company organized as a Delaware statutory trust.
Under normal circumstances, the Portfolio invest most of its assets in Class I shares of mutual funds (underlying funds) managed by Columbia Management Investment Advisers, LLC (the Investment Manager), a wholly owned subsidiary of Ameriprise Financial, Inc. (Ameriprise Financial), or its affiliates (Columbia Funds). The financial statements of the underlying funds in which the Portfolio invests should be read in conjunction with the Portfolio's financial statements.
Fiscal Year End Change
During the period, the Portfolio changed its fiscal year end from March 31 to January 31.
Portfolio Shares
The Trust may issue an unlimited number of shares (without par value). The Portfolio offers Class A, Class B, Class C, Class R and Class Z shares. All share classes have identical voting, dividend and liquidation rights. Each share class has its own expense structure and sales charges, as applicable.
Class A shares are subject to a maximum front-end sales charge of 5.75% based on the initial investment amount. Class A shares purchased without an initial sales charge in accounts aggregating $1 million to $50 million at the time of purchase are subject to a contingent deferred sales charge (CDSC) if the shares are sold within 18 months of purchase, charged as follows: 1.00% CDSC if redeemed within 12 months of purchase, and 0.50% CDSC if redeemed more than 12, but less than 18, months after purchase.
Class B shares may be subject to a maximum CDSC of 5.00% based upon the holding period after purchase. Class B shares will generally convert to Class A shares eight years after purchase. The Portfolio no longer accepts investments by new or existing investors in the Portfolio's Class B shares, except in connection with the reinvestment of any dividend and/or capital gain distributions in Class B shares of the Portfolio and exchanges by existing Class B shareholders of certain other funds within the Columbia Family of Funds.
Class C shares are subject to a 1.00% CDSC on shares redeemed within one year of purchase.
Class R shares are not subject to sales charges and are only available to qualifying institutional investors.
Class Z shares are not subject to sales charges, and are only available to certain investors, as described in the Portfolio's prospectus.
Note 2. Summary of Significant Accounting Policies
Use of Estimates
The preparation of financial statements in accordance with U.S. generally accepted accounting principles (GAAP) requires management to make certain estimates and assumptions that affect the reported amounts of assets and liabilities, the disclosure of contingent assets and liabilities at the date of the financial statements and the reported amounts of revenue and expenses during the reporting period. Actual results could differ from those estimates.
The following is a summary of significant accounting policies consistently followed by the Portfolio in the preparation of its financial statements.
Security Valuation
Investments in the underlying funds are valued at the net asset value of each class of the respective underlying fund determined as of the close of the New York Stock Exchange on the valuation date.
Derivative Instruments
The Portfolio invests in certain derivative instruments as detailed below to meet its investment objectives. Derivatives are instruments whose values depend on, or are derived from, in whole or in part, the value of one or more other assets, such as securities, currencies, commodities or indices. Derivative instruments may be used to maintain cash reserves while maintaining exposure to certain other assets, to offset anticipated declines in values of investments, to facilitate trading, to reduce transaction costs and to pursue higher investment returns. The Portfolio may also use derivative instruments to mitigate certain investment risks, such as foreign currency exchange rate risk, interest rate risk and credit risk. Derivatives may involve various risks, including the
19
Columbia Masters International Equity Portfolio, January 31, 2012
potential inability of the counterparty to fulfill its obligation under the terms of the contract, the potential for an illiquid secondary market and the potential for market movements which may expose the Portfolio to gains or losses in excess of the amount shown in the Statement of Assets and Liabilities.
The Portfolio and any counterparty are required to maintain an agreement that requires the Portfolio and that counterparty to monitor (on a daily basis) the net fair value of all derivatives entered into pursuant to the agreement between the Portfolio and such counterparty. If the net fair value of such derivatives between the Portfolio and that counterparty exceeds a certain threshold (as defined in the agreement), the Portfolio or the counterparty (as the case may be) is required to post cash and/or securities as collateral. Fair values of derivatives presented in the financial statements are not netted with the fair value of other derivatives or with any collateral amounts posted by the Portfolio or any counterparty.
Forward Foreign Currency Exchange Contracts
Forward foreign currency exchange contracts are agreements between two parties to buy and sell a currency at a set price on a future date. These contracts are intended to be used to minimize the exposure to foreign exchange rate fluctuations during the period between the trade and settlement dates of the contract. The Portfolio utilized forward foreign currency exchange contracts to hedge the currency exposure associated with some or all of the Portfolio's securities, to shift foreign currency exposure back to U.S. dollars, to shift investment exposure from one currency to another, and to shift U.S. dollar exposure to achieve a representative weighted mix of major currencies in its benchmark, and/or to recover an underweight country exposure in its portfolio.
The values of forward foreign currency exchange contracts fluctuate with changes in foreign currency exchange rates. The Portfolio will record a realized gain or loss when the forward foreign currency exchange contract is closed.
The use of forward foreign currency exchange contracts does not eliminate fluctuations in the prices of the Portfolio's securities. The risks of forward foreign currency exchange contracts include movement in the values of the foreign currencies relative to the U.S. dollar (or other foreign currencies) and the possibility that counterparties will not complete their contractual obligations, which may be in excess of the amount reflected, if any, in the Statement of Assets and Liabilities.
Effects of Derivative Transactions in the Financial Statements
The following tables are intended to provide additional information about the effect of derivatives on the financial statements of the Portfolio, including: the fair value of derivatives by risk category and the location of those fair values in the Statement of Assets and Liabilities; the impact of derivative transactions on the Portfolio's operations over the period including realized gains or losses and unrealized gains or losses. The derivative schedules following the Portfolio of Investments present additional information regarding derivative instruments outstanding at the end of the period, if any.
| Fair Values of Derivative Instruments at January 31, 2012 | |
| | | Asset derivatives | | Liability derivatives | |
| Risk Exposure Category | | Statement of Assets
and Liabilities Location | | Fair Value | | Statement of Assets
and Liabilities Location | | Fair Value | |
| Foreign exchange contracts | | Unrealized appreciation on
forward foreign currency
exchange contracts | | $ | 468,588 | | | Unrealized depreciation on
forward foreign currency
exchange contracts | | $ | 617,011 | | |
20
Columbia Masters International Equity Portfolio, January 31, 2012
Effect of Derivative Instruments in the Statement of Operations for the Year Ended January 31, 2012
Amount of Realized Gain (Loss) on Derivatives Recognized in Income
| Risk Exposure Category | | Forward Foreign
Currency Exchange
Contracts | |
| Foreign exchange contracts | | $ | 578,558 | | |
Change in Unrealized Appreciation (Depreciation) on Derivatives Recognized in Income
| Risk Exposure Category | | Forward Foreign
Currency Exchange
Contracts | |
| Foreign exchange contracts | | $ | (148,423 | ) | |
Volume of Derivative Instruments for the Year Ended January 31, 2012
| | | Contracts
Opened | |
Forward Foreign Currency
Exchange Contracts | | | 129 | | |
Security Transactions
Security transactions are accounted for on the trade date. Cost is determined and gains (losses) are based upon the specific identification method for both financial statement and federal income tax purposes.
Income Recognition
Income and capital gain distributions from the underlying funds, if any, are recorded on the ex-dividend date.
Expenses
General expenses of the Trust are allocated to the Portfolio and other funds of the Trust based upon relative net assets or other expense allocation methodologies determined by the nature of the expense. Expenses directly attributable to the Portfolio are charged to the Portfolio. Expenses directly attributable to a specific class of shares are charged to that share class.
Determination of Class Net Asset Value
All income, expenses (other than class-specific expenses, which are charged to that share class, as shown in the Statement of Operations) and realized and unrealized gains (losses) are allocated to each class of the Portfolio on a daily basis, based on the relative net assets of each class, for purposes of determining the net asset value of each class.
Federal Income Tax Status
The Portfolio intends to qualify each year as a regulated investment company under Subchapter M of the Internal Revenue Code, as amended, and will distribute substantially all of its taxable income (including net short-term capital gains), if any, for its tax year, and as such will not be subject to federal income taxes. In addition, the Portfolio intends to distribute in each calendar year substantially all of its net investment income, capital gains and certain other amounts, if any, such that the Portfolio should not be subject to federal excise tax. Therefore, no federal income or excise tax provision is recorded.
Distributions to Shareholders
Distributions from net investment income, if any, are declared and paid semi-annually. Net realized capital gains, if any, are distributed along with the income dividend. Income distributions and capital gain distributions are determined in accordance with federal income tax regulations which may differ from GAAP.
Guarantees and Indemnifications
Under the Trust's organizational documents and, in some cases, by contract, its officers and trustees are indemnified against certain liabilities arising out of the performance of their duties to the Trust or its funds. In addition, certain of the Portfolio's contracts with its service providers contain general indemnification clauses. The Portfolio's maximum exposure under these arrangements is unknown since the amount of any future claims that may be made against the Portfolio cannot be determined, and the Portfolio has no historical basis for predicting the likelihood of any such claims.
21
Columbia Masters International Equity Portfolio, January 31, 2012
Recent Accounting Pronouncement
Fair Value Measurements and Disclosures
In May 2011, the Financial Accounting and Standards Board (FASB) issued ASU No. 2011-04 modifying Topic 820, Fair Value Measurements and Disclosures. At the same time, the International Accounting Standards Board (IASB) issued International Financial Reporting Standard 13, Fair Value Measurement. The objective of the FASB and IASB is convergence of their guidance on fair value measurements and disclosures.
Specifically, ASU No. 2011-04 requires reporting entities to disclose i) the amounts of any transfers between Level 1 and Level 2, and the reasons for the transfers, ii) for Level 3 fair value measurements, a) quantitative information about significant unobservable inputs used, b) a description of the valuation processes used by the reporting entity and c) a narrative description of the sensitivity of the fair value measurement to changes in unobservable inputs if a change in those inputs might result in a significantly higher or lower fair value measurement. The effective date of ASU No. 2011-04 is for interim and annual periods beginning after December 15, 2011. At this time, management is evaluating the implications of this guidance and the impact it will have on the financial statement amounts and footnote disclosures, if any.
Note 3. Fees and Compensation Paid to Affiliates
Investment Management Fees
Under an Investment Management Services Agreement, the Investment Manager determines which securities will be purchased, held or sold. The Portfolio does not pay a fee to the Investment Manager for its investment management services.
Administration Fees
Under an Administrative Services Agreement, the Investment Manager serves as the Portfolio Administrator. The Portfolio pays the Portfolio Administrator an annual fee for administration and accounting services equal to 0.02% of the Portfolio's average daily net assets.
Pricing and Bookkeeping Fees
Prior to June 27, 2011, the Portfolio had entered into a Financial Reporting Services Agreement (the Financial Reporting Services Agreement) with State Street Bank and Trust Company (State Street) and the Investment Manager pursuant to which State Street provided financial reporting services to the Portfolio. The Portfolio also entered into an Accounting Services Agreement (collectively with the Financial Reporting Services Agreement, the State Street Agreements) with State Street and the Investment Manager pursuant to which State Street provided accounting services to the Portfolio. Under the State Street Agreements, the Portfolio paid State Street an annual fee of $26,000 paid monthly. The Portfolio also reimbursed State Street for certain out-of-pocket expenses and charges. Effective June 27, 2011, these services are provided under the Administrative Services Agreement discussed above.
Other Fees
Effective June 1, 2011, other expenses are for, among other things, certain expenses of the Portfolio or the Board, including: Portfolio boardroom and office expense, employee compensation, employee health and retirement benefits, and certain other expenses. Payment of these Portfolio and Board expenses is facilitated by a company providing limited administrative services to the Portfolio and the Board. For the period June 1, 2011 through January 31, 2012, other expenses paid to this company were $1,110.
Compensation of Board Members
Board members are compensated for their services to the Portfolio as set forth in the Statement of Operations. Under a Deferred Compensation Plan (the Plan), the Board members who are not "interested persons" of the Portfolio as defined under the 1940 Act may elect to defer payment of up to 100% of their compensation. Deferred amounts are treated as though equivalent dollar amounts had been invested in shares of the Portfolio or certain other funds managed by the Investment Manager. The Portfolio's liability for these amounts is adjusted for market value changes and remains in the Portfolio until distributed in accordance with the Plan.
Compensation of Chief Compliance Officer
The Board has appointed a Chief Compliance Officer to the Portfolio in accordance with federal securities regulations. Effective April 1, 2011, the Portfolio's expenses associated with the Chief Compliance Officer are paid directly by Columbia. Prior to April 1, 2011, the Portfolio, along with other affiliated funds, paid its pro-rata share of the expenses
22
Columbia Masters International Equity Portfolio, January 31, 2012
for the Chief Compliance Officer. Such fees did not exceed $15,000 per year.
Transfer Agent Fees
Under a Transfer and Dividend Disbursing Agent Agreement, Columbia Management Investment Services Corp. (the Transfer Agent), an affiliate of the Investment Manager and a wholly-owned subsidiary of Ameriprise Financial, is responsible for providing transfer agency services to the Portfolio. The Transfer Agent has contracted with Boston Financial Data Services (BFDS) to serve as sub-transfer agent.
The Transfer Agent receives monthly account-based service fees based on the number of open accounts and is reimbursed by the Portfolio for the fees and expenses the Transfer Agent pays to financial intermediaries that maintain omnibus accounts with the Portfolio that is a percentage of the average aggregate value of the Portfolio's shares maintained in each such omnibus account (other than omnibus accounts for which American Enterprise Investment Services Inc. is the broker of record or accounts where the beneficial shareholder is a customer of Ameriprise Financial Services, Inc., which are paid a per account fee). The Transfer Agent pays the fees of BFDS for services as sub-transfer agent and is not entitled to reimbursement for such fees from the Portfolio (with the exception of out-of-pocket fees).
The Transfer Agent also receives compensation from fees for various shareholder services and reimbursements for certain out-of -pocket expenses.
For the period ended January 31, 2012 and the year ended March 31, 2011, the Portfolio's annualized effective transfer agent fee rates as a percentage of average daily net assets of each class were as follows:
| | | Period
Ended
January 31,
2012 | | Year
Ended
March 31,
2011 | |
| Class A | | | 0.20 | % | | | 0.15 | % | |
| Class B | | | 0.19 | | | | 0.15 | | |
| Class C | | | 0.19 | | | | 0.15 | | |
| Class R | | | 0.19 | | | | 0.15 | | |
| Class Z | | | 0.19 | | | | 0.15 | | |
An annual minimum account balance fee of $20 may apply to certain accounts with a value below the Portfolio's initial minimum investment requirements to reduce the impact of small accounts on transfer agent fees. These minimum account balance fees are recorded as part of expense reductions in the Statement of Operations. For the period ended January 31, 2012 and the year ended March 31, 2011, these minimum account balance fees reduced total expenses by $148 and $0, respectively.
Distribution and Service Fees
The Portfolio has an agreement with Columbia Management Investment Distributors, Inc. (the Distributor), an affiliate of the Investment Manager and a wholly-owned subsidiary of Ameriprise Financial, for distribution and shareholder services. Pursuant to Rule 12b-1 under the 1940 Act, the Board has approved, and the Portfolio has adopted, distribution and shareholder service plans (the Plans) which set the distribution and service fees for the Portfolio. These fees are calculated daily and are intended to compensate the Distributor and/or eligible selling and/or servicing agents for selling shares of the Portfolio and providing services to investors.
The Plans require the payment of a monthly combined distribution and service fee to the Distributor at the maximum annual rate of 0.25% of the average daily net assets attributable to Class A shares of the Portfolio. The Plans also require the payment of a monthly service fee at the maximum annual rate of 0.25% of the average daily net assets attributable to Class B and Class C shares of the Portfolio and the payment of a monthly distribution fee at the maximum annual rates of 0.75%, 0.75% and 0.50% of the average daily net assets attributable to Class B, Class C and Class R shares, respectively.
Sales Charges
Sales charges, including front-end charges and CDSCs, received by the Distributor for distributing Portfolio shares were $6,656 for Class A, $3,596 for Class B and $128 for Class C shares for the period ended January 31, 2012 and $1,571 for Class A, $7,811 for Class B and $287 for Class C shares for the year ended March 31, 2011.
23
Columbia Masters International Equity Portfolio, January 31, 2012
Expenses Waived/Reimbursed by the Investment Manager and its Affiliates
The Investment Manager and certain of its affiliates have contractually agreed to waive fees and/or reimburse expenses (excluding certain fees and expenses described below), through July 31, 2012, unless sooner terminated at the sole discretion of the Board, so that the Portfolio's net operating expenses, after giving effect to fees waived/expenses reimbursed and any balance credits and/or overdraft charges from the Portfolio's custodian, do not exceed the following annual rates as a percentage of the class' average daily net assets:
| Class A | | | 0.25 | % | |
| Class B | | | 1.00 | | |
| Class C | | | 1.00 | | |
| Class R | | | 0.50 | | |
| Class Z | | | 0.00 | | |
Under the agreement, the following fees and expenses, are excluded from the waiver/reimbursement commitment, and therefore will be paid by the Portfolio, if applicable: taxes (including foreign transaction taxes), expenses associated with investments in affiliated and non-affiliated pooled investment vehicles (including mutual funds and exchange traded funds), transaction costs and brokerage commissions, costs related to any securities lending program, dividend expenses associated with securities sold short, inverse floater program fees and expenses, transaction charges and interest on borrowed money, interest, extraordinary expenses and any other expenses the exclusion of which is specifically approved by the Portfolio's Board. This agreement may be modified or amended only with approval from all parties.
Note 4. Federal Tax Information
The timing and character of income and capital gain distributions are determined in accordance with income tax regulations, which may differ from GAAP because of temporary or permanent book to tax differences.
For the period ended January 31, 2012, these differences are primarily due to differing treatments for foreign currency transactions, post-October capital losses, and deferral/reversal of wash sale losses. To the extent these differences are permanent, reclassifications are made among the components of the Portfolio's net assets in the Statement of Assets and Liabilities. Temporary differences do not require reclassifications. In the Statement of Assets and Liabilities the following reclassifications were made:
| Undistributed net investment income | | $ | 578,558 | | |
| Accumulated net realized loss | | | (578,558 | ) | |
Net investment income and net realized gains (losses), as disclosed in the Statement of Operations, and net assets were not affected by this reclassification.
The tax character of distributions paid during the years indicated was as follows:
| | | Period ended
January 31, | |
Year ended March 31, | |
| | | 2012 | | 2011 | | 2010 | |
| Ordinary income | | $ | 869,625 | | | $ | 5,730,648 | | | $ | 3,147,167 | | |
Short-term capital gain distributions, if any, are considered ordinary income distributions for tax purposes.
At January 31, 2012, the components of distributable earnings on a tax basis were as follows:
| Undistributed ordinary income | | $ | 478,933 | | |
Undistributed accumulated long-term
capital gains | | | — | | |
| Unrealized depreciation | | | (7,019,322 | ) | |
At January 31, 2012, the cost of investments for federal income tax purposes was $71,994,518 and the aggregate gross unrealized appreciation and depreciation based on that cost was:
| Unrealized appreciation | | $ | 1,412,543 | | |
| Unrealized depreciation | | $ | (8,431,865 | ) | |
| Net unrealized depreciation | | $ | (7,019,322 | ) | |
24
Columbia Masters International Equity Portfolio, January 31, 2012
The following capital loss carryforwards, determined at January 31, 2012, may be available to reduce taxable income arising from future net realized gains on investments, if any, to the extent permitted by the Internal Revenue Code:
| Year of Expiration | | Amount | |
| 2017 | | $ | 4,980,942 | | |
| 2018 | | | 25,984,153 | | |
| 2019 | | | 19,955,661 | | |
| Unlimited short-term | | | 505,562 | | |
| Unlimited long-term | | | 36,830,103 | | |
| Total | | $ | 88,256,421 | | |
On December 22, 2010, the Regulated Investment Company Modernization Act of 2010 (the Act) was enacted, which changed various technical rules governing the tax treatment of regulated investment companies. The changes are generally effective for taxable years beginning after the date of enactment. Under the Act, the Portfolio will be permitted to carry forward capital losses incurred in taxable years beginning after the date of enactment for an unlimited period. However, any losses incurred during those future taxable years will be required to be utilized prior to the losses incurred in pre-enactment taxable years, which carry an expiration date. As a result of this ordering rule, pre-enactment capital loss carryforwards may be more likely to expire unused.
Under current tax rules, Regulated Investment Companies can elect to treat certain late-year ordinary losses incurred and post-October capital losses (capital losses realized after October 31) as arising on the first day of the following taxable year, As of January 31, 2012, the Portfolio will elect to treat post-October capital losses of $1,338,373 as arising on February 1, 2012.
Management of the Portfolio has concluded that there are no significant uncertain tax positions that would require recognition in the financial statements. However, management's conclusion may be subject to review and adjustment at a later date based on factors including, but not limited to, new tax laws, regulations, and administrative interpretations (including relevant court decisions). Generally, the Portfolio's federal tax returns for the prior three fiscal years remain subject to examination by the Internal Revenue Service.
Note 5. Portfolio Information
The cost of purchases and proceeds from sales of securities, excluding short-term obligations, aggregated to $2,381,980 and $35,100,582, respectively, for the period ended January 31, 2012.
Note 6. Custody Credits
Prior to June 27, 2011, the Portfolio had an agreement with its custodian bank under which custody fees may have been reduced by balance credits. These credits are recorded as part of expense reductions on the Statement of Operations. The Portfolio could have invested a portion of the assets utilized in connection with the expense offset arrangement in an income-producing asset if they had not entered into such an agreement. For the period February 1, 2011 through June 27, 2011, there were no custody credits.
Note 7. Investments in Underlying Affiliated Funds Over 5%
The Fund does not invest in the underlying funds for the purpose of exercising management or control. At January 31, 2012, The Fund held the following positions, which exceeded 5% of the underlying fund's shares outstanding:
| Underlying fund Percent of shares held | | | |
| Columbia European Equity Fund | | | 10.31 | % | |
| Columbia Pacific/Asia Fund | | | 6.22 | | |
Note 8. Shareholder Concentration
At January 31, 2012, one unaffiliated shareholder account owned 54.1% of the outstanding shares of the Portfolio. The Portfolio has no knowledge about whether any portion of those shares was owned beneficially. Subscription and redemption activity of these accounts may have a significant effect on the operations of the Portfolio.
Note 9. Line of Credit
The Portfolio has entered into a revolving credit facility with a syndicate of banks led by JPMorgan Chase Bank, N.A. (the Administrative Agent), whereby the Portfolio may borrow for the temporary funding of shareholder redemptions or for other temporary or emergency purposes. The credit facility became effective on June 27, 2011, replacing a prior credit
25
Columbia Masters International Equity Portfolio, January 31, 2012
facility. The credit facility agreement, as amended, which is a collective agreement between the Portfolio and certain other funds managed by the Investment Manager, severally and not jointly, permits collective borrowings up to $500 million. Pursuant to a December 13, 2011 amendment to the credit facility agreement, interest is charged to each participating fund based on its borrowings at a rate equal to the higher of (i) the overnight federal funds rate plus 1.00% or (i) the one-month LIBOR rate plus 1.00%. Each borrowing under the credit facility matures no later than 60 days after the date of borrowing. The Portfolio also pays a commitment fee equal to its pro rata share of the amount of the credit facility at a rate of 0.08% per annum.
For the period June 27, 2011 through December 12, 2011, interest was charged to each participating fund based on its borrowings at a rate equal to the sum of the federal funds rate plus (i) 1.25% per annum plus (ii) if one-month LIBOR exceeds the federal funds rate, the amount of such excess. The Portfolio also paid a commitment fee equal to its pro rata share of the amount of the credit facility at a rate of 0.10% per annum.
For the period May 16, 2011 through June 26, 2011, the Portfolio and certain other funds managed by the Investment Manager participated in a $150 million committed, unsecured revolving credit facility provided by State Street. Prior to May 16, 2011, the collective borrowing amount of the credit facility was $225 million. Interest was charged to each fund based on its borrowings at a rate equal to the greater of the (i) federal funds rate plus 1.25% per annum or (ii) the overnight LIBOR rate plus 1.25% per annum. The Portfolio also paid a commitment fee equal to its pro rata share of the amount of the credit facility at a rate of 0.15% per annum.
The Portfolio had no borrowings during the period ended January 31, 2012 or the year ended March 31, 2011.
Note 10. Significant Risks
Allocation Risk
The Portfolio uses an asset allocation strategy in pursuing its investment objective. There is a risk that a Portfolio's allocation among asset classes or investments will cause the Portfolio to under-perform other funds with similar investment objectives, or that the investments themselves will not produce the returns expected.
Investing in Other Funds Risk
The performance of the Underlying Funds in which the Portfolio invests could be adversely affected if other entities investing in the same Underlying Funds make relatively large investments or redemptions in the Underlying Funds. Because the expenses and costs of the Underlying Funds are shared by the Portfolio, redemptions by other investors in the Underlying Funds could result in decreased economies of scale and increased operating expenses for the Portfolio. In addition, the Investment Manager has the authority to change the Underlying Funds in which the Portfolio invests or to change the percentage of the Portfolio's investments allocated to each Underlying Fund. If an Underlying Fund pays fees to the Investment Manager, such fees could result in the Investment Manager having a potential conflict of interest in selecting the Underlying Funds in which the Portfolio invests or in determining the percentage of the Portfolio's investments allocated to each Underlying Fund.
Note 11. Subsequent Events
Management has evaluated the events and transactions that have occurred through the date the financial statements were issued and noted no items requiring adjustment of the financial statements or additional disclosure.
Note 12. Information Regarding Pending and Settled Legal Proceedings
In June 2004, an action captioned John E. Gallus et al. v. American Express Financial Corp. and American Express Financial Advisors Inc. was filed in the United States District Court for the District of Arizona. The plaintiffs allege that they are investors in several American Express Company mutual funds (currently branded as Columbia) and they purport to bring the action derivatively on behalf of those funds under the Investment Company Act of 1940. The plaintiffs allege that fees allegedly paid to the defendants by the funds for investment advisory and administrative services are excessive. The plaintiffs seek remedies including restitution and rescission of investment advisory and distribution agreements. The plaintiffs voluntarily agreed to transfer this case to the United States District Court for the District of Minnesota (the District Court). In response to defendants' motion to dismiss the complaint, the District Court dismissed one of plaintiffs' four claims and granted plaintiffs limited discovery. Defendants moved for summary
26
Columbia Masters International Equity Portfolio, January 31, 2012
judgment in April 2007. Summary judgment was granted in the defendants' favor on July 9, 2007. The plaintiffs filed a notice of appeal with the Eighth Circuit Court of Appeals (the Eighth Circuit) on August 8, 2007. On April 8, 2009, the Eighth Circuit reversed summary judgment and remanded to the District Court for further proceedings. On August 6, 2009, defendants filed a writ of certiorari with the U.S. Supreme Court (the Supreme Court), asking the Supreme Court to stay the District Court proceedings while the Supreme Court considers and rules in a case captioned Jones v. Harris Associates, which involves issues of law similar to those presented in the Gallus case. On March 30, 2010, the Supreme Court issued its ruling in Jones v. Harris Associates, and on April 5, 2010, the Supreme Court vacated the Eighth Circuit's decision in the Gallus case and remanded the case to the Eighth Circuit for further consideration in light of the Supreme Court's decision in Jones v. Harris Associates. On June 4, 2010, the Eighth Circuit remanded the Gallus case to the District Court for further consideration in light of the Supreme Court's decision in Jones v. Harris Associates. On December 9, 2010, the District Court reinstated its July 9, 2007 summary judgment order in favor of the defendants. On January 10, 2011, plaintiffs filed a notice of appeal with the Eighth Circuit. In response to the plaintiffs' opening appellate brief filed on March 18, 2011, the defendants filed a response brief on May 4, 2011 with the Eighth Circuit. The plaintiffs filed a reply brief on May 26, 2011 and oral arguments took place on November 17, 2011.
In December 2005, without admitting or denying the allegations, American Express Financial Corporation (AEFC, which is now known as Ameriprise Financial, Inc. (Ameriprise Financial)) entered into settlement agreements with the Securities and Exchange Commission (SEC) and Minnesota Department of Commerce (MDOC) related to market timing activities. As a result, AEFC was censured and ordered to cease and desist from committing or causing any violations of certain provisions of the Investment Advisers Act of 1940, the Investment Company Act of 1940, and various Minnesota laws. AEFC agreed to pay disgorgement of $10 million and civil money penalties of $7 million. AEFC also agreed to retain an independent distribution consultant to assist in developing a plan for distribution of all disgorgement and civil penalties ordered by the SEC in accordance with various undertakings detailed at www.sec.gov/litigation/admin/ia-2451.pdf. Ameriprise Financial and its affiliates have cooperated with the SEC and the MDOC in these legal proceedings, and have made regular reports to the funds' Boards of Trustees.
Ameriprise Financial and certain of its affiliates have historically been involved in a number of legal, arbitration and regulatory proceedings, including routine litigation, class actions, and governmental actions, concerning matters arising in connection with the conduct of their business activities. Ameriprise Financial believes that the Funds are not currently the subject of, and that neither Ameriprise Financial nor any of its affiliates are the subject of, any pending legal, arbitration or regulatory proceedings that are likely to have a material adverse effect on the Funds or the ability of Ameriprise Financial or its affiliates to perform under their contracts with the Funds. Ameriprise Financial is required to make 10-Q, 10-K and, as necessary, 8-K filings with the Securities and Exchange Commission on legal and regulatory matters that relate to Ameriprise Financial and its affiliates. Copies of these filings may be obtained by accessing the SEC website at www.sec.gov.
There can be no assurance that these matters, or the adverse publicity associated with them, will not result in increased fund redemptions, reduced sale of fund shares or other adverse consequences to the Funds. Further, although we believe proceedings are not likely to have a material adverse effect on the Funds or the ability of Ameriprise Financial or its affiliates to perform under their contracts with the Funds, these proceedings are subject to uncertainties and, as such, we are unable to estimate the possible loss or range of loss that may result. An adverse outcome in one or more of these proceedings could result in adverse judgments, settlements, fines, penalties or other relief that could have a material adverse effect on the consolidated financial condition or results of operations of Ameriprise Financial.
27
Report of Independent Registered Public Accounting Firm
To the Trustees of Columbia Funds Series Trust and the Shareholders of Columbia Masters International Equity Portfolio
In our opinion, the accompanying statement of assets and liabilities, including the investment portfolio, and the related statements of operations and of changes in net assets and the financial highlights present fairly, in all material respects, the financial position of Columbia Masters International Equity Portfolio (the "Portfolio") (a series of Columbia Funds Series Trust) at January 31, 2012, the results of its operations, the changes in its net assets and the financial highlights for each of the periods indicated, in conformity with accounting principles generally accepted in the United States of America. These financial statements and financial highlights (hereafter referred to as "financial statements") are the responsibility of the Portfolio's management. Our responsibility is to express an opinion on these financial statements based on our audits. We conducted our audits of these financial statements in accordance with the standards of the Public Company Accounting Oversight Board (United States). Those standards require that we plan and perform the audit to obtain reasonable assurance about whether the financial statements are free of material misstatement. An audit includes examining, on a test basis, evidence supporting the amounts and disclosures in the financial statements, assessing the accounting principles used and significant estimates made by management, and evaluating the overall financial statement presentation. We believe that our audits, which included confirmation of securities at January 31, 2012 by correspondence with the transfer agent, custodian and brokers, provide a reasonable basis for our opinion.
PricewaterhouseCoopers LLP
Minneapolis, Minnesota
March 23, 2012
28
Federal Income Tax Information (Unaudited) – Columbia Masters International Equity Portfolio
For non-corporate shareholders, 81.00%, or the maximum amount allowable under the Jobs and Growth Tax Relief Reconciliation Act of 2003, of the ordinary income distributed by the Portfolio for the fiscal year ended January 31, 2012 may represent qualified dividend income.
The Portfolio will notify shareholders in January 2013 of amounts for use in preparing 2012 income tax returns.
29
Fund Governance
Shareholders elect the Board that oversees the funds' operations. The Board appoints officers who are responsible for day-to-day business decisions based on policies set by the Board. The following table provides basic biographical information about the funds' Board members, including their principal occupations during the past five years, although specific titles for individuals may have varied over the period. Under current Board policy, members may serve until the next Board meeting after he or she reaches the mandatory retirement age established by the Board, or the fifteenth anniversary of the first Board meeting they attended as a member of the Board.
On Sept. 29, 2009, Ameriprise Financial, the parent company of Columbia Management, entered into an agreement with Bank of America, N.A. ("Bank of America") to acquire a portion of the asset management business of Columbia Management Group, LLC and certain of its affiliated companies (the "Transaction"). Following the Transaction, which became effective on May 1, 2010, various alignment activities have occurred with respect to the Fund Family. In connection with the Transaction, Mr. Edward J. Boudreau, Jr., Mr. William P. Carmichael, Mr. William A. Hawkins, Mr. R. Glenn Hilliard, Mr. John J. Nagorniak, Ms. Minor M. Shaw and Dr. Anthony M. Santomero, who were members prior to the Transaction of the Legacy Columbia Nations funds' Board ("Nations Funds"), which includes Columbia Funds Series Trust, Columbia Funds Variable Insurance Trust I and Columbia Funds Master Investment Trust, LLC., began service on the Board for the Legacy RiverSource funds ("RiverSource Funds") effective June 1, 2011, which resulted in an overall increase from twelve Trustees to sixteen for all mutual funds overseen by the Board.
Independent Board Members
| Name, Address, Age | | Position Held
with Funds
and Length
of Service | | Principal Occupation During Past Five Years | | Number of
Funds in the
Fund Family
Overseen by
Board Member | | Other Present or
Past Directorships/
Trusteeships
(Within Past 5 Years) | |
Kathleen Blatz
901 S. Marquette Ave.
Minneapolis, MN 55402
Age 57 | | Board member since 1/06 for RiverSource Funds and since 6/11 for Nations Funds | | Attorney; Chief Justice, Minnesota Supreme Court, 1998-2006 | | | 153 | | | None | |
|
Edward J. Boudreau, Jr.
225 Franklin Street
Mail Drop
BX32 05228
Boston, MA 02110
Age 67 | | Board member since 6/11 for RiverSource Funds and since 1/05 for Nations Funds | | Managing Director, E.J. Boudreau & Associates (consulting) since 2000 | | | 146 | | | Former Trustee, BofA Funds Series Trust (11 funds) | |
|
Pamela G. Carlton
901 S. Marquette Ave.
Minneapolis, MN 55402
Age 57 | | Board member since 7/07 for RiverSource Funds and since 6/11 for Nations Funds | | President, Springboard-Partners in Cross Cultural Leadership (consulting company) | | | 153 | | | None | |
|
30
Fund Governance (continued)
Independent Board Members (continued)
| Name, Address, Age | | Position Held
with Funds
and Length
of Service | | Principal Occupation During Past Five Years | | Number of
Funds in the
Fund Family
Overseen by
Board Member | | Other Present or
Past Directorships/
Trusteeships
(Within Past 5 Years) | |
William P. Carmichael
225 Franklin Street
Mail Drop
BX32 05228
Boston, MA 02110
Age 68 | | Board member since 6/11 for RiverSource Funds and since 1999 for Nations Funds | | Retired | | | 146 | | | Director, Cobra Electronics Corporation (electronic equipment manufacturer); The Finish Line (athletic shoes and apparel); McMoRan Exploration Company (oil and gas exploration and development); Former Trustee, BofA Funds Series Trust (11 funds); former Director, Spectrum Brands, Inc. (consumer products); former Director, Simmons Company (bedding) | |
|
Patricia M. Flynn
901 S. Marquette Ave.
Minneapolis, MN 55402
Age 61 | | Board member since 11/04 for RiverSource Funds and since 6/11 for Nations Funds | | Trustee Professor of Economics and Management, Bentley University; former Dean, McCallum Graduate School of Business, Bentley University | | | 153 | | | None | |
|
William A. Hawkins
225 Franklin Street
Mail Drop
BX32 05228
Boston, MA 02110
Age 68 | | Board member since 6/11 for RiverSource Funds and since 1/05 for Nations Funds | | Managing Director, Overton Partners (financial consulting), since August 2010; President and Chief Executive Officer, California General Bank, N.A., January 2008-August 2010 | | | 146 | | | Trustee, BofA Funds Series Trust (11 funds) | |
|
R. Glenn Hilliard
225 Franklin Street
Mail Drop
BX32 05228
Boston, MA 02110
Age 69 | | Board member since 6/11 for RiverSource Funds and since 1/05 for Nations Funds | | Chairman and Chief Executive Officer, Hilliard Group LLC (investing and consulting), since April 2003; Non-Executive Director & Chairman, CNO Financial Group, Inc. (formerly Conseco, Inc.) (insurance), September 2003-May 2011 | | | 146 | | | Chairman, BofA Fund Series Trust (11 funds); former Director, CNO Financial Group, Inc. (insurance) | |
|
31
Fund Governance (continued)
Independent Board Members (continued)
| Name, Address, Age | | Position Held
with Funds
and Length
of Service | | Principal Occupation During Past Five Years | | Number of
Funds in the
Fund Family
Overseen by
Board Member | | Other Present or
Past Directorships/
Trusteeships
(Within Past 5 Years) | |
Stephen R. Lewis, Jr.
901 S. Marquette Ave.
Minneapolis, MN 55402
Age 73 | | Chair of the Board for RiverSource Funds since 1/07, Board member for RiverSource Funds since 1/02 and since 6/11 for Nations Funds | | President Emeritus and Professor of Economics Emeritus, Carleton College | | | 153 | | | Valmont Industries, Inc. (manufactures irrigation systems) | |
|
John F. Maher
901 S. Marquette Ave.
Minneapolis, MN 55402
Age 68 | | Board member since 12/06 for Legacy Seligman funds, since 12/08 for RiverSource Funds and since 6/11 for Nations Funds | | Retired President and Chief Executive Officer and former Director, Great Western Financial Corporation (financial services), 1986-1997 | | | 153 | | | None | |
|
John J. Nagorniak
225 Franklin Street
Mail Drop
BX32 05228
Boston, MA 02110
Age 67 | | Board member since 6/11 for RiverSource Funds and since 1/08 for Nations Funds | | Retired; President and Director, Foxstone Financial, Inc. (consulting), 2000-2007; Director, Mellon Financial Corporation affiliates (investing), 2000-2007; Chairman, Franklin Portfolio Associates (investing—Mellon affiliate) 1982-2007 | | | 146 | | | Trustee, Research Foundation of CFA Institute; Director, MIT Investment Company; Trustee, MIT 401k Plan; former Trustee, BofA Funds Series Trust (11 funds) | |
|
Catherine James Paglia
901 S. Marquette Ave.
Minneapolis, MN 55402
Age 59 | | Board member since 11/04 for RiverSource Funds and since 6/11 for Nations Funds | | Director, Enterprise Asset Management, Inc. (private real estate and asset management company) | | | 153 | | | None | |
|
32
Fund Governance (continued)
Independent Board Members (continued)
| Name, Address, Age | | Position Held
with Funds
and Length
of Service | | Principal Occupation During Past Five Years | | Number of
Funds in the
Fund Family
Overseen by
Board Member | | Other Present or
Past Directorships/
Trusteeships
(Within Past 5 Years) | |
Leroy C. Richie
901 S. Marquette Ave.
Minneapolis, MN 55402
Age 70 | | Board member since 2000 for Legacy Seligman funds, since 11/08 for RiverSource Funds and since 6/11 for Nations Funds | | Counsel, Lewis & Munday, P.C. since 2004; former Vice President and General Counsel, Automotive Legal Affairs, Chrysler Corporation | | | 153 | | | Digital Ally, Inc. (digital imaging); Infinity, Inc. (oil and gas exploration and production); OGE Energy Corp. (energy and energy services) | |
|
Minor M. Shaw
225 Franklin Street
Mail Drop
BX32 05228
Boston, MA 02110
Age 64 | | Board member since 6/11 for RiverSource Funds and since 2003 for Nations Funds | | President—Micco LLC (private investments) | | | 146 | | | Former Trustee, BofA Funds Series Trust (11 funds); Piedmont Natural Gas; Director, Blue Cross Blue Shield of South Carolina | |
|
Alison Taunton-Rigby
901 S. Marquette Ave
Minneapolis, MN 55402
Age 67 | | Board member since 11/02 for RiverSource Funds and since 6/11 for Nations Funds | | Chief Executive Officer and Director, RiboNovix, Inc. 2003-2010 (biotechnology); former President, Aquila Biopharmaceuticals | | | 153 | | | Director, Healthways, Inc. (health management programs); Director, ICI Mutual Insurance Company RRG; Director, Abt Associates (government contractor) | |
|
33
Fund Governance (continued)
Interested Board Member Not Affiliated with Investment Manager*
| Name, Address, Age | | Position Held
with Funds
and Length
of Service | | Principal Occupation During Past Five Years | | Number of
Funds in the
Fund Family
Overseen by
Board Member | | Other Present or
Past Directorships/
Trusteeships
(Within Past 5 Years) | |
Anthony M. Santomero*
225 Franklin Street
Mail Drop
BX32 05228
Boston, MA 02110
Age 65 | | Board member since 6/11 for RiverSource Funds and since 1/08 for Nations Funds | | Richard K. Mellon Professor Emeritus of Finance, The Wharton School, University of Pennsylvania, since 2002; Senior Advisor, McKinsey & Company (consulting), 2006-2008; President and Chief Executive Officer, Federal Reserve Bank of Philadelphia, 2000-2006 | | | 146 | | | Director, Renaissance Reinsurance Ltd.; Trustee, Penn Mutual Life Insurance Company; Director, Citigroup; Director, Citibank, N.A.; former Trustee, BofA Funds Series Trust (11 funds) | |
|
* Dr. Santomero is not an affiliated person of the investment manager or Ameriprise Financial. However, he is currently deemed by the funds to be an "interested person" (as defined in the 1940 Act) of the funds because he serves as a Director of Citigroup, Inc. and Citibank N.A., companies that may directly or through subsidiaries and affiliates engage from time-to-time in brokerage execution, principal transactions and lending relationships with the funds or accounts advised/managed by the investment manager.
Interested Board Member Affiliated with Investment Manager*
William F. Truscott
53600 Ameriprise Financial Center
Minneapolis, MN 55474
Age 51 | | Board member since 11/01 for RiverSource Funds and since 6/11 for Nations Funds; Senior Vice President since 2002 | | Chairman of the Board and President, Columbia Management Investment Advisers, LLC since May 2010 and February 2012, respectively (previously President, Chairman of the Board and Chief Investment Officer, 2001-April 2010); Chief Executive Officer, U.S. Asset Management & President, Annuities, Ameriprise Financial, Inc. since May 2010 (previously President—U.S. Asset Management and Chief Investment Officer, 2005-April 2010); Director, President and Chief Executive Officer, Ameriprise Certificate Company since 2006; Director and Chief Executive Officer, Columbia Management Investment Distributors, Inc. since May 2010 and February 2012, respectively (previously Chairman of the Board and Chief Executive Officer, 2006-April 2010). | | | 153 | | | None | |
|
* Interested person (as defined under the 1940 Act) by reason of being an officer, director, security holder and/or employee of the investment manager or Ameriprise Financial.
The SAI has additional information about the Fund's Board members and is available, without charge, upon request by calling 800.345.6611; contacting your financial intermediary; or visiting columbiamanagement.com.
34
Fund Governance (continued)
Officers
| Name, Year of Birth and Address | | Principal Occupation(s) During the Past Five Years | |
| J. Kevin Connaughton (Born 1964) | |
|
225 Franklin Street
Boston, MA 02110
President (since 2009) | | Senior Vice President and General Manager—Mutual Fund Products, Columbia Management Investment Advisers, LLC since May 2010; President, Columbia Funds, since 2009, and RiverSource Funds, since May 2010 (previously Senior Vice President and Chief Financial Officer, Columbia Funds, from June 2008 to January 2009, Treasurer, Columbia Funds, from October 2003 to May 2008, and senior officer of various other affiliated funds since 2000); Managing Director, Columbia Management Advisors, LLC from December 2004 to April 2010. | |
|
| Michael G. Clarke (Born 1969) | |
|
225 Franklin Street
Boston, MA 02110
Treasurer (since 2011) and Chief Financial Officer (since 2009) | | Vice President, Columbia Management Investment Advisers, LLC since May 2010; Managing Director of Fund Administration, Columbia Management Advisors, LLC, from September 2004 to April 2010; senior officer of Columbia Funds and affiliated funds since 2002. | |
|
| Scott R. Plummer (Born 1959) | |
|
5228 Ameriprise Financial Center
Minneapolis, MN 55474
Senior Vice President and Chief Legal Officer (since 2010) | | Chief Legal Officer and Assistant Secretary, Columbia Management Investment Advisers, LLC since June 2005; Vice President and Lead Chief Counsel—Asset Management, Ameriprise Financial, Inc. since May 2010 (previously Vice President and Chief Counsel—Asset Management, from 2005 to April 2010; Vice President, Chief Counsel and Assistant Secretary, Columbia Management Investment Distributors, Inc. since 2008; Vice President, General Counsel and Secretary, Ameriprise Certificate Company since 2005; Chief Counsel, RiverSource Distributors, Inc. since 2006; Senior officer of Columbia Funds and affiliated funds, since 2006. | |
|
| Thomas P. McGuire (Born 1971) | |
|
225 Franklin Street
Boston, MA 02110
Interim Chief Compliance Officer (since 2012) | | Vice President—Asset Management Compliance, Columbia Management Investment Advisers, LLC since March 2010; Chief Compliance Officer, Ameriprise Certificate Company, since September 2010; Compliance Executive Bank of America, from June 2005 to April 2010. | |
|
| William F. Truscott (Born 1960) | |
|
53600 Ameriprise Financial Center
Minneapolis, MN 55474
Senior Vice President (since 2010) | | Chairman of the Board and President, Columbia Management Investment Advisers, LLC since May 2010 and February 2012, respectively (previously President, Chairman of the Board and Chief Investment Officer, from 2001 to April 2010); Chief Executive Officer, U.S. Asset Management & President, Annuities, Ameriprise Financial, Inc. since May 2010 (previously President—U.S. Asset Management and Chief Investment Officer from 2005 to April 2010, and Senior Vice President—Chief Investment Officer, from 2001 to 2005); Director, President and Chief Executive Officer, Ameriprise Certificate Company since 2006; Director and Chief Executive Officer, Columbia Management Investment Distributors, Inc. since May 2010 and February 2012, respectively (previously Chairman of the Board and Chief Executive Officer from 2008 to April 2010); Chairman of the Board and Chief Executive Officer, RiverSource Distributors, Inc. since 2006. | |
|
35
Fund Governance (continued)
Officers (continued)
| Name, Year of Birth and Address | | Principal Occupation(s) During the Past Five Years | |
| Colin Moore (Born 1958) | |
|
225 Franklin Street
Boston, MA 02110
Senior Vice President (since 2010) | | Director and Chief Investment Officer, Columbia Management Investment Advisers, LLC since May 2010; Manager, Managing Director and Chief Investment Officer of Columbia Management Advisors, LLC from 2007 to April 2010; Head of Equities, Columbia Management Advisors, LLC from 2002 to 2007. | |
|
| Christopher O. Petersen (Born 1970) | |
|
5228 Ameriprise Financial Center
Minneapolis, MN 55474
Vice President and Secretary (since 2011) | | Vice President and Chief Counsel, Ameriprise Financial since January 2010 (formerly Vice President and Group Counsel or Counsel from April 2004 to January 2010); Senior officer of Columbia Funds and affiliated funds, since 2007. | |
|
| Amy Johnson (Born 1965) | |
|
5228 Ameriprise Financial Center
Minneapolis, MN 55474
Vice President (since 2010) | | Senior Vice President and Chief Operating Officer, Columbia Management Investment Advisers, LLC since May 2010 (previously Chief Administrative Officer, from 2009 until April 2010, Vice President—Asset Management and Trust Company Services, from 2006 to 2009, and Vice President—Operations and Compliance from 2004 to 2006). | |
|
| Joseph F. DiMaria (Born 1968) | |
|
225 Franklin Street
Boston, MA 02110
Vice President (since 2011) and Chief Accounting Officer (since 2008) | | Vice President, Mutual Fund Administration, Columbia Management Investment Advisers, LLC, since May 2010; Director of Fund Administration, Columbia Management Advisors, LLC from January 2006 to April 2010; Head of Tax/Compliance and Assistant Treasurer, Columbia Management Advisors, LLC, from November 2004 to December 2005. | |
|
| Paul B. Goucher (Born 1968) | |
|
5228 Ameriprise Financial Center
Minneapolis, MN 55474
Vice President and Assistant Treasurer (since 2010) | | Vice President and Chief Counsel of Ameriprise Financial since January 2010 (formerly Vice President and Group Counsel from November 2008 to January 2010); Director, Managing Director and General Counsel of J. & W. Seligman & Co. Incorporated (Seligman) from July 2008 to November 2008 and Managing Director and Associate General Counsel of Seligman from January 2005 to July 2008. | |
|
| Michael E. DeFao (Born 1968) | |
|
5228 Ameriprise Financial Center
Minneapolis, MN 55474
Vice President and Assistant Treasurer (since 2011) | | Vice President and Chief Counsel, Ameriprise Financial since May 2010; Associate General Counsel Bank of America from June 2005 to April 2010 | |
|
| Stephen T. Welsh (Born 1957) | |
|
225 Franklin Street
Boston, MA 02110
Vice President (since 2006) | | President and Director, Columbia Management Investment Services Corp. since May 2010; President and Director, Columbia Management Services, Inc. from July 2004 to April 2010; Managing Director, Columbia Management Distributors, Inc. from August 2007 to April 2010. | |
|
36
Important Information About This Report
The fund mails one shareholder report to each shareholder address. If you would like more than one report, please call shareholder services at 1-800-345-6611 and additional reports will be sent to you. This report has been prepared for shareholders of Columbia Masters International Equity Portfolio.
A description of the policies and procedures that the fund uses to determine how to vote proxies and a copy of the fund's voting records are available (i) at www.columbiamanagement.com, (ii) on the Securities and Exchange Commission's website at www.sec.gov, and (iii) without charge, upon request, by calling 1-800-368-0346. Information regarding how the fund voted proxies relating to portfolio securities during the 12-month period ended June 30 is available from the SEC's website. Information regarding how the fund voted proxies relating to portfolio securities is also available from the fund's website, www.columbiamanagement.com.
The fund files a complete schedule of portfolio holdings with the SEC for the first and third quarters of each fiscal year on Form N-Q. The fund's Form N-Q is available on the SEC's website at www.sec.gov and may be reviewed and copied at the SEC's Public Reference Room in Washington, D.C. Information on the operation of the Public Reference Room may be obtained by calling 1-800-SEC-0330.
Transfer Agent
Columbia Management Investment
Services Corp.
P.O. Box 8081
Boston, MA 02266-8081
1-800-345-6611
Distributor
Columbia Management Investment
Distributors, Inc.
225 Franklin Street
Boston, MA 02110
Investment Manager
Columbia Management Investment Advisers, LLC
225 Franklin Street
Boston, MA 02110
37

Columbia Masters International Equity Portfolio
P. O. Box 8081
Boston, MA 02266-8081
columbiamanagement.com
This information is for use with concurrent or prior delivery of a fund prospectus. Investors should consider the investment objectives, risks, charges and expenses of a mutual fund carefully before investing. For a free prospectus, which contains this and other important information about the funds, visit columbiamanagement.com. Read the prospectus carefully before investing. The Fund is distributed by Columbia Management Investment Distributors, Inc., member FINRA, and managed by Columbia Management Investment Advisers, LLC.
© 2012 Columbia Management Investment Advisers, LLC. All rights reserved.
C-1116 C (3/12)

Columbia LifeGoal® Portfolios
Annual Report for the Period Ended January 31, 2012
> Columbia LifeGoal® Growth Portfolio
> Columbia LifeGoal® Balanced Growth Portfolio
> Columbia LifeGoal® Income and Growth Portfolio
> Columbia LifeGoal® Income Portfolio
Not FDIC insured • No bank guarantee • May lose value
Table of Contents
Columbia LifeGoal® Growth
Portfolio | | | 1 | | |
|
Columbia LifeGoal® Balanced
Growth Portfolio | | | 6 | | |
|
Columbia LifeGoal® Income and
Growth Portfolio | | | 12 | | |
|
Columbia LifeGoal® Income
Portfolio | | | 18 | | |
|
| Portfolios of Investments | | | 24 | | |
|
| Financial Statements | | | 34 | | |
|
| Notes to Financial Statements | | | 69 | | |
|
Report of Independent Registered
Public Accounting Firm | | | 89 | | |
|
| Federal Income Tax Information | | | 90 | | |
|
| Fund Governance | | | 91 | | |
|
Important Information About
This Report | | | 101 | | |
|
The views expressed in this report reflect the current views of the respective parties. These views are not guarantees of future performance and involve certain risks, uncertainties and assumptions that are difficult to predict, so actual outcomes and results may differ significantly from the views expressed. These views are subject to change at any time based upon economic, market or other conditions and the respective parties disclaim any responsibility to update such views. These views may not be relied on as investment advice and, because investment decisions for a Columbia Fund are based on numerous factors, may not be relied on as an indication of trading intent on behalf of any particular Columbia Fund. References to specific securities should not be construed as a recommendation or investment advice.
President's Message

Dear Shareholders:
Americans were dispirited in the fourth quarter of 2011 by Washington's inability to reach a plan for deficit reduction and Europe's piecemeal attempt to address its own fiscal issues. Yet, there was sufficient good news to encourage risk taking, buoying both stocks and bonds to solid gains.
U.S. economic data surprised on the upside and fears of recession abated. With the bar of expectations set low, investors responded positively to the announcement that the economy had expanded by 1.8% in the third quarter. Consumer confidence improved, even though consumers remain under pressure with no real increase in disposable income and a continued decline in household net worth. Headline inflation—which tracks a broad range of consumer expenditures, including food and energy—declined. Even manufacturing held its ground.
Against this backdrop, the U.S. equity markets logged solid returns. The S&P 500 Index gained 11.82%, moving into positive territory for the year with quarterly advances in all ten sectors. Mid- and small-cap stocks did even better. Value outperformed growth across all market capitalizations. Energy stocks led the market, as the price of oil moved above $100 a barrel in December. Industrials and materials stocks rose, buoyed by improving economic data. The U.S. fixed-income markets logged modest but solid returns. High-yield bonds were the best performers as the economy showed signs of improvement. Emerging market bonds were strong performers, as inflation came under control in key regions. Municipal bonds and Treasuries eked out only modest gains, as investors moved away from quality in favor of riskier assets.
While fourth quarter gains were encouraging, challenges still remain. Columbia Management, however, remains strong and steadfast. Columbia Management is the eighth largest manager of long-term mutual fund assets with $326 billion under management as of December 31, 2011. The past year has been one of considerable change for the organization as we worked diligently to align products, services and resources in the integration of Columbia Management with RiverSource Investments. The strong line-up of talent, resources and capabilities that has resulted is highlighted by the success of our products. As of December 31, 2011, Columbia Management offers 52 funds rated either 4 or 5 stars by Morningstar.*
For more information about these and other funds offered by Columbia Management, including detailed, up-to-date fund performance and portfolio information, please visit us online at columbiamanagement.com. Other information and resources available on our website include:
g timely economic analysis and market commentary
g quarterly fund commentaries
g Columbia Management Investor, a quarterly newsletter for shareholders
Thank you for your continued support of the Columbia Funds. We look forward to serving your investment needs for many years to come.
Best Regards,

J. Kevin Connaughton
President, Columbia Funds
*All ratings are based on Class Z shares as of 12/31/2011. Out of 119 Class Z share Columbia funds rated by Morningstar, 7 funds received a 5-star Overall Rating and 45 funds received a 4-star Overall Rating. The Overall Morningstar Rating for a retail mutual fund is derived from a weighted average of the performance figures associated with its 3-, 5- and 10-year (if applicable) Morningstar Rating metrics. For share classes that do not have a 3-, 5-, or 10-year actual performance history, the fund's independent Morningstar Rating metric is then compared against the retail mutual fund universe breakpoints to determine its hypothetical rating.
For each fund with at least a three-year history, Morningstar calculates a Morningstar RatingTM based on a Morningstar Risk-Adjusted Return measure that accounts for variation in a fund's monthly performance (including the effects of sales charges/loads, and redemption fees), placing more emphasis on downward variations and rewarding consistent performance. The top 10% of funds in each category receive 5 stars, the next 22.5% receive 4 stars, the next 35% receive 3 stars, the next 22.5% receive 2 stars and the bottom 10% receive 1 star. (Each share class is counted as a fraction of one fund within this scale and rated separately, which may cause slight variations in the distribution percentages.)
The Morningstar RatingTM is for Class Z shares only; other classes may have different performance characteristics and may have different ratings. ©2012 Morningstar, Inc. All Rights Reserved. The Morningstar information contained herein: (1) is proprietary to Morningstar and/or its content providers; (2) may not be copied or distributed; and (3) is not warranted to be accurate, complete or timely. Neither Morningstar nor its content providers are responsible for any damages or losses arising from any use of this information.
Investors should consider the investment objectives, risks, charges and expenses of a mutual fund carefully before investing. For a free prospectus, which contains this and other important information about the funds, visit columbiamanagement.com. The prospectus should be read carefully before investing.
Columbia Funds are distributed by Columbia Management Investment Distributors, Inc., member FINRA, and managed by Columbia Management Investment Advisers, LLC.
© 2012 Columbia Management Investment Advisers, LLC. All rights reserved.
Portfolio Profile – Columbia LifeGoal Growth Portfolio
Summary
g Effective January 31, 2012, the fiscal year end for Columbia LifeGoal Growth Portfolio changed from March 31 to January 31.
g For the 10-month period ended January 31, 2012, the portfolio's Class A shares returned –4.98% without sales charge.
g The portfolio underperformed its benchmark, the S&P 500 Index, which returned 0.73% during the period.
g We attribute the portfolio's underperformance primarily to the underperformance of several underlying equity funds.
Portfolio Management
Colin Moore has co-managed the portfolio since 2009. From 2002 until joining Columbia Management Investment Advisers, LLC (the Investment Manager) in May 2010, Mr. Moore was associated with the portfolio's previous investment adviser as an investment professional.
Anwiti Bahuguna, PhD, has co-managed the portfolio since 2009. From 2002 until joining the Investment Manager in May 2010, Ms. Bahuguna was associated with the portfolio's previous investment adviser as an investment professional.
Robert McConnaughey has co-managed the portfolio since 2011. From 2002 until joining the Investment Manager in May 2010, Mr. McConnaughey was associated with the portfolio's previous investment adviser as an investment professional.
Melda Mergen, CFA, CAIA, has co-managed the portfolio since November 2011. From 1999 until joining the Investment Manager in May 2010, Ms. Mergen was associated with the portfolio's previous investment adviser or its predecessors as an investment professional.
Marie M. Schofield, CFA, has co-managed the portfolio since 2009. From 1990 until joining the Investment Manager in May 2010, Ms. Schofield was associated with the portfolio's previous investment adviser as an investment professional.
Beth Vanney, CFA, has co-managed the portfolio since November 2011. From 1999 until joining the Investment Manager in May 2010, Ms. Vanney was associated with the portfolio's previous investment adviser or its predecessors as an investment professional.
1The Standard & Poor's (S&P) 500 Index tracks the performance of 500 widely held, large-capitalization U.S. stocks.
Indices are not available for investment, are not professionally managed and do not reflect sales charges, fees, brokerage commissions, taxes or other expenses of investing. Securities in the fund may not match those in an index.
Performance data quoted represents past performance and current performance may be lower or higher. Past performance is no guarantee of future results. The investment return and principal value will fluctuate so that shares, when redeemed, may be worth more or less than the original cost. Please visit www.columbiamanagement.com for daily and most recent month-end performance updates.
Summary
10-month return as of 01/31/12
| | –4.98% | |
|
|  | | | Class A shares
(without sales charge) | |
|
| | +0.73% | |
|
|  | | | S&P 500 Index1 | |
|
1
Performance Information – Columbia LifeGoal Growth Portfolio
Performance data quoted represents past performance and current performance may be lower or higher. Past performance is no guarantee of future results. The investment return and principal value will fluctuate so that shares, when redeemed, may be worth more or less than the original cost. Please visit www.columbiamanagement.com for daily and most recent month-end performance updates.
Performance of a $10,000 investment 02/01/02 – 01/31/12
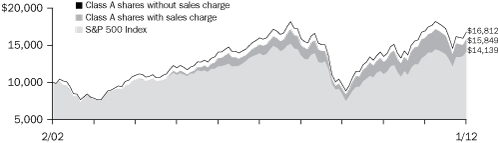
The chart above shows the change in value of a hypothetical $10,000 investment in Class A shares of Columbia LifeGoal Growth Portfolio during the stated time period, and does not reflect the deduction of taxes that a shareholder may pay on portfolio distributions or on the redemption of portfolio shares.
Performance of a $10,000 investment 02/01/02 – 01/31/12 ($)
| Sales charge | | without | | with | |
| Class A | | | 16,812 | | | | 15,849 | | |
| Class B | | | 15,582 | | | | 15,582 | | |
| Class C | | | 15,582 | | | | 15,582 | | |
| Class R | | | 16,395 | | | | n/a | | |
| Class R4 | | | 16,825 | | | | n/a | | |
| Class Z | | | 17,251 | | | | n/a | | |
Average annual total return as of 01/31/12 (%)
| Share class | | A | | B | | C | | R | | R4 | | Z | |
| Inception | | 10/15/96 | | 08/12/97 | | 10/15/96 | | 01/23/06* | | 03/07/11* | | 10/15/96 | |
| Sales charge | | without | | with | | without | | with | | without | | with | | without | | without | | without | |
10 month
(cumulative) | | | –4.98 | | | | –10.46 | | | | –5.60 | | | | –10.31 | | | | –5.56 | | | | –6.50 | | | | –5.12 | | | | –4.88 | | | | –4.71 | | |
| 1-year | | | –0.80 | | | | –6.52 | | | | –1.51 | | | | –6.42 | | | | –1.52 | | | | –2.50 | | | | –0.97 | | | | –0.73 | | | | –0.44 | | |
| 5-year | | | 0.97 | | | | –0.22 | | | | 0.23 | | | | –0.07 | | | | 0.22 | | | | 0.22 | | | | 0.72 | | | | 0.99 | | | | 1.25 | | |
| 10-year/Life | | | 5.33 | | | | 4.71 | | | | 4.54 | | | | 4.54 | | | | 4.54 | | | | 4.54 | | | | 5.07 | | | | 5.34 | | | | 5.60 | | |
The "with sales charge" returns include the maximum initial sales charge of 5.75% for Class A shares, the applicable contingent deferred sales charge of 5.00% in the first year, declining to 1.00% in the sixth year and eliminated thereafter for Class B shares and 1.00% for Class C shares for the first year only. The "without sales charge" returns do not include the effect of sales charges. If they had, returns would be lower.
Performance results reflect any fee waivers or reimbursements of portfolio expenses by the Investment Manager and/or any of its affiliates. Absent these fee waivers or expense reimbursement arrangements, performance results would have been lower.
All results shown assume reinvestment of distributions. Class R4 and Class Z shares are sold at net asset value with no distribution and service (Rule 12b-1) fees. Class R shares are sold at net asset value with distribution fees. Class R, Class R4 and Class Z shares have limited eligibility and the investment minimum requirements may vary. Please see the portfolio's prospectus for details. Performance for different share classes will vary based on differences in sales charges and fees associated with each class.
The tables do not reflect the deduction of taxes that a shareholder may pay on portfolio distributions or on the redemption of portfolio shares.
The inception date of the portfolio's Class R shares is January 23, 2006. Class R shares have no performance prior to their inception date. The performance shown for Class R shares prior to their inception date is that of Class A shares. If Class R shares fees and expenses were included, performance would be lower.
Class R4 shares were initially offered on March 7, 2011.
*The returns shown for periods prior to the share class inception date (including returns since inception, which are since portfolio inception) include the returns of the portfolio's oldest share class. These returns are adjusted to reflect any higher class-related operating expenses of the newer share classes, as applicable. Please visit columbiamanagement.com/mutual-funds/appended-performance for more information.
2
Understanding Your Expenses – Columbia LifeGoal Growth Portfolio
As an investor, you incur two types of costs. There are transaction costs, which generally include sales charges on purchases and may include redemption fees. There are also ongoing costs, which generally include management fees, distribution and service (Rule 12b-1) fees, and other portfolio expenses. The following information is intended to help you understand your ongoing costs (in dollars) of investing in the portfolio and to help you compare these costs with the ongoing costs of investing in other mutual funds.
Analyzing your portfolio's expenses
To illustrate these ongoing costs, we have provided examples and calculated the expenses paid by investors in each share class of the portfolio during the period. The actual and hypothetical information in the table is based on an initial investment of $1,000 at the beginning of the period indicated and held for the entire period. Expense information is calculated two ways and each method provides you with different information. The amount listed in the "Actual" column is calculated using the portfolio's actual operating expenses and total return for the period. You may use the Actual information, together with the amount invested, to estimate the expenses that you paid over the period. Simply divide your account value by $1,000 (for example, an $8,600 account value divided by $1,000 = 8.6), then multiply the results by the expenses paid during the period under the Actual column. The amount listed in the "Hypothetical" column assumes a 5% annual rate of return before expenses (which is not the portfolio's actual return) and then applies the portfolio's actual expense ratio for the period to the hypothetical return. You should not use the hypothetical account values and expenses to estimate either your actual account balance at the end of the period or the expenses you paid during the period. See "Compare with other funds" below for details on how to use the hypothetical data.
In addition to the ongoing expenses which the portfolio bears directly, the portfolio's shareholders indirectly bear the portfolio's allocable share of the costs and expenses of each underlying fund in which the portfolio invests. You can also estimate the effective expenses paid during the period, which includes the indirect fees associated with investing in the underlying funds, by using the amounts listed in the effective expenses paid during the period column.
Compare with other funds
Since all mutual funds are required to include the same hypothetical calculations about expenses in shareholder reports, you can use this information to compare the ongoing cost of investing in the portfolio with other funds. To do so, compare the hypothetical example with the 5% hypothetical examples that appear in the shareholder reports of other funds. As you compare hypothetical examples of other funds, it is important to note that hypothetical examples are meant to highlight the ongoing costs of investing in a fund only and do not reflect any transaction costs, such as sales charges, or redemption or exchange fees. Therefore, the hypothetical calculations are useful in comparing ongoing costs only, and will not help you determine the relative total costs of owning different funds. If transaction costs were included in these calculations, your costs would be higher.
08/01/11 – 01/31/12
| | | Account value
at the beginning
of the period ($) | | Account value
at the end
of the period ($) | | Expenses
paid during
the period ($) | | Portfolio's
annualized
expense
ratio (%) | | Effective
expenses paid
during the
period ($) | | Portfolio's
effective
annualized
expense
ratio (%) | |
| | | Actual | | Hypothetical | | Actual | | Hypothetical | | Actual | | Hypothetical | | Actual | | Actual | | Hypothetical | | Actual | |
| Class A | | | 1,000.00 | | | | 1,000.00 | | | | 974.60 | | | | 1,023.08 | | | | 2.36 | | | | 2.42 | | | | 0.47 | | | | 6.54 | | | | 6.70 | | | | 1.30 | | |
| Class B | | | 1,000.00 | | | | 1,000.00 | | | | 970.90 | | | | 1,019.31 | | | | 6.08 | | | | 6.23 | | | | 1.21 | | | | 10.24 | | | | 10.50 | | | | 2.04 | | |
| Class C | | | 1,000.00 | | | | 1,000.00 | | | | 970.60 | | | | 1,019.31 | | | | 6.08 | | | | 6.23 | | | | 1.21 | | | | 10.24 | | | | 10.50 | | | | 2.04 | | |
| Class R | | | 1,000.00 | | | | 1,000.00 | | | | 973.60 | | | | 1,021.86 | | | | 3.57 | | | | 3.66 | | | | 0.71 | | | | 7.74 | | | | 7.93 | | | | 1.54 | | |
| Class R4 | | | 1,000.00 | | | | 1,000.00 | | | | 975.20 | | | | 1,023.49 | | | | 1.96 | | | | 2.01 | | | | 0.39 | | | | 6.14 | | | | 6.29 | | | | 1.22 | | |
| Class Z | | | 1,000.00 | | | | 1,000.00 | | | | 976.40 | | | | 1,024.41 | | | | 1.06 | | | | 1.08 | | | | 0.21 | | | | 5.24 | | | | 5.36 | | | | 1.04 | | |
Expenses paid during the period are equal to the annualized expense ratio for each class as indicated above, multiplied by the average account value over the period and then multiplied by the number of days in the portfolio's most recent fiscal half year and divided by 365.
Effective expenses paid during the period and the Portfolio's effective annualized expense ratio include expenses borne directly to the class plus the Portfolio's pro rata portion of the ongoing expenses charged by the underlying funds using the expense ratio of each class of the underlying funds as of the underlying fund's most recent shareholder report.
Had Columbia Management Investment Advisers, LLC and/or any of its affiliates not waived/reimbursed a portion of fees and expenses, account value at the end of the period would have been reduced.
3
Portfolio Manager's Report – Columbia LifeGoal Growth Portfolio
Performance data quoted represents past performance and current performance may be lower or higher. Past performance is no guarantee of future results. The investment return and principal value will fluctuate so that shares, when redeemed, may be worth more or less than the original cost. Please visit www.columbiamanagement.com for daily and most recent month-end performance updates.
Net asset value per share
as of 01/31/12 ($)
| Class A | | | 11.59 | | |
| Class B | | | 10.56 | | |
| Class C | | | 10.47 | | |
| Class R | | | 11.48 | | |
| Class R4 | | | 11.79 | | |
| Class Z | | | 11.80 | | |
Distributions declared per share
04/01/11 – 01/31/12 ($)
| Class A | | | 0.04 | | |
| Class B | | | 0.02 | | |
| Class C | | | 0.02 | | |
| Class R | | | 0.03 | | |
| Class R4 | | | 0.05 | | |
| Class Z | | | 0.06 | | |
For the 10-month period ended January 31, 2012, the portfolio's Class A shares returned –4.98% without sales charge. The portfolio underperformed its benchmark, the S&P 500 Index, which returned 0.73% during the period. We attribute the portfolio's underperformance primarily to the underperformance of several underlying equity funds.
Underlying fund performance detracts from results
Global equity markets generated mixed results during the 10 months ended January 31, 2012 despite posting strong gains in the final quarter of 2011. U.S. equity indices posted low single-digit gains on average. Within the U.S. equity market, large-cap stocks modestly outperformed small-cap and mid-cap stocks, and growth stocks outperformed value stocks across the capitalization spectrum. International stocks generally declined, underperforming the U.S. equity market overall, as the U.S. dollar strengthened and concerns regarding European sovereign debt heightened. Emerging market equities also retreated somewhat.
The period proved to be much like the changing seasons. A cyclical bull market lasted through most of April 2011. Then a cyclical bear market dominated from May through September 2011 followed by a market upswing from October 2011 through the end of the period. During the cyclical bear market, more defensive investment strategies, such as those that emphasize factors related to higher quality, lower volatility and sensitivity to a strengthening U.S. dollar, tended to perform better. As the market improved during the last months of the period, more aggressive investment strategies, including price reversion, higher beta and small-cap, performed well. (Price reversion is an investment strategy involving the purchase or sale of stocks based on the theory that prices eventually move back toward the historical mean or average of the price. Beta is a measure of sensitivity to market movements.) For the period as a whole, the factors that worked best in identifying areas of equity strength fell into one of two categories—efficiency or profitability. Indicators of efficiency included strong operating cash flow and/or high earnings before interest and taxes (EBIT)-to-asset ratios. Profitability indicators that worked well for screening names in the equity universe during the annual period included high levels of return on assets (ROA) or return on investment (ROI).
For the portfolio, exposure to international developed and emerging market equities hampered the portfolio's results. The portfolio was largely underweighted these areas throughout the 10 months, however they still hurt relative performance as U.S. equity markets proved to offer a better store of value during the period than either international developed or emerging market equities. Similarly, while the portfolio was underweight underlying funds utilizing U.S. mid-cap and small-cap value oriented strategies, these underlying funds lagged their respective benchmark indices, thus detracting from the portfolio's relative results during the period. One other area that detracted modestly from the portfolio's total returns was convertible, or hybrid, securities.
On the positive side, an emphasis throughout the period on dividend-paying equities proved particularly advantageous, as two underlying funds that focus on high quality dividend paying equities were notable contributors to total returns during the period. In
4
Portfolio Manager's Report (continued) – Columbia LifeGoal Growth Portfolio
addition, underlying funds that focus on large-cap equities wherein stock selection was driven by quantitative models added value, as these underlying funds generated both strong absolute and relative results during the period.
The portfolio also benefited during the period from a small allocation to underlying funds employing absolute return strategies. Indeed, the portfolio established positions in two absolute return-oriented underlying funds, including an absolute return multi-strategy offering and an enhanced version of the same multi-strategy design. Both of these underlying funds performed well during the period. We continue to believe alternative asset investments can help buffer the portfolio from heightened volatility while simultaneously generating a potential new source of return that has low, or in some cases, no correlation to traditional stock and bond markets.
Adjusting risk exposure as market conditions shifted
Overall, we sought to reduce the portfolio's exposure to risk during the early summer months, as it was then that the financial markets were beginning to be fixated on the emerging verbal sparring coming out of the political circles in Washington D.C. Also, Europe's struggles with fiscal soundness were heightening. These macro challenges, along with a slowing of economic growth in the emerging markets and supply chain constraints tied to the natural disasters that struck Japan the prior spring, all weighed on investor sentiment. For these reasons and others more closely tied to the fundamental backdrop, we felt it prudent to modestly reduce the portfolio's exposure to equities, moving to an underweighted allocation versus the portfolio's long-term strategic neutral benchmark assignments, and to increase the portfolio's exposure to alternative assets. These risk-reduction strategies generally served the portfolio's results well, especially during the final months of summer 2011. While we subsequently maintained the portfolio's somewhat conservative positioning, we took small incremental steps to add some risk back into the portfolio toward the end of the period. We implemented this strategy by adding to the portfolio's equity positions, both across the market capitalization spectrum and across regions, including the U.S., Europe and Pacific-Asia ex Japan.
Portfolio Allocation
(Unaudited)
Fund holdings at
January 31, 2012 | | % of Fund's
portfolio
assets | |
Domestic Equity Funds/
International Equity Funds | |
| Includes large cap, international, mid cap, real estate, small cap, small-mid cap | |
| Columbia Pacific/Asia Fund | | | 9.1 | % | |
Columbia Contrarian
Core Fund | | | 6.2 | | |
Columbia Dividend
Income Fund | | | 11.9 | | |
Columbia Dividend
Opportunity Fund | | | 12.1 | | |
Columbia Emerging
Markets Fund | | | 6.0 | | |
Columbia Energy and Natural
Resources Fund | | | 3.0 | | |
Columbia Large Cap
Core Fund | | | 4.1 | | |
Columbia Large Cap
Growth Fund | | | 9.2 | | |
Columbia Large Core
Quantitative Fund | | | 3.1 | | |
Columbia Large Growth
Quantitative Fund | | | 4.1 | | |
Columbia Large Value
Quantitative Fund | | | 2.0 | | |
Columbia Mid Cap
Growth Fund | | | 5.1 | | |
| Columbia Mid Cap Value Fund | | | 1.1 | | |
Columbia Mid Cap Value
Opportunity Fund | | | 1.1 | | |
Columbia Select Large Cap
Growth Fund | | | 11.1 | | |
Columbia Select Large-Cap
Value Fund | | | 2.0 | | |
Columbia Small Cap
Growth Fund I | | | 2.0 | | |
| | | | 93.2 | % | |
| Fixed-Income Funds | |
| Includes government, corporate, mortgage and agency securities, floating rate, global, high yield, inflation protected, convertible | |
Columbia Convertible
Securities Fund | | | 5.9% | | |
| Alternative Investments | |
Columbia Absolute Return
Enhanced Multi-Strategy Fund | | | 0.9% | | |
| | | | 100.0 | % | |
5
Portfolio Profile – Columbia LifeGoal Balanced Growth Portfolio
Performance data quoted represents past performance and current performance may be lower or higher. Past performance is no guarantee of future results. The investment return and principal value will fluctuate so that shares, when redeemed, may be worth more or less than the original cost. Please visit www.columbiamanagement.com for daily and most recent month-end performance updates.
Summary
10-month return as of 01/31/12
| | –1.20% | |
|
|  | | | Class A shares
(without sales charge) | |
|
| | +8.33% | |
|
|  | | | Barclays Capital Aggregate
Bond Index1 | |
|
| | +0.73% | |
|
|  | | | S&P 500 Index2 | |
|
Summary
g Effective January 31, 2012, the fiscal year end for Columbia LifeGoal Balanced Growth Portfolio changed from March 31 to January 31.
g For the 10-month period ended January 31, 2012, the portfolio's Class A shares returned –1.20% without sales charge.
g The portfolio's equity benchmark, the broad-based S&P 500 Index, returned 0.73%.
g The portfolio's fixed income benchmark, the Barclays Capital U.S. Aggregate Bond Index, returned 8.33%.
g We attribute the portfolio's underperformance primarily to the underperformance of several underlying funds.
Portfolio Management
Colin Moore has co-managed the portfolio since 2009. From 2002 until joining Columbia Management Investment Advisers, LLC (the Investment Manager) in May 2010, Mr. Moore was associated with the portfolio's previous investment adviser as an investment professional.
Anwiti Bahuguna, PhD, has co-managed the portfolio since 2009. From 2002 until joining the Investment Manager in May 2010, Ms. Bahuguna was associated with the portfolio's previous investment adviser as an investment professional.
Melda Mergen, CFA, CAIA, has co-managed the portfolio since November 2011. From 1999 until joining the Investment Manager in May 2010, Ms. Mergen was associated with the portfolio's previous investment adviser or its predecessors as an investment professional.
Marie M. Schofield, CFA, has co-managed the portfolio since 2009. From 1990 until joining the Investment Manager in May 2010, Ms. Schofield was associated with the portfolio's previous investment adviser as an investment professional.
Beth Vanney, CFA, has co-managed the portfolio since November 2011. From 1999 until joining the Investment Manager in May 2010, Ms. Vanney was associated with the portfolio's previous investment adviser or its predecessors as an investment professional.
1The Barclays Capital Aggregate Bond Index is a market value-weighted index that tracks the daily price, coupon, pay-downs, and total return performance of fixed-rate, publicly placed, dollar-denominated, and non-convertible investment grade debt issues with a least $250 million par amount outstanding and with a least one year to final maturity.
2The Standard & Poor's (S&P) 500 Index tracks the performance of 500 widely held, large-capitalization U.S. stocks.
Indices are not available for investment, are not professionally managed and do not reflect sales charges, fees, brokerage commissions, taxes or other expenses of investing. Securities in the fund may not match those in an index.
6
Performance Information – Columbia LifeGoal Balanced Growth Portfolio
Performance of a $10,000 investment 02/01/02 – 01/31/12
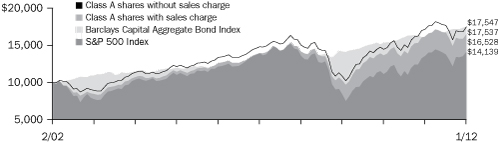
The chart above shows the change in value of a hypothetical $10,000 investment in Class A shares of Columbia LifeGoal Balanced Growth Portfolio during the stated time period, and does not reflect the deduction of taxes that a shareholder may pay on portfolio distributions or on the redemption of portfolio shares.
Performance of a $10,000 investment 02/01/02 – 01/31/12 ($)
| Sales charge | | without | | with | |
| Class A | | | 17,537 | | | | 16,528 | | |
| Class B | | | 16,246 | | | | 16,246 | | |
| Class C | | | 16,269 | | | | 16,269 | | |
| Class R | | | 17,092 | | | | n/a | | |
| Class T | | | 17,449 | | | | 16,445 | | |
| Class Z | | | 18,001 | | | | n/a | | |
Performance data quoted represents past performance and current performance may be lower or higher. Past performance is no guarantee of future results. The investment return and principal value will fluctuate so that shares, when redeemed, may be worth more or less than the original cost. Please visit www.columbiamanagement.com for daily and most recent month-end performance updates.
Average annual total return as of 01/31/12 (%)
| Share class | | A | | B | | C | | R | | T | | Z | |
| Inception | | 10/15/96 | | 08/13/97 | | 10/15/96 | | 01/23/06* | | 03/07/11* | | 10/15/96 | |
| Sales charge | | without | | with | | without | | with | | without | | with | | without | | without | | with | | without | |
| 10 month (cumulative) | | | –1.20 | | | | –6.89 | | | | –1.87 | | | | –6.74 | | | | –1.85 | | | | –2.82 | | | | –1.39 | | | | –1.23 | | | | –6.92 | | | | –1.00 | | |
| 1-year | | | 2.04 | | | | –3.85 | | | | 1.26 | | | | –3.74 | | | | 1.25 | | | | 0.25 | | | | 1.78 | | | | 1.98 | | | | –3.90 | | | | 2.30 | | |
| 5-year | | | 3.43 | | | | 2.22 | | | | 2.64 | | | | 2.31 | | | | 2.66 | | | | 2.66 | | | | 3.18 | | | | 3.38 | | | | 2.17 | | | | 3.72 | | |
| 10-year/Life | | | 5.78 | | | | 5.15 | | | | 4.97 | | | | 4.97 | | | | 4.99 | | | | 4.99 | | | | 5.51 | | | | 5.72 | | | | 5.10 | | | | 6.05 | | |
The "with sales charge" returns include the maximum initial sales charge of 5.75% for Class A shares, the applicable contingent deferred sales charge of 5.00% in the first year, declining to 1.00% in the sixth year and eliminated thereafter for Class B shares and 1.00% for Class C shares for the first year only. The "without sales charge" returns do not include the effect of sales charges. If they had, returns would be lower.
Performance results reflect any fee waivers or reimbursements of portfolio expenses by the Investment Manager and/or any of its affiliates. Absent these fee waivers or reimbursement arrangements, performance results shown would have been lower.
All results shown assume reinvestment of distributions. Class T and Class Z shares are sold at net asset value with no distribution and service (Rule 12b-1) fees. Class R shares are sold at net asset value with distribution and service (Rule 12b-1) fees. Class R, Class T and Class Z shares have limited eligibility and the investment minimum requirements may vary. Please see the portfolio's prospectus for details. Performance for different share classes will vary based on differences in sales charges and fees associated with each class.
The tables do not reflect the deduction of taxes that a shareholder may pay on portfolio distributions or on the redemption of portfolio shares.
The inception date of the portfolio's Class R shares is January 23, 2006. Class R shares have no performance prior to their inception date. The performance shown for Class R shares prior to their inception date is that of Class A shares. If Class R shares fees and expenses were included, performance would be lower.
Class T shares were initially offered on March 7, 2011.
*The returns shown for periods prior to the share class inception date (including returns since inception, which are since portfolio inception) include the returns of the portfolio's oldest share class. These returns are adjusted to reflect any higher class-related operating expenses of the newer share classes, as applicable. Please visit columbiamanagement.com/mutual-funds/appended-performance for more information.
7
Understanding Your Expenses – Columbia LifeGoal Balanced Growth Portfolio
As an investor, you incur two types of costs. There are transaction costs, which generally include sales charges on purchases and may include redemption fees. There are also ongoing costs, which generally include management fees, distribution and service (Rule 12b-1) fees, and other portfolio expenses. The following information is intended to help you understand your ongoing costs (in dollars) of investing in the portfolio and to help you compare these costs with the ongoing costs of investing in other mutual funds.
Analyzing your portfolio's expenses
To illustrate these ongoing costs, we have provided examples and calculated the expenses paid by investors in each share class of the portfolio during the period. The actual and hypothetical information in the table is based on an initial investment of $1,000 at the beginning of the period indicated and held for the entire period. Expense information is calculated two ways and each method provides you with different information. The amount listed in the "Actual" column is calculated using the portfolio's actual operating expenses and total return for the period. You may use the Actual information, together with the amount invested, to estimate the expenses that you paid over the period. Simply divide your account value by $1,000 (for example, an $8,600 account value divided by $1,000 = 8.6), then multiply the results by the expenses paid during the period under the Actual column. The amount listed in the "Hypothetical" column assumes a 5% annual rate of return before expenses (which is not the portfolio's actual return) and then applies the portfolio's actual expense ratio for the period to the hypothetical return. You should not use the hypothetical account values and expenses to estimate either your actual account balance at the end of the period or the expenses you paid during the period. See "Compare with other funds" below for details on how to use the hypothetical data.
In addition to the ongoing expenses which the portfolio bears directly, the portfolio's shareholders indirectly bear the portfolio's allocable share of the costs and expenses of each underlying fund in which the portfolio invests. You can also estimate the effective expenses paid during the period, which includes the indirect fees associated with investing in the underlying funds, by using the amounts listed in the effective expenses paid during the period column.
Compare with other funds
Since all mutual funds are required to include the same hypothetical calculations about expenses in shareholder reports, you can use this information to compare the ongoing cost of investing in the portfolio with other funds. To do so, compare the hypothetical example with the 5% hypothetical examples that appear in the shareholder reports of other funds. As you compare hypothetical examples of other funds, it is important to note that hypothetical examples are meant to highlight the ongoing costs of investing in a fund only and do not reflect any transaction costs, such as sales charges, or redemption or exchange fees. Therefore, the hypothetical calculations are useful in comparing ongoing costs only, and will not help you determine the relative total costs of owning different funds. If transaction costs were included in these calculations, your costs would be higher.
08/01/11 – 01/31/12
| | | Account value
at the beginning
of the period ($) | | Account value
at the end
of the period ($) | | Expenses
paid during
the period ($) | | Portfolio's
annualized
expense
ratio (%) | | Effective
expenses paid
during the
period ($) | | Portfolio's
effective
annualized
expense
ratio (%) | |
| | | Actual | | Hypothetical | | Actual | | Hypothetical | | Actual | | Hypothetical | | Actual | | Actual | | Hypothetical | | Actual | |
| Class A | | | 1,000.00 | | | | 1,000.00 | | | | 988.20 | | | | 1,022.57 | | | | 2.89 | | | | 2.94 | | | | 0.57 | | | | 6.59 | | | | 6.70 | | | | 1.30 | | |
| Class B | | | 1,000.00 | | | | 1,000.00 | | | | 984.20 | | | | 1,018.70 | | | | 6.72 | | | | 6.84 | | | | 1.33 | | | | 10.41 | | | | 10.60 | | | | 2.06 | | |
| Class C | | | 1,000.00 | | | | 1,000.00 | | | | 985.30 | | | | 1,018.75 | | | | 6.68 | | | | 6.79 | | | | 1.32 | | | | 10.37 | | | | 10.54 | | | | 2.05 | | |
| Class R | | | 1,000.00 | | | | 1,000.00 | | | | 987.80 | | | | 1,021.30 | | | | 4.15 | | | | 4.22 | | | | 0.82 | | | | 7.85 | | | | 7.98 | | | | 1.55 | | |
| Class T | | | 1,000.00 | | | | 1,000.00 | | | | 988.00 | | | | 1,022.32 | | | | 3.14 | | | | 3.19 | | | | 0.62 | | | | 6.84 | | | | 6.96 | | | | 1.35 | | |
| Class Z | | | 1,000.00 | | | | 1,000.00 | | | | 990.40 | | | | 1,023.85 | | | | 1.62 | | | | 1.65 | | | | 0.32 | | | | 5.33 | | | | 5.41 | | | | 1.05 | | |
Expenses paid during the period are equal to the annualized expense ratio for each class as indicated above, multiplied by the average account value over the period and then multiplied by the number of days in the portfolio's most recent fiscal half year and divided by 365.
Effective expenses paid during the period and the Portfolio's effective annualized expense ratio include expenses borne directly to the class plus the Portfolio's pro rata portion of the ongoing expenses charged by the underlying funds using the expense ratio of each class of the underlying funds as of the underlying fund's most recent shareholder report.
Had Columbia Management Investment Advisers, LLC and/or any of its affiliates not waived/reimbursed a portion of fees and expenses, account value at the end of the period would have been reduced.
8
Portfolio Manager's Report – Columbia LifeGoal Balanced Growth Portfolio
For the 10-month period ended January 31, 2012, the portfolio's Class A shares returned –1.20% without sales charge. The portfolio's equity benchmark, the broad-based S&P 500 Index, returned 0.73%, and its fixed income benchmark, the Barclays Capital U.S. Aggregate Bond Index, returned 8.33%. We attribute the portfolio's underperformance primarily to the underperformance of several underlying funds.
Underlying fund performance detracts from results
Global equity markets generated mixed results during the 10 months ended January 31, 2012 despite posting strong gains in the final quarter of 2011. U.S. equity indices posted low single-digit gains on average. Within the U.S. equity market, large-cap stocks modestly outperformed small-cap and mid-cap stocks, and growth stocks outperformed value stocks across the capitalization spectrum. International stocks generally declined, underperforming the U.S. equity market overall, as the U.S. dollar strengthened and concerns regarding European sovereign debt heightened. Emerging market equities also retreated somewhat.
The period proved to be much like the changing seasons. A cyclical bull market lasted through most of April 2011. Then a cyclical bear market dominated from May through September 2011 followed by a market upswing from October 2011 through the end of the period. During the cyclical bear market, more defensive investment strategies, such as those that emphasize factors related to higher quality, lower volatility and sensitivity to a strengthening U.S. dollar, tended to perform better. As the market improved during the last months of the period, more aggressive investment strategies, including price reversion, higher beta and small-cap, performed well. (Price reversion is an investment strategy involving the purchase or sale of stocks based on the theory that prices eventually move back toward the historical mean or average of the price. Beta is a measure of sensitivity to market movements.) For the period as a whole, the factors that worked best in identifying areas of equity strength fell into one of two categories—efficiency or profitability. Indicators of efficiency included strong operating cash flow and/or high earnings before interest and taxes (EBIT)-to-asset ratios. Profitability indicators that worked well for screening names in the equity universe during the annual period included high levels of return on assets (ROA) or return on investment (ROI).
The fixed income market posted consistently positive returns during the period, led by strength in interest rate-sensitive sectors, such as U.S. Treasuries, government agency securities and Treasury inflation-protected securities (TIPS). Emerging market bonds also performed well, as inflation came under control in key regions and solid economic growth was forecasted for 2012. More credit-sensitive sectors, such as high yield corporate bonds, lagged the Barclays Capital U.S. Aggregate Bond Index but still managed to post modestly positive total returns during the period. Cash produced the lowest returns in the portfolio's fixed income investable universe, gaining only modest ground, as the Federal Reserve Board (the Fed) held short-term interest rates near zero throughout the period.
For the portfolio, exposure to international developed and emerging market equities hampered the portfolio's results. The portfolio was largely underweighted in these
Performance data quoted represents past performance and current performance may be lower or higher. Past performance is no guarantee of future results. The investment return and principal value will fluctuate so that shares, when redeemed, may be worth more or less than the original cost. Please visit www.columbiamanagement.com for daily and most recent month-end performance updates.
Net asset value per share
as of 01/31/12 ($)
| Class A | | | 11.30 | | |
| Class B | | | 11.21 | | |
| Class C | | | 11.36 | | |
| Class R | | | 11.29 | | |
| Class T | | | 11.30 | | |
| Class Z | | | 11.29 | | |
Distributions declared per share
04/01/11 – 01/31/12 ($)
| Class A | | | 0.16 | | |
| Class B | | | 0.10 | | |
| Class C | | | 0.10 | | |
| Class R | | | 0.14 | | |
| Class T | | | 0.16 | | |
| Class Z | | | 0.18 | | |
9
Portfolio Manager's Report (continued) – Columbia LifeGoal Balanced Growth Portfolio
Portfolio Allocation
(Unaudited)
Fund holdings at
January 31, 2012 | | % of Fund's
portfolio
assets | |
Domestic Equity Funds/
International Equity Funds | |
| Includes large cap, international, mid cap, real estate, small cap, small-mid cap | |
| Columbia Pacific/Asia Fund | | | 1.5 | % | |
Columbia Contrarian
Core Fund | | | 5.1 | | |
Columbia Dividend
Income Fund | | | 2.7 | | |
Columbia Dividend
Opportunity Fund | | | 1.6 | | |
Columbia Emerging
Markets Fund | | | 3.0 | | |
Columbia Energy and Natural
Resources Fund | | | 1.6 | | |
Columbia European
Equity Fund | | | 3.6 | | |
Columbia International
Value Fund | | | 0.0* | | |
| Columbia Greater China Fund | | | 1.6 | | |
| Columbia Large Cap Core Fund | | | 4.3 | | |
Columbia Large Cap
Growth Fund | | | 5.0 | | |
Columbia Large Core
Quantitative Fund | | | 2.6 | | |
Columbia Large Value
Quantitative Fund | | | 1.6 | | |
Columbia Mid Cap
Growth Fund | | | 4.2 | | |
| Columbia Mid Cap Value Fund | | | 3.1 | | |
Columbia Multi-Advisor
International Equity Fund | | | 4.7 | | |
| Columbia Overseas Value Fund | | | 2.3 | | |
Columbia Select Large Cap
Growth Fund | | | 3.6 | | |
Columbia Select Large-Cap
Value Fund | | | 0.8 | | |
Columbia Small Cap
Growth Fund I | | | 0.8 | | |
Columbia Small Cap
Growth Fund II | | | 1.0 | | |
Columbia Small Cap
Value Fund I | | | 1.8 | | |
Columbia Small Cap
Value Fund II | | | 1.1 | | |
| | | | 57.6 | % | |
areas throughout the 10 months, however, they still hurt relative performance as U.S. equity markets proved to offer a better store of value during the period than either international developed or emerging market equities. Similarly, while the portfolio was underweight underlying funds utilizing U.S. mid-cap and small-cap value oriented strategies, these underlying funds lagged their respective benchmark indices, thus detracting from the portfolio's relative results during the period. On the fixed income side, having an underweighted allocation to U.S. Treasury-issued debt compared to the portfolio's fixed income benchmark detracted from relative results, as holding more of this strongly-performing strategy would have enabled the portfolio to capture improved relative performance. In our view, however, U.S. Treasury-issued debt did not hold significant appeal, as interest rates were being held down by the Fed and the risk of rising rates loomed, even if perhaps 12 to 24 or more months down the road. One other area that detracted modestly from the portfolio's total returns was convertible, or hybrid, securities.
On the positive side, strong absolute and relative returns from underlying funds focused on corporate credit, both investment grade and high yield, added value during the period. Exposure to securitized products, such as government mortgage-backed securities and asset-backed securities, also contributed favorably to the portfolio's risk-adjusted returns. Other areas of strength for the portfolio during the period were TIPS and emerging market bonds. An emphasis throughout the period on dividend-paying equities also proved particularly advantageous, as two underlying funds that focus on high quality dividend paying equities were notable contributors to total returns during the period. In addition, underlying funds that focus on large-cap equities wherein stock selection was driven by quantitative models added value, as these underlying funds generated both strong absolute and relative results during the period.
The portfolio also benefited during the period from a small allocation to underlying funds employing absolute return strategies. Indeed, the portfolio established positions in two absolute return-oriented underlying funds, including an absolute return multi-strategy offering and an enhanced version of the same multi-strategy design. Both of these underlying funds performed well during the period. We continue to believe alternative asset investments can help buffer the portfolio from heightened volatility while simultaneously generating a potential new source of return that may have low correlation to traditional stock and bond markets. At the end of the period, the portfolio additionally held a modest exposure to real estate securities.
Adjusting risk exposure as market conditions shifted
Overall, we sought to reduce the portfolio's exposure to risk during the early summer months, as it was then that the financial markets were beginning to be fixated on the emerging verbal sparring coming out of the political circles in Washington D.C. Also, Europe's struggles with fiscal soundness were heightening. These macro challenges, along with a slowing of economic growth in the emerging markets and supply chain constraints tied to the natural disasters that struck Japan the prior spring, all weighed on investor sentiment. For these reasons and others more closely tied to the fundamental backdrop, we felt it prudent to modestly reduce the portfolio's exposure to equities, moving to an underweighted allocation versus the portfolio's long-term
10
Portfolio Manager's Report (continued) – Columbia LifeGoal Balanced Growth Portfolio
strategic neutral benchmark assignments, and to increase the portfolio's exposure to fixed income and alternative assets. These risk-reduction strategies generally served the portfolio's results well, especially during the final months of summer 2011. While we subsequently maintained the portfolio's somewhat conservative positioning, we took small incremental steps to add some risk back into the portfolio toward the end of the period. We implemented this strategy by adding to the portfolio's equity positions, both across the market capitalization spectrum and across regions, including the U.S., Europe and Pacific-Asia ex Japan.
Portfolio Allocation (continued)
(Unaudited)
Fund holdings at
January 31, 2012 | | % of Fund's
portfolio
assets | |
| Fixed-Income Funds | |
| Includes government, corporate, mortgage and agency securities, floating rate, global, high yield, inflation protected, convertible | |
| Columbia Bond Fund | | | 1.9 | % | |
Columbia Convertible
Securities Fund | | | 2.1 | | |
Columbia Corporate
Income Fund | | | 7.1 | | |
Columbia Emerging Markets
Bond Fund | | | 1.8 | | |
| Columbia High Yield Bond Fund | | | 1.6 | | |
Columbia Income
Opportunities Fund | | | 3.2 | | |
Columbia International
Bond Fund | | | 1.8 | | |
Columbia Limited Duration
Credit Fund | | | 3.5 | | |
Columbia U.S. Government
Mortgage Fund | | | 4.8 | | |
Mortgage- and Asset-
Backed Portfolio | | | 3.5 | | |
| | | | 31.3 | % | |
| Alternative Investments | |
Columbia Absolute Return
Currency and Income Fund | | | 2.0% | | |
Columbia Absolute Return
Multi-Strategy Fund | | | 2.7 | | |
| | | | 4.7 | % | |
| Common Stocks | | | 0.0 | %* | |
| Inflation-Indexed Bonds | | | 2.4 | % | |
| Money Market Funds | | | 4.0 | % | |
| | | | | | 100.0 | % | |
*Round to less than 0.01%.
11
Portfolio Profile – Columbia LifeGoal Income and Growth Portfolio
Performance data quoted represents past performance and current performance may be lower or higher. Past performance is no guarantee of future results. The investment return and principal value will fluctuate so that shares, when redeemed, may be worth more or less than the original cost. Please visit www.columbiamanagement.com for daily and most recent month-end performance updates.
Summary
10-month return as of 01/31/12
| | | | +2.63% | |
|
|  | | | Class A shares
(without sales charge) | |
|
| | | | +8.33% | |
|
|  | | | Barclays Capital Aggregate
Bond Index1 | |
|
| | | | +0.73% | |
|
|  | | | S&P 500 Index2 | |
|
Summary
g Effective January 31, 2012, the fiscal year end for Columbia LifeGoal Income and Growth Portfolio changed from March 31 to January 31.
g For the 10-month period ended January 31, 2012, the portfolio's Class A shares returned 2.63% without sales charge.
g The portfolio's equity benchmark, the broad-based S&P 500 Index, returned 0.73%.
g The portfolio's its fixed income benchmark, the Barclays Capital U.S. Aggregate Bond Index, returned 8.33%.
g The portfolio's allocation to fixed income aided performance, while its exposure to equities hampered results.
Portfolio Management
Colin Moore has co-managed the portfolio since 2009. From 2002 until joining Columbia Management Investment Advisers, LLC (the Investment Manager) in May 2010, Mr. Moore was associated with the portfolio's previous investment adviser as an investment professional.
Anwiti Bahuguna, PhD, has co-managed the portfolio since 2009. From 2002 until joining the Investment Manager in May 2010, Ms. Bahuguna was associated with the portfolio's previous investment adviser as an investment professional.
Melda Mergen, CFA, CAIA, has co-managed the portfolio since November 2011. From 1999 until joining the Investment Manager in May 2010, Ms. Mergen was associated with the portfolio's previous investment adviser or its predecessors as an investment professional.
Marie M. Schofield, CFA, has co-managed the portfolio since 2009. From 1990 until joining the Investment Manager in May 2010, Ms. Schofield was associated with the portfolio's previous investment adviser as an investment professional.
Beth Vanney, CFA, has co-managed the portfolio since November 2011. From 1999 until joining the Investment Manager in May 2010, Ms. Vanney was associated with the portfolio's previous investment adviser or its predecessors as an investment professional.
1The Barclays Capital Aggregate Bond Index is a market value-weighted index that tracks the daily price, coupon, pay-downs, and total return performance of fixed-rate, publicly placed, dollar-denominated, and non-convertible investment-grade debt issues with a least $250 million par amount outstanding and with at least one year to final maturity.
2The Standard & Poor's (S&P) 500 Index tracks the performance of 500 widely held, large-capitalization U.S. stocks.
Indices are not available for investment, are not professionally managed and do not reflect sales charges, fees, brokerage commissions, taxes or other expenses of investing. Securities in the fund may not match those in an index.
12
Performance Information – Columbia LifeGoal Income and Growth Portfolio
Performance of a $10,000 investment 02/01/02 – 01/31/12
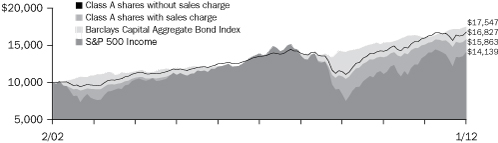
The chart above shows the change in value of a hypothetical $10,000 investment in Class A shares of Columbia LifeGoal Income and Growth Portfolio during the stated time period, and does not reflect the deduction of taxes that a shareholder may pay on portfolio distributions or on the redemption of portfolio shares.
Performance of a $10,000 investment 02/01/02 – 01/31/12 ($)
| Sales charge | | without | | with | |
| Class A | | | 16,827 | | | | 15,863 | | |
| Class B | | | 15,599 | | | | 15,599 | | |
| Class C | | | 15,612 | | | | 15,612 | | |
| Class R | | | 16,412 | | | | n/a | | |
| Class Z | | | 17,238 | | | | n/a | | |
Average annual total return as of 01/31/12 (%)
| Share class | | A | | B | | C | | R | | Z | |
| Inception | | 10/15/96 | | 08/07/97 | | 10/15/96 | | 01/23/06* | | 10/15/96 | |
| Sales charge | | without | | with | | without | | with | | without | | with | | without | | without | |
| 10-month | |
| (cumulative) | | | 2.63 | | | | –3.24 | | | | 1.96 | | | | –3.04 | | | | 1.97 | | | | 0.97 | | | | 2.34 | | | | 2.85 | | |
| 1-year | | | 5.00 | | | | –1.01 | | | | 4.13 | | | | –0.87 | | | | 4.16 | | | | 3.16 | | | | 4.64 | | | | 5.22 | | |
| 5-year | | | 4.46 | | | | 3.23 | | | | 3.67 | | | | 3.32 | | | | 3.67 | | | | 3.67 | | | | 4.19 | | | | 4.70 | | |
| 10-year | | | 5.34 | | | | 4.72 | | | | 4.55 | | | | 4.55 | | | | 4.56 | | | | 4.56 | | | | 5.08 | | | | 5.60 | | |
The "with sales charge" returns include the maximum initial sales charge of 5.75% for Class A shares, the applicable contingent deferred sales charge of 5.00% in the first year, declining to 1.00% in the sixth year and eliminated thereafter for Class B shares and 1.00% for Class C shares for the first year only. The "without sales charge" returns do not include the effect of sales charges. If they had, returns would be lower.
Performance results reflect any fee waivers or reimbursements of portfolio expenses by the Investment Manager and/or any of its affiliates. Absent these fee waivers or expense reimbursement arrangements, performance results would have been lower.
All results shown assume reinvestment of distributions. Class Z shares are sold at net asset value with no distribution and service (Rule 12b-1) fees. Class R shares are sold at net asset value with distribution and service (Rule 12b-1) fees. Class R and Class Z shares have limited eligibility and the investment minimum requirements may vary. Please see the portfolio's prospectus for details. Performance for different share classes will vary based on differences in sales charges and fees associated with each class.
The tables do not reflect the deduction of taxes that a shareholder may pay on portfolio distributions or on the redemption of portfolio shares.
The inception date of the portfolio's Class R shares is January 23, 2006. Class R shares have no performance prior to their inception date. The performance shown for Class R shares prior to their inception date is that of Class A shares. If Class R shares fees and expenses were included, performance would be lower.
*The returns shown for periods prior to the share class inception date (including returns since inception, which are since portfolio inception) include the returns of the portfolio's oldest share class. These returns are adjusted to reflect any higher class-related operating expenses of the newer share classes, as applicable. Please visit columbiamanagement.com/mutual-funds/appended-performance for more information.
Performance data quoted represents past performance and current performance may be lower or higher. Past performance is no guarantee of future results. The investment return and principal value will fluctuate so that shares, when redeemed, may be worth more or less than the original cost. Please visit www.columbiamanagement.com for daily and most recent month-end performance updates.
13
Understanding Your Expenses – Columbia LifeGoal Income and Growth Portfolio
As an investor, you incur two types of costs. There are transaction costs, which generally include sales charges on purchases and may include redemption fees. There are also ongoing costs, which generally include management fees, distribution and service (Rule 12b-1) fees, and other portfolio expenses. The following information is intended to help you understand your ongoing costs (in dollars) of investing in the portfolio and to help you compare these costs with the ongoing costs of investing in other mutual funds.
Analyzing your portfolio's expenses
To illustrate these ongoing costs, we have provided examples and calculated the expenses paid by investors in each share class of the portfolio during the period. The actual and hypothetical information in the table is based on an initial investment of $1,000 at the beginning of the period indicated and held for the entire period. Expense information is calculated two ways and each method provides you with different information. The amount listed in the "Actual" column is calculated using the portfolio's actual operating expenses and total return for the period. You may use the Actual information, together with the amount invested, to estimate the expenses that you paid over the period. Simply divide your account value by $1,000 (for example, an $8,600 account value divided by $1,000 = 8.6), then multiply the results by the expenses paid during the period under the Actual column. The amount listed in the "Hypothetical" column assumes a 5% annual rate of return before expenses (which is not the portfolio's actual return) and then applies the portfolio's actual expense ratio for the period to the hypothetical return. You should not use the hypothetical account values and expenses to estimate either your actual account balance at the end of the period or the expenses you paid during the period. See "Compare with other funds" below for details on how to use the hypothetical data.
In addition to the ongoing expenses which the portfolio bears directly, the portfolio's shareholders indirectly bear the portfolio's allocable share of the costs and expenses of each underlying fund in which the portfolio invests. You can also estimate the effective expenses paid during the period, which includes the indirect fees associated with investing in the underlying funds, by using the amounts listed in the effective expenses paid during the period column.
Compare with other funds
Since all mutual funds are required to include the same hypothetical calculations about expenses in shareholder reports, you can use this information to compare the ongoing cost of investing in the portfolio with other funds. To do so, compare the hypothetical example with the 5% hypothetical examples that appear in the shareholder reports of other funds. As you compare hypothetical examples of other funds, it is important to note that hypothetical examples are meant to highlight the ongoing costs of investing in a fund only and do not reflect any transaction costs, such as sales charges, or redemption or exchange fees. Therefore, the hypothetical calculations are useful in comparing ongoing costs only, and will not help you determine the relative total costs of owning different funds. If transaction costs were included in these calculations, your costs would be higher.
08/01/11 – 01/31/12
| | | Account value
at the beginning
of the period ($) | | Account value
at the end
of the period ($) | | Expenses
paid during
the period ($) | | Portfolio's
annualized
expense
ratio (%) | | Effective
expenses paid
during the
period ($) | | Portfolio's
effective
annualized
expense
ratio (%) | |
| | | Actual | | Hypothetical | | Actual | | Hypothetical | | Actual | | Hypothetical | | Actual | | Actual | | Hypothetical | | Actual | |
| Class A | | | 1,000.00 | | | | 1,000.00 | | | | 1,011.00 | | | | 1,022.42 | | | | 3.07 | | | | 3.09 | | | | 0.60 | | | | 6.25 | | | | 6.29 | | | | 1.22 | | |
| Class B | | | 1,000.00 | | | | 1,000.00 | | | | 1,007.10 | | | | 1,018.60 | | | | 6.90 | | | | 6.94 | | | | 1.35 | | | | 10.07 | | | | 10.13 | | | | 1.97 | | |
| Class C | | | 1,000.00 | | | | 1,000.00 | | | | 1,007.20 | | | | 1,018.60 | | | | 6.90 | | | | 6.94 | | | | 1.35 | | | | 10.08 | | | | 10.13 | | | | 1.97 | | |
| Class R | | | 1,000.00 | | | | 1,000.00 | | | | 1,010.60 | | | | 1,021.15 | | | | 4.35 | | | | 4.38 | | | | 0.85 | | | | 7.53 | | | | 7.57 | | | | 1.47 | | |
| Class Z | | | 1,000.00 | | | | 1,000.00 | | | | 1,012.40 | | | | 1,023.70 | | | | 1.79 | | | | 1.80 | | | | 0.35 | | | | 4.97 | | | | 5.00 | | | | 0.97 | | |
Expenses paid during the period are equal to the annualized expense ratio for each class as indicated above, multiplied by the average account value over the period and then multiplied by the number of days in the portfolio's most recent fiscal half year and divided by 365.
Effective expenses paid during the period and the Portfolio's effective annualized expense ratio include expenses borne directly to the class plus the Portfolio's pro rata portion of the ongoing expenses charged by the underlying funds using the expense ratio of each class of the underlying funds as of the underlying fund's most recent shareholder report.
Had Columbia Management Investment Advisers, LLC and/or any of its affiliates not waived/reimbursed a portion of fees and expenses, account value at the end of the period would have been reduced.
14
Portfolio Manager's Report – Columbia LifeGoal Income and Growth Portfolio
For the 10-month period ended January 31, 2012, the portfolio's Class A shares returned 2.63% without sales charge. The portfolio's equity benchmark, the broad-based S&P 500 Index, returned 0.73%, and its fixed income benchmark, the Barclays Capital U.S. Aggregate Bond Index, returned 8.33%. The portfolio's allocation to fixed income aided performance, while its exposure to equities hampered results.
Fixed income positioning aided results
The fixed income market posted consistently positive returns during the period, led by strength in interest rate-sensitive sectors, such as U.S. Treasuries, government agency securities and Treasury inflation-protected securities (TIPS). Emerging market bonds also performed well, as inflation came under control in key regions and solid economic growth was forecasted for 2012. More credit-sensitive sectors, such as high yield corporate bonds, lagged the Barclays Capital U.S. Aggregate Bond Index but still managed to post modestly positive total returns during the period. Cash produced the lowest returns in the portfolio's fixed income investable universe, gaining only modest ground, as the Federal Reserve Board (the Fed) held short-term interest rates near zero throughout the period.
Against this backdrop, the portfolio's fixed income allocation was a leading contributor to performance during the period. Specifically, strong absolute and relative returns from underlying funds focused on corporate credit, both investment grade and high yield, added value during the period. Exposure to securitized products, such as government mortgage-backed securities and asset-backed securities, also contributed favorably to the portfolio's risk-adjusted returns. Other areas of strength for the portfolio during the period were TIPS and emerging market bonds. On the other hand, having an underweighted allocation to U.S. Treasury-issued debt compared to the portfolio's fixed income benchmark detracted from relative results, as holding more of this strongly-performing strategy would have enabled the portfolio to capture improved relative performance. In our view, however, U.S. Treasury-issued debt did not hold significant appeal, as interest rates were being held down by the Fed and the risk of rising rates loomed, even if perhaps 12 to 24 or more months down the road.
Equity exposure hampered results
Global equity markets generated mixed results during the 10 months ended January 31, 2012 despite posting strong gains in the final quarter of 2011. U.S. equity indices posted low single-digit gains on average. Within the U.S. equity market, large-cap stocks modestly outperformed small-cap and mid-cap stocks, and growth stocks outperformed value stocks across the capitalization spectrum. International stocks generally declined, underperforming the U.S. equity market overall, as the U.S. dollar strengthened and concerns regarding European sovereign debt heightened. Emerging market equities also retreated somewhat.
The period proved to be much like the changing seasons. A cyclical bull market lasted through most of April 2011. Then a cyclical bear market dominated from May through September 2011 followed by a market upswing from October 2011 through the end of the period. During the cyclical bear market, more defensive investment strategies, such
Performance data quoted represents past performance and current performance may be lower or higher. Past performance is no guarantee of future results. The investment return and principal value will fluctuate so that shares, when redeemed, may be worth more or less than the original cost. Please visit www.columbiamanagement.com for daily and most recent month-end performance updates.
Net asset value per share
as of 01/31/12 ($)
| Class A | | | 10.96 | | |
| Class B | | | 10.91 | | |
| Class C | | | 10.84 | | |
| Class R | | | 10.96 | | |
| Class Z | | | 10.85 | | |
Distributions declared per share
04/01/11 – 01/31/12 ($)
| Class A | | | 0.21 | | |
| Class B | | | 0.15 | | |
| Class C | | | 0.15 | | |
| Class R | | | 0.19 | | |
| Class Z | | | 0.23 | | |
15
Portfolio Manager's Report (continued) – Columbia LifeGoal Income and Growth Portfolio
Portfolio Allocation
(Unaudited)
Fund holdings at
January 31, 2012 | | % of Fund's
portfolio
assets | |
Domestic Equity Funds/
International Equity Funds | |
| Includes large cap, international, mid cap, real estate, small cap, small-mid cap | |
| Columbia Contrarian Core Fund | | | 2.5 | % | |
| Columbia Dividend Income Fund | | | 3.3 | | |
Columbia Dividend
Opportunity Fund | | | 1.0 | | |
| Columbia Emerging Markets Fund | | | 1.5 | | |
| Columbia Greater China Fund | | | 0.5 | | |
| Columbia Large Cap Core Fund | | | 2.5 | | |
| Columbia Large Cap Growth Fund | | | 2.3 | | |
| Columbia Large Core | |
| Quantitative Fund | | | 1.8 | | |
Columbia Large Value
Quantitative Fund | | | 0.8 | | |
| Columbia Mid Cap Growth Fund | | | 2.0 | | |
| Columbia Mid Cap Value Fund | | | 1.5 | | |
| Columbia Multi-Advisor | |
| International Equity Fund | | | 4.0 | | |
Columbia Select Large Cap
Growth Fund | | | 2.5 | | |
Columbia Select Large-Cap
Value Fund | | | 0.9 | | |
| | | | 27.1 | % | |
| Fixed-Income Funds | |
| Includes government, corporate, mortgage and agency securities, floating rate, global, high yield, inflation protected, convertible | |
| Columbia Bond Fund | | | 7.8 | % | |
Columbia Convertible
Securities Fund | | | 3.0 | | |
| Columbia Corporate Income Fund | | | 11.3 | | |
Columbia Emerging Markets
Bond Fund | | | 3.0 | | |
Columbia Income
Opportunities Fund | | | 8.6 | | |
| Columbia Intermediate Bond Fund | | | 3.4 | | |
Columbia Limited Duration
Credit Fund | | | 6.7 | | |
| Columbia Short Term Bond Fund | | | 2.0 | | |
Columbia U.S. Government
Mortgage Fund | | | 6.7 | | |
Mortgage- and Asset-
Backed Portfolio | | | 7.2 | | |
| | | | 59.7 | % | |
| Alternative Investments | |
Columbia Absolute Return
Currency and Income Fund | | | 2.6% | | |
Columbia Absolute Return
Multi-Strategy Fund | | | 3.5 | | |
| | | | 6.1 | % | |
| Inflation-Indexed Bonds | | | 3.9 | % | |
| Money Market Funds | | | 3.2 | % | |
| | | | 100.0 | % | |
as those that emphasize factors related to higher quality, lower volatility and sensitivity to a strengthening U.S. dollar, tended to perform better. As the market improved during the final months of the period, more aggressive investment strategies, including price reversion, higher beta and small-cap, performed well. (Price reversion is an investment strategy involving the purchase or sale of stocks based on the theory that prices eventually move back toward the historical mean or average of the price. Beta is a measure of sensitivity to market movements.) For the period as a whole, the factors that worked best in identifying areas of equity strength fell into one of two categories—efficiency or profitability. Indicators of efficiency included strong operating cash flow and/or high earnings before interest and taxes (EBIT)-to-asset ratios. Profitability indicators that worked well for screening names in the equity universe during the period included high levels of return on assets (ROA) or return on investment (ROI).
For the portfolio, exposure to international developed and emerging market equities hampered the portfolio's results. The portfolio was largely underweighted these areas throughout the 10 months, however they still hurt relative performance as U.S. equity markets proved to offer a better store of value during the period than either international developed or emerging market equities. Similarly, while the portfolio was underweight underlying funds utilizing U.S. mid-cap and small-cap value oriented strategies, these underlying funds lagged their respective benchmark indices, thus detracting from the portfolio's relative results during the period. One other area that detracted modestly from the portfolio's total returns was convertible, or hybrid, securities.
On the positive side, an emphasis throughout the period on dividend-paying equities proved particularly advantageous, as two underlying funds that focus on high quality dividend paying equities were notable contributors to total returns during the period. In addition, underlying funds that focus on large-cap equities wherein stock selection was driven by quantitative models added value, as these underlying funds generated both strong absolute and relative results during the period.
Absolute return strategies benefited performance
The portfolio benefited during the period from a small allocation to underlying funds employing absolute return strategies. Indeed, the portfolio established positions in two absolute return-oriented underlying funds, including an absolute return multi-strategy offering and an enhanced version of the same multi-strategy design. Both of these underlying funds performed well during the period. We continue to believe alternative asset investments can help buffer the portfolio from heightened volatility while simultaneously generating a potential new source of return that may have low correlation to traditional stock and bond markets. At the end of the period, the portfolio additionally held a modest exposure to real estate securities.
Adjusting risk exposure as market conditions shifted
Overall, we sought to reduce the portfolio's exposure to risk during the early summer months, as it was then that the financial markets were beginning to be fixated on the emerging verbal sparring coming out of the political circles in Washington D.C. Also,
16
Portfolio Manager's Report (continued) – Columbia LifeGoal Income and Growth Portfolio
Europe's struggles with fiscal soundness were heightening. These macro challenges, along with a slowing of economic growth in the emerging markets and supply chain constraints tied to the natural disasters that struck Japan the prior spring, all weighed on investor sentiment. For these reasons and others more closely tied to the fundamental backdrop, we felt it prudent to modestly reduce the portfolio's exposure to equities, moving to an underweighted allocation versus the portfolio's long-term strategic neutral benchmark assignments, and to increase the portfolio's exposure to fixed income and alternative assets. These risk-reduction strategies generally served the portfolio's results well, especially during the final months of summer 2011. While we subsequently maintained the portfolio's somewhat conservative positioning, we took small incremental steps to add some risk back into the portfolio toward the end of the period. We implemented this strategy by adding to the portfolio's equity positions, both across the market capitalization spectrum and across regions, including the U.S., Europe and Pacific-Asia ex Japan.
17
Portfolio Profile – Columbia LifeGoal Income Portfolio
Performance data quoted represents past performance and current performance may be lower or higher. Past performance is no guarantee of future results. The investment return and principal value will fluctuate so that shares, when redeemed, may be worth more or less than the original cost. Please visit www.columbiamanagement.com for daily and most recent month-end performance updates.
Summary
10-month return as of 01/31/12
| | | | +4.56% | |
|
|  | | | Class A shares
(without sales charge) | |
|
| | | | +1.86% | |
|
|  | | | Barclays Capital U.S. Aggregate
1-3 Years Index1 | |
|
| | | | +2.38% | |
|
|  | | | Blended 80% Barclays Capital
U.S. Aggregate 1-3 Years Index/20% Barclays Capital U.S. Corporate High Yield Bond Index2 | |
|
Summary
g Effective January 31, 2012, the fiscal year end for Columbia LifeGoal Income Portfolio changed from March 31 to January 31.
g For the 10-month period ended January 31, 2012, the portfolio's Class A shares returned 4.56% without sales charge.
g The portfolio's return outperformed the 1.86% return of its benchmark, the Barclays Capital U.S. Aggregate 1-3 Years Index.
g The portfolio also outperformed its customized blended benchmark—80% Barclays Capital U.S. Aggregate 1-3 Years Index and 20% Barclays Capital U.S. Corporate High Yield Bond Index—which returned 2.38%.
g We attribute the portfolio's strong relative performance to its positioning within the fixed income sector and to our decision to take risk off the proverbial table by reducing equity exposure in the early summer months of 2011.
Portfolio Management
Colin Moore has co-managed the portfolio since 2009. From 2002 until joining Columbia Management Investment Advisers, LLC (the Investment Manager) in May 2010, Mr. Moore was associated with the portfolio's previous investment adviser as an investment professional.
Anwiti Bahuguna, PhD, has co-managed the portfolio since 2009. From 2002 until joining the Investment Manager in May 2010, Ms. Bahuguna was associated with the portfolio's previous investment adviser as an investment professional.
Melda Mergen, CFA, CAIA, has co-managed the portfolio since November 2011. From 1999 until joining the Investment Manager in May 2010, Ms. Mergen was associated with the portfolio's previous investment adviser or its predecessors as an investment professional.
Marie M. Schofield, CFA, has co-managed the portfolio since 2009. From 1990 until joining the Investment Manager in May 2010, Ms. Schofield was associated with the portfolio's previous investment adviser as an investment professional.
Beth Vanney, CFA, has co-managed the portfolio since November 2011. From 1999 until joining the Investment Manager in May 2010, Ms. Vanney was associated with the portfolio's previous investment adviser or its predecessors as an investment professional.
1The Barclays Capital U.S. Aggregate 1-3 Years Index is an index of publicly-issued investment-grade corporate, U.S. Treasury and government agency securities with remaining maturities of one to three years.
2This blend is 80% Barclays Capital U.S. Aggregate 1-3 Years Index and 20% Barclays Capital U.S. Corporate High Yield Bond Index. The Barclays Capital U.S. Corporate High Yield Bond Index is a market value-weighted index, which covers the U.S. non-investment grade fixed-rate debt market. The index is composed of U.S. dollar-denominated corporate debt in industrial, utility and finance sectors with a minimum $150 million par amount outstanding and a maturity greater than one year. The index includes reinvestment of income.
Indices are not available for investment, are not professionally managed and do not reflect sales charges, fees, brokerage commissions, taxes or other expenses of investing. Securities in the fund may not match those in an index.
18
Performance Information – Columbia LifeGoal Income Portfolio
Performance of a $10,000 investment 09/04/03 – 01/31/12

The chart above shows the change in value of a hypothetical $10,000 investment in Class A shares of Columbia LifeGoal Income Portfolio during the stated time period, and does not reflect the deduction of taxes that a shareholder may pay on portfolio distributions or on the redemption of portfolio shares.
Performance of a $10,000 investment 09/04/03 – 01/31/12 ($)
| Sales charge | | without | | with | |
| Class A | | | 14,670 | | | | 14,188 | | |
| Class B | | | 13,760 | | | | 13,760 | | |
| Class C | | | 13,765 | | | | 13,765 | | |
| Class Z | | | 14,990 | | | | n/a | | |
Average annual total return as of 01/31/12 (%)
| Share class | | A | | B | | C | | Z | |
| Inception | | 09/04/03 | | 09/04/03 | | 09/05/03 | | 09/04/03 | |
| Sales charge | | without | | with | | without | | with | | without | | with | | without | |
| 10-month | |
| (cumulative) | | | 4.56 | | | | 1.13 | | | | 3.91 | | | | 0.91 | | | | 3.92 | | | | 2.92 | | | | 4.88 | | |
| 1-year | | | 5.92 | | | | 2.51 | | | | 5.13 | | | | 2.13 | | | | 5.14 | | | | 4.14 | | | | 6.28 | | |
| 5-year | | | 4.59 | | | | 3.91 | | | | 3.80 | | | | 3.80 | | | | 3.80 | | | | 3.80 | | | | 4.87 | | |
| Life | | | 4.66 | | | | 4.25 | | | | 3.87 | | | | 3.87 | | | | 3.87 | | | | 3.87 | | | | 4.93 | | |
The "with sales charge" returns include the maximum initial sales charge of 3.25% for Class A shares, the applicable contingent deferred sales charge of 3.00% in the first year, declining to 1.00% in the fourth year and eliminated thereafter for Class B shares and 1.00% for Class C shares for the first year only. The "without sales charge" returns do not include the effect of sales charges. If they had, returns would be lower.
Performance results reflect any fee waivers or reimbursements of portfolio expenses by the Investment Manager and/or any of its affiliates. Absent these fee waivers or expense reimbursement arrangements, performance results would have been lower.
All results shown assume reinvestment of distributions. Class Z shares are sold at net asset value with no distribution and service (Rule 12b-1) fees. Class Z shares have limited eligibility and the investment minimum requirements may vary. Please see the portfolio's prospectus for details. Performance for different share classes will vary based on differences in sales charges and fees associated with each class.
The tables do not reflect the deduction of taxes that a shareholder may pay on portfolio distributions or on the redemption of portfolio shares.
Performance data quoted represents past performance and current performance may be lower or higher. Past performance is no guarantee of future results. The investment return and principal value will fluctuate so that shares, when redeemed, may be worth more or less than the original cost. Please visit www.columbiamanagement.com for daily and most recent month-end performance updates.
19
Understanding Your Expenses – Columbia LifeGoal Income Portfolio
As an investor, you incur two types of costs. There are transaction costs, which generally include sales charges on purchases and may include redemption fees. There are also ongoing costs, which generally include management fees, distribution and service (Rule 12b-1) fees, and other portfolio expenses. The following information is intended to help you understand your ongoing costs (in dollars) of investing in the portfolio and to help you compare these costs with the ongoing costs of investing in other mutual funds.
Analyzing your portfolio's expenses
To illustrate these ongoing costs, we have provided examples and calculated the expenses paid by investors in each share class of the Fund during the period. The actual and hypothetical information in the table is based on an initial investment of $1,000 at the beginning of the period indicated and held for the entire period. Expense information is calculated two ways and each method provides you with different information. The amount listed in the "Actual" column is calculated using the portfolio's actual operating expenses and total return for the period. You may use the Actual information, together with the amount invested, to estimate the expenses that you paid over the period. Simply divide your account value by $1,000 (for example, an $8,600 account value divided by $1,000 = 8.6), then multiply the results by the expenses paid during the period under the Actual column. The amount listed in the "Hypothetical" column assumes a 5% annual rate of return before expenses (which is not the portfolio's actual return) and then applies the portfolio's actual expense ratio for the period to the hypothetical return. You should not use the hypothetical account values and expenses to estimate either your actual account balance at the end of the period or the expenses you paid during the period. See "Compare with other funds" below for details on how to use the hypothetical data.
In addition to the ongoing expenses which the portfolio bears directly, the portfolio's shareholders indirectly bear the portfolio's allocable share of the costs and expenses of each underlying fund in which the portfolio invests. You can also estimate the effective expenses paid during the period, which includes the indirect fees associated with investing in the underlying funds, by using the amounts listed in the effective expenses paid during the period column.
Compare with other funds
Since all mutual funds are required to include the same hypothetical calculations about expenses in shareholder reports, you can use this information to compare the ongoing cost of investing in the portfolio with other funds. To do so, compare the hypothetical example with the 5% hypothetical examples that appear in the shareholder reports of other funds. As you compare hypothetical examples of other funds, it is important to note that hypothetical examples are meant to highlight the ongoing costs of investing in a fund only and do not reflect any transaction costs, such as sales charges, or redemption or exchange fees. Therefore, the hypothetical calculations are useful in comparing ongoing costs only, and will not help you determine the relative total costs of owning different funds. If transaction costs were included in these calculations, your costs would be higher.
08/01/11 – 01/31/12
| | | Account value
at the beginning
of the period ($) | | Account value
at the end
of the period ($) | | Expenses
paid during
the period ($) | | Portfolio's
annualized
expense
ratio (%) | | Effective
expenses paid
during the
period ($) | | Portfolio's
effective
annualized
expense
ratio (%) | |
| | | Actual | | Hypothetical | | Actual | | Hypothetical | | Actual | | Hypothetical | | Actual | | Actual | | Hypothetical | | Actual | |
| Class A | | | 1,000.00 | | | | 1,000.00 | | | | 1,018.50 | | | | 1,022.42 | | | | 3.09 | | | | 3.09 | | | | 0.60 | | | | 5.71 | | | | 5.72 | | | | 1.11 | | |
| Class B | | | 1,000.00 | | | | 1,000.00 | | | | 1,014.60 | | | | 1,018.60 | | | | 6.93 | | | | 6.94 | | | | 1.35 | | | | 9.54 | | | | 9.57 | | | | 1.86 | | |
| Class C | | | 1,000.00 | | | | 1,000.00 | | | | 1,014.70 | | | | 1,018.60 | | | | 6.93 | | | | 6.94 | | | | 1.35 | | | | 9.55 | | | | 9.57 | | | | 1.86 | | |
| Class Z | | | 1,000.00 | | | | 1,000.00 | | | | 1,019.70 | | | | 1,023.70 | | | | 1.80 | | | | 1.80 | | | | 0.35 | | | | 4.43 | | | | 4.43 | | | | 0.86 | | |
Expenses paid during the period are equal to the annualized expense ratio for each class as indicated above, multiplied by the average account value over the period and then multiplied by the number of days in the portfolio's most recent fiscal half year and divided by 365.
Effective expenses paid during the period and the Portfolio's effective annualized expense ratio include expenses borne directly to the class plus the Portfolio's pro rata portion of the ongoing expenses charged by the underlying funds using the expense ratio of each class of the underlying funds as of the underlying fund's most recent shareholder report.
Had Columbia Management Investment Advisers, LLC and/or any of its affiliates not waived/reimbursed a portion of fees and expenses, account value at the end of the period would have been reduced.
20
Portfolio Manager's Report – Columbia LifeGoal Income Portfolio
For the 10-month period ended January 31, 2012, the portfolio's Class A shares returned 4.56% without sales charge. The portfolio's return outperformed the 1.86% return of its benchmark, the Barclays Capital U.S. Aggregate 1-3 Years Index. It also outperformed its customized blended benchmark—80% Barclays Capital U.S. Aggregate 1-3 Years Index and 20% Barclays Capital U.S. Corporate High Yield Bond Index—which returned 2.38%. We attribute the portfolio's strong relative performance to its positioning within the fixed income sector and to our decision to take risk off the proverbial table by reducing equity exposure in the early summer months of 2011.
Fixed income positioning aided results
The fixed income market posted consistently positive returns during the period, led by strength in interest rate-sensitive sectors, such as U.S. Treasuries, government agency securities and Treasury inflation-protected securities (TIPS). Emerging market bonds also performed well, as inflation came under control in key regions and solid economic growth was forecasted for 2012. More credit-sensitive sectors, such as high yield corporate bonds, lagged the Barclays Capital U.S. Aggregate Bond Index but still managed to post modestly positive total returns during the period. Cash produced the lowest returns in the portfolio's fixed income investable universe, gaining only modest ground, as the Federal Reserve Board (the Fed) held short-term interest rates near zero throughout the period.
Against this backdrop, the portfolio's fixed income allocation was a leading contributor to performance during the period. Specifically, strong absolute and relative returns from underlying funds focused on corporate credit, both investment grade and high yield, added value during the period. Exposure to securitized products, such as government mortgage-backed securities and asset-backed securities, also contributed favorably to the portfolio's risk-adjusted returns. Other areas of strength for the portfolio during the period were TIPS and emerging market bonds. On the other hand, having an underweighted allocation to U.S. Treasury-issued debt compared to the portfolio's fixed income benchmark detracted from relative results, as holding more of this strongly-performing strategy would have enabled the portfolio to capture improved relative performance. In our view, however, U.S. Treasury-issued debt did not hold significant appeal, as interest rates were being held down by the Fed and the risk of rising rates loomed, even if perhaps 12 to 24 or more months down the road.
Equity exposure hampered results
Global equity markets generated mixed results during the 10 months ended January 31, 2012 despite posting strong gains in the final quarter of 2011. U.S. equity indices posted low single-digit gains on average. Within the U.S. equity market, large-cap stocks modestly outperformed small-cap and mid-cap stocks, and growth stocks outperformed value stocks across the capitalization spectrum. International stocks generally declined, underperforming the U.S. equity market overall, as the U.S. dollar strengthened and concerns regarding European sovereign debt heightened. Emerging market equities also retreated somewhat.
The period proved to be much like the changing seasons. A cyclical bull market lasted through most of April 2011. Then a cyclical bear market dominated from May through
Performance data quoted represents past performance and current performance may be lower or higher. Past performance is no guarantee of future results. The investment return and principal value will fluctuate so that shares, when redeemed, may be worth more or less than the original cost. Please visit www.columbiamanagement.com for daily and most recent month-end performance updates.
Net asset value per share
as of 01/31/12 ($)
| Class A | | | 10.49 | | |
| Class B | | | 10.47 | | |
| Class C | | | 10.46 | | |
| Class Z | | | 10.50 | | |
Distributions declared per share
04/01/11 – 01/31/12 ($)
| Class A | | | 0.28 | | |
| Class B | | | 0.22 | | |
| Class C | | | 0.22 | | |
| Class Z | | | 0.30 | | |
21
Portfolio Manager's Report (continued) – Columbia LifeGoal Income Portfolio
Portfolio Allocation
(Unaudited)
Fund holdings at
January 31, 2012 | | % of Fund's
portfolio
assets | |
| Fixed-Income Funds | |
| Includes government, corporate, mortgage and agency securities, floating rate, global, high yield, inflation protected, convertible | |
Columbia Convertible
Securities Fund | | | 4.9% | | |
Columbia Corporate
Income Fund | | | 14.2 | | |
| Columbia Emerging Markets | |
| Bond Fund | | | 4.0 | | |
Columbia Income
Opportunities Fund | | | 10.0 | | |
Columbia International
Bond Fund | | | 4.5 | | |
Columbia Limited Duration
Credit Fund | | | 11.0 | | |
Columbia Short Term
Bond Fund | | | 9.9 | | |
Columbia U.S. Government
Mortgage Fund | | | 11.4 | | |
Columbia U.S. Treasury
Index Fund | | | 0.5 | | |
Mortgage- and Asset-
Backed Portfolio | | | 13.7 | | |
| | | | 84.1 | % | |
| Alternative Investments | |
Columbia Absolute Return
Currency and Income Fund | | | 3.0% | | |
Columbia Absolute Return
Enhanced Multi-Strategy Fund | | | 3.0 | | |
| | | | 6.0 | % | |
| Inflation-Indexed Bonds | | | 4.9 | % | |
| Money Market Funds | | | 5.0 | % | |
| | | | 100.0 | % | |
September 2011 followed by a market upswing from October 2011 through the end of the period. During the cyclical bear market, more defensive investment strategies, such as those that emphasize factors related to higher quality, lower volatility and sensitivity to a strengthening U.S. dollar, tended to perform better. As the market improved in the last months of the period, more aggressive investment strategies, including price reversion, higher beta and small-cap, performed well. (Price reversion is an investment strategy involving the purchase or sale of stocks based on the theory that prices eventually move back toward the historical mean or average of the price. Beta is a measure of sensitivity to market movements.) For the period as a whole, the factors that worked best in identifying areas of equity strength fell into one of two categories—efficiency or profitability. Indicators of efficiency included strong operating cash flow and/or high earnings before interest and taxes (EBIT)-to-asset ratios. Profitability indicators that worked well for screening names in the equity universe during the period included high levels of return on assets (ROA) or return on investment (ROI).
For the portfolio, exposure to international developed and emerging market equities hampered the portfolio's results. The portfolio was largely underweighted these areas throughout the 10 months, however they still hurt relative performance as U.S. equity markets proved to offer a better store of value during the period than either international developed or emerging market equities. Similarly, while the portfolio was underweight underlying funds utilizing U.S. mid-cap and small-cap value oriented strategies, these underlying funds lagged their respective benchmark indices, thus detracting from the portfolio's relative results during the period. One other area that detracted modestly from the portfolio's total returns was convertible, or hybrid, securities.
On the positive side, an emphasis throughout the period on dividend-paying equities proved particularly advantageous, as two underlying funds that focus on high quality dividend paying equities were notable contributors to total returns during the period. In addition, underlying funds that focus on large-cap equities wherein stock selection was driven by quantitative models added value, as these underlying funds generated both strong absolute and relative results during the period.
Absolute return strategies benefited performance
The portfolio benefited during the period from a small allocation to underlying funds employing absolute return strategies. Indeed, the portfolio established positions in two absolute return-oriented underlying funds, including an absolute return multi-strategy offering and an enhanced version of the same multi-strategy design. Both of these underlying funds performed well during the period. We continue to believe alternative asset investments can help buffer the portfolio from heightened volatility while simultaneously generating a potential new source of return that may have low correlation to traditional stock and bond markets. At the end of the period, the portfolio additionally held a modest exposure to real estate securities.
22
Portfolio Manager's Report (continued) – Columbia LifeGoal Income Portfolio
Adjusting risk exposure as market conditions shifted
Overall, we sought to reduce the portfolio's exposure to risk during the early summer months, as it was then that the financial markets were beginning to be fixated on the emerging verbal sparring coming out of the political circles in Washington D.C. Also, Europe's struggles with fiscal soundness were heightening. These macro challenges, along with a slowing of economic growth in the emerging markets and supply chain constraints tied to the natural disasters that struck Japan the prior spring, all weighed on investor sentiment. For these reasons and others more closely tied to the fundamental backdrop, we felt it prudent to modestly reduce the portfolio's exposure to equities, moving to an underweighted allocation versus the portfolio's long-term strategic neutral benchmark assignments, and to increase the portfolio's exposure to fixed income and alternative assets. These risk-reduction strategies generally served the portfolio's results well, especially during the final few months of summer 2011. While we subsequently maintained the portfolio's somewhat conservative positioning, we took small incremental steps to add some risk back into the portfolio toward the end of the period. We implemented this strategy by adding to the portfolio's equity positions, both across the market capitalization spectrum and across regions, including the U.S., Europe and Pacific-Asia ex Japan.
23
Portfolio of Investments – Columbia LifeGoal Growth Portfolio
January 31, 2012
(Percentages represent value of investments compared to net assets)
| | | Shares | | Value | |
| Equity Funds 93.3% | |
| DIVIDEND INCOME 24.0% | |
| Columbia Dividend Income Fund(a) | | | 6,594,321 | | | $ | 91,397,291 | | |
| Columbia Dividend Opportunity Fund(a) | | | 11,205,211 | | | | 92,218,889 | | |
| Total | | | 183,616,180 | | |
| INTERNATIONAL 15.1% | |
| Columbia Pacific/Asia Fund(a) | | | 8,857,626 | | | | 69,620,939 | | |
| Columbia Emerging Markets Fund(a)(b) | | | 4,728,203 | | | | 45,958,132 | | |
| Total | | | 115,579,071 | | |
| U.S. LARGE CAP 44.8% | |
| Columbia Contrarian Core Fund(a) | | | 3,266,277 | | | | 47,132,370 | | |
| Columbia Energy and Natural Resources Fund(a) | | | 1,080,499 | | | | 23,144,286 | | |
| Columbia Large Cap Core Fund(a) | | | 2,332,403 | | | | 31,020,956 | | |
| Columbia Large Cap Growth Fund(a) | | | 2,866,453 | | | | 70,113,434 | | |
| Columbia Large Core Quantitative Fund(a) | | | 3,908,412 | | | | 23,411,391 | | |
| Columbia Large Growth Quantitative Fund(a) | | | 3,881,742 | | | | 31,286,842 | | |
| Columbia Large Value Quantitative Fund(a) | | | 2,297,287 | | | | 15,414,799 | | |
| Columbia Select Large Cap Growth Fund(a)(b) | | | 6,545,838 | | | | 84,637,684 | | |
| Columbia Select Large-Cap Value Fund(a) | | | 1,023,672 | | | | 15,600,757 | | |
| Total | | | 341,762,519 | | |
| U.S. MID CAP 7.3% | |
| Columbia Mid Cap Growth Fund(a)(b) | | | 1,468,753 | | | | 39,318,518 | | |
| Columbia Mid Cap Value Fund(a) | | | 612,807 | | | | 8,254,512 | | |
| Columbia Mid Cap Value Opportunity Fund(a) | | | 1,060,042 | | | | 8,225,929 | | |
| Total | | | 55,798,959 | | |
| U.S. SMALL CAP 2.1% | |
| Columbia Small Cap Growth Fund I(a)(b) | | | 538,230 | | | | 15,635,576 | | |
Total Equity Funds
(Cost: $678,255,657) | | $ | 712,392,305 | | |
| | | Shares | | Value | |
| Fixed-Income Funds 5.9% | |
| CONVERTIBLE 5.9% | |
| Columbia Convertible Securities Fund(a) | | | 3,081,584 | | | $ | 44,867,859 | | |
Total Fixed-Income Funds
(Cost: $43,201,148) | | $ | 44,867,859 | | |
| Alternative Investments 0.9% | |
Columbia Absolute Return Enhanced
Multi-Strategy Fund(a)(b) | | | 729,653 | | | $ | 7,252,752 | | |
Total Alternative Investments
(Cost: $7,229,901) | | $ | 7,252,752 | | |
Total Investments
(Cost: $728,686,706) | | | | $ | 764,512,916 | | |
| Other Assets and Liabilities | | | | | (882,597 | ) | |
| Net Assets | | $ | 763,630,319 | | |
Notes to Portfolio of Investments
(a) Investment in affiliated mutual fund advised by Columbia Management Investment Advisers, LLC or one of its affiliates.
(b) Non-income producing.
Fair Value Measurements
Generally accepted accounting principles (GAAP) require disclosure regarding the inputs and valuation techniques used to measure fair value and any changes in valuation inputs or techniques. In addition, investments shall be disclosed by major category.
The Portfolio categorizes its fair value measurements according to a three-level hierarchy that maximizes the use of observable inputs and minimizes the use of unobservable inputs by prioritizing that the most observable input be used when available. Observable inputs are those that market participants would use in pricing an investment based on market data obtained from sources independent of the reporting entity. Unobservable inputs are those that reflect the Portfolio's assumptions about the information market participants would use in pricing an investment. An investment's level within the fair value hierarchy is based on the lowest level of any input that is deemed significant to the asset or liability's fair value measurement. The input levels are not necessarily an indication of the risk or liquidity associated with investments at that level. For example, certain U.S. government securities are generally high quality and liquid, however, they are reflected as Level 2 because the inputs used to determine fair value may not always be quoted prices in an active market.
Fair value inputs are summarized in the three broad levels listed below:
• Level 1 — Valuations based on quoted prices for investments in active markets that the Portfolio has the ability to access at the measurement date (to include NAV for open-end mutual funds). Valuation adjustments are not applied to Level 1 investments.
• Level 2 — Valuations based on other significant observable inputs (including quoted prices for similar securities, interest rates, prepayment speeds, credit risks, etc.).
• Level 3 — Valuations based on significant unobservable inputs (including the Portfolio's own assumptions and judgment in determining the fair value of investments).
The Accompanying Notes to Financial Statements are an integral part of this statement.
24
Columbia LifeGoal Growth Portfolio
January 31, 2012
Fair Value Measurements (continued)
Inputs that are used in determining fair value of an investment may include price information, credit data, volatility statistics, and other factors. These inputs can be either observable or unobservable. The availability of observable inputs can vary between investments, and is affected by various factors such as the type of investment, and the volume and level of activity for that investment or similar investments in the marketplace. The inputs will be considered by the Investment Manager, along with any other relevant factors in the calculation of an investment's fair value. The Portfolio uses prices and inputs that are current as of the measurement date, which may include periods of market dislocations. During these periods, the availability of prices and inputs may be reduced for many investments. This condition could cause an investment to be reclassified between the various levels within the hierarchy.
Investments falling into the Level 3 category are primarily supported by quoted prices from brokers and dealers participating in the market for those investments. However, these may be classified as Level 3 investments due to lack of market transparency and corroboration to support these quoted prices. Additionally, valuation models may be used as the pricing source for any remaining investments classified as Level 3. These models rely on one or more significant unobservable inputs and/or significant assumptions by the Investment Manager. Inputs used in valuations may include, but are not limited to, financial statement analysis, capital account balances, discount rates and estimated cash flows, and comparable company data.
The following table is a summary of the inputs used to value the Portfolio's investments as of January 31, 2012
| | | Fair Value at January 31, 2012 | |
| Description(a) | | Level 1
Quoted Prices
in Active
Markets for
Identical Assets(b) | | Level 2
Other
Significant
Observable
Inputs | | Level 3
Significant
Unobservable
Inputs | | Total | |
| Investments in Affiliated Funds | | $ | 764,512,916 | | | $ | — | | | $ | — | | | $ | 764,512,916 | | |
(a) See the Portfolio of Investments for all investment classifications not indicated in the table.
(b) There were no significant transfers between Levels 1 and 2 during the period.
The Accompanying Notes to Financial Statements are an integral part of this statement.
25
Portfolio of Investments – Columbia LifeGoal Balanced Growth Portfolio
January 31, 2012
(Percentages represent value of investments compared to net assets)
| | | Shares | | Value | |
| Equity Funds 57.5% | |
| DIVIDEND INCOME 4.3% | |
| Columbia Dividend Income Fund(a) | | | 2,114,268 | | | $ | 29,303,749 | | |
| Columbia Dividend Opportunity Fund(a) | | | 2,135,067 | | | | 17,571,604 | | |
| Total | | | 46,875,353 | | |
| INTERNATIONAL 16.7% | |
| Columbia Pacific/Asia Fund(a) | | | 2,061,399 | | | | 16,202,601 | | |
| Columbia Emerging Markets Fund(a)(b) | | | 3,357,004 | | | | 32,630,076 | | |
| Columbia European Equity Fund(a) | | | 7,189,133 | | | | 39,252,665 | | |
| Columbia International Value Fund(a) | | | 1 | | | | 9 | | |
| Columbia Greater China Fund(a) | | | 377,214 | | | | 17,989,353 | | |
Columbia Multi-Advisor International
Equity Fund(a)(b) | | | 4,611,353 | | | | 51,647,155 | | |
| Columbia Overseas Value Fund(a) | | | 3,654,731 | | | | 25,144,548 | | |
| Total | | | 182,866,407 | | |
| U.S. LARGE CAP 24.5% | |
| Columbia Contrarian Core Fund(a) | | | 3,854,248 | | | | 55,616,798 | | |
Columbia Energy and Natural Resources
Fund(a) | | | 807,069 | | | | 17,287,418 | | |
| Columbia Large Cap Core Fund(a) | | | 3,537,984 | | | | 47,055,180 | | |
| Columbia Large Cap Growth Fund(a) | | | 2,208,489 | | | | 54,019,645 | | |
| Columbia Large Core Quantitative Fund(a) | | | 4,788,481 | | | | 28,683,001 | | |
| Columbia Large Value Quantitative Fund(a) | | | 2,534,768 | | | | 17,008,295 | | |
| Columbia Select Large Cap Growth Fund(a)(b) | | | 3,022,083 | | | | 39,075,531 | | |
| Columbia Select Large-Cap Value Fund(a) | | | 562,879 | | | | 8,578,278 | | |
| Total | | | 267,324,146 | | |
| U.S. MID CAP 7.3% | |
| Columbia Mid Cap Growth Fund(a)(b) | | | 1,696,835 | | | | 45,424,289 | | |
| Columbia Mid Cap Value Fund(a) | | | 2,529,888 | | | | 34,077,588 | | |
| Total | | | 79,501,877 | | |
| U.S. SMALL CAP 4.7% | |
| Columbia Small Cap Growth Fund I(a)(b) | | | 290,239 | | | | 8,431,454 | | |
| Columbia Small Cap Growth Fund II(a)(b) | | | 911,378 | | | | 11,146,146 | | |
| Columbia Small Cap Value Fund I(a) | | | 457,383 | | | | 19,987,634 | | |
| Columbia Small Cap Value Fund II(a) | | | 805,765 | | | | 11,441,867 | | |
| Total | | | 51,007,101 | | |
Total Equity Funds
(Cost: $629,890,057) | | $ | 627,574,884 | | |
| Fixed-Income Funds 31.2% | |
| CONVERTIBLE 2.1% | |
| Columbia Convertible Securities Fund(a) | | | 1,565,910 | | | $ | 22,799,643 | | |
| EMERGING MARKETS 1.8% | |
| Columbia Emerging Markets Bond Fund(a) | | | 1,692,766 | | | | 19,416,026 | | |
| HIGH YIELD 1.5% | |
| Columbia High Yield Bond Fund(a) | | | 6,034,860 | | | | 16,897,609 | | |
| INTERNATIONAL 1.8% | |
| Columbia International Bond Fund(a) | | | 1,696,112 | | | | 19,115,177 | | |
| INVESTMENT GRADE 24.0% | |
| Columbia Bond Fund(a) | | | 2,200,035 | | | | 21,054,339 | | |
| Columbia Corporate Income Fund(a) | | | 7,587,378 | | | | 77,694,753 | | |
| Columbia Income Opportunities Fund(a) | | | 3,666,254 | | | | 34,939,396 | | |
| Columbia Limited Duration Credit Fund(a) | | | 3,819,396 | | | | 38,270,346 | | |
| Columbia U.S. Government Mortgage Fund(a) | | | 9,345,732 | | | | 51,775,357 | | |
| Mortgage- and Asset-Backed Portfolio(a) | | | 3,960,878 | | | | 38,222,468 | | |
| Total | | | 261,956,659 | | |
Total Fixed-Income Funds
(Cost: $333,124,303) | | $ | 340,185,114 | | |
| | | Shares | | Value | |
| Alternative Investments 4.8% | |
Columbia Absolute Return Currency and
Income Fund(a)(b) | | | 2,158,944 | | | $ | 22,129,171 | | |
Columbia Absolute Return Multi-Strategy
Fund(a)(b) | | | 3,000,566 | | | | 29,915,648 | | |
Total Alternative Investments
(Cost: $51,676,677) | | $ | 52,044,819 | | |
| Issuer | | Shares | | Value | |
| Common Stocks—% | |
| CONSUMER STAPLES —% | |
| Food Products —% | |
| China Milk Products Group Ltd.(b)(c)(d) | | | 322,000 | | | $ | 10,240 | | |
Total Common Stocks
(Cost: $172,880) | | $ | 10,240 | | |
| Issuer | | Coupon
Rate | | Principal
Amount | | Value | |
| Inflation-Indexed Bonds 2.4% | |
U.S. Treasury Inflation-Indexed Bond
07/15/12 | | | 3.000 | % | | $ | 710,900 | | | $ | 727,340 | | |
| 07/15/13 | | | 1.875 | % | | | 1,595,129 | | | | 1,678,749 | | |
| 01/15/14 | | | 2.000 | % | | | 2,295,675 | | | | 2,454,219 | | |
| 01/15/15 | | | 1.625 | % | | | 2,985,671 | | | | 3,259,747 | | |
| 01/15/16 | | | 2.000 | % | | | 2,063,092 | | | | 2,340,481 | | |
| 07/15/17 | | | 2.625 | % | | | 1,697,360 | | | | 2,059,375 | | |
| 01/15/19 | | | 2.125 | % | | | 2,281,260 | | | | 2,763,355 | | |
| 01/15/21 | | | 1.125 | % | | | 279,229 | | | | 319,411 | | |
| 01/15/25 | | | 2.375 | % | | | 3,624,544 | | | | 4,732,860 | | |
| 04/15/29 | | | 3.875 | % | | | 3,302,760 | | | | 5,285,707 | | |
| 02/15/40 | | | 2.125 | % | | | 711,749 | | | | 991,778 | | |
Total Inflation-Indexed Bonds
(Cost: $24,065,389) | | | | | | $ | 26,613,022 | | |
| | | Shares | | Value | |
| Money Market Funds 4.0% | |
| BofA Cash Reserves, Capital Class, 0.070%(e) | | | 5,377,778 | | | $ | 5,377,778 | | |
Columbia Short-Term Cash Fund,
0.134%(a)(e)37,781,238 | | | 37,781,238 | | |
Total Money Market Funds
(Cost: $43,159,016) | | $ | 43,159,016 | | |
Total Investments
(Cost: $1,082,088,322) | | | | $ | 1,089,587,095 | | |
| Other Assets and Liabilities | | | | | 1,222,623 | | |
| Net Assets | | $ | 1,090,809,718 | | |
The Accompanying Notes to Financial Statements are an integral part of this statement.
26
Columbia LifeGoal Balanced Growth Portfolio
January 31, 2012
Investment in Derivatives
At January 31, 2012, $2,112,800 was held in a margin deposit account as collateral to cover initial margin requirements on open futures contracts.
Futures Contracts Outstanding at January 31, 2012
| Contract Description | | Number of
Contracts
Long (Short) | | Notional
Market Value | | Expiration
Date | | Unrealized
Appreciation | | Unrealized
Depreciation | |
| S&P 500 Index | | | 102 | | | $ | 33,359,100 | | | March 2012 | | $ | 1,542,266 | | | $ | — | | |
| U.S. Treasury Note, 10-year | | | 56 | | | | 7,406,000 | | | March 2012 | | | 128,964 | | | | — | | |
| Total | | | | | | | | $ | 1,671,230 | | | $ | — | | |
Notes to Portfolio of Investments
(a) Investment in affiliated mutual fund advised by Columbia Management Investment Advisers, LLC or one of its affiliates.
(b) Non-income producing.
(c) Identifies issues considered to be illiquid as to their marketability. The aggregate value of such securities at January 31, 2012 was $10,240, representing less than 0.01% of net assets. Information concerning such security holdings at January 31, 2012 was as follows:
| Security Description | | Acquisition Dates | | Cost | |
| China Milk Products Group Ltd. | | 11/17/10 | | $ | 172,880 | | |
(d) Represents fair value as determined in good faith under procedures approved by the Board of Trustees. At January 31, 2012, the value of these securities amounted to $10,240, which represents less than 0.01% of net assets.
(e) The rate shown is the seven-day current annualized yield at January 31, 2012.
Fair Value Measurements
Generally accepted accounting principles (GAAP) require disclosure regarding the inputs and valuation techniques used to measure fair value and any changes in valuation inputs or techniques. In addition, investments shall be disclosed by major category.
The Portfolio categorizes its fair value measurements according to a three-level hierarchy that maximizes the use of observable inputs and minimizes the use of unobservable inputs by prioritizing that the most observable input be used when available. Observable inputs are those that market participants would use in pricing an investment based on market data obtained from sources independent of the reporting entity. Unobservable inputs are those that reflect the Portfolio's assumptions about the information market participants would use in pricing an investment. An investment's level within the fair value hierarchy is based on the lowest level of any input that is deemed significant to the asset or liability's fair value measurement. The input levels are not necessarily an indication of the risk or liquidity associated with investments at that level. For example, certain U.S. government securities are generally high quality and liquid, however, they are reflected as Level 2 because the inputs used to determine fair value may not always be quoted prices in an active market.
Fair value inputs are summarized in the three broad levels listed below:
• Level 1 — Valuations based on quoted prices for investments in active markets that the Portfolio has the ability to access at the measurement date (including NAV for open-end mutual funds). Valuation adjustments are not applied to Level 1 investments.
• Level 2 — Valuations based on other significant observable inputs (including quoted prices for similar securities, interest rates, prepayment speeds, credit risks, etc.).
• Level 3 — Valuations based on significant unobservable inputs (including the Portfolio's own assumptions and judgment in determining the fair value of investments).
Inputs that are used in determining fair value of an investment may include price information, credit data, volatility statistics, and other factors. These inputs can be either observable or unobservable. The availability of observable inputs can vary between investments, and is affected by various factors such as the type of investment, and the volume and level of activity for that investment or similar investments in the marketplace. The inputs will be considered by the Investment Manager, along with any other relevant factors in the calculation of an investment's fair value. The Portfolio uses prices and inputs that are current as of the measurement date, which may include periods of market dislocations. During these periods, the availability of prices and inputs may be reduced for many investments. This condition could cause an investment to be reclassified between the various levels within the hierarchy.
Investments falling into the Level 3 category are primarily supported by quoted prices from brokers and dealers participating in the market for those investments. However, these may be classified as Level 3 investments due to lack of market transparency and corroboration to support these quoted prices. Additionally, valuation models may be used as the pricing source for any remaining investments classified as Level 3. These models rely on one or more significant unobservable inputs and/or significant assumptions by the Investment Manager. Inputs used in valuations may include, but are not limited to, financial statement analysis, capital account balances, discount rates and estimated cash flows, and comparable company data.
The Accompanying Notes to Financial Statements are an integral part of this statement.
27
Columbia LifeGoal Balanced Growth Portfolio
January 31, 2012
Fair Value Measurements (continued)
The following table is a summary of the inputs used to value the Portfolio's investments as of January 31, 2012:
| | | Fair Value at January 31, 2012 | |
| Description(a) | | Level 1
Quoted Prices
Identical Assets | | Level 2
Other
in Active
Markets for
Inputs(b) | | Level 3
Significant
Observable
Inputs | | Significant
Unobservable
Total | |
| Mutual Funds | |
| Investments in Affilated Funds | | $ | 1,019,804,817 | | | $ | — | | | $ | — | | | $ | 1,019,804,817 | | |
| Money Market Funds | | | 43,159,016 | | | | — | | | | — | | | | 43,159,016 | | |
| Total Mutual Funds | | | 1,062,963,833 | | | | — | | | | — | | | | 1,062,963,833 | | |
| Equity Securities | |
| Common Stocks | |
| Consumer Staples | | | — | | | | — | | | | 10,240 | | | | 10,240 | | |
| Total Equity Securities | | | — | | | | — | | | | 10,240 | | | | 10,240 | | |
| Bonds | |
| Inflation-Indexed Bonds | | | — | | | | 26,613,022 | | | | — | | | | 26,613,022 | | |
| Total Bonds | | | — | | | | 26,613,022 | | | | — | | | | 26,613,022 | | |
| Investments in Securities | | | 1,062,963,833 | | | | 26,613,022 | | | | 10,240 | | | | 1,089,587,095 | | |
| Derivatives(c) | |
| Assets | |
| Futures Contracts | | | 1,671,230 | | | | — | | | | — | | | | 1,671,230 | | |
| Total | | $ | 1,064,635,063 | | | $ | 26,613,022 | | | $ | 10,240 | | | $ | 1,091,258,325 | | |
The Fund's assets assigned to the Level 2 input category are generally valued using the market approach, in which a security's value is determined through reference to prices and information from market transactions for similar or identical assets.
The Fund's assets assigned to the Level 3 category are valued utilizing the valuation technique deemed the most appropriate in the circumstances. Certain Common Stock classified as Level 3 are valued using a market approach. To determine fair value for these securities, management considered various factors which may have included, but were not limited to, the halt price of the security, the movement in observed market prices for other securities from the issuer, the movement in certain foreign or domestic market indices, models utilized by the third party statistical pricing service, and the position of the security within the respective company's capital structure.
(a) See the Portfolio of Investments for all investment classifications not indicated in the table.
(b) Financial assets were transferred from Level 1 to Level 2 as a result of management's reassesement of the relevant fair valuation accounting standard.
Transfers between Level 1 and Level 2 are determined based on the fair value at the beginning of the period for security positions held throughout the period.
The following table shows transfers between Level 1 and Level 2 of the fair value hierarchy:
| | Transfers In | | Transfers Out | |
| | Level 1 | | Level 2 | | Level 1 | | Level 2 | |
| | | | | $ | — | | | $ | 8,728,264 | | | $ | 8,728,264 | | | $ | — | | |
(c) Derivative Instruments are valued at unrealized appreciation (depreciation).
The following table is a reconciliation of Level 3 assets for which significant unobservable inputs were used to determine fair value.
| | | Common
Stocks | |
| Balance as of March 31, 2011 | | $ | — | | |
| Accrued discounts/premiums | | | — | | |
| Realized gain (loss) | | | — | | |
| Change in unrealized appreciation (depreciation)* | | | 22 | | |
| Sales | | | — | | |
| Purchases | | | 10,218 | | |
| Transfers into Level 3 | | | — | | |
| Transfers out of Level 3 | | | — | | |
| Balance as of January 31, 2012 | | $ | 10,240 | | |
* Change in unrealized appreciation (depreciation) relating to securities held at January 31, 2012 was $22.
Transfers in and/or out of Level 3 are determined based on the fair value at the beginning of the period for security positions held throughout the period.
The Accompanying Notes to Financial Statements are an integral part of this statement.
28
Portfolio of Investments – Columbia LifeGoal Income and Growth Portfolio
January 31, 2012
(Percentages represent value of investments compared to net assets)
| | | Shares | | Value | |
| Equity Funds 27.0% | |
| DIVIDEND INCOME 4.3% | |
| Columbia Dividend Income Fund(a) | | | 302,662 | | | $ | 4,194,896 | | |
| Columbia Dividend Opportunity Fund(a) | | | 159,618 | | | | 1,313,658 | | |
| Total | | | 5,508,554 | | |
| INTERNATIONAL 6.0% | |
| Columbia Emerging Markets Fund(a)(b) | | | 200,019 | | | | 1,944,188 | | |
| Columbia Greater China Fund(a) | | | 13,982 | | | | 666,783 | | |
Columbia Multi-Advisor International Equity
Fund(a)(b) | | | 460,875 | | | | 5,161,798 | | |
| Total | | | 7,772,769 | | |
| U.S. LARGE CAP 13.2% | |
| Columbia Contrarian Core Fund(a) | | | 225,078 | | | | 3,247,870 | | |
| Columbia Large Cap Core Fund(a) | | | 244,260 | | | | 3,248,661 | | |
| Columbia Large Cap Growth Fund(a) | | | 120,383 | | | | 2,944,558 | | |
| Columbia Large Core Quantitative Fund(a) | | | 380,797 | | | | 2,280,973 | | |
| Columbia Large Value Quantitative Fund(a) | | | 144,563 | | | | 970,018 | | |
| Columbia Select Large Cap Growth Fund(a)(b) | | | 250,608 | | | | 3,240,363 | | |
| Columbia Select Large-Cap Value Fund(a) | | | 80,500 | | | | 1,226,823 | | |
| Total | | | 17,159,266 | | |
| U.S. MID CAP 3.5% | |
| Columbia Mid Cap Growth Fund(a)(b) | | | 97,687 | | | | 2,615,078 | | |
| Columbia Mid Cap Value Fund(a) | | | 144,795 | | | | 1,950,393 | | |
| Total | | | 4,565,471 | | |
Total Equity Funds
(Cost: $32,555,299) | | $ | 35,006,060 | | |
| Fixed-Income Funds 59.7% | |
| CONVERTIBLE 3.0% | |
| Columbia Convertible Securities Fund(a) | | | 269,738 | | | $ | 3,927,389 | | |
| EMERGING MARKETS 3.0% | |
| Columbia Emerging Markets Bond Fund(a) | | | 340,546 | | | | 3,906,061 | | |
| INTERNATIONAL 3.4% | |
| Columbia International Bond Fund(a) | | | 394,613 | | | | 4,447,290 | | |
| INVESTMENT GRADE 50.3% | |
| Columbia Bond Fund(a) | | | 1,051,991 | | | | 10,067,553 | | |
| Columbia Corporate Income Fund(a) | | | 1,425,133 | | | | 14,593,362 | | |
| Columbia Income Opportunities Fund(a) | | | 1,165,106 | | | | 11,103,460 | | |
| Columbia Limited Duration Credit Fund(a) | | | 867,986 | | | | 8,697,216 | | |
| Columbia Short Term Bond Fund(a) | | | 256,955 | | | | 2,546,424 | | |
| Columbia U.S. Government Mortgage Fund(a) | | | 1,563,251 | | | | 8,660,413 | | |
| Mortgage- and Asset-Backed Portfolio(a) | | | 964,367 | | | | 9,306,148 | | |
| Total | | | 64,974,576 | | |
Total Fixed-Income Funds
(Cost: $74,549,817) | | $ | 77,255,316 | | |
| | | Shares | | Value | |
| Alternative Investments 6.1% | |
Columbia Absolute Return Currency and
Income Fund(a)(b) | | | 333,789 | | | $ | 3,421,333 | | |
Columbia Absolute Return Multi-Strategy
Fund(a)(b) | | | 451,703 | | | | 4,503,484 | | |
Total Alternative Investments
(Cost: $7,874,037) | | $ | 7,924,817 | | |
| Issuer | | Coupon
Rate | | Principal
Amount | | Value | |
| Inflation-Indexed Bonds 3.9% | |
U.S. Treasury Inflation-Indexed Bond
07/15/12 | | | 3.000 | % | | $ | 144,696 | | | $ | 148,042 | | |
| 07/15/13 | | | 1.875 | % | | | 357,210 | | | | 375,936 | | |
| 01/15/14 | | | 2.000 | % | | | 428,526 | | | | 458,121 | | |
| 01/15/15 | | | 1.625 | % | | | 533,156 | | | | 582,098 | | |
| 01/15/16 | | | 2.000 | % | | | 364,746 | | | | 413,787 | | |
| 07/15/17 | | | 2.625 | % | | | 294,719 | | | | 357,576 | | |
| 01/15/19 | | | 2.125 | % | | | 410,943 | | | | 497,787 | | |
| 01/15/21 | | | 1.125 | % | | | 149,956 | | | | 171,536 | | |
| 01/15/25 | | | 2.375 | % | | | 630,095 | | | | 822,765 | | |
| 04/15/29 | | | 3.875 | % | | | 598,625 | | | | 958,034 | | |
| 02/15/40 | | | 2.125 | % | | | 177,937 | | | | 247,945 | | |
Total Inflation-Indexed Bonds
(Cost: $4,533,136) | | $ | 5,033,627 | | |
| | | | | Shares | | Value | |
| Money Market Funds 3.2% | |
BofA Cash Reserves, Capital Class,
0.070%(c) | | | 982,040 | | | $ | 982,040 | | |
| Columbia Short-Term Cash Fund, 0.134%(a)(c) | | | 3,179,381 | | | | 3,179,381 | | |
Total Money Market Funds
(Cost: $4,161,421) | | $ | 4,161,421 | | |
Total Investments
(Cost: $123,673,710) | | | | $ | 129,381,241 | | |
| Other Assets and Liabilities | | | | | 73,961 | | |
| Net Assets | | $ | 129,455,202 | | |
Investment in Derivatives
At January 31, 2012, $122,150 was held in a margin deposit account as collateral to cover initial margin requirements on open futures contracts.
Futures Contracts Outstanding at January 31, 2012
| Contract Description | | Number of
Contracts
Long (Short) | | Notional
Market Value | | Expiration
Date | | Unrealized
Appreciation | | Unrealized
Depreciation | |
| S&P 500 Index | | | 4 | | | $ | 1,308,200 | | | March 2012 | | $ | 981 | | | $ | — | | |
| U.S. Treasury Note, 5-year | | | 25 | | | | 3,101,172 | | | March 2012 | | | 32,612 | | | | — | | |
| U.S. Treasury Note, 10-year | | | 18 | | | | 2,380,500 | | | March 2012 | | | 41,453 | | | | — | | |
| Total | | | | | | | | $ | 75,046 | | | $ | — | | |
The Accompanying Notes to Financial Statements are an integral part of this statement.
29
Columbia LifeGoal Income and Growth Portfolio
January 31, 2012
Notes to Portfolio of Investments
(a) Investment in affiliated mutual fund advised by Columbia Management Investment Advisers, LLC or one of its affiliates.
(b) Non-income producing.
(c) The rate shown is the seven-day current annualized yield at January 31, 2012.
Fair Value Measurements
Generally accepted accounting principles (GAAP) require disclosure regarding the inputs and valuation techniques used to measure fair value and any changes in valuation inputs or techniques. In addition, investments shall be disclosed by major category.
The Portfolio categorizes its fair value measurements according to a three-level hierarchy that maximizes the use of observable inputs and minimizes the use of unobservable inputs by prioritizing that the most observable input be used when available. Observable inputs are those that market participants would use in pricing an investment based on market data obtained from sources independent of the reporting entity. Unobservable inputs are those that reflect the Portfolio's assumptions about the information market participants would use in pricing an investment. An investment's level within the fair value hierarchy is based on the lowest level of any input that is deemed significant to the asset or liability's fair value measurement. The input levels are not necessarily an indication of the risk or liquidity associated with investments at that level. For example, certain U.S. government securities are generally high quality and liquid, however, they are reflected as Level 2 because the inputs used to determine fair value may not always be quoted prices in an active market.
Fair value inputs are summarized in the three broad levels listed below:
• Level 1 — Valuations based on quoted prices for investments in active markets that the Portfolio has the ability to access at the measurement date (including NAV for open-end mutual funds). Valuation adjustments are not applied to Level 1 investments.
• Level 2 — Valuations based on other significant observable inputs (including quoted prices for similar securities, interest rates, prepayment speeds, credit risks, etc.).
• Level 3 — Valuations based on significant unobservable inputs (including the Portfolio's own assumptions and judgment in determining the fair value of investments).
Inputs that are used in determining fair value of an investment may include price information, credit data, volatility statistics, and other factors. These inputs can be either observable or unobservable. The availability of observable inputs can vary between investments, and is affected by various factors such as the type of investment, and the volume and level of activity for that investment or similar investments in the marketplace. The inputs will be considered by the Investment Manager, along with any other relevant factors in the calculation of an investment's fair value. The Portfolio uses prices and inputs that are current as of the measurement date, which may include periods of market dislocations. During these periods, the availability of prices and inputs may be reduced for many investments. This condition could cause an investment to be reclassified between the various levels within the hierarchy.
Investments falling into the Level 3 category are primarily supported by quoted prices from brokers and dealers participating in the market for those investments. However, these may be classified as Level 3 investments due to lack of market transparency and corroboration to support these quoted prices. Additionally, valuation models may be used as the pricing source for any remaining investments classified as Level 3. These models rely on one or more significant unobservable inputs and/or significant assumptions by the Investment Manager. Inputs used in valuations may include, but are not limited to, financial statement analysis, capital account balances, discount rates and estimated cash flows, and comparable company data.
The following table is a summary of the inputs used to value the Portfolio's investments as of January 31, 2012:
| | | Fair Value at January 31, 2012 | |
| Description(a) | | Level 1
Quoted Prices
Identical Assets | | Level 2
Other
in Active
Markets for
Inputs(b) | | Level 3
Significant
Observable
Inputs | | Significant
Unobservable
Total | |
| Mutual Funds | |
| Investments in Affiliated Funds | | $ | 120,186,193 | | | $ | — | | | $ | — | | | $ | 120,186,193 | | |
| Money Market Funds | | | 4,161,421 | | | | — | | | | — | | | | 4,161,421 | | |
| Total Mutual Funds | | | 124,347,614 | | | | — | | | | — | | | | 124,347,614 | | |
| Bonds | |
| Inflation-Indexed Bonds | | | — | | | | 5,033,627 | | | | — | | | | 5,033,627 | | |
| Total Bonds | | | — | | | | 5,033,627 | | | | — | | | | 5,033,627 | | |
| Investments in Securities | | | 124,347,614 | | | | 5,033,627 | | | | — | | | | 129,381,241 | | |
| Derivatives(c) | |
| Assets | |
| Futures Contracts | | | 75,046 | | | | — | | | | — | | | | 75,046 | | |
| Total | | $ | 124,422,660 | | | $ | 5,033,627 | | | $ | — | | | $ | 129,456,287 | | |
The Accompanying Notes to Financial Statements are an integral part of this statement.
30
Columbia LifeGoal Income and Growth Portfolio
January 31, 2012
Fair Value Measurements (continued)
The Fund's assets assigned to the Level 2 input category are generally valued using the market approach, in which a security's value is determined through reference to prices and information from market transactions for similar or identical assets.
(a) See the Portfolio of Investments for all investment classifications not indicated in the table.
(b) Financial assets were transferred from Level 1 to Level 2 as a result of management's reassessment of the relevant fair valuation accounting standard.
Transfers between Level 1 and Level 2 are determined based on the fair value at the beginning of the period for security positions held throughout the period.
The following table shows transfers between Level 1 and Level 2 of the fair value hierarchy:
| | Transfers In | | Transfers Out | |
| | Level 1 | | Level 2 | | Level 1 | | Level 2 | |
| | | | | $ | — | | | $ | 4,150,045 | | | $ | 4,150,045 | | | $ | — | | |
(c) Derivative instruments are valued at unrealized appreciation (depreciation).
The Accompanying Notes to Financial Statements are an integral part of this statement.
31
Portfolio of Investments – Columbia LifeGoal Income Portfolio
January 31, 2012
(Percentages represent value of investments compared to net assets)
| | | Shares | | Value | |
| Fixed-Income Funds 84.5% | |
| CONVERTIBLE 5.0% | |
| Columbia Convertible Securities Fund(a) | | | 90,890 | | | $ | 1,323,365 | | |
| EMERGING MARKETS 4.0% | |
| Columbia Emerging Markets Bond Fund(a) | | | 92,497 | | | | 1,060,936 | | |
| INTERNATIONAL 4.5% | |
| Columbia International Bond Fund(a) | | | 105,763 | | | | 1,191,949 | | |
| INVESTMENT GRADE 71.0% | |
| Columbia Corporate Income Fund(a) | | | 370,168 | | | | 3,790,518 | | |
| Columbia Income Opportunities Fund(a) | | | 279,230 | | | | 2,661,058 | | |
| Columbia Limited Duration Credit Fund(a) | | | 291,163 | | | | 2,917,452 | | |
| Columbia Short Term Bond Fund(a) | | | 267,197 | | | | 2,647,922 | | |
| Columbia U.S. Government Mortgage Fund(a) | | | 550,085 | | | | 3,047,474 | | |
| Columbia U.S. Treasury Index Fund(a) | | | 11,218 | | | | 132,596 | | |
| Mortgage- and Asset-Backed Portfolio(a) | | | 376,904 | | | | 3,637,126 | | |
| Total | | | 18,834,146 | | |
Total Fixed-Income Funds
(Cost: $21,058,286) | | $ | 22,410,396 | | |
| Alternative Investments 6.0% | |
Columbia Absolute Return Currency and
Income Fund(a)(b) | | | 77,054 | | | $ | 789,798 | | |
Columbia Absolute Return Multi-Strategy
Fund(a)(b) | | | 79,401 | | | | 791,629 | | |
Total Alternative Investments
(Cost: $1,571,667) | | $ | 1,581,427 | | |
| Issuer | | Coupon
Rate | | Principal
Amount | | Value | |
| Inflation-Indexed Bonds 4.9% | |
U.S. Treasury Inflation-Indexed Bond
07/15/12 | | | 3.000 | % | | $ | 69,203 | | | $ | 70,803 | | |
| 07/15/13 | | | 1.875 | % | | | 80,064 | | | | 84,262 | | |
| 01/15/14 | | | 2.000 | % | | | 97,949 | | | | 104,713 | | |
| 01/15/15 | | | 1.625 | % | | | 130,327 | | | | 142,290 | | |
| 01/15/16 | | | 2.000 | % | | | 91,187 | | | | 103,447 | | |
| 07/15/17 | | | 2.625 | % | | | 70,951 | | | | 86,083 | | |
| 01/15/19 | | | 2.125 | % | | | 105,370 | | | | 127,638 | | |
| 01/15/21 | | | 1.125 | % | | | 36,196 | | | | 41,405 | | |
| 01/15/25 | | | 2.375 | % | | | 180,027 | | | | 235,076 | | |
| 04/15/29 | | | 3.875 | % | | | 137,615 | | | | 220,238 | | |
| 02/15/40 | | | 2.125 | % | | | 62,801 | | | | 87,510 | | |
Total Inflation-Indexed Bonds
(Cost: $1,174,229) | | | | | | $ | 1,303,465 | | |
| | | Shares | | Value | |
| Money Market Funds 5.0% | |
| BofA Cash Reserves, Capital Class, 0.070%(c) | | | 1,320,902 | | | $ | 1,320,902 | | |
| Columbia Short-Term Cash Fund, 0.134%(a)(c)17,826 | | | 17,826 | | |
Total Money Market Funds
(Cost: $1,338,728) | | $ | 1,338,728 | | |
Total Investments
(Cost: $25,142,910) | | $ | 26,634,016 | | |
| Other Assets and Liabilities | | | (125,058 | ) | |
| Net Assets | | $ | 26,508,958 | | |
Notes to Portfolio of Investments
(a) Investment in affiliated mutual fund advised by Columbia Management Investment Advisers, LLC or one of its affiliates.
(b) Non-income producing.
(c) The rate shown is the seven-day current annualized yield at January 31, 2012.
Fair Value Measurements
Generally accepted accounting principles (GAAP) require disclosure regarding the inputs and valuation techniques used to measure fair value and any changes in valuation inputs or techniques. In addition, investments shall be disclosed by major category.
The Portfolio categorizes its fair value measurements according to a three-level hierarchy that maximizes the use of observable inputs and minimizes the use of unobservable inputs by prioritizing that the most observable input be used when available. Observable inputs are those that market participants would use in pricing an investment based on market data obtained from sources independent of the reporting entity. Unobservable inputs are those that reflect the Portfolio's assumptions about the information market participants would use in pricing an investment. An investment's level within the fair value hierarchy is based on the lowest level of any input that is deemed significant to the asset or liability's fair value measurement. The input levels are not necessarily an indication of the risk or liquidity associated with investments at that level. For example, certain U.S. government securities are generally high quality and liquid, however, they are reflected as Level 2 because the inputs used to determine fair value may not always be quoted prices in an active market.
Fair value inputs are summarized in the three broad levels listed below:
• Level 1 — Valuations based on quoted prices for investments in active markets that the Portfolio has the ability to access at the measurement date (to include NAV for open-end mutual funds). Valuation adjustments are not applied to Level 1 investments.
• Level 2 — Valuations based on other significant observable inputs (including quoted prices for similar securities, interest rates, prepayment speeds, credit risks, etc.).
• Level 3 — Valuations based on significant unobservable inputs (including the Portfolio's own assumptions and judgment in determining the fair value of investments).
The Accompanying Notes to Financial Statements are an integral part of this statement.
32
Columbia LifeGoal Income Portfolio
January 31, 2012
Fair Value Measurements (continued)
Inputs that are used in determining fair value of an investment may include price information, credit data, volatility statistics, and other factors. These inputs can be either observable or unobservable. The availability of observable inputs can vary between investments, and is affected by various factors such as the type of investment, and the volume and level of activity for that investment or similar investments in the marketplace. The inputs will be considered by the Investment Manager, along with any other relevant factors in the calculation of an investment's fair value. The Portfolio uses prices and inputs that are current as of the measurement date, which may include periods of market dislocations. During these periods, the availability of prices and inputs may be reduced for many investments. This condition could cause an investment to be reclassified between the various levels within the hierarchy.
Investments falling into the Level 3 category are primarily supported by quoted prices from brokers and dealers participating in the market for those investments. However, these may be classified as Level 3 investments due to lack of market transparency and corroboration to support these quoted prices. Additionally, valuation models may be used as the pricing source for any remaining investments classified as Level 3. These models rely on one or more significant unobservable inputs and/or significant assumptions by the Investment Manager. Inputs used in valuations may include, but are not limited to, financial statement analysis, capital account balances, discount rates and estimated cash flows, and comparable company data.
The following table is a summary of the inputs used to value the Portfolio's investments as of January 31, 2012:
| | | Fair Value at January 31, 2012 | |
| Description(a) | | Level 1
Quoted Prices
in Active
Markets for
Identical Assets | | Level 2
Other
Significant
Observable
Inputs(b) | | Level 3
Significant
Unobservable
Inputs | | Total | |
| Mutual Funds | |
| Investments in Affiliated Funds | | $ | 23,991,823 | | | $ | — | | | $ | — | | | $ | 23,991,823 | | |
| Money Market Funds | | | 1,338,728 | | | | — | | | | — | | | | 1,338,728 | | |
| Total Mutual Funds | | | 25,330,551 | | | | — | | | | — | | | | 25,330,551 | | |
| Bonds | |
| Inflation-Indexed Bonds | | | — | | | | 1,303,465 | | | | — | | | | 1,303,465 | | |
| Total Bonds | | | — | | | | 1,303,465 | | | | — | | | | 1,303,465 | | |
| Total | | $ | 25,330,551 | | | $ | 1,303,465 | | | $ | — | | | $ | 26,634,016 | | |
The Fund's assets assigned to the Level 2 input category are generally valued using the market approach, in which a security's value is determined through reference to prices and information from market transactions for similar or identical assets.
(a) See the Portfolio of Investments for all investment classifications not indicated in the table.
(b) Financial assets were transferred from Level 1 to Level 2 as a result of management's reassessment of the relevant fair valuation accounting standard.
Transfers between Level 1 and Level 2 are determined based on the fair value at the beginning of the period for security positions held throughout the period.
The following table shows transfers between Level 1 and Level 2 of the fair value hierarchy:
| | Transfers In | | Transfers Out | |
| | Level 1 | | Level 2 | | Level 1 | | Level 2 | |
| | | | | $ | — | | | $ | 1,393,837 | | | $ | 1,393,837 | | | $ | — | | |
The Accompanying Notes to Financial Statements are an integral part of this statement.
33
Statement of Assets and Liabilities – Columbia LifeGoal Portfolios
January 31, 2012
| | | Columbia
LifeGoal Growth
Portfolio | | Columbia
LifeGoal
Balanced
Growth Portfolio | | Columbia
LifeGoal Income
and Growth
Portfolio | | Columbia
LifeGoal Income
Portfolio | |
| Assets | |
| Investments, at value | |
Unaffiliated issuers (identified cost $—, $29,616,047,
$5,515,176, $2,495,131) | | $ | — | | | $ | 32,001,040 | | | $ | 6,015,667 | | | $ | 2,624,367 | | |
Affiliated issuers (identified cost $728,686,706, $1,052,472,275,
$118,158,534, $22,647,779) | | | 764,512,916 | | | | 1,057,586,055 | | | | 123,365,574 | | | | 24,009,649 | | |
Total investments (identified cost $728,686,706, $1,082,088,322,
$123,673,710, $25,142,910) | | | 764,512,916 | | | | 1,089,587,095 | | | | 129,381,241 | | | | 26,634,016 | | |
| Margin deposits on futures contracts | | | — | | | | 2,112,800 | | | | 122,150 | | | | — | | |
| Receivable for: | |
| Investments sold | | | 346,637 | | | | 475,747 | | | | 34,217 | | | | — | | |
| Capital shares sold | | | 310,414 | | | | 556,708 | | | | 166,549 | | | | 25,017 | | |
| Dividends | | | — | | | | 835,160 | | | | 182,722 | | | | 45,513 | | |
| Interest | | | — | | | | 62,344 | | | | 11,863 | | | | 3,058 | | |
| Reclaims | | | — | | | | 19,821 | | | | — | | | | — | | |
| Variation margin on futures contracts | | | — | | | | — | | | | 5,191 | | | | — | | |
| Prepaid expense | | | 5,460 | | | | 6,236 | | | | 5,105 | | | | 5,476 | | |
| Trustees' deferred compensation plan | | | — | | | | 142,817 | | | | — | | | | — | | |
| Total assets | | | 765,175,427 | | | | 1,093,798,728 | | | | 129,909,038 | | | | 26,713,080 | | |
| Liabilities | |
| Payable for: | |
| Investments purchased | | | — | | | | 830,396 | | | | 182,325 | | | | 63,973 | | |
| Capital shares purchased | | | 1,371,861 | | | | 1,549,050 | | | | 196,297 | | | | 52,059 | | |
| Variation margin on futures contracts | | | — | | | | 5,600 | | | | — | | | | — | | |
| Investment management fees | | | — | | | | 1,586 | | | | 266 | | | | 57 | | |
| Distribution fees and service fees | | | 8,458 | | | | 10,128 | | | | 1,540 | | | | 333 | | |
| Transfer agent fees | | | 90,321 | | | | 132,485 | | | | 19,535 | | | | 5,134 | | |
| Administration fees | | | 418 | | | | 596 | | | | 71 | | | | 14 | | |
| Plan administration fees | | | 2 | | | | — | | | | — | | | | — | | |
| Chief compliance officer expenses | | | — | | | | 25 | | | | — | | | | — | | |
| Expense reimbursement due to Investment Manager | | | — | | | | 169,540 | | | | 17,425 | | | | 4,941 | | |
| Other expenses | | | 74,048 | | | | 146,787 | | | | 36,377 | | | | 77,611 | | |
| Trustees' deferred compensation plan | | | — | | | | 142,817 | | | | — | | | | — | | |
| Total liabilities | | | 1,545,108 | | | | 2,989,010 | | | | 453,836 | | | | 204,122 | | |
| Net assets applicable to outstanding capital stock | | $ | 763,630,319 | | | $ | 1,090,809,718 | | | $ | 129,455,202 | | | $ | 26,508,958 | | |
The Accompanying Notes to Financial Statements are an integral part of this statement.
34
Statement of Assets and Liabilities (continued) – Columbia LifeGoal Portfolios
January 31, 2012
| | | Columbia
LifeGoal Growth
Portfolio | | Columbia
LifeGoal
Balanced
Growth Portfolio | | Columbia
LifeGoal Income
and Growth
Portfolio | | Columbia
LifeGoal Income
Portfolio | |
| Represented by | |
| Paid-in capital | | $ | 851,669,406 | | | $ | 1,084,043,907 | | | $ | 125,618,614 | | | $ | 26,222,930 | | |
| Undistributed (excess of distributions over) net investment income | | | 3,062,675 | | | | 314,308 | | | | 240,169 | | | | (10,474 | ) | |
| Accumulated net realized gain (loss) | | | (126,927,972 | ) | | | (2,720,053 | ) | | | (2,186,158 | ) | | | (1,194,604 | ) | |
| Unrealized appreciation (depreciation) on: | |
| Investments | | | 35,826,210 | | | | 7,498,773 | | | | 5,707,531 | | | | 1,491,106 | | |
| Foreign currency translations | | | — | | | | 1,553 | | | | — | | | | — | | |
| Futures contracts | | | — | | | | 1,671,230 | | | | 75,046 | | | | — | | |
| Total — representing net assets applicable to outstanding capital stock | | $ | 763,630,319 | | | $ | 1,090,809,718 | | | $ | 129,455,202 | | | $ | 26,508,958 | | |
| Net assets applicable to outstanding shares | |
| Class A | | $ | 539,370,183 | | | $ | 665,858,564 | | | $ | 68,452,305 | | | $ | 15,735,780 | | |
| Class B | | $ | 82,940,947 | | | $ | 85,004,630 | | | $ | 14,587,090 | | | $ | 2,689,565 | | |
| Class C | | $ | 90,147,845 | | | $ | 86,321,003 | | | $ | 24,156,187 | | | $ | 5,562,303 | | |
| Class R | | $ | 3,124,215 | | | $ | 3,907,785 | | | $ | 1,102,202 | | | $ | — | | |
| Class R4 | | $ | 279,434 | | | $ | — | | | $ | — | | | $ | — | | |
| Class T | | $ | — | | | $ | 102,913,218 | | | $ | — | | | $ | — | | |
| Class Z | | $ | 47,767,695 | | | $ | 146,804,518 | | | $ | 21,157,418 | | | $ | 2,521,310 | | |
| Shares outstanding | |
| Class A | | | 46,525,213 | | | | 58,926,032 | | | | 6,247,302 | | | | 1,500,025 | | |
| Class B | | | 7,852,295 | | | | 7,582,508 | | | | 1,337,375 | | | | 256,840 | | |
| Class C | | | 8,607,081 | | | | 7,601,222 | | | | 2,228,613 | | | | 531,774 | | |
| Class R | | | 272,129 | | | | 346,216 | | | | 100,528 | | | | — | | |
| Class R4 | | | 23,694 | | | | — | | | | — | | | | — | | |
| Class T | | | — | | | | 9,110,136 | | | | — | | | | — | | |
| Class Z | | | 4,048,749 | | | | 13,008,509 | | | | 1,950,314 | | | | 240,224 | | |
| Net asset value per share | |
| Class A(a) | | $ | 11.59 | | | $ | 11.30 | | | $ | 10.96 | | | $ | 10.49 | | |
| Class B | | $ | 10.56 | | | $ | 11.21 | | | $ | 10.91 | | | $ | 10.47 | | |
| Class C | | $ | 10.47 | | | $ | 11.36 | | | $ | 10.84 | | | $ | 10.46 | | |
| Class R | | $ | 11.48 | | | $ | 11.29 | | | $ | 10.96 | | | $ | — | | |
| Class R4 | | $ | 11.79 | | | $ | — | | | $ | — | | | $ | — | | |
| Class T(a) | | $ | — | | | $ | 11.30 | | | $ | — | | | $ | — | | |
| Class Z | | $ | 11.80 | | | $ | 11.29 | | | $ | 10.85 | | | $ | 10.50 | | |
(a) The maximum offering price per share for Class A for Columbia LifeGoal Growth Portfolio, Columbia LifeGoal Balanced Growth Portfolio, Columbia LifeGoal Income and Growth Portfolio and Columbia LifeGoal Income Portfolio is $12.30, $11.99, $11.63 and $10.84, respectively. The maximum offering price per share for Class T for Columbia LifeGoal Balanced Growth Portfolio is $11.99. The offering price is calculated by dividing the net asset value by 1.0 minus the maximum sales charge of 5.75% for Columbia LifeGoal Growth Portfolio, Columbia LifeGoal Balanced Growth Portfolio and Columbia LifeGoal Income and Growth Portfolio, and dividing the net asset value by 1.0 minus the maximum sales charge of 3.25% for Columbia LifeGoal Income Portfolio.
The Accompanying Notes to Financial Statements are an integral part of this statement.
35
Statement of Operations – Columbia LifeGoal Portfolios
| | | Columbia
LifeGoal Growth
Portfolio
Year ended
January 31, 2012(a) | | Columbia
LifeGoal Growth
Portfolio
Year ended
March 31, 2011 | |
| Net investment income | |
| Income: | |
| Dividends — unaffiliated issuers | | $ | — | | | $ | 39,407 | | |
| Dividends — affiliated issuers | | | 7,784,397 | | | | 4,565,269 | | |
| Total income | | | 7,784,397 | | | | 4,604,676 | | |
| Expenses: | |
| Investment management fees | | | 82,863 | | | | 939,753 | | |
| Distribution fees | |
| Class B | | | 552,531 | | | | 599,244 | | |
| Class C | | | 535,467 | | | | 492,500 | | |
| Class R | | | 11,066 | | | | 8,305 | | |
| Service fees | |
| Class B | | | 184,177 | | | | 199,748 | | |
| Class C | | | 178,489 | | | | 164,167 | | |
| Distribution and service fees — Class A | | | 988,158 | | | | 451,913 | | |
| Transfer agent fees | |
| Class A | | | 746,485 | | | | — | | |
| Class B | | | 130,490 | | | | — | | |
| Class C | | | 127,056 | | | | — | | |
| Class R | | | 3,948 | | | | — | | |
| Class R4 | | | 92 | | | | — | | |
| Class T | | | — | | | | — | | |
| Class Z | | | 68,523 | | | | — | | |
| Administration fees | | | 110,201 | | | | — | | |
| Plan administration fees | |
| Class R4 | | | 452 | | | | — | | |
| Compensation of board members | | | 8,952 | | | | — | | |
| Custodian fees | | | 15,269 | | | | — | | |
| Printing and postage fees | | | 165,202 | | | | — | | |
| Registration fees | | | 45,436 | | | | — | | |
| Professional fees | | | 61,467 | | | | — | | |
| Merger expense | | | — | | | | 36,257 | | |
| Other | | | 9,892 | | | | — | | |
| Total expenses | | | 4,026,216 | | | | 2,891,887 | | |
| Fees waived or expenses reimbursed by Investment Manager and its affiliates | | | (408,807 | ) | | | — | | |
| Expense reductions | | | (2,964 | ) | | | — | | |
| Total net expenses | | | 3,614,445 | | | | 2,891,887 | | |
| Net investment income | | | 4,169,952 | | | | 1,712,789 | | |
| Realized and unrealized gain (loss) — net | |
| Net realized gain (loss) on: | |
| Investments — unaffiliated issuers | | | — | | | | (140,002 | ) | |
| Investments — affiliated issuers | | | 38,505,141 | | | | 939,932 | | |
| Capital gain distributions from underlying affiliated funds | | | 11,798,576 | | | | 3,120,734 | | |
| Net realized gain | | | 50,303,717 | | | | 3,920,664 | | |
| Net change in unrealized appreciation (depreciation) on: | |
| Investments | | | (94,655,707 | ) | | | 59,201,605 | | |
| Net change in unrealized appreciation (depreciation) | | | (94,655,707 | ) | | | 59,201,605 | | |
| Net realized and unrealized gain (loss) | | | (44,351,990 | ) | | | 63,122,269 | | |
| Net change in net assets resulting from operations | | $ | (40,182,038 | ) | | $ | 64,835,058 | | |
(a) For the period from April 1, 2011 to January 31, 2012. During the period, the Fund's fiscal year end was changed from March 31 to January 31.
The Accompanying Notes to Financial Statements are an integral part of this statement.
36
Statement of Operations (continued) – Columbia LifeGoal Portfolios
| | | Columbia
LifeGoal
Balanced
Growth Portfolio
Year ended
January 31, 2012(a) | | Columbia
LifeGoal
Balanced
Growth Portfolio
Year ended
March 31, 2011 | |
| Net investment income | |
| Income: | |
| Dividends — unaffiliated issuers | | $ | 4,230 | | | $ | 62,826 | | |
| Dividends — affiliated issuers | | | 18,165,982 | | | | 12,255,227 | | |
| Interest | | | 806,679 | | | | 237,505 | | |
| Total income | | | 18,976,891 | | | | 12,555,558 | | |
| Expenses: | |
| Investment management fees | | | 470,885 | | | | 1,395,306 | | |
| Distribution fees | |
| Class B | | | 674,275 | | | | 1,159,439 | | |
| Class C | | | 569,163 | | | | 651,082 | | |
| Class R | | | 11,854 | | | | 10,170 | | |
| Service fees | |
| Class B | | | 224,811 | | | | 386,480 | | |
| Class C | | | 189,868 | | | | 217,027 | | |
| Distribution and service fees — Class A | | | 1,325,244 | | | | 647,058 | | |
| Shareholder service fee — Class T | | | 236,836 | | | | — | * | |
| Transfer agent fees | |
| Class A | | | 804,682 | | | | — | | |
| Class B | | | 129,490 | | | | — | | |
| Class C | | | 110,443 | | | | — | | |
| Class R | | | 3,715 | | | | — | | |
| Class T | | | 123,284 | | | | — | | |
| Class Z | | | 190,506 | | | | — | | |
| Administration fees | | | 172,993 | | | | — | | |
| Compensation of board members | | | 13,713 | | | | — | | |
| Custodian fees | | | 9,177 | | | | — | | |
| Printing and postage fees | | | 215,423 | | | | — | | |
| Registration fees | | | 42,635 | | | | — | | |
| Professional fees | | | 87,543 | | | | — | | |
| Line of credit interest expense | | | 58 | | | | 83 | | |
| Chief compliance officer expenses | | | 12 | | | | — | | |
| Total expenses | | | 5,606,610 | | | | 4,466,645 | | |
| Expense reductions | | | (32,048 | ) | | | — | | |
| Total net expenses | | | 5,574,562 | | | | 4,466,645 | | |
| Net investment income | | | 13,402,329 | | | | 8,088,913 | | |
| Realized and unrealized gain (loss) — net | |
| Net realized gain (loss) on: | |
| Investments — unaffiliated issuers | | | 122,863 | | | | (99,979 | ) | |
| Investments — affiliated issuers | | | 51,582,326 | | | | 30,868,293 | | |
| Capital gain distributions from underlying affiliated funds | | | 11,734,808 | | | | 3,244,910 | | |
| Foreign currency translations | | | 3,421 | | | | — | | |
| Futures contracts | | | 2,150,726 | | | | — | | |
| Net realized gain | | | 65,594,144 | | | | 34,013,224 | | |
| Net change in unrealized appreciation (depreciation) on: | |
| Investments | | | (118,574,461 | ) | | | 35,185,237 | | |
| Foreign currency translations | | | (7,625 | ) | | | — | | |
| Futures contracts | | | 1,671,230 | | | | — | | |
| Net change in unrealized appreciation (depreciation) | | | (116,910,856 | ) | | | 35,185,237 | | |
| Net realized and unrealized gain (loss) | | | (51,316,712 | ) | | | 69,198,461 | | |
| Net change in net assets resulting from operations | | $ | (37,914,383 | ) | | $ | 77,287,374 | | |
(a) For the period from April 1, 2011 to January 31, 2012. During the period, the Fund's fiscal year end was changed from March 31 to January 31.
* Rounds to less than $1.00.
The Accompanying Notes to Financial Statements are an integral part of this statement.
37
Statement of Operations (continued) – Columbia LifeGoal Portfolios
| | | Columbia
LifeGoal Income
and Growth
Portfolio
Year ended
January 31, 2012(a) | | Columbia
LifeGoal Income
and Growth
Portfolio
Year ended
March 31, 2011 | |
| Net investment income | |
| Income: | |
| Dividends — unaffiliated issuers | | $ | 575 | | | $ | 15,864 | | |
| Dividends — affiliated issuers | | | 2,998,927 | | | | 4,036,742 | | |
| Interest | | | 201,200 | | | | 108,224 | | |
| Total income | | | 3,200,702 | | | | 4,160,830 | | |
| Expenses: | |
| Investment management fees | | | 95,716 | | | | 345,101 | | |
| Distribution fees | |
| Class B | | | 120,398 | | | | 249,923 | | |
| Class C | | | 147,489 | | | | 174,555 | | |
| Class R | | | 2,860 | | | | 2,617 | | |
| Service fees | |
| Class B | | | 40,133 | | | | 83,308 | | |
| Class C | | | 49,164 | | | | 58,185 | | |
| Distribution and service fees — Class A | | | 138,741 | | | | 149,635 | | |
| Transfer agent fees | |
| Class A | | | 87,669 | | | | — | | |
| Class B | | | 23,255 | | | | — | | |
| Class C | | | 30,773 | | | | — | | |
| Class R | | | 961 | | | | — | | |
| Class Z | | | 27,027 | | | | — | | |
| Administration fees | | | 19,610 | | | | — | | |
| Compensation of board members | | | 8,458 | | | | — | | |
| Custodian fees | | | 10,070 | | | | — | | |
| Printing and postage fees | | | 40,462 | | | | — | | |
| Registration fees | | | 33,052 | | | | — | | |
| Professional fees | | | 43,398 | | | | — | | |
| Line of credit interest expense | | | 188 | | | | — | | |
| Other | | | 7,688 | | | | — | | |
| Total expenses | | | 927,112 | | | | 1,063,324 | | |
| Fees waived or expenses reimbursed by Investment Manager and its affiliates | | | (79,686 | ) | | | — | | |
| Expense reductions | | | (286 | ) | | | — | | |
| Total net expenses | | | 847,140 | | | | 1,063,324 | | |
| Net investment income | | | 2,353,562 | | | | 3,097,506 | | |
| Realized and unrealized gain (loss) — net | |
| Net realized gain (loss) on: | |
| Investments — unaffiliated issuers | | | 42,813 | | | | (23,695 | ) | |
| Investments — affiliated issuers | | | 5,577,748 | | | | 9,770,359 | | |
| Capital gain distributions from underlying affiliated funds | | | 899,369 | | | | 665,096 | | |
| Futures contracts | | | 463,006 | | | | — | | |
| Net realized gain | | | 6,982,936 | | | | 10,411,760 | | |
| Net change in unrealized appreciation (depreciation) on: | |
| Investments | | | (6,380,033 | ) | | | 518,350 | | |
| Futures contracts | | | 75,046 | | | | — | | |
| Net change in unrealized appreciation (depreciation) | | | (6,304,987 | ) | | | 518,350 | | |
| Net realized and unrealized gain (loss) | | | 677,949 | | | | 10,930,110 | | |
| Net change in net assets resulting from operations | | $ | 3,031,511 | | | $ | 14,027,616 | | |
(a) For the period from April 1, 2011 to January 31, 2012. During the period, the Fund's fiscal year end was changed from March 31 to January 31.
The Accompanying Notes to Financial Statements are an integral part of this statement.
38
Statement of Operations (continued) – Columbia LifeGoal Portfolios
| | | Columbia
LifeGoal Income
Portfolio
Year ended
January 31, 2012(a) | | Columbia
LifeGoal Income
Portfolio
Year ended
March 31, 2011 | |
| Net investment income | |
| Income: | |
| Dividends — unaffiliated issuers | | $ | 784 | | | $ | 729 | | |
| Dividends — affiliated issuers | | | 711,766 | | | | 983,931 | | |
| Interest | | | 56,426 | | | | 33,650 | | |
| Total income | | | 768,976 | | | | 1,018,310 | | |
| Expenses: | |
| Investment management fees | | | 15,588 | | | | 17,230 | | |
| Distribution fees | |
| Class B | | | 25,174 | | | | 46,023 | | |
| Class C | | | 33,805 | | | | 38,526 | | |
| Service fees | |
| Class B | | | 8,391 | | | | 15,341 | | |
| Class C | | | 11,268 | | | | 12,842 | | |
| Distribution and service fees — Class A | | | 29,363 | | | | 33,878 | | |
| Transfer agent fees | |
| Class A | | | 21,596 | | | | 20,739 | | |
| Class B | | | 6,201 | | | | 9,029 | | |
| Class C | | | 8,278 | | | | 7,947 | | |
| Class Z | | | 3,392 | | | | 5,156 | | |
| Administration fees | | | 8,838 | | | | 34,111 | | |
| Compensation of board members | | | 9,057 | | | | 27,853 | | |
| Pricing and bookkeeping fees | | | 89 | | | | 26,348 | | |
| Custodian fees | | | 8,117 | | | | 5,381 | | |
| Printing and postage fees | | | 28,169 | | | | — | | |
| Registration fees | | | 50,063 | | | | 47,904 | | |
| Professional fees | | | 42,791 | | | | 63,258 | | |
| Line of credit interest expense | | | 157 | | | | — | | |
| Chief compliance officer expenses | | | 14 | | | | 1,006 | | |
| Other | | | 8,073 | | | | 14,634 | | |
| Total expenses | | | 318,424 | | | | 427,206 | | |
| Fees waived or expenses reimbursed by Investment Manager and its affiliates | | | (139,453 | ) | | | (161,666 | ) | |
| Total net expenses | | | 178,971 | | | | 265,540 | | |
| Net investment income | | | 590,005 | | | | 752,770 | | |
| Realized and unrealized gain (loss) — net | |
| Net realized gain (loss) on: | |
| Investments — unaffiliated issuers | | | 22,037 | | | | 4,811 | | |
| Investments — affiliated issuers | | | 698,133 | | | | 1,459,165 | | |
| Capital gain distributions from underlying affiliated funds | | | 64,636 | | | | 20,145 | | |
| Futures contracts | | | 17,004 | | | | — | | |
| Net realized gain | | | 801,810 | | | | 1,484,121 | | |
| Net change in unrealized appreciation (depreciation) on: | |
| Investments | | | (284,613 | ) | | | (384,859 | ) | |
| Net change in unrealized appreciation (depreciation) | | | (284,613 | ) | | | (384,859 | ) | |
| Net realized and unrealized gain (loss) | | | 517,197 | | | | 1,099,262 | | |
| Net change in net assets resulting from operations | | $ | 1,107,202 | | | $ | 1,852,032 | | |
(a) For the period from April 1, 2011 to January 31, 2012. During the period, the Fund's fiscal year end was changed from March 31 to January 31.
The Accompanying Notes to Financial Statements are an integral part of this statement.
39
Statement of Changes in Net Assets – Columbia LifeGoal Portfolios
| | | Columbia LifeGoal Growth Portfolio | |
| | | Year ended
January 31,
2012(a) | | Year ended
March 31,
2011(b) | | Year ended
March 31,
2010 | |
| Operations | |
| Net investment income | | $ | 4,169,952 | | | $ | 1,712,789 | | | $ | 849,551 | | |
| Net realized gain (loss) | | | 50,303,717 | | | | 3,920,664 | | | | (15,019,054 | ) | |
| Net change in unrealized appreciation (depreciation) | | | (94,655,707 | ) | | | 59,201,605 | | | | 158,467,291 | | |
| Net increase (decrease) in net assets resulting from operations | | | (40,182,038 | ) | | | 64,835,058 | | | | 144,297,788 | | |
| Distributions to shareholders from: | |
| Net investment income | |
| Class A | | | (2,173,604 | ) | | | (1,169,632 | ) | | | (354,759 | ) | |
| Class B | | | (177,537 | ) | | | (135,848 | ) | | | (72,537 | ) | |
| Class C | | | (176,339 | ) | | | (124,109 | ) | | | (49,902 | ) | |
| Class R | | | (8,385 | ) | | | (6,818 | ) | | | (2,306 | ) | |
| Class R4 | | | (1,115 | ) | | | (8 | ) | | | — | | |
| Class Z | | | (247,376 | ) | | | (398,565 | ) | | | (102,921 | ) | |
| Total distributions to shareholders | | | (2,784,356 | ) | | | (1,834,980 | ) | | | (582,425 | ) | |
| Increase (decrease) in net assets from share transactions | | | 403,972,483 | | | | (52,207,149 | ) | | | (22,899,343 | ) | |
| Proceeds from regulatory settlements (Note 6) | | | — | | | | — | | | | 7,713 | | |
| Total increase in net assets | | | 361,006,089 | | | | 10,792,929 | | | | 120,823,733 | | |
| Net assets at beginning of year | | | 402,624,230 | | | | 391,831,301 | | | | 271,007,568 | | |
| Net assets at end of year | | $ | 763,630,319 | | | $ | 402,624,230 | | | $ | 391,831,301 | | |
| Undistributed net investment income | | $ | 3,062,675 | | | $ | 180,416 | | | $ | 274,839 | | |
(a) For the period from April 1, 2011 to January 31, 2012. During the period, the Fund's fiscal year end was changed from March 31 to January 31.
(b) Class R4 shares are for the period from March 7, 2011 (commencement of operations) to March 31, 2011.
The Accompanying Notes to Financial Statements are an integral part of this statement.
40
Statement of Changes in Net Assets – Columbia LifeGoal Portfolios
| | | Columbia LifeGoal Balanced Growth Portfolio | |
| | | Year ended
January 31,
2012(a) | | Year ended
March 31,
2011(b) | | Year ended
March 31,
2010 | |
| Operations | |
| Net investment income | | $ | 13,402,329 | | | $ | 8,088,913 | | | $ | 11,354,374 | | |
| Net realized gain (loss) | | | 65,594,144 | | | | 34,013,224 | | | | (22,053,973 | ) | |
| Net change in unrealized appreciation (depreciation) | | | (116,910,856 | ) | | | 35,185,237 | | | | 191,543,831 | | |
| Net increase (decrease) in net assets resulting from operations | | | (37,914,383 | ) | | | 77,287,374 | | | | 180,844,232 | | |
| Distributions to shareholders from: | |
| Net investment income | |
| Class A | | | (8,763,127 | ) | | | (4,512,130 | ) | | | (5,327,779 | ) | |
| Class B | | | (713,220 | ) | | | (1,529,833 | ) | | | (3,029,203 | ) | |
| Class C | | | (652,539 | ) | | | (857,409 | ) | | | (1,330,248 | ) | |
| Class R | | | (35,925 | ) | | | (31,530 | ) | | | (37,238 | ) | |
| Class T | | | (1,332,779 | ) | | | (6 | ) | | | — | | |
| Class Z | | | (2,351,181 | ) | | | (1,130,790 | ) | | | (1,522,123 | ) | |
| Net realized gains | |
| Class A | | | (1,000,010 | ) | | | — | | | | — | | |
| Class B | | | (134,466 | ) | | | — | | | | — | | |
| Class C | | | (130,698 | ) | | | — | | | | — | | |
| Class R | | | (5,155 | ) | | | — | | | | — | | |
| Class T | | | (155,678 | ) | | | — | | | | — | | |
| Class Z | | | (223,444 | ) | | | — | | | | — | | |
| Total distributions to shareholders | | | (15,498,222 | ) | | | (8,061,698 | ) | | | (11,246,591 | ) | |
| Increase (decrease) in net assets from share transactions | | | 568,809,486 | | | | (74,373,436 | ) | | | (26,500,404 | ) | |
| Proceeds from regulatory settlements (Note 6) | | | 4,433 | | | | — | | | | — | | |
| Total increase (decrease) in net assets | | | 515,401,314 | | | | (5,147,760 | ) | | | 143,097,237 | | |
| Net assets at beginning of year | | | 575,408,404 | | | | 580,556,164 | | | | 437,458,927 | | |
| Net assets at end of year | | $ | 1,090,809,718 | | | $ | 575,408,404 | | | $ | 580,556,164 | | |
| Undistributed net investment income | | $ | 314,308 | | | $ | 328,801 | | | $ | 279,115 | | |
(a) For the period from April 1, 2011 to January 31, 2012. During the period, the Fund's fiscal year end was changed from March 31 to January 31.
(b) Class T shares are for the period from March 7, 2011 (commencement of operations) to March 31, 2011.
The Accompanying Notes to Financial Statements are an integral part of this statement.
41
Statement of Changes in Net Assets – Columbia LifeGoal Portfolios
| | | Columbia LifeGoal Income and Growth Portfolio | |
| | | Year ended
January 31,
2012(a) | | Year ended
March 31,
2011 | | Year ended
March 31,
2010 | |
| Operations | |
| Net investment income | | $ | 2,353,562 | | | $ | 3,097,506 | | | $ | 4,079,078 | | |
| Net realized gain (loss) | | | 6,982,936 | | | | 10,411,760 | | | | (1,712,275 | ) | |
| Net change in unrealized appreciation (depreciation) | | | (6,304,987 | ) | | | 518,350 | | | | 31,464,277 | | |
| Net increase in net assets resulting from operations | | | 3,031,511 | | | | 14,027,616 | | | | 33,831,080 | | |
| Distributions to shareholders from: | |
| Net investment income | |
| Class A | | | (1,287,509 | ) | | | (1,484,710 | ) | | | (1,774,246 | ) | |
| Class B | | | (245,328 | ) | | | (565,960 | ) | | | (1,045,055 | ) | |
| Class C | | | (323,481 | ) | | | (411,751 | ) | | | (542,321 | ) | |
| Class R | | | (13,383 | ) | | | (12,309 | ) | | | (14,094 | ) | |
| Class Z | | | (440,198 | ) | | | (582,134 | ) | | | (647,227 | ) | |
| Total distributions to shareholders | | | (2,309,899 | ) | | | (3,056,864 | ) | | | (4,022,943 | ) | |
| Decrease in net assets from share transactions | | | (7,172,876 | ) | | | (20,706,161 | ) | | | (4,264,005 | ) | |
| Total increase (decrease) in net assets | | | (6,451,264 | ) | | | (9,735,409 | ) | | | 25,544,132 | | |
| Net assets at beginning of year | | | 135,906,466 | | | | 145,641,875 | | | | 120,097,743 | | |
| Net assets at end of year | | $ | 129,455,202 | | | $ | 135,906,466 | | | $ | 145,641,875 | | |
| Undistributed net investment income | | $ | 240,169 | | | $ | 134,174 | | | $ | 74,079 | | |
(a) For the period from April 1, 2011 to January 31, 2012. During the period, the Fund's fiscal year end was changed from March 31 to January 31.
The Accompanying Notes to Financial Statements are an integral part of this statement.
42
Statement of Changes in Net Assets – Columbia LifeGoal Portfolios
| | | Columbia LifeGoal Income Portfolio | |
| | | Year ended
January 31,
2012(a) | | Year ended
March 31,
2011 | | Year ended
March 31,
2010 | |
| Operations | |
| Net investment income | | $ | 590,005 | | | $ | 752,770 | | | $ | 1,076,274 | | |
| Net realized gain (loss) | | | 801,810 | | | | 1,484,121 | | | | (514,103 | ) | |
| Net change in unrealized appreciation (depreciation) | | | (284,613 | ) | | | (384,859 | ) | | | 4,929,754 | | |
| Net increase in net assets resulting from operations | | | 1,107,202 | | | | 1,852,032 | | | | 5,491,925 | | |
| Distributions to shareholders from: | |
| Net investment income | |
| Class A | | | (384,069 | ) | | | (392,912 | ) | | | (500,449 | ) | |
| Class B | | | (82,017 | ) | | | (131,848 | ) | | | (224,860 | ) | |
| Class C | | | (113,159 | ) | | | (110,683 | ) | | | (164,769 | ) | |
| Class Z | | | (63,575 | ) | | | (110,974 | ) | | | (176,430 | ) | |
| Total distributions to shareholders | | | (642,820 | ) | | | (746,417 | ) | | | (1,066,508 | ) | |
| Decrease in net assets from share transactions | | | (802,053 | ) | | | (4,776,128 | ) | | | (2,232,566 | ) | |
| Total increase (decrease) in net assets | | | (337,671 | ) | | | (3,670,513 | ) | | | 2,192,851 | | |
| Net assets at beginning of year | | | 26,846,629 | | | | 30,517,142 | | | | 28,324,291 | | |
| Net assets at end of year | | $ | 26,508,958 | | | $ | 26,846,629 | | | $ | 30,517,142 | | |
| Undistributed (excess of distributions over) net investment income | | $ | (10,474 | ) | | $ | 34,279 | | | $ | 22,128 | | |
(a) For the period from April 1, 2011 to January 31, 2012. During the period, the Fund's fiscal year end was changed from March 31 to January 31.
The Accompanying Notes to Financial Statements are an integral part of this statement.
43
Statement of Changes in Net Assets – Columbia LifeGoal Portfolios
| | | Columbia LifeGoal Growth Portfolio | |
| | | Year ended
January 31, 2012(a) | | Year ended
March 31, 2011(b) | | Year ended
March 31, 2010 | |
| | | Shares | | Dollars ($) | | Shares | | Dollars ($) | | Shares | | Dollars ($) | |
| Capital stock activity | |
| Class A shares | |
| Subscriptions | | | 4,679,165 | | | | 53,694,808 | | | | 2,942,148 | | | | 32,004,906 | | | | 3,091,308 | | | | 27,588,415 | | |
| Fund merger | | | 33,362,333 | | | | 402,184,297 | | | | — | | | | — | | | | — | | | | — | | |
| Distributions reinvested | | | 161,873 | | | | 1,676,786 | | | | 60,451 | | | | 628,610 | | | | 43,067 | | | | 335,160 | | |
| Redemptions | | | (8,122,929 | ) | | | (91,558,649 | ) | | | (3,866,896 | ) | | | (41,412,779 | ) | | | (3,207,836 | ) | | | (29,248,812 | ) | |
| Net increase (decrease) | | | 30,080,442 | | | | 365,997,242 | | | | (864,297 | ) | | | (8,779,263 | ) | | | (73,461 | ) | | | (1,325,237 | ) | |
| Class B shares | |
| Subscriptions | | | 83,022 | | | | 864,754 | | | | 68,216 | | | | 691,508 | | | | 300,175 | | | | 2,294,384 | | |
| Fund merger | | | 4,532,209 | | | | 49,947,366 | | | | — | | | | — | | | | — | | | | — | | |
| Distributions reinvested | | | 10,592 | | | | 99,350 | | | | 5,672 | | | | 55,098 | | | | 9,589 | | | | 68,850 | | |
| Redemptions | | | (3,413,589 | ) | | | (36,069,046 | ) | | | (3,111,479 | ) | | | (30,764,657 | ) | | | (2,663,286 | ) | | | (21,979,706 | ) | |
| Net increase (decrease) | | | 1,212,234 | | | | 14,842,424 | | | | (3,037,591 | ) | | | (30,018,051 | ) | | | (2,353,522 | ) | | | (19,616,472 | ) | |
| Class C shares | |
| Subscriptions | | | 1,002,164 | | | | 10,205,133 | | | | 716,653 | | | | 7,079,074 | | | | 961,091 | | | | 7,928,734 | | |
| Fund merger | | | 2,788,845 | | | | 30,466,023 | | | | — | | | | — | | | | — | | | | — | | |
| Distributions reinvested | | | 11,800 | | | | 109,741 | | | | 6,456 | | | | 65,447 | | | | 5,627 | | | | 40,063 | | |
| Redemptions | | | (1,534,752 | ) | | | (15,728,714 | ) | | | (1,636,359 | ) | | | (15,900,649 | ) | | | (1,945,856 | ) | | | (15,923,996 | ) | |
| Net increase (decrease) | | | 2,268,057 | | | | 25,052,183 | | | | (913,250 | ) | | | (8,756,128 | ) | | | (979,138 | ) | | | (7,955,199 | ) | |
| Class R shares | |
| Subscriptions | | | 209,990 | | | | 2,494,421 | | | | 59,234 | | | | 614,043 | | | | 59,693 | | | | 489,491 | | |
| Distributions reinvested | | | 732 | | | | 7,452 | | | | 634 | | | | 6,814 | | | | 298 | | | | 2,306 | | |
| Redemptions | | | (59,051 | ) | | | (683,349 | ) | | | (94,211 | ) | | | (1,066,410 | ) | | | (30,267 | ) | | | (272,508 | ) | |
| Net increase (decrease) | | | 151,671 | | | | 1,818,524 | | | | (34,343 | ) | | | (445,553 | ) | | | 29,724 | | | | 219,289 | | |
| Class R4 shares | |
| Subscriptions | | | 265 | | | | 3,333 | | | | 204 | | | | 2,500 | | | | — | | | | — | | |
| Fund merger | | | 23,841 | | | | 292,223 | | | | — | | | | — | | | | — | | | | — | | |
| Distributions reinvested | | | 101 | | | | 1,066 | | | | — | | | | — | | | | — | | | | — | | |
| Redemptions | | | (717 | ) | | | (8,180 | ) | | | — | | | | — | | | | — | | | | — | | |
| Net increase | | | 23,490 | | | | 288,442 | | | | 204 | | | | 2,500 | | | | — | | | | — | | |
| Class Z shares | |
| Subscriptions | | | 692,051 | | | | 8,123,766 | | | | 1,269,960 | | | | 14,082,120 | | | | 1,752,025 | | | | 16,262,948 | | |
| Distributions reinvested | | | 5,507 | | | | 58,785 | | | | 8,249 | | | | 90,214 | | | | 7,159 | | | | 56,483 | | |
| Redemptions | | | (1,055,990 | ) | | | (12,208,883 | ) | | | (1,792,037 | ) | | | (18,382,988 | ) | | | (1,187,216 | ) | | | (10,541,155 | ) | |
| Net increase (decrease) | | | (358,432 | ) | | | (4,026,332 | ) | | | (513,828 | ) | | | (4,210,654 | ) | | | 571,968 | | | | 5,778,276 | | |
| Total net increase (decrease) | | | 33,377,462 | | | | 403,972,483 | | | | (5,363,105 | ) | | | (52,207,149 | ) | | | (2,804,429 | ) | | | (22,899,343 | ) | |
(a) For the period from April 1, 2011 to January 31, 2012. During the period, the Fund's fiscal year end was changed from March 31 to January 31.
(b) Class R4 shares are for the period from March 7, 2011 (commencement of operations) to March 31, 2011.
The Accompanying Notes to Financial Statements are an integral part of this statement.
44
Statement of Changes in Net Assets – Columbia LifeGoal Portfolios
| | | Columbia LifeGoal Balanced Growth Portfolio | |
| | | Year ended
January 31, 2012(a) | | Year ended
March 31, 2011(b) | | Year ended
March 31, 2010 | |
| | | Shares | | Dollars ($) | | Shares | | Dollars ($) | | Shares | | Dollars ($) | |
| Capital stock activity | |
| Class A shares | |
| Subscriptions | | | 5,912,598 | | | | 66,186,698 | | | | 6,541,121 | | | | 69,860,832 | | | | 4,803,386 | | | | 44,609,724 | | |
| Fund merger | | | 35,995,473 | | | | 429,174,661 | | | | — | | | | — | | | | — | | | | — | | |
| Distributions reinvested | | | 535,765 | | | | 5,802,182 | | | | 215,592 | | | | 2,209,949 | | | | 532,093 | | | | 4,997,088 | | |
| Redemptions | | | (8,647,077 | ) | | | (96,275,570 | ) | | | (5,615,106 | ) | | | (59,795,287 | ) | | | (4,546,857 | ) | | | (42,351,740 | ) | |
| Net increase | | | 33,796,759 | | | | 404,887,971 | | | | 1,141,607 | | | | 12,275,494 | | | | 788,622 | | | | 7,255,072 | | |
| Class B shares | |
| Subscriptions | | | 129,496 | | | | 1,427,206 | | | | 213,510 | | | | 2,293,757 | | | | 589,083 | | | | 5,178,715 | | |
| Fund merger | | | 761,031 | | | | 9,005,433 | | | | — | | | | — | | | | — | | | | — | | |
| Distributions reinvested | | | 18,923 | | | | 203,617 | | | | 72,300 | | | | 715,651 | | | | 310,682 | | | | 2,872,923 | | |
| Redemptions | | | (4,929,584 | ) | | | (54,849,016 | ) | | | (6,505,211 | ) | | | (68,380,032 | ) | | | (4,573,702 | ) | | | (41,976,618 | ) | |
| Net decrease | | | (4,020,134 | ) | | | (44,212,760 | ) | | | (6,219,401 | ) | | | (65,370,624 | ) | | | (3,673,937 | ) | | | (33,924,980 | ) | |
| Class C shares | |
| Subscriptions | | | 848,142 | | | | 9,606,164 | | | | 966,168 | | | | 10,322,022 | | | | 1,437,027 | | | | 13,435,382 | | |
| Fund merger | | | 584,952 | | | | 7,007,012 | | | | — | | | | — | | | | — | | | | — | | |
| Distributions reinvested | | | 31,621 | | | | 344,295 | | | | 43,487 | | | | 447,942 | | | | 115,164 | | | | 1,082,100 | | |
| Redemptions | | | (1,704,392 | ) | | | (18,964,791 | ) | | | (1,674,694 | ) | | | (17,771,209 | ) | | | (1,846,000 | ) | | | (17,014,082 | ) | |
| Net decrease | | | (239,677 | ) | | | (2,007,320 | ) | | | (665,039 | ) | | | (7,001,245 | ) | | | (293,809 | ) | | | (2,496,600 | ) | |
| Class R shares | |
| Subscriptions | | | 249,996 | | | | 2,804,879 | | | | 116,201 | | | | 1,182,795 | | | | 60,150 | | | | 539,862 | | |
| Distributions reinvested | | | 3,805 | | | | 41,080 | | | | 2,990 | | | | 31,530 | | | | 4,033 | | | | 37,237 | | |
| Redemptions | | | (38,358 | ) | | | (427,710 | ) | | | (158,727 | ) | | | (1,747,133 | ) | | | (121,078 | ) | | | (1,160,141 | ) | |
| Net increase (decrease) | | | 215,443 | | | | 2,418,249 | | | | (39,536 | ) | | | (532,808 | ) | | | (56,895 | ) | | | (583,042 | ) | |
| Class T shares | |
| Subscriptions | | | 24,511 | | | | 270,790 | | | | 218 | | | | 2,500 | | | | — | | | | — | | |
| Fund merger | | | 9,782,229 | | | | 116,583,107 | | | | — | | | | — | | | | — | | | | — | | |
| Distributions reinvested | | | 102,021 | | | | 1,104,992 | | | | — | | | | — | | | | — | | | | — | | |
| Redemptions | | | (798,843 | ) | | | (8,887,325 | ) | | | — | | | | — | | | | — | | | | — | | |
| Net increase | | | 9,109,918 | | | | 109,071,564 | | | | 218 | | | | 2,500 | | | | — | | | | — | | |
| Class Z shares | |
| Subscriptions | | | 1,278,833 | | | | 14,425,281 | | | | 1,292,743 | | | | 13,769,633 | | | | 1,506,119 | | | | 13,977,974 | | |
| Fund merger | | | 10,650,993 | | | | 126,822,052 | | | | — | | | | — | | | | — | | | | — | | |
| Distributions reinvested | | | 103,756 | | | | 1,121,594 | | | | 40,312 | | | | 424,948 | | | | 114,054 | | | | 1,061,854 | | |
| Redemptions | | | (3,923,537 | ) | | | (43,717,145 | ) | | | (2,794,570 | ) | | | (27,941,334 | ) | | | (1,268,234 | ) | | | (11,790,682 | ) | |
| Net increase (decrease) | | | 8,110,045 | | | | 98,651,782 | | | | (1,461,515 | ) | | | (13,746,753 | ) | | | 351,939 | | | | 3,249,146 | | |
| Total net increase (decrease) | | | 46,972,354 | | | | 568,809,486 | | | | (7,243,666 | ) | | | (74,373,436 | ) | | | (2,884,080 | ) | | | (26,500,404 | ) | |
(a) For the period from April 1, 2011 to January 31, 2012. During the period, the Fund's fiscal year end was changed from March 31 to January 31.
(b) Class T shares are for the period from March 7, 2011 (commencement of operations) to March 31, 2011.
The Accompanying Notes to Financial Statements are an integral part of this statement.
45
Statement of Changes in Net Assets – Columbia LifeGoal Portfolios
| | | Columbia LifeGoal Income and Growth Portfolio | |
| | | Year ended
January 31, 2012(a) | | Year ended
March 31, 2011 | | Year ended
March 31, 2010 | |
| | | Shares | | Dollars ($) | | Shares | | Dollars ($) | | Shares | | Dollars ($) | |
| Capital stock activity | |
| Class A shares | |
| Subscriptions | | | 1,554,698 | | | | 16,759,129 | | | | 1,770,333 | | | | 18,308,738 | | | | 1,792,223 | | | | 16,683,536 | | |
| Distributions reinvested | | | 42,979 | | | | 455,165 | | | | 70,168 | | | | 713,359 | | | | 159,758 | | | | 1,519,412 | | |
| Redemptions | | | (1,210,036 | ) | | | (13,006,625 | ) | | | (2,041,585 | ) | | | (20,875,315 | ) | | | (1,470,993 | ) | | | (13,754,411 | ) | |
| Net increase (decrease) | | | 387,641 | | | | 4,207,669 | | | | (201,084 | ) | | | (1,853,218 | ) | | | 480,988 | | | | 4,448,537 | | |
| Class B shares | |
| Subscriptions | | | 89,180 | | | | 950,952 | | | | 102,115 | | | | 1,035,407 | | | | 209,608 | | | | 1,919,007 | | |
| Distributions reinvested | | | 4,555 | | | | 48,153 | | | | 25,558 | | | | 254,142 | | | | 101,019 | | | | 952,550 | | |
| Redemptions | | | (1,169,734 | ) | | | (12,578,086 | ) | | | (1,763,643 | ) | | | (18,113,872 | ) | | | (1,290,520 | ) | | | (12,149,208 | ) | |
| Net decrease | | | (1,075,999 | ) | | | (11,578,981 | ) | | | (1,635,970 | ) | | | (16,824,323 | ) | | | (979,893 | ) | | | (9,277,651 | ) | |
| Class C shares | |
| Subscriptions | | | 448,336 | | | | 4,773,031 | | | | 344,262 | | | | 3,500,601 | | | | 555,399 | | | | 5,176,368 | | |
| Distributions reinvested | | | 13,879 | | | | 145,532 | | | | 21,010 | | | | 211,334 | | | | 47,502 | | | | 445,991 | | |
| Redemptions | | | (427,640 | ) | | | (4,557,514 | ) | | | (517,115 | ) | | | (5,270,481 | ) | | | (565,216 | ) | | | (5,289,047 | ) | |
| Net increase (decrease) | | | 34,575 | | | | 361,049 | | | | (151,843 | ) | | | (1,558,546 | ) | | | 37,685 | | | | 333,312 | | |
| Class R shares | |
| Subscriptions | | | 71,112 | | | | 765,094 | | | | 24,212 | | | | 251,076 | | | | 24,710 | | | | 228,170 | | |
| Distributions reinvested | | | 1,242 | | | | 13,182 | | | | 1,199 | | | | 12,309 | | | | 1,484 | | | | 14,094 | | |
| Redemptions | | | (11,128 | ) | | | (121,119 | ) | | | (41,743 | ) | | | (439,144 | ) | | | (15,095 | ) | | | (140,807 | ) | |
| Net increase (decrease) | | | 61,226 | | | | 657,157 | | | | (16,332 | ) | | | (175,759 | ) | | | 11,099 | | | | 101,457 | | |
| Class Z shares | |
| Subscriptions | | | 312,750 | | | | 3,346,709 | | | | 632,691 | | | | 6,396,894 | | | | 579,483 | | | | 5,364,435 | | |
| Distributions reinvested | | | 17,365 | | | | 182,189 | | | | 24,952 | | | | 254,906 | | | | 43,544 | | | | 408,286 | | |
| Redemptions | | | (405,484 | ) | | | (4,348,668 | ) | | | (684,476 | ) | | | (6,946,115 | ) | | | (615,771 | ) | | | (5,642,381 | ) | |
| Net increase (decrease) | | | (75,369 | ) | | | (819,770 | ) | | | (26,833 | ) | | | (294,315 | ) | | | 7,256 | | | | 130,340 | | |
| Total net decrease | | | (667,926 | ) | | | (7,172,876 | ) | | | (2,032,062 | ) | | | (20,706,161 | ) | | | (442,865 | ) | | | (4,264,005 | ) | |
(a) For the period from April 1, 2011 to January 31, 2012. During the period, the Fund's fiscal year end was changed from March 31 to January 31.
The Accompanying Notes to Financial Statements are an integral part of this statement.
46
Statement of Changes in Net Assets – Columbia LifeGoal Portfolios
| | | Columbia LifeGoal Income Portfolio | |
| | | Year ended
January 31, 2012(a) | | Year ended
March 31, 2011 | | Year ended
March 31, 2010 | |
| | | Shares | | Dollars ($) | | Shares | | Dollars ($) | | Shares | | Dollars ($) | |
| Capital stock activity | |
| Class A shares | |
| Subscriptions | | | 452,484 | | | | 4,687,854 | | | | 371,656 | | | | 3,740,809 | | | | 414,030 | | | | 3,845,408 | | |
| Distributions reinvested | | | 18,917 | | | | 195,877 | | | | 24,375 | | | | 243,966 | | | | 44,786 | | | | 422,811 | | |
| Redemptions | | | (253,477 | ) | | | (2,632,181 | ) | | | (465,982 | ) | | | (4,705,202 | ) | | | (422,314 | ) | | | (4,050,740 | ) | |
| Net increase (decrease) | | | 217,924 | | | | 2,251,550 | | | | (69,951 | ) | | | (720,427 | ) | | | 36,502 | | | | 217,479 | | |
| Class B shares | |
| Subscriptions | | | 23,131 | | | | 238,641 | | | | 32,959 | | | | 327,934 | | | | 81,196 | | | | 758,008 | | |
| Distributions reinvested | | | 2,123 | | | | 21,964 | | | | 6,838 | | | | 68,016 | | | | 20,424 | | | | 192,117 | | |
| Redemptions | | | (277,747 | ) | | | (2,873,945 | ) | | | (246,160 | ) | | | (2,471,808 | ) | | | (257,918 | ) | | | (2,441,151 | ) | |
| Net decrease | | | (252,493 | ) | | | (2,613,340 | ) | | | (206,363 | ) | | | (2,075,858 | ) | | | (156,298 | ) | | | (1,491,026 | ) | |
| Class C shares | |
| Subscriptions | | | 129,828 | | | | 1,342,556 | | | | 148,916 | | | | 1,491,426 | | | | 126,587 | | | | 1,191,173 | | |
| Distributions reinvested | | | 5,302 | | | | 54,730 | | | | 6,200 | | | | 61,918 | | | | 14,092 | | | | 132,492 | | |
| Redemptions | | | (118,508 | ) | | | (1,223,947 | ) | | | (204,206 | ) | | | (2,043,283 | ) | | | (173,176 | ) | | | (1,638,681 | ) | |
| Net increase (decrease) | | | 16,622 | | | | 173,339 | | | | (49,090 | ) | | | (489,939 | ) | | | (32,497 | ) | | | (315,016 | ) | |
| Class Z shares | |
| Subscriptions | | | 121,024 | | | | 1,261,821 | | | | 278,353 | | | | 2,786,284 | | | | 204,365 | | | | 1,949,223 | | |
| Distributions reinvested | | | 2,321 | | | | 24,036 | | | | 3,017 | | | | 30,252 | | | | 11,166 | | | | 105,281 | | |
| Redemptions | | | (183,451 | ) | | | (1,899,459 | ) | | | (432,823 | ) | | | (4,306,440 | ) | | | (285,245 | ) | | | (2,698,507 | ) | |
| Net decrease | | | (60,106 | ) | | | (613,602 | ) | | | (151,453 | ) | | | (1,489,904 | ) | | | (69,714 | ) | | | (644,003 | ) | |
| Total net decrease | | | (78,053 | ) | | | (802,053 | ) | | | (476,857 | ) | | | (4,776,128 | ) | | | (222,007 | ) | | | (2,232,566 | ) | |
(a) For the period from April 1, 2011 to January 31, 2012. During the period, the Fund's fiscal year end was changed from March 31 to January 31.
The Accompanying Notes to Financial Statements are an integral part of this statement.
47
Financial Highlights – Columbia LifeGoal Growth Portfolio
The following tables are intended to help you understand the Portfolio's financial performance. Certain information reflects financial results for a single share of a class held for the periods shown. Per share net investment income (loss) amounts are calculated based on average shares outstanding during the period. Total returns assume reinvestment of all dividends and distributions. Total returns do not reflect payment of sales charges, if any, and are not annualized for periods of less than one year.
| | | Year ended
Jan. 31, | | Year ended March 31, | |
| | | 2012(a) | | 2011 | | 2010 | | 2009 | | 2008 | | 2007 | |
| Class A | |
| Per share data | |
| Net asset value, beginning of period | | $ | 12.25 | | | $ | 10.33 | | | $ | 6.68 | | | $ | 13.24 | | | $ | 14.69 | | | $ | 13.92 | | |
| Income from investment operations: | |
| Net investment income | | | 0.09 | | | | 0.08 | | | | 0.05 | | | | 0.06 | | | | 0.05 | | | | 0.07 | | |
| Net realized and unrealized gain (loss) | | | (0.71 | ) | | | 1.91 | | | | 3.62 | | | | (4.12 | ) | | | (0.59 | ) | | | 1.38 | | |
| Total from investment operations | | | (0.62 | ) | | | 1.99 | | | | 3.67 | | | | (4.06 | ) | | | (0.54 | ) | | | 1.45 | | |
| Less distributions to shareholders from: | |
| Net investment income | | | (0.04 | ) | | | (0.07 | ) | | | (0.02 | ) | | | (0.03 | ) | | | (0.05 | ) | | | (0.05 | ) | |
| Net realized gains | | | — | | | | — | | | | — | | | | (2.46 | ) | | | (0.86 | ) | | | (0.63 | ) | |
| Tax return of capital | | | — | | | | — | | | | — | | | | (0.01 | ) | | | — | | | | — | | |
| Total distributions to shareholders | | | (0.04 | ) | | | (0.07 | ) | | | (0.02 | ) | | | (2.50 | ) | | | (0.91 | ) | | | (0.68 | ) | |
| Proceeds from regulatory settlement | | | — | | | | — | | | | 0.00 | (b) | | | — | | | | — | | | | — | | |
| Net asset value, end of period | | $ | 11.59 | | | $ | 12.25 | | | $ | 10.33 | | | $ | 6.68 | | | $ | 13.24 | | | $ | 14.69 | | |
| Total return | | | (4.98 | %) | | | 19.35 | % | | | 55.04 | % | | | (37.62 | %) | | | (4.31 | %) | | | 10.74 | % | |
| Ratios to average net assets(c) | |
| Expenses prior to fees waived or expenses reimbursed | | | 0.52 | %(d) | | | 0.51 | % | | | 0.50 | % | | | 0.50 | % | | | 0.50 | % | | | 0.50 | % | |
| Net expenses after fees waived or expenses reimbursed(e) | | | 0.45 | %(d)(f) | | | 0.51 | % | | | 0.50 | % | | | 0.50 | %(f) | | | 0.50 | %(f) | | | 0.50 | % | |
| Net investment income | | | 0.93 | %(d)(f) | | | 0.72 | % | | | 0.54 | % | | | 0.68 | %(f) | | | 0.31 | %(f) | | | 0.31 | % | |
| Supplemental data | |
| Net assets, end of period (in thousands) | | $ | 539,370 | | | $ | 201,437 | | | $ | 178,769 | | | $ | 116,169 | | | $ | 210,861 | | | $ | 206,715 | | |
| Portfolio turnover | | | 86 | % | | | 36 | % | | | 19 | % | | | 45 | % | | | 21 | % | | | 8 | % | |
Notes to Financial Highlights
(a) For the period from April 1, 2011 to January 31, 2012. During the period, the Fund's fiscal year end was changed from March 31 to January 31.
(b) Rounds to less than $0.01.
(c) In addition to the fees and expenses which the Fund bears directly, the Fund indirectly bears a pro rata share of the fees and expenses of the underlying funds in which the Fund invests. Such indirect expenses are not included in the reported expense ratios.
(d) Annualized.
(e) The Investment Manager and certain of its affiliates agreed to waive/reimburse certain fees and expenses, if applicable.
(f) The benefits derived from expense reductions had an impact of less than 0.01%.
The Accompanying Notes to Financial Statements are an integral part of this statement.
48
Financial Highlights (continued) – Columbia LifeGoal Growth Portfolio
| | | Year ended
Jan. 31, | | Year ended March 31, | |
| | | 2012(a) | | 2011 | | 2010 | | 2009 | | 2008 | | 2007 | |
| Class B | |
| Per share data | |
| Net asset value, beginning of period | | $ | 11.21 | | | $ | 9.48 | | | $ | 6.17 | | | $ | 12.46 | | | $ | 13.93 | | | $ | 13.28 | | |
| Income from investment operations: | |
| Net investment income (loss) | | | 0.00 | (b) | | | 0.00 | (b) | | | (0.02 | ) | | | (0.01 | ) | | | (0.06 | ) | | | (0.04 | ) | |
| Net realized and unrealized gain (loss) | | | (0.63 | ) | | | 1.75 | | | | 3.34 | | | | (3.80 | ) | | | (0.55 | ) | | | 1.32 | | |
| Total from investment operations | | | (0.63 | ) | | | 1.75 | | | | 3.32 | | | | (3.81 | ) | | | (0.61 | ) | | | 1.28 | | |
| Less distributions to shareholders from: | |
| Net investment income | | | (0.02 | ) | | | (0.02 | ) | | | (0.01 | ) | | | (0.01 | ) | | | — | | | | — | | |
| Net realized gains | | | — | | | | — | | | | — | | | | (2.46 | ) | | | (0.86 | ) | | | (0.63 | ) | |
| Tax return of capital | | | — | | | | — | | | | — | | | | (0.01 | ) | | | — | | | | — | | |
| Total distributions to shareholders | | | (0.02 | ) | | | (0.02 | ) | | | (0.01 | ) | | | (2.48 | ) | | | (0.86 | ) | | | (0.63 | ) | |
| Proceeds from regulatory settlement | | | — | | | | — | | | | 0.00 | (b) | | | — | | | | — | | | | — | | |
| Net asset value, end of period | | $ | 10.56 | | | $ | 11.21 | | | $ | 9.48 | | | $ | 6.17 | | | $ | 12.46 | | | $ | 13.93 | | |
| Total return | | | (5.60 | %) | | | 18.46 | % | | | 53.78 | % | | | (37.99 | %) | | | (5.08 | %) | | | 9.90 | % | |
| Ratios to average net assets(c) | |
| Expenses prior to fees waived or expenses reimbursed | | | 1.27 | %(d) | | | 1.26 | % | | | 1.25 | % | | | 1.25 | % | | | 1.25 | % | | | 1.25 | % | |
| Net expenses after fees waived or expenses reimbursed(e) | | | 1.20 | %(d)(f) | | | 1.26 | % | | | 1.25 | % | | | 1.25 | %(f) | | | 1.25 | %(f) | | | 1.25 | % | |
| Net investment income (loss) | | | 0.06 | %(d)(f) | | | (0.05 | %) | | | (0.21 | %) | | | (0.09 | %)(f) | | | (0.46 | %)(f) | | | (0.45 | %) | |
| Supplemental data | |
| Net assets, end of period (in thousands) | | $ | 82,941 | | | $ | 74,403 | | | $ | 91,699 | | | $ | 74,197 | | | $ | 150,705 | | | $ | 170,971 | | |
| Portfolio turnover | | | 86 | % | | | 36 | % | | | 19 | % | | | 45 | % | | | 21 | % | | | 8 | % | |
Notes to Financial Highlights
(a) For the period from April 1, 2011 to January 31, 2012. During the period, the Fund's fiscal year end was changed from March 31 to January 31.
(b) Rounds to less than $0.01.
(c) In addition to the fees and expenses which the Fund bears directly, the Fund indirectly bears a pro rata share of the fees and expenses of the underlying funds in which the Fund invests. Such indirect expenses are not included in the reported expense ratios.
(d) Annualized.
(e) The Investment Manager and certain of its affiliates agreed to waive/reimburse certain fees and expenses, if applicable.
(f) The benefits derived from expense reductions had an impact of less than 0.01%.
The Accompanying Notes to Financial Statements are an integral part of this statement.
49
Financial Highlights (continued) – Columbia LifeGoal Growth Portfolio
| | | Year ended
Jan. 31, | | Year ended March 31, | |
| | | 2012(a) | | 2011 | | 2010 | | 2009 | | 2008 | | 2007 | |
| Class C | |
| Per share data | |
| Net asset value, beginning of period | | $ | 11.11 | | | $ | 9.40 | | | $ | 6.12 | | | $ | 12.38 | | | $ | 13.85 | | | $ | 13.20 | | |
| Income from investment operations: | |
| Net investment income (loss) | | | 0.00 | (b) | | | (0.00 | )(b) | | | (0.02 | ) | | | (0.01 | ) | | | (0.06 | ) | | | (0.04 | ) | |
| Net realized and unrealized gain (loss) | | | (0.62 | ) | | | 1.73 | | | | 3.31 | | | | (3.77 | ) | | | (0.55 | ) | | | 1.32 | | |
| Total from investment operations | | | (0.62 | ) | | | 1.73 | | | | 3.29 | | | | (3.78 | ) | | | (0.61 | ) | | | 1.28 | | |
| Less distributions to shareholders from: | |
| Net investment income | | | (0.02 | ) | | | (0.02 | ) | | | (0.01 | ) | | | (0.01 | ) | | | — | | | | — | | |
| Net realized gains | | | — | | | | — | | | | — | | | | (2.46 | ) | | | (0.86 | ) | | | (0.63 | ) | |
| Tax return of capital | | | — | | | | — | | | | — | | | | (0.01 | ) | | | — | | | | — | | |
| Total distributions to shareholders | | | (0.02 | ) | | | (0.02 | ) | | | (0.01 | ) | | | (2.48 | ) | | | (0.86 | ) | | | (0.63 | ) | |
| Proceeds from regulatory settlement | | | — | | | | — | | | | 0.00 | (b) | | | — | | | | — | | | | — | | |
| Net asset value, end of period | | $ | 10.47 | | | $ | 11.11 | | | $ | 9.40 | | | $ | 6.12 | | | $ | 12.38 | | | $ | 13.85 | | |
| Total return | | | (5.56 | %) | | | 18.41 | % | | | 53.73 | % | | | (37.99 | %) | | | (5.11 | %) | | | 9.97 | % | |
| Ratios to average net assets(c) | |
| Expenses prior to fees waived or expenses reimbursed | | | 1.27 | %(d) | | | 1.26 | % | | | 1.25 | % | | | 1.25 | % | | | 1.25 | % | | | 1.25 | % | |
| Net expenses after fees waived or expenses reimbursed(e) | | | 1.20 | %(d)(f) | | | 1.26 | % | | | 1.25 | % | | | 1.25 | %(f) | | | 1.25 | %(f) | | | 1.25 | % | |
| Net investment income (loss) | | | 0.06 | %(d)(f) | | | (0.04 | %) | | | (0.21 | %) | | | (0.09 | %)(f) | | | (0.41 | %)(f) | | | (0.43 | %) | |
| Supplemental data | |
| Net assets, end of period (in thousands) | | $ | 90,148 | | | $ | 70,437 | | | $ | 68,150 | | | $ | 50,343 | | | $ | 98,889 | | | $ | 96,558 | | |
| Portfolio turnover | | | 86 | % | | | 36 | % | | | 19 | % | | | 45 | % | | | 21 | % | | | 8 | % | |
Notes to Financial Highlights
(a) For the period from April 1, 2011 to January 31, 2012. During the period, the Fund's fiscal year end was changed from March 31 to January 31.
(b) Rounds to less than $0.01.
(c) In addition to the fees and expenses which the Fund bears directly, the Fund indirectly bears a pro rata share of the fees and expenses of the underlying funds in which the Fund invests. Such indirect expenses are not included in the reported expense ratios.
(d) Annualized.
(e) The Investment Manager and certain of its affiliates agreed to waive/reimburse certain fees and expenses, if applicable.
(f) The benefits derived from expense reductions had an impact of less than 0.01%.
The Accompanying Notes to Financial Statements are an integral part of this statement.
50
Financial Highlights (continued) – Columbia LifeGoal Growth Portfolio
| | | Year ended
Jan. 31, | | Year ended March 31, | |
| | | 2012(a) | | 2011 | | 2010 | | 2009 | | 2008 | | 2007 | |
| Class R | |
| Per share data | |
| Net asset value, beginning of period | | $ | 12.14 | | | $ | 10.25 | | | $ | 6.64 | | | $ | 13.19 | | | $ | 14.67 | | | $ | 13.92 | | |
| Income from investment operations: | |
| Net investment income | | | 0.05 | | | | 0.06 | | | | 0.03 | | | | 0.04 | | | | 0.02 | | | | 0.14 | | |
| Net realized and unrealized gain (loss) | | | (0.68 | ) | | | 1.88 | | | | 3.60 | | | | (4.10 | ) | | | (0.60 | ) | | | 1.27 | | |
| Total from investment operations | | | (0.63 | ) | | | 1.94 | | | | 3.63 | | | | (4.06 | ) | | | (0.58 | ) | | | 1.41 | | |
| Less distributions to shareholders from: | |
| Net investment income | | | (0.03 | ) | | | (0.05 | ) | | | (0.02 | ) | | | (0.02 | ) | | | (0.04 | ) | | | (0.03 | ) | |
| Net realized gains | | | — | | | | — | | | | — | | | | (2.46 | ) | | | (0.86 | ) | | | (0.63 | ) | |
| Tax return of capital | | | — | | | | — | | | | — | | | | (0.01 | ) | | | — | | | | — | | |
| Total distributions to shareholders | | | (0.03 | ) | | | (0.05 | ) | | | (0.02 | ) | | | (2.49 | ) | | | (0.90 | ) | | | (0.66 | ) | |
| Proceeds from regulatory settlement | | | — | | | | — | | | | 0.00 | (b) | | | — | | | | — | | | | — | | |
| Net asset value, end of period | | $ | 11.48 | | | $ | 12.14 | | | $ | 10.25 | | | $ | 6.64 | | | $ | 13.19 | | | $ | 14.67 | | |
| Total return | | | (5.12 | %) | | | 18.99 | % | | | 54.68 | % | | | (37.76 | %) | | | (4.65 | %) | | | 10.45 | % | |
| Ratios to average net assets(c) | |
| Expenses prior to fees waived or expenses reimbursed | | | 0.77 | %(d) | | | 0.76 | % | | | 0.75 | % | | | 0.75 | % | | | 0.75 | % | | | 0.75 | % | |
| Net expenses after fees waived or expenses reimbursed(e) | | | 0.70 | %(d)(f) | | | 0.76 | % | | | 0.75 | % | | | 0.75 | %(f) | | | 0.75 | %(f) | | | 0.75 | % | |
| Net investment income | | | 0.54 | %(d)(f) | | | 0.54 | % | | | 0.29 | % | | | 0.45 | %(f) | | | 0.12 | %(f) | | | 0.76 | % | |
| Supplemental data | |
| Net assets, end of period (in thousands) | | $ | 3,124 | | | $ | 1,463 | | | $ | 1,586 | | | $ | 831 | | | $ | 1,206 | | | $ | 1,169 | | |
| Portfolio turnover | | | 86 | % | | | 36 | % | | | 19 | % | | | 45 | % | | | 21 | % | | | 8 | % | |
Notes to Financial Highlights
(a) For the period from April 1, 2011 to January 31, 2012. During the period, the Fund's fiscal year end was changed from March 31 to January 31.
(b) Rounds to less than $0.01.
(c) In addition to the fees and expenses which the Fund bears directly, the Fund indirectly bears a pro rata share of the fees and expenses of the underlying funds in which the Fund invests. Such indirect expenses are not included in the reported expense ratios.
(d) Annualized.
(e) The Investment Manager and certain of its affiliates agreed to waive/reimburse certain fees and expenses, if applicable.
(f) The benefits derived from expense reductions had an impact of less than 0.01%.
The Accompanying Notes to Financial Statements are an integral part of this statement.
51
Financial Highlights (continued) – Columbia LifeGoal Growth Portfolio
| | | Year ended
Jan. 31,
2012(a) | | Year ended
March 31,
2011(b) | |
| Class R4 | |
| Per share data | |
| Net asset value, beginning of period | | $ | 12.45 | | | $ | 12.27 | | |
| Income from investment operations: | |
| Net investment income | | | 0.11 | | | | 0.01 | | |
| Net realized and unrealized gain (loss) | | | (0.72 | ) | | | 0.21 | | |
| Total from investment operations | | | (0.61 | ) | | | 0.22 | | |
| Less distributions to shareholders from: | |
| Net investment income | | | (0.05 | ) | | | (0.04 | ) | |
| Total distributions to shareholders | | | (0.05 | ) | | | (0.04 | ) | |
| Net asset value, end of period | | $ | 11.79 | | | $ | 12.45 | | |
| Total return | | | (4.88 | %) | | | 1.77 | % | |
| Ratios to average net assets(c) | |
| Expenses prior to fees waived or expenses reimbursed | | | 0.37 | %(d) | | | 0.51 | %(d) | |
| Net expenses after fees waived or expenses reimbursed(e) | | | 0.37 | %(d) | | | 0.51 | %(d) | |
| Net investment income | | | 1.15 | %(d) | | | 0.68 | %(d) | |
| Supplemental data | |
| Net assets, end of period (in thousands) | | $ | 279 | | | $ | 3 | | |
| Portfolio turnover | | | 86 | % | | | 36 | % | |
Notes to Financial Highlights
(a) For the period from April 1, 2011 to January 31, 2012. During the period, the Fund's fiscal year end was changed from March 31 to January 31.
(b) For the period from March 7, 2011 (commencement of operations) to March 31, 2011.
(c) In addition to the fees and expenses which the Fund bears directly, the Fund indirectly bears a pro rata share of the fees and expenses of the underlying funds in which the Fund invests. Such indirect expenses are not included in the reported expense ratios.
(d) Annualized.
(e) The Investment Manager and certain of its affiliates agreed to waive/reimburse certain fees and expenses, if applicable.
The Accompanying Notes to Financial Statements are an integral part of this statement.
52
Financial Highlights (continued) – Columbia LifeGoal Growth Portfolio
| | | Year ended
Jan. 31, | | Year ended March 31, | |
| | | 2012(a) | | 2011 | | 2010 | | 2009 | | 2008 | | 2007 | |
| Class Z | |
| Per share data | |
| Net asset value, beginning of period | | $ | 12.45 | | | $ | 10.49 | | | $ | 6.78 | | | $ | 13.37 | | | $ | 14.80 | | | $ | 14.01 | | |
| Income from investment operations: | |
| Net investment income | | | 0.09 | | | | 0.11 | | | | 0.07 | | | | 0.09 | | | | 0.16 | | | | 0.10 | | |
| Net realized and unrealized gain (loss) | | | (0.68 | ) | | | 1.94 | | | | 3.66 | | | | (4.17 | ) | | | (0.66 | ) | | | 1.40 | | |
| Total from investment operations | | | (0.59 | ) | | | 2.05 | | | | 3.73 | | | | (4.08 | ) | | | (0.50 | ) | | | 1.50 | | |
| Less distributions to shareholders from: | |
| Net investment income | | | (0.06 | ) | | | (0.09 | ) | | | (0.02 | ) | | | (0.04 | ) | | | (0.07 | ) | | | (0.08 | ) | |
| Net realized gains | | | — | | | | — | | | | — | | | | (2.46 | ) | | | (0.86 | ) | | | (0.63 | ) | |
| Tax return of capital | | | — | | | | — | | | | — | | | | (0.01 | ) | | | — | | | | — | | |
| Total distributions to shareholders | | | (0.06 | ) | | | (0.09 | ) | | | (0.02 | ) | | | (2.51 | ) | | | (0.93 | ) | | | (0.71 | ) | |
| Proceeds from regulatory settlement | | | — | | | | — | | | | 0.00 | (b) | | | — | | | | — | | | | — | | |
| Net asset value, end of period | | $ | 11.80 | | | $ | 12.45 | | | $ | 10.49 | | | $ | 6.78 | | | $ | 13.37 | | | $ | 14.80 | | |
| Total return | | | (4.71 | %) | | | 19.64 | % | | | 55.20 | % | | | (37.38 | %) | | | (4.02 | %) | | | 11.01 | % | |
| Ratios to average net assets(c) | |
| Expenses prior to fees waived or expenses reimbursed | | | 0.26 | %(d) | | | 0.26 | % | | | 0.25 | % | | | 0.25 | % | | | 0.25 | % | | | 0.25 | % | |
| Net expenses after fees waived or expenses reimbursed(e) | | | 0.20 | %(d)(f) | | | 0.26 | % | | | 0.25 | % | | | 0.25 | %(f) | | | 0.25 | %(f) | | | 0.25 | % | |
| Net investment income | | | 0.96 | %(d)(f) | | | 0.97 | % | | | 0.78 | % | | | 0.90 | %(f) | | | 1.07 | %(f) | | | 0.55 | % | |
| Supplemental data | |
| Net assets, end of period (in thousands) | | $ | 47,768 | | | $ | 54,882 | | | $ | 51,627 | | | $ | 29,467 | | | $ | 55,202 | | | $ | 252,536 | | |
| Portfolio turnover | | | 86 | % | | | 36 | % | | | 19 | % | | | 45 | % | | | 21 | % | | | 8 | % | |
Notes to Financial Highlights
(a) For the period from April 1, 2011 to January 31, 2012. During the period, the Fund's fiscal year end was changed from March 31 to January 31.
(b) Rounds to less than $0.01.
(c) In addition to the fees and expenses which the Fund bears directly, the Fund indirectly bears a pro rata share of the fees and expenses of the underlying funds in which the Fund invests. Such indirect expenses are not included in the reported expense ratios.
(d) Annualized.
(e) The Investment Manager and certain of its affiliates agreed to waive/reimburse certain fees and expenses, if applicable.
(f) The benefits derived from expense reductions had an impact of less than 0.01%.
The Accompanying Notes to Financial Statements are an integral part of this statement.
53
Financial Highlights – Columbia LifeGoal Balanced Growth Portfolio
| | | Year ended
Jan. 31, | | Year ended March 31, | |
| | | 2012(a) | | 2011 | | 2010 | | 2009 | | 2008 | | 2007 | |
| Class A | |
| Per share data | |
| Net asset value, beginning of period | | $ | 11.61 | | | $ | 10.23 | | | $ | 7.33 | | | $ | 11.36 | | | $ | 12.38 | | | $ | 11.86 | | |
| Income from investment operations: | |
| Net investment income | | | 0.15 | | | | 0.19 | | | | 0.23 | | | | 0.22 | | | | 0.25 | | | | 0.26 | | |
| Net realized and unrealized gain (loss) | | | (0.30 | ) | | | 1.37 | | | | 2.89 | | | | (2.91 | ) | | | (0.45 | ) | | | 0.88 | | |
| Total from investment operations | | | (0.15 | ) | | | 1.56 | | | | 3.12 | | | | (2.69 | ) | | | (0.20 | ) | | | 1.14 | | |
| Less distributions to shareholders from: | |
| Net investment income | | | (0.14 | ) | | | (0.18 | ) | | | (0.22 | ) | | | (0.22 | ) | | | (0.25 | ) | | | (0.26 | ) | |
| Net realized gains | | | (0.02 | ) | | | — | | | | — | | | | (1.12 | ) | | | (0.57 | ) | | | (0.36 | ) | |
| Total distributions to shareholders | | | (0.16 | ) | | | (0.18 | ) | | | (0.22 | ) | | | (1.34 | ) | | | (0.82 | ) | | | (0.62 | ) | |
| Proceeds from regulatory settlement | | | 0.00 | (b) | | | — | | | | — | | | | — | | | | — | | | | — | | |
| Net asset value, end of period | | $ | 11.30 | | | $ | 11.61 | | | $ | 10.23 | | | $ | 7.33 | | | $ | 11.36 | | | $ | 12.38 | | |
| Total return | | | (1.20 | %) | | | 15.48 | % | | | 42.94 | % | | | (26.48 | %) | | | (1.99 | %) | | | 9.95 | % | |
| Ratios to average net assets(c) | |
Expenses prior to fees waived or expenses reimbursed
(including interest expense) | | | 0.51 | %(d)(e) | | | 0.50 | %(d) | | | 0.50 | % | | | 0.50 | % | | | 0.50 | % | | | 0.50 | % | |
Net expenses after fees waived or expenses reimbursed
(including interest expense)(f) | | | 0.51 | %(d)(e)(g) | | | 0.50 | %(d) | | | 0.50 | % | | | 0.50 | %(g) | | | 0.50 | %(g) | | | 0.50 | % | |
Expenses prior to fees waived or expenses reimbursed
(excluding interest expense) | | | 0.51 | %(e) | | | 0.50 | % | | | 0.50 | % | | | 0.50 | % | | | 0.50 | % | | | 0.50 | % | |
Net expenses after fees waived or expenses reimbursed
(excluding interest expense)(f) | | | 0.51 | %(e)(g) | | | 0.50 | % | | | 0.50 | % | | | 0.50 | %(g) | | | 0.50 | %(g) | | | 0.50 | % | |
| Net investment income | | | 1.60 | %(e)(g) | | | 1.75 | % | | | 2.45 | % | | | 2.44 | %(g) | | | 2.05 | %(g) | | | 2.17 | % | |
| Supplemental data | |
| Net assets, end of period (in thousands) | | $ | 665,859 | | | $ | 291,758 | | | $ | 245,327 | | | $ | 170,155 | | | $ | 275,576 | | | $ | 266,506 | | |
| Portfolio turnover | | | 42 | % | | | 68 | % | | | 27 | % | | | 47 | % | | | 18 | % | | | 18 | % | |
Notes to Financial Highlights
(a) For the period from April 1, 2011 to January 31, 2012. During the period, the Fund's fiscal year end was changed from March 31 to January 31.
(b) Rounds to less than $0.01.
(c) In addition to the fees and expenses which the Fund bears directly, the Fund indirectly bears a pro rata share of the fees and expenses of the underlying funds in which the Fund invests. Such indirect expenses are not included in the reported expense ratios.
(d) Includes interest expense which rounds to less than 0.01%.
(e) Annualized.
(f) The Investment Manager and certain of its affiliates agreed to waive/reimburse certain fees and expenses, if applicable.
(g) The benefits derived from expense reductions had an impact of less than 0.01%.
The Accompanying Notes to Financial Statements are an integral part of this statement.
54
Financial Highlights (continued) – Columbia LifeGoal Balanced Growth Portfolio
| | | Year ended
Jan. 31, | | Year ended March 31, | |
| | | 2012(a) | | 2011 | | 2010 | | 2009 | | 2008 | | 2007 | |
| Class B | |
| Per share data | |
| Net asset value, beginning of period | | $ | 11.53 | | | $ | 10.16 | | | $ | 7.29 | | | $ | 11.30 | | | $ | 12.31 | | | $ | 11.81 | | |
| Income from investment operations: | |
| Net investment income | | | 0.07 | | | | 0.10 | | | | 0.16 | | | | 0.15 | | | | 0.16 | | | | 0.17 | | |
| Net realized and unrealized gain (loss) | | | (0.29 | ) | | | 1.37 | | | | 2.87 | | | | (2.89 | ) | | | (0.44 | ) | | | 0.86 | | |
| Total from investment operations | | | (0.22 | ) | | | 1.47 | | | | 3.03 | | | | (2.74 | ) | | | (0.28 | ) | | | 1.03 | | |
| Less distributions to shareholders from: | |
| Net investment income | | | (0.08 | ) | | | (0.10 | ) | | | (0.16 | ) | | | (0.15 | ) | | | (0.16 | ) | | | (0.17 | ) | |
| Net realized gains | | | (0.02 | ) | | | — | | | | — | | | | (1.12 | ) | | | (0.57 | ) | | | (0.36 | ) | |
| Total distributions to shareholders | | | (0.10 | ) | | | (0.10 | ) | | | (0.16 | ) | | | (1.27 | ) | | | (0.73 | ) | | | (0.53 | ) | |
| Proceeds from regulatory settlement | | | 0.00 | (b) | | | — | | | | — | | | | — | | | | — | | | | — | | |
| Net asset value, end of period | | $ | 11.21 | | | $ | 11.53 | | | $ | 10.16 | | | $ | 7.29 | | | $ | 11.30 | | | $ | 12.31 | | |
| Total return | | | (1.87 | %) | | | 14.63 | % | | | 41.72 | % | | | (27.01 | %) | | | (2.66 | %) | | | 9.00 | % | |
| Ratios to average net assets(c) | |
Expenses prior to fees waived or expenses reimbursed
(including interest expense) | | | 1.26 | %(d)(e) | | | 1.25 | %(e) | | | 1.25 | % | | | 1.25 | % | | | 1.25 | % | | | 1.25 | % | |
Net expenses after fees waived or expenses reimbursed
(including interest expense)(f) | | | 1.26 | %(d)(e)(g) | | | 1.25 | %(e) | | | 1.25 | % | | | 1.25 | %(g) | | | 1.25 | %(g) | | | 1.25 | % | |
Expenses prior to fees waived or expenses reimbursed
(excluding interest expense) | | | 1.26 | %(d) | | | 1.25 | % | | | 1.25 | % | | | 1.25 | % | | | 1.25 | % | | | 1.25 | % | |
Net expenses after fees waived or expenses reimbursed
(excluding interest expense)(f) | | | 1.26 | %(d)(g) | | | 1.25 | % | | | 1.25 | % | | | 1.25 | %(g) | | | 1.25 | %(g) | | | 1.25 | % | |
| Net investment income | | | 0.75 | %(d)(g) | | | 0.99 | % | | | 1.70 | % | | | 1.67 | %(g) | | | 1.28 | %(g) | | | 1.42 | % | |
| Supplemental data | |
| Net assets, end of period (in thousands) | | $ | 85,005 | | | $ | 133,770 | | | $ | 181,026 | | | $ | 156,679 | | | $ | 282,912 | | | $ | 325,190 | | |
| Portfolio turnover | | | 42 | % | | | 68 | % | | | 27 | % | | | 47 | % | | | 18 | % | | | 18 | % | |
Notes to Financial Highlights
(a) For the period from April 1, 2011 to January 31, 2012. During the period, the Fund's fiscal year end was changed from March 31 to January 31.
(b) Rounds to less than $0.01.
(c) In addition to the fees and expenses which the Fund bears directly, the Fund indirectly bears a pro rata share of the fees and expenses of the underlying funds in which the Fund invests. Such indirect expenses are not included in the reported expense ratios.
(d) Annualized.
(e) Includes interest expense which rounds to less than 0.01%.
(f) The Investment Manager and certain of its affiliates agreed to waive/reimburse certain fees and expenses, if applicable.
(g) The benefits derived from expense reductions had an impact of less than 0.01%.
The Accompanying Notes to Financial Statements are an integral part of this statement.
55
Financial Highlights (continued) – Columbia LifeGoal Balanced Growth Portfolio
| | | Year ended
Jan. 31, | | Year ended March 31, | |
| | | 2012(a) | | 2011 | | 2010 | | 2009 | | 2008 | | 2007 | |
| Class C | |
| Per share data | |
| Net asset value, beginning of period | | $ | 11.68 | | | $ | 10.29 | | | $ | 7.38 | | | $ | 11.43 | | | $ | 12.44 | | | $ | 11.92 | | |
| Income from investment operations: | |
| Net investment income | | | 0.08 | | | | 0.11 | | | | 0.16 | | | | 0.15 | | | | 0.16 | | | | 0.17 | | |
| Net realized and unrealized gain (loss) | | | (0.30 | ) | | | 1.38 | | | | 2.91 | | | | (2.93 | ) | | | (0.44 | ) | | | 0.88 | | |
| Total from investment operations | | | (0.22 | ) | | | 1.49 | | | | 3.07 | | | | (2.78 | ) | | | (0.28 | ) | | | 1.05 | | |
| Less distributions to shareholders from: | |
| Net investment income | | | (0.08 | ) | | | (0.10 | ) | | | (0.16 | ) | | | (0.15 | ) | | | (0.16 | ) | | | (0.17 | ) | |
| Net realized gains | | | (0.02 | ) | | | — | | | | — | | | | (1.12 | ) | | | (0.57 | ) | | | (0.36 | ) | |
| Total distributions to shareholders | | | (0.10 | ) | | | (0.10 | ) | | | (0.16 | ) | | | (1.27 | ) | | | (0.73 | ) | | | (0.53 | ) | |
| Proceeds from regulatory settlement | | | 0.00 | (b) | | | — | | | | — | | | | — | | | | — | | | | — | | |
| Net asset value, end of period | | $ | 11.36 | | | $ | 11.68 | | | $ | 10.29 | | | $ | 7.38 | | | $ | 11.43 | | | $ | 12.44 | | |
| Total return | | | (1.85 | %) | | | 14.64 | % | | | 41.76 | % | | | (27.05 | %) | | | (2.63 | %) | | | 9.09 | % | |
| Ratios to average net assets(c) | |
Expenses prior to fees waived or expenses reimbursed
(including interest expense) | | | 1.26 | %(d)(e) | | | 1.25 | %(e) | | | 1.25 | % | | | 1.25 | % | | | 1.25 | % | | | 1.25 | % | |
Net expenses after fees waived or expenses reimbursed
(including interest expense)(f) | | | 1.26 | %(d)(e)(g) | | | 1.25 | %(e) | | | 1.25 | % | | | 1.25 | %(g) | | | 1.25 | %(g) | | | 1.25 | % | |
Expenses prior to fees waived or expenses reimbursed
(excluding interest expense) | | | 1.26 | %(d) | | | 1.25 | % | | | 1.25 | % | | | 1.25 | % | | | 1.25 | % | | | 1.25 | % | |
Net expenses after fees waived or expenses reimbursed
(excluding interest expense)(f) | | | 1.26 | %(d)(g) | | | 1.25 | % | | | 1.25 | % | | | 1.25 | %(g) | | | 1.25 | %(g) | | | 1.25 | % | |
| Net investment income | | | 0.81 | %(d)(g) | | | 1.00 | % | | | 1.70 | % | | | 1.67 | %(g) | | | 1.30 | %(g) | | | 1.42 | % | |
| Supplemental data | |
| Net assets, end of period (in thousands) | | $ | 86,321 | | | $ | 91,556 | | | $ | 87,496 | | | $ | 64,940 | | | $ | 112,902 | | | $ | 118,747 | | |
| Portfolio turnover | | | 42 | % | | | 68 | % | | | 27 | % | | | 47 | % | | | 18 | % | | | 18 | % | |
Notes to Financial Highlights
(a) For the period from April 1, 2011 to January 31, 2012. During the period, the Fund's fiscal year end was changed from March 31 to January 31.
(b) Rounds to less than $0.01.
(c) In addition to the fees and expenses which the Fund bears directly, the Fund indirectly bears a pro rata share of the fees and expenses of the underlying funds in which the Fund invests. Such indirect expenses are not included in the reported expense ratios.
(d) Annualized.
(e) Includes interest expense which rounds to less than 0.01%.
(f) The Investment Manager and certain of its affiliates agreed to waive/reimburse certain fees and expenses, if applicable.
(g) The benefits derived from expense reductions had an impact of less than 0.01%.
The Accompanying Notes to Financial Statements are an integral part of this statement.
56
Financial Highlights (continued) – Columbia LifeGoal Balanced Growth Portfolio
| | | Year ended
Jan. 31, | | Year ended March 31, | |
| | | 2012(a) | | 2011 | | 2010 | | 2009 | | 2008 | | 2007 | |
| Class R | |
| Per share data | |
| Net asset value, beginning of period | | $ | 11.60 | | | $ | 10.22 | | | $ | 7.33 | | | $ | 11.36 | | | $ | 12.37 | | | $ | 11.86 | | |
| Income from investment operations: | |
| Net investment income | | | 0.13 | | | | 0.16 | | | | 0.20 | | | | 0.22 | | | | 0.21 | | | | 0.29 | | |
| Net realized and unrealized gain (loss) | | | (0.30 | ) | | | 1.38 | | | | 2.89 | | | | (2.94 | ) | | | (0.43 | ) | | | 0.81 | | |
| Total from investment operations | | | (0.17 | ) | | | 1.54 | | | | 3.09 | | | | (2.72 | ) | | | (0.22 | ) | | | 1.10 | | |
| Less distributions to shareholders from: | |
| Net investment income | | | (0.12 | ) | | | (0.16 | ) | | | (0.20 | ) | | | (0.19 | ) | | | (0.22 | ) | | | (0.23 | ) | |
| Net realized gains | | | (0.02 | ) | | | — | | | | — | | | | (1.12 | ) | | | (0.57 | ) | | | (0.36 | ) | |
| Total distributions to shareholders | | | (0.14 | ) | | | (0.16 | ) | | | (0.20 | ) | | | (1.31 | ) | | | (0.79 | ) | | | (0.59 | ) | |
| Proceeds from regulatory settlement | | | 0.00 | (b) | | | — | | | | — | | | | — | | | | — | | | | — | | |
| Net asset value, end of period | | $ | 11.29 | | | $ | 11.60 | | | $ | 10.22 | | | $ | 7.33 | | | $ | 11.36 | | | $ | 12.37 | | |
| Total return | | | (1.39 | %) | | | 15.21 | % | | | 42.46 | % | | | (26.67 | %) | | | (2.15 | %) | | | 9.59 | % | |
| Ratios to average net assets(c) | |
Expenses prior to fees waived or expenses reimbursed
(including interest expense) | | | 0.77 | %(d)(e) | | | 0.75 | %(e) | | | 0.75 | % | | | 0.75 | % | | | 0.75 | % | | | 0.75 | % | |
Net expenses after fees waived or expenses reimbursed
(including interest expense)(f) | | | 0.77 | %(d)(e)(g) | | | 0.75 | %(e) | | | 0.75 | % | | | 0.75 | %(g) | | | 0.75 | %(g) | | | 0.75 | % | |
Expenses prior to fees waived or expenses reimbursed
(excluding interest expense) | | | 0.77 | %(d) | | | 0.75 | % | | | 0.75 | % | | | 0.75 | % | | | 0.75 | % | | | 0.75 | % | |
Net expenses after fees waived or expenses reimbursed
(excluding interest expense)(f) | | | 0.77 | %(d)(g) | | | 0.75 | % | | | 0.75 | % | | | 0.75 | %(g) | | | 0.75 | %(g) | | | 0.75 | % | |
| Net investment income | | | 1.40 | %(d)(g) | | | 1.54 | % | | | 2.16 | % | | | 2.48 | %(g) | | | 1.69 | %(g) | | | 2.34 | % | |
| Supplemental data | |
| Net assets, end of period (in thousands) | | $ | 3,908 | | | $ | 1,517 | | | $ | 1,740 | | | $ | 1,666 | | | $ | 1,257 | | | $ | 1,916 | | |
| Portfolio turnover | | | 42 | % | | | 68 | % | | | 27 | % | | | 47 | % | | | 18 | % | | | 18 | % | |
Notes to Financial Highlights
(a) For the period from April 1, 2011 to January 31, 2012. During the period, the Fund's fiscal year end was changed from March 31 to January 31.
(b) Rounds to less than $0.01.
(c) In addition to the fees and expenses which the Fund bears directly, the Fund indirectly bears a pro rata share of the fees and expenses of the underlying funds in which the Fund invests. Such indirect expenses are not included in the reported expense ratios.
(d) Annualized.
(e) Includes interest expense which rounds to less than 0.01%.
(f) The Investment Manager and certain of its affiliates agreed to waive/reimburse certain fees and expenses, if applicable.
(g) The benefits derived from expense reductions had an impact of less than 0.01%.
The Accompanying Notes to Financial Statements are an integral part of this statement.
57
Financial Highlights (continued) – Columbia LifeGoal Balanced Growth Portfolio
| | | Year ended
Jan. 31,
2012(a) | | Year ended
March 31,
2011(b) | |
| Class T | |
| Per share data | |
| Net asset value, beginning of period | | $ | 11.61 | | | $ | 11.49 | | |
| Income from investment operations: | |
| Net investment income | | | 0.15 | | | | 0.02 | | |
| Net realized and unrealized gain (loss) | | | (0.30 | ) | | | 0.13 | | |
| Total from investment operations | | | (0.15 | ) | | | 0.15 | | |
| Less distributions to shareholders from: | |
| Net investment income | | | (0.14 | ) | | | (0.03 | ) | |
| Net realized gains | | | (0.02 | ) | | | — | | |
| Total distributions to shareholders | | | (0.16 | ) | | | (0.03 | ) | |
| Proceeds from regulatory settlement | | | 0.00 | (c) | | | — | | |
| Net asset value, end of period | | $ | 11.30 | | | $ | 11.61 | | |
| Total return | | | (1.23 | %) | | | 1.28 | % | |
| Ratios to average net assets(d) | |
| Expenses prior to fees waived or expenses reimbursed (including interest expense) | | | 0.56 | %(e)(f) | | | 0.55 | %(e) | |
| Net expenses after fees waived or expenses reimbursed (including interest expense)(g) | | | 0.56 | %(e)(f)(h) | | | 0.55 | %(e) | |
| Expenses prior to fees waived or expenses reimbursed (excluding interest expense) | | | 0.56 | %(e) | | | 0.55 | %(e) | |
| Net expenses after fees waived or expenses reimbursed (excluding interest expense)(g) | | | 0.56 | %(e)(h) | | | 0.55 | %(e) | |
| Net investment income | | | 1.58 | %(e)(h) | | | 2.26 | %(e) | |
| Supplemental data | |
| Net assets, end of period (in thousands) | | $ | 102,913 | | | $ | 3 | | |
| Portfolio turnover | | | 42 | % | | | 68 | % | |
Notes to Financial Highlights
(a) For the period from April 1, 2011 to January 31, 2012. During the period, the Fund's fiscal year end was changed from March 31 to January 31.
(b) For the period from March 7, 2011 (commencement of operations) to March 31, 2011.
(c) Rounds to less than $0.01.
(d) In addition to the fees and expenses which the Fund bears directly, the Fund indirectly bears a pro rata share of the fees and expenses of the underlying funds in which the Fund invests. Such indirect expenses are not included in the reported expense ratios.
(e) Annualized.
(f) Includes interest expense which rounds to less than 0.01%.
(g) The Investment Manager and certain of its affiliates agreed to waive/reimburse certain fees and expenses, if applicable.
(h) The benefits derived from expense reductions had an impact of less than 0.01%.
The Accompanying Notes to Financial Statements are an integral part of this statement.
58
Financial Highlights (continued) – Columbia LifeGoal Balanced Growth Portfolio
| | | Year ended
Jan. 31, | | Year ended March 31, | |
| | | 2012(a) | | 2011 | | 2010 | | 2009 | | 2008 | | 2007 | |
| Class Z | |
| Per share data | |
| Net asset value, beginning of period | | $ | 11.60 | | | $ | 10.21 | | | $ | 7.33 | | | $ | 11.36 | | | $ | 12.35 | | | $ | 11.84 | | |
| Income from investment operations: | |
| Net investment income | | | 0.17 | | | | 0.21 | | | | 0.25 | | | | 0.25 | | | | 0.34 | | | | 0.29 | | |
| Net realized and unrealized gain (loss) | | | (0.30 | ) | | | 1.39 | | | | 2.88 | | | | (2.92 | ) | | | (0.47 | ) | | | 0.87 | | |
| Total from investment operations | | | (0.13 | ) | | | 1.60 | | | | 3.13 | | | | (2.67 | ) | | | (0.13 | ) | | | 1.16 | | |
| Less distributions to shareholders from: | |
| Net investment income | | | (0.16 | ) | | | (0.21 | ) | | | (0.25 | ) | | | (0.24 | ) | | | (0.29 | ) | | | (0.29 | ) | |
| Net realized gains | | | (0.02 | ) | | | — | | | | — | | | | (1.12 | ) | | | (0.57 | ) | | | (0.36 | ) | |
| Total distributions to shareholders | | | (0.18 | ) | | | (0.21 | ) | | | (0.25 | ) | | | (1.36 | ) | | | (0.86 | ) | | | (0.65 | ) | |
| Proceeds from regulatory settlement | | | 0.00 | (b) | | | — | | | | — | | | | — | | | | — | | | | — | | |
| Net asset value, end of period | | $ | 11.29 | | | $ | 11.60 | | | $ | 10.21 | | | $ | 7.33 | | | $ | 11.36 | | | $ | 12.35 | | |
| Total return | | | (1.00 | %) | | | 15.89 | % | | | 43.01 | % | | | (26.28 | %) | | | (1.49 | %) | | | 10.15 | % | |
| Ratios to average net assets(c) | |
Expenses prior to fees waived or expenses reimbursed
(including interest expense) | | | 0.26 | %(d)(e) | | | 0.25 | %(e) | | | 0.25 | % | | | 0.25 | % | | | 0.25 | % | | | 0.25 | % | |
Net expenses after fees waived or expenses reimbursed
(including interest expense)(f) | | | 0.26 | %(d)(e)(g) | | | 0.25 | %(e) | | | 0.25 | % | | | 0.25 | %(g) | | | 0.25 | %(g) | | | 0.25 | % | |
Expenses prior to fees waived or expenses reimbursed
(excluding interest expense) | | | 0.26 | %(d) | | | 0.25 | % | | | 0.25 | % | | | 0.25 | % | | | 0.25 | % | | | 0.25 | % | |
Net expenses after fees waived or expenses reimbursed
(excluding interest expense)(f) | | | 0.26 | %(d)(g) | | | 0.25 | % | | | 0.25 | % | | | 0.25 | %(g) | | | 0.25 | %(g) | | | 0.25 | % | |
| Net investment income | | | 1.86 | %(d)(g) | | | 2.03 | % | | | 2.69 | % | | | 2.83 | %(g) | | | 2.68 | %(g) | | | 2.42 | % | |
| Supplemental data | |
| Net assets, end of period (in thousands) | | $ | 146,805 | | | $ | 56,805 | | | $ | 64,967 | | | $ | 44,020 | | | $ | 46,711 | | | $ | 292,939 | | |
| Portfolio turnover | | | 42 | % | | | 68 | % | | | 27 | % | | | 47 | % | | | 18 | % | | | 18 | % | |
Notes to Financial Highlights
(a) For the period from April 1, 2011 to January 31, 2012. During the period, the Fund's fiscal year end was changed from March 31 to January 31.
(b) Rounds to less than $0.01.
(c) In addition to the fees and expenses which the Fund bears directly, the Fund indirectly bears a pro rata share of the fees and expenses of the underlying funds in which the Fund invests. Such indirect expenses are not included in the reported expense ratios.
(d) Annualized.
(e) Includes interest expense which rounds to less than 0.01%.
(f) The Investment Manager and certain of its affiliates agreed to waive/reimburse certain fees and expenses, if applicable.
(g) The benefits derived from expense reductions had an impact of less than 0.01%.
The Accompanying Notes to Financial Statements are an integral part of this statement.
59
Financial Highlights – Columbia LifeGoal Income and Growth Portfolio
| | | Year ended
Jan. 31, | | Year ended March 31, | |
| | | 2012(a) | | 2011 | | 2010 | | 2009 | | 2008 | | 2007 | |
| Class A | |
| Per share data | |
| Net asset value, beginning of period | | $ | 10.89 | | | $ | 10.04 | | | $ | 8.03 | | | $ | 10.40 | | | $ | 11.04 | | | $ | 10.80 | | |
| Income from investment operations: | |
| Net investment income | | | 0.21 | | | | 0.26 | | | | 0.31 | | | | 0.33 | | | | 0.36 | | | | 0.34 | | |
| Net realized and unrealized gain (loss) | | | 0.07 | | | | 0.85 | | | | 2.00 | | | | (1.97 | ) | | | (0.30 | ) | | | 0.50 | | |
| Total from investment operations | | | 0.28 | | | | 1.11 | | | | 2.31 | | | | (1.64 | ) | | | 0.06 | | | | 0.84 | | |
| Less distributions to shareholders from: | |
| Net investment income | | | (0.21 | ) | | | (0.26 | ) | | | (0.30 | ) | | | (0.33 | ) | | | (0.36 | ) | | | (0.34 | ) | |
| Net realized gains | | | — | | | | — | | | | — | | | | (0.40 | ) | | | (0.34 | ) | | | (0.26 | ) | |
| Total distributions to shareholders | | | (0.21 | ) | | | (0.26 | ) | | | (0.30 | ) | | | (0.73 | ) | | | (0.70 | ) | | | (0.60 | ) | |
| Net asset value, end of period | | $ | 10.96 | | | $ | 10.89 | | | $ | 10.04 | | | $ | 8.03 | | | $ | 10.40 | | | $ | 11.04 | | |
| Total return | | | 2.63 | % | | | 11.21 | % | | | 29.06 | % | | | (16.58 | %) | | | 0.34 | % | | | 8.07 | % | |
| Ratios to average net assets(b) | |
Expenses prior to fees waived or expenses reimbursed
(including interest expense) | | | 0.64 | %(c)(d) | | | 0.50 | % | | | 0.50 | % | | | 0.50 | %(d) | | | 0.50 | % | | | 0.50 | % | |
Net expenses after fees waived or expenses reimbursed
(including interest expense)(e) | | | 0.57 | %(c)(d)(f) | | | 0.50 | % | | | 0.50 | % | | | 0.50 | %(d)(f) | | | 0.50 | %(f) | | | 0.50 | % | |
Expenses prior to fees waived or expenses reimbursed
(excluding interest expense) | | | 0.64 | %(c) | | | 0.50 | % | | | 0.50 | % | | | 0.50 | % | | | 0.50 | % | | | 0.50 | % | |
Net expenses after fees waived or expenses reimbursed
(excluding interest expense)(e) | | | 0.57 | %(c)(f) | | | 0.50 | % | | | 0.50 | % | | | 0.50 | %(f) | | | 0.50 | %(f) | | | 0.50 | % | |
| Net investment income | | | 2.37 | %(c)(f) | | | 2.52 | % | | | 3.26 | % | | | 3.59 | %(f) | | | 3.29 | %(f) | | | 3.15 | % | |
| Supplemental data | |
| Net assets, end of period (in thousands) | | $ | 68,452 | | | $ | 63,807 | | | $ | 60,848 | | | $ | 44,825 | | | $ | 54,370 | | | $ | 50,829 | | |
| Portfolio turnover | | | 55 | % | | | 87 | % | | | 34 | % | | | 52 | % | | | 20 | % | | | 25 | % | |
Notes to Financial Highlights
(a) For the period from April 1, 2011 to January 31, 2012. During the period, the Fund's fiscal year end was changed from March 31 to January 31.
(b) In addition to the fees and expenses which the Fund bears directly, the Fund indirectly bears a pro rata share of the fees and expenses of the underlying funds in which the Fund invests. Such indirect expenses are not included in the reported expense ratios.
(c) Annualized.
(d) Includes interest expense which rounds to less than 0.01%.
(e) The Investment Manager and certain of its affiliates agreed to waive/reimburse certain fees and expenses, if applicable.
(f) The benefits derived from expense reductions had an impact of less than 0.01%.
The Accompanying Notes to Financial Statements are an integral part of this statement.
60
Financial Highlights (continued) – Columbia LifeGoal Income and Growth Portfolio
| | | Year ended
Jan. 31, | | Year ended March 31, | |
| | | 2012(a) | | 2011 | | 2010 | | 2009 | | 2008 | | 2007 | |
| Class B | |
| Per share data | |
| Net asset value, beginning of period | | $ | 10.85 | | | $ | 10.00 | | | $ | 8.01 | | | $ | 10.36 | | | $ | 11.00 | | | $ | 10.77 | | |
| Income from investment operations: | |
| Net investment income | | | 0.14 | | | | 0.18 | | | | 0.23 | | | | 0.26 | | | | 0.28 | | | | 0.26 | | |
| Net realized and unrealized gain (loss) | | | 0.07 | | | | 0.85 | | | | 1.99 | | | | (1.95 | ) | | | (0.31 | ) | | | 0.49 | | |
| Total from investment operations | | | 0.21 | | | | 1.03 | | | | 2.22 | | | | (1.69 | ) | | | (0.03 | ) | | | 0.75 | | |
| Less distributions to shareholders from: | |
| Net investment income | | | (0.15 | ) | | | (0.18 | ) | | | (0.23 | ) | | | (0.26 | ) | | | (0.27 | ) | | | (0.26 | ) | |
| Net realized gains | | | — | | | | — | | | | — | | | | (0.40 | ) | | | (0.34 | ) | | | (0.26 | ) | |
| Total distributions to shareholders | | | (0.15 | ) | | | (0.18 | ) | | | (0.23 | ) | | | (0.66 | ) | | | (0.61 | ) | | | (0.52 | ) | |
| Net asset value, end of period | | $ | 10.91 | | | $ | 10.85 | | | $ | 10.00 | | | $ | 8.01 | | | $ | 10.36 | | | $ | 11.00 | | |
| Total return | | | 1.96 | % | | | 10.43 | % | | | 27.94 | % | | | (17.09 | %) | | | (0.41 | %) | | | 7.20 | % | |
| Ratios to average net assets(b) | |
Expenses prior to fees waived or expenses reimbursed
(including interest expense) | | | 1.39 | %(c)(d) | | | 1.25 | % | | | 1.25 | % | | | 1.25 | %(d) | | | 1.25 | % | | | 1.25 | % | |
Net expenses after fees waived or expenses reimbursed
(including interest expense)(e) | | | 1.31 | %(c)(d)(f) | | | 1.25 | % | | | 1.25 | % | | | 1.25 | %(d)(f) | | | 1.25 | %(f) | | | 1.25 | % | |
Expenses prior to fees waived or expenses reimbursed
(excluding interest expense) | | | 1.39 | %(c) | | | 1.25 | % | | | 1.25 | % | | | 1.25 | % | | | 1.25 | % | | | 1.25 | % | |
Net expenses after fees waived or expenses reimbursed
(excluding interest expense)(e) | | | 1.31 | %(c)(f) | | | 1.25 | % | | | 1.25 | % | | | 1.25 | %(f) | | | 1.25 | %(f) | | | 1.25 | % | |
| Net investment income | | | 1.58 | %(c)(f) | | | 1.75 | % | | | 2.51 | % | | | 2.80 | %(f) | | | 2.53 | %(f) | | | 2.39 | % | |
| Supplemental data | |
| Net assets, end of period (in thousands) | | $ | 14,587 | | | $ | 26,181 | | | $ | 40,508 | | | $ | 40,270 | | | $ | 66,558 | | | $ | 75,119 | | |
| Portfolio turnover | | | 55 | % | | | 87 | % | | | 34 | % | | | 52 | % | | | 20 | % | | | 25 | % | |
Notes to Financial Highlights
(a) For the period from April 1, 2011 to January 31, 2012. During the period, the Fund's fiscal year end was changed from March 31 to January 31.
(b) In addition to the fees and expenses which the Fund bears directly, the Fund indirectly bears a pro rata share of the fees and expenses of the underlying funds in which the Fund invests. Such indirect expenses are not included in the reported expense ratios.
(c) Annualized.
(d) Includes interest expense which rounds to less than 0.01%.
(e) The Investment Manager and certain of its affiliates agreed to waive/reimburse certain fees and expenses, if applicable.
(f) The benefits derived from expense reductions had an impact of less than 0.01%.
The Accompanying Notes to Financial Statements are an integral part of this statement.
61
Financial Highlights (continued) – Columbia LifeGoal Income and Growth Portfolio
| | | Year ended
Jan. 31, | | Year ended March 31, | |
| | | 2012(a) | | 2011 | | 2010 | | 2009 | | 2008 | | 2007 | |
| Class C | |
| Per share data | |
| Net asset value, beginning of period | | $ | 10.78 | | | $ | 9.94 | | | $ | 7.96 | | | $ | 10.30 | | | $ | 10.94 | | | $ | 10.71 | | |
| Income from investment operations: | |
| Net investment income | | | 0.14 | | | | 0.18 | | | | 0.23 | | | | 0.26 | | | | 0.28 | | | | 0.26 | | |
| Net realized and unrealized gain (loss) | | | 0.07 | | | | 0.84 | | | | 1.98 | | | | (1.94 | ) | | | (0.31 | ) | | | 0.49 | | |
| Total from investment operations | | | 0.21 | | | | 1.02 | | | | 2.21 | | | | (1.68 | ) | | | (0.03 | ) | | | 0.75 | | |
| Less distributions to shareholders from: | |
| Net investment income | | | (0.15 | ) | | | (0.18 | ) | | | (0.23 | ) | | | (0.26 | ) | | | (0.27 | ) | | | (0.26 | ) | |
| Net realized gains | | | — | | | | — | | | | — | | | | (0.40 | ) | | | (0.34 | ) | | | (0.26 | ) | |
| Total distributions to shareholders | | | (0.15 | ) | | | (0.18 | ) | | | (0.23 | ) | | | (0.66 | ) | | | (0.61 | ) | | | (0.52 | ) | |
| Net asset value, end of period | | $ | 10.84 | | | $ | 10.78 | | | $ | 9.94 | | | $ | 7.96 | | | $ | 10.30 | | | $ | 10.94 | | |
| Total return | | | 1.97 | % | | | 10.39 | % | | | 27.99 | % | | | (17.09 | %) | | | (0.41 | %) | | | 7.24 | % | |
| Ratios to average net assets(b) | |
Expenses prior to fees waived or expenses reimbursed
(including interest expense) | | | 1.39 | %(c)(d) | | | 1.25 | % | | | 1.25 | % | | | 1.25 | %(d) | | | 1.25 | % | | | 1.25 | % | |
Net expenses after fees waived or expenses reimbursed
(including interest expense)(e) | | | 1.32 | %(c)(d)(f) | | | 1.25 | % | | | 1.25 | % | | | 1.25 | %(d)(f) | | | 1.25 | %(f) | | | 1.25 | % | |
Expenses prior to fees waived or expenses reimbursed
(excluding interest expense) | | | 1.39 | %(c) | | | 1.25 | % | | | 1.25 | % | | | 1.25 | % | | | 1.25 | % | | | 1.25 | % | |
Net expenses after fees waived or expenses reimbursed
(excluding interest expense)(e) | | | 1.32 | %(c)(f) | | | 1.25 | % | | | 1.25 | % | | | 1.25 | %(f) | | | 1.25 | %(f) | | | 1.25 | % | |
| Net investment income | | | 1.61 | %(c)(f) | | | 1.77 | % | | | 2.51 | % | | | 2.81 | %(f) | | | 2.55 | %(f) | | | 2.41 | % | |
| Supplemental data | |
| Net assets, end of period (in thousands) | | $ | 24,156 | | | $ | 23,651 | | | $ | 23,321 | | | $ | 18,370 | | | $ | 26,501 | | | $ | 24,367 | | |
| Portfolio turnover | | | 55 | % | | | 87 | % | | | 34 | % | | | 52 | % | | | 20 | % | | | 25 | % | |
Notes to Financial Highlights
(a) For the period from April 1, 2011 to January 31, 2012. During the period, the Fund's fiscal year end was changed from March 31 to January 31.
(b) In addition to the fees and expenses which the Fund bears directly, the Fund indirectly bears a pro rata share of the fees and expenses of the underlying funds in which the Fund invests. Such indirect expenses are not included in the reported expense ratios.
(c) Annualized.
(d) Includes interest expense which rounds to less than 0.01%.
(e) The Investment Manager and certain of its affiliates agreed to waive/reimburse certain fees and expenses, if applicable.
(f) The benefits derived from expense reductions had an impact of less than 0.01%.
The Accompanying Notes to Financial Statements are an integral part of this statement.
62
Financial Highlights (continued) – Columbia LifeGoal Income and Growth Portfolio
| | | Year ended
Jan. 31, | | Year ended March 31, | |
| | | 2012(a) | | 2011 | | 2010 | | 2009 | | 2008 | | 2007 | |
| Class R | |
| Per share data | |
| Net asset value, beginning of period | | $ | 10.90 | | | $ | 10.04 | | | $ | 8.04 | | | $ | 10.40 | | | $ | 11.04 | | | $ | 10.80 | | |
| Income from investment operations: | |
| Net investment income | | | 0.18 | | | | 0.23 | | | | 0.28 | | | | 0.31 | | | | 0.32 | | | | 0.36 | | |
| Net realized and unrealized gain (loss) | | | 0.07 | | | | 0.86 | | | | 2.00 | | | | (1.96 | ) | | | (0.29 | ) | | | 0.46 | | |
| Total from investment operations | | | 0.25 | | | | 1.09 | | | | 2.28 | | | | (1.65 | ) | | | 0.03 | | | | 0.82 | | |
| Less distributions to shareholders from: | |
| Net investment income | | | (0.19 | ) | | | (0.23 | ) | | | (0.28 | ) | | | (0.31 | ) | | | (0.33 | ) | | | (0.32 | ) | |
| Net realized gains | | | — | | | | — | | | | — | | | | (0.40 | ) | | | (0.34 | ) | | | (0.26 | ) | |
| Total distributions to shareholders | | | (0.19 | ) | | | (0.23 | ) | | | (0.28 | ) | | | (0.71 | ) | | | (0.67 | ) | | | (0.58 | ) | |
| Net asset value, end of period | | $ | 10.96 | | | $ | 10.90 | | | $ | 10.04 | | | $ | 8.04 | | | $ | 10.40 | | | $ | 11.04 | | |
| Total return | | | 2.34 | % | | | 11.03 | % | | | 28.58 | % | | | (16.69 | %) | | | 0.09 | % | | | 7.80 | % | |
| Ratios to average net assets(b) | |
Expenses prior to fees waived or expenses reimbursed
(including interest expense) | | | 0.89 | %(c)(d) | | | 0.75 | % | | | 0.75 | % | | | 0.75 | %(d) | | | 0.75 | % | | | 0.75 | % | |
Net expenses after fees waived or expenses reimbursed
(including interest expense)(e) | | | 0.82 | %(c)(d)(f) | | | 0.75 | % | | | 0.75 | % | | | 0.75 | %(d)(f) | | | 0.75 | %(f) | | | 0.75 | % | |
Expenses prior to fees waived or expenses reimbursed
(excluding interest expense) | | | 0.89 | %(c) | | | 0.75 | % | | | 0.75 | % | | | 0.75 | % | | | 0.75 | % | | | 0.75 | % | |
Net expenses after fees waived or expenses reimbursed
(excluding interest expense)(e) | | | 0.82 | %(c)(f) | | | 0.75 | % | | | 0.75 | % | | | 0.75 | %(f) | | | 0.75 | %(f) | | | 0.75 | % | |
| Net investment income | | | 2.03 | %(c)(f) | | | 2.28 | % | | | 3.00 | % | | | 3.34 | %(f) | | | 2.93 | %(f) | | | 3.25 | % | |
| Supplemental data | |
| Net assets, end of period (in thousands) | | $ | 1,102 | | | $ | 428 | | | $ | 559 | | | $ | 358 | | | $ | 451 | | | $ | 896 | | |
| Portfolio turnover | | | 55 | % | | | 87 | % | | | 34 | % | | | 52 | % | | | 20 | % | | | 25 | % | |
Notes to Financial Highlights
(a) For the period from April 1, 2011 to January 31, 2012. During the period, the Fund's fiscal year end was changed from March 31 to January 31.
(b) In addition to the fees and expenses which the Fund bears directly, the Fund indirectly bears a pro rata share of the fees and expenses of the underlying funds in which the Fund invests. Such indirect expenses are not included in the reported expense ratios.
(c) Annualized.
(d) Includes interest expense which rounds to less than 0.01%.
(e) The Investment Manager and certain of its affiliates agreed to waive/reimburse certain fees and expenses, if applicable.
(f) The benefits derived from expense reductions had an impact of less than 0.01%.
The Accompanying Notes to Financial Statements are an integral part of this statement.
63
Financial Highlights (continued) – Columbia LifeGoal Income and Growth Portfolio
| | | Year ended
Jan. 31, | | Year ended March 31, | |
| | | 2012(a) | | 2011 | | 2010 | | 2009 | | 2008 | | 2007 | |
| Class Z | |
| Per share data | |
| Net asset value, beginning of period | | $ | 10.78 | | | $ | 9.94 | | | $ | 7.96 | | | $ | 10.30 | | | $ | 10.96 | | | $ | 10.73 | | |
| Income from investment operations: | |
| Net investment income | | | 0.23 | | | | 0.28 | | | | 0.33 | | | | 0.35 | | | | 0.42 | | | | 0.37 | | |
| Net realized and unrealized gain (loss) | | | 0.07 | | | | 0.84 | | | | 1.98 | | | | (1.93 | ) | | | (0.36 | ) | | | 0.49 | | |
| Total from investment operations | | | 0.30 | | | | 1.12 | | | | 2.31 | | | | (1.58 | ) | | | 0.06 | | | | 0.86 | | |
| Less distributions to shareholders from: | |
| Net investment income | | | (0.23 | ) | | | (0.28 | ) | | | (0.33 | ) | | | (0.36 | ) | | | (0.38 | ) | | | (0.37 | ) | |
| Net realized gains | | | — | | | | — | | | | — | | | | (0.40 | ) | | | (0.34 | ) | | | (0.26 | ) | |
| Total distributions to shareholders | | | (0.23 | ) | | | (0.28 | ) | | | (0.33 | ) | | | (0.76 | ) | | | (0.72 | ) | | | (0.63 | ) | |
| Net asset value, end of period | | $ | 10.85 | | | $ | 10.78 | | | $ | 9.94 | | | $ | 7.96 | | | $ | 10.30 | | | $ | 10.96 | | |
| Total return | | | 2.85 | % | | | 11.49 | % | | | 29.25 | % | | | (16.23 | %) | | | 0.40 | % | | | 8.30 | % | |
| Ratios to average net assets(b) | |
Expenses prior to fees waived or expenses reimbursed
(including interest expense) | | | 0.39 | %(c)(d) | | | 0.25 | % | | | 0.25 | % | | | 0.25 | %(d) | | | 0.25 | % | | | 0.25 | % | |
Net expenses after fees waived or expenses reimbursed
(including interest expense)(e) | | | 0.32 | %(c)(d)(f) | | | 0.25 | % | | | 0.25 | % | | | 0.25 | %(d)(f) | | | 0.25 | %(f) | | | 0.25 | % | |
Expenses prior to fees waived or expenses reimbursed
(excluding interest expense) | | | 0.39 | %(c) | | | 0.25 | % | | | 0.25 | % | | | 0.25 | % | | | 0.25 | % | | | 0.25 | % | |
Net expenses after fees waived or expenses reimbursed
(excluding interest expense)(e) | | | 0.32 | %(c)(f) | | | 0.25 | % | | | 0.25 | % | | | 0.25 | %(f) | | | 0.25 | %(f) | | | 0.25 | % | |
| Net investment income | | | 2.61 | %(c)(f) | | | 2.77 | % | | | 3.51 | % | | | 3.98 | %(f) | | | 3.78 | %(f) | | | 3.42 | % | |
| Supplemental data | |
| Net assets, end of period (in thousands) | | $ | 21,157 | | | $ | 21,839 | | | $ | 20,406 | | | $ | 16,275 | | | $ | 13,598 | | | $ | 68,749 | | |
| Portfolio turnover | | | 55 | % | | | 87 | % | | | 34 | % | | | 52 | % | | | 20 | % | | | 25 | % | |
Notes to Financial Highlights
(a) For the period from April 1, 2011 to January 31, 2012. During the period, the Fund's fiscal year end was changed from March 31 to January 31.
(b) In addition to the fees and expenses which the Fund bears directly, the Fund indirectly bears a pro rata share of the fees and expenses of the underlying funds in which the Fund invests. Such indirect expenses are not included in the reported expense ratios.
(c) Annualized.
(d) Includes interest expense which rounds to less than 0.01%.
(e) The Investment Manager and certain of its affiliates agreed to waive/reimburse certain fees and expenses, if applicable.
(f) The benefits derived from expense reductions had an impact of less than 0.01%.
The Accompanying Notes to Financial Statements are an integral part of this statement.
64
Financial Highlights – Columbia LifeGoal Income Portfolio
| | | Year ended
Jan. 31, | | Year ended March 31, | |
| | | 2012(a) | | 2011 | | 2010 | | 2009 | | 2008 | | 2007 | |
| Class A | |
| Per share data | |
| Net asset value, beginning of period | | $ | 10.31 | | | $ | 9.90 | | | $ | 8.58 | | | $ | 9.83 | | | $ | 10.22 | | | $ | 9.99 | | |
| Income from investment operations: | |
| Net investment income | | | 0.26 | | | | 0.29 | | | | 0.36 | | | | 0.38 | | | | 0.44 | | | | 0.42 | | |
| Net realized and unrealized gain (loss) | | | 0.20 | | | | 0.41 | | | | 1.31 | | | | (1.19 | ) | | | (0.38 | ) | | | 0.25 | | |
| Total from investment operations | | | 0.46 | | | | 0.70 | | | | 1.67 | | | | (0.81 | ) | | | 0.06 | | | | 0.67 | | |
| Less distributions to shareholders from: | |
| Net investment income | | | (0.28 | ) | | | (0.29 | ) | | | (0.35 | ) | | | (0.40 | ) | | | (0.43 | ) | | | (0.43 | ) | |
| Net realized gains | | | — | | | | — | | | | — | | | | (0.04 | ) | | | (0.02 | ) | | | (0.01 | ) | |
| Total distributions to shareholders | | | (0.28 | ) | | | (0.29 | ) | | | (0.35 | ) | | | (0.44 | ) | | | (0.45 | ) | | | (0.44 | ) | |
| Net asset value, end of period | | $ | 10.49 | | | $ | 10.31 | | | $ | 9.90 | | | $ | 8.58 | | | $ | 9.83 | | | $ | 10.22 | | |
| Total return | | | 4.56 | % | | | 7.21 | % | | | 19.77 | % | | | (8.37 | %) | | | 0.60 | % | | | 6.91 | % | |
| Ratios to average net assets(b) | |
Expenses prior to fees waived or expenses reimbursed
(including interest expense) | | | 1.24 | %(c)(d) | | | 1.24 | % | | | 1.25 | % | | | 1.06 | % | | | 1.14 | % | | | 1.21 | % | |
Net expenses after fees waived or expenses reimbursed
(including interest expense)(e) | | | 0.58 | %(c)(d) | | | 0.67 | % | | | 0.67 | % | | | 0.67 | % | | | 0.67 | %(f) | | | 0.67 | % | |
Expenses prior to fees waived or expenses reimbursed
(excluding interest expense) | | | 1.24 | %(c) | | | 1.24 | % | | | 1.25 | % | | | 1.06 | % | | | 1.14 | % | | | 1.21 | % | |
Net expenses after fees waived or expenses reimbursed
(excluding interest expense)(e) | | | 0.58 | %(c) | | | 0.67 | % | | | 0.67 | % | | | 0.67 | % | | | 0.67 | %(f) | | | 0.67 | % | |
| Net investment income | | | 3.00 | %(c) | | | 2.93 | % | | | 3.78 | % | | | 4.40 | % | | | 4.34 | %(f) | | | 4.19 | % | |
| Supplemental data | |
| Net assets, end of period (in thousands) | | $ | 15,736 | | | $ | 13,214 | | | $ | 13,390 | | | $ | 11,281 | | | $ | 13,941 | | | $ | 15,240 | | |
| Portfolio turnover | | | 66 | % | | | 109 | % | | | 35 | % | | | 51 | % | | | 24 | % | | | 42 | % | |
Notes to Financial Highlights
(a) For the period from April 1, 2011 to January 31, 2012. During the period, the Fund's fiscal year end was changed from March 31 to January 31.
(b) In addition to the fees and expenses which the Fund bears directly, the Fund indirectly bears a pro rata share of the fees and expenses of the underlying funds in which the Fund invests. Such indirect expenses are not included in the reported expense ratios.
(c) Annualized.
(d) Includes interest expense which rounds to less than 0.01%.
(e) The Investment Manager and certain of its affiliates agreed to waive/reimburse certain fees and expenses, if applicable.
(f) The benefits derived from expense reductions had an impact of less than 0.01%.
The Accompanying Notes to Financial Statements are an integral part of this statement.
65
Financial Highlights (continued) – Columbia LifeGoal Income Portfolio
| | | Year ended
Jan. 31, | | Year ended March 31, | |
| | | 2012(a) | | 2011 | | 2010 | | 2009 | | 2008 | | 2007 | |
| Class B | |
| Per share data | |
| Net asset value, beginning of period | | $ | 10.29 | | | $ | 9.89 | | | $ | 8.56 | | | $ | 9.82 | | | $ | 10.21 | | | $ | 9.98 | | |
| Income from investment operations: | |
| Net investment income | | | 0.19 | | | | 0.22 | | | | 0.28 | | | | 0.31 | | | | 0.36 | | | | 0.35 | | |
| Net realized and unrealized gain (loss) | | | 0.21 | | | | 0.40 | | | | 1.33 | | | | (1.20 | ) | | | (0.37 | ) | | | 0.25 | | |
| Total from investment operations | | | 0.40 | | | | 0.62 | | | | 1.61 | | | | (0.89 | ) | | | (0.01 | ) | | | 0.60 | | |
| Less distributions to shareholders from: | |
| Net investment income | | | (0.22 | ) | | | (0.22 | ) | | | (0.28 | ) | | | (0.33 | ) | | | (0.36 | ) | | | (0.36 | ) | |
| Net realized gains | | | — | | | | — | | | | — | | | | (0.04 | ) | | | (0.02 | ) | | | (0.01 | ) | |
| Total distributions to shareholders | | | (0.22 | ) | | | (0.22 | ) | | | (0.28 | ) | | | (0.37 | ) | | | (0.38 | ) | | | (0.37 | ) | |
| Net asset value, end of period | | $ | 10.47 | | | $ | 10.29 | | | $ | 9.89 | | | $ | 8.56 | | | $ | 9.82 | | | $ | 10.21 | | |
| Total return | | | 3.91 | % | | | 6.31 | % | | | 19.04 | % | | | (9.17 | %) | | | (0.15 | %) | | | 6.13 | % | |
| Ratios to average net assets(b) | |
Expenses prior to fees waived or expenses reimbursed
(including interest expense) | | | 1.95 | %(c)(d) | | | 1.99 | % | | | 2.00 | % | | | 1.81 | % | | | 1.89 | % | | | 1.96 | % | |
Net expenses after fees waived or expenses reimbursed
(including interest expense)(e) | | | 1.33 | %(c)(d) | | | 1.42 | % | | | 1.42 | % | | | 1.42 | % | | | 1.42 | %(f) | | | 1.42 | % | |
Expenses prior to fees waived or expenses reimbursed
(excluding interest expense) | | | 1.95 | %(c) | | | 1.99 | % | | | 2.00 | % | | | 1.81 | % | | | 1.89 | % | | | 1.96 | % | |
Net expenses after fees waived or expenses reimbursed
(excluding interest expense)(e) | | | 1.33 | %(c) | | | 1.42 | % | | | 1.42 | % | | | 1.42 | % | | | 1.42 | %(f) | | | 1.42 | % | |
| Net investment income | | | 2.24 | %(c) | | | 2.16 | % | | | 3.02 | % | | | 3.66 | % | | | 3.58 | %(f) | | | 3.43 | % | |
| Supplemental data | |
| Net assets, end of period (in thousands) | | $ | 2,690 | | | $ | 5,242 | | | $ | 7,079 | | | $ | 7,467 | | | $ | 8,849 | | | $ | 9,591 | | |
| Portfolio turnover | | | 66 | % | | | 109 | % | | | 35 | % | | | 51 | % | | | 24 | % | | | 42 | % | |
Notes to Financial Highlights
(a) For the period from April 1, 2011 to January 31, 2012. During the period, the Fund's fiscal year end was changed from March 31 to January 31.
(b) In addition to the fees and expenses which the Fund bears directly, the Fund indirectly bears a pro rata share of the fees and expenses of the underlying funds in which the Fund invests. Such indirect expenses are not included in the reported expense ratios.
(c) Annualized.
(d) Includes interest expense which rounds to less than 0.01%.
(e) The Investment Manager and certain of its affiliates agreed to waive/reimburse certain fees and expenses, if applicable.
(f) The benefits derived from expense reductions had an impact of less than 0.01%.
The Accompanying Notes to Financial Statements are an integral part of this statement.
66
Financial Highlights (continued) – Columbia LifeGoal Income Portfolio
| | | Year ended
Jan. 31, | | Year ended March 31, | |
| | | 2012(a) | | 2011 | | 2010 | | 2009 | | 2008 | | 2007 | |
| Class C | |
| Per share data | |
| Net asset value, beginning of period | | $ | 10.28 | | | $ | 9.88 | | | $ | 8.55 | | | $ | 9.81 | | | $ | 10.19 | | | $ | 9.97 | | |
| Income from investment operations: | |
| Net investment income | | | 0.20 | | | | 0.22 | | | | 0.28 | | | | 0.31 | | | | 0.36 | | | | 0.35 | | |
| Net realized and unrealized gain (loss) | | | 0.20 | | | | 0.40 | | | | 1.33 | | | | (1.20 | ) | | | (0.36 | ) | | | 0.24 | | |
| Total from investment operations | | | 0.40 | | | | 0.62 | | | | 1.61 | | | | (0.89 | ) | | | — | | | | 0.59 | | |
| Less distributions to shareholders from: | |
| Net investment income | | | (0.22 | ) | | | (0.22 | ) | | | (0.28 | ) | | | (0.33 | ) | | | (0.36 | ) | | | (0.36 | ) | |
| Net realized gains | | | — | | | | — | | | | — | | | | (0.04 | ) | | | (0.02 | ) | | | (0.01 | ) | |
| Total distributions to shareholders | | | (0.22 | ) | | | (0.22 | ) | | | (0.28 | ) | | | (0.37 | ) | | | (0.38 | ) | | | (0.37 | ) | |
| Net asset value, end of period | | $ | 10.46 | | | $ | 10.28 | | | $ | 9.88 | | | $ | 8.55 | | | $ | 9.81 | | | $ | 10.19 | | |
| Total return | | | 3.92 | % | | | 6.32 | % | | | 19.07 | % | | | (9.18 | %) | | | (0.05 | %) | | | 6.03 | % | |
| Ratios to average net assets(b) | |
Expenses prior to fees waived or expenses reimbursed
(including interest expense) | | | 1.98 | %(c)(d) | | | 1.99 | % | | | 2.00 | % | | | 1.81 | % | | | 1.89 | % | | | 1.96 | % | |
Net expenses after fees waived or expenses reimbursed
(including interest expense)(e) | | | 1.33 | %(c)(d) | | | 1.42 | % | | | 1.42 | % | | | 1.42 | % | | | 1.42 | %(f) | | | 1.42 | % | |
Expenses prior to fees waived or expenses reimbursed
(excluding interest expense) | | | 1.98 | %(c) | | | 1.99 | % | | | 2.00 | % | | | 1.81 | % | | | 1.89 | % | | | 1.96 | % | |
Net expenses after fees waived or expenses reimbursed
(excluding interest expense)(e) | | | 1.33 | %(c) | | | 1.42 | % | | | 1.42 | % | | | 1.42 | % | | | 1.42 | %(f) | | | 1.42 | % | |
| Net investment income | | | 2.26 | %(c) | | | 2.18 | % | | | 3.02 | % | | | 3.70 | % | | | 3.59 | %(f) | | | 3.44 | % | |
| Supplemental data | |
| Net assets, end of period (in thousands) | | $ | 5,562 | | | $ | 5,294 | | | $ | 5,573 | | | $ | 5,104 | | | $ | 4,932 | | | $ | 4,734 | | |
| Portfolio turnover | | | 66 | % | | | 109 | % | | | 35 | % | | | 51 | % | | | 24 | % | | | 42 | % | |
Notes to Financial Highlights
(a) For the period from April 1, 2011 to January 31, 2012. During the period, the Fund's fiscal year end was changed from March 31 to January 31.
(b) In addition to the fees and expenses which the Fund bears directly, the Fund indirectly bears a pro rata share of the fees and expenses of the underlying funds in which the Fund invests. Such indirect expenses are not included in the reported expense ratios.
(c) Annualized.
(d) Includes interest expense which rounds to less than 0.01%.
(e) The Investment Manager and certain of its affiliates agreed to waive/reimburse certain fees and expenses, if applicable.
(f) The benefits derived from expense reductions had an impact of less than 0.01%.
The Accompanying Notes to Financial Statements are an integral part of this statement.
67
Financial Highlights (continued) – Columbia LifeGoal Income Portfolio
| | | Year ended
Jan. 31, | | Year ended March 31, | |
| | | 2012(a) | | 2011 | | 2010 | | 2009 | | 2008 | | 2007 | |
| Class Z | |
| Per share data | |
| Net asset value, beginning of period | | $ | 10.31 | | | $ | 9.91 | | | $ | 8.57 | | | $ | 9.83 | | | $ | 10.22 | | | $ | 10.00 | | |
| Income from investment operations: | |
| Net investment income | | | 0.28 | | | | 0.32 | | | | 0.38 | | | | 0.42 | | | | 0.46 | | | | 0.46 | | |
| Net realized and unrealized gain (loss) | | | 0.21 | | | | 0.40 | | | | 1.34 | | | | (1.21 | ) | | | (0.37 | ) | | | 0.23 | | |
| Total from investment operations | | | 0.49 | | | | 0.72 | | | | 1.72 | | | | (0.79 | ) | | | 0.09 | | | | 0.69 | | |
| Less distributions to shareholders from: | |
| Net investment income | | | (0.30 | ) | | | (0.32 | ) | | | (0.38 | ) | | | (0.43 | ) | | | (0.46 | ) | | | (0.46 | ) | |
| Net realized gains | | | — | | | | — | | | | — | | | | (0.04 | ) | | | (0.02 | ) | | | (0.01 | ) | |
| Total distributions to shareholders | | | (0.30 | ) | | | (0.32 | ) | | | (0.38 | ) | | | (0.47 | ) | | | (0.48 | ) | | | (0.47 | ) | |
| Net asset value, end of period | | $ | 10.50 | | | $ | 10.31 | | | $ | 9.91 | | | $ | 8.57 | | | $ | 9.83 | | | $ | 10.22 | | |
| Total return | | | 4.88 | % | | | 7.37 | % | | | 20.33 | % | | | (8.25 | %) | | | 0.85 | % | | | 7.07 | % | |
| Ratios to average net assets(b) | |
Expenses prior to fees waived or expenses reimbursed
(including interest expense) | | | 0.98 | %(c)(d) | | | 0.99 | % | | | 1.00 | % | | | 0.81 | % | | | 0.89 | % | | | 0.96 | % | |
Net expenses after fees waived or expenses reimbursed
(including interest expense)(e) | | | 0.33 | %(c)(d) | | | 0.42 | % | | | 0.42 | % | | | 0.42 | % | | | 0.42 | %(f) | | | 0.42 | % | |
Expenses prior to fees waived or expenses reimbursed
(excluding interest expense) | | | 0.98 | %(c) | | | 0.99 | % | | | 1.00 | % | | | 0.81 | % | | | 0.89 | % | | | 0.96 | % | |
Net expenses after fees waived or expenses reimbursed
(excluding interest expense)(e) | | | 0.33 | %(c) | | | 0.42 | % | | | 0.42 | % | | | 0.42 | % | | | 0.42 | %(f) | | | 0.42 | % | |
| Net investment income | | | 3.24 | %(c) | | | 3.20 | % | | | 4.04 | % | | | 4.60 | % | | | 4.57 | %(f) | | | 4.50 | % | |
| Supplemental data | |
| Net assets, end of period (in thousands) | | $ | 2,521 | | | $ | 3,096 | | | $ | 4,475 | | | $ | 4,472 | | | $ | 5,813 | | | $ | 3,731 | | |
| Portfolio turnover | | | 66 | % | | | 109 | % | | | 35 | % | | | 51 | % | | | 24 | % | | | 42 | % | |
Notes to Financial Highlights
(a) For the period from April 1, 2011 to January 31, 2012. During the period, the Fund's fiscal year end was changed from March 31 to January 31.
(b) In addition to the fees and expenses which the Fund bears directly, the Fund indirectly bears a pro rata share of the fees and expenses of the underlying funds in which the Fund invests. Such indirect expenses are not included in the reported expense ratios.
(c) Annualized.
(d) Includes interest expense which rounds to less than 0.01%.
(e) The Investment Manager and certain of its affiliates agreed to waive/reimburse certain fees and expenses, if applicable.
(f) The benefits derived from expense reductions had an impact of less than 0.01%.
The Accompanying Notes to Financial Statements are an integral part of this statement.
68
Notes to Financial Statements – Columbia LifeGoal Portfolios
January 31, 2012
Note 1. Organization
Columbia Funds Series Trust (the Trust) is registered under the Investment Company Act of 1940, as amended (the 1940 Act), as an open-end management investment company organized as a Delaware statutory trust. Information presented in these financial statements pertains to the following series of the Trust (each a Portfolio and collectively, the Portfolios): Columbia LifeGoal Growth Portfolio, Columbia LifeGoal Balanced Growth Portfolio, Columbia LifeGoal Income and Growth Portfolio and Columbia LifeGoal Income Portfolio. Each Portfolio currently operates as a diversified portfolio.
Under normal circumstances, the Portfolios invest most of their assets in Class I shares of mutual funds managed by Columbia Management Investment Advisers, LLC (the Investment Manager) or its affiliates (Columbia Funds), exchange-traded funds (ETFs) and third party-advised funds (collectively, Underlying Funds), equity and fixed income securities, including Treasury Inflation Protected Securities (TIPS), and other instruments such as derivatives. The financial statements of the Underlying Funds in which the Portfolios invest should be read in conjunction with the Portfolios' financial statements.
Fiscal Year End Change
During the period, the Portfolios changed their fiscal year ends from March 31 to January 31.
Fund Shares
The Trust may issue an unlimited number of shares (without par value) that can be allocated among the separate series as designated by the Board of Trustees (the Board).
Columbia LifeGoal Growth Portfolio offers Class A, Class B, Class C, Class R, Class R4 and Class Z shares.
Columbia LifeGoal Balanced Growth Portfolio offers Class A, Class B, Class C, Class R, Class T and Class Z shares.
Columbia LifeGoal Income and Growth Portfolio offers Class A, Class B, Class C, Class R and Class Z shares.
Columbia LifeGoal Income Portfolio offers Class A, Class B, Class C and Class Z shares.
All share classes have identical voting, dividend and liquidation rights. Each share class has its own expense structure and sales charges, as applicable.
Class A shares are subject to a maximum front-end sales charge of 5.75% for each Portfolio with the exception of Columbia LifeGoal Income Portfolio. Class A shares of Columbia LifeGoal Income Portfolio are subject to a maximum front-end sales charge of 3.25% based on the initial investment amount. Class A shares purchased without an initial sales charge in accounts aggregating $1 million to $50 million at the time of purchase are subject to a contingent deferred sales charge (CDSC) if the shares are sold within 18 months of purchase, charged as follows: 1.00% CDSC if redeemed within 12 months of purchase, and 0.50% CDSC if redeemed more than 12, but less than 18, months after purchase.
Class B shares may be subject to a maximum CDSC of 5.00% (3.00% for Columbia LifeGoal Income Portfolio) based upon the holding period after purchase. Class B shares will generally convert to Class A shares eight years after purchase. The Portfolios no longer accept investments by new or existing investors in the Portfolios' Class B shares, except in connection with the reinvestment of any dividend and/or capital gain distributions in Class B shares of each Portfolio and exchanges by existing Class B shareholders of certain other funds within the Columbia Family of Funds.
Class C shares are subject to a 1.00% CDSC on shares redeemed within one year of purchase.
Class R shares are not subject to sales charges and are only available to qualifying institutional investors.
Class R4 shares are not subject to sales charges; however, this share class is closed to new investors.
Class T shares are subject to a maximum front-end sales charge of 5.75% based on the investment amount. Class T shares purchased without an initial sales charge in accounts aggregating $1 million to $50 million at the time of purchase are subject to a CDSC if the shares are sold within 18 months of purchase, charged as follows: 1.00% CDSC if redeemed within 12 months of purchase, and 0.50% CDSC if redeemed more than 12, but less than 18, months after purchase.
69
Columbia LifeGoal Portfolios, January 31, 2012 (continued)
Class Z shares are not subject to sales charges, and are only available to certain investors, as described in each Portfolio's prospectus.
Note 2. Summary of Significant Accounting Policies
Use of Estimates
The preparation of financial statements in accordance with U.S. generally accepted accounting principles (GAAP) requires management to make certain estimates and assumptions that affect the reported amounts of assets and liabilities, the disclosure of contingent assets and liabilities at the date of the financial statements and the reported amounts of revenue and expenses during the reporting period. Actual results could differ from those estimates.
The following is a summary of significant accounting policies consistently followed by the Portfolios in the preparation of their financial statements.
Security Valuation
Investments in the Underlying Funds are valued at the net asset value of each class of the respective Underlying Fund determined as of the close of the New York Stock Exchange on the valuation date.
All equity securities are valued at the close of business of the New York Stock Exchange (NYSE). Equity securities are valued at the last quoted sales price on the principal exchange or market on which they trade, except for securities traded on the NASDAQ Stock Market, which are valued at the NASDAQ official close price. Unlisted securities or listed securities for which there were no sales during the day are valued at the mean of the latest quoted bid and asked prices on such exchanges or markets.
Debt securities generally are valued by pricing services approved by the Board based upon market transactions for normal, institutional-size trading units of similar securities. The services may use various pricing techniques which take into account appropriate factors such as yield, quality, coupon rate, maturity, type of issue, trading characteristics and other data, as well as broker quotes. Debt securities for which quotations are readily available may also be valued based upon an over-the-counter or exchange bid quotation.
Foreign securities are valued based on quotations from the principal market in which such securities are normally traded. If any foreign share prices are not readily available as a result of limited share activity the securities are valued at the mean of the latest quoted bid and asked prices on such exchanges or markets. Foreign currency exchange rates are generally determined at 4:00 p.m. Eastern (U.S.) time. However, many securities markets and exchanges outside the U.S. close prior to the close of the NYSE; therefore, the closing prices for securities in such markets or on such exchanges may not fully reflect events that occur after such close but before the close of the NYSE. In those situations, foreign securities will be fair valued pursuant to the policy adopted by the Board, including utilizing a third party pricing service to determine these fair values. The third party pricing service takes into account multiple factors, including, but not limited to, movements in the U.S. securities markets, certain depositary receipts, futures contracts and foreign exchange rates that have occurred subsequent to the close of the foreign exchange, to determine a good faith estimate that reasonably reflects the current market conditions as of the close of the NYSE. The fair value of a security is likely to be different from the quoted or published price, if available.
Short-term securities purchased within 60 days to maturity are valued at amortized cost, which approximates market value. The value of short-term securities originally purchased with maturities greater than 60 days is determined based on an amortized value to par upon reaching 60 days to maturity. Short-term securities maturing in more than 60 days from the valuation date are valued at the market price or approximate market value based on current interest rates.
Futures and options on futures contracts are valued based upon the settlement price established each day by the board of trade or exchange on which they are traded.
Investments for which market quotations are not readily available, or that have quotations which management believes are not reliable, are valued at fair value as determined in good faith under consistently applied procedures established by and under the general supervision of the Board. If a security or class of securities (such as foreign securities) is valued at fair value, such value is likely to be different from the last quoted market price for the security. The determination of fair value often requires significant judgment. To determine fair value, management may use assumptions including but not limited
70
Columbia LifeGoal Portfolios, January 31, 2012 (continued)
to future cash flows and estimated risk premiums. Multiple inputs from various sources may be used to determine value.
Foreign Currency Transactions and Translation
The values of all assets and liabilities denominated in foreign currencies are translated into U.S. dollars at that day's exchange rates. Net realized and unrealized gains (losses) on foreign currency transactions and translations include gains (losses) arising from the fluctuation in exchange rates between trade and settlement dates on securities transactions, gains (losses) arising from the disposition of foreign currency and currency gains (losses) between the accrual and payment dates on dividends, interest income and foreign withholding taxes.
For financial statement purposes, the Portfolios do not distinguish that portion of gains (losses) on investments which is due to changes in foreign exchange rates from that which is due to changes in market prices of the investments. Such fluctuations are included with the net realized and unrealized gains (losses) on investments in the Statements of Operations.
Derivative Instruments
Each Portfolio may invest in certain derivative instruments as detailed below to meet its investment objectives. Derivatives are instruments whose values depend on, or are derived from, in whole or in part, the value of one or more other assets, such as securities, currencies, commodities or indices. Derivative instruments may be used to maintain cash reserves while maintaining exposure to certain other assets, to offset anticipated declines in values of investments, to facilitate trading, to reduce transaction costs and to pursue higher investment returns. Each Portfolio may also use derivative instruments to mitigate certain investment risks, such as foreign currency exchange rate risk, interest rate risk and credit risk. Derivatives may involve various risks, including the potential inability of the counterparty to fulfill its obligation under the terms of the contract, the potential for an illiquid secondary market and the potential for market movements which may expose the Portfolio to gains or losses in excess of the amount shown in the Statements of Assets and Liabilities.
Each Portfolio and any counterparty are required to maintain an agreement that requires the Portfolio and that counterparty to monitor (on a daily basis) the net fair value of all derivatives entered into pursuant to the agreement between the Portfolio and such counterparty. If the net fair value of such derivatives between the Portfolio and that counterparty exceeds a certain threshold (as defined in the agreement), the Portfolio or the counterparty (as the case may be) is required to post cash and/or securities as collateral. Fair values of derivatives presented in the financial statements are not netted with the fair value of other derivatives or with any collateral amounts posted by the Portfolio or any counterparty.
Futures Contracts
Futures contracts represent commitments for the future purchase or sale of an asset at a specified price on a specified date. Columbia LifeGoal Income Portfolio, Columbia LifeGoal Income and Growth Portfolio and Columbia LifeGoal Balanced Growth Portfolio each bought and sold futures contracts to manage the duration and yield curve exposure of the Portfolio versus the benchmark and to maintain appropriate equity market exposure while keeping sufficient cash to accommodate daily redemptions. Upon entering into futures contracts, the Portfolio bears risks which may include interest rates, exchange rates or securities prices moving unexpectedly, in which case, the Portfolio may not achieve the anticipated benefits of the futures contracts and may realize a loss. Additional risks include counterparty credit risk, the possibility of an illiquid market, and that a change in the value of the contract or option may not correlate with changes in the value of the underlying asset.
Upon entering into a futures contract, the Portfolio pledges cash or securities with the broker in an amount sufficient to meet the initial margin requirement. Subsequent payments (variation margin) are made or received by the Portfolio each day. The variation margin payments are equal to the daily change in the contract value and are recorded as variation margin receivable or payable and are offset in unrealized gains or losses. The Portfolio recognizes a realized gain or loss when the contract is closed or expires. Futures contracts involve, to varying degrees, risk of loss in excess of the variation margin disclosed in the Statement of Assets and Liabilities.
71
Columbia LifeGoal Portfolios, January 31, 2012 (continued)
Effects of Derivative Transactions in the Financial Statements
The following tables are intended to provide additional information about the effect of derivatives on the financial statements of the Portfolios, including: the fair value of derivatives by risk category and the location of those fair values in the Statements of Assets and Liabilities; the impact of derivative transactions on each Portfolios' operations over the period including realized gains or losses and unrealized gains or losses. The derivative schedules following certain Portfolio of Investments sections present additional information regarding derivative instruments outstanding at the end of the period, if any.
Columbia LifeGoal Balanced Growth Portfolio
| | | Fair Values of Derivative Instruments at January 31, 2012 | |
| | | Asset derivatives | | Liability derivatives | |
| Risk Exposure Category | | Statement of
Assets and
Liabilities Location | |
Fair Value | | Statement of
Assets and
Liabilities Location | | Fair Value | |
| Equity contracts | | Net assets—unrealized
appreciation on futures
contracts | | $ | 1,542,266 | * | | Net assets—unrealized
depreciation on futures
contracts | | $ | — | * | |
Interest rate contracts
| | Net assets—unrealized
appreciation on futures
contracts | | | 128,964 | * | | Net assets—unrealized
depreciation on futures
contracts | | | — | * | |
| Total | | | | $ | 1,671,230 | | | | | $ | — | | |
* Includes cumulative appreciation (depreciation) of futures contracts as reported in the Futures Contracts Outstanding table following the Portfolio of Investments. Only the current day's variation margin is reported in receivables or payables in the Statement of Assets and Liabilities.
Effect of Derivative Instruments in the Statement of
Operations for the Period Ended January 31, 2012
Amount of Realized Gain (Loss) on Derivatives Recognized in Income
| Risk Exposure Category | | Futures Contracts | |
| Equity contracts | | $ | 2,161,434 | | |
| Interest rate contracts | | | (10,708 | ) | |
| Total | | $ | 2,150,726 | | |
Change in Unrealized Appreciation (Depreciation) on Derivatives Recognized in Income
| Risk Exposure Category | | Futures Contracts | |
| Equity contracts | | $ | 1,542,266 | | |
| Interest rate contracts | | | 128,964 | | |
| Total | | $ | 1,671,230 | | |
Volume of Derivative Instruments for the Period Ended
January 31, 2012
| | | Contracts
Opened | |
| Futures contracts | | | 676 | | |
72
Columbia LifeGoal Portfolios, January 31, 2012 (continued)
Columbia LifeGoal Income and Growth Portfolio
| | | Fair Values of Derivative Instruments at January 31, 2012 | |
| | | Asset derivatives | | Liability derivatives | |
| Risk Exposure Category | | Statement of
Assets and
Liabilities Location | |
Fair Value | | Statement of
Assets and
Liabilities Location | | Fair Value | |
| Equity contracts | | Net assets—unrealized
appreciation on futures
contracts | | $ | 981 | * | | Net assets—unrealized
depreciation on futures
contracts | | $ | — | * | |
Interest rate contracts
| | Net assets—unrealized
appreciation on futures
contracts | | | 74,065 | * | | Net assets—unrealized
depreciation on futures
contracts | | | — | * | |
| Total | | | | $ | 75,046 | | | | | $ | — | | |
* Includes cumulative appreciation (depreciation) of futures contracts as reported in the Futures Contracts Outstanding table following the Portfolio of Investments. Only the current day's variation margin is reported in receivables or payables in the Statement of Assets and Liabilities.
Effect of Derivative Instruments in the Statement of
Operations for the Period Ended January 31, 2012
Amount of Realized Gain (Loss) on Derivatives Recognized in Income
| Risk Exposure Category | | Futures Contracts | |
| Equity contracts | | $ | 173,906 | | |
| Interest rate contracts | | | 289,100 | | |
| Total | | $ | 463,006 | | |
Change in Unrealized Appreciation (Depreciation) on Derivatives Recognized in Income
| Risk Exposure Category | | Futures Contracts | |
| Equity contracts | | $ | 981 | | |
| Interest rate contracts | | | 74,065 | | |
| Total | | $ | 75,046 | | |
Volume of Derivative Instruments for the Period Ended
January 31, 2012
| | | Contracts
Opened | |
| Futures contracts | | | 171 | | |
Columbia LifeGoal Income Portfolio
Fair Values of Derivative Instruments at January 31,
2012
At January 31, 2012, the Portfolio had no outstanding derivatives.
Columbia LifeGoal Income Portfolio
Effect of Derivative Instruments in the Statement of
Operations for the Period Ended January 31, 2012
Amount of Realized Gain (Loss) on Derivatives Recognized in Income
| Risk Exposure Category | | Futures Contracts | |
| Interest rate contracts | | $ | 17,004 | | |
Change in Unrealized Appreciation (Depreciation) on Derivatives Recognized in Income
| Risk Exposure Category | | Futures Contracts | |
| Interest rate contracts | | $ | — | | |
Volume of Derivative Instruments for the Period Ended
January 31, 2012
| | | Contracts
Opened | |
| Futures contracts | | | 9 | | |
Treasury Inflation Protected Securities
The Portfolios may invest in treasury inflation protected securities (TIPS). The principal amount of TIPS is adjusted periodically and is increased for inflation or decreased for deflation based on a monthly published index. Interest payments are based on the adjusted principal at the time the interest is paid. These adjustments are recorded as interest income in the Statements of Operations.
73
Columbia LifeGoal Portfolios, January 31, 2012 (continued)
Security Transactions
Security transactions are accounted for on the trade date. Cost is determined and gains (losses) are based upon the specific identification method for both financial statement and federal income tax purposes.
Income Recognition
Interest income is recorded on the accrual basis. Market premium and discount are amortized and accreted, respectively, on all debt securities, unless otherwise noted. Original issue discount is accreted to interest income over the life of the security with a corresponding increase in the cost basis, if any. For convertible securities, premiums attributable to the conversion feature are not amortized.
Corporate actions and dividend income are recorded net of any non-reclaimable tax withholdings, on the ex-dividend date or upon receipt of ex-dividend notification in the case of certain foreign securities.
Income and capital gain distributions from the Underlying Funds, if any, are recorded on the ex-dividend date.
Expenses
General expenses of the Trust are allocated to the Portfolios and other series of the Trust based upon relative net assets or other expense allocation methodologies determined by the nature of the expense. Expenses directly attributable to a Portfolio are charged to such Portfolio. Expenses directly attributable to a specific class of shares are charged to that share class.
Determination of Class Net Asset Value
All income, expenses (other than class-specific expenses which are charged directly to that share class, as shown in the Statement of Operations) and realized and unrealized gains (losses) are allocated to each class of a Portfolio on a daily basis, based on the relative net assets of each class, for purposes of determining the net asset value of each class.
Federal Income Tax Status
For federal income tax purposes, each Portfolio is treated as a separate entity. The Portfolios intend to qualify each year as separate regulated investment companies under Subchapter M of the Internal Revenue Code, as amended, and will distribute substantially all of their taxable income for their tax year, and as such will not be subject to federal income taxes. In addition, the Portfolios intend to distribute in each calendar year substantially all of their net investment income, capital gains and certain other amounts, if any, such that the Portfolios should not be subject to federal excise tax. Therefore, no federal income or excise tax provisions are recorded.
Foreign Taxes
The Portfolios may be subject to foreign taxes on income, gains on investments or currency repatriation, a portion of which may be recoverable. The Portfolios will accrue such taxes and recoveries, as applicable, based upon its current interpretation of tax rules and regulations that exist in the markets in which it invests.
Realized gains in certain countries may be subject to foreign taxes at the Portfolio level, based on statutory rates. Each Portfolio accrues for such foreign taxes on net realized and unrealized gains at the appropriate rate for each jurisdiction, as applicable.
Distributions to Shareholders
Distributions from net investment income, if any, are declared and paid quarterly for each Portfolio except Columbia LifeGoal Income Portfolio for which distributions from net investment income, if any, are declared and paid monthly. Net realized capital gains, if any, are distributed along with the income dividend. Income distributions and capital gain distributions are determined in accordance with federal income tax regulations which may differ from GAAP.
Guarantees and Indemnifications
Under the Trusts' organizational documents and, in some cases by contract, their officers and trustees are indemnified against certain liabilities arising out of the performance of their duties to the Trust or its portfolios. In addition, certain of the Portfolios' contracts with their service providers contain general indemnification clauses. The Portfolios' maximum exposure under these arrangements is unknown since the amount of any future claims that may be made against the Portfolios cannot be determined, and the Portfolios have no historical basis for predicting the likelihood of any such claims.
74
Columbia LifeGoal Portfolios, January 31, 2012 (continued)
Recent Accounting Pronouncement
Fair Value Measurements and Disclosures
In May 2011, the Financial Accounting and Standards Board (FASB) issued ASU No. 2011-04 modifying Topic 820, Fair Value Measurements and Disclosures. At the same time, the International Accounting Standards Board (IASB) issued International Financial Reporting Standard 13, Fair Value Measurement. The objective of the FASB and IASB is convergence of their guidance on fair value measurements and disclosures.
Specifically, ASU No. 2011-04 requires reporting entities to disclose i) the amounts of any transfers between Level 1 and Level 2, and the reasons for the transfers, ii) for Level 3 fair value measurements, a) quantitative information about significant unobservable inputs used, b) a description of the valuation processes used by the reporting entity and c) a narrative description of the sensitivity of the fair value measurement to changes in unobservable inputs if a change in those inputs might result in a significantly higher or lower fair value measurement. The effective date of ASU No. 2011-04 is for interim and annual periods beginning after December 15, 2011. At this time, management is evaluating the implications of this guidance and the impact it will have on the financial statement amounts and footnote disclosures, if any.
Note 3. Fees and Compensation Paid to Affiliates
Investment Management Fees
Under an Investment Management Services Agreement, the Investment Manager determines which securities will be purchased, held or sold. Effective May 1, 2011, the management fee is an annual fee that is a blend of (i) 0.00% on assets invested in funds that pay an investment advisory fee to the Investment Manager, (ii) 0.10% on assets invested in non-exchange traded third party advised mutual funds and (iii) 0.40% for Columbia LifeGoal Income Portfolio and 0.55% for all other Portfolios on assets invested in all other securities, including other funds advised by the Investment Manager that do not pay an investment advisory fee, ETFs, derivatives and individual securities.
Prior to May 1, 2011, the management fee for Columbia LifeGoal Growth Portfolio, Columbia LifeGoal Balanced Growth Portfolio and Columbia LifeGoal Income and Growth Portfolio was 0.25% of each Portfolio's average daily net assets. Also prior to May 1, 2011, the Investment Manager agreed to bear all fees and expenses of the Portfolios, excluding Columbia LifeGoal Income Portfolio, except investment management fees, taxes, brokerage commissions, costs of borrowing money, distribution and shareholder servicing fees and extraordinary expenses, if any (unified fee structure). Effective May 1, 2011, the unified fee structure was terminated and the Investment Manager no longer bears the fees and expenses of these Portfolios.
Prior to May 1, 2011, the management fee for Columbia LifeGoal Income Portfolio was 0.50% of the Portfolio's average daily net assets. The Investment Manager was entitled to receive an investment management fee based on Columbia LifeGoal Income Portfolio's assets that were invested in individual securities and the Mortgage- and Asset-Backed Portfolio and the Corporate Bond Portfolio, each of which is a series of the Trust. Columbia LifeGoal Income Portfolio was not charged a management fee on its assets that were invested in other Columbia Funds (excluding the Mortgage- and Asset-Backed Portfolio and the Corporate Bond Portfolio). Also prior to May 1, 2011, the Investment Manager contractually agreed to waive 0.10% of management fees payable by Columbia LifeGoal Income Portfolio on its assets that are invested in individual securities, the Mortgage- and Asset-Backed Portfolio and the Corporate Bond Portfolio.
The annualized effective management fee rates, net of any waivers, based on each Portfolio's average daily net assets for the period ended January 31, 2012 and the year ended March 31, 2011 were as follows:
| | | Period
Ended
January 31,
2012 | | Year
Ended
March 31,
2011 | |
| Columbia LifeGoal Growth Portfolio | | | 0.01 | % | | | 0.25 | % | |
Columbia LifeGoal Balanced
Growth Portfolio | | | 0.05 | % | | | 0.25 | % | |
Columbia LifeGoal Income and
Growth Portfolio | | | 0.09 | % | | | 0.25 | % | |
| Columbia LifeGoal Income Portfolio | | | 0.07 | % | | | 0.50 | % | |
75
Columbia LifeGoal Portfolios, January 31, 2012 (continued)
Administration Fees
Under an Administrative Services Agreement, the Investment Manager serves as the Portfolio Administrator. Effective May 1, 2011, the Portfolios pay the Portfolio Administrator an annual fee for administration and accounting services equal to 0.02% of each Portfolio's average daily net assets.
Prior to May 1, 2011, the administration fees for Columbia LifeGoal Growth Portfolio, Columbia LifeGoal Balanced Growth Portfolio and Columbia LifeGoal Income and Growth Portfolio were included in the unified fee structure and were paid by the Investment Manager. Prior to May 1, 2011, the administration fees for Columbia LifeGoal Income Portfolio was equal to the annual rate of 0.23% of the Portfolio's average daily net assets less the custody and pricing and bookkeeping fees that were payable by the Portfolio. Also prior to May 1, 2011, the Investment Manager contractually agreed to waive 0.10% of administration fees payable by Columbia LifeGoal Income Portfolio on its assets that are invested in Underlying Funds (excluding the Mortgage- and Asset-Backed Portfolio and the Corporate Bond Portfolio).
The annualized effective administration fee rates, net of any waivers, based on each Portfolio's average daily net assets for the period ended January 31, 2012 and the year ended March 31, 2011 were as follows:
| | | Period
Ended
January 31,
2012 | | Year
Ended
March 31,
2011 | |
| Columbia LifeGoal Growth Portfolio | | | 0.02 | % | | | 0.00 | % | |
Columbia LifeGoal Balanced
Growth Portfolio | | | 0.02 | % | | | 0.00 | % | |
Columbia LifeGoal Income and
Growth Portfolio | | | 0.02 | % | | | 0.00 | % | |
| Columbia LifeGoal Income Portfolio | | | 0.03 | % | | | 0.14 | % | |
Pricing and Bookkeeping Fees
Prior to May 16, 2011 for Columbia LifeGoal Growth Portfolio and June 27, 2011 for Columbia LifeGoal Balanced Growth Portfolio, Columbia LifeGoal Income and Growth Portfolio and Columbia LifeGoal Income Portfolio, the Portfolios had entered into a Financial Reporting Services Agreement (the Financial Reporting Services Agreement) with State Street Bank and Trust Company (State Street) and the Investment Manager pursuant to which State Street provided financial reporting services to the Portfolios. The Portfolios also entered into an Accounting Services Agreement (collectively with the Financial Reporting Services Agreement, the State Street Agreements) with State Street and the Investment Manager pursuant to which State Street provided accounting services to the Portfolios. Under the State Street Agreements, the Portfolios paid State Street an annual fee of $26,000 paid monthly, and also reimbursed State Street for certain out-of-pocket expenses and charges. Prior to May 1, 2011, the fees for pricing and bookkeeping for Columbia LifeGoal Growth Portfolio, Columbia LifeGoal Balanced Growth Portfolio, Columbia LifeGoal Income and Growth Portfolio were included in the unified fee structure and were paid by the Investment Manager.
Effective May 16, 2011 for Columbia LifeGoal Growth Portfolio and June 27, 2011 for Columbia LifeGoal Balanced Growth Portfolio, Columbia LifeGoal Income and Growth Portfolio and Columbia LifeGoal Income Portfolio, these services are now provided under the Administrative Services Agreement discussed above.
Other Fees
Effective June 1, 2011, other expenses are for, among other things, certain expenses of the Portfolios or the Board, including: Portfolio boardroom and office expense, employee compensation, employee health and retirement benefits, and certain other expenses. Payment of these Portfolio and Board expenses is facilitated by a company providing limited administrative services to the Portfolio and the Board. For the period June 1, 2011 through January 31, 2012, other expenses paid to this company were as follows:
| Columbia LifeGoal Growth Portfolio | | $ | 1,083 | | |
| Columbia LifeGoal Balanced Growth Portfolio | | | 1,083 | | |
| Columbia LifeGoal Income and Growth Portfolio | | | 1,083 | | |
| Columbia LifeGoal Income Portfolio | | | 1,083 | | |
76
Columbia LifeGoal Portfolios, January 31, 2012 (continued)
Compensation of Board Members
Under a Deferred Compensation Plan (the Plan), the Board members who are not "interested persons" of each Portfolio as defined under the 1940 Act may defer receipt of their compensation. Deferred amounts are treated as though equivalent dollar amounts had been invested in shares of each Portfolio or certain other funds managed by the Investment Manager. Each Portfolio's liability for these amounts is adjusted for market value changes and remains in the Portfolios until distributed in accordance with the Plan.
Compensation of Chief Compliance Officer
The Board has appointed a Chief Compliance Officer to the Portfolios in accordance with federal securities regulations. Effective April 1, 2011, the Portfolios' expenses associated with the Chief Compliance Officer are paid directly by Columbia.
Prior to April 1, 2011, Columbia LifeGoal Income Portfolio, along with other affiliated funds, paid its pro-rata share of the expenses for the Chief Compliance Officer. Such fees did not exceed $15,000 per year. Prior to April 1, 2011, the fees for the Chief Compliance Officer for Columbia LifeGoal Growth Portfolio, Columbia LifeGoal Balanced Growth Portfolio and Columbia LifeGoal Income and Growth Portfolio were included in the unified fee structure.
Transfer Agent Fees
Under a Transfer and Dividend Disbursing Agent Agreement, Columbia Management Investment Services Corp. (the Transfer Agent), an affiliate of the Investment Manager and a wholly-owned subsidiary of Ameriprise Financial, is responsible for providing transfer agency services to the Portfolios. The Transfer Agent has contracted with Boston Financial Data Services (BFDS) to serve as sub-transfer agent.
The Transfer Agent receives monthly account-based service fees based on the number of open accounts and is reimbursed by the Portfolios for the fees and expenses the Transfer Agent pays to financial intermediaries that maintain omnibus accounts with the Portfolios that is a percentage of the average aggregate value of each Portfolio's shares maintained in each such omnibus account (other than omnibus accounts for which American Enterprise Investment Services Inc. is the broker of record or accounts where the beneficial shareholder is a customer of Ameriprise Financial Services, Inc., which are paid a per account fee). The Transfer Agent pays the fees of BFDS for services as sub-transfer agent and is not entitled to reimbursement for such fees from the Portfolios.
The Transfer Agent also receives compensation from fees for various shareholder services and reimbursements for certain out-of -pocket expenses. Total transfer agent fees for Class R4 shares are subject to an annual limitation of not more than 0.05% of the average daily net assets attributable to each share class.
Prior to May 1, 2011, the transfer agent fees for Columbia LifeGoal Growth Portfolio, Columbia LifeGoal Balanced Growth Portfolio and Columbia LifeGoal Income and Growth Portfolio were included in the unified fee structure and were paid by the Investment Manager.
For the period ended January 31, 2012 and the year ended March 31, 2011, the Portfolios' annualized effective transfer agent fee rates as a percentage of average daily net assets of each class were as follows:
| | | Period Ended January 31, 2012 | |
| | | Class A | | Class B | | Class C | | Class R | | Class R4 | | Class T | | Class Z | |
| Columbia LifeGoal Growth Portfolio | | | 0.19 | % | | | 0.18 | % | | | 0.18 | % | | | 0.18 | % | | | 0.05 | % | | | N/A | | | | 0.17 | % | |
| Columbia LifeGoal Balanced Growth Porfolio | | | 0.15 | % | | | 0.14 | % | | | 0.15 | % | | | 0.16 | % | | | N/A | | | | 0.16 | % | | | 0.15 | % | |
| Columbia LifeGoal Income and Growth Portfolio | | | 0.16 | % | | | 0.14 | % | | | 0.16 | % | | | 0.17 | % | | | N/A | | | | N/A | | | | 0.15 | % | |
| Columbia LifeGoal Income Portfolio | | | 0.18 | % | | | 0.18 | % | | | 0.18 | % | | | N/A | | | | N/A | | | | N/A | | | | 0.18 | % | |
77
Columbia LifeGoal Portfolios, January 31, 2012 (continued)
| | | Year Ended March 31, 2011 | |
| | | Class A | | Class B | | Class C | | Class Z | |
| Columbia LifeGoal Income Portfolio | | | 0.15 | % | | | 0.15 | % | | | 0.15 | % | | | 0.15 | % | |
An annual minimum account balance fee of $20 may apply to certain accounts with a value below the Portfolios' initial minimum investment requirements to reduce the impact of small accounts on transfer agent fees. These minimum account balance fees are recorded as part of expense reductions in the Statements of Operations.
For the period ended January 31, 2012 and the year ended March 31, 2011, these minimum account balance fees reduced total expenses as follows:
| | | Period
Ended
January 31,
2012 | | Year
Ended
March 31,
2011 | |
| Columbia LifeGoal Growth Portfolio | | $ | 2,964 | | | $ | — | | |
Columbia LifeGoal Balanced
Growth Portfolio | | | 32,048 | | | | — | | |
Columbia LifeGoal Income and
Growth Portfolio | | | 280 | | | | — | | |
| Columbia LifeGoal Income Portfolio | | | — | | | | — | | |
Plan Administration Fees
Under a Plan Administration Services Agreement with the Transfer Agent, Columbia LifeGoal Growth Portfolio pays an annual fee at a rate of 0.25% of the Portfolio's average daily net assets attributable to Class R4 shares for the provision of various administrative, recordkeeping, communication and educational services.
Distribution and Service Fees
The Portfolios have an agreement with Columbia Management Investment Distributors, Inc. (the Distributor), an affiliate of the Investment Manager and a wholly-owned subsidiary of Ameriprise Financial, for distribution and shareholder services. Pursuant to Rule 12b-1 under the 1940 Act, the Board has approved, and the Portfolios have adopted, distribution and shareholder service plans (the Plans) which set the distribution and service fees for the Portfolios. These fees are calculated daily and are intended to compensate the Distributor and/or eligible selling and/or servicing agents for selling shares of the Portfolios and providing services to investors.
The Plans require the payment of a monthly combined distribution and service fee to the Distributor at the maximum annual rate of 0.25% of the average daily net assets attributable to Class A shares of each Portfolio. The Plans also require the payment of a monthly service fee at the maximum annual rate of 0.25% of the average daily net assets attributable to Class B and Class C shares of each Portfolio and the payment of a monthly distribution fee at the maximum annual rates of 0.75% of the average daily net assets attributable to Class B and Class C shares of each Portfolio. The Plans also require the payment of a monthly distribution fee at the maximum annual rate of 0.50% of the average daily net assets attributable to Class R shares of Columbia LifeGoal Growth Portfolio, Columbia LifeGoal Balanced Growth Portfolio and Columbia LifeGoal Income and Growth Portfolio.
Shareholder Services Fees
Columbia LifeGoal Balanced Growth Portfolio has adopted a shareholder services plan that permits it to pay for certain services provided to Class T shareholders by their selling and/or servicing agents. The Portfolio may pay shareholder servicing fees up to an aggregate annual rate of 0.50% of the Portfolio's average daily net assets attributable to Class T shares (comprised of up to 0.25% for shareholder liaison services and up to 0.25% for administrative support services). These fees are currently limited to an aggregate annual rate of not more than 0.30% of the Portfolio's average daily net assets attributable to Class T shares. The annualized shareholder services fees for the period ended January 31, 2012 and the year ended March 31, 2011 were 0.30% and 0.30%, respectively of the Portfolio's average daily net assets attributable to Class T shares.
78
Columbia LifeGoal Portfolios, January 31, 2012 (continued)
Sales Charges
Sales charges, including front-end and CDSCs, received by the Distributor for distributing each Portfolio's shares for the period ended January 31, 2012 and the year ended March 31, 2011, were as follows:
| | | Period Ended January 31, 2012 | |
| | | Class A | | Class B | | Class C | | Class T | |
| Columbia LifeGoal Growth Portfolio | | $ | 714,528 | | | $ | 39,575 | | | $ | 4,801 | | | $ | — | | |
| Columbia LifeGoal Balanced Growth Portfolio | | | 625,323 | | | | 21,587 | | | | 4,176 | | | | 4,240 | | |
| Columbia LifeGoal Income and Growth Portfolio | | | 86,408 | | | | 6,260 | | | | 1,296 | | | | — | | |
| Columbia LifeGoal Income Portfolio | | | 5,800 | | | | 511 | | | | 393 | | | | — | | |
| | | Year Ended March 31, 2011 | |
| | | Class A | | Class B | | Class C | |
| Columbia LifeGoal Growth Portfolio | | $ | 44,023 | | | $ | 67,582 | | | $ | 5,859 | | |
| Columbia LifeGoal Balanced Growth Portfolio | | | 88,517 | | | | 99,464 | | | | 5,151 | | |
| Columbia LifeGoal Income and Growth Portfolio | | | 17,709 | | | | 25,995 | | | | 1,302 | | |
| Columbia LifeGoal Income Portfolio | | | 1,357 | | | | 2,546 | | | | 229 | | |
Expenses Waived/Reimbursed by the Investment Manager and its Affiliates
Effective May 1, 2011, the Investment Manager and certain of its affiliates have contractually agreed to waive fees and/or reimburse expenses (excluding certain fees and expenses described below as well as any reorganization costs allocated to the Portfolios), through July 31, 2012, unless sooner terminated at the sole discretion of the Board, so that the Portfolios' net operating expenses, after giving effect to fees waived/expenses reimbursed and any balance credits and/or overdraft charges from the Portfolios' custodian, do not exceed the following annual rates as a percentage of the class' average daily net assets:
| | | Class A | | Class B | | Class C | | Class R | | Class R4 | | Class T | | Class Z | |
| Columbia LifeGoal Growth Portfolio | | | 0.45 | % | | | 1.20 | % | | | 1.20 | % | | | 0.70 | % | | | 0.39 | % | | | N/A | | | | 0.20 | % | |
| Columbia LifeGoal Balanced Growth Portfolio | | | 0.51 | % | | | 1.26 | % | | | 1.26 | % | | | 0.76 | % | | | N/A | | | | 0.56 | % | | | 0.26 | % | |
| Columbia LifeGoal Income and Growth Portfolio | | | 0.51 | % | | | 1.26 | % | | | 1.26 | % | | | 0.76 | % | | | N/A | | | | N/A | | | | 0.26 | % | |
| Columbia LifeGoal Income Portfolio | | | 0.51 | % | | | 1.26 | % | | | 1.26 | % | | | N/A | | | | N/A | | | | N/A | | | | 0.26 | % | |
Prior to May 1, 2011, the Investment Manager and its affiliates contractually agreed to waive fees and/or reimburse expenses of Columbia LifeGoal Income Portfolio (excluding certain fees and expenses described below as well as any reorganization costs allocated to the Portfolio), so that the Portfolio's net operating expenses, after giving effect to fees waived/expenses reimbursed and any balance credits and/or overdraft charges from the Portfolio's custodian, did not exceed the following annual rates as a percentage of the class' average daily net assets:
| Class A | | | 0.67 | % | |
| Class B | | | 1.42 | % | |
| Class C | | | 1.42 | % | |
| Class Z | | | 0.42 | % | |
79
Columbia LifeGoal Portfolios, January 31, 2012 (continued)
Under the agreement, the following fees and expenses are excluded from the waiver/reimbursement commitment, and therefore will be paid by the Portfolios, if applicable: taxes (including foreign transaction taxes), expenses associated with investments in affiliated and non-affiliated pooled investment vehicles (including mutual funds and exchange traded funds), transaction costs and brokerage commissions, costs related to any securities lending program, dividend expenses associated with securities sold short, inverse floater program fees and expenses, transaction charges and interest on borrowed money, interest, extraordinary expenses and any other expenses the exclusion of which is specifically approved by the Board. This agreement may be modified or amended only with approval from all parties. Reorganization (see Note 10) costs were allocated to the Portfolios only to the extent they are expected to be offset by the anticipated reduction in expenses borne by the Portfolios' shareholders during the first year following the Reorganization.
Note 4. Federal Tax Information
The timing and character of income and capital gain distributions are determined in accordance with income tax regulations, which may differ from GAAP because of temporary or permanent book to tax differences.
For the period ended January 31, 2012, these differences are primarily due to differing treatments for futures contracts, foreign currency transactions, short-term capital gain distributions from investments in mutual funds, post-October capital losses, capital loss carryforwards, Trustees' deferred compensation and deferral/reversal of wash sale losses. To the extent these differences are permanent, reclassifications are made among the components of the Portfolios' net assets in the Statements of Assets and Liabilities. Temporary differences do not require reclassifications. In the Statements of Assets and Liabilities the following reclassifications were made:
| Fund | | Undistributed
(Excess of
Distributions Over)
Net Investment
Income | | Accumulated
Net Realized
Gain (Loss) | | Paid-In capital | |
| Columbia LifeGoal Growth Portfolio | | $ | 1,573,496 | | | $ | (1,460,405 | ) | | $ | (113,091 | ) | |
| Columbia LifeGoal Balanced Growth Portfolio | | | 431,949 | | | | (4,179,305 | ) | | | 3,747,356 | | |
| Columbia LifeGoal Income and Growth Portfolio | | | 62,332 | | | | (62,333 | ) | | | 1 | | |
| Columbia LifeGoal Income Portfolio | | | 8,062 | | | | (8,061 | ) | | | (1 | ) | |
Net investment income and net realized gains (losses), as disclosed in the Statements of Operations, and net assets were not affected by these reclassifications.
The tax character of distributions paid during the period ended January 31, 2012 was as follows:
| | | Ordinary
Income | | Long-Term
Capital Gains | | Tax Return
of Capital | |
| Columbia LifeGoal Growth Portfolio | | $ | 2,784,356 | | | $ | — | | | $ | — | | |
| Columbia LifeGoal Balanced Growth Portfolio | | | 13,848,771 | | | | 1,649,451 | | | | — | | |
| Columbia LifeGoal Income and Growth Portfolio | | | 2,309,899 | | | | — | | | | — | | |
| Columbia LifeGoal Income Portfolio | | | 642,820 | | | | — | | | | — | | |
80
Columbia LifeGoal Portfolios, January 31, 2012 (continued)
The tax character of distributions paid during the period ended March 31, 2011 was as follows:
| | | Ordinary
Income | | Long-Term
Capital Gains | | Tax Return
of Capital | |
| Columbia LifeGoal Growth Portfolio | | $ | 1,834,980 | | | $ | — | | | $ | — | | |
| Columbia LifeGoal Balanced Growth Portfolio | | | 8,061,698 | | | | — | | | | — | | |
| Columbia LifeGoal Income and Growth Portfolio | | | 3,056,864 | | | | — | | | | — | | |
| Columbia LifeGoal Income Portfolio | | | 746,417 | | | | — | | | | — | | |
The tax character of distributions paid during the period ended March 31, 2010 was as follows:
| | | Ordinary
Income | | Long-Term
Capital Gains | | Tax Return
of Capital | |
| Columbia LifeGoal Growth Portfolio | | $ | 582,425 | | | $ | — | | | $ | — | | |
| Columbia LifeGoal Balanced Growth Portfolio | | | 11,426,591 | | | | — | | | | — | | |
| Columbia LifeGoal Income and Growth Portfolio | | | 4,022,943 | | | | — | | | | — | | |
| Columbia LifeGoal Income Portfolio | | | 1,066,508 | | | | — | | | | — | | |
Short-term capital gain distributions, if any, are considered ordinary income distributions for tax purposes.
At January 31, 2012, the components of distributable earnings on a tax basis were as follows:
| Fund | |
Undistributed
Ordinary Income | | Undistributed
Long-Term
Capital Gains | | Unrealized
Appreciation
(Depreciation) | |
| Columbia LifeGoal Growth Portfolio | | $ | 3,063,061 | | | $ | — | | | $ | 24,036,810 | | |
| Columbia LifeGoal Balanced Growth Portfolio | | | 577,853 | | | | 6,558,262 | | | | 1,944,279 | | |
| Columbia LifeGoal Income and Growth Portfolio | | | 240,555 | | | | 447,875 | | | | 3,203,234 | | |
| Columbia LifeGoal Income Portfolio | | | 28,748 | | | | — | | | | 512,084 | | |
At January 31, 2012, the cost of investments for federal income tax purposes along with the aggregate gross unrealized appreciation and depreciation based on that cost was:
| Fund | | Tax Cost | | Gross
Unrealized
Appreciation | | Gross
Unrealized
Depreciation | | Net
Appreciation
(Depreciation) | |
| Columbia LifeGoal Growth Portfolio | | $ | 740,476,106 | | | $ | 30,509,819 | | | $ | (6,473,009 | ) | | $ | 24,036,810 | | |
| Columbia LifeGoal Balanced Growth Portfolio | | | 1,087,642,816 | | | | 35,897,308 | | | | (33,953,029 | ) | | | 1,944,279 | | |
| Columbia LifeGoal Income and Growth Portfolio | | | 126,178,007 | | | | 3,901,740 | | | | (698,506 | ) | | | 3,203,234 | | |
| Columbia LifeGoal Income Portfolio | | | 26,121,932 | | | | 514,338 | | | | (2,254 | ) | | | 512,084 | | |
81
Columbia LifeGoal Portfolios, January 31, 2012 (continued)
The following capital loss carryforwards, determined at January 31, 2012, may be available to reduce taxable income arising from future net realized gains on investments, if any, to the extent permitted by the Internal Revenue Code:
| Fund | | 2016 | | 2017 | | 2018 | | 2019 | | Total | |
| Columbia LifeGoal Growth Portfolio | | $ | 2,416,522 | | | $ | 60,295,998 | | | $ | 47,841,948 | | | $ | 1,684,583 | | | $ | 112,239,051 | | |
| Columbia LifeGoal Balanced Growth Portfolio | | | — | | | | — | | | | — | | | | — | | | | — | | |
| Columbia LifeGoal Income and Growth Portfolio | | | — | | | | — | | | | — | | | | — | | | | — | | |
| Columbia LifeGoal Income Portfolio | | | — | | | | — | | | | 215,582 | | | | — | | | | 215,582 | | |
On December 22, 2010, the Regulated Investment Company Modernization Act of 2010 (the Act) was enacted, which changed various technical rules governing the tax treatment of regulated investment companies. The changes are generally effective for taxable years beginning after the date of enactment. Under the Act, the Portfolios will be permitted to carry forward capital losses incurred in taxable years beginning after the date of enactment for an unlimited period. However, any losses incurred during those future taxable years will be required to be utilized prior to the losses incurred in pre-enactment taxable years, which carry an expiration date. As a result of this ordering rule, pre-enactment capital loss carryforwards may be more likely to expire unused.
For the period ended January 31, 2012, the amounts of capital loss carryforwards utilized were as follows:
| Fund | | Utilized | |
| Columbia LifeGoal Growth Portfolio | | $ | 30,472,998 | | |
Columbia LifeGoal Balanced
Growth Portfolio | | | 54,850,473 | | |
Columbia LifeGoal Income and
Growth Portfolio | | | 5,895,816 | | |
| Columbia LifeGoal Income Portfolio | | | 648,013 | | |
Columbia LifeGoal Growth Portfolio acquired capital loss carryforward in connection with the merger with Columbia Portfolio Builder Total Equity Fund of $67,261,396 (Note 11). In addition to the acquired capital loss carryforward, the Portfolio also acquired unrealized capital gain as a result of the merger. The yearly utilization of the acquired capital loss carryforward may be limited by the Internal Revenue Code. Any capital loss carryforward acquired as part of a merger that is permanently lost due to the provisions under the Internal Revenue Code is included as being expired.
Columbia LifeGoal Balanced Growth Portfolio acquired capital loss carryforwards in connection with the merger with Columbia Asset Allocation Fund, Columbia Asset Allocation Fund II and Columbia Liberty Fund of $0, $3,101,021 and $0, respectively (Note 11). In addition to the acquired capital loss carryforwards, the Portfolio also acquired unrealized capital gains as a result of the merger. These acquired capital loss carryforwards were utilized in full during the current fiscal year.
Under current tax rules, Regulated Investment Companies can elect to treat certain late-year ordinary losses incurred and post-October capital losses (capital losses realized after October 31) as arising on the first day of the following taxable year. As of January 31, 2012, the Portfolios will elect to treat the following post-October capital losses as arising on February 1, 2012:
| Columbia LifeGoal Growth Portfolio | | $ | 2,899,522 | | |
Columbia LifeGoal Balanced
Growth Portfolio | | | 2,102,116 | | |
Columbia LifeGoal Income and
Growth Portfolio | | | 54,692 | | |
| Columbia LifeGoal Income Portfolio | | | — | | |
Management of the Portfolios has concluded that there are no significant uncertain tax positions that would require recognition in the financial statements. However, management's conclusion may be subject to review and adjustment at a later date based on factors including, but not limited to, new tax laws, regulations, and administrative interpretations (including
82
Columbia LifeGoal Portfolios, January 31, 2012 (continued)
relevant court decisions). Generally, the Portfolios' federal tax returns for the prior three fiscal years remain subject to examination by the Internal Revenue Service.
Note 5. Portfolio Information
For the period January 31, 2012, the cost of purchases and proceeds from sales of securities, excluding short-term obligations, for each Portfolio aggregated to:
| | | U.S. Government Securities | | Investment Securities | |
| Fund | | Purchases | | Proceeds | | Purchases | | Proceeds | |
| Columbia LifeGoal Growth Portfolio | | $ | — | | | $ | — | | | $ | 582,451,084 | | | $ | 648,340,386 | | |
| Columbia LifeGoal Balanced Growth Portfolio | | | 15,586,792 | | | | 361,894 | | | | 456,333,443 | | | | 602,118,690 | | |
| Columbia LifeGoal Income and Growth Portfolio | | | 1,242,513 | | | | 869,822 | | | | 71,323,077 | | | | 80,755,107 | | |
| Columbia LifeGoal Income Portfolio | | | 204,286 | | | | 428,262 | | | | 16,872,122 | | | | 17,659,373 | | |
Note 6. Regulatory Settlements
During the period ended January 31, 2012, Columbia LifeGoal Balanced Growth Portfolio received payments of $4,433 resulting from certain regulatory settlements with third parties in which the Portfolio had participated. The payments have been included in "Proceeds from regulatory settlements" in the Statement of Changes in Net Assets.
During the year ended March 31, 2010, Columbia LifeGoal Growth Portfolio received payments of $7,713 resulting from certain regulatory settlements with third parties in which the Portfolio had participated. The payments have been included in "Proceeds from regulatory settlements" in the Statement of Changes in Net Assets.
Note 7. Custody Credits
Prior to June 27, 2011, Columbia LifeGoal Income and Growth Portfolio had an agreement with its custodian bank under which custody fees may have been reduced by balance credits. These credits are recorded as part of expense reductions on the Statement of Operations. The Fund could have invested a portion of the assets utilized in connection with the expense offset arrangement in an income-producing asset if they had not entered into such an agreement. Subsequent to this date, the Fund may invest its daily balance in an affiliated money market fund as detailed below. For the period April 1, 2011 through June 26, 2011, these credits reduced total expenses by $6.
Note 8. Investments in Underlying Affiliated Funds Over 5%
The Portfolios do not invest in the Underlying Funds for the purpose of exercising management or control. At January 31, 2012, each Portfolio held the following positions, which exceeded 5% of the underlying fund's shares outstanding:
Columbia LifeGoal Growth Portfolio
| Underlying Fund | | Percent of
Shares Held | |
| Columbia Pacific/Asia Fund | | | 26.53 | % | |
| Columbia Emerging Markets Fund | | | 10.90 | | |
| Columbia Convertible Securities Fund | | | 8.32 | | |
Columbia Absolute Return Enhanced
Multi-Strategy Fund | | | 7.10 | | |
| Columbia Large Value Quantitative Fund | | | 5.76 | | |
| Columbia Large Growth Quantitative Fund | | | 5.45 | | |
83
Columbia LifeGoal Portfolios, January 31, 2012 (continued)
Columbia LifeGoal Balanced Growth Portfolio
| Underlying Fund | | Percent of
Shares Held | |
| Columbia Overseas Value Fund | | | 84.16 | % | |
| Mortgage- and Asset-Backed Portfolio | | | 43.61 | | |
| Columbia International Bond Fund | | | 31.93 | | |
Columbia Absolute Return Currency and
Income Fund | | | 18.06 | | |
| Columbia Absolute Return Multi-Strategy Fund | | | 15.16 | | |
| Columbia European Equity Fund | | | 10.40 | | |
| Columbia Emerging Markets Fund | | | 7.42 | | |
| Columbia Greater China Fund | | | 6.98 | | |
| Columbia Large Value Quantitative Fund | | | 6.36 | | |
| Columbia Pacific/Asia Fund | | | 6.17 | | |
| Columbia Corporate Income Fund | | | 5.98 | | |
Columbia LifeGoal Income and Growth Portfolio
| Underlying Fund | | Percent of
Shares Held | |
| Mortgage- and Asset-Backed Portfolio | | | 10.62 | % | |
| Columbia International Bond Fund | | | 7.43 | | |
Note 9. Shareholder Concentration
At January 31, 2012, certain shareholder accounts owned more than 10% of the outstanding shares of one or more of the Portfolios. For unaffiliated shareholder accounts, the Portfolios have no knowledge about whether any portion of those shares was owned beneficially. Subscription and redemption activity of these accounts may have a significant effect on the operations of the Portfolios. The number of accounts and aggregate percentages of shares outstanding held therein were as follows:
| | | Number of
Unaffiliated
Shareholders | | Percentage
of Shares
Outstanding
Held | |
Columbia LifeGoal Growth
Portfolio | | | 1 | | | | 27.9 | % | |
Columbia LifeGoal Balanced
Growth Portfolio | | | 1 | | | | 41.4 | % | |
Columbia LifeGoal Income
and Growth Portfolio | | | 1 | | | | 57.0 | % | |
Columbia LifeGoal Income
Portfolio | | | 2 | | | | 60.5 | % | |
Note 10. Line of Credit
Each Portfolio has entered into a revolving credit facility with a syndicate of banks led by JPMorgan Chase Bank, N.A. (the Administrative Agent), whereby the Portfolios may borrow for the temporary funding of shareholder redemptions or for other temporary or emergency purposes. The credit facility became effective on May 16, 2011 for Columbia LifeGoal Growth Portfolio and June 27, 2011 for Columbia LifeGoal Balanced Growth Portfolio, Columbia LifeGoal Income and Growth Portfolio and Columbia LifeGoal Income Portfolio, replacing a prior credit facility. The credit facility agreement, which is a collective agreement between the Portfolios and certain other funds managed by the Investment Manager, severally and not jointly, permits collective borrowings up to $500,000,000. Pursuant to a December 13, 2011 amendment to the credit facility agreement, interest is charged to each participating fund based on its borrowings at a rate equal to the higher of (i) the overnight federal funds rate plus 1.00% or (i) the
84
Columbia LifeGoal Portfolios, January 31, 2012 (continued)
one-month LIBOR rate plus 1.00%. Each borrowing under the credit facility matures no later than 60 days after the date of borrowing. The Fund also pays a commitment fee equal to its pro rata share of the amount of the credit facility at a rate of 0.08% per annum.
For the period May 16, 2011 through December 13, 2011 for Columbia LifeGoal Growth Portfolio and for the period June 27, 2011 through December 13, 2011 for Columbia LifeGoal Balanced Growth Portfolio, Columbia LifeGoal Income and Growth Portfolio and Columbia LifeGoal Income Portfolio, interest was charged to each fund based on its borrowings at a rate equal to the sum of the federal funds rate plus (i) 1.25% per annum plus (ii) if one-month LIBOR exceeds the federal funds rate, the amount of such excess. Each Portfolio also paid a commitment fee equal to its pro rata share of the amount of the credit facility at a rate of 0.10% per annum.
For the period May 16, 2011 through June 26, 2011, Columbia LifeGoal Balanced Growth Portfolio, Columbia LifeGoal Income and Growth Portfolio and Columbia LifeGoal Income Portfolio and certain other funds managed by the Investment Manager participated in a $150,000,000 committed, unsecured revolving credit facility provided by State Street. Prior to May 16, 2011, each Portfolio and certain other funds managed by the Investment Manager participated in a $225,000,000 committed, unsecured revolving credit facility provided by State Street. Interest was charged to each Portfolio based on its borrowings at a rate equal to the greater of the (i) federal funds rate plus 1.25% per annum or (ii) the overnight LIBOR rate plus 1.25% per annum. Each Portfolio also paid a commitment fee equal to its pro rata share of the amount of the credit facility at a rate of 0.15% per annum.
The average daily loan balance outstanding for each Portfolio on days when borrowings existed was as follows:
| Fund | | Period Ended
January 31, 2012
Average Daily
Loan Balance
Outstanding | | Period Ended
January 31, 2012
Weighted
Average
Interest Rate | | Year Ended
March 31, 2011
Average Daily
Loan Balance
Outstanding | | Year Ended
March 31, 2011
Weighted
Average
Interest Rate | |
| Columbia LifeGoal Balanced Growth Portfolio | | $ | 1,500,000 | | | | 1.38 | % | | $ | 1,000,000 | | | | 1.49 | % | |
| Columbia LifeGoal Income and Growth Portfolio | | | 4,900,000 | | | | 1.38 | % | | | — | | | | — | | |
| Columbia LifeGoal Income Portfolio | | | 4,100,000 | | | | 1.38 | % | | | — | | | | — | | |
Note 11. Fund Merger
At the close of business on June 3, 2011, Columbia LifeGoal Growth Portfolio acquired the assets and assumed the identified liabilities of Columbia Portfolio Builder Total Equity Fund, a series of RiverSource Market Advantage Series, Inc. The reorganization was completed after shareholders of the acquired fund approved the plan on February 15, 2011. The purpose of the transaction was to combine two funds managed by the Investment Manager with comparable investment objectives and strategies.
The aggregate net assets of Columbia LifeGoal Growth Portfolio immediately before the acquisition were $389,808,690 and the combined net assets immediately after the acquisition were $872,698,599.
The merger was accomplished by a tax-free exchange of 46,780,747 shares of Columbia Portfolio Builder Total Equity Fund valued at $482,889,909 (including $48,740,099 of unrealized appreciation).
In exchange for Columbia Portfolio Builder Total Equity Fund shares, Columbia LifeGoal Growth Portfolio issued the following number of shares:
| | | Shares | |
| Class A | | | 33,362,333 | | |
| Class B | | | 4,532,209 | | |
| Class C | | | 2,788,845 | | |
| Class R4 | | | 23,841 | | |
85
Columbia LifeGoal Portfolios, January 31, 2012 (continued)
For financial reporting purposes, net assets received and shares issued by Columbia LifeGoal Growth Portfolio were recorded at fair value; however, Columbia Portfolio Builder Total Equity Fund's cost of investments were carried forward .
The financial statements reflect the operations of Columbia LifeGoal Growth Portfolio for the period prior to the merger and the combined fund for the period subsequent to the merger. Because the combined investment portfolios have been managed as a single integrated portfolio since the merger was completed, it is not practicable to separate the amounts of revenue and earnings of Columbia Portfolio Builder Total Equity Fund that have been included in the combined Portfolio's Statement of Operations since the merger was completed.
Assuming the merger had been completed on April 1, 2011, Columbia LifeGoal Growth Portfolio's pro-forma net investment income, net gain on investments, net change in unrealized depreciation and net decrease in net assets from operations for the period ended January 31, 2012 would have been approximately $4.2 million, $49.8 million, $(98.3) million, and $(44.3) million, respectively.
At the close of business on April 29, 2011, Columbia LifeGoal Balanced Growth Portfolio acquired the assets and assumed the identified liabilities of Columbia Asset Allocation Fund, and Columbia Liberty Fund, each a series of Columbia Funds Series Trust I and Columbia Asset Allocation Fund II, a series of Columbia Funds Series Trust. The mergers were completed after shareholders of the acquired funds approved the plan on February 15, 2011.
The aggregate net assets of Columbia LifeGoal Balanced Growth Portfolio immediately before the acquisitions were $583,478,641 and the combined net assets immediately after the acquisitions were $1,272,070,906.
The acquisitions were accomplished by a tax-free exchange of 15,288,797 shares of Columbia Asset Allocation Fund valued at $229,967,429 (including unrealized appreciation of $14,938,823); 4,579,184 shares of Columbia Asset Allocation Fund II valued at $99,286,174 (including unrealized appreciation of $3,692,061) and 42,804,120 shares of Columbia Liberty Fund valued at $359,338,662 (including unrealized appreciation of $17,249,085).
In exchange for shares of Columbia Asset Allocation Fund, Columbia Asset Allocation Fund II, and Columbia Liberty Fund, Columbia LifeGoal Balanced Growth Portfolio issued the following number of shares:
| | | Columbia Asset
Allocation Fund | | Columbia Asset
Allocation Fund II | | Columbia
Liberty Fund | |
| Class A | | | 877,276 | | | | 5,870,179 | | | | 29,248,018 | | |
| Class B | | | 215,821 | | | | 85,458 | | | | 459,752 | | |
| Class C | | | 165,196 | | | | 80,144 | | | | 339,612 | | |
| Class T | | | 9,782,229 | | | | — | | | | — | | |
| Class Z | | | 8,263,848 | | | | 2,295,741 | | | | 91,404 | | |
For financial reporting purposes, net assets received and shares issued by Columbia LifeGoal Balanced Growth Portfolio were recorded at fair value; however, Columbia Asset Allocation Fund, Columbia Asset Allocation Fund II, and Columbia Liberty Fund's cost of investments were carried forward.
The financial statements reflect the operations of Columbia LifeGoal Balanced Growth Portfolio for the period prior to the mergers and the combined fund for the period subsequent to the mergers. Because the combined investment portfolios have been managed as a single integrated portfolio since the mergers were completed, it is not practicable to separate the amounts of revenue and earnings of Columbia Asset Allocation Fund, Columbia Asset Allocation Fund II, and Columbia Liberty Fund that have been included in the combined Fund's Statement of Operations since the mergers were completed.
86
Columbia LifeGoal Portfolios, January 31, 2012 (continued)
Assuming the mergers had been completed on April 1, 2011, Columbia LifeGoal Balanced Growth Portfolio's pro-forma net investment income, net gain on investments, net change in unrealized depreciation and net decrease in net assets from operations for the period ended January 31, 2012 would have been approximately $14.6 million, $75.2 million, $(109.4) million, and $(19.6) million, respectively.
Note 12. Significant Risks
Allocation Risk
Each Portfolio uses an asset allocation strategy in pursuing its investment objective. There is a risk that a Portfolio's allocation among asset classes or investments will cause the Portfolio to under-perform other funds with similar investment objectives, or that the investments themselves will not produce the returns expected.
Investing in Other Funds Risk
The performance of the Underlying Funds in which the Portfolios invest could be adversely affected if other entities investing in the same Underlying Funds make relatively large investments or redemptions in the Underlying Funds. Because the expenses and costs of the Underlying Funds are shared by the Portfolios, redemptions by other investors in the Underlying Funds could result in decreased economies of scale and increased operating expenses for the Portfolios. In addition, the Investment Manager has the authority to change the Underlying Funds in which the Portfolios invest or to change the percentage of each Portfolio's investments allocated to each Underlying Fund. If an Underlying Fund pays fees to the Investment Manager, such fees could result in the Investment Manager having a potential conflict of interest in selecting the Underlying Funds in which the Portfolios invest or in determining the percentage of the Portfolios' investments allocated to each Underlying Fund.
Note 13. Subsequent Events
Management has evaluated the events and transactions that have occurred through the date the financial statements were issued and noted no items requiring adjustment of the financial statements or additional disclosure.
Note 14. Information Regarding Pending and Settled Legal Proceedings
In June 2004, an action captioned John E. Gallus et al. v. American Express Financial Corp. and American Express Financial Advisors Inc. was filed in the United States District Court for the District of Arizona. The plaintiffs allege that they are investors in several American Express Company mutual funds (currently branded as Columbia) and they purport to bring the action derivatively on behalf of those funds under the Investment Company Act of 1940. The plaintiffs allege that fees allegedly paid to the defendants by the funds for investment advisory and administrative services are excessive. The plaintiffs seek remedies including restitution and rescission of investment advisory and distribution agreements. The plaintiffs voluntarily agreed to transfer this case to the United States District Court for the District of Minnesota (the District Court). In response to defendants' motion to dismiss the complaint, the District Court dismissed one of plaintiffs' four claims and granted plaintiffs limited discovery. Defendants moved for summary judgment in April 2007. Summary judgment was granted in the defendants' favor on July 9, 2007. The plaintiffs filed a notice of appeal with the Eighth Circuit Court of Appeals (the Eighth Circuit) on August 8, 2007. On April 8, 2009, the Eighth Circuit reversed summary judgment and remanded to the District Court for further proceedings. On August 6, 2009, defendants filed a writ of certiorari with the U.S. Supreme Court (the Supreme Court), asking the Supreme Court to stay the District Court proceedings while the Supreme Court considers and rules in a case captioned Jones v. Harris Associates, which involves issues of law similar to those presented in the Gallus case. On March 30, 2010, the Supreme Court issued its ruling in Jones v. Harris Associates, and on April 5, 2010, the Supreme Court vacated the Eighth Circuit's decision in the Gallus case and remanded the case to the Eighth Circuit for further consideration in light of the Supreme Court's decision in Jones v. Harris Associates. On June 4, 2010, the Eighth Circuit remanded the Gallus case to the District Court for further consideration in light of the Supreme Court's decision in Jones v. Harris Associates. On December 9, 2010, the District Court reinstated its July 9, 2007 summary judgment order in favor of the defendants. On January 10, 2011, plaintiffs filed a notice of appeal with the Eighth Circuit. In response to the plaintiffs' opening appellate brief filed on March 18, 2011, the defendants filed a response
87
Columbia LifeGoal Portfolios, January 31, 2012 (continued)
brief on May 4, 2011 with the Eighth Circuit. The plaintiffs filed a reply brief on May 26, 2011 and oral arguments took place on November 17, 2011.
In December 2005, without admitting or denying the allegations, American Express Financial Corporation (AEFC, which is now known as Ameriprise Financial, Inc. (Ameriprise Financial)) entered into settlement agreements with the Securities and Exchange Commission (SEC) and Minnesota Department of Commerce (MDOC) related to market timing activities. As a result, AEFC was censured and ordered to cease and desist from committing or causing any violations of certain provisions of the Investment Advisers Act of 1940, the Investment Company Act of 1940, and various Minnesota laws. AEFC agreed to pay disgorgement of $10 million and civil money penalties of $7 million. AEFC also agreed to retain an independent distribution consultant to assist in developing a plan for distribution of all disgorgement and civil penalties ordered by the SEC in accordance with various undertakings detailed at www.sec.gov/litigation/admin/ia-2451.pdf. Ameriprise Financial and its affiliates have cooperated with the SEC and the MDOC in these legal proceedings, and have made regular reports to the funds' Boards of Trustees.
Ameriprise Financial and certain of its affiliates have historically been involved in a number of legal, arbitration and regulatory proceedings, including routine litigation, class actions, and governmental actions, concerning matters arising in connection with the conduct of their business activities. Ameriprise Financial believes that the Funds are not currently the subject of, and that neither Ameriprise Financial nor any of its affiliates are the subject of, any pending legal, arbitration or regulatory proceedings that are likely to have a material adverse effect on the Funds or the ability of Ameriprise Financial or its affiliates to perform under their contracts with the Funds. Ameriprise Financial is required to make 10-Q, 10-K and, as necessary, 8-K filings with the Securities and Exchange Commission on legal and regulatory matters that relate to Ameriprise Financial and its affiliates. Copies of these filings may be obtained by accessing the SEC website at www.sec.gov.
There can be no assurance that these matters, or the adverse publicity associated with them, will not result in increased fund redemptions, reduced sale of fund shares or other adverse consequences to the Funds. Further, although we believe proceedings are not likely to have a material adverse effect on the Funds or the ability of Ameriprise Financial or its affiliates to perform under their contracts with the Funds, these proceedings are subject to uncertainties and, as such, we are unable to estimate the possible loss or range of loss that may result. An adverse outcome in one or more of these proceedings could result in adverse judgments, settlements, fines, penalties or other relief that could have a material adverse effect on the consolidated financial condition or results of operations of Ameriprise Financial.
88
Report of Independent Registered Public Accounting Firm
To the Trustees of Columbia Funds Series Trust
In our opinion, the accompanying statements of assets and liabilities, including the investment portfolios, and the related statements of operations and of changes in net assets and the financial highlights present fairly, in all material respects, the financial position of Columbia LifeGoal Growth Portfolio, Columbia LifeGoal Balanced Growth Portfolio, Columbia LifeGoal Income and Growth Portfolio, and Columbia LifeGoal Income Portfolio (the "Portfolios") (each a series of Columbia Funds Series Trust) at January 31, 2012, the results of their operations changes in each of their net assets and the financial highlights for each of the periods indicated, in conformity with accounting principles generally accepted in the United States of America. These financial statements and financial highlights (hereafter referred to as "financial statements") are the responsibility of the Portfolios' management. Our responsibility is to express an opinion on these financial statements based on our audits. We conducted our audits of these financial statements in accordance with the standards of the Public Company Accounting Oversight Board (United States). Those standards require that we plan and perform the audit to obtain reasonable assurance about whether the financial statements are free of material misstatement. An audit includes examining, on a test basis, evidence supporting the amounts and disclosures in the financial statements, assessing the accounting principles used and significant estimates made by management, and evaluating the overall financial statement presentation. We believe that our audits, which included confirmation of securities at January 31, 2012 by correspondence with the transfer agent, custodian and brokers, provide a reasonable basis for our opinion.
PricewaterhouseCoopers LLP
Minneapolis, Minnesota
March 23, 2012
89
Federal Income Tax Information (Unaudited) – Columbia LifeGoal Portfolios
Columbia LifeGoal Growth Portfolio
For non-corporate shareholders, 100.00%, or the maximum amount allowable under the Jobs and Growth Tax Relief Reconciliation Act of 2003, of the ordinary income distributed by the Portfolio for the fiscal year ended January 31, 2012 may represent qualified dividend income.
100.00% of the ordinary income distributed by the Portfolio for the fiscal year ended January 31, 2012, qualifies for the corporate dividends received deduction.
The Portfolio will notify shareholders in January 2013 of amounts for use in preparing 2012 income tax returns.
Columbia LifeGoal Balanced Growth Portfolio
The Portfolio hereby designates as a capital gain dividend with respect to the fiscal year ended January 31, 2012, $8,618,099, or, if subsequently determined to be different, the net capital gain of such year.
For non-corporate shareholders, 38.67%, or the maximum amount allowable under the Jobs and Growth Tax Relief Reconciliation Act of 2003, of the ordinary income distributed by the Portfolio for the fiscal year ended January 31, 2012 may represent qualified dividend income.
29.28% of the ordinary income distributed by the Portfolio for the fiscal year ended January 31, 2012, qualifies for the corporate dividends received deduction.
The Portfolio will notify shareholders in January 2013 of amounts for use in preparing 2012 income tax returns.
Columbia LifeGoal Income and Growth Portfolio
The Portfolio hereby designates as a capital gain dividend with respect to the fiscal year ended January 31, 2012, $470,269, or, if subsequently determined to be different, the net capital gain of such year.
For non-corporate shareholders, 13.53%, or the maximum amount allowable under the Jobs and Growth Tax Relief Reconciliation Act of 2003, of the ordinary income distributed by the Portfolio for the fiscal year ended January 31, 2012 may represent qualified dividend income.
12.60% of the ordinary income distributed by the Portfolio for the fiscal year ended January 31, 2012, qualifies for the corporate dividends received deduction.
The Portfolio will notify shareholders in January 2013 of amounts for use in preparing 2012 income tax returns.
Columbia LifeGoal Income Portfolio
For non-corporate shareholders, 4.57%, or the maximum amount allowable under the Jobs and Growth Tax Relief Reconciliation Act of 2003, of the ordinary income distributed by the Portfolio for the fiscal year ended January 31, 2012 may represent qualified dividend income.
4.22% of the ordinary income distributed by the Portfolio for the fiscal year ended January 31, 2012, qualifies for the corporate dividends received deduction.
The Portfolio will notify shareholders in January 2013 of amounts for use in preparing 2012 income tax returns.
90
Fund Governance
Shareholders elect the Board that oversees the funds' operations. The Board appoints officers who are responsible for day-to-day business decisions based on policies set by the Board. The following table provides basic biographical information about the funds' Board members, including their principal occupations during the past five years, although specific titles for individuals may have varied over the period. Under current Board policy, members may serve until the next Board meeting after he or she reaches the mandatory retirement age established by the Board, or the fifteenth anniversary of the first Board meeting they attended as a member of the Board.
On Sept. 29, 2009, Ameriprise Financial, the parent company of Columbia Management, entered into an agreement with Bank of America, N.A. ("Bank of America") to acquire a portion of the asset management business of Columbia Management Group, LLC and certain of its affiliated companies (the "Transaction"). Following the Transaction, which became effective on May 1, 2010, various alignment activities have occurred with respect to the Fund Family. In connection with the Transaction, Mr. Edward J. Boudreau, Jr., Mr. William P. Carmichael, Mr. William A. Hawkins, Mr. R. Glenn Hilliard, Mr. John J. Nagorniak, Ms. Minor M. Shaw and Dr. Anthony M. Santomero, who were members prior to the Transaction of the Legacy Columbia Nations funds' Board ("Nations Funds"), which includes Columbia Funds Series Trust, Columbia Funds Variable Insurance Trust I and Columbia Funds Master Investment Trust, LLC., began service on the Board for the Legacy RiverSource funds ("RiverSource Funds") effective June 1, 2011, which resulted in an overall increase from twelve Trustees to sixteen for all mutual funds overseen by the Board.
Independent Board Members
| Name, Address, Age | | Position Held
with Funds
and Length
of Service | | Principal Occupation During Past Five Years | | Number of
Funds in the
Fund Family
Overseen by
Board Member | | Other Present or
Past Directorships/
Trusteeships
(Within Past 5 Years) | |
| Kathleen Blatz | |
|
901 S. Marquette Ave.
Minneapolis, MN 55402
Age 57 | | Board member since 1/06 for RiverSource Funds and since 6/11 for Nations Funds | | Attorney; Chief Justice, Minnesota Supreme Court, 1998-2006 | | | 153 | | | None | |
|
| Edward J. Boudreau, Jr. | |
|
225 Franklin Street
Mail Drop
BX32 05228
Boston, MA 02110
Age 67 | | Board member since 6/11 for RiverSource Funds and since 1/05 for Nations Funds | | Managing Director, E.J. Boudreau & Associates (consulting) since 2000 | | | 146 | | | Former Trustee, BofA Funds Series Trust (11 funds) | |
|
| Pamela G. Carlton | |
|
901 S. Marquette Ave.
Minneapolis, MN 55402
Age 57 | | Board member since 7/07 for RiverSource Funds and since 6/11 for Nations Funds | | President, Springboard-Partners in Cross Cultural Leadership (consulting company) | | | 153 | | | None | |
|
91
Fund Governance (continued)
Independent Board Members (continued)
| Name, Address, Age | | Position Held
with Funds
and Length
of Service | | Principal Occupation During Past Five Years | | Number of
Funds in the
Fund Family
Overseen by
Board Member | | Other Present or
Past Directorships/
Trusteeships
(Within Past 5 Years) | |
| William P. Carmichael | |
|
225 Franklin Street
Mail Drop
BX32 05228
Boston, MA 02110
Age 68 | | Board member since 6/11 for RiverSource Funds and since 1999 for Nations Funds | | Retired | | | 146 | | | Director, Cobra Electronics Corporation (electronic equipment manufacturer); The Finish Line (athletic shoes and apparel); McMoRan Exploration Company (oil and gas exploration and development); Former Trustee, BofA Funds Series Trust (11 funds); former Director, Spectrum Brands, Inc. (consumer products); former Director, Simmons Company (bedding) | |
|
| Patricia M. Flynn | |
|
901 S. Marquette Ave.
Minneapolis, MN 55402
Age 61 | | Board member since 11/04 for RiverSource Funds and since 6/11 for Nations Funds | | Trustee Professor of Economics and Management, Bentley University; former Dean, McCallum Graduate School of Business, Bentley University | | 153 | | None | |
|
| William A. Hawkins | |
|
225 Franklin Street
Mail Drop
BX32 05228
Boston, MA 02110
Age 68 | | Board member since 6/11 for RiverSource Funds and since 1/05 for Nations Funds | | Managing Director, Overton Partners (financial consulting), since August 2010; President and Chief Executive Officer, California General Bank, N.A., January 2008-August 2010 | | | 146 | | | Trustee, BofA Funds Series Trust (11 funds) | |
|
| R. Glenn Hilliard | |
|
225 Franklin Street
Mail Drop
BX32 05228
Boston, MA 02110
Age 69 | | Board member since 6/11 for RiverSource Funds and since 1/05 for Nations Funds | | Chairman and Chief Executive Officer, Hilliard Group LLC (investing and consulting), since April 2003; Non-Executive Director & Chairman, CNO Financial Group, Inc. (formerly Conseco, Inc.) (insurance), September 2003-May 2011 | | | 146 | | | Chairman, BofA Fund Series Trust (11 funds); former Director, CNO Financial Group, Inc. (insurance) | |
|
92
Fund Governance (continued)
Independent Board Members (continued)
| Name, Address, Age | | Position Held
with Funds
and Length
of Service | | Principal Occupation During Past Five Years | | Number of
Funds in the
Fund Family
Overseen by
Board Member | | Other Present or
Past Directorships/
Trusteeships
(Within Past 5 Years) | |
| Stephen R. Lewis, Jr. | |
|
901 S. Marquette Ave.
Minneapolis, MN 55402
Age 73 | | Chair of the Board for RiverSource Funds since 1/07, Board member for RiverSource Funds since 1/02 and since 6/11 for Nations Funds | | President Emeritus and Professor of Economics Emeritus, Carleton College | | | 153 | | | Valmont Industries, Inc. (manufactures irrigation systems) | |
|
| John F. Maher | |
|
901 S. Marquette Ave.
Minneapolis, MN 55402
Age 68 | | Board member since 12/06 for Legacy Seligman funds, since 12/08 for RiverSource Funds and since 6/11 for Nations Funds | | Retired President and Chief Executive Officer and former Director, Great Western Financial Corporation (financial services), 1986-1997 | | | 153 | | | None | |
|
| John J. Nagorniak | |
|
225 Franklin Street
Mail Drop
BX32 05228
Boston, MA 02110
Age 67 | | Board member since 6/11 for RiverSource Funds and since 1/08 for Nations Funds | | Retired; President and Director, Foxstone Financial, Inc. (consulting), 2000-2007; Director, Mellon Financial Corporation affiliates (investing), 2000-2007; Chairman, Franklin Portfolio Associates (investing—Mellon affiliate) 1982-2007 | | | 146 | | | Trustee, Research Foundation of CFA Institute; Director, MIT Investment Company; Trustee, MIT 401k Plan; former Trustee, BofA Funds Series Trust (11 funds) | |
|
| Catherine James Paglia | |
|
901 S. Marquette Ave.
Minneapolis, MN 55402
Age 59 | | Board member since 11/04 for RiverSource Funds and since 6/11 for Nations Funds | | Director, Enterprise Asset Management, Inc. (private real estate and asset management company) | | | 153 | | | None | |
|
93
Fund Governance (continued)
Independent Board Members (continued)
| Name, Address, Age | | Position Held
with Funds
and Length
of Service | | Principal Occupation During Past Five Years | | Number of
Funds in the
Fund Family
Overseen by
Board Member | | Other Present or
Past Directorships/
Trusteeships
(Within Past 5 Years) | |
| Leroy C. Richie | |
|
901 S. Marquette Ave.
Minneapolis, MN 55402
Age 70 | | Board member since 2000 for Legacy Seligman funds, since 11/08 for RiverSource Funds and since 6/11 for Nations Funds | | Counsel, Lewis & Munday, P.C. since 2004; former Vice President and General Counsel, Automotive Legal Affairs, Chrysler Corporation | | | 153 | | | Digital Ally, Inc. (digital imaging); Infinity, Inc. (oil and gas exploration and production); OGE Energy Corp. (energy and energy services) | |
|
| Minor M. Shaw | |
|
225 Franklin Street
Mail Drop
BX32 05228
Boston, MA 02110
Age 64 | | Board member since 6/11 for RiverSource Funds and since 2003 for Nations Funds | | President—Micco LLC (private investments) | | | 146 | | | Former Trustee, BofA Funds Series Trust (11 funds); Piedmont Natural Gas; Director, Blue Cross Blue Shield of South Carolina | |
|
| Alison Taunton-Rigby | |
|
901 S. Marquette Ave
Minneapolis, MN 55402
Age 67 | | Board member since 11/02 for RiverSource Funds and since 6/11 for Nations Funds | | Chief Executive Officer and Director, RiboNovix, Inc. 2003-2010 (biotechnology); former President, Aquila Biopharmaceuticals | | | 153 | | | Director, Healthways, Inc. (health management programs); Director, ICI Mutual Insurance Company RRG; Director, Abt Associates (government contractor) | |
|
94
Fund Governance (continued)
Interested Board Member Not Affiliated with Investment Manager*
| Name, Address, Age | | Position Held
with Funds
and Length
of Service | | Principal Occupation During Past Five Years | | Number of
Funds in the
Fund Family
Overseen by
Board Member | | Other Present or
Past Directorships/
Trusteeships
(Within Past 5 Years) | |
| Anthony M. Santomero* | |
|
225 Franklin Street
Mail Drop
BX32 05228
Boston, MA 02110
Age 65 | | Board member since 6/11 for RiverSource Funds and since 1/08 for Nations Funds | | Richard K. Mellon Professor Emeritus of Finance, The Wharton School, University of Pennsylvania, since 2002; Senior Advisor, McKinsey & Company (consulting), 2006-2008; President and Chief Executive Officer, Federal Reserve Bank of Philadelphia, 2000-2006 | | | 146 | | | Director, Renaissance Reinsurance Ltd.; Trustee, Penn Mutual Life Insurance Company; Director, Citigroup; Director, Citibank, N.A.; former Trustee, BofA Funds Series Trust (11 funds) | |
|
* Dr. Santomero is not an affiliated person of the investment manager or Ameriprise Financial. However, he is currently deemed by the funds to be an "interested person" (as defined in the 1940 Act) of the funds because he serves as a Director of Citigroup, Inc. and Citibank N.A., companies that may directly or through subsidiaries and affiliates engage from time-to-time in brokerage execution, principal transactions and lending relationships with the funds or accounts advised/managed by the investment manager.
Interested Board Member Affiliated with Investment Manager*
| William F. Truscott | |
|
53600 Ameriprise Financial Center
Minneapolis, MN 55474
Age 51 | | Board member since 11/01 for RiverSource Funds and since 6/11 for Nations Funds; Senior Vice President since 2002 | | Chairman of the Board and President, Columbia Management Investment Advisers, LLC since May 2010 and February 2012, respectively (previously President, Chairman of the Board and Chief Investment Officer, 2001-April 2010); Chief Executive Officer, U.S. Asset Management & President, Annuities, Ameriprise Financial, Inc. since May 2010 (previously President—U.S. Asset Management and Chief Investment Officer, 2005-April 2010); Director, President and Chief Executive Officer, Ameriprise Certificate Company since 2006; Director and Chief Executive Officer, Columbia Management Investment Distributors, Inc. since May 2010 and February 2012, respectively (previously Chairman of the Board and Chief Executive Officer, 2006-April 2010). | | | 153 | | | None | |
|
* Interested person (as defined under the 1940 Act) by reason of being an officer, director, security holder and/or employee of the investment manager or Ameriprise Financial.
The SAI has additional information about the Fund's Board members and is available, without charge, upon request by calling 800.345.6611; contacting your financial intermediary; or visiting columbiamanagement.com.
95
Fund Governance (continued)
Officers
| Name, Year of Birth and Address | | Principal Occupation(s) During the Past Five Years | |
| J. Kevin Connaughton (Born 1964) | |
|
225 Franklin Street
Boston, MA 02110
President (since 2009) | | Senior Vice President and General Manager—Mutual Fund Products, Columbia Management Investment Advisers, LLC since May 2010; President, Columbia Funds, since 2009, and RiverSource Funds, since May 2010 (previously Senior Vice President and Chief Financial Officer, Columbia Funds, from June 2008 to January 2009, Treasurer, Columbia Funds, from October 2003 to May 2008, and senior officer of various other affiliated funds since 2000); Managing Director, Columbia Management Advisors, LLC from December 2004 to April 2010. | |
|
| Michael G. Clarke (Born 1969) | |
|
225 Franklin Street
Boston, MA 02110
Treasurer (since 2011) and Chief Financial Officer (since 2009) | | Vice President, Columbia Management Investment Advisers, LLC since May 2010; Managing Director of Fund Administration, Columbia Management Advisors, LLC, from September 2004 to April 2010; senior officer of Columbia Funds and affiliated funds since 2002. | |
|
| Scott R. Plummer (Born 1959) | |
|
5228 Ameriprise Financial Center
Minneapolis, MN 55474
Senior Vice President and Chief Legal Officer (since 2010) | | Chief Legal Officer and Assistant Secretary, Columbia Management Investment Advisers, LLC since June 2005; Vice President and Lead Chief Counsel—Asset Management, Ameriprise Financial, Inc. since May 2010 (previously Vice President and Chief Counsel—Asset Management, from 2005 to April 2010; Vice President, Chief Counsel and Assistant Secretary, Columbia Management Investment Distributors, Inc. since 2008; Vice President, General Counsel and Secretary, Ameriprise Certificate Company since 2005; Chief Counsel, RiverSource Distributors, Inc. since 2006; Senior officer of Columbia Funds and affiliated funds, since 2006. | |
|
| Thomas P. McGuire (Born 1971) | |
|
225 Franklin Street
Boston, MA 02110
Interim Chief Compliance Officer (since 2012) | | Vice President—Asset Management Compliance, Columbia Management Investment Advisers, LLC since March 2010; Chief Compliance Officer, Ameriprise certificate Company, since September 2010; Compliance Executive, Bank of America, from June 2005 to April 2010. | |
|
| William F. Truscott (Born 1960) | |
|
53600 Ameriprise Financial Center
Minneapolis, MN 55474
Senior Vice President (since 2010) | | Chairman of the Board and President, Columbia Management Investment Advisers, LLC since May 2010 and February 2012, respectively (previously President, Chairman of the Board and Chief Investment Officer, from 2001 to April 2010); Chief Executive Officer, U.S. Asset Management & President, Annuities, Ameriprise Financial, Inc. since May 2010 (previously President—U.S. Asset Management and Chief Investment Officer from 2005 to April 2010, and Senior Vice President—Chief Investment Officer, from 2001 to 2005); Director, President and Chief Executive Officer, Ameriprise Certificate Company since 2006; Director and Chief Executive Officer, Columbia Management Investment Distributors, Inc. since May 2010 and February 2012, respectively (previously Chairman of the Board and Chief Executive Officer from 2008 to April 2010); Chairman of the Board and Chief Executive Officer, RiverSource Distributors, Inc. since 2006. | |
|
96
Fund Governance (continued)
Officers (continued)
| Name, Year of Birth and Address | | Principal Occupation(s) During the Past Five Years | |
| Colin Moore (Born 1958) | |
|
225 Franklin Street
Boston, MA 02110
Senior Vice President (since 2010) | | Director and Chief Investment Officer, Columbia Management Investment Advisers, LLC since May 2010; Manager, Managing Director and Chief Investment Officer of Columbia Management Advisors, LLC from 2007 to April 2010; Head of Equities, Columbia Management Advisors, LLC from 2002 to 2007. | |
|
| Christopher O. Petersen (Born 1970) | |
|
5228 Ameriprise Financial Center
Minneapolis, MN 55474
Vice President and Secretary (since 2011) | | Vice President and Chief Counsel, Ameriprise Financial since January 2010 (formerly Vice President and Group Counsel or Counsel from April 2004 to January 2010); Senior officer of Columbia Funds and affiliated funds, since 2007. | |
|
| Amy Johnson (Born 1965) | |
|
5228 Ameriprise Financial Center
Minneapolis, MN 55474
Vice President (since 2010) | | Senior Vice President and Chief Operating Officer, Columbia Management Investment Advisers, LLC since May 2010 (previously Chief Administrative Officer, from 2009 until April 2010, Vice President—Asset Management and Trust Company Services, from 2006 to 2009, and Vice President—Operations and Compliance from 2004 to 2006). | |
|
| Joseph F. DiMaria (Born 1968) | |
|
225 Franklin Street
Boston, MA 02110
Vice President (since 2011) and Chief Accounting Officer (since 2008) | | Vice President, Mutual Fund Administration, Columbia Management Investment Advisers, LLC, since May 2010; Director of Fund Administration, Columbia Management Advisors, LLC from January 2006 to April 2010; Head of Tax/Compliance and Assistant Treasurer, Columbia Management Advisors, LLC, from November 2004 to December 2005. | |
|
| Paul B. Goucher (Born 1968) | |
|
5228 Ameriprise Financial Center
Minneapolis, MN 55474
Vice President and Assistant Treasurer (since 2010) | | Vice President and Chief Counsel of Ameriprise Financial since January 2010 (formerly Vice President and Group Counsel from November 2008 to January 2010); Director, Managing Director and General Counsel of J. & W. Seligman & Co. Incorporated (Seligman) from July 2008 to November 2008 and Managing Director and Associate General Counsel of Seligman from January 2005 to July 2008. | |
|
| Michael E. DeFao (Born 1968) | |
|
5228 Ameriprise Financial Center
Minneapolis, MN 55474
Vice President and Assistant Treasurer (since 2011) | | Vice President and Chief Counsel, Ameriprise Financial since May 2010; Associate General Counsel Bank of America from June 2005 to April 2010 | |
|
| Stephen T. Welsh (Born 1957) | |
|
225 Franklin Street
Boston, MA 02110
Vice President (since 2006) | | President and Director, Columbia Management Investment Services Corp. since May 2010; President and Director, Columbia Management Services, Inc. from July 2004 to April 2010; Managing Director, Columbia Management Distributors, Inc. from August 2007 to April 2010. | |
|
97
This page intentionally left blank.
This page intentionally left blank.
This page intentionally left blank.
Important Information About This Report
The fund mails one shareholder report to each shareholder address. If you would like more than one report, please call shareholder services at 1-800-345-6611 and additional reports will be sent to you. This report has been prepared for shareholders of Columbia LifeGoal Portfolios.
A description of the policies and procedures that the fund uses to determine how to vote proxies and a copy of the fund's voting records are available (i) at www.columbiamanagement.com, (ii) on the Securities and Exchange Commission's website at www.sec.gov, and (iii) without charge, upon request, by calling 1-800-368-0346. Information regarding how the fund voted proxies relating to portfolio securities during the 12-month period ended June 30 is available from the SEC's website. Information regarding how the fund voted proxies relating to portfolio securities is also available from the fund's website, www.columbiamanagement.com.
The fund files a complete schedule of portfolio holdings with the SEC for the first and third quarters of each fiscal year on Form N-Q. The fund's Form N-Q is available on the SEC's website at www.sec.gov and may be reviewed and copied at the SEC's Public Reference Room in Washington, D.C. Information on the operation of the Public Reference Room may be obtained by calling 1-800-SEC-0330.
Transfer Agent
Columbia Management Investment
Services Corp.
P.O. Box 8081
Boston, MA 02266-8081
1-800-345-6611
Distributor
Columbia Management Investment
Distributors, Inc.
225 Franklin Street
Boston, MA 02110
Investment Manager
Columbia Management Investment Advisers, LLC
225 Franklin Street
Boston, MA 02110
101

Columbia LifeGoal® Portfolios
P. O. Box 8081
Boston, MA 02266-8081
columbiamanagement.com
This information is for use with concurrent or prior delivery of a fund prospectus. Investors should consider the investment objectives, risks, charges and expenses of a mutual fund carefully before investing. For a free prospectus, which contains this and other important information about the funds, visit columbiamanagement.com. Read the prospectus carefully before investing. The Fund is distributed by Columbia Management Investment Distributors, Inc., member FINRA, and managed by Columbia Management Investment Advisers, LLC.
© 2012 Columbia Management Investment Advisers, LLC. All rights reserved.
C-1056 C (3/12)
Item 2. Code of Ethics.
(a) The registrant has adopted a code of ethics that applies to the registrant’s principal executive officer, principal financial officer, principal accounting officer or controller, or persons performing similar functions, regardless of whether these individuals are employed by the registrant or a third party.
(b) During the period covered by this report, there were not any amendments to a provision of the code of ethics adopted in 2(a) above.
(c) During the period covered by this report, there were no waivers, including any implicit waivers, from a provision of the code of ethics described in 2(a) above that relates to one or more of the items set forth in paragraph (b) of this item’s instructions.
Item 3. Audit Committee Financial Expert.
The registrant’s Board of Trustees has determined that Edward J. Boudreau Jr., Pamela G. Carlton, William P. Carmichael, William A. Hawkins and John F. Maher, each of whom are members of the registrant’s Board of Trustees and Audit Committee, each qualify as an audit committee financial expert. Mr. Boudreau, Ms. Carlton, Mr. Carmichael, Mr. Hawkins and Mr. Maher each are independent trustees, as defined in paragraph (a)(2) of this item’s instructions.
Item 4. Principal Accountant Fees and Services.
Fee information below is disclosed for the five series of the registrant whose report to stockholders are included in this annual filing. The series changed its fiscal year end from March 31 to January 31, effective January 31, 2012. The fees presented for 2012 represent the ten month period ended January 31, 2012. The fees presented for 2011 represent the fiscal year ended March 31, 2011.
(a) Audit Fees. Aggregate Audit Fees billed by the principal accountant for professional services rendered during the period ended January 31, 2012 and the fiscal year ended March 31, 2011 are approximately as follows:
2012 | | 2011 | |
$ | 77,900 | | $ | 80,400 | |
| | | | | |
Audit Fees include amounts related to the audit of the registrant’s annual financial statements or services that are normally provided by the accountant in connection with statutory and regulatory filings or engagements for those fiscal years. Fiscal year 2011 also includes audit fees for the review of and provision of consent in connection with filing Form N-1A for new share classes.
(b) Audit-Related Fees. Aggregate Audit-Related Fees billed to the registrant by the principal accountant for professional services rendered during the period ended January 31, 2012 and the fiscal year ended March 31, 2011 are approximately as follows:
2012 | | 2011 | |
$ | 44,000 | | $ | 31,500 | |
| | | | | |
Audit-Related Fees include amounts for assurance and related services by the principal accountant that are reasonably related to the performance of the audit of the registrant’s financial statements and are not reported in Audit Fees above. In both fiscal years 2012 and 2011, Audit-Related Fees consist of agreed-upon procedures performed for semi-annual shareholder reports and agreed- upon procedures related to fund mergers. Fiscal year 2012 also included Audit-Related Fees for agreed-upon procedures for fund accounting and custody conversions.
During the period ended January 31, 2012 and the fiscal year ended March 31, 2011, there were no Audit-Related Fees billed by the registrant’s principal accountant to the registrant’s investment adviser (not including any sub-adviser whose role is primarily portfolio management and is subcontracted with or overseen by another investment adviser) and any entity controlling, controlled by, or under common control with the adviser that provides ongoing services to the registrant for an engagement that related directly to the operations and financial reporting of the registrant.
(c) Tax Fees. Aggregate Tax Fees billed by the principal accountant to the registrant for professional services rendered during the period ended January 31, 2012 and the fiscal year ended March 31, 2011 are approximately as follows:
2012 | | 2011 | |
$ | 36,200 | | $ | 22,600 | |
| | | | | |
Tax Fees include amounts for the review of annual tax returns, the review of required shareholder distribution calculations and typically include amounts for professional services by the principal accountant for tax compliance, tax advice and tax planning. In fiscal year 2012, Tax Fees also include the review of foreign tax filings.
During the period ended January 31, 2012 and the fiscal year ended March 31, 2011, there were no Tax Fees billed by the registrant’s principal accountant to the registrant’s investment adviser (not including any sub-adviser whose role is primarily portfolio management and is subcontracted with or overseen by another investment adviser) and
any entity controlling, controlled by, or under common control with the adviser that provides ongoing services to the registrant for an engagement that related directly to the operations and financial reporting of the registrant.
(d) All Other Fees. Aggregate All Other Fees billed by the principal accountant to the registrant for professional services rendered during the period ended January 31, 2012 and the fiscal year ended March 31, 2011 are approximately as follows:
All Other Fees include amounts for products and services provided by the principal accountant, other than the services reported in paragraphs (a) through (c) above.
Aggregate All Other Fees billed by the registrant’s principal accountant to the registrant’s investment adviser (not including any sub-adviser whose role is primarily portfolio management and is subcontracted with or overseen by another investment adviser) and any entity controlling, controlled by, or under common control with the adviser that provides ongoing services to the registrant for an engagement that related directly to the operations and financial reporting of the registrant during the period ended January 31, 2012 and the fiscal year ended March 31, 2011 are approximately as follows:
2012 | | 2011 | |
$ | 225,000 | | $ | 495,300 | |
| | | | | |
In both fiscal years 2012 and 2011, All Other Fees consist of fees billed for internal control examinations of the registrant’s transfer agent and investment advisor.
(e)(1) Audit Committee Pre-Approval Policies and Procedures
The registrant’s Audit Committee is required to pre-approve the engagement of the registrant’s independent accountants to provide audit and non-audit services to the registrant and non-audit services to its investment adviser (not including any sub-adviser whose role is primarily portfolio management and is subcontracted with or overseen by another investment adviser) or any entity controlling, controlled by or under common control with such investment adviser that provides ongoing services to the registrant (“Adviser Affiliates”), if the engagement relates directly to the operations and financial reporting of the registrant.
The Audit Committee has adopted a Policy for Engagement of Independent Accountants for Audit and Non-Audit Services (“Policy”). The Policy sets forth the understanding of the Audit Committee regarding the engagement of the registrant’s independent accountants to provide (i) audit and permissible audit-related, tax and other services to the registrant (collectively “Fund Services”); (ii) non-audit services to the registrant’s investment adviser (not including any sub-adviser whose role is primarily portfolio management and is subcontracted with or overseen by another investment adviser) and
Adviser Affiliates, if the engagement relates directly to the operations or financial reporting of a Fund (collectively “Fund-related Adviser Services”); and (iii) certain other audit and non-audit services to the registrant’s investment adviser (not including any sub-adviser whose role is primarily portfolio management and is subcontracted with or overseen by another investment adviser) and Adviser Affiliates. As set forth in this Fund Policy, a service will require specific pre-approval by the Audit Committee if it is to be provided by the Fund’s independent auditor; provided, however, that pre-approval of non-audit services to the Fund, the Adviser or Control Affiliates may be waived if certain de minimis requirements set forth in the SEC’s rules are met.
Under the Policy, the Audit Committee may delegate pre-approval authority to any pre-designated member or members who are Independent Trustees/Directors. The member(s) to whom such authority is delegated must report, for informational purposes only, any pre-approval decisions to the Audit Committee at its next regular meeting. The Audit Committee’s responsibilities with respect to the pre-approval of services performed by the independent accountants may not be delegated to management.
On an annual basis, at a regularly scheduled Audit Committee meeting, the Fund’s Treasurer or other Fund Officer shall submit to the Audit Committee a schedule of the types of Fund Services and Fund-related Adviser Services that are subject to specific pre-approval.
This schedule will provide a description of each type of service that is subject to specific pre-approval, along with total projected fees for each service. The pre-approval will generally cover a one-year period. The Audit Committee will review and approve the types of services and the projected fees for the next one-year period and may add to, or subtract from, the list of pre-approved services from time to time, based on subsequent determinations. This specific approval acknowledges that the Audit Committee is in agreement with the types of services that the independent accountants will be permitted to perform.
The Fund’s Treasurer or other Fund Officer shall report to the Audit Committee at each of its regular meetings regarding all Fund Services or Fund-related Adviser Services initiated since the last such report was rendered, including a general description of the services with forecasted fees for the annual period, proposed changes requiring specific pre-approval and a description of services provided by the independent auditor with actual fees during the current reporting period.
*****
(e)(2) The percentage of services described in paragraphs (b) through (d) of this Item approved pursuant to the “de minimis” exception under paragraph (c)(7)(i)(C) of Rule 2-01 of Regulation S-X during the period ended January 31, 2012 and the fiscal year ended March 31, 2011 was zero.
(f) Not applicable.
(g) The aggregate non-audit fees billed by the registrant’s accountant for services rendered to the registrant, and rendered to the registrant’s investment adviser (not including any sub-adviser whose role is primarily portfolio management and is subcontracted with or overseen by another investment adviser), and any entity controlling, controlled by, or under common control with the adviser that provides ongoing services to the registrant for the period ended January 31, 2012 and the fiscal year ended March 31, 2011 are approximately as follows:
2012 | | 2011 | |
$ | 305,200 | | $ | 549,400 | |
| | | | | |
(h) The registrant’s Audit Committee of the Board of Directors has considered whether the provision of non-audit services that were rendered to the registrant’s adviser (not including any sub-adviser whose role is primarily portfolio management and is subcontracted with or overseen by another investment adviser), and any entity controlling, controlled by, or under common control with the investment adviser that provides ongoing services to the registrant that were not pre-approved pursuant to paragraph (c)(7)(ii) of Rule 2-01 of Regulation S-X, is compatible with maintaining the principal accountant’s independence.
Item 5. Audit Committee of Listed Registrants.
Not applicable.
Item 6. Investments
(a) The registrant’s “Schedule I — Investments in securities of unaffiliated issuers” (as set forth in 17 CFR 210.12-12) is included in Item 1 of this Form N-CSR.
(b) Not applicable.
Item 7. Disclosure of Proxy Voting Policies and Procedures for Closed-End Management Investment Companies.
Not applicable.
Item 8. Portfolio Managers of Closed-End Management Investment Companies.
Not applicable.
Item 9. Purchases of Equity Securities by Closed-End Management Investment Company and Affiliated Purchasers.
Not applicable.
Item 10. Submission of Matters to a Vote of Security Holders.
There were no material changes to the procedures by which shareholders may recommend nominees to the registrant’s board of directors.
Item 11. Controls and Procedures.
(a) The registrant’s principal executive officer and principal financial officers, based on their evaluation of the registrant’s disclosure controls and procedures as of a date within 90 days of the filing of this report, have concluded that such controls and procedures are adequately designed to ensure that material information required to be disclosed by the registrant in Form N-CSR is accumulated and communicated to the registrant’s management, including the principal executive officer and principal financial officer, or persons performing similar functions, as appropriate to allow timely decisions regarding required disclosure.
(b) There was no change in the registrant’s internal control over financial reporting that occurred during the registrant’s second fiscal quarter of the period covered by this report that has materially affected, or is reasonably likely to materially affect, the registrant’s internal control over financial reporting.
Item 12. Exhibits.
(a)(1) Code of ethics required to be disclosed under Item 2 of Form N-CSR attached hereto as Exhibit 99.CODE ETH.
(a)(2) Certifications pursuant to Rule 30a-2(a) under the Investment Company Act of 1940 (17 CFR 270.30a-2(a)) attached hereto as Exhibit 99.CERT.
(a)(3) Not applicable.
(b) Certification pursuant to Rule 30a-2(b) under the Investment Company Act of 1940 (17 CFR 270.30a-2(b)) attached hereto as Exhibit 99.906CERT.
SIGNATURES
Pursuant to the requirements of the Securities Exchange Act of 1934 and the Investment Company Act of 1940, the registrant has duly caused this report to be signed on its behalf by the undersigned, thereunto duly authorized.
(registrant) | | Columbia Funds Series Trust | |
| | | |
| | | |
By (Signature and Title) | | /s/ J. Kevin Connaughton | |
| | J. Kevin Connaughton, President and Principal Executive Officer |
| | | |
| | | |
Date | | March 26, 2012 | |
|
|
Pursuant to the requirements of the Securities Exchange Act of 1934 and the Investment Company Act of 1940, this report has been signed below by the following persons on behalf of the registrant and in the capacities and on the dates indicated. |
|
|
By (Signature and Title) | | /s/ J. Kevin Connaughton | |
| | J. Kevin Connaughton, President and Principal Executive Officer |
| | | |
| | | |
Date | | March 26, 2012 | |
| | | |
| | | |
By (Signature and Title) | | /s/ Michael G. Clarke | |
| | Michael G. Clarke, Treasurer and Chief Financial Officer | |
| | | |
| | | |
Date | | March 26, 2012 | |
| | | | | | | |